
Use these links to rapidly review the document
TABLE OF CONTENTS
INDEX TO FINANCIAL STATEMENTS
As filed with the Securities and Exchange Commission on October 14, 2004May 2, 2005
Registration No. 333-
UNITED STATES SECURITIES AND EXCHANGE COMMISSION
Washington, D.C. 20549
FORM S-1
REGISTRATION STATEMENT
UNDER
THE SECURITIES ACT OF 1933
PLAINS ALL AMERICAN PIPELINE, L.P.
(Exact Name of Registrant as Specified in Its Charter)
Delaware (State or Other Jurisdiction of Incorporation or Organization) | 4610 (Primary Standard Industrial Classification Code Number) | 76-0582150 (I.R.S. Employer Identification Number) | ||
333 Clay Street, Suite 1600 Houston, Texas 77002 (713) 646-4100 (Address, Including Zip Code, and Telephone Number, including Area Code, of Registrant's Principal Executive Offices) | ||||
Tim Moore Vice President and General Counsel 333 Clay Street, Suite 1600 Houston, Texas 77002 (713) 646-4100 (Name, Address, Including Zip Code, and Telephone Number, Including Area Code, of Agent for Service) | ||||
Copies to:
David P. Oelman
Vinson & Elkins L.L.P.
1001 Fannin Street, Suite 2300
Houston, Texas 77002
(713) 758-2222
Approximate date of commencement of proposed sale to the public:From time to time after this Registration Statement becomes effective.
If any of the securities being registered on this form are to be offered on a delayed or continuous basis pursuant to Rule 415 under the Securities Act of 1933, check the following box. ý
If this form is filed to register additional securities for an offering pursuant to Rule 462(b) under the Securities Act, check the following box and list the Securities Act registration statement number of the earlier effective registration statement for the same offering. o
If this form is a post-effective amendment filed pursuant to Rule 462(c) under the Securities Act, check the following box and list the Securities Act registration statement number of the earlier effective registration statement for the same offering. o
If this form is a post-effective amendment filed pursuant to Rule 462(d) under the Securities Act, check the following box and list the Securities Act registration statement number of the earlier effective registration statement for the same offering. o
If delivery of the prospectus is expected to be made pursuant to Rule 434, please check the following box. o
CALCULATION OF REGISTRATION FEE
| Title Of Each Class Of Securities To Be Registered | Amount to be Registered | Proposed Maximum Offering Price Per Unit | Proposed Maximum Aggregate Offering Price | Amount of Registration Fee | ||||||||
|---|---|---|---|---|---|---|---|---|---|---|---|---|
| Common Units representing limited partner interests | 19,469,207 units | (1) | $ | $ | ||||||||
The registrant hereby amends this registration statement on such date or dates as may be necessary to delay its effective date until the registrant shall file a further amendment which specifically states that this registration statement shall thereafter become effective in accordance with Section 8(a) of the Securities Act of 1933 or until the registration statement shall become effective on such date as the Securities and Exchange Commission, acting pursuant to said Section 8(a), may determine.
The information in this prospectus is not complete and may be changed. We may not sell these securities until the registration statement filed with the Securities and Exchange Commission is effective. This prospectus is not an offer to sell these securities and it is not soliciting an offer to buy these securities in any state where the offer or sale is not permitted.
Subject to Completion Dated October , 2004May 2, 2005
P R O S P E C T U S
3,245,70019,469,207 Common Units
Plains All American Pipeline, L.P.
Representing Limited Partner Interests
Up to 3,245,70019,469,207 of our common units may be offered from time to time by the selling unitholders named in this prospectus. The selling unitholders may sell the common units at various times and in various types of transactions, including sales in the open market, sales in negotiated transactions and sales by a combination of methods. We will not receive any proceeds from the sale of common units by the selling unitholders.
Our common units are listed on the New York Stock Exchange under the symbol "PAA."
Limited partnerships are inherently different from corporations. You should carefully consider each of the factors described under "Risk Factors" which begins on page 2 of this prospectus before you make an investment in the securities.
NEITHER THE SECURITIES AND EXCHANGE COMMISSIONCOMMISION NOR ANY STATE SECURITIES COMMISSIONCOMMISION HAS APPROVED OR DISAPPROVED OF THESE SECURITIES OR DETERMINED IF THIS PROSPECTUS IS TRUTHFUL OR COMPLETE. ANY REPRESENTATION TO THE CONTRARY IS A CRIMINAL OFFENSE.
In connection with certain sales of securities hereunder, a prospectus supplement may accompany this prospectus.
The date of this prospectus is October , 2004[ ], 2005
i
| Directors and Executive Officers | |
| Executive Compensation |
i
ii
| Tax Consequences of Unit Ownership | |
| Tax Treatment of Operations | |
| Disposition of Common Units | |
| Uniformity of Units | |
ii
This prospectus is part of a registration statement that we filed with the Securities and Exchange Commission, or SEC, using a "shelf""shelf' registration process. Under this shelf process, the selling unitholders may sell up to 3,245,70019,469,207 of our common units. In connection with certain sales of securities hereunder, a prospectus supplement may accompany this prospectus. The prospectus supplement may also add, update or change information contained in this prospectus. Therefore, before you invest in our securities, you should read this prospectus and any attached prospectus supplements.
In this registration statement, the terms "we," "our," "ours," and "us" refer to Plains All American Pipeline, L.P. and its subsidiaries, unless otherwise indicated or the context requires otherwise.
iii
We are a publicly traded Delaware limited partnership, formed in 1998 and engaged in interstate and intrastate crude oil transportation, and crude oil gathering, marketing, terminalling and storage, as well as the marketing and storage of liquefied petroleum gas and othernatural gas related petroleum products. We refer to liquefied petroleum gas and othernatural gas related petroleum products collectively as "LPG." We have an extensive network of pipeline transportation, storage and gathering assets in key oil producing basins and at major market hubs in the United States and Canada. Several members of our existing management team founded this midstream crude oil business in 1992, and we completed our initial public offering in 1998.
We haveOur operations in the United States and Canada, which can be categorized into two primary business activities: crude oil pipeline transportation operations and gathering, marketing, terminalling and storage operations.
Our principal business strategy is to capitalize on the regional crude oil supply and demand imbalances that exist in the United States and Canada by combining the strategic location and distinctive capabilities of our transportation and terminalling assets with our extensive marketing and distribution expertise to generate sustainable earnings and cash flow.
We intend to execute our business strategy by:
To a lesser degree, we also engage in a similar business strategy with respect to the wholesale marketing and storage of LPG, which we began as a result of an acquisition in mid-2001.
You should carefully consider the following risk factors together with all of the other information included in this prospectus in evaluating an investment in us. If any of the following risks were actually to occur, our business, financial condition or results of operations could be materially adversely affected.
The level of our profitability is dependent upon an adequate supply of crude oil from fields located offshore and onshore California. Production from these offshore fields has experienced substantial production declines since 1995.
A significant portion of our segment profit is derived from pipeline transportation margins associated with the Santa Ynez and Point Arguello fields located offshore California. We expect that there will continue to be natural production declines from each of these fields as the underlying reservoirs are depleted. We estimate that a 5,000 barrel per day decline in volumes shipped from these fields would result in a decrease in annual pipeline segment profit of approximately $3.1$3.2 million. In addition, any significant production disruption from these fieldsthe Santa Ynez field due to production problems, transportation problems or other reasons wouldcould have a material adverse effect on our business.
Our trading policies cannot eliminate all price risks. In addition, any non-compliance with our trading policies could result in significant financial losses.
Generally, it is our policy that as we purchase crude oil we establish a margin for crude oil purchased by selling crude oil for physical delivery to third party users, such as independent refiners or major oil companies, or by entering into a future delivery obligation under futures contracts on the NYMEX and over-the-counter.over the counter. Through these transactions, we seek to maintain a position that is substantially balanced between purchases, on the one hand, and sales or future delivery obligations, on the other hand. Our policy is generally not to acquire and hold crude oil, futures contracts or derivative products for the purpose of speculating on price changes. This policyThese policies and practices cannot, however, eliminate all price risks. For example, we engage in a controlled trading program for up to an aggregate of 500,000 barrels of crude oil. While this activity is monitored independently by our risk management function, it exposes us to price risks within predefined limits and authorizations. In addition, any event that disrupts our anticipated physical supply of crude oil could expose us to risk of loss resulting from price changes. Moreover, we are exposed to some risks that are not hedged, including certain basis risks and price risks on certain of our inventory, such as pipeline linefill, which must be maintained in order to transport crude oil on our pipelines. In addition, we engage in a controlled trading program for up to an aggregate of 500,000 barrels of crude oil. Although this activity is monitored independently by our risk management function, it exposes us to price risks within predefined limits and authorizations.
In addition, our trading operations involve the risk of non-compliance with our trading policies. For example, we discovered in November 1999 that our trading policy was violated by one of our former employees, which resulted in aggregate losses of approximately $181.0 million. We have taken steps within our organization to enhance our processes and procedures to detect future unauthorized trading. We cannot assure you, however, that these steps will detect and prevent all violations of our trading policies and procedures, particularly if deception or other intentional misconduct is involved.
If we do not make acquisitions on economically acceptable terms our future growth may be limited.
Our ability to grow and to increase distributions to unitholders is substantially dependent on our ability to make acquisitions that result in an increase in adjusted operating surplus per unit. If we are unable to make such accretive acquisitions either because (i) we are unable to identify attractive acquisition candidates or negotiate acceptable purchase contracts with them, (ii) we are unable to raise financing for such acquisitions on economically acceptable terms or (iii) we are outbid by competitors, our future growth and ability to raise distributions will be limited. In particular, competition for midstream assets and businesses has intensified substantially and as a result such assets and businesses
have become more costly. As a result, we may not be able to complete the number or size of acquisitions that we have targeted internally or to continue to grow as quickly as we have historically.
Our acquisition strategy requires access to new capital. Tightened creditcapital markets or other factors which increase our cost of capital could impair our ability to grow.
Our business strategy is substantially dependent on acquiring additional assets or operations that will allow us to increase distributions to unitholders.operations. We continuously consider and enter into discussions regarding potential acquisitions. These transactions can be effected quickly, may occur at any time and may be significant in size relative to our existing assets and operations. Any material acquisition will require access to capital. Any limitations on our access to capital or increase in the cost of that capital could significantly impair our ability to execute our acquisition strategy. Our ability to maintain our targeted credit profile, including maintaining our credit ratings, could impact our cost of capital as well as our ability to execute our acquisition strategy.
Our acquisition strategy involves risks that may adversely affect our business.
Any acquisition involves potential risks, including:
Any of these factors could adversely affect our ability to achieve anticipated levels of cash flows from our acquisitions, realize other anticipated benefits and our ability to makepay distributions to you.or meet our debt service requirements.
The nature of our assets and business could expose us to significant environmental compliance costs and liabilities.
Our operations involving the storage, treatment, processing, and transportation of liquid hydrocarbons including crude oil and are subject to stringent federal, state, and local laws and regulations governing the discharge of materials into the environment, orand otherwise relating to protection of the environment.environment, operational safety and related matters. Compliance with these laws and regulations increases our overall cost of business, including our capital costs to construct, maintain and upgrade equipment and facilities.facilities, or claims for damages to property or persons resulting from our operations. Failure to comply with these laws and regulations may result in the assessment of administrative, civil, and criminal penalties, the imposition of investigatory and remedial liabilities, and even the issuance of injunctions that may restrict or prohibit our operations, or claims of damages to property or persons resulting from our operations. EnvironmentalThe laws and regulations applicable to our operations are subject to change, and we cannot provide any assurance that compliance with current and future laws and regulations will not have a material affecteffect on our results of operations or earnings. A discharge of hazardous liquids into the environment could, to the extent such event is not insured, subject us to substantial expense, including both the cost to comply with applicable laws and regulations and any claims made by neighboring landowners and other thirdliability to private parties for personal injury andor property damage.
The profitability of our pipeline operations depends on the volume of crude oil shipped by third parties.shipped.
Third party shippers generally do not have long-termlong term contractual commitments to ship crude oil on our pipelines. A decision by a shipper to substantially reduce or cease to ship volumes of crude oil on our pipelines could cause a significant decline in our revenues. For example, we estimate that an
average 10,00020,000 barrel per day variance in the Basin Pipeline System within the current operating window, equivalent to an approximate 4%7% volume variance on that pipeline system, would change annualized segment profit by approximately $1.0$1.8 million. In addition, we estimate that an average 10,000 barrel per day variance on the Capline Pipeline System, equivalent to an approximate 7% volume variance on that system, would change annualized segment profit by approximately $1.5 million.
The success of our business strategy to increase and optimize throughput on our pipeline and gathering assets is dependent upon our securing additional supplies of crude oil.
Our operating results are dependent upon securing additional supplies of crude oil from increased production by oil companies and aggressive lease gathering efforts. The ability of producers to increase production is dependent on the prevailing market price of oil, the exploration and production budgets of the major and independent oil companies, the depletion rate of existing reservoirs, the success of new wells drilled, environmental concerns, regulatory initiatives and other matters beyond our control. There can be no assurance that production of crude oil will rise to sufficient levels to cause an increase in the throughput on our pipeline and gathering assets.
Our operations are dependent upon demand for crude oil by refiners in the Midwest and on the Gulf Coast. Any decrease in this demand could adversely affect our business.
Demand for crude oil is dependent upon the impact of future economic conditions, fuel conservation measures, alternative fuel requirements, governmental regulation or technological advances in fuel economy and energy generation devices, all of which could reduce demand. Demand also depends on the ability and willingness of shippers having access to our transportation assets to satisfy their demand by deliveries through those assets, and any decrease in this demand could adversely affect our business.
We face intense competition in our gathering, marketing, terminalling and storage activities and gathering and marketing activities.
Our competitors include other crude oil pipelines, the major integrated oil companies, their marketing affiliates, and independent gatherers, brokers and marketers of widely varying sizes, financial resources and experience. Some of these competitors have capital resources many times greater than ours and control greater supplies of crude oil. We estimate that a $0.01 per barrel variance in the aggregate average segment profit per barrel would have an approximate $2.5$2.6 million annual effect on segment profit.
The profitability of our gathering and marketing activities is generally dependent on the volumes of crude oil we purchase and gather.
To maintain the volumes of crude oil we purchase, we must continue to contract for new supplies of crude oil to offset volumes lost because of natural declines in crude oil production from depleting wells or volumes lost to competitors. Replacement of lost volumes of crude oil is particularly difficult in an environment where production is low and competition to gather available production is intense. Generally, because producers experience inconveniences in switching crude oil purchasers, such as delays in receipt of proceeds while awaiting the preparation of new division orders, producers typically do not change purchasers on the basis of minor variations in price. Thus, we may experience difficulty acquiring crude oil at the wellhead in areas where there are existing relationships between producers and other gatherers and purchasers of crude oil. We estimate that a 5,00015,000 barrel per day decrease in barrels gathered by us would have an approximate $1.0$3.0 million per year negative impact on segment profit. This impact is based on a reasonable margin throughout various market conditions. Actual margins vary based on the location of the crude oil, the strength or weakness of the market and the grade or quality of crude oil.
We are exposed to the credit risk of our customers in the ordinary course of our gathering and marketing activities.
There can be no assurance that we have adequately assessed the credit-worthinesscredit worthiness of our existing or future counter-partiescounterparties or that there will not be an unanticipated deterioration in their credit worthiness, which could have an adverse impact on us.
In those cases wherein which we provide division order services for crude oil purchased at the wellhead, we may be responsible for distribution of proceeds to all parties. In other cases, we pay all of or a portion of the production proceeds to an operator who distributes these proceeds to the various interest owners. These arrangements expose us to operator credit risk, and there can be no assurance that we will not experience losses in dealings with other parties.
Our pipeline assets are subject to federal, state and provincial regulation.
Our domestic interstate common carrier pipelines are subject to regulation by the Federal Energy Regulatory Commission (FERC) under the Interstate Commerce Act. The Interstate Commerce Act requires that tariff rates for petroleum pipelines be just and reasonable and non-discriminatory. We are also subject to the Pipeline Safety Regulations of the U.S. Department of Transportation. Our intrastate pipeline transportation activities are subject to various state laws and regulations as well as orders of regulatory bodies.
Our Canadian pipeline assets are subject to regulation by the National Energy Board and by provincial agencies. With respect to a pipeline over which it has jurisdiction, each of these Canadian agencies has the power to determine the rates we are allowed to charge for transportation on such pipeline. The extent to which regulatory agencies can override existing transportation contracts has not been fully decided.
Our pipeline systems are dependent upon their interconnections with other crude oil pipelines to reach end markets.
Reduced throughput on these interconnecting pipelines as a result of testing, line repair, reduced operating pressures or other causes could result in reduced throughput on our pipeline systems that would adversely affect our profitability.
Fluctuations in demand can negatively affect our operating results.
Fluctuations in demand for crude oil, such as caused by refinery downtime or shutdown, can have a negative effect on our operating results. Specifically, reduced demand in an area serviced by our transmission systems will negatively affect the throughput on such systems. Although the negative impact may be mitigated or overcome by our ability to capture differentials created by demand fluctuations, this ability is dependent on location and grade of crude oil, and thus is unpredictable.
The terms of our indebtedness may limit our ability to borrow additional funds or capitalize on business opportunities.
As of June 30,December 31, 2004, pro forma for the third quarter equity and debt offerings, our total outstanding long-term debt was approximately $797.1$949 million. Various limitations in our indebtedness may reduce our ability to incur additional debt, to engage in some transactions and to capitalize on business opportunities. Any subsequent refinancing of our current indebtedness or any new indebtedness could have similar or greater restrictions.
Changes in currency exchange rates and foreign currency restrictions and shortages could adversely affect our operating results.
Because we conduct operations in Canada, we are exposed to currency fluctuations and exchange rate risks that may adversely affect our results of operations. In addition, legal restrictions or shortages in currencies outside the U.S. may prevent us from converting sufficient local currency to enable us to
complyCash distributions are not guaranteed and may fluctuate with our currency placement obligations not denominated in local currency or to meet our operating needsperformance and debt service requirements.
Our tax treatment depends on our status as a partnership for federal income tax purposes, as well as our not being subject to entity-level taxation by states. If the IRS treats us as a corporation or we become subject to entity-level taxation for state tax purposes, it would substantially reduce our ability to make distributions to you.establishment of financial reserves.
IfBecause distributions on the common units are dependent on the amount of cash we were classified as a corporation for federal income tax purposes, we would pay federal income taxgenerate, distributions may fluctuate based on our income atperformance. The actual amount of cash that is available to be distributed each quarter will depend on numerous factors, some of which are beyond our control and the corporate rate. Treatmentcontrol of us as a corporation would cause a material reduction in our anticipatedthe general partner. Cash distributions are dependent primarily on cash flow, including cash flow from financial reserves and working capital borrowings, and not solely on profitability, which would materiallyis affected by non-cash items. Therefore, cash distributions might be made during periods when we record losses and adversely affect our ability to make distributions to you.
In addition, because of widespread state budget deficits, several states are evaluating ways to subject partnerships to entity-level taxation through the imposition of state income, franchise or other forms of taxation. Imposition of such forms of taxation would reduce our cash flow.
We willmight not be required to comply with Section 404 of the Sarbanes-Oxley Act for the first time.
The Sarbanes-Oxley Act of 2002 has imposed many new requirements on public companies regarding corporate governance and financial reporting. Among these is the requirement under Section 404 of the Act, beginning with our 2004 Annual Report, for management to report on our internal control over financial reporting and for our independent public accountants to attest to management's report. During 2003,made during periods when we commenced actions to enhance our ability to comply with these requirements, including but not limited to the addition of staffing in our internal audit department, documentation of existing controls and implementation of new controls or modification of existing controls as deemed appropriate. We have continued to devote substantial time and resources to the documentation and testing of our controls, and to planning for and implementation of remedial efforts in those instances where remediation is indicated. At this point, we have no indication that management will be unable to favorably report on our internal controls nor that our independent auditors will be unable to attest to management's findings. Both we and our auditors, however, must complete the process (which we have never completed before), so we cannot assure you of the results. It is unclear what impact failure to comply fully with Section 404 or the discovery of a material weakness in our internal control over financial reporting would have on us, but presumably it could result in the reduced ability to obtain financing, the loss of customers, and additional expenditures to meet the requirements.record profits.
Risks Inherent in an Investment in Plains All American Pipeline
Cost reimbursements due to our general partner may be substantial and will reduce our cash available for distribution to you.
Prior to making any distribution on the common units, we will reimburse our general partner and its affiliates, including officers and directors of the general partner, for all expenses incurred on our behalf. The reimbursement of expenses and the payment of fees could adversely affect our ability to make distributions. The general partner has sole discretion to determine the amount of these expenses. In addition, our general partner and its affiliates may provide us services for which we will be charged reasonable fees as determined by the general partner.
You may not be able to remove our general partner even if you wish to do so.
Our general partner manages and operates Plains All American Pipeline. Unlike the holders of common stock in a corporation, you will have only limited voting rights on matters affecting our business. You will have no right to elect the general partner or the directors of the general partner on an annual or other continuing basis. Because the owners of our general partner own more than
one-third of our outstanding units, these owners have the practical ability to prevent the removal of our general partner.
In addition, the following provisions of our partnership agreement may discourage a person or group from attempting to remove our general partner or otherwise change our management:
As a result of these provisions, the price at which the common units will trade may be lower because of the absence or reduction of a takeover premium in the trading price.
We may issue additional common units without your approval, which would dilute your existing ownership interests.
Our general partner may cause us to issue an unlimited number of common units, without your approval. The issuance of additional common units or other equity securities of equal or senior rank will have the following effects:
We may also issue at any time an unlimited number of equity securities ranking junior or senior to the common units without the approval of the unitholders.
Our general partner has a limited call right that may require you to sell your units at an undesirable time or price.
If at any time our general partner and its affiliates own 80% or more of the common units, the general partner will have the right, but not the obligation, which it may assign to any of its affiliates, to acquire all, but not less than all, of the remaining common units held by unaffiliated persons at a price generally equal to the then current market price of the common units. As a result, you may be required to sell your common units at a time when you may not desire to sell them or at a price that is less than the price you would like to receive. You may also incur a tax liability upon a sale of your common units.
You may not have limited liability if a court finds that unitholder actions constitute control of our business.
Under Delaware law, you could be held liable for our obligations to the same extent as a general partner if a court determined that the right of unitholders to remove our general partner or to take other action under our partnership agreement constituted participation in the "control" of our business.
Our general partner generally has unlimited liability for our obligations, such as our debts and environmental liabilities, except for those contractual obligations that are expressly made without recourse to our general partner.
In addition, Section 17-607 of the Delaware Revised Uniform Limited Partnership Act provides that under some circumstances, a unitholder may be liable to us for the amount of a distribution for a period of three years from the date of the distribution.
Conflicts of interest could arise among our general partner and us or the unitholders.
These conflicts may include the following:
Tax Risks to Common Unitholders
You should read "Tax Considerations" for a more complete discussion of the following expected material federal income tax consequences of owning and disposing of common units.
The IRS could treat us as a corporation for tax purposes, which would substantially reduce the cash available for distribution to you.
The anticipated after-tax benefit of an investment in the common units depends largely on our being treated as a partnership for federal income tax purposes. We have not requested, and do not plan to request, a ruling from the IRS on this or any other matter affecting us.
If we were classified as a corporation for federal income tax purposes, we would pay federal income tax on our income at the corporate tax rate, which is currently a maximum of 35%. Distributions to you would generally be taxed again to you as corporate distributions, and no income, gains, losses, deductions or credits would flow through to you. Because a tax would be imposed upon
us as a corporation, the cash available for distribution to you would be substantially reduced. Treatment of us as a corporation would result in a material reduction in the after-tax return to the unitholders, likely causing a substantial reduction in the value of the common units.
Current law may change so as to cause us to be taxed as a corporation for federal income tax purposes or otherwise subject us to entity-level taxation. In addition, because of widespread state budget deficits, several states are evaluating ways to subject partnerships to entity-level taxation through the imposition of state income, franchise or other forms of taxation. If any state were to impose a tax upon us as an entity, the cash available for distribution to you would be reduced. Our partnership agreement provides that, if a law is enacted or existing law is modified or interpreted in a manner that subjects us to taxation as a corporation or otherwise subjects us to entity-level taxation for federal, state or local income tax purposes, then the minimum quarterly distribution and the target distribution levels will be decreased to reflect that impact on us.
A successful IRS contest of the federal income tax positions we take may adversely impact the market for common units.
We have not requested a ruling from the IRS with respect to any matter affecting us. The IRS may adopt positions that differ from the conclusions of our counsel expressed in this registration statement or from the positions we take. It may be necessary to resort to administrative or court proceedings to sustain our counsel's conclusions or the positions we take. A court may not concur with our counsel's conclusions or the positions we take. Any contest with the IRS may materially and adversely impact the market for common units and the price at which they trade. In addition, the costs of any contest with the IRS, principally legal, accounting and related fees, will be borne by us and directly or indirectly by the unitholders and the general partner.
You may be required to pay taxes even if you do not receive any cash distributions.
You will be required to pay federal income taxes and, in some cases, state and local income taxes on your share of our taxable income even if you do not receive any cash distributions from us. You may not receive cash distributions from us equal to your share of our taxable income or even equal to the actual tax liability that results from your share of our taxable income.
Tax gain or loss on disposition of common units could be different than expected.
If you sell your common units, you will recognize gain or loss equal to the difference between the amount realized and your tax basis in those common units. Prior distributions in excess of the total net taxable income you were allocated for a common unit, which decreased your tax basis in that common unit, will, in effect, become taxable income to you if the common unit is sold at a price greater than your tax basis in that common unit, even if the price you receive is less than your original cost. A
substantial portion of the amount realized, whether or not representing gain, may be ordinary income to you. Should the IRS successfully contest some positions we take, you could recognize more gain on the sale of units than would be the case under those positions, without the benefit of decreased income in prior years. Also, if you sell your units, you may incur a tax liability in excess of the amount of cash you receive from the sale.
If you are a tax-exempt entity, a regulated investment company or an individual not residing in the United States, you may have adverse tax consequences from owning common units.
Investment in common units by tax-exempt entities, regulated investment companies or mutual funds and foreign persons raises issues unique to them. For example, virtually all of our income allocated to organizations exempt from federal income tax, including individual retirement accounts and other retirement plans, will be unrelated business taxable income and will be taxable to them. VeryRecent legislation treats net income derived from the ownership of certain publicly traded partnerships (including us) as qualifying income to a regulated investment company. However, this legislation is only effective for taxable years beginning after October 22, 2004, the date of enactment. For taxable years beginning on or before the date of enactment, very little of our income will be qualifying income to a regulated investment company or mutual fund.company. Distributions to foreign persons will be reduced by withholding taxes at the highest effective U.S.
federal income tax rate for individuals, and foreign persons will be required to file federal income tax returns and pay tax on their share of our taxable income.
We are registered as a tax shelter. This may increase the risk of an IRS audit of us or a unitholder.
We are registered with the IRS as a "tax shelter." Our tax shelter registration number is 99061000009. The IRS requires that some types of entities, including some partnerships, register as "tax shelters" in response to the perception that they claim tax benefits that the IRS may believe to be unwarranted. As a result, we may be audited by the IRS and tax adjustments could be made. Any unitholder owning less than a 1% profits interest in us has very limited rights to participate in the income tax audit process. Further, any adjustments in our tax returns will lead to adjustments in the unitholders' tax returns and may lead to audits of unitholders' tax returns and adjustments of items unrelated to us. You will bear the cost of any expense incurred in connection with an examination of your personal tax return.
Recently issued Treasury Regulations require taxpayers to report certain information on Internal Revenue Service Form 8886 if they participate in a "reportable transaction." Unitholders may be required to file this form with the IRS if we participate in a "reportable transaction." A transaction may be a reportable transaction based upon any of several factors. Unitholders are urged to consult with their own tax advisor concerning the application of any of these factors to their investment in our common units. Congress is considering legislative proposals that, if enacted, would impose significant penalties for failure to comply with these disclosure requirements. The Treasury Regulations also impose obligations on "material advisors" that organize, manage or sell interests in registered "tax shelters." As stated above, we have registered as a tax shelter, and, thus, one of our material advisors will be required to maintain a list with specific information, including unitholder names and tax identification numbers, and to furnish this information to the IRS upon request. Unitholders are urged to consult with their own tax advisor concerning any possible disclosure obligation with respect to their investment and should be aware that we and our material advisors intend to comply with the list and disclosure requirements.
We treat a purchaser of units as having the same tax benefits without regard to the units purchased. The IRS may challenge this treatment, which could adversely affect the value of the units.
Because we cannot match transferors and transferees of common units, we have adopted depreciation and amortization positions that do not conform with all aspects of the Treasury regulations. A successful IRS challenge to those positions could adversely affect the amount of tax benefits available to you. It also could affect the timing of these tax benefits or the amount of gain from your sale of common units and could have a negative impact on the value of the common units or result in audit adjustments to your tax returns. Please read "Tax Considerations—Uniformity of Units" in this prospectus for further discussion of the effect of the depreciation and amortization positions we have adopted.
You will likely be subject to foreign, state and local taxes in jurisdictions where you do not live as a result of an investment in units.
In addition to federal income taxes, you will likely be subject to other taxes, including foreign taxes, state and local taxes, unincorporated business taxes and estate, inheritance or intangible taxes that are imposed by the various jurisdictions in which we do business or own property and in which you do not reside. We own property and conduct business in Canada and in most states in the United States. You may be required to file Canadian federal income tax returns and to pay Canadian federal and provincial income taxes and to file state and local income tax returns and pay state and local income taxes in many or all of the jurisdictions in which we do business or own property. Further, you may be subject to penalties for failure to comply with those requirements. It is your responsibility to file all federal, state, local and foreign tax returns. Our counsel has not rendered an opinion on the foreign, state or local tax consequences of an investment in the common units.
We will not receive any proceeds from the sale of common units by the selling unitholders.
PRICE RANGE OF COMMON UNITS AND DISTRIBUTIONS
As of September 30, 2004,April 18, 2005, there were 62,740,21867,293,108 common units outstanding, held by approximately 34032,000 holders of record, including common units held in street name. The number of common units outstanding on this date includes the 3,245,700 Class C common units and the 1,307,190 Class B common units that converted in February 2005. The common units are traded on the New York Stock Exchange under the symbol "PAA." An additional 1,307,190 Class B common units and 3,245,700 Class C common units were outstanding as of such date. The Class B common units are held by an affiliate of Plains Holdings Inc. and the Class C common units are held by six holders of record. The Class B common units and the Class C common units arepari passu with and have economic terms substantially similar to the common units but are not publicly traded. Holders of the Class B common units and the Class C common units have the right to demand a meeting of limited partners to vote on whether the Class B common units and Class C common units may be converted at the option of the holders into an equal number of common units. We anticipate that notice of the exercise of such right will be given on October 15, 2004.
The following table sets forth, for the periods indicated, the high and low sales prices for the common units, as reported on the New York Stock Exchange Composite Transactions Tape, and quarterly cash distributions declared per common unit. The last reported sale price of common units on the New York Stock Exchange on October 11, 2004April 18, 2005 was $36.41$38.84 per common unit.
| | Price Range | | Price Range | | ||||||||||||||
|---|---|---|---|---|---|---|---|---|---|---|---|---|---|---|---|---|---|---|
| | Cash Distributions per Unit(1) | Cash Distributions per Unit(1) | ||||||||||||||||
| | High | Low | High | Low | ||||||||||||||
| 2002 | ||||||||||||||||||
| First Quarter | $ | 26.79 | $ | 23.60 | $ | 0.5250 | ||||||||||||
| Second Quarter | 27.30 | 24.60 | 0.5375 | |||||||||||||||
| Third Quarter | 26.38 | 19.54 | 0.5375 | |||||||||||||||
| Fourth Quarter | 24.44 | 22.04 | 0.5375 | |||||||||||||||
2003 | ||||||||||||||||||
| First Quarter | $ | 26.90 | $ | 24.20 | $ | 0.5500 | $ | 26.90 | $ | 24.20 | $ | 0.5500 | ||||||
| Second Quarter | 31.48 | 24.65 | 0.5500 | 31.48 | 24.65 | 0.5500 | ||||||||||||
| Third Quarter | 32.49 | 29.10 | 0.5500 | 32.49 | 29.10 | 0.5500 | ||||||||||||
| Fourth Quarter | 32.82 | 29.76 | 0.5625 | 32.82 | 29.76 | 0.5625 | ||||||||||||
2004 | ||||||||||||||||||
| First Quarter | $ | 35.23 | $ | 31.18 | $ | 0.5625 | $ | 35.23 | $ | 31.18 | $ | 0.5625 | ||||||
| Second Quarter | 36.13 | 27.25 | 0.5775 | 36.13 | 27.25 | 0.5775 | ||||||||||||
| Third Quarter | 35.98 | 31.63 | (2) | 35.98 | 31.63 | 0.6000 | ||||||||||||
| Fourth Quarter (through October 11, 2004) | 36.99 | 35.76 | (2) | |||||||||||||||
| Fourth Quarter | 37.99 | 34.51 | 0.6125 | |||||||||||||||
2005 | ||||||||||||||||||
| First Quarter | $ | 40.98 | $ | 36.50 | $ | 0.6375 | ||||||||||||
| Second Quarter (through April 18, 2005) | $ | 39.61 | $ | 38.00 | (2) | |||||||||||||
SELECTED HISTORICAL FINANCIAL AND OPERATING DATA
We have derived the historical financial information and operating data below from our audited consolidated financial statements as of and for the years ended December 31, 2004, 2003, 2002, 2001, 2000 and 1999 and from our unaudited financial statements as of and for the six months ended June 30, 2004 and 2003.2000. The selected financial data should be read in conjunction with the consolidated financial statements, including the notes thereto, and "Management's Discussion and Analysis of Financial Condition and Results of Operations" included in this prospectus.
| | | Six Months Ended June 30, | Year Ended December 31, | Year Ended December 31, | ||||||||||||||||||||||||||||||||||||
|---|---|---|---|---|---|---|---|---|---|---|---|---|---|---|---|---|---|---|---|---|---|---|---|---|---|---|---|---|---|---|---|---|---|---|---|---|---|---|---|---|
| | | 2004 | 2003 | 2003 | 2002 | 2001 | 2000 | 1999 | 2004 | 2003 | 2002 | 2001 | 2000 | |||||||||||||||||||||||||||
| | | (in millions except per unit data) | (in millions except per unit data) | |||||||||||||||||||||||||||||||||||||
| Statement of operations data: | Statement of operations data: | |||||||||||||||||||||||||||||||||||||||
| Revenues | $ | 8,936.4 | $ | 5,991.1 | $ | 12,589.8 | $ | 8,384.2 | $ | 6,868.2 | $ | 6,641.2 | $ | 10,910.4 | ||||||||||||||||||||||||||
| Cost of sales and field operations (excluding LTIP charge) | 8,782.2 | 5,878.2 | 12,366.6 | 8,209.9 | 6,720.9 | 6,506.5 | 10,800.1 | |||||||||||||||||||||||||||||||||
| Revenues(10) | $ | 20,975.5 | $ | 12,589.8 | $ | 8,384.2 | $ | 6,868.2 | $ | 6,641.2 | ||||||||||||||||||||||||||||||
| Cost of sales and field operations (excluding LTIP charge)(10) | (20,641.1 | ) | (12,366.6 | ) | (8,209.9 | ) | (6,720.9 | ) | (6,506.5 | ) | ||||||||||||||||||||||||||||||
| Unauthorized trading losses and related expenses | Unauthorized trading losses and related expenses | — | — | — | — | — | 7.0 | 166.4 | — | — | — | — | (7.0 | ) | ||||||||||||||||||||||||||
| Inventory valuation adjustment | Inventory valuation adjustment | — | — | — | — | 5.0 | — | — | (2.0 | ) | — | — | (5.0 | ) | — | |||||||||||||||||||||||||
| LTIP charge—operations(1) | LTIP charge—operations(1) | 0.5 | — | 5.7 | — | — | — | — | (0.9 | ) | (5.7 | ) | — | — | — | |||||||||||||||||||||||||
| General and administrative expenses (excluding LTIP charge) | General and administrative expenses (excluding LTIP charge) | 35.1 | 25.2 | 50.0 | 45.7 | 46.6 | 40.8 | 23.2 | (75.8 | ) | (50.0 | ) | (45.7 | ) | (46.6 | ) | (40.8 | ) | ||||||||||||||||||||||
| LTIP charge—general and administrative(1) | LTIP charge—general and administrative(1) | 3.7 | — | 23.1 | — | — | — | — | (7.0 | ) | (23.1 | ) | — | — | — | |||||||||||||||||||||||||
| Depreciation and amortization | Depreciation and amortization | 29.1 | 22.2 | 46.8 | 34.0 | 24.3 | 24.5 | 17.3 | (67.2 | ) | (46.8 | ) | (34.0 | ) | (24.3 | ) | (24.5 | ) | ||||||||||||||||||||||
| Restructuring expense | — | — | — | — | — | — | 1.4 | |||||||||||||||||||||||||||||||||
| Total costs and expenses | Total costs and expenses | 8,850.6 | 5,925.6 | 12,492.3 | 8,289.6 | 6,796.8 | 6,578.8 | 11,008.4 | (20,794.0 | ) | (12,492.3 | ) | (8,289.6 | ) | (6,796.8 | ) | (6,578.8 | ) | ||||||||||||||||||||||
| Gain on sale of assets | Gain on sale of assets | 0.6 | — | 1.0 | 48.2 | 16.4 | 0.6 | 0.6 | — | 1.0 | 48.2 | |||||||||||||||||||||||||||||
| Asset impairment | (2.0 | ) | — | — | — | — | ||||||||||||||||||||||||||||||||||
| Operating income | Operating income | 85.7 | 65.4 | 98.2 | 94.6 | 72.4 | 110.6 | (81.6 | ) | 180.1 | 98.2 | 94.6 | 72.4 | 110.6 | ||||||||||||||||||||||||||
| Interest expense | Interest expense | (19.5 | ) | (17.7 | ) | (35.2 | ) | (29.1 | ) | (29.1 | ) | (28.7 | ) | (21.1 | ) | (46.7 | ) | (35.2 | ) | (29.1 | ) | (29.1 | ) | (28.7 | ) | |||||||||||||||
| Interest income and other, net(2) | Interest income and other, net(2) | 0.5 | — | (3.6 | ) | (0.2 | ) | 0.4 | (4.4 | ) | (0.6 | ) | (0.3 | ) | (3.6 | ) | (0.2 | ) | 0.4 | (4.4 | ) | |||||||||||||||||||
| Income (loss) from continuing operations before cumulative effect of change in accounting principle(12) | $ | 66.7 | $ | 47.7 | $ | 59.4 | $ | 65.3 | $ | 43.7 | $ | 77.5 | $ | (103.4 | ) | |||||||||||||||||||||||||
| Income from continuing operations before cumulative effect of change in accounting principle(2)(3) | $ | 133.1 | $ | 59.4 | $ | 65.3 | $ | 43.7 | $ | 77.5 | ||||||||||||||||||||||||||||||
| Basic net income (loss) per limited partner unit before cumulative effect of change in accounting principle(2)(12) | $ | 1.03 | $ | 0.87 | $ | 1.01 | $ | 1.34 | $ | 1.12 | $ | 2.13 | $ | (3.21 | ) | |||||||||||||||||||||||||
| Diluted net income (loss) per limited partner unit before cumulative effect of change in accounting principle(2)(12) | $ | 1.03 | $ | 0.87 | $ | 1.00 | $ | 1.34 | $ | 1.12 | $ | 2.13 | $ | (3.21 | ) | |||||||||||||||||||||||||
| Basic net income per limited partner unit before cumulative effect of change in accounting principle(2)(3) | $ | 1.94 | $ | 1.01 | $ | 1.34 | $ | 1.12 | $ | 2.13 | ||||||||||||||||||||||||||||||
| Diluted net income per limited partner unit before cumulative effect of change in accounting principle(2)(3) | $ | 1.94 | $ | 1.00 | $ | 1.34 | $ | 1.12 | $ | 2.13 | ||||||||||||||||||||||||||||||
| Basic weighted average number of limited partner units outstanding | Basic weighted average number of limited partner units outstanding | 60.0 | 51.2 | 52.7 | 45.5 | 37.5 | 34.4 | 31.6 | 63.3 | 52.7 | 45.5 | 37.5 | 34.4 | |||||||||||||||||||||||||||
| Diluted weighted average number of limited partner units outstanding | Diluted weighted average number of limited partner units outstanding | 60.0 | 51.2 | 53.4 | 45.5 | 37.5 | 34.4 | 31.6 | 63.3 | 53.4 | 45.5 | 37.5 | 34.4 | |||||||||||||||||||||||||||
Balance sheet data (at end of period): | Balance sheet data (at end of period): | |||||||||||||||||||||||||||||||||||||||
| Total assets | Total assets | 2,682.0 | 1,710.4 | 2,095.6 | 1,666.6 | 1,261.2 | 885.8 | 1,223.0 | $ | 3,160.4 | $ | 2,095.6 | $ | 1,666.6 | $ | 1,261.2 | $ | 885.8 | ||||||||||||||||||||||
| Total long-term debt(3)(4) | 934.8 | 526.5 | 519.0 | 509.7 | 354.7 | 320.0 | 424.1 | |||||||||||||||||||||||||||||||||
| Total debt(4) | 956.8 | 544.5 | 646.2 | 609.0 | 456.2 | 321.3 | 482.8 | |||||||||||||||||||||||||||||||||
| Total long-term debt(4) | 949.0 | 519.0 | 509.7 | 354.7 | 320.0 | |||||||||||||||||||||||||||||||||||
| Total debt | 1,124.5 | 646.3 | 609.0 | 456.2 | 321.3 | |||||||||||||||||||||||||||||||||||
| Partners' capital | Partners' capital | 865.6 | 600.8 | 746.7 | 511.6 | 402.8 | 214.0 | 193.0 | 1,070.2 | 746.7 | 511.6 | 402.8 | 214.0 | |||||||||||||||||||||||||||
Other data: | Other data: | |||||||||||||||||||||||||||||||||||||||
| Maintenance capital expenditures | Maintenance capital expenditures | $ | 3.1 | $ | 4.2 | $ | 7.6 | $ | 6.0 | $ | 3.4 | $ | 1.8 | $ | 1.7 | $ | 11.3 | $ | 7.6 | $ | 6.0 | $ | 3.4 | $ | 1.8 | |||||||||||||||
| Net cash provided by (used in) operating activities(5) | Net cash provided by (used in) operating activities(5) | 147.1 | 204.8 | 115.3 | 185.0 | (16.2 | ) | (33.5 | ) | (71.2 | ) | 104.0 | 115.3 | 185.0 | (16.2 | ) | (33.5 | ) | ||||||||||||||||||||||
| Net cash provided by (used in) investing activities(5) | Net cash provided by (used in) investing activities(5) | (474.6 | ) | (139.8 | ) | (272.1 | ) | (374.9 | ) | (263.2 | ) | 211.0 | (186.1 | ) | (651.2 | ) | (272.1 | ) | (374.9 | ) | (263.2 | ) | 211.0 | |||||||||||||||||
| Net cash provided by (used in) financing activities | Net cash provided by (used in) financing activities | 334.0 | 63.0 | 157.2 | 189.5 | 279.5 | (227.8 | ) | 305.6 | 554.5 | 157.2 | 189.5 | 279.5 | (227.8 | ) | |||||||||||||||||||||||||
| Declared distributions per limited partner unit(6)(7)(8) | Declared distributions per limited partner unit(6)(7)(8) | 1.13 | 1.09 | 2.19 | 2.11 | 1.95 | 1.83 | 1.59 | 2.30 | 2.19 | 2.11 | 1.95 | 1.83 | |||||||||||||||||||||||||||
Table continued on following page. | ||||||||||||||||||||||||||||||||||||||||
| | | Year Ended December 31, | ||||||||||||||||||||||||||||||||||
|---|---|---|---|---|---|---|---|---|---|---|---|---|---|---|---|---|---|---|---|---|---|---|---|---|---|---|---|---|---|---|---|---|---|---|---|---|
| | | 2004 | 2003 | 2002 | 2001 | 2000 | ||||||||||||||||||||||||||||||
Operating Data: | Operating Data: | Operating Data: | ||||||||||||||||||||||||||||||||||
| Volumes (thousands of barrels per day)(9) | Volumes (thousands of barrels per day)(9) | Volumes (thousands of barrels per day)(9) | ||||||||||||||||||||||||||||||||||
| Pipeline segment: | Pipeline segment: | Pipeline segment: | ||||||||||||||||||||||||||||||||||
| Tariff activities | Tariff activities | |||||||||||||||||||||||||||||||||||
| All American | 57 | 61 | 59 | 65 | 69 | 74 | 103 | All American | 54 | 59 | 65 | 69 | 74 | |||||||||||||||||||||||
| Link acquisition | 185 | N/A | N/A | N/A | N/A | N/A | N/A | Link acquisition | 283 | N/A | N/A | N/A | N/A | |||||||||||||||||||||||
| Capline | 112 | N/A | N/A | N/A | N/A | N/A | N/A | Capline | 123 | N/A | N/A | N/A | N/A | |||||||||||||||||||||||
| Basin | 273 | 245 | 263 | 93 | N/A | N/A | N/A | Basin | 265 | 263 | 93 | N/A | N/A | |||||||||||||||||||||||
| Other domestic(10) | 408 | 26 | 299 | 219 | 144 | 130 | 61 | Other domestic | 424 | 299 | 219 | 144 | 130 | |||||||||||||||||||||||
| Canada | 250 | 181 | 203 | 187 | 132 | N/A | N/A | Canada | 263 | 203 | 187 | 132 | N/A | |||||||||||||||||||||||
| Pipeline margin activities | 73 | 81 | 78 | 73 | 61 | 60 | 54 | Pipeline margin activities | 74 | 78 | 73 | 61 | 60 | |||||||||||||||||||||||
| Total | 1,358 | 829 | 902 | 637 | 406 | 264 | 218 | Total | 1,486 | 902 | 637 | 406 | 264 | |||||||||||||||||||||||
Gathering, marketing, terminalling and storage segment: | Gathering, marketing, terminalling and storage segment: | Gathering, marketing, terminalling and storage segment: | ||||||||||||||||||||||||||||||||||
| Lease gathering | 550 | 430 | 437 | 410 | 348 | 262 | 265 | Crude oil lease gathering | 589 | 437 | 410 | 348 | 262 | |||||||||||||||||||||||
| Bulk purchases(11) | 135 | 78 | 90 | 68 | 46 | 28 | 138 | Crude oil bulk purchases | 148 | 90 | 68 | 46 | 28 | |||||||||||||||||||||||
| Total | 685 | 508 | 527 | 478 | 394 | 290 | 403 | Total | 737 | 527 | 478 | 394 | 290 | |||||||||||||||||||||||
| LPG sales | LPG sales | 48 | 38 | 35 | 19 | N/A | ||||||||||||||||||||||||||||||
| LPG sales | 40 | 35 | 38 | 35 | 19 | N/A | N/A | |||||||||||||||||||||||||||||
MANAGEMENT'S DISCUSSION AND ANALYSIS OF
FINANCIAL CONDITION AND RESULTS OF OPERATIONS
The following discussion is intended to provide investors with an understanding of our financial condition and results of our operations and should be read in conjunction with our historical consolidated financial statements and accompanying notes included elsewhere in this prospectus.notes.
Our discussion and analysis includes the following:
Company Overview.Overview
Plains All American Pipeline, L.P. is a Delaware limited partnership formed in September of 1998. Our operations are conducted directly and indirectly through our operating subsidiaries, Plains Marketing, L.P., Plains Pipeline, L.P. and Plains Marketing Canada, L.P. We are engaged in interstate and intrastate crude oil transportation, and crude oil gathering, marketing, terminalling and storage, as well as the marketing and storage of liquefied petroleum gas and other petroleum products. We refer to liquified petroleum gas and other petroleum products collectively as "LPG." We ownhave an extensive network of pipeline transportation, terminalling, storage and gathering assets in key oil producing basins and at major market hubs in the United States and Canada.
We are one of the largest midstream crude oil companies in North America. As of June 30,December 31, 2004, we owned approximately 15,000 miles of active crude oil pipelines, approximately 37 million barrels of active terminalling and storage capacity and a full complement of truck transportation and injection assets.over 400 transport trucks. Currently, we handle an average of over 2.62.4 million barrels per day of physical crude oil through our extensive network of assets located in major oil producing regions of the United States and Canada. Our operations consist of two operating segments: (i) pipeline operations ("Pipeline Operations") and (ii) gathering, marketing, terminalling and storage operations ("GMT&S"). Through our pipeline segment, we engage in interstate and intrastate crude oil pipeline transportation and certain related margin activities. Through our GMT&S segment, we engage in purchases and resales of crude oil and LPG at various points along the distribution chain and we operate certain terminalling and storage assets.
Overview of Operating Results and Significant Activities
Six Months Ended June 30, 2004.During the first six months of 2004, we recognized net income and earnings per limited partner unit of $63.5$130.0 million and $0.98,$1.89, respectively, both of which was a 33%were substantial increases over 2003 and 13% increase, respectively, over the first six months of 2003.2002. The results for the first six months of 2004 as compared to the first six months of 2003two previous years include significant contributions from the acquisitions completed during the second half of 2003 and the first half of 2004. In addition, the 2004 results
include a non-cash gain of approximately $0.5 million resulting from the mark-to-market of open derivative instruments pursuant to Statement of Financial Accounting Standard No. 133, as amended ("SFAS 133"), while the first six months of 2003 includes a non-cash gain of approximately $1.1 million.
Significant events in the first six months of 2004 that affected The following significant activities impacted our operations, operating results of operations included the following:or our financial position during 2004:
Fiscal Year 2003. During 2003:
simplifying our capital structure. The conversion also triggered the vesting in 2003 and 2004 of a portion of the outstanding phantom units under our Long-Term Incentive Plan. During 2003, we accrued a portion of the estimated expense associated with the anticipated 2004 vesting, resulting in a charge of approximately $28.8 million.
Prospects for the Future.Future
We believe we have access to equity and debt capital and that we are well situated to optimize our position in and around our existing assets and to expand our asset base by continuing to consolidate, rationalize and optimize the North American crude oil infrastructure. We have deliberately configured
our assets to provide a counter-cyclical balance between our gathering and marketing activities and our terminalling and storage activities. We believe the combination of these balanced activities adds stability to the portion of our business that is highly cyclical, and with our relatively stable, fee-based pipeline assets, enables us to generate stable financial results in an industry that is highly cyclical.results.
During fiscal year 2004 we have further strengthened our positionbusiness by expanding our asset base through acquisitionacquisitions and internal growth projects. We operate in a mature industry and believe that our primary source of growth will come from acquisitions, and we believe that there are opportunities for acquisitions. We will continue to pursue the purchase of midstream crude oil assets, and we will also continue to initiate projects designed to optimize crude oil flows in the areas in which we operate. We believe the outlook is positive for, and have a strategic initiative of increasing our participation in, the importing of foreign crude oil, primarily through building a meaningful asset presence to enable us to receive foreign crude oil via the Gulf Coast. We also believe there are opportunities for us to grow our LPG business. In addition, we believe we can, and will pursue opportunities to, leverage our assets, business model, knowledge and expertise into investments in businesses complementary to our crude oil and LPG activities. Although we believe that we are well situated in the North American crude oil infrastructure, we face various operational, regulatory and financial challenges that may impact our ability to execute our strategy as planned. See "Risk Factors" and "Forward-Looking Statements"Factors—Risks Related to Our Business" for further discussion of these items. We can give no assurance that our current or future acquisition efforts will be successful or that any such acquisition will be completed on terms considered favorable to us.
We completed a number of acquisitions in 2004, 2003 and 2002 that have impacted the results of operations and liquidity discussed herein. The following acquisitions were accounted for, and the purchase price was allocated, in accordance with the purchase method of accounting. We adopted SFAS No. 141, "Business Combinations" in 2001 and followed the provisions of that statement for all business combinations initiated after June 30, 2001. Our ongoing acquisition activity is discussed further in "—Liquidity"Liquidity and Capital Resources" below.
2004 Acquisitions
During the first six months ofIn 2004, we have completed several acquisitions for aggregate consideration of approximately $506.1$549.5 million. The aggregate consideration includes cash paid, estimated transaction costs and assumed liabilities and net working capital items. The following table
summarizes our 2004 acquisitions, (in millions) for the first six months of 2004, and a description of each of these follows the table:
| Acquisition | Effective Date | Acquisition Price | Operating Segment | |||||
|---|---|---|---|---|---|---|---|---|
| Capline and Capwood Pipeline Systems | 03/01/04 | $ | 158.5 | Pipeline | ||||
| Link Energy LLC | 04/01/04 | 326.1 | Pipeline/GMT&S | |||||
| Cal Ven Pipeline System | 05/01/04 | 19.0 | Pipeline | |||||
| Other(1) | 06/01/04 | 2.5 | Pipeline | |||||
| Total 2004 Acquisitions through June 30, 2004 | $ | 506.1 | ||||||
| Acquisition | Effective Date | Acquisition Cost | Operating Segment | |||||
|---|---|---|---|---|---|---|---|---|
| Capline and Capwood Pipeline System | 03/01/04 | $ | 158.5 | Pipeline | ||||
| Link Energy LLC | 04/01/04 | 332.3 | Pipeline/GMT&S | |||||
| Cal Ven Pipeline System | 05/01/04 | 19.0 | Pipeline | |||||
| Schaefferstown Propane Storage Facility | 08/25/04 | 32.0 | GMT&S | |||||
| Other | various | 7.7 | GMT&S | |||||
| Total 2004 Acquisitions | $ | 549.5 | ||||||
Capline and Capwood Pipeline Systems. In March 2004, we completed the acquisition of all of Shell Pipeline Company LP's interests in two entities for approximately $158.0 million in cash (including a $15.8 million deposit paid in December 2003) and approximately $0.5 million of transaction and other costs. In December 2003, subsequent to the announcement of the acquisition and in anticipation of closing, we issued approximately 2.8 million common units for net proceeds of approximately $88.4 million, after paying approximately $4.1 million of transaction costs. The proceeds
from this issuance were used to pay down the outstanding balances under our revolving credit facility. At closing, the cash portion of this acquisition was funded from cash on hand and borrowings under our revolving credit facility.
The principal assets of the entities are: (i) an approximate 22% undivided joint interest in the Capline Pipeline System, and (ii) an approximate 76% undivided joint interest in the Capwood Pipeline System. The Capline Pipeline System is a 633-mile, 40-inch mainline crude oil pipeline originating in St. James, Louisiana, and terminating in Patoka, Illinois. The Capwood Pipeline System is a 57-mile, 20-inch mainline crude oil pipeline originating in Patoka, Illinois, and terminating in Wood River, Illinois. The results of operations and assets from this acquisition (the "Capline acquisition") have been included in our consolidated financial statements and in our pipeline operations segment since March 1, 2004. These pipelines provide one of the primary transportation routes for crude oil shipped into the Midwestern U.S. and delivered to several refineries and other pipelines.
The purchase price was allocated as follows (in millions):
| Crude oil pipelines and facilities | Crude oil pipelines and facilities | $ | 151.4 | $ | 151.4 | ||
| Crude oil storage and terminal facilities | Crude oil storage and terminal facilities | 5.7 | 5.7 | ||||
| Land | Land | 1.3 | 1.3 | ||||
| Office equipment and other | Office equipment and other | 0.1 | 0.1 | ||||
| Total | $ | 158.5 | $ | 158.5 | |||
Link Energy LLC. On April 1, 2004, we completed the acquisition of all of the North American crude oil and pipeline operations of Link for approximately $326$332 million, including $268 million of cash (net of approximately $5.5 million subsequently returned to PAA from an indemnity escrow account) and approximately $58$64 million of net liabilities assumed and acquisition related costs. The Link crude oil business consists of approximately 7,000 miles of active crude oil pipeline and gathering systems, over 10 million barrels of active crude oil storage capacity, a fleet of approximately 200 owned or leased trucks and approximately 2 million barrels of crude oil linefill and working inventory. The Link assets complement our assets in West Texas and along the Gulf Coast and allow us to expand our presence in the Rocky Mountain and Oklahoma/Kansas regions. The results of operations and assets from this acquisition (the "Link acquisition") have been included in our consolidated financial statements and both our pipeline operations and GMT&S operations segments since April 1, 2004.
The purchase price was allocated as follows and includes goodwill primarily related to Link's gathering and marketing business (in millions):
| Fair value of assets acquired: | |||||||||||
| Cash paid for acquisition(1) | Cash paid for acquisition(1) | $ | 268.0 | ||||||||
Fair value of net liabilities assumed: | Fair value of net liabilities assumed: | ||||||||||
| Accounts receivable(2) | Accounts receivable(2) | 409.4 | |||||||||
| Other current assets | Other current assets | 1.8 | |||||||||
| Accounts payable and accrued liabilities(2) | Accounts payable and accrued liabilities(2) | (459.6 | ) | ||||||||
| Other current liabilities | Other current liabilities | (8.5 | ) | ||||||||
| Other long-term liabilities | Other long-term liabilities | (7.4 | ) | ||||||||
| Total net liabilities assumed | (64.3 | ) | |||||||||
| Total purchase price | Total purchase price | $ | 332.3 | ||||||||
Purchase price allocation | Purchase price allocation | ||||||||||
| Property and equipment | Property and equipment | $ | 256.3 | Property and equipment | $ | 260.2 | |||||
| Inventory | Inventory | 1.1 | Inventory | 3.4 | |||||||
| Linefill | Linefill | 48.4 | Linefill | 55.4 | |||||||
| Inventory in third party assets | Inventory in third party assets | 15.1 | Inventory in third party assets | 8.1 | |||||||
| Goodwill | Goodwill | 5.0 | Goodwill | 5.0 | |||||||
| Other long term assets | Other long term assets | 0.2 | Other long term assets | 0.2 | |||||||
| Subtotal | 326.1 | Total | $ | 332.3 | |||||||
Accounts receivable | 405.4 | ||||||||||
| Other current assets | 1.8 | ||||||||||
| Subtotal | 407.2 | ||||||||||
Total assets acquired | 733.3 | ||||||||||
Fair value of liabilities assumed: | |||||||||||
| Accounts payable and accrued liabilities | (448.9 | ) | |||||||||
| Other current liabilities | (8.5 | ) | |||||||||
| Other long-term liabilities | (7.4 | ) | |||||||||
| Total liabilities assumed | 464.8 | ||||||||||
Cash paid for acquisition(1) | $ | 268.5 | |||||||||
We areThe total purchase price includes (i) $9.4 million in transaction costs, (ii) approximately $7.4 million related to a plan to involuntarily terminate and relocate employees in conjunction with the acquisition, and (iii) approximately $11.0 million related to costs to terminate a contract assumed in the processacquisition. These activities are substantially complete and the majority of evaluating certain estimates made in the purchase price allocation; thus, the allocation is subject to refinement.related costs have been incurred as of December 31, 2004. In addition, we anticipate making capital expenditures of approximately $20.0$28.0 million ($9.018.0 million of which will be spent in 2004)2005) to upgrade certain of the assets and comply with certain regulatory requirements.
On April 2, 2004, the Office of the Attorney General of Texas (the "Texas AG") delivered written notice to us that itThe acquisition was investigating the possibility that the acquisition of Link's assets might reduce competition in one or more markets within the petroleum products industry in the State of Texas.initially funded with cash on hand and borrowings under our existing credit facilities as well as under a new $200 million, 364-day credit facility. In connection with the Link purchase, both PAA and Linkacquisition, on April 15, 2004, we completed all necessary filings required under the Hart-Scott-Rodino Act,private placement of 3,245,700 Class C common units to a group of institutional investors. During the third quarter of 2004, we completed a public offering of common units and the required 30-day waiting period expired on March 24, 2004 without any inquiry or request for additional information from the U.S. Departmentsale of Justice or the Federal Trade Commission. Representatives from the Antitrust and Civil Medicaid Fraud Divisionunsecured senior notes. A portion of the Texas AG indicated their investigationproceeds from these transactions was prompted by complaints received from allegedly interested industry parties regardingused to retire the potential impact on competition in the Permian Basin area of West Texas. We understand that similar complaints have been received by the Federal Trade Commission, and that, consistent with federal-state protocols for conducting joint merger investigations, appropriate federal and state antitrust authorities are coordinating their activities. In connection with the April notice and again in June 2004, the Texas AG requested information from us. We have complied with these requests and are cooperating fully with the antitrust enforcement authorities.$200 million, 364-day credit facility.
Cal Ven Pipeline System. On May 7, 2004 we completed the acquisition of the Cal Ven Pipeline System from Cal Ven Limited, a subsidiary of Unocal Canada Limited. The total purchase price was approximately $19 million, including transaction costs. The transaction was funded through a combination of cash on hand and borrowings under our revolving credit facilities. The Cal Ven Pipeline
System includes approximately 195 miles of 8-inch and 10-inch gathering and mainline crude oil pipelines. The system is located in northern Alberta and delivers crude oil into the Rainbow Pipeline System. The Rainbow Pipeline System then transports the crude south to the Edmonton market, where it can be used in local refineries or shipped on connecting pipelines to the U.S. market. The results of
operations and assets from this acquisition have been included in our consolidated financial statements and our pipeline operations segment since May 1, 2004.
Schaefferstown Propane Storage Facility. In August 2004, we completed the acquisition of the Schaefferstown Propane Storage Facility from Koch Hydrocarbon, L.P. The total purchase price was approximately $32 million, including transaction costs. In connection with the transaction, we also acquired an additional $14.2 million of inventory. The transaction was funded through a combination of cash on hand and borrowings under our revolving credit facilities. The results of operations and assets from this acquisition have been included in our consolidated financial statements and our gathering, marketing, terminalling and storage operations segment since August 25, 2004.
2003 Acquisitions
During 2003, we completed ten acquisitions for aggregate consideration of approximately $159.5 million. The aggregate consideration includes cash paid, estimated transaction costs, assumed liabilities and estimated near-term capital costs. The acquisitions were initially financed with borrowings under our credit facilities, which were subsequently repaid with a portion of the proceeds from our equity issuances and the issuance of senior notes. See "—Liquidity and Capital Resources." The businesses acquired during 2003 impacted our results of operations subsequent tocommencing on the effective date of each acquisition as indicated below. These acquisitions included mainline crude oil pipelines, crude oil gathering lines, terminal and storage facilities, and an underground LPG storage facility. With the exception of $0.5 million that was allocated to goodwill and other intangible assets and $4.7 million associated with crude oil linefill and working inventory, the remaining aggregate purchase price was allocated to property and equipment. The following table details our 2003 acquisitions (in millions):
| Acquisition | Acquisition | Effective Date | Acquisition Price | Operating Segment | Effective Date | Acquisition Price | Operating Segment | |||||||||
|---|---|---|---|---|---|---|---|---|---|---|---|---|---|---|---|---|
| Red River Pipeline System | Red River Pipeline System | 02/01/03 | $ | 19.4 | Pipeline | 02/01/03 | $ | 19.4 | Pipeline | |||||||
| Iatan Gathering System | Iatan Gathering System | 03/01/03 | 24.3 | Pipeline | 03/01/03 | 24.3 | Pipeline | |||||||||
| Mesa Pipeline Facility | Mesa Pipeline Facility | 05/05/03 | 2.9 | Pipeline | Mesa Pipeline Facility | 05/05/03 | 2.9 | Pipeline | ||||||||
| South Louisiana Assets | South Louisiana Assets | 06/01/03 | 13.4 | Pipeline/GMT&S | South Louisiana Assets | 06/01/03 | 13.4 | Pipeline/G,M,T,&S | ||||||||
| Alto Storage Facility | Alto Storage Facility | 06/01/03 | 8.5 | GMT&S | 06/01/03 | 8.5 | G,M,T&S | |||||||||
| Iraan to Midland Pipeline System | Iraan to Midland Pipeline System | 06/30/03 | 17.6 | Pipeline | 06/30/03 | 17.6 | Pipeline | |||||||||
| ArkLaTex Pipeline System | ArkLaTex Pipeline System | 10/01/03 | 21.3 | Pipeline/GMT&S | 10/01/03 | 21.3 | Pipeline | |||||||||
| South Saskatchewan Pipeline System | South Saskatchewan Pipeline System | 11/01/03 | 47.7 | Pipeline | 11/01/03 | 47.7 | Pipeline | |||||||||
| Atchafalaya Pipeline System | Atchafalaya Pipeline System | 12/01/03 | 4.4 | Pipeline | Atchafalaya Pipeline System | 12/01/03 | 4.4 | Pipeline | ||||||||
| Total 2003 Acquisitions | $ | 159.5 | ||||||||||||||
| Total 2003 Acquisitions | $ | 159.5 | ||||||||||||||
2002 Acquisitions
Shell West Texas Assets. On August 1, 2002, we acquired interests in approximately 2,000 miles of gathering and mainline crude oil pipelines and approximately 9.0 million barrels (net to our interest) of above-groundabove ground crude oil terminalling and storage assets in West Texas from Shell Pipeline Company LP and Equilon Enterprises LLC (the "Shell acquisition") for approximately $324 million. The primary assets included in the transaction are interests in the Basin Pipeline System, the Permian Basin Gathering System and the Rancho Pipeline System. The entire purchase price was allocated to property and equipment.
The acquired assets are primarily fee-based mainline crude oil pipeline transportation assets that gather crude oil in the Permian Basin and transport the crude oil to major market locations in the Mid-Continent and Gulf Coast regions. The Permian Basin has long been one of the most stable crude
oil producing regions in the United States, dating back to the 1930s. The acquired assets complement our existing asset infrastructure in West Texas and represent a transportation link to Cushing, Oklahoma, where we provide storage and terminalling services. In addition, we believe that the Basin Pipeline System is poised to benefit from potential shut-downs of refineries and other pipelines due to the shifting market dynamics in the West Texas area. The Rancho Pipeline System was taken out of service in March 2003, pursuant to the operating agreement. See "Business—Acquisitions and Dispositions—Shutdown and Partial Sale of Rancho Pipeline System."
Other 2002 Acquisitions. During February and March of 2002, we completed two other acquisitions for aggregate consideration totaling $15.9 million, with effective dates of February 1, 2002 and March 31, 2002, respectively. These acquisitions include an equity interest in a crude oil pipeline company and crude oil gathering and marketing assets.
2001 Acquisitions
CANPET Energy Group. In July 2001, we acquired the assets of CANPET Energy Group Inc., a Calgary-based Canadian crude oil and LPG marketing company (the "CANPET acquisition"), for approximately $24.6 million plus excess inventory at the closing date of approximately $25.0 million. A portion of the purchase price, payable in common units or cash, at our option, was deferred subject to various performance standards being met. On April 30, 2004, we satisfied the deferred payment with the issuance of approximately 385,000 common units (representing approximately $13.1 million in value as of the date of issuance) and the payment of $6.5 million in cash. In addition, an incremental $3.7 million in cash was paid for the distributions that would have been paid on the common units had they been outstanding since the effective date of the acquisition.
At the time of the acquisition, CANPET's activities consisted of gathering approximately 75,000 barrels per day of crude oil and marketing an average of approximately 26,000 barrels per day of natural gas liquids or LPGs. The principal assets acquired include a crude oil handling facility, a 130,000-barrel tank facility, LPG facilities, existing business relationships and operating inventory. The acquired assets are part of our strategy to establish a Canadian operation that complements our operations in the United States. The purchase price, as adjusted for post-closing adjustments of $1.0 million, was allocated as follows (in millions):
| Inventory | $ | 28.1 | ||
| Goodwill | 35.4 | |||
| Intangible assets (contracts) | 1.0 | |||
| Pipeline linefill | 4.3 | |||
| Crude oil gathering, terminalling and other assets | 5.1 | |||
| Total | $ | 73.9 | ||
Murphy Oil Company Ltd. Midstream Operations. In May 2001, we completed the acquisition of substantially all of the Canadian crude oil pipeline, gathering, storage and terminalling assets of Murphy Oil Company Ltd. for approximately $158.4 million in cash after post-closing adjustments, including financing and transaction costs (the "Murphy acquisition"). Initial financing for the acquisition was provided through borrowings under our credit facilities. The purchase price included $6.5 million for excess inventory in the pipeline systems. The principal assets acquired include approximately 560 miles of crude oil and condensate mainlines (including dual lines on which condensate is shipped for blending purposes and blended crude is shipped in the opposite direction) and associated gathering and lateral lines, approximately 1.1 million barrels of crude oil storage and terminalling capacity located primarily in Kerrobert, Saskatchewan, approximately 254,000 barrels of pipeline linefill and tank inventories, and 121 trailers used primarily for crude oil transportation. The
acquired assets are part of our strategy to establish a Canadian operation that complements our operations in the United States.
Murphy agreed to continue to transport production from fields previously delivering crude oil to these pipeline systems, under a long-term contract. At the time of acquisition, these volumes averaged approximately 11,000 barrels per day. Total volumes transported on the pipeline system in 2001 were approximately 223,000 barrels per day of light, medium and heavy crudes, as well as condensate.
The purchase price, as adjusted post-closing, was allocated as follows (in millions):
| Crude oil pipeline, gathering and terminal assets | $ | 148.0 | ||
| Pipeline linefill | 7.6 | |||
| Networking capital items | 2.0 | |||
| Other property and equipment | 0.5 | |||
| Other assets, including debt issue costs | 0.3 | |||
| Total | $ | 158.4 | ||
Other 2001 Acquisitions. In December 2001, we consummated the acquisition of the Wapella Pipeline System from private investors for approximately $12.0 million, including transaction costs. The entire purchase price was allocated to property and equipment. The system further expands our market in Canada.
Critical Accounting Policies and Estimates
Our critical accounting policies are discussed in Note 2 to the Consolidated Financial Statements. The preparation of financial statements in conformity with accounting principles generally accepted in the United States requires us to make estimates and assumptions that affect the reported amounts of assets and liabilities, as well as the disclosure of contingent assets and liabilities, at the date of the financial statements. Such estimates and assumptions also affect the reported amounts of revenues and expenses during the reporting period. Although we believe these estimates are reasonable, actual results could differ from these estimates. The critical accounting policies that we have identified are discussed below.
Purchase and Sales AccrualsAccruals.
We routinely make accruals based on estimates for certain components of our revenues and cost of sales due to the timing of compiling billing information, receiving third-party information and reconciling our records with those of third parties. Where applicable, these accruals are based on nominated volumes expected to be purchased, transported and subsequently sold. Uncertainties involved in these estimates include levels of production at the wellhead, access to certain qualities of crude oil, pipeline capacities and delivery times, utilization of truck fleets to transport volumes to their destinations, weather, market conditions and other forces beyond our control. These estimates are generally associated with a portion of the last month of each reporting period. We currently estimate that less than 2% of total annual revenues and cost of sales are recorded using estimates and less than 8%5% of total quarterly revenues and cost of sales are recorded using estimates. Accordingly, a variance from this estimate of 10% would impact the respective line items by less than 1% on both an annual and quarterly basis. Although the resolution of these uncertainties has not historically had a material impact on our reported results of operations or financial condition, because of the high volume, low margin nature of our business, we cannot provide assurance that actual amounts will not vary significantly from estimated amounts. Variances from estimates are reflected in the period actual results become known, typically in the month following the estimate.
Mark-to-Market AccrualAccrual.
In situations where we are required to make mark-to-market estimates pursuant to SFAS 133, the estimates of gains or losses at a particular period end do not reflect the end results of particular transactions, and will most likely not reflect the actual gain or loss at the conclusion of a transaction. We reflect estimates for these items based on our internal records and information from third parties. A portion of the estimates we use are based on internal models or models of third parties because they are not quoted on a national market. Additionally, values may vary among different models due to a difference in assumptions applied such as the estimate of prevailing market prices, volatility, correlations and other factors and may not be reflective of the price at which they can be settled due to the lack of a liquid market. Less than 1% of total revenues are based on
estimates derived from these models. Although the resolution of these uncertainties has not historically had a material impact on our results of operations or financial condition, we cannot provide assurance that actual amounts will not vary significantly from estimated amounts.
Contingent Liability AccrualsAccruals.
We accrue reserves for contingent liabilities including, but not limited to, environmental remediation, insurance claims, asset retirement obligations and potential legal claims. Accruals are made when our assessment indicates that it is probable that a liability has occurred and the amount of liability can be reasonably estimated. Our estimates are based on all known facts at the time and our assessment of the ultimate outcome. Among the many uncertainties that impact our estimates are the necessary regulatory approvals for, and potential modification of, our remediation plans, the limited amount of data available upon initial assessment of the impact of soil or water contamination, changes in costs associated with environmental remediation services and equipment, costs of medical care associated with worker's compensation and employee health insurance claims, and the possibility of existing legal claims giving rise to additional claims. Our estimates andfor contingent liability accruals are increased or decreased as additional information is obtained or resolution is achieved. A variance of 10% in our aggregate estimate for the contingent liabilities discussed above would have an approximate $3.0$2.3 million impact on earnings. Although the resolution of these uncertainties has not historically had a material impact on our results of operations or financial condition, we cannot provide assurance that actual amounts will not vary significantly from estimated amounts.
Fair Value of Assets and Liabilities Acquired and Identification of Associated Goodwill and Intangible AssetsAssets.
In conjunction with each acquisition, we must allocate the cost of the acquired entity to the assets and liabilities assumed based on their estimated fair values at the date of acquisition. We also estimate the amount of transaction costs that will be incurred in connection with each acquisition. As additional information becomes available, we may adjust the original estimates within a short time period subsequent to the acquisition. In addition, in conjunction with the adoption of SFAS 141, we are required to recognize intangible assets separately from goodwill. Goodwill and intangible assets with indefinite lives are not amortized but instead are periodically assessed for impairment. The impairment testing entails estimating future net cash flows relating to the asset, based on management's estimate of market conditions including pricing, demand, competition, operating costs and other factors. Intangible assets with finite lives are amortized over the estimated useful life determined by management. Determining the fair value of assets and liabilities acquired, as well as intangible assets that relate to such items as customer relationships, contracts, and industry expertise involves professional judgment and is ultimately based on acquisition models and management's assessment of the value of the assets acquired and, to the extent available, third party assessments. Uncertainties associated with these estimates include changes in production decline rates, production interruptions, fluctuations in refinery capacity or product slates, economic obsolescence factors in the area and potential future sources of
cash flow. Although the resolution of these uncertainties has not historically had a material impact on our results of operations or financial condition, we cannot provide assurance that actual amounts will not vary significantly from estimated amounts.
Recent Accounting Pronouncements and Change in Accounting Principle
Recent Accounting Pronouncements
Buy/sell transactions. The Emerging Issues Task Force ("EITF") is currently considering Issue No. 04-13, "Accounting for Purchases and Sales of Inventory with the Same Counterparty," ("EITF No. 04-13"), which relates to buy/sell transactions. The issues to be addressed by the EITF are i) under what circumstances should two or more transactions with the same counterparty be viewed as a single nonmonetary transaction within the scope of APB No. 29; and ii) if nonmonetary transactions within the scope of APB No. 29 involve inventory, are there any circumstances under which the transactions should be recognized at fair value.
Buy/sell transactions are contractual arrangements in which we agree to buy a specific quantity and quality of crude oil or LPG to be delivered at a specific location while simultaneously agreeing to sell a specified quantity and quality of crude oil or LPG at a different location, usually with the same counterparty. These arrangements are generally designed to increase our margin through a variety of methods, including reducing our transportation or storage costs or acquiring a grade of crude oil that more closely matches our physical delivery requirement to one of our other customers. The value difference between purchases and sales is referred to as margin and is primarily due to grade, quality or location differentials. All buy/sell transactions result in us making or receiving physical delivery of the product, involve the attendant risks and rewards of ownership, including title transfer, assumption of environmental risk, transportation scheduling, credit risk and counterparty nonperformance risk, and such transactions are settled in cash similar to all other purchases and sales. Accordingly, such transactions are recorded in both revenues and purchases as separate sales and purchase transactions on a "gross" basis.
We believe that buy/sell transactions are monetary in nature and thus outside the scope of APB Opinion No. 29, "Accounting for Nonmonetary Transactions" ("APB No. 29"). Additionally, we have evaluated EITF No. 99-19, "Reporting Revenue Gross as a Principal versus Net as an Agent" ("EITF No. 99-19") and, based on that evaluation, we believe that recording these transactions on a gross basis is appropriate. If the EITF were to determine that these transactions should be accounted for as monetary transactions on a gross basis, no change in our accounting policy for buy/sell transactions would be necessary. If the EITF were to determine that these transactions should be accounted for as nonmonetary transactions qualifying for fair value recognition and require a net presentation of such transactions, the amounts of revenues and purchases associated with buy/sell transactions would be netted in our consolidated statement of operations, but there would be no effect on operating income, net income or cash flows from operating activities. If the EITF were to determine that these transactions should be accounted for as nonmonetary transactions not qualifying for fair value recognition, these amounts of revenues and purchases would be netted in our consolidated statement of operations and there could be an impact on operating income and net income related to the timing of the ultimate sale of product purchased in the "buy" side of the buy/sell transaction. However, we do not believe any impact on operating income, net income or cash flows from operating activities would be material.
Earnings per Unit. In March 2004, the Emerging Issues Task Force issued Issue No. 03-06 ("EITF 03-06"), "Participating Securities and the Two-Class Method under FASB Statement No. 128." EITF 03-06 addresses a number of questions regarding the computation of earnings per share by companies that have issued securities, other than common stock, that contractually entitle the holder to participate in dividends and earnings of the company when, and if, it declares dividends on its common stock. The issue also provides further guidance in applying the two-class method of calculating earnings per share, clarifying what constitutes a participating security and how to apply the two-class method of computing earnings per share once it is determined that a security is participating, including how to allocate undistributed earnings to such a security. EITF 03-06 was effective for fiscal periods beginning after March 31, 2004. The adoption of EITF 03-06 may have an impact on earnings per limited partner unit in future periods if net income exceeds distributions or if other participating securities are issued. The effect of applying EITF 03-06 on prior periods was not material except for the year ended December 31, 2000, which has been restated as shown below.
Basic and Diluted Income Before Extraordinary Item and Cumulative Effect of Change in Accounting Principle per Limited Partner Unit:
| | 2000 | For the Year Ended December 31, 2000 | ||||
|---|---|---|---|---|---|---|
| Prior to the adoption of SFAS 145(1) or EITF 03-06 | $ | 2.64 | $ | 2.64 | ||
| After the adoption of SFAS 145 but prior to the adoption of EITF 03-06 | $ | 2.20 | $ | 2.20 | ||
| After the adoption of both SFAS 145 and EITF 03-06 | $ | 2.13 | $ | 2.13 | ||
Change in Accounting Principle
During the second quarter of 2004, we changed our method of accounting for pipeline linefill in third party assets. Historically, we have viewed pipeline linefill, whether in our assets or third party assets, as having long-term characteristics rather than characteristics typically associated with the short-term classification of operating inventory. Therefore, previously we have not included linefill barrels in the same average costcosting calculation as our operating inventory, but instead have carried linefill at historical cost. Following this change in accounting principle, the linefill in third party assets that we have historically classified as a portion of "Pipeline Linefill" on the face of the balance sheet (a long-term asset) and carried at historical cost, will beis included in "Inventory" (a current asset) in determining the average cost of operating inventory and applying the lower of cost or market analysis. At the end of each period, we will reclassify the linefill in third party assets not expected to be liquidated within the succeeding twelve months out of "Inventory" (a current asset), at average cost, and into "Inventory in Third Party Assets" (a long-term asset), which is now reflected as a separate line item within other assets on the consolidated balance sheet.
This change in accounting principle iswas effective January 1, 2004 and is reflected in theour consolidated statement of operations for the six monthsyear ended June 30,December 31, 2004 and theour consolidated balance sheet as of June 30,December 31, 2004. The cumulative effect of this change in accounting principle as of January 1, 2004, is a charge of approximately $3.1 million, representing a reduction in Inventory of approximately $1.7 million, a reduction in Pipeline Linefill of approximately $30.3 million and an increase in Inventory
in Third Party Assets of $28.9 million. The pro forma impact for the second quarter ofperiods ended December 31, 2003 was not material to net income or net income per basic and diluted limited partner unit. The pro forma impact for the first half of 2003 would have been an increase to net income of approximately $1.8 million ($0.04 per basic and diluted limited partner unit) resulting in pro forma net income of $49.6 million and pro forma net income per limited partner unit (basic and diluted) of $0.91.2002 is detailed below:
| | Reported Year Ended December 31, | Impact of Change in Accounting Principle Year Ended December 31, | Pro Forma Year Ended December 31, | |||||||||||||||
|---|---|---|---|---|---|---|---|---|---|---|---|---|---|---|---|---|---|---|
| | 2003 | 2002 | 2003 | 2002 | 2003 | 2002 | ||||||||||||
| Net income | $ | 59.5 | $ | 65.3 | $ | 2.0 | $ | (0.1 | ) | $ | 61.5 | $ | 65.2 | |||||
| Basic income per limited partner unit | $ | 1.01 | $ | 1.34 | $ | 0.04 | $ | — | $ | 1.05 | $ | 1.34 | ||||||
| Diluted income per limited partner unit | $ | 1.00 | $ | 1.34 | $ | 0.04 | $ | — | $ | 1.04 | $ | 1.34 | ||||||
In conjunction with this change in accounting principle, we will classifyhave classified cash flows associated with purchases and sales of linefill on assets that we own as cash flows from investing activities instead of the historical classification asof cash flows from operating activities. Accordingly, theour statement of cash flows for the six monthsyears ended June 30,December 31, 2003 and 2002 has been revised to reclassify the cash paid for linefill in assets owned from operating activities to investing activities. The effect of the reclassification was an increase to net cash provided by operating activities and net cash used in investing activities of $28.5 million for the six months ended June 30, 2003. As a result of this change in classification, net cash provided by operating activities for the years ended December 31, 2003 and 2002 would increaseincreased to $115.3 million from $68.5 million and to $185.0 million from $173.9 million, respectively.
Net cash used in investing activities for the years ended December 31, 2003 and 2002 would increaseincreased to $272.1 million from $225.3 million and $374.8 million from $363.8 million, respectively. In addition, net cash used in operating activities for the year ended December 31, 2001 would decrease from $30 million to $16.2 million and net cash used in investing activities would increase to $263.2 million from $249.5 million. This change in classification had no impact on the years ended 2000 and 1999.
Analysis of Operating Segments
Our operations consist of two operating segments: (1) our(i) Pipeline Operations through whichand (ii) GMT&S Operations. Through our pipeline segment, we engage in interstate and intrastate crude oil pipeline transportation and certain related merchant activities; and (2)margin activities. Through our GMT&S Operations, through whichsegment, we engage in purchases and resales of crude oil and LPG at various points along the distribution chain and the operation ofwe operate certain terminalling and storage assets. We believe that the combination of our terminalling and storage activities and gathering and marketing activities provides a counter-cyclical balance that has a stabilizing effect on our results of operations and cash flow. In a contango market (oil prices for future deliveries are higher than for current deliveries), we use our tankage to improve our gathering margins by storing crude oil we have purchased at lower prices in the current month for delivery at higher prices in future months. In a backwardated market (oil prices for future deliveries are lower than for current deliveries), we use less storage capacity, but increased marketing margins (premiums for prompt delivery) provide an offset to this reduced cash flow.
We evaluate segment performance based on segment profit and maintenance capital. We define segment profit as revenues less (i) purchases, (ii) field operating costs and (iii) segment general and administrative ("G&A") expenses. Each of the items above excludes depreciation and amortization. As a master limited partnership, we make quarterly distributions of our "available cash" (as defined in our partnership agreement) to our unitholders. Therefore, we look at each period's earnings before non-cash depreciation and amortization as an important measure of segment performance. The exclusion of depreciation and amortization expense could be viewed as limiting the usefulness of segment profit as a performance measure because it does not account in current periods for the implied reduction in value of our capital assets, such as crude oil pipelines and facilities, caused by aging and wear and tear. Management compensates for this limitation by recognizing that depreciation and amortization are largely offset by repair and maintenance costs, which keep the actual value of our principal fixed assets from declining. These maintenance costs are a component of field operating costs included in segment profit or in maintenance capital, depending on the nature of the cost. Maintenance capital consists of capital expenditures required either to maintain the existing operating capacity of partially or fully depreciated assets or to extend their useful lives. Capital expenditures made to expand our existing capacity, whether through construction or acquisition, are not considered maintenance capital expenditures. Repair and maintenance expenditures associated with existing assets that do not extend the useful life or expand the operating capacity are charged to expense as incurred. See Note 14 "Operating Segments" in the "Notes to the Consolidated Financial Statements" for a reconciliation of
segment profit to consolidated income before cumulative effect of change in accounting principle. The following table reflects our results of operations and maintenance capital for each segment.
| | Pipeline Operations | GMT&S Operations | |||||
|---|---|---|---|---|---|---|---|
| | (in millions) | ||||||
| Year Ended December 31, 2004(1) | |||||||
| Revenues | $ | 874.9 | $ | 20,223.5 | |||
| Purchases | (554.6 | ) | (19,992.8 | ) | |||
| Field operating costs (excluding LTIP charge) | (121.1 | ) | (97.5 | ) | |||
| LTIP charge—operations | (0.1 | ) | (0.8 | ) | |||
| Segment G&A expenses (excluding LTIP charge)(2) | (38.1 | ) | (37.7 | ) | |||
| LTIP charge—general and administrative | (3.8 | ) | (3.2 | ) | |||
| Segment profit | $ | 157.2 | $ | 91.5 | |||
| Noncash SFAS 133 impact(3) | $ | — | $ | 1.0 | |||
| Maintenance capital | $ | 8.3 | $ | 3.0 | |||
Year Ended December 31, 2003(1) | |||||||
| Revenues | $ | 658.6 | $ | 11,985.6 | |||
| Purchases | (487.1 | ) | (11,799.8 | ) | |||
| Field operating costs (excluding LTIP charge) | (60.9 | ) | (73.3 | ) | |||
| LTIP charge—operations | (1.5 | ) | (4.3 | ) | |||
| Segment G&A expenses (excluding LTIP charge)(2) | (18.3 | ) | (31.6 | ) | |||
| LTIP charge—general and administrative | (9.5 | ) | (13.5 | ) | |||
| Segment profit | $ | 81.3 | $ | 63.1 | |||
| Noncash SFAS 133 impact(3) | $ | — | $ | 0.4 | |||
| Maintenance capital | $ | 6.4 | $ | 1.2 | |||
Year Ended December 31, 2002(1) | |||||||
| Revenues | $ | 486.2 | $ | 7,921.8 | |||
| Purchases | (362.2 | ) | (7,765.1 | ) | |||
| Field operating costs | (40.1 | ) | (66.3 | ) | |||
| Segment G&A expenses(2) | (13.2 | ) | (31.5 | ) | |||
| Segment Profit | $ | 70.7 | $ | 58.9 | |||
| Noncash SFAS 133 impact(3) | $ | — | $ | 0.3 | |||
| Maintenance capital | $ | 3.4 | $ | 2.6 | |||
Pipeline Operations
As of June 30, 2004 and December 31, 2003,2004, we owned approximately 15,000 miles and 7,000(of which approximately 13,000 miles respectively,are included in our pipeline segment) of active gathering and mainline crude oil pipelines located throughout the United States and Canada. Our activities from pipeline operations generally consist of transporting volumes of crude oil for a fee and third-partythird party leases of pipeline capacity (collectively referred to as "tariff activities"), as well as barrel exchanges and buy/sell arrangements (collectively referred to as "pipeline margin activities"). In connection with certain of our merchant activities conducted under our gathering and marketing business, we are also shippers on certain of our own pipelines. These transactions are conducted at published tariff rates and eliminated in consolidation. Tariffs and other fees on our pipeline systems vary by receipt point and delivery point. The segment profit generated by our tariff and other fee-related activities depends on the volumes transported on the pipeline and the level of the tariff and other fees charged as well as the fixed and variable field costs of operating the pipeline. Segment profit from our pipeline capacity leases, barrel exchanges and buy/sell arrangements generally reflect a negotiated amount.
The following table sets forth our operating results from our Pipeline Operations segment for the periods indicated:
| | Year Ended December 31, | ||||||||||
|---|---|---|---|---|---|---|---|---|---|---|---|
| | 2004 | 2003 | 2002 | ||||||||
| | (in millions) | ||||||||||
| Operating Results(1) | |||||||||||
| Revenues | |||||||||||
| Tariff activities | $ | 299.7 | $ | 153.3 | $ | 103.7 | |||||
| Pipeline margin activities | 575.2 | 505.3 | 382.5 | ||||||||
| Total pipeline operations revenues | 874.9 | 658.6 | 486.2 | ||||||||
Costs and Expenses | |||||||||||
| Pipeline margin activities purchases | (554.6 | ) | (487.1 | ) | (362.2 | ) | |||||
| Field operating costs (excluding LTIP charge) | (121.1 | ) | (60.9 | ) | (40.1 | ) | |||||
| LTIP charge—operations | (0.1 | ) | (1.4 | ) | — | ||||||
| Segment G&A expenses (excluding LTIP charge)(2) | (38.1 | ) | (18.3 | ) | (13.2 | ) | |||||
| LTIP charge—general and administrative | (3.8 | ) | (9.6 | ) | — | ||||||
| Segment profit | $ | 157.2 | $ | 81.3 | $ | 70.7 | |||||
| Maintenance capital | $ | 8.3 | $ | 6.4 | $ | 3.4 | |||||
Average Daily Volumes (thousands of barrels per day)(3) | |||||||||||
| Tariff activities | |||||||||||
| All American | 54 | 59 | 65 | ||||||||
| Basin | 265 | 263 | 93 | ||||||||
| Link acquisition | 283 | N/A | N/A | ||||||||
| Capline | 123 | N/A | N/A | ||||||||
| Other domestic | 424 | 299 | 219 | ||||||||
| Canada | 263 | 203 | 187 | ||||||||
| Total tariff activities | 1,412 | 824 | 564 | ||||||||
| Pipeline margin activities | 74 | 78 | 73 | ||||||||
| Total | 1,486 | 902 | 637 | ||||||||
OurRevenues from both our tariff activities and our pipeline margin activities have increased over the three year period ended December 31, 2004. The increase in revenues from gatheringtariff activities in both the 2004 and marketing2003 periods is primarily related to increased volumes resulting from our acquisition activities reflect the sale of gathered and bulk-purchasedas discussed further below. The increase in revenue from our pipeline margin activities was related to higher average prices for crude oil sold and LPG volumes, plustransported on our SJV gathering system in each of the sale of additional barrels exchanged throughyears compared to the year prior. The increase in 2004 was partially offset by lower buy/sell arrangements entered intovolumes (as compared to supplement2003), while the margins of the gathered and bulk-purchased volumes.2003 period benefitted from higher buy/sell volumes (as compared to 2002). Because the commoditiesbarrels that we buy and sell are generally indexed to the same pricing indices, for both the purchase and the sale, revenues and costs related to purchases will increase and decrease with changes in market prices without significant changes to our margins related to those purchases and sales. For example,
Our buy/sell arrangements in our pipeline segment consisted of the following:
| | Year Ended December 31, | |||||||||
|---|---|---|---|---|---|---|---|---|---|---|
| | 2004 | 2003 | 2002 | |||||||
| | (in millions) | |||||||||
| Barrels per day | 12,000 | 17,000 | 10,000 | |||||||
Revenues (in millions) | $ | 149.8 | $ | 166.2 | $ | 95.8 | ||||
| Purchases (in millions) | (142.5 | ) | (159.2 | ) | (87.6 | ) | ||||
Margin (in millions) | $ | 7.3 | $ | 7.0 | $ | 8.2 | ||||
Increases in segment profit, our primary measure of segment performance, were driven by the following:
growth and higher average pricescosts related to compliance activities attributable to Sarbanes-Oxley section 404 compliance. Costs related to section 404 compliance were $2.6 million in 2004. These items were partially offset by the inclusion of an LTIP charge of approximately $9.6 million in the 2003 period compared to $3.8 million in the 2004 period. The increase in sales volume2003 as compared to 2002 is primarily related to the LTIP charge mentioned above, an overall increase in costs from our continued growth from acquisitions and increased lease gatheredindirect costs allocated to the pipeline operations segment as operations grew.
As discussed above, the increase in pipeline operations segment profit is largely related to our acquisition activities. We have completed a number of acquisitions during 2004 and 2003 that have impacted our results of operations. The following presentation summarizes the revenue and volume impact of recent acquisitions.
| | Year Ended December 31, | |||||||||||||||
|---|---|---|---|---|---|---|---|---|---|---|---|---|---|---|---|---|
| | 2004 | 2003 | 2002 | |||||||||||||
| | Revenues | Volumes | Revenues | Volumes | Revenues | Volumes | ||||||||||
| | (volumes in thousands of barrels per day and revenues in millions) | |||||||||||||||
| Tariff activities(1)(2) | ||||||||||||||||
| 2004 acquisitions | $ | 115.6 | 525 | $ | N/A | N/A | $ | N/A | N/A | |||||||
| 2003 acquisitions | 39.7 | 170 | 14.8 | 82 | N/A | N/A | ||||||||||
| 2002 acquisitions | 54.6 | 327 | 54.2 | 344 | 23.1 | 171 | ||||||||||
| All other pipeline systems | 89.8 | 390 | 84.3 | 398 | 80.6 | 393 | ||||||||||
| Total tariff activities | $ | 299.7 | 1,412 | $ | 153.3 | 824 | $ | 103.7 | 564 | |||||||
The increase in 2004 is predominately related to (i) the inclusion of an average of 283,000 barrels resulting primarilyper day and $79.3 million of revenues from the Link acquisition.
Generally, we expect our segment profit to increase or decrease directionally with increases or decreasespipelines acquired in lease gathered volumes and LPG sales volumes. However, although the Link acquisition, increased lease gathered(ii) the inclusion of an average of approximately 123,000 barrels per day and $25.9 million of revenues from the Capline pipeline system and (iii) 119,000 barrels per day and $10.4 million of revenues from other 2004 acquisitions. Additionally, volumes and revenues there was nothave increased as a corresponding contributionresult of the inclusion for the full year of 2004 of several pipeline systems acquired during 2003 as compared to segment profit asonly a portion of the lease gathered barrelsyear in 2003 (See "Acquisitions"), coupled with higher realized prices on our loss allowance oil. Revenues from all other pipeline systems increased in the 2004 period, primarily supportrelated to slightly higher volumes on various systems. The appreciation of Canadian currency also favorably impacted revenues. The Canadian dollar to U.S. dollar exchange rate appreciated to an average of 1.30 to 1 for the year ended December 31, 2004, compared to an average of 1.40 to 1 for the year ended December 31, 2003.
The increase in 2003 relates to various acquisitions completed in 2003 along with the inclusion of assets acquired in 2002 for an entire year compared to only a portion of 2002.
Maintenance Capital
For the periods ended December 31, 2004, 2003 and 2002, maintenance capital expenditures were approximately $8.3 million, $6.4 million and $3.4 million, respectively for our pipeline operations. Although we believe thatoperations segment. The increase in 2004 is because of the combinationgrowth of our lease gathering business, primarily related to the Link acquisition. The increase in 2003 is related to our continued growth, primarily through acquisitions.
Gathering, Marketing, Terminalling and our storage assets provides a counter-cyclical balance, which provides stability in our margins, these margins are not fixed and may vary from period to period. In order to evaluate the performance of this segment, management focuses on the following metrics: (i) segment profit (ii) crude oil lease gathered volumes and LPG sales volumes and (iii) segment profit per barrel calculated on these volumes.Storage Operations
As of June 30, 2004 and December 31, 2003,2004, we owned approximately 37 million and 24 million, respectively, barrels of active above-ground crude oil terminalling and storage facilities, including a crude oil terminalling and storage facility at Cushing, Oklahoma. Cushing, which we refer to as the Cushing Interchange, is one of the largest crude oil market hubs in the United States and the designated delivery point for New York Mercantile Exchange, or NYMEX, crude oil futures contracts. Terminals are facilities where crude oil is transferred to or from storage or a transportation system, such as a pipeline, to another transportation system, such as trucks or another pipeline. The operation of these facilities is called "terminalling." Approximately 12.613.6 million barrels of our 37.037 million barrels of tankage is used primarily in our GMT&S Operations segment and the balance is used in our Pipeline Operations segment. On a stand-alone basis, segment profit from terminalling and storage activities is dependent on the throughput of volumes, the volume of crude oil stored and the level of fees generated from our terminalling and storage services. Our terminalling and storage activities are
integrated with our gathering and marketing activities and the level of tankage that we allocate for our arbitrage activities (and therefore not available for lease to third parties) varies throughout crude oil price cycles. This integration enables us to use our storage tanks in an effort to counter-cyclically balance and hedge our gathering and marketing activities. In a contango market (when oil prices for future deliveries are higher than for current deliveries), we use our tankage to improve our gathering margins by storing crude oil we have purchased at lower prices in the current month for delivery at higher prices in future months. In a backwardated market (when oil prices for future deliveries are lower than for current deliveries), we use and lease less storage capacity, but increased marketing margins (premiums for prompt delivery) provide an offset to this reduced cash flow. We believe that this combination of our terminalling and storage activities and gathering and marketing activities provides a counter-cyclical balance that has a stabilizing effect on our results of operations and cash flows.
DuringOur revenues from gathering and marketing activities reflect the first halfsale of 2004, market conditions were generally favorable as the market was in relatively strong backwardationgathered and experienced periods of volatility. The NYMEX benchmark price of crude ranged from $42.38 to $32.20 during the period. The market conditions in the first half of 2003 were more favorable as there was relatively high volatility and strong backwardation throughout the period. Additionally, cold weather during the first quarter of 2003 resulted in increased sales and higher margins in our LPG activities. During the first half of 2003, the NYMEX benchmark price ofbulk-purchased crude oil ranged from $39.99and LPG volumes, plus the sale of additional barrels exchanged through buy/sell arrangements entered into to $25.04.
Six Months Ended June 30, 2004 and 2003
Forsupplement the six months ended June 30, 2004, we reported consolidated net income of $63.6 million on total revenues of $8.9 billion compared to net income for the same period in 2003 of $47.7 million on total revenues of $6.0 billion. The following table reflects our results of operations and maintenance
capital for each segment (note that eachmargins of the items in the following table excludes depreciationgathered and amortization):
| | Pipeline | GMT&S | |||||
|---|---|---|---|---|---|---|---|
| | (in millions) | ||||||
| Six Months Ended June 30, 2004(1) | |||||||
| Revenues | $ | 412.1 | $ | 8,572.6 | |||
| Purchases | (269.6 | ) | (8,464.2 | ) | |||
| Field operating costs (excluding LTIP charge) | (51.2 | ) | (45.7 | ) | |||
| LTIP charge—operations | (0.1 | ) | (0.4 | ) | |||
| Segment G&A expenses (excluding LTIP charge)(2) | (16.3 | ) | (18.7 | ) | |||
| LTIP charge—general and administrative | (1.7 | ) | (2.0 | ) | |||
| Segment profit | $ | 73.2 | $ | 41.6 | |||
| Noncash SFAS 133 impact(3) | $ | — | $ | 0.5 | |||
| Maintenance capital | $ | 2.1 | $ | 1.0 | |||
Six Months Ended June 30, 2003(1) | |||||||
| Revenues | $ | 324.8 | $ | 5,689.3 | |||
| Purchases | (243.6 | ) | (5,591.9 | ) | |||
| Field operating costs | (27.7 | ) | (38.0 | ) | |||
| Segment G&A expenses(2) | (9.1 | ) | (16.1 | ) | |||
| Segment profit | $ | 44.4 | $ | 43.3 | |||
| Noncash SFAS 133 impact(3) | $ | — | $ | 1.1 | |||
| Maintenance capital | $ | 3.8 | $ | 0.4 | |||
The following table sets forth our operating results from our Pipeline Operations segment for the periods indicated:
| | Six Months Ended June 30, | |||||||||
|---|---|---|---|---|---|---|---|---|---|---|
| | 2004 | 2003 | ||||||||
| Operating Results (in millions)(1) | ||||||||||
| Revenues | ||||||||||
| Tariff activities | $ | 130.9 | $ | 72.1 | ||||||
| Pipeline margin activities | 281.2 | 252.7 | ||||||||
| Total pipeline operations revenues | 412.1 | 324.8 | ||||||||
Costs and Expenses | ||||||||||
| Pipeline margin activities purchases | (269.6 | ) | (243.6 | ) | ||||||
| Field operating costs (excluding LTIP charge) | (51.2 | ) | (27.7 | ) | ||||||
| LTIP charge—operations | (0.1 | ) | — | |||||||
| Segment G&A expenses (excluding LTIP charge)(2) | (16.3 | ) | (9.1 | ) | ||||||
| LTIP charge—general and administrative | (1.7 | ) | — | |||||||
| Segment profit | $ | 73.2 | $ | 44.4 | ||||||
| Maintenance capital | $ | 2.1 | $ | 3.8 | ||||||
Average Daily Volumes (thousands of barrels per day)(3) | ||||||||||
| Tariff activities | ||||||||||
| All American | 57 | 61 | ||||||||
| Basin | 273 | 245 | ||||||||
| Link acquisition | 185 | N/A | ||||||||
| Capline | 112 | N/A | ||||||||
| Other domestic | 408 | 261 | ||||||||
| Canada | 250 | 181 | ||||||||
| Total tariff activities | 1,285 | 748 | ||||||||
Pipeline margin activities | 73 | 81 | ||||||||
| Total | 1,358 | 829 | ||||||||
Total average daily volumes transported were approximately 1.4 million barrels per day and 0.8 million barrels per day for the six months ended June 30, 2004 and 2003, respectively. The increase relates to our tariff activities. As discussed above, we have completed a number of acquisitions during
2004 and 2003 that have impacted our results of operations. The following table reflects our total average daily volumes from our tariff activities by year of acquisition for comparison purposes:
| | Six Months Ended June 30, | ||||
|---|---|---|---|---|---|
| | 2004 | 2003 | |||
| | (thousands of barrels per day) | ||||
| Tariff activities(1) | |||||
| 2004 acquisitions | 396 | — | |||
| 2003 acquisitions | 166 | 33 | |||
| All other pipeline systems | 723 | 715 | |||
| Total tariff activities average daily volumes | 1,285 | 748 | |||
Average daily volumes from our tariff activities increased 0.5 million barrels per day to approximately 1.3 million barrels per day. Almost all of the increase in the current year quarter is due to volumes transported on the pipelines acquired in 2004 and 2003. Volumes on all other pipeline systems were relatively unchanged.
Total revenues from our pipeline operations were approximately $412.1 million and $324.8 million for the six months ended June 30, 2004 and 2003, respectively. An increase in revenues from tariff activities accounted for $58.8 million of the increase. Additionally, our margin activities increased by approximately $28.5 million in the first half of 2004. This increase was related to higher average prices for crude oil sold and transported on our SJV gathering system in the 2004 period as compared to the 2003 period, partially offset by lower buy/sellbulk-purchased volumes. Because the barrelscommodities that we buy and sell are generally indexed to the same pricing indices for both the purchase and the sale, revenues and costs related to purchases will increase and decrease with changes in market prices without significant changes to ourprices. However, the margins related to those purchases and sales. Volumes transported on the SJV systemsales will not necessarily have decreased from thecorresponding increases and decreases. For example, our revenues increased approximately 69% in 2004 compared to 2003, period. This is primarily related to a normalizing of volumes transportedwhile our segment profit increased approximately 45% in the first quarter of 2004 as the first quarter of 2003 included additional shipments that typically move on other pipelines. These volumes shifted to the SJV system in 2003 because of maintenance being performed on a refinery during that timesame period.
Revenues from our tariff activities increased approximately 82% or $58.8 million. The following table reflects our revenues from our tariff activities by year of acquisition for comparison purposes:
| | Six Months Ended June 30, | ||||||
|---|---|---|---|---|---|---|---|
| | 2004 | 2003 | |||||
| | (in millions) | ||||||
| Tariff activities revenues(1) | |||||||
| 2004 acquisitions | $ | 41.9 | $ | — | |||
| 2003 acquisitions | 17.3 | 4.0 | |||||
| All other pipeline systems | 71.7 | 68.1 | |||||
| Total tariff activities average daily volumes | $ | 130.9 | $ | 72.1 | |||
The increase in the first half of 2004 is predominately related to the inclusion of $26.6 million of revenues from the pipelines acquired in the Link acquisition and $15.3 of revenues from other businesses acquired in 2004. Revenues from pipeline systems acquired in 2003 have increased to $17.3 million from $4.0 million. The increase is primarily the result of the inclusion in the first half of
2004 of several pipeline systems that were acquired after or during the first half of 2003. See "—Acquisitions." Revenues from all other pipeline systems increased approximately $3.6 million to $71.7 million. The increase is primarily related to increased volumes on our Basin pipeline system and a $1.4 million favorable impact resulting from the decrease in the Canadian dollar to U.S. dollar exchange rate to an average of 1.34 to 1 for the first half of 2004, from an average of 1.45 to 1 for the first half of 2003.
Field operating costs increased to $51.3 million in the first half of 2004 from $27.7 million in the first half of 2003. This increase is predominately related to our continued growth, primarily from acquisitions, and is comprised primarily of higher payroll and utility costs.
Segment G&A expenses increased approximately $8.9 million between comparable periods, primarily as a result of our Link acquisition along with a $1.7 million accrual related to the vesting of unit grants under our LTIP. G&A costs have also increased because of increased headcount resulting from continued growth and higher costs related to requirements of the Sarbanes-Oxley Act of 2002. Additionally, the percentage of indirect costs allocated to the pipeline operations segment has increased in the 2004 period as our pipeline operations have grown. Including the impact of the items discussed above, segment profit was approximately $73.2 million for the six months ended June 30, 2004, an increase of 65% as compared to the $44.4 million reported for the six months ended June 30, 2003. Segment profit includes a $0.8 million favorable impact resulting from the decrease in the average Canadian dollar to U.S. dollar exchange rate for the 2004 period as compared to the 2003 period.
The following table sets forth our operating results from our GMT&S Operations segment for the comparative periods indicated:
| | Six Months Ended June 30, | |||||||
|---|---|---|---|---|---|---|---|---|
| | 2004 | 2003 | ||||||
| Operating Results (in millions)(1) | ||||||||
| Revenues | $ | 8,572.6 | $ | 5,689.3 | ||||
| Purchases and related costs | (8,464.2 | ) | (5,591.9 | ) | ||||
| Field operating costs (excluding LTIP charge) | (45.7 | ) | (38.0 | ) | ||||
| LTIP charge—operations | (0.4 | ) | — | |||||
| Segment G&A expenses (excluding LTIP charge)(2) | (18.7 | ) | (16.1 | ) | ||||
| LTIP charge—general and administrative | (2.0 | ) | — | |||||
| Segment profit | $ | 41.6 | $ | 43.3 | ||||
| Noncash SFAS 133 impact(3) | $ | 0.5 | $ | 1.1 | ||||
| Maintenance capital | $ | 1.0 | $ | 0.4 | ||||
Average Daily Volumes (thousands of barrels per day)(4) | ||||||||
| Crude oil lease gathering | 550 | 430 | ||||||
| Crude oil bulk purchases | 135 | 78 | ||||||
| Total | 685 | 508 | ||||||
| LPG sales(5) | 40 | 35 | ||||||
Table continued on following page.
Additionally, field operating costs and segment G&A expenses both increased during the period. Field operating costs increased to approximately $46.1 million in the current period from $38.0 million in the prior year period. This increase is primarily related to the Link acquisition. Also included is an approximately $0.4 million LTIP charge in the 2004 period. Segment G&A expenses increased to $20.7 million in the current period from $16.1 million in the 2003 period. The increase is primarily related to the inclusion of the $2.0 million LTIP charge in the 2004 period and increased headcount from continued growth and higher costs related to Sarbanes-Oxley requirements. This segment G&A increase is partially offset by lower costs being allocated to our GMT&S segment as our Pipeline Operations segment continues to grow.
The crude oil volumes gathered from producers, using our assets or third-party assets, has increased by 28% during the first half of 2004. The increase is related to the Link acquisition and organic growth and other acquisitions, which has offset natural production declines. In addition, we marketed 40,000 barrels per day of LPG during the first six months of 2004 compared to 35,000 barrels per day in the first six months of 2003. Segment profit per barrel calculated based on our lease gathered crude oil and LPG sales volumes was $0.39 per barrel for the six months ended June 30, 2004, compared to $0.52 for the six months ended June 30, 2003. The impact of change in the non-cash SFAS 133 mark-to-market for the first half of 2004 as compared to the first half of 2003 was a decrease in segment profit per barrel of approximately $0.02. Additionally, segment profit per barrel was negatively impacted by lower segment profit per barrel on the lease gathered barrels added in the 2004 quarter from the Link acquisition. Per barrel profits related to the Link acquisition are lower because Link's gathering business primarily supported its pipeline operations.
Revenues from our gathering, marketing, terminalling and storage operations were approximately $8.6$20.2 billion, $12.0 billion and $5.7$7.9 billion for the six monthsyears ended June 30,December 31, 2004, 2003 and 2003,2002, respectively. As discussed above, revenuesRevenues and costs related to purchases for the 2004 period were impacted by higher average prices and higher volumes as compared to the 2003 period. Approximately 60% of the increase in revenues resulted from higher average prices in the 2004 period and the remainder was attributable to increased sales volumes. The average NYMEX price for crude oil was $36.78$41.29 per barrel and $31.42$31.08 per barrel for the six monthsyears ended June 30,December 31, 2004 and 2003, respectively.
Other Expenses
Depreciation and Amortization. Depreciation and amortization expense was $29.1 million for the six months ended June 30, 2004, compared to $22.2 million for the six months ended June 30, 2003. The increase relates primarilyin revenues and costs related to the assets from our 2004 acquisitions and our variouspurchases in 2003 acquisitions being included for the full six months in 2004 versus only a part or none of the six months in 2003. Additionally, several capital projects were completed during mid-to-late 2003 that were not included in the first six months of 2003 depreciation expense. Amortization of debt issue costs was $1.2 million and $2.0 million in the first half of 2004 and 2003, respectively.
Interest Expense. During the first half of 2004, our average debt balance was approximately $771 million. This balance consisted of fixed rate senior notes with a face amount totaling $450 million and borrowings under our revolving credit facilities averaging $321 million. During the comparable 2003 period, our average debt balance was approximately $520 million and consisted of fixed rate senior notes with a face amount of $200 million and borrowings under our revolving credit facilities of
$320 million. Therelated to higher average debt balanceprices and higher volumes in the 2004 period was primarily related to the portion of our acquisitions that were not refinanced with equity during the period. Our financial growth strategy is to fund our acquisitions using a balance of debt and equity.
The net result of the changes to our debt structure and our interest rate hedging instruments mentioned above was an increase in the average amount of fixed rate debt outstanding in the first half of 2004 to approximately 58%2003 as compared to approximately 38%2002. The average NYMEX price for crude oil was $26.10 per barrel in the first half of 2003. The new senior unsecured credit facilities reduced the interest rate on our credit facilities by approximately 100 basis points compared to the senior secured facility. In addition, during these two periods the average three-month LIBOR rate declined to 1.2% in 2004 from 1.3% in 2003.
The net impact of the items discussed above was an increase in interest expense in the first half of 2004 of approximately $1.8 million to a total of $19.5 million. The higher average debt in the 2004 period resulted in additional interest expense of approximately $6.2 million, while at the same time our commitment and other fees decreased by approximately $1.4 million. Our weighted average interest rate, excluding commitment and other fees, was approximately 4.9% for the first half of 2004 compared to 6.1% for the first half of 2003. The lower weighted average rate decreased interest expense by approximately $3.0 million in the first half of 2004 compared to the first half of 2003.2002.
Three Years Ended December 31, 2003
The following table reflectsOur buy/sell arrangements in our results of operations and maintenance capital for eachGMT&S segment (note that eachconsisted of the items in the following table excludes depreciation and amortization).following:
| | Pipeline | GMT&S | |||||
|---|---|---|---|---|---|---|---|
| | (in millions) | ||||||
| Year Ended December 31, 2003(1) | |||||||
| Revenues | $ | 658.6 | $ | 11,985.6 | |||
| Purchases | (487.1 | ) | (11,799.8 | ) | |||
| Field operating costs (excluding LTIP charge) | (60.9 | ) | (73.3 | ) | |||
| LTIP charge—operations | (1.4 | ) | (4.3 | ) | |||
| Segment G&A expenses (excluding LTIP charge)(2) | (18.3 | ) | (31.6 | ) | |||
| LTIP charge—general and administrative | (9.6 | ) | (13.5 | ) | |||
| Segment profit | $ | 81.3 | $ | 63.1 | |||
| Noncash SFAS 133 impact(3) | — | 0.4 | |||||
| Maintenance capital | $ | 6.4 | $ | 1.2 | |||
Year Ended December 31, 2002(1) | |||||||
| Revenues | $ | 486.2 | $ | 7,921.8 | |||
| Purchases | (362.2 | ) | (7,765.1 | ) | |||
| Field operating costs | (40.1 | ) | (66.3 | ) | |||
| Segment G&A expenses(2) | (13.2 | ) | (31.5 | ) | |||
| Segment profit | $ | 70.7 | $ | 58.9 | |||
| Noncash SFAS 133 impact(3) | — | 0.3 | |||||
| Maintenance capital | $ | 3.4 | $ | 2.6 | |||
Year Ended December 31, 2001(1) | |||||||
| Revenues | $ | 357.4 | $ | 6,528.3 | |||
| Purchases | (266.7 | ) | (6,383.6 | ) | |||
| Field operating costs | (19.4 | ) | (73.7 | ) | |||
| Segment G&A expenses(2) | (12.4 | ) | (28.5 | ) | |||
| Segment profit | $ | 58.9 | $ | 42.5 | |||
| Noncash SFAS 133 impact(3) | $ | — | $ | 0.2 | |||
| Maintenance capital | $ | 0.5 | $ | 2.9 | |||
| | Year Ended December 31, | |||||||||
|---|---|---|---|---|---|---|---|---|---|---|
| | 2004 | 2003 | 2002 | |||||||
| Barrels per day(1) | 790,000 | 545,000 | 460,000 | |||||||
Revenues (in millions)(1) | $ | 11,247.0 | $ | 6,124.9 | $ | 4,140.8 | ||||
| Purchases (in millions)(1) | (11,137.7 | ) | (5,967.2 | ) | (4,026.2 | ) | ||||
Margin (in millions) | $ | 109.3 | $ | 157.7 | $ | 114.6 | ||||
Generally, we expect our segment profit to increase or decrease directionally with increases or decreases in lease gathered volumes and LPG sales volumes. Although we believe that the combination of our lease gathering business activitiesand our storage assets provides a counter-cyclical balance that exist during eachprovides stability in our margins, these margins are not fixed and may vary from period to period.
profit per barrel calculated on these volumes. The following table sets forth our operating results from our PipelineGathering, Marketing, Terminalling and Storage Operations segment for the periods indicated:
| | Year Ended December 31, | ||||||||||
|---|---|---|---|---|---|---|---|---|---|---|---|
| | 2003 | 2002 | 2001 | ||||||||
| Operating Results (in millions)(1) | |||||||||||
| Revenues | |||||||||||
| Tariff activities | $ | 153.3 | $ | 103.7 | $ | 69.4 | |||||
| Pipeline margin activities | 505.3 | 382.5 | 288.0 | ||||||||
| Total pipeline operations revenues | 658.6 | 486.2 | 357.4 | ||||||||
| Costs and Expenses | |||||||||||
| Pipeline margin activities purchases | (487.1 | ) | (362.2 | ) | (266.7 | ) | |||||
| Field operating costs (excluding LTIP charge) | (60.9 | ) | (40.1 | ) | (19.4 | ) | |||||
| LTIP charge—operations | (1.4 | ) | — | — | |||||||
| Segment G&A expenses (excluding LTIP charge)(2) | (18.3 | ) | (13.2 | ) | (12.4 | ) | |||||
| LTIP charge—general and administrative | (9.6 | ) | — | — | |||||||
| Segment profit | $ | 81.3 | $ | 70.7 | $ | 58.9 | |||||
| Maintenance capital | $ | 6.4 | $ | 3.4 | $ | 0.5 | |||||
Average Daily Volumes (thousands of barrels per day)(3)(4) | |||||||||||
| Tariff activities | |||||||||||
| All American | 59 | 65 | 69 | ||||||||
| Basin | 263 | 93 | N/A | ||||||||
| Other domestic | 299 | 219 | 144 | ||||||||
| Canada | 203 | 187 | 132 | ||||||||
| Total tariff activities | 824 | 564 | 345 | ||||||||
| Pipeline margin activities | 78 | 73 | 61 | ||||||||
| Total | 902 | 637 | 406 | ||||||||
| | December 31, | ||||||||||
|---|---|---|---|---|---|---|---|---|---|---|---|
| | 2004 | 2003 | 2002 | ||||||||
| | (in millions, except per barrel amounts) | ||||||||||
| Operating Results(1) | |||||||||||
| Revenues | $ | 20,223.5 | $ | 11,985.6 | $ | 7,921.8 | |||||
| Purchases and related costs | (19,992.8 | ) | (11,799.8 | ) | (7,765.1 | ) | |||||
| Field operating costs (excluding LTIP charge) | (97.5 | ) | (73.3 | ) | (66.3 | ) | |||||
| LTIP charge—operations | (0.8 | ) | (4.3 | ) | — | ||||||
| Segment G&A expenses (excluding LTIP charge)(2) | (37.7 | ) | (31.6 | ) | (31.5 | ) | |||||
| LTIP charge—general and administrative | (3.2 | ) | (13.5 | ) | — | ||||||
| Segment profit | $ | 91.5 | $ | 63.1 | $ | 58.9 | |||||
| Noncash SFAS 133 impact(3) | $ | 1.0 | $ | 0.4 | $ | 0.3 | |||||
| Maintenance capital | $ | 3.0 | $ | 1.2 | $ | 2.6 | |||||
| Segment profit per barrel(4) | $ | 0.39 | $ | 0.36 | $ | 0.36 | |||||
Average Daily Volumes (thousands of barrels per day)(5) | |||||||||||
| Crude oil lease gathered | 589 | 437 | 410 | ||||||||
| Crude oil bulk purchases | 148 | 90 | 68 | ||||||||
| Total | 737 | 527 | 478 | ||||||||
| LPG sales | 48 | 38 | 35 | ||||||||
Total average daily volumes transported were approximately 902,000 barrels per day for the year ended December 31, 2003, compared to 637,000 barrels per day and 406,000 barrels per day for the years ended December 31, 2002 and 2001, respectively. As discussed above, we have completed a number of acquisitions during 2003 and 2002 that have impacted the results of operations.
The following table reflects our total average daily volumes from our tariff activities by year of acquisition for comparison purposes:
| | Year Ended December 31, | |||||||
|---|---|---|---|---|---|---|---|---|
| | 2003 | 2002 | 2001 | |||||
| | (thousands of barrels per day) | |||||||
| Tariff activities(1) | ||||||||
| 2003 acquisitions | 82 | — | — | |||||
| 2002 acquisitions | 344 | 171 | — | |||||
| 2001 acquisitions | 200 | 193 | 134 | |||||
| All other pipeline systems | 198 | 200 | 211 | |||||
| Total tariff activities | 824 | 564 | 345 | |||||
The increase in average daily volumes from our tariff activities to 824,000 barrels per day in 2003 from 564,000 barrels per day and 345,000 barrels per day in 2002 and 2001, respectively, resulted primarily from our acquisition activities discussed above. The following discussion explains year-to-year variances based on the comparison of volumes in the table above.
2003 Acquisitions—Approximately 82,000 barrels per day of the increase in 2003 volumes over 2002 volumes is related to systems acquired during 2003.
2002 Acquisitions—An additional 173,000 barrels per day of the increase in 2003 resulted from the inclusion of assets acquired in 2002 for the entire year in 2003 as compared to only a portion of 2002. The assets acquired in the Shell acquisition accounted for 171,000 barrels per day of this increase as increased barrels per day on the Basin Pipeline System and the Permian Basin Gathering System coupled with the impact of including a full year results in 2003 as compared to only five months in 2002 more than offset the decrease in barrels per day resulting from the shut-down of the Rancho Pipeline System. See "Business—Acquisitions and Dispositions—Shutdown and Sale of Rancho Pipeline System."
2001 Acquisitions—In addition, volumes on pipeline systems acquired in 2001 increased by approximately 7,000 barrels per day in the 2003 period as Canadian volumes benefited from the completion of capital expansion projects that allowed for additional volumes on certain pipelines. Barrels per day on these systems increased in the 2002 period as compared to the 2001 period primarily due to the inclusion of the Murphy acquisition for a full year in 2002 compared to only a portion of the year in 2001.
All other pipeline systems—Volumes on all other pipeline systems decreased approximately 2,000 barrels per day primarily because of a 6,000 barrel per day decrease in our All American tariff volumes and various other decreases totaling 4,000 barrels per day on several of our pipeline systems. The decrease in All American tariff volumes is attributable to a decline in California outer continental shelf ("OCS") production. Partially offsetting these decreases was an 8,000 barrel per day increase in our West Texas Gathering System volumes. Our West Texas Gathering System has benefited from the shutdown of the Rancho pipeline and also from temporary refinery problems that have diverted crude oil barrels from other systems. Volumes on all other pipeline systems decreased by approximately 11,000 barrels per day in 2002 as compared to 2001, primarily because of an approximate 4,000 barrel per day decrease in our All American tariff volumes and a 4,000 barrel per day decrease in our West Texas Gathering System volumes.
Revenues. Total revenues from our pipeline operations were approximately $658.6 million for the year ended December 31, 2003, compared to $486.2 million and $357.4 million for the years ended December 31, 2002 and 2001, respectively. The increase in revenues was primarily related to our pipeline margin activities, which increased by approximately $122.8 million in 2003. This increase was related to higher average crude oil prices coupled with increased volumes on our buy/sell arrangements on our San Joaquin Valley gathering system in 2003. Because the barrels that we buy and sell are generally indexed to the same pricing indices, revenues and purchases will increase and decrease with changes in market prices without significant changes to our margins related to those purchases and sales. The increase in 2002 over 2001 also was primarily related to our pipeline margin activities on our San Joaquin Valley gathering system. Increased volumes and higher average prices on our buy/sell arrangements were the primary drivers of the increase.
Revenues from our tariff activities increased approximately 48% or $49.6 million in 2003 as compared to 2002. The following table reflects revenues from our tariff activities by year of acquisition for comparison purposes:
| | Year Ended December 31, | ||||||||||
|---|---|---|---|---|---|---|---|---|---|---|---|
| | 2003 | 2002 | 2001 | ||||||||
| | (in millions) | ||||||||||
| Tariff activities(1) | |||||||||||
| 2003 acquisitions | $ | 14.8 | $ | — | $ | — | |||||
| 2002 acquisitions | 54.2 | 23.1 | — | ||||||||
| 2001 acquisitions | 28.0 | 21.6 | 9.9 | ||||||||
| All other pipeline systems | 56.3 | 59.0 | 59.5 | ||||||||
| Total tariff activities | $ | 153.3 | $ | 103.7 | $ | 69.4 | |||||
The increase in revenues from our tariff activities to $153.3 million in 2003 from $103.7 million and $69.4 million in 2002 and 2001, respectively, resulted predominantly from our acquisition activities discussed above. The following discussion explains year-to-year variances based on the comparison of revenues in the table above.
2003 Acquisitions—Approximately $14.8 million of the increase in 2003 revenues over 2002 revenues is related to systems acquired during 2003.
2002 Acquisitions—An additional $31.1 million of the increase in 2003 revenues from our tariff activities resulted from the inclusion of assets acquired in 2002 for the entire year in 2003 as compared to only a portion of 2002. This increase was entirely related to the assets acquired in the Shell acquisition as increased revenues on the Basin Pipeline System and the Permian Basin Gathering System coupled with the impact of including a full year results in 2003 as compared to only five months in 2002 more than offset the decrease in revenues resulting from the shut-down of the Rancho Pipeline System. See "Business—Acquisitions and Dispositions—Shutdown and Sale of Rancho Pipeline System."
2001 Acquisitions—In addition, revenues from 2001 acquisitions increased approximately $6.4 million in 2003 as compared to 2002. This increase predominately resulted from increased Canadian revenues of $6.5 million in the 2003 period primarily due to expanded capacity, higher tariffs and a $3.4 million favorable exchange rate impact. The favorable exchange rate impact has resulted from a decrease in the Canadian dollar to U.S. dollar exchange rate to an average rate of 1.40 to 1 for the year ended December 31, 2003, from an average rate of 1.57 to 1 for the year ended December 31, 2002. Revenues from these systems increased to $21.6 million in 2002 from $9.9 million in 2001
primarily because of the inclusion of the Murphy acquisition for a full year in 2002 and increases in the tariff of certain pipeline systems acquired in the Murphy acquisition.
All other pipeline systems—Revenues from all other pipeline systems were relatively flat for all of the comparable periods as the decrease in volumes attributable to OCS production on our All American system (on which we receive the highest per barrel tariffs among our pipeline operations) was offset in each period by other increases, including increases in the tariffs for OCS volumes transported.
Field Operating Costs. Field operating costs increased to $62.3 million in 2003 from $40.1 million and $19.4 million in 2002 and 2001, respectively. The 2003 increase in costs includes $1.4 million related to the accrual made for the probable vesting of unit grants under our LTIP and approximately $1.0 million related to a pipeline spill in Mississippi. The remaining increase is predominately related to our continued growth, primarily from acquisitions, coupled with higher utility costs.
The increase in field operating costs in 2002 as compared to 2001 was primarily related to the acquisition of businesses in 2002 and late 2001 and the inclusion of the results of the Murphy acquisition for all of 2002 compared to only a portion of 2001. Our field operating costs for the 2002 period also includes a $1.2 million noncash charge associated with the establishment of a liability for potential cleanup of environmental conditions associated with our 1999 acquisitions, based on additional information. In many cases, the actual cash expenditure may not occur for ten years or more.
Segment G&A Expenses. Segment G&A expenses were approximately $27.9 million in 2003, compared to approximately $13.2 million and $12.4 million in 2002 and 2001, respectively. The increase in 2003 is primarily a result of a $9.6 million accrual related to the probable vesting of unit grants under our LTIP. Additionally, the percentage of indirect costs allocated to the pipeline operations segment has increased in 2003 as our pipeline operations have grown. The increase in segment G&A expenses in 2002 as compared to 2001 was partially due to increased costs from the assets acquired in the Murphy acquisition related to the inclusion of these assets for all of 2002 compared to only a portion of 2001.
Segment Profit. Our pipeline operations segment profit increased 15% to approximately $81.3 million for the year ended December 31, 2003. Pipeline segment profit was approximately $58.9 million in 2001. The primary reasons for the increase in segment profit are discussed above. In addition, segment profit includes a $2.0 million favorable impact resulting from the decrease in the average Canadian dollar to U.S. dollar exchange rate for the 2003 period as compared to the 2002 period.
Maintenance Capital. For the periods ended December 31, 2003, 2002 and 2001, maintenance capital expenditures were approximately $6.4 million, $3.4 million and $0.5 million, respectively for our pipeline operations segment. The increases between the years are related to our continued growth, primarily through acquisitions.
The following table sets forth our operating results from our GMT&S segment for the periods indicated:
| | December 31, | ||||||||||
|---|---|---|---|---|---|---|---|---|---|---|---|
| | 2003 | 2002 | 2001 | ||||||||
| Operating Results (in millions)(1) | |||||||||||
| Revenues | $ | 11,985.6 | $ | 7,921.8 | $ | 6,528.3 | |||||
| Purchases and related costs | (11,799.8 | ) | (7,765.1 | ) | (6,383.6 | ) | |||||
| Field operating costs (excluding LTIP charge) | (73.3 | ) | (66.3 | ) | (73.7 | ) | |||||
| LTIP charge—operations | (4.3 | ) | — | — | |||||||
| Segment G&A expenses (excluding LTIP charge)(2) | (31.6 | ) | (31.5 | ) | (28.5 | ) | |||||
| LTIP charge—general and administrative | (13.5 | ) | — | — | |||||||
| Segment profit | $ | 63.1 | $ | 58.9 | $ | 42.5 | |||||
| Noncash SFAS 133 impact(3) | $ | 0.4 | $ | 0.3 | $ | 0.2 | |||||
| Maintenance capital | $ | 1.2 | $ | 2.6 | $ | 2.9 | |||||
Average Daily Volumes (thousands of barrels per day)(4) | |||||||||||
| Crude oil lease gathering | 437 | 410 | 348 | ||||||||
| Crude oil bulk purchases(5) | 90 | 68 | 46 | ||||||||
| Total | 527 | 478 | 394 | ||||||||
| LPG sales | 38 | 35 | 19 | ||||||||
The following factors contributed to our growthIncreases in segment profit, during 2003 as compared to 2002:our primary measure of segment performance, were driven by the following:
As discussed above, 2002 market conditions were characterized by periods of weak contango and strong backwardation. Although these conditions are generally disadvantageous for our gathering and marketing activities, the 2001 market conditions were even less favorable. These market conditions and increasedIncreased crude oil lease gatheringgathered volumes contributed to the growth in our segment profit in 2002 as compared to 2001. The increased volumes resulted predominantly from the inclusion of the assets acquired in the CANPET acquisition for the entire year in 2002 as compared to only a portion of 2001. The increase in segment profit was also impacted by decreased field operating costs in the 2002 period as compared to the 2001 period as discussed further below.
Field operating costs included in segment profit increased to approximately $77.6 million in the year ended December 31, 2003 compared to $66.3 million and $73.7 million for the years ended December 31, 2002 and 2001, respectively. The increase in 2003 includes $4.3 million related to the probable vesting of unit grants under our LTIP. The remaining increase was partially related to our continued growth, primarily from acquisitions, coupled with increased regulatory compliance activities and higher fuel costs. The decrease in field operating costs in 2002 as compared to 2001 was primarily related to the inclusion in 2001 of a $5.0 million noncash writedown of operating crude oil inventory and a $2.0 million noncash reserve for doubtful accounts.
Segment G&A expenses include the costs directly associated with the segments, as well as a portion of corporate overhead costs considered allocable. See "—Other Income and Expenses." Segment G&A expense increased to $45.1 million in 2003 compared to $31.5 million and $28.5 million for 2002 and 2001, respectively. Included in the 2003 amount is $13.5 million related to the accrual for the probable vesting of unit grants under our LTIP. The percentage of indirect costs allocated to the Gathering, Marketing, Terminalling and Storage Operations segment has decreased from period to period as our pipeline operations have grown, partially offsetting the impact of the overall increase in G&A resulting from our continued growth. Segment G&A expenses increased in 2002 from 2001 primarily because of increased costs of $5.6 million from the assets acquired in the CANPET acquisition due to the inclusion of those assets for all of 2002 compared to only a portion of 2001. This increase was offset by decreased segment G&A of $2.6 million from our domestic operations. This decrease was partially related to a reduction in accounting and consulting costs in 2002 from those that had been incurred in 2001. Partially offsetting these items is the approximately $2.4 million favorable impact on segment profit because of the appreciation of the Canadian dollar.
LPG sales volumes—The crude oil volumes gathered from producers, using our assets or third-party assets, hashave increased by 7% and 18% during 2003 and 2002, respectively.approximately 35% in 2004. The increase in 2003 is primarily related to organic growth and acquisitions,the Link acquisition, which has offset natural production declines. The increase in 2002 resulted primarily from our acquisition activities. In addition, we marketed 38,00048,000 barrels per day of LPG during 20032004 compared to 35,000 barrels per day and 19,00038,000 barrels per day in 2003.
The impact of a full year of our LPG operationsthe items discussed above resulted in the 2002 period compared to only six months during 2001. Segmentsegment profit per barrel calculated(calculated based on our lease gathered crude oil and LPG barrels was $0.36barrels) of $0.39 per barrel for the year ended December 31, 2003,2004, compared to $0.36 and $0.32 for the years ended December 31, 2002 and 2001, respectively.
Revenues from our gathering, marketing, terminalling and storage operations were approximately $12.0 billion, $7.9 billion and $6.5 billion for the years ended December 31, 2003, 2002 and 2001, respectively. As discussed above, revenues and costs related to purchases for 2003 were impacted by higher average prices and higher volumes in the 2003 period as compared to the 2002 period. The average NYMEX price for crude oil was $31.08 per barrel and $26.10 per barrel forboth 2003 and 2002, respectively. The increase in revenues and costs related to purchases in 2002 as compared to 2001 was predominantly related to higher sales volumes, as the average NYMEX price for crude oil in 2002 was only $0.12 higher than the $25.98 average in 2001.2002.
Maintenance capital.Capital
For the periods ended December 31, 2004, 2003 2002 and 2001,2002, maintenance capital expenditures were approximately $3.0 million, $1.2 million $2.6 million and $2.9$2.6 million, respectively for our gathering, marketing, terminalling and storage operations segment. The increase in 2004 as compared to 2003 is primarily related to the Link acquisition. The decrease in 2003 as compared to 2002 and 2001 iswas primarily because of a reduction in costs associated with information systems and the replacement of a portion of our fleet.fleet in 2002.
Other Income and Expenses
Unallocated G&A Expenses.Expenses
Segment G&A expenses include the costs directly associated with the segments, as well as a portion of corporate overhead costs considered allocable. Total G&A expenses were $82.8 million, $73.0 million $45.7 million and $46.6$45.7 million for the years ended December 31, 2004, 2003 2002 and 2001,2002, respectively. We have included in the above segment discussion the G&A expenses for each of these years that were attributable to our segments either directly or by allocation. During 2002, we were unsuccessful in our pursuit of several sizable acquisition opportunities determined by auction and one negotiated transaction that had advanced nearly to the execution stage when it was abruptly terminated by the seller. As a result, our 2002 results reflect a $1.0 million charge to G&A expenses associated with the third-party costs of these unsuccessful transactions.
During 2001, we incurred charges of $5.7 million that were not attributable to a segment, related to incentive compensation paid to certain officers and key employees of Plains Resources and its affiliates. In 1998 (in connection with our IPO) and 2000, Plains Resources granted certain officers and key employees of the former general partner the right to earn ownership in a portion of our common units owned by it. These rights provided for vesting over a three-year period, subject to distributions being paid on the common and subordinated units. In connection with the general partner transition in 2001, these rights, as well as grants to directors under our LTIP, vested. This resulted in a charge to our 2001 income of approximately $6.1 million, of which Plains Resources funded approximately 94%. Approximately $5.7 million of the charge was noncash and was not allocated to a segment.the segments.
Depreciation and Amortization.Amortization
Depreciation and amortization expense was $46.8$67.2 million for the year ended December 31, 2003,2004, compared to $34.1$46.8 million and $24.3$34.1 million for the years ended December 31, 20022003 and 2001,2002, respectively. The increase in 2004 relates primarily to the assets from our 2004 acquisitions and our various 2003 acquisitions being included for the full year versus only a part of the year in 2003. In addition, 2004 includes approximately $4.2 million of depreciation of trucks and trailers under capital leases. Amortization of debt issue costs was $2.5 million in 2004, compared to $3.8 million in 2003.
The increase in 2003 over 2002 relates primarily to the inclusion of the assets from the Shell acquisition for the entire year as compared to a portion of 2002. Additionally, several acquisitions were completed during the year along with various capital projects. Amortization of debt issue costs was $3.8 million in 2003, and was essentially unchanged from $3.7 million in 2002.
The increase in 2002 over 2001 consists of approximately $4.1 million related toflat between the inclusion of assets from the Shell acquisition and approximately $3.5 million related to the inclusion of the assets from the Murphy and CANPET acquisitions for all of 2002 compared to only a portion of 2001. The remainder of the increase is related to increased debt issue costs related to the amendment of our credit facilities during 2002 and late 2001, the sale of senior notes in September 2002 and the completion of various capital projects.two years.
Interest Expense.Expense
Interest expense was $35.2$46.7 million for the year ended December 31, 2003,2004, compared to $35.2 million and $29.1 million for each of the years ended December 31, 2003 and 2002, respectively. In 2004, our average debt balance was $859.5 million. This balance consisted of fixed rate senior notes averaging $585.8 million and 2001,borrowings under our revolving credit facilities averaging $273.7 million. During the 2003 period, our average debt balance was approximately $525.5 million and consisted of fixed rate senior notes averaging $214.4 million and borrowings under our revolving credit facilities averaging $311.1 million. The higher average debt balance in 2004 was primarily related to the portion of our acquisitions that were not refinanced with equity. Our financial growth strategy is to fund our acquisitions using a balance of debt and equity.
During the third quarter of 2004, we issued $175 million of five year senior unsecured notes and $175 million of 12 year senior unsecured notes. These issuances resulted in an increase in the average amount of longer term and higher cost fixed rate debt outstanding in 2004 to approximately 68% as compared to approximately 41% in 2003. During 2004 and 2003, the average three-month LIBOR rate was 1.6% and 1.2%, respectively.
The higher average debt balance in 2004 resulted in additional interest expense of approximately $16.8 million, while at the same time our commitment and other fees decreased by approximately $0.4 million. Our weighted average interest rate, excluding commitment and other fees, was approximately 5.0% for 2004 compared to 6.0% for 2003. The lower weighted average rate decreased interest expense by approximately $4.9 million in 2004 compared to 2003.
The increase in 2003 compared to 2002 was primarily related to an increase in the average debt balance during the 2003 period to approximately $525.5 million from approximately $444.6 million in the 2002 period, which resulted in additional interest expense of approximately $5.0 million. The higher average debt balance was primarily due to the portion of the Shell acquisition that was not financed with equity. This debt was outstanding for all of 2003 versus only a portion of 2002. Also, increased commitment and other fees coupled with lower capitalized interest resulted in approximately $2.2 million of the increase in the 2003 period. Our weighted average interest rate decreased slightly during 2003 to 6.0% versus 6.2% in 2002, which decreased our interest expense by approximately $1.1 million. Although the change in our weighted average interest rate was nominal, the change was the net result of various factors that included an increase in the amount of fixed rate long-term debt
with longer maturities, long-term interest rate hedges and declining short-term interest rates. In mid-September 2002, we issued $200 million of ten-year bonds bearing a fixed interest rate of 7.75%. In the fourth quarter of 2002 and the first quarter of 2003, we entered into hedging arrangements to lock in interest rates on approximately $50 million of ourits floating rate debt. In addition, the average three-month LIBOR rate declined from approximately 1.8% during 2002 to approximately 1.2% during 2003. The net impact of these factors, increased commitment fees and changes in average debt balances decreased the average interest rate by 0.2%.
Interest expense was relatively flat in the 2002 period as compared to 2001 due to the impact of higher debt levels and commitment fees offset by lower average interest rates and the capitalization of interest. The overall increased average debt balance in 2002 is due to the portion of the Shell acquisition in August 2002 which was not financed with the issuance of equity.Other
During the third quarter of 2001,2004, we issued acompleted (i) the issuance of 4,968,000 common units and (ii) the issuance of an aggregate of $350 million of senior unsecured notes. We used the proceeds from these issuances to, among other things, repay amounts outstanding under our revolving credit facilities, including all amounts outstanding under the $200 million, senior secured term B loan, the proceeds of which were364-day facility we used to reduce borrowings underfund the Link acquisition. The repayment and termination of this facility resulted in a non-cash charge of approximately $0.7 million associated with the write-off of unamortized debt issue costs. Additionally, during the fourth quarter of 2004, we recognized an impairment charge of approximately $2.0 million associated with taking our revolver. As such, our commitment fees on our revolver increased as they are based on unused availability. The lower interest rates in 2002 are due to a decrease in LIBOR and prime ratespipeline system in the current year. In addition, approximately $0.8 millionIllinois Basin out of interest expense was capitalized during 2002, in conjunction with expansion construction onservice. The impairment represents the remaining net book value of the idled pipeline system. This pipeline did not support
spending the capital necessary to continue service and we shifted the majority of the gathering and transport activities to trucks. As a result, we were able to maintain most of our Cushing terminal compared to approximately $0.2 million in the 2001 period.margins.
Other. During the fourth quarter of 2003 we completed the refinancing of our bank credit facilities with new senior unsecured credit facilities totaling $750 million and a $200 million uncommitted facility for the purchase of hedged crude oil.oil (See "—Liquidity and Capital Resources—Credit Facilities and Long-term Debt"). In addition, during the third quarter of 2003 we made a $34 million prepayment on our seniorSenior secured term B loan in anticipation of the refinancing. The completion of these transactions resulted in a non-cash charge of approximately $3.3 million associated with the write-off of unamortized debt issue costs.
This section identifies certain matters of risk and uncertainty that may affect our financial performance and results of operations in the future.
Ongoing Acquisition Activities. Consistent with our business strategy, we are continuously engaged in discussions with potential sellers regarding the possible purchase by us of transportation, gathering, terminalling or storage assets and related businesses. These acquisition efforts often involve assets which, if acquired, would have a material effect on our financial condition and results of operations. In an effort to prudently and economically leverage our asset base, knowledge base and skill sets, management has also expanded its efforts to encompass businesses that are closely related to, or significantly intertwined with, the crude oil business. We can give no assurance that our current or future acquisition efforts will be successful or that any such acquisition will be completed on terms considered favorable to us.
During the third quarter of 2004, we acquired the Schaefferstown Propane Storage Facility from Koch Hydrocarbon, L.P. The total purchase price was approximately $32 million. In connection with the transaction, we also acquired an additional $14.2 million of inventory. The facility is located approximately 65 miles northwest of Philadelphia near Schaefferstown, Pennsylvania, and has the capacity to store approximately 20.0 million gallons of refrigerated propane. In addition, the facility has nineteen bullet storage tanks with an aggregate capacity of 570,000 gallons. Propane is delivered to the facility via truck or pipeline and is transported out of the facility by truck. The transaction also included approximately 61 acres of land and a truck rack. The preliminary purchase price was allocated to property and equipment.
Link Energy LLC Acquisition. The completion and integration of the Link acquisition began impacting our operating results in the second quarter of 2004. We anticipate that the assets acquired in the acquisition will generate a baseline cash flow from operations of approximately $25.0 million annually. In addition, we believe that we will realize annual cost savings and synergies of approximately $27.0 million to $32.0 million that are expected to be phased in by the first quarter of 2005 as the
business is fully integrated. However, we also anticipate certain one-time expense items in the initial six to nine month period as a result of integration costs, as well as costs associated with regulatory requirements. These costs will have a negative impact in the short-term on our baseline projection for the acquisition.
OCS Production. In October 2004, Plains Exploration and Production ("PXP") announced that it had successfully completed an initial development well into the Rocky Point field, which is accessible from the Point Arguello platforms and that drilling operations are underway on a second development well. Such drilling activities, if successful, are not expected to have a significant impact on pipeline shipments on our All American Pipeline system in 2004 but, could lead to increased volumes in future periods. However, weWe can give no assurances, however, that our volumes transported would increase as a result of this drilling activity.
Distribution Increase.Pipeline Integrity and Storage Tank Testing Compliance. Management intendsAlthough we believe our short-term estimates of costs under the pipeline integrity management rules and API 653 (and similar Canadian regulations) are reasonable, a high degree of uncertainty exists with respect to recommendestimating such costs, as we continue to the board of directors an increase in our quarterly distribution for the third quarter of 2004 to $0.60 per unit, or $2.40 per unit on an annualized basis. If approved by the board, the distribution increase would be effective with the distribution to be paid in mid-November 2004. An annualized distribution rate of $2.40 per unit would represent an increase of approximately 4% over its current annualized distribution of $2.31 per unittest existing assets and a 9% increase over the November 2003 distribution. You should be aware that management's recommendation is subject to the approval of its board of directors, which holds the sole authority to declare quarterly distributions to unitholders.as we acquire new assets.
Sarbanes-OxleySarbanes Oxley Act and New SEC Rules.Related Legislation. Several regulatory and legislative initiatives were introduced in 2002 and 2003 in response to developments during 2001 and 2002 regarding accounting issues at large public companies, resulting disruptions in the capital markets and ensuing calls for action to prevent repetitionrecurrence of thosesimilar events. ImplementationWe believe implementation of reforms in connection with these initiatives have added and will add to the costs of doing business for all publicly-tradedmost publicly traded entities, including us as a partnership. These costs will have an adverse impact on future income and cash flow.
Among the new requirements is the requirement under Section 404 of the Act, beginning with our 2004 Annual Report, for management to report on our internal control over financial reporting and for our independent public accountants to attest to management's report. During 2003, we commenced actions to enhance our ability to comply with these requirements, including but not limited to the addition of staffing in our internal audit department, documentation of existing controls and implementation of new controls or modification of existing controls as deemed appropriate. We have continued to devote substantial time and resources to the documentation and testing of our controls, and to planning for and implementation of remedial efforts in those instances where remediation is indicated. At this point, we have no indication that management will be unable to favorably report on our internal controls nor that our independent auditors will be unable to attest to management's findings. Both we and our auditors, however, must complete the process (which we have never completed before), so we cannot assure you of the results. It is unclear what impact failure to comply fully with Section 404 or the discovery of a material weakness in our internal control over financial reporting would have on us, but presumably it could result in the reduced ability to obtain financing, the loss of customers, and additional expenditures to meet the requirements.
Longer Term Outlook. Our longer-term outlook, spanning a period of five or more years, is influenced by many factors affecting the North American crude oil sector. Some of the more significant trends and factors include:
We believe the collective impact of these trends, factors and developments, many of which are beyond our control, will result in an increasingly volatile crude oil market that is subject to more frequent short-term swings in market prices and grade differentials and shifts in market structure. In an environment of reduced inventories and tight supply and demand balances, even relatively minor supply disruptions can cause significant price swings. Conversely, despite a relatively balanced market on a global basis, competition within a given region of the U.S. could cause downward pricing pressure and significantly impact regional crude oil price differentials among crude oil grades and locations. Although we believe our business strategy is designed to manage these trends, factors and potential developments, and that we are strategically positioned to benefit from certain of these developments, there can be no assurance that we will not be negatively affected.
Liquidity and Capital Resources
Liquidity
Cash generated from operations and our credit facilities are our primary sources of liquidity. At June 30,December 31, 2004, we had a working capital deficit of approximately $26.2$12.5 million, approximately $342.6$420.2 million of availability under our committed revolving credit facilities and $168.0$344.6 million of unused capacity under our uncommitted hedged inventory facility. Usage of the credit facilities is subject to compliance with covenants. We believe we are currently in compliance with all covenants.
As discussed above, In January 2005, we closed the Link acquisition on April 1, 2004. The acquisition was funded with cash on hand, borrowings under a new $200 million, 364-day credit facility andhad additional net borrowings under our existing revolving credit facilities.uncommitted hedged inventory facility of approximately $236.8 million. The new credit facility was terminated following our August 2004proceeds were used to pay for crude oil stored at December 31, 2004.
Capital Resources
We periodically access the capital markets for both equity and debt offering described below.financing. In connection with the Link acquisition, on April 15, 2004, we completed the private placement of 3,245,700 units of Class C common units to a group of institutional investors comprised of affiliates of Kayne Anderson Capital Advisors, Vulcan Capital and Tortoise Capital Advisors for $30.81 per unit. Total proceeds from the transaction, after deducting transaction costs and including the general partner's proportionate contribution, werewas approximately $101 million, and were used to reduce the balance outstanding under our existing revolving credit facilities.
million. In the third quarter of 2004, we completed a public offering of 4,968,000 common units for $33.25 per unit. The offering resulted in gross proceeds of approximately $165.2 million from the sale of units and approximately $3.4 million from our general partner's proportionate capital contribution. Total costs associated with the offering, including underwriter fees and other expenses, were approximately $7.4$7.7 million. Net proceeds of $161.1$160.9 million were used to permanently reduce outstanding borrowings under the new $200 million, 364-day credit facility discussed above.facility.
OnIn August 12, 2004, we sold $175completed the sale of $350 million of 4.75% senior notes due 2009 and $175 million of 5.88% senior notes due 2016. The 4.75% notes were sold at 99.551% and the 5.88% notes were sold at 99.345% of face value.notes. We used the net proceeds, after deducting initial purchaser discounts and offering costs, of approximately $345.3$345 million to repay amounts outstanding under our credit facilities,
including the remaining balance under the $200 million, 364-day facility we used to fund the Link acquisition, and for general partnership purposes. In connection with this repayment, we terminated the facility. Subsequent to the notes offering, we also terminated our $125 million, 364-day facility, which was scheduled to expire in November 2004.
We have recently increased the capacity of our uncommitted senior secured hedged inventory facility from $200 million to $300 million, primarily as a result of increased crude oil prices and an increase in our crude oil storage capacity as a result of acquisitions.
We believe that we have sufficient liquid assets, cash flow from operations and borrowing capacity under our credit agreements to meet our financial commitments, debt service obligations, contingencies and anticipated capital expenditures. However, we are subject to business and operational risks that could adversely affect our cash flow. A material decrease in our cash flows would likely produce an adverse effect on our borrowing capacity.
Capital Expenditures
We have made and will continue to make capital expenditures for acquisitions, expansion capital and maintenance capital. Historically, we have financed these expenditures primarily with cash generated by operations, credit facility borrowings, the issuance of senior unsecured notes and the sale of additional common units.
We expect to spendinvest approximately $125 million to $150$100 million on expansion capital projects during 2004.2005. Our 2005 expansion capital projects include the following notable projects with the estimated cost for the entire year.
| | Estimated to be incurred in 2005 | ||
|---|---|---|---|
| | (in millions) | ||
| Capital projects and upgrades associated with the Link acquisition | $ | 18.0 | |
| Trenton pipeline expansion | 16.0 | ||
| Cushing Phase V expansion | 13.0 | ||
| Cal Ven fractionator | 16.0 | ||
| Capital projects and upgrades associated with the Shell South Louisiana Assets acquisition | 8.0 | ||
| Other | 29.0 | ||
| $ | 100.0 | ||
In addition, we expect to spendinvest approximately $14.1$19.0 million on maintenance capital projects during 2004. For the first half of 2004,2005.
We believe that we have incurred approximately $32.0 million relatedsufficient liquid assets, cash flow from operations and borrowing capacity under our credit agreements to expansionmeet our financial commitments, debt service obligations, contingencies and anticipated capital projectsexpenditures. However, we are subject to business and approximately $3.1 millionoperational risks that could adversely affect our cash flow. A material decrease in our cash flows would likely produce an adverse effect on maintenance capital projects.
We will also have additional cash funding requirements related to the Link acquisition. The aggregate estimated purchase price for the Link acquisition is approximately $326.1 million, of which approximately $268.5 million (net of approximately $5.5 million subsequently returned to us from an indemnity escrow account) was funded at closing. The approximately $58.0 million balance includes acquisition related costs and net liabilities assumed.our borrowing capacity.
Cash Flows
Cash flows for the six monthsyears ended June 30,December 31, 2004, 2003 and 20032002 were as follows:
| | Six Months Ended June 30, | |||||||
|---|---|---|---|---|---|---|---|---|
| | 2004 | 2003 | ||||||
| | (in millions) | |||||||
| Cash provided by (used in): | ||||||||
| Operating activities | $ | 147.1 | $ | 204.8 | ||||
| Investing activities | (474.6 | ) | (139.8 | ) | ||||
| Financing activities | 334.0 | (63.0 | ) | |||||
| | Year Ended December 31, | ||||||||||
|---|---|---|---|---|---|---|---|---|---|---|---|
| | 2004 | 2003 | 2002 | ||||||||
| | (in millions) | ||||||||||
| Cash provided by (used in): | |||||||||||
| Operating activities | $ | 104.0 | $ | 115.3 | $ | 185.0 | |||||
| Investing activities | (651.2 | ) | (272.1 | ) | (374.9 | ) | |||||
| Financing activities | 554.5 | 157.2 | 189.5 | ||||||||
Operating Activities. The primary drivers of our cash flow from operations are (i) the collection of amounts related to the sale of crude oil and LPG and the transportation of crude oil for a fee and (ii) the payment of amounts related to the purchase of crude oil and LPG and other expenses, principally field operating costs and general and administrative expenses and interest expense.expenses. The cash settlement from the purchase and sale of crude oil during any particular month typically occurs within thirty days from the end of the month, except in the months that we store inventory because of contango market conditions.conditions or in months that we increase linefill. The storage of crude oil in periods of a contango market can have a material impact on our cash flows from operating activities for the period we pay for and store the crude oil and the subsequent period that we receive proceeds from the sale of the crude oil. When we
store the crude oil, we borrow on our credit facilities to pay for the crude oil andso the impact on
operating cash flow is negative. Conversely, cash flow from operations increases in the period we collect the cash from the sale of the stored crude oil. To a lesser extent,In addition, our cash flow from operating activities is also impacted by the level of LPG inventory stored at period end.
Cash flow from operations was $147.1$104.0 million and $204.8 million for the six months ended June 30,in 2004 and 2003, respectively.
Investing Activities. Netreflects cash usedgenerated by our recurring operations that was offset negatively by several factors totaling approximately $100 million. The primary item was a net increase in investing activities for the six months ended June 30, 2004hedged crude oil and 2003 consisted predominantly of cash paid for acquisitions. Net cash usedLPG inventory and linefill in the 2004 period was $474.6 million and was primarily comprised of (i) $142.3 million paid for the Capline and Capwood Pipeline Systems acquisition (a deposit had been paid in December 2003), (ii) approximately $280 million paid for the Link acquisition, (iii) approximately $19 million paid for the CalVen acquisition and (iv) $32.2 million paid for additions to property and equipment. Included in cash paid for additions to property and equipment is (i) approximately $6.6 million related to the Cushing Phase IV expansion, (ii) approximately $5.0 million related to the Iatan System expansion, (iii) approximately $3.0 million of maintenance capital, and (iv) approximately $1.2 million related to the Cushing to Caney pipeline project. Net cash used in investing activities in the 2003 period includes approximately $79.6 million paid for acquisitions and approximately $37.5 million for additions to property and equipment. In addition, approximately $28.5 million was paid for linefill onthird party assets that we own.
Financing Activities. Cash provided by financing activities in the 2004 period was approximately $334.0 million and was comprised of (i) approximately $100.9 million of proceeds from the issuance of Class C common units, (ii) net short and long-termfinanced with borrowings under our revolving credit facilityfacilities (approximately $75 million net). Cash flows from operations were also negatively impacted by a decrease of approximately $403.7$20 million used primarilyin prepayments received from counter parties to fund the purchase price of the Capline and Link acquisitions, (iii) net repayments under our short-term letter ofmitigate credit and hedged inventory facility of approximately $96.1 million resulting from the collection of receivables related to prior year sales of inventory that was stored because of contango market conditions, and (iv) $72.7 million of distributions paid to common unitholders and the general partner. Cash used in financing activities in the 2003 period consisted of (i) approximately $63.9 million of proceeds from the issuance of common units used to pay down outstanding balances on the revolving credit facility, (ii) $58.8 million of distributions paid to unitholders and the general partner, (iii) a $7.0 million repayment of a maturity under our senior secured term loan, (iv) net long-term borrowings under our revolving credit facilities of $29.1 million, and (v) net short-term debt repayments of $90.2 million primarily from the proceeds of inventory sales.risk.
Cash flows for the years ended December 31, 2003, 2002 and 2001 were as follows:
| | Year ended December 31, | ||||||||||
|---|---|---|---|---|---|---|---|---|---|---|---|
| | 2003 | 2002 | 2001 | ||||||||
| | (in millions) | ||||||||||
| Cash provided by (used in): | |||||||||||
| Operating activities | $ | 115.3 | $ | 185.0 | $ | (16.2 | ) | ||||
| Investing activities | (272.1 | ) | (374.9 | ) | (263.2 | ) | |||||
| Financing activities | 157.2 | 189.5 | 279.5 | ||||||||
Operating Activities. Our positive cash flow from operations for 2003 resulted from cash generated by our recurring operations. In addition, cash flow from operating activities was positively impacted by approximately $74 million related to proceeds received in 2003 from the sale of 2002 hedged crude oil inventory and negatively impacted by approximately $100 million related to inventory stored at the end of 2003. The proceeds from the sale of the 2003 stored crude oil were received in the first quarter of 2004. In 2003, we also received approximately $23 million of additional prepayments over the 2002 balance from counter-partiescounter parties to mitigate our credit risk, and paid approximately $6.2 million to terminate an interest rate hedge in conjunction with a change in our capital structure.
Our positive cash flow from operations for 2002 resulted from cash generated by our recurring operations. In addition, we received approximately $93 million of proceeds during 2002 associated with crude oil hedged and stored during 2001. This was partially offset by the payment of approximately $74 million for crude oil purchased and stored during 2002 but for which receipt of the proceeds occurred during 2003. In addition, our 2002 cash flow from operating activities was positively impacted by the collection of approximately $21 million of prepayments from counter-partiescounter parties to mitigate our credit risks and the collection of approximately $9.1 million of amounts that had been outstanding primarily since 1999 and 2000.
Our negative cash flow from operations for 2001 resulted from positive cash generated by our recurring operations offset by the payment of approximately $93 million for crude oil hedged and stored during 2001 for which receipt of the proceeds occurred during 2002.
Investing Activities. Net cash used in investing activities in 2004, 2003 2002 and 20012002 consisted predominantly of cash paid for acquisitions and purchases of linefill.acquisitions. Net cash used in 2004 was approximately $651 million and was comprised primarily of cash paid for acquisitions of $535 million, which included (i) approximately $294 million for the Link acquisition, (ii) approximately $143 million for the Capline/Capwood acquisition (a deposit of $15.8 million was paid during 2003), (iii) approximately $47 million for the Schafferstown Propane Storage Facility (including approximately $14.2 million of working inventory) and (iv) approximately $51 million related to various other acquisitions. Investing activities for 2004 also included over $115 million of property and equipment construction and capitalized maintenance projects, which includes approximately $34 million related to the Cushing to Broome pipeline construction project.
Net cash used in investing activities 2003 was $272.1 million and was comprised of (i) an aggregate $152.6 million paid primarily for ten acquisitions completed during 2003, (ii) a $15.8 million deposit paid on the acquisition from Shell Pipeline Company;Capline acquisition; see "—Acquisitions", (iii) proceeds of approximately $8.5 million from sales of assets, and (iv) $65.4 million paid for additions to property and equipment, including $19.2 million related to the construction of crude oil gathering and transmission lines in West Texas, and (v) crude oil linefill purchases of approximately $47 million, primarily attributable to increased linefill requirements related to 2003 and 2002 acquisitions. Net cash used in 2002 was $374.9 million and was comprised of (i) an aggregate $324.6 million paid for three acquisitions completed during 2002; see "—Acquisitions", and (ii) $40.6 million paid for additions to property and equipment, primarily related to our Cushing expansion and the construction of the Marshall terminal in Canada, and (iii) crude oil linefill purchases of approximately $11 million. Net cash used in 2001 was $263.2 million and was comprised of (i) an aggregate $229.2 million paid for three acquisitions completed during 2001; see "—Acquisitions", and (ii) $21.1 million paid for additions to property and equipment, and (iii) approximately $13.7 million of crude oil linefill attributable to increased linefill requirements.
Financing Activities. Cash provided by financing activities in 2004 consisted primarily of $348.1 million of net proceeds from the issuance of senior notes and $262.1 million of net proceeds
from the issuance of common units, used primarily to fund acquisitions and pay down outstanding balances on our revolving credit facilities. Net borrowings under our short-term and long-term revolving credit facilities were $107.7 million. In addition, $158.4 million of distributions were paid to our unitholders and general partner.
Cash provided by financing activities in 2003 consisted primarily of $499.7 million of net proceeds from the issuance of common units and senior unsecured notes, used primarily to fund capital projects and acquisitions and pay down outstanding balances on our revolving credit facilities and senior term loans. Net repayments of our short-term and long-term revolving credit facilities and related senior term loans were $215.4 million. In addition, $121.8 million of distributions were paid to our unitholders and general partner. Cash provided by financing activities in 2002 consisted of approximately $344.6 million of net proceeds from the issuance of common units and senior unsecured notes, used primarily to fund capital projects and acquisitions and pay down outstanding balances on the revolving credit facility. Net repayments of our short-term and long-term revolving credit facilities during 2002 were $49.9 million. In addition, $99.8 million of distributions were paid to our unitholders and general partner during the year ended December 31, 2002.
Credit Facilities and Long-term Debt
During August 2004, we completed the sale of $175 million of 4.75% senior notes due 2009 and $175 million of 5.88% senior notes due 2016. The 4.75% notes were sold at 99.551% of face value and the 5.88% notes were sold at 99.345% of face value. We used the net proceeds, after deducting initial purchaser discounts and offering costs, of approximately $345 million to repay amounts outstanding under our credit facilities, including the remaining balance under the $200 million, 364-day facility funded in connection with the Link acquisition, and for general partnership purposes. In connection with this repayment, we terminated the facility. Subsequent to the notes offering, we also terminated our $125 million, 364-day facility that was scheduled to expire in November 2004.
Cash provided by financing activities in 2001 consisted primarily of net short-term and long-termIn November 2004, we entered into a new $750 million, five-year senior unsecured credit facility, which contains a sub-facility for Canadian borrowings of $134.3up to $300 million. The new credit facility extends our maturities, lowers our cost of credit and provides an additional $125 million of liquidity over our previous facilities. This facility can be expanded to $1 billion. As of December 31, 2004, we had approximately $231.8 million outstanding under this credit facility, as well as $98.0 million in letters of credit outstanding, resulting in unused capacity under the facility of approximately $420.2 million.
Also in the fourth quarter of 2004, we amended and renewed our secured hedged inventory facility; increasing the facility to $425 million, with the ability to further increase the facility in the future by an incremental $75 million. This facility is an uncommitted working capital facility, which is used to finance the purchase of hedged crude oil inventory for storage when market conditions warrant. Borrowings under the hedged inventory facility are secured by the inventory purchased under the facility and the associated accounts receivable, and will be repaid with the proceeds from the issuancesale of common unitssuch inventory. This facility expires in November 2005. As of $227.5December 31, 2004, we had approximately $80.4 million outstanding and no letters of credit issued under our hedged crude oil inventory facility resulting in unused uncommitted capacity under this facility of approximately $344.6 million.
Our credit agreements and the paymentindentures governing our senior notes contain cross default provisions. Our credit agreements prohibit distributions on, or purchases or redemptions of, $75.9 millionunits if any default or event of default is continuing. In addition, the agreements contain various covenants limiting our ability to, among other things:
Our credit facility treats a change of control as an event of default and also requires us to maintain:
For covenant compliance purposes, letters of credit and borrowings to fund hedged inventory and margin requirements are excluded when calculating the debt coverage ratio.
A default under our credit facility would permit the lenders to accelerate the maturity of the outstanding debt. As long as we are in compliance with our credit agreements, our ability to make distributions toof available cash is not restricted. We are currently in compliance with the covenants contained in our unitholderscredit agreements and general partner.indentures.
Contingencies
Industry Credit Markets and Accounts Receivable. Throughout the latter part of 2001 and all of 2002, there were significant disruptions and extreme volatility in the financial markets and credit markets. Because of the credit intensive nature of the energy industry and extreme financial distress at several large, diversified energy companies, the energy industry was especially impacted by these
developments. We believe that these developments have created an increased level of direct and indirect counterparty credit and performance risk.
The majority of our credit extensions relate to our gathering and marketing activities that can generally be described as high volume and low margin activities. During periods of relatively higher prices, our absolute exposure to any given counterparty may be increased. In our credit approval process, we make a determination of the amount, if any, of the line of credit to be extended to any given customer and the form and amount of financial performance assurances we require. Such financial assurances are commonly provided to us in the form of standby letters of credit, advance cash payments or "parental" guarantees. As of June 30, 2004, we had received approximately $18.3 million of advance cash payments and prepayments from third parties to mitigate credit risk.
Pipeline and Storage Regulation. Some of our petroleum pipelines and storage tanks in the United States are subject to regulation by the U.S. Department of Transportation ("DOT") with respect to the design, installation, testing, construction, operation, replacement and management of pipeline and tank facilities. In addition, we must permit access to and copying of records, and must make certain reports available and provide information as required by the Secretary of Transportation. Comparable regulation exists in Canada and in some states in which we conduct intrastate common carrier or private pipeline operations. See "Business—Regulation—Pipeline and Storage Regulation."
Regulatory compliance costs include those related to pipeline integrity management and the adoption by the DOT of API 653 as the standard for the inspection, repair, alteration and reconstruction of jurisdictional storage tanks. For our estimates of costs associated with these regulations, see "Business—Regulation—Pipeline and Storage Regulation."
The DOT is currently considering expanding the scope of its pipeline regulation to include certain gathering pipeline systems that are not currently subject to regulation. This expanded scope would likely include the establishment of additional pipeline integrity management programs for these newly regulated pipelines. The DOT is in the initial stages of evaluating this initiative and we do not currently know what, if any, impact this will have on our operating expenses. However, we cannot assure you that future costs related to the potential programs will not be material.
Export License Matter. In our gathering and marketing activities, we import and export crude oil from and to Canada. Exports of crude oil are subject to the short supply"short supply" controls of the Export Administration Regulations ("EAR") and must be licensed by the Bureau of Industry and Security (the "BIS") of the U.S. Department of Commerce.Commerce Department. In 2002, we determined that we may have exceededviolated the terms of our licenses with respect to the quantity of crude oil exports authorized by previous licenses.exported and the end-users in Canada. Export of crude oil in excess of theexcept as authorized amountsby license is a violation of the EAR. OnIn October 18, 2002, we submitted to the BIS an initial notification of voluntary disclosure. The BIS subsequently informed us that we could continue to export while previous exports were under review. We applied for and received aseveral new licenselicenses allowing for exports ofexport volumes and end users that more than adequately reflectingaccurately reflect our anticipated business and customer needs. We also conducted reviews of new and existing contracts and implemented new procedures and practices in order to monitor compliance with applicable laws regarding the export of crude oil to Canada. As a result, we subsequently submitted additional information to the BIS in October 2003 and May 2004. In August 2004, we received a request from the BIS for additional information. We are cooperatinghave responded to this and subsequent requests, and continue to cooperate fully with the BIS in its inquiry.officials. At this time, we have received neither a warning letter nor a charging letter, which could involve the imposition of penalties, and no indication whetherof what penalties the BIS intends to charge us with a violation of the EAR or, if so, what penalties would be assessed.might assess. As a result, we cannot reasonably estimate the ultimate impact of this matter.
Alfons Sperber v. Plains Resources Inc., et al. On December 18, 2003, a putative class action lawsuit was filed in the Delaware Chancery Court, New Castle County, entitled Alfons Sperber v. Plains Resources Inc., et al. This suit, brought on behalf of a putative class of Plains All American Pipeline, L.P. common unitholders, assertsasserted breach of fiduciary duty and breach of contract claims against us,
Plains AAP, L.P., and Plains All American GP LLC and its directors, as well as breach of fiduciary duty claims against Plains Resources Inc. and its directors. The complaint seekssought to enjoin or rescind a proposed acquisition of all of the outstanding stock of Plains Resources Inc., as well as declaratory relief, an accounting, disgorgement and the imposition of a constructive trust, and an award of damages, fees, expenses and costs, among other things. This lawsuit has been settled in principle, subjectprinciple. The court has approved the settlement and the settlement became final in March 2005.
Pipeline Releases. In December 2004 and January 2005, we experienced two unrelated releases of crude oil that reached rivers located near the sites where the releases originated. In late December 2004, one of our pipelines in West Texas experienced a rupture that resulted in the release
of approximately 4,500 barrels of crude oil, a portion of which reached a remote location of the Pecos River. In early January 2005, an overflow from a temporary storage tank located in East Texas resulted in the release of approximately 1,200 barrels of crude oil, a portion of which reached the Sabine River. In both cases, emergency response personnel under the supervision of a unified command structure consisting of representatives of Plains Pipeline, the U.S. Environmental Protection Agency, the Texas Commission on Environmental Quality and the Texas Railroad Commission conducted clean-up operations at each site. Approximately 4,200 barrels and 980 barrels were recovered from the two respective sites. The unrecovered oil has been or will be removed or otherwise addressed by PAA in the course of site remediation. Aggregate costs associated with each release, including estimated remediation costs, are estimated at approximately $1.7 million and $1.4 million, respectively. We continue to work with the appropriate state and federal environmental authorities in responding to the preparationreleases and execution of appropriate settlement documentation and court approval.no enforcement proceedings have been instituted by any governmental authority at this time.
Litigation.General. We, in the ordinary course of business, are a claimant and/or a defendant in various legal proceedings. We do not believe that the outcome of these legal proceedings, individually or in the aggregate, will have a materially adverse effect on our financial condition, results of operations or cash flows.
Environmental. We may experience future releases of crude oil into the environment from our pipeline, gathering and storage operations, or discover past releases that were previously unidentified. Although we maintain an inspection program designed to prevent and, as applicable, to detect and address such releases promptly, damages and liabilities incurred due to any such environmental releases from our assets may substantially affect our business. At December 31, 2004, our reserve for environmental liabilities totaled approximately $19.8 million. Approximately $12.7 million of the reserve is related to liabilities assumed as part of the Link acquisition. Although we believe our reserve is adequate, no assurance can be given that any costs incurred in excess of this reserve would not have a material adverse effect on our financial condition, results of operations or cash flows.
Other. A pipeline, terminal or other facility may experience damage as a result of an accident or natural disaster. These hazards can cause personal injury and loss of life, severe damage to and destruction of property and equipment, pollution or environmental damage and suspension of operations. We maintain insurance of various types that we consider adequate to cover our operations and properties. The insurance covers our assets in amounts considered reasonable. The insurance policies are subject to deductibles that we consider reasonable and not excessive. Our insurance does not cover every potential risk associated with operating pipelines, terminals and other facilities, including the potential loss of significant revenues. The overall trend in the environmental insurance industry appears to be a contraction in the breadth and depth of available coverage, while costs, deductibles and retention levels have increased. Absent a material favorable change in the insurance markets, this trend is expected to continue as we continue to grow and expand. As a result, we anticipate that we will elect to self-insure more of our activities.activities or incorporate higher retention in our insurance arrangements.
The occurrence of a significant event not fully insured, indemnified or indemnifiedreserved against, or the failure of a party to meet its indemnification obligations, could materially and adversely affect our operations and financial condition. We believe that we are adequately insured for public liability and property damage to others with respect to our operations. With respect to all of our coverage, no assurance can be given that we will be able to maintain adequate insurance in the future at rates we consider reasonable.
We may experience future releases of crude oil intoreasonable, or that we have established adequate reserves to the environment from our pipeline and storage operations, or discover past releasesextent that were previously unidentified. Although we maintain an inspection program designed to prevent and, as applicable, to detect and address such releases promptly, damages and liabilities incurred due to any such environmental releases from our assets may substantially affect our business.
Credit Facilities and Long-Term Debt
During August 2004, we completed the sale of $175 million of 4.750% senior notes due August 2009 and $175 million of 5.875% senior notes due August 2016. The notes were issued by us and a 100% owned finance subsidiary (neither of which have independent assets or operations) at an aggregate discount of $2.2 million, resulting in an effective average interest rate of 5.40%. Interest payments on each series of notesrisks are due February 15 and August 15 of each year. The notes are fully and unconditionally guaranteed, jointly and severally, by all of our existing 100% owned subsidiaries, except for subsidiaries that are minor.
During December 2003, we completed the sale of $250 million of 5.625% senior notes due December 2013. The notes were issued by us and a 100% owned finance subsidiary (neither of which have independent assets or operations) at a discount of $0.7 million, resulting in an effective interest rate of 5.66%. Interest payments are due on June 15 and December 15 of each year. The notes are fully and unconditionally guaranteed, jointly and severally, by all of our existing 100% owned subsidiaries, except for subsidiaries that are minor.not insured.
We have senior unsecured bank credit facilities consisting of:
We also have a secured $300 million hedged inventory facility (recently increased from $200 million). This facility is an uncommitted working capital facility, which will be used to finance the purchase of hedged crude oil inventory for storage when market conditions warrant. Borrowings under the hedged inventory facility will be secured by the inventory purchased under the facility and the associated accounts receivable, and will be repaid with the proceeds from the sale of such inventory. At June 30, 2004, we had approximately $4.4 million outstanding and $27.6 million of letters of credit issued under our hedged crude oil inventory facility resulting in unused uncommitted capacity of approximately $268.0 million under this facility (pro forma for the recent increase to $300 million).
Our credit facilities, the indentures governing the 4.750% senior notes, 5.625% senior notes, 5.875% senior notes and 7.75% senior notes contain cross default provisions. Our credit facilities prohibit distributions on, or purchases or redemptions of, units if any default or event of default is continuing. In addition, the agreements contain various covenants limiting our ability to, among other things:
Our credit facilities treat a change of control as an event of default and also require us to maintain:
For covenant compliance purposes, letters of credit and borrowings to fund hedged inventory and margin requirements are excluded when calculating the debt coverage ratio.
A default under our credit facilities would permit the lenders to accelerate the maturity of the outstanding debt. As long as we are in compliance with our credit agreements, they do not restrict our ability to make distributions of available cash as defined in "Cash Distribution Policy—Distributions of Available Cash." We are currently in compliance with the covenants contained in our credit facilities and indentures.
The average life of our long-term debt capitalization at June 30, 2004, was approximately 6 years. At June 30, 2004 we had approximately $13.2 million of short-term working capital borrowings and $90.0 million of long-term borrowings outstanding under our $425 million U.S. revolving credit facility, no amounts outstanding under our $125 million, 364-day revolving credit facility, $25.7 million outstanding under our $30 million Canadian working capital revolving credit facility, $170.0 million outstanding under our $170 million Canadian revolving credit facility that matures in 2009,
$200.0 million outstanding under our new $200 million, 364-day revolving credit facility, $200 million of senior notes that mature in 2012 and $250 million of senior notes that mature in 2013.
Commitments
Contractual Obligations. In the ordinary course of doing business we enter into various contractual obligations for varying terms and amounts. The following table includes our non-cancelable contractual obligations as of June 30, 2004, and our best estimate of the period in which the obligation will be settled:
| | 2004 | 2005 | 2006 | 2007 | 2008 | Thereafter | Total | |||||||||||||||
|---|---|---|---|---|---|---|---|---|---|---|---|---|---|---|---|---|---|---|---|---|---|---|
| | (in millions) | |||||||||||||||||||||
| Long-term debt | $ | — | $ | 200.0 | $ | — | $ | 115.8 | $ | — | $ | 620.0 | $ | 935.8 | ||||||||
| Operating leases(1) | 9.3 | 15.8 | 13.8 | 10.2 | 3.8 | 12.4 | 65.3 | |||||||||||||||
| Capital expenditure obligations | 76.4 | — | — | — | — | — | 76.4 | |||||||||||||||
| Other long-term liabilities | 1.5 | 0.5 | 0.2 | — | — | — | 2.2 | |||||||||||||||
| Total | $ | 87.2 | $ | 216.3 | $ | 14.0 | $ | 126.0 | $ | 3.8 | $ | 632.4 | $ | 1,079.7 | ||||||||
In addition to the items in the table above, we have entered into various operational commitments and agreements related to pipeline operations and to the marketing, transportation, terminalling and storage of crude oil and the marketing and storage of LPG. The majority of these contractual commitments are for the purchase of crude oil and LPG that are madefrom third parties under contracts, thatthe majority of which range in term from a thirty-day evergreen to three years. A substantial portion of the contracts that extend beyond thirty days include cancellation provisions that allow us to cancel the contract with thirty days written notice. From time to time, we also enterWe establish a margin for these purchases by entering into various types of physical and financial sale and exchange transactions including fixed price delivery contracts, floating price collar arrangements, financial swaps and crude oil futures contracts as hedging devices. Through these transactions,through which we seek to maintain a position that is substantially balanced between crude oil and LPG purchases and sales and future delivery obligations. The volumetable below includes purchase obligations related to these activities. Where applicable the amounts presented represent the net obligations associated with buy/sell contracts and pricesthose subject to a net settlement arrangement with the counterparty. We do not expect to use a significant amount of internal capital to meet these obligations, as the obligations will be funded by corresponding sales to credit worthy entities.
The following table includes our best estimate of the amount and timing of these purchasepayments as well as others due under the specified contractual obligations as of December 31, 2004.
| | 2005 | 2006 | 2007 | 2008 | 2009 | Thereafter | |||||||||||||
|---|---|---|---|---|---|---|---|---|---|---|---|---|---|---|---|---|---|---|---|
| | (in millions) | ||||||||||||||||||
| Long-term debt and interest payments(1) | $ | 49.7 | $ | 49.7 | $ | 49.7 | $ | 49.7 | $ | 368.0 | $ | 799.7 | |||||||
| Leases(2) | 17.8 | 14.0 | 10.9 | 6.3 | 5.2 | 13.7 | |||||||||||||
| Capital expenditure obligations | 20.6 | — | — | — | — | — | |||||||||||||
| Other long-term liabilities(3) | 2.8 | 4.9 | 3.5 | 1.6 | 1.1 | 3.0 | |||||||||||||
| Subtotal | 90.9 | 68.6 | 64.1 | 57.6 | 374.3 | 816.4 | |||||||||||||
| Crude oil and LPG purchases(4) | 1,265.7 | 20.0 | 2.0 | 2.0 | 1.0 | — | |||||||||||||
| Total | $ | 1,356.6 | $ | 88.6 | $ | 66.1 | $ | 59.6 | $ | 375.3 | $ | 816.4 | |||||||
Letters of Credit. In connection with our crude oil marketing, we provide certain suppliers and transporters with irrevocable standby letters of credit to secure our obligation for the purchase of crude oil. Our liabilities with respect to these purchase obligations are recorded in accounts payable on our balance sheet in the month the crude oil is purchased. Generally, these letters of credit are issued for up to seventy-day periods and are terminated upon completion of each transaction. At June 30,December 31, 2004, we had outstanding letters of credit under our various facilities of approximately $136.1$98.0 million.
Distributions. We willplan to distribute 100% of our available cash within 45 days after the end of each quarter to unitholders of record and to our general partner. Available cash is generally defined as all cash and cash equivalents on hand at the end of the quarter less reserves established by our general partner for future requirements. On August 13, 2004,February 14, 2005, we paid a cash distribution of $0.5775$0.6125 per unit on all outstanding units. The total distribution paid was approximately $41.8$45.0 million, with approximately $38.8$41.2 million paid to our common unitholders and approximately $3.0$3.8 million paid to our general partner for its general partner ($0.8 million) and incentive distribution interests ($2.23.0 million).
Our general partner is entitled to incentive distributions if the amount we distribute with respect to any quarter exceeds levels specified in our partnership agreement. Under the quarterly incentive distribution provisions, our general partner is entitled, without duplication, to 15% of amounts we
distribute in excess of $0.450 per limited partner unit, 25% of amounts we distribute in excess of $0.495 per limited partner unit and 50% of amounts we distribute in excess of $0.675 per limited partner unit.
In 2003,2004, we paid $4.4 million in incentive distributions to our general partner. Thus far in 2004 (through August 13, 2004), we have paid $5.6$8.3 million in incentive distributions to our general partner. See "Certain Relationships and Related Transactions—Our General Partner."
Off-Balance Sheet Arrangements
We have no off-balance sheet arrangements as defined by Item 307303 of Regulation S-K.
Quantitative and Qualitative Disclosures About Market Risks
We are exposed to various market risks, including volatility in (i) crude oil and LPG commodity prices, (ii) interest rates and (iii) currency exchange rates. We utilize various derivative instruments to manage such exposure. Our risk management policies and procedures are designed to monitor interest rates, currency exchange rates, NYMEX and over-the-counter positions, and physical volumes, grades, locations and delivery schedules to ensure our hedging activities address our market risks. We have a risk management function that has direct responsibility and authority for our risk policies and our trading controls and procedures and certain aspects of corporate risk management. To hedge the risks discussed above we engage in price risk management activities that we categorize by the risks we are hedging. The following discussion addresses each category of risk.
Commodity Price Risk
We hedge our exposure to price fluctuations with respect to crude oil and LPG in storage, and expected purchases sales and transportationsales of these commodities. The derivative instruments utilized consist primarily of futures and option contracts traded on the NYMEX and over-the-counter transactions, including crude oil swap and option contracts entered into with financial institutions and other energy companies (see Note 5 to our consolidated financial statements for a discussion of the mitigation of credit risk beginning on page F-45 of this prospectus).companies. Our policy is to purchase only crude oil for which we have a market, and to structure our sales contracts so that crude oil price fluctuations do not materially affect the segment profit we receive. Except for the controlled trading program discussed below, we do not acquire and hold crude oil futures contracts or other derivative products for the purpose of speculating on crude oil price changes that might expose us to indeterminable losses.
While we seek to maintain a position that is substantially balanced within our crude oil lease purchase and LPG activities, we may experience net unbalanced positions for short periods of time as a result of production, transportation and delivery variances as well as logistical issues associated with inclement weather conditions. In connection with managing these positions and maintaining a constant presence in the marketplace, both necessary for our core business, we engage in a controlled trading program for up to an aggregate of 500,000 barrels of crude oil.
In order to hedge margins involving our physical assets and manage risks associated with our crude oil purchase and sale obligations, we use derivative instruments, including regulated futures and options transactions, as well as over-the-counter instruments. In analyzing our risk management activities, we draw a distinction between enterprise-levelenterprise level risks and trading-relatedtrading related risks. Enterprise-levelEnterprise level risks are those that underlie our core businesses and may be managed based on whether there is value in doing so. Conversely, trading-relatedtrading related risks (the risks involved in trading in the hopes of generating an increased return) are not inherent in the core business; rather, those risks arise as a result of engaging in the trading activity. We have a Risk Management Committee that approves all new risk management strategies through a formal process. With the partial exception of the controlled trading program, our
approved strategies are intended to mitigate enterprise-levelenterprise level risks that are inherent in our core businesses of gathering and marketing and storage.
Although the intent of our risk-management strategies is to hedge our margin, not all of our derivatives qualify for hedge accounting. In such instances, changes in the fair values of these derivatives will receive mark-to-market treatment in current earnings, and result in greater potential for earnings volatility than in the past.volatility. This accounting treatment is discussed further under Note 2 "Summary of Significant Accounting Policies" beginning on page F-35 of this prospectus.our Consolidated Financial Statements.
All of our open commodity price risk derivatives at June 30,December 31, 2004 were categorized as non-trading. The fair value of these instruments and the change in fair value that would be expected from a 10 percent price decrease are shown in the table below (in millions):
| | Fair Value | Effect of 10% Price Decrease | Fair Value | Effect of 10% Price Decrease | |||||||||
|---|---|---|---|---|---|---|---|---|---|---|---|---|---|
| Crude oil: | |||||||||||||
| Futures contracts | $ | 18.6 | $ | (1.4 | ) | $ | 42.3 | (11.8 | ) | ||||
| Swaps and options contracts | $ | (4.6 | ) | $ | 2.5 | (5.1 | ) | (5.1 | ) | ||||
LPG: | |||||||||||||
| Futures contracts | $ | — | $ | — | |||||||||
| Swaps and options contracts | $ | (1.0 | ) | $ | 1.3 | ||||||||
| Swaps and option contracts | 2.3 | (2.7 | ) | ||||||||||
The fair values of the futures contracts are based on quoted market prices obtained from the NYMEX. The fair value of the swaps and option contracts are estimated based on quoted prices from various sources such as independent reporting services, industry publications and brokers. These quotes are compared to the contract price of the swap, which approximates the gain or loss that would have been realized if the contracts had been closed out at year end. For positions where independent quotations are not available, an estimate is provided, or the prevailing market price at which the positions could be liquidated is used. The assumptions in these estimates as well as the source is maintained by the independent risk control function. All hedge positions offset physical exposures to the cash market; none of these offsetting physical exposures are included in the above table. Price-risk sensitivities were calculated by assuming an across-the-board 10 percent decrease in price regardless of term or historical relationships between the contractual price of the instruments and the underlying commodity price. In the event of an actual 10 percent change in prompt month crude prices, the fair value of our derivative portfolio would typically change less than that shown in the table due to lower volatility in out-month prices.
Interest Rate Risk
We utilize both fixed and variable rate debt, and are exposed to market risk due to the floating interest rates on our credit facilities. Therefore, from time to time we utilize interest rate swaps and collars to hedge interest obligations on specific debt issuances, including anticipated debt issuances. There are no interest rate hedging instruments outstanding as of December 31, 2004. The table below presents principal payments and the related weighted average interest rates by expected maturity dates for variable rate debt outstanding at December 31, 2003. The 7.75%2004. All of our senior notes issued during 2002 and the 5.625% senior notes issued during 2003 are fixed rate notes and their interest rates are not subject to market risk. Our variable rate debt bears interest at LIBOR, prime or the bankers acceptance rate plus the applicable margin. The average interest rates presented below are based upon rates
in effect at June 30,December 31, 2004. The carrying values of the variable rate
instruments in our credit facilities approximate fair value primarily because interest rates fluctuate with prevailing market rates.rates, and the credit spread on outstanding borrowings reflects market.
| | Expected Year of Maturity | |||||||||||||||||||||||
|---|---|---|---|---|---|---|---|---|---|---|---|---|---|---|---|---|---|---|---|---|---|---|---|---|
| | 2004 | 2005 | 2006 | 2007 | 2008 | Thereafter | Total | |||||||||||||||||
| | (in millions) | |||||||||||||||||||||||
| Liabilities: | ||||||||||||||||||||||||
| Short-term debt—variable rate | $ | 22.0 | $ | — | $ | — | $ | — | $ | — | $ | — | $ | 22.0 | ||||||||||
| Average interest rate | 3.3 | % | — | — | — | — | — | 3.3 | % | |||||||||||||||
| Long-term debt—variable rate | $ | — | $ | 200.0 | $ | — | $ | 115.8 | $ | — | $ | 170.0 | $ | 485.8 | ||||||||||
| Average interest rate | — | 2.3 | % | — | 2.8 | % | — | 2.3 | % | 2.4 | % | |||||||||||||
| | Expected Year of Maturity | |||||||||||||||||||
|---|---|---|---|---|---|---|---|---|---|---|---|---|---|---|---|---|---|---|---|---|
| | 2005 | 2006 | 2007 | 2008 | 2009 | Thereafter | Total | |||||||||||||
| | (in millions) | |||||||||||||||||||
| Liabilities: | ||||||||||||||||||||
| Short-term debt—variable rate | $ | 168.6 | $ | — | $ | — | $ | — | $ | — | $ | — | 168.6 | |||||||
| Average interest rate | 3.4 | % | — | — | — | — | — | 3.4 | ||||||||||||
| Long-term debt—variable rate | $ | — | $ | — | $ | — | $ | — | $ | 143.6 | — | 143.6 | ||||||||
| Average interest rate | — | — | — | — | 3.5 | % | 3.5 | % | ||||||||||||
Currency Exchange Risk
Our cash flow stream relating to our Canadian operations is based on the U.S. dollar equivalent of such amounts measured in Canadian dollars. Assets and liabilities of our Canadian subsidiaries are translated to U.S. dollars using the applicable exchange rate as of the end of a reporting period. Revenues, expenses and cash flow are translated using the average exchange rate during the reporting period.
Because a significant portion of our Canadian business is conducted in Canadian dollars, we use certain financial instruments to minimize the risks of changes in the exchange rate. These instruments include forward exchange contracts forward extra option contracts and cross currency swaps. Additionally, at times, a portion of our debt is denominatedNeither the forward exchange contracts nor the cross currency swaps qualify for hedge accounting in Canadian dollars.accordance with SFAS 133.
At December 31, 2003, we did not have any Canadian dollar debt. All of the financial instruments utilized are placed with large creditworthy financial institutions.
At June 30, 2004, we had forward exchange contracts that allow us to exchange $2.0 million Canadian dollars for U.S. dollars, quarterly, at least $1.5 million U.S. quarterly during 2004 (based on a Canadian dollar to U.S. dollarset exchange rate of 1.33 to 1) and $1.0 million Canadian forrates as detailed below:
| | Canadian Dollars | US Dollars | Total | |||||
|---|---|---|---|---|---|---|---|---|
| | ($ in millions) | |||||||
| 2005 | $ | 3.0 | $ | 2.3 | 1.33 to 1 | |||
| 2006 | $ | 2.0 | $ | 1.5 | 1.32 to 1 | |||
In addition, at least $0.7 million U.S. quarterly during 2005 (based on a Canadian dollar to U.S. dollar exchange rate of 1.34 to 1). At June 30,December 31, 2004, we also had cross currency swap contracts for an aggregate notional principal amount of $21.0 million effectively converting this amount of our U.S. dollar denominated debt to $32.5 million of Canadian dollar debt (based on a Canadian dollar to U.S. dollar exchange rate of 1.55 to 1). The notional principal amount reduces by $2.0 million U.S. in May 2005 and has a final maturity in May 2006 ($19.0 million U.S.). At December 31, 2004, $9.9 million of our long-term debt was denominated in Canadian dollars ($11.9 million Canadian based on a Canadian dollar to U.S. dollar exchange rate of 1.20 to 1). All of these financial instruments are placed with what we believe to be large, creditworthy financial institutions.
We estimate the fair value of these instruments based on current termination values. The table shown below summarizes the fair value of our foreign currency hedges by year of maturity (in millions):
| | Year of Maturity | | Year of Maturity | ||||||||||||||||||||||||||||||
|---|---|---|---|---|---|---|---|---|---|---|---|---|---|---|---|---|---|---|---|---|---|---|---|---|---|---|---|---|---|---|---|---|---|
| | 2004 | 2005 | 2006 | 2007 | Total | | 2005 | 2006 | 2007 | 2008 | Total | ||||||||||||||||||||||
| Forward exchange contracts | $ | 0.1 | $ | — | $ | — | $ | — | $ | 0.1 | Forward exchange contracts | $ | (0.9 | ) | $ | (0.6 | ) | $ | — | $ | — | $ | (1.5 | ) | |||||||||
| Cross currency swaps | (0.2 | ) | (0.6 | ) | (2.8 | ) | — | (3.6 | ) | Cross currency swaps | (0.9 | ) | (5.4 | ) | — | — | (6.3 | ) | |||||||||||||||
Total | $ | (0.1 | ) | $ | (0.6 | ) | $ | (2.8 | ) | $ | — | $ | (3.5 | ) | |||||||||||||||||||
| Total | $ | (1.8 | ) | $ | (6.0 | ) | $ | — | $ | — | $ | (7.8 | ) | ||||||||||||||||||||
We are a publicly traded Delaware limited partnership, formed in 1998 and engaged in interstate and intrastate crude oil transportation, and crude oil gathering, marketing, terminalling and storage, as well as the marketing and storage of liquefied petroleum gas and othernatural gas related petroleum products. We refer to liquefied petroleum gas and othernatural gas related petroleum products collectively as "LPG." We have an extensive network of pipeline transportation, storage and gathering assets in key oil producing basins and at major market hubs in the United States and Canada. Our operations can be categorized into two primary business activities:
Our principal business strategy is to capitalize on the regional crude oil supply and demand imbalances that exist in the United States and Canada by combining the strategic location and distinctive capabilities of our transportation and terminalling assets with our extensive marketing and distribution expertise to generate sustainable earnings and cash flow.
We intend to execute our business strategy by:
To a lesser degree, we also engage in a similar business strategy with respect to the wholesale marketing and storage of LPG, which we began as a result of an acquisition in mid-2001. Since that time, the portion of our Gathering, Marketing, Terminalling and Storage Operations segment profit associated with those activities has increased from $4.2 million in 2001 to $10.0 million in 2002 and $11.6 million in 2003. The segment profit for 2001 reflects results from July 1 through December 31.LPG.
Targeted Credit Profile
We believe that a major factor in our continued success will beis our ability to maintain a competitive cost of capital and access to the capital markets. Since our initial public offering in 1998, weWe have consistently communicated to the financial community our intention to maintain a strong credit profile that we believe is consistent with an investment grade credit rating. We have targeted a general credit profile with the following attributes:
Based on our second quarter 2004 results, and pro forma for our third quarter 2004 equity and debt offerings, we were withinslightly above our targeted credit profile.metric for long-term debt-to-EBITDA primarily due to acquisitions made at various times throughout the year, and the inclusion of less than a full year's results in EBITDA. In order for us to maintain our targeted credit profile and achieve growth through acquisitions, we intend to fund acquisitions using approximately equal proportions of equity and debt. In certain cases, acquisitions will initially be financed using debt since it is difficult to predict the actual timing of accessing the market to raise equity. Accordingly, from time to time we may be temporarily outside the parameters of our targeted credit profile.
Credit Rating Agencies Update
In July 2004, Standard & Poor's removed us from creditwatch with negative implications and affirmed their BBB- stable senior unsecured rating (an investment grade rating). In August 2004, Moody's Investors Service upgradedAs of February 2005, our senior unsecured rating from Ba1 towith Standard & Poors and Moody's Investment Services was BBB- stable and Baa3 (anstable, respectively, both of which are investment grade rating).grade. We cannot assure you that these ratings will remain in effect for any given period of time or that one or both of these ratings will not be lowered or withdrawn entirely by a rating agency. You should noteNote that a credit rating is not a recommendation to buy, sell or hold securities, and may be revised or withdrawn at any time.
We believe that the following competitive strengths position us to successfully execute our principal business strategy:
Board of DirectorsUnitholder Meeting
On July 23, 2004, in connection with the acquisition of Plains Resources Inc. by Vulcan Energy Corporation, Plains All American GP LLC (the general partnerJanuary 20, 2005, we held a special meeting of our general partner Plains AAP, L.P.), amended its limited liability company agreementunitholders. At the meeting, our unitholders approved the following matters:
On July 26, 2004, Plains Holdings Inc. (a wholly owned subsidiary of Plains Resources Inc.) designated Mr. David N. Capobianco aseach Class B common unit is convertible into one of our directors. Mr. Capobiancocommon units and (b) the issuance of additional common units upon such conversion;
Distribution IncreaseAcquisition Activities
Effective on January 1, 2005, we acquired south Louisiana crude oil pipeline assets from Shell Pipeline Company LLG for approximately $12 million. The primary assets acquired include the Terrebonne Bay gathering system, the Bay St. Elaine pipeline, the Cocodrie to Houma pipeline, the Gocodrie station, the Golden Meadow gathering system, the Turtle Bayou gathering system and the Patterson station.
On August 13, 2004, we paid a cash distribution of $0.5775 per unit on all outstanding limited partner units. This distribution equals an annual distribution of $2.31 per unit and represents an increase of 5.0% over the second quarter of 2003 distribution. Management intends to recommend to the board of directors an increase in our quarterly distribution to $0.60 per unit, or $2.40 per unit on an annualized basis. If approved by the board, the distribution increase would be effective with the distribution to be paid in mid-November 2004. An annualized distribution rate of $2.40 per unit would represent an increase of approximately 4% over its current annualized distribution of $2.31 per unit and a 9% increase over the November 2003 distribution. You should be aware that management's recommendation is subject to the approval of its board of directors, which holds the sole authority to declare quarterly distributions to unitholders.
Schaefferstown Propane Storage Facility
In August 2004,January 31, 2005, we acquired the SchaefferstownJoarcam Pipeline System from Joarcam Pipeline, LLG and SES Equities, Ltd. The Joarcam Pipeline System is comprised of approximately 36 miles of 6-inch gathering and mainline crude oil pipelines. The system, which has a current operating capacity of approximately 7,500 barrels per day, originates at Gamrose, Alberta and delivers crude oil into the Enbridge Pipeline at Edmonton.
In March 2005, we acquired the Tulsa Propane Storage FacilityDistribution Terminal from Koch Hydrocarbon, LP and the Tulsa Pipeline System from Koch Pipeline Company, L.P. The total purchase price wasacquired assets include a 130-mile pipeline capable of transporting approximately $32 million. In connection with the transaction, we also acquired an additional $14.2 million of inventory. The facility is located approximately 65 miles northwest of Philadelphia near Schaefferstown, Pennsylvania, and has the capacity400,000 to store approximately 20.0 million500,000 gallons of refrigerated propane. In addition, the facility has nineteen bulletpropane per day, total storage tanks with an aggregate capacity of 570,000 gallons. Propane is deliveredapproximately 810,000 gallons and two truck loading bays. The pipeline connects the terminal to the facility via truck or pipeline and is transported out of the facility by truck. The transaction also included approximately 61 acres of land and a truck rack. The preliminary purchase price was allocated to property and equipment.
Common Unit Offering
During the third quarter of 2004, we completed a public offering of 4,968,000 common units. The net proceeds from the offering, including our general partner's proportionate capital contribution and expenses associated with the offering, were approximately $161.1 million. We used the net proceeds to pay down outstanding indebtedness and reduce the commitment level under our $200 million, 364-day credit facility.
LTIP Vesting
From January 1, 2004 through September 30, 2004, we have issued approximately 363,000 common unitsKoch Hydrocarbon, LP's fractionator in satisfaction of the vesting of phantom units under our Long-Term Incentive Plan.Medford, Oklahoma.
Debt Issuance
During August 2004, we completed the sale of $175 million of 4.750% senior notes due August 2009 and $175 million of 5.875% senior notes due August 2016 in a private placement pursuant to Rule 144A of the Securities Act of 1933. The net proceeds from the offering, after deducting the initial purchasers' discounts and our estimated offering expenses, were approximately $345.3 million. We used the net proceeds to repay the remaining balance of approximately $40.8 million outstanding under our $200 million, 364-day credit facility. Following this payment, this facility was terminated and we used the remaining net proceeds to repay amounts outstanding under our revolving credit facilities and for general partnership purposes. As a result of this transaction, we recognized a noncash charge of approximately $0.7 million associated with the write-off of unamortized debt issue costs.
Other Acquisition Activities
Since 1998, including our recent Schaefferstown acquisition, we have completed numerous acquisitions for an aggregate purchase price of approximately $1.9 billion. Consistent with our business strategy, we are continuously engaged in discussions with potential sellers regarding the possible purchase by us of assets and operations that are strategic and complimentarycomplementary to our existing operations. Such assets and operations include crude oil related assets and LPG assets, as well as energy assets that are closely related to, or intertwined with, these business lines, and enable us to leverage our asset base, knowledge base and skill sets. Such acquisition efforts involve participation by us in processes that have been made public, involve a number of potential buyers and are commonly referred to as "auction" processes, as well as situations in which we believe we are the only party or one of a very limited number of potential buyers in negotiations with the potential seller. These acquisition efforts often involve assets which, if acquired, would have a material effect on our financial condition and results of operations.
Distribution Increase
On January 25, 2005, we announced a cash distribution of $0.6125 per unit on all outstanding limited partner units. This fourth quarter distribution was paid on February 14, 2005, to unitholders of record at the close of business on February 4, 2005. This distribution equals an annual distribution of
$2.45 per unit and represents an increase of approximately 8.9% over the February 2004 distribution and approximately 2.1% over the November 2004 distribution.
Cushing Terminal Expansion
We have started the Phase V expansion of our Cushing Terminal Facility. Under the Phase V expansion, we will construct approximately 1.1 million barrels of additional tankage at our crude oil storage and terminal facility located in Cushing, Oklahoma. The Phase V project will expand the total capacity of the facility to approximately 7.4 million barrels and, including site preparation and additional manifold modifications, is expected to cost approximately $13 million. We estimate that the new tankage will become operational during the fourth quarter of 2005. Upon completion of the Phase V expansion project, our Cushing Terminal Facility will consist of twenty 270,000 barrel tanks, four 150,000 barrel tanks, fourteen 100,000 barrel tanks and a manifold and pumping system capable of handling up to 800,000 barrels of crude oil throughput per day.
February 2005 Private Placement of Common Units
In February, 2005, we issued 575,000 common units to a subsidiary of Vulcan Energy Corporation. The sale price for the common units was $38.13 per unit resulting in net proceeds, including the general partner's proportionate capital contribution and expenses associated with the sale, of approximately $22.3 million. We intend to use the net proceeds from the private placement to fund a portion of our 2005 expansion capital program. Pending the incurrence of such expenditures, the net proceeds will be used to repay indebtedness under our revolving credit facilities.
We were formed as a master limited partnership in September 1998 to acquire and operate the midstream crude oil businessbusinesses and assets of Plains Resources Inc. and its wholly-owned subsidiaries as a separate, publicly traded master limited partnership.assets. We completed our initial public offering in November 1998. Unless the context otherwise requires, we refer to Plains Resources Inc. and its wholly owned subsidiaries as Plains Resources. As a result of subsequent equity offerings and the purchase inSince June 2001, by senior management and a group of financial investors of majority control of our general partner and a portion of the limited partner units held by Plains Resources, Plains Resources' overall effective ownership in us was reduced to approximately 18.9% as of September 30, 2004. See "Security Ownership of Certain Beneficial Owners and Management and Related Unitholders' Matters."
As a result of the 2001 transaction, our 2% general partner interest ishas been held by Plains AAP, L.P., a Delaware limited partnership. Plains All American GP LLC, a Delaware limited liability company, is Plains AAP, L.P.'s general partner. Unless the context otherwise requires, we use the term "general partner" to refer to both Plains AAP, L.P. and Plains All American GP LLC. Plains AAP, L.P. and Plains All American GP LLC are essentially held by seven owners with the largest interest, 44%, held by Plains Resources. We use the phrase "former general partner" to refer to the subsidiaryowners. See "Security Ownership of Plains Resources that formerly held the general partner interest.Certain Beneficial Owners and Management and Related Unitholders' Matters—Beneficial Ownership of General Partner Interest."
Partnership Structure and Management
Our operations are conducted through, and our operating assets are owned by, our subsidiaries. We own our interests in our subsidiaries through two operating partnerships, Plains Marketing, L.P. and Plains Pipeline, L.P. Our Canadian and LPG operations are conducted through Plains Marketing Canada, L.P.
Our general partner, Plains AAP, L.P., is a limited partnership. Our general partner is managed by its general partner, Plains All American GP LLC, which has ultimate responsibility for conducting our business and managing our operations. References to our general partner, unlessPlains All American GP LLC is governed by an eight-member board of directors. As amended in July 2004, the context otherwise requires, includelimited liability company agreement provides that four directors are designated by the four owners that hold 9% or greater of the outstanding membership interests of Plains All American GP LLC, one director is the Chairman and CEO and three independent directors are elected by majority vote of the membership owners of Plains All American GP LLC. Our general partner does not receive anya management fee or other compensation in connection with its management of our business, but it is reimbursed for all direct and indirect expenses incurred on our behalf.
The chart on the next page depicts the current structure and ownership of Plains All American Pipeline, L.P. and certain subsidiaries.
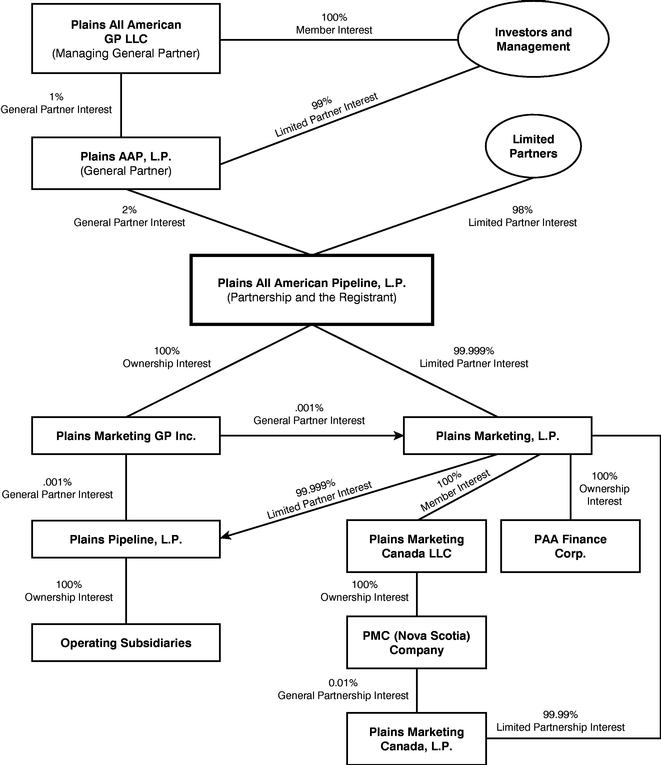
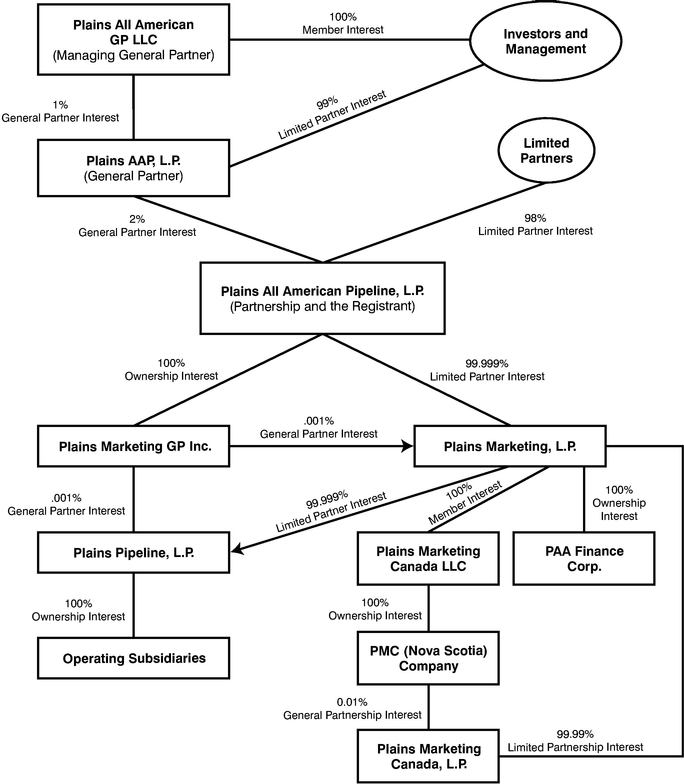
An integral component of our business strategy and growth objective is to acquire assets and operations that are strategic and complementary to our existing operations. Such assets and operations include crude oil related assets and LPG assets, as well as energy assets that are closely related to, or intertwined with, these business lines, and enable us to leverage our asset base, knowledge base and skill sets. We have established a target to complete, on average, $200 million to $300 million in acquisitions per year, subject to availability of attractive assets on acceptable terms. Since 1998, and through December 31, 2004, we have completed numerous acquisitions for an aggregate purchase price of approximately $1.9 billion. In addition, from time to time, we have sold assets that are no longer considered essential to our operations.
FollowingThe following table summarizes selected acquisitions that we have completed over the past five years:
| Acquisition | Date | Description | Approximate Purchase Price (in millions) | ||||
|---|---|---|---|---|---|---|---|
| Schaefferstown Propane Storage Facility | August 2004 | Storage capacity of approximately 0.5 million barrels of refrigerated propane | $ | 32 | |||
Cal Ven Pipeline System | May 2004 | 195-miles of gathering and mainline crude oil pipelines in northern Alberta | $ | 19 | |||
Link Energy LLC | April 2004 | The North American crude oil and pipeline operations of Link Energy, LLC ("Link") | $ | 332 | |||
Capline and Capwood Pipeline Systems | March 2004 | An approximate 22% undivided joint interest in the Capline Pipeline System and an approximate 76% undivided joint interest in the Capwood Pipeline System | $ | 158 | |||
South Saskatchewan Pipeline System | November 2003 | A 158-mile mainline crude oil pipeline and 203 miles of gathering lines in Saskatchewan | $ | 48 | |||
ArkLaTex Pipeline System | October 2003 | 240 miles of crude oil gathering and mainline pipelines and 470,000 barrels of crude oil storage capacity | $ | 21 | |||
Iraan to Midland Pipeline System | June 2003 | 98-mile mainline crude oil pipeline | $ | 18 | |||
South Louisiana Assets | June 2003 and December 2003 | Various terminalling and gathering assets in South Louisiana, including a 100% interest in Atchafalaya Pipeline, L.L.C. | $ | 18 | |||
Iatan Gathering System | March 2003 | West Texas crude oil gathering system | $ | 24 | |||
Red River Pipeline System | February 2003 | 334-mile crude oil pipeline along with 645,000 barrels of crude oil storage capacity | $ | 19 | |||
Shell West Texas Assets | August 2002 | Basin Pipeline System, Permian Basin Pipeline System and the Rancho Pipeline System | $ | 324 | |||
Canadian Operations | May/July 2001 | The assets of CANPET Energy Group (crude oil and LPG marketing) and substantially all of the Canadian crude oil pipeline, gathering, storage and terminalling assets of Murphy Oil Company Ltd. (560 miles of crude oil and condensate mainlines along with 1.1 million barrels of crude oil storage and terminalling capacity) | $ | 232 | |||
The following is a brief descriptionmore in-depth discussion of selected acquisitions completed during the first half of 2004 and in 2003 and major acquisitions and dispositions that have occurred since our initial public offering in November 1998.2004:
Link Energy LLCSchaefferstown Propane Storage Facility
On April 1,In August 2004, we completed the acquisition of all of the North American crude oil and pipeline operations of Link forSchaefferstown Propane Storage Facility from Koch Hydrocarbon, L.P. The total purchase price was approximately $326$32 million, including $268transaction costs. In connection with the transaction, the Partnership also acquired an additional $14.2 million of inventory. The transaction was funded through a combination of cash (neton hand and borrowings under the Partnership's revolving credit facilities. The storage facility is located approximately 65 miles northwest of Philadelphia near Schaefferstown, Pennsylvania, and has the capacity to store approximately $5.5 million subsequently returned to PAA from an indemnity escrow account) and approximately $58 million of net liabilities assumed and acquisition related costs. The Link crude oil business consists of approximately 7,000 miles of active crude oil pipeline and gathering systems, over 100.5 million barrels of crude oilrefrigerated propane. In addition, the facility has 19 bullet storage tanks with an aggregate capacity a fleet of approximately 200 owned14,000 barrels. Propane is delivered to the facility via truck or leased truckspipeline and is transported out of the facility by truck. In addition, the transaction also included approximately 2 million barrels61 acres of crude oil linefillland and working inventory. The Link assets complement our assets in West Texas and along the Gulf Coast and allow us to expand our presence in the Rocky Mountain and Oklahoma/Kansas regions.a truck rack. The results of operations and assets from this acquisition (the "Link acquisition") have been included in our consolidated financial statements and both our pipeline operations and gathering, marketing, terminalling and storage operations segmentssegment since April 1,August 25, 2004.
On April 2, 2004, the Office of the Attorney General of Texas (the "Texas AG") delivered written notice to us that it was investigating the possibility that the acquisition of Link's assets might reduce competition in one or more markets within the petroleum products industry in the State of Texas. In connection with the Link purchase, both PAA and Link completed all necessary filings required under the Hart-Scott-Rodino Act, and the required 30-day waiting period expired on March 24, 2004 without any inquiry or request for additional information from the U.S. Department of Justice or the Federal Trade Commission. Representatives from the Antitrust and Civil Medicaid Fraud Division of the Office of the Texas AG indicated their investigation was prompted by complaints received from allegedly interested industry parties regarding the potential impact on competition in the Permian Basin area of West Texas. We understand that similar complaints have been received by the Federal Trade Commission, and that, consistent with federal-state protocols for conducting joint merger investigations, appropriate federal and state antitrust authorities are coordinating their activities. In connection with the April notice and again in June 2004, the Texas AG requested information from us. We have complied with these requests and are cooperating fully with the antitrust enforcement authorities.
Cal Ven Pipeline System
On May 7, 2004, we completed the acquisition of the Cal Ven Pipeline System from Cal Ven Limited, a subsidiary of Unocal Canada Limited. The total purchase price was approximately $19 million, including transaction costs. The transaction was funded through a combination of cash on hand and borrowings under our revolving credit facilities. The Cal Ven Pipeline System includes approximately 195 miles of 8-inch and 10-inch gathering and mainline crude oil pipelines. The system is located in northern Alberta and delivershas the ability to deliver crude oil into the Rainbow Pipeline System. The Rainbow
Pipeline System then transports the crude south to the Edmonton market, where it can be used in local refineries or shipped on connecting pipelines to the U.S. market. The results of operations and assets from this acquisition have been included in our consolidated financial statements and our pipeline operations segment since May 1, 2004.
Link Energy LLC
On April 1, 2004, we completed the acquisition of all of the North American crude oil and pipeline operations of Link Energy LLC ("Link") for approximately $332 million, including $268 million of cash (net of approximately $5.5 million subsequently returned to us from an indemnity escrow account) and approximately $64 million of net liabilities assumed and acquisition-related costs. The Link crude oil business consists of approximately 7,000 miles of active crude oil pipeline and gathering systems, over 10 million barrels of active crude oil storage capacity, a fleet of approximately 200 owned or leased trucks and approximately 2 million barrels of crude oil linefill and working inventory. The Link assets complement our assets in West Texas and along the Gulf Coast and allowed us to expand our presence in the Rocky Mountain and Oklahoma/Kansas regions. The results of operations and assets from this acquisition have been included in our consolidated financial statements and both our pipeline operations and gathering, marketing, terminalling and storage operations segments since April 1, 2004.
Capline and Capwood Pipeline System
In March 2004, we completed the acquisition of all of Shell Pipeline Company LP's ("SPLC") interests in two entities for approximately $158.0 million in cash (including a $15.8 million deposit paid in December 2003) and approximately $0.5 million of transaction and other costs. The principal assets of the entities are: (i) an approximate 22% undivided joint interest in the Capline Pipe LinePipeline System, and (ii) an approximate 76% undivided joint interest in the Capwood Pipeline System. The Capline Pipeline System is a 633-mile, 40-inch mainline crude oil pipeline originating in St. James, Louisiana, and terminating in Patoka, Illinois. The Capline system is one of the primary transportation routes for crude oil shipped into the Midwestern U.S., accessing over 2.7 million barrels of refining capacity in PADD II, including refineries owned by ConocoPhillips, ExxonMobil, BP, MarathonAshland, CITGO and Premcor.II. Capline has direct connections to a significant amount of sweet and light sour crude
production in the Gulf of Mexico. In addition, with its two active docks capable of handling 600,000-barrel tankers as well as access to LOOP, the Louisiana Offshore Oil Port, the Capline System is a key transporter of sweetboth domestic and light sour foreign crude to PADD II. With aThe total system operating capacity ofis 1.14 million barrels per day, with approximately 248,000 barrels per day are subject to the interest acquired. During 2003,Since we acquired this asset, throughput on the interest we acquired averaged approximately 125,000147,000 barrels per day.
The Capwood Pipeline System is a 57-mile, 20-inch mainline crude oil pipeline originating in Patoka, Illinois, and terminating in Wood River, Illinois. The Capwood system has an operating capacity of 277,000 barrels per day of crude oil. Of that capacity, approximately 211,000 barrels per day are subject to the interest acquired. Since we acquired this asset, throughput on the interest we acquired averaged approximately 120,000 barrels per day. The Capwood System has the ability to deliver crude at Wood River to several other PADD II refineries and pipelines, including those owned by Koch and ConocoPhillips.pipelines. Movements on the Capwood system are driven by the volumes shipped on Capline as well as Canadian crude that can be delivered to Patoka via the Mustang Pipeline. Since closing, we have assumed the operatorship of the Capwood system from SPLC.
South Saskatchewan Pipeline System
In November 2003, we completed the acquisition of the South Saskatchewan Pipeline System from South Saskatchewan Pipe Line Company. The South Saskatchewan Pipeline System originates approximately 75 miles southwest of Swift Current, Saskatchewan, and traverses north and east until it reaches its terminus at Regina, Saskatchewan. The system consists of a 158-mile, 16-inch mainline and 203 miles of gathering lines ranging in diameter from three to twelve inches. In 2002, the system transported approximately 52,000 barrels of crude oil per day. During the period of 2003 that we owned the system, it transported approximately 52,000 barrels of crude oil per day. For the six months ended June 30, 2004, the system transported approximately 47,000 barrels of crude oil per day. At Regina, the system can deliver crude oil to the Enbridge Pipeline System, as well as to local markets, and through the Enbridge connection crude can be delivered into our Wascana Pipeline System. Total purchase price for these assets was approximately $48 million, including transaction costs.
ArkLaTex Pipeline System
In October 2003, we completed the acquisition of the ArkLaTex Pipeline System from Link Energy (formerly EOTT Energy). The ArkLaTex Pipeline System consists of 240 miles of active crude oil gathering and mainline pipelines and connects to our Red River Pipeline System near Sabine, Texas. Also included in the transaction were 470,000 barrels of active crude oil storage capacity, the
assignment of certain of Link Energy's crude oil supply contracts and crude oil linefill and working inventory comprising approximately 108,000 barrels. The total purchase price for these assets of approximately $21.3 million included approximately $14.0 million of cash paid to Link Energy for the pipeline system, approximately $2.9 million of cash paid to Link Energy to purchase crude oil linefill and working inventory, approximately $3.6 million for estimated near-term capital costs and transaction costs and approximately $0.8 million associated with the satisfaction of outstanding claims for accounts receivable and inventory balances.
Iraan to Midland Pipeline System
In June 2003, we acquired the Iraan to Midland Pipeline System from a unit of Marathon Ashland Petroleum LLC ("MAP") for aggregate consideration of approximately $17.6 million. The Iraan to Midland Pipeline System is a 16-inch, 98-mile mainline crude oil pipeline that originates in Iraan, Texas and terminates in Midland, Texas. At Midland, the system has the ability to deliver crude oil to our Basin Pipeline System and to the Mesa Pipeline System. The Iraan to Midland Pipeline System transported approximately 22,000 barrels per day of crude oil in the first six months of 2004. The results of operations and assets of the Iraan to Midland Pipeline System have been included in our consolidated financial statements and our pipeline operations since June 30, 2003. The aggregate purchase price included $13.6 million in cash, approximately $3.6 million associated with the satisfaction of outstanding claims for accounts receivable and inventory balances, and approximately $0.4 million of estimated transaction costs.
South Louisiana Assets
In June 2003, we completed the acquisition of terminalling and gathering assets from El Paso Corporation for approximately $13.4 million, including transaction costs. These assets are located in southern Louisiana and include various interests in five pipelines and gathering systems and two terminal facilities. These assets complement our existing activities in south Louisiana and we believe will help leverage our exposure to the growing volume of crude oil and condensate production from the Gulf of Mexico. The results of operations and assets from this acquisition have been included in our consolidated financial statements and in our pipeline operations segment since June 1, 2003. The assets acquired in this acquisition include a 331/3% interest in Atchafalaya Pipeline, L.L.C. In December 2003, we acquired the remaining 662/3% interests in two separate transactions totaling $4.4 million.
Iatan Gathering System
In March 2003, we completed the acquisition of a West Texas crude oil gathering system from Navajo Refining Company, L.P. for approximately $24.3 million, including transaction costs. The assets are located in the Permian Basin in West Texas and consist of approximately 360 miles of active crude oil gathering lines. The results of operations and assets from this acquisition have been included in our consolidated financial statements and in our pipeline operations segment since March 1, 2003.
Red River Pipeline System
In February 2003, we completed the acquisition of a 334-mile crude oil pipeline from BP Pipelines (North America) Inc. for approximately $19.4 million, including transaction costs. The system originates at Sabine in East Texas and terminates near Cushing, Oklahoma. Subsequent to the acquisition, we connected the pipeline system to our Cushing Terminal. The system also includes approximately 645,000 barrels of crude oil storage capacity. The results of operations and assets from this acquisition have been included in our consolidated financial statements and in our pipeline operations segment since February 1, 2003. This pipeline complements our existing assets in East Texas.
Shell West Texas Assets
On August 1, 2002, we acquired interests in approximately 2,000 miles of gathering and mainline crude oil pipelines and approximately 9.0 million barrels (net to our interest) of above-ground crude oil terminalling and storage assets in West Texas from Shell Pipeline Company LP and Equilon Enterprises LLC (the "Shell acquisition"). The primary assets included in the transaction are interests in the Basin Pipeline System ("Basin System"), the Permian Basin Gathering System ("Permian Basin System") and the Rancho Pipeline System ("Rancho System"). The total purchase price of $324.4 million consisted of (i) $304.0 million in cash, which was borrowed under our revolving credit facility, (ii) approximately $9.1 million related to the settlement of pre-existing accounts receivable and inventory balances and (iii) approximately $11.3 million of estimated transaction and closing costs.
The acquired assets are primarily fee-based mainline crude oil pipeline transportation assets that gather crude oil in the Permian Basin and transport that crude oil to major market locations in the Mid-Continent and Gulf Coast regions. The acquired assets complement our existing asset infrastructure in West Texas and represent a transportation link to Cushing, Oklahoma, where we provide storage and terminalling services. In addition, we believe that the Basin system is poised to benefit from potential shut-downs of refineries and other pipelines due to the shifting market dynamics in the West Texas area. As was contemplated at the time of the acquisition, the Rancho system was taken out of service in March 2003, pursuant to the terms of its operating agreement. See "—Shutdown and Partial Sale of Rancho Pipeline System."
Canadian Expansion
In early 2000, we articulated to the financial community our intent to establish a strong Canadian operation that complements our operations in the United States. In 2001, after evaluating the marketplace and analyzing potential opportunities, we consummated the two transactions detailed below in 2001. The combination of these assets, an established fee-based pipeline transportation business and a rapidly-growing, entrepreneurial gathering and marketing business, allowed us to optimize both businesses and establish what we believe to be a solid foundation for future growth in Canada.
CANPET Energy Group, Inc. In July 2001, we purchased substantially all of the assets of CANPET Energy Group Inc., a Calgary-based Canadian crude oil and LPG marketing company, for approximately $24.6 million plus $25.0 million for additional inventory owned by CANPET. In December 2003 we recorded an additional $24.3 million related to a portion of the purchase price that had previously been deferred subject to various performance standards of the business acquired. See Note 7 "Partners' Capital and Distributions" in the "Notes to the Consolidated Financial Statements." The principal assets acquired included a crude oil handling facility, a 130,000-barrel tank facility, LPG facilities, existing business relationships and operating inventory.
Murphy Oil Company Ltd. Midstream Operations. In May 2001, we completed the acquisition of substantially all of the Canadian crude oil pipeline, gathering, storage and terminalling assets of Murphy Oil Company Ltd. for approximately $161.0 million in cash, including financing and transaction costs. The purchase price included $6.5 million for excess inventory in the systems. The principal assets acquired include (i) approximately 560 miles of crude oil and condensate mainlines (including dual lines on which condensate is shipped for blending purposes and blended crude is shipped in the opposite direction) and associated gathering and lateral lines, (ii) approximately 1.1 million barrels of crude oil storage and terminalling capacity located primarily in Kerrobert, Saskatchewan, (iii) approximately 254,000 barrels of pipeline linefill and tank inventories, and (iv) 121 trailers used primarily for crude oil transportation.
West Texas Gathering System
In July 1999, we completed the acquisition of the West Texas Gathering System from Chevron Pipe Line Company for approximately $36.0 million, including transaction costs. The assets acquired include approximately 420 miles of crude oil mainlines, approximately 295 miles of associated gathering and lateral lines, and approximately 2.7 million barrels of tankage located along the system.
Scurlock Permian
In May 1999, we completed the acquisition of Scurlock Permian LLC ("Scurlock") and certain other pipeline assets from Marathon Ashland Petroleum LLC. Including working capital adjustments and closing and financing costs, the cash purchase price was approximately $141.7 million. Financing for the acquisition was provided through $117.0 million of borrowings under our revolving credit facility and the sale of 1.3 million Class B common units to our former general partner for total cash consideration of $25.0 million.
Scurlock, previously a wholly owned subsidiary of Marathon Ashland Petroleum, was engaged in crude oil transportation, gathering and marketing. The assets acquired included approximately 2,300 miles of active pipelines, numerous storage terminals and a fleet of trucks. The largest asset consists of an approximately 954-mile pipeline and gathering system located in the Spraberry Trend in West Texas that extends into Andrews, Glasscock, Martin, Midland, Regan and Upton Counties, Texas. The assets we acquired also included approximately one million barrels of crude oil linefill.
Ongoing Acquisition Activities
Consistent with our business strategy, we are continuously engaged in discussions with potential sellers regarding the possible purchase by us of assets and operations that are strategic and complimentarycomplementary to our existing operations. Such assets and operations include crude oil related assets and LPG assets, as well as energy assets that are closely related to, or intertwined with, these business lines, and enable us to leverage our asset base, knowledge base and skill sets. Such acquisition efforts involve participation by us in processes that have been made public, involve a number of potential buyers and are commonly referred to as "auction" processes, as well as situations wherein which we believe we are the only party or one of a very limited number of potential buyers in negotiations with the potential seller. These acquisition efforts often involve assets which, if acquired, would have a material effect on our financial condition and results of operations.
In connection with our acquisition activities, we routinely incur third party costs, which are capitalized and deferred pending final outcome of the transaction. Deferred costs associated with successful transactions are capitalized as part of the transaction, while deferred costs associated with unsuccessful transactions are expensed at the time of such final determination. We had a total of approximately $0.2 million in deferred costs at June 30, 2004. We can give no assurance that our current or future acquisition efforts will be successful or that any such acquisition will be completed on terms considered favorable to us.
Dispositions
Shutdown and Sale of Rancho Pipeline System
We acquired an interest in the Rancho Pipeline System from Shell in conjunction with the Shell acquisition.August 2002. The Rancho Pipeline System Agreement dated November 1, 1951, pursuant to which the system was constructed and operated, terminated in March 2003. Upon termination, the agreement required the owners to take the pipeline system, in which we owned an approximate 50% interest, out of service. Accordingly, we notified our shippers and did not accept nominations for movements after February 28, 2003. This shutdown was contemplated at the time of the acquisition and was accounted for under purchase accounting in accordance with SFAS No. 141 "Business Combinations." The pipeline was shut down on March 1, 2003 and a purge of the crude oil linefill was completed in April 2003. In June 2003,
we completed transactions whereby we transferred all of our ownership interest in approximately 241 miles of the total 458 miles of the pipeline in exchange for $4.0 million and approximately 500,000 barrels of crude oil tankage in West Texas. In August 2004, we sold all of our remaining ownership interest in the remaining portion of the system to Kinder Morgan Texas Pipeline, L.P. for approximately $870,000.$0.9 million, including the assumption by the purchaser of all liabilities typically associated with pipelines of this type. We recognized a gain of approximately $0.6 million on this transaction.
All American Pipeline Linefill Sale and Asset Disposition
In March 2000, we sold the segment of the All American Pipeline that extends from Emidio, California to McCamey, Texas to a unit of El Paso Corporation for $129.0 million. Except for minor third partythird-party volumes, one of our
subsidiaries, Plains Marketing, L.P., was the sole shipper on this segment of the pipeline since its predecessor acquired the line from the Goodyear Tire & Rubber Company in July 1998. We realized net proceeds of approximately $124.0 million after the associated transaction costs and estimated costs to remove equipment. We used the proceeds from the sale to reduce outstanding debt. We recognized a gain of approximately $20.1 million in connection with the sale.
We had suspended shipments of crude oil on this segment of the pipeline in November 1999. At that time, we owned approximately 5.2 million barrels of crude oil in the segment of the pipeline. We sold this crude oil from November 1999 to February 2000 for net proceeds of approximately $100.0 million, which were used for working capital purposes. We recognized an aggregate gain of approximately $44.6 million, of which approximately $28.1 million was recognized in 2000 in connection with the sale of the linefill.2000.
Description of Segments and Associated Assets
Our business activities are conducted through two primary segments, Pipeline Operations and Gathering, Marketing, Terminalling and Storage Operations.Operations ("GMT&S"). Our operations are conducted in approximately 40 states in the United States and six provinces in Canada. The majority of our operations are conducted in Texas, Oklahoma, California, Kansas and Louisiana and in the Canadian provinces of Alberta and Saskatchewan.
Following is a description of the activities and assets for each of our business segments:
Pipeline Operations
As of June 30,December 31, 2004, we owned approximately 15,000 miles of active gathering and mainline crude oil pipelines located throughout the United States and Canada. Approximately 13,000 miles of these pipelines are used in our pipeline operations segment with the remainder used in our GMT&S segment. Our activities from pipeline operations generally consist of transporting crude oil for a fee and third partythird-party leases of pipeline capacity, as well as barrel exchanges and buy/sell arrangements.
Substantially all of our pipeline systems are controlled or monitored from one of two central control rooms with computer systems designed to continuously monitor real-time operational data, including measurement of crude oil quantities injected into and delivered through the pipelines, product flow rates, and pressure and temperature variations. The systems are designed to enhance leak detection capabilities, sound automatic alarms in the event of operational conditions outside of pre-established parameters and provide for remote-controlledremote controlled shut-down of pump stations on the pipeline systems. Pump stations, storage facilities and meter measurement points along the pipeline systems are linked by telephone, satellite, radio or a combination thereof to provide communications for remote monitoring and in some instances control, which reduces our requirement for full-time site personnel at most of these locations.
We perform scheduled maintenance on all of our pipeline systems and make repairs and replacements when necessary or appropriate. We attempt to control corrosion of the mainlines through the use of cathodic protection, corrosion inhibiting chemicals injected into the crude stream and other
protection systems typically used in the industry. Maintenance facilities containing equipment for pipe repairs, spare parts and trained response personnel are strategically located along the pipelines and in concentrated operating areas. We believe that all of our pipelines have been constructed and are maintained in all material respects in accordance with applicable federal, state, provincial and local laws and regulations, standards prescribed by the American Petroleum Institute, the Canadian Standards Association and accepted industry practice. See "—Regulation—Pipeline and Storage Regulation."
Following is a description of our major pipeline assets in the United States and Canada, grouped by geographic location:
Major Pipeline Assets
Southwest U.S.All American Pipeline System
The All American Pipeline is a common carrier crude oil pipeline system that transports crude oil produced from certain outer continental shelf, or OCS, fields offshore California via connecting
pipelines to refinery markets in California. The system extends approximately 10 miles along the California coast from Las Flores to Gaviota (24-inch diameter pipe) and continues from Gaviota approximately 126 miles to our station in Emidio, California (30-inch diameter pipe). Between Gaviota and our Emidio Station, the All American Pipeline interconnects with our San Joaquin Valley, or SJV, Gathering System as well as various third-party intrastate pipelines. The system is subject to tariff rates regulated by the FERC.
The All American Pipeline currently transports OCS crude oil received at the onshore facilities of the Santa Ynez field at Las Flores and the onshore facilities of the Point Arguello field located at Gaviota. ExxonMobil, which owns all of the Santa Ynez production, and Plains Exploration and Production Company ("PXP") and other producers that together own approximately 75% of the Point Arguello production, have entered into transportation agreements committing to transport all of their production from these fields on the All American Pipeline. These agreements, which expire in August 2007, provide for a minimum tariff with annual escalations based on specific composite indices. The producers from the Point Arguello field that do not have contracts with us have no other means of transporting their production and, therefore, ship their volumes on the All American Pipeline at the filed tariffs. Volumes attributable to PXP are purchased and sold to a third party under our marketing agreement with PXP before such volumes enter the All American Pipeline. See "Certain Relationships and Related Transactions—Transactions with Related Parties—General." The third party pays the same tariff as required in the transportation agreements. For 2003 and 2004, the tariffs averaged $1.71 per barrel and $1.81 per barrel, respectively. Effective January 1, 2005, based on the contractual escalator, the average tariff increased to $1.88 per barrel. The agreements do not require these owners to transport a minimum volume.
A significant portion of our revenues less direct field operating costs is derived from the pipeline transportation business associated with these two fields. The relative contribution to our revenues less direct field operating costs from these fields has decreased from approximately 24% in 2000 to 11% in 2004, as we have grown and diversified through acquisitions and organic expansions and as a result of declines in volumes produced and transported from these fields. Since our acquisition in 1998, the volume decline has been substantially offset by an increase in pipeline tariffs. Over the last several years, transportation volumes received from the Santa Ynez and Point Arguello fields have declined from 92,000 and 60,000 average daily barrels, respectively, in 1995 to 44,000 and 10,000 average daily barrels, respectively, for 2004. We expect that there will continue to be natural production declines from each of these fields as the underlying reservoirs are depleted. A 5,000 barrel per day decline in volumes shipped from these fields would result in a decrease in annual pipeline segment profit of approximately $3.2 million, based on a tariff of $1.88 per barrel.
In October 2004, PXP announced that it had successfully completed an initial development well into the Rocky Point field that is accessible from the Point Arguello platforms and that drilling operations are underway on a second development well. If successful, such incremental drilling activity could lead to increased volumes on our All American Pipeline System in future periods. However, we can give no assurance that our volumes transported would increase as a result of this drilling activity.
The table below sets forth the historical volumes received from both of these fields for the past five years:
| | Year Ended December 31 | ||||||||||
|---|---|---|---|---|---|---|---|---|---|---|---|
| | 2004 | 2003 | 2002 | 2001 | 2000 | ||||||
| | (barrels in thousands) | ||||||||||
| Average daily volumes received from: | |||||||||||
| Point Arguello (at Gaviota) | 10 | 13 | 16 | 18 | 18 | ||||||
| Santa Ynez (at Las Flores) | 44 | 46 | 50 | 51 | 56 | ||||||
| Total | 54 | 59 | 66 | 69 | 74 | ||||||
Basin Pipeline System.System We acquired
The Basin Pipeline System, in which we own an approximate 87% undivided joint interest, inis a primary route for transporting Permian Basin crude oil to Cushing, Oklahoma, for further delivery to Mid-Continent and Midwest refining centers. We acquired the Basin Pipeline System in August 2002. Since acquisition, we have been the Shell acquisition.operator of the system. The Basin Systemsystem is a 515-mile mainline, telescoping crude oil system with a capacity ranging from approximately 144,000 barrels per day to 394,000 barrels per day depending on the segment. System throughput (as measured by system deliveries) was approximately 273,000265,000 barrels per day (net to our interest) during 2004. Within the first six monthscurrent operating range, a 20,000 barrel per day decline in volumes shipped on the Basin system would result in a decrease in annual pipeline segment profit of 2004.approximately $1.8 million.
The Basin Systemsystem consists of three primary movements of crude oil: (i) barrels are shipped from Jal, New Mexico to the West Texas markets of Wink and Midland, where they are exchanged and/or further shipped to refining centers; (ii) barrels are shipped to the Mid-Continent region on the Midland to Wichita Falls segment and the Wichita Falls to Cushing segment; and (iii) foreign and Gulf of Mexico barrels are delivered into Basin at Wichita Falls and delivered to a connecting carrier or shipped to Cushing for further distribution to Mid-Continent or Midwest refineries. The size of the pipe ranges from 20 to 24 inches in diameter. The Basin system also includes approximately 5.8 million barrels (5.0 million barrels, net to our interest) of crude oil storage capacity located along the system. TEPPCO Partners, L.P. owns the remaining approximately 13% interest in the system.
In 2004, we expanded a 424-mile section of the system extending from Midland, Texas to Cushing, Oklahoma. With the completion of this $1.8 million expansion, the capacity of this section has increased approximately 15%, from 350,000 barrels per day to approximately 400,000 barrels per day. The Basin system is subject to tariff rates regulated by the Federal Energy Regulatory Commission (the "FERC"). See "—Regulation—Transportation Regulation."
West Texas Gathering System. The West Texas Gathering System is a common carrier crude oil pipeline system locatedTEPPCO Partners, L.P. owns the remaining approximately 13% interest in the heart of the Permian Basin producing area, and includes approximately 420 miles of crude oil mainlines and approximately 295 miles of associated gathering and lateral lines. The West Texas Gathering System has the capability to transport approximately 190,000 barrels per day. Total system volumes were approximately 80,000 barrels per day in the first six months of 2004. Chevron USA has agreed to transport its equity crude oil production from fields connected to the West Texas Gathering System on the system through July 2011 (representing approximately 18,000 barrels per day, or 21% of the total system volumes during 2003). The system also includes approximately 2.7 million barrels of crude oil storage capacity, located primarily in Monahans, Midland, Wink and Crane, Texas.
Permian Basin Gathering System. The Permian Basin System, acquired in the Shell acquisition, includes several gathering systems and trunk lines with connecting injection stations and storage facilities. In total, the system consists of 919 miles of pipe and primarily transports crude oil from wells in the Permian Basin to the Basin System. The Permian Basin System gathered approximately 48,000 barrels per day in the first six months of 2004. The Permian Basin System includes approximately 3.9 million barrels of crude oil storage capacity.
Spraberry Pipeline System. The Spraberry Pipeline System, acquired in the Scurlock acquisition, gathers crude oil from the Spraberry Trend of West Texas and transports it to Midland, Texas, where it interconnects with the West Texas Gathering System and other pipelines. The Spraberry Pipeline
System consists of approximately 954 miles of pipe of varying diameter, and has a throughput capacity of approximately 50,000 barrels of crude oil per day. The Spraberry Trend is one of the largest producing areas in West Texas, and we are one of the largest gatherers in the Spraberry Trend. For the first six months of 2004, the Spraberry Pipeline System gathered approximately 38,000 barrels per day of crude oil. The Spraberry Pipeline System also includes approximately 659,000 barrels of tank capacity located along the pipeline, including the recent expansion.
Dollarhide Pipeline System. The Dollarhide Pipeline System, acquired from Unocal Pipeline Company in October 2001, is a common carrier pipeline system that is located in West Texas. in the first six months of 2004, the Dollarhide Pipeline System delivered approximately 6,000 barrels of crude oil per day into the West Texas Gathering System. The system also includes approximately 55,000 barrels of crude oil storage capacity along the system.
Mesa Pipeline System. The Mesa Pipeline System, in which we acquired an 8.8% undivided interest from Unocal Corporation in May 2003, is located in the Permian Basin in West Texas, originating at Midland and terminating at Colorado City, and serves to complement our Basin Pipeline System. We have access to a net capacity of approximately 28,000 barrels of crude oil per day on the system. This system is operated by an affiliate of ChevronTexaco.
Iraan to Midland Pipeline System. The Iraan to Midland Pipeline System, acquired from a unit of Marathon Ashland Petroleum LLC in June 2003, is a 16-inch, 98-mile mainline crude oil pipeline that originates in Iraan, Texas and terminates in Midland, Texas. At Midland, the system has the ability to deliver crude oil to our Basin Pipeline System and to the Mesa Pipeline System. In the first six months of 2004, deliveries averaged approximately 22,000 barrels per day.
Iatan Gathering System. The Iatan gathering system, acquired from Navajo Refining Company, L.P. in March 2003, is located in the Permian Basin in West Texas and consists of approximately 360 miles of active crude oil gathering lines. During the first six months of 2004, volumes on this system averaged 22,000 barrels per day.
New Mexico Pipeline System. The New Mexico Pipeline System, included in the April 2004 Link transaction, is an extensive crude oil mainline and gathering system primarily located in Lea and Eddy Counties, New Mexico. The system consists of approximately 1,200 miles of active pipe and approximately 1.3 million barrels of associated storage. The system delivers primarily to the Basin Pipeline System, an Amoco Pipeline System, and the Kaston Pipeline system. For the second quarter of 2004, volumes averaged approximately 67,000 barrels per day.
Texas Pipeline System. The Texas Pipeline System, included in the April 2004 Link transaction, is an extensive crude oil mainline and gathering system delivering crude oil produced in the Permian Basin primarily to Midland, McCamey, and Colorado City, Texas. Also, included in the system is a 10" mainline from McCamey, Texas to Healdton, Oklahoma and approximately 2.0 million barrels of storage. For the second quarter of 2004, volumes averaged approximately 103,000 barrels per day.
Western U.S.Capline/Capwood Pipeline Systems
All American Pipeline System. The segment of the All American Pipeline that we retained following the sale of the line segment to El Paso is a common carrier crude oil pipeline system that transports crude oil produced from certain outer continental shelf, or OCS, fields offshore California to locations in California. This segment is subject to tariff rates regulated by the FERC.
We own and operate the segment of the system that extends approximately 10 miles along the California coast from Las Flores to Gaviota (24-inch diameter pipe) and continues from Gaviota approximately 126 miles to our station in Emidio, California (30-inch diameter pipe). Between Gaviota and our Emidio Station, the All American Pipeline interconnects with our San Joaquin Valley, or SJV,
Gathering System as well as various third party intrastate pipelines, including the Unocap Pipeline System, the Shell Pipeline Company, L.P. and the Pacific Pipeline.
The All American Pipeline currently transports OCS crude oil received at the onshore facilities of the Santa Ynez field at Las Flores and the onshore facilities of the Point Arguello field located at Gaviota. ExxonMobil, which owns all of the Santa Ynez production, and PXP and other producers, which together own approximately 75% of the Point Arguello production, have entered into transportation agreements committing to transport all of their production from these fields on the All American Pipeline. These agreements, which expire in August 2007, provide for a minimum tariff with annual escalations based on specific composite indices. The producers from the Point Arguello field who do not have contracts with us have no other means of transporting their production and, therefore, ship their volumes on the All American Pipeline at the posted tariffs. Volumes attributable to PXP are purchased and sold to a third party under our marketing agreement with PXP before such volumes enter the All American Pipeline. See "Certain Relationships and Related Transactions—Transactions with Related Parties—General." The third party pays the same tariff as required in the transportation agreements. At December 31, 2003, the tariffs averaged $1.71 per barrel. Effective January 1, 2004, based on the contractual escalator, the average tariff increased to $1.81 per barrel. The agreements do not require these owners to transport a minimum volume.
A significant portion of our revenues less direct field operating costs is derived from the pipeline transportation business associated with these two fields. The relative contribution to our revenues less direct field operating costs from these fields has decreased from approximately 23% in 1999 to 17% in 2003, as we have grown and diversified through acquisitions and organic expansions and as a result of declines in volumes produced and transported from these fields, offset somewhat by an increase in pipeline tariffs. Over the last several years, transportation volumes received from the Santa Ynez and Point Arguello fields have declined from 92,000 and 60,000 average daily barrels, respectively, in 1995 to 46,000 and 11,000 average daily barrels, respectively, for the first six months of 2004. We expect that there will continue to be natural production declines from each of these fields as the underlying reservoirs are depleted. A 5,000 barrel per day decline in volumes shipped from these fields would result in a decrease in annual pipeline tariff revenues of approximately $3.3 million, based on a tariff of $1.81 per barrel.
In October 2004, PXP announced that it had successfully completed an initial development well into the Rocky Point field which is accessible from the Point Arguello platforms and that drilling operations are underway on a second development well. Such activities are not expected to have a significant impact on pipeline shipments on our All American Pipeline system in 2004. If successful, such incremental drilling activity could lead to increased volumes on our All American Pipeline System in future periods. However, we can give no assurance that our volumes transported would increase as a result of this drilling activity.
The table below sets forth the historical volumes received from both of these fields for the past five years and the six months ended June 30, 2004:
| | | Year Ended December 31, | ||||||||||||
|---|---|---|---|---|---|---|---|---|---|---|---|---|---|---|
| | Six Months Ended June 30, 2004 | |||||||||||||
| | 2003 | 2002 | 2001 | 2000 | 1999 | |||||||||
| | (barrels in thousands) | |||||||||||||
| Average daily volumes received from: | ||||||||||||||
| Point Arguello (at Gaviota) | 11 | 13 | 16 | 18 | 18 | 20 | ||||||||
| Santa Ynez (at Las Flores) | 46 | 46 | 50 | 51 | 56 | 59 | ||||||||
| Total | 57 | 59 | 66 | 69 | 74 | 79 | ||||||||
SJV Gathering System. The SJV Gathering System is connected to most of the major fields in the San Joaquin Valley. The SJV Gathering System was constructed in 1987 with a design capacity of approximately 140,000 barrels per day. The system consists of a 16-inch pipeline that originates at the Belridge station and extends 45 miles south to a connection with the All American Pipeline at the Pentland station. The SJV Gathering System also includes approximately 730,000 barrels of tank capacity, which can be used to facilitate movements along the system as well as to support our other activities.
The table below sets forth the historical volumes received into the SJV Gathering System for the past five years and the six months ended June 30, 2004:
| | | Year Ended December 31, | ||||||||||
|---|---|---|---|---|---|---|---|---|---|---|---|---|
| | Six Months Ended June 30, 2004 | |||||||||||
| | 2003 | 2002 | 2001 | 2000 | 1999 | |||||||
| | (barrels in thousands) | |||||||||||
| Total average daily volumes | 73 | 78 | 73 | 61 | 60 | 84 | ||||||
Butte Pipeline System. We own an approximate 22% equity interest in Butte Pipe Line Company, which in turn owns the Butte Pipeline System, a 370-mile mainline system that runs from Baker, Montana to Guernsey, Wyoming. The Butte Pipeline System is connected to the Poplar Pipeline System, which in turn is connected to the Wascana Pipeline System, which is located in our Canadian Region and is wholly owned by us. The total system volumes for the Butte Pipeline System during the first six months of 2004 were approximately 66,000 barrels of crude oil per day (approximately 15,000 barrels per day, net to our 22% interest). The operator of the system is Bridger Pipeline.
North Dakota Systems. The North Dakota Systems, included in the April 2004 Link acquisition, consist of the Bowman-Baker Pipeline System, the Trenton Pipeline System and the North Dakota Gathering System. Aggregate volumes on the systems averaged approximately 46,000 barrels per day for the second quarter of 2004. The Bowman-Baker System is a 283-mile, FERC regulated common carrier pipeline system from Harding County, South Dakota to the Butte Pipeline System at Baker, Montana. The Trenton Pipeline System consists of 116 miles of active pipeline from Richland County, Montana to Williston County, North Dakota delivering crude to Enbridge's Portal Pipeline System. The North Dakota Gathering System consists of approximately 220 miles of active pipeline located in the Williston Basin region of North Dakota. The system delivers primarily to Tesoro pipeline for consumption at Tesoro's Mandan Refinery or to the Little Missouri Pipeline, a feeder of the Butte Pipeline System.
U.S. Gulf Coast
Sabine Pass Pipeline System. The Sabine Pass Pipeline System, acquired in the Scurlock acquisition, is a common carrier crude oil pipeline system. The Sabine Pass Pipeline System primarily gathers crude oil from onshore facilities of offshore production near Johnson's Bayou, Louisiana, and delivers it to tankage and barge loading facilities in Sabine Pass, Texas. The Sabine Pass Pipeline System consists of approximately 51 miles of pipe ranging from 4 to 10 inches in diameter and has a throughput capacity of approximately 26,000 barrels of crude oil per day. During the first six months of 2004, the system transported approximately 15,000 barrels of crude oil per day. The Sabine Pass Pipeline System also includes 245,000 barrels of tank capacity located along the pipeline.
Ferriday Pipeline System. The Ferriday Pipeline System, acquired in the Scurlock acquisition, is a common carrier crude oil pipeline system located in eastern Louisiana and western Mississippi. The Ferriday Pipeline System consists of approximately 570 miles of pipe ranging from 2 inches to 12 inches in diameter. During the first six months of 2004, the Ferriday Pipeline System delivered approximately 7,000 barrels of crude oil per day to third party pipelines that supplied refiners in the Midwest. The Ferriday Pipeline System also includes approximately 332,000 barrels of tank capacity located along the pipeline.
La Gloria Pipeline System. The La Gloria Pipeline System, acquired in the Scurlock acquisition, is a proprietary crude oil pipeline system that during the first six months of 2004, transported approximately 22,000 barrels of crude oil per day to Crown Central's refinery in Longview, Texas. Crown Central's deliveries are subject to a throughput and deficiency agreement, which extends through 2004.
Red River Pipeline System. The Red River Pipeline System, acquired in 2003, is a 334-mile crude oil pipeline system that originates at Sabine in East Texas, and terminates near Cushing, Oklahoma. The Red River system has a capacity of up to 22,000 barrels of crude oil per day, depending upon the type of crude oil being transported. During the first six months of 2004, the system transported approximately 11,000 barrels of crude oil per day. The system also includes approximately 645,000 barrels of crude oil storage capacity. In 2003, we completed a connection of the pipeline system to our Cushing Terminal.
ArkLaTex Pipeline System. The ArkLaTex Pipeline System, acquired from Link Energy (formerly EOTT Energy) in September 2003, consists of 240 miles of active crude oil gathering and mainline pipelines and connects to our Red River Pipeline System near Sabine, Texas. Also included in the transaction were 470,000 barrels of active crude oil storage capacity. During the first six months of 2004, volumes transported averaged 8,000 barrels per day.
Atchafalaya Pipeline System. The Atchafalaya Pipeline System, which we own 100% through three separate transactions in 2003, originates near Garden City, Louisiana and traverses east to its terminus near Gibson, Louisiana. The system consists of 35 miles of active 8-inch crude oil and condensate pipelines. During the first six months of 2004, the system transported approximately 15,000 barrels per day of crude oil and condensate.
Eugene Island Flowline System. The Eugene Island Flowline System ("EIFS") is a 57-mile offshore gathering pipeline located in the Eugene Island federal lease block area of the Gulf of Mexico. The system delivers crude oil gathered offshore to the Burns Terminal and to the Burns dock barge-loading facility in south Louisiana. The total system volumes for the EIFS during the first half of 2004 were approximately 12,000 barrels per day of crude oil.
Capline/Capwood Pipeline System. The Capline Pipeline System, in which we acquiredown a 22% undivided joint interest, from Shell in March 2004, is a 633-mile, 40-inch mainline crude oil pipeline system that runs fromoriginating in St. James, Louisiana, toand terminating in Patoka, Illinois. The Capline Pipeline System consist of 633 miles of 40-inch pipe. The Capline Pipeline System is one of the primary transportation routes for crude oil shipped into the Midwestern U.S., accessing over 2.7 million barrels of refining capacity in PADD II, including refineries owned by ConocoPhillips, ExxonMobil, BP, MarathonAshland, CITGO and Premcor.II. Capline has direct connections to a significant amount of sweet and light sour crude production in the Gulf of Mexico. In addition, with its two active docks capable of handling 600,000-barrel tankers as well as access to LOOP, the Louisiana Offshore Oil Port, it is a key transporter of sweet and light sour foreign crude to PADD II. With a total system operating capacity of 1.14 million barrels per day of crude oil, approximately 248,000 barrels per day are subject to the interestour interest. Since we acquired by us. Since acquisition,this asset in March 2004, throughput on the interest acquired has averaged approximately 168,000147,000 barrels per day. A 10,000 barrel per day decline in volumes shipped on the Capline system would result in a decrease in annual pipeline segment profit of approximately $1.5 million.
The Capwood Pipeline System, in which we acquiredown a 76% undivided joint interest, from Shell in March 2004, is a 57-mile, 20-inch mainline crude oil pipeline system that runs fromoriginating in Patoka, Illinois, toand terminating in Wood River, Illinois. The Capwood Pipeline System consists of 57 miles of 20-inch pipe. The Capwood Pipeline System has an operating capacity of 277,000 barrels per day of crude oil. Of that capacity, approximately 211,000 barrels per day are subject to the interest acquired by us.our interest. The system has the ability to deliver crude oil at Wood River to several other PADD II refineries and pipelines, including those owned by Koch and ConocoPhillips.pipelines. Movements on the Capwood system are driven by the volumes shipped on Capline as well as Canadian crude that can be delivered to Patoka via the Mustang Pipeline. Since closing, we havePAA assumed the
operatorship of the Capwood system from SPLC. Since acquisition,we acquired this asset in March 2004, throughput on thenet to our interest acquired has averaged approximately 130,000120,000 barrels per day.
Mississippi/Alabama Pipeline System. The Mississippi/Alabama Pipeline System, included in Our significant pipeline systems are discussed on the April 2004 Link transaction, consists of a 331 mile proprietary gathering system and a 355 mile common carrier trunk system delivering crude oil primarily to three local refineries and to the Capline Pipeline System at Liberty, Mississippi. Also included in this system is approximately 4.5 million barrels of storage. Approximately 2.8 million barrels of this storage capacity is located at a deep water terminal in Mobile, Alabama capable of handling tankers with a draft of approximately 37 feet. For the second quarter of 2004, volumes averaged approximately 38,000 barrels per day.
Southwest Louisiana Pipeline System. The Southwest Louisiana Pipeline System, included in the April 2004 Link transaction, consists of approximately 254 miles of primarily 6-10" pipe. The system originates in Rapides Parish, Louisiana and delivers to the Citgo refinery in Lake Charles, LA and to Nederland, Texas. For the second quarter of 2004, volumes averaged approximately 7,000 barrels per day.
Central U.S.
Oklahoma Pipeline System. The Oklahoma Pipeline System, included in the April 2004 Link transaction, consists of approximately 1,354 miles of active pipe, originating at various points in Oklahoma and terminating at Cushing, Oklahoma. In addition to the pipeline, there are approximately 1.7 million barrels of storage included in the system. For the second quarter of 2004, volumes averaged approximately 77,000 barrels per day.
Midcontinent Pipeline System. The Midcontinent Pipeline System, included in the April 2004 Link transaction, consists of approximately 1,200 miles of pipe, originating at various points in Nebraska, Kansas, and Colorado. Deliveries are primarily to Jayhawk pipeline and our Oklahoma Pipeline System. Also included in the system are approximately 0.4 million barrels of storage. For the second quarter of 2004, volumes averaged approximately 30,000 barrels per day.
Canada
Cal Ven Pipeline System. The Cal Ven Pipeline System, acquired in the Cal Ven acquisition in May 2004,previous pages. Following is a crude oiltabular presentation of all of our active pipeline that is locatedassets in Northern Alberta, Canada. The Cal Ven Pipeline System is comprised of approximately 195 miles of 8-inch and 10-inch gathering and mainline crude oil pipelines. The Cal Ven Pipeline System delivers crude oil into the Rainbow Pipeline System at Utikuma. At acquisition, the Cal Ven Pipeline System transported approximately 16,000 barrels per day.
Manito Pipeline System. The Manito Pipeline System, acquired in the Murphy acquisition, is a provincially regulated system located in Saskatchewan, Canada. The Manito Pipeline System is a 101-mile crude oil pipeline and a parallel 101-mile condensate pipeline that connects our North Saskatchewan Pipeline System and multiple gathering lines to the Enbridge system at Kerrobert. The Manito Pipeline System volumes were approximately 72,000 barrels of crude oil and condensate per day in the first six months of 2004.
Milk River Pipeline System. The Milk River Pipeline System, acquired in the Murphy acquisition, is a National Energy Board ("NEB") regulated system located in Alberta, Canada. The Milk River Pipeline System consists of three parallel 11-mile crude oil pipelines that connect the Bow River Pipeline in Alberta to the Cenex Pipeline at the United States border. The Milk River Pipeline System transported approximately 100,000 barrels of crude oil per day duringand Canada, grouped by geographic location and including the first six months of 2004.aforementioned major pipeline assets:
North Saskatchewan Pipeline System. The North Saskatchewan Pipeline System, acquired in the Murphy acquisition, is a provincially regulated system located in Saskatchewan, Canada. We operate the
| Region | Pipeline | Ownership Percentage | Pipeline Mileage | 2004 Average Net Volumes | ||||
|---|---|---|---|---|---|---|---|---|
| Southwest US | Basin | 87.0 | % | 515 | 265,000 | |||
| West Texas Gathering | 100.0 | % | 717 | 80,000 | ||||
| Permian Basin | 100.0 | % | 919 | 46,000 | ||||
| Dollarhide | 100.0 | % | 24 | 6,000 | ||||
| Mesa | 8.8 | % | 79 | 28,000 | ||||
| Iraan | 100.0 | % | 98 | 23,000 | ||||
| Iatan | 100.0 | % | 360 | 22,000 | ||||
| New Mexico | 100.0 | % | 1,185 | 50,000 | ||||
| Texas | 100.0 | % | 1,276 | 80,000 | ||||
| Lefors | 100.0 | % | 68 | 2,000 | ||||
| Merkel | 100.0 | % | 128 | 1,000 | ||||
Western US | All American | 100.0 | % | 136 | 54,000 | |||
| San Joaquin Valley | 100.0 | % | 86 | 74,000 | ||||
US Rocky Mountains | Butte | 22.0 | % | 370 | 15,000 | |||
| North Dakota | 100.0 | % | 620 | 39,000 | ||||
US Gulf Coast | Sabine Pass | 100.0 | % | 33 | 15,000 | |||
| Ferriday | 100.0 | % | 570 | 7,000 | ||||
| La Gloria | 100.0 | % | 114 | 23,000 | ||||
| Red River | 100.0 | % | 567 | 12,000 | ||||
| ArkLaTex | 100.0 | % | 161 | 7,000 | ||||
| Atchafalaya | 100.0 | % | 35 | 14,000 | ||||
| Eugene Island | 100.0 | % | 66 | 12,000 | ||||
| Bridger Lakes | 100.0 | % | 17 | 3,000 | ||||
| Capline | 22.0 | % | 633 | 123,000 | ||||
| Capwood/Patoka | 76.0 | % | 57 | 109,000 | ||||
| Pearsall | 100.0 | % | 62 | 2,000 | ||||
| Mississippi/Alabama | 100.0 | % | 686 | 29,000 | ||||
| Southwest Louisiana | 100.0 | % | 267 | 4,000 | ||||
Central US | Oklahoma | 100.0 | % | 1,498 | 56,000 | |||
| Midcontinent | 100.0 | % | 1,196 | 22,000 | ||||
Canada | Cal Ven | 100.0 | % | 177 | 11,000 | |||
| Manito | 100.0 | % | 101 | 71,000 | ||||
| Milk River | 100.0 | % | 11 | 106,000 | ||||
| Cactus Lake | 14.9 | % | 55 | 3,000 | ||||
| Wascana | 100.0 | % | 114 | 9,000 | ||||
| Wapella | 100.0 | % | 79 | 14,000 | ||||
| South Sask | 100.0 | % | 158 | 49,000 |
North Saskatchewan Pipeline System, which is a 34-mile crude oil pipeline and a parallel 34-mile condensate pipeline that connects to our Manito Pipeline at Dulwich. During the first six months of 2004, the North Saskatchewan Pipeline System delivered approximately 6,200 barrels of crude oil and condensate per day into the Manito Pipeline. Our ownership interest in the North Saskatchewan Pipeline System is approximately 69%.
Cactus Lake/Bodo Pipeline System. The Cactus Lake/Bodo Pipeline System, acquired in the Murphy acquisition, is located in Alberta and Saskatchewan, Canada. The Bodo portion of the system is NEB-regulated, and the remainder is provincially regulated. We operate the Cactus Lake/Bodo Pipeline System, which is a 55-mile crude oil pipeline and a parallel 55-mile condensate pipeline that connects to our storage and terminalling facility at Kerrobert. During the first six months of 2004, the Cactus Lake/Bodo Pipeline System transported approximately 25,000 barrels per day (approximately 3,200 barrels per day, net to our interest) of crude oil and condensate. Our ownership interest in the Cactus Lake segment is 15% and our ownership interest in the Bodo Pipeline is 100%. We also own various interests in the lateral lines in these systems.
Wascana Pipeline System. The Wascana Pipeline System, acquired in the Murphy acquisition, is an NEB-regulated system located in Saskatchewan, Canada. The Wascana Pipeline System is a 107-mile crude oil pipeline that connects to the Bridger Pipeline system at the United States border near Raymond, Montana. During the first six months of 2004, the Wascana Pipeline System transported approximately 8,000 barrels of crude oil per day.
Wapella Pipeline System. The Wapella Pipeline System is a 79 mile, NEB-regulated system located in southeastern Saskatchewan and southwestern Manitoba. During the first six months of 2004, the Wapella Pipeline System delivered approximately 14,000 barrels of crude oil per day to the Enbridge Pipeline at Cromer, Manitoba. The system also includes approximately 18,500 barrels of crude oil storage capacity.
South Saskatchewan Pipeline System. The South Saskatchewan Pipeline System, which was acquired in November 2003, originates approximately 75 miles southwest of Swift Current, Saskatchewan, and traverses north and east until it reaches its terminus at Regina. The system consists of a 158-mile, 16-inch mainline and 203 miles of gathering lines ranging in diameter from three to twelve inches. During the first six months of 2004, the system transported approximately 47,000 barrels of crude oil per day. At Regina, the system can deliver crude oil to the Enbridge Pipeline System and to local markets. In addition, the system can indirectly deliver crude oil into our Wascana Pipeline System.
Gathering, Marketing, Terminalling and Storage Operations
The combination of our gathering and marketing operations and our terminalling and storage operations provides a counter-cyclical balance that has a stabilizing effect on our operations and cash flow. The strategic use of our terminalling and storage assets in conjunction with our gathering and marketing operations generally provides us with the flexibility to optimizemaintain our margins irrespective of whether a strong or weak market exists. Following is a description of our activities with respect to this segment.
Gathering and Marketing Operations
Crude Oil. The majority of our gathering and marketing activities are in the geographic locations previously discussed. These activities include:
We purchase crude oil from many independent producers and believe that we have established broad-based relationships with crude oil producers in our areas of operations. Gathering and marketing activities involve relatively large volumes of transactions often with lower margins compared tothan pipeline and terminalling and storage operations.
The following table shows the average daily volume of our lease gathering and bulk purchases for the past five years and the six months ended June 30, 2004:years:
| | | Year Ended December 31, | |||||||||||
|---|---|---|---|---|---|---|---|---|---|---|---|---|---|
| | Six Months Ended June 30, 2004 | ||||||||||||
| | 2003 | 2002 | 2001 | 2000 | 1999 | ||||||||
| | (barrels in thousands) | ||||||||||||
| Lease gathering | 550 | 437 | 410 | 348 | 262 | 265 | |||||||
| Bulk purchases(1) | 136 | 90 | 68 | 46 | 28 | 138 | |||||||
| Total volumes | 686 | 527 | 478 | 394 | 290 | 403 | |||||||
| | Year Ended December 31 | ||||||||||
|---|---|---|---|---|---|---|---|---|---|---|---|
| | 2004 | 2003 | 2002 | 2001 | 2000 | ||||||
| | (barrels in thousands) | ||||||||||
| Lease gathering | 589 | 437 | 410 | 348 | 262 | ||||||
| Bulk purchases | 148 | 90 | 68 | 46 | 28 | ||||||
| Total volumes per day | 737 | 527 | 478 | 394 | 290 | ||||||
Crude Oil Purchases. We purchase crude oil from producers under contracts, the majority of which range in term from a thirty-day evergreen to three years. In a typical producer's operation, crude oil flows from the wellhead to a separator where the petroleum gases are removed. After separation, the crude oil is treated to remove water, sand and other contaminants and is then moved into the producer's on-site storage tanks. When the tank is full,approaching capacity, the producer contacts our field personnel to purchase and transport the crude oil to market. We utilize our truck fleet and gathering pipelines as well as third partythird-party pipelines, trucks and barges to transport the crude oil to market. We own or lease approximately 400 trucks used for gathering crude oil.
Since 1998, we have had a marketing arrangement with Plains Resources, under which we have been the exclusive marketer and purchaser for all of Plains Resources' equity crude oil production (including its subsidiaries that conduct exploration and production activities). In connection with the separation of Plains Resources and one of its subsidiaries discussed below, Plains Resources divested the bulk of its producing properties. As a result, we do not anticipate the marketing arrangement with Plains Resources to be material to our operating results in the future.
In December 2002, Plains Resources completed a spin-off to its stockholders of PXP. We currently have a marketing agreement with PXP for the majoritycertain of its equity crude oil production and that of its subsidiaries. The marketing agreement provides that we will purchase PXP's equity crude oil production for resale at market prices, for which we charge a fee of $0.20 per barrel. ThisFor any new contracts for the sale of the crude oil entered into after January 1, 2005, the marketing fee iswill be adjusted to $0.15 per barrel, subject to further adjustment every three yearsin November 2007 based upon then existing
market conditions. We are currently negotiating an adjustment to the marketing fee, which we expect to be a downward adjustment. See "Certain Relationships and Related Transactions—Transactions with Related Parties—General."
Bulk Purchases. In addition to purchasing crude oil at the wellhead from producers, we purchase crude oil in bulk at major pipeline terminal locations. This oil is transported from the wellhead to the pipeline by major oil companies, large independent producers or other gathering and marketing companies. We purchase crude oil in bulk when we believe additional opportunities exist to realize margins further downstream in the crude oil distribution chain. The opportunities to earn additional margins vary over time with changing market conditions. Accordingly, the margins associated with our bulk purchases will fluctuate from period to period.
Crude Oil Sales. The marketing of crude oil is complex and requires current detailed knowledge of crude oil sources and end markets and a familiarity with a number of factors including grades of crude oil, individual refinery demand for specific grades of crude oil, area market price structures for the different grades of crude oil, location of customers, availability of transportation facilities and timing and costs (including storage) involved in delivering crude oil to the appropriate customer. We sell our crude oil to major integrated oil companies, independent refiners and other resellers in various types of sale and exchange transactions,transactions. The majority of these contracts are at market prices forand have terms ranging from one month to three years.
We establish a margin for crude oil we purchase by selling crude oil for physical delivery to third partythird-party users, such as independent refiners or major oil companies, or by entering into a future delivery obligation with respect to futures contracts on the NYMEX andor over-the-counter. Through these transactions, we seek to maintain a position that is substantially balanced between crude oil purchases and sales and future delivery obligations. From time to time, we enter into various types of sale and exchange transactions including fixed price delivery contracts, floating price collar arrangements, financial swaps and crude oil futures contracts as hedging devices. Except for pre-defined inventory positions, our policy is generally to purchase only crude oil for which we have a market, to structure our sales contracts so that crude oil price fluctuations do not materially affect the segment profit we receive, and to not acquire and hold crude oil, futures contracts or other derivative products for the purpose of speculating on crude oil price changes that might expose us to indeterminable losses. In November 1999, we discovered thata significant violation of this policy was violated, andpolicy. As a result, we incurred $174.0an aggregate loss of approximately $181 million in unauthorized trading losses, including associated costs and legal expenses. In 2000, we recognized an additional $7.0 million charge related to the settlement of litigation for an amount in excess of established reserves.
Crude Oil Exchanges. We pursue exchange opportunities to enhance margins throughout the gathering and marketing process. When opportunities arise to increase our margin or to acquire a grade of crude oil that more closely matches our physical delivery requirement or the preferences of our refinery customers, we exchange physical crude oil with third parties. These exchanges are effected through contracts called exchange or buy-sell agreements. Through an exchange agreement, we agree to buy crude oil that differs in terms of geographic location, grade of crude oil or physical delivery schedule from crude oil we have available for sale. Generally, we enter into exchanges to acquire crude oil at locations that are closer to our end markets, thereby reducing transportation costs and increasing our margin. We also exchange our crude oil to be physically delivered at a later date, if the exchange is expected to result in a higher margin net of storage costs, and enter into exchanges based on the grade of crude oil, which includes such factors as sulfur content and specific gravity, in order to meet the quality specifications of our physical delivery contracts.
Producer Services. Crude oil purchasers who buy from producers compete on the basis of competitive prices and highly responsive services. Through our team of crude oil purchasing representatives, we maintain ongoing relationships with producers in the United StatesU.S. and Canada. We believe that our ability to offer high-quality field and administrative services to producers is a key factor in our ability to maintain volumes of purchased crude oil and to obtain new volumes. Field services include
efficient gathering capabilities, availability of trucks, willingness to construct gathering pipelines where economically justified, timely pickup of crude oil from tank batteries at the lease or production point, accurate measurement of crude oil volumes received, avoidance of spills and effective management of pipeline deliveries. Accounting and other administrative services include securing division orders (statements from interest owners affirming the division of ownership in crude oil purchased by us), providing statements of the crude oil purchased each month, disbursing production proceeds to interest owners, and calculation and payment of ad valorem and production taxes on behalf of interest owners. In order to compete effectively, we must maintain records of title and division order interests in an accurate and timely manner for purposes of making prompt and correct payment of
crude oil production proceeds, together with the correct payment of all severance and production taxes associated with such proceeds.
Liquefied Petroleum Gas and Other Petroleum Products. We also market and store LPG and other petroleum products throughoutin the United States and Canada, concentrated primarily in Washington, California, Kansas, Michigan, Texas, Montana, Nebraska and the Canadian provinces of Alberta and Ontario.Canada. These activities include:
We purchase LPG from numerous producers and have established long-term, broad-basedbroad based relationships with LPG producers in our areas of operation. We purchase LPG directly from gas plants, major pipeline terminals, refineries and storage locations. Marketing activities for LPG typically consist of smaller volumes and generally higher margin per barrel transactions relative to crude oil.
LPG Purchases. We purchase LPG from producers, refiners, and other LPG marketing companies under contracts that range from immediate delivery to one year in term. In a typical producer's or refiner's operation, LPG that is produced at the gas plant or refinery is fractionated into various components including propane and butane and then purchased by us for movement via tank truck, railcar or pipeline.
In addition to purchasing LPG at gas plants or refineries, we also purchase LPG in bulk at major pipeline terminal points and storage facilities from major oil companies, large independent producers or other LPG marketing companies. We purchase LPG in bulk when we believe additional opportunities exist to realize margins further downstream in our LPG distribution chain. The opportunities to earn additional margins vary over time with changing market conditions. Accordingly, the margins associated with our bulk purchases will fluctuate from period to period.
LPG Sales. The marketing of LPG is complex and requires current detailed knowledge of LPG sources and end markets and a familiarity with a number of factors including the various modes and availability of transportation, area market prices and timing and costs of delivering LPG to customers.
We sell LPG primarily to industrial end users and retailers, and limited volumes to other marketers. Propane is sold to small independent retailers who then transport the product via bobtail truck to residential consumers for home heating and to some light industrial users such as forklift operators. Butane is used by refiners for gasoline blending and as a diluent for the movement of conventional heavy oil production. Butane demand for use as heavy oil diluent has increased as supplies of Canadian condensate have declined.
We establish a margin for propane by transporting it in bulk, via various transportation modes, to our controlled terminals where we deliver the propane to our retailer customers for subsequent delivery to their individual heating customers. We also create margin by selling propane for future physical delivery to third party users, such as retailers and industrial users. Through these transactions, we seek to maintain a position that is substantially balanced between propane purchases and sales and future delivery obligations. From time to time, we enter into various types of sale and exchange transactions including floating price collar arrangements, financial swaps and crude oil and LPG-related futures contracts as hedging devices. Except for pre-defined inventory positions, our policy is generally to
purchase only LPG for which we have a market, and to structure our sales contracts so that LPG spot price fluctuations do not materially affect the segment profit we receive. Margin is created on the butane purchased by delivering large volumes during the short refinery blending season through the use of our extensive leased railcar fleet and the use of our own storage facilities and third party storage facilities. We also create margin on butane by capturing the difference in price between condensate and butane when butane is used to replace condensate as a diluent for the movement of Canadian heavy oil production. While we seek to maintain a position that is substantially balanced within our LPG activities, as a result of production, transportation and delivery variances as well as logistical issues associated with inclement weather conditions, from time to time we experience net unbalanced positions for short periods of time. In connection with managing these positions and maintaining a constant presence in the marketplace, both necessary for our core business, our policies provide that any net imbalance may not exceed 250,000 barrels. These activities are monitored independently by our risk management function and must take place within predefined limits and authorizations.
LPG Exchanges. We pursue exchange opportunities to enhance margins throughout the marketing process. When opportunities arise to increase our margin or to acquire a volume of LPG that more closely matches our physical delivery requirement or the preferences of our customers, we exchange physical LPG with third parties. These exchanges are effected through contracts called exchange or buy-sell agreements. Through an exchange agreement, we agree to buy LPG that differs in terms of geographic location, type of LPG or physical delivery schedule from LPG we have available for sale. Generally, we enter into exchanges to acquire LPG at locations that are closer to our end markets in order to meet the delivery specifications of our physical delivery contracts.
Credit. Our merchant activities involve the purchase of crude oil and LPG for resale and require significant extensions of credit by our suppliers of crude oil.oil and LPG. In order to assure our ability to perform our obligations under crude oil purchase agreements, various credit arrangements are negotiated with our crude oil suppliers. These arrangements include open lines of credit directly with us, and standby letters of credit issued under our senior unsecured revolving credit facility.
When we marketsell crude oil and LPG, we must determine the amount, if any, of the line of credit to be extended to any given customer. We manage our exposure to credit risk through credit analysis, credit approvals, credit limits and monitoring procedures. If we determine that a customer should receive a credit line, we must then decide on the amount of credit that should be extended.
Because our typical crude oil sales transactions can involve tens of thousands of barrels of crude oil, the risk of nonpayment and nonperformance by customers is a major consideration in our business. We believe our sales are made to creditworthy entities or entities with adequate credit support. Generally, sales of crude oil are settled within 30 days of the month of delivery (in the case of foreign cargoes, typically 10 days after delivery), and pipeline, transportation and terminalling services also settle within 30 days from invoice for the provision of services.
We also have credit risk with respect to our sales of LPG; however, because our sales are typically in relatively small amounts to individual customers, we do not believe that we have material concentration of credit risk. Typically, we enter into annual contracts to sell LPG on a forward basis, as well as sell LPG on a current basis to local distributors and retailers. In certain cases our customers
prepay for their purchases, in amounts ranging from $0.05approximately $2 per gallonbarrel to 100% of their contracted amounts. Generally, sales of LPG are settled within 30 days of the date of invoice.
Terminalling and Storage Operations
We own approximately 37 million barrels of terminalling and storage assets, including tankage associated withassets. Approximately 13.6 million barrels of capacity are used in our pipelineGMT&S segment, and gathering systems.the remaining 23.4 million barrels are used in our Pipeline segment. Our storage and terminalling operations increase our margins in our business of purchasing and selling crude oil and also generate revenue through a combination of storage and throughput charges to third parties. Storage fees are generated when we lease tank capacity to third parties. Terminalling fees, also referred to as throughput fees, are generated
when we receive crude oil from one connecting pipeline and redeliver crude oil to another connecting carrier in volumes that allow the refinery to receive its crude oil on a ratable basis throughout a delivery period. Both terminalling and storage fees are generally earned from:
The tankage that is used to support our arbitrage activities positions us to capture margins in a contango market (when the oil prices for future deliveries are higher than the current prices) or when the market switches from contango to backwardation (when the oil prices for future deliveries are lower than the current prices).
Our most significant terminalling and storage asset is our Cushing Terminal located at the Cushing Interchange. The Cushing Interchange is one of the largest wet-barrel trading hubs in the U.S. and the delivery point for crude oil futures contracts traded on the NYMEX. The Cushing Terminal has been designated by the NYMEX as an approved delivery location for crude oil delivered under the NYMEX light sweet crude oil futures contract. As the NYMEX delivery point and a cash market hub, the Cushing Interchange serves as a primary source of refinery feedstock for the Midwest refiners and plays an integral role in establishing and maintaining markets for many varieties of foreign and domestic crude oil. Our Cushing Terminal was constructed in 1993, with an initial tankage capacity of 2 million barrels, to capitalize on the crude oil supply and demand imbalance in the Midwest. The Cushing Terminal is also used to support and enhance the margins associated with our merchant activities relating to our lease gathering and bulk purchasing activities. See "—Gathering and Marketing Operations—Bulk Purchases." InSince 1999, we have completed our 1.1 million barrel Phase Ifour separate expansion project,phases, which increased the facility's total storage capacity to 3.1 million barrels. On July 1, 2002, we placed in service approximately 1.1 million barrels of tank capacity associated with our Phase II expansion of the Cushing Terminal, raising the facility's total storage capacity to approximately 4.2 million barrels. In January 2003, we placed in service our 1.1 million barrel Phase III expansion, and in July 2004, we completed our Phase IV expansion which increased the total capacity of our Cushing Terminal by 20%. The expansion increased the capacity of the Cushing Terminal to a total of approximately 6.3 million barrels. The Cushing Terminal now consists of fourteen 100,000-barrel tanks, four 150,000-barrel tanks and sixteen 270,000-barrel tanks, all of which are used to store and terminal crude oil. We believeoil. In January 2005, we announced the commencement of our Phase V expansion that the facility can be further expandedwill add approximately 1.1 million barrels of storage capacity to meet additional demand should market conditions warrant.our Cushing Terminal. The Cushing Terminal also includes a pipeline manifold and pumping system that has an estimated throughput capacity of approximately 800,000 barrels per day. The Cushing Terminal is connected to the major pipelines and other terminals in the Cushing Interchange through pipelines that range in size from 10 inches to 24 inches in diameter.
The Cushing Terminal is designed to serve the needs of refiners in the Midwest. In order to service an expected increase in the volumes as well as theand varieties of foreign and domestic crude oil projected to be transported through the Cushing Interchange, we incorporated certain attributes into the original design of the Cushing Terminal including:
As a result of incorporating these attributes into the design of the Cushing Terminal, we believe we are favorably positioned to serve the needs of Midwest refiners to handle an increase in the number of varieties of crude oil transported through the Cushing Interchange. The pipeline manifold and pumping system of our Cushing Terminal is designed to support more than 10 million barrels of tank capacity and we have sufficient land holdings in and around the Cushing Interchange on which to construct additional tankage.capacity. Our tankage in Cushing ranges in age from less than a year old to approximately 11 years old and the average age is approximately 5.15 years old. In contrast, we estimate that of the approximately 21 million barrels of remaining tanks in Cushing owned by third parties, the average age is approximately 50 years and of that, approximately 9 million barrels has an average age of over 70 years. We believe that provides us with a competitive advantage over our competitors. In addition, we believe that we are well positioned to accommodate construction of replacement tankage that may be required as a result of the imposition of stricter regulatory standards and related attrition among our competitors' tanks in connection with the requirements of API 653. See "—Regulation—Pipeline and Storage Regulation."
Our Cushing Terminal also incorporates numerous environmental and operational safeguards. We believe that our terminal is the only one at the Cushing Interchange in which each tank has a secondary liner (the equivalent of double bottoms), leak detection devices and secondary seals. The Cushing Terminal is the only terminal at the Cushing Interchange equipped with aboveground pipelines. Like the pipeline systems we operate, theThe Cushing Terminal is operated by a computer system designed to monitor real-time operational data and each tank is cathodically protected. In addition, each tank is equipped with a high-level alarm system to prevent overflows; a double seal floating roof designed to minimize air emissions and prevent the possible accumulation of potentially flammable gases between fluid levels and the roof of the tank; and a foam dispersal system that, in the event of a fire, is fed by a fully-automatedfully automated fire water distribution network.
We also own LPG storage facilities located in Alto, Michigan, Schaefferstown, Pennsylvania and Schaefferstown, Pennsylvania.Claremont, New Hampshire. The Alto facility is approximately 20 miles southeast of Grand Rapids. The Alto facility was acquired from Ohio-Northwest Development Inc. in 2003 and is capable of storing over 501.2 million gallonsbarrels of LPG. The Schaefferstown facility is approximately 65 miles northwest of Philadelphia. It was acquired from Koch Hydrocarbon, L.P. in September 2004Philadelphia and is capable of storing over 200.5 million gallonsbarrels of propane. The Claremont facility is on the Vermont border and has the capacity to store approximately 17,000 barrels of propane. In addition, the Claremont facility has two truck loading stations and two rail unloading stations. We believe these facilities will further support the expansion of our LPG business in Canada and the northern tier of the U.S. as we combine the facilities' existing fee-based storage business with our wholesale propane marketing expertise. In addition, there may be opportunities to expand these facilities as LPG markets continue to develop in the region.
Crude Oil Volatility; Counter-CyclicalCounter Cyclical Balance; Risk Management
Crude oil prices have historically been very volatile and cyclical, with NYMEX benchmark prices ranging from asa high as approximately $54of over $55 per barrel (onin October 12, 2004)2004 to as low as $10.00$10 per barrel over the last 1420 years. Segment profit from terminalling and storage activities is dependent on the crude oil throughput volume, capacity leased to third parties, capacity that we use for our own activities, and the level of other fees generated at our terminalling and storage facilities. Segment profit from our gathering and marketing activities is dependent on our ability to sell crude oil at a price in excess of our aggregate cost. Although margins may be affected during transitional periods, these
operations are not directly affected by the absolute level of crude oil prices, but are affected by overall levels of supply and demand for crude oil and relative fluctuations in market-relatedmarket related indices.
During periods when supply exceeds the demand for crude oil, the market for crude oil is often in contango, meaning that the price of crude oil for future deliveries is higher than current prices. A contango market has a generally negative impact on marketing margins, but is favorable to the storage business, because storage owners at major trading locations (such as the Cushing Interchange) can simultaneously purchase production at current prices for storage and sell at higher prices for future delivery.
When there is a higher demand than supply of crude oil in the near term, the market is backwardated, meaning that the price of crude oil for future deliveries is lower than current prices. A backwardated market has a positive impact on marketing margins because crude oil gatherers can capture a premium for prompt deliveries. In this environment, there is little incentive to store crude oil as current prices are above future delivery prices.
The periods between a backwardated market and a contango market are referred to as transition periods. Depending on the overall duration of these transition periods, how we have allocated our assets to particular strategies and the time length of our crude oil purchase and sale contracts and storage lease agreements, these transition periods may have either an adverse or beneficial affect on our aggregate segment profit. A prolonged transition from a backwardated market to a contango market, or vice versa (essentially a market that is neither in pronounced backwardation nor contango), represents the most difficult environment for our gathering, marketing, terminalling and storage activities. When the market is in contango, we will use our tankage to improve our gathering margins by storing crude oil we have purchased for delivery in future months that are selling at a higher price. In a backwardated market, we use and lease less storage capacity but increased marketing margins provide an offset to this reduced cash flow. We believe that the combination of our terminalling and storage activities and gathering and marketing activities provides a counter-cyclicalcounter cyclical balance that has a stabilizing effect on our operations and cash flow. References to counter-cyclical balance elsewhere in this report are referring to this relationship between our terminalling and storage activities and our gathering and marketing activities in transitioning crude oil markets.
As use of the financial markets for crude oil has increased by producers, refiners, utilities and trading entities, risk management strategies, including those involving price hedges using NYMEX futures contracts and derivatives, have become increasingly important in creating and maintaining margins. Such hedging techniques require significant resources dedicated to managing these positions. Our risk management policies and procedures are designed to monitor both NYMEX and over-the-counter positions and physical volumes, grades, locations and delivery schedules to ensure that our hedging activities are implemented in accordance with such policies. We have a risk management function that has direct responsibility and authority for our risk policies, our trading controls and procedures and certain other aspects of corporate risk management.
Our policy is to purchase only crude oil for which we have a market, and to structure our sales contracts so that crude oil price fluctuations do not materially affect the segment profit we receive. Except for the controlled trading program discussed below, we do not acquire and hold crude oil futures contracts or other derivative products for the purpose of speculating on crude oil price changes that might expose us to indeterminable losses.
While we seek to maintain a position that is substantially balanced within our crude oil lease purchase and LPG activities, we may experience net unbalanced positions for short periods of time as a result of production, transportation and delivery variances as well as logistical issues associated with inclement weather conditions. In connection with managing these positions and maintaining a constant presence in the marketplace, both necessary for our core business, we engage in a controlled trading program for up to an aggregate of 500,000 barrels of crude oil. This controlled trading activity is
monitored independently by our risk management function and must take place within predefined limits and authorizations.
In order to hedge margins involving our physical assets and manage risks associated with our crude oil purchase and sale obligations, we use derivative instruments, including regulated futures and options transactions, as well as over-the-counter instruments. In analyzing our risk management activities, we draw a distinction between enterprise-levelenterprise level risks and trading-relatedtrading related risks. Enterprise-levelEnterprise level risks are those that underlie our core businesses and may be managed based on whether there is value in doing so. Conversely, trading-relatedtrading related risks (the risks involved in trading in the hopes of generating an increased return) are not inherent in the core business; rather, those risks arise as a result of engaging in the trading activity. We have a Risk Management Committee that approves all new risk management strategies through a formal process. With the partial exception of the controlled trading program, our approved strategies are intended to mitigate enterprise-levelenterprise level risks that are inherent in our core businesses of crude oil gathering and marketing and storage.
Although the intent of our risk-management strategies is to hedge our margin, not all of our derivatives qualify for hedge accounting. In such instances, changes in the fair values of these derivatives will receive mark-to-market treatment in current earnings, and result in greater potential for earnings volatility than in the past.volatility.
Marathon Ashland Petroleum ("MAP") accounted for 12%10%, 10%12% and 11%10% of our revenues for each of the three years in the period ended December 31, 2003. For the six months ended June 30, 2004, Marathon Ashland Petroleum and2004. BP Oil Supply Company eachalso accounted for 10% of our revenues.revenues for the year ended December 31, 2004. No other customers accounted for 10% or more of our revenues during the three years ended December 31, 2003 or the six months ended June 30, 2004. The majority of the revenues from Marathon Ashland Petroleum and BP Oil Supply Company pertain to our gathering, marketing, terminalling and storage operations. We believe that the loss of these customers would have only a short-term impact on our operating results. There can be no assurance, however, that we would be able to identify and access a replacement market at comparable margins.
Competition among pipelines is based primarily on transportation charges, access to producing areas and demand for the crude oil by end users. We believe that high capital requirements, environmental considerations and the difficulty in acquiring rights-of-way and related permits make it unlikely that competing pipeline systems comparable in size and scope to our pipeline systems will be built in the foreseeable future. However, to the extent there are already third-party owned pipelines or owners with joint venture pipelines with excess capacity in the vicinity of our operations, we will be exposed to significant competition based on the incremental cost of moving an incremental barrel of crude oil.
We face intense competition in our gathering, marketing, terminalling and storage operations. Our competitors include other crude oil pipeline companies, the major integrated oil companies, their marketing affiliates and independent gatherers, brokers and marketers of widely varying sizes, financial resources and experience. Some of these competitors have capital resources many times greater than ours, and control greater supplies of crude oil.
Our operations are subject to extensive regulations. We estimate that we are subject to regulatory oversight by over 70 federal, state, provincial and local departments and agencies, many of which are authorized by statute to issue and have issued laws and regulations binding on the oil pipeline industry,
related businesses and individual participants. The failure to comply with such rules and regulations can result in substantial penalties. The regulatory burden on our operations increases our cost of doing business and, consequently, affects our profitability. However, except for certain exemptions that apply
to smaller companies, we do not believe that we are affected in a significantly different manner by these laws and regulations than are our competitors. DueFollowing is a discussion of certain laws and regulations affecting us. However, due to the myriad of complex federal, state, provincial and local regulations that may affect us, directly or indirectly, you should not rely on the followingsuch discussion of certain laws and regulations as an exhaustive review of all regulatory considerations affecting our operations.
Pipeline and Storage Regulation
A substantial portion of our petroleum pipelines and storage tanks in the United States are subject to regulation by the U.S. Department of Transportation ("DOT") with respect to the design, installation, testing, construction, operation, replacement and management of pipeline and tank facilities. In addition, we must permit access to and copying of records, and must make certain reports available and provide information as required by the Secretary of Transportation. Comparable regulation exists in Canada and in some states in which we conduct intrastate common carrier or private pipeline operations.
Federal pipeline safety rules also require pipeline operators to develop and maintain a written qualification program for individuals performing covered tasks on pipeline facilities,facilities. Comparable regulation exists in some states in which we conduct intrastate common carrier or private pipeline operations, as well as in Canada under the National Energy Board ("NEB") and establish pipeline integrity management programs. In particular, sinceprovincial agencies.
Since 2000, the DOT has adopted a series of rules requiring operators of interstate pipelines transporting hazardous liquids or natural gas to develop and follow an integrity management program that provides for continual assessment of the integrity of all pipeline segments that could affect so-called "high consequence areas," including high population areas, areas that are sources of drinking water, ecological resource areas that are unusually sensitive to environmental damage from a pipeline release, and commercially navigable waterways. Segments of our pipelines transporting hazardous liquids in high consequence areas are subject to these DOT rules and therefore obligate us to evaluate pipeline conditions by means of periodic internal inspection, pressure testing, or other equally effective assessment means, and to correct identified anomalies. If, as a result of our evaluation process, we determine that there is a need to provide further protection to high consequence areas, then we will be required to implement additional spill prevention, mitigation and risk control measures for our pipelines. The DOT rules also require us to evaluate and, as necessary, improve our management and analysis processes for integrating available integrity-relatedintegrity related data relating to our pipeline segments and to remediate potential problems found as a result of the required assessment and evaluation process. Costs associated with this program were approximately $1.0 million in 2003.2003 and approximately $5 million in 2004. Based on currently available information, we estimate that the costs to implement and carry out this program will be approximately $5.6 million in 2004. Ourour preliminary estimate for 2005 is $5.8approximately $8 million. The relative increase in program cost for 2004over the last few years is primarily attributable to pipeline segments acquired in 2003 and 2004 (including the Link assets), which are subject to the new rules and for which were scheduled for assessment commenced in 2004. TheseCertain of these costs are recurring in nature and thus will impact future periods. We will continue to refine our estimates as information from our assessments is collected. Our estimates do not include the potential costs associated with assets acquired in the future. Although we believe that our pipeline operations are in substantial compliance with currently applicable regulatory requirements, we cannot predict the potential costs associated with additional, future regulation.
The DOT is currently considering expanding the scope of its pipeline regulation to include certain gathering pipeline systems that are not currently subject to regulation. This expanded scope would likely include the establishment of additional pipeline integrity management programs for these newly regulated pipelines. The DOT is in the initial stages of evaluating this initiative and we do not currently know what, if any, impact this will have on our operating expenses. However, we cannot assure you that
future costs related to the potential programs will not be material. However, even if the DOT does not expand the scope of its pipeline regulation to include pipeline systems not currently regulated, we may still need to implementupgrade or expand our existing pipeline integrity management programs to remain in compliance with the Federal Water Pollution Control Act and other environmental laws. We could be
required to spend substantial sums to ensure the integrity of and upgrade our pipeline systems to maintain environmental compliance, and in some cases, we may take pipelines out of service if we believe the cost of upgrades will exceed the value of the pipelines. We cannot provide any assurance as to the ultimate amount or timing of future pipeline integrity expenditures for environmental compliance.
States are largely preempted by federal law from regulating pipeline safety but may assume responsibility for enforcing federal intrastate pipeline regulations and inspection of intrastate pipelines. In practice, states vary considerably in their authority and capacity to address pipeline safety. We do not anticipate any significant problems in complying with applicable state laws and regulations in those states in which we operate.
The DOT has adopted API 653 as the standard for the inspection, repair, alteration and reconstruction of existing crude oil storage tanks subject to DOT jurisdiction (approximately 83% of our 37 million barrels)barrels are subject to DOT jurisdiction). API 653 requires regularly scheduled inspection and repair of tanks remaining in service. Full compliance is required by 2009. We have commenced our compliance activities and, basedCosts associated with this program were approximately $3 million in 2004. Based on currently available information, we estimate thatanticipate we will spend approximately $3 million in 2004 and an approximate average of $6.2$6 million per year from 2005 through 2009 in connection with API 653 compliance activities. Such amounts incorporate the costs associated with the assets acquired in 2003 and 2004. Our estimates do not include the potential costs associated with assets acquired in the future. We will continue to refine our estimates as information from our assessments is collected.
We have instituted security measures and procedures, in accordance with DOT guidelines, to enhance the protection of certain of our facilities from terrorist attack. We cannot assure you that these security measures would fully protect our facilities from a concentrated attack. See "—Operational Hazards and Insurance."
In Canada, the NEB and provincial agencies such as the Alberta Energy and Utilities Board and the Saskatchewan Industry and Resources have promulgated regulations similar to the domestic pipeline integrity management rules and API 653 standards. We spent approximately $4.1 million in 2004 in compliance activities. Our preliminary estimate for 2005 is approximately $5.1 million. In addition, we expect to incur compliance costs under other regulations related to pipeline and storage tank integrity, such as operator competency programs, regulatory upgrades to our operating and maintenance systems and environmental upgrades of buried sump tanks. Our preliminary estimate for such costs for 2005 is approximately $0.5 million. Certain of these costs are recurring in nature and thus will impact future periods. We will continue to refine our estimates as information from our assessments is collected. Our estimates do not include the potential costs associated with assets acquired in the future. Although we believe that our pipeline operations are in substantial compliance with currently applicable regulatory requirements, we cannot predict the potential costs associated with additional, future regulation.
Asset acquisitions are an integral part of our business strategy. As we acquire additional assets, we may be required to incur additional costs in order to ensure that the acquired assets comply with these standards. The timing of such additional costs is uncertainthe regulatory standards in the U.S. and could vary materially from our current projections.Canada.
Transportation Regulation
General Interstate Regulation. Our interstate common carrier pipeline operations are subject to rate regulation by the FERC under the Interstate Commerce Act. The Interstate Commerce Act requires that tariff rates for petroleum pipelines, which includes both crude oil as well aspipelines and refined product pipelines, be just and reasonable and non-discriminatory.
State Regulation. Our intrastate pipeline transportation activities are subject to various state laws and regulations, as well as orders of state regulatory bodies.
Canadian Regulation. Our Canadian pipeline assets are subject to regulation by the NEB and by provincial agencies. With respect to a pipeline over which it has jurisdiction, each of these agencies has the power, upon application by a third party, to determine the rates we are allowed to charge for transportation on, and set other terms of access to, such pipeline. In such circumstances, if the relevant regulatory agency determines that the applicable terms and conditions of service are not just and reasonable, the agency can amend the offending provisions of an existing transportation contract.
Energy Policy Act of 1992 and Subsequent Developments. In October 1992, Congress passed the Energy Policy Act of 1992 ("EP Act"EPAct"), which among other things, required the FERC to issue rules
establishing a simplified and generally applicable ratemaking methodology for petroleum pipelines and to streamline procedures in petroleum pipeline proceedings. The FERC responded to this mandate by issuing several orders, including Order No. 561. Beginning January 1, 1995, Order No. 561 enables petroleum pipelines to change their rates within prescribed ceiling levels that are tied to an inflation index. Rate increases made pursuant to the indexing methodology are subject to protest, but such protests must show that the portion of the rate increase resulting from application of the index is substantially in excess of the pipeline's increase in costs. If the indexing methodology results in a reduced ceiling level that is lower than a pipeline's filed rate, Order No. 561 requires the pipeline to reduce its rate to comply with the lower ceiling unless doing so would reduce a rate "grandfathered" by EP ActEPAct (see below) below the grandfathered level. A pipeline must, as a general rule, utilize the indexing methodology to change its rates. The FERC, however, retained cost-of-service ratemaking, market-basedmarket based rates, and settlement as alternatives to the indexing approach, which alternatives may be used in certain specified circumstances. The EP ActEPAct deemed petroleum pipeline rates in effect for the 365-day period ending on the date of enactment of EP ActEPAct that had not been subject to complaint, protest or investigation during that 365-day period to be just and reasonable under the Interstate Commerce Act. Generally, complaints against such "grandfathered" rates may only be pursued if the complainant can show either that a substantial change has occurred since the enactment of EPAct in either the economic circumstances of the oil pipeline, that were a basis for the rate or in the nature of the services has occurred sinceprovided, that were a basis for the enactment of EP Act, EP Act does notrate. EPAct places no such limit a companies abilityon challenges to challenge a provision of an oil pipeline tariff as unduly discriminatory or preferential.
On July 20, 2004, the United States Court of Appeals for the District of Columbia Circuit ("D.C. Circuit") issued its opinion inBP West Coast Products, LLC v. FERC, which upheld FERC's determination that the rates of an interstate petroleum products pipeline, SFPP, L.P. ("SFPP"), were grandfathered rates under EP ActEPAct and that SFPP's shippers had not demonstrated substantially changed circumstances that would justify modification of those rates. The court also vacated the portion of the FERC's decision applying theLakehead policy, under which the FERC allowed a regulated entity organized as a master limited partnership to include in its cost-of-service an income tax allowance to the extent that its unit-holdersentity's unitholders were corporations subject to income tax. On December 2, 2004, the FERC issued a Notice of Inquiry that called for comments regarding whetherBP West Coast applies broadly or only to the specific facts of that case. We are uncertain what action if any,the FERC ultimately will take in response to the court's disapproval of the FERC'sLakehead policy and what effect, if any, such action might have on our rates should they be challenged.
Additionally, inBP West Coast, the court remanded to the FERC the issue of whether SFPP's revised cost-of-service without a tax allowance would qualify as a substantially changed circumstance that would justify modification of SFPP's rates. Because the court remanded to the FERC and because the FERC's ruling on the substantially changed circumstances issue will focus on the facts and record presented to it, it is not clear what impact, if any, the opinion will have on our rates or on the rates of other FERC-jurisdictional pipelines organized as tax pass-through entities. Moreover, it is not clear to
what extent FERC's actions taken in response toBP West Coast will be challenged and, if so, whether they will withstand further FERC or judicial review.
In a subsequent FERC proceeding involving SFPP, certain shippers again challenged SFPP's grandfathered rates on the basis of substantially changed circumstances since the passage of EP Act.EPAct. On March 26, 2004, the FERC issued an order in that case, finding that some of SFPP's rates should no longer be grandfathered.were not grandfathered and that there were substantially changed circumstances on certain of their systems. Several of the participants in the proceeding have requested rehearing of the FERC's order, and several participants have filed petitions with the D.C. Circuit for review of the order. FERC and court action on those petitions is pending. We are uncertain whether FERC's order will remain intact and, if it does, what effect, if any, that order might have on our grandfathered rates should they be challenged.
Our Pipelines. The FERC generally has not investigated rates on its own initiative when those rates have not been the subject of a protest or complaint by a shipper. Substantially all of our segment
profit on transportation is produced by rates that are either grandfathered or set by agreement of the parties.with one or more shippers.
Trucking Regulation
We operate a fleet of trucks to transport crude oil and oilfield materials as a private, contract and common carrier. We are licensed to perform both intrastate and interstate motor carrier services. As a motor carrier, we are subject to certain safety regulations issued by the Department of Transportation. The trucking regulations cover, among other things, driver operations, maintaining log books, truck manifest preparations, the placement of safety placards on the trucks and trailer vehicles, drug and alcohol testing, safety of operation and equipment, and many other aspects of truck operations. We are also subject to the Occupational Safety and Health Act, as amended ("OSHA"), with respect to our trucking operations.
Our trucking assets in Canada are subject to regulation by both federal and provincial transportation agencies in the provinces in which they are operated. These regulatory agencies do not set freight rates, but do establish and administer rules and regulations relating to other matters including equipment and driver licensing, equipment inspection, hazardous materials and safety.
Cross-BorderCross Border Regulation
As a result of our Canadian acquisitions and cross-bordercross border activities, we are subject to regulatory matters including export licenses, tariffs, Canadian and U.S. customs and tax issues and toxic substance certifications. Regulations include the Short Supply Controls of the Export Administration Act, the North American Free Trade Agreement and the Toxic Substances Control Act. Violations of these license, tariff and tax reporting requirements could result in the imposition of significant administrative, civil and criminal penalties. Furthermore, the failure to comply with U.S., Canadian, state, provincial and local tax requirements could lead to the imposition of additional taxes, interest and penalties.
Environmental, Health and Safety Regulation
General
Our operations involving the storage, treatment, processing, and transportation of liquid hydrocarbons including crude oil are subject to stringent federal, state, provincial and local laws and regulations governing the discharge of materials into the environment or otherwise relating to protection of the environment. As with the industry generally, compliance with these laws and regulations increases our overall cost of business, including our capital costs to construct, maintain and upgrade equipment and facilities. Failure to comply with these laws and regulations may result in the assessment of administrative, civil, and criminal penalties, the imposition of investigatory and remedial
liabilities, and even the issuance of injunctions that may restrict or prohibit our operations. Environmental laws and regulations are subject to change, and we cannot provide any assurance that compliance with current and future laws and regulations will not have a material affect on our results of operations or earnings. A discharge of hazardous liquids into the environment could, to the extent such event is not insured, subject us to substantial expense, including both the cost to comply with applicable laws and regulations and any claims made by neighboring landowners and other third parties for personal injury and property damage.
Water
The U.S. Oil Pollution Act as amended ("OPA"), was enacted in 1990 and amends provisions of the Federal Water Pollution Control Act of 1972, as amended ("Clean Water Act"), and other statutes as they pertain to prevention and response to oil spills. The OPA and analogous state and Canadian federal and provincial laws subject owners of facilities to strict, joint and potentially unlimited liability for containment and
removal costs, natural resource damages, and certain other consequences of an oil spill, where such spill is into navigable waters, along shorelines or in the exclusive economic zone of the U.S. The OPA establishes a liability limit of $350 million for onshore facilities. However, a party cannot take advantage of this liability limit if the spill is caused by gross negligence or willful misconduct, resulted from a violation of a federal safety, construction, or operating regulation, or if there is a failure to report a spill or cooperate in the cleanup. We believe that we are in substantial compliance with applicable OPA requirements.
The U.S. Clean Water Act and analogous state and Canadian federal and provincial laws impose restrictions and strict controls regarding the discharge of pollutants into navigable waters of the United States and Canada, as well as state and provincial waters. Permits must be obtained to discharge pollutants into these waters. The Clean Water Act imposes substantial potential liability for the removal and remediation of pollutants. Although we can give no assurances, we believe that compliance with existing permits and compliance with foreseeable new permit requirements will not have a material adverse effect on our financial condition or results of operations.
Some states and all provinces maintain groundwater protection programs that require permits for discharges or operations that may impact groundwater conditions. We believe that we are in substantial compliance with any such applicable state requirements.
In addition to the costs described above we could also be required to spend substantial sums to ensure the integrity of and upgrade our pipeline systems as a result of oil spills, and in some cases, we may take pipelines out of service if we believe the cost of upgrades will exceed the value of the pipelines. We cannot provide any assurance as to the ultimate amount or timing of future pipeline integrity expenditures for environmental compliance.
Air Emissions
Our operations are subject to the FederalU.S. Clean Air Act as amended, and comparable state and provincial laws. We believe that our operations are in substantial compliance withUnder these laws, in those areas in which we operate.
Amendments to the Federal Clean Air Act enacted in 1990 (the "1990 Federal Clean Air Act Amendments") as well as changes to state implementation plans for controllingpermits may be required before construction can commence on a new source of potentially significant air emissions in regional non-attainment areasand operating permits may require most industrial operations in the U.S. to incur capital expenditures in order to meet air emission control standards developed by the U.S. Environmental Protection Agency (the "EPA") and state environmental agencies. The 1990 Federal Clean Air Act Amendments also imposed an operating permit requirementbe required for major sources of air emissions ("Title V permits"), which applies to some of our facilities.already constructed. We may be required to incur certain capital expenditures in the next several years for air pollution control equipment in connection with obtaining or maintaining permits and approvals addressingfor sources of air emission related issues. Althoughemissions. While we believe that our operations are in substantial compliance with these laws in those areas in which we operate, we can provide no assurance we believethat future compliance with the 1990 Federal Clean Air Act Amendmentsobligations will not have a material adverse effect on our financial condition or results of operations.
Canada is a participant in the Kyoto Protocol of the United Nations Framework Convention on Climate Change. The Kyoto Protocol requires participating developed nations such as Canada to reduce their emissions of carbon dioxide and other "greenhouse gases" to five percent below 1990 levels by 2012. As a result, already stringent air emissions regulations applicable to our operations in Canada will be replaced, by 2010, with even stricter requirements. We are currently monitoring the
impact on our operations of proposed changes in regulations that will be necessary as a result of Canada's participation in the Protocol.
Solid Waste
We generate wastes, including hazardous wastes, that are subject to the requirements of the federal Resource Conservation and Recovery Act ("RCRA") and comparable state and provincial laws. We are not required to comply with a substantial portion of the RCRA requirements because our operations generate primarily oil and gas wastes, which currently are excluded from consideration as RCRA hazardous wastes. However, it is possible that in the future the exclusion of oil and gas wastes from regulation as RCRA hazardous wastes may be eliminated, in which event, our wastes as well as the wastes of our competitors in the oil and gas industry will be subject to more rigorous and costly
disposal requirements, resulting in additional capital expenditures or operating expenses for us and the industry in general.
Hazardous Substances
The federal Comprehensive Environmental Response, Compensation and Liability Act, as amended ("CERCLA"), also known as "Superfund," and comparable state and provincial laws impose liability, without regard to fault or the legality of the original act, on certain classes of persons that contributed to the release of a "hazardous substance" into the environment. These persons include the owner or operator of the site or sites where the release occurred and companies that disposed of, or arranged for the disposal of, the hazardous substances found at the site. Under CERCLA, such persons may be subject to strict joint and several liability for the costs of cleaning up the hazardous substances that have been released into the environment, for damages to natural resources, and for the costs of certain health studies. It is not uncommon for neighboring landowners and other third parties to file claims for personal injury and property damage allegedly caused by hazardous substances or other pollutants released into the environment. In the course of our ordinary operations, we may generate waste that falls within CERCLA's definition of a "hazardous substance," in which event we may be held jointly and severally liable under CERCLA for all or part of the costs required to clean up sites at which such hazardous substances have been released into the environment.
OSHA
We are subject to the requirements of OSHA, and comparable state statutes that regulate the protection of the health and safety of workers. In addition, the OSHA hazard communication standard requires that certain information be maintained about hazardous materials used or produced in operations and that this information be provided to employees, state and local government authorities and citizens. We believe that our operations are in substantial compliance with OSHA requirements, including general industry standards, record keeping requirements and monitoring of occupational exposure to regulated substances. OSHA has also been given jurisdiction over enforcement of legislation designed to protect employees who provide evidence in fraud cases from retaliation by their employer.
Similar regulatory requirements exist in Canada under the federal and provincial Occupational Health and Safety Acts and related regulations. The agencies with jurisdiction under these regulations are empowered to enforce them through inspection, audit, incident investigation or public or employee complaint. Additionally, recent legislation directly ties corporate accountability to the Criminal Code of Canada. This legislation enables occupational health and safety ("OH&S") regulators to prosecute organizations and individuals criminally for violations of the regulations. We believe that our operations are in substantial compliance with applicable OH&S requirements.
Endangered Species Act
The federal Endangered Species Act as amended ("ESA"), restricts activities that may affect endangered species or their habitats. Although certain of our facilities are in areas that may be designated as habitat for endangered species, we believe that we are in substantial compliance with the ESA. However, the discovery of previously unidentified endangered species could cause us to incur additional costs or operation restrictions or bans in the affected area, which costs, restrictions, or bans could have a material adverse effect on our financial condition or results of operations. Similar regulation (the Species Risk Act) applies to our Canadian operations.
Hazardous Materials Transportation Requirements
The DOT regulations affecting pipeline safety require pipeline operators to implement measures designed to reduce the environmental impact of oil discharge from onshore oil pipelines. These regulations require operators to maintain comprehensive spill response plans, including extensive spill response training for pipeline personnel. In addition, DOT regulations contain detailed specifications for pipeline operation and maintenance. We believe our operations are in substantial compliance with such regulations. See "—Regulation—Pipeline and Storage Regulation."
Environmental Remediation
We currently own or lease and have in the past owned or leased, properties where hazardous liquids, including hydrocarbons, are being or have been handled. Although we have utilized operating and disposal practices that were standard in the industry at the time, hazardous liquids or associated generated wastes may have been disposed of or released on or under the properties owned or leased by us or on or under other locations where these wastes have been taken for disposal. In addition, many of these properties have been operated by third parties whose treatment and disposal or release of hazardous liquids or associated generated wastes was not under our control. These properties and the hazardous liquids or associated generated wastes disposed thereon may be subject to CERCLA, RCRA and analogous state and Canadian federal and provincial laws. Under such laws, we could be required to remove or remediate previously spilled hazardous liquids or associated generated wastes (including wastes disposed of or released by prior owners or operators), to clean up contaminated property (including contaminated groundwater) or to perform remedial plugging operations to prevent future contamination.
We maintain insurance of various types with varying levels of coverage that we consider adequate under the circumstances to cover our operations and properties. The insurance policies are currently involved in remediation activities at a number of sites, which involve potentially significant expense.
Contamination resulting from spills of liquid hydrocarbons, including crude oilsubject to deductibles and associated generated wastes, isretention levels that we consider reasonable and not unusual within the petroleum pipeline industry. Historic spills along our pipelines as well as at our terminalling and storage facilities as a result of past operations have resulted in contamination of the environment, including soils and groundwater. Properties acquired by us through acquisitions from predecessor operators, such as the properties recently acquiredexcessive. Consistent with insurance coverage generally available in the Link acquisition, oftentimesindustry, in certain circumstances our insurance policies provide limited coverage for losses or liabilities relating to gradual pollution, with broader coverage for sudden and accidental occurrences.
In addition, we have similar impacts to soils and groundwater arising from historical operations on those properties. We are currently addressing site conditions, including soils and groundwater, at a numberentered into indemnification agreements with various counterparties in conjunction with several of our properties, including recently acquired properties, where historicalacquisitions. Allocation of environmental liability is an issue negotiated in connection with each of our acquisition transactions. In each case, we make an assessment of potential environmental exposure based on available information. Based on that assessment and relevant economic and risk factors, we determine whether to negotiate an indemnity, what the terms of any indemnity should be (for example, minimum thresholds or more recent operations by us or predecessor operators may have resulted in releases of hydrocarbonscaps on exposure) and other wastes. As of June 30, 2004, we have reserved approximately $23.5 million, of which $15.7 million is relatedwhether to liabilities assumed as part of the Link acquisition.obtain insurance, if available. In addition,some cases, we have received contractual protections in the form of environmental indemnifications from several predecessor operators for properties acquired by us that are contaminated as a result of historical operations. These contractual indemnifications typically are subject to specific monetary and term limitsrequirements that must be satisfied before indemnification will apply.apply and have term and total dollar limits.
The acquisitions we completed in 2003 and 2004 include a variety of provisions dealing with the allocation of responsibility for environmental costs that range from no or limited indemnities from the sellers to indemnification from sellers with defined limitations on their maximum exposure. We have not obtained insurance for any of the conditions related to our 2003 acquisitions, and only in limited circumstances for our 2004 acquisitions.
For instance, in connection with the Link acquisition, we identified a number of known environmental claims and estimated an amount for potential claims that are currently unknown,liabilities, for which we received a purchase price reduction from Link. A substantial portion of the knownthese environmental liabilities are associated with the former Texas New Mexico ("TNM") pipeline assets. On the effective date of the acquisition, we and TNM entered into a cost-sharing agreement whereby, on a tiered basis, we will bear $11 million of the first $20 million of pre-May 1999 known environmental issues. We will also bear the first $25,000 per site for unknownnew sites which were not identified at the time we entered into the agreement (capped at 100 sites). TNM will pay all costs in excess of $20 million (excluding the deductible for unknownnew sites). TNM's obligations are guaranteed by Shell Oil Products.Products ("SOP"). We recorded a reserve for environmental liabilities of approximately $17.0 million in connection with the Link acquisition.
In connection with the acquisition of certain Shell crude oil transmissionstransmission and gathering assets from SOP in 2002, Shell purchased an environmental insurance policy covering known and unknown environmental matters associated with operations prior to closing. We are a named beneficiary under the policy, which has a $100,000 deductible per site, an aggregate coverage limit of $70 million, and expires in 2012. Shell has recently made a claim against the policy; however, we do not believe that the claim will substantially reduce our coverage under the policy.
Allocation of environmental liability is an issue negotiated inIn connection with eachour 1999 acquisition of our acquisition transactions.Scurlock Permian LLC from MAP, we were indemnified by MAP for any environmental liabilities attributable to Scurlock's business or properties which occurred prior to the date of the closing of the acquisition. This indemnity applied to claims that exceeded $25,000 individually and $1.0 million in the aggregate. For the indemnity to apply, we were required to assert any claims on or before May 15, 2003. In each case,conjunction with the expiration of this indemnity, we make an assessment of potential environmental exposure based on available information. Based on that assessment and relevant economic and risk factors, we determine whetherreached agreement with respect to negotiate anMAP's remaining indemnity whatobligations. Under the terms of any indemnity should be (for example,
minimum thresholds or caps on exposure) and whetherthis agreement, MAP will continue to obtain insurance, if available. The acquisitions we completed in 2003 or 2004 include a varietyremain obligated for liabilities associated with two Superfund sites at which it is alleged that Scurlock Permian deposited waste oils. In addition, MAP paid us $4.6 million cash as satisfaction of provisions dealing with the allocation of responsibility for environmental costs that range from no or limited indemnities from the sellers to indemnification from sellers with defined limitations on their maximum exposure. We have not obtained insurance for any of the conditions related to our 2003 acquisitions, and only limited circumstances for our 2004 acquisitions. We believe our exposureits obligations with respect to the acquired properties is reasonable in light of all the information availableother sites. During 2002, we had reassessed previous investigations and completed environmental studies related to us, but can give no assurance in that regard. To the extent our assessment involves projected costs that are neither indemnified nor insured, we include such costs in our environmental reserve.
We believe that the environmental reserve described above is adequate, and in conjunctionconditions associated with our indemnification arrangements, should prevent remediation costs from having1999 acquisitions. As a material adverse effect on our financial condition, resultsresult of operations, or cash flows. Nevertheless, no assurances can be made that any costs incurred in excessreassessment, we established an additional reserve of this reserve or outside of the indemnifications would not have a material adverse effect on our financial condition, results of operations, or cash flows.$1.2 million.
Other assets we have acquired or will acquire in the future may have environmental remediation liabilities for which we are not indemnified. We have in the past experienced and in the future will likely experience releases of crude oil into the environment from our pipeline and storage operations, or discover releases that were previously unidentified. Although we maintain a program designed to prevent and, as applicable, to detect and address such releases promptly, damages and liabilities incurred due to environmental releases from our assets may substantially affect our business.
At December 31, 2004, our reserve for environmental liabilities totaled approximately $19.8 million (approximately $12.7 million of this reserve is related to liabilities assumed as part of the Link acquisition). Approximately $9.3 million of our environmental reserve is classified as current and $10.5 million is classified as long-term. At December 31, 2004, we have recorded receivables totaling approximately $6.3 million for amounts recoverable under insurance and from third parties under indemnification agreements.
In some cases, the actual cash expenditures may not occur for three to five years. We believe that this reserve is adequate, and in conjunction with our indemnification arrangements, should prevent remediation costs from having a material adverse effect on our financial condition, results of operations, or cash flows. Our estimates used in these reserves are based on all known facts at the time and our assessment of the ultimate outcome. Among the many uncertainties that impact our estimates are the necessary regulatory approvals for, and potential modification of, our remediation plans, the limited amount of data available upon initial assessment of the impact of soil or water contamination, changes in costs associated with environmental remediation services and equipment and the possibility
of existing legal claims giving rise to additional claims. Therefore, no assurances can be made that any costs incurred in excess of this reserve or outside of the indemnifications would not have a material adverse effect on our financial condition, results of operations, or cash flows.
Operational Hazards and Insurance
Pipelines, terminals, trucks or other facilities or equipment may experience damage as a result of an accident or natural disaster. These hazards can cause personal injury and loss of life, severe damage to and destruction of property and equipment, pollution or environmental damage and suspension of operations. Since we and our predecessors commenced midstream crude oil activities in the early 1990s, we have maintained insurance of various types and varying levels of coverage that we consider adequate under the circumstances to cover our operations and properties. The insurance policies are subject to deductibles and retention levels that we consider reasonable and not excessive. However, such insurance does not cover every potential risk associated with operating pipelines, terminals and other facilities, including the potential loss of significant revenues. Consistent with insurance coverage generally available to the industry, in certain circumstances our insurance policies provide limited coverage for losses or liabilities relating to gradual pollution, with broader coverage for sudden and accidental occurrences. Over the last several years, our operations have expanded significantly, with total assets increasing over 300%400% since the end of 1998. At the same time that the scale and scope of our business activities have expanded, the breadth and depth of the available insurance markets have contracted. Notwithstanding what we believe is a favorable claims history, the overall cost of such insurance as well as the deductibles and overall retention levels that we maintain have increased. As a result, it is anticipated that we will electhave elected to self-insureself insure more activities against certain of these operating hazards.hazards and expect this trend will continue in the future. Certain aspects of these conditions were exacerbated by the events of September 11, 2001, and their overall effect on the insurance industry have adversely impacted the availability and cost of certain coverages. Due to these events, insurers have excluded acts of terrorism and sabotage from our insurance policies and on certain of our key assets, we have elected to purchase a separate insurance policy for acts of terrorism and sabotage.
Since the terrorist attacks, the United States Government has issued numerous warnings that energy assets, including our nation's pipeline infrastructure, may be future targets of terrorist organizations. These developments expose our operations and assets to increased risks. We have instituted security measures and procedures in conformity with DOT guidance. We will institute, as appropriate, additional security measures or procedures indicated by the DOT or the Transportation Safety Administration. However, we cannot assure you that these or any other security measures would
protect our facilities from a concentrated attack. Any future terrorist attacks on our facilities, those of our customers and, in some cases, those of our competitors, could have a material adverse effect on our business, whether insured or not.
The occurrence of a significant event not fully insured, indemnified or indemnifiedreserved against, or the failure of a party to meet its indemnification obligations, could materially and adversely affect our operations and financial condition. We believe that we are adequately insured for public liability and property damage to others with respect to our operations. We believe that our levels of coverage and retention are generally consistent with those of similarly situated companies in our industry. With respect to all of our coverage, no assurance can be given that we will be able to maintain adequate insurance in the future at rates we consider reasonable.reasonable, or that we have established adequate reserves to the extent that such risks are not insured.
Title to Properties and Rights-of-Way
We believe that we have satisfactory title to all of our assets. Although title to such properties are subject to encumbrances in certain cases, such as customary interests generally retained in connection with acquisition of real property, liens related to environmental liabilities associated with historical
operations, liens for current taxes and other burdens and minor easements, restrictions and other encumbrances to which the underlying properties were subject at the time of acquisition by our predecessor or us, we believe that none of these burdens will materially detract from the value of such properties or from our interest therein or will materially interfere with their use in the operation of our business.
Substantially all of our pipelines are constructed on rights-of-way granted by the apparent record owners of such property and, in some instances, such rights-of-way are revocable at the election of the grantor. In many instances, lands over which rights-of-way have been obtained are subject to prior liens that have not been subordinated to the right-of-way grants. In some cases, not all of the apparent record owners have joined in the right-of-way grants, but in substantially all such cases, signatures of the owners of majority interests have been obtained. We have obtained permits from public authorities to cross over or under, or to lay facilities in or along water courses, county roads, municipal streets and state highways, and in some instances, such permits are revocable at the election of the grantor. We have also obtained permits from railroad companies to cross over or under lands or rights-of-way, many of which are also revocable at the grantor's election. In some cases, property for pipeline purposes was purchased in fee. All of the pump stations are located on property owned in fee or property under long-term leases. In certain states and under certain circumstances, we have the right of eminent domain to acquire rights-of-way and lands necessary for our common carrier pipelines.
Some of the leases, easements, rights-of-way, permits and licenses transferred to us, upon our formation in 1998 and in connection with acquisitions we have made since that time, required the consent of the grantor to transfer such rights, which in certain instances is a governmental entity. We believe that we have obtained such third party consents, permits and authorizations as are sufficient for the transfer to us of the assets necessary for us to operate our business in all material respects as described in this report. With respect to any consents, permits or authorizations that have not yet been obtained, we believe that such consents, permits or authorizations will be obtained within a reasonable period, or that the failure to obtain such consents, permits or authorizations will have no material adverse effect on the operation of our business.
To carry out our operations, our general partner or its affiliates employed approximately 1,950 employees at June 30,December 31, 2004. None of the employees of our general partner were represented by labor unions, and our general partner considers its employee relations to be good.
Export License Matter. In our gathering and marketing activities, we import and export crude oil from and to Canada. Exports of crude oil are subject to the short supply"short supply" controls of the Export Administration Regulations ("EAR") and must be licensed by the Bureau of Industry and Security (the "BIS") of the U.S. Department of Commerce.Commerce Department. In 2002, we determined that we may have exceededviolated the terms of our licenses with respect to the quantity of crude oil exports authorized by previous licenses.exported and the end-users in Canada. Export of crude oil in excess of theexcept as authorized amountsby license is a violation of the EAR. OnIn October 18, 2002, we submitted to the BIS an initial notification of voluntary disclosure. The BIS subsequently informed us that we could continue to export while previous exports were under review. We applied for and received aseveral new licenselicenses allowing for exports ofexport volumes and end users that more than adequately reflectingaccurately reflect our anticipated business and customer needs. We also conducted reviews of new and existing contracts and implemented new procedures and practices in order to monitor compliance with applicable laws regarding the export of crude oil to Canada. As a result, we subsequently submitted additional information to the BIS in October 2003 and May 2004. In August 2004, we received a request from the BIS for additional information. We willhave responded to this and subsequent requests, and continue to cooperate fully with the BIS in its inquiry.officials. At this time, we have received neither a warning letter nor a charging
letter, which could involve the imposition of penalties, and no indication whetherof what penalties the BIS intends to charge us with a violation of the EAR or, if so, what penalties would be assessed.might assess. As a result, we cannot reasonably estimate the ultimate impact of this matter.
Alfons Sperber v. Plains Resources Inc., et al. On December 18, 2003, a putative class action lawsuit was filed in the Delaware Chancery Court, New Castle County, entitled Alfons Sperber v. Plains Resources Inc., et al. This suit, brought on behalf of a putative class of Plains All American Pipeline, L.P. common unitholders, assertsasserted breach of fiduciary duty and breach of contract claims against us, Plains AAP, L.P., and Plains All American GP LLC and its directors, as well as breach of fiduciary duty claims against Plains Resources Inc. and its directors. (Plains Resources, Inc. is a unitholder and an interest owner in our general partner. See "Security Ownership of Certain Beneficial Owners and Management and Related Unitholders' Matters.") The complaint seekssought to enjoin or rescind a proposed acquisition of all of the outstanding stock of Plains Resources Inc., as well as declaratory relief, an accounting, disgorgement and the imposition of a constructive trust, and an award of damages, fees, expenses and costs, among other things. This lawsuit has been settled in principle, subjectprinciple. The court has approved the settlement and the settlement became final in March 2005.
Pipeline Releases. In December 2004 and January 2005, we experienced two unrelated releases of crude oil that reached rivers located near the sites where the releases originated. In late December 2004, one of our pipelines in West Texas experienced a rupture that resulted in the release of approximately 4,500 barrels of crude oil, a portion of which reached a remote location of the Pecos River. In early January 2005, an overflow from a temporary storage tank located in East Texas resulted in the release of approximately 1,200 barrels of crude oil, a portion of which reached the Sabine River. In both cases, emergency response personnel under the supervision of a unified command structure consisting of representatives of Plains Pipeline, the U.S. Environmental Protection Agency, the Texas Commission on Environmental Quality and the Texas Railroad Commission conducted clean-up operations at each site. Approximately 4,200 barrels and 980 barrels were recovered from the two respective sites. The unrecovered oil has been or will be removed or otherwise addressed by us in the course of site remediation. Aggregate costs associated with each release, including estimated remediation costs, are estimated at approximately $1.7 million and $1.4 million, respectively. We continue to work with the appropriate state and federal environmental authorities in responding to the preparationreleases and execution of appropriate settlement documentation and court approval.no enforcement proceedings have been instituted by any governmental authority at this time.
Other. We, in the ordinary course of business, are a claimant and/or a defendant in various other legal proceedings. We do not believe that the outcome of these other legal proceedings, individually and in the aggregate, will have a materially adverse effect on our financial condition, results of operations or cash flows.
In November 1999, we discovered that a former employee had engaged in unauthorized trading activity that resulted in significant losses and litigation and had a temporary, but material adverse impact on our liquidity and our relationship with our customers. A full investigation into the unauthorized trading activities by outside legal counsel and independent accountants and consultants determined that the vast majority of the losses occurred in 1999, but also extended into 1998 and required restatements of our financial statements for the applicable periods. Including litigation settlement costs, the aggregate losses associated with this event totaled approximately $181 million. All of the cases were settled and paid. Additionally, based on recommendations from experts involved in the investigation, we made significant enhancements to our systems, policies and procedures and developed and adopted a written policy document and manual of procedures designed to enhance our processes and procedures and improve our ability to detect any activity that might occur at an early stage. We can give no assurance that the above steps will serve to detect and prevent all violations of our trading policy; however, we believe that such steps substantially reduce the possibility of a recurrence of unauthorized trading activities, and that any material unauthorized trading that does occur would be detected at an early stage.
Partnership Management and Governance
As is the case with many publicly traded partnerships, we do not directly have officers, directors or employees. Our operations and activities are managed by the general partner of our general partner, Plains All American GP LLC, which employs our management and operational personnel.personnel (other than our Canadian personnel who are employed by PMC (Nova Scotia) Company). References to our general partner, unless the context otherwise requires, include Plains All American GP LLC. References to our officers, directors and employees are references to the officers, directors and employees of Plains All American GP LLC (or, in the case of our Canadian and LPG operations, PMC (Nova Scotia) Company).
Our general partner manages our operations and activities. Unitholders are limited partners and do not directly or indirectly participate in our management or operation. Our general partner owes a fiduciary duty to the unitholders, as limited by our partnership agreement. As a general partner, our general partner is liable for all of our debts (to the extent not paid from our assets), except for indebtedness or other obligations that are made specifically non-recourse to it. Whenever possible, our general partner intends to incur indebtedness or other obligations on a non-recourse basis.
Our partnership agreement provides that the general partner will manage and operate us and that, unlike holders of common stock in a corporation, unitholders will have only limited voting rights on matters affecting our business or governance. Specifically, our partnership agreement defines "Board of Directors" to mean the board of directors of Plains All American GP LLC, which is comprised of up to eight directors elected by the members of Plains All American GP LLC, and not by the unitholders. The four owners that hold 9% or greater of the outstanding membership interests of Plains All American GP LLC have the right to designate one director each, one director is the Chairman and CEO and three independent directors are elected by majority vote of the membership owners of Plains All American GP LLC. Thus, the corporate governance of Plains All American GP LLC is, in effect, the corporate governance of our partnership, subject in all cases to any specific unitholder rights contained in our partnership agreement. We currently have seven directors serving on the board of directors. One of the members of Plains All American GP LLC, Sable Investments, L.P., has the right at any time to designate an eighth director. Because we are a limited partnership, the new listing standards of the New York Stock Exchange do not require that we or our general partner have a majority of independent directors or a nominating or compensation committee of the board of directors.
Non-management directors meet in executive session in connection with each regular board meeting. Each non-management director acts as presiding director at the regularly scheduled executive sessions, rotating alphabetically by last name.
Interested parties can communicate directly with non-management directors by mail in care of Tim Moore, General Counsel and Secretary or Sharon Spurlin, Director of Internal Audit, Plains All American Pipeline, L.P., 333 Clay Street, Suite 1600, Houston, Texas 77002. Such communications should specify the intended recipient or recipients. Commercial solicitations or communications will not be forwarded.
We have an audit committee that reviews our external financial reporting, engages our independent auditors and reviews the adequacy of our internal accounting controls. The Board of Directors has determined that (i) each member of our audit committee is "independent" under applicable New York Stock Exchange Rules and (ii) that each member of our audit committee is an "Audit Committee Financial Expert," as that term is defined in Item 401 of Regulation S-K. The members of our audit committee and other committees are indicated in the table below.
In determining the independence of the members of our audit committee, the Board of Directors considered the relationships described below:
Mr. Everardo Goyanes, the Chairman of our Audit Committee, is the Chief Executive Officer of Liberty Energy Corporation ("LEC"), a subsidiary of Liberty Mutual Insurance Company. Mr. Goyanes is an employee of Liberty Mutual Insurance Company. LEC makes investments in producing properties, from some of which Plains Marketing, L.P. buys the production. LEC does not operate the properties in which it invests. Plains Marketing pays the same amount per barrel to LEC that it pays to other interest owners in the properties. In 2003,2004, the amount paid to LEC by Plains Marketing was approximately $1,085,000$1.1 million ($974,0001.0 million net of severance taxes),.
Mr. J. Taft Symonds, a member of our Audit Committee, is a director and the non-executive Chairman of the Board of Tetra Technologies, Inc. ("Tetra"). A subsidiary of Tetra owns crude oil producing properties, from some of which Plains Marketing buys the production. We paid approximately $7.9$11 million to the Tetra subsidiary in 2003.2004. Until July 2004, Mr. Symonds was also a director of Plains Resources Inc., with whom Plains Marketing has a marketing arrangement. We paid approximately $25.7$28.3 million to Plains Resources in 2003,2004, and recognized segment profit of approximately $0.2$0.1 million. Mr. Symonds was not and is not an officer of Tetra or Plains Resources,
and does not participate in operational decision-making,decision making, including decisions concerning selection of crude oil purchasers or entering into sales or marketing arrangements.
We have a compensation committee, which reviews and makes recommendations regarding the compensation for the executive officers and administers our equity compensation plans for officers and key employees. We also have a governance committee that is reviewing and revising our governance practices as appropriate in light of recent governance reform initiatives, which will periodically reviewreviews our governance guidelines. In addition, our partnership agreement provides for the establishment/activation of a conflicts committee as circumstances warrant to review conflicts of interest between us and our general partner or the owners of our general partner. Such committeesa committee would consist of a minimum of two members, none of which arewhom can be officers or employees of our general partner or directors, officers or employees of its affiliates.affiliates nor owners of the general partner's interest. Any matters approved by the conflicts committee will be conclusively deemed to be fair and reasonable to us, approved by all of our partners, and not a breach by our general partner of any duties owed to us or our unitholders.
Our committee charters and governance guidelines, as well as our Code of Business Conduct and our Code of Ethics for Senior Financial Officers, are available on our website at www.paalp.com.
Directors and Executive Officers
The following table sets forth certain information with respect to the executive officers and members of the Board of Directors of our general partner. Directors are elected annually thereafter.annually. Certain
owners of our general partner each have the right to separately designate a member of our board. Such designees are indicated in the footnote to the following table.
| Name | Age (as of 12/31/04) | Position with Our General Partner | ||
|---|---|---|---|---|
| Greg L. Armstrong(1) | 46 | Chairman of the Board, Chief Executive Officer and Director | ||
| Harry N. Pefanis | 47 | President and Chief Operating Officer | ||
| Phillip D. Kramer | 48 | Executive Vice President and Chief Financial Officer | ||
| George R. Coiner | Senior Group Vice President | |||
| W. David Duckett | 49 | President—PMC (Nova Scotia) Company | ||
| Mark F. Shires | 47 | Senior Vice President—Operations | ||
| Alfred A. Lindseth | 35 | Senior Vice President—Technology, Process & Risk Management | ||
| Lawrence J. Dreyfuss | 50 | Vice President, Associate General Counsel and Assistant Secretary; Vice President, General Counsel and Secretary of PMC (Nova Scotia) Company (the general partner of Plains Marketing Canada, L.P.) | ||
| James B. Fryfogle | Vice President— | |||
| Jim G. Hester | Vice President—Acquisitions | |||
| Tim Moore | 47 | Vice President, General Counsel and Secretary | ||
| Daniel J. Nerbonne | 47 | Vice President—Engineering | ||
| John F. Russell | Vice President—Pipeline Operations | |||
| Al Swanson | 40 | Vice President and Treasurer | ||
| Tina L. Val | 35 | Vice President—Accounting and Chief Accounting Officer | ||
| Troy E. Valenzuela | 43 | Vice President—Environmental, Health and Safety | ||
| John P. vonBerg | 50 | Vice President—Trading | ||
| David N. Capobianco(1) | 35 | Director and Member of Compensation Committee | ||
| Everardo Goyanes | 60 | Director and Member of Audit* Committee | ||
| Gary R. Petersen(1) | 58 | Director and Member of Compensation* Committee | ||
| Robert V. Sinnott(1) | 55 | Director and Member of Compensation Committee | ||
| Arthur L. Smith | 52 | Director and Member of Audit and Governance* Committees | ||
| J. Taft Symonds | 65 | Director and Member of Governance and Audit Committees |
Table continued on following page.
Greg L. Armstrong has served as Chairman of the Board and Chief Executive Officer since our formation. He has also served as a director of our general partner or former general partner since our formation. In addition, he was President, Chief Executive Officer and director of Plains Resources Inc. from 1992 to May 2001. He previously served Plains Resources as: President and Chief Operating Officer from October to December 1992; Executive Vice President and Chief Financial Officer from June to October 1992; Senior Vice President and Chief Financial Officer from 1991 to 1992; Vice
President and Chief Financial Officer from 1984 to 1991; Corporate Secretary from 1981 to 1988; and Treasurer from 1984 to 1987. Mr. Armstrong is also a director of Varco International, Inc.
Harry N. Pefanis has served as President and Chief Operating Officer since our formation. He was also a director of our former general partner. In addition, he was Executive Vice President—Midstream of Plains Resources from May 1998 to May 2001. He previously served Plains Resources as: Senior Vice President from February 1996 until May 1998; Vice President—Products Marketing from 1988 to February 1996; Manager of Products Marketing from 1987 to 1988; and Special Assistant for Corporate Planning from 1983 to 1987. Mr. Pefanis was also President of several former midstream subsidiaries of Plains Resources until our formation in 1998.
Phillip D. Kramer has served as Executive Vice President and Chief Financial Officer since our formation. In addition, he was Executive Vice President and Chief Financial Officer of Plains Resources from May 1998 to May 2001. He previously served Plains Resources as: Senior Vice President and Chief Financial Officer from May 1997 until May 1998; Vice President and Chief Financial Officer from 1992 to 1997; Vice President from 1988 to 1992; Treasurer from 1987 to March 2001; and Controller from 1983 to 1987.
George R. Coiner has served as Senior Group Vice President since February 2004 and as Senior Vice President from our formation to February 2004. In addition, he was Vice President of Plains Marketing & Transportation Inc., a former midstream subsidiary of Plains Resources from November 1995 until our formation in 1998. Prior to joining Plains Marketing & Transportation Inc., he was Senior Vice President, Marketing with Scurlock Permian Corp.
W. David Duckett has been President of PMC (Nova Scotia) Company since June 2003, and Executive Vice President of PMC (Nova Scotia) Company from July 2001 to June 2003. Mr. Duckett was previously with CANPET Energy Group Inc. since 1985, where he served in various capacities, including most recently as President, Chief Executive Officer and Chairman of the Board.
Mark F. Shires has served as Senior Vice President—Operations since June 2003 and as Vice President—Operations from August 1999 to June 2003. He served as Manager of Operations from April 1999 to August 1999. In addition, he was a business consultant from 1996 until April 1999. He served as a consultant to Plains Marketing & Transportation Inc. and Plains All American Pipeline, LP from May 1998 until April 1999. He previously served as President of Plains Terminal & Transfer Corporation, a former midstream subsidiary of Plains Resources, from 1993 to 1996.
Alfred A. Lindseth has served as Senior Vice President—Technology, Process & Risk Management since June 2003 and as Vice President—Administration from March 2001 to June 2003. He served as Risk Manager from March 2000 to March 2001. He previously served PricewaterhouseCoopers LLP in
its Financial Risk Management Practice section as a Consultant from 1997 to 1999 and as Principal Consultant from 1999 to March 2000. He also served GSC Energy, an energy risk management brokerage and consulting firm, as Manager of its Oil & Gas Hedging Program from 1995 to 1996 and as Director of Research and Trading from 1996 to 1997.
Lawrence J. Dreyfuss has served as Vice President, Associate General Counsel and Assistant Secretary of our general partner since February 2004 and as Associate General Counsel and Assistant Secretary of our general partner from June 2001 to February 2004 and held a senior management position in the Law Department since May 1999. In addition, he was a Vice President of Scurlock Permian LLC from 1987 to 1999.
James B. Fryfogle has served as a Vice President (currently Vice President—Lease OperationsRefinery Supply) since July 2004. Prior to joining PAAus in January 2004, Mr. Fryfogle served as Manager of Crude Supply and Trading for Marathon Ashland Petroleum. Mr. Fryfogle had held numerous positions of increasing responsibility with Marathon Ashland Petroleum or its affiliates or predecessors since 1975.
Jim G. Hester has served as Vice President—Acquisitions since March 2002. Prior to joining us, Mr. Hester was Senior Vice President—Special Projects of Plains Resources. From May 2001 to December 2001, he was Senior Vice President—Operations for Plains Resources. From May 1999 to May 2001, he was Vice President—Business Development and Acquisitions of Plains Resources. He was Manager of Business Development and Acquisitions of Plains Resources from 1997 to May 1999, Manager of Corporate Development from 1995 to 1997 and Manager of Special Projects from 1993 to 1995. He was Assistant Controller from 1991 to 1993, Accounting Manager from 1990 to 1991 and Revenue Accounting Supervisor from 1988 to 1990.
Tim Moore has served as Vice President, General Counsel and Secretary since May 2000. In addition, he was Vice President, General Counsel and Secretary of Plains Resources from May 2000 to May 2001. Prior to joining Plains Resources, he served in various positions, including General Counsel—Corporate, with TransTexas Gas Corporation from 1994 to 2000. He previously was a corporate attorney with the Houston office of Weil, Gotshal & Manges LLP. Mr. Moore also has seven years of energy industry experience as a petroleum geologist.
John F. Russell has served as Vice President—Pipeline Operations since July 2004. Prior to joining PAA, Mr. Russell served as Vice President of Business Development & Joint Interest for ExxonMobil Pipeline Company. Mr. Russell had held numerous positions of increasing responsibility with ExxonMobil Pipeline Company or its affiliates or predecessors since 1974.
Daniel J. Nerbonne has served as Vice President—Engineering since February 2005. Prior to joining us, Mr. Nerbonne was General Manager of Portfolio Projects for Shell Oil Products US from January 2004 to January 2005 and served in various capacities, including General Manager of Commercial and Joint Interest, with Shell Pipeline Company or its predecessors from 1998. From 1980 to 1998 Mr. Nerbonne held numerous positions of increasing responsibility in engineering, operations, and business development, including Vice President of Business Development from December 1996 to April 1998, with Texaco Trading and Transportation or its affiliates.
Al Swanson has served as Vice President and Treasurer since February 2004 and as Treasurer from May 2001 to February 2004. In addition, he held several finance-relatedfinance related positions at Plains Resources including Treasurer from February 2001 to May 2001 and Director of Treasury from November 2000 to February 2001. Prior to joining Plains Resources, he served as Treasurer of Santa Fe Snyder Corporation from 1999 to October 2000 and in various capacities at Snyder Oil Corporation including Director of Corporate Finance from 1998, Controller—SOCO Offshore, Inc. from 1997, and Accounting Manager from 1992. Mr. Swanson began his career with Apache Corporation in 1986 serving in internal audit and accounting.
Tina L. Val has served as Vice President—Accounting and Chief Accounting Officer since June 2003. She served as Controller from April 2000 until she was elected to her current position. From January 1998 to January 2000, Ms. Val served as a consultant to Conoco de Venezuela S.A. She previously served as Senior Financial Analyst for Plains Resources from October 1994 to July 1997.
Troy E. Valenzuela has served as Vice President—Environmental, Health and Safety, or EH&S, since July 2002, and has had oversight responsibility for the environmental, safety and regulatory compliance efforts of us and our predecessors for the last 12 years. He was Director of EH&S with Plains Resources from January 1996 to June 2002, and Manager of EH&S from July 1992 to
December 1995. Prior to his time with Plains Resources, Mr. Valenzuela spent seven years with Chevron USA Production Company in various EH&S roles.
John P. vonBerg has served as Vice President of Trading since May 2003 and Director of these activities since joining us in January of 2002. He was with Genesis Energy in differing capacities as a Director, Vice Chairman, President and CEO from 1996 through 2001, and from 1993 to 1996 he
served as a Vice President and a Crude Oil Manager for Phibro Energy USA. Mr. VonBerg began his career with Marathon Oil Company, spending 13 years in various disciplines.
David N. Capobianco has served as a director of our general partner since July 2004. Mr. Capobianco is a memberChairman of the board of directors of Vulcan Energy Corporation and a Managing Director of Vulcan Capital, an affiliate of Vulcan Inc., where he has been employed since April 2003. Previously, he served as a Vice President of Greenhill Capital from July 2001 to April 2003 and a Vice President of Harvest Partners from July 1995 to January 2001. Mr. Capobianco holds a BA in economics from Duke University and an MBA from Harvard Business School.
Everardo Goyanes has served as a director of our general partner or former general partner since May 1999. Mr. Goyanes has been President and Chief Executive Officer of Liberty Energy Holdings LLC (an energy investment firm) since May 2000. From 1999 to May 2000, he was a financial consultant specializing in natural resources. From 1989 to 1999, he was Managing Director of the Natural Resources Group of ING Barings Furman Selz (a banking firm). He was a financial consultant from 1987 to 1989 and was Vice President—Finance of Forest Oil Corporation from 1983 to 1987. Mr. Goyanes received a BA in Economics from Cornell University and a Masters degree in Finance (honors) from Babson Institute.
Gary R. Petersen has served as a director since June 2001. Mr. Petersen co-founded EnCap Investments L.P. (an investment management firm) and has been a Managing Director and principal of the firm since 1988. He had previously served as Senior Vice President and Manager of the Corporate Finance Division of the Energy Banking Group for RepublicBank Corporation. Prior to his position at RepublicBank, he was Executive Vice President and a member of the Board of Directors of Nicklos Oil & Gas Company in Houston, Texas from 1979 to 1984. He served from 1970 to 1971 in the U.S. Army as a First Lieutenant in the Finance Corps and as an Army Officer in the National Security Agency. He is also a director of Equus II Incorporated.
John T. Raymond has served as a director since June 2001. He has been a director and the Chief Executive Officer of Vulcan Energy Corporation since July 2004. Mr. Raymond has served as President and Chief Executive Officer of Plains Resources since December 2002. Prior thereto, Mr. Raymond served as Executive Vice President and Chief Operating Officer of Plains Resources from May 2001 to November 2001 and President and Chief Operating Officer since November 2001. Mr. Raymond also served as President and Chief Operating Officer of Plains Exploration and Production from December 2002 to March 2004. He was Director of Corporate Development of Kinder Morgan, Inc. from January 2000 to May 2001. He served as Vice President of Corporate Development of Ocean Energy, Inc. from April 1998 to January 2000. He was Vice President of Howard Weil Labouisse Friedrichs, Inc. from 1992 to April 1998.
Robert V. Sinnott has served as a director of our general partner or former general partner since September 1998. Mr. Sinnott has been a Senior Managing Directorserves as the President and Chief Investment Officer of Kayne Anderson Capital Advisors, L.P. (an investment management firm) since 1996, and was a, where he has served in various capacities, including Senior Managing Director from 1992 to 1996.and Managing Director, since 1992. He is also a vice president of Kayne Anderson Investment Management, Inc., the general partner of Kayne Anderson Capital Advisors, L.P. He was Vice President and Senior Securities Officer of the Investment Banking Division of Citibank from 1986 to 1992. He is also a director of Glacier Water Services, Inc. (a vended water company). Mr. Sinnott was previously a director of Plains Resources.
Arthur L. Smith has served as a director of our general partner or former general partner since February 1999. Mr. Smith is Chairman and CEO of John S. Herold, Inc. (a petroleum research and consulting firm), a position he has held since 1984. From 1976 to 1984 Mr. Smith was a securities analyst with Argus Research Corp., The First Boston Corporation and Oppenheimer & Co., Inc. Mr. Smith has prior public board experience with Pioneer Natural Resources, Cabot Oil & Gas Corporation and Evergreen Resources, Inc. Mr. Smith holds the CFA designation. He serves on the board of non-profit Dress for Success Houston and the Board of Visitors for the Duke Nicholas School of the Environment and Earth Sciences. Mr. Smith received a BA from Duke University and an MBA from NYU's Stern School of Business.
J. Taft Symonds has served as a director since June 2001. Mr. Symonds is Chairman of the Board of Symonds Trust Co. Ltd. (an investment firm) and Chairman of the Board of Tetra Technologies, Inc. (an oilfield services firm). From 1978 to 2004 he was Chairman of the Board and Chief Financial Officer of Maurice Pincoffs Company, Inc. (an international marketing firm). Mr. Symonds was previously a director of Plains Resources. Mr. Symonds has a background in both investment and commercial banking, including merchant banking in New York, London and Hong Kong with Paine Webber Jackson & Curtis, Robert Fleming Group and Banque de la Societe Financiere Europeenne. He is a director of Intercorr International and President of the Houston Arboretum and Nature Center. Mr. Symonds received a BA from Stanford University and an MBA from Harvard.
Management Team/Canadian Officers
The following table sets forth certain information with respect to other members of our management team and officers of the general partner of our Canadian operating partnership:partnership.
| Name | Age (as of 12/31/04) | Position with Our General Partner/ | |||
|---|---|---|---|---|---|
| Management | |||||
A. Patrick Diamond | Manager—Special Projects | ||||
Canadian Officers: | |||||
D. Mark Alenius | 45 | Vice President and Chief Financial Officer of PMC (Nova Scotia) Company | |||
Stephen L. Bart | 44 | Vice President—Operations of PMC (Nova Scotia) Company | |||
| Ralph R. Cross | 49 | Vice President—Business Development of PMC (Nova Scotia) Company | |||
M.D. (Mike) Hallahan | Vice President—Crude Oil of PMC (Nova Scotia) Company | ||||
Richard (Rick) Henson | 50 | Vice President—Corporate Services of PMC (Nova Scotia) Company | |||
| Ron F. Wunder | 36 | Vice President—LPG of PMC (Nova Scotia) Company | |||
A. Patrick Diamond has served as Manager—Special Projects since June 2001. In addition, he was Manager—Special Projects of Plains Resources from August 1999 to June 2001. Prior to joining Plains Resources, Mr. Diamond served Salomon Smith Barney Inc. in its Global Energy Investment Banking Group as an Associate from July 1997 to May 1999 and as a Financial Analyst from July 1994 to June 1997.
D. Mark Alenius has served as Vice President and Chief Financial Officer of PMC (Nova Scotia) Company since November 2002. In addition, Mr. Alenius was Managing Director, Finance of PMC (Nova Scotia) Company from July 2001 to November 2002. Mr. Alenius was previously with CANPET Energy Group Inc. where he served as Vice President, Finance, Secretary and Treasurer, and was a member of the Board of Directors. Mr. Alenius joined CANPET in February 2000. Prior to joining
CANPET Energy, Mr. Alenius briefly served as Chief Financial Officer of Bromley-Marr ECOS Inc., a manufacturing and processing company, from January to July 1999. Mr. Alenius was previously with Koch Industries, Inc.'s Canadian group of businesses, where he served in various capacities, including most recently as Vice-President, Finance and Chief Financial Officer of Koch Pipelines Canada, Ltd.
Stephen L. Bart has been Vice President, Operations of PMC (Nova Scotia) Company since April 2005 and was Managing Director, LPG Operations & Engineering from February to April 2005. From June 2003 to February 2005, Mr. Bart was engaged as a principal of Broad Quay Development, a consulting firm. From April 2001 to June 2003, Mr. Bart served as Chief Executive Officer of Novera Energy Limited, a publicly-traded international renewable energy concern. From January 2000 to April 2003, he served as Director, Northern Development, for Westcoast Energy Inc.
Ralph R. Cross has been Vice President of Business Development of PMC (Nova Scotia) Company since July 2001. Mr. Cross was previously with CANPET Energy Group Inc. since 1992, where he served in various capacities, including most recently as Vice President of Business Development.
Ronald H. Gagnon has been Vice President, Operations of PMC (Nova Scotia) Company since January 2004, Managing Director, Information and Transportation Services from June 2003 to January 2004 and Director, Information Services from July 2001 to May 2003. Mr. Gagnon was previously with CANPET Energy Group Inc. since 1987, where he served in various capacities, including Vice President, Producer Services.
M.D. (Mike) Hallahan has served as Vice President, Crude Oil of PMC (Nova Scotia) Company since February 2004 and Managing Director, Facilities from July, 2001 to February, 2004. He was
previously with CANPET Energy Group inc.Inc. where he served in various capacities since 1996, most recently General Manager, Facilities.
Richard (Rick) Henson joined PMC (Nova Scotia) Company in December 2004 as Vice President of Corporate Services. Mr. Henson was previously with Nova Chemicals Corporation, serving in various executive positions from 1999 through 2004, including Vice President, Petrochemicals and Feedstocks, and Vice President, Ethylene and Petrochemicals Business.
Ron F. Wunder has served as Vice President, LPG of PMC (Nova Scotia) Company since February 2004 and as Managing Director, Crude Oil from July 2001 to February 2004. He was previously with CANPET Energy Group Inc. since 1992, where he served in various capacities, including most recently as General Manager, Crude Oil.
The following table sets forth certain compensation information for our Chief Executive Officer and the four other most highly compensated executive officers in 20032004 (the "Named Executive Officers"). Messrs. Armstrong, Pefanis and Kramer were compensated by Plains Resources prior to July 2001. However, weWe reimburse our general partner and its affiliates (and, for a portion of 2001, we reimbursed our former general partner and its affiliates, which included Plains Resources) for expenses incurred on our behalf, including the costs of officer compensation allocable to us.compensation. The Named Executive Officers have also received certain equity-based awards from our general partner, and from our former general partner and its affiliates, which awards (other than awards under the Long-Term Incentive Plan)Plans) are not subject to reimbursement by us. See "—Long-Term Incentive Plan" and "Certain Relationships and Related Transactions—Transactions with Related Parties."
| | | Annual Compensation | Long-Term Compensation | |||||||||||
|---|---|---|---|---|---|---|---|---|---|---|---|---|---|---|
| Name and Principal Position | | | | Other Compensation | ||||||||||
| Year | Salary | Bonus | LTIP Payout | |||||||||||
| Greg L. Armstrong Chairman and CEO | 2003 2002 2001 | $ | 330,000 330,000 165,000 | (1) | $ | 1,000,000 600,000 450,000 | $ | 12,000 11,000 | (2) (2) (1)(2) | $ | — | |||
| Harry N. Pefanis President and COO | 2003 2002 2001 | $ | 235,000 235,000 117,500 | (1) | $ | 800,000 475,000 350,000 | $ | 12,000 11,000 | (2) (2) (1)(2) | $ | 452,400 | |||
| Phillip D. Kramer Executive V.P. and CFO | 2003 2002 2001 | $ | 200,000 200,000 100,000 | (1) | $ | 500,000 275,000 100,000 | $ | 12,000 11,000 | (2) (2) (1)(2) | $ | — | |||
| George R. Coiner Senior Vice President | 2003 2002 2001 | $ | 200,000 200,000 175,000 | $ | 719,600 451,000 430,100 | (3) (4) (5) | $ | 12,000 11,000 10,500 | (2) (2) (2) | $ | 226,200 | |||
| W. David Duckett(6) President—PMC (Nova Scotia Company) | 2003 2002 2001 | $ | 190,658 163,891 80,020 | $ | 724,883 270,070 15,182 | $ | — — — | $ | — — — | |||||
Table continued on following page.
| Long-Term Compensation | ||||||||||||||
|---|---|---|---|---|---|---|---|---|---|---|---|---|---|---|
| Annual Compensation | ||||||||||||||
| Name and Principal Position | All Other Compensation | |||||||||||||
| Year | Salary | Bonus | LTIP Payout | |||||||||||
| Greg L. Armstrong Chairman and CEO | 2004 2003 2002 | $ | 330,000 330,000 330,000 | $ | 1,800,000 1,000,000 600,000 | $ | 1,692,600 — — | $ | 13,930(1) 12,930 11,930 | |||||
Harry N. Pefanis President and COO | 2004 2003 2002 | $ | 235,000 235,000 235,000 | $ | 1,500,000 800,000 475,000 | $ | 1,674,600 452,400 — | $ | 13,875(1) 12,875 11,875 | |||||
Phillip D. Kramer Executive V.P. and CFO | 2004 2003 2002 | $ | 200,000 200,000 200,000 | $ | 850,000 500,000 275,000 | $ | 1,209,000 — — | $ | 13,745(1) 12,745 11,745 | |||||
George R. Coiner Senior Group Vice President | 2004 2003 2002 | $ | 200,000 200,000 200,000 | $ | 1,061,000(2) 719,600(2) 451,000(2) | $ | 1,643,138 226,200 — | $ | 13,730(1) 12,730 11,651 | |||||
W. David Duckett(3) President—PMC (Nova Scotia Company) | 2004 2003 2002 | $ | 204,161 190,658 163,891 | $ | 933,505(4) 724,883(4) 270,070(4) | $ | — — — | $ | 26,541(5) — — | |||||
Employment Contracts and Termination of Employment and Change-in-Control Arrangements
Messrs. Armstrong and Pefanis have employment agreements with our general partner. Mr. Armstrong is employed as Chairman and Chief Executive Officer. The initial three-year term of Mr. Armstrong's employment agreement expiredcommenced on June 30, 2004, but was2001, and is automatically extended for one year in accordance with the agreement. The term will be automatically extended by one year on June 30 of each year (such that the term is reset to three years) unless Mr. Armstrong receives notice from the Chairman of the Compensation Committee that the Board of Directors has elected not to extend the agreement. Mr. Armstrong has agreed, during the term of the agreement and for five years thereafter, not to disclose (subject to typical exceptions) any confidential information obtained by him while employed under the agreement. The agreement providesprovided for a current base salary of $330,000 per year, subject to annual review. In February 2005, the annual salary was increased to $375,000. If Mr. Armstrong's employment is terminated without cause, he will be entitled to receive an amount equal to his annual base salary plus his highest annual bonus, multiplied by the lesser of (i) the number of years (including fractional years) remaining on the agreement and (ii) two. If Mr. Armstrong terminates his employment as a result of a change in control he will be entitled to receive an amount equal to three times the aggregate of his annual base salary and highest annual bonus. Under Mr. Armstrong's agreement, a "change of control" is defined to include (i) the acquisition by an entity or group (other than Plains Resources and its wholly owned subsidiaries) of 50% or more of our general partner or (ii) the existing owners of our general partner ceasing to own more than 50% of our general partner. If Mr. Armstrong's employment is terminated because of his death, a lump sum payment will be paid to his designee equal to his annual salary plus his highest annual bonus, multiplied by the lesser of (i) the number of years (including fractional years) remaining on the agreement and (ii) two. Under the agreement, Mr. Armstrong will be reimbursed for any excise tax due as a result of compensation (parachute) payments.
Mr. Pefanis is employed as President and Chief Operating Officer. The initial three-year term of Mr. Pefanis' employment agreement expiredcommenced on June 30, 2004, but was2001, and is automatically extended for one year in accordance with the agreement. The term will be automatically extended by one year on June 30 of each year (such that the term is reset to three years) unless Mr. Pefanis receives notice from the Chairman of the Board of Directors that the Board has elected not to extend the agreement. Mr. Pefanis has agreed, during the term of the agreement and for one year thereafter, not to disclose (subject to typical exceptions) any confidential
information obtained by him while employed under the agreement. The agreement providesprovided for a current base salary of $235,000 per year, subject to annual review. In February 2005, the annual salary was increased to $300,000. The provisions in
Mr. Pefanis' agreement with respect to termination, change in control and related payment obligations are substantially similar to the parallel provisions in Mr. Armstrong's agreement.
Our general partner has adopted the Plains All American GP LLC 1998 Long-Term Incentive Plan (the "LTIP""1998 LTIP") for employees and directors of our general partner and its affiliates who perform services for us. Awards contemplated by the 1998 LTIP include phantom units and unit options. The LTIP consists of two components, a restricted ("phantom") unit plan and a unit option plan. The1998 LTIP currently permits the grant of phantom units and unit options covering an aggregate of 1,425,000 common units delivered upon vesting of such phantom units or unit options. No options have been granted under the plan. The plan is administered by the compensation committeeCompensation Committee of our general partner's board of directors. Our general partner's board of directors in its discretion may terminate the LTIP at any time with respect to any common units for which a grant has not yet been made. Our general partner's board of directors also has the right to alter or amend the 1998 LTIP or any part of the plan from time to time, including, subject to any applicable NYSE listing requirements, increasing the number of common units with respect to which awards may be granted; provided, however, that no change in any outstanding grant may be made that would materially impair the rights of the participant without the consent of such participant.
Restricted Unit Plan. A restricted unit is a "phantom" unit that entitles the grantee to receive, upon the vesting of the phantom unit, a common unit (or cash equivalent, depending on the terms of the grant). As discussed in more detail below, a substantial number of phantom units have vested in 2003 and 2004. As of September 30, 2004, giving effect to vested grants, grants of approximately 134,000 unvested phantom units remain outstanding to employees, officers and directors of our general partner. The compensation committee may, in the future, make additional grants under the plan to employees and directors containing such terms as the compensation committee shall determine.
If a grantee terminates employment or membership on the board for any reason, the grantee's phantom units will be automatically forfeited unless, and to the extent, the compensation committee provides otherwise. Vested phantom units may be satisfied in common units or cash equivalents. Common units to be delivered upon the vesting of rights may be common units acquired by our general partner in the open market or in private transactions, common units already owned by our general partner, or any combination of the foregoing. Our general partner will be entitled to reimbursement by us for the cost incurred in acquiring common units. In addition, over the term of the plan we may issue up to 975,000 new common units to satisfy delivery obligations under the grants, less any common units issued upon exercise of unit options under the plan (see below).grants. When we issue new common units upon vesting of the phantom units,grants, the total number of common units outstanding increases.
Phantom Units. A phantom unit entitles the grantee to receive, upon the vesting of the phantom unit, a common unit (or cash equivalent, depending on the terms of the grant). A substantial number of phantom units have vested in 2003 and 2004. As of December 31, 2004, giving effect to vested grants, grants of approximately 134,000 unvested phantom units under the 1998 LTIP remain outstanding to employees, officers and directors of our general partner. The compensation committee,Compensation Committee may, in its discretion, may grantthe future, make additional grants under the plan to employees and directors containing such terms as the Compensation Committee shall determine, including tandem distribution equivalent rights with respect to phantom units.
Other than grants to directors (discussed below), none of the phantom units vested until November 2003. Since that time, approximately 927,000 phantom units have vested. Approximately 381,000Including grants to directors, approximately 418,000 units werehave been purchased and delivered or issued in satisfaction of those phantom units,vesting, after payment of cash-equivalents and netting for taxes. As a result of the vesting of these awards, we recognized an expense of approximately $28.8 million as of December 31,during 2003 and an additional expense of approximately $4.2$7.9 million as of June 30,during 2004.
The issuance of the common units pursuant to the restricted unit planupon vesting of phantom units is primarily intended to serve as a means of incentive compensation for performance. Therefore, no consideration is paid to us by the plan participants upon receipt of the common units.
In 2000, the three non-employee directors of our former general partner (Messrs. Goyanes, Sinnott and Smith) were each granted 5,000 phantom units. These units vested and were paid in connection
with the transfer of the general partner interest in 2001. Additional grantsGrants of 5,000 phantom units were made in 2002 to each non-employee director of our general partner. These units vest and are payable in 25% increments on each anniversary of June 8, 2001. The first three vestings took place on June 8 of 2002, 2003 and 2004. SeeFor further information on grants to directors, see "—Compensation of Directors."
The following table shows the vesting of phantom units granted under the 1998 LTIP to the Named Executive Officers.
| | | | | | | Remaining Unvested Grants(2) | |||||||||||||||||||||||||||||||||||||
|---|---|---|---|---|---|---|---|---|---|---|---|---|---|---|---|---|---|---|---|---|---|---|---|---|---|---|---|---|---|---|---|---|---|---|---|---|---|---|---|---|---|---|---|
| | | November 2003 Vesting | February 2004 Vesting | May 2004 Vesting | August 2004 Vesting | Remaining Unvested Grants(2) | | 2003 Vesting | 2004 Vesting | ||||||||||||||||||||||||||||||||||
| Name | Total Units | Total Units | |||||||||||||||||||||||||||||||||||||||||
| Units | Value(1) | Units | Value(1) | Units | Value(1) | Units | Value(1) | Units | Value(3) | Units | Value(1) | Units | Value(1) | Units | Value(3) | ||||||||||||||||||||||||||||
| Greg L. Armstrong | 70,000 | — | — | 17,500 | $ | 551,250 | 17,500 | $ | 580,650 | 17,500 | 560,700 | 17,500 | $ | 629,650 | 70,000 | — | — | 52,500 | $ | 1,692,600 | 17,500 | $ | 660,450 | ||||||||||||||||||||
| Harry N. Pefanis | 70,000 | 15,000 | $ | 452,400 | 47,500 | $ | 1,511,550 | 2,500 | $ | 82,950 | 2,500 | 80,100 | 2,500 | $ | 89,950 | 70,000 | 15,000 | $ | 452,400 | 52,500 | $ | 1,674,600 | 2,500 | $ | 94,350 | ||||||||||||||||||
| Phillip D. Kramer | 50,000 | — | — | 12,500 | $ | 393,750 | 12,500 | $ | 414,750 | 12,500 | 400,500 | 12,500 | $ | 449,750 | 50,000 | — | — | 37,500 | $ | 1,209,000 | 12,500 | $ | 471,750 | ||||||||||||||||||||
| George R. Coiner | 67,500 | 7,500 | $ | 226,200 | 31,875 | $ | 1,028,869 | 9,375 | $ | 311,063 | 9,375 | 300,375 | 9,375 | $ | 337,313 | 67,500 | 7,500 | $ | 226,200 | 50,625 | $ | 1,643,138 | 9,375 | $ | 353,813 | ||||||||||||||||||
| W. David Duckett | — | — | — | — | — | — | — | — | — | — | — | — | — | — | — | — | — | — | |||||||||||||||||||||||||
Unit Option Plan. The unit option plan under our 1998 LTIP currently permits the grant of options covering common units. No grants have been made under the unit option plan to date.
However, the compensation committeeCompensation Committee may, in the future, make grants under the plan to employees and directors containing such terms as the committee shall determine, provided that unit options have an exercise price equal to the fair market value of the units on the date of grant.
Upon exerciseIn January 2005, our unitholders approved the 2005 Plains All American GP LLC Long-Term Incentive Plan (the "2005 LTIP"). The 2005 LTIP provides for awards to our employees and directors. Awards contemplated by the 2005 LTIP include phantom units, restricted units, unit appreciation rights and unit options, as determined by the Compensation Committee (each an "Award"). Up to 3,000,000 units may be issued in satisfaction of Awards. Certain Awards may also include, in the discretion of the Compensation Committee, a "distribution equivalent right," or "DER," that entitles the grantee to a cash payment, either while the Award is outstanding or upon vesting, equal to any cash distributions paid on a unit option, our general partnerwhile the Award is outstanding.
Common units to be delivered upon the vesting of rights may deliverbe common units acquired by itour general partner in the open market or in private transactions, or use common units already owned by our general partner, or any combination of the foregoing. In addition, we may issue up to 975,000 new common units to satisfy delivery obligations under the grants, less any common units issued upon vesting of restricted units under the plan. Our general partner will be entitled to reimbursement by us for the difference between the cost incurred by our general partner in acquiring suchcommon units. In addition, over the term of the plan we may issue new common units andto satisfy delivery obligations under the proceeds received by our general partner from an optionee at the time of exercise. Thus, the cost of the unit options will be borne by us. Ifgrants. When we issue new common units upon exercisevesting of the unit options,grants, the total number of common units outstanding increases.
The Compensation Committee and Board of Directors have approved grants under the 2005 LTIP of phantom units with associated DERs to the Named Executive Officers as follows: Mr. Armstrong—300,000 phantom units; Mr. Pefanis—200,000 phantom units; Mr. Kramer—100,000 phantom units; Mr. Coiner—80,000 phantom units; and Mr. Duckett—75,000 phantom units. The phantom units for Messrs Armstrong and Pefanis will increase,vest incrementally solely upon achievement by the Partnership of annualized distributions of $2.60, $2.80 and our general partner$3.00 per unit and continued employment of at least 2, 4 and 5 years, respectively and any phantom units unvested after seven years will remitbe forfeited. The phantom units granted to Messrs Kramer, Coiner and Duckett are also subject to incremental vesting upon attainment of similar distribution thresholds and similar minimum years of continued employment, provided however that any remaining unvested units will fully vest after six years.
The issuance of the common units upon vesting of phantom units is primarily intended to serve as a means of incentive compensation for performance. Therefore, no consideration is paid to us by the proceeds received by it from the optioneeplan participants upon exercisereceipt of the unit option.common units.
Certain other employees and officers have also received grants of equity not associated with the LTIPLTIP's described above, and for which we have no direct cost or reimbursement obligations. For example, in 2001 our general partner maintainsestablished a Performance Option Plan funded by common units owned by the general partner. See "Certain Relationships and Related Transactions—Transactions with Related Parties."
New tax rules concerning deferred compensation became effective January 1, 2005. We intend to operate all of our equity plans, and make any amendments thereto that may be necessary, for the plans and awards granted thereunder to comply with this new law.
Each director of our general partner who is not an employee of our general partner is reimbursed for any travel, lodging and other out-of-pocket expenses related to meeting attendance or otherwise related to service on the board (including, without limitation, reimbursement for continuing education expenses). Each non-employee director is currently paid an annual retainer fee of $45,000, plus reimbursement for out-of-pocket expenses related to meeting attendance.$45,000. In 2001, Messrs. Goyanes and Smith each received $10,000 for their service on a special committee of the Board of Directors of our former general partner. Mr. Armstrong is otherwise compensated for his services as an employee and therefore receives no separate compensation for his services as a director. Each committee chairman (other than the Audit Committee) receives $2,000
annually. The chairman of the Audit Committee receives $30,000 annually, and the other members of the Audit Committee receive $15,000 annually. Mr. Petersen assigns any compensation he receives in his capacity as a director to EnCap Energy Capital Fund III, L.P. (EnCap III), which is controlled by EnCap Investments L.P., of which Mr. Petersen is a Managing Director. Mr. Capobianco assigns any compensation he receives in his capacity as a director to Vulcan Capital.
In 2000, Messrs. Goyanes, Sinnott and Smith,Except as directors of our former general partner,described below, each non-employee director has received a grantan LTIP award of 5,000 phantom units each under our LTIP. The phantomin the aggregate. These units vested and were paidvest annually in 2001 in connection with the consummation25% increments, subject to an automatic re-grant of the General Partner Transition. Each non-employeeamount vested, such that the director of our general partner received a grantwill always have outstanding an award of 5,000 phantom units in 2002.units. For Mr. Peterson and Mr. Capobianco, a cash equivalent payment will be made to EnCap III and Vulcan Capital, respectively, upon any vesting. The units vest in full upon the death or disability (as determined by the board) of the director. For any "independent" directors (as defined in the Third Amended and are payableRestated Limited Liability Company Agreement of Plains All American GP LLC, as amended, and currently including Messrs. Goyanes, Smith and Symonds), the units will also vest full if such director (i) retires (no longer with full-time employment and no longer serving as an officer or director of any public company) or (ii) is removed from the Board or is not reelected to the Board, unless such removal or failure to reelect is for "good cause," as defined in 25% increments annually on each anniversary of June 8, 2001.the letter granting the phantom units.
Reimbursement of Expenses of Our General Partner and its Affiliates
We do not pay our general partner a management fee, but we do reimburse our general partner for all expenses incurred on our behalf, including the costs of employee, officer and director compensation and benefits, as well as all other expenses necessary or appropriate to the conduct of our business. Our partnership agreement provides that our general partner will determine the expenses that are allocable to us in any reasonable manner determined by our general partner in its sole discretion. Prior to July 1, 2001, an allocation was made for overhead associated with officers and employees who divided time between us and Plains Resources. As a result of the transfer of the general partner interest (and related transactions) in 2001, all of the employees and officers of the general partner devote 100% of their efforts to our business and there are no allocated expenses. See "Certain Relationships and Related Transactions."
SECURITY OWNERSHIP OF CERTAIN BENEFICIAL OWNERS AND
MANAGEMENT AND RELATED UNITHOLDERS' MATTERS
Beneficial Ownership of Limited Partner UnitsInterest
Our common units, Class B common units and Class C common units outstanding represent 98% of our equity (limited partner interest). The 2% general partner interest is discussed separately below under the caption "Beneficial Ownership of General Partner Interest." The following table sets forth the beneficial ownership of limited partner units held by beneficial owners of 5% or more of the units, by directors and Namedthe Chief Executive OfficersOfficer and the four other most highly compensated executive officers in 2004 (the "Named Executive Officers") of our general partner and by all directors and executive officers as a group as of September 30, 2004.April 27, 2005.
| Name of Beneficial Owner | Common Units | Percentage of Common Units | Class B Common Units | Percentage of Class B Units | Class C Common Units(12) | Percentage of Class C Common Units | Percentage of Total Limited Partner Units(3) | Common Units | Percentage of Common Units(1) | |||||||||||
|---|---|---|---|---|---|---|---|---|---|---|---|---|---|---|---|---|---|---|---|---|
| Paul G. Allen | 11,084,039 | 17.7 | % | 1,307,190 | 100.0 | % | 1,298,280 | 40 | % | 20.3 | % | 13,688,400(2) | 20.2 | % | ||||||
| Plains Resources Inc.(2) | 11,084,039 | 17.7 | % | 1,307,190 | 100.0 | % | — | — | 18.4 | % | ||||||||||
| Kayne Anderson Capital Advisors, L.P.(4) | 3,147,427 | 5.0 | % | — | — | 1,460,565 | 45 | % | 6.8 | % | ||||||||||
| Tortoise Energy Infrastructure Corporation(5) | 763,435 | 1.2 | % | — | — | 486,855 | 15 | % | 1.9 | % | ||||||||||
| Vulcan Energy Corporation | 12,390,120 | (3) | 18.3 | % | ||||||||||||||||
| Richard Kayne/Kayne Anderson Capital Advisors, L.P. | 5,591,121(4) | 8.2 | % | |||||||||||||||||
| Greg L. Armstrong | 213,992 | (6)(7)(8) | (9) | — | — | — | — | (9) | 250,242(5)(6)(7) | (8) | ||||||||||
| Harry N. Pefanis | 146,615 | (7)(8) | (9) | — | — | — | — | (9) | 161,277(6)(7) | (8) | ||||||||||
| George R. Coiner | 65,276 | (7)(8) | (9) | — | — | — | — | (9) | 74,276(6)(7) | (8) | ||||||||||
| Phillip D. Kramer | 89,600 | (7)(8) | (9) | — | — | — | — | (9) | 113,350(6)(7) | (8) | ||||||||||
| W. David Duckett | 119,541 | (9) | — | — | — | — | — | 119,541(6) | (8) | |||||||||||
| David N. Capobianco(10) | — | — | — | — | — | — | — | |||||||||||||
| David N. Capobianco | —(9) | (8) | ||||||||||||||||||
| Everardo Goyanes | 7,450 | (9) | — | — | — | — | (9) | 8,700(6) | (8) | |||||||||||
| Gary R. Petersen(11) | 4,000 | (9) | — | — | — | — | (9) | |||||||||||||
| John T. Raymond(12) | 403,117 | (9) | — | — | — | — | (9) | |||||||||||||
| Robert V. Sinnott(13) | 13,750 | (9) | — | — | — | — | (9) | |||||||||||||
| Gary R. Petersen | 5,700(10) | |||||||||||||||||||
| Robert V. Sinnott | 15,000(6)(11) | (6) | ||||||||||||||||||
| Arthur L. Smith | 13,750 | (9) | — | — | — | — | (9) | 11,250(6) | (8) | |||||||||||
| J. Taft Symonds | 13,750 | (9) | — | — | — | — | (9) | 20,000(6) | (8) | |||||||||||
| All directors and executive officers as a group (23 persons) | 1,269,375 | (7)(8) | 2.0 | % | — | — | — | — | 1.9 | % | 1,007,027(6)(7) | 1.5 | % | |||||||
Table continued on following page.
Beneficial Ownership of General Partner Interest
Plains AAP, L.P. owns all of our 2% general partner interest and all of our incentive distribution rights. The following table sets forth the effective ownership of Plains AAP, L.P. (after giving effect to proportionate ownership of Plains All American GP LLC, its 1% general partner) as of September 30, 2004..
| Name and Address of Owner | Percentage Ownership of Plains AAP | ||
|---|---|---|---|
| Paul G. Allen(1) 505 Fifth Avenue S, Suite 900 Seattle, Washington 98104 | 44.000 | % | |
777 Walker, Suite 2400 Houston, | 44.000 | % | |
Sable Investments, L.P. 700 Milam, Suite 3100 Houston, TX 77002 | 20.000 | % | |
KAFU Holdings, L.P.(3) 1800 Avenue of the Stars, 2nd Floor Los Angeles, CA 90067 | 16.418 | % | |
E-Holdings III, L.P.(4) 1100 Louisiana, Suite 3150 Houston, TX 77002 | 9.000 | % | |
PAA Management, L.P.(5) 333 Clay Street, #1600 Houston, TX 77002 | 4.000 | % | |
Wachovia Investors, 301 South College Street, 12th Floor Charlotte, NC 28288 | 3.382 | % | |
Mark E. Strome 100 Wilshire Blvd., Suite 1500 Santa Monica, CA 90401 | 2.134 | % | |
Strome Hedgecap Fund, 100 Wilshire Blvd., Suite 1500 Santa Monica, CA 90401 | 1.066 | % |
Table continued on following page.
Duckett (approximately 4.5%). Other than Mr. Armstrong, no directors own any interest in PAA Management, L.P. Directors and executive officers as a group own approximately 95% of PAA Management, L.P. Mr. Armstrong disclaims any beneficial ownership of the general partner interest owned by Plains AAP, L.P., other than through his ownership interest in PAA Management, L.P.
On July 23, 2004, Vulcan Energy acquired all of the outstanding shares of common stock of Plains Resources.
Equity Compensation Plan Information
| Plan Category | Number of units to be issued upon exercise/vesting of outstanding options, warrants and rights* | Weighted average exercise price of outstanding options, warrants and rights | Number of units remaining available for future issuance under equity compensation plans* | ||||
|---|---|---|---|---|---|---|---|
| | (a) | (b) | (c) | ||||
| Equity compensation plans approved by unitholders: | |||||||
| 1998 Long Term Incentive Plan | 133,625 | (1) | N/A | (2) | 460,101 | (1)(3) | |
| Equity compensation plans not approved by unit holders: | |||||||
| 1998 Long Term Incentive Plan | (1)(4) | N/A | (2) | (5) | |||
| Performance Option Plan | (6) | 16.39 | (7) | (8) |
| Plan Category | Number of Units to be Issued upon Exercise/Vesting of Outstanding Options, Warrants and Rights* | Weighted Average Exercise Price of Outstanding Options, Warrants and Rights* | Number of Units Remaining Available for Future Issuance under Equity Compensation Plans* | ||||
|---|---|---|---|---|---|---|---|
| (a) | (b) | (c) | |||||
| Equity compensation plans approved by unitholders: | |||||||
| 1998 Long Term Incentive Plan | 133,625(1) | N/A(2) | 460,101(1)(3) | ||||
| 2005 Long Term Incentive Plan | —(4) | N/A(2) | —(3) | ||||
| Equity compensation plans not approved by unitholders: | |||||||
| 1998 Long Term Incentive Plan | (1)(5) | N/A(2) | (6) | ||||
| Performance Option Plan | (7) | 15.91(8) | (7) | ||||
Table continued on following page.
For a narrative description of the material features of the LTIP and the Performance Option Plan, see "Management—Long-Term Incentive Plan" and "Certain Relationships and Related Transactions—Transactions with Related Parties—Performance Option Plan."
CERTAIN RELATIONSHIPS AND RELATED TRANSACTIONS
Our operations and activities are managed by, and our officers and personnel are employed by, our general partner (or, in the case of our Canadian operations, PMC (Nova Scotia) Company). Prior to the consummation of the General Partner Transition, some of the senior executives who managed our business also managed and operated the business of Plains Resources. The transition of employment of such executives to our general partner was effected on June 30, 2001. We do not pay our general partner a management fee, but we do reimburse our general partner for all expenses incurred on our behalf.
Our general partner owns the 2% general partner interest and all of the incentive distribution rights. Our general partner is entitled to receive incentive distributions if the amount we distribute with respect to any quarter exceeds levels specified in our partnership agreement. Under the quarterly incentive distribution provisions, generally our general partner is entitled, without duplication, to 15% of amounts we distribute in excess of $0.450 ($1.80 annualized) per unit, 25% of the amounts we distribute in excess of $0.495 ($1.98 annualized) per unit and 50% of amounts we distribute in excess of $0.675 ($2.70 annualized) per unit.
The following table illustrates the allocation of aggregate distributions at different per-unit levels:
| Annual Distribution Per Unit | Annual Distribution Per Unit | Distribution to Unitholders(1)(2) | Distribution to GP(1)(2)(3) | Total Distribution(1) | GP Percentage of Total Distribution | Annual Distribution Per Unit | Distribution to Unitholders(1)(2) | Distribution to GP(1)(2)(3) | Total Distribution(1) | GP Percentage of Total Distribution | ||||||||||||||||
|---|---|---|---|---|---|---|---|---|---|---|---|---|---|---|---|---|---|---|---|---|---|---|---|---|---|---|
| $ | 1.80 | $ | 126,000 | $ | 2,571 | $ | 128,571 | 2.0 | % | 1.80 | $ | 126,000 | $ | 2,571 | $ | 128,571 | 2.0 | % | ||||||||
| $ | 1.98 | $ | 138,600 | $ | 4,795 | $ | 143,395 | 3.3 | % | 1.98 | $ | 138,600 | $ | 4,795 | $ | 143,395 | 3.3 | % | ||||||||
| $ | 2.31 | $ | 161,700 | $ | 12,495 | $ | 174,195 | 7.2 | % | 2.45 | $ | 171,500 | $ | 15,762 | $ | 187,262 | 8.4 | % | ||||||||
| $ | 2.40 | $ | 168,000 | $ | 14,595 | $ | 182,595 | 8.0 | % | 2.60 | $ | 182,000 | $ | 19,262 | $ | 201,262 | 9.6 | % | ||||||||
| $ | 2.60 | $ | 182,000 | $ | 19,262 | $ | 201,262 | 9.6 | % | 2.80 | $ | 196,000 | $ | 28,595 | $ | 224,595 | 12.7 | % | ||||||||
| $ | 2.80 | $ | 196,000 | $ | 28,595 | $ | 224,595 | 12.7 | % | 3.00 | $ | 210,000 | $ | 42,595 | $ | 252,595 | 16.9 | % | ||||||||
| $ | 3.00 | $ | 210,000 | $ | 42,595 | $ | 252,595 | 16.9 | % | |||||||||||||||||
Transactions with Related Parties
General
Before the General Partner Transition, Plains Resources indirectly owned and controlled our former general partner interest. In 2001, our former general partner and its affiliates incurred $31.2 million of direct and indirect expenses on our behalf, which we reimbursed. Of this amount, approximately $218,000, $655,000 and $127,000 represented allocated salary and bonus (for the year 2000) reimbursement for the services of Messrs. Armstrong, Pefanis and Kramer, respectively, as officers of our former general partner.
As of September 30,December 31, 2004 Vulcan Energy through its wholly owned subsidiary Plains Resources, owned an effective 44% of our general partner interest, as well as approximately 18.4%18.3% of our outstanding limited partner units. Mr. John Raymond, one of our directors, is a director and the Chief Executive Officer of Vulcan Energy. Mr. Raymond was designated as a member of our board by Sable Investments, L.P., which is controlled by Mr. James C. Flores. Mr. Flores is a director of Vulcan
Energy, the 100% owner of Plains Resources. We have ongoing relationships with Plains Resources.Resources, a wholly owned subsidiary of Vulcan Energy. These relationships include but are not limited to:
On December 18, 2002, Plains Resources completed a spin-off of one of its subsidiaries, PXP, to its shareholders. PXP is a successor participant to the Plains Resources Marketing agreement. For the year ended December 31, 2003,2004, PXP produced approximately 26,00022,000 barrels per day that were subject to the Marketing Agreement. We paid approximately $277.9$328.3 million for such production and recognized segment profit of approximately $1.7$1.4 million. In our opinion, these purchases were made at prevailing market prices. We are also party to a Letter Agreement with Stocker Resources, L.P. (now PXP) that provides that if the Marketing Agreement terminates before our crude oil sales agreement with Tosco Refining Co. terminates, PXP will continue to sell and we will continue to purchase PXP's equity crude oil production from the Arroyo Grande field (now owned by a subsidiary of PXP) under the same terms as the Marketing Agreement until our Tosco sales agreement terminates. In July 2004, we amended and restated the Marketing Agreement to, among other things, reflect the change in parties as a result of the spin-off. We sell PXP's crude under sales contracts that range from one year to seven years in length. We are currently negotiating an adjustmentIn October 2004, we further amended the PXP Marketing Agreement to exclude any newly acquired properties and to adjust the marketing fee which we expect to be a downward adjustment$0.15 per barrel for any new contracts entered into after January 1, 2005.
Transaction Grant Agreements
In connection with our initial public offering, our former general partner, at no cost to us, agreed to transfer, subject to vesting, approximately 400,000 of its affiliates' common units (including distribution equivalent rights attributable to such units) to certain key officers and employees of our former general partner and its affiliates, including Messrs. Armstrong, Pefanis, Coiner and Kramer. Approximately 70,000 units vested in 2000, and the remainder in 2001. The value of the units and associated distribution equivalent rights that vested under the Transaction Grant Agreements for all grantees in 2001 was $5.7 million. Although we recorded noncash compensation expenses with respect to these vestings, the compensation expense incurred in connection with these grants was funded by our former general partner, without reimbursement by us.
1998 Long-Term Incentive Plan
Our general partner has adoptedmaintains the Plains All American LLC 1998 Long-Term Incentive PlanLTIP for employees and directors of our general partner and its affiliates who perform services for us. The 1998 LTIP consists of two components, a restricted unit plan and a unit option plan. The 1998 LTIP permits the grant of restricted units and unit options covering delivery of an aggregate of 1,425,000 common units. No options have been granted under the plan. The plan is administered by the compensation committee of our general partner's board of directors.
A restricted unit is a "phantom" unit that entitles the grantee to receive a common unit (or cash equivalent) upon the vesting of the phantom unit. As of September 30,December 31, 2004, approximately 418,000 common units have been issued, or purchased and delivered, upon vesting and grants of approximately 134,000 phantom units remain outstanding to employees, officers and directors of our general partner.partner of which we expect approximately 93,000 to vest in May 2005. See "Management—Executive Compensation."
2005 Long-Term Incentive Plan
In January 2005, our unitholders approved the 2005 LTIP. The 2005 LTIP provides for awards to our employees and directors. Awards contemplated by the 2005 LTIP include phantom units, restricted units, unit appreciation rights and unit options, as determined by the Compensation Committee (each an "Award"). Up to 3,000,000 units may be issued in satisfaction of Awards. Certain Awards may also include DERs, in the discretion of the Compensation Committee. In February 2005, our Board of Directors and Compensation Committee approved grants of approximately 1,900,000 phantom units (a substantial portion of which include DERs) under the 2005 LTIP. See "Management—Executive Compensation."
Performance Option Plan
In connection with the General Partner Transition,2001, the owners of the general partner (other than PAA Management, L.P.) contributed an aggregate of 450,000 subordinated units (now converted into common units) to the general partner to provide a pool of units available for the grant of options to management and key employees. In that regard, the general partner adopted the Plains All American 2001 Performance Option Plan, pursuant to which options to purchase approximately 375,000 units have been granted.granted with respect to all units under the Plan. Of this amount, 75,000, 55,000, 45,000, 72,500 and 42,50015,000 were granted to Messrs. Armstrong, Pefanis, Kramer, Coiner and Coiner,Duckett, respectively, and approximately 346,000405,000 to executive officers as a group. These options generally vest in 25% increments based upon achieving quarterly distribution levels on our units of $0.525, $0.575, $0.625 and $0.675 ($2.10, $2.30, $2.50 and $2.70, annualized). The first such level was reached in 2002, and 25% of the options vested. The second level was reached in 2004, and an incremental 25% of the options vested. The options will vest in their entirety immediately upon a change in control (as defined in the grant agreements). The original purchase price under the options was $22 per subordinated unit, declining over time in an amount equal to 80% of each quarterly distribution per unit. As of September 30,December 31, 2004, the purchase price was $16.39$15.91 per unit. The terms of future grants may differ from the existing grants. Because the units underlying the plan were contributed to the general partner, we will have no obligation to reimburse the general partner for the cost of the units upon exercise of the options.
Stock Option Replacement
In connection with the General Partner Transition, certain members of the management team that had been employed by Plains Resources, including Messrs. Armstrong, Pefanis and Kramer, were transferred to the general partner. At that time, such individuals held in-the-money but unvested stock options in Plains Resources, which were subject to forfeiture because of the transfer of employment. Plains Resources, through its affiliates, agreed to substitute a contingent grant of subordinated units, which are now common units pursuant to conversion, with a value equal to the spread on the unvested
options, with distribution equivalent rights from the date of grant. The grant included 8,548, 4,602 and 9,742 units to Messrs. Armstrong, Pefanis and Kramer, respectively. The units vestvested on the same schedule as the stock options would have vested. The units granted to Messrs. Armstrong, Pefanis and Kramer vested in their entirety in 2002. The general partner administersadministered the vesting and delivery of the units under the grants. Because the units necessary to satisfy the delivery requirements under the grants were provided by Plains Resources, we havehad no obligation to reimburse the general partner for the cost of such units.
CANPET Energy Group Inc.
In July 2001, we acquired the assets of CANPET Energy Group Inc., a Calgary-basedCalgary based Canadian crude oil and LPG marketing company (the "CANPET acquisition"), for approximately $24.6 million plus excess inventory at the closing date of approximately $25.0 million. A portion of the purchase price, payable in common units or cash, at our option, was deferred subject to various performance standards being met. On April 30, 2004, we satisfied the deferred payment with the issuance of approximately 385,000 common units (representing approximately $13.1 million in value as of the date of issuance) and the payment of $6.5 million in cash. In addition, an incremental $3.7 million in cash was paid for the distributions that would have been paid on the common units had they been outstanding since the effective date of the acquisition. Mr. W. David Duckett, the President of PMC (Nova Scotia) Company, the general partner of Plains Marketing Canada, L.P., owns approximately 37.8% of CANPET, and received a proportionate share of the proceeds from the contingent payment of purchase price for the CANPET assets.
Tank Car Lease and CANPET
In connection with the CANPET asset acquisition, Plains Marketing Canada, L.P. assumed CANPET's rights and obligations under a Master Railcar Leasing Agreement between CANPET and Pivotal Enterprises Corporation ("Pivotal"). The agreement provides for Plains Marketing Canada, L.P. to lease approximately 57 railcars from Pivotal at a lease price of $1,000 (Canadian) per month, per car. The lease extends until June of 2008, with an option for Pivotal to extend the term of the lease for an additional five years. Pivotal is substantially owned by former employees of CANPET, including Mr. W. David Duckett. Mr. Duckett owns a 22% interest in Pivotal.
Class B Common Units
In May 1999, we sold 1,307,190 unregistered Class B common units (the "Class B common units") to our general partner at the time, Plains All American Inc., a wholly owned subsidiary of Plains Resources Inc., pursuant to Rule 4(2) of the Securities Act. We received $19.125 per Class B common unit, a price equal to the then-market value of our common units for total proceeds of approximately $25 million. We used the net proceeds from the offering to defray costs associated with our acquisition of Scurlock Permian LLC and certain other pipeline assets from Marathon Ashland Petroleum LLC. In January 2005, our common unitholders approved a change in the terms of the Class B common units such that they were immediately convertible into an equal number of common units at the option of the holders, and in February 2005, all of the Class B common units converted.
Class C Common Units
In April 2004, we sold 3,245,700 unregistered Class C common units (the "Class C common units") to a group of investors comprised of affiliates of Kayne Anderson Capital Advisors, Vulcan Capital and Tortoise Capital pursuant to Rule 4(2) under the Securities Act. For more detailed information with respect to our relationship with Kayne Anderson Capital Advisors and Vulcan Capital, see "Security Ownership of Certain Beneficial Owners and Management and Related UnitholderUnitholders' Matters." We received $30.81 per Class C common unit, an amount which represented 94% of the average closing price of our common units for the twenty trading days immediately ending and including March 26, 2004. Net proceeds from the private placement, including the general partner's proportionate capital contribution and expenses associated with the sale, were approximately $101.0 million. We used the net proceeds from thisthe offering to repay indebtedness under our revolving credit facility incurred in connection with the Link acquisition. In January 2005, our common unitholders approved a change in the terms of the Class C common units such that they were immediately convertible into an equal number of common units at the option of the holders, and in February 2005, all of the Class C common units converted.
Other
An affiliate of Wachovia Investors,Kayne Anderson Investment Management, Inc., which owns a portion of our general partner interest, participated as an underwriter in our December 2003 and July 2004 equity offerings. For the December 2003 offering, they earned approximately $197,000 in net underwriting discounts and commissions. We estimate that they will earn approximately $936,000 in net underwriting discounts and commissions for the July 2004 offering. An affiliate of KAFU Holdings, L.P., another owner of our general partner interest, also participated in our December 2003 and July 2004 equity offerings. In the aggregate for both offerings, theyit earned approximately $672,000 in commissions for theirits participation. An affiliate of Wachovia Investors, Inc. is also a lender under our bank credit facility.
DESCRIPTION OF OUR COMMON UNITS
Generally, our common units represent limited partner interests that entitle the holders to participate in our cash distributions and to exercise the rights and privileges available to limited partners under our partnership agreement. For a description of the relative rights and preferences of holders of common units and our general partner in and to cash distributions. See "Cash Distribution Policy."
Our outstanding common units are listed on the NYSE under the symbol "PAA." Any additional common units we issue will also be listed on the NYSE.
The transfer agent and registrar for our common units is American Stock Transfer & Trust Company.
Each holder of common units is entitled to one vote for each common unit on all matters submitted to a vote of the unitholders.
Status as Limited Partner or Assignee
Except as described below under "—Limited Liability," the common units will be fully paid, and unitholders will not be required to make additional capital contributions to us.
Each purchaser of common units offered by this prospectus must execute a transfer application whereby the purchaser requests admission as a substituted limited partner and makes representations and agrees to provisions stated in the transfer application. If this action is not taken, a purchaser will not be registered as a record holder of common units on the books of our transfer agent or issued a common unit certificate. Purchasers may hold common units in nominee accounts.
An assignee, pending its admission as a substituted limited partner, is entitled to an interest in us equivalent to that of a limited partner with respect to the right to share in allocations and distributions, including liquidating distributions. Our general partner will vote and exercise other powers attributable to common units owned by an assignee who has not become a substituted limited partner at the written direction of the assignee. Transferees who do not execute and deliver transfer applications will be treated neither as assignees nor as record holders of common units and will not receive distributions, federal income tax allocations or reports furnished to record holders of common units. The only right the transferees will have is the right to admission as a substituted limited partner in respect of the transferred common units upon execution of a transfer application in respect of the common units. A nominee or broker who has executed a transfer application with respect to common units held in street name or nominee accounts will receive distributions and reports pertaining to its common units.
Assuming that a limited partner does not participate in the control of our business within the meaning of the Delaware Revised Uniform Limited Partnership Act (the "Delaware Act") and that he otherwise acts in conformity with the provisions of our partnership agreement, his liability under the Delaware Act will be limited, subject to some possible exceptions, generally to the amount of capital he is obligated to contribute to us in respect of his units plus his share of any undistributed profits and assets.
Under the Delaware Act, a limited partnership may not make a distribution to a partner to the extent that at the time of the distribution, after giving effect to the distribution, all liabilities of the partnership, other than liabilities to partners on account of their partnership interests and liabilities for which the recourse of creditors is limited to specific property of the partnership, exceed the fair value
of the assets of the limited partnership. For the purposes of determining the fair value of the assets of a limited partnership, the Delaware Act provides that the fair value of the property subject to liability of which recourse of creditors is limited shall be included in the assets of the limited partnership only to the extent that the fair value of that property exceeds the nonrecourse liability. The Delaware Act provides that a limited partner who receives a distribution and knew at the time of the distribution that the distribution was in violation of the Delaware Act is liable to the limited partnership for the amount of the distribution for three years from the date of the distribution.
As soon as practicable, but in no event later than 120 days after the close of each fiscal year, our general partner will furnish or make available to each unitholder of record (as of a record date selected by our general partner) an annual report containing our audited financial statements for the past fiscal year. These financial statements will be prepared in accordance with generally accepted accounting principles. In addition, no later than 45 days after the close of each quarter (except the fourth quarter), our general partner will furnish or make available to each unitholder of record (as of a record date selected by our general partner) a report containing our unaudited financial statements and any other information required by law.
Our general partner will use all reasonable efforts to furnish each unitholder of record information reasonably required for tax reporting purposes within 90 days after the close of each fiscal year. Our general partner's ability to furnish this summary tax information will depend on the cooperation of unitholders in supplying information to our general partner. Each unitholder will receive information to assist him in determining his U.S. federal and state and Canadian federal and provincial tax liability and filing his U.S. federal and state and Canadian federal and provincial income tax returns.
A limited partner can, for a purpose reasonably related to the limited partner's interest as a limited partner, upon reasonable demand and at his own expense, have furnished to him:
Our general partner may, and intends to, keep confidential from the limited partners trade secrets and other information the disclosure of which our general partner believes in good faith is not in our best interest or which we are required by law or by agreements with third parties to keep confidential.
In connection with our acquisition of Scurlock Permian LLC, in May 1999, we issued 1,307,190 Class B common units for $19.125 per unit in a private placement to our general partner at the time, Plains All American Inc. The Class B common units generally havehad voting rights that arewere identical to the voting rights of the common units and votevoted with the common units as a single class on each matter, except that the Class B common units arewere not entitled to vote upon the NYSE listing proposals relating
proposals relating to the conversion of the Class B common units or Class C common units into common units. Each Class B common unit iswas entitled to receive 100% of the quarterly amount distributed on each common unit for each quarter. The holderIn January 2005, our common unitholders approved a change in the terms of the Class B Common units such that they were immediately convertible into an equal number of Common Units at the option of the holders, and in February 2005, all of the Class B common units has the right to demand a unitholder vote on whether the Class B can be converted into common units. We expect the holder to exercise that right on or after October 15, 2004. Assuming the right is exercised on October 15, if our unitholders do not approve the conversion before February 12, 2005, then the terms of the Class B common units will be changed such that each Class B common unit will be entitled to receive 110% of the quarterly amount distributed on each common unit on apari passu basis with distributions on the common units. If the approval of the conversion is not secured by May 13, 2005, the distribution right increases to 115%. In the event of our dissolution and liquidation, each Class B common unit is entitled to receive 100% of the amount distributed on each common unit.converted.
In connection with the Link acquisition, on April 15, 2004, we issued 3,245,700 Class C common units for $30.81 per unit in a private placement to a group of institutional investors comprised of affiliates of Kayne Anderson Capital Advisers,Advisors, Vulcan Capital and Tortoise Capital Advisors. The Class C common units generally havehad voting rights that arewere identical to the voting rights of the common units and votevoted with the common units as a single class on each matter, except that the Class C common units arewere not entitled to vote upon the NYSE listing proposals relating to the conversion of the Class B common units or Class C common units into common units. Each Class C common unit iswas entitled to receive 100% of the quarterly amount distributed on each common unit for each quarter. TheIn January 2005, our common unitholders approved a change in the terms of the Class C Common units such that they were immediately convertible into an equal number of Common Units at the option of the holders, and in February 2005, all of the Class C common units have the right to demand a unitholder vote on whether the Class C can be converted into common units. We expect the holders to exercise that right on or after October 15, 2004. Assuming the right is exercised on October 15, if our unitholders do not approve the conversion before February 12, 2005, then the terms of the Class C common units will be changed such that each Class C common unit will be entitled to receive 110% of the quarterly amount distributed on each common unit on apari passu basis with distributions on the common units. If the approval of the conversion is not secured by May 13, 2005, the distribution right increases to 115%. In the event of our dissolution and liquidation, each Class C common unit is entitled to receive 100% of the amount distributed on each common unit.converted.
Distributions of Available Cash
General. We will distribute to our unitholders, on a quarterly basis, all of our available cash in the manner described below.
Definition of Available Cash. Available cash generally means, for any quarter ending prior to liquidation, all cash on hand at the end of that quarter less the amount of cash reserves that are necessary or appropriate in the reasonable discretion of the general partner to:
Operating Surplus and Capital Surplus
General. Cash distributions to our unitholders will be characterized as either operating surplus or capital surplus. We distribute available cash from operating surplus differently than available cash from capital surplus. See "—Quarterly Distributions of Available Cash."
Definition of Operating Surplus. Operating surplus refers generally to:
Definition of Capital Surplus. Capital surplus will generally be generated only by:
We will treat all available cash distributed as coming from operating surplus until the sum of all available cash distributed since we began equals the operating surplus as of the end of the quarter prior to the distribution. Any available cash in excess of operating surplus, regardless of its source, will be treated as capital surplus.
If we distribute available cash from capital surplus for each common unit in an aggregate amount per common unit equal to the initial public offering price of the common units, there will not be a distinction between operating surplus and capital surplus, and all distributions of available cash will be treated as operating surplus. We do not anticipate that we will make distributions from capital surplus.
The incentive distribution rights represent the right to receive an increasing percentage of quarterly distributions of available cash from operating surplus after the minimum quarterly distribution
and the target distribution levels have been achieved. The target distribution levels are based on the amounts of available cash from operating surplus distributed above the payments made under the minimum quarterly distribution, if any, and the related 2% distribution to the general partner.
Effect of Issuance of Additional Units
We can issue additional common units or other equity securities for consideration and under terms and conditions approved by our general partner in its sole discretion and without the approval of our unitholders. We may fund acquisitions through the issuance of additional common units or other equity securities.
Holders of any additional common units that we issue will be entitled to share equally with our then-existing unitholders in distributions of available cash. In addition, the issuance of additional interests may dilute the value of the interests of the then-existing unitholders. If we issue additional partnership interests, our general partner will be required to make an additional capital contribution to us or the operating partnership.
Quarterly Distributions of Available Cash
We will make quarterly distributions to our partners prior to our liquidation in an amount equal to 100% of our available cash for that quarter. We expect to make distributions of all available cash within approximately 45 days after the end of each quarter to holders of record on the applicable record date. The minimum quarterly distribution and the target distribution levels are also subject to certain other adjustments as described below under "—Distributions from Capital Surplus" and "—Adjustment to the Minimum Quarterly Distribution and Target Distribution Levels."
Distributions From Operating Surplus
We will make distributions of available cash from operating surplus in the following manner:
For any quarter that we distribute available cash from operating surplus to the common unitholders in an amount equal to the minimum quarterly distribution on all units, then we will distribute any additional available cash from operating surplus in that quarter among the unitholders and the general partner in the following manner:
Our distributions to the general partner above, other than in its capacity as holders of units, that are in excess of its aggregate 2% general partner interest represent the incentive distribution rights. The right to receive incentive distribution rights is not part of its general partner interest and may be transferred separately from that interest, subject to certain restrictions.
Distributions from Capital Surplus
How Distributions from Capital Surplus Will Be Made. We will make distributions of available cash from capital surplus in the following manner:
Effect of a Distribution from Capital Surplus. Our partnership agreement treats a distribution of available cash from capital surplus as the repayment of the initial unit price. To show that repayment, the minimum quarterly distribution and the target distribution levels will be reduced by multiplying each amount by a fraction, the numerator of which is the unrecovered capital of the common units immediately after giving effect to that repayment and the denominator of which is the unrecovered capital of the common units immediately prior to that repayment.
When Payback Occurs. When "payback" of the reduced initial unit price has occurred, i.e., when the unrecovered capital of the common units is zero, and then
Distributions of available cash from capital surplus will not reduce the minimum quarterly distribution or target distribution levels for the quarter in which they are distributed.
Adjustment to the Minimum Quarterly Distribution and Target Distribution Levels
How We Adjust the Minimum Quarterly Distribution and Target Distribution Levels. In addition to adjusting the minimum quarterly distribution and target distribution levels to reflect a distribution of capital surplus, if we combine our units into fewer units or subdivide our units into a greater number of units (but not if we issue additional common units for cash or property), we will proportionately adjust:
For example, in the event of a two-for-one split of the common units (assuming no prior adjustments), the minimum quarterly distribution, each of the target distribution levels and the unrecovered capital of the common units would each be reduced to 50% of its initial level.
If We Became Subject to Taxation. If legislation is enacted or if existing law is modified or interpreted by the relevant governmental authority so that we become taxable as a corporation or otherwise subject to taxation as an entity for federal, state or local income tax purposes, we will reduce
the minimum quarterly distribution and the target distribution levels to an amount equal to the product of:
For example, assuming we were not previously subject to state and local income tax, if we become taxable as an entity for federal income tax purposes and became subject to a maximum marginal federal, and effective state and local, income tax rate of 38%, then the minimum quarterly distribution and the target distribution levels would each be reduced to 62% of the amount immediately prior to that adjustment.
Distribution of Cash Upon Liquidation
General. If we dissolve and liquidate, we will sell our assets or otherwise dispose of our assets and we will adjust the partners' capital account balances to show any resulting gain or loss. We will first apply the proceeds of liquidation to the payment of our creditors in the order of priority provided in our partnership agreement and by law and, thereafter, distribute to the unitholders and the general partner in accordance with their adjusted capital account balances.
Manner of Adjustment. If we liquidate, we would allocate any loss to the general partner and each unitholder as follows:
Interim Adjustments to Capital Accounts. If we issued additional security interests or made distributions of property, interim adjustments to capital accounts would also be made. These adjustments would be based on the fair market value of the interests or the property distributed and any gain or loss would be allocated to the unitholders and the general partner in the same way that a gain or loss is allocated upon liquidation. If positive interim adjustments are made to the capital accounts, any subsequent negative adjustments to the capital accounts resulting from our issuance of additional interests, distributions of property, or upon our liquidation, would be allocated in a way that, to the extent possible, in the capital account balances of the general partner equaling the amount which would have been the general partner's capital account balances if no prior positive adjustments to the capital accounts had been made.
DESCRIPTION OF OUR PARTNERSHIP AGREEMENT
The following is a summary of the material provisions of our partnership agreement. The following provisions of our partnership agreement are summarized elsewhere in this prospectus:
Our purpose under our partnership agreement is to serve as a partner of our operating partnerships and to engage in any business activities that may be engaged in by our operating partnerships or that is approved by our general partner. The partnership agreements of our operating partnerships provide that they may engage in any activity that was engaged in by our predecessors at the time of our initial public offering or reasonably related thereto and any other activity approved by our general partner.
Each limited partner, and each person who acquires a unit from a unitholder and executes and delivers a transfer application, grants to our general partner and, if appointed, a liquidator, a power of attorney to, among other things, execute and file documents required for our qualification, continuance or dissolution. The power of attorney also grants the authority for the amendment of, and to make consents and waivers under, our partnership agreement.
Reimbursements of Our General Partner
Our general partner does not receive any compensation for its services as our general partner. It is, however, entitled to be reimbursed for all of its costs incurred in managing and operating our business. Our partnership agreement provides that our general partner will determine the expenses that are allocable to us in any reasonable manner determined by our general partner in its sole discretion.
Issuance of Additional Securities
Our partnership agreement authorizes us to issue an unlimited number of additional limited partner interests and other equity securities that are equal in rank with or junior to our common units on terms and conditions established by our general partner in its sole discretion without the approval of any limited partners.
It is likely that we will fund acquisitions through the issuance of additional common units or other equity securities. Holders of any additional common units we issue will be entitled to share equally with the then-existing holders of common units in our cash distributions. In addition, the issuance of additional partnership interests may dilute the value of the interests of the then-existing holders of common units in our net assets.
In accordance with Delaware law and the provisions of our partnership agreement, we may also issue additional partnership interests that, in the sole discretion of our general partner, may have special voting rights to which common units are not entitled.
Our general partner has the right, which it may from time to time assign in whole or in part to any of its affiliates, to purchase common units or other equity securities whenever, and on the same terms that, we issue those securities to persons other than our general partner and its affiliates, to the extent
necessary to maintain their percentage interests in us that existed immediately prior to the issuance. The holders of common units will not have preemptive rights to acquire additional common units or other partnership interests in us.
Amendments to Our Partnership Agreement
Amendments to our partnership agreement may be proposed only by our general partner. Any amendment that materially and adversely affects the rights or preferences of any type or class of limited partner interests in relation to other types or classes of limited partner interests or our general partner interest will require the approval of at least a majority of the type or class of limited partner interests or general partner interests so affected. However, in some circumstances, more particularly described in our partnership agreement, our general partner may make amendments to our partnership agreement without the approval of our limited partners or assignees.
Withdrawal or Removal of Our General Partner
Our general partner has agreed not to withdraw voluntarily as our general partner prior to December 31, 2008 without obtaining the approval of the holders of a majority of our outstanding common units, excluding those held by our general partner and its affiliates, and furnishing an opinion of counsel regarding limited liability and tax matters. On or after December 31, 2008, our general partner may withdraw as general partner without first obtaining approval of any unitholder by giving 90 days' written notice, and that withdrawal will not constitute a violation of our partnership agreement. In addition, our general partner may withdraw without unitholder approval upon 90 days' notice to our limited partners if at least 50% of our outstanding common units are held or controlled by one person and its affiliates other than our general partner and its affiliates.
Upon the voluntary withdrawal of our general partner, the holders of a majority of our outstanding common units, excluding the common units held by the withdrawing general partner and its affiliates, may elect a successor to the withdrawing general partner. If a successor is not elected, or is elected but an opinion of counsel regarding limited liability and tax matters cannot be obtained, we will be dissolved, wound up and liquidated, unless within 90 days after that withdrawal, the holders of a majority of our outstanding units, excluding the common units held by the withdrawing general partner and its affiliates agree to continue our business and to appoint a successor general partner.
Our general partner may not be removed unless that removal is approved by the vote of the holders of not less than two-thirds of our outstanding units, including units held by our general partner and its affiliates, and we receive an opinion of counsel regarding limited liability and tax matters. Any removal of this kind is also subject to the approval of a successor general partner by the vote of the holders of a majority of our outstanding common units, including those held by our general partner and its affiliates.
While our partnership agreement limits the ability of our general partner to withdraw, it allows the general partner interest and incentive distribution rights to be transferred to an affiliate or to a third party in conjunction with a merger or sale of all or substantially all of the assets of our general partner.
In addition, our partnership agreement expressly permits the sale, in whole or in part, of the ownership of our general partner. Our general partner may also transfer, in whole or in part, the common units it owns.
Liquidation and Distribution of Proceeds
Upon our dissolution, unless we are reconstituted and continued as a new limited partnership, the person authorized to wind up our affairs (the liquidator) will, acting with all the powers of our general
partner that the liquidator deems necessary or desirable in its good faith judgment, liquidate our assets. The proceeds of the liquidation will be applied as follows:
Under some circumstances and subject to some limitations, the liquidator may defer liquidation or distribution of our assets for a reasonable period of time. If the liquidator determines that a sale would be impractical or would cause a loss to our partners, our general partner may distribute assets in kind to our partners.
Change of Management Provisions
Our partnership agreement contains the following specific provisions that are intended to discourage a person or group from attempting to remove our general partner or otherwise change management:
If at any time our general partner and its affiliates own 80% or more of the issued and outstanding limited partner interests of any class, our general partner will have the right to purchase all, but not less than all, of the outstanding limited partner interests of that class that are held by non-affiliated persons. The record date for determining ownership of the limited partner interests would be selected by our general partner on at least 10 but not more than 60 days' notice. The purchase price in the event of a purchase under these provisions would be the greater of (1) the current market price (as defined in our agreement) of the limited partner interests of the class as of the date three days prior to the date that notice is mailed to the limited partners as provided in our partnership agreement and (2) the highest cash price paid by our general partner or any of its affiliates for any limited partner interest of the class purchased within the 90 days preceding the date our general partner mails notice of its election to purchase the units.
Under our partnership agreement, in most circumstances, we will indemnify our general partner, its affiliates and their officers and directors to the fullest extent permitted by law, from and against all losses, claims or damages any of them may suffer by reason of their status as general partner, officer or director, as long as the person seeking indemnity acted in good faith and in a manner believed to be in or not opposed to our best interest. Any indemnification under these provisions will only be out of our assets. Our general partner shall not be personally liable for, or have any obligation to contribute or loan funds or assets to us to enable us to effectuate any indemnification. We are authorized to purchase insurance against liabilities asserted against and expenses incurred by persons for our activities, regardless of whether we would have the power to indemnify the person against liabilities under our partnership agreement.
Under our partnership agreement, we have agreed to register for resale under the Securities Act and applicable state securities laws any common units, or other partnership securities proposed to be sold by our general partner or any of its affiliates or their assignees if an exemption from the registration requirements is not otherwise available. We are obligated to pay all expenses incidental to the registration, excluding underwriting discounts and commissions.
This section is a summary of the material tax considerations that may be relevant to prospective unitholders who are individual citizens or residents of the United States and, unless otherwise noted in the following discussion, expresses the opinion of Vinson & Elkins L.L.P., special counsel to the general partner and us, insofar as it relates to matters of United States federal income tax law and legal conclusions with respect to those matters.
This section is based upon current provisions of the Internal Revenue Code, existing and proposed regulations and current administrative rulings and court decisions, all of which are subject to change. Later changes in these authorities may cause the tax consequences to vary substantially from the consequences described below.
No attempt has been made in the following discussion to comment on all federal income tax matters affecting us or our unitholders. Moreover, the discussion focuses on unitholders who are individual citizens or residents of the United States and has only limited application to corporations, estates, trusts, nonresident aliens or other unitholders subject to specialized tax treatment, such as tax-exempt institutions, foreign persons, individual retirement accounts (IRAs), real estate investment trusts (REITs) or mutual funds. Accordingly, we recommend that each prospective unitholder consult, and depend on, his own tax advisor in analyzing the federal, state, local and foreign tax consequences particular to him of the ownership or disposition of common units.
All statements as to matters of law and legal conclusions, but not as to factual matters, contained in this section, unless otherwise noted, are the opinion of counsel and are based on the accuracy of the factual representations made by us.
No ruling has been or will be requested from the IRS regarding any matter affecting us or prospective unitholders. An opinion of counsel represents only that counsel's best legal judgment and does not bind the IRS or the courts. Accordingly, the opinions and statements made here may not be sustained by a court if contested by the IRS. Any contest of this sort with the IRS may materially and adversely impact the market for the common units and the prices at which common units trade. In addition, the costs of any contest with the IRS will be borne directly or indirectly by the unitholders and the general partner. Furthermore, the treatment of us, or an investment in us, may be significantly modified by future legislative or administrative changes or court decisions. Any modifications may or may not be retroactively applied.
For the reasons described below, counsel has not rendered an opinion with respect to the following specific federal income tax issues:
(1) the treatment of a unitholder whose common units are loaned to a short seller to cover a short sale of common units (please read "—Tax Consequences of Unit Ownership—Treatment of Short Sales");
(2) whether our monthly convention for allocating taxable income and losses is permitted by existing Treasury Regulations (please read "—Disposition of Common Units—Allocations Between Transferors and Transferees"); and
(3) whether our method for depreciating Section 743 adjustments is sustainable (please read "—Tax Consequences of Unit Ownership—Section 754 Election").
A partnership is not a taxable entity and incurs no federal income tax liability. Instead, each partner of a partnership is required to take into account his share of items of income, gain, loss and deduction of the partnership in computing his federal income tax liability, regardless of whether cash distributions are made to him by the partnership. Distributions by a partnership to a partner are
generally not taxable unless the amount of cash distributed is in excess of the partner's adjusted basis in his partnership interest.
No ruling has been or will be sought from the IRS and the IRS has made no determination as to our status or the status of the operating partnerships as partnerships for federal income tax purposes or whether our operations generate "qualifying income" under Section 7704 of the Code. Instead, we will rely on the opinion of counsel that, based upon the Internal Revenue Code, its regulations, published revenue rulings and court decisions and the representations described below, we and the operating partnerships will be classified as a partnership for federal income tax purposes.
In rendering its opinion, counsel has relied on factual representations made by us and the general partner. The representations made by us and our general partner upon which counsel has relied are:
(a) neither we nor the operating partnerships will elect to be treated as a corporation;
(b) for each taxable year, more than 90% of our gross income will be income from sources that our counsel has opined or will opine is "qualifying income" within the meaning of Section 7704(d) of the Internal Revenue Code.
Section 7704 of the Internal Revenue Code provides that publicly-traded partnerships will, as a general rule, be taxed as corporations. However, an exception, referred to as the "Qualifying Income Exception," exists with respect to publicly-traded partnerships of which 90% or more of the gross income for every taxable year consists of "qualifying income." Qualifying income includes income and gains derived from the transportation and marketing of crude oil, natural gas and products thereof. Other types of qualifying income include interest (other than from a financial business), dividends, gains from the sale of real property and gains from the sale or other disposition of assets held for the production of income that otherwise constitutes qualifying income. We estimate that less than 3% of our current income is not qualifying income; however, this estimate could change from time to time. Based upon and subject to this estimate, the factual representations made by us and the general partner and a review of the applicable legal authorities, counsel is of the opinion that at least 90% of our current gross income constitutes qualifying income.
If we fail to meet the Qualifying Income Exception, other than a failure which is determined by the IRS to be inadvertent and that is cured within a reasonable time after discovery, we will be treated as if we had transferred all of our assets, subject to liabilities, to a newly formed corporation, on the first day of the year in which we fail to meet the Qualifying Income Exception, in return for stock in that corporation, and then distributed that stock to the unitholders in liquidation of their interests in us. This contribution and liquidation should be tax-free to unitholders and us so long as we, at that time, do not have liabilities in excess of the tax basis of our assets. Thereafter, we would be treated as a corporation for federal income tax purposes.
If we were taxable as a corporation in any taxable year, either as a result of a failure to meet the Qualifying Income Exception or otherwise, our items of income, gain, loss and deduction would be reflected only on our tax return rather than being passed through to our unitholders, and our net income would be taxed to us at corporate rates. In addition, any distribution made to a unitholder would be treated as either taxable dividend income, to the extent of our current or accumulated earnings and profits, or, in the absence of earnings and profits, a nontaxable return of capital, to the extent of the unitholder's tax basis in his common units, or taxable capital gain, after the unitholder's tax basis in his common units has been reduced to zero. Accordingly, taxation as a corporation would result in a material reduction in a unitholder's cash flow and after-tax return and thus would likely result in a substantial reduction of the value of the units.
The discussion below is based on the conclusion that we will be classified as a partnership for federal income tax purposes.
Unitholders who have become limited partners of Plains All American Pipeline will be treated as partners of Plains All American Pipeline for federal income tax purposes. Also:
will be treated as partners of Plains All American Pipeline for federal income tax purposes. As there is no direct authority addressing assignees of common units who are entitled to execute and deliver transfer applications and become entitled to direct the exercise of attendant rights, but who fail to execute and deliver transfer applications, counsel's opinion does not extend to these persons. Furthermore, a purchaser or other transferee of common units who does not execute and deliver a transfer application may not receive some federal income tax information or reports furnished to record holders of common units unless the common units are held in a nominee or street name account and the nominee or broker has executed and delivered a transfer application for those common units.
A beneficial owner of common units whose units have been transferred to a short seller to complete a short sale would appear to lose his status as a partner with respect to those units for federal income tax purposes. Please read "—Tax Consequences of Unit Ownership—Treatment of Short Sales."
Income, gain, deductions or losses would not appear to be reportable by a unitholder who is not a partner for federal income tax purposes, and any cash distributions received by a unitholder who is not a partner for federal income tax purposes would therefore be fully taxable as ordinary income. These holders should consult their own tax advisors with respect to their status as partners in Plains All American Pipeline for federal income tax purposes.
Tax Consequences of Unit Ownership
Flow-through of Taxable Income. We will not pay any federal income tax. Instead, each unitholder will be required to report on his income tax return his share of our income, gains, losses and deductions without regard to whether corresponding cash distributions are received by that unitholder. Consequently, we may allocate income to a unitholder even if he has not received a cash distribution. Each unitholder will be required to include in income his share of our income, gains, losses and deductions for our taxable year ending with or within his taxable year.
Treatment of Distributions. Distributions by us to a unitholder generally will not be taxable to the unitholder for federal income tax purposes to the extent of his tax basis in his common units immediately before the distribution. Our cash distributions in excess of a unitholder's tax basis generally will be considered to be gain from the sale or exchange of the common units, taxable in accordance with the rules described under "—Disposition of Common Units" below. Any reduction in a unitholder's share of our liabilities for which no partner, including the general partner, bears the economic risk of loss, known as "nonrecourse liabilities," will be treated as a distribution of cash to that unitholder. To the extent our distributions cause a unitholder's "at risk" amount to be less than zero at the end of any taxable year, he must recapture any losses deducted in previous years. Please read "—Limitations on Deductibility of Losses."
A decrease in a unitholder's percentage interest in us because of our issuance of additional common units will decrease his share of our nonrecourse liabilities, and thus will result in a
corresponding deemed distribution of cash. A non-pro rata distribution of money or property may result in ordinary income to a unitholder, regardless of his tax basis in his common units, if the
distribution reduces the unitholder's share of our "unrealized receivables," including depreciation recapture, and/or substantially appreciated "inventory items," both as defined in Section 751 of the Internal Revenue Code, and collectively, "Section 751 Assets." To that extent, he will be treated as having been distributed his proportionate share of the Section 751 Assets and having exchanged those assets with us in return for the non-pro rata portion of the actual distribution made to him. This latter deemed exchange will generally result in the unitholder's realization of ordinary income. That income will equal the excess of (1) the non-pro rata portion of that distribution over (2) the unitholder's tax basis for the share of Section 751 Assets deemed relinquished in the exchange.
Basis of Common Units. A unitholder's initial tax basis for his common units will be the amount he paid for the common units plus his share of our nonrecourse liabilities. That basis will be increased by his share of our income and by any increases in his share of our nonrecourse liabilities. That basis will be decreased, but not below zero, by distributions from us, by the unitholder's share of our losses, by any decreases in his share of our nonrecourse liabilities and by his share of our expenditures that are not deductible in computing taxable income and are not required to be capitalized. A limited partner will have no share of our debt which is recourse to the general partner, but will have a share, generally based on his share of profits, of our nonrecourse liabilities. Please read "—Disposition of Common Units—Recognition of Gain or Loss."
Limitations on Deductibility of Losses. The deduction by a unitholder of his share of our losses will be limited to the tax basis in his units and, in the case of an individual unitholder or a corporate unitholder, if more than 50% of the value of its stock is owned directly or indirectly by five or fewer individuals or some tax-exempt organizations, to the amount for which the unitholder is considered to be "at risk" with respect to our activities, if that is less than his tax basis. A unitholder must recapture losses deducted in previous years to the extent that distributions cause his at risk amount to be less than zero at the end of any taxable year. Losses disallowed to a unitholder or recaptured as a result of these limitations will carry forward and will be allowable to the extent that his tax basis or at risk amount, whichever is the limiting factor, is subsequently increased. Upon the taxable disposition of a unit, any gain recognized by a unitholder can be offset by losses that were previously suspended by the at risk limitation but may not be offset by losses suspended by the basis limitation. Any excess loss above that gain previously suspended by the at risk or basis limitations will no longer utilizable.
In general, a unitholder will be at risk to the extent of the tax basis of his units, excluding any portion of that basis attributable to his share of our nonrecourse liabilities, reduced by any amount of money he borrows to acquire or hold his units, if the lender of those borrowed funds owns an interest in us, is related to the unitholder or can look only to the units for repayment. A unitholder's at risk amount will increase or decrease as the tax basis of the unitholder's units increases or decreases, other than tax basis increases or decreases attributable to increases or decreases in his share of our nonrecourse liabilities.
The passive loss limitations generally provide that individuals, estates, trusts and some closely-held corporations and personal service corporations can deduct losses from passive activities, which are generally activities in which the taxpayer does not materially participate, only to the extent of the taxpayer's income from those passive activities. The passive loss limitations are applied separately with respect to each publicly-traded partnership. Consequently, any passive losses we generate will only be available to offset our passive income generated in the future and will not be available to offset income from other passive activities or investments, including our investments or investments in other publicly-traded partnerships, or salary or active business income. Passive losses that are not deductible because they exceed a unitholder's share of income we generate may be deducted in full when he disposes of his entire investment in us in a fully taxable transaction with an unrelated party. The passive activity
loss rules are applied after other applicable limitations on deductions, including the at risk rules and the basis limitation.
A unitholder's share of our net income may be offset by any suspended passive losses, but it may not be offset by any other current or carryover losses from other passive activities, including those attributable to other publicly-traded partnerships.
Limitations on Interest Deductions. The deductibility of a non-corporate taxpayer's "investment interest expense" is generally limited to the amount of that taxpayer's "net investment income." Investment interest expense includes:
The computation of a unitholder's investment interest expense will take into account interest on any margin account borrowing or other loan incurred to purchase or carry a unit. Net investment income includes gross income from property held for investment and amounts treated as portfolio income under the passive loss rules, less deductible expenses, other than interest, directly connected with the production of investment income, but generally does not include gains attributable to the disposition of property held for investment. The IRS has indicated that net passive income from a publicly-traded partnership will be treated as investment income for purposes of the limitations on the deductibility of investment interest. In addition, the unitholder's share of our portfolio income will be treated as investment income.
Entity-Level Collections. If we are required or elect under applicable law to pay any federal, state or local income tax on behalf of any unitholder or the general partner or any former unitholder, we are authorized to pay those taxes from our funds. That payment, if made, will be treated as a distribution of cash to the partner on whose behalf the payment was made. If the payment is made on behalf of a person whose identity cannot be determined, we are authorized to treat the payment as a distribution to all current unitholders. We are authorized to amend our partnership agreement in the manner necessary to maintain uniformity of intrinsic tax characteristics of units and to adjust later distributions, so that after giving effect to these distributions, the priority and characterization of distributions otherwise applicable under our partnership agreement is maintained as nearly as is practicable. Payments by us as described above could give rise to an overpayment of tax on behalf of an individual partner in which event the partner would be required to file a claim in order to obtain a credit or refund.
Allocation of Income, Gain, Loss and Deduction. In general, if we have a net profit, our items of income, gain, loss and deduction will be allocated among the general partner and the unitholders in accordance with their percentage interests in us. At any time that incentive distributions are made to the general partner, gross income will be allocated to the recipients to the extent of these distributions. If we have a net loss for the entire year, that loss will be allocated first to the general partner and the unitholders in accordance with their percentage interests in us to the extent of their positive capital accounts and, second, to the general partner.
Specified items of our income, gain, loss and deduction will be allocated to account for the difference between the tax basis and fair market value of property contributed to us by the general partner, referred to in this discussion as "Contributed Property," and to account for the difference between the fair market value of our assets and their carrying value on our books at the time of an offering. The effect of these allocations to a unitholder purchasing common units in an offering will be essentially the same as if the tax basis of our assets were equal to their fair market value at the time of
the offering. In addition, items of recapture income will be allocated to the extent possible to the partner who was allocated the deduction giving rise to the treatment of that gain as recapture income in order to minimize the recognition of ordinary income by some unitholders. Finally, although we do
not expect that our operations will result in the creation of negative capital accounts, if negative capital accounts nevertheless result, items of our income and gain will be allocated in an amount and manner to eliminate the negative balance as quickly as possible.
An allocation of items of our income, gain, loss or deduction, other than an allocation required by the Internal Revenue Code to eliminate the difference between a partner's "book" capital account, credited with the fair market value of Contributed Property, and "tax" capital account, credited with the tax basis of Contributed Property referred to in this discussion as the "Book-Tax Disparity", will generally be given effect for federal income tax purposes in determining a partner's share of an item of income, gain, loss or deduction only if the allocation has substantial economic effect. In any other case, a partner's share of an item will be determined on the basis of the partner's interest in us, which will be determined by taking into account all the facts and circumstances, including the partner's relative contributions to us, the interests of all the partners in profits and losses, the interest of all the partners in cash flow and other nonliquidating distributions and rights of the partners to distributions of capital upon liquidation.
Counsel is of the opinion that, with the exception of the issues described in "—Tax Consequences of Unit Ownership—Section 754 Election" and "—Disposition of Common Units—Allocations Between Transferors and Transferees," respectively, allocations under our partnership agreement will be given effect for federal income tax purposes in determining a partner's share of an item of income, gain, loss or deduction.
Treatment of Short Sales. A unitholder whose units are loaned to a "short seller" to cover a short sale of units may be considered as having disposed of those units. If so, he would no longer be a partner with respect to those units during the period of the loan and may recognize gain or loss from the disposition. As a result, during this period:
Counsel has not rendered an opinion regarding the treatment of a unitholder where common units are loaned to a short seller to cover a short sale of common units; therefore, unitholders desiring to ensure their status as partners and avoid the risk of gain recognition from a loan to a short seller should modify any applicable brokerage account agreements to prohibit their brokers from borrowing their units. The IRS has announced that it is actively studying issues relating to the tax treatment of short sales of partnership interests. Please read "—Disposition of Common Units—Recognition of Gain or Loss."
Alternative Minimum Tax. Although it is not expected that we will generate significant tax preference items or adjustments, each unitholder will be required to take into account his distributive share of any items of our income, gain, loss or deduction for purposes of the alternative minimum tax. The current minimum tax rate for noncorporate taxpayers is 26% on the first $175,000 of alternative minimum taxable income in excess of the exemption amount and 28% on any additional alternative minimum taxable income. Prospective unitholders should consult with their tax advisors as to the impact of an investment in units on their liability for the alternative minimum tax.
Tax Rates. In general the highest effective United States federal income tax rate for individuals currently is 35% and the maximum United States federal income tax rate for net capital gains of an
individual currently is 15% if the asset disposed of was held for more than 12 months at the time of disposition.
Section 754 Election. We have made the election permitted by Section 754 of the Internal Revenue Code. That election is irrevocable without the consent of the IRS. The election will generally
permit us to adjust a common unit purchaser's tax basis in our assets ("inside basis") under Section 743(b) of the Internal Revenue Code to reflect his purchase price. This election does not apply to a person who purchases common units directly from us. The Section 743(b) adjustment belongs to the purchaser and not to other partners. For purposes of this discussion, a partner's inside basis in our assets will be considered to have two components: (1) his share of our tax basis in our assets ("common basis") and (2) his Section 743(b) adjustment to that basis.
Treasury regulations under Section 743 of the Internal Revenue Code require, if the remedial allocation method is adopted (which we have adopted), a portion of the Section 743(b) adjustment attributable to recovery property to be depreciated over the remaining cost recovery period for the Section 704(c) built-in gain. Under Treasury Regulation Section 1.167(c)-l(a)(6), a Section 743(b) adjustment attributable to property subject to depreciation under Section 167 of the Internal Revenue Code rather than cost recovery deductions under Section 168 is generally required to be depreciated using either the straight-line method or the 150% declining balance method. Under our partnership agreement, the general partner is authorized to take a position to preserve the uniformity of units even if that position is not consistent with these Treasury Regulations. Please read "—Tax Treatment of Operations" and "—Uniformity of Units."
Although counsel is unable to opine as to the validity of this approach because there is no clear authority on this issue, we intend to depreciate the portion of a Section 743(b) adjustment attributable to unrealized appreciation in the value of Contributed Property, to the extent of any unamortized Book-Tax Disparity, using a rate of depreciation or amortization derived from the depreciation or amortization method and useful life applied to the common basis of the property, or treat that portion as non-amortizable to the extent attributable to property the common basis of which is not amortizable. This method is consistent with the regulations under Section 743 but is arguably inconsistent with Treasury Regulation Section 1.167(c)-1(a)(6), which is not expected to directly apply to a material portion of our assets. To the extent this Section 743(b) adjustment is attributable to appreciation in value in excess of the unamortized Book-Tax Disparity, we will apply the rules described in the Treasury Regulations and legislative history. If we determine that this position cannot reasonably be taken, we may take a depreciation or amortization position under which all purchasers acquiring units in the same month would receive depreciation or amortization, whether attributable to common basis or a Section 743(b) adjustment, based upon the same applicable rate as if they had purchased a direct interest in our assets. This kind of aggregate approach may result in lower annual depreciation or amortization deductions than would otherwise be allowable to some unitholders. Please read "—Uniformity of Units."
A Section 754 election is advantageous if the transferee's tax basis in his units is higher than the units' share of the aggregate tax basis of our assets immediately prior to the transfer. In that case, as a result of the election, the transferee would have, among other items, a greater amount of depreciation and depletion deductions and a smaller share of any gain or loss on a sale of our assets. Conversely, a Section 754 election is disadvantageous if the transferee's tax basis in his units is lower than those units' share of the aggregate tax basis of our assets immediately prior to the transfer. Thus, the fair market value of the units may be affected either favorably or unfavorably by the election.
The calculations involved in the Section 754 election are complex and will be made on the basis of assumptions as to the value of our assets and other matters. The determinations we make may be successfully challenged by the IRS and the deductions resulting from them may be reduced or disallowed altogether. For example, the allocation of the Section 743(b) adjustment among our assets
must be made in accordance with the Internal Revenue Code. The IRS could seek to reallocate some or all of any Section 743(b) adjustment allocated by us to our tangible assets to goodwill instead. Goodwill, as an intangible asset, is generally amortizable over a longer period of time or under a less accelerated method than our tangible assets. Should the IRS require a different basis adjustment to be made, and should, in our opinion, the expense of compliance exceed the benefit of the election, we
may seek permission from the IRS to revoke our Section 754 election. If permission is granted, a subsequent purchaser of units may be allocated more income than he would have been allocated had the election not been revoked.
Accounting Method and Taxable Year. We use the year ending December 31 as our taxable year and the accrual method of accounting for federal income tax purposes. Each unitholder will be required to include in income his share of our income, gain, loss and deduction for our taxable year ending within or with his taxable year. In addition, a unitholder who has a taxable year ending on a date other than December 31 and who disposes of all of his units following the close of our taxable year but before the close of his taxable year must include his share of our income, gain, loss and deduction in income for his taxable year, with the result that he will be required to include in income for his taxable year his share of more than one year of our income, gain, loss and deduction. Please read "—Disposition of Common Units—Allocations Between Transferors and Transferees."
Initial Tax Basis, Depreciation and Amortization. The tax basis of our assets will be used for purposes of computing depreciation and cost recovery deductions and, ultimately, gain or loss on the disposition of these assets. The federal income tax burden associated with the difference between the fair market value of our assets and their tax basis immediately prior to this offering will be borne by partners holding interests in us prior to this offering. Please read "—Tax Consequences of Unit Ownership—Allocation of Income, Gain, Loss and Deduction."
To the extent allowable, we may elect to use the depreciation and cost recovery methods that will result in the largest deductions being taken in the early years after assets are placed in service. We are not entitled to any amortization deductions with respect to any goodwill conveyed to us on formation. Property we subsequently acquire or construct may be depreciated using accelerated methods permitted by the Internal Revenue Code.
If we dispose of depreciable property by sale, foreclosure, or otherwise, all or a portion of any gain, determined by reference to the amount of depreciation previously deducted and the nature of the property, may be subject to the recapture rules and taxed as ordinary income rather than capital gain. Similarly, a partner who has taken cost recovery or depreciation deductions with respect to property we own will likely be required to recapture some or all of those deductions as ordinary income upon a sale of his interest in us. Please read "—Tax Consequences of Unit Ownership—Allocation of Income, Gain, Loss and Deduction" and "—Disposition of Common Units—Recognition of Gain or Loss."
The costs incurred in selling our units (called "syndication expenses") must be capitalized and cannot be deducted currently, ratably or upon our termination. There are uncertainties regarding the classification of costs as organization expenses, which may be amortized by us, and as syndication expenses, which may not be amortized by us. The underwriting discounts and commissions we incur will be treated as syndication expenses.
Valuation and Tax Basis of Our Properties. The federal income tax consequences of the ownership and disposition of units will depend in part on our estimates of the relative fair market values, and the initial tax bases, of our assets. Although we may from time to time consult with professional appraisers regarding valuation matters, we will make many of the relative fair market value estimates ourselves. These estimates of basis are subject to challenge and will not be binding on the IRS or the courts. If the estimates of fair market value or basis are later found to be incorrect, the character and amount of
items of income, gain, loss or deductions previously reported by unitholders might change, and unitholders might be required to adjust their tax liability for prior years and may incur interest and penalties with respect to those adjustments.
Recognition of Gain or Loss. Gain or loss will be recognized on a sale of units equal to the difference between the amount realized and the unitholder's tax basis for the units sold. A unitholder's amount realized will be measured by the sum of the cash or the fair market value of other property received plus his share of our nonrecourse liabilities. Because the amount realized includes a unitholder's share of our nonrecourse liabilities, the gain recognized on the sale of units could result in a tax liability in excess of any cash received from the sale.
Prior distributions from us in excess of cumulative net taxable income for a common unit that decreased a unitholder's tax basis in that common unit will, in effect, become taxable income if the common unit is sold at a price greater than the unitholder's tax basis in that common unit, even if the price is less than his original cost.
Except as noted below, gain or loss recognized by a unitholder, other than a "dealer" in units, on the sale or exchange of a unit held for more than one year will generally be taxable as capital gain or loss. Capital gain recognized by an individual on the sale of units held more than 12 months will generally be taxed a maximum rate of 15%. A portion of this gain or loss, which will likely be substantial, however, will be separately computed and taxed as ordinary income or loss under Section 751 of the Internal Revenue Code to the extent attributable to assets giving rise to depreciation recapture or other "unrealized receivables" or to "inventory items" we own. The term "unrealized receivables" includes potential recapture items, including depreciation recapture. Ordinary income attributable to unrealized receivables, inventory items and depreciation recapture may exceed net taxable gain realized upon the sale of a unit and may be recognized even if there is a net taxable loss realized on the sale of a unit. Thus, a unitholder may recognize both ordinary income and a capital loss upon a sale of units. Capital losses may offset capital gains and no more than $3,000 of ordinary income in the case of individuals, and may only be used to offset capital gains in the case of corporations.
The IRS has ruled that a partner who acquires interests in a partnership in separate transactions must combine those interests and maintain a single adjusted tax basis for all those interests. Upon a sale or other disposition of less than all of those interests, a portion of that tax basis must be allocated to the interests sold using an "equitable apportionment" method. Although the ruling is unclear as to how the holding period of these interests is determined once they are combined, Treasury regulations allow a selling unitholder who can identify common units transferred with an ascertainable holding period to elect to use the actual holding period of the common units transferred. Thus, according to the ruling, a common unitholder will be unable to select high or low basis common units to sell as would be the case with corporate stock, but, according to the regulations, may designate specific common units sold for purposes of determining the holding period of units transferred. A unitholder electing to use the actual holding period of common units transferred must consistently use that identification method for all subsequent sales or exchanges of common units. A unitholder considering the purchase of additional units or a sale of common units purchased in separate transactions should consult his tax advisor as to the possible consequences of this ruling and application of the regulations.
Specific provisions of the Internal Revenue Code affect the taxation of some financial products and securities, including partnership interests, by treating a taxpayer as having sold an "appreciated" partnership interest, one in which gain would be recognized if it were sold, assigned or terminated at its fair market value, if the taxpayer or related persons enter(s) into:
Moreover, if a taxpayer has previously entered into a short sale, an offsetting notional principal contract or a futures or forward contract with respect to the partnership interest, the taxpayer will be
treated as having sold that position if the taxpayer or a related person then acquires the partnership interest or substantially identical property. The Secretary of Treasury is also authorized to issue regulations that treat a taxpayer that enters into transactions or positions that have substantially the same effect as the preceding transactions as having constructively sold the financial position.
Allocations Between Transferors and Transferees. In general, our taxable income and losses will be determined annually, will be prorated on a monthly basis and will be subsequently apportioned among the unitholders in proportion to the number of units owned by each of them as of the opening of the NYSE on the first business day of the month (the "Allocation Date"). However, gain or loss realized on a sale or other disposition of our assets other than in the ordinary course of business will be allocated among the unitholders on the Allocation Date in the month in which that gain or loss is recognized. As a result, a unitholder transferring units may be allocated income, gain, loss and deduction realized after the date of transfer.
The use of this method may not be permitted under existing Treasury regulations. Accordingly, counsel is unable to opine on the validity of this method of allocating income and deductions between unitholders. If this method is not allowed under the Treasury regulations, or only applies to transfers of less than all of the unitholder's interest, our taxable income or losses might be reallocated among the unitholders. We are authorized to revise our method of allocation between unitholders to conform to a method permitted under future Treasury Regulations.
A unitholder who owns units at any time during a quarter and who disposes of them prior to the record date set for a cash distribution for that quarter will be allocated items of our income, gain, loss and deductions attributable to that quarter but will not be entitled to receive that cash distribution.
Notification Requirements. A unitholder who sells or exchanges units is required to notify us in writing of that sale or exchange within 30 days after the sale or exchange. We are required to notify the IRS of that transaction and to furnish specified information to the transferor and transferee. However, these reporting requirements do not apply to a sale by an individual who is a citizen of the United States and who effects the sale or exchange through a broker. Additionally, a transferor and a transferee of a unit will be required to furnish statements to the IRS, filed with their income tax returns for the taxable year in which the sale or exchange occurred, that describe the amount of the consideration received for the unit that is allocated to our goodwill or going concern value. Failure to satisfy these reporting obligations may lead to the imposition of substantial penalties.
Constructive Termination. We will be considered to have been terminated for tax purposes if there is a sale or exchange of 50% or more of the total interests in our capital and profits within a 12-month period. A constructive termination results in the closing of our taxable year for all unitholders. In the case of a unitholder reporting on a taxable year other than a fiscal year ending December 31, the closing of our taxable year may result in more than 12 months of our taxable income or loss being includable in his taxable income for the year of termination. We would be required to make new tax elections after a termination, including a new election under Section 754 of the Internal Revenue Code, and a termination would result in a deferral of our deductions for depreciation. A termination could also result in penalties if we were unable to determine that the termination had occurred. Moreover, a termination might either accelerate the application of, or subject us to, any tax legislation enacted before the termination.
Because we cannot match transferors and transferees of units, we must maintain uniformity of the economic and tax characteristics of the units to a purchaser of these units. In the absence of uniformity, we may be unable to completely comply with a number of federal income tax requirements, both statutory and regulatory. A lack of uniformity can result from a literal application of Treasury
Regulation Section 1.167(c)-1(a)-i (a)(6). Any non-uniformity could have a negative impact on the value of the units. Please read "—Tax Consequences of Unit Ownership—Section 754 Election."
We intend to depreciate the portion of a Section 743(b) adjustment attributable to unrealized appreciation in the value of Contributed Property, to the extent of any unamortized Book-Tax Disparity, using a rate of depreciation or amortization derived from the depreciation or amortization method and useful life applied to the common basis of that property, or treat that portion as nonamortizable, to the extent attributable to property the common basis of which is not amortizable, consistent with the regulations under Section 743 even though that portion may be inconsistent with Treasury Regulation Section 1.167(c)-1(a)(6), which is not expected to directly apply to a material portion of our assets. Please read "—Tax Consequences of Unit Ownership—Section 754 Election." To the extent that the Section 743 (b) adjustment is attributable to appreciation in value in excess of the unamortized Book-Tax Disparity, we will apply the rules described in the Treasury Regulations and legislative history. If we determine that this position cannot reasonably be taken, we may adopt a depreciation and amortization position under which all purchasers acquiring units in the same month would receive depreciation and amortization deductions, whether attributable to a common basis or Section 743(b) adjustment, based upon the same applicable rate as if they had purchased a direct interest in our property. If this position is adopted, it may result in lower annual depreciation and amortization deductions than would otherwise be allowable to some unitholders and risk the loss of depreciation and amortization deductions not taken in the year that these deductions are otherwise allowable. This position will not be adopted if we determine that the loss of depreciation and amortization deductions will have a material adverse effect on the unitholders. If we choose not to utilize this aggregate method, we may use any other reasonable depreciation and amortization method to preserve the uniformity of the intrinsic tax characteristics of any units that would not have a material adverse effect on the unitholders. The IRS may challenge any method of depreciating the Section 743(b) adjustment described in this paragraph. If this challenge were sustained, the uniformity of units might be affected, and the gain from the sale of units might be increased without the benefit of additional deductions. Please read "—Disposition of Common Units—Recognition of Gain or Loss."
Tax-Exempt Organizations and Other Investors
Ownership of units by employee benefit plans, other tax-exempt organizations, non-resident aliens, foreign corporations, other foreign persons and regulated investment companies raises issues unique to those investors and, as described below, may have substantially adverse tax consequences to them. Employee benefit plans and most other organizations exempt from federal income tax, including individual retirement accounts and other retirement plans, are subject to federal income tax on unrelated business taxable income. Virtually all of our income allocated to a unitholder which is a tax-exempt organization will be unrelated business taxable income and will be taxable to the unitholder.
AFor tax years beginning on or prior to October 22, 2004, a regulated investment company or "mutual fund" is required to derive 90% or more of its gross income from interest, dividends and gains from the sale of stocks or securities or foreign currency or specified related sources. It is not anticipated that any significant amount of our gross income will include that type of income. Recent legislation adds net income derived from the ownership of an interest in a "qualified publicly traded partnership" to the categories of qualified income for a regulated investment company. We expect that we will meet the definition of a qualified publicly traded partnership. However, this legislation is only effective for taxable years beginning after October 22, 2004.
Non-resident aliens and foreign corporations, trusts or estates that own units will be considered to be engaged in business in the United States because of the ownership of units. As a consequence they will be required to file federal tax returns to report their share of our income, gain, loss or deduction
and pay federal income tax at regular rates on their share of our income or gain. And, under rules applicable to publicly traded partnerships, we will withhold tax at the highest effective applicable rate from cash distributions made quarterly to foreign unitholders. Each foreign unitholder must obtain a
taxpayer identification number from the IRS and submit that number to our transfer agent on a Form W-8 BEN or applicable substitute form in order to obtain credit for these withholding taxes.
In addition, because a foreign corporation that owns units will be treated as engaged in a United States trade or business, that corporation may be subject to United States branch profits tax at a rate of 30%, in addition to regular federal income tax, on its share of our income and gain, as adjusted for changes in the foreign corporation's "U.S. net equity," which is effectively connected with the conduct of a United States trade or business. That tax may be reduced or eliminated by an income tax treaty between the United States and the country in which the foreign corporate unitholder is a "qualified resident." In addition, this type of unitholder is subject to special information reporting requirements under Section 6038C of the Internal Revenue Code.
Under a ruling of the IRS, a foreign unitholder who sells or otherwise disposes of a unit will be subject to federal income tax on gain realized on the disposition of that unit to the extent that this gain is effectively connected with a United States trade or business of the foreign unitholder. Apart from the ruling, a foreign unitholder will not be taxed or subject to withholding upon the disposition of a unit if he has owned less than 5% in value of the units during the five-year period ending on the date of the disposition and if the units are regularly traded on an established securities market at the time of the disposition.
Information Returns and Audit Procedures. We intend to furnish to each unitholder, within 90 days after the close of each calendar year, specific tax information, including a Schedule K-1, which describes his share of our income, gain, loss and deduction for our preceding taxable year. In preparing this information, which will not be reviewed by counsel, we will take various accounting and reporting positions, some of which have been mentioned earlier, to determine the unitholder's share of income, gain, loss and deduction. We cannot assure you that those positions will yield a result that conforms to the requirements of the Internal Revenue Code, regulations or administrative interpretations of the IRS. Neither we nor counsel can assure prospective unitholders that the IRS will not successfully contend in court that those positions are impermissible. Any challenge by the IRS could negatively affect the value of the units.
The IRS may audit our federal income tax information returns. Adjustments resulting from an IRS audit may require each unitholder to adjust a prior year's tax liability, and possibly may result in an audit of that unitholder's own return. Any audit of a unitholder's return could result in adjustments not related to our returns as well as those related to our returns.
Partnerships generally are treated as separate entities for purposes of federal tax audits, judicial review of administrative adjustments by the IRS and tax settlement proceedings. The tax treatment of partnership items of income, gain, loss and deduction are determined in a partnership proceeding rather than in separate proceedings with the partners. The Internal Revenue Code requires that one partner be designated as the "Tax Matters Partner" for these purposes. The partnership agreement appoints the general partner as our Tax Matters Partner.
The Tax Matters Partner has made and will make some elections on our behalf and on behalf of unitholders. In addition, the Tax Matters Partner can extend the statute of limitations for assessment of tax deficiencies against unitholders for items in our returns. The Tax Matters Partner may bind a unitholder with less than a 1% profits interest in us to a settlement with the IRS unless that unitholder elects, by filing a statement with the IRS, not to give that authority to the Tax Matters Partner. The Tax Matters Partner may seek judicial review, by which all the unitholders are bound, of a final partnership
administrative adjustment and, if the Tax Matters Partner fails to seek judicial review, judicial review may be sought by any unitholder having at least a 1% interest in profits or by any group of unitholders having in the aggregate at least a 5% interest in profits. However, only one action for judicial review will go forward, and each unitholder with an interest in the outcome may participate. However, if we
elect to be treated as a large partnership, a unitholder will not have the right to participate in settlement conferences with the IRS or to seek a refund.
A unitholder must file a statement with the IRS identifying the treatment of any item on his federal income tax return that is not consistent with the treatment of the item on our return. Intentional or negligent disregard of the consistency requirement may subject a unitholder to substantial penalties. However, if we elect to be treated as a large partnership, the unitholders would be required to treat all partnership items in a manner consistent with our return.
Nominee Reporting. Persons who hold an interest in us as a nominee for another person are required to furnish to us:
Brokers and financial institutions are required to furnish additional information, including whether they are United States persons and specific information on units they acquire, hold or transfer for their own account. A penalty of $50 per failure, up to a maximum of $100,000 per calendar year, is imposed by the Internal Revenue Code for failure to report that information to us. The nominee is required to supply the beneficial owner of the units with the information furnished to us.
Registration as a Tax Shelter. The Internal Revenue Code requires that "tax shelters" be registered with the Secretary of the Treasury. It is arguable that we are not subject to the registration requirement on the basis that we will not constitute a tax shelter. However, we have registered as a tax shelter with the Secretary of Treasury in the absence of assurance that we will not be subject to tax shelter registration and in light of the substantial penalties which might be imposed if registration is required and not undertaken.
Issuance of this registration number does not indicate that investment in us or the claimed tax benefits have been reviewed, examined or approved by the IRS.
Our tax shelter registration number is 99061000009. A unitholder who sells or otherwise transfers a unit in a later transaction must furnish the registration number to the transferee. The penalty for failure of the transferor of a unit to furnish the registration number to the transferee is $100 for each failure. The unitholders must disclose our tax shelter registration number on Form 8271 to be attached to the tax return on which any deduction, loss or other benefit we generate is claimed or on which any of our income is included. A unitholder who fails to disclose the tax shelter registration number on his return, without reasonable cause for that failure, will be subject to a $250 penalty for each failure. Any penalties discussed are not deductible for federal income tax purposes.
Recently issued Treasury Regulations require taxpayers to report certain information on Internal Revenue Service Form 8886 if they participate in a "reportable transaction." Unitholders may be required to file this form with the IRS if we participate in a "reportable transaction." A transaction may be a reportable transaction based upon any of several factors. Unitholders are urged to consult with their own tax advisor concerning the application of any of these factors to their investment in our common units. Congress is considering legislative proposals that, if enacted, would impose significant penalties for failure to comply with these disclosure requirements. The Treasury Regulations also impose obligations on "material advisors" that organize, manage or sell interests in registered "tax shelters." As stated above, we have registered as a tax shelter, and, thus, one of our material advisors will be required to maintain a list with specific information, including unitholder names and tax identification numbers, and to furnish this information to the IRS upon request. Unitholders are urged to consult with their own tax advisor concerning any possible disclosure obligation with respect to their investment and should be aware that we and our material advisors intend to comply with the list and disclosure requirements.
Accuracy-related Penalties. An additional tax equal to 20% of the amount of any portion of an underpayment of tax that is attributable to one or more specified causes, including negligence or disregard of rules or regulations, substantial understatements of income tax and substantial valuation misstatements, is imposed by the Internal Revenue Code. No penalty will be imposed, however, for any portion of an underpayment if it is shown that there was a reasonable cause for that portion and that the taxpayer acted in good faith regarding that portion.
A substantial understatement of income tax in any taxable year exists if the amount of the understatement exceeds the greater of 10% of the tax required to be shown on the return for the taxable year or $5,000 ($10,000 for most corporations).$5,000. The amount of any understatement subject to penalty generally is reduced if any portion is attributable to a position adopted on the return:
More stringent rules apply to "tax shelters," a term that in this context does not appear to include us. If any item of income, gain, loss or deduction included in the distributive shares of unitholders might result in that kind of an "understatement" of income for which no "substantial authority" exists, we must disclose the pertinent facts on our return. In addition, we will make a reasonable effort to furnish sufficient information for unitholders to make adequate disclosure on their returns to avoid liability for this penalty. More stringent rules apply to "tax shelters," which we do not believe includes us.
A substantial valuation misstatement exists if the value of any property, or the adjusted basis of any property, claimed on a tax return is 200% or more of the amount determined to be the correct amount of the valuation or adjusted basis. No penalty is imposed unless the portion of the
underpayment attributable to a substantial valuation misstatement exceeds $5,000 ($10,000 for most corporations).$5,000. If the valuation claimed on a return is 400% or more than the correct valuation, the penalty imposed increases to 40%.
Reportable Transactions. If we were to engage in a "reportable transaction," we (and possibly you and others) would be required to make a detailed disclosure of the transaction to the IRS. A transaction may be a reportable transaction based upon any of several factors, including the fact that it is a type of tax avoidance transaction publicly identified by the IRS as a "listed transaction" or that it produces certain kinds of losses in excess of $2 million. Our participation in a reportable transaction could increase the likelihood that our federal income tax information return (and possibly your tax return) would be audited by the IRS. Please read "—Information Returns and Audit Procedures" above.
Moreover, if we were to participate in a reportable transaction with a significant purpose to avoid or evade tax, or in any listed transaction, you may be subject to the following provisions of the American Jobs Creation Act of 2004:
We do not expect to engage in any "reportable transactions."
State, Local and Other Tax Considerations
In addition to federal income taxes, you may be subject to other taxes, such as state and local and Canadian federal and provincial taxes, unincorporated business taxes, and estate, inheritance or intangible taxes that may be imposed by the various jurisdictions in which we do business or own property. Although an analysis of those various taxes is not presented herein, each prospective unitholder should consider their potential impact on his investment in us. We will own property or conduct business in Canada and in most states of the United States. A unitholder may be required to
file Canadian federal income tax returns and to pay Canadian federal and provincial income taxes and to file state income tax returns and to pay taxes in various states and may be subject to penalties for failure to comply with such requirements. In certain states, tax losses may not produce a tax benefit in the year incurred (if, for example, we have no income from sources within that state) and also may not be available to offset income in subsequent taxable years. Some of the states may require us to withhold a percentage of income from amounts to be distributed to a unitholder who is not a resident of the state. Withholding, the amount of which may be greater or less than a particular unitholder's income tax liability to the state, generally does not relieve the non-resident unitholder from the obligation to file an income tax return. Amounts withheld may be treated as if distributed to unitholders for purposes of determining the amount distributed by us. Please read "—Tax Consequences of Unit Ownership." We may also own additional property or do business in other states in the future.
It is the responsibility of each unitholder to investigate the legal and tax consequences, under the laws of pertinent states and localities, including the Canadian provinces and Canada, of his investment in us. Accordingly, each prospective unitholder should consult, and must depend upon, his own tax counsel or other advisor with regard to those matters. Further, it is the responsibility of each unitholder to file all Canadian, Canadian province, state and local, as well as federal tax returns that may be required of him. Counsel has not rendered an opinion on the Canadian federal, Canadian provincial, state or local tax consequences of an investment in us.
This prospectus covers the offering for resale of up to 3,245,70019,469,207 common units by selling unitholders. These common units are issuable upon the conversion of our outstanding Class C common units. The Class C common units will not be eligible for conversion into common units until such conversion has been approved by a vote of our common unitholders. It is currently anticipated that this approval will be received at a special meeting of our unitholders to be held in early 2005. No selling unitholder may offer or sell our common units under this prospectus unless the conversion of the Class C common units into common units has been approved by our common unitholders. In addition, no such sales may occur unless the selling unitholder has notified us of his or her intention to sell our common units and this prospectus has been declared effective by the SEC, and remains effective at the time such selling unitholder offers or sells such common units. We are required to update this prospectus to reflect material developments in our business, financial position and results of operations. The following table sets forth information relating to the selling unitholders' beneficial ownership of our Class C common units and the common units into which they may be convertible. Additional information with respect to the holders of the Class C common units is contained in this prospectus under the caption "Security Ownership of Certain Beneficial Owners and Management and Related Unitholders Matters."units:
| Selling Unitholders | Number of Class C Common Units Beneficially Owned | Number of Common Units Offered Hereunder | Number and Percentage of Common Units to be Owned Following Completion of this Offering | Number of Common Units Owned Prior to the Offering | Amount of Common Units being Offered | Amount of Units to be Owned after Completion of the Offering | Percentage of Common Units to be Owned after Completion of the Offering | ||||||||
|---|---|---|---|---|---|---|---|---|---|---|---|---|---|---|---|
| Kayne Anderson Capital Advisors, L.P.(1) | 1,460,565 | 1,460,565 | 3,147,427/6.8% | ||||||||||||
| Vulcan Energy II Inc.(2) | 1,298,280 | 1,298,280 | — | ||||||||||||
| Plains Holdings II Inc.(1) | 11,082,930 | 11,082,930 | 0 | — | |||||||||||
| Plains Holdings Inc.(1) | 1,307,190 | 1,307,190 | 0 | — | |||||||||||
| Plains AAP, L.P.(2) | 446,875 | 446,875 | 0 | — | |||||||||||
| Sable Holdings, L.P. | 609,446 | 609,446 | 0 | — | |||||||||||
| Kayne Anderson Capital Advisors, L.P.(4) | 5,355,391 | 3,055,887 | 2,299,504 | 3.4 | % | ||||||||||
| Vulcan Private Equity I LLC(5) | 1,298,280 | 1,298,280 | 0 | — | |||||||||||
| Tortoise Energy Infrastructure Corporation | 486,855 | 486,855 | 763,435/1.2% | 1,215,255 | 1,142,760 | 72,495 | * | ||||||||
| Wachovia Investors, Inc. | 328,668 | 328,668 | 0 | — | |||||||||||
| Strome Hedgecap Fund, L.P. | 100,000 | 100,000 | 0 | — | |||||||||||
| John T. Raymond(3) | 403,117 | 97,171 | 305,946 | * | |||||||||||
Any prospectus supplement reflecting a sale of common units hereunder will set forth, with respect to the selling unitholders:
All expenses incurred with the registration of the common units owned by the selling unitholders will be borne by us.
We are registering the common units on behalf of the selling unitholders. As used in this prospectus, "selling unitholders" includes donees and pledgees selling common units received from a named selling unitholder after the date of this prospectus.
Under this prospectus, the selling unitholders intend to offer our securities to the public:
The selling unitholders may price the common units offered from time to time:
We will pay the costs and expenses of the registration and offering of the common units offered hereby. We will not pay any underwriting fees, discounts and selling commissions allocable to each selling unitholder's sale of its respective common units, which will be paid by the selling unitholders. Broker-dealers may act as agent or may purchase securities as principal and thereafter resell the securities from time to time:
Broker-dealers or underwriters may receive compensation in the form of underwriting discounts or commissions and may receive commissions from purchasers of the securities for whom they may act as agents. If any broker-dealer purchases the securities as principal, it may effect resales of the securities from time to time to or through other broker-dealers, and other broker-dealers may receive compensation in the form of concessions or commissions from the purchasers of securities for whom they may act as agents.
To the extent required, the names of the specific managing underwriter or underwriters, if any, as well as other important information, will be set forth in prospectus supplements. In that event, the discounts and commissions the selling unitholders will allow or pay to the underwriters, if any, and the discounts and commissions the underwriters may allow or pay to dealers or agents, if any, will be set forth in, or may be calculated from, the prospectus supplements. Any underwriters, brokers, dealers and agents who participate in any sale of the securities may also engage in transactions with, or perform services for, us or our affiliates in the ordinary course of their businesses.
In addition, the selling unitholders have advised us that they may sell common units in compliance with Rule 144, if available, or pursuant to other available exemptions from the registration requirements under the Securities Act, rather than pursuant to this prospectus.
To the extent required, this prospectus may be amended or supplemented from time to time to describe a specific plan of distribution.
In connection with offerings under this shelf registration and in compliance with applicable law, underwriters, brokers or dealers may engage in transactions which stabilize or maintain the market price of the securities at levels above those which might otherwise prevail in the open market. Specifically, underwriters, brokers or dealers may over-allot in connection with offerings, creating a short position in the securities for their own accounts. For the purpose of covering a syndicate short position or stabilizing the price of the securities, the underwriters, brokers or dealers may place bids for the securities or effect purchases of the securities in the open market. Finally, the underwriters may impose a penalty whereby selling concessions allowed to syndicate members or other brokers or dealers for distribution the securities in offerings may be reclaimed by the syndicate if the syndicate repurchases previously distributed securities in transactions to cover short positions, in stabilization transactions or otherwise. These activities may stabilize, maintain or otherwise affect the market price of the securities, which may be higher than the price that might otherwise prevail in the open market, and, if commenced, may be discontinued at any time.
The validity of the common units will be passed upon for Plains All American Pipeline by Vinson & Elkins L.L.P., Houston, Texas. The selling unitholders' counsel and the underwriters' own legal counsel will advise them about other issues relating to any offering in which they participate.
The consolidated financial statements of Plains All American Pipeline, L.P. as of December 31, 20032004 and 20022003 and for each of the three years in the period ended December 31, 20032004 and management's assessment of the balance sheeteffectiveness of Plains AAP, L.P.internal control over financial reporting (which is included in Management's Report on Internal Control over Financial Reporting) as of December 31, 20032004 included in this Prospectus have been so included in reliance on the reportsreport of PricewaterhouseCoopers LLP, an independent registered public accounting firm, given on the authority of said firm as experts in auditing and accounting.
The combined financial statements of the Capline Pipe Line Business, Capwood Pipe Line Business and Patoka Pipe Line Business (the "Businesses")balance sheet as of December 31, 2003 and 2002 and for the year ended December 31, 2003 and for the periods from February 14, 2002 through December 31, 2002 and January 1, 2002 through February 13, 20022004 of Plains AAP, L.P. included in this Prospectus havehas been so included in reliance on the report (which report contains an explanatory paragraph relating to the Businesses being sold to Plains All American Pipeline, L.P. as described in Note 6 to the combined financial statements) of PricewaterhouseCoopers LLP, an independent registered public accounting firm, given on the authority of said firm as experts in auditing and accounting.
The consolidated financial statements of Link Energy LLC and its subsidiaries (Successor Company) at December 31, 2003 and for the period from March 1, 2003 to December 31, 2003 and of EOTT Energy Partners, L.P. and its subsidiaries (Predecessor Company) at December 31, 2002 and for the period from January 1, 2003 to February 28, 2003 and for each of the two years in the period ended December 31, 2002 included in this Prospectus have been so included in reliance on the reports (which contain an explanatory paragraph relating to the Successor Company's and Predecessor Company's ability to continue as a going concern as described in Note 3 to the consolidated financial statements, an explanatory paragraph relating to the adoption of fresh start accounting as described in Note 1 to the consolidated financial statements and an explanatory paragraph relating to the restatement of the financial results as described in Notes 1 and 10 to the consolidated financial statements) of PricewaterhouseCoopers LLP, an independent registered public accounting firm, given on the authority of said firm as experts in auditing and accounting.
WHERE YOU CAN FIND MORE INFORMATION
We file annual, quarterly and special reports and other information with the Securities and Exchange Commission under the Securities Exchange Act of 1934. You can inspect and/or copy these reports and other information at offices maintained by the SEC, including:
In addition, please call the SEC at 1-800-732-0330 for further information on their public reference room.
Further, our common units are listed on the New York Stock Exchange, and you can inspect similar information at the offices of the New York Stock Exchange, located at 20 Broad Street, New York, New York 10005.
You can read and copy any of our materials filed with the SEC at our website athttp://www.paalp.com or you may request a copy of these filings at no cost by making written or telephone requests for copies to:
Plains All American Pipeline, L.P.
333 Clay Street, Suite 1600
Houston, Texas 77002
Attention: Tim Moore
Telephone: (713) 646-4100
You should rely only on the information provided in this prospectus. The information contained on our website is not a part of this prospectus. We have not authorized anyone else to provide you with any information. You should not assume that the information provided in this prospectus is accurate as of any date other than the date on the cover of this prospectus.
All statements, other than statements of historical fact, included in this prospectusreport are forward-looking statements, including, but not limited to, statements identified by the words "anticipate," "believe," "estimate," "expect," "plan," "intend" and "forecast," and similar expressions and statements regarding our business strategy, plans and objectives of our management for future operations. These statements reflect our current views with respect to future events, based on what we believe are reasonable assumptions. Certain factors could cause actual results to differ materially from results anticipated in the forward-looking statements. These factors include, but are not limited to:
Other factors described herein, or factors that are unknown or unpredictable, could also have a material adverse effect on future results. Please read "Risk Factors" beginning on page 2and "Management's Discussion and Analysis of this prospectus.Financial Condition and Results of Operations." Except as required by applicable securities laws, we do not intend to update these forward-looking statements and information.
PLAINS ALL AMERICAN PIPELINE, L.P.UNAUDITED PRO FORMA COMBINEDMANAGEMENT'S REPORT ON INTERNAL CONTROL OVER FINANCIAL STATEMENTSREPORTING
Plains All American Pipeline, L.P. ("PAA")'s management is responsible for establishing and maintaining adequate internal control over financial reporting. Our internal control over financial reporting is a publicly traded Delaware limited partnership engaged in interstateprocess designed to provide reasonable assurance regarding the reliability of financial reporting and intrastate crude oil transportation, and crude oil gathering, marketing, terminalling and storage, as well as the marketing and storagepreparation of liquefied petroleum gas and other petroleum products. The following unaudited pro forma financial statements are presented to give effect to the transactions described below:
The acquisition of the North American crude oil and pipeline operations of Link Energy LLC, ("Link Energy" and the "Link acquisition"). The acquisition price of approximately $326 million includes the assumption of liabilities and net working capital items and transaction and other acquisition costs. The acquisition closed and was effective on April 1, 2004 and has been accounted for using the purchase method of accounting.
The acquisition of Shell Pipeline Company LP's ("SPLC") interest in certain entities. The principal assets of the entities include interests in the Capline Pipe Line System, the Capwood Pipe Line System and the Patoka Pipe Line System (referred to in this report as "the SPLC acquisition"). The purchase price, including transaction and closing costs, was approximately $158.5 million. The acquisition closed and was effective on March 1, 2004. The acquisition has been accounted for using the purchase method of accounting.
The transactions described above are included in PAA's historical unaudited consolidated balance sheet as of June 30, 2004. Accordingly, a pro forma balance sheet is not presented. The unaudited pro forma statements of operations for the six months ended June 30, 2004 and the year ended December 31, 2003 are based upon the following:
The unaudited pro forma combined statements of operations are not necessarily indicative of the results of the actual or future operations that would have been achieved had the transactions occurred at the dates assumed (as noted below). The unaudited pro forma combined statements of operations should be read in conjunction with: i) the notes thereto; ii) the historical unaudited financial statements of PAA for the six months ended June 30, 2004; iii) the historical unaudited financial statements of Link Energy for the three months ended March 31, 2004; and iv) the audited financial statements of PAA for the year ended December 31, 2003, as well as those for Link Energy and the businesses acquired in the SPLC acquisition, for the same period.
The following unaudited pro forma combined statements of operations for the six months ended June 30, 2004 and the year ended December 31, 2003 have been prepared as if the transactions described above had taken place at the beginning of the period presented.
PLAINS ALL AMERICAN PIPELINE, L.P. AND SUBSIDIARIESUNAUDITED PRO FORMA COMBINED STATEMENT OF OPERATIONSFor the Six Months Ended June 30, 2004(in thousands, except per unit data)
| | Plains All American Historical | Link Energy Historical | SPLC Acquisition Historical | Pro Forma Acquisition Adjustments | Plains All American Pro Forma | ||||||||||||
|---|---|---|---|---|---|---|---|---|---|---|---|---|---|---|---|---|---|
| REVENUES | $ | 8,936,379 | $ | 40,682 | $ | 7,416 | $ | (465 | )(a) | $ | 8,984,012 | ||||||
COSTS AND EXPENSES | |||||||||||||||||
| Purchases and related costs | 8,685,372 | 8,081 | — | (465 | )(a) | 8,692,988 | |||||||||||
Field operating costs (excluding LTIP charge) | 96,851 | 20,725 | 2,023 | — | 119,599 | ||||||||||||
| LTIP charge—operations | 567 | — | — | — | 567 | ||||||||||||
| General and administrative expenses (excluding LTIP charge) | 35,081 | 18,514 | — | — | 53,595 | ||||||||||||
| LTIP charge — general and administrative | 3,661 | — | — | — | 3,661 | ||||||||||||
| Depreciation and amortization | 29,118 | 5,060 | 874 | (5,934 2,571 | )(b) (c) | 31,689 | |||||||||||
| Total costs and expenses | 8,850,650 | 52,380 | 2,897 | (3,828 | ) | 8,902,099 | |||||||||||
| Other, net | — | (20 | ) | — | — | (20 | ) | ||||||||||
| Gains on sales of assets | — | 730 | (e) | — | — | 730 | |||||||||||
| OPERATING INCOME | 85,729 | (10,988 | ) | 4,519 | 3,363 | 82,623 | |||||||||||
OTHER INCOME/(EXPENSE) | |||||||||||||||||
| Interest expense | (19,499 | ) | (11,531 | ) | — | (2,893 | )(d) | (33,923 | ) | ||||||||
Interest and other income (expense), net | 453 | (24 | ) | — | — | 429 | |||||||||||
| Income from continuing operations before cumulative effect of change in accounting principle | 66,683 | (22,543 | ) | 4,519 | 470 | 49,129 | |||||||||||
| Cumulative effect of change in accounting principle | (3,130 | ) | — | — | — | (3,130 | ) | ||||||||||
| NET INCOME (LOSS) FROM CONTINUING OPERATIONS | $ | 63,553 | $ | (22,543 | ) | $ | 4,519 | $ | 470 | $ | 45,999 | ||||||
| NET INCOME FROM CONTINUING OPERATIONS—LIMITED PARTNERS | $ | 58,954 | $ | 41,751 | |||||||||||||
| NET INCOME FROM CONTINUING OPERATIONS—GENERAL PARTNER | $ | 4,599 | $ | 4,248 | |||||||||||||
| BASIC AND DILUTED NET INCOME FROM CONTINUING OPERATIONS PER LIMITED PARTNER UNIT | |||||||||||||||||
| Income from continuing operations before cumulative effect of change in accounting principle | $ | 1.03 | $ | 0.75 | |||||||||||||
| Cumulative effect of change in accounting principle | (0.05 | ) | (0.05 | ) | |||||||||||||
| Net income from continuing operations | $ | 0.98 | $ | 0.70 | |||||||||||||
| BASIC AND DILUTED WEIGHTED AVERAGE UNITS OUTSTANDING | 59,985 | 59,985 | |||||||||||||||
See notes to unaudited pro forma combined financial statements
PLAINS ALL AMERICAN PIPELINE, L.P. AND SUBSIDIARIESUNAUDITED PRO FORMA COMBINED STATEMENT OF OPERATIONSFor the Twelve Months Ended December 31, 2003(in thousands, except per unit data)
| | | Link Energy Historical | | | | |||||||||||||||
|---|---|---|---|---|---|---|---|---|---|---|---|---|---|---|---|---|---|---|---|---|
| | | Successor Company | Predecessor Company | | | | ||||||||||||||
| | Plains All American Historical | Ten Months Ended December 31, 2003 | Two Months Ended February 28, 2003 | SPLC Acquisition Historical | Pro Forma Acquisition Adjustments | Plains All American Pro Forma | ||||||||||||||
| REVENUES | $ | 12,589,849 | $ | 153,033 | $ | 31,635 | $ | 35,855 | $ | (2,828 | )(a) | $ | 12,807,544 | |||||||
COSTS AND EXPENSES | ||||||||||||||||||||
| Purchases and related costs | 12,232,536 | 23,863 | 4,521 | — | (2,828 | )(a) | 12,258,092 | |||||||||||||
Field operating costs (excluding LTIP charge) | 134,177 | 70,102 | 13,020 | 10,574 | — | 227,873 | ||||||||||||||
| LTIP charge—operations | 5,727 | — | — | — | — | 5,727 | ||||||||||||||
| General and administrative expenses (excluding LTIP charge) | 49,969 | 45,959 | 6,846 | 1,275 | — | 104,049 | ||||||||||||||
| LTIP charge—general and administrative | 23,063 | — | — | — | — | 23,063 | ||||||||||||||
| Depreciation and amortization | 46,821 | 17,161 | 4,642 | 5,264 | (27,067 11,607 | )(b) (c) | 58,428 | |||||||||||||
| Total costs and expenses | 12,492,293 | 157,085 | 29,029 | 17,113 | (18,288 | ) | 12,677,232 | |||||||||||||
| Other, net | — | 1,982 | 8 | — | — | 1,990 | ||||||||||||||
| Gains on sales of assets | 648 | 11,885 | (e) | — | — | (11,700 | )(f) | 833 | ||||||||||||
| OPERATING INCOME | 98,204 | 9,815 | 2,614 | 18,742 | 3,760 | 133,135 | ||||||||||||||
OTHER INCOME/(EXPENSE) | ||||||||||||||||||||
| Interest expense | (35,226 | ) | (32,708 | ) | (5,645 | ) | — | (13,206 | )(d) | (86,785 | ) | |||||||||
Interest and other income (expense), net | (3,530 | ) | 192 | 156 | — | — | (3,182 | ) | ||||||||||||
| Income (Loss) from Continuing Operations Before Reorganization Items, Net Gain on Discharge of Debt and Fresh Start Adjustments | 59,448 | (22,701 | ) | (2,875 | ) | 18,742 | (9,446 | ) | 43,168 | |||||||||||
Reorganization Items | — | — | (7,330 | ) | — | — | (7,330 | ) | ||||||||||||
| Net Gain on Discharge of Debt | — | — | 131,560 | — | — | 131,560 | ||||||||||||||
| Fresh Start Adjustments | — | — | (56,771 | ) | — | — | (56,771 | ) | ||||||||||||
| NET INCOME (LOSS) FROM CONTINUING OPERATIONS | $ | 59,448 | $ | (22,701 | ) | $ | 64,584 | $ | 18,742 | $ | (9,446 | ) | $ | 110,627 | ||||||
| NET INCOME FROM CONTINUING OPERATIONS—LIMITED PARTNERS | $ | 53,473 | $ | 103,628 | ||||||||||||||||
| NET INCOME FROM CONTINUING OPERATIONS—GENERAL PARTNER | $ | 5,975 | $ | 6,999 | ||||||||||||||||
| BASIC NET INCOME FROM CONTINUING OPERATIONS PER LIMITED PARTNER UNIT | $ | 1.01 | $ | 1.96 | ||||||||||||||||
| DILUTED NET INCOME FROM CONTINUING OPERATIONS PER LIMITED PARTNER UNIT | $ | 1.00 | $ | 1.94 | ||||||||||||||||
| BASIC WEIGHTED AVERAGE UNITS OUTSTANDING | 52,743 | 52,743 | ||||||||||||||||||
| DILUTED WEIGHTED AVERAGE UNITS OUTSTANDING | 53,400 | 53,400 | ||||||||||||||||||
See notes to unaudited pro forma combined financial statements
PLAINS ALL AMERICAN PIPELINE, L.P. AND SUBSIDIARIESNOTES TO UNAUDITED PRO FORMA COMBINED FINANCIAL STATEMENTS
Note 1—Acquisitions
Link Acquisition
The Link acquisition presented in these pro forma statements has been accounted for using the purchase method of accounting and the purchase price has been allocatedexternal purposes in accordance with Statementgenerally accepted accounting principles.
Internal control over financial reporting cannot provide absolute assurance of Financial Accounting Standards No. 141, "Business Combinations." The acquisition consistsachieving financial reporting objectives because of its inherent limitations. Internal control over financial reporting is a process that involves human diligence and compliance and is subject to lapses in judgment and breakdowns resulting from human failures. Internal control over financial reporting also can be circumvented by collusion or improper management override. Because of such limitations, there is a risk that material misstatements may not be prevented or detected on a timely basis by internal control over financial reporting. However, these inherent limitations are known features of the North American crude oil and pipeline operations of Link Energy. The purchase price of approximately $326 million includes cash paid of approximately $268 million and approximately $58 million of net liabilities assumed and acquisition related costs. The acquisition closed and was effective on April 1, 2004. The total purchase price and the related allocation are preliminary as we are infinancial reporting process. Therefore, it is possible to design into the process of evaluating certain estimates. The purchase price allocation issafeguards to reduce, though not eliminate, this risk.
Management has used the framework set forth in the table below (in millions):
| Fair value of assets acquired: | |||||
| Property and equipment | $ | 256.3 | |||
| Inventory | 1.1 | ||||
| Linefill | 48.4 | ||||
| Inventory in third party assets | 15.1 | ||||
| Goodwill | 5.0 | ||||
| Other long term assets | 0.2 | ||||
| Subtotal | 326.1 | ||||
Accounts receivable | 405.4 | ||||
| Other current assets | 1.8 | ||||
| Subtotal | 407.2 | ||||
Total assets acquired | 733.3 | ||||
Fair value of liabilities assumed: | |||||
| Accounts payable and accrued liabilities | (448.9 | ) | |||
| Other current liabilities | (8.5 | ) | |||
| Other long-term liabilities | (7.4 | ) | |||
| Total liabilities assumed | (464.8 | ) | |||
Cash paid for acquisition | $ | 268.5 | (1) | ||
SPLC Acquisition
The SPLC acquisition presented in these pro forma statements has been accounted for using the purchase method of accounting and the purchase price has been allocated in accordance with Statement of Financial Accounting Standards No. 141, "Business Combinations." The purchase consistsSponsoring Organizations of the acquisition of Shell Pipeline Company LP'sTreadway Commission ("SPLC"COSO") interest in certain entities. The principal assetsto evaluate the effectiveness of the entities include interests in certain businesses from Shell Pipeline Company, including its interests in the Capline Pipe Line System, the Capwood Pipe Line System and the Patoka Pipe Line System. The purchase price of approximately $158.5 million includes transaction and closing costs. The
acquisition closed and was effective on March 1, 2004. The purchase price allocation is as follows (in millions):
| Crude oil pipelines and facilities | $ | 151.4 | |
| Crude oil storage and terminal facilities | 5.7 | ||
| Land | 1.3 | ||
| Office equipment and other | 0.1 | ||
| Total | $ | 158.5 | |
Note 2—Pro Forma Adjustments
The pro forma adjustments are as follows:
PLAINS ALL AMERICAN PIPELINE, L.P. AND SUBSIDIARIESCONSOLIDATED BALANCE SHEETS(in thousands, except unit data)
| | June 30, 2004 | December 31, 2003 | ||||||
|---|---|---|---|---|---|---|---|---|
| | (unaudited) | |||||||
| ASSETS | ||||||||
CURRENT ASSETS | ||||||||
| Cash and cash equivalents | $ | 12,056 | $ | 4,137 | ||||
| Trade accounts receivable, net | 645,295 | 590,645 | ||||||
| Inventory | 128,534 | 105,967 | ||||||
| Other current assets | 43,564 | 32,225 | ||||||
| Total current assets | 829,449 | 732,974 | ||||||
| PROPERTY AND EQUIPMENT | 1,730,496 | 1,272,634 | ||||||
| Accumulated depreciation | (147,949 | ) | (121,595 | ) | ||||
| 1,582,547 | 1,151,039 | |||||||
| OTHER ASSETS | ||||||||
| Pipeline linefill in owned assets | 148,680 | 95,928 | ||||||
| Inventory in third party assets | 38,745 | 26,725 | ||||||
| Other, net | 82,483 | 88,965 | ||||||
| Total assets | $ | 2,681,904 | $ | 2,095,631 | ||||
| LIABILITIES AND PARTNERS' CAPITAL | ||||||||
CURRENT LIABILITIES | ||||||||
| Accounts payable | $ | 763,659 | $ | 603,460 | ||||
| Due to related parties | 27,195 | 26,981 | ||||||
| Short-term debt | 21,989 | 127,259 | ||||||
| Other current liabilities | 42,803 | 44,219 | ||||||
| Total current liabilities | 855,646 | 801,919 | ||||||
| LONG-TERM LIABILITIES | ||||||||
| Long-term debt under credit facilities | 485,774 | 70,000 | ||||||
| Senior notes, net of unamortized discount of $957 and $1,009, respectively | 449,043 | 448,991 | ||||||
| Other long-term liabilities and deferred credits | 25,922 | 27,994 | ||||||
| Total liabilities | 1,816,385 | 1,348,904 | ||||||
| COMMITMENTS AND CONTINGENCIES (NOTE 9) | ||||||||
PARTNERS' CAPITAL | ||||||||
| Common unitholders (57,724,722 and 49,502,556 units outstanding at June 30, 2004, and December 31, 2003, respectively) | 722,110 | 744,073 | ||||||
| Class B common unitholder (1,307,190 units outstanding at each date) | 17,951 | 18,046 | ||||||
| Class C common unitholders (3,245,700 units and no units outstanding at June 30, 2004, and December 31, 2003, respectively) | 98,297 | — | ||||||
| Subordinated unitholders (no units and 7,522,214 units outstanding at June 30, 2004, and December 31, 2003, respectively) | — | (39,913 | ) | |||||
| General partner | 27,161 | 24,521 | ||||||
| Total partners' capital | 865,519 | 746,727 | ||||||
| Total liabilities and partners' capital | $ | 2,681,904 | $ | 2,095,631 | ||||
The accompanying notes are an integral part of these consolidated financial statements.
PLAINS ALL AMERICAN PIPELINE, L.P. AND SUBSIDIARIESCONSOLIDATED STATEMENTS OF OPERATIONS(in thousands, except per unit data)
| | Six Months Ended June 30, | |||||||
|---|---|---|---|---|---|---|---|---|
| | 2004 | 2003 | ||||||
| | (unaudited) | |||||||
| REVENUES | ||||||||
| Crude oil and LPG sales | $ | 8,555,451 | $ | 5,672,571 | ||||
| Other gathering, marketing, terminalling and storage revenues | 16,727 | 15,957 | ||||||
| Pipeline margin activities revenues | 281,166 | 252,686 | ||||||
| Pipeline tariff activities revenues | 83,035 | 49,883 | ||||||
| Total revenues | 8,936,379 | 5,991,097 | ||||||
COSTS AND EXPENSES | ||||||||
| Crude oil and LPG purchases and related costs | 8,416,244 | 5,569,420 | ||||||
| Pipeline margin activities purchases | 269,128 | 243,131 | ||||||
| Field operating costs (excluding LTIP charge) | 96,851 | 65,689 | ||||||
| LTIP charge—operations | 567 | — | ||||||
| General and administrative expenses (excluding LTIP charge) | 35,081 | 25,233 | ||||||
| LTIP charge—general and administrative | 3,661 | — | ||||||
| Depreciation and amortization | 29,118 | 22,176 | ||||||
| Total costs and expenses | 8,850,650 | 5,925,649 | ||||||
| OPERATING INCOME | 85,729 | 65,448 | ||||||
| OTHER INCOME/(EXPENSE) | ||||||||
| Interest expense (net of $219 and $244 capitalized for the three month periods, respectively, and $397 and $296 capitalized for the six month periods, respectively) | (19,499 | ) | (17,686 | ) | ||||
| Interest and other income (expense), net | 453 | (13 | ) | |||||
| Income before cumulative effect of change in accounting principle | 66,683 | 47,749 | ||||||
| Cumulative effect of change in accounting principle | (3,130 | ) | — | |||||
| NET INCOME | $ | 63,553 | $ | 47,749 | ||||
| NET INCOME-LIMITED PARTNERS | $ | 58,954 | $ | 44,566 | ||||
| NET INCOME-GENERAL PARTNER | $ | 4,599 | $ | 3,183 | ||||
| BASIC AND DILUTED NET INCOME PER LIMITED PARTNER UNIT | ||||||||
| Income before cumulative effect of change in accounting principle | $ | 1.03 | $ | 0.87 | ||||
| Cumulative effect of change in accounting principle | (0.05 | ) | — | |||||
| Net income | $ | 0.98 | $ | 0.87 | ||||
| WEIGHTED AVERAGE UNITS OUTSTANDING | 59,985 | 51,200 | ||||||
The accompanying notes are an integral part of these consolidated financial statements.
PLAINS ALL AMERICAN PIPELINE, L.P. AND SUBSIDIARIESCONSOLIDATED STATEMENTS OF CASH FLOWS(in thousands)
| | Six Months Ended June 30, | ||||||||
|---|---|---|---|---|---|---|---|---|---|
| | 2004 | 2003 | |||||||
| | (unaudited) | ||||||||
| CASH FLOWS FROM OPERATING ACTIVITIES | |||||||||
| Net income | $ | 63,553 | $ | 47,749 | |||||
| Adjustments to reconcile to cash flows from operating activities: | |||||||||
| Depreciation and amortization | 29,118 | 22,176 | |||||||
| Cumulative effect of change in accounting principle | 3,130 | ||||||||
| Change in derivative fair value | (556 | ) | (1,155 | ) | |||||
| Noncash portion of LTIP charge | 4,228 | — | |||||||
| Noncash amortization of terminated interest rate swap | 714 | — | |||||||
| Changes in assets and liabilities, net of acquisitions: | |||||||||
| Accounts receivable and other | (28,575 | ) | 52,402 | ||||||
| Inventory | (24,135 | ) | 41,015 | ||||||
| Accounts payable and other current liabilities | 99,423 | 35,718 | |||||||
| Settlement of environmental indemnities | — | 4,600 | |||||||
| Due to related parties | 210 | 2,292 | |||||||
| Net cash provided by operating activities | 147,110 | 204,797 | |||||||
| CASH FLOWS FROM INVESTING ACTIVITIES | |||||||||
| Cash paid in connection with acquisitions (Note 2) | (443,210 | ) | (79,616 | ) | |||||
| Additions to property and equipment | (32,170 | ) | (37,492 | ) | |||||
| Cash paid for linefill on assets owned | — | (28,478 | ) | ||||||
| Proceeds from sales of assets | 737 | 5,790 | |||||||
| Net cash used in investing activities | (474,643 | ) | (139,796 | ) | |||||
| CASH FLOWS FROM FINANCING ACTIVITIES | |||||||||
| Net borrowings on long-term revolving credit facility | 415,827 | 29,089 | |||||||
| Net repayments on working capital revolving credit facility | (12,100 | ) | — | ||||||
| Net repayments on short-term letter of credit and hedged inventory facility | (96,091 | ) | (90,178 | ) | |||||
| Net borrowings on other short-term debt | (1,641 | ) | — | ||||||
| Principal payments on senior secured term loan | — | (7,000 | ) | ||||||
| Cash paid in connection with financing arrangements | (500 | ) | (60 | ) | |||||
| Net proceeds from the issuance of common units | 101,213 | 63,895 | |||||||
| Distributions paid to unitholders and general partner | (72,673 | ) | (58,772 | ) | |||||
| Net cash provided by (used in) financing activities | 334,035 | (63,026 | ) | ||||||
Effect of translation adjustment on cash | 1,417 | 94 | |||||||
Net increase in cash and cash equivalents | 7,919 | 2,069 | |||||||
| Cash and cash equivalents, beginning of period | 4,137 | 3,501 | |||||||
| Cash and cash equivalents, end of period | $ | 12,056 | $ | 5,570 | |||||
Cash paid for interest, net of amounts capitalized | $ | 20,547 | $ | 19,092 | |||||
The accompanying notes are an integral part of these consolidated financial statements.
PLAINS ALL AMERICAN PIPELINE, L.P. AND SUBSIDIARIESCONSOLIDATED STATEMENT OF PARTNERS' CAPITAL(in thousands)
| | Common Units | Class B Common Units | Class C Common Units | Subordinated Units | General Partner | Total Partners' Capital | |||||||||||||||||||||
|---|---|---|---|---|---|---|---|---|---|---|---|---|---|---|---|---|---|---|---|---|---|---|---|---|---|---|---|
| | Units | Amount | Units | Amount | Units | Amount | Units | Amount | Amount | Amount | |||||||||||||||||
| | (unaudited) | ||||||||||||||||||||||||||
| Balance at December 31, 2003 | 49,502 | $ | 744,073 | 1,307 | $ | 18,046 | — | $ | — | 7,523 | $ | (39,913 | ) | $ | 24,521 | $ | 746,727 | ||||||||||
| Issuance of common units under LTIP | 315 | 10,250 | — | — | — | — | — | — | 208 | 10,458 | |||||||||||||||||
| Private placement of Class C common units | — | — | — | — | 3,246 | 98,831 | — | — | 2,041 | 100,872 | |||||||||||||||||
| Payment of deferred acquisition price | 385 | 13,082 | — | — | — | — | — | — | 267 | 13,349 | |||||||||||||||||
| Distributions | — | (60,363 | ) | — | (1,470 | ) | — | (1,826 | ) | — | (4,231 | ) | (4,783 | ) | (72,673 | ) | |||||||||||
| Other comprehensive income | — | 3,604 | — | 84 | — | 78 | — | (841 | ) | 308 | 3,233 | ||||||||||||||||
| Net income | — | 55,005 | — | 1,291 | — | 1,214 | — | 1,444 | 4,599 | 63,553 | |||||||||||||||||
| Conversion of subordinated units | 7,523 | (43,541 | ) | — | — | — | — | (7,523 | ) | 43,541 | — | — | |||||||||||||||
| Balance at June 30, 2004 | 57,725 | $ | 722,110 | 1,307 | $ | 17,951 | 3,246 | $ | 98,297 | — | $ | — | $ | 27,161 | $ | 865,519 | |||||||||||
The accompanying notes are an integral part of these consolidated financial statements.
PLAINS ALL AMERICAN PIPELINE, L.P. AND SUBSIDIARIESCONSOLIDATED STATEMENTS OF COMPREHENSIVE INCOME ANDCHANGES IN ACCUMULATED OTHER COMPREHENSIVE INCOME(in thousands)
Statements of Comprehensive Income
| | Six Months Ended June 30, | |||||
|---|---|---|---|---|---|---|
| | 2004 | 2003 | ||||
| | (unaudited) | |||||
| Net income | $ | 63,553 | $ | 47,749 | ||
| Other comprehensive income | 3,233 | 36,313 | ||||
| Comprehensive income | $ | 66,786 | $ | 84,062 | ||
Statement of Changes in Accumulated Other Comprehensive Income
| | Net Deferred Gain (Loss) on Derivative Instruments | Currency Translation Adjustments | Total | ||||||||
|---|---|---|---|---|---|---|---|---|---|---|---|
| | | (unaudited) | | ||||||||
| Balance at December 31, 2003 | $ | (7,692 | ) | $ | 39,861 | $ | 32,169 | ||||
| Current period activity: | |||||||||||
| Reclassification adjustments for settled contracts | 7,832 | — | 7,832 | ||||||||
| Changes in fair value of outstanding hedge positions | 4,418 | — | 4,418 | ||||||||
| Currency translation adjustment | — | (9,017 | ) | (9,017 | ) | ||||||
| Total period activity | 12,250 | (9,017 | ) | 3,233 | |||||||
| Balance at June 30, 2004 | $ | 4,558 | $ | 30,844 | $ | 35,402 | |||||
The accompanying notes are an integral part of these consolidated financial statements.
PLAINS ALL AMERICAN PIPELINE, L.P. AND SUBSIDIARIESNOTES TO THE CONSOLIDATED FINANCIAL STATEMENTS(unaudited)
Note 1—Organization and Accounting Policies
Plains All American Pipeline, L.P. is a publicly traded Delaware limited partnership (the "Partnership") engaged in interstate and intrastate crude oil transportation, and crude oil gathering, marketing, terminalling and storage, as well as the marketing and storage of liquefied petroleum gas and other petroleum products. We refer to liquefied petroleum gas and other petroleum products collectively as "LPG." Our operations are conducted directly and indirectly through our operating subsidiaries, Plains Marketing, L.P., Plains Pipeline, L.P. (formerly known as All American Pipeline, L.P.) and Plains Marketing Canada, L.P., and are concentrated in Texas, Oklahoma, California, Louisiana, Kansas and the Canadian provinces of Alberta and Saskatchewan.
The accompanying consolidated financial statements and related notes present (i) our consolidated financial position as of June 30, 2004, and December 31, 2003, (ii) the results of our consolidated operations for the three months and six months ended June 30, 2004 and 2003, (iii) our consolidated cash flows for the six months ended June 30, 2004 and 2003, (iv) our consolidated changes in partners' capital for the six months ended June 30, 2004, (v) our consolidated comprehensive income for the three months and six months ended June 30, 2004 and 2003, and (vi) our changes in consolidated accumulated other comprehensive income for the six months ended June 30, 2004. The financial statements have been prepared in accordance with the instructions for interim reporting as prescribed by the Securities and Exchange Commission. All adjustments (consisting only of normal recurring adjustments) that in the opinion of management were necessary for a fair statement of the results for the interim periods have been reflected. All significant intercompany transactions have been eliminated. Certain reclassifications are made to prior period amounts to conform to current period presentation. The results of operations for the three months and six months ended June 30, 2004 should not be taken as indicative of the results to be expected for the full year. The consolidated interim financial statements should be read in conjunction with our consolidated financial statements and notes thereto presented in our 2003 Annual Report on Form 10-K/A Amendment No. 1.
Change in Accounting Principle
During the second quarter of 2004, we changed our method of accounting for pipeline linefill in third party assets. Historically, we have viewed pipeline linefill, whether in our assets or third party assets, as having long-term characteristics rather than characteristics typically associated with the short-term classification of operating inventory. Therefore, previously we have not included linefill barrels in the same average costing calculation as our operating inventory, but instead have carried linefill at historical cost. Following this change in accounting principle, the linefill in third party assets that we have historically classified as a portion of "Pipeline Linefill" on the face of the balance sheet (a long-term asset) and carried at historical cost, will be included in "Inventory" (a current asset) in determining the average cost of operating inventory and applying the lower of cost or market analysis. At the end of each period, we will reclassify the linefill in third party assets not expected to be liquidated within the succeeding twelve months out of "Inventory" (a current asset), at average cost, and into "Inventory in Third Party Assets" (a long-term asset), which is now reflected as a separate line item within other assets on the consolidated balance sheet.
This change in accounting principle is effective January 1, 2004 and is reflected in the consolidated statement of operations for the six months ended June 30, 2004 and the consolidated balance sheet as of June 30, 2004, included herein. The cumulative effect of this change in accounting principle as of January 1, 2004, is a charge of approximately $3.1 million, representing a reduction in Inventory of approximately $1.7 million, a reduction in Pipeline Linefill of approximately $30.3 million and an
increase in Inventory in Third Party Assets of $28.9 million. The pro forma impact for the second quarter of 2003 was not material to net income or net income per basic and diluted limited partner unit. The pro forma impact for the first half of 2003 would have been an increase to net income of approximately $1.8 million ($0.04 per basic and diluted limited partner unit) resulting in pro forma net income of $49.6 million and pro forma net income per limited partner unit (basic and diluted) of $0.91.
In conjunction with this change in accounting principle, we will classify cash flows associated with purchases and sales of linefill on assets that we own as cash flows from investing activities instead of the historical classification as cash flows from operating activities. Accordingly, the accompanying statement of cash flows for the six months ended June 30, 2003 has been revised to reclassify the cash paid for linefill in assets owned from operating activities to investing activities. The effect of the reclassification was an increase to net cash provided by operating activities and net cash used in investing activities of $28.5 million for the six months ended June 30, 2003. As a result of this change in classification, net cash provided by operating activities for the years ended December 31, 2003 and 2002 increased to $115.3 million from $68.5 million and to $185.0 million from $173.9 million, respectively. Net cash used in investing activities for the years ended December 31, 2003 and 2002 increased to $272.1 million from $225.3 million and $374.8 million from $363.8 million, respectively. In addition, net cash used in operating activities for the year ended December 31, 2001 decreased from $30 million to $16.2 million and net cash used in investing activities increased to $263.2 million from $249.5 million.
Note 2—Acquisitions
The following acquisitions were made in 2004 and were accounted for under Statement of Financial Accounting Standards ("SFAS") No. 141 "Business Combinations."
Link Energy LLC
On April 1, 2004, we completed the acquisition of all of the North American crude oil and pipeline operations of Link Energy LLC ("Link") for approximately $326 million, including $268 million of cash (net of approximately $5.5 million subsequently returned to us from an indemnity escrow account) and approximately $58 million of net liabilities assumed and acquisition related costs. The Link crude oil business consists of approximately 7,000 miles of active crude oil pipeline and gathering systems, over 10 million barrels of crude oil storage capacity, a fleet of approximately 200 owned or leased trucks and approximately 2 million barrels of crude oil linefill and working inventory. The Link assets complement our assets in West Texas and along the Gulf Coast and allow us to expand our presence in the Rocky Mountain and Oklahoma/Kansas regions. The results of operations and assets from this acquisition (the "Link acquisition") have been included in our consolidated financial statements and both our pipeline operations and gathering, marketing, terminalling, and storage operations segments since April 1, 2004.
The purchase price was allocated as follows and includes goodwill primarily related to Link's gathering and marketing business (in millions):
| Fair value of assets acquired: | |||||
| Property and equipment | $ | 256.3 | |||
| Inventory | 1.1 | ||||
| Linefill | 48.4 | ||||
| Inventory in third party assets | 15.1 | ||||
| Goodwill | 5.0 | ||||
| Other long term assets | 0.2 | ||||
| Subtotal | 326.1 | ||||
Accounts receivable | 405.4 | ||||
| Other current assets | 1.8 | ||||
| Subtotal | 407.2 | ||||
Total assets acquired | 733.3 | ||||
Fair value of liabilities assumed: | |||||
| Accounts payable and accrued liabilities | (448.9 | ) | |||
| Other current liabilities | (8.5 | ) | |||
| Other long-term liabilities | (7.4 | ) | |||
| Total liabilities assumed | (464.8 | ) | |||
Cash paid for acquisition | $ | 268.5 | (1) | ||
We are in the process of evaluating certain estimates made in the purchase price and related allocation; thus, the purchase price and allocation are both subject to refinement. In addition, we anticipate making capital expenditures of approximately $19.1 million to upgrade certain of the assets and comply with certain regulatory requirements.
The acquisition was initially funded with cash on hand, borrowings under a new $200 million, 364-day credit facility and borrowings under our existing revolving credit facilities (see Note 4). In connection with the acquisition, on April 15, 2004, we completed the private placement of 3,245,700 Class C common units to a group of institutional investors comprised of affiliates of Kayne Anderson Capital Advisors, Vulcan Capital and Tortoise Capital Advisors for $30.81 per unit, generating aggregate net proceeds of approximately $101 million, including the general partner's proportionate contribution. During the third quarter of 2004, we completed a public offering of common units, raising approximately $159 million net of expenses and inclusive of the underwriters' exercise of the overallotment option and the general partner's proportionate contribution. Proceeds from the public offering were used to retire a portion of the $200 million, 364-day credit facility. See Note 6.
Capline and Capwood Pipeline Systems
In March 2004, we completed the acquisition of all of Shell Pipeline Company LP's interests in two entities for approximately $158.0 million in cash (including a $15.8 million deposit paid in December 2003) and approximately $0.5 million of transaction and other costs. In December 2003, subsequent to the announcement of the acquisition and in anticipation of closing, we issued approximately 2.8 million common units for net proceeds of approximately $88.4 million, after paying approximately $4.1 million of transaction costs. The proceeds from this issuance were used to pay down
our revolving credit facility. At closing, the cash portion of this acquisition was funded from cash on hand and borrowings under our revolving credit facility.
The principal assets of these entities are: (i) an approximate 22% undivided joint interest in the Capline Pipeline System, and (ii) an approximate 76% undivided joint interest in the Capwood Pipeline System. The Capline Pipeline System is a 667-mile, 40-inch mainline crude oil pipeline originating in St. James, Louisiana, and terminating in Patoka, Illinois. The Capwood Pipeline System is a 57-mile, 20-inch mainline crude oil pipeline originating in Patoka, Illinois, and terminating in Wood River, Illinois. The results of operations and assets from this acquisition (the "Capline acquisition") have been included in our consolidated financial statements and in our pipeline operations segment since March 1, 2004. These pipelines provide one of the primary transportation routes for crude oil shipped into the Midwestern U.S., and delivered to several refineries and other pipelines.
The purchase price was allocated as follows (in millions):
| Crude oil pipelines and facilities | $ | 151.4 | |
| Crude oil storage and terminal facilities | 5.7 | ||
| Land | 1.3 | ||
| Office equipment and other | 0.1 | ||
| Total | $ | 158.5 | |
Pro Forma Data
The following unaudited pro forma data is presented to show pro forma revenues, income before cumulative effect of change in accounting principle, net income, basic and diluted income before cumulative effect of accounting change per limited partner unit and basic and diluted net income per limited partner unit for the Partnership as if the Capline and Link acquisitions had occurred as of the beginning of the periods reported (in millions, except per unit amounts):
| | Six Months Ended June 30, | |||||
|---|---|---|---|---|---|---|
| | 2004 | 2003 | ||||
| Revenues | $ | 8,984.3 | $ | 6,106.8 | ||
| Income before cumulative effect of change in accounting principle(1) | $ | 49.5 | $ | 108.9 | ||
| Net income(2) | $ | 46.4 | $ | 104.9 | ||
| Basic and diluted income before cumulative effect of change in accounting principle per limited partner unit(1) | $ | 0.76 | $ | 2.04 | ||
| Basic and diluted net income per limited partner unit(2) | $ | 0.70 | $ | 1.97 | ||
Other Acquisitions
On May 7, 2004, we completed the acquisition of the Cal Ven Pipeline System from Cal Ven Limited, a subsidiary of Unocal Canada Limited. The total purchase price was approximately
$19 million, including transaction costs. The transaction was funded through a combination of cash on hand and borrowings under our revolving credit facilities. The Cal Ven Pipeline System includes approximately 195 miles of 8-inch and 10-inch gathering and mainline crude oil pipelines. The system is located in northern Alberta and delivers crude oil into the Rainbow Pipeline System. The Rainbow Pipeline System then transports the crude south to the Edmonton market, where it can be used in local refineries or shipped on connecting pipelines to the U.S. market. The results of operations and assets from this acquisition have been included in our consolidated financial statements and our pipeline operations segment since May 1, 2004.
Note 3—Trade Accounts Receivable
The majority of our trade accounts receivable relate to our gathering and marketing activities and can generally be described as high volume and low margin activities. We routinely review our trade accounts receivable balances to identify past due amounts and analyze the reasons such amounts have not been collected. In many instances, such uncollected amounts involve billing delays and discrepancies or disputes as to the appropriate price, volume or quality of crude oil delivered, received or exchanged. We also attempt to monitor changes in the creditworthiness of our customers as a result of developments related to each customer, the industry as a whole and the general economy.reporting. Based on these analyses, as well as our historical experience andthat evaluation, management has concluded that the facts and circumstances surrounding certain aged balances, we have established an allowance for doubtful trade accounts receivable. At June��30, 2004, approximately 99% of our net trade accounts receivable were less than 60 days past the scheduled invoice date. Our allowance for doubtful trade accounts receivable totaled $0.4 million. We consider this reserve adequate; however, there is no assurance that actual amounts will not vary significantly from estimated amounts. The discovery of previously unknown facts or adverse developments affecting one of our counterparties or the industry as a whole could adversely impact our results of operations.
Note 4—Debt
Debt consists of the following (in millions):
| | June 30, 2004 | December 31, 2003 | |||||
|---|---|---|---|---|---|---|---|
| Short-term debt: | |||||||
Senior secured hedged inventory borrowing facility bearing interest at a rate of 2.0% and 1.9% at June 30, 2004 and December 31, 2003, respectively | $ | 4.4 | $ | 100.5 | |||
| Working capital borrowings on senior unsecured $425 million domestic revolving credit facility, bearing interest at a rate of 4.0% at both June 30, 2004 and December 31, 2003, respectively(1) | 13.2 | 25.3 | |||||
| Other | 4.4 | 1.5 | |||||
| Total short-term debt | 22.0 | 127.3 | |||||
Long-term debt: | |||||||
$200 million revolving credit facility, bearing interest at a rate of 2.3% at June 30, 2004 | $ | 200.0 | $ | — | |||
| Senior unsecured $425 million domestic revolving credit facility, bearing interest at 2.3% at June 30, 2004(1) | 90.0 | — | |||||
| Senior unsecured $30 million Canadian working capital revolving credit facilty, bearing interest at a rate of 4.4% at June 30, 2004 | 25.7 | — | |||||
| Senior unsecured $170 million Canadian revolving credit facility, bearing interest at a rate of 2.3% and 2.2% at June 30, 2004 and December 31, 2003, respectively | 170.0 | 70.0 | |||||
| 7.75% senior notes due October 2012, net of unamortized discount of $0.3 million and $0.3 million at June 30, 2004 and December 31, 2003, respectively | 199.7 | 199.7 | |||||
| 5.63% senior notes due December 2013, net of unamortized discount of $0.6 million and $0.7 million at June 30, 2004 and December 31, 2003, respectively | 249.4 | 249.3 | |||||
| Total long-term debt(1) | 934.8 | 519.0 | |||||
| Total debt | $ | 956.8 | $ | 646.3 | |||
In connection with the Link acquisition, we entered into a new $200 million revolving credit facility that has a 364-day term and contains a twelve-month term out option, exercisable at our election, at the end of the primary term. We have classified amounts outstanding under this facility as long-term as we have both the intent and the ability to refinance these amounts into long-term borrowings. The facility bears interest at a rate of LIBOR plus a margin ranging from .625% to 1.25%, depending upon our credit rating, and includes essentially the same covenants as our existing credit facilities. We repaid approximately $160 million of amounts outstanding under this facility with proceeds from our third quarter 2004 equity offering, and have committed to use net proceeds from future debt and equity offerings to prepay indebtedness outstanding and reduce the commitment level. See Note 6.
On August 5, 2004, we sold $175 million of 4.75% Senior Notes due 2009 and $175 million of 5.88% Senior Notes due 2016. The 4.75% notes were sold at 99.551% and the 5.88% notes were sold at 99.345% of face value. We expect to close the sale on August 12, 2004, with proceeds after initial purchaser discount and offering costs of approximately $345.3 million. We intend to use the proceeds to
repay amounts outstanding under our credit facilities, including the remaining balance under the $200 million, 364-day facility we used to fund the Link acquisition, and for general partnership purposes.
We are in the process of increasing the capacity of our uncommitted senior secured hedged inventory facility from $200 million to $300 million, primarily as a result of increased crude oil prices and an increase in our crude oil storage capacity as a result of acquisitions. We expect to complete the increase during the third quarter.
Note 5—Earnings Per Common Unit
The following table sets forth the computation of basic and diluted earnings per limited partner unit:
| | Six months ended June 30, | |||||||
|---|---|---|---|---|---|---|---|---|
| | 2004 | 2003 | ||||||
| | (in thousands, except per unit data) | |||||||
| Net income | $ | 63,553 | $ | 47,749 | ||||
| Less: | ||||||||
| General partner incentive distributions | (3,396 | ) | (2,274 | ) | ||||
| General partner 2% ownership | (1,203 | ) | (909 | ) | ||||
| Numerator: net income available for common unitholders | $ | 58,954 | $ | 44,566 | ||||
| Denominator: weighted average number of limited partner units outstanding | 59,985 | 51,200 | ||||||
| Basic and diluted net income per limited partner unit | $ | 0.98 | $ | 0.87 | ||||
In March 2004, the Emerging Issues Task Force issued Issue No. 03-06 ("EITF 03-06"), "Participating Securities and the Two-Class Method under FASB Statement No. 128." EITF 03-06 addresses a number of questions regarding the computation of earnings per share by companies that have issued securities other than common stock that contractually entitle the holder to participate in dividends and earnings of the company when, and if, it declares dividends on its common stock. The issue also provides further guidance in applying the two-class method of calculating earnings per share, clarifying what constitutes a participating security and how to apply the two-class method of computing earnings per share once it is determined that a security is participating, including how to allocate undistributed earnings to such a security. EITF 03-06Company's internal control over financial reporting was effective for fiscal periods beginning after March 31, 2004. The adoption of EITF 03-06 did not result in a change in the Partnership's earnings per limited partner unit for any of the periods presented.
Note 6—Partners' Capital and Distributions
Subordinated Unit Conversion
In November 2003, pursuant to the terms of our Partnership Agreement, 25% of our subordinated units converted to common units on a one-for-one basis. In February 2004, all of the remaining subordinated units converted to common units on a one-for-one basis.
Issuance of Common Units
Long-Term Incentive Plan. We issued approximately 138,000 common units during the first quarter of 2004 and approximately 177,500 common units during the second quarter of 2004 in conjunction with the vesting of awards under our Long-Term Incentive Plan ("LTIP"). In connection with such
issuances, the General Partner made a proportional two percent contribution. See Note 7 for additional discussion.
Payment of Deferred Acquisition Price. In connection with the CANPET acquisition in July 2001, $26.5 million Canadian of the purchase price, payable in common units or cash at our option, was deferred subject to various performance objectives being met. These objectives were met as of December 31, 2003 and an increase to goodwill for this liability was recorded2004. Our management's assessment of the effectiveness of the Partnership's internal control over financial reporting as of that date. The liability was satisfied on April 30,December 31, 2004 with the issuance of approximately 385,000 common units and the payment of $6.5 millionhas been audited by PricewaterhouseCoopers LLP, an independent registered public accounting firm, as stated in cash. The number of common units issued in satisfaction of the deferred payment was based upon $34.02 per share, the average trading price of our common units for the ten-day trading period prior to the payment date, and a Canadian dollar to U.S. dollar exchange rate of 1.35 to 1, the average noon-day exchange rate for the ten-day trading period prior to the payment date. In addition, an incremental $3.7 million in cash was paid for the distributions that would have been paid on the common units had they been outstanding since the effective date of the acquisition.
Private Placement of Class C Common Units. In connection with the Link acquisition, on April 15, 2004 we issued 3,245,700 Class C common units for $30.81 per unit in a private placement to a group of institutional investors comprised of affiliates of Kayne Anderson Capital Advisors, Vulcan Capital and Tortoise Capital Advisors. Total proceeds from the transaction, after deducting transaction costs and including the general partner's proportionate contribution, were approximately $101 million, and were used to reduce the balance outstanding under our revolving credit facilities. The Class C common units are unlisted securities that are pari passu in voting and distribution rights with the Partnership's publicly traded common units. The Class C common units are similar in many respects to the Partnership's Class B common units. The Class C common units are convertible into common units upon approval by the holders of a majority of the common units. Beginning six months from the closing of the private placement, the Class C unitholders may request that the Partnership call a meeting of its common unitholders to consider approval of the conversion of the Class C units into common units. If the approval of the conversion is not obtained within 120 days of the request, the Class C unitholders will be entitled to receive distributions, on a per unit basis, equal to 110% of the amount of distributions paid on a common unit. If the approval of the conversion is not secured within 90 days after the end of the 120-day period, the distribution right increases to 115%. The holder of our Class B common units, Plains Holdings Inc., has a similar right to request a unitholder meeting,their report which is currently exercisable.appears herein.
| /s/ ��GREG L. ARMSTRONG Greg L. Armstrong, Chairman of the Board, Chief Executive Officer and Director of Plains All American GP LLC (Principal Executive Officer) | |||
/s/ PHILLIP D. KRAMER Phillip D. Kramer, Executive Vice President and Chief Financial Officer of Plains All American GP LLC (Principal Financial Officer) |
Equity Offering. In the third quarter of 2004, we completed a public offering of 4,904,000 common units for $33.25 per unit. The offering resulted in gross proceeds of approximately $163.1 million from the sale of units and approximately $3.3 million from our general partner's proportionate capital contribution. Total costs associated with the offering, including underwriter fees and other expenses, were approximately $7.3 million. Net proceeds of $159.1 million were used to permanently reduce outstanding borrowings under the $200 million, 364-day credit facility (see Note 4).
Distributions
On July 21, 2004, we declared a cash distribution of $0.5775 per unit on our outstanding common units, Class B common units and Class C common units. The distribution is payable on August 13, 2004, to unitholders of record on August 3, 2004, for the period April 1, 2004, through June 30, 2004. The total distribution to be paid is approximately $41.8 million, with approximately $38.8 million to be paid to our common unitholders and $0.8 million and $2.2 million to be paid to our general partner for its general partner and incentive distribution interests, respectively.
On April 23, 2004, we declared a cash distribution of $0.5625 per unit on our outstanding common units, Class B common units and Class C common units. The distribution was paid on May 14, 2004, to unitholders of record on May 4, 2004, for the period January 1, 2004, through March 31, 2004. The2, 2005
total distribution paid was approximately $37.5 million, with approximately $35.0 million paid to our common unitholders and $0.7 million and $1.8 million paid to our general partner for its general partner and incentive distribution interests, respectively.
On January 22, 2004, we declared a cash distribution of $0.5625 per unit on our outstanding common units, Class B common units and subordinated units. The distribution was paid on February 13, 2004, to unitholders of record on February 3, 2004, for the period October 1, 2003, through December 31, 2003. The total distribution paid was approximately $35.2 million, with approximately $28.7 million paid to our common unitholders, $4.2 million paid to our subordinated unitholders and $0.7 million and $1.6 million paid to our general partner for its general partner and incentive distribution interests, respectively.
Note 7—Vesting of Unit Grants Under Long-Term Incentive Plan
During the first half of 2004, approximately 796,000 phantom units vested. We paid cash in lieu of delivery of common units for approximately 306,000 of the phantom units and issued approximately 315,500 new common units (after netting for taxes) in connection with the remainder of the vesting.
Under generally accepted accounting principles, we are required to recognize an expense when it is considered probable that phantom unit grants under our LTIP will vest. During the first half of 2004, we recognized $4.2 million of compensation expense related to the vesting of phantom units under the LTIP. This expense includes an anticipated vesting in August 2004. We will recognize additional expense when it is considered probable that additional vestings will occur. Generally, future vestings will occur when the annualized distribution rate reaches $2.50 and again at $2.70. We anticipate that, after giving effect to the August vesting and related tax withholding and cash settlement, approximately 874,000 phantom units will be available under the plan for future grant and approximately 140,000 phantom units will remain outstanding. In accordance with the provisions of the LTIP and applicable NYSE standards, no more than approximately 564,000 of such phantom unit grants (outstanding or future) could be satisfied by delivery of common units.
Note 8—Derivative Instruments and Hedging Activities
We utilize various derivative instruments to (i) manage our exposure to commodity price risk, (ii) engage in a controlled trading program, (iii) manage our exposure to interest rate risk and (iv) manage our exposure to currency exchange rate risk. Our risk management policies and procedures are designed to monitor interest rates, currency exchange rates, NYMEX and over-the-counter positions, and physical volumes, grades, locations and delivery schedules to ensure that our hedging activities address our market risks. We formally document all relationships between hedging instruments and hedged items, as well as our risk management objectives and strategy for undertaking the hedge. We calculate hedge effectiveness on a quarterly basis. This process includes specific identification of the hedging instrument and the hedged transaction, the nature of the risk being hedged and how the hedging instrument's effectiveness will be assessed. Both at the inception of the hedge and on an ongoing basis, we assess whether the derivatives that are used in hedging transactions are highly effective in offsetting changes in cash flows of hedged items.
Summary of Financial Impact
The following is a summary of the financial impact of the derivative instruments and hedging activities discussed below. The June 30, 2004, balance sheet includes assets of $35.4 million ($27.7 million current), liabilities of $23.5 million ($16.3 million current) and unrealized net gains deferred to Other Comprehensive Income ("OCI") of $4.6 million. Earnings for the six months ended June 30, 2004, include a gain of $10.7 million (including a gain of $7.1 million that was reclassified into earnings from OCI during the period).
As of June 30, 2004, the total amount of deferred net losses recorded in OCI are expected to be reclassified to future earnings, contemporaneously with the related physical purchase or delivery of the underlying commodity or payments of interest. During the six months ended June 30, 2004, no amounts were reclassified to earnings from OCI in connection with forecasted transactions that were no longer considered probable of occurring. Of the $4.6 million net gain deferred in OCI at June 30, 2004, a net gain of $11.0 million will be reclassified into earnings in the next twelve months and the remaining net loss at various intervals ending in 2013. Since a portion of these amounts are based on market prices at the current period end, actual amounts to be reclassified will differ and could vary materially as a result of changes in market conditions.
The following sections discuss our risk management activities in the indicated categories.
Commodity Price Risk Hedging
We hedge our exposure to price fluctuations with respect to crude oil and LPG in storage, and expected purchases, sales and transportation of these commodities. The derivative instruments utilized consist primarily of futures and option contracts traded on the NYMEX and over-the-counter transactions, including crude oil swap and option contracts entered into with financial institutions and other energy companies. In accordance with SFAS No. 133 "Accounting for Derivative Instruments and Hedging Activities," these derivative instruments are recognized in the balance sheet or earnings at their fair values. The majority of the instruments that qualify for hedge accounting are cash flow hedges. Therefore, the corresponding changes in fair value for the effective portion of the hedges are deferred into OCI and recognized in revenues or cost of sales and operations in the periods during which the underlying physical transactions occur. We have determined that our physical purchase and sale agreements qualify for the normal purchase and sale exclusion and thus are not subject to SFAS 133.
Controlled Trading Program
Although we seek to maintain a position that is substantially balanced within our crude oil lease purchase activities, we may experience net unbalanced positions for short periods of time as a result of production, transportation and delivery variances as well as logistical issues associated with inclement weather conditions. In connection with managing these positions and maintaining a constant presence in the marketplace, both necessary for our core business, we engage in a controlled trading program for up to an aggregate of 500,000 barrels of crude oil. These activities are monitored independently by our risk management function and must take place within predefined limits and authorizations. In accordance with SFAS 133, these derivative instruments are recorded in the balance sheet as assets or liabilities at their fair value, with the changes in fair value recorded net in revenues.
Interest Rate Risk Hedging
At June 30, 2004, we have no open interest rate hedging instruments. However, there is approximately $5.4 million deferred in OCI that relates to instruments terminated and cash settled in 2003. The net deferred loss related to these instruments is being amortized into interest expense over the original terms of the terminated instruments (approximately fifty percent over three years and the remaining fifty percent over ten years). Approximately $0.7 million related to the terminated instruments has been reclassified into interest expense during the first half of 2004, and approximately $1.4 million will be reclassified for the entire year of 2004. In addition, earnings for the first half of 2004 include a loss of approximately $0.7 million that was reclassified out of OCI related to an instrument that matured in March 2004.
Currency Exchange Rate Risk Hedging
Because a significant portion of our Canadian business is conducted in Canadian dollars, we use certain financial instruments to minimize the risks of unfavorable changes in exchange rates. These instruments include forward exchange contracts and cross currency swaps. The forward exchange contracts qualify for hedge accounting as cash flow hedges and the cross currency swaps qualify for hedge accounting as fair value hedges, both in accordance with SFAS 133. Additionally, at times, a portion of our debt is denominated in Canadian dollars. At June 30, 2004, $4.0 million of our long-term debt was denominated in Canadian dollars ($5.3 million Canadian based on a Canadian dollar to U.S. dollar exchange rate of 1.33 to 1). All of these financial instruments are placed with what we believe to be large creditworthy financial institutions.
At June 30, 2004, we had forward exchange contracts that allow us to exchange $2.0 million Canadian for approximately $1.5 million U.S. quarterly during 2004 and approximately $1.0 million Canadian for approximately $0.7 million U.S. quarterly during 2005 (based on a Canadian dollar to U.S. dollar exchange rate of 1.33 to 1 and 1.34 to 1, respectively). In addition, at June 30, 2004, we also had cross currency swap contracts for an aggregate notional principal amount of $21.0 million, effectively converting this amount of our U.S. dollar denominated debt to $32.5 million of Canadian dollar debt (based on a Canadian dollar to U.S. dollar exchange rate of 1.55 to 1). The notional principal amount reduces by $2.0 million U.S. in May 2005 and has a final maturity in May 2006 of $19.0 million U.S.
Note 9—Commitments and Contingencies
Litigation
Export License Matter. In our gathering and marketing activities, we import and export crude oil from and to Canada. Exports of crude oil are subject to the short supply controls of the Export Administration Regulations ("EAR") and must be licensed by the Bureau of Industry and Security (the "BIS") of the U.S. Department of Commerce. In 2002, we determined that we may have exceeded the quantity of crude oil exports authorized by previous licenses. Export of crude oil in excess of the authorized amounts is a violation of the EAR. On October 18, 2002, we submitted to the BIS an initial notification of voluntary disclosure. The BIS subsequently informed us that we could continue to export while previous exports were under review. We applied for and have received a new license allowing for exports of volumes more than adequately reflecting our anticipated needs. We also conducted reviews of new and existing contracts and implemented new procedures and practices in order to monitor compliance with applicable laws regarding the export of crude oil to Canada. As a result, we subsequently submitted additional information to the BIS in October 2003 and May 2004. In August 2004, we received a request from the BIS for additional information. At this time, we have received no indication whether the BIS intends to charge us with a violation of the EAR or, if so, what penalties would be assessed. As a result, we cannot estimate the ultimate impact of this matter.
General. We, in the ordinary course of business, are a claimant and/or a defendant in various legal proceedings. We do not believe that the outcome of these legal proceedings, individually or in the aggregate, will have a materially adverse effect on our financial condition, results of operations or cash flows.
Environmental
We may experience future releases of crude oil into the environment from our pipeline and storage operations, or discover past releases that were previously unidentified. Although we maintain an inspection program designed to prevent and, as applicable, to detect and address such releases promptly, damages and liabilities incurred due to any such environmental releases from our assets may substantially affect our business. At June 30, 2004, our reserve for environmental liabilities totaled approximately $23.5 million. Approximately $15.7 million of the reserve is related to liabilities assumed as part of the Link acquisition. Although we believe our reserve is adequate, no assurance can be given that any costs incurred in excess of this reserve would not have a material adverse effect on our financial condition, results of operations or cash flows.
Other
The occurrence of a significant event not fully insured, indemnified or reserved against, or the failure of a party to meet its indemnification obligations, could materially and adversely affect our operations and financial condition. We believe we are adequately insured for public liability and property damage to others with respect to our operations. We believe that our levels of coverage and
retention are generally consistent with those of similarly situated companies in our industry. With respect to all of our coverage, no assurance can be given that we will be able to maintain adequate insurance in the future at rates we consider reasonable, or that we have established adequate reserves to the extent that such risks are not insured.
Note 10—Operating Segments
Our operations consist of two operating segments: (1) Pipeline Operations—engages in interstate and intrastate crude oil pipeline transportation and certain related merchant activities; and (2) Gathering, Marketing, Terminalling and Storage Operations—engages in purchases and resales of crude oil and LPG at various points along the distribution chain and the operation of certain terminalling and storage assets. We believe that the combination of our terminalling and storage activities and gathering and marketing activities provides a counter-cyclical balance that has a stabilizing effect on our results of operations and cash flow. In a contango market (oil prices for future deliveries are higher than for current deliveries), we use our tankage to improve our gathering margins by storing crude oil we have purchased at lower prices in the current month for delivery at higher prices in future months. In a backwardated market (oil prices for future deliveries are lower than for current deliveries), we use and lease less storage capacity, but increased marketing margins (premiums for prompt delivery) provide an offset to this reduced cash flow.
We evaluate segment performance based on segment profit and maintenance capital. We define segment profit as revenues less (i) purchases, (ii) field operating costs, and (iii) segment general and administrative expenses. Maintenance capital consists of capital expenditures required either to maintain the existing operating capacity of partially or fully depreciated assets or to extend their useful lives. Capital expenditures made to expand our existing capacity, whether through construction or acquisition, are not considered maintenance capital expenditures. Repair and maintenance expenditures associated with existing assets that do not extend the useful life or expand the operating capacity are charged to expense as incurred. The following table reflects our results of operations for each segment
for the periods indicated (note that each of the items in the following table excludes depreciation and amortization):
| | Pipeline | Gathering, Marketing, Terminalling & Storage | Total | ||||||||
|---|---|---|---|---|---|---|---|---|---|---|---|
| | (in millions) | ||||||||||
| Six Months Ended June 30, 2004 | |||||||||||
| Revenues: | |||||||||||
| External Customers | $ | 364.2 | $ | 8,572.2 | $ | 8,936.4 | |||||
| Intersegment(1) | 47.9 | 0.4 | 48.3 | ||||||||
| Total revenues of reportable segments | $ | 412.1 | $ | 8,572.6 | $ | 8,984.7 | |||||
| Segment profit | $ | 73.2 | $ | 41.6 | $ | 114.8 | |||||
| Non-cash SFAS 133 impact(2) | $ | — | $ | 0.5 | $ | 0.5 | |||||
| Maintenance capital | $ | 2.1 | $ | 1.0 | $ | 3.1 | |||||
Six Months Ended June 30, 2003 | |||||||||||
| Revenues: | |||||||||||
| External Customers | $ | 302.3 | $ | 5,688.8 | $ | 5,991.1 | |||||
| Intersegment(1) | 22.5 | 0.5 | 23.0 | ||||||||
| Total revenues of reportable segments | $ | 324.8 | $ | 5,689.3 | $ | 6,014.1 | |||||
| Segment profit | $ | 44.4 | $ | 43.3 | $ | 87.7 | |||||
| Non-cash SFAS 133 impact(2) | $ | — | $ | 1.1 | $ | 1.1 | |||||
| Maintenance capital | $ | 3.8 | $ | 0.4 | $ | 4.2 | |||||
The following table reconciles segment profit to consolidated income before cumulative effect of change in accounting principle (in millions):
| | For the six months ended June 30, | ||||||
|---|---|---|---|---|---|---|---|
| | 2004 | 2003 | |||||
| Segment profit | $ | 114.8 | $ | 87.7 | |||
| Depreciation and amortization | (29.1 | ) | (22.2 | ) | |||
| Interest expense | (19.5 | ) | (17.7 | ) | |||
| Interest income and other, net | 0.5 | (0.1 | ) | ||||
| Income before cumulative effect of change in accounting principle | $ | 66.7 | $ | 47.7 | |||
Report of Independent Registered Public Accounting Firm
To the Board of Directors of the General Partner and Unitholders of
Plains All American Pipeline, L.P.:
We have completed an integrated audit of Plains All American Pipeline, L.P.'s 2004 consolidated financial statements and of its internal control over financial reporting as of December 31, 2004 and audits of its 2003 and 2002 consolidated financial statements in accordance with the standards of the Public Company Accounting Oversight Board (United States). Our opinions, based on our audits, are presented below.
Consolidated financial statements
In our opinion, the accompanying consolidated balance sheets and the related consolidated statements of operations, of cash flows, of changes in partners' capital, of comprehensive income and of changes in accumulated other comprehensive income (loss) present fairly, in all material respects, the financial position of Plains All American Pipeline, L.P. and its subsidiaries (the "Partnership") at December 31, 20032004 and 2002,2003, and the results of their operations and their cash flows for each of the three years in the period ended December 31, 20032004 in conformity with accounting principles generally accepted in the United States of America. These financial statements are the responsibility of the Partnership's management. Our responsibility is to express an opinion on these financial statements based on our audits. We conducted our audits of these statements in accordance with the standards of the Public Company Accounting Oversight Board (United States). Those standards require that we plan and perform the audit to obtain reasonable assurance about whether the financial statements are free of material misstatement. An audit of financial statements includes examining, on a test basis, evidence supporting the amounts and disclosures in the financial statements, assessing the accounting principles used and significant estimates made by management, and evaluating the overall financial statement presentation. We believe that our audits provide a reasonable basis for our opinion.
As discussed in Note 21 to the consolidated financial statements, the Partnership changed its method of accounting for derivative instruments and hedging activitiespipeline linefill in third party assets effective January 1, 2001.2004.
Internal control over financial reporting
Also, in our opinion, management's assessment, included in the accompanying Management's Report on Internal Control Over Financial Reporting, that the Partnership maintained effective internal control over financial reporting as of December 31, 2004 based on criteria established in COSO, is fairly stated, in all material respects, based on those criteria. Furthermore, in our opinion, the Partnership maintained, in all material respects, effective internal control over financial reporting as of December 31, 2004, based on criteria established in Internal Control—Integrated Framework issued by the COSO. The Partnership's management is responsible for maintaining effective internal control over financial reporting and for its assessment of the effectiveness of internal control over financial reporting. Our responsibility is to express opinions on management's assessment and on the effectiveness of the Partnership's internal control over financial reporting based on our audit. We conducted our audit of internal control over financial reporting in accordance with the standards of the Public Company Accounting Oversight Board (United States). Those standards require that we plan and perform the audit to obtain reasonable assurance about whether effective internal control over financial reporting was maintained in all material respects. An audit of internal control over financial reporting includes obtaining an understanding of internal control over financial reporting, evaluating management's assessment, testing and evaluating the design and operating effectiveness of internal control, and performing such other procedures as we consider necessary in the circumstances. We believe that our audit provides a reasonable basis for our opinions.
A company's internal control over financial reporting is a process designed to provide reasonable assurance regarding the reliability of financial reporting and the preparation of financial statements for external purposes in accordance with generally accepted accounting principles. A company's internal control over financial reporting includes those policies and procedures that (i) pertain to the maintenance of records that, in reasonable detail, accurately and fairly reflect the transactions and dispositions of the assets of the company; (ii) provide reasonable assurance that transactions are recorded as necessary to permit preparation of financial statements in accordance with generally accepted accounting principles, and that receipts and expenditures of the company are being made only in accordance with authorizations of management and directors of the company; and (iii) provide reasonable assurance regarding prevention or timely detection of unauthorized acquisition, use, or disposition of the company's assets that could have a material effect on the financial statements.
Because of its inherent limitations, internal control over financial reporting may not prevent or detect misstatements. Also, projections of any evaluation of effectiveness to future periods are subject to the risk that controls may become inadequate because of changes in conditions, or that the degree of compliance with the policies or procedures may deteriorate.
PricewaterhouseCoopers LLP
Houston, TexasFebruary 26, 2004, except as to Note 1which is as of July 21, 2004March 2, 2005
PLAINS ALL AMERICAN PIPELINE, L.P. AND SUBSIDIARIES
CONSOLIDATED BALANCE SHEETS
(in thousands, except unit data)
| | | December 31, 2003 | December 31, 2002 | | December 31, 2004 | December 31, 2003 | ||||||||||
|---|---|---|---|---|---|---|---|---|---|---|---|---|---|---|---|---|
| ASSETS | ASSETS | ASSETS | ||||||||||||||
CURRENT ASSETS | CURRENT ASSETS | CURRENT ASSETS | ||||||||||||||
| Cash and cash equivalents | Cash and cash equivalents | $ | 4,137 | $ | 3,501 | Cash and cash equivalents | $ | 12,988 | $ | 4,137 | ||||||
| Accounts receivable, net | 590,645 | 499,909 | ||||||||||||||
| Trade accounts receivable, net | Trade accounts receivable, net | 521,785 | 590,645 | |||||||||||||
| Inventory | Inventory | 105,967 | 81,849 | Inventory | 498,200 | 105,967 | ||||||||||
| Other current assets | Other current assets | 32,225 | 17,676 | Other current assets | 68,229 | 32,225 | ||||||||||
| Total current assets | 732,974 | 602,935 | Total current assets | 1,101,202 | 732,974 | |||||||||||
| PROPERTY AND EQUIPMENT | PROPERTY AND EQUIPMENT | 1,272,634 | 1,030,303 | PROPERTY AND EQUIPMENT | 1,911,509 | 1,272,634 | ||||||||||
| Accumulated depreciation | Accumulated depreciation | (121,595 | ) | (77,550 | ) | Accumulated depreciation | (183,887 | ) | (121,595 | ) | ||||||
| 1,151,039 | 952,753 | 1,727,622 | 1,151,039 | |||||||||||||
| OTHER ASSETS | OTHER ASSETS | OTHER ASSETS | ||||||||||||||
| Pipeline linefill | 122,653 | 62,558 | ||||||||||||||
| Pipeline linefill in owned assets | Pipeline linefill in owned assets | 168,352 | 95,928 | |||||||||||||
| Inventory in third party assets | Inventory in third party assets | 59,279 | 26,725 | |||||||||||||
| Other, net | Other, net | 88,965 | 48,329 | Other, net | 103,956 | 88,965 | ||||||||||
| Total assets | $ | 2,095,631 | $ | 1,666,575 | Total assets | $ | 3,160,411 | $ | 2,095,631 | |||||||
| LIABILITIES AND PARTNERS' CAPITAL | LIABILITIES AND PARTNERS' CAPITAL | LIABILITIES AND PARTNERS' CAPITAL | ||||||||||||||
CURRENT LIABILITIES | CURRENT LIABILITIES | CURRENT LIABILITIES | ||||||||||||||
| Accounts payable | Accounts payable | $ | 603,460 | $ | 488,922 | Accounts payable | $ | 850,912 | $ | 603,460 | ||||||
| Due to related parties | Due to related parties | 26,981 | 23,301 | Due to related parties | 32,897 | 26,981 | ||||||||||
| Short-term debt (see Note 6) | 127,259 | 99,249 | ||||||||||||||
| Short-term debt | Short-term debt | 175,472 | 127,259 | |||||||||||||
| Other current liabilities | Other current liabilities | 44,219 | 25,777 | Other current liabilities | 54,436 | 44,219 | ||||||||||
| Total current liabilities | 801,919 | 637,249 | Total current liabilities | 1,113,717 | 801,919 | |||||||||||
| LONG-TERM LIABILITIES | LONG-TERM LIABILITIES | LONG-TERM LIABILITIES | ||||||||||||||
| Long-term debt under credit facilities, including current maturities of $9,000 for the 2002 period | 70,000 | 310,126 | ||||||||||||||
| Senior notes, net of unamortized discount of $1,009 and $390, respectively | 448,991 | 199,610 | ||||||||||||||
| Long-term debt under credit facilities and other | Long-term debt under credit facilities and other | 151,753 | 70,000 | |||||||||||||
| Senior notes, net of unamortized discount of $2,729 and $1,009, respectively | Senior notes, net of unamortized discount of $2,729 and $1,009, respectively | 797,271 | 448,991 | |||||||||||||
| Other long-term liabilities and deferred credits | Other long-term liabilities and deferred credits | 27,994 | 7,980 | Other long-term liabilities and deferred credits | 27,466 | 27,994 | ||||||||||
| Total liabilities | 1,348,904 | 1,154,965 | Total liabilities | 2,090,207 | 1,348,904 | |||||||||||
| COMMITMENTS AND CONTINGENCIES (NOTE 12) | ||||||||||||||||
COMMITMENTS AND CONTINGENCIES (NOTES 11 and 12) | COMMITMENTS AND CONTINGENCIES (NOTES 11 and 12) | |||||||||||||||
PARTNERS' CAPITAL | PARTNERS' CAPITAL | PARTNERS' CAPITAL | ||||||||||||||
| Common unitholders (49,502,556 and 38,240,939 units outstanding at December 31, 2003, and December 31, 2002, respectively) | 744,073 | 524,428 | ||||||||||||||
| Common unitholders (62,740,218 and 49,502,556 units outstanding at December 31, 2004, and December 31, 2003, respectively) | Common unitholders (62,740,218 and 49,502,556 units outstanding at December 31, 2004, and December 31, 2003, respectively) | 919,826 | 744,073 | |||||||||||||
| Class B common unitholder (1,307,190 units outstanding at each date) | Class B common unitholder (1,307,190 units outstanding at each date) | 18,046 | 18,463 | Class B common unitholder (1,307,190 units outstanding at each date) | 18,775 | 18,046 | ||||||||||
| Subordinated unitholders (7,522,214 and 10,029,619 units outstanding at December 31, 2003, and December 31, 2002, respectively) | (39,913 | ) | (47,103 | ) | ||||||||||||
| Class C common unitholders (3,245,700 units and no units outstanding at December 31, 2004, and December 31, 2003, respectively) | Class C common unitholders (3,245,700 units and no units outstanding at December 31, 2004, and December 31, 2003, respectively) | 100,423 | — | |||||||||||||
| Subordinated unitholders (no units and 7,522,214 units outstanding at December 31, 2004, and December 31, 2003, respectively) | Subordinated unitholders (no units and 7,522,214 units outstanding at December 31, 2004, and December 31, 2003, respectively) | — | (39,913 | ) | ||||||||||||
| General partner | General partner | 24,521 | 15,822 | General partner | 31,180 | 24,521 | ||||||||||
| Total partners' capital | 746,727 | 511,610 | Total partners' capital | 1,070,204 | 746,727 | |||||||||||
| $ | 2,095,631 | $ | 1,666,575 | Total liabilities and partners' capital | $ | 3,160,411 | $ | 2,095,631 | ||||||||
The accompanying notes are an integral part of these consolidated financial statements.
PLAINS ALL AMERICAN PIPELINE, L.P. AND SUBSIDIARIES
CONSOLIDATED STATEMENTS OF OPERATIONS
(in thousands, except per unit data)
| | Year Ended December 31, | ||||||||||
|---|---|---|---|---|---|---|---|---|---|---|---|
| | 2003 | 2002 | 2001 | ||||||||
| REVENUES | |||||||||||
| Crude oil and LPG sales | $ | 11,952,623 | $ | 7,892,162 | $ | 6,481,305 | |||||
| Pipeline margin activities | 505,287 | 382,513 | 285,618 | ||||||||
| Pipeline tariffs and fees | 99,887 | 79,939 | 54,234 | ||||||||
| Other | 32,052 | 29,609 | 47,058 | ||||||||
| Total revenues | 12,589,849 | 8,384,223 | 6,868,215 | ||||||||
COSTS AND EXPENSES | |||||||||||
| Crude oil and LPG purchases and related costs | 11,727,355 | 7,726,323 | 6,338,365 | ||||||||
| Pipeline margin activities purchases | 486,154 | 362,311 | 270,786 | ||||||||
| Other purchases | 19,027 | 14,862 | 4,965 | ||||||||
| Field operating costs (excluding LTIP charge) | 134,177 | 106,436 | 106,854 | ||||||||
| LTIP charge—operations | 5,727 | — | — | ||||||||
| Inventory valuation adjustment | — | — | 4,984 | ||||||||
| General and administrative (excluding LTIP charge) | 49,969 | 45,663 | 46,586 | ||||||||
| LTIP charge—general and administrative | 23,063 | — | — | ||||||||
| Depreciation and amortization | 46,821 | 34,068 | 24,307 | ||||||||
| Total costs and expenses | 12,492,293 | 8,289,663 | 6,796,847 | ||||||||
| Gains on sales of assets | 648 | — | 984 | ||||||||
| OPERATING INCOME | 98,204 | 94,560 | 72,352 | ||||||||
| OTHER INCOME/(EXPENSE) | |||||||||||
| Interest expense (net of capitalized interest of $524, $773 and $153) | (35,226 | ) | (29,057 | ) | (29,082 | ) | |||||
| Interest income and other, net (Note 2) | (3,530 | ) | (211 | ) | 401 | ||||||
| Income before cumulative effect of accounting change | 59,448 | 65,292 | 43,671 | ||||||||
| Cumulative effect of accounting change | — | — | 508 | ||||||||
| NET INCOME | $ | 59,448 | $ | 65,292 | $ | 44,179 | |||||
| NET INCOME-LIMITED PARTNERS | $ | 53,473 | $ | 60,912 | $ | 42,239 | |||||
| NET INCOME-GENERAL PARTNER | $ | 5,975 | $ | 4,380 | $ | 1,940 | |||||
| BASIC NET INCOME PER LIMITED PARTNER UNIT | |||||||||||
Income before cumulative effect of accounting change | $ | 1.01 | $ | 1.34 | $ | 1.12 | |||||
| Cumulative effect of accounting change | — | — | 0.01 | ||||||||
| Net income | $ | 1.01 | $ | 1.34 | $ | 1.13 | |||||
| DILUTED NET INCOME PER LIMITED PARTNER UNIT | |||||||||||
Income before cumulative effect of accounting change | $ | 1.00 | $ | 1.34 | $ | 1.12 | |||||
| Cumulative effect of accounting change | — | — | 0.01 | ||||||||
| Net Income | $ | 1.00 | $ | 1.34 | $ | 1.13 | |||||
| BASIC WEIGHTED AVERAGE UNITS OUTSTANDING | 52,743 | 45,546 | 37,528 | ||||||||
| DILUTED WEIGHTED AVERAGE UNITS OUTSTANDING | 53,400 | 45,546 | 37,528 | ||||||||
| | Twelve Months Ended December 31, | ||||||||||
|---|---|---|---|---|---|---|---|---|---|---|---|
| | 2004 | 2003 | 2002 | ||||||||
| REVENUES | |||||||||||
| Crude oil and LPG sales (includes approximately $11,246,951, $6,124,895 and $4,140,830, respectively, related to buy/sell transactions, see Note 2) | $ | 20,184,319 | $ | 11,952,623 | $ | 7,892,405 | |||||
| Other gathering, marketing, terminalling and storage revenues | 38,310 | 32,052 | 29,366 | ||||||||
| Pipeline margin activities revenues (includes approximately $149,797, $166,165 and $95,826, respectively, related to buy/sell transactions, see Note 2) | 575,222 | 505,287 | 382,513 | ||||||||
| Pipeline tariff activities revenues | 177,619 | 99,887 | 79,939 | ||||||||
| Total revenues | 20,975,470 | 12,589,849 | 8,384,223 | ||||||||
COSTS AND EXPENSES | |||||||||||
| Crude oil and LPG purchases and related costs (includes approximately $11,137,669, $5,967,165 and $4,026,245, respectively, related to buy/sell transactions, see Note 2) | 19,870,865 | 11,746,382 | 7,741,185 | ||||||||
| Pipeline margin activities purchases (includes approximately $142,538, $159,231 and $87,554, respectively, related to buy/sell transactions, see Note 2) | 553,707 | 486,154 | 362,311 | ||||||||
| Field operating costs (excluding LTIP charge) | 218,548 | 134,177 | 106,436 | ||||||||
| LTIP charge—operations | 918 | 5,727 | — | ||||||||
| General and administrative expenses (excluding LTIP charge) | 75,735 | 49,969 | 45,663 | ||||||||
| LTIP charge—general and administrative | 7,013 | 23,063 | — | ||||||||
| Depreciation and amortization | �� | 67,241 | 46,821 | 34,068 | |||||||
| Total costs and expenses | 20,794,027 | 12,492,293 | 8,289,663 | ||||||||
| Gain on sales of assets | 580 | 648 | — | ||||||||
| Asset impairment | (2,000 | ) | — | — | |||||||
| OPERATING INCOME | 180,023 | 98,204 | 94,560 | ||||||||
OTHER INCOME/(EXPENSE) | |||||||||||
| Interest expense (net of capitalized interest of $544, $524 and $773) | (46,676 | ) | (35,226 | ) | (29,057 | ) | |||||
| Interest and other income (expense), net | (211 | ) | (3,530 | ) | (211 | ) | |||||
| Income before cumulative effect of change in accounting principle | 133,136 | 59,448 | 65,292 | ||||||||
| Cumulative effect of change in accounting principle | (3,130 | ) | — | — | |||||||
| NET INCOME | $ | 130,006 | $ | 59,448 | $ | 65,292 | |||||
| NET INCOME-LIMITED PARTNERS | $ | 119,286 | $ | 53,473 | $ | 60,912 | |||||
| NET INCOME-GENERAL PARTNER | $ | 10,720 | $ | 5,975 | $ | 4,380 | |||||
BASIC NET INCOME PER LIMITED PARTNER UNIT | |||||||||||
| Income before cumulative effect of change in accounting principle | $ | 1.94 | $ | 1.01 | $ | 1.34 | |||||
| Cumulative effect of change in accounting principle | (0.05 | ) | — | — | |||||||
| Basic net income per limited partner unit | $ | 1.89 | $ | 1.01 | $ | 1.34 | |||||
DILUTED NET INCOME PER LIMITED PARTNER UNIT | |||||||||||
| Income before cumulative effect of change in accounting principle | $ | 1.94 | $ | 1.00 | $ | 1.34 | |||||
| Cumulative effect of change in accounting principle | (0.05 | ) | — | — | |||||||
| Diluted net income per limited partner unit | $ | 1.89 | $ | 1.00 | $ | 1.34 | |||||
| BASIC WEIGHTED AVERAGE UNITS OUTSTANDING | 63,277 | 52,743 | 45,546 | ||||||||
| DILUTED WEIGHTED AVERAGE UNITS OUTSTANDING | 63,277 | 53,400 | 45,546 | ||||||||
The accompanying notes are an integral part of these consolidated financial statements.
PLAINS ALL AMERICAN PIPELINE, L.P. AND SUBSIDIARIES
CONSOLIDATED STATEMENTS OF CASH FLOWS
(in thousands)
| | | Year Ended December 31, | | Year Ended December 31, | ||||||||||||||||||||
|---|---|---|---|---|---|---|---|---|---|---|---|---|---|---|---|---|---|---|---|---|---|---|---|---|
| | | 2003 | 2002 | 2001 | | 2004 | 2003 | 2002 | ||||||||||||||||
| CASH FLOWS FROM OPERATING ACTIVITIES | CASH FLOWS FROM OPERATING ACTIVITIES | CASH FLOWS FROM OPERATING ACTIVITIES | ||||||||||||||||||||||
| Net income | Net income | $ | 59,448 | $ | 65,292 | $ | 44,179 | Net income | $ | 130,006 | $ | 59,448 | $ | 65,292 | ||||||||||
| Adjustments to reconcile to cash flows from operating activities: | Adjustments to reconcile to cash flows from operating activities: | Adjustments to reconcile to cash flows from operating activities: | ||||||||||||||||||||||
| Depreciation and amortization | 67,241 | 46,821 | 34,068 | |||||||||||||||||||||
| Gain on sales of assets | (580 | ) | (648 | ) | — | |||||||||||||||||||
| Depreciation and amortization | 46,821 | 34,068 | 24,307 | Cumulative effect of change in accounting principle | 3,130 | — | — | |||||||||||||||||
| Gains on sales of assets | (648 | ) | — | (984 | ) | Allowance for doubtful accounts | 400 | 360 | 146 | |||||||||||||||
| Cumulative effect of accounting change | — | — | (508 | ) | Inventory valuation adjustment | 2,032 | — | — | ||||||||||||||||
| Noncash compensation expense | — | — | 5,741 | SFAS 133 non-cash mark-to-market adjustment | (994 | ) | (363 | ) | (243 | ) | ||||||||||||||
| Allowance for doubtful accounts | 360 | 146 | 3,000 | Gain on foreign currency revaluation | (4,954 | ) | — | — | ||||||||||||||||
| Inventory valuation adjustment | — | — | 4,984 | Non-cash amortization of terminated interest rate swap | 1,486 | — | — | |||||||||||||||||
| Change in derivative fair value | (363 | ) | (243 | ) | (207 | ) | Net cash paid for terminated swaps | (1,465 | ) | (6,152 | ) | — | ||||||||||||
| Net cash paid for termination of interest rate hedging instruments | (6,152 | ) | — | — | Loss on refinancing of debt | 658 | 3,272 | — | ||||||||||||||||
| Write-off of unamortized debt issue costs | 3,272 | — | — | LTIP charge | 7,931 | 28,790 | — | |||||||||||||||||
| Noncash portion of LTIP charge (Note 11) | 28,052 | — | — | Impairment of long-lived assets | 2,000 | — | — | |||||||||||||||||
| Changes in assets and liabilities, net of acquisitions: | Changes in assets and liabilities, net of acquisitions: | Changes in assets and liabilities, net of acquisitions: | ||||||||||||||||||||||
| Accounts receivable and other | (102,005 | ) | (136,480 | ) | (18,856 | ) | Trade accounts receivable and other assets | (30,364 | ) | (102,005 | ) | (136,480 | ) | |||||||||||
| Inventory | (38,941 | ) | 105,944 | (117,878 | ) | Inventory | (398,671 | ) | (38,941 | ) | 105,944 | |||||||||||||
| Accounts payable and other current liabilities | 117,412 | 106,065 | 46,671 | Accounts payable and other liabilities | 327,449 | 121,274 | 107,265 | |||||||||||||||||
| Other long-term liabilities and deferred credits | 4,600 | 1,200 | 600 | Inventory in third-party assets | (7,248 | ) | — | — | ||||||||||||||||
| Due to related parties | 3,452 | 8,962 | (7,266 | ) | Due to related parties | 5,911 | 3,452 | 8,962 | ||||||||||||||||
| Net cash provided by (used in) operating activities | 115,308 | 184,954 | (16,217 | ) | Net cash provided by operating activities | 103,968 | 115,308 | 184,954 | ||||||||||||||||
CASH FLOWS FROM INVESTING ACTIVITIES | CASH FLOWS FROM INVESTING ACTIVITIES | CASH FLOWS FROM INVESTING ACTIVITIES | ||||||||||||||||||||||
| Cash paid in connection with acquisitions (Note 3) | Cash paid in connection with acquisitions (Note 3) | (168,359 | ) | (324,628 | ) | (229,162 | ) | Cash paid in connection with acquisitions (Note 3) | (535,266 | ) | (168,359 | ) | (324,628 | ) | ||||||||||
| Additions to property and equipment | Additions to property and equipment | (65,416 | ) | (40,590 | ) | (21,069 | ) | Additions to property and equipment | (116,944 | ) | (65,416 | ) | (40,590 | ) | ||||||||||
| Cash paid for linefill on assets owned | Cash paid for linefill on assets owned | (46,790 | ) | (11,060 | ) | (13,736 | ) | Cash paid for linefill on assets owned | (1,989 | ) | (46,790 | ) | (11,060 | ) | ||||||||||
| Proceeds from sales of assets | Proceeds from sales of assets | 8,450 | 1,437 | 740 | Proceeds from sales of assets | 3,012 | 8,450 | 1,437 | ||||||||||||||||
| Net cash used in investing activities | (272,115 | ) | (374,841 | ) | (263,227 | ) | Net cash used in investing activities | (651,187 | ) | (272,115 | ) | (374,841 | ) | |||||||||||
CASH FLOWS FROM FINANCING ACTIVITIES | CASH FLOWS FROM FINANCING ACTIVITIES | CASH FLOWS FROM FINANCING ACTIVITIES | ||||||||||||||||||||||
| Net borrowings/(repayments) on short-term letter of credit and hedged inventory facilities | (6,197 | ) | (4,770 | ) | 99,583 | |||||||||||||||||||
| Net borrowings/(repayments) on long-term revolving credit facilities | 87,773 | (42,144 | ) | 34,677 | ||||||||||||||||||||
| Principal payments on senior secured term loans (Note 6) | (297,000 | ) | (3,000 | ) | — | |||||||||||||||||||
| Net borrowings/(repayments) on long-term revolving credit facilities and other | Net borrowings/(repayments) on long-term revolving credit facilities and other | 64,893 | 62,473 | (42,144 | ) | |||||||||||||||||||
| Net borrowings on working capital revolving credit facility | Net borrowings on working capital revolving credit facility | 62,900 | 25,300 | — | ||||||||||||||||||||
| Net repayments on short-term letter of credit and hedged inventory facilities | Net repayments on short-term letter of credit and hedged inventory facilities | (20,090 | ) | (6,197 | ) | (4,770 | ) | |||||||||||||||||
| Principal payments on senior secured term loans | Principal payments on senior secured term loans | — | (297,000 | ) | (3,000 | ) | ||||||||||||||||||
| Cash paid in connection with financing arrangements | Cash paid in connection with financing arrangements | (5,191 | ) | (5,435 | ) | (6,351 | ) | Cash paid in connection with financing arrangements | (5,073 | ) | (5,191 | ) | (5,435 | ) | ||||||||||
| Net proceeds from the issuance of common units (Note 7) | 250,341 | 145,046 | 227,549 | |||||||||||||||||||||
| Proceeds from the issuance of senior unsecured notes (Note 6) | 249,340 | 199,600 | — | |||||||||||||||||||||
| Distributions paid to unitholders and general partner (Note 7) | (121,822 | ) | (99,841 | ) | (75,929 | ) | ||||||||||||||||||
| Net proceeds from the issuance of common units (Note 6) | Net proceeds from the issuance of common units (Note 6) | 262,132 | 250,341 | 145,046 | ||||||||||||||||||||
| Proceeds from the issuance of senior notes | Proceeds from the issuance of senior notes | 348,068 | 249,340 | 199,600 | ||||||||||||||||||||
| Distributions paid to unitholders and general partner | Distributions paid to unitholders and general partner | (158,352 | ) | (121,822 | ) | (99,841 | ) | |||||||||||||||||
| Net cash provided by financing activities | 157,244 | 189,456 | 279,529 | Net cash provided by financing activities | 554,478 | 157,244 | 189,456 | |||||||||||||||||
Effect of translation adjustment on cash | Effect of translation adjustment on cash | 199 | 421 | — | Effect of translation adjustment on cash | 1,592 | 199 | 421 | ||||||||||||||||
Net increase (decrease) in cash and cash equivalents | Net increase (decrease) in cash and cash equivalents | 636 | (10 | ) | 85 | Net increase (decrease) in cash and cash equivalents | 8,851 | 636 | (10 | ) | ||||||||||||||
| Cash and cash equivalents, beginning of period | Cash and cash equivalents, beginning of period | 3,501 | 3,511 | 3,426 | Cash and cash equivalents, beginning of period | 4,137 | 3,501 | 3,511 | ||||||||||||||||
| Cash and cash equivalents, end of period | Cash and cash equivalents, end of period | $ | 4,137 | $ | 3,501 | $ | 3,511 | Cash and cash equivalents, end of period | $ | 12,988 | $ | 4,137 | $ | 3,501 | ||||||||||
Cash paid for interest, net of amounts capitalized | Cash paid for interest, net of amounts capitalized | $ | 36,382 | $ | 28,550 | $ | 33,341 | Cash paid for interest, net of amounts capitalized | $ | 40,780 | $ | 36,382 | $ | 28,550 | ||||||||||
The accompanying notes are an integral part of these consolidated financial statements.
PLAINS ALL AMERICAN PIPELINE, L.P. AND SUBSIDIARIES
CONSOLIDATED STATEMENT OF CHANGES IN PARTNERS' CAPITAL
(in thousands)
| | Common Unitholders | Class B Common Unitholders | Subordinated Unitholders | General Partner | Total Partners' Capital | | | Class B Common Units | Class C Common Units | | | | | | |||||||||||||||||||||||||||||||||||||
|---|---|---|---|---|---|---|---|---|---|---|---|---|---|---|---|---|---|---|---|---|---|---|---|---|---|---|---|---|---|---|---|---|---|---|---|---|---|---|---|---|---|---|---|---|---|---|---|---|---|---|---|
| | Units | Amount | Units | Amount | Units | Amount | Amount | Amount | Common Units | Subordinated Units | | | Total Partners' Capital Amount | ||||||||||||||||||||||||||||||||||||||
| Balance at December 31, 2000 | 23,049 | $ | 217,073 | 1,307 | $ | 21,042 | 10,030 | $ | (27,316 | ) | $ | 3,200 | $ | 213,999 | |||||||||||||||||||||||||||||||||||||
| Issuance of units | 8,867 | 222,032 | — | — | — | — | 5,517 | 227,549 | |||||||||||||||||||||||||||||||||||||||||||
| Noncash compensation expense | — | — | — | — | — | — | 5,741 | 5,741 | |||||||||||||||||||||||||||||||||||||||||||
| Net income | — | 29,436 | — | 1,476 | — | 11,327 | 1,940 | 44,179 | |||||||||||||||||||||||||||||||||||||||||||
| Distributions | — | (51,271 | ) | — | (2,549 | ) | — | (19,558 | ) | (2,551 | ) | (75,929 | ) | ||||||||||||||||||||||||||||||||||||||
| Other comprehensive loss | — | (8,708 | ) | — | (435 | ) | — | (3,344 | ) | (255 | ) | (12,742 | ) | ||||||||||||||||||||||||||||||||||||||
| | Common Units | General Partner Amount | Total Units | Class B Common Units | Subordinated Units | Class C Common Units | Total Partners' Capital Amount | ||||||||||||||||||||||||||||||||||||||||||||
| | Total Partners' Capital Amount | ||||||||||||||||||||||||||||||||||||||||||||||||||
| (unaudited) | |||||||||||||||||||||||||||||||||||||||||||||||||||
Balance at December 31, 2001 | 31,916 | 408,562 | 1,307 | 19,534 | 10,030 | (38,891 | ) | 13,592 | 402,797 | 31,916 | $ | 408,562 | 1,307 | $ | 19,534 | — | $ | — | 10,030 | $ | (38,891 | ) | $ | 13,592 | 43,253 | $ | 402,797 | ||||||||||||||||||||||||
| Issuance of units | 6,325 | 142,013 | — | — | — | — | 3,033 | 145,046 | |||||||||||||||||||||||||||||||||||||||||||
| Issuance of common units | 6,325 | 142,013 | — | — | — | — | — | — | 3,033 | 6,325 | 145,046 | ||||||||||||||||||||||||||||||||||||||||
| Net income | — | 45,857 | — | 1,736 | — | 13,319 | 4,380 | 65,292 | — | 45,857 | — | 1,736 | — | — | — | 13,319 | 4,380 | — | 65,292 | ||||||||||||||||||||||||||||||||
| Distributions | — | (70,821 | ) | — | (2,762 | ) | — | (21,188 | ) | (5,070 | ) | (99,841 | ) | — | (70,821 | ) | — | (2,762 | ) | — | — | — | (21,188 | ) | (5,070 | ) | — | (99,841 | ) | ||||||||||||||||||||||
| Other comprehensive loss | — | (1,183 | ) | — | (45 | ) | — | (343 | ) | (113 | ) | (1,684 | ) | — | (1,183 | ) | — | (45 | ) | — | — | — | (343 | ) | (113 | ) | — | (1,684 | ) | ||||||||||||||||||||||
Balance at December 31, 2002 | 38,241 | 524,428 | 1,307 | 18,463 | 10,030 | (47,103 | ) | 15,822 | 511,610 | 38,241 | $ | 524,428 | 1,307 | $ | 18,463 | — | $ | — | 10,030 | $ | (47,103 | ) | $ | 15,822 | 49,578 | $ | 511,610 | ||||||||||||||||||||||||
Issuance of units | 8,736 | 245,093 | — | — | — | — | 5,237 | 250,330 | |||||||||||||||||||||||||||||||||||||||||||
| Issuance of units under LTIP | 18 | 555 | — | — | — | — | 11 | 566 | |||||||||||||||||||||||||||||||||||||||||||
| Issuance of common units | 8,736 | 245,093 | — | — | — | — | — | — | 5,237 | 8,736 | 250,330 | ||||||||||||||||||||||||||||||||||||||||
| Issuance of common units under LTIP | 18 | 555 | — | — | — | — | — | — | 11 | 18 | 566 | ||||||||||||||||||||||||||||||||||||||||
| Net income | — | 41,278 | — | 1,370 | — | 10,825 | 5,975 | 59,448 | — | 41,278 | — | 1,370 | — | — | — | 10,825 | 5,975 | — | 59,448 | ||||||||||||||||||||||||||||||||
| Conversion of 25% of subordinated units | 2,507 | (9,823 | ) | — | — | (2,507 | ) | 9,823 | — | — | |||||||||||||||||||||||||||||||||||||||||
| Conversion of subordinated units | 2,507 | (9,823 | ) | — | — | — | — | (2,507 | ) | 9,823 | — | — | — | ||||||||||||||||||||||||||||||||||||||
| Distributions | — | (89,801 | ) | — | (2,860 | ) | — | (21,939 | ) | (7,222 | ) | (121,822 | ) | — | (89,801 | ) | — | (2,860 | ) | — | — | — | (21,939 | ) | (7,222 | ) | — | (121,822 | ) | ||||||||||||||||||||||
| Other comprehensive income | — | 32,343 | — | 1,073 | — | 8,481 | 4,698 | 46,595 | — | 32,343 | — | 1,073 | — | — | — | 8,481 | 4,698 | — | 46,595 | ||||||||||||||||||||||||||||||||
Balance at December 31, 2003 | 49,502 | $ | 744,073 | 1,307 | $ | 18,046 | 7,523 | $ | (39,913 | ) | $ | 24,521 | $ | 746,727 | 49,502 | $ | 744,073 | 1,307 | $ | 18,046 | — | $ | — | 7,523 | $ | (39,913 | ) | $ | 24,521 | 58,332 | $ | 746,727 | |||||||||||||||||||
| Issuance of common units | 4,968 | 157,568 | — | — | — | — | — | — | 3,371 | 4,968 | 160,939 | ||||||||||||||||||||||||||||||||||||||||
| Issuance of common units under LTIP | 362 | 11,772 | — | — | — | — | — | — | 238 | 362 | 12,010 | ||||||||||||||||||||||||||||||||||||||||
| Private placement of Class C common units | — | — | — | — | 3,246 | 98,782 | — | — | 2,041 | 3,246 | 100,823 | ||||||||||||||||||||||||||||||||||||||||
| Issuance of units for acquisition contingent consideration | 385 | 13,082 | — | — | — | — | — | — | 267 | 385 | 13,349 | ||||||||||||||||||||||||||||||||||||||||
| Distributions | — | (134,175 | ) | — | (3,009 | ) | — | (5,648 | ) | — | (4,231 | ) | (11,289 | ) | — | (158,352 | ) | ||||||||||||||||||||||||||||||||||
| Other comprehensive income | — | 59,886 | — | 1,248 | — | 3,098 | — | (841 | ) | 1,311 | — | 64,702 | |||||||||||||||||||||||||||||||||||||||
| Net income | — | 111,161 | — | 2,490 | — | 4,191 | — | 1,444 | 10,720 | — | 130,006 | ||||||||||||||||||||||||||||||||||||||||
| Conversion of subordinated units | 7,523 | (43,541 | ) | — | — | — | — | (7,523 | ) | 43,541 | — | — | — | ||||||||||||||||||||||||||||||||||||||
| Balance at December 31, 2004 | 62,740 | $ | 919,826 | 1,307 | $ | 18,775 | 3,246 | $ | 100,423 | — | $ | — | $ | 31,180 | 67,293 | $ | 1,070,204 | ||||||||||||||||||||||||||||||||||
The accompanying notes are an integral part of these consolidated financial statements.
PLAINS ALL AMERICAN PIPELINE, L.P. AND SUBSIDIARIES
CONSOLIDATED STATEMENTS OF COMPREHENSIVE INCOME
| | Year Ended December 31, | Year Ended December 31, | ||||||||||||||||||
|---|---|---|---|---|---|---|---|---|---|---|---|---|---|---|---|---|---|---|---|---|
| | 2003 | 2002 | 2001 | 2004 | 2003 | 2002 | ||||||||||||||
| | (in thousands) | (in thousands) | ||||||||||||||||||
| Net income | $ | 59,448 | $ | 65,292 | $ | 44,179 | $ | 130,006 | $ | 59,448 | $ | 65,292 | ||||||||
| Other comprehensive income (loss) | 46,595 | (1,684 | ) | (12,742 | ) | 64,702 | 46,595 | (1,684 | ) | |||||||||||
| Comprehensive income | $ | 106,043 | $ | 63,608 | $ | 31,437 | $ | 194,708 | $ | 106,043 | $ | 63,608 | ||||||||
CONSOLIDATED STATEMENT OF CHANGES IN ACCUMULATED
OTHER COMPREHENSIVE INCOME (LOSS)
| | | Net Deferred Loss on Derivative Instruments | Currency Translation Adjustments | Total | | Net Deferred Gain/(Loss) on Derivative Instruments | Currency Translation Adjustments | Total | ||||||||||||||
|---|---|---|---|---|---|---|---|---|---|---|---|---|---|---|---|---|---|---|---|---|---|---|
| | (in thousands) | |||||||||||||||||||||
| Balance at December 31, 2000 | $ | — | $ | — | $ | — | ||||||||||||||||
| Cumulative effect of accounting change | (8,337 | ) | — | (8,337 | ) | |||||||||||||||||
| Reclassification adjustments for settled contracts | (2,526 | ) | — | (2,526 | ) | |||||||||||||||||
| Changes in fair value of outstanding hedge positions | 6,123 | — | 6,123 | |||||||||||||||||||
| Currency translation adjustment | — | (8,002 | ) | (8,002 | ) | |||||||||||||||||
| | (in thousands) | |||||||||||||||||||||
| Balance at December 31, 2001 | Balance at December 31, 2001 | (4,740 | ) | (8,002 | ) | (12,742 | ) | Balance at December 31, 2001 | $ | (4,740 | ) | $ | (8,002 | ) | $ | (12,742 | ) | |||||
| Reclassification adjustments for settled contracts | Reclassification adjustments for settled contracts | 797 | — | 797 | Reclassification adjustments for settled contracts | 797 | — | 797 | ||||||||||||||
| Changes in fair value of outstanding hedge positions | Changes in fair value of outstanding hedge positions | (4,264 | ) | — | (4,264 | ) | Changes in fair value of outstanding hedge positions | (4,264 | ) | — | (4,264 | ) | ||||||||||
| Currency translation adjustment | Currency translation adjustment | — | 1,783 | 1,783 | Currency translation adjustment | — | 1,783 | 1,783 | ||||||||||||||
| 2002 Activity | (3,467 | ) | 1,783 | (1,684 | ) | 2002 Activity | (3,467 | ) | 1,783 | (1,684 | ) | |||||||||||
| Balance at December 31, 2002 | Balance at December 31, 2002 | (8,207 | ) | (6,219 | ) | (14,426 | ) | Balance at December 31, 2002 | (8,207 | ) | (6,219 | ) | (14,426 | ) | ||||||||
| Reclassification adjustments for settled contracts | Reclassification adjustments for settled contracts | (28,151 | ) | — | (28,151 | ) | Reclassification adjustments for settled contracts | (28,151 | ) | — | (28,151 | ) | ||||||||||
| Changes in fair value of outstanding hedge positions | Changes in fair value of outstanding hedge positions | 28,666 | — | 28,666 | Changes in fair value of outstanding hedge positions | 28,666 | — | 28,666 | ||||||||||||||
| Currency translation adjustment | Currency translation adjustment | — | 46,080 | 46,080 | Currency translation adjustment | — | 46,080 | 46,080 | ||||||||||||||
| 2003 Activity | 515 | 46,080 | 46,595 | 2003 Activity | 515 | 46,080 | 46,595 | |||||||||||||||
| Balance at December 31, 2003 | Balance at December 31, 2003 | $ | (7,692 | ) | $ | 39,861 | $ | 32,169 | Balance at December 31, 2003 | (7,692 | ) | 39,861 | 32,169 | |||||||||
Reclassification adjustments for settled contracts | Reclassification adjustments for settled contracts | 13,262 | — | 13,262 | ||||||||||||||||||
| Changes in fair value of outstanding hedge positions | Changes in fair value of outstanding hedge positions | 20,367 | — | 20,367 | ||||||||||||||||||
| Currency translation adjustment | Currency translation adjustment | — | 31,073 | 31,073 | ||||||||||||||||||
| 2004 Activity | 33,629 | 31,073 | 64,702 | |||||||||||||||||||
| Balance at December 31, 2004 | Balance at December 31, 2004 | $ | 25,937 | $ | 70,934 | $ | 96,871 | |||||||||||||||
The accompanying notes are an integral part of these consolidated financial statements.
PLAINS ALL AMERICAN PIPELINE, L.P. AND SUBSIDIARIES
NOTES TO THE CONSOLIDATED FINANCIAL STATEMENTS
Note 1—Organization and Basis of Presentation
Organization
Plains All American Pipeline, L.P. ("PAA") is a publicly traded Delaware limited partnership (the "Partnership")formed in September of 1998. Our operations are conducted directly and indirectly through our operating subsidiaries, Plains Marketing, L.P., Plains Pipeline, L.P. and Plains Marketing Canada, L.P. We are engaged in interstate and intrastate crude oil transportation, and crude oil gathering, marketing, terminalling and storage, as well as the marketing and storage of liquefied petroleum gas and other natural gas related petroleum products. We refer to liquified petroleum gas and othernatural gas related petroleum products collectively as "LPG"."LPG." We were formedown an extensive network of pipeline transportation, terminalling, storage and gathering assets in September 1998 to acquirekey oil producing basins and operateat major market hubs in the midstream crude oil businessUnited States and assets of Plains Resources Inc. and its wholly-owned subsidiaries ("Plains Resources") as a separate, publicly traded master limited partnership. We completed our initial public offering in November 1998. As a result of subsequent equity offerings and the purchase in 2001 by senior management and a group of financial investors of majority control of our general partner and a portion of Plains Resources' limited partner units (the "General Partner Transition"), Plains Resources' overall effective ownership in us was reduced to approximately 22%.Canada.
As a result of the 2001 transaction, ourOur 2% general partner interest is held by Plains AAP, L.P., a Delaware limited partnership. Plains All American GP LLC, a Delaware limited liability company, is Plains AAP, L.P.'s general partner. Plains All American GP LLC manages our operations and activities and employs our officers and personnel, who devote 100% of their efforts to the management of the Partnership. Unless the context otherwise requires, we use the term "general partner" to refer to both Plains AAP, L.P. and Plains All American GP LLC. Plains AAP, L.P. and Plains All American GP LLC are essentially held by 7seven owners with the largest interest,interests ranging from 44%, held by Plains Resources. We use the phrase "former general partner" to refer to the subsidiary of Plains Resources that formerly held the general partner interest.
Our operations are conducted directly and indirectly through our operating subsidiaries, Plains Marketing, L.P., Plains Pipeline, L.P. and Plains Marketing Canada, L.P., and are concentrated in Texas, Oklahoma, California, Louisiana and the Canadian provinces of Alberta and Saskatchewan.3.2%.
Change in Accounting Principle
During the second quarter of 2004, we changed our method of accounting for pipeline linefill in third party assets. Historically, we have viewed pipeline linefill, whether in our assets or third party assets, as having long-term characteristics rather than characteristics typically associated with the short-term classification of operating inventory. Therefore, previously we have not included linefill barrels in the same average costing calculation as our operating inventory, but instead have carried linefill at historical cost. Following this change in accounting principle, the linefill in third party assets that we have historically classified as a portion of "Pipeline Linefill" on the face of the balance sheet (a long-term asset) and carried at historical cost, will be included in "Inventory" (a current asset) in determining the average cost of operating inventory and applying the lower of cost or market analysis. At the end of each period, we will reclassify the linefill in third party assets not expected to be liquidated within the succeeding twelve months out of "Inventory" (a current asset), at average cost, and into "Inventory in Third Party Assets" (a long-term asset), which is now reflected as a separate line item within other assets on the consolidated balance sheet.
This change in accounting principle is effective January 1, 2004. The cumulative effect of this change in accounting principle as of January 1, 2004, is a charge of approximately $3.1 million, representing a reduction in Inventory of approximately $1.7 million, a reduction in Pipeline Linefill of approximately $30.3 million and an increase in Inventory in Third Party Assets of $28.9 million. The pro forma impact on net income and net income per limited partner unit (basic and diluted) presented
below gives effect to the retroactive application of the change in accounting for pipeline linefill in third party assets had the new method been in effect in the years presented.
| | 2003 | 2002 | 2001 | |||||||
|---|---|---|---|---|---|---|---|---|---|---|
| | (in millions, except per unit data) | |||||||||
| Income before cumulative effect of accounting change | $ | 59.4 | $ | 65.3 | $ | 43.7 | ||||
| Income before cumulative effect of accounting change per limited partner unit: | ||||||||||
| Basic | $ | 1.01 | $ | 1.34 | $ | 1.12 | ||||
| Diluted | $ | 1.00 | $ | 1.34 | $ | 1.12 | ||||
Net Income | $ | 59.4 | $ | 65.3 | $ | 44.2 | ||||
| Net Income per limited partner unit: | ||||||||||
| Basic | $ | 1.01 | $ | 1.34 | $ | 1.13 | ||||
| Diluted | $ | 1.00 | $ | 1.34 | $ | 1.13 | ||||
Pro Forma Income before cumulative effect of accounting change | $ | 61.4 | $ | 64.8 | $ | 38.4 | ||||
| Pro Forma Income before cumulative effect of accounting change per limited partner unit: | ||||||||||
| Basic | $ | 1.05 | $ | 1.33 | $ | 0.97 | ||||
| Diluted | $ | 1.04 | $ | 1.33 | $ | 0.97 | ||||
Pro Forma Net Income | $ | 61.4 | $ | 64.8 | $ | 38.9 | ||||
| Pro Forma Net Income per limited partner unit: | ||||||||||
| Basic | $ | 1.05 | $ | 1.33 | $ | 0.99 | ||||
| Diluted | $ | 1.04 | $ | 1.33 | $ | 0.99 | ||||
In conjunction with this change in accounting principle, we have classified the cash flows associated with purchases and sales of linefill on assets that we own as cash flows from investing activities instead of the historical classification as cash flows from operating activities. Accordingly, the accompanying statement of cash flows for the year ended December 31, 2003, 2002 and 2001 has been revised to reclassify the cash paid for linefill in assets owned from operating activities to investing activities. As a result of this change in classification, net cash provided by operating activities for the years ended December 31, 2003 and 2002 increased to $115.3 million from $68.5 million and to $185.0 million from $173.9 million, respectively. Net cash used in investing activities for the years ended December 31, 2003 and 2002 increased to $272.1 million from $225.3 million and $374.8 million from $363.8 million, respectively. In addition, net cash used in operating activities for the year ended December 31, 2001 decreased from $30 million to $16.2 million and net cash used in investing activities increased to $263.2 million from $249.5 million.
Basis of Consolidation and Presentation
The accompanying financial statements and related notes present our consolidated financial position as of December 31, 20032004 and 2002,2003, and the consolidated results of our operations, cash flows, changes in partners' capital, and comprehensive income (loss) for the years ended December 31, 2003, 2002 and 2001, and changes in accumulated other comprehensive income for the years ended December 31, 2004, 2003 and 2002. All significant intercompany transactions have been eliminated. Certain reclassifications were made to prior periods to conform with the current period presentation. The accompanying consolidated financial statements of PAA include PAA and all of its wholly-owned subsidiaries. Investments in 50% or less owned affiliates, over which the Company has significant influence, are accounted for by the equity method.
Change in Accounting Principle
During the second quarter of 2004, we changed our method of accounting for pipeline linefill in third party assets. Historically, we have viewed pipeline linefill, whether in our assets or third party assets, as having long-term characteristics rather than characteristics typically associated with the short-term classification of operating inventory. Therefore, previously we have not included linefill barrels in the same average costing calculation as our operating inventory, but instead have carried linefill at historical cost. Following this change in accounting principle, the linefill in third party assets that we have historically classified as a portion of "Pipeline Linefill" on the face of the balance sheet (a long-term asset) and carried at historical cost, is included in "Inventory" (a current asset) in determining the average cost of operating inventory and applying the lower of cost or market analysis. At the end of each period, we reclassify the linefill in third party assets not expected to be liquidated within the succeeding twelve months out of "Inventory" (a current asset), at average cost, and into "Inventory in Third Party Assets" (a long-term asset), which is now reflected as a separate line item within other assets on the consolidated balance sheet.
This change in accounting principle is effective January 1, 2004 and is reflected in the consolidated statement of operations for the year ended December 31, 2004 and the consolidated balance sheets as
of December 31, 2004 and 2003 included herein. The cumulative effect of this change in accounting principle as of January 1, 2004, is a charge of approximately $3.1 million, representing a reduction in Inventory of approximately $1.7 million, a reduction in Pipeline Linefill of approximately $30.3 million and an increase in Inventory in Third Party Assets of $28.9 million. The pro forma impact for the year ended December 31, 2003 would have been an increase to net income of approximately $2.0 million ($0.04 per basic and diluted limited partner unit) resulting in pro forma net income of $61.5 million and pro forma basic net income per limited partner unit of $1.05 and pro forma diluted net income per limited partner unit of $1.04. The pro forma impact for the year ended December 31, 2002 would have been a decrease to net income of approximately $0.1 million (no impact to basic and diluted limited partner unit) resulting in pro forma net income of $65.2 million and pro forma basic net income per limited partner unit of $1.34 and pro forma diluted net income per limited partner unit of $1.34.
In conjunction with this change in accounting principle, we have classified cash flows associated with purchases and sales of linefill on assets that we own as cash flows from investing activities instead of the historical classification of cash flows from operating activities. As a result of this change in classification, net cash provided by operating activities for the years ended December 31, 2003 and 2002 increased to $115.3 million from $68.5 million and to $185.0 million from $173.9 million, respectively. Net cash used in investing activities for the years ended December 31, 2003 and 2002 increased to $272.1 million from $225.3 million and $374.8 million from $363.8 million, respectively.
Note 2—Summary of Significant Accounting Policies
Use of Estimates
The preparation of financial statements in conformity with generally accepted accounting principles requires us to make estimates and assumptions that affect the reported amounts of assets and liabilities and disclosure of contingent assets and liabilities at the date of the financial statements and the reported amounts of revenues and expenses during the reporting period. Significant estimates we make include: (i) accruals related to purchases and sales, (ii) mark-to-market estimates pursuant to Statement of Financial Accounting Standards ("SFAS") No. 133 "Accounting For Derivative Instruments and Hedging Activities", as amended, (iii) contingent liability accruals (iv) accruals related to our Long-Term Incentive Plan (the "LTIP") and (v)(iv) estimated fair value of assets and liabilities acquired and identification of associated goodwill and intangible assets. Although we believe these estimates are reasonable, actual results could differ from these estimates.
Revenue Recognition
Buy/sell transactions. The Emerging Issues Task Force ("EITF") is currently considering Issue No. 04-13, "Accounting for Purchases and Sales of Inventory with the Same Counterparty," ("EITF No. 04-13"), which relates to buy/sell transactions. The issues to be addressed by the EITF are i) under what circumstances should two or more transactions with the same counterparty be viewed as a single nonmonetary transaction within the scope of APB No. 29; and ii) if nonmonetary transactions within the scope of APB No. 29 involve inventory, are there any circumstances under which the transactions should be recognized at fair value.
Buy/sell transactions are contractual arrangements in which we agree to buy a specific quantity and quality of crude oil or LPG to be delivered at a specific location while simultaneously agreeing to sell a specified quantity and quality of crude oil or LPG at a different location, usually with the same counterparty. These arrangements are generally designed to increase our margin through a variety of
methods, including reducing our transportation or storage costs or acquiring a grade of crude oil that more closely matches our physical delivery requirement to one of our other customers. The value difference between purchases and sales is referred to as margin and is primarily due to grade, quality or location differentials. All buy/sell transactions result in us making or receiving physical delivery of the product, involve the attendant risks and rewards of ownership, including title transfer, assumption of environmental risk, transportation scheduling, credit risk and counterparty nonperformance risk, and such transactions are settled in cash similar to all other purchases and sales. Accordingly, such transactions are recorded in both revenues and purchases as separate sales and purchase transactions on a "gross" basis.
We believe that buy/sell transactions are monetary in nature and thus outside the scope of APB Opinion No. 29, "Accounting for Nonmonetary Transactions" ("APB No. 29"). Additionally, we have evaluated EITF No. 99-19, "Reporting Revenue Gross as a Principal versus Net as an Agent" ("EITF No. 99-19") and, based on that evaluation, we believe that recording these transactions on a gross basis is appropriate. If the EITF were to determine that these transactions should be accounted for as monetary transactions on a gross basis, no change in our accounting policy for buy/sell transactions would be necessary. If the EITF were to determine that these transactions should be accounted for as nonmonetary transactions qualifying for fair value recognition and require a net presentation of such transactions, the amounts of revenues and purchases associated with buy/sell transactions would be netted in our consolidated statement of operations, but there would be no effect on operating income, net income or cash flows from operating activities. If the EITF were to determine that these transactions should be accounted for as nonmonetary transactions not qualifying for fair value recognition, these amounts of revenues and purchases would be netted in our consolidated statement of operations and there could be an impact on operating income and net income related to the timing of the ultimate sale of product purchased in the "buy" side of the buy/sell transaction. However, we do not believe any impact on operating income, net income or cash flows from operating activities would be material.
Gathering, Marketing, Terminalling and Storage Segment Revenues. Revenues from crude oil and LPG sales are recognized at the time title to the product sold transfers to the purchaser, which occurs upon receipt of the product by the purchaser. All salesSales of crude oil and LPG consist of outright sales contracts and buy/sell arrangements which are booked gross except in the case ofas well as barrel exchanges thatwhich are net settled.booked net.
Terminalling and storage revenues, which are classified as other revenues on the income statement, consist of (i) storage fees from actual storage used on a month-to-month basis; (ii) storage fees resulting from short-term and long-term contracts for committed space that may or may not be utilized by the customer on a given month; and (iii) terminal throughput charges to pump crude oil to connecting carriers. Revenues on storage are recognized ratably over the term of the contract. Terminal throughput charges are recognized as the crude oil exits the terminal and is delivered to the connecting crude oil carrier. Any throughput volumes in transit at the end of a given month are treated as third party inventory and do not incur storage fees. All terminalling and storage revenues are based on actual volumes and rates.
Pipeline Segment Revenues. Pipeline margin activities primarily consist of the purchase and sale of crude oil shipped on our San Joaquin Valley system from barrel exchanges and buy/sell arrangements. Revenues associated with these activities are recognized at the time title to the product sold transfers
to the purchaser, which occurs upon receipt of the product by the purchaser. Revenues for these transactions are recorded gross except in the case of barrel exchanges that are net settled. All of our pipeline margin activities revenues are based on actual volumes and prices. Revenues from pipeline tariffs and fees are associated with the transportation of crude oil at a published tariff as well as fees associated with line leases for committed space on a particular system that may or may not be utilized. Tariff revenues are recognized either at the point of delivery or at the point of receipt pursuant to specifications outlined in the regulated and non-regulated tariffs. Revenues associated with line lease fees are recognized in the month to which the lease applies, whether or not the space is actually utilized. All pipeline tariff and fee revenues are based on actual volumes and rates.
Purchases and Related Costs
Purchases and related costs include: (i) the cost of crude oil and LPG purchased;purchased in outright purchases as well as buy/sell arrangements; (ii) third party transportation and storage, whether by pipeline, truck or barge; and (iii) expenses to issue letters of credit to support these purchases. These purchases are accrued at the time title transfers to us which occurs upon receipt of the product.
Operating Expenses and General and Administrative Expenses
Operating expenses consist of various field and pipeline operating expenses including fuel and power costs, telecommunications, labor costs for truck drivers and pipeline field personnel, maintenance
costs, regulatory compliance, environmental remediation, insurance, vehicle leases, and property taxes. General and administrative expenses consist primarily of payroll and benefit costs, certain information system and legal costs, office rent, contract and consultant costs, and audit and tax fees.
Foreign Currency Transactions
Assets and liabilities of subsidiaries with a functional currency other than the U.S. Dollar are translated at period end rates of exchange and revenues and expenses are translated at average exchange rates prevailing for each month. The resulting translation adjustments are made directly to a separate component of other comprehensive income in partners' capital. Gains and losses from foreign currency transactions (transactions denominated in a currency other than the entity's functional currency) are included in the consolidated statement of operations. These gains totaled approximately $5.0 million for the year ended December 31, 2004, and were immaterial for the years ended December 31, 2003 and 2002.
Cash and Cash Equivalents
Cash and cash equivalents consist of all demand deposits and funds invested in highly liquid instruments with original maturities of three months or less and at times maytypically exceed federally insured limits. We periodically assess the financial condition of the institutions where these funds are held and believe that any possible credit risk is minimal.
Accounts Receivable
Our accounts receivable are primarily from purchasers and shippers of crude oil.oil and, to a lesser extent, purchasers of LPG. There werewas a nominal amount due from related parties at December 31, 2004 and no amounts due from related parties at December 31, 2003 or 2002.2003. The majority of our accounts
receivable relate to our gathering and marketing activities that can generally be described as high volume and low margin activities, in many cases involving complex exchanges of crude oil volumes. We make a determination of the amount, if any, of the line of credit to be extended to any given customer and the form and amount of financial performance assurances we require. Such financial assurances are commonly provided to us in the form of standby letters of credit.
Accounts receivable included in the consolidated balance sheets are reflected netcredit, advance cash payments or "parental" guarantees. At December 31, 2004, we had received approximately $20.3 million of advance cash payments and prepayments from third parties to mitigate credit risk. In addition, we enter into netting arrangements with our counterparties. These arrangements cover a significant part of our allowance for doubtful accounts.transactions and also serve to mitigate credit risk.
We routinely review ourall outstanding accounts receivable balances to identify past due amountson a monthly basis and analyze the reasons such amounts have not been collected. In many instances, such delays involve billing delays and discrepancies or disputes as to the appropriate price, volumes or quality of crude oil delivered or exchanged. We also attempt to monitor changes in the creditworthiness ofassess whether our customers as a result of developments related to each customer, the industry as a whole and the general economy. Based on these analyses as well as our historical experience and the facts and circumstances surrounding certain aged balances, we have established an allowance for doubtful trade accounts receivable is adequate. Actual balances are not applied against the reserve until all collection efforts have been exhausted. At December 31, 2004 and 2003, substantially all of our net accounts receivable classified as current were less than 60 days past their scheduled invoice date, and our allowance for doubtful accounts receivable (the entire balance of which is classified as current) totaled $0.6 million and $0.2 million, respectively. Although we consider this reserve adequate; however,our allowance for doubtful trade accounts receivable to be adequate, there is no assurance that actual amounts will not vary significantly from estimated amounts. The discovery of previously unknown facts or adverse developments affecting one of our counterparties or the industry as a whole could adversely impact our results of operations.
At December 31, 2003 and 2002, approximately 99% of net accounts receivable classified as current were less than 60 days past scheduled invoice date, and our allowance for doubtful accounts receivable classified as current totaled $0.2 million and $3.1 million, respectively. We consider these reserves adequate. At December 31, 2003 we had no accounts receivable balances or allowance for doubtful accounts classified as long-term. At December 31, 2002, approximately $11.5 million of accounts receivable ($6.5 million, net of a $5.0 million allowance) was classified as long-term. Following is a reconciliation of the changes in our allowance for doubtful accounts balances (in millions):
| | December 31, | ||||||||
|---|---|---|---|---|---|---|---|---|---|
| | 2003 | 2002 | 2001 | ||||||
| Balance at beginning of year | $ | 8.1 | $ | 8.0 | $ | 5.0 | |||
| Applied to accounts receivable balances | (8.3 | ) | — | — | |||||
| Charged to expense | 0.4 | 0.1 | 3.0 | ||||||
| Balance at end of year | $ | 0.2 | $ | 8.1 | $ | 8.0 | |||
| | December 31, | ||||||||
|---|---|---|---|---|---|---|---|---|---|
| | 2004 | 2003 | 2002 | ||||||
| Balance at beginning of year | $ | 0.2 | $ | 8.1 | $ | 8.0 | |||
| Applied to accounts receivable balances | — | (8.3 | ) | — | |||||
| Increase in reserve charged to expense | 0.4 | 0.4 | 0.1 | ||||||
| Balance at end of year | $ | 0.6 | $ | 0.2 | $ | 8.1 | |||
Inventory and Pipeline Linefill
Inventory primarily consists of crude oil and LPG in pipelines, storage tanks and rail cars whichthat is valued at the lower of cost or market, with cost determined using an average cost method. InDuring the fourth quarter of 2001, the Partnership2004, we recorded a $5.0$2.0 million noncash charge related to the writedown of operating crude oilour LPG inventory. Linefill and minimum working inventory to reflect pricesrequirements are recorded at December 31, 2001. During 2001, the price of crude oil traded on the NYMEX averaged $25.98 per barrel. At December 31, 2001, the NYMEX crude oil price was approximately 24% lower, or $19.84 per barrel. There was no writedown of operating crude oil inventory at December 31, 2003 or 2002, as the market priceshistorical cost and consist of crude oil and LPG were higher thanused to pack an operated pipeline such that when an incremental barrel enters a pipeline it forces a barrel out at another location, as well as the minimum amount of crude oil necessary to operate our storage and terminalling facilities.
Linefill and minimum working inventory requirements in third party assets are included in "Inventory" (a current asset) in determining the average cost per barrel.of operating inventory and applying the lower of cost or market analysis. At the end of each period, we reclassify the linefill in third party assets not expected to be liquidated within the succeeding twelve months out of "Inventory," at average cost, and into "Inventory in Third Party Assets" (a long-term asset), which is reflected as a separate line item within other assets on the consolidated balance sheet.
At December 31, 2004 and 2003, inventory and 2002, inventorylinefill consisted of (in millions):of:
| | December 31, | | December 31, 2004 | December 31, 2003 | |||||||||||||||||||
|---|---|---|---|---|---|---|---|---|---|---|---|---|---|---|---|---|---|---|---|---|---|---|---|
| | 2003 | 2002 | | Barrels | Dollars | Dollar/ barrel | Barrels | Dollars | Dollar/ barrel | ||||||||||||||
| | | (Barrels in thousands and dollars in millions) | |||||||||||||||||||||
| Inventory | Inventory | ||||||||||||||||||||||
| Crude oil | $ | 50.6 | $ | 53.5 | Crude oil | 8,716 | $ | 396.2 | $ | 45.46 | 1,676 | $ | 50.6 | $ | 30.19 | ||||||||
| LPG | 53.8 | 28.3 | LPG | 2,857 | 100.1 | 35.04 | 2,243 | 53.8 | 23.99 | ||||||||||||||
| Other | 1.6 | — | Other | — | 1.9 | N/A | — | 1.6 | N/A | ||||||||||||||
| $ | 106.0 | $ | 81.8 | Inventory subtotal | 11,573 | $ | 498.2 | 3,919 | $ | 106.0 | |||||||||||||
Inventory in third-party assets | Inventory in third-party assets | ||||||||||||||||||||||
| Crude oil | Crude oil | 1,294 | $ | 48.7 | 37.64 | 853 | $ | 22.6 | 26.49 | ||||||||||||||
| LPG | LPG | 318 | 10.6 | 33.33 | 183 | 4.1 | 22.40 | ||||||||||||||||
| Inventory in third-party assets subtotal | 1,612 | $ | 59.3 | 1,036 | $ | 26.7 | |||||||||||||||||
Linefill | Linefill | ||||||||||||||||||||||
| Crude oil linefill | Crude oil linefill | 6,015 | $ | 168.4 | 28.00 | 3,767 | $ | 95.9 | 25.46 | ||||||||||||||
| Total | Total | 19,200 | $ | 725.9 | 8,722 | $ | 228.6 | ||||||||||||||||
Property and Equipment and Pipeline Linefill
Property and equipment, net is stated at cost and consisted of the following (in millions):following:
| | December 31, | |||||||||||||
|---|---|---|---|---|---|---|---|---|---|---|---|---|---|---|
| | December 31, | 2004 | 2003 | |||||||||||
| | 2003 | 2002 | (in millions) | |||||||||||
| Crude oil pipelines and facilities | $ | 1,114.5 | $ | 909.3 | $ | 1,605.3 | $ | 1,114.5 | ||||||
| Crude oil and LPG storage and terminal facilities | 100.8 | 82.4 | 169.6 | 100.8 | ||||||||||
| Trucking equipment and other | 43.8 | 30.0 | 117.6 | 43.8 | ||||||||||
| Office property and equipment | 13.5 | 8.6 | 19.0 | 13.5 | ||||||||||
| 1,272.6 | 1,030.3 | 1,911.5 | 1,272.6 | |||||||||||
| Less accumulated depreciation | (121.6 | ) | (77.5 | ) | (183.9 | ) | (121.6 | ) | ||||||
| $ | 1,151.0 | $ | 952.8 | $ | 1,727.6 | $ | 1,151.0 | |||||||
Depreciation expense for each of the three years in the period ended December 31, 2003,2004, was $63.3 million, $42.4 million $30.2 million and $21.6$30.2 million, respectively. Our policy is to depreciate property and equipment over estimated useful lives as follows:
We calculate our depreciation and amortization using the straight-line method, based on estimated useful lives and salvage values of our assets. These estimates are based on various factors including age (in the case of acquired assets), manufacturing specifications, technological advances and historical data concerning useful lives of similar assets. Uncertainties that impact these estimates include changes in laws and regulations relating to restoration and abandonment requirements, economic conditions, and supply and demand in the area. When assets are put into service, we make estimates with respect to useful lives and salvage values that we believe are reasonable. However, subsequent events could cause us to change our estimates, thus impacting the future calculation of depreciation and amortization.
Historically, adjustments to useful lives have not had a material impact on our aggregate depreciation levels from year to year.
In accordance with our capitalization policy, costs associated with acquisitions and improvements, including related interest costs, which expand our existing capacity are capitalized. For the years ended December 31, 2004, 2003 2002 and 2001,2002, capitalized interest was $0.5 million, $0.8$0.5 million and $0.2$0.8 million, respectively. In addition, costs required either to maintain the existing operating capacity of partially or fully depreciated assets or to extend their useful lives are capitalized and classified as maintenance capital. Repair and maintenance expenditures associated with existing assets that do not extend the useful life or expand the operating capacity are charged to expense as incurred.
Linefill and minimum working inventory requirements are recorded at lower of cost or market and consists of crude oil and LPG used to pack a pipeline such that when an incremental barrel enters a pipeline it forces a barrel out at another location as well as minimum crude oil necessary to operate our storage and terminalling facilities. At December 31, 2003, we had approximately 4.6 million barrels of crude oil and 7.7 million gallons of LPG used to maintain our minimum linefill and working inventory requirements. Proceeds from the sale and repurchase of pipeline linefill are reflected as cash flows from operating activities in the accompanying consolidated statements of cash flows.
Asset Retirement Obligation
In June 2001, the FASB issued SFAS No. 143 "Asset Retirement Obligations." SFAS 143 establishes accounting requirements for retirement obligations associated with tangible long-lived assets, including (1) the time of the liability recognition, (2) initial measurement of the liability, (3) allocation of asset retirement cost to expense, (4) subsequent measurement of the liability and (5) financial statement disclosures. SFAS 143 requires that the cost for asset retirement should be capitalized as part of the cost of the related long-lived asset and subsequently allocated to expense using a systematic and rational method. Effective January 1, 2003, we adopted SFAS 143, as required. DeterminationThe adoption of the amounts to be recognized upon adoption is based upon numerous estimates and assumptions, including future retirement costs, future inflation rates and the credit-adjusted risk-free interest rate. The majoritythis statement did not have a material impact on our financial position, results of operations or cash flows.
Some of our assets, primarily related to our pipeline operations segment, have obligations to perform remediation and, in some instances, removal activities when the asset is abandoned. However, the majority of these obligations are associated with active assets and the fair value of the asset retirement obligations cannot be reasonably estimated, as the settlement dates are indeterminate. WeA small portion of these obligations relate to assets that are inactive and although the ultimate timing and cost to settle these obligations is not known with certainty, we can reasonably estimate the obligation. As such, we have estimated that the fair value of these obligations is approximately $2.5 million at December 31, 2004. For those obligations that are currently indeterminate, we will record such asset retirement obligations in the period in which we can reasonably determine the settlement dates. The adoption of this statement did not have a material impact on our financial position, results of operations or cash flows.
Impairment of Long-Lived Assets
Long-lived assets with recorded values that are not expected to be recovered through future cash flows are written-down to estimated fair value in accordance with SFAS No. 144 "Accounting for the Impairment or Disposal of Long-Lived Assets," as amended. Under SFAS 144, an asset shall be tested for impairment when events or circumstances indicate that its carrying value may not be recoverable. The carrying value of a long-lived asset is not recoverable if it exceeds the sum of the undiscounted
cash flows expected to result from the use and eventual disposition of the asset. If the carrying value exceeds the sum of the undiscounted cash flows, an impairment loss equal to the amount the carrying value exceeds the fair value of the asset is recognized. Fair value is generally determined from estimated discounted future net cash flows. We adopted SFAS 144 on January 1, 2002, and there have been no events or circumstances indicating that2002. In 2004, we recognized a charge of approximately $2.0 million associated with taking our pipeline in the carryingIllinois Basin out of service. The impairment represents the remaining net book value of anythe idled pipeline system. This pipeline did not support spending the capital necessary to continue service and we shifted the majority of our assets may not be recoverable.the gathering and transport activities to trucks.
Other Assets
Other assets net consist of the following (in millions):following:
| | December 31, | |||||||||||||
|---|---|---|---|---|---|---|---|---|---|---|---|---|---|---|
| | December 31, | 2004 | 2003 | |||||||||||
| | 2003 | 2002 | (in millions) | |||||||||||
| Goodwill | $ | 39.4 | $ | 12.9 | $ | 47.1 | $ | 39.4 | ||||||
| Deposit on Capline Acquisition | 15.8 | — | ||||||||||||
| Deposit on pending acquisition | 11.9 | 15.8 | ||||||||||||
| Debt issue costs | 12.1 | 21.6 | 15.5 | 12.1 | ||||||||||
| Investment in affiliate | 7.8 | 8.0 | 8.2 | 7.8 | ||||||||||
| Long term receivable, net | — | 6.5 | ||||||||||||
| Fair value of derivative instruments | 5.9 | 2.6 | 8.6 | 5.9 | ||||||||||
| Intangible assets (contracts) | 2.6 | 2.4 | ||||||||||||
| Intangible assets | 2.7 | 2.6 | ||||||||||||
| Other | 7.1 | 2.6 | 14.0 | 7.1 | ||||||||||
| 90.7 | 56.6 | 108.0 | 90.7 | |||||||||||
| Less accumulated amortization | (1.7 | ) | (8.3 | ) | (4.1 | ) | (1.7 | ) | ||||||
| $ | 89.0 | $ | 48.3 | $ | 103.9 | $ | 89.0 | |||||||
Goodwill is recorded as the amount of the purchase price in excess of the fair value of certain assets purchased. At December 31, 2003, we recorded additional consideration related to the deferred portion of the purchase price in the CANPET acquisition (See Note 3). The entire amount of this consideration was recorded as additional goodwill. In accordance with SFAS No. 142, "Goodwill and Other Intangible Assets," which we adopted January 1, 2002, we test goodwill and other intangible assets periodically to determine whether an impairment has occurred. Goodwill is tested for impairment at a level of reporting referred to as a reporting unit. If the fair value of a reporting unit exceeds its carrying amount, goodwill of the reporting unit is considered not impaired. An impairment loss is recognized for intangibles if the carrying amount of an intangible asset is not recoverable and its carrying amount exceeds its fair value. As of December 31, 2003, no2004, substantially all of our goodwill is allocated to our gathering, marketing, terminalling and storage operations ("GMT&S"). Since adoption of SFAS 142, the company has not recognized any impairment has occurred.of goodwill.
Costs incurred in connection with the issuance of long-term debt and amendments to our credit facilities are capitalized and amortized using the straight-linestraight line method over the term of the related debt. Use of the straight-line method does not differ materially from the "effective interest" method of amortization. During the fourth quarter of 2003, we replaced our senior secured credit facilities with new senior unsecured credit facilities and we completed the sale of $250 million of 5.625% senior notes (See Note 6). We capitalized approximately $5.1 million of costs associated with those transactions. Also, in conjunction with the credit facility refinancing, we incurred a non-cash charge of approximately $3.3 million attributable to a loss on the early extinguishment of debt (included in Interest income and other, net on the Consolidated Statement of Operations). The loss consists of unamortized debt issue costs written off as a result of the completion of the new credit facility. In addition, we wrote off approximately $11.3 million of fully amortized debtDebt issue costs and the related accumulated amortization are written off in conjunction with the refinancing or termination of the applicable debt arrangement. We capitalized costs of approximately $5.9 million and $5.1 million in 2004 and 2003, respectively. In addition, during 2004 we wrote off approximately $0.7 million of unamortized costs and approximately $1.7 million of fully amortized costs and the related accumulated amortization. During 2003, we wrote off comparable amounts totaling $3.3 million and $11.3 million, respectively.
Amortization of other assets for each of the three years in the period ended December 31, 2003,2004, was $3.9 million, $4.4 million $3.9 million and $2.7$3.9 million, respectively.
Environmental Matters
We record environmental liabilities when environmental assessments and/or remedial efforts are probable and we can reasonably estimate the costs. Generally, our recording of these accruals coincides with our completion of a feasibility study or our commitment to a formal plan of action. We also record receivables for amounts recoverable from insurance or from third parties under indemnification agreements in the period that we determine the costs are probable of recovery.
We expense or capitalize, as appropriate, environmental expenditures. We expense expenditures that relate to an existing condition caused by past operations, which do not contribute to current or future revenue generation. We recordcapitalize environmental liabilities whenassumed in business combinations based on the fair value of the environmental assessments and/or remedial efforts are probable and we can reasonably estimateobligations caused by past operations of the costs. Generally, our recording of
these accruals coincides with our completion of a feasibility study or our commitment to a formal plan of action.acquired company.
Income and Other Taxes
Except as noted below, no provision for U.S. federal or Canadian income taxes related to our operations is included in the accompanying consolidated financial statements, because as a partnership we are not subject to federal, state or provincial income tax and the tax effect of our activities accrues to the unitholders. Net earnings for financial statement purposes may differ significantly from taxable income reportable to unitholders as a result of differences between the tax bases and financial reporting bases of assets and liabilities and the taxable income allocation requirements under the partnership agreement. Individual unitholders will have different investment bases depending upon the timing and price of acquisition of partnership units. Further, each unitholder's tax accounting, which is partially dependent upon the unitholder's tax position, may differ from the accounting followed in the consolidated financial statements. Accordingly, there could be significant differences between each individual unitholder's tax bases and the unitholder's share of the net assets reported in the consolidated financial statements. We do not have access to information about each individual unitholder's tax attributes, and the aggregate tax basis cannot be readily determined. Accordingly, we do not believe that in our circumstances, the aggregate difference would be meaningful information.
The Partnership's Canadian operations are conducted through an operating limited partnership, of which our wholly owned subsidiary PMC (Nova Scotia) Company is the general partner. For Canadian tax purposes, the general partner is taxed as a corporation, subject to income taxes and a capital-based tax at federal and provincial levels. For 2003 and 2002, the income tax was not material and the capital-based tax was approximately $0.4 million (U.S.) and $0.5 million (U.S), respectively. In addition, interest payments made by Plains Marketing Canada, L.P. on its intercompany loan from Plains Marketing, L.P. are subject to a 10% Canadian withholding tax, which for 2003 and 2002 totaled $0.4 million and $0.5 million, respectively, and is recorded in other expense.years presented, these amounts were immaterial.
In addition to federal income taxes, owners of our common units may be subject to other taxes, such as state and local and Canadian federal and provincial taxes, unincorporated business taxes, and estate, inheritance or intangible taxes that may be imposed by the various jurisdictions in which we do business or own property. A unitholder may be required to file Canadian federal income tax returns, pay Canadian federal and provincial income taxes, file state income tax returns and pay taxes in various states.
Recent Accounting Pronouncements
In March 2004, the Emerging Issues Task Force issued Issue No. 03-06 ("EITF 03-06"), "Participating Securities and the Two-Class Method under FASB Statement No. 128." EITF 03-06 addresses a number of questions regarding the computation of earnings per share by companies that have issued securities, other than common stock, that contractually entitle the holder to participate in dividends and earnings of the company when, and if, it declares dividends on its common stock. The issue also provides further guidance in applying the two-class method of calculating earnings per share, clarifying what constitutes a participating security and how to apply the two-class method of computing earnings per share once it is determined that a security is participating, including how to allocate undistributed earnings to such a security. EITF 03-06 was effective for fiscal periods beginning after March 31, 2004. There was no impact on earnings per limited partner unit in the periods presented because of the adoption of EITF 03-06. The adoption of EITF 03-06 may have an impact on earnings per limited partner unit in future periods if net income exceeds distributions or if other participating securities are issued.
Derivative Instruments and Hedging Activities
We utilize various derivative instruments to (i) manage our exposure to commodity price risk, (ii) engage in a controlled trading program, (iii) manage our exposure to interest rate risk and (iv) manage our exposure to currency exchange rate risk. Beginning January 1, 2001, weWe record all derivative instruments on the balance sheet as either assets or liabilities measured at their fair value under the provisions of SFAS 133, "Accounting for Derivative Instruments and Hedging Activities" as amended by SFAS 137 and SFAS 138 (collectively "SFAS 133"). At adoption, and in accordance with the transition provisions of SFAS 133, we recorded a loss of $8.3 million in Other Comprehensive Income ("OCI"), representing the cumulative effect of an accounting change to recognize, at fair value, all cash flow derivatives. We also recorded a noncash gain of $0.5 million in earnings as a cumulative effect adjustment. SFAS 133 requires that changes in derivative instruments fair value be recognized currently in earnings unless specific hedge accounting criteria are met, in which case, changes in fair value are deferred to OCIOther Comprehensive Income ("OCI") and reclassified into earnings when the underlying transaction affects earnings. Accordingly, changes in fair value are included in the current period for (i) derivatives characterized as fair value hedges, (ii) derivatives that do not qualify for hedge accounting and (iii) the
portion of cash flow hedges that is not highly effective in offsetting changes in cash flows of hedged items.
Net Income Per Unit
Basic and diluted net income per unit is determined by dividing net income after deducting the amount allocated to the general partner interest, (including its incentive distribution in excess of its 2% interest), by the weighted average number of outstanding limited partner units during the period, including common units and subordinated units. Partnership income is first allocated to the general partner based on the amount of incentive distributions. The remainder is then allocated between the limited partners and general partner based on percentage ownership in the Partnership. Other comprehensive income is allocated based on the same effective percentages. The following
table sets forth the computation of basic and diluted net income per limited partner unit for 2004, 2003 2002 and 2001 (in millions, except per unit amounts). The net income available to limited partners and the weighted average limited partner units outstanding have been adjusted for the impact of the contingent equity issuance related to the CANPET acquisition for the calculation of diluted net income per limited partner unit (See Note 3).2002.
| | Year Ended December 31, | |||||||||||||||||||||||
|---|---|---|---|---|---|---|---|---|---|---|---|---|---|---|---|---|---|---|---|---|---|---|---|---|
| | | 2003 | 2002 | 2001 | | Year ended December 31, | ||||||||||||||||||
| | | (in millions, except per unit data) | | 2004 | 2003 | 2002 | ||||||||||||||||||
| Net income | Net income | $ | 59.4 | $ | 65.3 | $ | 44.2 | Net income | $ | 130,006 | $ | 59,448 | $ | 65,292 | ||||||||||
| Less: | Less: | Less: | ||||||||||||||||||||||
| General partner incentive distributions | (4.9 | ) | (3.1 | ) | (1.1 | ) | Incentive distribution right | (8,286 | ) | (4,884 | ) | (3,137 | ) | |||||||||||
| General partner 2% ownership | (1.1 | ) | (1.3 | ) | (0.9 | ) | ||||||||||||||||||
| Subtotal | 121,720 | 54,564 | 62,155 | |||||||||||||||||||||
| General partner 2% ownership | (2,434 | ) | (1,091 | ) | (1,243 | ) | ||||||||||||||||||
Numerator for basic earnings per limited partner unit: | Numerator for basic earnings per limited partner unit: | Numerator for basic earnings per limited partner unit: | ||||||||||||||||||||||
| Net income available for common unitholders | 53.4 | 60.9 | 42.2 | Net income available for limited partners | 119,286 | 53,473 | 60,912 | |||||||||||||||||
| Effect of dilutive securities: | ||||||||||||||||||||||||
| Effect of dilutive securities: | Effect of dilutive securities: | |||||||||||||||||||||||
| Increase in general partner's incentive distribution—Contingent equity issuance | (0.1 | ) | — | — | Increase in general partner's incentive distribution-contingent equity issuance | — | (61 | ) | — | |||||||||||||||
Numerator for diluted earnings per limited partner unit | Numerator for diluted earnings per limited partner unit | $ | 53.3 | $ | 60.9 | $ | 42.2 | Numerator for diluted earnings per limited partner unit | $ | 119,286 | $ | 53,412 | $ | 60,912 | ||||||||||
Denominator: | Denominator: | Denominator: | ||||||||||||||||||||||
| Denominator for basic earnings per limited partner unit—weighted average number of limited partner units | 52.7 | 45.5 | 37.5 | Denominator for basic earnings per limited partner unit—weighted average number of limited partner units | 63,277 | 52,743 | 45,546 | |||||||||||||||||
| Effect of dilutive securities: | Effect of dilutive securities: | |||||||||||||||||||||||
| Contingent equity issuance | 0.7 | — | — | Contingent equity issuance | — | 657 | — | |||||||||||||||||
Denominator for diluted earnings per limited partner unit—weighted average number of limited partner units | 53.4 | 45.5 | 37.5 | |||||||||||||||||||||
| Denominator for diluted earnings per limited partner unit—weighted average number of limited partner units | 63,277 | 53,400 | 45,546 | |||||||||||||||||||||
Basic net income per limited partner unit | Basic net income per limited partner unit | $ | 1.01 | $ | 1.34 | $ | 1.13 | Basic net income per limited partner unit | $ | 1.89 | $ | 1.01 | $ | 1.34 | ||||||||||
Diluted net income per limited partner unit | Diluted net income per limited partner unit | $ | 1.00 | $ | 1.34 | $ | 1.13 | Diluted net income per limited partner unit | $ | 1.89 | $ | 1.00 | $ | 1.34 | ||||||||||
Note 3—Acquisitions
The following acquisitions were accounted for using the purchase method of accounting and the purchase price was allocated in accordance with such method. In addition, we adopted SFAS No. 141, "Business Combinations" in 2001 and followed the provisions of that statement for all business combinations initiated after June 30, 2001.
Significant Acquisitions
Link Energy LLC
On April 1, 2004, we completed the acquisition of all of the North American crude oil and pipeline operations of Link Energy LLC ("Link") for approximately $332 million, including $268 million of cash (net of approximately $5.5 million subsequently returned to us from an indemnity escrow account) and approximately $64 million of net liabilities assumed and acquisition-related costs. The Link crude oil business consists of approximately 7,000 miles of active crude oil pipeline and gathering systems, over 10 million barrels of active crude oil storage capacity, a fleet of approximately 200 owned or leased trucks and approximately 2 million barrels of crude oil linefill and working inventory. The Link assets complement our assets in West Texas and along the Gulf Coast and allow us to expand our presence in the Rocky Mountain and Oklahoma/Kansas regions. The results of operations and assets and liabilities from this acquisition (the "Link acquisition") have been included in our consolidated financial statements and in both our pipeline operations and gathering, marketing, terminalling and storage operations segments since April 1, 2004.
The purchase price was allocated as follows and includes goodwill primarily related to Link's gathering and marketing business (in millions):
| Cash paid for acquisition(1) | $ | 268.0 | |||
Fair value of net liabilities assumed: | |||||
| Accounts receivable(2) | 409.4 | ||||
| Other current assets | 1.8 | ||||
| Accounts payable and accrued liabilities(2) | (459.6 | ) | |||
| Other current liabilities | (8.5 | ) | |||
| Other long-term liabilities | (7.4 | ) | |||
| Total net liabilities assumed | (64.3 | ) | |||
| Total purchase price | $ | 332.3 | |||
Purchase price allocation | |||||
| Property and equipment | $ | 260.2 | |||
| Inventory | 3.4 | ||||
| Linefill | 55.4 | ||||
| Inventory in third party assets | 8.1 | ||||
| Goodwill | 5.0 | ||||
| Other long term assets | 0.2 | ||||
| Total | $ | 332.3 | |||
The total purchase price includes (i) approximately $9.4 million in transaction costs, (ii) approximately $7.4 million related to a plan to involuntarily terminate and relocate employees in conjunction with the acquisition, and (iii) approximately $11.0 million related to costs to terminate a contract assumed in the acquisition. These activities are substantially complete and the majority of the related costs have been incurred as of December 31, 2004. In addition, we anticipate making capital expenditures of approximately $28.0 million ($18.0 million in 2005) to upgrade certain of the assets and comply with certain regulatory requirements.
The acquisition was initially funded with cash on hand, borrowings under our existing revolving credit facilities and under a new $200 million, 364-day credit facility. In connection with the acquisition, on April 15, 2004, we completed the private placement of 3,245,700 Class C common units to a group of institutional investors. During the third quarter of 2004, we completed a public offering of common units and the sale of an aggregate of $350 million of senior notes. A portion of the proceeds from these transactions was used to retire the $200 million, 364-day credit facility.
In connection with the Link purchase, both PAA and Link completed all necessary filings required under the Hart-Scott-Rodino Act, and the required 30-day waiting period expired on March 24, 2004 without any inquiry or request for additional information from the U.S. Department of Justice or the Federal Trade Commission (the "FTC"). On April 2, 2004, the Office of the Attorney General of Texas (the "Texas AG") delivered written notice to us that it was investigating the possibility that the acquisition of Link's assets might reduce competition in one or more markets within the petroleum products industry in the State of Texas. Such investigation was coordinated with the FTC, consistent with federal-state protocols for conducting joint merger investigations. We cooperated fully with the antitrust enforcement authorities, including the provision of information at the request of the Texas AG Antitrust Division. In late 2004, we were informed by the Texas AG Antitrust Division and subsequently by the FTC that they were closing their investigation and do not have any current intentions to pursue any additional course of action with respect to these assets.
Capline and Capwood Pipeline Systems
In March 2004, we completed the acquisition of all of Shell Pipeline Company LP's interests in two entities for approximately $158.0 million in cash (including a $15.8 million deposit paid in December 2003) and approximately $0.5 million of transaction and other costs. In December 2003, subsequent to the announcement of the acquisition and in anticipation of closing, we issued approximately 2.8 million common units for net proceeds of approximately $88.4 million, after paying approximately $4.1 million of transaction costs. The proceeds from this issuance were used to pay down our revolving credit facility. At closing, the cash portion of this acquisition was funded from cash on hand and borrowings under our revolving credit facility.
The principal assets of these entities are: (i) an approximate 22% undivided joint interest in the Capline Pipeline System, and (ii) an approximate 76% undivided joint interest in the Capwood Pipeline System. The Capline Pipeline System is a 633-mile, 40-inch mainline crude oil pipeline originating in St. James, Louisiana, and terminating in Patoka, Illinois. The Capwood Pipeline System is a 57-mile, 20-inch mainline crude oil pipeline originating in Patoka, Illinois, and terminating in Wood River, Illinois. The results of operations and assets from this acquisition (the "Capline acquisition") have been included in our consolidated financial statements and in our pipeline operations segment since
March 1, 2004. These pipelines provide one of the primary transportation routes for crude oil shipped into the Midwestern U.S., and delivered to several refineries and other pipelines.
The purchase price was allocated as follows (in millions):
| Crude oil pipelines and facilities | $ | 151.4 | |
| Crude oil storage and terminal facilities | 5.7 | ||
| Land | 1.3 | ||
| Office equipment and other | 0.1 | ||
| Total | $ | 158.5 | |
Pro Forma Data
The following unaudited pro forma data is presented to show pro forma revenues, income before cumulative effect of change in accounting principle, net income, basic and diluted income before cumulative effect of accounting change per limited partner unit and basic and diluted net income per limited partner unit for the Partnership as if the Capline and Link acquisitions had occurred as of the beginning of the periods reported:
| | Year Ended December 31, | |||||
|---|---|---|---|---|---|---|
| | 2004 | 2003 | ||||
| | (unaudited) (in millions, except per unit amounts) | |||||
| Revenues | $ | 21,023.4 | $ | 12,807.5 | ||
| Income before cumulative effect of change in accounting principle(1) | $ | 115.9 | $ | 110.4 | ||
| Net income(2) | $ | 112.8 | $ | 106.4 | ||
| Basic income before cumulative effect of change in accounting principle per limited partner unit(1) | $ | 1.77 | $ | 1.97 | ||
| Diluted income before cumulative effect of change in accounting principle per limited partner unit(1) | $ | 1.77 | $ | 1.94 | ||
| Basic net income per limited partner unit(2) | $ | 1.72 | $ | 1.90 | ||
| Diluted net income per limited partner unit(2) | $ | 1.72 | $ | 1.87 | ||
Shell West Texas Assets
On August 1, 2002, we acquired from Shell Pipeline Company LP and Equilon Enterprises LLC interests in approximately 2,000 miles of gathering and mainline crude oil pipelines and approximately 8.99.0 million barrels (net to our interest) of above-ground crude oil terminalling and storage assets in West Texas (the "Shell acquisition"). The results of operations and assets from this acquisition have been included in our consolidated financial statements and in our pipeline operations segment since that date. The primary assets included in the transaction were interests in the Basin Pipeline System,
the Permian Basin Gathering System and the Rancho Pipeline System. These assets complement our existing asset infrastructure in West Texas and represent a transportation link to Cushing, Oklahoma, where we are a provider of storage and terminalling services. The total purchase price of $324.4 million consisted of (i) $304.0 million in cash, which was borrowed under our revolving credit facility, (ii) approximately $9.1 million related to the settlement of pre-existing accounts receivable and inventory balances and (iii) approximately $11.3 million of estimated transaction and closing costs. The entire purchase price was allocated to property and equipment.
Other Acquisitions
CANPET Energy Group Inc.2004 Acquisitions
In July 2001,During 2004, in addition to the Link and Capline acquisitions, we acquired the assets of CANPET Energy Group Inc. ("CANPET"), a Calgary-based Canadiancompleted several other acquisitions for aggregate consideration totaling $58.7 million including transaction costs. These acquisitions include crude oil mainline and LPG marketing company, for approximately $24.6 million plus excess inventory at the closing date of approximately $25.0 million. A portion of the purchase price, payable in common units or cash at our option, was deferred subject to various performance standards being met. In addition, an amount will be paid equivalent to the distributions that would have been paid on the common units assuming (i) the deferred portion of thegathering pipelines and propane storage facilities. The aggregate purchase price was paid in common unitsallocated to property and (ii) they had been outstanding since the acquisition date. As of December 31, 2003, we determined that it was beyond a reasonable doubt that the performance standards were met and we recorded additional consideration of $24.3 million (see Note 7) resulting in aggregate consideration of $73.9 million. The deferred consideration was recorded as additional goodwill.equipment.
At the time of the acquisition, CANPET's activities consisted of gathering approximately 75,000 barrels per day of crude oil and marketing an average of approximately 26,000 barrels per day of natural gas liquids or LPG's. The principal assets acquired include a crude oil handling facility, a 130,000-barrel tank facility, LPG facilities, existing business relationships and operating inventory. The acquired assets are part of our strategy to establish a Canadian operation that complements our operations in the United States. Initial financing for the acquisition was provided through borrowings under our credit facility.
The purchase price, as adjusted post-closing, was allocated as follows (in millions):
| Inventory | $ | 28.1 | |
| Goodwill | 35.4 | ||
| Intangible assets (contracts) | 1.0 | ||
| Pipeline linefill | 4.3 | ||
| Crude oil gathering, terminalling and other assets | 5.1 | ||
| Total | $ | 73.9 | |
Murphy Oil Company Ltd. Midstream Operations
In May 2001, we closed the acquisition of substantially all of the Canadian crude oil pipeline, gathering, storage and terminalling assets of Murphy Oil Company Ltd. for approximately $158.4 million in cash after post-closing adjustments (the "Murphy acquisition"), including financing and transaction costs. Initial financing for the acquisition was provided through borrowings under our credit facilities. The purchase included $6.5 million for excess inventory in the pipeline systems. The principal assets acquired include approximately 560 miles of crude oil and condensate transmission mainlines (including dual lines on which condensate is shipped for blending purposes and blended crude is shipped in the opposite direction) and associated gathering and lateral lines, approximately 1.1 million barrels of crude oil storage and terminalling capacity located primarily in Kerrobert, Saskatchewan, approximately 254,000 barrels of pipeline linefill and tank inventories, and 121 trailers used primarily for crude oil transportation. The acquired assets are part of our strategy to establish a Canadian operation that complements our operations in the United States.
Murphy agreed to continue to transport production from fields previously delivering crude oil to these pipeline systems, under a long-term contract. At the time of the acquisition, the volume under the contract was approximately 11,000 barrels per day. Total volumes transported on the pipeline system in 2001 were approximately 223,000 barrels per day of light, medium and heavy crudes, as well as condensate.
The purchase price, as adjusted post-closing, was allocated as follows (in millions):
| Crude oil pipeline, gathering and terminal assets | $ | 148.0 | |
| Pipeline linefill | 7.6 | ||
| Net working capital items | 2.0 | ||
| Other property and equipment | 0.5 | ||
| Other assets, including debt issue costs | 0.3 | ||
| Total | $ | 158.4 | |
Other Acquisitions
2003 Acquisitions
During 2003, we completed ten acquisitions for aggregate consideration totaling approximately $159.5 million. The aggregate consideration includes cash paid, estimated transaction costs, assumed liabilities and estimated near-term capital costs. These acquisitions included mainline crude oil
pipelines, crude oil gathering lines, terminal and storage facilities, and an underground LPG storage facility. The aggregate purchase price was allocated as follows (in million):
| Crude oil pipelines and facilities | $ | 138.0 | |
| Crude oil and LPG storage facilities | 7.3 | ||
| Trucking equipment and other | 7.8 | ||
| Office property and equipment | 1.2 | ||
| Pipeline Linefill | 4.7 | ||
| Goodwill | 0.5 | ||
| $ | 159.5 | ||
2002 Acquisitions
During 2002, in addition to the Shell acquisition, we completed two acquisitions for aggregate consideration totaling approximately $15.9 million including transaction costs. These acquisitions include crude oil pipeline, gathering and marketing assets and a 22% equity interest in a pipeline company. With the exception of $1.3 million that was allocated to goodwill, the aggregate purchase price was allocated to property and equipment.
2001 Acquisition
In December 2001, in addition to the CANPET and Murphy acquisitions, we acquired the Wapella Pipeline System from private investors for approximately $12.0 million, including transaction costs. The entire purchase price was allocated to property and equipment. The system includes a crude oil pipeline and approximately 21,500 barrels of crude oil storage capacity located along the system as well as a truck terminal.
Note 4—Asset Dispositions
Shutdown and Sale of Rancho Pipeline System
We acquired an interest in the Rancho Pipeline System from Shell in conjunction with the Shell acquisition.August 2002. The Rancho Pipeline System Agreement dated November 1, 1951, pursuant to which the system was constructed and
operated, terminated in March 2003. Upon termination, the agreement required the owners to take the pipeline system, in which we owned an approximate 50% interest, out of service. Accordingly, we notified our shippers and did not accept nominations for movements after February 28, 2003. This shutdown was contemplated at the time of the acquisition and was accounted for under purchase accounting in accordance with SFAS No. 141 "Business Combinations." The pipeline was shut down on March 1, 2003 and a purge of the crude oil linefill was completed in April 2003. In June 2003, we completed transactions whereby we transferred all of our ownership interest in approximately 240241 miles of the total 458 miles of the pipeline in exchange for $4.0 million and approximately 500,000 barrels of crude oil tankage in West Texas. TheIn August 2004, we sold our interest in the remaining portion will either be sold or salvaged. No gain or loss has been recorded on the shutdown of the Rancho System or these transactions.system for approximately $0.9 million, including the assumption of all liabilities typically associated with pipelines of this type. We recognized a gain of approximately $0.6 million on this transaction.
Other Dispositions
During 2004, 2003 and 2002, we sold various other property and equipment for proceeds totaling approximately $3.0 million, $8.5 million and $1.4 million, respectively. A gainGains of approximately $0.6 million waswere recognized in both 2004 (including the gain on the sale of the Rancho Pipeline System) and 2003, respectively, and no gain or loss was recognized in 2002. In December 2001, we sold excess communications equipment and recognized a gain of $1.0 million.
Note 5—Industry Credit Markets
Throughout the latter part of 2001 and all of 2002, there have been significant disruptions and extreme volatility in the financial markets and credit markets. Because of the credit intensive nature of the energy industry and extreme financial distress at several large, diversified energy companies, the energy industry has been especially impacted by these developments. Accordingly, we are exposed to an increased level of direct and indirect counterparty credit and performance risk.
The majority of our credit extensions and therefore our accounts receivable relate to our gathering and marketing activities that can generally be described as high volume and low margin activities. In our credit approval process, we must determine the amount, if any, of the line of credit to be extended to any given customer and the form and amount of financial performance assurances we require. Such financial assurances are commonly provided to us in the form of standby letters of credit, advance cash payments or "parental" guarantees. At December 31, 2003, we had received approximately $44.0 million of advance cash payments and prepayments from third parties to mitigate credit risk.
Note 6—Debt
Short-term debtDebt consists of the following (in millions):following:
| | December 31, | |||||
|---|---|---|---|---|---|---|
| | 2003 | 2002 | ||||
| Senior secured hedged inventory borrowing facility bearing interest at a rate of 1.9% at December 31, 2003 | $ | 100.5 | $ | — | ||
| Senior unsecured $425 million domestic revolving credit facility—working capital borrowings, bearing interest at a rate of 4.0% at December 31, 2003(1) | 25.3 | — | ||||
| Senior secured letter of credit and borrowing facility bearing interest at a rate of 3.4% at December 31, 2002 | — | 97.7 | ||||
| Other | 1.5 | 1.5 | ||||
| Total short-term debt and current maturities of long-term debt | $ | 127.3 | $ | 99.2 | ||
| | December 31, | ||||||
|---|---|---|---|---|---|---|---|
| | 2004 | 2003 | |||||
| | (in millions) | ||||||
| Short-term debt: | |||||||
| Senior secured hedged inventory borrowing facility bearing interest at a rate of 3.0% and 1.9% at December 31, 2004 and December 31, 2003, respectively | $ | 80.4 | $ | 100.5 | |||
| Working capital borrowings, bearing interest at a rate of 3.7% and 4.0% at December 31, 2004 and December 31, 2003, respectively(1) | 88.2 | 25.3 | |||||
| Other | 6.9 | 1.5 | |||||
| Total short-term debt | 175.5 | 127.3 | |||||
Long-term debt: | |||||||
| Senior unsecured revolving credit facility, bearing interest at 3.5% at December 31, 2004(1) | $ | 143.6 | $ | — | |||
| Senior unsecured $170 million Canadian revolving credit facility, bearing interest at a rate of 2.2% at December 31, 2003 | — | 70.0 | |||||
| 4.75% senior notes due August 2009, net of unamortized discount of $0.7 million at December 31, 2004 | 174.3 | — | |||||
| 7.75% senior notes due October 2012, net of unamortized discount of $0.3 million and $0.3 million at December 31, 2004 and December 31, 2003, respectively | 199.7 | 199.7 | |||||
| 5.63% senior notes due December 2013, net of unamortized discount of $0.6 million and $0.7 million at December 31, 2004 and December 31, 2003, respectively | 249.4 | 249.3 | |||||
| 5.88% senior notes due August 2016, net of unamortized discount of $1.1 million at December 31, 2004 | 173.9 | — | |||||
| Other | 8.1 | — | |||||
| Total long-term debt(1) | 949.0 | 519.0 | |||||
| Total debt | $ | 1,124.5 | $ | 646.3 | |||
Long-term debt consists of the following (in millions):
| | December 31, | |||||
|---|---|---|---|---|---|---|
| | 2003 | 2002 | ||||
| 5.63% senior notes due December 2013, net of unamortized discount of $0.7 million | $ | 249.3 | $ | — | ||
7.75% senior notes due October 2012, net of unamortized discount of $0.3 million and $0.4 million at December 31, 2003 and 2002, respectively | 199.7 | 199.6 | ||||
Senior unsecured $170 million Canadian revolving credit facility, bearing interest at a rate of 2.17% at December 31, 2003 | 70.0 | — | ||||
Senior secured domestic revolving credit facility, bearing interest at a rate of 4.8% at December 31, 2002 | — | 10.4 | ||||
Senior secured term B loan, bearing interest at a rate of 3.9% at December 31, 2002 | — | 198.0 | ||||
Senior secured term loan, bearing interest at a rate of 3.9% at December 31, 2002 | — | 99.0 | ||||
$30 million Canadian senior secured revolving credit facility, bearing interest at a rate of 5.0% at December 31, 2002 | — | 2.7 | ||||
Total long-term debt(1),(2) | $ | 519.0 | $ | 509.7 | ||
Credit Facilities
DuringIn November 2003,2004, we refinanced our bank credit facilities withentered into a new $750 million, five-year senior unsecured credit facilities totaling $750 millionfacility, which contains a sub-facility for Canadian borrowings of up to $300 million. The new credit facility extends our maturities, lowers our cost of credit and a $200 million uncommitted facility for the purpose of financing hedged crude oil. The $750provides an additional $125 million of new facilities consist of:liquidity over our previous facilities. This facility can be expanded to $1 billion. At December 31, 2004, approximately $231.8 million was outstanding under this facility (including $88.2 million classified as short-term).
Also in the fourth quarter of 2004, we amended and renewed our senior secured hedged inventory facility; increasing the facility to $425 million, U.S. revolving credit facility;
All of the facilities with the exception ofability to further increase the $200 million hedged inventory facility are unsecured. The $200 million hedged inventoryin the future by an incremental $75 million. This facility is an uncommitted working capital facility, which will beis used to finance the purchase of hedged crude oil inventory for storage when market conditions warrant. Borrowings under the hedged inventory facility will be securedare collateralized by the inventory purchased under the facility and the associated accounts receivable, and will be repaid fromwith the proceeds from the sale of such inventory. This facility expires in November 2005.
Senior Notes
During August 2004, we completed the sale of $175 million of 4.75% Senior Notes due 2009 and $175 million of 5.88% Senior Notes due 2016. The 4.75% notes were sold at 99.551% of face value and the 5.88% notes were sold at 99.345% of face value. Interest payments are due on February 15 and August 15 of each year.
During December 2003, we completed the sale of $250 million of 5.625% senior notes due in December 2013. The notes were issued by Plains All American Pipeline, L.P. and a 100% owned consolidated finance subsidiary (neither of which have independent assets or operations) at a discount of $0.7 million, resulting in an effective interest rate of 5.66%. Interest payments are due on June 15
and December 15 of each year. The notes are fully and unconditionally guaranteed, jointly and severally, by all of our existing 100% owned subsidiaries, except for subsidiaries which are minor.
During September 2002, we completed the sale of $200 million of 7.75% senior notes due in October 2012. The notes were issued by Plains All American Pipeline, L.P. and a 100% owned consolidated finance subsidiary (neither of which have independent assets or operations) at a discount of $0.4 million, resulting in an effective interest rate of 7.78%. Interest payments are due on April 15 and October 15 of each year. The
In each instance, the notes were co-issued by Plains All American Pipeline, L.P. and a 100% owned consolidated finance subsidiary (neither of which have independent assets or operations) and are fully and unconditionally guaranteed, jointly and severally, by all of our existing 100% owned subsidiaries, except for subsidiaries which are minor.
Covenants and Compliance
Our credit facilities, the indenture governing the 5.625% senior notesagreements and the indentureindentures governing the 7.75% senior notes contain cross default provisions. Our credit facilitiesagreements prohibit distributions on, or purchases or redemptions of, units if any default or event of default is continuing. In addition, the agreements contain various covenants limiting our ability to, among other things:
Our credit facilities treatfacility treats a change of control as an event of default and also requirerequires us to maintain:
For covenant compliance purposes, letters of credit and borrowings to fund hedged inventory and margin requirements are excluded when calculating the debt coverage ratio.
A default under our credit facilitiesfacility would permit the lenders to accelerate the maturity of the outstanding debt. As long as we are in compliance with our credit agreements, they do not restrict our ability to make distributions of "available cash" as defined in our partnership agreement.available cash is not restricted. We are currently in compliance with the covenants contained in our credit facilitiesagreements and indentures.
Letters of Credit
As is customary in our industry, and in connection with our crude oil marketing, we provide certain suppliers and transporters with irrevocable standby letters of credit to secure our obligation for the purchase of crude oil. OurThese letters of credit are issued under our credit facility, and our liabilities with respect to these purchase obligations are recorded in accounts payable on our balance sheet in the month the crude oil is purchased. Generally, these letters of credit are issued for up to seventy-day periods and are terminated upon completion of each transaction. At December 31, 20032004 and 2002,2003, we had outstanding letters of credit of approximately $57.9$98.0 million and $52.5$57.9 million, respectively. In addition to changes in the level of activity and other factors, the amount of letters of credit outstanding varies based on NYMEX crude oil prices, which were $32.52$43.34 per barrel and $29.45$32.52 per barrel at December 31, 2004 and 2003, and 2002, respectively.
Maturities
The weighted average life of our long-term debt outstanding at December 31, 2003,2004, was approximately 98 years and all balances mature in 2009 or later.the aggregate maturities for the for the next five years are as follows:
| Calendar Year | Payment | |||
|---|---|---|---|---|
| 2005 | $ | — | ||
| 2006 | 3.7 | |||
| 2007 | 3.6 | |||
| 2008 | 0.8 | |||
| 2009 | 318.6 | |||
| Thereafter | 625.0 | |||
| Total(1) | 951.7 | |||
Note 7—6—Partners' Capital and Distributions
Units Outstanding
Partners' capital at December 31, 20032004 consists of (1) 50,809,74667,293,108 common units, including 1,307,190 Class B common units and 3,245,700 Class C common units, representing a 85.4%98% effective aggregate ownership interest in the Partnership and its subsidiaries, (after giving affect to the general partner interest), (2) 7,522,214 subordinated units representing a 12.6% effective aggregate ownership interest in the Partnership and its subsidiaries (after giving affect to the general partner interest) and (3) a 2% general partner interest.
Class B and Class C Common Units
The Class B common units are initially and Class C common units werepari passu with common units with respect to distributions, and are convertible intoquarterly distributions. In accordance with a common units upon approval ofunitholder vote at a majority of the common unitholders. The Class B unitholders may request that we call aspecial meeting of common unitholders to consider approval of the conversion of Class B units into common units. If the approval of a conversion by the common unitholders is not obtained within 120 days of a request,on January 20, 2005, each Class B common unitholder will be entitled to receive distributions, on a per unit basis, equal to 110%and Class C common unit became convertible into one common unit upon request of the amount of distributions paid on a common unit, with such distribution right increasing to 115% if such approval is not secured within 90 days after the endholder. In February 2005, all of the 120-day period. Except for the vote to approve the conversion, Class B and Class C common units have the same voting rights as theconverted into common units.
Subordinated Units and Conversion
Pursuant to the terms of our Partnership Agreement and having satisfied the financial tests contained therein, in November 2003, 25% of the subordinated units converted to common units on a one-for-one basis. In February 2004, all of the remaining subordinated units converted to common units on a one-for-one basis.
The subordinated units have a debit balance in Partners' Capital of approximately $39.9 million at December 31, 2003. The debit balance is the result of several different factors including: (i) a low initial capital balance in connection with the formation of the partnershipPartnership as a result of a low carry-over book basis in the assets contributed to the Partnership at the date of formation, (ii) a significant net loss in 1999 and (iii) distributions to unitholders that have exceeded net income allocated to unitholders each period. Additionally, the capital balances of the common unitholders and the General Partner have increased periodically as additional units have been sold and as the General Partner has made additional capital contributions associated with those offerings. The subordinated unitholders are not required to make any additional contributions associated with those offerings of common units. No additional Subordinated Unitssubordinated units were issued after the initial issuance.
Pursuant to the terms of our Partnership Agreement and having satisfied the financial tests contained therein, in November 2003, 25% of the Subordinated Units converted to Common Units on a one-for-one basis. In February 2004, all of the remaining Subordinated Units converted to Common Units on a one-for-one basis.
General Partner Incentive Distributions
Our general partner is entitled to receive incentive distributions if the amount we distribute with respect to any quarter exceeds levels specified in our partnership agreement. Under the quarterly incentive distribution provisions, generally the general partner is entitled, without duplication, to 15% of amounts we distribute in excess of $0.450 per unit, referred to as our minimum quarterly distributions ("MQD"), 25% of the amounts we distribute in excess of $0.495 per unit and 50% of amounts we distribute in excess of $0.675 per unit (referred to as
"incentive "incentive distributions"). Cash distributions on our outstanding units and the portion of the distributions representing an excess over the MQD were as follows:
| | Year | Year | ||||||||||||||||||||||||||||||||||
|---|---|---|---|---|---|---|---|---|---|---|---|---|---|---|---|---|---|---|---|---|---|---|---|---|---|---|---|---|---|---|---|---|---|---|---|---|
| | 2003 | 2002 | 2001 | 2004 | 2003 | 2002 | ||||||||||||||||||||||||||||||
| | Distribution | Excess over MQD | Distribution | Excess over MQD | Distribution | Excess over MQD | Distribution(1) | Excess over MQD | Distribution(1) | Excess over MQD | Distribution(1) | Excess over MQD | ||||||||||||||||||||||||
| First Quarter | $ | 0.5500 | $ | 0.1000 | $ | 0.5250 | $ | 0.0750 | $ | 0.4750 | $ | 0.0250 | $ | 0.5625 | $ | 0.1125 | $ | 0.5375 | $ | 0.0875 | $ | 0.5125 | $ | 0.0625 | ||||||||||||
| Second Quarter | $ | 0.5500 | $ | 0.1000 | $ | 0.5375 | $ | 0.0875 | $ | 0.5000 | $ | 0.0500 | $ | 0.5625 | $ | 0.1125 | $ | 0.5500 | $ | 0.1000 | $ | 0.5250 | $ | 0.0750 | ||||||||||||
| Third Quarter | $ | 0.5500 | $ | 0.1000 | $ | 0.5375 | $ | 0.0875 | $ | 0.5125 | $ | 0.0625 | $ | 0.5775 | $ | 0.1275 | $ | 0.5500 | $ | 0.1000 | $ | 0.5375 | $ | 0.0875 | ||||||||||||
| Fourth Quarter | $ | 0.5625 | $ | 0.1125 | $ | 0.5375 | $ | 0.0875 | $ | 0.5125 | $ | 0.0625 | $ | 0.6000 | $ | 0.1500 | $ | 0.5500 | $ | 0.1000 | $ | 0.5375 | $ | 0.0875 | ||||||||||||
Distributions
We will distribute 100% of our available cash within 45 days after the end of each quarter to unitholders of record and to our general partner. Available cash is generally defined as all of our cash and cash equivalents on hand at the end of each quarter less reserves established by our general partner for future requirements.
During 2003, we paid Total cash distributions of approximately $121.8 million ($2.19 on a per unit basis), with approximately $92.7 million paid to our common unitholders, $21.9 million paid to our subordinated unitholders and $2.3 million and $4.9 million paid to our general partner for its general partner and incentive distribution interests, respectively.made were as follows:
During 2002, we paid distributions of approximately $99.8 million ($2.11 on a per unit basis), with approximately $73.6 million paid to our common unitholders, $21.1 million paid to our subordinated unitholders and $2.0 million and $3.1 million paid to our general partner for its general partner and incentive distribution interests, respectively.
During 2001, we paid distributions of approximately $75.9 million ($1.95 on a per unit basis), with approximately $53.8 million paid to our common unitholders, $19.5 million paid to our subordinated unitholders and $1.5 million and $1.1 million paid to our general partner for its general partner and incentive distribution interests, respectively.
| | | | GP | | | |||||||||||||
|---|---|---|---|---|---|---|---|---|---|---|---|---|---|---|---|---|---|---|
| Year | Common Units | Subordinated Units | | Distribution per unit | ||||||||||||||
| 2% | Incentive | Total | ||||||||||||||||
| | (in millions, except per unit amounts) | |||||||||||||||||
| 2004 | $ | 142.9 | $ | 4.2 | $ | 3.0 | $ | 8.3 | $ | 158.4 | $ | 2.30 | ||||||
| 2003 | $ | 92.7 | $ | 21.9 | $ | 2.3 | $ | 4.9 | $ | 121.8 | $ | 2.19 | ||||||
| 2002 | $ | 73.6 | $ | 21.1 | $ | 2.0 | $ | 3.1 | $ | 99.8 | $ | 2.11 | ||||||
On January 22, 2004,25, 2005, we declared a cash distribution of $0.5625$0.6125 per unit on our outstanding common units, Class B common units and subordinatedClass C common units. The distribution was paid on February 13, 2004,14, 2005, to unitholders of record on February 3, 2004,4, 2005, for the period October 1, 2003,2004, through December 31, 2003.2004. The total distribution paid was approximately $35.2$45.0 million, with approximately $28.7$41.2 million paid to our common unitholders $4.2 million paid to our subordinated unitholders and $0.7$0.8 million and $1.6$3.0 million paid to our general partner for its general partner and incentive distribution interests, respectively.
Equity Offerings
InDuring the three years ended December 2003,31, 2004, we completed athe following public offeringequity offerings of 2,840,800our common units:
| Period | Units | Gross Unit Price | Proceeds from Sale | GP Contribution | Costs | Net Proceeds | |||||||||||
|---|---|---|---|---|---|---|---|---|---|---|---|---|---|---|---|---|---|
| | (in millions, except per unit amounts) | ||||||||||||||||
| July/August 2004 | 4,968,000 | $ | 33.25 | $ | 165.2 | $ | 3.4 | $ | 7.7 | $ | 160.9 | ||||||
| December 2003 | 2,840,800 | $ | 31.94 | $ | 90.7 | $ | 1.8 | $ | 4.1 | $ | 88.4 | ||||||
| September 2003 | 3,250,000 | $ | 30.91 | $ | 100.5 | $ | 2.1 | $ | 4.6 | $ | 98.0 | ||||||
| March 2003 | 2,645,000 | $ | 24.80 | $ | 65.6 | $ | 1.3 | $ | 3.0 | $ | 63.9 | ||||||
| August 2002 | 6,325,000 | $ | 23.50 | $ | 148.6 | $ | 3.0 | $ | 6.6 | $ | 145.0 | ||||||
Private Placement of Class C Common Units
In connection with the Link acquisition, on April 15, 2004 we issued 3,245,700 Class C common units for $31.94$30.81 per unit. The offering resultedunit in gross proceedsa private placement to a group of approximately $90.7 million from the saleinstitutional investors consisting of the unitsaffiliates of Kayne Anderson Capital Advisors, Vulcan Capital and approximately $1.8 million fromTortoise Capital Advisors. Affiliates of both Kayne Anderson Capital Advisors and Vulcan Capital own interests in our general partner's proportionate capital contribution.partner. Total costs associated with the offering, including underwriter fees and other expenses, were approximately $4.1 million. Net proceeds of approximately $88.4 million were used to reduce outstanding borrowings under our revolving credit facility.
In September 2003, we completed a public offering of 3,250,000 common units for $30.91 per unit. The offering resulted in gross proceeds of approximately $100.5 million from the sale of the units and approximately $2.1 million from our general partner's proportionate capital contribution. Total costs associated with the offering, including underwriter fees and other expenses, were approximately
$4.5 million. Net proceeds of approximately $98.0 million were used to reduce outstanding borrowings under the domestic revolving credit facility and reduce the principal balance on our Senior secured term B loan.
In March 2003, we completed a public offering of 2,645,000 common units for $24.80 per unit. The offering resulted in gross proceeds of approximately $65.6 million from the sale of the units and approximately $1.3 million from our general partner's proportionate capital contribution. Total costs associated with the offering, including underwriter fees and other expenses, were approximately $3.0 million. Net proceeds of approximately $63.9 million were used to reduce outstanding borrowings under the domestic revolving credit facility.
In August 2002, we completed a public offering of 6,325,000 common units for $23.50 per unit. The offering resulted in cash proceeds of approximately $148.6 million from the sale of the units and approximately $3.0 million from our general partner's proportionate capital contribution. Total costs associated with the offering, including underwriter fees and other expenses, were approximately $6.6 million. Net proceeds of approximately $145.0 million were used to reduce outstanding borrowings under the domestic revolving credit facility.
In May 2001, we completed a public offering of 3,966,700 common units. Total net cash proceeds from the offering,transaction, after deducting transaction costs and including our formerthe general partner's proportionate contribution, were approximately $100.7 million. In addition, in October 2001, we completed a public offering of 4,900,000 common units. Net cash proceeds from the offering, including our general partner's proportionate contribution, were approximately $126.0 million. The net proceeds$101 million, and were used to repay borrowingsreduce the balance outstanding under our revolving credit facility,facilities. The Class C common units were unlisted securities that arepari passu in voting and distribution rights with the Partnership's publicly traded common units. The Class C common units were similar in most respects to the Partnership's Class B common units. Both classes became convertible on a portionone-for-one basis into common units upon approval by the holders of which was used to financea majority of the common units at a special meeting of our Canadian acquisitions.unitholders held
on January 20, 2005. All of the Class B common units and Class C common units converted in February 2005.
Contingent Equity IssuancePayment of Deferred Acquisition Price
In connection with the CANPET acquisition in July 2001, a portion$26.5 million Canadian of the purchase price, payable in common units or cash at our option, was deferred subject to various performance objectives being met. These objectives have beenwere met as of December 31, 2003 and the deferred amount is payablean increase to goodwill for this liability was recorded as of that date. The liability was satisfied on April 30, 2004.2004 with the issuance of approximately 385,000 common units and the payment of $6.5 million in cash. The number of common units issued in satisfaction of the deferred payment will dependwas based upon $34.02 per share, the average trading price of our common units for athe ten-day trading period prior to the payment date, and thea Canadian anddollar to U.S. dollar exchange rate onof 1.35 to 1, the average noon-day exchange rate for the ten-day trading period prior to the payment date. In addition, an amount will beincremental $3.7 million in cash was paid equivalent tofor the distributions that would have been paid on the common units had they been outstanding since the acquisition was consummated. At our option, the deferred payment may be paid in cash rather than the issuance of units. Assuming the entire obligation is satisfied with common units, based on the foreign exchange rate in effect at December 31, 2003, (1.30 to 1 Canadian dollar to U.S. dollar exchange rate) and an estimated $33.35 per unit price, approximately 613,000 units would be issued and approximately $3.9 million would be paid related to distributions. We currently anticipate that one-thirdeffective date of the contingent purchase price and all of the amount related to past distributions will be paid in cash and the remainder will be settled with approximately 409,000 common units.acquisition.
Note 8—7—Derivatives and Financial Instruments
We utilize various derivative instruments to (i) manage our exposure to commodity price risk, (ii) engage in a controlled trading program, (iii) manage our exposure to interest rate risk and (iv) manage our exposure to currency exchange rate risk. Our risk management policies and procedures are designed to monitor interest rates, currency exchange rates, NYMEX and over-the-counter positions, and physical volumes, grades, locations and delivery schedules to ensure that our hedging activities address our market risks. We formally document all relationships between hedging instruments and hedged items, as well as our risk management objectives and strategy for undertaking the hedge. We calculate hedge effectiveness on a quarterly basis. This process includes specific identification of the hedging instrument and the hedged transaction, the nature of the risk being hedged and how the
hedging instrument's effectiveness will be assessed. Both at the inception of the hedge and on an ongoing basis, we assess whether the derivatives that are used in hedging transactions are highly effective in offsetting changes in cash flows of hedged items.
Summary of Financial Impact
The following is a summary of the financial impact of the derivative instruments and hedging activities discussed below. AtThe December 31, 2003, the2004, balance sheet includes assets of $27.9$63.9 million ($22.055.2 million current), liabilities of $28.1$29.5 million ($17.118.9 million current) and related unrealized lossesnet gains deferred to OCIOther Comprehensive Income ("OCI") of $1.6 million related to open$25.9 million. Total derivative positions. Revenuesactivities for the year ended December 31, 2003 include2004, generated a noncash gain of $0.4 million ($1.4 million noncash$35.1 million. This gain netincludes (i) derivatives that do not qualify for hedge accounting (a gain of approximately $0.9 million), (ii) the reversalportion of the prior period fair value adjustment related to contractscash flow hedges that is not highly effective in offsetting changes in cash flows of hedged items (a gain of approximately $0.1 million), and (iii) gains and losses recognized in earnings for all hedges settled during the current year)period (a net gain of approximately $34.1 million). Our hedge-related assets and liabilitiesThe majority of these gains are included in other current and non-current assets and liabilities in the consolidated balance sheet. In addition, during the fourth quarter of 2003 we terminated and cash settled three interest-raterelated to our commodity price risk hedging instruments for approximately $6.2 million. The net deferred loss related to these instruments was deferred in OCI and is being amortized into interest expense over the original terms of the terminated instruments (approximately fifty percent over three years and the remaining fifty percent over ten years).activities that are offset by physical transactions, as discussed below.
As of December 31, 2003,2004, the total amount of deferred net lossesgains recorded in OCI are expected to be reclassified to future earnings, contemporaneously with the related physical purchase or delivery of the underlying commodity or payments of interest. During the periodsyear ended December 31, 2003 and 2002,2004, no
amounts were reclassified to earnings from OCI in connection with forecasted transactions that were no longer considered probable of occurring. Based onOf the aggregate amounts$25.9 million net gain deferred in OCI at December 31, 2003,2004, a net lossgain of $0.4$34.7 million will be reclassified tointo earnings in the next twelve months and the remainder by 2013.remaining net loss at various intervals (ending in 2016 for amounts related to our terminated interest rate swaps and 2009 for amounts related to our commodity price risk hedging). Since a portion of these amounts areis based on market prices at the current period end, actual amounts to be reclassified will differ and could vary materially as a result of changes in market conditions.
The following sections discuss our risk management activities in the indicated categories.
Commodity Price Risk Hedging
We hedge our exposure to price fluctuations with respect to crude oil and LPG in storage, and expected purchases, sales and transportation of these commodities. The derivative instruments utilizedwe use consist primarily of futures and option contracts traded on the NYMEX and over-the-counter transactions, including crude oil swap and option contracts entered into with financial institutions and other energy companies (see Note 5 for a discussion of the mitigation of credit risk).companies. In accordance with SFAS No. 133 "Accounting for Derivative Instruments and Hedging Activities," as amended, these derivative instruments are recordedrecognized in the balance sheet as assets or liabilitiesearnings at their fair values. The majority of our commodity price risk derivativethe instruments that qualify for hedge accounting asare cash flow hedges. Therefore, the corresponding changes in fair value for the effective portion of the hedgehedges are deferred ininto OCI and recognized in revenues or crude oil and LPG purchases and related costs in the periods during which the underlying physical transactions occur. At December 31, 2003 there was an unrealized gain of $2.1 million deferred in OCI related to our commodity price risk activities. All of these deferred positions mature by December 2004. An unrealized gain of $1.2 million related to these activities was deferred in OCI at December 31, 2002. For each of the three years ended December 31, 2003, income of $0.5 million, $0.3 million and $0.4 million (excluding the impact of the adoption of SFAS 133), respectively, was included in revenues due to changes in the fair value of derivatives that do not qualify for hedge accounting and the portion of cash flow hedges that are not highly effective. We have determined that substantially all of our physical purchase and sale agreements qualify for the normal purchase and sale exclusion and thus are not subject to SFAS 133. Physical transactions that are derivatives and are ineligible, or become ineligible, for the normal purchase and sale treatment (e.g. due to changes in settlement provisions) are recorded in the balance sheet as assets or liabilities at their fair value, with the changes in fair value recorded net in revenues.
WhileAlthough we seek to maintain a position that is substantially balanced within our crude oil lease purchase and LPG activities, we may experience net unbalanced positions for short periods of time as a result of production, transportation and delivery variances as well as logistical issues associated with inclement weather conditions. In connection with managing these positions and maintaining a constant presence in the marketplace, both necessary for our core business, we engage in a controlled trading program for up to an aggregate of 500,000 barrels of crude oil and an aggregate of 250,000 barrels of LPG.oil. These activities are monitored independently by our risk management function and must take place within predefined limits and authorizations. In accordance with SFAS 133, these derivative instruments are recorded in the balance sheet as assets or liabilities at their fair value, with the changes in fair value recorded net in revenues. There were no open positions under this program at December 31, 2003 and 2002. The realized earnings impact related to these activities for the years ended December 31, 2003, 2002 and 2001, was a loss of $0.1 million, income of $0.1 million and a loss of $0.9 million, respectively.
Interest Rate Risk Hedging
We also utilize various products, such as interest rate swaps, collars and treasury locks to hedge interest obligations on specific debt issuances, including anticipated debt issuances. All of these instruments are placed with large creditworthy financial institutions.
At December 31, 2003, there was one2004, we have no open interest rate swap outstanding with an aggregate notional principal amount of $50 million. The interest rate swap is based on LIBOR rates and provides for a LIBOR rate of 4.3% expiring in March 2004. Interest on the underlying debt being hedged is based on LIBOR plus a margin.
The instruments outstanding at December 31, 2002, consisted of interest rate swaps and a treasury lock with an aggregate notional principal amount of $150 million. The interest rate swaps were based on LIBOR rates and provided for a LIBOR rate of 5.1% for a $50.0hedging instruments. However, there are approximately $6.1 million notional principal amount expiring October 2006 and a LIBOR rate of 4.3% for a $50.0 million notional principal amount expiring March 2004. Interest on the underlying debt that was hedged was based on LIBOR plus a margin. During 2002, we entered into a treasury lock in anticipation of the issuance of our 7.75% senior notes due October 2012 and potential subsequent add-on thereto. A treasury lock is a financial derivative instrument that enables the company to lock in the U.S. Treasury Note rate. The treasury lock had a notional principal amount of $50.0 million and an effective interest rate of 4.60%. The treasury lock matured in January 2003, was extended to March 2003 with an effective interest rate of 4.68%, was converted to a forward starting swap and was subsequently unwound in conjunction with the issuance of our 5.625% Senior Notes.
The instruments outstanding at December 31, 2003 and 2002 qualify for hedge accounting as cash flow hedges in accordance with SFAS 133. The effective portion of changes in fair values of these hedges is recorded in OCI until the related hedged item impacts earnings. At December 31, 2003, and 2002, there was a $6.5 million unrealized loss and a $9.6 million unrealized loss, respectively, deferred in OCI related to our interest rate risk activities. As discussed above, approximately $6.1 million of the loss deferred in OCI at December 31, 2003,that relates to cash flow hedge instruments that were terminated and cash settled during 2003. During 2003 and 2002, there were no amounts recognized in earnings($1.4 million related to hedge ineffectiveness.an instrument settled in 2004 and $4.7 million related to instruments settled in 2003) that relate to debt agreements refinanced in 2004 and 2003, respectively. The deferred loss related to these instruments is being amortized into interest expense over the original terms of the terminated instruments (approximately $2.9 million over the next two years and the remaining $3.2 million over approximately ten years). Approximately $1.5 million related to the terminated instruments were reclassified into interest expense during 2004. In addition, earnings for 2004 include a loss of approximately $0.7 million that was reclassified out of OCI related to an instrument that matured in March 2004.
Currency Exchange Rate Risk Hedging
Because a significant portion of our Canadian business is conducted in Canadian dollars (CAD),and, at times, a portion of our debt is denominated in Canadian dollars, we use certain financial instruments to minimize the risks of unfavorable changes in exchange rates. These instruments include forward exchange contracts forward extra option contracts and cross
currency swaps. Additionally, at times, a portion of our debt is denominatedNeither the forward exchange contracts nor the cross currency swaps qualify for hedge accounting in Canadian dollars. At December 31, 2003 we did not have any Canadian dollar debt and at December 31, 2002, $2.7 million of our long-term debt was denominated in Canadian dollars ($4.3 million CAD based on a Canadian dollar to U.S. dollar exchange rate of 1.58 to 1). All of these financial instruments are placedaccordance with large creditworthy financial institutions.SFAS 133.
At December 31, 2003,2004, we had forward exchange contracts that allow us to exchange approximately $2.0 million Canadian dollars for U.S. dollars, quarterly, at least $1.5 million U.S. quarterly during 2004 and approximately $1.0 million Canadian for at least $0.7 million U.S. quarterly during 2005 (based on a Canadian dollar to U.S. dollarset exchange rate of approximately 1.33 to 1 and 1.34 to 1, respectively).rates as detailed below:
| | Canadian Dollars | US Dollars | Rate | |||
|---|---|---|---|---|---|---|
| | ($ in millions) | | ||||
| 2005 | $3.0 | $2.3 | 1.33 to 1 | |||
| 2006 | $2.0 | $1.5 | 1.32 to 1 | |||
In addition, at December 31, 2003,2004, we also had cross currency swap contracts for an aggregate notional principal amount of $23.0$21.0 million, effectively converting this amount of our U.S. dollar denominated debt to $35.6$32.5 million of Canadian dollar debt (based on a Canadian dollar to U.S. dollar exchange rate of 1.55 to 1). The notional principal amount reduceswill reduce by $2.0 million U.S. on May 2004 andin May 2005 and has a final maturity in May 2006 ($19.0of $19.0 million U.S.).
At December 31, 2002, we had forward exchange contracts and forward extra option contracts that allow us to exchange $3.02004, $9.9 million of our long-term debt was denominated in Canadian dollars ($11.9 million Canadian for at least $1.9 million U.S. quarterly during 2003 (basedbased on a Canadian dollar to U.S. dollar exchange rate of 1.541.20 to 1). At December 31, 2002,All of these financial instruments are placed with what we also had cross currency swap contracts for an aggregate notional principal amount of $24.8 million, effectively converting this amount of our U.S. dollar denominated debtbelieve to $38.3 million of Canadian dollar debt (based on a Canadian dollar to U.S. dollar exchange rate of 1.55 to 1).
The forward exchange contracts and forward extra option contracts qualify for hedge accounting as cash flow hedges and the cross currency swaps qualify for hedge accounting as fair value hedges, both in accordance with SFAS 133. Such derivative activity resulted in an unrealized loss of $0.3 million and an unrealized gain of $0.2 million deferred in OCI related to our currency exchange rate cash flow hedges at December 31, 2003 and 2002, respectively. The earnings impact related to our currency exchange rate fair value hedges was a loss of $0.1 million for the year ended December 31, 2003 and nominal for the year ended December 31, 2002.be large, creditworthy financial institutions.
Fair Value of Financial Instruments
The carrying amounts and fair values of our financial instruments are as follows (in millions):
| | December 31, | December 31, | ||||||||||||||||||||
|---|---|---|---|---|---|---|---|---|---|---|---|---|---|---|---|---|---|---|---|---|---|---|
| | 2003 | 2002 | 2004 | 2003 | ||||||||||||||||||
| | Carrying Amount | Fair Value | Carrying Amount | Fair Value | Carrying Amount | Fair Value | Carrying Amount | Fair Value | ||||||||||||||
| NYMEX futures | $ | 7.5 | $ | 7.5 | $ | 0.6 | $ | 0.6 | $42.3 | $42.3 | $7.5 | $7.5 | ||||||||||
| Options and swaps | $ | (3.3 | ) | $ | (3.3 | ) | $ | (0.6 | ) | $ | (0.6 | ) | $(2.8 | ) | $(2.8 | ) | $(3.3 | ) | $(3.3 | ) | ||
| Forward exchange contracts | $ | (0.4 | ) | $ | (0.4 | ) | $ | 0.1 | $ | 0.1 | $(1.5 | ) | $(1.5 | ) | $(0.4 | ) | $(0.4 | ) | ||||
| Forward extra option contracts | $ | — | $ | — | $ | 0.2 | $ | 0.2 | ||||||||||||||
| Cross currency swaps | $ | (4.8 | ) | $ | (4.8 | ) | $ | 0.3 | $ | 0.3 | $(6.3 | ) | $(6.3 | ) | $(4.8 | ) | $(4.8 | ) | ||||
| Treasury lock | $ | — | $ | — | $ | (3.3 | ) | $ | (3.3 | ) | ||||||||||||
| Interest rate swaps | $ | (0.4 | ) | $ | (0.4 | ) | $ | (6.3 | ) | $ | (6.3 | ) | $— | $— | $(0.4 | ) | $(0.4 | ) | ||||
| Short and long-term debt under credit facilities | $ | 95.3 | $ | 95.3 | $ | 409.4 | $ | 409.4 | $231.8 | $231.8 | $95.3 | $95.3 | ||||||||||
| Borrowings under senior secured hedged inventory facility | $80.4 | $80.4 | $100.5 | $100.5 | ||||||||||||||||||
| Senior notes | $ | 449.0 | $ | 482.9 | $ | 199.6 | $ | 209.0 | $797.3 | $848.0 | $449.0 | $482.9 | ||||||||||
As of December 31, 20032004 and 2002,2003, the carrying amounts of items comprising current assets and current liabilities approximate fair value due to the short-term maturities of these instruments. The carrying amounts of the variable rate instruments in our credit facilities and senior secured hedged inventory facility approximate fair value primarily because the interest rates fluctuate with prevailing market rates, whileand the credit spread on outstanding borrowings reflects market. The interest rate on the 5.625%our
senior notes (7.75%, 5.88%, 5.63%, and the 7.75% senior notes4.75%) is fixed and the fair value is based on quoted market prices.
The carrying amount of our derivative financial instruments approximate fair value as these instruments are recorded on the balance sheet at their fair value under SFAS 133. Our derivative financial instruments include cross currency swaps, forward exchange and extra option contracts, interest rate swap, collar and treasury lock agreements for which fair values are based on current liquidation values. We also have over-the-counter option and swap contracts for which fair values are estimated based on quoted prices from various sources such as independent reporting services, industry publications and brokers. For positions where independent quotations are not available, an estimate is provided, or the prevailing market price at which the positions could be liquidated is used. In addition, we have NYMEX futures and options for which the fair values are based on quoted market prices.
Note 9—8—Major Customers and Concentration of Credit Risk
Marathon Ashland Petroleum ("MAP") accounted for 12%10%, 10%12% and 11%10% of our revenues for each of the three years in the period ended December 31, 2003.2004. BP Oil Supply also accounted for 10% of our revenues for the year ended December 31, 2004. No other customers accounted for 10% or more of our revenues during any of the three years. The majority of the revenues from Marathon Ashland PetroleumMAP and BP Oil Supply pertain to our gathering, marketing, terminalling and storage operations. We believe that the loss of this customerthese customers would have only a short-term impact on our operating results. There can be no assurance, however, that we would be able to identify and access a replacement market at comparable margins.
Financial instruments that potentially subject us to concentrations of credit risk consist principally of trade receivables. Our accounts receivable are primarily from purchasers and shippers of crude oil. This industry concentration has the potential to impact our overall exposure to credit risk, either positively or negatively, in that the customers may be similarly affected by changes in economic, industry or other conditions. We review credit exposure and financial information of our counterparties and generally require letters of credit for receivables from customers that are not considered credit worthy, unless the credit risk can otherwise be reduced (see Note 5).reduced.
Note 10—9—Related Party Transactions
Reimbursement of Expenses of Our General Partner and Its Affiliates
We do not directly employ any persons to manage or operate our business. These functions are provided by employees of our general partner (or, in the case of our Canadian operations, PMC (Nova Scotia) Company). Our general partner does not receive a management fee or other compensation in connection with its management of us. We reimburse our general partner for all direct and indirect costs of services provided, including the costs of employee, officer and director compensation and benefits allocable to us, and all other expenses necessary or appropriate to the conduct of our business, and allocable to us. Our agreement provides that our general partner will determine the expenses allocable to us in any reasonable manner determined by our general partner in its sole discretion. Historically, an allocation was made for overhead associated with officers and employees who divided time between us and Plains Resources. As a result of the General Partner Transition, all of the employees and officers of the general partner devote 100% of their efforts to our business and there are no allocated expenses. Total costs reimbursed by us to our general partner in for the years ended December 31, 2004, 2003 2002 and 20012002 were approximately $151.0 million, $88.1 million and $70.8 million, and $31.3 million, respectively. Total costs reimbursed by us to our former general partner and Plains Resources were approximately $31.2 million for the year ended December 31, 2001.
Crude Oil Marketing Agreement
As of December 31, 2004, Vulcan Energy, through its wholly-owned subsidiary Plains Resources, owned an effective 44% of our general partner interest, as well as approximately 18.3% of our outstanding limited partner units. We are the exclusive marketer/purchaser for all of Plains Resources' and its subsidiaries' equity crude oil production. TheWe have a marketing agreement with Plains Resources provides that(the "Marketing Agreement") whereby we will purchase for resale at market prices the majority of Plains Resources' crude oil production for which we charge a
fee of $0.20 per barrel. This fee is subject to adjustment every three years based on then-existing market conditions. For the years ended December 31, 2004, 2003 2002 and 2001,2002, we paid Plains Resources approximately $28.3 million, $25.7 million $247.7 million and $223.2$247.7 million, respectively, for the purchase of crude oil under the agreement, including the royalty share of production, and recognized margins of approximately $0.2$0.1 million, $1.8$0.2 million and $1.8 million from the marketing fee for the same periods, respectively. In our opinion, these purchases were made at prevailing market prices. In November 2001, the marketing agreement automatically extended for an additional three-year period. In connection with the separation of Plains Resources and one of its subsidiaries, discussed below, Plains Resources divested the bulk of its producing properties. As a result, we do not anticipate the marketing arrangement with Plains Resources to be material to our operating results in the future. We are in the process of negotiating an amended agreement to reflect the separation. As currently in effect, the marketing agreementMarketing Agreement will terminate upon a "change inof control" of Plains Resources or our general partner. The recently announced buyoutrecent purchase of Plains Resources stockby Vulcan Energy would constitutehave constituted a change of control; however,control under the Marketing Agreement. In July 2004, we received assurances prioramended and restated the Marketing Agreement to exclude the initial announcement that neither Plains Resources norVulcan transaction from the buyout group intend for the agreement to terminate.change of control provisions.
In December 2002, Plains Resources completed a spin-off of one of its subsidiaries, Plains Exploration and Production Company ("PXP") to its shareholders. PXP is a successor participant to the Plains Resources Marketing agreement.Agreement. For the yearyears ended December 31, 2004 and 2003, we paid PXP approximately $328.3 million and $277.9 million, respectively, for the purchase of crude oil under the agreement, including the royalty share of production and recognized margins of approximately $1.4 and $1.7 million, respectively, from the marketing fee. In our opinion, these purchases were made at prevailing market prices. We are also party to a Letter Agreement with Stocker Resources, L.P. (now PXP) that provides that if the Marketing Agreement terminates before our crude oil sales agreement with Tosco Refining Co. ("Tosco") terminates, PXP will continue to sell and we will continue to purchase PXP's equity crude oil production from the Arroyo Grande field (now owned by a subsidiary of PXP) under the same terms as the Marketing Agreement until our Tosco sales agreement terminates. In July 2004, we amended and restated the Marketing Agreement to, among other things, reflect the change in parties as a result of the spin-off. We aresell PXP's crude under sales contracts that range from one year to four years in length. In October 2004, we further amended the process of negotiatingPXP Marketing Agreement to exclude any newly acquired properties and to adjust the terms of an amended agreement with PXP.
Separation Agreement
A separation agreement wasmarketing fee to $0.15 per barrel for any new contracts entered into in connection with the General Partner Transition pursuant to which (i) Plains Resources has indemnified us for (a) claims relating to securities laws or regulations in connection with the upstream or midstream businesses, based on alleged acts or omissions occurring on or prior to June 8, 2001 or (b) claims related to the upstream business, whenever arising, and (ii) we have indemnified Plains Resources for claims related to the midstream business, whenever arising. Plains Resources also has agreed to indemnify and maintain liability insurance for the individuals who were, on or before June 8, 2001, directors or officers of Plains Resources or our former general partner.after January 1, 2005.
Due to Related Parties
The balance of amounts due to related parties at December 31, 2004 and 2003 and 2002 was $27.0$32.9 million and $23.3$27.0 million, respectively, and was primarily related to crude oil purchased by us but not yet paid as of December 31 of each year.
Transaction Grant Agreements
In connection with our initial public offering, our former general partner, at no cost to us, agreed to transfer, subject to vesting, approximately 400,000 of its affiliates' common units (including distribution equivalent rights attributable to such units) to certain key officers and employees of our former general partner and its affiliates. Under these grants, the common units vested based on attaining a targeted operating surplus for a given year. Approximately 70,000 units vested in 2000, with
the remainder in 2001. The value of the units and associated distribution equivalent rights that vested under the Transaction Grant Agreements for all grantees in 2001 were $5.7 million. Although we recorded noncash compensation expenses with respect to these vestings, the compensation expense incurred in connection with these grants was funded by our former general partner, without reimbursement by us.
Performance Option Plan
In connection with the General Partner Transition,transfer of a majority of our general partner interest in 2001, the owners of the general partner (other than PAA Management, L.P.) contributed an aggregate of 450,000 subordinated units (now converted into common units) to the general partner to provide a pool of units available for the grant of options to management and key employees. In that regard, the general partner adopted the Plains All American 2001 Performance Option Plan, pursuant to which options to purchase approximately 375,000391,000 units have been granted. These options vest in 25% increments based upon achieving quarterly distribution levels on our units of $0.525, $0.575, $0.625 and $0.675 ($2.10, $2.30, $2.50 and $2.70, annualized). The first such level was reached, and 25% of the options vested, in 2002. The second level was reached, and an additional 25% of the options vested, in 2004. The options will vest in their entirety immediately upon a change in control (as defined in the grant agreements). The original purchaseexercise price under the options iswas $22 per subordinated unit at the time of grant, declining over time in an amount equal to 80% of each quarterly distribution per unit. As of February 17,December 31, 2004, the purchaseexercise price was $17.30$15.91 per unit. The terms of future grants may differ from the existing grants. Because the units underlying the plan were contributed to the general partner, we will have no obligation to reimburse the general partner for the cost of the units upon exercise of the options. At December 31, 20032004 approximately 371,875388,000 units were outstanding following the exercise of 3,125 options during 2003.
Stock Option Replacement
In connection with the General Partner Transition, certain members of the management team that had been employed by Plains Resources were transferred to the general partner. At that time, such individuals held in-the-money but unvested stock options in Plains Resources, which were subject to forfeiture because of the transfer of employment. Plains Resources, through its affiliates, agreed to substitute a contingent grant of subordinated units (or common units after conversion) with a value equal to the spread on the unvested options, with distribution equivalent rights from the date of grant. The units vest on the same schedule as the stock options would have vested. The general partner administers the vesting and delivery of the units under the grants. Because the units necessary to satisfy the delivery requirements under the grants are provided by Plains Resources, we have no obligation to reimburse the general partner for the cost of such units.outstanding.
Benefit Plan
A subsidiary of Plains Resources was, until June 8, 2001, ourOur general partner. On that date, such entity transferred the general partner interest to our current general partner, which effective July 1, 2001, maintains a 401(k) defined contribution plan whereby it matches 100% of an employee's contribution (subject to certain limitations in the plan). For the years ended December 31, 2004, 2003 and 2002, the defined contribution plan matching expense was approximately $4.0 million, $2.6 million and $2.1 million, respectively. Similarly, PMC (Nova Scotia) Company maintains a group Registered Savings Plan and a Non Registered Employee Savings Plan for our Canadian employees. For the period July 1 throughyears ended December 31, 2001, defined contribution plan2004, 2003 and 2002, these plans had expense wasof approximately $1.1 million.
Prior to July 1, 2001, Plains Resources maintained a 401(k) defined contribution plan whereby it matched 100% of an employee's contribution (subject to certain limitations in the plan), with matching contributions being made 50% in cash$1.0 million, $0.7 million and 50% in common stock of Plains Resources (the number of shares for the stock match being based on the market value of the common stock at the time the shares were granted). For the period January 1 through June 30, 2001, defined contribution plan expense was $1.0 million.$0.4 million, respectively.
Note 11—10—Long-Term Incentive Plans
Our general partner has adopted the Plains All American GP LLC 1998 Long-Term Incentive Plan (the "LTIP""1998 LTIP") for employees and directors of our general partner and its affiliates who perform services for us. Awards contemplated by the 1998 LTIP include phantom units and unit options. The LTIP consists of two components, a restricted ("phantom") unit plan and a unit option plan. The1998 LTIP currently permits the grant of phantom units and unit options covering an aggregate of 1,425,000 common units. The plan is administered by the Compensation Committee of our general partner's board of directors. Our general partner's board of directors in its discretion may terminate the LTIP at any time with respect to any common units for which a grant has not yet been made. Our general partner's board of directors also has the right to alter or amend the 1998 LTIP or any part of the plan from time to time, including, subject to any applicable NYSE listing requirements, increasing the number of common units with respect to which awards may be granted; provided, however, that no change in any outstanding grant may be made that would materially impair the rights of the participant without the consent of such participant.
Restricted Unit Plan. A restrictedphantom unit is a "phantom" unit that entitles the grantee to receive, upon the vesting of the phantom unit, a common unit (or cash equivalent, depending on the terms of the grant). As of December 31, 2003,2004, aggregate outstanding grants of approximately 1,003,000134,000 units have been made to employees, officers and directors of our general partner. As discussed in more detail below, a substantial number of phantom units have recently vested or are expected to vest in the first half of 2004. As of February 17, 2004, giving effect to vested grants, grants of approximately 684,000 unvested phantom units remain outstanding to employees, officers and directors of our general partner. As discussed below, a substantial portion of these phantom units are expected to vest in May 2004. The Compensation Committee may, in the future, make additional grants under
the plan to employees and directors containing such terms as the Compensation Committee shall determine.
If a grantee terminates employment or membership on the board for any reason, the grantee's phantom units will be automatically forfeited unless, and to the extent, the Compensation Committee provides otherwise. Common units to be delivered upon the vesting of rightsgrants may be common units acquired by our general partner in the open market or in private transactions, common units already owned by our general partner, or any combination of the foregoing. Our general partner will be entitled to reimbursement by us for the cost incurred in acquiring common units.units and any other costs incurred in settling obligations under the 1998 LTIP. In addition, the Partnership may issue up to 975,000 new common units to satisfy delivery obligations under the grants, less any common units issued upon exercise of unit options under the plan (see below). If we issue new common units upon vesting of the phantom units, the total number of common units outstanding will increase. The Compensation Committee, in its discretion, may grant tandem distribution equivalent rights ("DERs") with respect to phantom units.
The phantom units (other than director grants) granted during A DER entitles the subordination period were subjectgrantee to a cash payment, either while the basic restriction thataward is outstanding or upon vesting, could take place only after and in proportionequal to any conversion of subordinated units into common units. Certain grants were subject to additional vesting criteria, primarily related to the Partnership's performance. In November 2003, 25% of the outstanding subordinated units convertedcash distributions paid on a one-for-one basis into common units andunit while the remainderaward is outstanding. There are no tandem equivalent distribution rights outstanding at this time under the 1998 LTIP.
Other than grants to directors, none of our subordinated units converted into common units in February 2004. As a result, approximately 35,000the phantom units vested inuntil November 2003,2003. Since that time, approximately 326,000927,000 phantom units vestedhave vested. Including grants to directors, approximately 418,000 units have been purchased and delivered or issued in February 2004, and we anticipate that approximately 473,000 additional phantom units will vest in May 2004, subject to the satisfaction of service period requirements.vesting, after payment of cash-equivalents and netting for taxes. Under generally accepted accounting principles, we are required to recognize an expense when it is considered probable that the financial tests for conversion of subordinated units and required distribution levels will be met and that the phantom unitsunit grants under our 1998 LTIP will vest. As a result, we recognized an expense of approximately $7.9 million and $28.8 million for the years ended December 31, 2004 and 2003, we had recorded approximately $28.8 million of compensation expense for the units that vested during 2003 and those that we concluded probable of vesting during 2004. The compensation expense recorded is based upon the actual amounts paid in 2003, or for the unpaid
portion, an estimated market price of $33.35 per unit, our share of employment taxes and other related costs.
During 2003, we paid cash in lieu of issuing units for approximately 7,500 of the phantom units that vested during the year and issued approximately 18,000 common units (after netting for taxes). For those units that vested in February 2004, we paid cash in lieu of issuing units for approximately 104,000 of the phantom units and issued approximately 138,000 new common units (after netting for taxes) in connection with such vesting. We anticipate paying cash for approximately 201,000 of the phantom units expected to vest in May 2004, as well as issuing approximately 181,000 new common units (after netting for taxes) in connection with such vesting.respectively.
The issuance of the common units pursuant to the restricted unit planupon vesting of phantom units is primarily intended to serve as a means of incentive compensation for performance. Therefore, no consideration will beis paid to us by the plan participants upon receiptvesting and delivery of the common units.
In 2000, the three non-employee directors of our former general partner were each granted 5,000 phantom units. These units vested in connection with the consummation of the General Partner Transition. Additional grants of 5,000 phantom units were made in 2002 to each non-employee director of our general partner. These units vest in 25% increments on each anniversary of June 8, 2001. The first vesting took place on June 8, 2002.
Unit Option Plan. The Unit Option Plan under our Long-Term Incentive PlanOur 1998 LTIP currently permits the grant of options coveringto purchase common units. No unit option grants have been made under the Unit Option Plan1998 LTIP to date. However, the Compensation Committee may, in the future, make grants under the plan to employees and directors containing such terms as the committee shall determine, provided that unit options have an exercise price equal to the fair market value of the units on the date of grant.
In January 2005, our unitholders approved the 2005 Long-Term Incentive Plan (the "2005 LTIP"). The 2005 LTIP provides for awards to our employees and directors. Awards contemplated by the 2005 LTIP include phantom units, restricted units, unit appreciation rights and unit options, as determined by the Compensation Committee (each an "Award"). Up to 3,000,000 units may be issued in satisfaction of Awards. Certain Awards may also include DERs in the discretion of the Compensation Committee. Our general partner will be entitled to reimbursement by us for any costs incurred in settling obligations under the 2005 LTIP. Certain of these Awards could be considered a common stock equivalent and thus be dilutive to our earnings per unit from the time of their date of grant. In February 2005, our Board of Directors and Compensation Committee approved grants of approximately 1,900,000 phantom units (a substantial number of which include DERs) under the 2005 LTIP.
The issuance of the common units upon vesting of phantom units is primarily intended to serve as a means of incentive compensation for performance. Therefore, no consideration is paid to us by the plan participants upon vesting and delivery of the common units.
Note 12—11—Commitments and Contingencies
We lease certain real property, equipment and operating facilities under various operating and capital leases. We also incur costs associated with leased land, rights-of-way, permits and regulatory fees, the contracts for which generally extend beyond one year but can be cancelled at any time should they not be required for operations. Future non-cancellable commitments related to these items at December 31, 2003,2004, are summarized below (in millions):
| 2004 | $ | 12.7 | |||
| 2005 | $ | 11.2 | $17.8 | ||
| 2006 | $ | 8.8 | $14.0 | ||
| 2007 | $ | 5.3 | $10.9 | ||
| 2008 | $ | 2.8 | $6.3 | ||
| 2009 | $5.2 | ||||
| Thereafter | $ | 0.7 | $13.7 | ||
Total lease expense incurredExpenditures related to leases for 2004, 2003 and 2002 and 2001 was $10.5were $20.1 million, $8.3$13.4 million and $7.4$9.7 million, respectively. As is common within the industry and in the ordinary course of business, we have also entered into various operational commitments and agreements related to pipeline operations and to marketing, transportation, terminalling and storage of crude oil and LPG.
Litigation
Export License Matter. In our gathering and marketing activities, we import and export crude oil from and to Canada. Exports of crude oil are subject to the short supply"short supply" controls of the Export Administration Regulations ("EAR") and must be licensed by the Bureau of Industry and Security (the "BIS") of the U.S. Department of Commerce. We haveCommerce Department. In 2002, we determined that we may have exceededviolated the terms of our licenses with respect to the quantity of crude oil exports authorized by previous licenses.exported and the end-users in Canada. Export of crude oil in excess of the
except as authorized amountsby license is a violation of the EAR. OnIn October 18, 2002, we submitted to the BIS an initial notification of voluntary disclosure. The BIS subsequently informed us that we could continue to export while previous exports were under review. We applied for and have received aseveral new licenselicenses allowing for exports ofexport volumes and end users that more than adequately reflectingaccurately reflect our anticipated business and customer needs. On October 2, 2003,We also conducted reviews of new and existing contracts and implemented new procedures and practices in order to monitor compliance with applicable laws regarding the export of crude oil to Canada. As a result, we subsequently submitted additional information to the BIS.BIS in October 2003 and May 2004. In August 2004, we received a request from the BIS for additional information. We have responded to this and subsequent requests, and continue to cooperate fully with BIS officials. At this time, we have received neither a warning letter nor a charging letter, which could involve the imposition of penalties, and no indication whetherof what penalties the BIS intends to charge us with a violation of the EAR or, if so, what penalties would be assessed.might assess. As a result, we cannot reasonably estimate the ultimate impact of this matter.
Alfons Sperber v. Plains Resources Inc., et.et al. On December 18, 2003, a putative class action lawsuit was filed in the Delaware Chancery Court, New Castle County, entitledAlfons Sperber v. Plains Resources Inc., et al. This suit, brought on behalf of a putative class of Plains All American Pipeline, L.P. common unit holders, assertsunitholders, asserted breach of fiduciary duty and breach of contract claims against the Partnership,us, Plains AAP, L.P., and Plains All American GP LLC and its directors, as well as breach of fiduciary duty claims against Plains Resources Inc. and its directors. The complaint seekssought to enjoin or rescind a proposed acquisition of all of the outstanding stock of Plains Resources Inc., as well as declaratory relief, an accounting, disgorgement and the imposition of a constructive trust, and an award of damages, fees, expenses and costs, among other things. This lawsuit has been settled in principle. The Partnership intends to vigorously defend this lawsuit.court has approved the settlement and, assuming no appeals are filed, the settlement will become final in March 2005.
Other Litigation.Other. We, in the ordinary course of business, are a claimant and/or a defendant in various other legal proceedings. We do not believe that the outcome of these other legal proceedings, individually and in the aggregate, will have a materially adverse effect on our financial condition, results of operations or cash flows.
OtherNote 12—Environmental Remediation
The occurrenceWe currently own or lease properties where hazardous liquids, including hydrocarbons, are being or have been handled. As such, we could be required to remove or remediate hazardous liquids or associated generated wastes (including wastes disposed of a significant event not fully insured or indemnified against,released by prior owners or operators), to clean up contaminated property (including contaminated groundwater) or to perform remedial operations to prevent future contamination.
We maintain insurance of various types with varying levels of coverage that we consider adequate under the failure of a partycircumstances to meet its indemnification obligations, could materially and adversely affectcover our operations and financial condition. We believeproperties. The insurance policies are subject to deductibles and retention levels that we consider reasonable and not excessive. Consistent with insurance coverage generally available in the industry, in certain circumstances our insurance policies provide limited coverage for losses or liabilities relating to gradual pollution, with broader coverage for sudden and accidental occurrences.
In addition, we have entered into indemnification agreements with various counterparties in conjunction with several of our acquisitions. Allocation of environmental liability is an issue negotiated in connection with each of our acquisition transactions. In each case, we make an assessment of potential environmental exposure based on available information. Based on that assessment and relevant economic and risk factors, we determine whether to negotiate an indemnity, what the terms of any indemnity should be (for example, minimum thresholds or caps on exposure) and whether to obtain insurance, if available. In some cases, we have received contractual protections in the form of environmental indemnifications from several predecessor operators for properties acquired by us that are adequately insuredcontaminated as a result of historical operations. These contractual indemnifications typically are subject to specific monetary requirements that must be satisfied before indemnification will apply and have term and total dollar limits.
The acquisitions we completed in 2003 and 2004 include a variety of provisions dealing with the allocation of responsibility for public liability and property damageenvironmental costs that range from no or limited indemnities from the sellers to othersindemnification from sellers with respectdefined limitations on their maximum exposure. We have not obtained insurance for any of the conditions related to our operations. With respect to all2003 acquisitions, and only in limited circumstances for our 2004 acquisitions.
For instance, in connection with the Link acquisition, we identified a number of our coverage, no assurance can be given thatenvironmental liabilities for which we received a purchase price reduction from Link. A substantial portion of these environmental liabilities are associated with the former Texas New Mexico ("TNM") pipeline assets. On the effective date of the acquisition, we and TNM entered into a cost-sharing agreement whereby, on a tiered basis, we will be able to maintain adequate insurance inbear $11 million of the futurefirst $20 million of pre-May 1999 environmental issues. We will also bear the first $25,000 per site for new sites which were not identified at ratesthe time we consider reasonable.
We may experience future releases of crude oilentered into the environment from our pipeline and storage operations, or discover past releases that were previously unidentified. Although we maintain an inspection program designed to prevent and, as applicable, to detect and address such releases promptly, damages andagreement (capped at 100 sites). TNM will pay all costs in excess of $20 million (excluding the deductible for new sites). TNM's obligations are guaranteed by Shell Oil Products ("SOP"). We recorded a reserve for environmental liabilities incurred due to any such environmental releases from our assets may substantially affect our business.of approximately $17.0 million in connection with the Link acquisition.
Note 13—Environmental Remediation
In connection with various acquisitions, we have received indemnities from the sellers for environmental exposure, subject to our prior paymentacquisition of certain threshold amounts. Based on our investigations of thecrude oil transmission and gathering assets acquiredfrom SOP in such acquisitions, we have identified several sites that exceed the threshold limitations2002, Shell purchased an environmental insurance policy covering known and unknown environmental matters associated with operations prior to closing. We are a named beneficiary under the various indemnities. Althoughpolicy, which has a $100,000 deductible per site, an aggregate coverage limit of $70 million, and expires in 2012. Shell has recently made a claim against the policy; however, we havedo not yet determinedbelieve that the total cost of remediation of these sites, we believeclaim will substantially reduce our indemnification arrangements should prevent such costs from having a material adverse effect on our financial condition, results of operations or cash flows.coverage under the policy.
In connection with our 1999 acquisition of Scurlock Permian LLC from MAP, we were indemnified by MAP for any environmental liabilities attributable to Scurlock's business or properties which occurred prior to the date of the closing of the acquisition. This indemnity applied to claims that exceeded $25,000 individually and $1.0 million in the aggregate. For the indemnity to apply, we were required to assert any claims on or before May 15, 2003. In conjunction with the expiration of this indemnity, we reached agreement with respect to MAP's remaining indemnity obligations. Under the terms of this agreement, MAP will continue to remain obligated for liabilities associated with two
Superfund sites at which it is alleged that Scurlock Permian deposited waste oils. In addition, MAP paid us $4.6 million cash as satisfaction of its obligations with respect to other sites. During 2002, we had reassessed previous investigations and completed environmental studies related to environmental conditions associated with our 1999 acquisitions. As a result of that reassessment, we established an additional reserve of $1.2 million.
As of December 31, 2003, we have approximately $6.6 million reserved associated with our remediation obligations. This amount is approximately equal to the threshold amounts the partnership must incur before the sellers' indemnities take effect. Approximately $1.6 million of our environmental reserve is classified as current and $5.0 million is classified as long-term because in many cases, the actual cash expenditures may not occur for up to ten years or more.
Other assets we have acquired or will acquire in the future may have environmental remediation liabilities for which we are not indemnified. We mayhave in the past experienced and in the future will likely experience future releases of crude oil into the environment from our pipeline and storage operations, or discover releases that were previously unidentified. Although we maintain an extensive inspectiona program designed to prevent and, as applicable, to detect and address such releases promptly, damages and liabilities incurred due to any future environmental releases from our assets may substantially affect our business.
At December 31, 2004, our reserve for environmental liabilities totaled approximately $19.8 million (approximately $12.7 million of this reserve is related to liabilities assumed as part of the Link acquisition). Approximately $9.3 million of our environmental reserve is classified as current and $10.5 million is classified as long-term. At December 31, 2004, we have recorded receivables totaling approximately $6.3 million for amounts recoverable under insurance and from third parties under indemnification agreements.
In some cases, the actual cash expenditures may not occur for three to five years. We believe that this reserve is adequate, and in conjunction with our indemnification arrangements, should prevent remediation costs from having a material adverse effect on our financial condition, results of operations, or cash flows. Our estimates used in these reserves are based on all known facts at the time and our assessment of the ultimate outcome. Among the many uncertainties that impact our estimates are the necessary regulatory approvals for, and potential modification of, our remediation plans, the limited amount of data available upon initial assessment of the impact of soil or water contamination, changes in costs associated with environmental remediation services and equipment and the possibility of existing legal claims giving rise to additional claims. Therefore, no assurances can be made that any costs incurred in excess of this reserve or outside of the indemnifications would not have a material adverse effect on our financial condition, results of operations, or cash flows.
Note 14—13—Quarterly Financial Data (Unaudited):
| | First Quarter | Second Quarter | Third Quarter | Fourth Quarter | Total(1) | First Quarter | Second Quarter | Third Quarter | Fourth Quarter | Total(1) | ||||||||||||||||||||
|---|---|---|---|---|---|---|---|---|---|---|---|---|---|---|---|---|---|---|---|---|---|---|---|---|---|---|---|---|---|---|
| | (in millions, except per unit data) | (in thousands, except per unit data) | ||||||||||||||||||||||||||||
| 2004 | ||||||||||||||||||||||||||||||
| Revenues(3) | $ | 3,804.6 | $ | 5,131.7 | $ | 5,867.0 | $ | 6,172.1 | $ | 20,975.5 | ||||||||||||||||||||
| Gross margin | 59.7 | 64.8 | 74.0 | 65.7 | 264.2 | |||||||||||||||||||||||||
| Operating income | 40.5 | 45.2 | 55.1 | 39.2 | 180.0 | |||||||||||||||||||||||||
| Income before cumulative effect of change in accounting principle | 31.0 | 35.7 | 41.7 | 24.7 | 133.1 | |||||||||||||||||||||||||
| Net income | 27.9 | 35.7 | 41.7 | 24.7 | 130.0 | |||||||||||||||||||||||||
| Basic and diluted income per limited partner unit before cumulative effect of change in accounting principle | 0.49 | 0.54 | 0.59 | 0.32 | 1.94 | |||||||||||||||||||||||||
| Basic and diluted net income per limited partner unit | 0.44 | 0.54 | 0.59 | 0.32 | 1.89 | |||||||||||||||||||||||||
| Cash distributions per common unit(2) | $ | 0.563 | $ | 0.563 | $ | 0.578 | $ | 0.600 | $ | 2.30 | ||||||||||||||||||||
| 2003 | ||||||||||||||||||||||||||||||
| Revenues | $ | 3,281.9 | $ | 2,709.2 | $ | 3,053.7 | $ | 3,545.0 | $ | 12,589.8 | ||||||||||||||||||||
| Revenues(3) | $ | 3,281.9 | $ | 2,709.2 | $ | 3,053.7 | $ | 3,545.0 | $ | 12,589.8 | ||||||||||||||||||||
| Gross margin | 46.7 | 44.0 | 38.7 | 41.2 | 170.6 | 46.7 | 44.0 | 38.7 | 41.2 | 170.6 | ||||||||||||||||||||
| Operating income | 33.6 | 31.9 | 21.0 | 11.6 | 98.2 | 33.6 | 31.9 | 21.0 | 11.6 | 98.2 | ||||||||||||||||||||
| Net income (loss) | 24.4 | 23.4 | 11.9 | (0.2 | ) | 59.4 | 24.4 | 23.4 | 11.9 | (0.2 | ) | 59.4 | ||||||||||||||||||
| Basic net income (loss) per limited partner unit | 0.46 | 0.42 | 0.20 | (0.03 | ) | 1.01 | 0.46 | 0.42 | 0.20 | (0.03 | ) | 1.01 | ||||||||||||||||||
| Diluted net income (loss) per limited partner unit | 0.46 | 0.42 | 0.19 | (0.03 | ) | 1.00 | 0.46 | 0.42 | 0.20 | (0.03 | ) | 1.00 | ||||||||||||||||||
| Cash distributions per common unit(2) | $ | 0.550 | $ | 0.550 | $ | 0.550 | $ | 0.563 | $ | 2.21 | $ | 0.538 | $ | 0.550 | $ | 0.550 | $ | 0.550 | $ | 2.19 | ||||||||||
2002 | ||||||||||||||||||||||||||||||
| Revenues | $ | 1,545.3 | $ | 1,985.3 | $ | 2,344.1 | $ | 2,509.5 | $ | 8,384.2 | ||||||||||||||||||||
| Gross margin | 31.4 | 34.5 | 35.3 | 39.0 | 140.2 | |||||||||||||||||||||||||
| Operating income | 20.8 | 23.4 | 23.8 | 26.7 | 94.6 | |||||||||||||||||||||||||
| Net income | 14.3 | 17.0 | 16.3 | 17.7 | 65.3 | |||||||||||||||||||||||||
| Basic and diluted net income per limited partner unit | 0.31 | 0.37 | 0.33 | 0.33 | 1.34 | |||||||||||||||||||||||||
| Cash distributions per common unit(2) | $ | 0.525 | $ | 0.538 | $ | 0.538 | $ | 0.538 | $ | 2.14 | ||||||||||||||||||||
Note 15—14—Operating Segments
Our operations consist of two operating segments: (1) (i) pipeline operations ("Pipeline Operations—engagesOperations") and (ii) gathering, marketing, terminalling and storage operations ("GMT&S"). Through our pipeline segment, we engage in interstate and intrastate crude oil pipeline transportation and certain related merchant activities; (2) Gathering, Marketing, Terminalling and Storage Operations—engagesmargin activities. Through our GMT&S segment, we engage in purchases and resales of crude oil and LPG at various points along the distribution chain and the operation ofwe operate certain terminalling and
storage assets. We evaluate segment performance basedbelieve that the combination of our terminalling and storage activities and gathering and marketing activities provides a counter-cyclical balance that has a stabilizing effect on (i) segment profitour results of operations and (ii) maintenance capital. We define segment profit as revenues less (i) purchases, (ii) field operating costs and (iii) segment general and administrative expenses. Maintenance capital consists of capital expenditures required either to maintain the existing operating capacity of partially or fully depreciated assets or to extend their useful lives. Capital expenditures made to expand our existing capacity, whether through construction or acquisition, are not considered maintenance capital expenditures. Repair and maintenance expenditures associated with existing assets that do not extend the useful life or expand the operating capacity are charged to expense as incurred.cash flow. In a contango market (oil prices for future deliveries are higher than for current deliveries), we use our tankage to improve our gathering margins by storing crude oil we have purchased at lower prices in the current month for delivery at higher prices in future months. In a backwardated market (oil prices for future deliveries are lower than for current deliveries), we use and lease less storage capacity, but increased marketing margins (premiums for prompt delivery) provide an offset to this reduced cash flow.
We believeevaluate segment performance based on segment profit and maintenance capital. We define segment profit as revenues less (i) purchases, (ii) field operating costs, and (iii) segment general and administrative expenses. Maintenance capital consists of capital expenditures required either to maintain the existing operating capacity of partially or fully depreciated assets or to extend their useful lives. Capital expenditures made to expand our existing capacity, whether through construction or
acquisition, are not considered maintenance capital expenditures. Repair and maintenance expenditures associated with existing assets that do not extend the combination of our terminalling and storage activities and gathering and marketing activities provides a counter-cyclical balance that has a stabilizing effect on our operations and cash flow.useful life or expand the operating capacity are charged to expense as incurred. The following table reflects our results of operationscertain financial data for each segment for the periods indicated (note that each of the items in the following table excludeexcludes depreciation and amortization):
| | Pipeline | Gathering Marketing, Terminalling & Storage | Total | ||||||||
|---|---|---|---|---|---|---|---|---|---|---|---|
| | (in millions) | ||||||||||
| Twelve Months Ended December 31, 2003 | |||||||||||
| Revenues: | |||||||||||
| External Customers | $ | 605.1 | $ | 11,984.7 | $ | 12,589.8 | |||||
| Intersegment(a) | 53.5 | 0.9 | 54.5 | ||||||||
| Total revenues of reportable segments | $ | 658.6 | $ | 11,985.6 | $ | 12,644.3 | |||||
| Segment profit(c) | $ | 81.3 | $ | 63.1 | $ | 144.4 | |||||
| Capital expenditures | $ | 211.9 | $ | 21.9 | $ | 233.8 | |||||
| Total assets | $ | 1,221.0 | $ | 874.6 | $ | 2,095.6 | |||||
| Non-cash SFAS 133 impact(b) | $ | — | $ | 0.4 | $ | 0.4 | |||||
| Maintenance capital | $ | 6.4 | $ | 1.2 | $ | 7.6 | |||||
Twelve Months Ended December 31, 2002 | |||||||||||
| Revenues: | |||||||||||
| External Customers | $ | 462.4 | $ | 7,921.8 | $ | 8,384.2 | |||||
| Intersegment(a) | 23.8 | — | 23.8 | ||||||||
| Total revenues of reportable segments | $ | 486.2 | $ | 7,921.8 | $ | 8,408.0 | |||||
| Segment profit(c) | $ | 70.7 | $ | 58.9 | $ | 129.6 | |||||
| Capital expenditures | $ | 341.9 | $ | 23.3 | $ | 365.2 | |||||
| Total assets | $ | 1,030.7 | $ | 635.9 | $ | 1,666.6 | |||||
| Non-cash SFAS 133 impact(b) | $ | — | $ | 0.3 | $ | 0.3 | |||||
| Maintenance capital | $ | 3.4 | $ | 2.6 | $ | 6.0 | |||||
Twelve Months Ended December 31, 2001 | ||||||||||||||||||||||
| | | Pipeline | GMT&S | Total | ||||||||||||||||||
|---|---|---|---|---|---|---|---|---|---|---|---|---|---|---|---|---|---|---|---|---|---|---|
| | | (in millions) | ||||||||||||||||||||
| Twelve Months Ended December 31, 2004 | Twelve Months Ended December 31, 2004 | |||||||||||||||||||||
| Revenues: | Revenues: | Revenues: | ||||||||||||||||||||
| External Customers | $ | 339.9 | $ | 6,528.3 | $ | 6,868.2 | External Customers (includes buy/sell revenues of $149.8, $11,247.0, and $11,396.8, respectively) | $ | 752.9 | $ | 20,222.6 | $ | 20,975.5 | |||||||||
| Intersegment(a) | 17.5 | — | 17.5 | Intersegment(a) | 122.0 | 0.9 | 122.9 | |||||||||||||||
| Total revenues of reportable segments | $ | 357.4 | $ | 6,528.3 | $ | 6,885.7 | Total revenues of reportable segments | $ | 874.9 | $ | 20,223.5 | $ | 21,098.4 | |||||||||
| Segment profit(c) | Segment profit(c) | $ | 58.9 | $ | 42.5 | $ | 101.4 | Segment profit(c) | $ | 157.2 | $ | 91.5 | $ | 248.7 | ||||||||
| Capital expenditures | Capital expenditures | $ | 169.8 | $ | 80.4 | $ | 250.2 | Capital expenditures | $ | 520.7 | $ | 131.5 | $ | 652.2 | ||||||||
| Total assets | Total assets | $ | 472.3 | $ | 788.9 | $ | 1,261.2 | Total assets | $ | 1,507.5 | $ | 1,652.9 | $ | 3,160.4 | ||||||||
| Non-cash SFAS 133 impact(b) | Non-cash SFAS 133 impact(b) | $ | — | $ | 0.2 | $ | 0.2 | Non-cash SFAS 133 impact(b) | $ | — | $ | 1.0 | $ | 1.0 | ||||||||
| Maintenance capital | Maintenance capital | $ | 0.5 | $ | 2.9 | $ | 3.4 | Maintenance capital | $ | 8.3 | $ | 3.0 | $ | 11.3 | ||||||||
| Twelve Months Ended December 31, 2003 | Twelve Months Ended December 31, 2003 | |||||||||||||||||||||
| Revenues: | Revenues: | |||||||||||||||||||||
| External Customers (includes buy/sell revenues of $166.2, $6,124.9, and $6,291.1, respectively) | $ | 605.1 | $ | 11,984.7 | $ | 12,589.8 | ||||||||||||||||
| Intersegment(a) | 53.5 | 0.9 | 54.4 | |||||||||||||||||||
| Total revenues of reportable segments | $ | 658.6 | $ | 11,985.6 | $ | 12,644.2 | ||||||||||||||||
| Segment profit(c) | Segment profit(c) | $ | 81.3 | $ | 63.1 | $ | 144.4 | |||||||||||||||
| Capital expenditures | Capital expenditures | $ | 211.9 | $ | 21.9 | $ | 233.8 | |||||||||||||||
| Total assets | Total assets | $ | 1,221.0 | $ | 874.6 | $ | 2,095.6 | |||||||||||||||
| Non-cash SFAS 133 impact(b) | Non-cash SFAS 133 impact(b) | $ | — | $ | 0.4 | $ | 0.4 | |||||||||||||||
| Maintenance capital | Maintenance capital | $ | 6.4 | $ | 1.2 | $ | 7.6 | |||||||||||||||
| Twelve Months Ended December 31, 2002 | Twelve Months Ended December 31, 2002 | |||||||||||||||||||||
| Revenues: | Revenues: | |||||||||||||||||||||
| External Customers (includes buy/sell revenues of $95.8, $4,140.8, and $4,236.7, respectively) | $ | 462.4 | $ | 7,921.8 | $ | 8,384.2 | ||||||||||||||||
| Intersegment(a) | 23.8 | — | 23.8 | |||||||||||||||||||
| Total revenues of reportable segments | $ | 486.2 | $ | 7,921.8 | $ | 8,408.0 | ||||||||||||||||
| Segment profit(c) | Segment profit(c) | $ | 70.7 | $ | 58.9 | $ | 129.6 | |||||||||||||||
| Capital expenditures | Capital expenditures | $ | 341.9 | $ | 23.3 | $ | 365.2 | |||||||||||||||
| Non-cash SFAS 133 impact(b) | Non-cash SFAS 133 impact(b) | $ | — | $ | 0.3 | $ | 0.3 | |||||||||||||||
| Maintenance capital | Maintenance capital | $ | 3.4 | $ | 2.6 | $ | 6.0 | |||||||||||||||
| Table continued on following page | Table continued on following page | |||||||||||||||||||||
| | For the year ended December 31, | Year ended December 31, | ||||||||||||||||||
|---|---|---|---|---|---|---|---|---|---|---|---|---|---|---|---|---|---|---|---|---|
| | 2003 | 2002 | 2001 | 2004 | 2003 | 2002 | ||||||||||||||
| Segment profit | $ | 144.4 | $ | 129.6 | $ | 101.4 | $ | 248.7 | $ | 144.4 | $ | 129.6 | ||||||||
| Unallocated general and administrative expenses | — | (1.0 | ) | (5.7 | ) | — | — | (1.0 | ) | |||||||||||
| Depreciation and amortization | (46.8 | ) | (34.1 | ) | (24.3 | ) | (67.2 | ) | (46.8 | ) | (34.1 | ) | ||||||||
| Gain on sale of assets | 0.6 | — | 1.0 | 0.6 | 0.6 | — | ||||||||||||||
| Impairment loss | (2.0 | ) | — | — | ||||||||||||||||
| Interest expense | (35.2 | ) | (29.1 | ) | (29.1 | ) | (46.7 | ) | (35.2 | ) | (29.1 | ) | ||||||||
| Interest income and other, net | (3.6 | ) | (0.1 | ) | 0.4 | (0.3 | ) | (3.6 | ) | (0.1 | ) | |||||||||
| Cumulative effect of accounting change | — | — | 0.5 | |||||||||||||||||
| Net Income | $ | 59.4 | $ | 65.3 | $ | 44.2 | ||||||||||||||
| Income before cumulative effect of change in accounting principle | $ | 133.1 | $ | 59.4 | $ | 65.3 | ||||||||||||||
Geographic Data
We have operations in the United States and Canada. Set forth below are revenues and long lived assets attributable to these geographic areas (in millions):
| | For the Year Ended December 31, | |||||
|---|---|---|---|---|---|---|
| Revenues | ||||||
| 2003 | 2002 | |||||
| United States | $ | 10,536.8 | $ | 6,941.7 | ||
| Canada | 2,053.0 | 1,442.5 | ||||
| $ | 12,589.8 | $ | 8,384.2 | |||
For the Year Ended December 31, | ||||||
|---|---|---|---|---|---|---|
| Long-Lived Assets | ||||||
| 2003 | 2002 | |||||
| United States | $ | 1,039.8 | $ | 866.9 | ||
| Canada | 316.9 | 194.1 | ||||
| $ | 1,356.7 | $ | 1,061.0 | |||
| | For the Year Ended December 31, | ||||||||
|---|---|---|---|---|---|---|---|---|---|
| Revenues | |||||||||
| 2004 | 2003 | 2002 | |||||||
| United States (includes buy/sell revenues of $10,164.6, $5,621.6, and $3,715.5, respectively) | $ | 17,499.5 | $ | 10,536.8 | $ | 6,941.7 | |||
| Canada (includes buy/sell revenues of $1,232.2, $669.5, and $521.2, respectively) | 3,476.0 | 2,053.0 | 1,442.5 | ||||||
| $ | 20,975.5 | $ | 12,589.8 | $ | 8,384.2 | ||||
For the Year Ended December 31, | ||||||
|---|---|---|---|---|---|---|
| Long-Lived Assets | ||||||
| 2004 | 2003 | |||||
| United States | $ | 1,670.8 | $ | 1,039.8 | ||
| Canada | 379.7 | 316.9 | ||||
| $ | 2,050.5 | $ | 1,356.7 | |||
Note 16—15—Subsequent Events (Unaudited)
Link Acquisition. On April 1, 2004, we completed the acquisition of substantially all of the North American crude oil and pipeline operations of Link Energy LLC ("Link") for approximately $330 million, including $273 million of cash, the assumption of $49 million of liabilities and $8 million of transaction, closing and integration costs and other items. The Link crude oil business consists of approximately 7,000 miles of active crude oil pipeline and gathering systems, over 10 million barrels of crude oil storage capacity, a fleet of approximately 200 owned or leased trucks and approximately 2 million barrels of crude oil linefill and working inventory. The Link assets complement our assets in West Texas and along the Gulf Coast and allow us to expand our presence in the Rocky Mountain and Oklahoma/Kansas regions.Event
On February 25, 2005, we issued 575,000 common units to a subsidiary of Vulcan Energy Corporation. The acquisitionsale price for the common units was funded with cash on hand, borrowings under a new $200 million 364-day credit facility and borrowings under our existing revolving credit facilities. The new credit facility contains a twelve-month term out option, exercisable at our election, at the end of the primary term, bears interest at a rate of LIBOR plus a margin ranging from ..625% to 1.25%, depending upon our credit rating, and includes essentially the same covenants as our existing credit facilities. On April 15, we completed the private placement of 3,245,700 units of Class C Common Units for $30.81$38.13 per unit to a group of institutional investors. Totalresulting in net proceeds, from the transaction, after deducting transaction costs and including the general partner's proportionate capital contribution wereand expenses associated with the sale, of approximately $101 million and was used to reduce the balance outstanding under our existing revolving credit facilities. The partnership has committed$22.3 million. We intend to use net proceeds from future debt and equity offerings to retire or reduce the amount outstanding under the new $200 million 364-day credit facility.
On April 2, 2004, the Office of the Attorney General of Texas delivered written notice to us that it was investigating the possibility that the acquisition of Link's assets might reduce competition in one or more markets within the petroleum products industry in the State of Texas. In connection with the Link purchase, both PAA and Link completed all necessary filings required under the Hart-Scott-Rodino Act, and the required 30-day waiting period expired on March 24, 2004 without any inquiry or request for additional information from the U.S. Department of Justice or the Federal Trade Commission. Representatives from the Antitrust and Civil Medicaid Fraud Division of the Office of the Attorney General of Texas indicated their investigation was prompted by complaints received from allegedly interested industry parties regarding the potential impact on competition in the Permian Basin area of West Texas. We understand that similar complaints have been received by the Federal Trade Commission, and that, consistent with federal-state protocols for conducting joint merger investigations, appropriate federal and state antitrust authorities are coordinating their activities. We are cooperating fully with the antitrust enforcement authorities.
LINK ENERGY LLC(A LIMITED LIABILITY COMPANY)CONDENSED CONSOLIDATED STATEMENTS OF OPERATIONS(In Thousands, Except per Unit Amounts)(Unaudited)
| | Successor Company | Predecessor Company | |||||||||
|---|---|---|---|---|---|---|---|---|---|---|---|
| | Three Months ended March 31, 2004 | One Month ended March 31, 2003 | Two Months ended February 28, 2003 | ||||||||
| | | (Restated) | (Restated) | ||||||||
| Operating Revenue | $ | 40,682 | $ | 17,733 | $ | 31,635 | |||||
| Cost of Sales | 8,081 | 1,876 | 4,521 | ||||||||
| Operating Expenses | 20,725 | 6,082 | 13,020 | ||||||||
| Depreciation and Amortization-operating | 5,054 | 1,707 | 4,123 | ||||||||
| Gross Profit | 6,822 | 8,068 | 9,971 | ||||||||
| Selling, General and Administrative Expenses | 18,514 | 3,885 | 6,846 | ||||||||
| Depreciation and Amortization-corporate & other | 6 | 1 | 519 | ||||||||
| Other (Income) Expense | (710 | ) | (138 | ) | (8 | ) | |||||
| Operating Income (Loss) | (10,988 | ) | 4,320 | 2,614 | |||||||
| Interest Expense and Related Charges | (11,531 | ) | (3,301 | ) | (5,645 | ) | |||||
| Interest Income | 17 | 23 | 58 | ||||||||
| Other, net | (41 | ) | 1 | 98 | |||||||
| Income (Loss) from Continuing Operations Before Reorganization Items, Net Gain on Discharge of Debt, Fresh Start Adjustments and Cumulative Effect of Accounting Changes | (22,543 | ) | 1,043 | (2,875 | ) | ||||||
| Reorganization Items (Note 5) | — | — | (7,330 | ) | |||||||
| Net Gain on Discharge of Debt (Note 5) | — | — | 131,560 | ||||||||
| Fresh Start Adjustments (Note 6) | — | — | (56,771 | ) | |||||||
| Income (Loss) from Continuing Operations | (22,543 | ) | 1,043 | 64,584 | |||||||
| Income (Loss) from Discontinued Operations (Note 7) | 139 | (6,471 | ) | 519 | |||||||
| Net Income (Loss) Before Cumulative Effect of Accounting Changes | (22,404 | ) | (5,428 | ) | 65,103 | ||||||
| Cumulative Effect of Accounting Changes (Note 12) | — | — | (3,976 | ) | |||||||
| Net Income (Loss) | $ | (22,404 | ) | $ | (5,428 | ) | $ | 61,127 | |||
| Basic Net Income (Loss) Per Unit (Note 10) LLC Unit | $ | (1.81 | ) | $ | (0.44 | ) | N/A | ||||
| Common Unit | $ | N/A | N/A | $ | 0.14 | ||||||
| Subordinated Unit | $ | N/A | N/A | $ | — | ||||||
| Diluted Net Income (Loss) Per Unit (Note 10) | $ | (1.81 | ) | $ | (0.44 | ) | $ | 0.10 | |||
| Average Units Outstanding for Diluted Computation | 12,353 | 12,317 | 27,476 | ||||||||
The accompanying notes are an integral part of these condensed consolidated financial statements.
LINK ENERGY LLC(A LIMITED LIABILITY COMPANY)CONDENSED CONSOLIDATED BALANCE SHEETS(In Thousands)(Unaudited)
| | March 31, 2004 | December 31, 2003 | |||||||
|---|---|---|---|---|---|---|---|---|---|
| ASSETS | |||||||||
| Current Assets Cash and cash equivalents | $ | 2,929 | $ | 2,450 | |||||
| Restricted cash | 3,581 | 6,045 | |||||||
| Trade and other receivables, net of allowance for doubtful accounts of $1,210 and $1,210, respectively | 406,512 | 446,030 | |||||||
| Inventories | 7,838 | 7,636 | |||||||
| Other | 6,682 | 6,283 | |||||||
| Total current assets | 427,542 | 468,444 | |||||||
| Property, Plant and Equipment | 277,480 | 278,724 | |||||||
| Less: Accumulated depreciation | 21,114 | 16,214 | |||||||
| Net property, plant and equipment | 256,366 | 262,510 | |||||||
| Long-lived assets of discontinued operations | — | 838 | |||||||
| Other Assets | 5,907 | 6,852 | |||||||
| Total Assets | $ | 689,815 | $ | 738,644 | |||||
| LIABILITIES AND MEMBERS' CAPITAL | |||||||||
| Current Liabilities Trade and other accounts payable | $ | 431,598 | $ | 476,509 | |||||
| Accrued taxes payable | 3,964 | 6,700 | |||||||
| Term loans (Note 4) | 75,000 | 75,000 | |||||||
| Commodity repurchase agreement (Note 4) | 16,860 | 18,000 | |||||||
| Receivable financing (Note 4) | 45,500 | 27,000 | |||||||
| Other | 24,668 | 27,982 | |||||||
| Total current liabilities | 597,590 | 631,191 | |||||||
| Long-Term Liabilities Senior notes (Note 4) | 110,052 | 104,451 | |||||||
| Other | 15,607 | 17,399 | |||||||
| Total long-term liabilities | 125,659 | 121,850 | |||||||
| Commitments and Contingencies (Note 11) | |||||||||
| Members' Capital (Deficit) | |||||||||
| Members' Capital (Deficit) | (33,434 | ) | (14,392 | ) | |||||
| Accumulated Other Comprehensive Income (Loss) | — | (5 | ) | ||||||
| Total | (33,434 | ) | (14,397 | ) | |||||
| Total Liabilities and Members' Capital | $ | 689,815 | $ | 738,644 | |||||
The accompanying notes are an integral part of these condensed consolidated financial statements.
LINK ENERGY LLC(A LIMITED LIABILITY COMPANY)CONDENSED CONSOLIDATED STATEMENTS OF CASH FLOWS(In Thousands)(Unaudited)
| | Successor Three Months ended March 31, 2004 | Company One Month ended March 31, 2003 | Predecessor Company Two Months ended February 28, 2003 | ||||||||||
|---|---|---|---|---|---|---|---|---|---|---|---|---|---|
| | | (Restated) | (Restated) | ||||||||||
| CASH FLOWS FROM OPERATING ACTIVITIES | |||||||||||||
| Reconciliation of net income (loss) to net cash provided by (used in) operating activities Net income (loss) | $ | (22,404 | ) | $ | (5,428 | ) | $ | 61,127 | |||||
| Depreciation and amortization | 5,060 | 1,925 | 5,560 | ||||||||||
| Net unrealized change in crude oil trading activities | 374 | (895 | ) | (2,120 | ) | ||||||||
| Gains on disposal of assets | (730 | ) | (103 | ) | — | ||||||||
| Non-cash compensation expense | 3,361 | — | — | ||||||||||
| Non-cash net gain for reorganization items and discharge of debt | — | — | (127,185 | ) | |||||||||
| Fresh start adjustments | — | — | 56,771 | ||||||||||
| Changes in components of working capital—Receivables | 39,518 | (33,040 | ) | (32,177 | ) | ||||||||
| Inventories | (202 | ) | (5,769 | ) | 6,757 | ||||||||
| Other current assets | 551 | (3,073 | ) | 2,428 | |||||||||
| Trade accounts payable | (41,655 | ) | 33,067 | 47,845 | |||||||||
| Accrued taxes payable | (2,736 | ) | 883 | 1,717 | |||||||||
| Other current liabilities | 827 | (407 | ) | (320 | ) | ||||||||
| Other assets and liabilities | 1,231 | (1,026 | ) | 2,530 | |||||||||
| Net Cash Provided by (Used in) Operating Activities | (16,805 | ) | (13,866 | ) | 22,933 | ||||||||
| CASH FLOWS FROM INVESTING ACTIVITIES | |||||||||||||
| Proceeds from sale of property, plant and equipment | 1,614 | 103 | — | ||||||||||
| Release of restricted cash | 2,464 | — | — | ||||||||||
| Additions to property, plant and equipment | (899 | ) | (259 | ) | (285 | ) | |||||||
| Net Cash Provided by (Used in) Investing Activities | 3,179 | (156 | ) | (285 | ) | ||||||||
| CASH FLOWS FROM FINANCING ACTIVITIES | |||||||||||||
| Increase (decrease) in receivable financing | 18,500 | (10,000 | ) | — | |||||||||
| Decrease in repurchase agreement | (1,140 | ) | — | — | |||||||||
| Other | (3,255 | ) | (2,336 | ) | 1,655 | ||||||||
| Net Cash Provided By (Used in) Financing Activities | 14,105 | (12,336 | ) | 1,655 | |||||||||
| Increase (Decrease) in Cash and Cash Equivalents | 479 | (26,358 | ) | 24,303 | |||||||||
| Cash and Cash Equivalents Beginning of Period | 2,450 | 40,735 | 16,432 | ||||||||||
| Cash and Cash Equivalents End of Period | $ | 2,929 | $ | 14,377 | $ | 40,735 | |||||||
| SUPPLEMENTAL DISCLOSURE OF CASH FLOW INFORMATION | |||||||||||||
| Cash Paid for Interest | $ | 8,231 | $ | 2,084 | $ | 5,599 | |||||||
| Cash Paid for Reorganization Items | $ | — | $ | 1,637 | $ | 2,867 | |||||||
| SUPPLEMENTAL NON CASH INVESTING AND FINANCING INFORMATION | |||||||||||||
| Discharge of 11% Senior Notes, including accrued interest | $ | — | $ | — | $ | 248,481 | |||||||
| Cancellation of additional partnership interests | $ | — | $ | — | $ | 9,318 | |||||||
| Issuance of 9% Senior Notes and payment of interest in kind | $ | 5,460 | $ | — | $ | 104,000 | |||||||
| Issuance of new equity of Successor Company | $ | — | $ | — | $ | 36,687 | |||||||
The accompanying notes are an integral part of these condensed consolidated financial statements.
LINK ENERGY LLC(A LIMITED LIABILITY COMPANY)CONDENSED CONSOLIDATED STATEMENTS OF MEMBERS' CAPITAL(In Thousands)(Unaudited)
| | Members' Capital | Accumulated Other Comprehensive Income (Loss) | Total | ||||||||
|---|---|---|---|---|---|---|---|---|---|---|---|
| Members' Capital (Deficit) at December 31, 2003 | $ | (14,392 | ) | $ | (5 | ) | $ | (14,397 | ) | ||
| Net Loss | (22,404 | ) | — | (22,404 | ) | ||||||
| Unrealized net losses on derivative instruments arising during the period | — | — | — | ||||||||
| Less reclassification adjustments for net realized losses on derivative instruments included in net loss | — | 5 | 5 | ||||||||
| Comprehensive loss | (22,399 | ) | |||||||||
| Restricted unit compensation expense | 3,361 | — | 3,361 | ||||||||
| Other | 1 | — | 1 | ||||||||
| Members' Capital (Deficit) at March 31, 2004 | $ | (33,434 | ) | $ | — | $ | (33,434 | ) | |||
The accompanying notes are an integral part of these condensed consolidated financial statements.
LINK ENERGY LLC(A LIMITED LIABILITY COMPANY)NOTES TO CONDENSED CONSOLIDATED FINANCIAL STATEMENTS(UNAUDITED)
1. SALE OF CRUDE OIL BUSINESS
On April 1, 2004, Link Energy LLC ("Link LLC") sold all of its crude oil marketing, pipeline and trucking transportation business, which constitutes all of Link LLC's remaining operations, to Plains All American Pipeline, L.P. ("Plains"). As a part of such sale, we agreed to settle all outstanding litigation with Texas New Mexico Pipe Line Company, a wholly owned subsidiary of Shell Pipeline Company. The $290 million proceeds from the transaction consist of approximately $273 million in cash from Plains, plus assumption of certain obligations and approximately $17 million in cash from Texas New Mexico Pipe Line Company. Under the terms of the purchase and sale agreement, an escrow of $10 million was established to provide for post-closing adjustments related to inventory and working capital. Link LLC and Plains subsequently agreed that, subject to the satisfaction of certain conditions, there would be no post closing adjustments to inventory or working capital and Link LLC and Plains would each receive one-half of the remaining escrow balance in accordance with the terms of the purchase and sale agreement.
In conjunction with this transaction, the requisite holders of Link LLC's 9% senior notes provided the necessary consents to amend the indenture effective as of the closing of the transaction, to remove substantially all of the covenants in the indenture and to provide that Plains would not be required to assume the senior notes as otherwise required by the indenture. The holders of approximately 86% of the outstanding senior notes agreed to sell their notes to us for 100% of the principal and accrued interest at the closing of the transaction. The other holders of the senior notes have been offered the right to resell their notes on the same terms. Senior noteholders that sell their notes to us on these terms will also receive their proportionate share of up to $25 million from any funds (including funds released from the escrow) that may remain after we make provision for our outstanding liabilities, obligations and contingencies. The potential premium is in exchange for the senior noteholders' waiver and modification of certain provisions of the notes, including the right to have Plains assume the notes, and approximates the premium on the notes reflected by the estimated market value if Plains had assumed the notes.
Upon the closing of the transaction, we used the proceeds of the sale to repay and redeem approximately $249 million of long and short-term debt, which included our existing credit facilities, the majority of our 9% senior notes referenced above, and other indebtedness and accrued interest. In addition, we paid transaction expenses of approximately $4.6 million. See further discussion regarding the repayment of debt in Note 4.
As a result of the closing of the transaction, we have no further operations and will wind down over a period of time. Funds released from the escrow plus remaining funds from the transaction are being used to wind down Link LLC and make provisions for any remaining liabilities or claims, and to make the additional payments described above to redeem the remaining outstanding senior notes. See discussion regarding the offer to repurchase the remaining outstanding senior notes not tendered at the closing of the transaction in Note 4.
The following is a pro-forma summary of Link LLC's net assets on April 2, 2004 (post the closing of the Plains transaction and the repayment of debt on April 1, 2004 with the net proceeds from the Plains transaction):
| | (in millions) | |||
|---|---|---|---|---|
| Assets | ||||
| Cash and restricted cash | $ | 33 | ||
| Other current assets | 5 | |||
| Total Assets | 38 | |||
| Liabilities | ||||
| Trade and other payables | 11 | |||
| 9% Senior notes | 16 | |||
| Total Liabilities | 27 | |||
| Net Assets | $ | 11 | ||
As senior noteholders that have sold their notesprivate placement to us have the right to receive their proportionate share of up to $25 million of any remaining funds as previously discussed, there will not be any liquidating or other distributions to the holders of Link LLC's units.
A Special Committee of the Board of Directors of Link LLC reviewed the transaction with its financial advisor, Petrie Parkman & Company, which rendered an opinion that the Plains transaction, as summarized in its opinion, was fair from a financial point of view.
2. BASIS OF PRESENTATION
Organization
Effective October 1, 2003, EOTT Energy, LLC ("EOTT LLC") changed its name to Link Energy LLC ("Link LLC"). Link LLC is a Delaware limited liability company that was formed on November 14, 2002 to assume and continue the business formerly directly owned by EOTT Energy Partners, L.P. (the "MLP"). The MLP emerged from bankruptcy and merged into EOTT Energy Operating Limited Partnership resulting in EOTT LLC becoming the successor registrant to the MLP on March 1, 2003, the effective date of the Third Amended Joint Chapter 11 Plan of Reorganization, as supplemented ("Restructuring Plan"). We operated principally through four affiliated operating limited partnerships, Link Energy Limited Partnership, Link Energy Canada Limited Partnership, Link Energy Pipeline Limited Partnership, and EOTT Energy Liquids, L.P. (see Note 7 for information regarding the disposition of our Liquids operations), each of which is a Delaware limited partnership. Link Energy General Partner, LLC served as the general partner for our four affiliated operating limited partnerships. Until the MLP emerged from bankruptcy, EOTT Energy Corp. (the "General Partner"), a Delaware corporation and a wholly owned subsidiary of Enron Corp. ("Enron"), served as the general partner of the MLP and owned an approximate 1.98% general partner interest in the MLP. Unless the context otherwise requires, the terms "we," "our," "us," and "Link" refer to Link Energy
LLC and its four affiliated operating limited partnerships, Link Energy Finance Corp., and Link Energy General Partner, LLC (the "Subsidiary Entities"), and for periods prior to our emergence from bankruptcy in March 2003, such terms and "EOTT" refer to EOTT Energy Partners, L.P. and its sole general partner, EOTT Energy Corp., as well as the Subsidiary Entities.
Interim Financial Statements
The financial statements presented herein have been prepared by Link LLC in accordance with generally accepted accounting principles in the United States and the rules and regulations of the Securities and Exchange Commission. The financial statements presented herein have been prepared on a going concern basis as the sale of substantially all of our assets to Plains and the winding down of Link LLC occurred subsequent to the period ended March 31, 2004. Interim results are not necessarily indicative of results for a full year. The financial information included herein has been prepared without audit. The condensed consolidated balance sheet at December 31, 2003 has been derived from, but does not include all the disclosures contained in, the audited financial statements for the year ended December 31, 2003. In the opinion of management, all of these unaudited statements include all adjustments and accruals consisting only of normal recurring adjustments, except for those relating to fresh start reporting and those more fully discussed in Notes 5 and 6, which are necessary for a fair presentation of the results of the interim periods reported herein. These condensed consolidated financial statements should be read in conjunction with the consolidated financial statements and accompanying notes included in our Annual Report on Form 10-K as amended on June 16, 2004 for the year ended December 31, 2003.
Fresh Start Reporting
As a result of the application of fresh start reporting under the American Institute of Certified Public Accountants Statement of Position No. 90-7 ("SOP 90-7"), "Financial Reporting by Entities in Reorganization Under the Bankruptcy Code," as of February 28, 2003 (the date chosen for accounting purposes), Link LLC's financial results for the one month ended March 31, 2003, and the two months ended February 28, 2003 include two different bases of accounting and accordingly, the financial condition, operating results and cash flows of the Successor Company and the Predecessor Company have been separately disclosed. For a further discussion of fresh start reporting, see Note 6. For purposes of these financial statements, references to the "Predecessor Company" are references to us for periods through February 28, 2003 (the last day of the calendar month in which we emerged from bankruptcy) and references to the "Successor Company" are references to Link LLC for periods subsequent to February 28, 2003. The Successor Company's financial statements are not comparable to the Predecessor Company's financial statements. See further discussion in Note 6.
Partnership Status
As a limited liability company, we are generally treated like a partnership for federal income tax purposes and like a corporation with limited liability for state law and other non-tax purposes. In other words, for federal income tax purposes, we do not pay tax on our income or gain, nor are we entitled to a deduction for our losses, but such gains or losses are allocated to each member in accordance with
the member's interest in us and the member will be responsible for paying the income tax applicable to such membership interest. In order for us to continue to be classified as a partnership for federal income tax purposes, at least 90% of our gross income for every taxable year must consist of "qualifying income" within the meaning of the Internal Revenue Code. In 2002 and 2003, we recognized income from our settlement with Enron and discharge of indebtedness in excess of 10% of our gross income for each of those years.
We were trying to raise additional equity and we believed that we might not be able to access the capital markets without a higher degree of certainty as to our classification for federal income tax purposes. Therefore, in January 2004, we requested a private letter ruling from the Internal Revenue Service to determine either that the income from our settlement with Enron and the debt discharge income is qualifying income or that the recognition of such income should be disregarded for purposes of the qualifying income test because it was an inadvertent result of our bankruptcy. Due to the fact that the Company is no longer trying to raise equity, we retracted the private letter ruling request from the Internal Revenue Service in April 2004.
Reclassifications
Certain reclassifications have been made to prior period amounts to conform with the current period presentation.
3. RESTATEMENT OF FINANCIAL RESULTS.
As reported in our Amendment No. 1 to our Form 10-K for the year ended December 31, 2003, we have restated our prior year financial results to reflect inventory and accounts payable reconciliation adjustments in prior periods. The restatement resulted in a decrease in our net loss for the one month ended March 31, 2003 of $1.2 million and an increase in our net income for the two months ended February 28, 2003 of $0.9 million.
A summary of the effects of the restatement on reported amounts for the one month ended March 31, 2003 and the two months ended February 28, 2003 are presented below. (Amounts in thousands, except per share amounts.)
| | Successor Company One Month ended March 31, 2003 | Predecessor Company Two Months ended February 28, 2003 | |||||
|---|---|---|---|---|---|---|---|
| REVENUE | |||||||
| As Reported | $ | 17,315 | $ | 31,979 | |||
| As Restated | 17,733 | 31,635 | |||||
| GROSS PROFIT | |||||||
| As Reported | 8,077 | 9,681 | |||||
| As Restated | 8,068 | 9,971 | |||||
| OPERATING INCOME | |||||||
| As Reported | 4,329 | 2,324 | |||||
| As Restated | 4,320 | 2,614 | |||||
| NET INCOME (LOSS) | |||||||
| As Reported | (6,650 | ) | 60,267 | ||||
| As Restated | (5,428 | ) | 61,127 | ||||
| DILUTED EARNINGS (LOSS) PER UNIT | |||||||
| As Reported | (0.54 | ) | 0.08 | ||||
| As Restated | (0.44 | ) | 0.10 | ||||
4. CREDIT RESOURCES
Summary of Exit Credit Facilities, Senior Notes, and Other Debt
The tables below provide a summary of our financing arrangements as of March 31, 2004 (in millions).
| | Commitment/ Face Amount | Amount Outstanding | ||||||
|---|---|---|---|---|---|---|---|---|
| Exit Credit Facilities: | ||||||||
| Letter of Credit Facility | $ | 260.0 | $ | 235.9 | ||||
| Trade Receivables Agreement | 100.0 | 45.5 | ||||||
| Commodity Repurchase Agreement | 16.9 | 16.9 | ||||||
| Term Loans | 75.0 | 75.0 | ||||||
| Senior Notes | 114.7 | 110.0 | (1) | |||||
| Other Debt: | ||||||||
| Enron Note | 5.7 | 6.3 | (1) | |||||
| Big Warrior Note | 2.4 | 2.2 | (1) | |||||
| Ad Valorem Tax Liability | 4.5 | 4.5 | ||||||
On April 1, 2004, we utilized net proceeds from the sale of the crude oil business to Plains to repay the following debt outstanding and related accrued interest at March 31, 2004 (in millions):
| Trade Receivables Agreement | $ | 45.5 | ||
| Commodity Repurchase Agreement | 16.9 | |||
| Term Loans | 75.0 | |||
| Senior Notes | 99.0 | |||
| Enron Note | 5.7 | |||
| Big Warrior Note | 2.4 | |||
| Total principal | 244.5 | |||
| Interest | 4.6 | |||
| Total principal and interest paid | $ | 249.1 | ||
The outstanding letters of credit and the ad valorem liability were assumed by Plains in connection with the sale of the crude oil business.
Subsequent to the sale of the crude oil business, we offered to repurchase the remaining senior notes not redeemed on April 1 (approximately $15.7 million) for 101% of the principal amount plus any accrued and unpaid interest thereon to the payment date. As of June 14, 2004, we have only $0.1 million of senior notes outstanding.
5. BANKRUPTCY PROCEEDINGS AND RESTRUCTURING PLAN
On October 8, 2002, the MLP and the Subsidiary Entities filed pre-negotiated voluntary petitions for reorganization under Chapter 11 of the United States Bankruptcy Code (the "EOTT Bankruptcy"). The filing was made in the United States Bankruptcy Court for the Southern District of Texas, Corpus Christi Division (the "EOTT Bankruptcy Court"). Additionally, the General Partner filed a voluntary petition for reorganization under Chapter 11 on October 21, 2002 in the EOTT Bankruptcy Court in order to join in the voluntary, pre-negotiated Restructuring Plan. On October 24, 2002, the EOTT Bankruptcy Court administratively consolidated, for distribution purposes, the General Partner's bankruptcy filing with the previously filed cases. The EOTT Bankruptcy Court confirmed our Restructuring Plan on February 18, 2003, and it became effective March 1, 2003. We filed a motion closing the bankruptcy case on April 14, 2004, and the order closing the case was entered on June 2, 2004.
The following reorganization items and net gain on discharge of debt, which were specifically related to the EOTT Bankruptcy, were recorded during the two months ended February 28, 2003, (in thousands):
| Reorganization items—legal and professional fees | $ | (7,330 | ) | |
| Net gain on discharge of 11% senior notes, related accrued interest and other debt(1) | $ | 131,560 |
6. FRESH START REPORTING
As previously discussed, our Consolidated Financial Statements reflect the adoption of fresh start reporting required by SOP 90-7 for periods subsequent to our emergence from bankruptcy. In accordance with the principles of fresh start reporting, we have adjusted our assets and liabilities to their fair values as of February 28, 2003. The net effect of the fresh start reporting adjustments was a loss of $56.8 million, which is reflected in the results of operations of the Predecessor Company for the two months ended February 28, 2003.
The effects of the reorganization pursuant to the Restructuring Plan and the application of fresh start reporting on the Predecessor Company's consolidated balance sheet as of February 28, 2003 are as follows (in thousands):
| | Predecessor Company February 28, 2003 | Debt Discharge and Reclass Adjustments | Fresh Start Adjustments | Successor Company February 28, 2003 | |||||||||
|---|---|---|---|---|---|---|---|---|---|---|---|---|---|
| | (Restated) | | | (Restated) | |||||||||
| Assets | |||||||||||||
| Current Assets | |||||||||||||
| Cash and cash equivalents | $ | 40,735 | $ | — | $ | — | $ | 40,735 | |||||
| Trade and other receivables | 439,361 | — | — | 439,361 | |||||||||
| Inventories | 25,525 | — | 750(g | ) | 26,275 | ||||||||
| Other | 12,911 | — | (2,021 | )(h) | 10,890 | ||||||||
| Total current assets | 518,532 | — | (1,271 | ) | 517,261 | ||||||||
| Property, Plant and Equipment, at cost | 598,633 | — | (267,654 | )(i) | 330,979 | ||||||||
| Less: Accumulated depreciation | 223,188 | — | (223,188 | )(i) | — | ||||||||
| Net property, plant and equipment | 375,445 | — | (44,466 | ) | 330,979 | ||||||||
| Goodwill | 7,436 | — | (7,436 | )(j) | — | ||||||||
| Other Assets | 10,762 | — | (2,880 | )(h) | 7,882 | ||||||||
| Total Assets | $ | 912,175 | $ | — | $ | (56,053 | ) | $ | 856,122 | ||||
| Liabilities and Members'/Partners' Capital | |||||||||||||
| Current Liabilities | |||||||||||||
| Trade and other accounts payable | $ | 451,873 | $ | 17,406 | (a) | $ | — | $ | 469,279 | ||||
| Accrued taxes payable | 13,045 | (8,307 | )(b) | — | 4,738 | ||||||||
| Term loans | 75,000 | (75,000 | )(c) | — | — | ||||||||
| Repurchase agreement | 75,000 | (75,000 | )(c) | — | — | ||||||||
| Receivable financing | 50,000 | — | — | 50,000 | |||||||||
| Other | 19,226 | 2,815 | (a)(b) | 318 | (k) | 22,359 | |||||||
| Total current liabilities | 684,144 | (138,086 | ) | 318 | 546,376 | ||||||||
| Long-Term Liabilities | |||||||||||||
| 9% Senior Notes | — | 98,800 | (d) | — | 98,800 | ||||||||
| Term loans | — | 75,000 | (c) | — | 75,000 | ||||||||
| Repurchase agreement | — | 75,000 | (c) | — | 75,000 | ||||||||
| Ad valorem tax liability | — | 6,992 | (b) | — | 6,992 | ||||||||
| Other | 17,781 | — | 400 | (k) | 18,181 | ||||||||
| Total long-term liabilities | 17,781 | 255,792 | 400 | 273,973 | |||||||||
| Liabilities Subject to Compromise | 284,843 | (284,843 | )(a) | — | — | ||||||||
| Additional Partnership Interests | 9,318 | (9,318 | )(e) | — | — | ||||||||
| Members'/Partners' Capital (Deficit) | (83,911 | ) | 176,455 | (f) | (56,771 | ) | 35,773 | ||||||
| Total Liabilities and Members'/Partners' Capital | $ | 912,175 | $ | — | $ | (56,053 | ) | $ | 856,122 | ||||
Notes:
7. DISCONTINUED OPERATIONS
West Coast Assets
Effective October 1, 2003, we sold all of the assets comprising our natural gas gathering, processing, natural gas liquids fractionation, storage and related trucking and distribution facilities located on the West Coast.
Revenues and results of operations for the West Coast operating segment for the three months ended March 31, 2004, the one month ended March 31, 2003 and the two months ended February 28,
2003, are shown below (in thousands). We did not allocate any interest expense to the West Coast discontinued operations for any of the periods presented below.
| | Successor Company | Predecessor Company | |||||||
|---|---|---|---|---|---|---|---|---|---|
| | Three Months ended March 31, 2004 | One Month ended March 31, 2003 | Two Months ended February 28, 2003 | ||||||
| Revenues | $ | — | $ | 2,934 | $ | 5,571 | |||
| Income (loss) from discontinued operations | $ | — | $ | 248 | $ | 395 | |||
Liquids Operations
Effective December 31, 2003, we sold all of our remaining natural gas liquids assets for approximately $20 million, plus inventory value. The assets included our underground salt dome storage facility and related pipeline grid near Mont Belvieu, Texas as well as our processing facility and former methyl tertiary butyl ether ("MTBE") plant at Morgan's Point, near La Porte, Texas.
Revenues and results of operations for the Liquids Operations for the three months ended March 31, 2004, the one month ended March 31, 2003 and the two months ended February 28, 2003 are shown below (in thousands). We did not allocate any interest expense to the Liquids discontinued operations for any periods presented below.
| | Successor Company | Predecessor Company | |||||||
|---|---|---|---|---|---|---|---|---|---|
| | Three Months ended March 31, 2004 | One Month ended March 31, 2003 | Two Months ended February 28, 2003 | ||||||
| | | (Restated) | (Restated) | ||||||
| Revenues | $ | — | $ | 8,525 | $ | 40,337 | |||
| Income (loss) from discontinued operations | $ | 139 | $ | (6,719 | ) | $ | 124 | ||
8. INVENTORY
In connection with the sale of the crude oil business to Plains on April 1, 2004, Link LLC personnel, accompanied by Plains representatives, completed a comprehensive physical measurement of all crude oil volumes held by Link LLC in its pipelines and storage tanks. The measurement process was completed as of March 31, 2004. The results of the measurement process identified approximately 70,000 barrels of crude oil tank bottoms that were previously classified as merchantable crude oil inventory. Storage tank bottoms include sediment, water or non-merchantable paraffin that accumulate at the bottom of the tank. A charge of $2.1 million was recorded to cost of sales in the three months ended March 31, 2004 to reflect the write-down of our inventory.
9. CAPITAL
The following is a rollforward of LLC units and warrants outstanding:
| | LLC Units | Warrants | ||||
|---|---|---|---|---|---|---|
| Outstanding at December 31, 2003 | 13,182,889 | 922,432 | ||||
| Exercise of warrants | 26 | (26 | ) | |||
| Change in restricted units outstanding | 25,000 | — | ||||
| Outstanding at March 31, 2004 | 13,207,915 | 922,406 | ||||
Under the Link LLC Equity Incentive Plan ("Incentive Plan") adopted in June 2003, 1.2 million restricted units were authorized to be issued to certain key employees and directors. The Incentive Plan had a ten-year term and restricted unit awards granted thereunder typically vested over a three-year period. We have recorded non-cash compensation expense of $3.5 million related to the Incentive Plan for the three months ended March 31, 2004. The following table sets forth the Incentive Plan activity for the three months ended March 31, 2004:
In March 2004, the Company agreed to repurchase 105,000 restricted units for $4,000. As a result, we accelerated the recognition of non-cash compensation expense of approximately $1.0 million, which is included in the $3.5 million of total non-cash compensation expense discussed above.
In connection with the sale of our crude oil business to Plains on April 1, 2004, officers and certain key employees signed a settlement and release agreement in connection with consideration received under change in control agreements. The settlement and release agreement required, among other things, the relinquishment of the remaining 750,000 restricted units.
10. EARNINGS PER UNIT
Basic earnings per unit include the weighted average impact of outstanding units (i.e., it excludes unit equivalents). Diluted earnings per unit consider the impact of all potentially dilutive securities.
Successor Company
Basic and diluted net loss per unit for the Successor Company were $1.81 for the three months ended March 31, 2004 and $0.44 per unit (as restated) for the one month ended March 31, 2003. Outstanding warrants and restricted units were determined to be antidilutive and are not included in the computation of fully diluted earnings per unit. For the three months ended March 31, 2004, basic and diluted net loss per unit from continuing operations were $1.82 and basic and diluted net income
per unit for discontinued operations were $0.01. For the one month ended March 31, 2003, basic and diluted net income per unit from continuing operations were $0.08 and basic and diluted net loss per unit from discontinued operations were $0.52.
Predecessor Company
Total and per unit information related to income (loss) from continuing operations, discontinued operations, the cumulative effect of an accounting change and net income (loss) for the Predecessor Company is shown in the table below. All amounts exclude amounts allocated to the General Partner (in thousands, except per unit amounts):
| | Two Months ended February 28, 2003 (Restated) | |||||||||||||||||
|---|---|---|---|---|---|---|---|---|---|---|---|---|---|---|---|---|---|---|
| | Basic(1) | | | |||||||||||||||
| | Common | Subordinated | Diluted | |||||||||||||||
| | Income (Loss) | Per Unit | Income Loss | Per Unit | Income (Loss) | Per Unit | ||||||||||||
| Income (Loss) from Continuing Operations | $ | 2,133 | $ | 0.11 | $ | — | $ | — | $ | 2,133 | $ | 0.08 | ||||||
| Income (Loss) from Discontinued Operations(2) | 519 | 0.03 | — | — | 519 | 0.02 | ||||||||||||
| Cumulative Effect of Accounting Changes(3) | — | — | — | — | — | — | ||||||||||||
| Net Income (Loss) | $ | 2,652 | $ | 0.14 | $ | — | $ | — | $ | 2,652 | $ | 0.10 | ||||||
| Weighted Average Units Outstanding | 18,476 | 9,000 | 27,476 | |||||||||||||||
11. COMMITMENTS AND CONTINGENCIES
Litigation. We are, in the ordinary course of business, a defendant in various lawsuits, some of which are covered in whole or in part by insurance. We believe that the ultimate resolution of litigation, individually and in the aggregate, will not have a materially adverse impact on our financial position or results of operations. Prior to and since the commencement of our bankruptcy proceedings, various legal actions arose in the ordinary course of business, of which the significant actions are discussed below.
John H. Roam, et al. vs. Texas-New Mexico Pipe Line Company and EOTT Energy Pipeline Limited Partnership, Cause No. CV43296, In the District Court of Midland County, Texas, 238th Judicial District (Kniffen Estates Suit). The Kniffen Estates Suit was filed on March 2, 2001, by certain residents of the Kniffen Estates, a residential subdivision located outside of Midland, Texas. The allegations in the petition state that free crude oil products were discovered in water wells in the Kniffen Estates area, on or about October 3, 2000. The plaintiffs claim that the crude oil products are from a 1992 release from a pipeline then owned by the Texas-New Mexico Pipe Line Company ("Tex-New Mex"). We purchased that pipeline from Tex-New Mex in 1999. With respect to us, the plaintiffs were seeking damages arising from any contamination of the soil or groundwater since we acquired the pipeline in question. No specific amount of money damages was claimed in the Kniffen Estates Suit, but the plaintiffs did file proofs of claim in our bankruptcy proceeding totaling $62 million. In response to the Kniffen Estates Suit, we filed a cross-claim against Tex-New Mex. In the cross-claim, we claimed that, in relation to the matters alleged by the plaintiffs, Tex-New Mex breached the Purchase and Sale Agreement between the parties dated May 1, 1999, by failing to disclose the 1992 release and by failing to undertake the defense and handling of the toxic tort claims, fair market value claims, and remediation claims arising from the release. On April 5, 2002, we filed an amended cross-claim which alleged that Tex-New Mex defrauded us as part of Tex-New Mex's sale of the pipeline systems to us in 1999. The amended cross-claim also alleged that various practices employed by Tex-New Mex in the operation of its pipelines constituted gross negligence and willful misconduct and voided our obligation to indemnify Tex-New Mex for remediation of releases that occurred prior to May 1, 1999. In the Purchase and Sale Agreement, we agreed to indemnify Tex-New Mex only for certain remediation obligations that arose before May 1, 1999, unless these obligations were the result of the gross negligence or willful misconduct of Tex-New Mex prior to May 1, 1999. EOTT Energy Pipeline Limited Partnership ("PLP") and the plaintiffs agreed to a settlement during our bankruptcy proceedings. The settlement provides for the plaintiffs' release of their claims filed against PLP in this proceeding and in the bankruptcy proceedings, in exchange for an allowed general unsecured claim in our bankruptcy of $3,252,800 (as described above, the plaintiffs filed proofs of claim in our bankruptcy proceedings totaling $62 million). The allowed general unsecured claim was accrued at December 31, 2002. On April 1, 2003, we filed a second amended cross-claim in this matter. In addition to the claims filed in the previous cross-claims, we requested (i) injunctive relief for Tex-New Mex's refusal to honor its indemnity obligations; (ii) injunctive relief requiring Tex-New Mex to identify, investigate and remediate sites where the conduct alleged in our cross-claim occurred; and (iii) restitution damages of over $125,000,000. At a hearing on April 11, 2003, the court severed into a separate action EOTT's cross-claims against Tex-New Mex that extend beyond the crude oil release and groundwater contamination in the Kniffen Estates subdivision ("EOTT's Over-Arching Claim"). Developments in EOTT's Over-Arching Claim are described immediately below. The trial of EOTT's Kniffen Claims commenced on June 16, 2003, and the jury returned its verdict on July 2, 2003. The jury found that Tex-New Mex's gross negligence and willful misconduct caused the contamination in the Kniffen Estates. The jury also found that Tex-New Mex committed fraud against us with respect to the Kniffen Estates site. On November 28, 2003, the court the final judgment which provides for the award to us of (i) actual damages in the amount of $7,701,938, (ii) attorney's fees in the amount of $1,400,000, (iii) prejudgment interest in the amount of $1,044,509 and (iv) punitive damages in the amount of $18,203,876. The final judgment also contains a finding that Tex-New Mex is obligated to indemnify us for future remediation
costs incurred at the Kniffen Estates site. On March 31, 2004, we entered into a settlement agreement with Tex-New Mex that resolves this lawsuit, EOTT's Over-Arching Claim, and the litigation with Jimmie T. Cooper and Betty P. Cooper that is described below. Pursuant to the terms of the settlement, we received cash payments totaling $25 million ($17 million from Tex-New Mex and the remainder as part of the proceeds received in the Plains transaction) on April 1, 2004, and all claims in this litigation were released. In addition, the settlement provided for the termination of all environmental indemnity obligations under the agreements governing Tex-New Mex's sale of its pipeline system to us. In accordance with the terms of the settlement, the amended judgment was vacated and this lawsuit was dismissed on April 15, 2004.
EOTT Energy Operating Limited Partnership vs. Texas-New Mexico Pipeline Company, Cause No. CV-44, 099, In the District Court of Midland County, Texas, 238th Judicial District ("EOTT's Over-Arching Claim"). As described above, the claims in this lawsuit were severed from EOTT's Kniffen Claims on April 11, 2003. In this lawsuit, we alleged that various practices employed by Tex-New Mex in the operation of its pipelines and handling of spills constitute gross negligence and willful misconduct, thus triggering Tex-New Mex's obligation to indemnify us for remediation of releases where such practices ("Non-Remediation Practices") were employed. In addition to damages, we were seeking (a) injunctive relief requiring Tex-New Mex to honor its indemnity obligations under the Purchase and Sale Agreement and (b) injunctive relief requiring Tex-New Mex to identify, investigate, and remediate sites where Tex-New Mex employed the Non-Remediation Practices. Discovery opened in EOTT's Over-Arching Claim on December 1, 2003. On March 3, 2004, we amended our petition to specifically list more than 200 contamination sites where Tex-New Mex employed the Non-Remediation Practices. The March 31, 2004 settlement agreement that provided for the resolution of the Kniffen Estates Suit also provided for the release of all claims in EOTT's Over-Arching Claim. In accordance with the terms of that settlement agreement, EOTT's Over-Arching Claim was dismissed with prejudice on April 20, 2004.
Bankruptcy Issues related to Claims Made by Texas-New Mexico Pipeline Company and its affiliates. Tex-New Mex, Shell Oil Company ("Shell") and Equilon filed proofs of claim in our bankruptcy, each filing similar claims in the amount of $112 million. In July of 2003, we entered into an agreement with Shell, Tex-New Mex and Equilon whereby all of their claims were either withdrawn, estimated or allowed, leaving the value of the claims estimated for distribution purposes at $56,924.52. In connection with the settlement of the Kniffen Estates Suit and the Over-Arching Claim, we have resolved all of our outstanding bankruptcy claims with Shell and its related entities.
Jimmie T. Cooper and Betty P. Cooper vs. Texas-New Mexico Pipeline Company, Inc., EOTT Energy Pipeline Limited Partnership, and EOTT Energy Corp., Case No. CIV-03-0035 JB/LAM, In the United States District Court for the District of New Mexico. This lawsuit was filed on October 1, 2002. The plaintiffs in this lawsuit are surface interest owners of certain property located in Lea County, New Mexico. The plaintiffs alleged that aquifers underlying their property and water wells located on their property were contaminated as a result of spills and leaks from a pipeline running across their property that is or was owned by Tex-New Mex and us. The plaintiffs sought payment of costs that would be incurred in investigating and remediating the alleged crude oil releases and replacing water supplies from aquifers that have allegedly been contaminated and damages in an unspecified amount arising
from the plaintiffs' alleged fear of exposure to carcinogens and the alleged interference with the plaintiffs' quiet enjoyment of their property. The plaintiffs are also seeking an unspecified amount of punitive damages. EOTT and the plaintiffs agreed to the terms of a settlement, whereby the plaintiffs agreed to release their claims against us and received an allowed general unsecured claim in our bankruptcy in the amount of $1,027,000. The allowed general unsecured claim was accrued at December 31, 2002. On October 21, 2003, the plaintiffs filed a motion seeking our dismissal from this lawsuit. Tex-New Mex opposed this motion, and on October 31, 2003, Tex-New Mex filed a motion for leave to file a cross-claim against us. In the proposed cross-claim, Tex-New Mex is seeking a declaratory judgment finding that we are contractually obligated to indemnify Tex-New Mex for all costs Tex-New Mex has incurred or will incur related to the defense of the plaintiffs' claims in this lawsuit. The proposed cross-claim also alleges that we failed to assume Tex-New Mex's defense of this lawsuit and failed to indemnify Tex-New Mex for the expenses Tex-New Mex has incurred in this lawsuit, and that such actions by us constitute a breach of the Purchase and Sale Agreement governing Tex-New Mex's sale of the subject pipeline to us. The March 31, 2004 settlement agreement that provided for the resolution of the Kniffen Estates Suit also provided for the release of Tex-New Mex's claims against us in this lawsuit. In accordance with the terms of that settlement agreement, this lawsuit was dismissed with prejudice on April 20, 2004.
In re EOTT Energy Partners, L.P., Case No. 02-21730, EOTT Energy Finance Corp., Case No. 02-21731, EOTT Energy General Partner, L.L.C., Case No. 02-21732, EOTT Energy Operating Limited Partnership, Case No. 02-21733, EOTT Energy Canada Limited Partnership, Case No. 02-21734, EOTT Energy Liquids, L.P., Case No. 02-21736, EOTT Energy Corp., Case No. 02-21788, Debtors (Jointly Administered under Case No. 02-21730), In the United States Bankruptcy Court for the Southern District of Texas, Corpus Christi Division. On October 8, 2002, we and all of our subsidiaries filed voluntary petitions for relief under Chapter 11 of the United States Bankruptcy Code in the United States Bankruptcy Court for the Southern District of Texas (the "EOTT Bankruptcy Court") to facilitate reorganization of our business and financial affairs for the benefit of us, our creditors and other interested parties. Additionally, the General Partner filed its voluntary petition for reorganization under Chapter 11 on October 21, 2002 in the EOTT Bankruptcy Court. Our Restructuring Plan was confirmed on February 18, 2003 and became effective on March 1, 2003. Shell and Tex-New Mex filed a notice of appeal to our plan confirmation on February 24, 2003. A hearing on the appeal was held in the District Court on August 19, 2003, where the judge ruled the appeal was moot. The ruling became final on October 24, 2003. We filed a motion closing the bankruptcy case on April 14, 2004, and the order closing the case was entered on June 2, 2004.
Blackmore Partners, L.P. v. Link Energy, LLC, J. Robert Chambers, Julie H. Edwards, Thomas M. Matthews, Robert E. Ogle, James M. Tidwell, S. Wil VanLoh, Jr., and Daniel J. Zaloudek, Case No. 454-N, In the Court of Chancery of the State of Delaware in and for New Castle County, for the alleged breach of fiduciary duties to certain unitholders in connection with the anticipated distribution of proceeds resulting from the sale of substantially all of the Company's operating assets to Plain Marketing, L.P., Plains Pipeline, L.P. and Plains All American Pipeline, L.P. effective April 1, 2004 (the "Transaction"). The suit was brought by a unitholder who claims that the Company and its directors in place at the time of the Transaction favored the interests of unitholders who were also the holders of the Company's 9% Senior Notes (the "Notes") to the detriment of plaintiff and the other members of
the class as defined by plaintiff (i.e., unitholders who do not also ownfund a portion of our 2005 expansion capital program. Pending the Notes). The plaintiff maintains that the Company's liquidation plan is inequitable and discriminatory since it allegedly provides a $25 million supplemental payment to the unitholders who also own the Notes. Based on management's current knowledge, we believe the allegations are without merit. We can provide no assurances regarding the outcomeincurrence of this lawsuit, but will continue to gather and analyze new information as it becomes available.
EPA's Section 308 Request. In July 2001, Enron received a request for information from the EPA under Section 308 of the CWA, requesting information regarding certain spills and releases from oil pipelines owned or operated by Enron and its affiliated companies for the time period July 1, 1998 to July 11, 2001. Enron responded in January of 2002 to the EPA's Section 308 request in its capacity as the operator of the pipelines actually owned by us and on our behalf. Under the terms of the Enron Settlement Agreement dated October 8, 2002, we would be required to indemnify EOTT Energy Corp., as the prior general partner, and its affiliates including Enron Pipeline Services Company, with regard to any environmental remediation, except for claims of gross negligence and willful misconduct. While we cannot predict the outcome of the EPA's Section 308 request, the EPA could seek to impose liability for environmental cleanup on us with respect to the matters being reviewed. The outcome of the EPA's Section 308 request is not yet known, and we are unaware of any potential liability.
Environmental. Prior to the sale of all of our assets, we were subject to extensive federal, state and local laws and regulations covering the discharge of materials into the environment, or otherwise relating to the protection of the environment, and which requiresuch expenditures, for remediation at various operating facilities and waste disposal sites, as well as expenditures in connection with the construction of new facilities. At the federal level, such laws include, among others, the Clean Air Act, the Clean Water Act, the Oil Pollution Act, the Resource Conservation and Recovery Act, the Comprehensive Environmental Response, Compensation and Liability Act, and the National Environmental Policy Act, as each may be amended from time to time. Failure to comply with these laws and regulations may result in the assessment of administrative, civil, and criminal penalties or the imposition of injunctive relief.
Prior to the sale of our Liquids Operations discussed further in Note 7, we produced MTBE at our Morgan's Point Facility. MTBE is used as an additive in gasoline. Due to health concerns around MTBE, there have been lawsuits filed against companies involved in the production of MTBE. We have not been named in any such actions, nor do we anticipate being included in any such actions. However, we can provide no assurances that we may not be included in such actions due to our past production of MTBE.
We have incurred spill clean up and remediation costs associated with the assets acquired from Tex-New Mex as well as in connection with other properties we own in various locations throughout the United States. We have insurance covering clean up and remediation costs that may be incurred in connection with properties not acquired from Tex-New Mex. However, no assurance can be given that the insurance will be adequate to cover any such cleanup and remediation costs.
The following are summaries of environmental remediation expense, estimated environmental liabilities, and amounts receivable under insurance policies for the indicated periods (in thousands):
| | Successor Company | Predecessor Company | ||||||||
|---|---|---|---|---|---|---|---|---|---|---|
| | Three Months ended March 31, 2004 | One Month ended March 31, 2003 | Two Months ended February 28, 2003 | |||||||
| Remediation expense | $ | 1,407 | $ | 926 | $ | 1,979 | ||||
| Estimated insurance recoveries | (361 | ) | — | (79 | ) | |||||
| Net remediation expense | $ | 1,046 | $ | 926 | $ | 1,900 | ||||
| | Successor Company | Predecessor Company | ||||||||
|---|---|---|---|---|---|---|---|---|---|---|
| | Three Months ended March 31, 2004 | One Month ended March 31, 2003 | Two Months ended February 28, 2003 | |||||||
| Environmental liability at beginning of period | $ | 12,216 | $ | 13,440 | $ | 13,440 | ||||
| Remediation expense | 1,407 | 926 | 1,979 | |||||||
| Cash expenditures | (2,400 | ) | (1,176 | ) | (1,979 | ) | ||||
| Environmental liability at end of period | $ | 11,223 | $ | 13,190 | $ | 13,440 | ||||
| | Successor Company | Predecessor Company | ||||||||
|---|---|---|---|---|---|---|---|---|---|---|
| | Three Months ended March 31, 2004 | One Month ended March 31, 2003 | Two Months ended February 28, 2003 | |||||||
| Environmental insurance receivable at beginning of period | $ | 3,089 | $ | 8,837 | $ | 8,803 | ||||
| Estimated recoveries | 361 | — | 79 | |||||||
| Cash receipts | — | (1,780 | ) | (45 | ) | |||||
| Environmental insurance receivable at end of period | $ | 3,450 | $ | 7,057 | $ | 8,837 | ||||
The environmental liability was classified in Other Current ($6.7 million) and Other Long-Term Liabilities ($4.5 million) and the insurance receivable was classified in Trade and Other Receivables ($3.0 million) and Other Assets ($0.4 million) at March 31, 2004.
12. NEW ACCOUNTING STANDARDS
Accounting Standards Adopted—First Quarter 2004
In December 2003, the FASB issued FASB Interpretation No. 46 (revised December 2003), "Consolidation of Variable Interest Entities—an Interpretation of ARB No.51" ("FIN 46R"). FIN 46R replaces FIN 46 which we implemented effective with the adoption of fresh start reporting on March 1, 2003. FIN 46R is required to be implemented by the end of the first reporting period beginning after
December 15, 2003. We adopted FIN 46R effective January 1, 2004. Adoption of FIN 46R had no impact on our financial statements.
Accounting Standards Previously Adopted—Cumulative Effect of Accounting Changes
In June 2001, the FASB issued SFAS No. 143, "Accounting for Asset Retirement Obligations." This statement required entities to record the fair value of a liability for legal obligations associated with the retirement obligations of tangible long-lived assets in the period in which it is incurred. When the liability is initially recorded, a corresponding increase in the carrying value of the related long-lived asset would be recorded. Over time, accretion of the liability is recognized each period, and the capitalized cost is depreciated over the useful life of the related asset. Upon settlement of the liability, an entity either settles the obligation for its recorded amount or incurs a gain or loss on settlement. We adopted the accounting principle required by the new statement effective January 1, 2003. As a result of the adoption of SFAS 143 on January 1, 2003, we recorded a liability of $1.7 million, property, plant and equipment, net of accumulated depreciation of $0.1 million and a cumulative effect of a change in accounting principle of $1.6 million.
In October 2002, the EITF reached a consensus in EITF Issue 02-03 to rescind Issue EITF 98-10, and related interpretive guidance, and preclude mark to market accounting for energy trading contracts that are not derivative instruments pursuant to SFAS 133. The consensus requires that gains and losses (realized and unrealized) on all derivative instruments held for trading purposes be shown net in the income statement, whether or not the instrument is settled physically. The consensus to rescind EITF Issue 98-10 was effective for all new contracts entered into (and physical inventory purchased) after October 25, 2002. For energy trading contracts and physical inventories that existed on or before October 25, 2002, that remained at December 31, 2002, the consensus was effective January 1, 2003 and was reported as a cumulative effect of a change in accounting principle. The cumulative effect of the accounting change at January 1, 2003 was a loss of $2.4 million.
13. BUSINESS SEGMENT INFORMATION
We have two reportable segments, which management reviews in order to make decisions about resources to be allocated and assess performance: North American Crude Oil and Pipeline Operations. The North American Crude Oil segment primarily purchases, gathers, transports and markets crude oil. The Pipeline Operations segment operates approximately 6,900 miles of active common carrier pipelines in 12 states. Effective December 31, 2003, we sold our Liquids Operations and therefore the results of operations related to these assets have been classified as discontinued operations presented herein. We sold all of our natural gas liquids assets on the West Coast on October 1, 2003 and therefore, the results of operations related to these assets previously included in the West Coast Operations segment have been reclassified to discontinued operations for all periods presented herein.
The accounting policies of the segments are the same as those described in the summary of significant accounting policies as discussed in Note 2 included in our Annual Report on Form 10-K (as amended) for the year ended December 31, 2003. We evaluate performance based on operating income (loss).
We account for intersegment revenue for our North American Crude Oil Operations as if the sales were to third parties, that is, at current market prices. Intersegment revenues for Pipeline Operations are based on published pipeline tariffs.
FINANCIAL INFORMATION BY BUSINESS SEGMENT (IN THOUSANDS)
| | North American Crude Oil | Pipeline Operations | Corporate and Other(a) | Consolidated | |||||||||
|---|---|---|---|---|---|---|---|---|---|---|---|---|---|
| Three Months ended March 31, 2004 (Successor Company) | |||||||||||||
| Revenue from external customers | $ | 29,307 | $ | 11,375 | $ | — | $ | 40,682 | |||||
| Intersegment revenue(b) | (2,407 | ) | 15,357 | (12,950 | ) | — | |||||||
| Total operating revenue | 26,900 | 26,732 | (12,950 | ) | 40,682 | ||||||||
| Gross profit (loss) | (1,621 | ) | 8,443 | — | 6,822 | ||||||||
| Operating income (loss) | (4,533 | ) | 6,266 | (12,721 | ) | (10,988 | ) | ||||||
| Other expenses, net | — | — | (11,555 | ) | (11,555 | ) | |||||||
| Income (loss) from continuing operations | (4,533 | ) | 6,266 | (24,276 | ) | (22,543 | ) | ||||||
| Total assets | 474,576 | 203,680 | 11,559 | 689,815 | |||||||||
| Depreciation and amortization | 638 | 4,416 | 6 | 5,060 | |||||||||
| | North American Crude Oil | Pipeline Operations | Corporate and Other(a) | Consolidated | ||||||||||
|---|---|---|---|---|---|---|---|---|---|---|---|---|---|---|
| One Month ended March 31, 2003 (Successor Company) (Restated) | ||||||||||||||
| Revenue from external customers | $ | 16,768 | $ | 965 | $ | — | $ | 17,733 | ||||||
| Intersegment revenue(b) | (2,913 | ) | 8,568 | (5,655 | ) | — | ||||||||
| Total operating revenue | 13,855 | 9,533 | (5,655 | ) | 17,733 | |||||||||
| Gross profit | 3,852 | 4,216 | — | 8,068 | ||||||||||
| Operating income (loss) | 3,313 | 3,238 | (2,231 | ) | 4,320 | |||||||||
| Other expense | — | — | (3,277 | ) | (3,277 | ) | ||||||||
| Income (loss) from continuing operations before cumulative effect of accounting changes (c) | 3,313 | 3,238 | (5,508 | ) | 1,043 | |||||||||
| Total assets | 547,962 | 221,766 | 99,884 | 869,612 | ||||||||||
| Depreciation and amortization | 376 | 1,331 | 1 | 1,708 | ||||||||||
| | North American Crude Oil | Pipeline Operations | Corporate and Other(a) | Consolidated | ||||||||||
|---|---|---|---|---|---|---|---|---|---|---|---|---|---|---|
| Two Months ended February 28, 2003 (Predecessor Company) (Restated) | ||||||||||||||
| Revenue from external customers | $ | 27,213 | $ | 4,422 | $ | — | $ | 31,635 | ||||||
| Intersegment revenue(b) | (1,768 | ) | 11,828 | (10,060 | ) | — | ||||||||
| Total operating revenue | 25,445 | 16,250 | (10,060 | ) | 31,635 | |||||||||
| Gross profit (loss) | 3,752 | 6,219 | — | 9,971 | ||||||||||
| Operating income (loss) | 2,365 | 4,261 | (4,012 | ) | 2,614 | |||||||||
| Other expense | — | — | (5,489 | ) | (5,489 | ) | ||||||||
| Reorganization items, net gain on discharge of debt and fresh start adjustments(c) | — | — | 67,459 | 67,459 | ||||||||||
| Income (loss) from continuing operations | 2,365 | 4,261 | 57,958 | 64,584 | ||||||||||
| Total assets | 505,965 | 226,646 | 123,511 | 856,122 | ||||||||||
| Depreciation and amortization | 837 | 3,286 | 519 | 4,642 | ||||||||||
REPORT OF INDEPENDENT REGISTERED PUBLIC ACCOUNTING FIRM
To the Board of Directors and Unitholders of Link Energy LLC:
In our opinion, the accompanying consolidated balance sheet and the related consolidated statements of operations, members' capital and cash flows present fairly, in all material respects, the financial position of Link Energy LLC and its subsidiaries (Successor Company) at December 31, 2003 and the results of their operations and their cash flows for the period from March 1, 2003 to December 31, 2003 in conformity with accounting principles generally accepted in the United States of America. In addition, in our opinion, the financial statement schedule listed in the accompanying index present fairly, in all material respects, the information set forth therein when read in conjunction with the related consolidated financial statements. These financial statements and the financial statement schedule are the responsibility of the Company's management. Our responsibility is to express an opinion on these financial statements and financial statement schedule based on our audit. We conducted our audit of these statements in accordance with the standards of the Public Company Accounting Oversight Board (United States). Those standards require that we plan and perform the audit to obtain reasonable assurance about whether the financial statements are free of material misstatement. An audit includes examining, on a test basis, evidence supporting the amounts and disclosures in the financial statements, assessing the accounting principles used and significant estimates made by management, and evaluating the overall financial statement presentation. We believe that our audit provides a reasonable basis for our opinion.
As discussed in the Note 1 caption "Restatement of Financial Results" and in Note 10 to the consolidated financial statements, the Company has restated its financial results for the period from March 1, 2003 to December 31, 2003.
As discussed in Note 1 to the consolidated financial statements, the United States Bankruptcy Court for the Southern District of Texas confirmed the Company's voluntary petitions for reorganization under Chapter 11 of the U.S. Bankruptcy Code (the "plan") on February 18, 2003, to be effective on March 1, 2003. In connection with its emergence from bankruptcy, the Company adopted fresh start accounting as of February 28, 2003.
The accompanying consolidated financial statements have been prepared assuming that the Company will continue as a going concern. As discussed in Note 3 to the consolidated financial statements, the Company has suffered recurring losses from operations and has a net capital deficiency that raises substantial doubt about its ability to continue as a going concern. Management's plans in regard to these matters are also described in Note 3. The financial statements do not include any adjustments that might result from the outcome of this uncertainty.
PRICEWATERHOUSECOOPERS LLP
Houston, TexasMarch 30, 2004, except as to the matters discussed in the Note 1 caption "Restatement of Financial Results" and in Note 10 which the date is June 15, 2004
REPORT OF INDEPENDENT REGISTERED PUBLIC ACCOUNTING FIRM
To the Board of Directors and Unitholders of Link Energy LLC:
In our opinion, the accompanying consolidated balance sheet and the related consolidated statements of operations, partners' capital and cash flows present fairly, in all material respects, the financial position of EOTT Energy Partners, L.P. and its subsidiaries (Predecessor Company) at December 31, 2002 and the results of their operations and their cash flows for the period from January 1, 2003 to February 28, 2003, and for each of the two years in the period ended December 31, 2002 in conformity with accounting principles generally accepted in the United States of America. In addition, in our opinion, the financial statement schedule listed in the accompanying index presents fairly, in all material respects, the information set forth therein when read in conjunction with the related consolidated financial statements. These financial statements and the financial statement schedule are the responsibility of the Company's management. Our responsibility is to express an opinion on these financial statements and financial statement schedule based on our audits. We conducted our audits of these statements in accordance with the standards of the Public Company Accounting Oversight Board (United States). Those standards require that we plan and perform the audit to obtain reasonable assurance about whether the financial statements are free of material misstatement. An audit includes examining, on a test basis, evidence supporting the amounts and disclosures in the financial statements, assessing the accounting principles used and significant estimates made by management, and evaluating the overall financial statement presentation. We believe that our audits provide a reasonable basis for our opinion.
As discussed in the Note 1 caption "Restatement of Financial Results" and in Note 10 to the consolidated financial statements, the Company has restated its financial results for the period from January 1, 2003 to February 28, 2003, and for each of the two years in the period ended December 31, 2002.
As discussed in Note 1 to the consolidated financial statements, the Company filed a petition on October 8, 2002 with the United States Bankruptcy Court for the Southern District of Texas for reorganization under the provisions of Chapter 11 of the U.S. Bankruptcy Code. The Company's reorganization plan was confirmed on February 18, 2003, to be effective on March 1, 2003. In connection with its emergence from bankruptcy, the Company adopted fresh start accounting as of February 28, 2003.
The accompanying consolidated financial statements have been prepared assuming that the Company will continue as a going concern. As discussed in Note 3 to the consolidated financial statements, the Company has suffered recurring losses from operations and has a net capital deficiency that raises substantial doubt about its ability to continue as a going concern. Management's plans in regard to these matters are also described in Note 3. The financial statements do not include any adjustments that might result from the outcome of this uncertainty.
As discussed in Note 20 to the consolidated financial statements, the Company adopted the provisions of Emerging Issues Task Force No. 02-03, "Issues Involved in Accounting for Derivative Contracts Held for Trading Purposes and Contracts Involved in Energy Trading and Risk Management Activities," related to the rescission of Emerging Issues Task Force Issue 98-10, "Accounting for Contracts Involved in Energy Trading and Risk Management Activities," as of January 1, 2003. As discussed in Note 20 to the consolidated financial statements, the Company changed its method of accounting for asset retirement obligations as of January 1, 2003.
PRICEWATERHOUSECOOPERS LLP
Houston, TexasMarch 30, 2004, except as to the matters discussed in the Note 1 caption "Restatement of Financial Results" and in Note 10 which the date is June 15, 2004
LINK ENERGY LLC(A LIMITED LIABILITY COMPANY)CONSOLIDATED STATEMENTS OF OPERATIONS(in thousands, except per unit amounts)
| | | Predecessor Company | ||||||||||||
|---|---|---|---|---|---|---|---|---|---|---|---|---|---|---|
| | Successor Company | |||||||||||||
| | | Year ended December 31, | ||||||||||||
| | Ten Months ended December 31, 2003 | Two Months ended February 28, 2003 | ||||||||||||
| | 2002 | 2001 | ||||||||||||
| | (Restated) | (Restated) | (Restated) | (Restated) | ||||||||||
| Operating Revenue | $ | 153,033 | $ | 31,635 | $ | 182,932 | $ | 250,571 | ||||||
| Cost of Sales | 23,863 | 4,521 | 25,007 | 43,149 | ||||||||||
| Operating Expenses | 70,102 | 13,020 | 94,274 | 97,969 | ||||||||||
| Depreciation and Amortization—operating | 17,139 | 4,123 | 26,621 | 27,802 | ||||||||||
| Gross Profit | 41,929 | 9,971 | 37,030 | 81,651 | ||||||||||
| Selling, General and Administrative Expenses | 45,959 | 6,846 | 53,480 | 45,051 | ||||||||||
| Depreciation and Amortization—corporate & other | 22 | 519 | 3,267 | 3,083 | ||||||||||
| Other (Income) Expense | (13,867 | ) | (8 | ) | 6,710 | (1,092 | ) | |||||||
| Impairment of Assets | — | — | 1,168 | — | ||||||||||
| Operating Income (Loss) | 9,815 | 2,614 | (27,595 | ) | 34,609 | |||||||||
| Interest Expense and Related Charges | (32,708 | ) | (5,645 | ) | (45,876 | ) | (35,363 | ) | ||||||
| Interest Income | 77 | 58 | 127 | 1,319 | ||||||||||
| Other, net | 115 | 98 | (44 | ) | (517 | ) | ||||||||
| Income (Loss) from Continuing Operations Before Reorganization Items, Net Gain on Discharge of Debt and Fresh Start Adjustments | (22,701 | ) | (2,875 | ) | (73,388 | ) | 48 | |||||||
| Reorganization Items | — | (7,330 | ) | 32,847 | — | |||||||||
| Net Gain on Discharge of Debt (Note 5) | — | 131,560 | — | — | ||||||||||
| Fresh Start Adjustments (Note 6) | — | (56,771 | ) | — | — | |||||||||
| Income (Loss) from Continuing Operations | (22,701 | ) | 64,584 | (40,541 | ) | 48 | ||||||||
| Loss from Discontinued Operations (Note 8) | (30,214 | ) | 519 | (62,713 | ) | (16,605 | ) | |||||||
| Income (Loss) Before Cumulative Effect of Accounting Change | (52,915 | ) | 65,103 | (103,254 | ) | (16,557 | ) | |||||||
| Cumulative Effect of Accounting Change (Notes 2 & 20) | — | (3,976 | ) | — | 1,073 | |||||||||
| Net Income (Loss) | $ | (52,915 | ) | $ | 61,127 | $ | (103,254 | ) | $ | (15,484 | ) | |||
| Basic Net Income (Loss) Per Unit (Note 12) | ||||||||||||||
| LLC Unit | $ | (4.29 | ) | $ | N/A | $ | N/A | $ | N/A | |||||
| Common Unit | $ | N/A | $ | 0.14 | $ | (0.03 | ) | $ | (0.55 | ) | ||||
| Subordinated Unit | $ | N/A | $ | — | $ | (3.23 | ) | $ | (0.55 | ) | ||||
| Diluted Net Income (Loss) Per Unit (Note 12) | $ | (4.29 | ) | $ | 0.10 | $ | (1.08 | ) | $ | (0.55 | ) | |||
| Distributions Per Unit | $ | — | $ | — | $ | 0.25 | $ | 1.90 | ||||||
| Average Units Outstanding for Diluted Computation | 12,331 | 27,476 | 27,476 | 27,476 | ||||||||||
The accompanying notes are an integral part of these consolidated financial statements.
LINK ENERGY LLC(A LIMITED LIABILITY COMPANY)CONSOLIDATED BALANCE SHEETS(in thousands)
| | Successor Company | Predecessor Company | |||||||
|---|---|---|---|---|---|---|---|---|---|
| | December 31, 2003 | December 31, 2002 | |||||||
| | (Restated) | ||||||||
| ASSETS | |||||||||
| Current Assets | |||||||||
| Cash and cash equivalents | $ | 2,450 | $ | 16,432 | |||||
| Restricted cash (Note 8) | 6,045 | — | |||||||
| Trade and other receivables, net of allowance for doubtful accounts of $1,210 and $1,210, respectively | 446,030 | 407,096 | |||||||
| Inventories of continuing operations | 7,636 | 15,389 | |||||||
| Inventories of discontinued operations | — | 16,970 | |||||||
| Other | 6,283 | 23,888 | |||||||
| Total current assets | 468,444 | 479,775 | |||||||
| Property, Plant and Equipment | 278,724 | 546,410 | |||||||
| Less: Accumulated depreciation | 16,214 | 205,351 | |||||||
| Net property, plant and equipment | 262,510 | 341,059 | |||||||
| Long-lived assets of discontinued operations | 838 | 39,899 | |||||||
| Goodwill | — | 7,436 | |||||||
| Other Assets | 6,852 | 4,070 | |||||||
| Total Assets | $ | 738,644 | $ | 872,239 | |||||
LIABILITIES AND MEMBERS'/PARTNERS' CAPITAL | |||||||||
| Current Liabilities | |||||||||
| Trade and other accounts payable | $ | 476,509 | $ | 389,925 | |||||
| Accrued taxes payable | 6,700 | 11,327 | |||||||
| Term loans (Note 4) | 75,000 | 75,000 | |||||||
| Commodity repurchase agreement (Note 4) | 18,000 | 75,000 | |||||||
| Receivable financing (Note 4) | 27,000 | 50,000 | |||||||
| Other | 27,982 | 23,274 | |||||||
| Total current liabilities | 631,191 | 624,526 | |||||||
| Long-Term Liabilities | |||||||||
| Senior notes (Note 4) | 104,451 | — | |||||||
| Other | 17,399 | 15,817 | |||||||
| Total long-term liabilities | 121,850 | 15,817 | |||||||
| Liabilities Subject to Compromise (Note 5) | — | 292,827 | |||||||
| Commitments and Contingencies (Note 15) | |||||||||
| Additional Partnership Interests (Note 18) | — | 9,318 | |||||||
| Members'/Partners' Capital (Deficit) | |||||||||
| Partners' Capital (Deficit) | — | (70,249 | ) | ||||||
| Members' Capital (Deficit) | (14,392 | ) | — | ||||||
| Accumulated Other Comprehensive Income (Loss) | (5 | ) | — | ||||||
| Total | (14,397 | ) | (70,249 | ) | |||||
| Total Liabilities and Members'/Partners' Capital | $ | 738,644 | $ | 872,239 | |||||
The accompanying notes are an integral part of these consolidated financial statements.
LINK ENERGY LLC(A LIMITED LIABILITY COMPANY)CONSOLIDATED STATEMENTS OF CASH FLOWS(in thousands)
| | Successor Company | Predecessor Company | ||||||||||||||
|---|---|---|---|---|---|---|---|---|---|---|---|---|---|---|---|---|
| | | | Year ended December 31, | |||||||||||||
| | Ten Months ended December 31, 2003 | Two Months ended February 28, 2003 | ||||||||||||||
| | 2002 | 2001 | ||||||||||||||
| | (Restated) | (Restated) | (Restated) | (Restated) | ||||||||||||
| CASH FLOWS FROM OPERATING ACTIVITIES | ||||||||||||||||
| Reconciliation of net income (loss) to net cash provided by (used in) operating activities | ||||||||||||||||
| Net income (loss) | $ | (52,915 | ) | $ | 61,127 | $ | (103,254 | ) | $ | (15,484 | ) | |||||
| Depreciation | 19,242 | 5,560 | 35,535 | 33,469 | ||||||||||||
| Amortization of goodwill and other | — | — | 2,015 | 2,609 | ||||||||||||
| Impairment of assets | 2,751 | — | 77,268 | 29,057 | ||||||||||||
| Write-down of liquids operations inventories | 4,003 | — | — | — | ||||||||||||
| Net unrealized change in crude oil trading activities | 822 | (2,120 | ) | (1,755 | ) | 2,053 | ||||||||||
| (Gains) losses on disposal of assets | (2,727 | ) | — | 984 | 229 | |||||||||||
| Non-cash compensation expense | 2,306 | — | — | — | ||||||||||||
| Non-cash net gain for reorganization items and discharge of debt | — | (127,185 | ) | (37,802 | ) | — | ||||||||||
| Fresh start adjustments | — | 56,771 | — | — | ||||||||||||
| Changes in components of working capital | ||||||||||||||||
| Receivables | (6,475 | ) | (32,177 | ) | 94,089 | 421,680 | ||||||||||
| Inventories | 12,762 | 6,757 | 54,077 | 1,799 | ||||||||||||
| Other current assets | 3,192 | 2,428 | 7,411 | (1,780 | ) | |||||||||||
| Trade accounts payable | 9,034 | 47,845 | (96,934 | ) | (537,198 | ) | ||||||||||
| Accrued taxes payable | 1,962 | 1,717 | 2,481 | (1,909 | ) | |||||||||||
| Other current liabilities | 14,500 | (320 | ) | (98 | ) | 19,249 | ||||||||||
| Other assets and liabilities | (8,623 | ) | 2,530 | 682 | 4,968 | |||||||||||
| Net Cash Provided by (Used in) Operating Activities | (166 | ) | 22,933 | 34,699 | (41,258 | ) | ||||||||||
| CASH FLOWS FROM INVESTING ACTIVITIES | ||||||||||||||||
| Proceeds from sale of assets | 62,197 | — | 2,390 | 17,209 | ||||||||||||
| Increase in restricted cash | (6,045 | ) | — | — | — | |||||||||||
| Acquisitions | — | — | — | (117,000 | ) | |||||||||||
| Additions to property, plant and equipment | (9,153 | ) | (285 | ) | (31,238 | ) | (36,228 | ) | ||||||||
| Net Cash Provided by (Used in) Investing Activities | 46,999 | (285 | ) | (28,848 | ) | (136,019 | ) | |||||||||
| CASH FLOWS FROM FINANCING ACTIVITIES | ||||||||||||||||
| Increase (decrease) in receivable financing | (23,000 | ) | — | 7,500 | 42,500 | |||||||||||
| Increase (decrease) in short-term borrowings | — | — | (40,000 | ) | 40,000 | |||||||||||
| Increase in term loans | — | — | 75,000 | — | ||||||||||||
| Increase (decrease) in repurchase agreements | (57,000 | ) | — | (25,000 | ) | 100,000 | ||||||||||
| Debt issuance cost | (3,758 | ) | — | (750 | ) | — | ||||||||||
| Distributions to unitholders | — | — | (4,712 | ) | (43,163 | ) | ||||||||||
| Exercise of warrants | 444 | — | — | — | ||||||||||||
| Other | (1,804 | ) | 1,655 | (4,398 | ) | (13,349 | ) | |||||||||
| Net Cash Provided by (Used in) Financing Activities | (85,118 | ) | 1,655 | 7,640 | 125,988 | |||||||||||
| Increase (Decrease) in Cash and Cash Equivalents | (38,285 | ) | 24,303 | 13,491 | (51,289 | ) | ||||||||||
| Cash and Cash Equivalents Beginning of Period | 40,735 | 16,432 | 2,941 | 54,230 | ||||||||||||
| Cash and Cash Equivalents End of Period | $ | 2,450 | $ | 40,735 | $ | 16,432 | $ | 2,941 | ||||||||
| SUPPLEMENTAL DISCLOSURE OF CASH FLOW INFORMATION | ||||||||||||||||
| Cash Paid for Interest | $ | 19,558 | $ | 5,599 | $ | 34,931 | $ | 33,041 | ||||||||
| Cash Paid for Reorganization Items | $ | 6,271 | $ | 2,867 | $ | 4,955 | $ | — | ||||||||
| SUPPLEMENTAL NON CASH INVESTING AND FINANCING INFORMATION | ||||||||||||||||
| Discharge of 11% Senior Notes, including accrued interest | $ | — | $ | 248,481 | $ | — | $ | — | ||||||||
| Cancellation of additional partnership interests | $ | — | $ | 9,318 | $ | — | $ | — | ||||||||
| Issuance of 9% Senior Notes and payment of interest in kind | $ | 5,200 | $ | 104,000 | $ | — | $ | — | ||||||||
| Issuance of new equity of Successor Company | $ | — | $ | 36,687 | $ | — | $ | — | ||||||||
The accompanying notes are an integral part of these consolidated financial statements.
LINK ENERGY LLC(A LIMITED LIABILITY COMPANY)CONSOLIDATED STATEMENTS OF MEMBERS'/PARTNERS' CAPITAL(in thousands)
| | Partners Capital | | | |||||||||||||||||
|---|---|---|---|---|---|---|---|---|---|---|---|---|---|---|---|---|---|---|---|---|
| | Accumulated Other Comprehensive Income (Loss) | | ||||||||||||||||||
| | Common Unitholders | Subordinated Unitholders | General Partner | Members' Capital | Total | |||||||||||||||
| Partners' Capital (Deficit) at December 31, 2000 (Unaudited) | $ | 47,832 | $ | 41,247 | $ | 7,285 | $ | — | $ | — | $ | 96,364 | ||||||||
| Net loss (Restated) | (10,207 | ) | (4,973 | ) | (304 | ) | — | — | (15,484 | ) | ||||||||||
| Cash distribution | (35,105 | ) | (7,200 | ) | (858 | ) | — | — | (43,163 | ) | ||||||||||
| Partners' Capital (Deficit) at December 31, 2001 (Restated) | 2,520 | 29,074 | 6,123 | — | — | 37,717 | ||||||||||||||
| Net loss (Restated) | (553 | ) | (29,074 | ) | (73,627 | ) | — | — | (103,254 | ) | ||||||||||
| Cash distribution | (4,619 | ) | — | (93 | ) | — | — | (4,712 | ) | |||||||||||
| Partners' Capital (Deficit) at December 31, 2002 (Restated) | (2,652 | ) | — | (67,597 | ) | — | — | (70,249 | ) | |||||||||||
| Loss before reorganization items, net gain on discharge of debt and fresh start adjustments (Restated) | — | — | (6,332 | ) | — | — | (6,332 | ) | ||||||||||||
| Reorganization items and net gain on discharge of debt | 17,624 | 35,354 | 80,374 | 35,773 | — | 169,125 | ||||||||||||||
| Fresh start adjustments | (14,972 | ) | (35,354 | ) | (6,445 | ) | — | — | (56,771 | ) | ||||||||||
| Members' Capital at February 28, 2003 (Successor Company) (Restated) | $ | — | $ | — | $ | — | $ | 35,773 | $ | — | $ | 35,773 | ||||||||
| Members' Capital at March 1, 2003 (Successor Company) (Restated) | $ | — | $ | — | $ | — | $ | 35,773 | $ | — | $ | 35,773 | ||||||||
| Net loss (Restated) | — | — | — | (52,915 | ) | — | (52,915 | ) | ||||||||||||
| Unrealized net losses on derivative instruments arising during the period | — | — | — | — | (160 | ) | ||||||||||||||
| Less reclassification adjustment for net realized losses on derivative instruments included in net loss | — | — | — | — | 155 | (5 | ) | |||||||||||||
| Comprehensive loss | (52,920 | ) | ||||||||||||||||||
| Exercise of warrants | — | — | — | 444 | — | 444 | ||||||||||||||
| Issuance of restricted units | — | — | — | 12,450 | — | 12,450 | ||||||||||||||
| Less unearned compensation expense | — | — | — | (10,144 | ) | — | (10,144 | ) | ||||||||||||
| Members' Capital at December 31, 2003 (Successor Company) | $ | — | $ | — | $ | — | $ | (14,392 | ) | $ | (5 | ) | $ | (14,397 | ) | |||||
The accompanying notes are an integral part of these consolidated financial statements
LINK ENERGY LLC(A LIMITED LIABILITY COMPANY)NOTES TO CONSOLIDATED FINANCIAL STATEMENTS(As Restated)
1. BASIS OF PRESENTATION
Name Change and Organization
Effective October 1, 2003, EOTT Energy LLC ("EOTT LLC") changed its name to Link Energy LLC ("Link LLC"). In connection with our name change, we also changed the names of several of our subsidiaries as listed in the table below.
Link LLC is a Delaware limited liability company that was formed on November 14, 2002 in anticipation of assuming and continuing the business formerly directly owned by EOTT Energy Partners, L.P. (the "MLP"), which, as described in Note 5 below, filed for Chapter 11 reorganization with its wholly owned subsidiaries on October 8, 2002. The MLP emerged from bankruptcy and merged into EOTT Energy Operating Limited Partnership resulting in EOTT LLC becoming the successor registrant to the MLP on March 1, 2003, the effective date of the Third Amended Joint Chapter 11 Plan of Reorganization, as supplemented ("Restructuring Plan"). We operate principally through four affiliated operating limited partnerships, Link Energy Limited Partnership, Link Energy Canada Limited Partnership, Link Energy Pipeline Limited Partnership, and EOTT Energy Liquids, L.P. (see Note 8 for information regarding the disposition of our Liquids operations), each of which is a Delaware limited partnership. Link Energy Finance Corp. was formed in order to facilitate certain investors' ability to purchase our senior notes. Link Energy General Partner, LLC serves as the general partner for our four affiliated operating limited partnerships. Until the MLP emerged from bankruptcy, EOTT Energy Corp. (the "General Partner"), a Delaware corporation and a wholly owned subsidiary of Enron Corp. ("Enron"), served as the general partner of the MLP and owned an approximate 1.98% general partner interest in the MLP. The General Partner filed for bankruptcy on October 21, 2002. Unless the context otherwise requires, the terms "we," "our," "us," and "Link" refer to Link Energy LLC and its four affiliated operating limited partnerships, Link Energy Finance Corp., and Link Energy General Partner, LLC (the "Subsidiary Entities"), and for periods prior to our emergence from bankruptcy in March 2003, such terms and "EOTT" refer to EOTT Energy Partners, L.P. and its sole general partner, EOTT Energy Corp., as well as the Subsidiary Entities.
Restatement of Financial Results
We have restated our financial results for the ten months ended December 31, 2003, the two months ended February 28, 2003, and the years ended December 31, 2002 and 2001 as more fully discussed in Note 10. The restatement relates to control deficiencies identified with inventory and accounts payable reconciliation procedures in our pipeline and liquids operations. The restatement results in a decrease in our net loss for the ten months ended December 31, 2003 of $0.9 million, an increase in our net income for the two months ended February 28, 2003 of $0.9 million, and an
increase in our net loss for the years ended December 31, 2002 and 2001 of $1.5 million and $0.3 million respectively.
Fresh Start Reporting
As a result of the application of fresh start reporting under the American Institute of Certified Public Accountants Statement of Position No. 90-7 ("SOP 90-7"), "Financial Reporting by Entities in Reorganization Under the Bankruptcy Code," as of February 28, 2003 (the date chosen for accounting purposes), Link's financial results for the ten months ended December 31, 2003 and the two months ended February 28, 2003 include two different bases of accounting and accordingly, the financial condition, operating results and cash flows of the Successor Company and the Predecessor Company have been separately disclosed. For a further discussion of fresh start reporting, see Note 6. For purposes of these financial statements, references to the "Predecessor Company" are references to us for periods through February 28, 2003 (the last day of the calendar month in which we emerged from bankruptcy) and references to the "Successor Company" are references to Link for periods subsequent to February 28, 2003. The Successor Company's financial statements are not comparable to the Predecessor Company's financial statements. See further discussion in Note 6.
Partnership Status
As a limited liability company, we are generally treated like a partnership for federal income tax purposes and like a corporation with limited liability for state law and other non-tax purposes. In other words, for federal income tax purposes, we do not pay tax on our income or gain, nor are we entitled to a deduction for our losses, but such gains or losses are allocated to each member in accordance with the member's interest in us and the member will be responsible for paying the income tax applicable to such membership interest. Our taxable income or loss, which may vary substantially from the net income or net loss we report in our consolidated statement of operations, is includable in the federal income tax returns of our members. The aggregate difference in the basis of our net assets for financial and tax reporting purposes cannot be readily determined as we do not have access to information about each member's tax attributes in Link.
In order for us to continue to be classified as a partnership for federal income tax purposes, at least 90% of our gross income for every taxable year must consist of "qualifying income" within the meaning of the Internal Revenue Code. In 2002 and 2003, we recognized income from our settlement with Enron and discharge of indebtedness in excess of 10% of our gross income for each of those years. As disclosed in more detail in our Third Amended Joint Chapter 11 Plan which is incorporated by reference into our Annual Report on Form 10-K for the year ended December 31, 2002, we concluded that income from our settlement with Enron and our debt discharge income constituted "qualifying income," although the matter was not free from doubt. In January 2004, we requested a private letter ruling from the Internal Revenue Service to determine either that the income from our settlement with Enron and the debt discharge income is qualifying income or that the recognition of such income should be disregarded for purposes of the qualifying income test because it was an inadvertent result of our bankruptcy.
We are unable to predict how or when the Internal Revenue Serviceproceeds will rule. If the ruling is favorable, we will continue to be treated as a partnership for federal income tax purposes for so long as we satisfy the qualifying income test. If we are unable to obtain a favorable ruling and are unsuccessful in litigating the matter should we choose to do so, we will be taxable as a corporation for the year in which we failed to meet the qualifying income test and every year thereafter. Any classification of us as a corporation could result in a material reduction in the value of our units.
LLC Agreement
Under our Limited Liability Company Agreement (the "LLC Agreement"), our Board may, but is not required, to make distributions to each interest holder, and in any event, our exit credit facilities do not permit us to make any cash distributions so long as we have any indebtedness or other obligations outstanding under the exit credit facilities. Similar to a corporation, members do not share our liability. Under our LLC Agreement, members are also entitled to certain information about us and to vote for directors and on certain other matters. The holders of the majority of outstanding units have the right to vote on mergers and the election or removal of directors. The holders of two-thirds of the units have the right to approve additional issuances of equity and certain amendments to the LLC Agreement. Members are not entitled to participate in our management directly, but participate indirectly through the election of our directors.
Reclassifications
Certain reclassifications have been made to prior period amounts to conform with the current period presentation.
2. SUMMARY OF SIGNIFICANT ACCOUNTING POLICIES
Principles of Consolidation. We own and operate our assets through our operating limited partnerships. The accompanying financial statements reflect the consolidated accounts of Link Energy LLC and the operating limited partnerships after elimination of intercompany transactions.
Nature of Operations. Through our affiliated limited partnerships, Link Energy Limited Partnership, Link Energy Canada Limited Partnership, Link Energy Pipeline Limited Partnership, and EOTT Energy Liquids, L.P., we are engaged in the purchasing, gathering, transporting, trading, storage and resale of crude oil and related activities. Prior to their disposition in 2003, we were also engaged in the operation of a hydrocarbon processing plant (the "Morgan's Point Facility"), a natural gas liquids storage facility (the "Mont Belvieu Facility") and natural gas liquids assets on the West Coast. See Note 8 for information regarding the disposition of our Morgan's Point Facility, Mont Belvieu Facility and natural gas liquids assets on the West Coast. The results of operations related to these assets have been reclassified to discontinued operations for all periods presented herein. Our remaining principal business segments are our North American Crude Oil gathering and marketing operations and our Pipeline Operations.
Use of Estimates. The preparation of financial statements in conformity with generally accepted accounting principles requires management to make estimates and assumptions that affect the reported amounts of assets and liabilities and disclosure of contingent assets and liabilities at the date of the financial statements and the reported amounts of revenues and expenses during the reporting period. Actual results could differ from those estimates.
Cash Equivalents. We record as cash equivalents all highly liquid short-term investments having original maturities of three months or less.
Restricted Cash. Restricted cash represents cash which is not available for general corporate purposes. At December 31, 2003, restricted cash is comprised of amounts to be used for the settlement of certain obligations related to our Liquids Operations, which were sold on December 31, 2003. See further discussion in Note 8.
Inventory. Inventory includes crude oil inventory in our North American Crude Oil gathering and marketing operations and our Pipeline Operations. Inventory is stated at average cost for all periods presented.
Property, Plant and Equipment. Property, plant and equipment is stated at historical cost for the Predecessor Company and has been adjusted to reflect the adoption of fresh start reporting for the Successor Company. See Note 7. Normal maintenance and repairs are charged to expense as incurred while significant improvements which extend the life of the asset are capitalized. Upon retirement or sale of an asset, the asset and the related accumulated depreciation are removed from the accounts and any resulting gain or loss is reflected in the results of operations.
Impairment of Assets. We evaluate impairment of our long-lived assets in accordance with Statement of Financial Accounting Standards ("SFAS") No. 144, "Accounting for the Impairment or Disposal of Long-Lived Assets," and would recognize an impairment when estimated undiscounted future cash flows associated with an asset or group of assets are less than the asset carrying amount. Long-lived assets are subject to factors which could affect future cash flows. These factors include competition, our financial condition and cost of credit which impacts our ability to maintain or increase our crude oil volumes, regulation, environmental matters, consolidation in the industry, refinery demand for specific grades of crude oil, area market price structures and continued developmental drilling in certain areas of the United States. We continuously monitor these factors and pursue alternative strategies to maintain or enhance cash flows associated with these assets; however, no assurances can be given that we can mitigate the effects, if any, on future cash flows related to any changes in these factors. See Note 8 for further discussion of asset impairments.
Depreciation. Depreciation is provided by applying the straight-line method to the basis of property, plant, and equipment over the estimated useful lives of the assets. Asset lives are 10 to 20 years for barging, terminalling, gathering and pipeline facilities, 5 to 10 years for transportation equipment, and 3 to 20 years for other buildings and equipment.
Goodwill. Effective January 1, 2002, we adopted SFAS No. 142, "Goodwill and Other Intangible Assets." SFAS No. 142 requires entities to discontinue the amortization of goodwill, allocate all existing
goodwill among its reporting segments based on criteria set by SFAS No. 142 and perform initial impairment tests by applying a fair value-based analysis on the goodwill in each reporting segment. Goodwill is to be tested for impairment annually or more frequently if circumstances indicate a possible impairment. Goodwill was allocated to the North American Crude Oil segment and in 2002 no impairment of goodwill was required. Our reported income from continuing operations of $0.05 million ($0.00 per diluted unit) in 2001 included amortization of goodwill of $1.0 million ($0.4 per diluted unit). Our income from continuing operations in 2001, excluding the amortization of goodwill, would have been $1.0 million ($0.04 per diluted unit). In connection with the adoption of fresh start reporting (see Note 6), all remaining goodwill at February 28, 2003 was eliminated.
Pipeline Linefill. Pipeline linefill, which consists of minimum operating requirements is recorded at cost for the Predecessor Company and was adjusted to fair value in connection with the adoption of fresh start reporting for the Successor Company (See Note 6). Total minimum operating linefill requirements held in third party pipelines and our pipelines at December 31, 2003 and 2002 were 2.1 million barrels valued at $39.7 million and 2.9 million barrels valued at $50.2 million, respectively. Minimum linefill requirements held in third party pipelines at December 31, 2003 and 2002 were valued at $6.3 million and $8.8 million, respectively, and classified as Other Assets and Other Current Assets, respectively, on the balance sheet. Minimum linefill requirements held in our pipelines at December 31, 2003 and 2002, were valued at $33.4 million and $41.4 million, respectively, and classified as Property, Plant and Equipment on the balance sheet. See Note 8 for information regarding the sale of certain linefill.
Derivative and Hedging Activities. We utilize derivative instruments to minimize our exposure to commodity price fluctuations. Generally, as we purchase lease crude oil at prevailing market prices, we enter into corresponding sales transactions involving either physical deliveries of crude oil to third parties or a sale of futures contracts on the NYMEX. Price risk management strategies, including those involving price hedges using NYMEX futures contracts, are very important in managing our commodity price risk. Such hedging techniques require resources for managing both future positions and physical inventories. We effect transactions both in the futures and physical markets in order to deliver the crude oil to its highest value location or otherwise to maximize the value of the crude oil we control. Throughout the process, we seek to maintain a substantially balanced risk position at all times. We do have certain risks that cannot be completely hedged such as basis risks (the risk that price relationships between delivery points, grades of crude oil or delivery periods will change) and the risk that transportation costs will change.
Effective January 1, 1999, we began reporting energy trading contracts (as defined) at fair value in the balance sheet with changes in fair value included in earnings in accordance with Emerging Issues Task Force ("EITF") Issue 98-10, "Accounting for Contracts Involved in Energy Trading and Risk Management Activities."
Effective January 1, 2001, we began reporting derivative activities in accordance with SFAS No. 133, "Accounting for Derivative Instruments and Hedging Activities," as amended. SFAS No. 133 requires that derivative instruments be recorded in the balance sheet as either assets or liabilities measured at fair value. Under SFAS No. 133, we are required to "mark-to-fair value" all of our
derivative instruments at the end of each reporting period. At the date of initial adoption of SFAS No. 133, the difference between the fair value of derivative instruments and the previous carrying amount of those derivatives was recorded as the cumulative effect of a change in accounting principle. The cumulative effect of adopting SFAS No. 133 effective January 1, 2001 was a $1.3 million ($0.05 per diluted unit) increase in income. SFAS No. 133 requires that changes in the derivative's fair value be recognized currently in earnings unless specific hedge accounting criteria are met. Qualifying criteria include, among other requirements, that we formally designate, document, and assess the effectiveness of the hedging instruments as they are established and at the end of each reporting period. Special accounting for qualifying hedges allows a derivative's gains and losses to offset related results from the hedged item in the income statement. Changes in the fair value of derivatives designated as cash flow hedges are deferred to Other Comprehensive Income (Loss) ("OCI"), a component of Members' Capital, and reclassified into earnings when the associated hedged transaction affects earnings. Deferral of derivative gains and losses through OCI is limited to the portion of the change in fair value of the derivative instrument which effectively hedges the associated hedged transaction; ineffective portions are recognized currently in earnings. Beginning in the second quarter of 2003, we designated certain of our derivative instruments as cash flow hedges of forecasted transactions. These hedges were for a maximum of two-months and had no material effect on our OCI or earnings for the ten months ended December 31, 2003. The ineffective portions of our hedged transactions were not material to our earnings for the ten months ended December 31, 2003. SFAS No. 133 requires that any cash flow hedges, for which it is probable that the original forecasted transactions will not occur by the end of the originally specified time period, be discontinued and reclassified into earnings, and that such reclassifications be recorded and separately disclosed. We had no such reclassifications for the ten months ended December 31, 2003. All unrealized derivative gains and losses included in accumulated other comprehensive income (loss) at December 31, 2003 are expected to be reclassified to net income (loss) within the next twelve months. Realized derivative gains and losses are included in Operating Revenue in our Statement of Operations.
Changes in the market value of transactions designated as energy trading activities in accordance with EITF Issue 98-10 (prior to the rescission of EITF Issue 98-10) and derivative instruments accounted for under SFAS No. 133, are recorded in revenues every period as unrealized gains or losses. The related price risk management assets and liabilities are recorded in other current or non-current assets and liabilities, as applicable, on the balance sheet. The fair value of transactions is determined primarily based on forward prices of the commodity, adjusted for certain transaction costs associated with the transactions. For the ten months ended December 31, 2003, we had net unrealized losses of $0.8 million, for the two months ended February 28, 2003, we had net unrealized gains of $4.5 million and for the years ended December 31, 2002 and 2001, we had net unrealized gains of $1.8 million and net unrealized losses of $2.5 million, respectively.
In the first quarter of 2001, we changed our method of accounting for inventories used in our energy trading activities from the average cost method to the fair value method. The cumulative effect of the change in accounting for inventories as of January 1, 2001 was $0.2 million ($0.01 per diluted unit) and is reported as a decrease in net income for 2001. The change in accounting for inventories increased reported net income in 2001 by approximately $2.6 million. The consensus to rescind EITF Issue 98-10 eliminated EOTT's basis for recognizing physical inventories at fair value. With the
rescission of EITF Issue 98-10, inventories purchased after October 25, 2002 were valued at average cost.
In October 2002, the EITF reached a consensus in EITF Issue 02-03 "Issues Involved in Accounting for Derivative Contracts Held for Trading Purposes and Contracts Involved in Energy Trading and Risk Management Activities." The EITF reached a consensus to rescind EITF Issue 98-10, and related interpretive guidance, and preclude mark to market accounting for energy trading contracts that are not derivative instruments pursuant to SFAS No. 133. See Note 20 for discussion of the cumulative effect of the change in accounting principle. The consensus requires that gains and losses (realized and unrealized) on all derivative instruments held for trading purposes be shown net in the income statement, whether or not the instrument is settled physically.
Revenue Recognition. Prior to the rescission of EITF Issue 98-10 in the fourth quarter of 2002, substantially all of our current gathering, marketing and trading activities were accounted for on a fair value basis with changes in fair value included in earnings. Qualifying derivative instruments are accounted for pursuant to SFAS No. 133 and energy trading activities were accounted for pursuant to EITF Issue 98-10. We recognize revenue on the accrual method, for non trading activities and non- derivative instruments, based on the right to receive payment for goods and services delivered to third parties.
Certain estimates were made in determining the fair value of contracts. We have determined these estimates using available market data and valuation methodologies. Judgment is required in interpreting market data, and the use of different market assumptions or estimation methodologies may affect the estimated fair value amounts.
Cost of Sales and Operating Expenses. Cost of sales includes the cost of purchasing crude oil and associated transportation costs. Operating expenses consist of field and pipeline expenses, including payroll and benefits, utilities, telecommunications, fuel and power, environmental expenses and property taxes.
Receivable Financing. SFAS No. 140 "Accounting for Transfers and Servicing of Financial Assets and Extinguishments of Liabilities—A Restatement of FASB Statement No. 125" was effective March 31, 2001. Under SFAS No. 140, transfers of accounts receivable under our receivables agreement, discussed further in Note 4, are accounted for as financings. Costs associated with the transfers are classified as "Interest Expense and Related Charges" on the Consolidated Income Statement.
Foreign Currency Transactions. Canadian operations represent all of our foreign activities. The U.S. dollar is the functional currency. Foreign currency transactions are initially translated into U.S. dollars. The resulting gains and losses are included in the determination of net income (loss) in the period in which the exchange rate changes. The gain (loss) on foreign currency transactions, included in "Other, net" on the Consolidated Income Statement was a gain of $0.1 million for the ten months ended December 31, 2003 and a gain of $0.1 million for the two months ended February 28, 2003. No gain or loss was recognized for the year ended December 31, 2002 and a $0.3 million loss was recognized for the year ended December 31, 2001.
Environmental. Expenditures for ongoing compliance with environmental regulations that relate to current operations are expensed or capitalized as appropriate. Estimated liabilities are recorded when environmental assessments indicate that remedial efforts are probable and the costs can be reasonably estimated. Estimates of the liability and insurance recovery, if any, are based upon currently available facts, existing technology and presently enacted laws and regulations and are included in the balance sheet on an undiscounted basis.
Unit Based Compensation Plans. We account for unit-based compensation using the intrinsic value recognition provisions of APB No. 25, "Accounting for Stock Issued to Employees," and related interpretations. If we had elected to recognize compensation cost based on the fair value recognition provisions of SFAS No. 123, "Accounting for Stock Based Compensation", net income (loss) and net income (loss) per unit would be unchanged for the ten months ended December 31, 2003, the two months ended February 28, 2003 and for the years ended December 31, 2002 and 2001.
3. LIQUIDITY/GOING CONCERN
General
We emerged from bankruptcy on March 1, 2003 as a highly leveraged company and have not been able to significantly reduce our debt to date. We will not be able to continue as a viable business unless we reduce our debt and attract new volumes.
Our Restructuring Plan anticipated profitable Liquids Operations and a quick return of crude oil volume growth in 2003. After incurring an operating loss of $31.0 million from our Liquids Operations since our emergence from bankruptcy, we sold our Liquids Operations in December 2003 for approximately $20 million (see Note 8). Our pre-bankruptcy customers and business partners have been less willing to do business with us than we anticipated as a result of our being highly leveraged and having shown no substantive improvement in our financial performance. Although our Restructuring Plan assumed that our marketing volumes would increase to approximately 350,000 barrels per day by the end of 2003, our actual marketing volumes were approximately 254,000 barrels per day in December 2003, and we do not anticipate an appreciable increase in volumes for the remainder of 2004.
Furthermore, as a result of our bankruptcy, we incurred higher costs in obtaining credit than we had in the past. Our trade creditors were less willing to extend credit to us on an unsecured basis and the amount of letters of credit we have been required to post for our marketing activities increased significantly. Our letters of credit outstanding at December 31, 2003 were $250 million with a maximum commitment available of $260 million.
Our cash flow from operations is not sufficient to meet our current cash requirements and, as a result, we have been borrowing under our Trade Receivables Agreement in order to fund our operations and capital needs. Absent a significant improvement in our business performance, we expect to continue to borrow to meet our cash requirements to the extent borrowed funds are available. At March 19, 2004, we have approximately $23.0 million in borrowing availability under our Trade Receivables Agreement. Based on our current cash requirements, we may exhaust our sources of available cash in the second quarter of 2004.
We have sold substantially all of our non-strategic assets in an effort to reduce our aggregate indebtedness, which was approximately $268 million as of March 15, 2004. We will not be able to use funds from future asset sales, if any, to meet our current cash needs because the proceeds from any such sales are likely to be required to reduce our outstanding indebtedness. In addition to asset sales, we have attempted, without success, to raise additional equity and to convert indebtedness to equity.
We are in advanced discussions with a potential buyer regarding the sale of substantially all of our assets; however, there can be no assurances that we can consummate a transaction. The net proceeds of the transaction would be used to repay all of our outstanding indebtedness, as well as to satisfy other existing obligations. If the transaction were consummated, we would have no further operations and would wind down over a period of time. If we are not successful in consummating the transaction, we will continue to pursue other strategic alternatives, which include the sale of additional assets (singularly or in groups) or a voluntary filing under the U.S. Bankruptcy Code. Based on our existing level of indebtedness, it is unlikely that either a sale or bankruptcy would yield any material residual value for the Company's unitholders.
Factors Adversely Affecting Our Liquidity and Working Capital
Our ability to fund our liquidity and working capital requirements has been adversely affected by various factors, including the following:
For the rolling four-month periods ending February 29, 2004, March 31, 2004 and April 30, 2004, we will be required to maintain Minimum Consolidated EBIDA of $15.7 million, $16.9 million and $16.5 million, respectively. Thereafter, the requirement continues to increase until it reaches $17.4 million for the four-month period ended August 31, 2004. Because this covenant becomes increasingly stringent, we expect we will not be in compliance with this covenant and thereby will be in default under our exit credit facilities for the foreseeable future.
For the rolling four-month periods ending February 29, 2004, March 31, 2004 and April 30, 2004, we will be required to maintain an Interest Coverage Ratio of 1.35 to 1.00, 1.36 to 1.00 and 1.34 to 1.00, respectively. This ratio requirement continues to increase until it reaches 1.42 to 1.0 for the four-month period ended August 31, 2004. Because this covenant becomes increasingly stringent, we expect we will not be in compliance with this covenant and thereby will be in default under our exit credit facilities for the foreseeable future.
Any breaches, unless waived, could severely limit our access to liquidity and credit support and result in our being required to repay all outstanding indebtedness, plus accrued and unpaid interest, under our exit credit facilities as well as the 9% Senior Note Indenture. Although our exit credit facility lenders provided a waiver for our breaches of covenants as of December 31, 2003, there can be no assurance they will provide waivers for any subsequent period, including January 31, 2004, or that any amendment to our exit credit facilities required to obtain such assurance will not adversely affect our liquidity.
Going Concern
Our Consolidated Financial statements have been prepared assuming we will continue as a going concern which contemplates the realization of assets and settlement of liabilities in the normal course of business. The factors discussed above raise substantial doubt about our ability to continue as a going
concern. Our Consolidated Financial statements do not include any adjustments that might result from the outcome of this uncertainty.
4. CREDIT RESOURCES
Summary of Debtor in Possession ("DIP") Financing
On October 18, 2002, we entered into agreements with Standard Chartered, SCTS, Lehman and other lending institutions for $575 million in DIP financing facilities. The DIP facilities provided (i) $500 million of credit and financing facilities through Standard Chartered and SCTS, which included up to $325 million for letters of credit through Standard Chartered and $175 million of inventory repurchase/accounts receivable financing through SCTS, and (ii) $75 million of term loans through Lehman and other lending institutions. The credit facilities were subject to a borrowing base and were secured by a first-priority lien on all, or substantially all, of our real and personal property. At December 31, 2002 we had amounts outstanding under the repurchase agreement and accounts receivable financing agreement of $75 million and $50 million, respectively, at weighted average interest rates of 4.4% and 4.7%, respectively. As of February 28, 2003, we had outstanding approximately $313 million of letters of credit, $125 million of inventory repurchase/accounts receivable financing, and $75 million of term loans. The DIP financing facilities contained certain restrictive covenants that, among other things, limited distributions, other debt, and certain asset sales. On February 28, 2003, as we emerged from bankruptcy, the DIP financing facilities were refinanced by the same institutions. The following discussion provides an overview of our post-bankruptcy debt.
Summary of exit credit facilities, Senior Notes, and other debt
Our emergence from bankruptcy, as of March 1, 2003, was financed through a combination of exit credit facilities, senior notes and other debt associated with settlement of claims during our bankruptcy proceedings. The table below provides a summary of these financing arrangements as of December 31, 2003.
Summary of Financing Arrangements(in millions)
| | Commitment/ Face Amount | Amount Outstanding | Maturity | ||||||
|---|---|---|---|---|---|---|---|---|---|
| Exit Credit Facilities: | |||||||||
| Letter of Credit Facility | $ | 260.0 | $ | 250.1 | August 30, 2004 | ||||
| Trade Receivables Agreement | 100.0(1) | 27.0 | March 1, 2004(2) | ||||||
| Commodity Repurchase Agreement | 18.0 | 18.0 | March 1, 2004(2) | ||||||
| Term Loans | 75.0 | 75.0 | August 30, 2004 | ||||||
| Senior Notes | 109.2 | 104.5 | March 1, 2010(3)(4) | ||||||
| Other Debt: | |||||||||
| Enron Note | 5.7 | 6.4 | October 1, 2005(3)(5) | ||||||
| Big Warrior Note | 2.5 | 2.3 | March 1, 2007(3) | ||||||
| Ad Valorem Tax Liability | 6.6 | 6.6 | March 1, 2009 | ||||||
The following is a summary of our scheduled debt maturities at December 31, 2003 (in millions):
| | 2004 | 2005 | 2006 | 2007 | 2008 | After 2008 | Total | ||||||||||||||
|---|---|---|---|---|---|---|---|---|---|---|---|---|---|---|---|---|---|---|---|---|---|
| Senior Notes | $ | — | $ | — | $ | — | $ | — | $ | — | $ | 109.2 | $ | 109.2 | |||||||
| Term Loans(1) | 75.0 | — | — | — | — | — | 75.0 | ||||||||||||||
| Commodity Repurchase Agreement(1) | 18.0 | — | — | — | — | — | 18.0 | ||||||||||||||
| Trade Receivables Agreement(1) | 27.0 | — | — | — | — | — | 27.0 | ||||||||||||||
| Enron Note(2) | 1.0 | 4.7 | — | — | — | — | 5.7 | ||||||||||||||
| Big Warrior Note | 0.3 | 0.4 | 0.4 | 1.4 | — | — | 2.5 | ||||||||||||||
| Ad Valorem Tax Liability | 2.8 | 0.9 | 1.0 | 1.1 | 0.8 | — | 6.6 | ||||||||||||||
| $ | 124.1 | $ | 6.0 | $ | 1.4 | $ | 2.5 | $ | 0.8 | $ | 109.2 | $ | 244.0 | ||||||||
Exit Credit Facilities
On February 11, 2003, we entered into our exit credit facilities with the same lenders and under substantially the same terms in the DIP financing facilities. These new facilities were effective March 1, 2003 and $2.9 million of facility and extension fees were paid in connection with these new facilities. Such fees are being amortized as interest expense over the terms of the facilities.
Letter of Credit Facility
The Letter of Credit Facility, as amended, with Standard Chartered provides $260 million of financing until August 30, 2004 and is subject to defined borrowing base limitations. The borrowing base is (as of the date of determination) the sum of cash equivalents, specified percentages of eligible receivables, deliveries, fixed assets, inventory, margin deposits and undrawn product purchase letters of credit, minus (i) first purchase crude payables, other priority claims, aggregate net amounts payable by the borrowers under certain hedging contracts and certain eligible receivables arising from future crude oil obligations, (ii) the principal amount of loans outstanding and any accrued and unpaid fees and expenses under the Term Loans, and (iii) all outstanding amounts under the Amended and Restated Commodity Repurchase Agreement and the Amended and Restated Receivables Purchase Agreement ("SCTS Purchase Agreements"). Pursuant to a scheduled advance rate reduction, effective July 1, 2003, the specified percentages of eligible receivables and fixed assets in the borrowing base were reduced. As of February 15, 2004, our aggregate letter of credit obligation exceeded the borrowing base by approximately $1.9 million. We have obtained a waiver of this violation from our lenders. As of March 15, 2004, the Borrowing Base exceeded LC Obligations by approximately $12 million.
The Letter of Credit Facility required an upfront facility fee of $1.25 million that was paid at closing. Since we did not reduce Standard Chartered's exposure below $200 million by March 1, 2004, we paid a $2.5 million fee to Standard Chartered. Letter of credit fees range from 2.25% to 2.75% per annum depending on usage. The commitment fee is 0.5% per annum of the unused portion of the Letter of Credit Facility. Additionally, we agreed to a fronting fee, which is the greater of 0.25% per annum times the face amount of the letter of credit or $250. An annual arrangement fee of 1% per annum times the average daily maximum commitment amount, as defined in the Letter of Credit Facility, is payable on a monthly basis.
The exit credit facilities include various financial covenants that we must adhere to on a monthly basis as discussed in Note 3 and set forth below.
For purposes of determining the financial information used in the financial covenants set forth above and in Note 3, we are required to exclude all items directly attributable to our Liquids Operations and the West Coast natural gas liquids assets ("Designated Assets") for the first five months ended May 31, 2003, and to make "permitted adjustments" (changes due to fresh start reporting, income and expenses attributable to the Designated Assets during the first five months
ended May 31, 2003, changes due to the cumulative affect of changes in GAAP, which are approved by the bank, gains or losses from the sales of assets or Designated Assets and any write-downs on Designated Assets), as defined.
In connection with the sale of assets in 2003 discussed in Note 8, the Letter of Credit Facility was amended to allow the net proceeds from these asset sales to be used to repay amounts outstanding under the Commodity Repurchase Agreement.
In addition, there are certain restrictive covenants that, among other things, limit other debt, certain asset sales, mergers and change in control transactions. Additionally, the exit credit facilities prohibit us from making any distributions, or purchases, acquisitions, redemptions or retirement of our LLC units so long as we have any indebtedness, liabilities or other obligations outstanding to Standard Chartered, SCTS, Lehman, or any other lenders under these facilities.
SCTS Purchase Agreements
We have an agreement with SCTS similar to our pre-bankruptcy inventory repurchase agreement, which provides for the financing of purchases of crude oil inventory utilizing a forward commodity repurchase agreement ("Commodity Repurchase Agreement"). The maximum commitment under the Commodity Repurchase Agreement was $75 million. It required an upfront facility fee of approximately $378,000 and carried an interest rate of LIBOR plus 3%. During the fourth quarter of 2003, net proceeds of $57 million from the disposition of assets were used to repay amounts outstanding under the Commodity Repurchase Agreement and the maximum commitment amount was reduced to $18 million. The Commodity Repurchase Agreement had an initial term of six months to August 30, 2003, at which time we had the option to extend for an additional twelve months. In August 2003, we amended the Commodity Repurchase Agreement to provide us the option to (1) extend the maturity date to March 1, 2004 and (2) prior to March 1, 2004, extend the maturity date to August 30, 2004. The election of each option will require the payment of an extension fee of $375,000. We elected to extend the maturity date to March 1, 2004, which required the payment of the extension fee of $375,000 and increased the interest rate to LIBOR plus 7%. We subsequently elected to extend the Commodity Repurchase Agreement to June 1, 2004, although we have an option to extend the maturity to August 30, 2004, subject to us being in compliance with our debt covenants. The election of the option required the payment of an extension fee of $0.2 million. At December 31, 2003, we had outstanding repurchase agreements of $18 million with an interest rate of 8.2%.
In addition, we also have an agreement with SCTS similar to our pre-bankruptcy trade receivables agreement, which provides for the financing of up to an aggregate amount of $100 million of certain trade receivables ("Trade Receivables Agreement") outstanding at any one time. The discount fee is LIBOR plus 3% and an upfront facility fee of approximately $504,000 was paid. The Trade Receivables Agreement had an initial term of six months to August 30, 2003, at which time we had the option to extend for an additional twelve months. In August 2003, we amended the Trade Receivables Agreement to provide us the option to (1) extend the maturity date to March 1, 2004 and (2) prior to March 1, 2004, extend the maturity date to August 30, 2004. The election of each option will require the payment of an extension fee of $0.5 million. We elected to extend the maturity date to March 1, 2004, which required the payment of an extension fee of $0.5 million and increased the interest rate to
LIBOR plus 7%. We subsequently elected to extend the Trade Receivables Agreement to June 1, 2004, although we have an option to extend the maturity to August 30, 2004. The election of the option required the payment of an extension fee of $250,000. Receivables financed at December 31, 2003 totaled $27 million at a weighted average interest rate of 8.1%.
Term Loan Agreement
We entered into an agreement with Lehman, as Term Lender Agent, and other lenders (collectively, "Term Lenders"), which provides for term loans in the aggregate amount of $75 million (the "Term Loans"). The Term Loans mature on August 30, 2004.
The financing included two term notes. The Tier-A Term Note is for $50 million with a 9% per annum interest rate. The Tier-B Term Note is for $25 million with a 10% per annum interest rate. Interest is payable monthly on both notes. An upfront fee of $750,000 was paid and we agreed to pay a deferred financing fee in the aggregate amount of $2 million on the maturity date of the Term Loans. This latter fee was fully accrued as of February 28, 2003.
The Term Loans are collateralized and have certain repayment priorities with respect to collateral proceeds pursuant to the Intercreditor and Security Agreement that is discussed below. Under the Term Loan Agreement, term loan debt outstanding is subject to a borrowing base as defined in the Letter of Credit Agreement. Further, the Term Loan Agreement contains financial covenants that mirror those outlined above in the discussion of the Letter of Credit Facility.
Intercreditor and Security Agreement
In connection with the Letter of Credit Facility, the Term Loans and the SCTS Purchase Agreements, we entered into the Intercreditor and Security Agreement ("Intercreditor Agreement") with Standard Chartered, Lehman, SCTS and various other secured parties ("Secured Parties"). This agreement provides for the sharing of collateral among the Secured Parties and prioritizes the application of collateral proceeds which provides for repayment of the Tier-A Term Note and the Standard Chartered letter of credit exposure above $300 million prior to other secured obligations.
In addition, to the extent that drawings are made on any letters of credit, Standard Chartered, as Collateral Agent, may distribute funds from our debt service payment account to itself (as letter of credit issuer ("LC Issuer") on behalf of the letter of credit participants) as needed to allow Link LLC to reimburse Standard Chartered, as letter of credit issuer, for such drawings.
Senior Notes
On October 1, 1999, we issued to the public $235 million of 11% senior notes. The senior notes were due October 1, 2009, and interest was paid semiannually on April 1 and October 1. The senior notes were fully and unconditionally guaranteed by all of our operating limited partnerships but were otherwise unsecured. On October 1, 2002, we did not make the interest payment of $12.9 million on our 11% senior notes. These notes were cancelled effective March 1, 2003 as a result of our Restructuring Plan and the holders of these notes, along with our general unsecured creditors with allowed claims, received a pro rata share of $104 million of 9% senior unsecured notes, plus a pro rata share of 11,947,820 Link LLC units.
Link LLC Senior Notes 2010
In February 2003, we issued $104 million of 9% senior unsecured notes to the Bank of New York, as depositary agent, which was subsequently allocated by the depositary agent to former holders of the 11% senior notes described above and our general unsecured creditors with allowed claims. The senior notes are due in March 2010, and interest will be paid semiannually on September 1 and March 1, with the first payment made on September 1, 2003. Under the terms of the indenture governing our senior notes, we are allowed to pay interest payments in kind by issuing additional senior notes on the first two interest payment dates. If we make payments in kind, we must make the payments as if interest were being charged at 10% per annum instead of 9% per annum. On September 1, 2003, we issued an additional senior note in the aggregate principal amount of $5.2 million to the Bank of New York in lieu of the first interest payment. On March 1, 2004, we issued an additional senior note in the aggregate principal amount of $5.5 million to the Bank of New York in lieu of the second interest payment. We may not optionally redeem the notes. The notes are subject to mandatory redemption or sinking fund payments if we sell assets and use the money for certain purposes or if we have a change of control. Provisions of the indenture could limit additional borrowings, sale and lease back transactions, affiliate transactions, purchases of our own equity, payments on debt subordinated to the senior notes, distributions to members, certain merger, consolidation or change in control transactions, or sale of assets if certain financial performance ratios are not met.
Other Debt
In connection with our settlement with Enron as part of the Restructuring Plan, we executed a $6.2 million note payable to Enron ("Enron Note") that is guaranteed by our subsidiaries. The Enron Note is secured by an irrevocable letter of credit and bears interest at 10% per annum. Interest is paid semiannually on April 1 and October 1, beginning on April 1, 2003 and we are allowed to pay interest payments in kind on the first two interest payment dates. Principal payments of $1 million are payable in October 2003 and October 2004, with the remaining principal balance due in October 2005. On October 1, 2003, we paid our first principal payment of $1.0 million and elected to pay our interest payment of $0.3 million in kind. We failed to cause the letter of credit to be renewed at least 10 business days prior to its expiration, which resulted in an event of default under, and the automatic acceleration of, the Enron Note. A replacement letter of credit has been issued and we have requested Enron to waive the event of default and rescind the automatic acceleration of the note. There can be no assurance that Enron will provide the waiver, and therefore, the Enron Note is recorded in Other Current Liabilities on the Consolidated Balance Sheet at December 31, 2003.
In connection with a settlement with Big Warrior Corporation ("Big Warrior") during our bankruptcy, we executed a $2.7 million note payable to Big Warrior, which is secured by a second lien position in one of our Mississippi pipelines. The four-year note is payable in quarterly installments which began June 1, 2003 based on a seven-year amortization schedule, at an interest rate of 6% per annum. A final balloon payment is due March 1, 2007. Effective July 31, 2003, Farallon Capital Partners, L.P. ("Farallon") and Tinicum Partners, L.P. ("Tinicum"), both of which are Term Lenders, purchased this note from Big Warrior.
In conjunction with our Restructuring Plan, we agreed to pay accrued but unpaid ad valorem taxes over six years from the effective date of our Restructuring Plan. This debt bears interest at 6% with principal and interest payments due quarterly. The first payment was made on June 1, 2003. Unpaid ad valorem taxes of $2 million associated with the Liquids Operations sold on December 31, 2003 (see Note 8) were paid in January 2004.
5. BANKRUPTCY PROCEEDINGS AND RESTRUCTURING PLAN
On October 8, 2002, the MLP and the Subsidiary Entities filed pre-negotiated voluntary petitions for reorganization under Chapter 11 of the United States Bankruptcy Code (the "EOTT Bankruptcy"). The filing was made in the United States Bankruptcy Court for the Southern District of Texas, Corpus Christi Division (the "EOTT Bankruptcy Court"). Additionally, the General Partner filed a voluntary petition for reorganization under Chapter 11 on October 21, 2002 in the EOTT Bankruptcy Court in order to join in the voluntary, pre-negotiated Restructuring Plan. On October 24, 2002, the EOTT Bankruptcy Court administratively consolidated, for distribution purposes, the General Partner's bankruptcy filing with the previously filed cases. We operated as debtors-in-possession under the Bankruptcy Code, which means we continued to remain in possession of our assets and properties and continued our day-to-day operations. The EOTT Bankruptcy Court confirmed our Restructuring Plan on February 18, 2003, and it became effective March 1, 2003.
We entered into an agreement, dated October 7, 2002, with Enron, Standard Chartered Bank ("Standard Chartered"), Standard Chartered Trade Services Corporation ("SCTS"), Lehman Commercial Paper Inc. ("Lehman Commercial") and holders of approximately 66% of the outstanding principal amount of our 11% senior notes (the "Restructuring Agreement"). Under this Restructuring Agreement, Enron, Standard Chartered, SCTS, Lehman Commercial and approximately 66% of our 11% senior note holders agreed to vote in favor of the Restructuring Plan, and to refrain from taking actions not in support of the Restructuring Plan.
The Restructuring Plan, however, was subject to the approval of the EOTT Bankruptcy Court, and the Settlement Agreement with Enron ("Enron Settlement Agreement") was subject to the additional approval of the United States Bankruptcy Court for the Southern District of New York (the "Enron Bankruptcy Court"), where Enron and certain of its affiliates filed for Chapter 11 bankruptcy protection. The EOTT Bankruptcy Court approved the Enron Settlement Agreement on November 22, 2002, and the Enron Bankruptcy Court approved the Enron Settlement Agreement on December 5, 2002. The major provisions of the Restructuring Plan, which became effective March 1, 2003, are as follows:
As a result of the confirmation of our Restructuring Plan, the following liabilities that were deemed subject to compromise were either discharged by the EOTT Bankruptcy Court or retained as ongoing obligations of the Successor Company. Estimated liabilities subject to compromise at December 31, 2002 were as follows (in thousands):
| 11% Senior Notes | $ | 235,000 | ||
| Interest payable—11% Senior Notes | 13,481 | |||
| Accounts payable and suspense payable | 34,876 | |||
| Allowed claims for environmental settlements and contingencies | 7,970 | |||
| Other | 1,500 | |||
| Total | $ | 292,827 | ||
The following reorganization items and net gain on discharge of debt, which were specifically related to the EOTT Bankruptcy, were recorded during the two months ended February 28, 2003, (in thousands):
| Reorganization items—legal and professional fees | $ | (7,330 | ) | |
| Net gain on discharge of 11% senior notes, related accrued interest and other debt(1) | $ | 131,560 |
6. FRESH START REPORTING
As previously discussed, our Consolidated Financial Statements reflect the adoption of fresh start reporting required by SOP 90-7 for periods subsequent to our emergence from bankruptcy. In accordance with the principles of fresh start reporting, we have adjusted our assets and liabilities to their fair values as of February 28, 2003. The net effect of the fresh start reporting adjustments was a loss of $56.8 million, which is reflected in the results of operations of the Predecessor Company for the two months ended February 28, 2003.
The enterprise value of Link on the effective date of the Restructuring Plan was determined to be approximately $363 million. The enterprise value was determined with the assistance of a third party financial advisor using discounted cash flow, comparable transaction and capital market comparison analyses, adjusted for the actual working capital as of the effective date of the Restructuring Plan. The discounted cash flow analyses were based upon five year projected financial results, including an assumption for terminal values using cash flow multiples, discounted at our estimated post-restructuring weighted-average cost of capital.
Pursuant to SOP 90-7, the reorganization value of Link on the effective date of the Restructuring Plan was determined to be approximately $856 million, which represented the enterprise value plus the fair value of current liabilities exclusive of funded debt on February 28, 2003. We have allocated the reorganization value as of February 28, 2003 to tangible and identifiable intangible assets in conformity with SFAS No. 141, "Business Combinations", using discounted cash flow and replacement cost valuation analyses, and liabilities, including debt, were recorded at their net present values. Independent third-party valuation specialists were used to determine the allocation of the reorganization value to our tangible and identifiable intangible assets and to determine the fair value of our long-term liabilities.
The valuations were based on a number of estimates and assumptions, which are inherently subject to significant uncertainties and contingencies beyond our control. Accordingly, there can be no assurance that the valuations will be realized, and actual results could vary significantly.
The effects of the reorganization pursuant to the Restructuring Plan and the application of fresh start reporting on the Predecessor Company's consolidated balance sheet as of February 28, 2003 are as follows (in thousands):
| | Predecessor Company February 28, 2003 | Debt Discharge and Re-Class Adjustments | Fresh Start Adjustments | Successor Company February 28, 2003 | |||||||||
|---|---|---|---|---|---|---|---|---|---|---|---|---|---|
| | (Restated) | | | (Restated) | |||||||||
| Assets Current Assets Cash and cash equivalents | $ | 40,735 | $ | — | $ | — | $ | 40,735 | |||||
| Trade and other receivables | 439,361 | — | — | 439,361 | |||||||||
| Inventories | 25,525 | — | 750 | (g) | 26,275 | ||||||||
| Other | 12,911 | — | (2,021 | )(h) | 10,890 | ||||||||
| Total current assets | 518,532 | — | (1,271 | ) | 517,261 | ||||||||
| Property, Plant and Equipment, at cost | 598,633 | — | (267,654 | )(i) | 330,979 | ||||||||
| Less: Accumulated depreciation | 223,188 | — | (223,188 | )(i) | — | ||||||||
| Net property, plant and equipment | 375,445 | — | (44,466 | ) | 330,979 | ||||||||
| Goodwill | 7,436 | — | (7,436 | )(j) | — | ||||||||
| Other Assets | 10,762 | — | (2,880 | )(h) | 7,882 | ||||||||
| Total Assets | $ | 912,175 | $ | — | $ | (56,053 | ) | $ | 856,122 | ||||
| Liabilities and Members'/Partners' Capital Current Liabilities Trade and other accounts payable | $ | 451,873 | $ | 17,406 | (a) | $ | — | $ | 469,279 | ||||
| Accrued taxes payable | 13,045 | (8,307 | )(b) | — | 4,738 | ||||||||
| Term loans | 75,000 | (75,000 | )(c) | — | — | ||||||||
| Repurchase agreement | 75,000 | (75,000 | )(c) | — | — | ||||||||
| Receivable financing | 50,000 | — | — | 50,000 | |||||||||
| Other | 19,226 | 2,815 | (a)(b) | 318 | (k) | 22,359 | |||||||
| Total current liabilities | 684,144 | (138,086 | ) | 318 | 546,376 | ||||||||
| Long-Term Liabilities 9% Senior Notes | — | 98,800 | (d) | — | 98,800 | ||||||||
| Term loans | — | 75,000 | (c) | — | 75,000 | ||||||||
| Repurchase agreement | — | 75,000 | (c) | — | 75,000 | ||||||||
| Ad valorem tax liability | — | 6,992 | (b) | — | 6,992 | ||||||||
| Other | 17,781 | — | 400 | (k) | 18,181 | ||||||||
| Total long-term liabilities | 17,781 | 255,792 | 400 | 273,973 | |||||||||
| Liabilities Subject to Compromise | 284,843 | (284,843 | )(a) | — | — | ||||||||
| Additional Partnership Interests | 9,318 | (9,318 | )(e) | — | — | ||||||||
| Members'/Partners' Capital (Deficit) | (83,911 | ) | 176,455 | (f) | (56,771 | ) | 35,773 | ||||||
| Total Liabilities and Members'/Partners' Capital | $ | 912,175 | $ | — | $ | (56,053 | ) | $ | 856,122 | ||||
Notes:
7. PROPERTY, PLANT AND EQUIPMENT
The components of property, plant and equipment are as follows (in thousands):
| | Successor Company December 31, 2003 | Predecessor Company December 31, 2002 | |||||
|---|---|---|---|---|---|---|---|
| Operating PP&E, including pipelines, storage tanks, etc | $ | 268,866 | $ | 477,834 | |||
| Office PP&E buildings and leasehold improvements | 1,717 | 52,621 | |||||
| Tractors and trailers and other vehicles | 1,248 | 10,739 | |||||
| Land | 6,893 | 5,216 | |||||
| Property, Plant & Equipment | 278,724 | 546,410 | |||||
| Less: Accumulated depreciation | (16,214 | ) | (205,351 | ) | |||
| Net Property, Plant & Equipment | $ | 262,510 | $ | 341,059 | |||
8. DISPOSITIONS OF ASSETS
Discontinued Operations—West Coast Assets
Effective June 25, 2003, we signed a definitive agreement to sell all of the assets comprising our natural gas gathering, processing, natural gas liquids fractionation, storage and related trucking and distribution facilities located on the West Coast. A sale of these assets to a third party had been one of the options considered by us since we emerged from bankruptcy. The sales price for the assets exclusive of inventory was $9.9 million. The proceeds from the sale of the West Coast natural gas liquids assets
could be increased by up to $1.4 million depending on the operating results of the West Coast natural gas liquids assets during the twelve month period following closing. The closing occurred on October 1, 2003, and $9.0 million of the net proceeds from the sale were used to pay down amounts outstanding under the Commodity Repurchase Agreement.
Effective June 1, 2002, we sold our West Coast refined products marketing operations to Trammo Petroleum Inc. The sales price was not significant.
Effective June 30, 2001, we sold our West Coast crude oil gathering and blending operations to Pacific Marketing and Transportation LLC ("Pacific") for $14.3 million. We could have been required to repay up to $1.5 million of the sale price, subject to a two-year look-back provision regarding average operating results during the period July 1, 2001 through June 30, 2003. Such amount is reflected in Liabilities Subject to Compromise in the Consolidated Balance Sheet at December 31, 2002. In addition, we also provided customary indemnifications to Pacific with a maximum aggregate exposure of $3.7 million, whose terms were due to expire between June 2002 through June 2006. In the third quarter of 2003, we negotiated a settlement and release with Pacific of all remaining obligations related to the sale for a payment of $0.2 million.
Revenues and results of operations for the West Coast operating segment for the ten months ended December 31, 2003, the two months ended February 28, 2003, and the years ended December 31, 2002 and 2001 are shown below (in (in thousands). We did not allocate any interest expense to the West Coast discontinued operations for any of the periods presented below.
| | Successor Company | Predecessor Company | |||||||||||
|---|---|---|---|---|---|---|---|---|---|---|---|---|---|
| | Ten Months ended December 31, 2003 | Two Months ended February 28, 2003 | Year ended December 31, 2002 | Year ended December 31, 2001 | |||||||||
| | (Restated) | (Restated) | (Restated) | | |||||||||
| Revenues | $ | 20,639 | $ | 5,571 | $ | 68,467 | $ | 491,091 | |||||
| Income (loss) from discontinued operations | $ | 752 | $ | 395 | $ | (25,246 | ) | $ | (4,679 | ) | |||
The income (loss) from the West Coast discontinued operations includes a loss on disposal of $0.8 million for the ten months ended December 31, 2003, no gain or loss recognized for the two months ended February 28, 2003, a gain on disposal of $0.2 million and a loss on disposal of $1.3 million for the years ended December 31, 2002 and 2001, respectively. At December 31, 2002, we recorded an impairment charge of $22.9 million to reflect these assets at their estimated fair values at December 31, 2002.
Discontinued Operations—Liquids Operations
Effective December 31, 2003, we sold all of our remaining natural gas liquids assets to a subsidiary of Valero Energy Corporation ("Valero") for approximately $20 million, plus inventory value. The assets included our underground salt dome storage facility and related pipeline grid near Mont Belvieu, Texas as well as our processing facility and former methyl tertiary butyl ether ("MTBE") plant at Morgan's Point, near La Porte, Texas. Net proceeds of approximately $15 million from the sale were used to pay down amounts outstanding under the Commodity Repurchase Agreement.
Net proceeds from the sale of approximately $6 million were placed in escrow for ad valorem tax liabilities associated with the assets sold, reimbursement of any costs associated with potential title defects and adjustments associated with the verification of actual inventory balances sold.
In connection with the sale, we provided indemnifications to Valero for (1) title defects for a period of two years up to a maximum amount of $2 million and (2) preclosing environmental liabilities with an indefinite term and no monetary limits. We recorded a $1.1 million liability at December 31, 2003, reflecting the estimated fair value of these obligations.
Revenues and results of operations for the Liquids Operations for the ten months ended December 31, 2003, the two months ended February 28, 2003 and the years ended December 31, 2002 and 2001 are shown below (in thousands). We did not allocate any interest expense to the Liquids discontinued operations for any periods presented below.
| | Successor Company | Predecessor Company | |||||||||||
|---|---|---|---|---|---|---|---|---|---|---|---|---|---|
| | Ten Months ended December 31, 2003 | Two Months ended February 28, 2003 | Year ended December 31, 2002 | Year ended December 31, 2001 | |||||||||
| | (Restated) | (Restated) | (Restated) | | |||||||||
| Revenues | $ | 128,684 | $ | 40,337 | $ | 212,670 | $ | 48,701 | |||||
| Income (loss) from discontinued operations | $ | (30,966 | ) | $ | 124 | $ | (37,467 | ) | $ | (11,926 | ) | ||
Income (loss) from the Liquids discontinued operations for the ten months ended December 31, 2003 includes a loss on disposal of $8.4 million. At December 31, 2002, we recorded impairments of $33.0 million and $20.2 million related to our Mont Belvieu and Morgan's Point facilities, respectively, to reflect these assets at their estimated fair values at December 31, 2002.
During the fourth quarter of 2003, pursuant to a previously announced plan to reduce our Liquids Operations, we began to phase out our MTBE production at the Morgan's Point Facility. The decision to cease production of MTBE and end our financial exposure to the MTBE market was made after earlier attempts to sell the Liquids Operations terminated unsuccessfully. In connection with the phase out of MTBE production, we recorded charges in September 2003 for severance costs of $1.8 million, asset impairments of $2.8 million and the write-down of our materials and supplies inventory of $2.3 million. The severance costs were accrued pursuant to our pre-existing severance plan in accordance with SFAS No. 112, "Employers' Accounting for Post Employment Benefits—an Amendment of FASB Statements No. 5 and 43". The impairment charges reflect adjustments to the carrying values of long-lived assets used in the MTBE manufacturing operations to reflect their fair values. The charge for materials and supplies represents an adjustment to the carrying values of inventory items to reflect their net realizable values. The market for surplus MTBE related materials and supplies has been severely impacted by recent plant shut downs.
Our Liquids Operations were originally acquired effective June 30, 2001. We paid $117 million in cash to Enron and State Street Bank and Trust Company of Connecticut, National Association, Trustee.
Concurrently with the acquisition of the Liquids Operations, we entered into a ten-year tolling agreement for the conversion of feedstocks into products, on a take-or-pay basis ("Toll Conversion Agreement"), and a ten-year storage and transportation agreement for the use of a significant portion of the Mont Belvieu Facility and pipeline grid system, on a take-or-pay basis ("Storage Agreement"). Both agreements were with Enron Gas Liquids, Inc. ("EGLI"), a wholly-owned subsidiary of Enron, which is now in bankruptcy. Under these agreements EGLI retained all existing third party commodity, transportation and storage contracts associated with these facilities. These agreements were the principle basis for determining the desirability of the transaction and the purchase price of the Liquids assets.
As more fully explained in Note 18, on December 3, 2001, EGLI was included in Enron's bankruptcy filing. Due to the non-performance by EGLI under the Toll Conversion Agreement in late November 2001, we began to operate the Morgan's Point Facility as a merchant operation in the spot market. We were unable to enter into third party spot or term contracts for storage until the Storage Agreement was rejected by EGLI. On April 2, 2002, the Bankruptcy Court entered a stipulation and agreed order rejecting the Toll Conversion and Storage Agreements (the "Stipulation"), which order became final and non-appealable on April 12, 2002. Rejection of the Storage Agreement with EGLI resulted in the loss of the buyer of the fixed throughput and storage capacity at the Mont Belvieu Facility. However, the rejection allowed us to directly seek new customers and pursue long-term contracts for the Mont Belvieu Facility to replace the long-term and continuous stream of revenue we expected under the Storage Agreement with EGLI. As a result of EGLI's non-performance under these contracts, we recorded a $29.1 million impairment in the fourth quarter of 2001.
Sales of Other Assets
On October 1, 2003, we sold certain crude oil marketing and transportation assets in the Arkansas, Louisiana and Texas ("ArkLaTex") area to Plains Marketing L.P. and Plains All American Pipeline, L.P., a wholly owned subsidiary of Plains Resources, Inc. The sales price for these assets, including linefill, was approximately $17 million. Subsequent to closing, $16.2 million of the net proceeds from the sale were used to pay down amounts outstanding under the Commodity Repurchase Agreement. The gain on the sale of these assets was $11.7 million. The long-lived assets disposed of were historically presented in the North American Crude Oil and Pipeline Operations operating segments.
In the fourth quarter of 2003, we entered into a Crude Oil Joint Marketing Agreement with ChevronTexaco Global Trading, a division of Chevron U.S.A. Inc. ("ChevronTexaco"). The agreement was effective January 1, 2004 with a term of 10 years. Under the agreement, ChevronTexaco will market all of the Company's lease crude oil in West Texas and Eastern New Mexico, with the Company handling the transportation of the crude oil and related administrative functions. The agreement contains various performance factors which must be met in order for the agreement to remain in effect for the full term of the agreement and if ChevronTexaco does not achieve certain performance targets during the first year of the agreement, we have agreed to economic adjustments not to exceed $1 million. In addition, if this agreement is terminated prior to January, 2006, as a result of us (1) divesting all or substantially all of our assets within the West Texas and New Mexico area or (2) seeking the protection of bankruptcy and are no longer able to perform our obligations under this
agreement, then we will owe ChevronTexaco a $1 million termination payment. No assets were sold pursuant to this agreement, with the exception of linefill. In December 2003, the Company sold approximately 370,000 barrels of linefill held in West Texas and New Mexico to ChevronTexaco for approximately $10 million. The Company recognized a gain of approximately $2.6 million related to the sale, which gain has been deferred (included in Other Long-Term Liabilities on the Consolidated Balance Sheet), as the agreement contains mandatory obligations for the Company to repurchase the linefill from ChevronTexaco in the event that the agreement is terminated within the first five years.
9. CHANGE IN ESTIMATE OF CRUDE OIL LINEFILL
Measuring the physical volumes of crude oil linefill in certain of the pipelines we operate in the West Texas and New Mexico area is inherently difficult. Because these pipelines are operated under very little pressure, unlike the vast majority of our other pipelines, we cannot use traditional engineering based methods to estimate the physical volumes in the system but instead have utilized certain operational assumptions and topographical information which take into consideration the measurement limitations.
As a part of our pipeline integrity management program, we are in the process of removing from service various pipelines we operate in this area, some of which were acquired from Texas-New Mexico Pipe Line Company in 1999. The actual physical volume of crude oil linefill we removed from the line we took out of service during the third quarter of 2003 was less than our estimate of linefill volume for the applicable pipeline. Following this discovery, we initiated a thorough review of our estimates for all of our pipelines which are operated under very little pressure. We also engaged the services of a third party consultant to review our methodology of estimating linefill volumes. After completing this review, we revised downward our estimates of the physical volume of crude oil linefill in certain of our pipelines by approximately 170,000 barrels. As a result, we recorded a charge of $4.6 million to reflect our change in estimate of physical linefill volumes based on September 30, 2003 market prices. The charge was recorded in cost of sales in the Consolidated Statements of Operations.
We currently estimate that we will complete the program to remove these pipelines from service in the first half of 2004. The amount of crude oil linefill we ultimately remove from the affected pipelines could differ materially from our current estimates. Therefore, additional charges could be required in the near term.
10. RESTATEMENT OF FINANCIAL RESULTS
As reported in our initial Annual Report on Form 10-K for 2003, we identified control deficiencies with inventory and accounts payable reconciliation procedures in our pipelines and liquids operations. In order to address these issues, we designed and implemented additional procedures to provide reasonable assurance that these control deficiencies did not lead to a further misstatement in our consolidated financial statements. Related to this matter, we originally recorded charges in the third and fourth quarter of 2003 of $1.8 million and $0.9 million, respectively.
We are restating prior year financial results to reflect the inventory and accounts payable reconciliation adjustments in prior periods. The restatement results in a decrease in our net loss for the
ten months ended December 31, 2003 of $0.9 million, an increase in our net income for the two months ended February 28, 2003 of $0.9 million, and an increase in our net loss for the years ended December 31, 2002 and 2001 of $1.5 million and $0.3 million respectively.
A summary of the effects of the restatement on reported amounts for the ten months ended December 31, 2003, the two months ended February 28, 2003, and the years ended December 31,2002 and 2001 are presented below. The effects on reported amounts for the quarterly periods in the years 2003 and 2002 are presented in Note 22. (Amounts in thousands, except per share amounts).
| | Successor Company | Predecessor Company | ||||||||||||
|---|---|---|---|---|---|---|---|---|---|---|---|---|---|---|
| | Ten Months ended December 31, 2003 | Two Months ended February 28, 2003 | Year ended December 31, 2002 | Year ended December 31, 2001 | ||||||||||
| REVENUE | ||||||||||||||
| As Reported | $ | 152,678 | $ | 31,979 | $ | 182,942 | $ | 250,573 | ||||||
| As Restated | 153,033 | 31,635 | 182,932 | 250,571 | ||||||||||
| GROSS PROFIT | ||||||||||||||
| As Reported | 41,440 | 9,681 | 37,558 | 81,902 | ||||||||||
| As Restated | 41,929 | 9,971 | 37,030 | 81,651 | ||||||||||
| OPERATING INCOME | ||||||||||||||
| As Reported | 9,326 | 2,324 | (27,067 | ) | 34,860 | |||||||||
| As Restated | 9,815 | 2,614 | (27,595 | ) | 34,609 | |||||||||
| NET INCOME (LOSS) | ||||||||||||||
| As Reported | (53,829 | ) | 60,267 | (101,731 | ) | (15,233 | ) | |||||||
| As Restated | (52,915 | ) | 61,127 | (103,254 | ) | (15,484 | ) | |||||||
| DILUTED EARNINGS (LOSS) PER UNIT | ||||||||||||||
| As Reported | (4.37 | ) | 0.08 | (1.07 | ) | (0.54 | ) | |||||||
| As Restated | (4.29 | ) | 0.10 | (1.08 | ) | (0.55 | ) | |||||||
11. CAPITAL
As part of the Restructuring Plan, EOTT's common units, subordinated units and additional partnership interests were canceled and 14,475,321 new limited liability company units ("LLC units") were authorized. Holders of common units received 369,520 LLC units and 957,981 warrants to purchase additional LLC units. The warrants have a five-year term, a strike price of $12.50, are exercisable after June 30, 2003 and had an estimated fair value of $0.01 per warrant as of the effective date of the Restructuring Plan. Holders of EOTT's former 11% senior notes and general unsecured creditors with allowed claims received a pro rata allocation of 11,947,820 LLC units. The Bank of New York, the depositary agent, distributed approximately 90% of the LLC units in August 2003 and the final allocation of units was completed in December 2003. Additionally, 1.2 million LLC units were reserved for a management incentive plan for issuance to certain key employees and directors. See further discussion in Note 19.
The following is a rollforward of LLC units and warrants outstanding:
| | Common Units | Subordinated Units | LLC Units | Warrants | |||||
|---|---|---|---|---|---|---|---|---|---|
| Units Outstanding at December 31, 2002 | 18,476,011 | 9,000,000 | — | — | |||||
| Units Cancelled in Connection with Restructuring Plan | (18,476,011 | ) | (9,000,000 | ) | — | — | |||
| Issuance of New LLC Units and Warrants | — | — | 12,317,340 | 957,981 | |||||
| LLC Units and Warrants Outstanding as of February 28, 2003 | — | — | 12,317,340 | 957,981 | |||||
| Exercise of Warrants | — | — | 35,549 | (35,549 | ) | ||||
| Restricted Units Outstanding | — | — | 830,000 | — | |||||
| LLC Units and Warrants Outstanding at December 31, 2003 | — | — | 13,182,889 | 922,432 | |||||
The LLC units and the warrants were issued pursuant to an exemption from the registration requirements of the Securities Act of 1933, as amended and applicable state law, pursuant to the exemptions afforded under Section 1145, Title 11 of the U.S. Bankruptcy Code. The LLC units and the warrants have been registered pursuant to the Securities Exchange Act of 1934, as amended (the "Exchange Act") pursuant to Section 12(g) and we are therefore a reporting company under the Exchange Act. Neither the LLC units nor the warrants are traded on any national exchange or pursuant to an automated quotation system administered by the National Association of Securities Dealers, Inc. ("NASD").
The LLC units issued pursuant to the Restructuring Plan are subject to the terms of a Registration Rights Agreement effective March 1, 2003 (the "Registration Rights Agreement"). Following completion of the audit of our financial statements for the year ending December 31, 2003, any holders of 10% or more of the securities eligible for registration under the terms of the Registration Rights Agreement will be entitled to demand registration of their LLC units, subject to certain conditions. The Registration Rights Agreement also provides for customary piggyback registration rights entitling holders of LLC units to include their units in any registration in which we may engage, subject to certain conditions. We will be required to pay all registration expenses in connection with any such registrations.
The LLC units are subject to the terms of an LLC Agreement, which currently, among other things, restricts the issuance of additional equity interests in Link without the approval of holders of at least two-thirds of the outstanding units.
12. EARNINGS PER UNIT
Basic earnings per unit include the weighted average impact of outstanding units (i.e., it excludes unit equivalents). Diluted earnings per unit consider the impact of all potentially dilutive securities.
Successor Company
Basic and diluted net loss per unit for the Successor Company were $4.29 for the ten months ended December 31, 2003. Outstanding stock warrants and contingently issuable restricted units were determined to be antidilutive and are not included in the computation of fully diluted earnings per unit. Basic and diluted net loss per unit from continuing operations were $1.84 for the ten months ended December 31, 2003. Basic and diluted net loss per unit from discontinued operations were $2.45 for the ten months ended December 31, 2003.
Predecessor Company
Total and per unit information related to income (loss) from continuing operations, discontinued operations, the cumulative effect of an accounting change and net income (loss) for the Predecessor
Company is shown in the tables below. All amounts exclude amounts allocated to the General Partner (in thousands, except per unit amounts):
| | Two Months ended February 28, 2003 (Restated) | |||||||||||||||||
|---|---|---|---|---|---|---|---|---|---|---|---|---|---|---|---|---|---|---|
| | Basic(1) | | | |||||||||||||||
| | Common | Subordinated | Diluted(2) | |||||||||||||||
| | Income (Loss) | Per Unit | Income (Loss) | Per Unit | Income (Loss) | Per Unit | ||||||||||||
| Income (Loss) from Continuing Operations | $ | 2,133 | $ | 0.11 | $ | — | $ | — | $ | 2,133 | $ | 0.08 | ||||||
| Income (Loss) from Discontinued Operations(3) | 519 | 0.03 | — | — | 519 | 0.02 | ||||||||||||
| Cumulative Effect of Accounting Changes(4) | — | — | — | — | — | — | ||||||||||||
| Net Income (Loss) | $ | 2,652 | $ | 0.14 | $ | — | $ | — | $ | 2,652 | $ | 0.10 | ||||||
| Weighted Average Units Outstanding | 18,476 | 9,000 | 27,476 | |||||||||||||||
| | Year ended December 31, 2002 (Restated) | ||||||||||||||||||
|---|---|---|---|---|---|---|---|---|---|---|---|---|---|---|---|---|---|---|---|
| | Basic(1) | | | ||||||||||||||||
| | Common | Subordinated | Diluted(2) | ||||||||||||||||
| | Income (Loss) | Per Unit | Income (Loss) | Per Unit | Income (Loss) | Per Unit | |||||||||||||
| Income (Loss) from Continuing Operations | $ | (1,017 | ) | $ | (0.06 | ) | $ | (29,074 | ) | $ | (3.23 | ) | $ | (30,091 | ) | $ | (1.10 | ) | |
| Income (Loss) from Discontinued Operations(3) | 464 | 0.03 | — | — | 464 | 0.02 | |||||||||||||
| Net Income (Loss) | $ | (553 | ) | $ | (0.03 | ) | $ | (29,074 | ) | $ | (3.23 | ) | $ | (29,627 | ) | $ | (1.08 | ) | |
| Weighted Average Units Outstanding | 18,476 | 9,000 | 27,476 | ||||||||||||||||
| | Year ended December 31, 2001 (Restated) | ||||||||||||||||||
|---|---|---|---|---|---|---|---|---|---|---|---|---|---|---|---|---|---|---|---|
| | Basic(1) | | | ||||||||||||||||
| | Common | Subordinated | Diluted(2) | ||||||||||||||||
| | Income (Loss) | Per Unit | Income (Loss) | Per Unit | Income (Loss) | Per Unit | |||||||||||||
| Income (Loss) from Continuing Operations | $ | 31 | $ | — | $ | 14 | $ | — | $ | 45 | $ | — | |||||||
| Income (Loss) from Discontinued Operations(3) | (10,945 | ) | (0.59 | ) | (5,331 | ) | (0.59 | ) | (16,276 | ) | (0.59 | ) | |||||||
| Cumulative Effect of Accounting Changes | 707 | 0.04 | 344 | 0.04 | 1,051 | 0.04 | |||||||||||||
| Net Income (Loss) | $ | (10,207 | ) | $ | (0.55 | ) | $ | (4,973 | ) | $ | (0.55 | ) | $ | (15,180 | ) | $ | (0.55 | ) | |
| Weighted Average Units Outstanding | 18,476 | 9,000 | 27,476 | ||||||||||||||||
2002 net losses among the unitholders and the General Partner was recouped during the two months ended February 28, 2003.
13. OPERATING REVENUES
In connection with adopting EITF Issue 02-03, revenues and cost of sales related to our crude oil marketing and trading activities have been presented on a net basis. Gross revenues and purchase costs that have been netted are as follows (in thousands):
| | | Predecessor Company | ||||||||||
|---|---|---|---|---|---|---|---|---|---|---|---|---|
| | Successor Company | |||||||||||
| | | Year ended December 31, | ||||||||||
| | Ten Months ended December 31, 2003 | Two Months ended February 28, 2003 | ||||||||||
| | 2002 | 2001 | ||||||||||
| | (Restated) | (Restated) | (Restated) | (Restated) | ||||||||
| Gross revenue | $ | 4,260,719 | $ | 831,187 | $ | 4,541,591 | $ | 8,081,536 | ||||
| Purchase costs reclassified | 4,124,451 | 803,974 | 4,386,983 | 7,854,972 | ||||||||
| Operating revenues for marketing and trading operations, net | 136,268 | 27,213 | 154,608 | 226,564 | ||||||||
| Gross revenue from other operations | 16,765 | 4,422 | 28,324 | 24,007 | ||||||||
| Operating revenue | $ | 153,033 | $ | 31,635 | $ | 182,932 | $ | 250,571 | ||||
Consistent with standard crude oil industry practice, we utilize "buy/sell" contracts to facilitate our delivery obligations and to limit our overall risk. We utilize buy/sell contracts to price the relative values of crude oil that we seek to exchange between locations. The economic objective is to exchange one barrel of crude oil for another barrel of crude oil that has a different attribute such as, but not limited to, quality, location or delivery period. The primary objective of pricing both sides of a buy/sell contract at prices reflective of the crude oil's relative values is to allow for volume variances which occur between the estimated scheduled volumes and actual deliveries. If all volumes on these crude oil purchase contracts were exactly as forecast each month, such contracts could be handled by exchange contracts, with simply a location and quality differential. However, volumes are frequently (almost always in the case of lease production) different than scheduled. Both parties to the transaction are protected against volume variances by using the current month's market price for each grade, location or delivery period associated with the different barrels of crude oil.
The following amounts have been recorded for buy/sell contracts in Operating Revenue in the Consolidated Statements of Operations (in millions):
| | | Predecessor Company | ||||||||||
|---|---|---|---|---|---|---|---|---|---|---|---|---|
| | Successor Company | | Year ended December 31, | |||||||||
| | Ten Months ended December 31, 2003 | Two Months ended February 28, 2003 | ||||||||||
| | 2002 | 2001 | ||||||||||
| Gross revenues | $ | 2,735 | $ | 502 | $ | 2,568 | $ | 5,075 | ||||
| Purchase costs | 2,625 | 481 | 2,474 | 5,013 | ||||||||
| Net operating revenue | $ | 110 | $ | 21 | $ | 94 | $ | 62 | ||||
14. OTHER (INCOME) EXPENSE.
The components of other (income) expense are as follows (in thousands):
| | | Predecessor Company | ||||||||||||
|---|---|---|---|---|---|---|---|---|---|---|---|---|---|---|
| | Successor Company | | Year ended December 31, | |||||||||||
| | Ten Months ended December 31, 2003 | Two Months ended February 28, 2003 | ||||||||||||
| | 2002 | 2001 | ||||||||||||
| (Gain) loss on disposal of fixed assets | $ | (11,885 | ) | $ | — | $ | 1,184 | $ | (1,108 | ) | ||||
| Litigation settlements and provisions | (1,171 | ) | — | 7,970 | 528 | |||||||||
| Gain on sale of NYMEX seats | — | — | (1,297 | ) | — | |||||||||
| Other income | (811 | ) | (8 | ) | (1,147 | ) | (512 | ) | ||||||
| Total | $ | (13,867 | ) | $ | (8 | ) | $ | 6,710 | $ | (1,092 | ) | |||
15. COMMITMENTS AND CONTINGENCIES
Operating Leases. We lease certain real property, equipment, and operating facilities under various operating leases. Future non-cancelable commitments related to these items at December 31, 2003, are as follows (in millions): years ending December 31, 2004—$5.3; 2005—$4.2; 2006—$3.3; 2007—$1.0; 2008—$0.3; thereafter—$0.4.
Total lease expense incurred was $5.9 million for the ten months ended December 31, 2003, $1.2 million for the two months ended February 28, 2003 and $7.7 million and $8.3 million for the years ended December 31, 2002 and 2001, respectively.
Indemnities. In November 2002, the Financial Accounting Standards Board ("FASB") issued Interpretation No. 45, "Guarantor's Accounting and Disclosure Requirements for Guarantees, Including Indirect Guarantees of Indebtedness of Others" ("FIN 45"). FIN 45 requires disclosures to be made by a guarantor in its financial statements about its obligations under certain guarantees it has issued and that a guarantor recognize, at the inception of a guarantee, a liability for the fair value of the obligation under the guarantee. We are a party to various contracts entered into in the ordinary course of business that contain indemnity provisions. Our obligations under the indemnities are contingent upon the occurrence of events or circumstances specified in the contracts. No such events or circumstances have occurred to date and we do not consider our liability under the indemnities to be material to our financial position or results of operations.
Litigation. We are, in the ordinary course of business, a defendant in various lawsuits, some of which are covered in whole or in part by insurance. We believe that the ultimate resolution of litigation, individually and in the aggregate, will not have a materially adverse impact on our financial position or results of operations. Several litigation claims were settled during the course of the bankruptcy proceedings or are still being negotiated post confirmation. How each matter was or is being handled is set forth in the summary of each case below. For matters where the parties negotiated a settlement during our bankruptcy proceedings, the settlement amount was recorded at December 31, 2002 as an allowed general unsecured claim in "Other Income (Expense)" in our Consolidated Statement of Operations. In connection with our Restructuring Plan, general unsecured creditors with allowed claims received a pro rata share of $104 million of 9% senior unsecured notes and a pro rata share of 11,947,820 Link LLC units. See further discussion in Notes 4 and 11. Prior to and since the commencement of our bankruptcy proceedings, various legal actions arose in the ordinary course of business, of which the significant actions are discussed below.
John H. Roam, et al. vs. Texas-New Mexico Pipe Line Company and EOTT Energy Pipeline Limited Partnership, Cause No. CV43296, In the District Court of Midland County, Texas, 238th Judicial District (Kniffen Estates Suit). The Kniffen Estates Suit was filed on March 2, 2001, by certain residents of the Kniffen Estates, a residential subdivision located outside of Midland, Texas. The allegations in the petition state that free crude oil products were discovered in water wells in the Kniffen Estates area, on or about October 3, 2000. The plaintiffs claim that the crude oil products are from a 1992 release from a pipeline then owned by the Texas-New Mexico Pipe Line Company ("Tex-New Mex"). We purchased that pipeline from Tex-New Mex in 1999. The plaintiffs have alleged that Tex-New Mex was negligent, grossly negligent, and malicious in failing to accurately report and remediate the spill. With respect to us, the plaintiffs were seeking damages arising from any contamination of the soil or groundwater since we acquired the pipeline in question. No specific amount of money damages was claimed in the Kniffen Estates Suit, but the plaintiffs did file proofs of claim in our bankruptcy proceeding totaling $62 million. In response to the Kniffen Estates Suit, we filed a cross-claim against Tex-New Mex. In the cross-claim, we claimed that, in relation to the matters alleged by the plaintiffs, Tex-New Mex breached the Purchase and Sale Agreement between the parties dated May 1, 1999, by failing to disclose the 1992 release and by failing to undertake the defense and handling of the toxic tort claims, fair market value claims, and remediation claims arising from the release. On April 5, 2002, we filed an amended cross-claim which alleged that Tex-New Mex defrauded
us as part of Tex-New Mex's sale of the pipeline systems to us in 1999. The amended cross-claim also alleged that various practices employed by Tex-New Mex in the operation of its pipelines constituted gross negligence and willful misconduct and voided our obligation to indemnify Tex-New Mex for remediation of releases that occurred prior to May 1, 1999. In the Purchase and Sale Agreement, we agreed to indemnify Tex-New Mex only for certain remediation obligations that arose before May 1, 1999, unless these obligations were the result of the gross negligence or willful misconduct of Tex-New Mex prior to May 1, 1999. EOTT Energy Pipeline Limited Partnership ("PLP") and the plaintiffs agreed to a settlement during our bankruptcy proceedings. The settlement provides for the plaintiffs' release of their claims filed against PLP in this proceeding and in the bankruptcy proceedings, in exchange for an allowed general unsecured claim in our bankruptcy of $3,252,800 (as described above, the plaintiffs filed proofs of claim in our bankruptcy proceedings totaling $62 million). The allowed general unsecured claim was accrued at December 31, 2002. On April 1, 2003, we filed a second amended cross-claim in this matter. In addition to the claims filed in the previous cross-claims, we requested (i) injunctive relief for Tex-New Mex's refusal to honor its indemnity obligations; (ii) injunctive relief requiring Tex-New Mex to identify, investigate and remediate sites where the conduct alleged in our cross-claim occurred; and (iii) restitution damages of over $125,000,000. Tex-New Mex filed a motion to compel arbitration of these issues. The motion to compel arbitration was denied at a hearing held on April 11, 2003. At the April 11, 2003 hearing, the court also severed into a separate action EOTT's cross-claims against Tex-New Mex that extend beyond the crude oil release and groundwater contamination in the Kniffen Estates subdivision ("EOTT's Over-Arching Claim"). Developments in EOTT's Over-Arching Claim are described immediately below. Prior to the trial of the plaintiff's claims against Tex-New Mex and EOTT's original cross-claim against Tex-New Mex arising from the crude oil release and groundwater contamination in the Kniffen Estates subdivision ("EOTT's Kniffen Claims"), Tex-New Mex reached a settlement with the plaintiffs that provided for the release of the plaintiffs' claims. The trial of EOTT's Kniffen Claims commenced on June 16, 2003, and the jury returned its verdict on July 2, 2003. The jury found that Tex-New Mex's gross negligence and willful misconduct caused the contamination in the Kniffen Estates. The jury also found that Tex-New Mex committed fraud against us with respect to the Kniffen Estates site. The jury awarded us actual damages equal to the expenses we have incurred to date in remediating the Kniffen Estates site (approximately $6.1 million) and punitive damages in the amount of $50 million. On November 28, 2003, the court entered an amended judgment based on the jury verdict. The final judgment provides for the award to us of (i) actual damages in the amount of $7,701,938, (ii) attorney's fees in the amount of $1,400,000, (iii) prejudgment interest in the amount of $1,044,509 and (iv) punitive damages in the amount of $18,203,876. The punitive damages were reduced from the jury's award of $50 million in accordance with Texas' statutory caps on punitive damages awards. The final judgment also contains a finding that Tex-New Mex is obligated to indemnify us for future remediation costs incurred at the Kniffen Estates site. Tex-New Mex filed a motion for new trial that was overruled by operation of law on February 11, 2004. Tex-New Mex has indicated its intent to appeal the amended judgment by posting a supersedeas bond in the amount of $10,665,419 on February 12, 2004. We cannot predict the outcome of Tex-New Mex's appellate efforts.
EOTT Energy Operating Limited Partnership vs. Texas-New Mexico Pipeline Company, Cause No. CV-44, 099, In the District Court of Midland County, Texas, 238th Judicial District ("EOTT's
Over-Arching Claim"). As described above, the claims in this lawsuit were severed from EOTT's Kniffen Claims on April 11, 2003. In this lawsuit, we allege that various practices employed by Tex-New Mex in the operation of its pipelines and handling of spills constitute gross negligence and willful misconduct, thus triggering Tex-New Mex's obligation to indemnify us for remediation of releases where such practices ("Non-Remediation Practices") were employed. In addition to damages, we are seeking (a) injunctive relief requiring Tex-New Mex to honor its indemnity obligations under the Purchase and Sale Agreement and (b) injunctive relief requiring Tex-New Mex to identify, investigate, and remediate sites where Tex-New Mex employed the Non-Remediation Practices. Discovery opened in EOTT's Over-Arching Claim on December 1, 2003. The court conducted a scheduling conference for this case on January 12, 2004, and set a trial date of September 19, 2005. On March 3, 2004, we amended our petition to specifically list more than 200 contamination sites where Tex-New Mex employed the Non-Remediation Practices.
Bankruptcy Issues related to Claims Made by Texas-New Mexico Pipeline Company and its affiliates. Tex-New Mex, Shell Oil Company ("Shell") and Equilon filed proofs of claim in our bankruptcy, each filing similar claims in the amount of $112 million. In July of 2003, we entered into an agreement with Shell, Tex-New Mex and Equilon whereby all of their claims were either withdrawn, estimated or allowed, leaving the value of the claims estimated for distribution purposes at $56,924.52. We are currently working to fully resolve these claims in the bankruptcy claims resolution process.
Jimmie T. Cooper and Betty P. Cooper vs. Texas-New Mexico Pipeline Company, Inc., EOTT Energy Pipeline Limited Partnership, and EOTT Energy Corp., Case No. CIV-03-0035 JB/LAM, In the United States District Court for the District of New Mexico. This lawsuit was filed on October 1, 2002. The plaintiffs in this lawsuit are surface interest owners of certain property located in Lea County, New Mexico. The plaintiffs alleged that aquifers underlying their property and water wells located on their property were contaminated as a result of spills and leaks from a pipeline running across their property that is or was owned by Tex-New Mex and us. The plaintiffs did not specify when the alleged spills and leaks occurred. The plaintiffs are seeking payment of costs that would be incurred in investigating and remediating the alleged crude oil releases and replacing water supplies from aquifers that had allegedly been contaminated. The plaintiffs sought damages in an unspecified amount arising from the plaintiffs' alleged fear of exposure to carcinogens and the alleged interference with the plaintiffs' quiet enjoyment of their property. The plaintiffs are also seeking an unspecified amount of punitive damages. EOTT and the plaintiffs agreed to the terms of a settlement, whereby the plaintiffs agreed to release their claims against us and received an allowed general unsecured claim in our bankruptcy in the amount of $1,027,000. The allowed general unsecured claim was accrued at December 31, 2002. The settlement documents have been finalized. On October 21, 2003, the plaintiffs filed a motion seeking our dismissal from this lawsuit. Tex-New Mex opposed this motion, and on October 31, 2003, Tex-New Mex filed a motion for leave to file a cross-claim against us. In the proposed cross-claim, Tex-New Mex is seeking a declaratory judgment finding that we are contractually obligated to indemnify Tex-New Mex for all costs Tex-New Mex has incurred or will incur related to the defense of the plaintiffs' claims in this lawsuit. The proposed cross-claim also alleges that we failed to assume Tex-New Mex's defense of this lawsuit and failed to indemnify Tex-New Mex for the expenses Tex-New Mex has incurred in this lawsuit, and that such actions by us constitute a breach of the Purchase and Sale Agreement governing Tex-New Mex's sale of the subject pipeline to us. On December 4, 2003, we filed a motion in our
bankruptcy proceeding seeking a determination that Tex-New Mex's proposed cross-claim had been waived, barred, and discharged in our bankruptcy proceeding. A hearing on that motion (the "Zero Claim Motion") was held on February 18, 2004 and the bankruptcy court took the Zero Claim Motion under advisement. We have asked the court to delay ruling on Tex-New Mex's motion for leave to file cross-claim until the bankruptcy court rules on our Zero Claim Motion. At the settlement conference held on February 27, 2004, the plaintiffs and Tex-New Mex reached a settlement. Tex-New Mex has agreed to pay the plaintiffs $1,350,000 for a release of the plaintiffs' claims.
In re EOTT Energy Partners, L.P., Case No. 02-21730, EOTT Energy Finance Corp., Case No. 02-21731, EOTT Energy General Partner, L.L.C., Case No. 02-21732, EOTT Energy Operating Limited Partnership, Case No. 02-21733, EOTT Energy Canada Limited Partnership, Case No. 02-21734, EOTT Energy Liquids, L.P., Case No. 02-21736, EOTT Energy Corp., Case No. 02-21788, Debtors (Jointly Administered under Case No. 02-21730), In the United States Bankruptcy Court for the Southern District of Texas, Corpus Christi Division. On October 8, 2002, we and all of our subsidiaries filed voluntary petitions for relief under Chapter 11 of the United States Bankruptcy Code in the United States Bankruptcy Court for the Southern District of Texas (the "EOTT Bankruptcy Court") to facilitate reorganization of our business and financial affairs for the benefit of us, our creditors and other interested parties. Additionally, the General Partner filed its voluntary petition for reorganization under Chapter 11 on October 21, 2002 in the EOTT Bankruptcy Court. Our Restructuring Plan was confirmed on February 18, 2003 and became effective on March 1, 2003. The provisions of the Restructuring Plan are further described in Note 5. Shell and Tex-New Mex filed a notice of appeal to our plan confirmation on February 24, 2003. A hearing on the appeal was held in the District Court on August 19, 2003, where the judge ruled the appeal was moot. The ruling became final on October 24, 2003. The bankruptcy remains open while we resolve all of the outstanding claims. We expect to close the bankruptcy in early 2004.
EPA Section 308 Request. In July 2001, Enron received a request for information from the Environmental Protection Agency ("EPA") under Section 308 of the Clean Water Act, requesting information regarding certain spills and releases from oil pipelines owned or operated by Enron and its affiliated companies for the time period July 1, 1998 to July 11, 2001. Enron responded in January of 2002 to the EPA's Section 308 request in its capacity as the operator of the pipelines actually owned by us and on our behalf. Under the terms of the Enron Settlement Agreement dated October 8, 2002, we would be required to indemnify EOTT Energy Corp., as the prior general partner, and its affiliates including Enron Pipeline Services Company, with regard to any environmental remediation, except for claims of gross negligence and willful misconduct. While we cannot predict the outcome of the EPA's Section 308 request, the EPA could seek to impose liability for environmental cleanup on us with respect to the matters being reviewed. The outcome of the EPA Section 308 request is not yet known, and we are unaware of any potential liability of Enron, its affiliates, or us. It is possible that our bankruptcy proceedings did not relieve us from certain potential environmental remediation liability.
Environmental. We are subject to extensive federal, state and local laws and regulations covering the discharge of materials into the environment, or otherwise relating to the protection of the environment, and which require expenditures for remediation at various operating facilities and waste disposal sites, as well as expenditures in connection with the construction of new facilities. At the
federal level, such laws include, among others, the Clean Air Act, the Clean Water Act, the Oil Pollution Act, the Resource Conservation and Recovery Act, the Comprehensive Environmental Response, Compensation and Liability Act, and the National Environmental Policy Act, as each may be amended from time to time. Failure to comply with these laws and regulations may result in the assessment of administrative, civil, and criminal penalties or the imposition of injunctive relief.
Prior to the sale of our Liquids Operations discussed further in Note 8, we produced MTBE at our Morgan's Point Facility. MTBE is used as an additive in gasoline. Due to health concerns around MTBE, there have been lawsuits filed against companies involved in the production of MTBE. We have not been named in any such actions, nor do we anticipate being included in any such actions. However, we can provide no assurances that we may not be included in such actions due to our past production of MTBE.
In 2001, expenses incurred for spill clean up and remediation costs related to the assets purchased from Tex-New Mex increased significantly. Based on our experience with these assets, we filed an amended cross-claim against Tex-New Mex alleging contingent claims for potential remediation issues not yet known to us. We allege that Tex-New Mex failed to report spills, underreported spills, failed to properly respond to leaks in the pipeline and engaged in other activities with regard to the pipeline that may result in future remediation liabilities. We obtained $20 million in insurance coverage in connection with the acquisition from Tex-New Mex believing that amount would be sufficient to cover our remediation requirements along the pipeline for a ten-year period. However, after four years into the term of the insurance policy, we have made claims in excess of the amount of insurance coverage.
In addition to costs associated with the assets acquired from Tex-New Mex, we have also incurred spill clean up and remediation costs in connection with other properties we own in various locations throughout the United States. We also have insurance covering clean up and remediation costs that may be incurred in connection with properties not acquired from Tex-New Mex. However, no assurance can be given that the insurance will be adequate to cover any such cleanup and remediation costs.
The following are summaries of environmental remediation expense, estimated environmental liabilities, and amounts receivable under insurance policies for the indicated periods (in thousands):
| | Successor Company | Predecessor Company | |||||||||||
|---|---|---|---|---|---|---|---|---|---|---|---|---|---|
| | Ten Months ended December 31, 2003 | Two Months ended February 28, 2003 | Twelve Months ended December 31, 2002 | Twelve Months ended December 31, 2001 | |||||||||
| Remediation expense | $ | 9,107 | $ | 1,979 | $ | 14,819 | $ | 25,372 | |||||
| Estimated insurance recoveries | (1,325 | ) | (79 | ) | (1,316 | ) | (13,576 | ) | |||||
| Net remediation expense | $ | 7,782 | $ | 1,900 | $ | 13,503 | $ | 11,796 | |||||
| | Successor Company | Predecessor Company | ||||||||
|---|---|---|---|---|---|---|---|---|---|---|
| | Ten Months ended December 31, 2003 | Two Months ended February 28, 2003 | Year ended December 31, 2002 | |||||||
| Environmental liability at beginning of period | $ | 13,440 | $ | 13,440 | $ | 12,075 | ||||
| Remediation expense | 9,107 | 1,979 | 14,819 | |||||||
| Cash expenditures | (10,331 | ) | (1,979 | ) | (13,454 | ) | ||||
| Environmental liability at end of period | $ | 12,216 | $ | 13,440 | $ | 13,440 | ||||
| | Successor Company | Predecessor Company | ||||||||
|---|---|---|---|---|---|---|---|---|---|---|
| | Ten Months ended December 31, 2003 | Two Months ended February 28, 2003 | Year ended December 31, 2002 | |||||||
| Environmental insurance receivable at beginning of period | $ | 8,837 | $ | 8,803 | $ | 14,344 | ||||
| Estimated recoveries | 1,325 | 79 | 1,316 | |||||||
| Cash receipts | (7,073 | ) | (45 | ) | (6,857 | ) | ||||
| Environmental insurance receivable at end of period | $ | 3,089 | $ | 8,837 | $ | 8,803 | ||||
The environmental liability was classified in Other Current ($6.4 million) and Other Long-Term Liabilities ($5.8 million) and the insurance receivable was classified in Trade and Other Receivables ($2.5 million) and Other Assets ($0.5 million) at December 31, 2003.
We may experience future releases of crude oil into the environment or discover releases that were previously unidentified. While an inspection program is maintained on our pipelines to prevent and detect such releases, and operational safeguards and contingency plans are in place for the operation of our processing facilities, damages and liabilities incurred due to any future environmental releases could affect our business. We believe that our operations and facilities are in substantial compliance with applicable environmental laws and regulations and that there are no outstanding potential liabilities or claims relating to safety and environmental matters of which we are currently aware, the resolution of which, individually or in the aggregate, would have a materially adverse effect on our
financial position or results of operations. However, we could be significantly adversely impacted by additional repair or remediation costs related to the pipeline assets we acquired from Tex-New Mex if the need for any additional repairs or remediation arises and we do not obtain reimbursement for any such costs as a result of the pending litigation concerning those assets. Our environmental expenditures include amounts spent on permitting, compliance and response plans, monitoring and spill cleanup and other remediation costs. In addition, we could be required to spend substantial sums to ensure the integrity of our pipeline systems, and in some cases, we may take pipelines out of service if we believe the costs of upgrades will exceed the value of the pipelines.
No assurance can be given as to the amount or timing of future expenditures for environmental remediation or compliance, and actual future expenditures may be different from the amounts currently estimated. In the event of future increases in costs, we may be unable to pass on those increases to our customers.
Tax Status
For information regarding our continued qualification as a partnership for federal income tax purposes, see Note 1.
16. FAIR VALUE OF FINANCIAL INSTRUMENTS
Fair Value. Fair value represents the amount at which a financial instrument could be exchanged in a current transaction between willing parties. We have determined the estimated fair value amounts using available market data and valuation methodologies. Judgment is required in interpreting market data and the use of different market assumptions or estimation methodologies may affect the estimated fair value amounts.
As of December 31, 2003 and 2002, the carrying amounts of items comprising current assets and current liabilities approximate fair value due to the short-term maturities of these instruments. The carrying amounts of the variable rate instruments in our credit facilities approximate fair value because the interest rates fluctuate with prevailing market rates. The carrying amount of our derivative instruments and energy trading activities approximate fair value as these contracts are recorded on the balance sheet at their fair value.
The carrying amount and fair values of our financial instruments are as follows (in millions):
| | Successor Company December 31, 2003 | Predecessor Company December 31, 2002 | ||||||||||||
|---|---|---|---|---|---|---|---|---|---|---|---|---|---|---|
| | Carrying Amount | Fair Value | Carrying Amount | Fair Value | ||||||||||
| NYMEX futures | $ | — | $ | — | $ | 0.2 | $ | 0.2 | ||||||
| Forward contracts | $ | 0.5 | $ | 0.5 | $ | (1.0 | ) | $ | (1.0 | ) | ||||
| Short-term debt | $ | 45.0 | $ | 45.0 | $ | 125.0 | $ | 125.0 | ||||||
| Term loans | $ | 75.0 | $ | 75.0 | $ | 75.0 | $ | 75.0 | ||||||
| Enron Note | $ | 6.4 | $ | 6.5 | $ | 6.2 | $ | 7.2 | ||||||
| Long-term | ||||||||||||||
| 9% Notes | $ | 104.5 | $ | 101.4 | $ | 6.2 | $ | 7.2 | ||||||
| 11% Notes | $ | — | $ | — | $ | 235.0 | $ | N/A | ||||||
| Long-term debt—other | $ | 2.3 | $ | 2.4 | $ | 2.7 | $ | 2.4 | ||||||
As of December 31, 2002, it was not practicable to determine the fair value of our 11% senior unsecured notes since we were not yet able to determine the fair value of the consideration the senior unsecured noteholders would receive under the Restructuring Plan. Under the terms of our Restructuring Plan, we cancelled our 11% senior notes and the former senior unsecured noteholders and holders of allowed general unsecured claims received a pro rata share of $104 million of 9% senior unsecured notes and a pro rata share of 11,947,820 Link LLC units. Excluding amounts included in Liabilities Subject to Compromise at December 31, 2002, we believe that the carrying amounts of other financial instruments are a reasonable estimate of their fair value, unless otherwise noted.
Generally, as we purchase crude oil, we enter into corresponding sales transactions involving physical delivery of crude oil to third party users or corresponding sales transactions on the NYMEX. This process enables us to minimize our exposure to price risk until we take physical delivery of the crude oil. In 2002, substantially all of our crude oil marketing and trading operations are accounted for on a fair value basis pursuant to SFAS No. 133 or EITF Issue 98-10. Effective January 1, 2003, energy trading contracts that are not derivative instruments pursuant to SFAS No. 133 are no longer accounted for at fair value. See further discussion of our accounting policies in Note 2.
The following table indicates fair values and changes in fair value of our energy trading and derivative transactions (in thousands):
| | Successor Company | Predecessor Company | ||||||||
|---|---|---|---|---|---|---|---|---|---|---|
| | Ten Months ended December 31, 2003 | Two Months ended February 28, 2003 | Year ended December 31, 2002 | |||||||
| Fair value of contracts at beginning of period | $ | 1,254 | $ | (844 | ) | $ | (5,597 | ) | ||
| Cumulative effect of accounting change | — | (2,389 | ) | — | ||||||
| Change in realized and unrealized value | (2,401 | ) | 4,114 | 3,814 | ||||||
| Fair value of new contracts entered into during year. | 1,673 | 373 | 939 | |||||||
| Fair value of contracts at end of period | $ | 526 | $ | 1,254 | $ | (844 | ) | |||
Fair Value of Contracts at December 31, 2003
| Source of Fair Value | Maturity of 90 Days or Less | Maturity Greater than 90 Days but Less than One Year | Total Fair Value | ||||||
|---|---|---|---|---|---|---|---|---|---|
| Prices Actively Quoted | $ | 677 | $ | (162 | ) | $ | 515 | ||
| *Prices Provided by Other External Source | 13 | (2 | ) | 11 | |||||
| Total | $ | 690 | $ | (164 | ) | $ | 526 | ||
Credit Risk. In the normal course of business, we extend credit to various companies in the energy industry. Within this industry, certain elements of credit risk exist and may, to varying degrees, exceed amounts recognized in the accompanying consolidated financial statements, which may be affected by changes in economic or other external conditions and may accordingly impact our overall exposure to credit risk. Our exposure to credit loss in the event of nonperformance is limited to the book value of the trade commitments included in the accompanying Consolidated Balance Sheets. We manage our exposure to credit risk through credit analysis, credit approvals, credit limits and monitoring procedures. Further, we believe that our portfolio of receivables is well diversified and that the allowance for doubtful accounts is adequate to absorb any potential losses. We require collateral in the form of letters of credit for certain of our receivables.
During the ten months ended December 31, 2003, the two months ended February 28, 2003 and the years ended December 31, 2002, and 2001 sales to Koch Supply & Trading L.P. accounted for approximately 19%, 19%, 17%, and 12% of our consolidated gross revenues, respectively.
Market Risk. Our trading and non-trading transactions give rise to market risk, which represents the potential loss that can be caused by a change in the market value of a particular commitment. We closely monitor and manage our exposure to market risk to ensure compliance with our stated risk
management policies which are regularly assessed to ensure their appropriateness given our objectives, strategies and current market conditions.
We enter into forward, futures and other contracts to hedge the impact of market fluctuations on assets, lease crude oil purchases or other contractual commitments. Changes in the market value of transactions designated as energy trading activities (prior to the rescission of EITF Issue 98-10) or derivatives under SFAS 133 are recorded every period as mark-to-market gains or losses.
17. SUMMARY OF OUR SETTLEMENT AGREEMENT WITH ENRON
The General Partner and EOTT entered into a settlement agreement dated October 8, 2002 (the "Enron Settlement Agreement") with Enron, Enron North America Corp., Enron Energy Services, Inc., Enron Pipeline Services Company ("EPSC"), EGP Fuels Company ("EGP Fuels") and Enron Gas Liquids, Inc. ("EGLI") (collectively, the "Enron Parties"). As part of the Settlement Agreement, Enron consented to the filing of our bankruptcy in the Southern District of Texas, and Enron waived its rights of first refusal with respect to the sale of the Morgan's Point Facility, Mont Belvieu Facility and other assets we purchased pursuant to the Purchase and Sale Agreement dated June 29, 2001 between Enron and us. The EOTT Bankruptcy Court approved the Enron Settlement Agreement on November 22, 2002, and the Enron Bankruptcy Court approved the Enron Settlement Agreement on December 5, 2002. The Enron Settlement Agreement was consummated on December 31, 2002. The following is a summary of the significant terms of the settlement:
The following is a summary of the net Enron Settlement amount recorded in Reorganization Items in the Consolidated Statement of Operations (in millions) as discussed in Note 5:
| Forgiveness of payable to Enron and affiliates | $ | 38.5 | |||
| Forgiveness of performance collateral from Enron | 15.8 | ||||
| Note issued to Enron | (6.2 | ) | |||
| Cash Payment to Enron for certain claims | (1.2 | ) | |||
| Final contribution to Enron Cash Balance Plan | (1.4 | ) | |||
| Total | $ | 45.5 | |||
18. IMPACT OF ENRON BANKRUPTCY AND TRANSACTIONS WITH ENRON AND RELATED PARTIES
IMPACT OF ENRON BANKRUPTCY
Beginning on December 2, 2001, Enron, along with certain of its subsidiaries, filed bankruptcy proceedings under Chapter 11 of the Federal Bankruptcy Code. Because of our contractual relationships with Enron and certain of its subsidiaries, the bankruptcy significantly impacted us in various ways. In connection with the Enron Settlement Agreement discussed above, the following claims were released:
Rejection of Agreements; Claims Against Enron's Bankruptcy Estate. We were adversely impacted as a result of the inclusion of EGLI in Enron's bankruptcy. We had in place ten-year Toll Conversion and Storage Agreements with EGLI. As a result of EGLI's non-performance under these agreements, we recorded a $29.1 million non-cash impairment, which was our remaining investment in these long-term contracts, at December 31, 2001. We had a monetary damage claim against EGLI and Enron as a result of the rejection of the agreements under the Stipulation. Accordingly, we filed claims against EGLI in the Enron Bankruptcy Court on May 12, 2002, resulting from EGLI's rejection of the Toll Conversion and Storage Agreements, in the amount of $540.5 million. In addition, Enron guaranteed EGLI's performance under the EGLI agreements; however, its guarantee was limited to $50 million under the Toll Conversion Agreement and $25 million under the Storage Agreement. Accordingly, we filed a claim against Enron in the Enron Bankruptcy Court resulting from EGLI's rejection of the agreements in the amount of $75 million. We filed additional claims against numerous Enron affiliates on October 15, 2002 totaling $213.5 million. Under the terms of the Enron Settlement Agreement, we withdrew all claims filed by us in the Enron Bankruptcy Court upon the effective date of our Restructuring Plan.
Performance Collateral from Enron. As discussed above, Enron guaranteed payments under the Toll Conversion and Storage Agreements. In addition, EGLI owed us approximately $9 million under the Toll Conversion and Storage Agreements prior to filing for bankruptcy. Pursuant to the Toll Conversion and Storage Agreements, if Enron's credit rating dropped below certain defined levels specified in these agreements, we could request within five days of this occurrence for EGLI to post letters of credit. The letters of credit could be drawn upon if EGLI failed to pay any amount owed to us under these agreements. The Toll Conversion Agreement provided that the letter of credit would be in an amount reasonably requested by us, not to exceed $25 million. The Storage Agreement provided
that the letter of credit would be in an amount as reasonably requested, but no amount is specified. In late November 2001, Enron's credit rating fell below the ratings specified in these agreements. Accordingly, on November 27, 2001, we requested that EGLI post two $25 million letters of credit. In lieu of posting letters of credit, we received a $25 million deposit/performance collateral from EGLI/Enron, against which we recouped the $9 million of outstanding invoices. We applied the remaining sum, approximately $16 million, to recoup or offset a portion of our damages as a result of EGLI's rejection of the Toll Conversion and Storage Agreements. Our Restructuring Plan resulted in a release by Enron of any claim to the $25 million deposit/performance collateral.
Tax and Environmental Indemnities. We also had indemnities from Enron for certain ad valorem taxes, possible environmental expenditures and title defects relating to the Morgan's Point Facility and the Mont Belvieu Facility. The total indemnity amount provided for under the Purchase Agreement was $25 million and we had made no claims under the indemnities through December 31, 2002. Under the terms of the Enron Settlement Agreement, we released Enron from these indemnities.
Pension Plan Underfunding Issues. The Enron Settlement Agreement provided that we withdraw from the defined benefit pension plan known as the Enron Corp. Cash Balance Plan (the "Cash Balance Plan") on December 31, 2002. The PBGC filed proofs of claim in our bankruptcy proceedings to address concerns about the Cash Balance Plan, and also an objection to our Restructuring Plan ("PBGC Claim").
To address the issues raised by the PBGC, as well as the objections we filed to the PBGC's proofs of claim, a Stipulation and Order Regarding EOTT Chapter 11 Proceedings and Settlement Among the Enron Parties, us and the PBGC (the "PBGC Stipulation") was executed and entered by the Enron Bankruptcy Court on February 27, 2003.
The PBGC Stipulation set forth that Enron will continue to hold, subject to the terms of the PBGC Stipulation, the Enron Note, the letter of credit securing the Enron Note, any payments thereunder, and the Cash Payment (collectively, the "Settlement Proceeds") on behalf of the Enron Parties. Any claim of the PBGC against us for liabilities (if any) arising from the Cash Balance Plan will attach to the Settlement Proceeds with the same effect (if any) that such claim (if any) now has as against us and such claim will be subject to the claims and defenses of the Enron Parties and the Enron Creditors' Committee with respect thereto. The PBGC's rights regarding the Settlement Proceeds will constitute the sole basis for the PBGC to seek to enforce its claims (if any) against us for the PBGC Claims.
TRANSACTIONS WITH ENRON AND RELATED PARTIES
At December 31, 2002, we had current payables to Enron of $3.6 million, which was primarily comprised of certain amounts owed to Enron under the Enron Settlement Agreement. In addition, we had $5.2 million of long-term liabilities owed to Enron at December 31, 2002, which is the long-term portion of the note issued in connection with the Enron Settlement Agreement.
The agreements described below were terminated and the amounts due under these agreements were forgiven effective December 31, 2002 under the terms of the Enron Settlement Agreement. See further discussion in Note 17.
Operations and General and Administrative Services. As is commonly the case with publicly traded partnerships, we did not directly employ any persons responsible for managing or operating EOTT or for providing services relating to day-to-day business affairs prior to January 1, 2003. The General Partner provided such services or obtained such services from third parties and we were responsible for reimbursing the General Partner for substantially all of its direct and indirect costs and expenses. The General Partner, through the MLP Partnership Agreement, provided services to us under a Corporate Services Agreement which included liability and casualty insurance and certain data processing services and employee benefits. Those costs were $1.9 million, and $2.5 million, for the years ended December 31, 2002 and 2001, respectively.
Operation and Services Agreement with EPSC. EPSC agreed to provide certain operating and administrative services to the General Partner, effective October 1, 2000 and the agreement provided that the General Partner would reimburse EPSC for its costs and expenses in rendering the services. The General Partner would in turn be reimbursed by us. EOTT LLC took over these services effective January 1, 2003. The costs incurred related to these services for the years ended December 31, 2002 and 2001 were $24.6 million, and $56.7 million respectively.
Transition Services Agreement with EGP Fuels. The General Partner entered into an agreement for EGP Fuels to provide transition services through December 31, 2001 for the processing of invoices and payments to third parties related to the Morgan's Point Facility and Mont Belvieu Facility. The agreement provided that the General Partner would reimburse EGP Fuels for these direct costs and we would reimburse the General Partner. Costs related to these services were $12.3 million for the six months ended December 31, 2001.
Credit Facility. We had a credit facility with Enron to provide credit support in the form of guarantees, letters of credit and working capital loans through December 31, 2001.
Purchase and Sale Agreement. We acquired certain liquids processing, storage and transportation assets in June 2001 from Enron. See further discussion in Note 8.
Additional Partnership Interests. On May 14, 1999 and February 14, 2000, Enron paid $2.5 million and $6.8 million, respectively, in support of our first and fourth quarter 1999 distributions to our common unitholders and received APIs. APIs have no voting rights and do not receive distributions. In connection with the Restructuring Plan, the API's were cancelled.
19. EMPLOYEE BENEFIT AND RETIREMENT PLANS
Successor Company
We adopted welfare benefit plans providing medical, dental, life, accidental death and dismemberment and long-term disability coverage to employees, with all related premiums and costs not offset by employee contributions being incurred by us. Link Energy implemented a Savings Plan in
March 2003 for all employees. Total benefit costs for the ten months ended December 31, 2003 were $4.6 million, including $4.3 million in costs attributable to health and welfare benefit plans.
In 2003, we adopted the Link Energy Annual Incentive Plan, a variable pay plan, based on our earnings before depreciation adjusted for restructuring costs. No bonuses were paid out under this plan for 2003.
We provide no postretirement medical, life insurance and dental benefits to employees who retire. The Company provides unemployment, severance and disability-related benefits or continuation of benefits such as health care and life insurance and other postemployment benefits. SFAS No. 112 requires the cost of those benefits to be accrued over the service lives of the employees expected to receive such benefits. At December 31, 2003, the liability accrued was $0.9 million.
The Compensation Committee recommended to the Board of Directors the adoption of the Link Energy Equity Incentive Plan ("Incentive Plan") effective June 2003. The Incentive Plan is designed to promote individual performance by relating executive compensation directly to the creation of unitholder wealth. Under the Incentive Plan, the Committee is authorized to grant awards of restricted units to executive officers and other key employees. In June 2003, 1.2 million restricted stock units were authorized to be issued to certain key employees and directors. The Incentive Plan has a ten-year term and restricted unit awards granted thereunder typically vest over a three-year period. Outstanding awards have a vesting schedule of 50% vested on June 1, 2004; 25% vested on June 1, 2005 and 25% vested on June 1, 2006. We have recorded compensation expense of $2.3 million for the ten months ended December 31, 2003.
The following table sets forth the Equity Incentive Plan activity for the ten months ended December 31, 2003:
Predecessor Company
We adopted welfare benefit plans providing medical, dental, life, accidental death and dismemberment and long-term disability coverage to employees, with all related premiums and costs not offset by employee contributions being incurred by us. Total benefit costs for the two months ended February 28, 2003 were $1.3 million, including $1.1 million in costs attributable to health and welfare benefit plans. Total benefit costs for 2002 were $8.9 million, including $6.3 million in costs attributable to health and welfare benefit plans. Total benefit costs for 2001 were $6.7 million, including $4.6 million in cost attributable to health and welfare benefit plans. Through December 31, 2002, employees of the Company were covered by various retirement, stock purchase and other benefit plans of Enron.
In 2002, we accrued $2.1 million in connection with guaranteed bonuses and retention payments. In 2001, the Company maintained a variable pay plan based on our earnings before interest and depreciation and amortization pursuant to which $3.6 million was recorded.
As discussed in Note 18, we were a participating employer in the Cash Balance Plan until the consummation of the Enron Settlement Agreement on December 31, 2002. See Note 18 for further discussion regarding issues raised by the PBGC concerning this plan and an agreed stipulation executed between the PBGC, the Enron Parties and us.
Prior to December 31, 2002, we provided certain postretirement medical, life insurance and dental benefits to eligible employees who retired after January 1, 1994. Benefits were provided under the provisions of contributory defined dollar benefit plans for eligible employees and their dependents. We terminated our participation in this plan effective December 31, 2002. These postretirement benefit costs were accrued over the service lives of employees expected to be eligible to receive such benefits. Enron retained liability for former employees of the Company who retired prior to January 1, 1994. In connection with the termination, curtailment and settlement gains of $1.5 million were recorded in 2002.
The following table sets forth information related to changes in the benefit obligations, changes in plan assets, and components of the expense recognized related to postretirement benefits provided by the Company (in thousands):
| | 2002 | ||||
|---|---|---|---|---|---|
| CHANGE IN BENEFIT OBLIGATION | |||||
| Benefit obligation at January 1 | $ | 1,103 | |||
| Service cost | 144 | ||||
| Interest cost | 137 | ||||
| Plan participants' contributions | 76 | ||||
| Plan amendments | 7 | ||||
| Actuarial loss (gain) | 895 | ||||
| Effect of curtailments | (1,815 | ) | |||
| Effect of settlements | (380 | ) | |||
| Benefits paid | (167 | ) | |||
| Benefit obligation at December 31 | $ | — | |||
CHANGE IN PLAN ASSETS | |||||
| Fair value of plan assets at January 1 | $ | — | |||
| Company contributions | 91 | ||||
| Plan participants' contributions | 76 | ||||
| Benefits paid | (167 | ) | |||
| Fair value of plan assets at December 31 | $ | — | |||
| COMPONENTS OF NET PERIODIC BENEFIT COST | 2002 | 2001 | |||||||
|---|---|---|---|---|---|---|---|---|---|
| Service cost | $ | 144 | $ | 99 | |||||
| Interest cost | 137 | 73 | |||||||
| Amortization of prior service cost | 24 | 24 | |||||||
| Recognized net actuarial gain | 5 | (29 | ) | ||||||
| Net periodic postretirement benefit cost | 310 | 167 | |||||||
| Effect of curtailments | (1,160 | ) | — | ||||||
| Effect of settlements | (380 | ) | — | ||||||
| Total benefit cost (credit) | $ | (1,230 | ) | $ | 167 | ||||
We provided unemployment, severance and disability-related benefits or continuation of benefits such as health care and life insurance and other postemployment benefits. SFAS No. 112 requires the cost of those benefits to be accrued over the service lives of the employees expected to receive such benefits. At December 31, 2002, the liability accrued was $1.2 million.
EOTT Energy Corp. Unit Option Plan. In February 1994, the Board of Directors adopted the 1994 EOTT Energy Corp. Unit Option Plan (the "Unit Option Plan"), which was a variable compensatory plan. To date, no compensation expense has been recognized under the Unit Option Plan. Under the Unit Option Plan, selected employees were granted options to purchase subordinate units at a price of $15.00 per unit as determined by the Compensation Committee of the Board of Directors. Options
granted under the Unit Option Plan vested to the employees over a five-year period and expired on the tenth anniversary of the date of grant. Under the Restructuring Plan, the Unit Option Plan was terminated on February 28, 2003.
Unit Option Plan activity for the years ended December 31, 2001 and 2002, and the two months ended February 28, 2003, consisted of forfeitures of 5,000 shares, 240,000 shares and 215,000 shares, respectively. No shares were outstanding or available for grant at February 28, 2003.
EOTT Energy Corp. Long-Term Incentive Plan. In October 1997, the Board of Directors adopted the EOTT Energy Corp. Long-Term Incentive Plan ("Plan"), which was a variable compensatory plan. Under the Plan, selected key employees were awarded Phantom Appreciation Rights ("PAR"). Each PAR was a right to receive cash based on our performance prior to the time the PAR was redeemed. Our performance was measured primarily by calculating the change in the average of Earnings Before Interest on Debt related to acquisitions, Depreciation and Amortization ("EBIDA"), for each of the three consecutive fiscal years immediately preceding the grant date of the PAR and the exercise date of the PAR. The Plan had a five-year term beginning January 1, 1997, and PAR awards vested in 25% increments in the four-year period following the grant year. Under the Restructuring Plan, the Long-Term Incentive Plan was terminated on February 28, 2003.
The following table sets forth the Long-Term Incentive Plan activity for the two months ended February 28, 2003 and the years ended December 31, 2002 and 2001:
| | Number Of PARs | ||||||
|---|---|---|---|---|---|---|---|
| | Two Months Ended February 28, 2003 | Year Ended December 31, | |||||
| | 2002 | 2001 | |||||
| Outstanding beginning of period | 274,394 | 1,067,375 | 939,975 | ||||
| Granted | — | — | 332,000 | ||||
| Exercised | — | 684,831 | 106,250 | ||||
| Forfeited | 274,394 | 108,150 | 98,350 | ||||
| Outstanding at end of period | — | 274,394 | 1,067,375 | ||||
| Available for grant at end of period | — | — | — | ||||
Note: PARs were not available for grant after December 31, 2001 as the term of the plan expired December 31, 2001.
20. NEW ACCOUNTING STANDARDS
Accounting Standards Adopted
In June 2001, the FASB issued SFAS No. 143, "Accounting for Asset Retirement Obligations." This statement requires entities to record the fair value of a liability for legal obligations associated with the retirement obligations of tangible long-lived assets in the period in which it is incurred. When the liability is initially recorded, a corresponding increase in the carrying value of the related long-lived asset would be recorded. Over time, accretion of the liability is recognized each period, and the
capitalized cost is depreciated over the useful life of the related asset. Upon settlement of the liability, an entity either settles the obligation for its recorded amount or incurs a gain or loss on settlement. We adopted the accounting principle required by the new statement effective January 1, 2003. Determination of the fair value of the retirement obligation is based on numerous estimates and assumptions including estimated future third-party costs, future inflation rates and the future timing of settlement of the obligations.
At the time of adoption of the new standard, our long-lived assets consisted primarily of our crude oil gathering and transmission pipelines and associated field storage tanks, our liquids processing and handling facilities at Morgan's Point, our underground storage facility and associated pipeline grid system, and transportation facilities at Mont Belvieu and our gas processing and fractionation plant and related storage and distribution facilities on the West Coast. Since our initial adoption of this standard, a number of these assets have been sold.
We identified asset retirement obligations that are within the scope of the new statement, including contractual obligations included in certain right-of-way agreements, easements and surface leases associated with our crude oil gathering, transportation and storage assets and obligations pertaining to closure and/or removal of facilities and other assets associated with our Morgan's Point, Mont Belvieu and West Coast facilities. We have estimated the fair value of asset retirement obligations based on contractual requirements where the settlement date is reasonably determinable. We could not make reasonable estimates of the fair values of certain retirement obligations, principally those associated with certain right-of-way agreements and easements for our pipelines, our Morgan's Point, Mont Belvieu and West Coast facilities, because the settlement dates for the retirement obligations cannot be reasonably determined. We will record retirement obligations associated with these assets in the period in which sufficient information exists to reasonably estimate the settlement dates of the respective retirement obligations.
As a result of the adoption of SFAS 143 on January 1, 2003, we recorded a liability of $1.7 million, property, plant and equipment, net of accumulated depreciation of $0.1 million and a cumulative effect of a change in accounting principle of $1.6 million. The effect of adoption of the new accounting principle was not material to the results of operations for the two months ended February 28, 2003, nor would it have had a material impact on our net income for the years ended December 31, 2002 or 2001. The asset retirement obligation as of January 1, 2002 was not material.
In September 2003, we recorded additional asset retirement obligations resulting from the planned reduction in our operations at the Morgan's Point Facility to phase out the production of MTBE. Such obligations have been settled at December��31, 2003. The following is a roll-forward of our asset retirement obligations for the two months ended February 28, 2003 and for the ten months ended December 31,2003:
| | Successor Company | Predecessor Company | ||||
|---|---|---|---|---|---|---|
| | Ten Months ended December 31, 2003 | Two Months ended February 28, 2003 | ||||
| Balance at beginning of period | $ | 1,678 | $ | — | ||
| Additions to liability | 1,525 | 1,675 | ||||
| Accretion expense | 13 | 3 | ||||
| Liabilities settled | (1,403 | ) | — | |||
| Revisions to estimates | — | — | ||||
| Balance at end of period | $ | 1,813 | $ | 1,678 | ||
In October 2002, the EITF reached a consensus in EITF Issue 02-03 to rescind Issue EITF 98-10, and related interpretive guidance, and preclude mark to market accounting for energy trading contracts that are not derivative instruments pursuant to SFAS 133. The consensus requires that gains and losses (realized and unrealized) on all derivative instruments held for trading purposes be shown net in the income statement, whether or not the instrument is settled physically. The consensus to rescind EITF Issue 98-10 eliminated our basis for recognizing physical inventories at fair value. The consensus to rescind EITF Issue 98-10 was effective for all new contracts entered into (and physical inventory purchased) after October 25, 2002. For energy trading contracts and physical inventories that existed on or before October 25, 2002, that remained at December 31, 2002, the consensus was effective January 1, 2003 and was reported as a cumulative effect of a change in accounting principle. The cumulative effect of the accounting change on January 1, 2003 was a loss of $2.4 million. With the rescission of EITF Issue 98-10, inventories purchased after October 25, 2002 have been valued at average cost.
In January 2003, the FASB issued FASB Interpretation No. 46, "Consolidation of Variable Interest Entities—an Interpretation of ARB No. 51" ("FIN 46"). FIN 46 is an interpretation of Accounting Research Bulletin 51, "Consolidated Financial Statements", and addresses consolidation by business enterprises of variable interest entities ("VIE"). FIN 46 requires an enterprise to consolidate a VIE if that enterprise has a variable interest that will absorb a majority of the entity's expected losses if they occur, receive a majority of the entity's expected residual returns if they occur, or both. This guidance applies immediately to VIE's created after January 31, 2003, and to VIE's in which an enterprise obtains an interest after that date. We implemented FIN 46 effective with the adoption of fresh start reporting on March 1, 2003. This statement did not have any impact on our financial statements.
In April 2003, the FASB issued SFAS 149, "Amendment of Statement 133 on Derivative Instrument and Hedging Activities." The statement amends and clarifies accounting for derivative instruments, including certain derivative instruments embedded in other contracts, and for hedging
activities under SFAS 133. The new statement is effective for contracts entered into or modified after June 30, 2003 (with certain exceptions) and for hedging relationships designated after June 30, 2003. The accounting guidance in the new statement is to be applied prospectively. We implemented SFAS 149 effective with the adoption of fresh start reporting on March 1, 2003. This statement did not have any impact on our financial statements.
In May 2003, the FASB issued SFAS 150, "Accounting for Certain Financial Instruments with Characteristics of Both Liabilities and Equity." This statement establishes standards for how a company classifies and measures certain financial instruments with characteristics of both liabilities and equity. This statement is effective for financial instruments entered into or modified after May 31, 2003 and otherwise is effective at the beginning of the first interim period beginning after June 15, 2003. The statement will be implemented by reporting the cumulative effect of a change in accounting principle for financial instruments created before the issuance date of the statement and still existing at the beginning of the period of adoption. We implemented SFAS 150 effective with the adoption of fresh start reporting on March 1, 2003. The adoption of this statement did not have any impact on our financial statements.
Accounting Standards Not Yet Adopted
In December 2003, the FASB issued FASB Interpretation No. 46 (revised December 2003), "Consolidation of Variable Interest Entities—an Interpretation of ARB No.51" ("FIN 46R"). FIN 46R replaces FIN 46 (discussed above) which we implemented effective with the adoption of fresh start reporting on March 1, 2003. FIN 46R is required to be implemented by the end of the first reporting period beginning after December 15, 2003. We plan to adopt FIN 46R effective January 1, 2004. Adoption of FIN 46R will not have an impact on our financial statements.
21. BUSINESS SEGMENT INFORMATION
We have two reportable segments, which management reviews in order to make decisions about resources to be allocated and assess performance: North American Crude Oil and Pipeline Operations. The North American Crude Oil segment primarily purchases, gathers, transports and markets crude oil. The Pipeline Operations segment operates approximately 6,900 miles of active common carrier pipelines in 12 states. Effective December 31, 2003, we sold our Liquids Operations and therefore the results of operations related to these assets have been reclassified to discontinued operations for all periods presented herein. Effective June 30, 2001, we sold our West Coast crude oil gathering and marketing operations. Effective June 1, 2002, we sold our West Coast refined products marketing operations. Effective June 25, 2003, we signed a definitive agreement to sell all of our natural gas liquids assets on the West Coast, which subsequently closed on October 1, 2003. The results of operations related to these assets previously included in the West Coast Operations segment have been reclassified to discontinued operations for all periods presented herein.
The accounting policies of the segments are the same as those described in the summary of significant accounting policies as discussed in Note 2. We evaluate performance based on operating income (loss).
We account for intersegment revenue for our North American Crude Oil Operations as if the sales were to third parties, that is, at current market prices. Intersegment revenues for Pipeline Operations are based on published pipeline tariffs.
FINANCIAL INFORMATION BY BUSINESS SEGMENT (IN THOUSANDS)
| | North American Crude Oil | Pipeline Operations | Corporate and Other(a) | Consolidated | ||||||||||
|---|---|---|---|---|---|---|---|---|---|---|---|---|---|---|
| TEN MONTHS ENDED DECEMBER 31, 2003 (SUCCESSOR COMPANY) (RESTATED) | ||||||||||||||
| Revenue from external customers | $ | 136,268 | $ | 16,765 | $ | — | $ | 153,033 | ||||||
| Intersegment revenue(b) | (17,731 | ) | 71,605 | (53,874 | ) | — | ||||||||
| Total operating revenue(c) | 118,537 | 88,370 | (53,874 | ) | 153,033 | |||||||||
| Gross profit (loss) | 13,231 | 28,698 | — | 41,929 | ||||||||||
| Operating income (loss) | 5,001 | 30,504 | (25,690 | ) | 9,815 | |||||||||
| Other expenses, net | — | — | (32,516 | ) | (32,516 | ) | ||||||||
| Income (loss) from continuing operations | 5,001 | 30,504 | (58,206 | ) | (22,701 | ) | ||||||||
| Long-lived assets of continuing operations. | 62,530 | 199,719 | 261 | 262,510 | ||||||||||
| Total assets | 516,849 | 206,773 | 15,022 | 738,644 | ||||||||||
| Additions to long-lived assets-continuing operations | 858 | 7,265 | 175 | 8,298 | ||||||||||
| Depreciation and amortization | 2,150 | 14,989 | 22 | 17,161 | ||||||||||
| | North American Crude Oil | Pipeline Operations | Corporate and Other(a) | Consolidated | ||||||||||
|---|---|---|---|---|---|---|---|---|---|---|---|---|---|---|
| TWO MONTHS ENDED FEBRUARY 28, 2003 (PREDECESSOR COMPANY) (RESTATED) | ||||||||||||||
| Revenue from external customers | $ | 27,213 | $ | 4,422 | $ | — | $ | 31,635 | ||||||
| Intersegment revenue(b) | (1,768 | ) | 11,828 | (10,060 | ) | — | ||||||||
| Total operating revenue(c) | 25,445 | 16,250 | (10,060 | ) | 31,635 | |||||||||
| Gross profit (loss) | 3,752 | 6,219 | — | 9,971 | ||||||||||
| Operating income (loss) | 2,365 | 4,261 | (4,012 | ) | 2,614 | |||||||||
| Other income, net | — | — | (5,489 | ) | (5,489 | ) | ||||||||
| Reorganization items, net gain on discharge of debt and fresh start adjustments(d) | — | — | 67,459 | 67,459 | ||||||||||
| Income (loss) from continuing operations | 2,365 | 4,261 | 57,958 | 64,584 | ||||||||||
| Long-lived assets of continuing operations | 75,046 | 209,476 | 476 | 284,998 | ||||||||||
| Total assets | 505,965 | 226,646 | 123,511 | 856,122 | ||||||||||
| Additions to long-lived assets-continuing operations | 8 | 108 | — | 116 | ||||||||||
| Depreciation and amortization | 837 | 3,286 | 519 | 4,642 | ||||||||||
| | North American Crude Oil | Pipeline Operations | Corporate and Other(a) | Consolidated | ||||||||||
|---|---|---|---|---|---|---|---|---|---|---|---|---|---|---|
| YEAR ENDED DECEMBER 31, 2002 (PREDECESSOR COMPANY) (RESTATED) | ||||||||||||||
| Revenue from external customers | $ | 154,608 | $ | 28,324 | $ | — | $ | 182,932 | ||||||
| Intersegment revenue(b) | (11,320 | ) | 79,008 | (67,688 | ) | — | ||||||||
| Total operating revenue(c) | 143,288 | 107,332 | (67,688 | ) | 182,932 | |||||||||
| Gross profits | 3,396 | 33,634 | — | 37,030 | ||||||||||
| Operating income (loss) | (13,861 | ) | 14,797 | (28,531 | ) | (27,595 | ) | |||||||
| Other expense | — | — | (45,793 | ) | (45,793 | ) | ||||||||
| Reorganization items(d) | — | — | 32,847 | 32,847 | ||||||||||
| Income (loss) from continuing operations before cumulative effect of accounting changes(d) | (13,861 | ) | 14,797 | (41,477 | ) | (40,541 | ) | |||||||
| Long-lived assets of continuing operations | 71,282 | 261,975 | 7,802 | 341,059 | ||||||||||
| Total assets | 475,889 | 285,990 | 110,360 | 872,239 | ||||||||||
| Additions to long-lived assets-continuing operations | 1,158 | 15,494 | 136 | 16,788 | ||||||||||
| Depreciation and amortization | 5,740 | 20,881 | 3,267 | 29,888 | ||||||||||
| | North American Crude Oil | Pipeline Operations | Corporate and Other(a) | Consolidated | ||||||||||
|---|---|---|---|---|---|---|---|---|---|---|---|---|---|---|
| YEAR ENDED DECEMBER 31, 2001 (PREDECESSOR COMPANY) (RESTATED) | ||||||||||||||
| Revenue from external customers | $ | 226,564 | $ | 24,007 | $ | — | $ | 250,571 | ||||||
| Intersegment revenue(b) | (15,673 | ) | 103,515 | (87,842 | ) | — | ||||||||
| Total operating revenue(c) | 210,891 | 127,522 | (87,842 | ) | 250,571 | |||||||||
| Gross profits | 25,213 | 56,438 | — | 81,651 | ||||||||||
| Operating income (loss) | 9,742 | 49,715 | (24,848 | ) | 34,609 | |||||||||
| Other expense | — | — | (34,561 | ) | (34,561 | ) | ||||||||
| Income (loss) from continuing operations before cumulative effect of accounting changes(d) | 9,742 | 49,715 | (59,409 | ) | 48 | |||||||||
| Long-lived assets of continuing operations | 75,703 | 266,806 | 11,544 | 354,053 | ||||||||||
| Total assets | 629,199 | 295,793 | 180,506 | 1,105,498 | ||||||||||
| Additions to long-lived assets-continuing operations | 3,844 | 16,500 | 2,140 | 22,484 | ||||||||||
| Depreciation and amortization | 6,010 | 21,792 | 3,083 | 30,885 | ||||||||||
22. QUARTERLY FINANCIAL DATA (UNAUDITED) (In Thousands, Except Per Unit Amounts)
As discussed in Note 10, the following quarterly financial data has been restated.
| Successor Company | First Quarter(1) | Second Quarter | Third Quarter | Fourth Quarter | Total | |||||||||||
|---|---|---|---|---|---|---|---|---|---|---|---|---|---|---|---|---|
| 2003 (RESTATED) | ||||||||||||||||
| Operating revenue | $ | 17,733 | $ | 44,477 | $ | 44,759 | $ | 46,064 | $ | 153,033 | ||||||
| Gross profit | 8,068 | 15,804 | 7,316 | 10,741 | 41,929 | |||||||||||
| Operating income (loss) | 4,320 | 2,972 | (4,609 | ) | 7,132 | 9,815 | ||||||||||
| Net income (loss) from continuing operations | 1,043 | (6,704 | ) | (14,163 | ) | (2,877 | ) | (22,701 | ) | |||||||
| Basic net income (loss) per Unit | 0.09 | (0.54 | ) | (1.15 | ) | (0.23 | ) | (1.84 | ) | |||||||
| Diluted net income (loss) per Unit | 0.09 | (0.54 | ) | (1.15 | ) | (0.23 | ) | (1.84 | ) | |||||||
| Cash distributions per Unit | — | — | — | — | — | |||||||||||
| | First Quarter(1) | Second Quarter | Third Quarter | Fourth Quarter | Total | |||||||||||
|---|---|---|---|---|---|---|---|---|---|---|---|---|---|---|---|---|
| 2003 (REPORTED) | ||||||||||||||||
| Operating revenue | $ | 17,315 | $ | 43,956 | $ | 45,341 | $ | 46,064 | $ | 152,676 | ||||||
| Gross profit | 8,077 | 15,732 | 7,792 | 9,839 | 41,440 | |||||||||||
| Operating income (loss) | 4,329 | 2,900 | (4,133 | ) | 6,230 | 9,326 | ||||||||||
| Net income (loss) from continuing operations. | 1,052 | (6,776 | ) | (13,687 | ) | (3,779 | ) | (23,190 | ) | |||||||
| Basic net income (loss) per Unit | 0.09 | (0.55 | ) | (1.11 | ) | (0.31 | ) | (1.88 | ) | |||||||
| Diluted net income (loss) per Unit | 0.09 | (0.55 | ) | (1.11 | ) | (0.31 | ) | (1.88 | ) | |||||||
| Cash distributions per Unit | — | — | — | — | — | |||||||||||
| Predecessor Company | First Quarter(2) | Second Quarter | Third Quarter | Fourth Quarter | Total | |||||||||||
|---|---|---|---|---|---|---|---|---|---|---|---|---|---|---|---|---|
| 2003 (RESTATED) | ||||||||||||||||
| Operating revenue | $ | 31,635 | $ | — | $ | — | $ | — | $ | 31,635 | ||||||
| Gross profit | 9,971 | — | — | — | 9,971 | |||||||||||
| Operating income | 2,614 | — | — | — | 2,614 | |||||||||||
| Net income (loss) from continuing operations(3) | 64,584 | — | — | — | 64,584 | |||||||||||
| Basic net income (loss) per Unit(4) | ||||||||||||||||
| Common | 0.11 | — | — | — | 0.11 | |||||||||||
| Subordinated | — | — | — | — | — | |||||||||||
| Diluted net income (loss) per Unit | 0.08 | — | — | — | 0.08 | |||||||||||
| Cash distributions per Common Unit | — | — | — | — | — | |||||||||||
| | First Quarter(2) | Second Quarter | Third Quarter | Fourth Quarter | Total | |||||||||||
|---|---|---|---|---|---|---|---|---|---|---|---|---|---|---|---|---|
| 2003 (REPORTED) | ||||||||||||||||
| Operating revenue | $ | 31,979 | $ | — | $ | — | $ | — | $ | 31,979 | ||||||
| Gross profit | 9,681 | — | — | — | 9,681 | |||||||||||
| Operating income | 2,324 | — | — | — | 2,324 | |||||||||||
| Net income (loss) from continuing operations(3) | 64,294 | — | — | — | 64,294 | |||||||||||
| Basic net income (loss) per Unit(4) | ||||||||||||||||
| Common | 0.16 | — | — | — | 0.16 | |||||||||||
| Subordinated | — | — | — | — | — | |||||||||||
| Diluted net income (loss) per Unit | 0.11 | — | — | — | 0.11 | |||||||||||
| Cash distributions per Common Unit | — | — | — | — | — | |||||||||||
| | First Quarter | Second Quarter | Third Quarter | Fourth Quarter | Total | ||||||||||||
|---|---|---|---|---|---|---|---|---|---|---|---|---|---|---|---|---|---|
| 2002 (RESTATED) | |||||||||||||||||
| Operating revenue | $ | 54,960 | $ | 47,630 | $ | 42,776 | $ | 37,566 | $ | 182,932 | |||||||
| Gross profit | 16,993 | 12,515 | 4,321 | 3,201 | 37,030 | ||||||||||||
| Operating income (loss) | 5,293 | (1,350 | ) | (12,327 | ) | (19,211 | ) | (27,595 | ) | ||||||||
| Net income (loss) from continuing operations(3) | (5,856 | ) | (13,579 | ) | (25,372 | ) | 4,266 | (40,541 | ) | ||||||||
| Basic net income (loss) per Unit(4) | |||||||||||||||||
| Common | (0.06 | ) | — | — | — | (0.06 | ) | ||||||||||
| Subordinated | (0.51 | ) | (1.42 | ) | (1.30 | ) | — | (3.23 | ) | ||||||||
| Diluted net income (loss) per Unit | (0.20 | ) | (0.46 | ) | (0.44 | ) | — | (1.10 | ) | ||||||||
| Cash distributions per Common Unit(5) | 0.25 | — | — | — | 0.25 | ||||||||||||
| | First Quarter | Second Quarter | Third Quarter | Fourth Quarter | Total | ||||||||||||
|---|---|---|---|---|---|---|---|---|---|---|---|---|---|---|---|---|---|
| 2002 (REPORTED) | |||||||||||||||||
| Operating revenue | $ | 54,960 | $ | 47,630 | $ | 42,814 | $ | 37,538 | $ | 182,942 | |||||||
| Gross profit | 17,131 | 12,484 | 3,579 | 4,364 | 37,558 | ||||||||||||
| Operating income (loss) | 5,431 | (1,381 | ) | (13,069 | ) | (18,048 | ) | (27,067 | ) | ||||||||
| Net income (loss) from continuing operations(3) | (5,718 | ) | (13,610 | ) | (26,114 | ) | 5,429 | (40,013 | ) | ||||||||
| Basic net income (loss) per Unit(4) | |||||||||||||||||
| Common | (0.05 | ) | — | — | — | (0.05 | ) | ||||||||||
| Subordinated | (0.49 | ) | (1.43 | ) | (1.32 | ) | — | (3.24 | ) | ||||||||
| Diluted net income (loss) per Unit | (0.20 | ) | (0.46 | ) | (0.44 | ) | — | (1.10 | ) | ||||||||
| Cash distributions per Common Unit(5) | 0.25 | — | — | — | 0.25 | ||||||||||||
LINK ENERGY LLC(A LIMITED LIABILITY COMPANY)
SCHEDULE II
VALUATION AND QUALIFYING ACCOUNTS AND RESERVESFOR THE TEN MONTHS ENDED DECEMBER 31, 2003, TWO MONTHSENDED FEBRUARY 28, 2003, ANDFOR THE YEARS ENDED DECEMBER 31, 2002 AND 2001
(In Thousands)
| | Balance at Beginning of Period | Charges to Costs and Expenses | Deductions and Other | Balance at End of Period | |||||||||
|---|---|---|---|---|---|---|---|---|---|---|---|---|---|
| Successor Company | |||||||||||||
| Ten Months Ended December 31, 2003 | |||||||||||||
| Allowance for Doubtful Accounts | $ | 1,210 | $ | — | $ | — | $ | 1,210 | |||||
| Litigation Provisions | $ | 1,605 | $ | — | $ | (1,146 | ) | $ | 459 | ||||
| Safety and Environmental | $ | 13,440 | $ | 9,107 | $ | (10,331 | ) | $ | 12,216 | ||||
Predecessor Company | |||||||||||||
| Two Months Ended February 28, 2003 | |||||||||||||
| Allowance for Doubtful Accounts | $ | 1,210 | $ | — | $ | — | $ | 1,210 | |||||
| Litigation Provisions | $ | 8,376 | $ | — | $ | (6,771 | ) | $ | 1,605 | ||||
| Safety and Environmental | $ | 13,440 | $ | 1,979 | $ | (1,979 | ) | $ | 13,440 | ||||
| Year ended December 31, 2002 | |||||||||||||
| Allowance for Doubtful Accounts | $ | 1,225 | $ | — | $ | (15 | ) | $ | 1,210 | ||||
| Litigation Provisions | $ | 315 | $ | 8,163 | $ | (102 | ) | $ | 8,376 | ||||
| Safety and Environmental | $ | 12,075 | $ | 14,819 | $ | (13,454 | ) | $ | 13,440 | ||||
| Year ended December 31, 2001 | |||||||||||||
| Allowance for Doubtful Accounts | $ | 1,827 | $ | — | $ | (602 | ) | $ | 1,225 | ||||
| Litigation Provisions | $ | 1,000 | $ | 315 | $ | (1,000 | ) | $ | 315 | ||||
| Safety and Environmental | $ | 6,412 | $ | 25,372 | $ | (19,709 | ) | $ | 12,075 | ||||
Report of Independent Auditors
To the Board of Directors ofShell Pipeline Company LP the General Partner and partners of Plains AAP, L.P.:
In our opinion, the accompanying combined balance sheets and the related combined statements of income and owner's net investment and cash flows of the Capline Pipe Line Business, Capwood Pipe Line Business and Patoka Pipe Line Business ("the Businesses") presentsheet presents fairly, in all material respects, the financial position of the BusinessesPlains AAP, L.P. at December 31, 2003 and 2002, and the results of their operations and their cash flows for the year ended December 31, 2003, and for the periods February 14, 2002, through December 31, 2002, and January 1, 2002, through February 13, 2002,2004 in conformity with accounting principles generally accepted in the United States of America. TheseThis financial statements arestatement is the responsibility of Shell Pipeline CompanyPlains AAP, L.P.'s management; our responsibility is to express an opinion on thesethis financial statementsstatement based on our audits.audit. We conducted our auditsaudit of these statementsthis statement in accordance with auditing standards generally accepted in the United States of America, which require that we plan and perform the audit to obtain reasonable assurance about whether the financial statements arebalance sheet is free of material misstatement. An audit includes examining, on a test basis, evidence supporting the amounts and disclosures in the financial statements,balance sheet, assessing the accounting principles used and significant estimates made by management, and evaluating the overall financial statementbalance sheet presentation. We believe that our audits provideaudit of the balance sheet provides a reasonable basis for our opinion.
As described in Note 6, the Businesses were sold on March 1, 2004, to Plains All American Pipeline L.P.
PricewaterhouseCoopers LLP
Houston, TexasMarch 12, 2004
Capline Pipe Line Business, Capwood Pipe Line Business and Patoka Pipe Line BusinessCombined Balance SheetsDecember 31, 2003 and 2002
| (dollars in thousands) | 2003 | 2002 | ||||||
|---|---|---|---|---|---|---|---|---|
| Assets | ||||||||
| Current assets | ||||||||
| Accounts receivable | $ | 421 | $ | 679 | ||||
| Allowance oil inventory | 4,853 | 8,192 | ||||||
| Materials and supplies | 357 | 372 | ||||||
| Other | 116 | 41 | ||||||
| 5,747 | 9,284 | |||||||
| Property and equipment, net | 93,857 | 98,428 | ||||||
| Total assets | $ | 99,604 | $ | 107,712 | ||||
| Liabilities and Owner's Net Investment | ||||||||
| Current liabilities | ||||||||
| Property tax payable | $ | 343 | $ | 91 | ||||
| Other | — | 48 | ||||||
| Total current liabilities | 343 | 139 | ||||||
| Owner's net investment | 99,261 | 107,573 | ||||||
| Total liabilities and owner's net investment | $ | 99,604 | $ | 107,712 | ||||
The accompanying notes are an integral part of these financial statements.
Capline Pipe Line Business, Capwood Pipe Line Business and Patoka Pipe Line BusinessCombined Statements of Income and Owner's Net Investment
| (dollars in thousands) | Year Ended December 31, 2003 | February 14 through December 31, 2002 | January 1 through February 13, 2002 | ||||||||
|---|---|---|---|---|---|---|---|---|---|---|---|
| Revenue | |||||||||||
| Transportation and allowance oil revenue | $ | 34,363 | $ | 43,974 | $ | 6,028 | |||||
| Other revenue | 1,492 | 746 | 102 | ||||||||
| Total revenue | 35,855 | 44,720 | 6,130 | ||||||||
| Costs and expenses | |||||||||||
| Power and fuel | 5,535 | 7,298 | 1,000 | ||||||||
| Outside services | 2,271 | 1,995 | 273 | ||||||||
| Salary and wages | 1,769 | 1,346 | 184 | ||||||||
| Depreciation | 5,264 | 4,589 | 64 | ||||||||
| Taxes other than taxes on income | 657 | 570 | 78 | ||||||||
| Materials and supplies | 342 | 460 | 63 | ||||||||
| Management fees | 528 | 457 | 63 | ||||||||
| Pension and benefits | 421 | 287 | 39 | ||||||||
| Other | 326 | 299 | 40 | ||||||||
| Total costs and expense | 17,113 | 17,301 | 1,804 | ||||||||
| Net income | 18,742 | 27,419 | 4,326 | ||||||||
Deemed distributions to parent company | (27,054 | ) | (31,967 | ) | (4,382 | ) | |||||
Purchase price allocation | — | 93,730 | — | ||||||||
Owner's net investment | |||||||||||
| Beginning of period | 107,573 | 18,391 | 18,447 | ||||||||
| End of period | $ | 99,261 | $ | 107,573 | $ | 18,391 | |||||
The accompanying notes are an integral part of these financial statements.The post-acquisition financial statements reflect a new basis of accounting, and the pre-acquisition and post-acquisition period financial statements are presented but are not comparable (See Note 1 in the Notes to Combined Financial Statements).
Capline Pipe Line Business, Capwood Pipe Line Business and Patoka Pipe Line BusinessCombined Statements of Cash Flows
| (dollars in thousands) | Year Ended December 31, 2003 | February 14 through December 31, 2002 | January 1 through February 13, 2002 | ||||||||||
|---|---|---|---|---|---|---|---|---|---|---|---|---|---|
| Cash flows provided by operating activities | |||||||||||||
| Net income | $ | 18,742 | $ | 27,419 | $ | 4,326 | |||||||
| Adjustments to reconcile net income to net cash provided by operating activities | |||||||||||||
| Depreciation | 5,264 | 4,589 | 64 | ||||||||||
| (Increase) decrease in working capital | |||||||||||||
| Receivables | 258 | 237 | 32 | ||||||||||
| Allowance oil inventory | 3,339 | 662 | 90 | ||||||||||
| Materials and supplies | 15 | 33 | 5 | ||||||||||
| Property tax payable | 252 | (32 | ) | (5 | ) | ||||||||
| Other | (123 | ) | 48 | 6 | |||||||||
| 9,005 | 5,537 | 192 | |||||||||||
| Net cash provided by operating activities | 27,747 | 32,956 | 4,518 | ||||||||||
| Cash flows used for investing activities | |||||||||||||
| Capital expenditures | (693 | ) | (989 | ) | (136 | ) | |||||||
| Net cash used for investing activities | (693 | ) | (989 | ) | (136 | ) | |||||||
| Cash flows used for financing activities | |||||||||||||
| Deemed distributions to parent company | (27,054 | ) | (31,967 | ) | (4,382 | ) | |||||||
| Net cash used for financing activities | (27,054 | ) | (31,967 | ) | (4,382 | ) | |||||||
| Net increase in cash and cash equivalents | — | — | — | ||||||||||
| Cash and cash equivalents | |||||||||||||
| Beginning of period | — | — | — | ||||||||||
| End of period | — | — | — | ||||||||||
| Nonmonetary activities | |||||||||||||
| Purchase price allocation | $ | — | $ | 93,730 | $ | — | |||||||
The accompanying notes are an integral part of these financial statements.The post-acquisition financial statements reflect a new basis of accounting, and the pre-acquisition and post-acquisition period financial statements are presented but are not comparable (See Note 1 in the Notes to Combined Financial Statements).
Capline Pipe Line Business, Capwood Pipe Line Business and Patoka Pipe Line BusinessNotes to Combined Financial Statements
1. Organization and Basis of Presentation
The accompanying combined financial statements present, in conformity with accounting principles generally accepted in the United States of America, the assets, liabilities, revenues and expenses of the historical operations of the transportation businesses comprised of the Capline Pipe Line Business, Capwood Pipe Line Business and Patoka Pipe Line Business (collectively the "Businesses") owned by Shell Pipeline Company LP ("Shell Pipeline"), formerly Equilon Pipeline Company LLC. Throughout the period covered by the financial statements, Shell Pipeline owned and managed the Businesses' operations.
Effective January 1, 1998, Shell Oil Company ("Shell Oil") and Texaco, Inc. ("Texaco") formed Equilon Enterprises LLC ("Equilon Enterprises") with 56 percent and 44 percent membership interests, respectively. Shell Pipeline is a wholly owned subsidiary of Equilon Enterprises.
In connection with the 2002 merger of Chevron Corporation and Texaco, Inc., the Federal Trade Commission required Texaco to divest its interest in Equilon Enterprises, and in early 2002 Shell Oil acquired Texaco's 44 percent interest in Equilon Enterprises, making Shell Oil the 100 percent owner of Equilon Enterprises. The acquisition by Shell Oil was accounted for using the purchase method of accounting in accordance with generally accepted accounting principles, with Shell Pipeline allocating the purchase price paid by Shell Oil to Shell Pipeline's net assets as of the acquisition date. Accordingly, the post-acquisition financial statements reflect a new basis of accounting, and the pre-acquisition period and post-acquisition period financial statements are presented but are not comparable.
The Capline Pipe Line Business ("Capline") is an undivided interest in a pipeline system consisting of 667 miles of 40-inch pipe from St. James, Louisiana to Patoka, Illinois. The Capwood Pipe Line Business ("Capwood") is an undivided interest in a pipeline system consisting of 57 miles of 20-inch pipe from Patoka, Illinois to Wood River, Illinois. The Patoka Pipe Line Business is a wholly owned pipeline system consisting of 1.2 miles of 22-inch pipe connecting Capline to storage locations in Patoka. Shell Pipeline's ownership percentages of each of the pipelines mentioned above are 22 percent, 76 percent and 100 percent, respectively. The combined financial statements include the Businesses' pro rata share of the assets, liabilities, revenues and expenses, because the undivided interests are not subject to joint control and the Businesses are only responsible for their pro rata share of direct costs.
The accompanying combined financial statements are presented on a carve-out basis to include the historical operations of the Businesses owned by Shell Pipeline viewed from a nonoperator perspective. In this context, a direct relationship existed between the carve-out operations and the operator, Shell Pipeline. Shell Pipeline's net investment in the Businesses (owner's net investment) is shown in lieu of stockholder's equity in the combined financial statements.
The combined statement of income and owner's net investment includes the pro rata share of the annual management fee charged to the undivided interests by the operator. The results of operations also include pro-rata allocations in accordance with the terms of the operating agreement, generally based on direct payroll and benefit costs.
Throughout the period covered by the combined financial statements, Shell Pipeline has provided cash management services to the Businesses through a centralized treasury function. As a result, all charges and cost allocations for the Businesses were deemed to have been paid by the Businesses to Shell Pipeline, in cash, during the period in which the cost was recorded in the combined financial statements.
All of the allocations and estimates in the combined financial statements were based on assumptions that Shell Pipeline management believes were reasonable under the circumstances. These allocations and estimates are not necessarily indicative of the costs and expenses that would have resulted if the Businesses had been operated as a separate entity.
2. Significant Accounting Policies
Use of Estimates
The preparation of financial statements in conformity with accounting principles generally accepted in the United States of America requires management to make estimates and assumptions that affect the reported amounts of assets, liabilities, revenues and expenses and the disclosures of contingent assets and liabilities. Although Shell Pipeline's management believes these estimates are reasonable, actual results could differ from these estimates.
Revenue Recognition
Revenues for the transportation of crude are recognized (1) based upon regulated tariff rates and the related transportation volumes and (2) when the delivery of crude is made to the shipper or another common carrier pipeline. Allowance oil revenue is recognized when the Businesses receive the allowance oil volumes, which are valued at current market value. Any allowance oil sold is recorded in revenue as a net amount based on the selling price less its weighted average cost. Other revenue consists of additional charges in accordance with the tariff agreement based on the viscosity of the crude oil.
Property and Equipment
Crude oil pipeline and gathering assets are carried at cost. Costs subject to depreciation are net of expected salvage values and deprecation is calculated on a straight-line basis over the estimated useful lives of the respective assets as follows:
Acquisitions and expenditures for renewals and betterments are capitalized, while maintenance and repairs, which do not improve or extend asset life, are expensed as incurred.
Impairment of Long-Lived Assets
The Businesses have adopted Statement of Financial Accounting Standards ("SFAS") No. 144,Accounting for the Impairment or Disposal of Long-Lived Assets, effective January 1, 2002. SFAS No. 144 retains the fundamental provisions of existing generally accepted accounting principles in the United States of America ("GAAP") with respect to the recognition and measurement of long-lived asset impairment contained in SFAS No. 121,Accounting for the Impairment of Long-Lived Assets and for Long-Lived Assets to Be Disposed Of. However, SFAS No. 144 provides new guidance intended to address certain significant implementation issues associated with SFAS No. 121, including expanded guidance with respect to appropriate cash flows to be used to determine whether recognition of any long-lived asset impairment is required, and if required how to measure the amount of the impairment. SFAS No. 144 also requires that any net assets to be disposed of by sale be reported at the lower of
carrying value or fair value less cost to sell, and expands the reporting of discontinued operations to include any component of any entity.
Accounts Receivable
Accounts receivable are valued at historical cost less an allowance for doubtful accounts.
Allowance Oil
A loss allowance factor of 0.2 percent on average, by volume, is incorporated into crude oil tariffs to offset evaporation and other losses in transit. The net excess of allowance quantities, calculated in accordance with the tariffs, over actual losses is valued at the average market value at the time the excess occurred and the result is recorded as allowance oil revenue. Inventories of allowance oil are carried at the lower of such value (cost) or market value with cost being determined on an average-cost basis. Gains or losses on sales of allowance oil barrels are included in transportation and allowance oil revenue.
Materials and Supplies
Inventories of materials and supplies are carried at lower of historical cost or market.
Environmental and Other Accrued Liabilities
The Businesses accrue for environmental remediation and other accrued liabilities when it is probable that such liabilities exist, based on past events or known conditions, and the amount of such liability can be reasonably estimated. If the Businesses can only estimate a range of probable liabilities, the minimum future undiscounted expenditure necessary to satisfy the Businesses' future obligation is accrued.
Concentration of Credit and Other Risks
A significant portion of the Businesses' revenues and receivables are from oil and gas companies. Although collection of these receivables could be influenced by economic factors affecting the oil and gas industry, management believes the risk of significant loss is considered remote.
One customer individually represents 53, 64 and 64 percent of sales for the fiscal year ended December 31, 2003, and for the periods February 14, 2002, to December 31, 2002, and January 1, 2002, to February 13, 2002, respectively. Another customer individually represents 14 percent of sales for the fiscal year ended December 31, 2003.
Development and production of crude oil in the service area of the pipelines is subject to among other factors, prices of crude oil and federal and state energy policy, none of which are within the Businesses' control.
Income Taxes
The Businesses have not historically incurred income tax expense as the Businesses were in partnerships, which, in accordance with the provisions of the Internal Revenue Code, are not subject to U.S. Federal income taxes. Rather, each partner includes its allocated share of the partnership's income or loss in its own federal and state income tax returns.
New Accounting Standards
Statement of Financial Accounting Standards No. 146,Accounting for Costs Associated with Exit or Disposal Activities—SFAS No. 146, issued in June 2002, addresses financial accounting and reporting for costs associated with exit or disposal activities and nullifies EITF 94-3,Liability Recognition for Certain Employee Termination Benefits and Other Costs to Exit an Activity (including Certain Costs Incurred in a Restructuring). In accordance with the requirements of the standard, the Businesses have adopted SFAS No. 146 for exit and disposal activities initiated after December 31, 2002. The Businesses did not have exit or disposal activities and accordingly, the adoption of SFAS No. 146 did not have an effect on the Businesses' financial position, results of operations or liquidity.
FASB Interpretation No. 45Guarantor's Accounting and Disclosure Requirements for Guarantees, Including Indirect Guarantees of Indebtedness of Others—FIN No. 45, issued in November 2002, elaborates on the disclosures to be made by a guarantor in its financial statements about its obligations under certain guarantees that it has provided. It also clarifies that a guarantor is required to recognize, at the inception of a guarantee, a liability for the fair value of the obligation undertaken in issuing the guarantee. The Businesses have adopted FIN No. 45 and new guarantees, except those specifically excluded from the scope of the interpretation, issued after December 31, 2002, have been recognized at their fair value as a liability in accordance with the requirements of the interpretation. There were no guarantees in respect to the Businesses and accordingly, the adoption of FIN No. 45 did not have an effect on the Businesses' financial position, results of operations or liquidity.
3. Property, Plant and Equipment
Property, plant and equipment consisted of the following at December 31, 2003 and 2002:
| | 2003 | 2002 | ||||
|---|---|---|---|---|---|---|
| Land | $ | 533 | $ | 533 | ||
| Right of way | 615 | 615 | ||||
| Line pipe | 65,557 | 65,314 | ||||
| Equipment and other pipeline assets | 25,070 | 24,442 | ||||
| Oil tanks | 11,610 | 11,078 | ||||
| Construction work-in-progress | 325 | 1,035 | ||||
| 103,710 | 103,017 | |||||
Accumulated depreciation | 9,853 | 4,589 | ||||
| Net property, plant and equipment | $ | 93,857 | $ | 98,428 | ||
As described in Note 1, on February 13, 2002, Shell Oil acquired Texaco's 44 percent interest in Equilon Enterprises, making Shell Oil the 100 percent owner of Equilon Enterprises. The acquisition was accounted for using the purchase method of accounting in accordance with generally accepted accounting principles. Shell Oil's property, plant and equipment including the Capline, Capwood and Patoka Pipe Line Businesses was adjusted to estimated fair market value on February 14, 2002, and depreciated based on revised estimated remaining useful lives. The Businesses' accumulated depreciation balance at February 14, 2002, was eliminated pursuant to the purchase method of accounting.
4. Related Party Transactions
The Businesses have entered into transactions with Shell Oil including its affiliates. Such transactions are in the ordinary course of business, include the transportation of crude oil and petroleum products and approximate market value.
The aggregate amounts of such transactions for the year ended December 31, 2003, and for the periods ended December 31, 2002, and February 13, 2002, consisted of pipeline tariff revenues totaling approximately $781,000, $287,000 and $39,000, respectively.
The Businesses have no employees and rely on the operator, Shell Pipeline, to provide personnel to perform daily operating and administrative duties on behalf of the Businesses. Accordingly, in accordance with the terms of the operating agreement, the operator has charged the Businesses for management fees aggregating approximately $528,000, $427,000 and $63,000 for the year ended December 31, 2003, and for the periods ended December 31, 2002, and February 13, 2002, respectively.
Certain of those personnel participate in the Alliance Pension Plan (a defined benefit plan) and the Alliance Savings Plan (a defined contribution plan). Also, certain of those personnel participate in Shell sponsored benefit plans that provide pensions and other postretirement benefits. A portion of these plans are unfunded, and the costs are shared by Shell Oil and its employees. The Businesses' allocated expense related to these plans was approximately $421,000, $288,000 and $39,000 for the year ended December 31, 2003, and for the periods ended December 31, 2002, and February 13, 2002, respectively.
In addition, as described in Note 1, the results of operations also include allocations of salary and wages. Such allocations totaled approximately $1,769,000, $1,346,000 and $184,000 for the year ended December 31, 2003, and for the periods ended December 31, 2002, and February 13, 2002, respectively.
5. Commitments and Contingencies
The Businesses lease certain real property, equipment and operating facilities under various operating leases. The Businesses also incur costs associated with leased land, rights-of-way, permits and regulatory fees, the contracts for which generally extend beyond one year but can be cancelled at any time should they not be required for operations. Future noncancellable commitments related to these items at December 31, 2003 were not significant.
Total lease expense incurred for the year ended December 31, 2003, and for the periods ended December 31, 2002, and February 13, 2002, was approximately $136,000, $106,000 and $15,000, respectively.
The Businesses are subject to possible loss contingencies including actions or claims based on environmental laws, federal regulations, and other matters.
The Businesses may be obligated to take remedial action as a result of the enactment of laws or the issuance of new regulations or to correct for the effects of the Businesses' actions on the environment. The Businesses have not accrued for any liability at December 31, 2003 or 2002, for planned environmental remediation activities. In management's opinion, this is appropriate based on existing facts and circumstances.
6. Subsequent Event
On December 16, 2003, Shell Pipeline entered into a purchase and sale agreement with Plains All American Pipeline L.P. committing to sell the Businesses for approximately $158 million excluding transaction costs and crude oil inventory and linefill requirements. The transaction closed on March 1, 2004.April 8, 2005
PLAINS AAP, L.P. BALANCE SHEET (in thousands)
| | June 30, 2004 | ||||||||
|---|---|---|---|---|---|---|---|---|---|
| | | (unaudited) | | December 31, 2004 | |||||
| ASSETS | ASSETS | ASSETS | |||||||
| Cash | Cash | $ | 8 | Cash | $ | 7 | |||
| Investment in Plains All American Pipeline, L.P. | Investment in Plains All American Pipeline, L.P. | 63,491 | Investment in Plains All American Pipeline, L.P. | 67,516 | |||||
| Total Assets | $ | 67,523 | |||||||
Total Assets | $ | 63,499 | |||||||
LIABILITIES AND PARTNERS' CAPITAL | LIABILITIES AND PARTNERS' CAPITAL | LIABILITIES AND PARTNERS' CAPITAL | |||||||
| LIABILITIES | LIABILITIES | LIABILITIES | |||||||
| Performance Options Obligation | Performance Options Obligation | $ | 1,577 | Performance Options Obligation | $ | 4,061 | |||
| COMMITMENTS AND CONTINGENCIES | COMMITMENTS AND CONTINGENCIES | COMMITMENTS AND CONTINGENCIES | |||||||
| PARTNERS' CAPITAL | PARTNERS' CAPITAL | PARTNERS' CAPITAL | |||||||
| Limited Partners | Limited Partners | 61,436 | Limited Partners | 62,954 | |||||
| General Partner | General Partner | 486 | General Partner | 508 | |||||
Total Partners' Capital | 61,922 | ||||||||
| Total Liabilities and Partners' Capital | $ | 63,499 | Total Partners' Capital | 63,462 | |||||
| Total Liabilities and Partners' Capital | $ | 67,523 | |||||||
The accompanying notes are an integral part of this financial statement.
PLAINS AAP, L.P.
Notes to the Financial Statement
Note 1—Organization
Plains AAP, L.P. (the "Partnership") is a Delaware limited partnership, which was formed on May 21, 2001 and, through a series of transactions, was capitalized on June 8, 2001. Through this series of transactions, Plains Holdings II Inc. conveyed to the Partnership its general partner interest in Plains All American Pipeline, L.P. ("PAA") and subsequently sold a portion of its interest in the newly formed partnership to certain investors. The ownership interests in the Partnership (collectively, the "Partners") at June 30,December 31, 2004, are comprised of a 1% general partner interest held by Plains All American GP LLC (the "General Partner") and the following limited partner interests:
As of June 30,December 31, 2004, we own a 2% general partner interest in PAA as well as incentive distribution rights, the ownership of which entitles us to receive incentive distributions if the amount that PAA distributes with respect to any quarter exceeds levels specified in the PAA partnership agreement. We also own a limited partner interest consisting of 446,875 common units (see Note 4). PAA is a publicly traded Delaware limited partnership, formed in 1998 and engaged in interstate and intrastate crude oil transportation, and crude oil gathering, marketing, terminalling and storage, as well as the marketing and storage of liquefied petroleum gas and other petroleum products (collectively, "LPG"), primarily in Texas, California, Oklahoma, Louisiana, Kansas,the United States and the Canadian provinces of Alberta and Saskatchewan.Canada. PAA's operations can be categorized into two primary business activities:
Crude Oil Pipeline Transportation Operations. As of June 30,December 31, 2004, PAA owned approximately 15,000 miles of active gathering and mainline crude oil pipelines located throughout the United States and Canada. Its activities from pipeline operations generally consist of transporting crude oil for a fee, third party leases of pipeline capacity, barrel exchanges and buy/sell arrangements.
Gathering, Marketing, Terminalling and Storage Operations. As of June 30,December 31, 2004, PAA owned approximately 37 million barrels of active above-ground crude oil terminalling and storage facilities, including tankage associated with its pipeline systems. These facilities include a crude oil terminalling and storage facility at Cushing, Oklahoma. Cushing is one of the largest crude oil market hubs in the United States and the designated delivery point for NYMEX crude oil futures contracts. PAA utilizes its storage tanks to counter-cyclically balance its gathering and marketing operations and to execute various hedging strategies to stabilize profits and reduce the negative impact of crude oil market volatility. PAA's terminalling and storage operations also generate revenue at the Cushing Interchange and ourits other locations through a combination of storage and throughput charges to third parties. PAA's gathering and marketing operations include: the
purchase of crude oil at the wellhead and the bulk purchase of crude oil at pipeline and terminal facilities;facilities, as well as foreign cargoes; the transportation of crude oil on trucks, barges and pipelines; the subsequent resale or exchange of crude oil at various points along the crude oil distribution chain; and the purchase of LPG from producers, refiners and other marketers, the storage of LPG at storage facilities owned by PAA or other parties and the sale of LPG to wholesalers, retailers and industrial end users.
Note 2—Summary of Significant Accounting Policies
Use of Estimates
The preparation of financial statements in conformity with generally accepted accounting principles requires management to make estimates and assumptions that affect the reported amounts of assets and liabilities and disclosure of contingent assets and liabilities at the date of the balance sheet. These estimates include those made in determining the value of the vested options under our Performance Option Plan (see Note 6). Although management believes these estimates are reasonable, actual results could differ, and may differ materially from these estimates.
Investment in PAA
Management has determined that PAA is not a variable interest entity as defined by FASB Interpretation No. 46 "Consolidation of Variable Interest Entities." Accordingly, weWe account for our ownership investment in PAA in accordance with Accounting Principles Board Opinion No. 18, "The Equity Method of Accounting for Investments in Common Stock." We have the ability to exercise significant influence over PAA, but not control; and therefore, we account for the investment under the equity method (see Note 5). Changes in our ownership interest due to PAA's issuance of additional capital or other capital transactions that alter our ownership investment are recorded directly to partners' capital.
Stock-Based Compensation
The recipients of the options issued under the Performance Option Plan are employees of the General Partner. The options are options to purchase units of PAA. Thus, the accounting models prescribed by both Statement of Financial Accounting Standards ("SFAS") No. 123, "Accounting for Stock-Based Compensation," as amended by SFAS No. 148 "Accounting for Stock-Based Compensation—Transition and Disclosure"123R (revised 2004) "Share-Based Payment", and Accounting Principles Board Opinion No. 25 "Accounting for Stock Issued to Employees" are not appropriate. We account for the options using an approach based on when the options will vest. Once the options vest, we adjust the accrual each period based on their fair market value as calculated using the "Black-Scholes Model" (see Note 6).
Income Taxes
No liability for U.S. Federal or Canadian income taxes related to our operations is included in the accompanying financial statement because, as a partnership, we are not subject to Federal, State or Provincial income tax; and the tax effect of our activities accrues to the Partners. The Partners may be required to file U.S. Federal and State, as well as Canadian Federal and Provincial, income tax returns.
Note 3—Investment in PAA
Our investment in PAA at June 30,December 31, 2004, is approximately $63.5$67.5 million. The summarized financial information of PAA at June 30,December 31, 2004, is presented below (in thousands)millions):
| Current assets | $ | 829,449 | $ | 1,101.2 | ||
| Non-current assets | $ | 1,852,455 | $ | 2,059.2 | ||
| Current liabilities | $ | 855,646 | $ | 1,113.7 | ||
| Long-term debt and other long-term liabilities | $ | 960,739 | $ | 976.5 | ||
| Partners' capital | $ | 865,519 | $ | 1,070.2 |
At the date of inception, our investment in PAA exceeded our share of the underlying equity in the net assets of PAA by approximately $44.5 million. This excess is related to the fair value of PAA's crude oil pipelines and other assets at the time of inception and is amortized on a straight-line basis over their estimated useful life of 30 years. At June 30,December 31, 2004, the unamortized portion of this excess was approximately $36.5$35.7 million.
Note 4—Contribution of Subordinated Units
On June 8, 2001, certain of our limited partners contributed to us an aggregate of 450,000 subordinated units of PAA. In November 2003, 25% of these subordinated units converted into common units, and the remaining 75% converted into common units in February 2004. These 450,000 units (the "Option Units") (446,875 units remain after options were exercised) are intended for use in connection with an option plan pursuant to which certain members of the management of our general partner will, subject to the satisfaction of vesting criteria, have a right to purchase a portion of such Option Units. During 2003, options for 3,125 Option Units were exercised (see Note 6). Until the exercise of the remainder of such options, we will continue to own and receive any distributions paid by PAA with respect to the Option Units. Any distributions we make as a result of the receipt of distributions on the Option Units will be paid to our limited partners in proportion to the original contribution of the Option Units.
The conversion of the remaining 75% of the subordinated units in February of 2004 resulted in an increase in our investment of approximately $1.5 million for the Partnership. This change of interest gain was non-cash and has been reflected in our partners' capital.
Note 5—Partners' Capital
We distribute all of our available cash, less reserves established by management, on a quarterly basis. Except as described in Note 4, distributions are paid to the partners in proportion to their percentage interest in the Partnership. Included in partners' capital is accumulated other comprehensive income of approximately $5.1$6.5 million related to our share of PAA's accumulated other comprehensive income (loss). Other comprehensive income (loss) is allocated based on each partner's ownership interest.
The General Partner manages the business and affairs of the Partnership. Except for situations in which the approval of the limited partners is expressly required by the Partnership agreement, or by nonwaivable provisions of applicable law, the General Partner has full and complete authority, power and discretion to manage and control the business, affairs and property of the Partnership, to make all decisions regarding those matters and to perform any and all other acts or activities customary or incident to the management of the Partnership's business, including the execution of contracts and
management of litigation. The General Partner (or, in the case of PAA's Canadian operations, PMC (Nova Scotia) Company) employs all officers and personnel involved in the operation and management of PAA and its subsidiaries. PAA reimburses the General Partner for all expenses, including compensation expenses, related to such operation and management. The Partnership has no commitment or intent to fund cash flow deficits or furnish other financial assistance to PAA.
Note 6—Performance Option Plan
In June 2001, During the Performance Option Plan (the "Plan") was approved by the General Partner to grant options to purchase up to 450,000 Option Units of PAA to employees of the General Partner. See Note 4. Options to purchase 375,000 units have been issued under the Plan. The options were granted with a per unit exercise price of $22, less 80% of any per unit distribution on an Option Unit from June 2001, until the date of exercise. As of July 21, 2004, the exercise price has been reduced to $16.39 for distributions made since June 2001.
The options have a ten-year term and vest in 25% increments upon PAA achieving quarterly distribution levels as follows:
| Vesting % | Quarterly Distribution Level | Annual Distribution Level | ||||
|---|---|---|---|---|---|---|
| 25% | $ | 0.525 | $ | 2.10 | ||
| 50% | $ | 0.575 | $ | 2.30 | ||
| 75% | $ | 0.625 | $ | 2.50 | ||
| 100% | $ | 0.675 | $ | 2.70 | ||
These options are considered performance awards and are accounted for at fair value upon vesting and are revalued at each financial statement date based on the "Black-Scholes Model." At June 30, 2004, an estimated fair value of $17.40 per unit resulted in a cumulative reduction of the Partners' capital accounts and corresponding increase in the Performance Options Obligation of approximately $1.6 million. No options expired or were forfeited during the period. Future grants may include different vesting criteria.
The facts and assumptions used in the "Black-Scholes Model" at June 30, 2004, were as follows:
| | | | Assumptions | ||||||||||
|---|---|---|---|---|---|---|---|---|---|---|---|---|---|
| Options Outstanding | Percent Vested | Options Vested | Weighted Average Interest Rate | Weighted Average Expected Life | Weighted Average Expected Volatility | Weighted Average Expected Dividend Yield(1) | |||||||
| 371,875 | 25 | % | 90,625 | 3.85 | % | 4.2 | 29.50 | % | 1.89 | % | |||
Note 7—Subsequent Event
Distribution
PAA declared cash distributions to the Partnership of $3.0 million ($0.8 million for its general partner interest and $2.2 million for its incentive distribution interest) for the secondthird quarter of 2004. The distribution, which was declared on July 21, 2004, was received on August 15, 2004. With the payment of this distribution of $0.5775 per unit, the vesting requirements have been met for the next 25% increment of options.
Report of Independent Registered Public Accounting Firm
To the Board of Directors of Plains AAP, L.P.:
In our opinion, the accompanying balance sheet presents fairly, in all material respects, the financial position of Plains AAP, L.P. at December 31, 2003 in conformity with accounting principles generally accepted in the United States of America. This financial statement is the responsibility of Plains AAP, L.P.'s management. Our responsibility is to express an opinion on this financial statement based on our audit. We conducted our audit of this statement in accordance with the standards of the Public Company Accounting Oversight Board (United States). Those standards require that we plan and perform the audit to obtain reasonable assurance about whether the balance sheet is free of material misstatement. An audit includes examining, on a test basis, evidence supporting the amounts and disclosures in the balance sheet, assessing the accounting principles used and significant estimates made by management, and evaluating the overall balance sheet presentation. We believe that our audit of the balance sheet provides a reasonable basis for our opinion.
PricewaterhouseCoopers LLP
Houston, TexasApril 13, 2004
PLAINS AAP, L.P.BALANCE SHEET(in thousands)
| | December 31, 2003 | |||||
|---|---|---|---|---|---|---|
| ASSETS | ||||||
| Cash | $ | 8 | ||||
| Investment in Plains All American Pipeline, L.P. | 59,986 | |||||
| Total Assets | $ | 59,994 | ||||
LIABILITIES AND PARTNERS' CAPITAL | ||||||
LIABILITIES | ||||||
Performance Options Obligation | $ | 1,445 | ||||
COMMITMENTS AND CONTINGENCIES | ||||||
PARTNERS' CAPITAL | ||||||
| Limited Partners | 58,102 | |||||
| General Partner | 447 | |||||
| Total Partners' Capital | 58,549 | |||||
| Total Liabilities and Partners' Capital | $ | 59,994 | ||||
The accompanying notes are an integral part of this financial statement.
PLAINS AAP, L.P.Notes to the Financial Statement
Note 1—Organization
Plains AAP, L.P. (the "Partnership") is a Delaware limited partnership, which was formed on May 21, 2001, and, through a series of transactions, was capitalized on June 8, 2001. Through this series of transactions Plains Holdings II Inc. conveyed to the Partnership its general partner interest in Plains All American Pipeline, L.P. ("PAA") and subsequently sold a portion of its interest in the newly formed partnership to certain investors. The ownership interests in the Partnership (collectively, the "Partners") at December 31, 2003, are comprised of a 1% general partner interest held by Plains All American GP LLC (the "General Partner") and the following limited partner interests:
As of December 31, 2003, we own a 2% general partner interest in PAA and a limited partner interest consisting of 446,875 common and subordinated units (see Note 4). PAA is a publicly traded Delaware limited partnership, formed in 1998 and engaged in interstate and intrastate crude oil transportation, and crude oil gathering, marketing, terminalling and storage, as well as the marketing and storage of liquefied petroleum gas and other petroleum products, primarily in Texas, California, Oklahoma, Louisiana and the Canadian Provinces of Alberta and Saskatchewan. PAA's operations can be categorized into two primary business activities:
Crude Oil Pipeline Transportation Operations. PAA owns and operates approximately 7,000 miles of gathering and mainline crude oil pipelines located throughout the United States and Canada. Its activities from pipeline operations generally consist of transporting crude oil for a fee, third party leases of pipeline capacity, barrel exchanges and buy/sell arrangements.
Gathering, Marketing, Terminalling and Storage Operations. PAA owns and operates approximately 24.0 million barrels of above-ground crude oil terminalling and storage facilities, including tankage associated with its pipeline systems. These facilities include a crude oil terminalling and storage facility at Cushing, Oklahoma. Cushing is one of the largest crude oil market hubs in the United States and the designated delivery point for NYMEX crude oil futures contracts. PAA utilizes its storage tanks to counter-cyclically balance its gathering and marketing operations and to execute various hedging strategies to stabilize profits and reduce the negative impact of crude oil market volatility. PAA's terminalling and storage operations also generate revenue at the Cushing Interchange and our other locations through a combination of storage and throughput charges to third parties. PAA's gathering and marketing operations include:
Note 2—Summary of Significant Accounting Policies
Use of Estimates
The preparation of financial statements in conformity with generally accepted accounting principles requires management to make estimates and assumptions that affect the reported amounts of assets and liabilities and disclosure of contingent assets and liabilities at the date of the balance sheet. These estimates include those made in determining the value of the vested options under our Performance Option Plan (see Note 6). Although management believes these estimates are reasonable, actual results could differ from these estimates.
Investment in PAA
We account for our ownership investment in PAA in accordance with Accounting Principles Board Opinion No. 18, "The Equity Method of Accounting for Investments in Common Stock." We have the ability to exercise significant influence over PAA, but not control; and therefore, we account for the investment under the equity method (see Note 5). Changes in our ownership interest due to PAA's issuance of additional capital or other capital transactions which alter our ownership investment are recorded directly to partners' capital.
Stock-Based Compensation
The recipients of the options issued under the Performance Option Plan are employees of the General Partner. The options are for units of PAA. Thus, the accounting models prescribed by both Statement of Financial Accounting Standards ("SFAS") No. 123, "Accounting for Stock-Based Compensation," as amended by SFAS No. 148 "Accounting for Stock-Based Compensation—Transition and Disclosure" and Accounting Principles Board Opinion No. 25 "Accounting for Stock Issued to Employees" are not appropriate. We account for the options using a probability approach based on when the options will vest. Once the options vest, we adjust the accrual each period based on their fair market value as calculated using the "Black-Scholes Model" (see Note 6).
Income Taxes
No liability for U.S. Federal or Canadian income taxes related to our operations is included in the accompanying financial statement because, as a partnership, we are not subject to Federal, State or Provincial income tax; and the tax effect of our activities accrues to the Partners. The Partners may be required to file U.S. Federal and State, as well as Canadian Federal and Provincial, income tax returns.
Note 3—Investment in PAA
Our investment in PAA at December 31, 2003, is approximately $60.0 million. The summarized financial information of PAA at December 31, 2003, is presented below (in thousands):
| Current assets | $ | 732,974 | |
| Non-current assets | $ | 1,362,657 | |
| Current liabilities | $ | 801,919 | |
| Long-term debt and other long-term liabilities | $ | 546,985 | |
| Partners' capital | $ | 746,727 |
At the date of inception, our investment in PAA exceeded our share of the underlying equity in the net assets of PAA by approximately $44.5 million. This excess is related to the fair value of PAA's crude oil pipelines and other assets and is amortized on a straight-line basis over their estimated useful life of 30 years. At December 31, 2003, the unamortized portion of this excess was approximately $39.7 million.
Note 4—Contribution of Subordinated Units
On June 8, 2001, certain of our limited partners contributed to us an aggregate of 450,000 subordinated units of PAA. In November 2003, 25% of these subordinated units converted into common units, and the remaining 75% converted in February 2004. These 450,000 units (the "Option Units") are intended for use in connection with an option plan pursuant to which certain members of the management of our general partner will, subject to the satisfaction of vesting criteria, have a right to purchase a portion of such Option Units. During September 2003, options for 3,125 Option Units were exercised (see Note 6). Until the exercise of the remainder of such options, we will continue to own and receive any distributions paid by PAA with respect to the Option Units. Any distributions we make as a result of the receipt of distributions on the Option Units will be paid to our limited partners in proportion to the original contribution of the Option Units.
The conversion of 25% of the subordinated units resulted in an increase in our investment of approximately $0.7 million for the Partnership. This change of interest gain was non-cash and has been reflected in our partners' capital.
Note 5—Partners' Capital
We distribute all of our available cash, less reserves established by management, on a quarterly basis. Except as described in Note 4, distributions are paid to the partners in proportion to their percentage interest in the Partnership. Included in partners' capital is accumulated other comprehensive income of approximately $4.7 million related to our share of PAA's accumulated other comprehensive income (loss). Other comprehensive income (loss) is allocated based on each partner's ownership interest.
The General Partner manages the business and affairs of the Partnership. Except for situations in which the approval of the limited partners is expressly required by the Partnership agreement, or by nonwaivable provisions of applicable law, the General Partner has full and complete authority, power and discretion to manage and control the business, affairs and property of the Partnership, to make all decisions regarding those matters and to perform any and all other acts or activities customary or incident to the management of the Partnership's business, including the execution of contracts and management of litigation. The General Partner (or, in the case of PAA's Canadian operations, PMC (Nova Scotia) Company) employs all officers and personnel involved in the operation and management of PAA and its subsidiaries. PAA reimburses the General Partner for all expenses, including compensation expenses, related to such operation and management. The Partnership has no commitment or intent to fund cash flow deficits or furnish other financial assistance to PAA.
During December 2003, PAA completed the issuance and sale of 2,840,8004,968,000 Common Units at a public offering price of $31.94$33.25 per unit. In conjunction with that offering, we received additional investments from the Partners and made a contribution to PAA totaling approximately $1.8$3.4 million. The December 2003In addition, PAA offering wasissued common units under its Long-Term Incentive Plan ("LTIP") in the first offering completed following the conversionthird quarter of 25% of the subordinated units. Now that2004. Because we hold PAA common units, we recognize a change of interest gain or a loss at the time of each offering or issuance if the offeringoffering/issuance price is more or less than our average carrying amount per unit. Such gains or losses reflect the change in the book value of our equity in PAA compared to our proportionate share of the change in the underlying net assets of PAA due to the sale or issuance of the additional units. We recognized a gain of $0.1$0.5 million in our partners' capital atrelated to the timeoffering of the offering.
During September 2003, PAA completedcommon units and the issuance and sale of 3,250,000 Common Units at a public offering price of $30.91 per unit. In conjunction with that offering, we received additional investments from the Partners and made a contribution to PAA totaling approximately $2.1 million.
During March 2003, PAA completed the issuance and sale of 2,645,000 Common Units at a public offering price of $24.80 per unit. In conjunction with that offering, we received additional investments from the Partners and made a contribution to PAA totaling approximately $1.3 million.under PAA's LTIP.
Note 6—Performance Option Plan
In June 2001, the Performance Option Plan (the "Plan") was approved by the General Partner to grant options to purchase up to 450,000 Option Units of PAA to employees of the General Partner. SeePartner (see Note 4.4). Options to purchase 375,000391,000 units have been issued under the Plan.Plan (including 16,000 options issued during the third quarter of 2004). The options were granted with a per unit exercise price of $22, less 80% of any per unit distribution on an Option Unit from June 2001, until the date of exercise. As of February 13, 2004,14, 2005, the exercise price has been reduced to $17.30$15.42 for distributions made since June 2001.
The options have a ten-year term and vest in 25% increments upon PAA achieving quarterly distribution levels as follows:
| Vesting % | Quarterly Distribution Level | Annual Distribution Level | ||||
|---|---|---|---|---|---|---|
| 25% | $ | 0.525 | $ | 2.10 | ||
| 50% | $ | 0.575 | $ | 2.30 | ||
| 75% | $ | 0.625 | $ | 2.50 | ||
| 100% | $ | 0.675 | $ | 2.70 | ||
| Vesting % | Quarterly Distribution Level | Annual Distribution Level | ||||
|---|---|---|---|---|---|---|
| 25% | $ | 0.525 | $ | 2.10 | ||
| 25% | $ | 0.575 | $ | 2.30 | ||
| 25% | $ | 0.625 | $ | 2.50 | ||
| 25% | $ | 0.675 | $ | 2.70 | ||
In April 2002, upon declaration of the first quarter 2002 distribution, PAA attained the distribution level necessary for 25% or 93,750 of the options to vest. On September 30, 2003, 3,125 options were exercised at a weighted average exercise price of $18.19. No options expired or were forfeited during the year. Future grants may include different vesting criteria.
These options are considered performance awards and are accounted for at fair value whenupon vesting is probable and are revalued at each financial statement date based on the "Black-Scholes Model." As of the date of declaration of the second quarter 2004 distribution (July 21, 2004) PAA attained the distribution level necessary for 50% of the options to vest. At December 31, 2003,2004, an estimated fair value of $15.95$22.04 per unit resulted in a cumulative reduction of the Partners' capital accounts and corresponding increase in the Performance Options Obligation of approximately $1.4$4.1 million. No options expired or were forfeited or exercised during the period ended December 31, 2004. The options issued during the third quarter of 2004 will vest no earlier than the declaration date for the second quarter 2006 distribution. Thus, those options are not included in the obligation amounts. Future grants may include different vesting criteria.
The facts and assumptions used in the "Black-Scholes Model" at December 31, 2003,2004, were as follows:
| | Assumptions | | | | Assumptions | |||||||||||||||||||||
|---|---|---|---|---|---|---|---|---|---|---|---|---|---|---|---|---|---|---|---|---|---|---|---|---|---|---|
| Options Outstanding | Percent Vested | Options Vested | Weighted Average Interest Rate | Weighted Average Expected Life | Weighted Average Expected Volatility | Weighted Average Expected Dividend Yield(1) | Percent Vested | Options Vested | Weighted Average Interest Rate | Weighted Average Expected Life | Weighted Average Expected Volatility | Weighted Average Expected Dividend Yield(1) | ||||||||||||||
| 371,875 | 25 | % | 90,625 | 3.77 | % | 4.6 | 29.50 | % | 1.93 | % | ||||||||||||||||
| 387,875 | 50 | % | 184,375 | 3.59 | % | 4.0 | 30.00 | % | 1.81 | % | ||||||||||||||||
Note 7—Subsequent EventEvents
Distribution
PAA declared cash distributions to the Partnership of $2.3$3.8 million ($0.70.8 million for its general partner interest and $1.6$3.0 million for its incentive distribution interest) for the fourth quarter of 2003.2004. The distribution, which was declared on January 22, 2004,25, 2005, was received on February 13,14, 2005.
Private Placement of Common Units
On February 25, 2005, PAA issued 575,000 common units to a subsidiary of Vulcan Energy Corporation at a price of $38.13 per unit. In conjunction with that offering, we received additional investments from the Partners and made a contribution to PAA totaling approximately $0.4 million.
Performance Options/American Jobs Creation Act
On March 31, 2005, the Board of Directors of our general partner approved amendments to the Performance Option Plan and adjustments to the terms of outstanding unvested options. Such amendments and adjustments were designed to avoid or minimize any tax penalty that might otherwise be payable under the American Jobs Creation Act of 2004.
On March 31, 2005, grants for options to purchase 59,000 PAA common units were approved by the Board. Because the units underlying the Option Plan were contributed to us by certain of our owners, PAA will have no obligation to reimburse us for the cost of the units upon exercise of the options.
PLAINS ALL AMERICAN PIPELINE, L.P.
UNAUDITED PRO FORMA COMBINED FINANCIAL STATEMENT
Plains All American Pipeline, L.P. ("PAA") is a publicly traded Delaware limited partnership engaged in interstate and intrastate crude oil transportation, and crude oil gathering, marketing, terminalling and storage, as well as the marketing and storage of liquefied petroleum gas and other petroleum products. The following unaudited pro forma financial statements are presented to give effect to the transactions described below:
The acquisition of the North American crude oil and pipeline operations of Link Energy LLC, ("Link Energy" and the "Link acquisition"). The acquisition price of approximately $326 million includes the assumption of liabilities and net working capital items and transaction and other acquisition costs. The acquisition closed and was effective on April 1, 2004 and has been accounted for using the purchase method of accounting.
The acquisition of Shell Pipeline Company LP's ("SPLC") interest in certain entities. The principal assets of the entities include interests in the Capline Pipe Line System, the Capwood Pipe Line System and the Patoka Pipe Line System (referred to in this report as "the SPLC acquisition"). The purchase price, including transaction and closing costs, was approximately $158.5 million. The acquisition closed and was effective on March 1, 2004. The acquisition has been accounted for using the purchase method of accounting.
The transactions described above are included in PAA's historical audited consolidated balance sheet as of December 31, 2004. Accordingly, an unaudited pro forma combined balance sheet is not presented. The historical financial statements of Link Energy and of the businesses acquired in the SPLC acquisition are not presented since the results of the transactions are reflected in PAA's historical consolidated statement of operations for a period of nine months or more. The unaudited pro forma statement of operations for the year ended December 31, 2004 is based upon the following:
The unaudited pro forma combined statement of operations is not necessarily indicative of the results of the actual or future operations that would have been achieved had the transactions occurred at the date assumed (as noted below). The unaudited pro forma combined statement of operations should be read in conjunction with: i) the notes thereto; and ii) the historical audited financial statements of PAA for the year ended December 31, 2004.
The following unaudited pro forma combined statement of operations for the year ended December 31, 2004 has been prepared as if the transactions described above had taken place at the beginning of the period presented.
PLAINS ALL AMERICAN PIPELINE, L.P. AND SUBSIDIARIES
UNAUDITED PRO FORMA COMBINED STATEMENT OF OPERATIONS
For the Year Ended December 31, 2004
(in thousands, except per unit data)
| | Plains All American Historical | Link Energy Historical | SPLC Acquisition Historical | Pro Forma Acquisition Adjustments | Plains All American Pro Forma | ||||||||||||
|---|---|---|---|---|---|---|---|---|---|---|---|---|---|---|---|---|---|
| REVENUES | $ | 20,975,470 | $ | 40,682 | $ | 7,416 | $ | (465 | )(a) | $ | 21,023,103 | ||||||
COSTS AND EXPENSES | |||||||||||||||||
| Purchases and related costs | 20,424,572 | 8,081 | — | (465 | )(a) | 20,432,188 | |||||||||||
Field operating costs (excluding LTIP charge) | 218,548 | 20,725 | 2,023 | — | 241,296 | ||||||||||||
| LTIP charge—operations | 918 | — | — | — | 918 | ||||||||||||
| General and administrative expenses (excluding LTIP charge) | 75,735 | 18,514 | — | — | 94,249 | ||||||||||||
| LTIP charge—general and administrative | 7,013 | — | — | — | 7,013 | ||||||||||||
| Depreciation and amortization | 67,241 | 5,060 | 874 | (5,961 2,571 | )(b) (c) | 69,785 | |||||||||||
| Total costs and expenses | 20,794,027 | 52,380 | 2,897 | (3,855 | ) | 20,845,449 | |||||||||||
| Other, net | — | (20 | ) | — | — | (20 | ) | ||||||||||
| Gains on sales of assets | 580 | 730 | (e) | — | — | 1,310 | |||||||||||
| Asset impairment | (2,000 | ) | — | — | — | (2,000 | ) | ||||||||||
| OPERATING INCOME | 180,023 | (10,988 | ) | 4,519 | 3,390 | 176,944 | |||||||||||
OTHER INCOME/(EXPENSE) | |||||||||||||||||
| Interest expense | (46,676 | ) | (11,531 | ) | — | (2,936 | )(d) | (61,143 | ) | ||||||||
Interest and other income (expense), net | (211 | ) | (24 | ) | — | — | (235 | ) | |||||||||
| Income from continuing operations before cumulative effect of change in accounting principle | 133,136 | (22,543 | ) | 4,519 | 454 | 115,566 | |||||||||||
| Cumulative effect of change in accounting principle | (3,130 | ) | — | — | — | (3,130 | ) | ||||||||||
| NET INCOME (LOSS) FROM CONTINUING OPERATIONS | $ | 130,006 | $ | (22,543 | ) | $ | 4,519 | $ | 454 | $ | 112,436 | ||||||
| NET INCOME FROM CONTINUING OPERATIONS—LIMITED PARTNERS | $ | 119,286 | $ | 102,067 | |||||||||||||
| NET INCOME FROM CONTINUING OPERATIONS—GENERAL PARTNER | $ | 10,720 | $ | 10,369 | |||||||||||||
| BASIC AND DILUTED NET INCOME FROM CONTINUING OPERATIONS PER LIMITED PARTNER UNIT | |||||||||||||||||
| Income from continuing operations before cumulative effect of change in accounting principle | $ | 1.94 | $ | 1.66 | |||||||||||||
| Cumulative effect of change in accounting principle | (0.05 | ) | (0.05 | ) | |||||||||||||
| Net income from continuing operations | $ | 1.89 | $ | 1.61 | |||||||||||||
| BASIC AND DILUTED WEIGHTED AVERAGE UNITS OUTSTANDING | 63,277 | 63,277 | |||||||||||||||
See notes to unaudited pro forma combined financial statements
PLAINS ALL AMERICAN PIPELINE, L.P. AND SUBSIDIARIES
NOTES TO UNAUDITED PRO FORMA COMBINED FINANCIAL STATEMENT
Note 1—Acquisitions
Link Acquisition
The Link acquisition presented in this pro forma statement has been accounted for using the purchase method of accounting and the purchase price has been allocated in accordance with Statement of Financial Accounting Standards No. 141, "Business Combinations". The acquisition consists of the North American crude oil and pipeline operations of Link Energy. The purchase price of approximately $332 million includes cash paid of approximately $268 million (net of approximately $5.5 million subsequently returned to us from an indemnity escrow account) and approximately $64 million of net liabilities assumed and acquisition related costs. The acquisition closed and was effective on April 1, 2004. The purchase price allocation is set forth in the table below (in millions):
| Cash paid for acquisition(1) | $ | 268.0 | |||
Fair value of net liabilities assumed: | |||||
| Accounts receivable(2) | 409.4 | ||||
| Other current assets | 1.8 | ||||
| Accounts payable and accrued liabilities(2) | (459.6 | ) | |||
| Other current liabilities | (8.5 | ) | |||
| Other long-term liabilities | (7.4 | ) | |||
| Total net liabilities assumed | (64.3 | ) | |||
| Total purchase price | $ | 332.3 | |||
Purchase price allocation | |||||
| Property and equipment | $ | 260.2 | |||
| Inventory | 3.4 | ||||
| Linefill | 55.4 | ||||
| Inventory in third party assets | 8.1 | ||||
| Goodwill | 5.0 | ||||
| Other long term assets | 0.2 | ||||
| Total | $ | 332.3 | |||
SPLC Acquisition
The SPLC acquisition presented in this pro forma statement has been accounted for using the purchase method of accounting and the purchase price has been allocated in accordance with Statement of Financial Accounting Standards No. 141, "Business Combinations." The purchase consists of the acquisition of Shell Pipeline Company LP's ("SPLC") interest in certain entities. The principal assets of the entities include interests in certain businesses from Shell Pipeline Company, including its interests in the Capline Pipe Line System, the Capwood Pipe Line System and the Patoka Pipe Line System. The purchase price of approximately $158.5 million includes transaction and closing costs. The
acquisition closed and was effective on March 1, 2004. The purchase price allocation is as follows (in millions):
| Crude oil pipelines and facilities | $ | 151.4 | |
| Crude oil storage and terminal facilities | 5.7 | ||
| Land | 1.3 | ||
| Office equipment and other | 0.1 | ||
| Total | $ | 158.5 | |
Note 2—Pro Forma Adjustments
The pro forma adjustments are as follows:
PART II
INFORMATION REQUIRED IN THE REGISTRATION STATEMENT
Item 13. Other Expenses of Issuance and Distribution
We will incur the following expenses in connection with the issuance and distribution of the securities registered hereby. With the exception of the SEC registration fee, the amounts set forth below are estimates.
| SEC registration fee | SEC registration fee | $ | 14,969 | SEC registration fee | $ | — | ||
| Legal fees and expenses | Legal fees and expenses | 85,000 | Legal fees and expenses | 85,000 | ||||
| Accounting fees and expenses | Accounting fees and expenses | 30,000 | Accounting fees and expenses | 40,000 | ||||
| Printing and engraving expenses | Printing and engraving expenses | 30,000 | Printing and engraving expenses | 30,000 | ||||
| Miscellaneous | Miscellaneous | 20,000 | Miscellaneous | 20,000 | ||||
| Total | $ | 179,969.00 | Total | $ | 175,000 | |||
Item 14. Indemnification of Officers and Members of Our Board of Directors
Section 17-108 of the Delaware Revised Limited Partnership Act empowers a Delaware limited partnership to indemnify and hold harmless any partner or other person from and against all claims and demands whatsoever. The partnership agreement of Plains All American Pipeline provides that Plains All American Pipeline will indemnify the general partner, any departing partner, any person who is or was an affiliate of the general partner or any departing partner, and any person who is or was a member, partner, officer, director, employee, agent or trustee of the general partner or any departing partner or any affiliate of the general partner or any departing partner, or any person who is or was serving at the request of the general partner or any departing partner or any affiliate of the general partner or any departing partner as an officer, director, employee, member, partner, agent, fiduciary or trustee of another person (each, an "Indemnitee"), to the fullest extent permitted by law, from and against any and all losses, claims, damages, liabilities (joint and several), expenses (including, without limitation, legal fees and expenses), judgments, fines, penalties, interest, settlements and other amounts arising from any and all claims, demands, actions, suits or proceedings, whether civil, criminal, administrative or investigative, in which any Indemnitee may be involved, or is threatened to be involved, as a party or otherwise, by reason of its status as any of the foregoing; provided that in each case the Indemnitee acted in good faith and in a manner that such Indemnitee reasonably believed to be in or not opposed to the best interests of Plains All American Pipeline and, with respect to any criminal proceeding, had no reasonable cause to believe its conduct was unlawful. Any indemnification under these provisions will be only out of the assets of Plains All American Pipeline, and the general partner shall not be personally liable for, or have any obligation to contribute or loan funds or assets to Plains All American Pipeline to enable it to effectuate, such indemnification. Plains All American Pipeline is authorized to purchase (or to reimburse the general partner or its affiliates for the cost of) insurance against liabilities asserted against and expenses incurred by such persons in connection with Plains All American Pipeline's activities, regardless of whether Plains All American Pipeline would have the power to indemnify such person against such liabilities under the provisions described above.
The underwriting agreements that we may enter into with respect to the offer and sale of securities covered by this registration statement will contain certain provisions for the indemnification of directors and officers and the underwriters or sales agent, as applicable, against civil liabilities under the Securities Act.
II-1
Item 15. Recent Sales of Unregistered Securities
September 2002 Private Placement of Debt Securities
In September 2002, we sold unregistered debt securities to UBS Warburg LLC, acting as sole initial purchaser, pursuant to Rule 144A under the Securities Act and to non-U.S. persons outside the United States in reliance on Regulation S under the Securities Act. The sale consisted of $200,000,000 aggregate principal amount of 7.750% Notes due 2012 (the "2012 Notes"). The 2012 Notes were sold to investors at a price of 99.800% per note with an initial purchaser's discount of 1.513% per note. We used the net proceeds of approximately $196.3 million to repay indebtedness outstanding under our revolving credit facility.
Class B Common Units
In May 1999, we sold 1,307,190 unregistered Class B common units (the "Class B common units") to our general partner at the time, Plains All American Inc., pursuant to Rule 4(2) of the Securities Act. We received $19.125 per Class B common unit, a price equal to the then-market value of our common units for total proceeds of approximately $25 million. We used the net proceeds from this offering to defray costs associated with our acquisition of Scurlock Permian.
December 2003 Private Placement of Debt Securities
In December 2003, we sold unregistered debt securities to UBS Securities LLC, Fleet Securities, Inc., Banc of America Securities LLC, Bank One Capital Markets, Inc., Citigroup Global Markets Inc., Fortis Investment Services LLC, Wachovia Capital Markets, LLC, BNP Paribas Bancorp, Piper Jaffray Inc. and Wells Fargo Brokerage Services, LLC, as initial purchasers, pursuant to Rule 144A under the Securities Act and to non-U.S. persons outside the United States in reliance on Regulation S under the Securities Act. The sale consisted of $250,00,000 aggregate principal amount of 5.625% Notes due 2013 (the "2013 Notes"). The 2013 Notes were sold to investors at a price of 99.734% per note with an initial purchasers' discount of 0.65% per note. We used the net proceeds of approximately $247.3 million to repay indebtedness outstanding under our revolving credit facility.
Class C Common Units
In April 2004, we sold 3,245,700 unregistered Class C common units (the "Class C common units") to a group of investors comprised of affiliates of Kayne Anderson Capital Advisors, Vulcan Capital and Tortoise Capital pursuant to Rule 4(2) under the Securities Act. We received $30.81 per Class C common unit, an amount which represented 94% of the average price of our common units for the twenty days immediately ending and including March 26, 2004. Net proceeds from the private placement, including the general partner's proportionate capital contribution and expenses associated with the sale, were approximately $101.0 million. We used the net proceeds from this offering to repay indebtedness under our revolving credit facility incurred in connection with the Link acquisition.
August 2004 Private Placement of Debt Securities
In August 2004, we sold unregistered debt securities to Banc of America Securities LLC, J.P. Morgan Securities Inc., Wachovia Capital Markets, LLC, Citigroup Global Markets Inc, UBS Securities LLC, BNP Paribas Securities Corp, Comerica Securities, Inc., Fortis Securities LLC, SunTrust Capital Markets, Inc., Wedbush Morgan Securities Inc., and Wells Fargo Securities, LLC, as initial purchasers, pursuant to Rule 144A under the Securities Act and to non-U.S. persons outside the United States in reliance on Regulation S under the Securities Act. The sale consisted of $175,000,000 aggregate principal amount of 4.750% Notes due 2009 (the "2009 Notes") and $175,000,000 aggregate principal amount of 5.875% Notes due 2016 (the "2016 Notes"). The 2009 Notes were sold to investors at a price of 99.551% per note with an initial purchaser's discount of 0.600% per note. The 2016 Notes
II-2
were sold to investors at a price of 99.345% per note with an initial purchaser's discount of 0.675% per note. We used the net proceeds of approximately $345.3 million to repay approximately $40.8 million outstanding under our $200 million, 364-day credit facility, and we used the remaining net proceeds to repay amounts outstanding under our revolving credit facilities and the remaining balance of the net proceeds was reserved for general partnership purposes.
II-2
February 2005 Private Placement of Common Units
In February 2005, we issued 575,000 common units to a subsidiary of Vulcan Energy Corporation. The sale price for the common units was $38.13 per unit resulting in net proceeds, including the general partner's proportionate capital contribution and expenses associated with the sale, of approximately $22.3 million. We intend to use the net proceeds from the private placement to fund a portion of our 2005 expansion capital program. Pending the incurrence of such expenditures, the net proceeds will be used to repay indebtedness under our revolving credit facilities.
Item 16. Exhibits and Financial Statement Schedules
| — | Form of Underwriting Agreement | |||
3.1 | — | Third Amended and Restated Agreement of Limited Partnership of Plains All American Pipeline, L.P., dated as of June 27, 2001 (incorporated by reference to Exhibit 3.1 to Form 8-K filed August 27, 2001) as amended by Amendment No. 1 to the Third Amended and Restated Agreement of Limited Partnership of Plains All American Pipeline, L.P., dated as of April 15, 2004 (incorporated by reference to Exhibit 3.1 to the Quarterly Report on Form 10-Q for the period ended March 31, 2004) | ||
3.2 | — | Third Amended and Restated Agreement of Limited Partnership of Plains Marketing, L.P. dated as of April 1, 2004 (incorporated by reference to Exhibit 3.2 to the Quarterly Report on Form 10-Q for the period ended March 31, 2004) | ||
3.3 | — | Third Amended and Restated Agreement of Limited Partnership of Plains Pipeline, L.P. dated as of April 1, 2004 (incorporated by reference to Exhibit 3.3 to the Quarterly Report on Form 10-Q for the period ended March 31, 2004) | ||
3.4 | — | Second Amendment dated as of July 23, 2004 to Amended and Restated Limited Liability Company Agreement of Plains All American GP LLC (incorporated by reference to Exhibit 3.1 to the Partnership's Current Report on Form 8-K filed July 27, 2004) | ||
3.5 | — | Amended and Restated Limited Partnership Agreement of Plains AAP, L.P. (incorporated by reference to Exhibit 3.1 to Plains All American Pipeline, L.P.'s Current Report on Form 8-K filed on June 11, 2001) | ||
3.6 | — | Certificate of Incorporation of PAA Finance Corp. (incorporated by reference to Exhibit 3.6 to Plains All American Pipeline, L.P.'s Registration Statement on Form S-3 filed on August 27, 2001) | ||
3.7 | — | Bylaws of PAA Finance Corp. (incorporated by reference to Exhibit 3.7 to the Plains All American Pipeline, L.P.'s Registration Statement on Form S-3 filed on August 27, 2001) | ||
4.1 | — | Indenture dated September 25, 2002 among Plains All American Pipeline, L.P., PAA Finance Corp. and Wachovia Bank, National Association (incorporated by reference to Exhibit 4.1 to Quarterly Report on Form 10-Q for the Quarter ended September 30, 2002) | ||
4.2 | — | First Supplemental Indenture dated as of September 25, 2002 (incorporated by reference to Exhibit 4.2 to Quarterly Report on Form 10-Q for the Quarter ended September 30, 2002) | ||
4.3 | — | Second Supplemental Indenture dated as of December 10, 2003. (incorporated by reference to Exhibit 4.4 to Annual Report on Form 10-K for the Year Ended December 31, 2003) | ||
4.4 | — | Third Supplemental Indenture (Series A and Series B 4.750% Senior Notes due 2009) dated August 12, 2004 among Plains All American Pipeline, L.P., PAA Finance Corp., the Subsidiary Guarantors named therein and Wachovia, National Association (incorporated by reference to Exhibit 4.4 to the Registration Statement on Form S-4, File No. 333-121168) | ||
II-3
4.5 | — | Fourth Supplemental Indenture (Series A and Series B 5.875% Senior Notes due 2009) dated August 12, 2004 among Plains All American Pipeline, L.P., PAA Finance Corp., the Subsidiary Guarantors named therein and Wachovia, National Association (incorporated by reference to Exhibit 4.5 to the Registration Statement on Form S-4, File No. 333-121168) | ||
4.6 | — | Exchange and Registration Rights Agreement (4.750% Senior Notes due 2009) dated August 12, 2004 among Plains All American Pipeline, L.P., PAA Finance Corp., the Guarantors named therein and the Initial Purchasers named therein (incorporated by reference to Exhibit 4.6 to the Registration Statement on Form S-4, File No. 333-121168) | ||
4.7 | — | Exchange and Registration Rights Agreement (5.875% Senior Notes due 20016) dated August 12, 2004 among Plains All American Pipeline, L.P., PAA Finance Corp., the Guarantors named therein and the Initial Purchasers named therein (incorporated by reference to Exhibit 4.7 to the Registration Statement on Form S-4, File No. 333-121168) | ||
4.8 | — | Class C Common Unit Purchase Agreement by and among Plains All American Pipeline, L.P., Kayne Anderson Energy Fund II, L.P., KAFU Holdings, L.P., Kayne Anderson Capital Income Partners, L.P., Kayne Anderson MLP Fund, L.L.P., Tortoise Energy Infrastructure Corporation and Vulcan Energy II Inc. dated March 31, 2004 (incorporated by reference to Exhibit 4.1 to the quarterly report on Form | ||
— | Registration Rights Agreement by and among Plains All American Pipeline, L.P., Kayne Anderson Energy Fund II, L.P., KAFU Holdings, L.P., Kayne Anderson Capital Income Partners (QP), L.P., Kayne Anderson MLP Fund, L.P., Tortoise Energy Infrastructure Corporation and Vulcan Energy II Inc. dated April 15, 2004 (incorporated by reference to Exhibit 4.2 to the Quarterly Report on Form | |||
5.1* | — | Opinion of Vinson & Elkins L.L.P. as to the legality of the securities being registered | ||
8.1* | — | Opinion of Vinson & Elkins L.L.P. relating to tax matters | ||
II-3
10.1 | — | |||
10.2 | — | First Amendment to Credit Agreement dated as of March 4, 2005 (incorporated by reference to Exhibit 10.1 to Form 8-K filed March 7, 2005) | ||
10.3 | — | Restated Credit Facility (Uncommitted Senior Secured Discretionary Contango Facility) dated November 19, 2004 among Plains Marketing, L.P. and the lenders named therein (incorporated by reference to Exhibit 10.1 to Form 8-K filed November 24, 2004) | ||
10.4 | — | First Amendment to Restated Credit Facility dated as of April 20, 2005 (incorporated by reference to Exhibit 10.1 to Form 8-K filed April 20, 2005) | ||
10.5 | — | Amended and Restated Marketing Agreement, dated as of July 23, 2004, among Plains Resources Inc., Calumet Florida Inc. and Plains Marketing, L.P. (incorporated by reference to Exhibit 10.2 to the Quarterly Report on Form 10-Q for the period ended June 30, 2004) | ||
— | Amended and Restated Omnibus Agreement, dated as of July 23, 2004, among Plains Resources Inc., Plains All American Pipeline, L.P., Plains Marketing, L.P., Plains Pipeline, L.P. and Plains All American GP LLC. (incorporated by reference to Exhibit 10.3 to the Quarterly Report on Form 10-Q for the period ended June 30, 2004) | |||
— | Contribution, Assignment and Amendment Agreement, dated as of June 27, 2001, among Plains All American Pipeline, L.P., Plains Marketing, L.P., All American Pipeline, L.P., Plains AAP, L.P., Plains All American GP LLC and Plains Marketing GP Inc. (incorporated by reference to Exhibit 10.1 to Form 8-K filed June 27, 2001) | |||
II-4
— | Contribution, Assignment and Amendment Agreement, dated as of June 8, 2001, among Plains All American Inc., Plains AAP, L.P. and Plains All American GP LLC (incorporated by reference to Exhibit 10.1 to Form 8-K filed June 11, 2001) | |||
— | Separation Agreement, dated as of June 8, 2001 among Plains Resources Inc., Plains All American Inc., Plains All American GP LLC, Plains AAP, L.P. and Plains All American Pipeline, L.P. (incorporated by reference to Exhibit 10.2 to Form 8-K filed June 11, 2001) | |||
— | Pension and Employee Benefits Assumption and Transition Agreement, dated as of June 8, 2001 among Plains Resources Inc., Plains All American Inc. and Plains All American GP LLC (incorporated by reference to Exhibit 10.3 to Form 8-K filed June 11, 2001) | |||
— | Plains All American GP LLC 2005 Long-Term Incentive Plan (incorporated by reference to Annex A to Proxy Statement filed December 7, 2004.) | |||
10.12** | — | Plains All American GP LLC 1998 Long-Term Incentive Plan (incorporated by reference to Exhibit 99.1 to Registration Statement on Form S-8, File No. 333-74920) as amended June 27, 2003 (incorporated by reference to Exhibit 10.1 to Form 10-Q filed June 30, 2003) | ||
— | Plains All American 2001 Performance Option Plan (incorporated by reference to Exhibit 99.2 to Registration Statement on Form S-8, File No. 333-74920) | |||
— | Amended and Restated Employment Agreement between Plains All American GP LLC and Greg L. Armstrong dated as of June 30, 2001 (incorporated by reference to Exhibit 10.3 to Quarterly Report on Form 10-Q for the Quarter Ended September 30, 2001) | |||
— | Amended and Restated Employment Agreement between Plains All American GP LLC and Harry N. Pefanis dated as of June 30, 2001 (incorporated by reference to Exhibit 10.4 to Quarterly Report on Form 10-Q for the Quarter Ended September 30, 2001) | |||
II-4
— | Asset Purchase and Sale Agreement between Murphy Oil Company Ltd. And Plains Marketing Canada, L.P. (incorporated by reference to Form 8-K filed May 10, 2001) | |||
— | Transportation Agreement dated July 30, 1993, between All American Pipeline Company and Exxon Company, U.S.A. (incorporated by reference to Exhibit 10.9 to Registration Statement, File No. 333-64107) | |||
— | Transportation Agreement dated August 2, 1993, between All American Pipeline Company and Texaco Trading and Transportation Inc., Chevron U.S.A. and Sun Operating Limited Partnership (incorporated by reference to Exhibit 10.10 to Registration Statement, File No. 333-64107) | |||
— | First Amendment to Contribution, Conveyance and Assumption Agreement dated as of December 15, 1998 (incorporated by reference to Exhibit 10.13 to Annual Report on Form 10-K for the Year Ended December 31, 1998) | |||
— | Agreement for Purchase and Sale of Membership Interest in Scurlock Permian LLC between Marathon Ashland LLC and Plains Marketing, L.P. dated as of March 17, 1999 (incorporated by reference to Exhibit 10.16 to Annual Report on Form 10-K for the Year Ended December 31, 1998) | |||
— | ||||
10.22** | — | PMC (Nova Scotia) Company bonus program (incorporated by reference to Exhibit 10.20 to Annual Report on Form 10-K for the Year Ended December 31, | ||
— | ||||
II-5
— | ||||
— | Master Railcar Leasing Agreement dated as of May 25, 1998 (effective June 1, 1998), between Pivotal Enterprises Corporation and CANPET Energy Group, Inc., (incorporated by reference to Exhibit 10.16 to Annual Report on Form 10-K for the Year Ended December 31, 2001) | |||
10.26** | — | Form of LTIP Grant Letter (Armstrong/Pefanis) (incorporated by reference to Exhibit 10.1 to Current Report on Form 8-K filed February 23, 2005) | ||
10.27** | — | Form of LTIP Grant Letter—executive officers (incorporated by reference to Exhibit 10.2 to Current Report on Form 8-K filed February 23, 2005) | ||
10.28** | — | Form of LTIP Grant Letter—independent directors (incorporated by reference to Exhibit 10.3 to Current Report on Form 8-K filed February 23, 2005) | ||
10.29** | — | Form of LTIP Grant Letter—designated directors (incorporated by reference to Exhibit 10.4 to Current Report on Form 8-K filed February 23, 2005) | ||
10.30** | — | Form of LTIP Grant Letter—payment to entity (incorporated by reference to Exhibit 10.5 to Current Report on Form 8-K filed February 23, 2005) | ||
21.1 | — | List of Subsidiaries of Plains All American Pipeline, L.P. (incorporated by reference to Exhibit 21.1 to Registration Statement, File No. 333-119738) | ||
23.1* | — | Consent of PricewaterhouseCoopers LLP | ||
23.2* | ||||
— | Consent of Vinson & Elkins L.L.P. (contained in Exhibits 5.1 and 8.1) | |||
24.1* | — | Powers of Attorney (included on the signature page) |
II-5
See index of financial statements beginning on page F-1 of this prospectus.
The undersigned registrant hereby undertakes:
(1) to file, during any period in which offers or sales are being made, a post-effective amendment to this registration statement:
(i) to include any prospectus required by Section 10(a)(3) of the Securities Act of 1933;
(ii) to reflect in the prospectus any facts or events arising after the effective date of the registration statement (or the most recent post-effective amendment thereof) which, individually or in the aggregate, represents a fundamental change in the information set forth in the registration statement. Notwithstanding the foregoing, any increase or decrease in volume of securities offered (if the total dollar value of securities offered would not exceed that which was registered) and any deviation from the low or high end of the estimated maximum offering range may be reflected in the form of prospectus filed with the Securities and Exchange Commission pursuant to Rule 424(b) if, in the aggregate, the changes in volume and price represent no more than a 20 percent change in the maximum aggregate offering price set forth in the "Calculation of Registration Fee" table in the effective registration statement; and
II-6
(iii) to include any material information with respect to the plan of distribution not previously disclosed in the registration statement or any material change to such information in the registration statement.
(2) That, for the purpose of determining any liability under the Securities Act of 1933, each such post-effective amendment shall be deemed to be a new registration statement relating to the securities offered therein, and the offering of such securities at that time shall be deemed to be the initial bona fide offering thereof.
(3) To remove from registration by means of a post-effective amendment any of the securities being registered which remain unsold at the termination of the offering.
Insofar as indemnification for liabilities arising under the Securities Act may be permitted to directors, officers and controlling persons of the registrant pursuant to the foregoing provisions, or otherwise, the registrant has been advised that in the opinion of the Securities and Exchange Commission such indemnification is against public policy as expressed in the Securities Act and is, therefore, unenforceable. In the event that a claim for indemnification against such liabilities (other than the payment by the registrant of expenses incurred or paid by a director, officer or controlling person of the registrant in the successful defense of any action, suit or proceeding) is asserted by such director, officer or controlling person in connection with the securities being registered, the registrant will, unless in the opinion of its counsel the matter has been settled by controlling precedent, submit to a court of appropriate jurisdiction of the question whether such indemnification by it is against public policy as expressed in the Securities Act and will be governed by the final adjudication of such issue.
II-6II-7
Pursuant to the requirements of the Securities Act of 1933, the Registrant has duly caused this Registration Statement to be signed on its behalf by the undersigned, thereunto duly authorized, in the City of Houston, State of Texas on October 13, 2004.April 29, 2005.
| PLAINS ALL AMERICAN PIPELINE, L.P. | ||||
By: | Plains AAP, L.P., its general partner | |||
By: | Plains All American GP LLC, its general partner | |||
By: | /s/ GREG L. ARMSTRONG Name: Greg L. Armstrong Title:Chairman of the Board and Chief Executive Officer | |||
Pursuant to the requirements of the Securities Act of 1933, as amended, this registration statement has been signed below by the following persons in the capacities and on the dates indicated below.
We, the undersigned directors and officers, do hereby constitute and appoint Phillip D. Kramer and Tim Moore and each of them our true and lawful attorneys-in-fact and agents, to do any and all acts and things in our names and on our behalf in our capacities as directors and officers and to execute any and all instruments for us and in our name in the capacities indicated below, which said attorneys and agents may deem necessary or advisable to enable said corporation to comply with the Securities Act of 1933 and any rules, regulations and requirements of the Securities and Exchange Commission, in connection with this Registration Statement, or any registration statement for this offering that is to be effective upon filing pursuant to Rule 462(b) under the Securities Act of 1933, including specifically, but without limitation, power and authority to sign for us or any of us in names in the capacities indicated below, any and all amendments (including post-effective amendments) hereto; and we do hereby ratify and confirm all that said attorneys and agents shall do or cause to be done by virtue thereof.
PLAINS ALL AMERICAN GP LLC, for itself and as the general partner of PLAINS AAP, L.P., as the general partner of PLAINS ALL AMERICAN PIPELINE, L.P.
| /s/ GREG L. ARMSTRONG Greg L. Armstrong | Chairman of the Board, Chief Executive Officer and Director (Principal Executive Officer) | |||
/s/ PHILLIP D. KRAMER | Executive Vice President, Chief Financial Officer (Principal Financial Officer) | |||
II-7II-8
/s/ TINA L. VAL Tina L. Val | Vice President—Accounting (Principal Accounting Officer) | |||
/s/ EVERARDO GOYANES Everardo Goyanes | Director | |||
/s/ ARTHUR L. SMITH Arthur L. Smith | Director | |||
/s/ ROBERT V. SINNOTT Robert V. Sinnott | Director | |||
/s/ GARY R. PETERSEN Gary R. Petersen | Director | |||
/s/ DAVID N. CAPOBIANCO David N. Capobianco | Director | |||
/s/ J. TAFT SYMONDS J. Taft Symonds | Director |
II-8II-9
1.1+ | |||||
| — | Form of Underwriting Agreement | ||||
3.1 | — | Third Amended and Restated Agreement of Limited Partnership of Plains All American Pipeline, L.P., dated as of June 27, 2001 (incorporated by reference to Exhibit 3.1 to Form 8-K filed August 27, 2001) as amended by Amendment No. 1 to the Third Amended and Restated Agreement of Limited Partnership of Plains All American Pipeline, L.P., dated as of April 15, 2004 (incorporated by reference to Exhibit 3.1 to the Quarterly Report on Form 10-Q for the period ended March 31, 2004) | |||
3.2 | — | Third Amended and Restated Agreement of Limited Partnership of Plains Marketing, L.P. dated as of April 1, 2004 (incorporated by reference to Exhibit 3.2 to the Quarterly Report on Form 10-Q for the period ended March 31, 2004) | |||
3.3 | — | Third Amended and Restated Agreement of Limited Partnership of Plains Pipeline, L.P. dated as of April 1, 2004 (incorporated by reference to Exhibit 3.3 to the Quarterly Report on Form 10-Q for the period ended March 31, 2004) | |||
3.4 | — | Second Amendment dated as of July 23, 2004 to Amended and Restated Limited Liability Company Agreement of Plains All American GP LLC (incorporated by reference to Exhibit 3.1 to the Partnership's Current Report on Form 8-K filed July 27, 2004) | |||
3.5 | — | Amended and Restated Limited Partnership Agreement of Plains AAP, L.P. (incorporated by reference to Exhibit 3.1 to Plains All American Pipeline, L.P.'s Current Report on Form 8-K filed on June 11, 2001) | |||
3.6 | — | Certificate of Incorporation of PAA Finance Corp. (incorporated by reference to Exhibit 3.6 to Plains All American Pipeline, L.P.'s Registration Statement on Form S-3 filed on August 27, 2001) | |||
3.7 | — | Bylaws of PAA Finance Corp. (incorporated by reference to Exhibit 3.7 to the Plains All American Pipeline, L.P.'s Registration Statement on Form S-3 filed on August 27, 2001) | |||
4.1 | — | Indenture dated September 25, 2002 among Plains All American Pipeline, L.P., PAA Finance Corp. and Wachovia Bank, National Association (incorporated by reference to Exhibit 4.1 to Quarterly Report on Form 10-Q for the Quarter ended September 30, 2002) | |||
4.2 | — | First Supplemental Indenture dated as of September 25, 2002 (incorporated by reference to Exhibit 4.2 to Quarterly Report on Form 10-Q for the Quarter ended September 30, 2002) | |||
4.3 | — | Second Supplemental Indenture dated as of December 10, 2003. (incorporated by reference to Exhibit 4.4 to Annual Report on Form 10-K for the Year Ended December 31, 2003) | |||
4.4 | — | Third Supplemental Indenture (Series A and Series B 4.750% Senior Notes due 2009) dated August 12, 2004 among Plains All American Pipeline, L.P., PAA Finance Corp., the Subsidiary Guarantors named therein and Wachovia, National Association (incorporated by reference to Exhibit 4.4 to the Registration Statement on Form S-4, File No. 333-121168) | |||
4.5 | — | Fourth Supplemental Indenture (Series A and Series B 5.875% Senior Notes due 2009) dated August 12, 2004 among Plains All American Pipeline, L.P., PAA Finance Corp., the Subsidiary Guarantors named therein and Wachovia, National Association (incorporated by reference to Exhibit 4.5 to the Registration Statement on Form S-4, File No. 333-121168) | |||
4.6 | — | Exchange and Registration Rights Agreement (4.750% Senior Notes due 2009) dated August 12, 2004 among Plains All American Pipeline, L.P., PAA Finance Corp., the Guarantors named therein and the Initial Purchasers named therein (incorporated by reference to Exhibit 4.6 to the Registration Statement on Form S-4, File No. 333-121168) | |||
4.7 | — | Exchange and Registration Rights Agreement (5.875% Senior Notes due 20016) dated August 12, 2004 among Plains All American Pipeline, L.P., PAA Finance Corp., the Guarantors named therein and the Initial Purchasers named therein (incorporated by reference to Exhibit 4.7 to the Registration Statement on Form S-4, File No. 333-121168) | |||
4.8 | — | Class C Common Unit Purchase Agreement by and among Plains All American Pipeline, L.P., Kayne Anderson Energy Fund II, L.P., KAFU Holdings, L.P., Kayne Anderson Capital Income Partners, L.P., Kayne Anderson MLP Fund, L.L.P., Tortoise Energy Infrastructure Corporation and Vulcan Energy II Inc. dated March 31, 2004 (incorporated by reference to Exhibit 4.1 to the quarterly report on Form | ||
— | Registration Rights Agreement by and among Plains All American Pipeline, L.P., Kayne Anderson Energy Fund II, L.P., KAFU Holdings, L.P., Kayne Anderson Capital Income Partners (QP), L.P., Kayne Anderson MLP Fund, L.P., Tortoise Energy Infrastructure Corporation and Vulcan Energy II Inc. dated April 15, 2004 (incorporated by reference to Exhibit 4.2 to the Quarterly Report on Form | |||
5.1* | — | Opinion of Vinson & Elkins L.L.P. as to the legality of the securities being registered | ||
8.1* | — | Opinion of Vinson & Elkins L.L.P. relating to tax matters | ||
10.1 | — | |||
10.2 | — | First Amendment to Credit Agreement dated as of March 4, 2005 (incorporated by reference to Exhibit 10.1 to Form 8-K filed March 7, 2005) |
II-9
— | Restated Credit Facility (Uncommitted Senior Secured Discretionary Contango Facility) dated November 19, 2004 among Plains Marketing, L.P. and the lenders named therein (incorporated by reference to Exhibit 10.1 to Form 8-K filed November 24, 2004) | |||
10.4 | — | First Amendment to Restated Credit Facility dated as of April 20, 2005 (incorporated by reference to Exhibit 10.1 to Form 8-K filed April 20, 2005) | ||
10.5 | — | Amended and Restated Marketing Agreement, dated as of July 23, 2004, among Plains Resources Inc., Calumet Florida Inc. and Plains Marketing, L.P. (incorporated by reference to Exhibit 10.2 to the Quarterly Report on Form 10-Q for the period ended June 30, 2004) | ||
— | Amended and Restated Omnibus Agreement, dated as of July 23, 2004, among Plains Resources Inc., Plains All American Pipeline, L.P., Plains Marketing, L.P., Plains Pipeline, L.P. and Plains All American GP LLC. (incorporated by reference to Exhibit 10.3 to the Quarterly Report on Form 10-Q for the period ended June 30, 2004) | |||
— | Contribution, Assignment and Amendment Agreement, dated as of June 27, 2001, among Plains All American Pipeline, L.P., Plains Marketing, L.P., All American Pipeline, L.P., Plains AAP, L.P., Plains All American GP LLC and Plains Marketing GP Inc. (incorporated by reference to Exhibit 10.1 to Form 8-K filed June 27, 2001) | |||
— | Contribution, Assignment and Amendment Agreement, dated as of June 8, 2001, among Plains All American Inc., Plains AAP, L.P. and Plains All American GP LLC (incorporated by reference to Exhibit 10.1 to Form 8-K filed June 11, 2001) | |||
— | Separation Agreement, dated as of June 8, 2001 among Plains Resources Inc., Plains All American Inc., Plains All American GP LLC, Plains AAP, L.P. and Plains All American Pipeline, L.P. (incorporated by reference to Exhibit 10.2 to Form 8-K filed June 11, 2001) | |||
— | Pension and Employee Benefits Assumption and Transition Agreement, dated as of June 8, 2001 among Plains Resources Inc., Plains All American Inc. and Plains All American GP LLC (incorporated by reference to Exhibit 10.3 to Form 8-K filed June 11, 2001) | |||
— | Plains All American GP LLC 2005 Long-Term Incentive Plan (incorporated by reference to Annex A to Proxy Statement filed December 7, 2004.) | |||
10.12** | — | Plains All American GP LLC 1998 Long-Term Incentive Plan (incorporated by reference to Exhibit 99.1 to Registration Statement on Form S-8, File No. 333-74920) as amended June 27, 2003 (incorporated by reference to Exhibit 10.1 to Form 10-Q filed June 30, 2003) | ||
— | Plains All American 2001 Performance Option Plan (incorporated by reference to Exhibit 99.2 to Registration Statement on Form S-8, File No. 333-74920) | |||
— | Amended and Restated Employment Agreement between Plains All American GP LLC and Greg L. Armstrong dated as of June 30, 2001 (incorporated by reference to Exhibit 10.3 to Quarterly Report on Form 10-Q for the Quarter Ended September 30, 2001) | |||
II-10
— | Amended and Restated Employment Agreement between Plains All American GP LLC and Harry N. Pefanis dated as of June 30, 2001 (incorporated by reference to Exhibit 10.4 to Quarterly Report on Form 10-Q for the Quarter Ended September 30, 2001) | |||
— | Asset Purchase and Sale Agreement between Murphy Oil Company Ltd. And Plains Marketing Canada, L.P. (incorporated by reference to Form 8-K filed May 10, 2001) | |||
— | Transportation Agreement dated July 30, 1993, between All American Pipeline Company and Exxon Company, U.S.A. (incorporated by reference to Exhibit 10.9 to Registration Statement, File No. 333-64107) | |||
— | Transportation Agreement dated August 2, 1993, between All American Pipeline Company and Texaco Trading and Transportation Inc., Chevron U.S.A. and Sun Operating Limited Partnership (incorporated by reference to Exhibit 10.10 to Registration Statement, File No. 333-64107) | |||
— | First Amendment to Contribution, Conveyance and Assumption Agreement dated as of December 15, 1998 (incorporated by reference to Exhibit 10.13 to Annual Report on Form 10-K for the Year Ended December 31, 1998) | |||
— | Agreement for Purchase and Sale of Membership Interest in Scurlock Permian LLC between Marathon Ashland LLC and Plains Marketing, L.P. dated as of March 17, 1999 (incorporated by reference to Exhibit 10.16 to Annual Report on Form 10-K for the Year Ended December 31, 1998) | |||
— | ||||
10.22** | — | PMC (Nova Scotia) Company bonus program (incorporated by reference to Exhibit 10.20 to Annual Report on Form 10-K for the Year Ended December 31, | ||
— | ||||
— | ||||
— | Master Railcar Leasing Agreement dated as of May 25, 1998 (effective June 1, 1998), between Pivotal Enterprises Corporation and CANPET Energy Group, Inc., (incorporated by reference to Exhibit 10.16 to Annual Report on Form 10-K for the Year Ended December 31, 2001) | |||
10.26** | — | Form of LTIP Grant Letter (Armstrong/Pefanis) (incorporated by reference to Exhibit 10.1 to Current Report on Form 8-K filed February 23, 2005) | ||
10.27** | — | Form of LTIP Grant Letter—executive officers (incorporated by reference to Exhibit 10.2 to Current Report on Form 8-K filed February 23, 2005) | ||
10.28** | — | Form of LTIP Grant Letter—independent directors (incorporated by reference to Exhibit 10.3 to Current Report on Form 8-K filed February 23, 2005) | ||
10.29** | — | Form of LTIP Grant Letter—designated directors (incorporated by reference to Exhibit 10.4 to Current Report on Form 8-K filed February 23, 2005) | ||
10.30** | — | Form of LTIP Grant Letter—payment to entity (incorporated by reference to Exhibit 10.5 to Current Report on Form 8-K filed February 23, 2005) | ||
21.1 | — | List of Subsidiaries of Plains All American Pipeline, L.P. (incorporated by reference to Exhibit 21.1 to Registration Statement, File No. 333-119738) | ||
23.1* | — | Consent of PricewaterhouseCoopers LLP | ||
II-11
23.2* | ||||
— | Consent of Vinson & Elkins L.L.P. (contained in Exhibits 5.1 and 8.1) | |||
24.1* | — | Powers of Attorney (included on the signature page) |
All financial statement schedules are omitted because the information is not required, is not material or is otherwise included in theSee index of financial statements or related notes thereto.
II-12beginning on page F-1 of this prospectus.