
As filed with the Securities and Exchange Commission on May 15,November 20, 2006
Registration No. 333- 333-134145
SECURITIES AND EXCHANGE COMMISSION
Washington, D.C. 20549
Amendment No. 3 to
FORM S-1
REGISTRATION STATEMENT
UNDER
THE SECURITIES ACT OF 1933
ALLEGIANT TRAVEL COMPANY
(Exact name of registrant as specified in charter)
| NEVADA (State or other jurisdiction of incorporation or organization) | 4512 (Primary Standard Industrial Classification Code Number) | 20-4745737 (I.R.S. Employer Identification Number) | ||
3301 N. Buffalo Drive, Suite B-9 Las Vegas, Nevada 89129 (702) 851-7300 (Address, including zip code, and telephone number, including area code, of registrant's principal executive offices) | ||||
Andrew C. Levy Managing Director and Secretary 3301 N. Buffalo Drive, Suite B-9 Las Vegas, Nevada 89129 (702) 851-7300 | ||||
(Name, address, including zip code, and telephone number, including area code, of agent for service of process) | ||||
With copies to: | ||
| Robert B. Goldberg Ellis Funk, P.C. 3490 Piedmont Road, Suite 400 Atlanta, Georgia 30305 (404) 233-2800 | Mark C. Smith Skadden, Arps, Slate, Meagher & Flom LLP Four Times Square New York, New York 10036 (212) 735-3000 | |
Approximate date of commencement of proposed sale to the public:
As soon as practicable after this Registration Statement becomes effective.
If any of the securities being registered on this Form are to be offered on a delayed or continuous basis pursuant to Rule 415 under the Securities Act of 1933, check the following box: o
If this Form is filed to register additional securities for an offering pursuant to Rule 462(b) under the Securities Act, check the following box and list the Securities Act registration statement number of the earlier effective registration statement for the same offering. o
If this Form is a post-effective amendment filed pursuant to Rule 462(c) under the Securities Act, check the following box and list the Securities Act registration statement number of the earlier effective registration statement for the same offering. o
If this Form is a post-effective amendment filed pursuant to Rule 462(d) under the Securities Act, check the following box and list the Securities Act registration statement number of the earlier effective registration statement for the same offering. o
CALCULATION OF REGISTRATION FEE
| Title of each class of Securities to be Registered | Amount to be Registered | Proposed Maximum Offering Price Per Share | Proposed Maximum Aggregate Offering Price(1) | Amount of Registration Fee | Amount to be Registered(1) | Proposed Maximum Offering Price Per Share(2) | Proposed Maximum Aggregate Offering Price(2) | Amount of Registration Fee(3)(4) | ||||||||
|---|---|---|---|---|---|---|---|---|---|---|---|---|---|---|---|---|
| Common Stock, $0.001 par value | $ | $100,000,000 | $10,700 | 5,750,000 | $17.00 | $97,750,000 | $10,459 |
The Registrant hereby amends this registration statement on such date or dates as may be necessary to delay its effective time until the Registrant shall file a further amendment which specifically states that this registration statement shall thereafter become effective in accordance with Section 8(a) of the Securities Act of 1933 or until the registration statement shall become effective on such date as the Commission, acting pursuant to said Section 8(a), may determine.
Subject to Completion
Preliminary Prospectus dated May 15,November 20, 2006
The information in this prospectus is not complete and may be changed. We may not sell these securities until the registration statement filed with the Securities and Exchange Commission is declared effective. This prospectus is not an offer to sell these securities and is not soliciting an offer to buy these securities in any state where the offer or sale is not permitted.
P R O S P E C T U S
5,000,000 Shares
Common Stock
This is Allegiant Travel Company's initial public offering. Allegiant isWe are selling shares, and the selling stockholders are selling5,000,000 shares.
We expect the public offering price to be between $$15.00 and $$17.00 per share. Currently, no public market exists for the shares. After pricing of the offering, we expect that the shares will be quoted on the Nasdaq National Market under the symbol "ALGT."
Investing in our common stock involves risks that are described in the "Risk Factors" section beginning on page 12 of this prospectus.
| | Per Share | Total | ||||
|---|---|---|---|---|---|---|
| Public offering price | $ | $ | ||||
| Underwriting discount | $ | $ | ||||
| Proceeds, before expenses, to Allegiant | $ | $ | ||||
The underwriters may also purchase up to an additional 750,000 shares from Allegiant, and up to an additional shares from the selling stockholders,us, at the public offering price, less the underwriting discount, within 30 days from the date of this prospectus to cover overallotments.
Neither the Securities and Exchange Commission nor any state securities commission has approved or disapproved of these securities or determined if this prospectus is truthful or complete. Any representation to the contrary is a criminal offense.
The shares will be ready for delivery on or about , 2006.
| Merrill Lynch & Co. | ||
Bear, Stearns & Co. Inc. | ||
Raymond James | ||
The date of this prospectus is , 2006.
| | Page | |
|---|---|---|
| Special Note About Forward-Looking Statements | 1 | |
| Summary | 2 | |
| Risk Factors | 12 | |
| Company History and Reorganization | ||
| Use of Proceeds | ||
| Dividend Policy | ||
| Capitalization | ||
| Dilution | ||
| Selected Financial and Operating Data | ||
| Unaudited Pro Forma Condensed Consolidated Financial Information | ||
| Management's Discussion and Analysis of Financial Condition and Results of Operations | ||
| Industry | ||
| Business | ||
| Management | ||
| Principal | ||
| Related Party Transactions | ||
| Description of Capital Stock | ||
| Shares Eligible for Future Sale | ||
| Material United States Federal Tax Considerations for Non-U.S. Holders of Common Stock | ||
| Underwriting | ||
| Legal Matters | ||
| Experts | ||
| Where You Can Find Additional Information | ||
| Index to Consolidated Financial Statements | F-1 |
You should rely only on the information contained in this prospectus. We have not, and the underwriters have not, authorized any other person to provide you with information. If anyone provides you with different or inconsistent information, you should not rely on it. We are not, and the underwriters are not, making an offer to sell those securities in any jurisdiction where the offer and sale is not permitted. The information appearing in this prospectus is accurate only as of the date on the front cover of this prospectus. Our business, financial condition, results of operations and prospects may have changed since that date.
i
SPECIAL NOTE ABOUT FORWARD-LOOKING STATEMENTS
We have made forward-looking statements in this prospectus, including the sections entitled "Management's Discussion and Analysis of Financial Condition and Results of Operations" and "Business," that are based on our management's beliefs and assumptions and on information currently available to our management. Forward-looking statements include the information concerning our possible or assumed future results of operations, business strategies, financing plans, competitive position, industry environment, potential growth opportunities, the effects of future regulation and the effects of competition. Forward-looking statements include all statements that are not historical facts and can be identified by the use of forward-looking terminology such as the words "believe," "expect," "anticipate," "intend," "plan," "estimate" or similar expressions.
Forward-looking statements involve risks, uncertainties and assumptions. Actual results may differ materially from those expressed in the forward-looking statements. We do not have any intention or obligation to update forward-looking statements after we distribute this prospectus.
You should understand that many important factors, in addition to those discussed elsewhere in this prospectus, could cause our results to differ materially from those expressed in the forward-looking statements. These factors include, without limitation, increases in fuel prices, terrorist attacks, risks inherent to airlines, demand for air services to Las Vegas, Orlando and OrlandoTampa/St. Petersburg from the markets served by us, our ability to implement our growth strategy, our fixed obligations, our dependence on the Las Vegas, Orlando and OrlandoTampa/St. Petersburg markets, our ability to add, renew or replace gate leases, our competitive environment, problems with our aircraft, dependence on fixed fee customers, economic and other conditions in markets in which we operate, governmental regulation, increases in maintenance costs and insurance premiums and cyclical and seasonal fluctuations in our operating results.
This section summarizes material information that appears later in this prospectus and is qualified in its entirety by the more detailed information and financial statements included elsewhere in this prospectus. In this prospectus, we consider Alaska Airlines, Inc., American Airlines, Inc., Continental Airlines, Inc., Delta Air Lines, Inc., Northwest Airlines, Inc., United Air Lines Inc., Trans World Airlines, Inc. (prior to its acquisition by AMR Corp.) and US Airways, Inc. (prior to 2005) as U.S. legacy carriers, and we consider AirTran Airways, Inc., America West Airlines, Inc., Frontier Airlines, Inc., JetBlue Airways Corporation, Southwest Airlines Co., and US Airways, Inc. (starting in 2005) as U.S. low costlow-cost carriers. This summary may not contain all of the information that may be important to you. As an investor or prospective investor, you should carefully review the entire prospectus, including the risk factors and the more detailed information that appears later.
In this prospectus, we use the terms "Allegiant," "we," "us" and "our" to refer to Allegiant Travel Company and its subsidiaries.
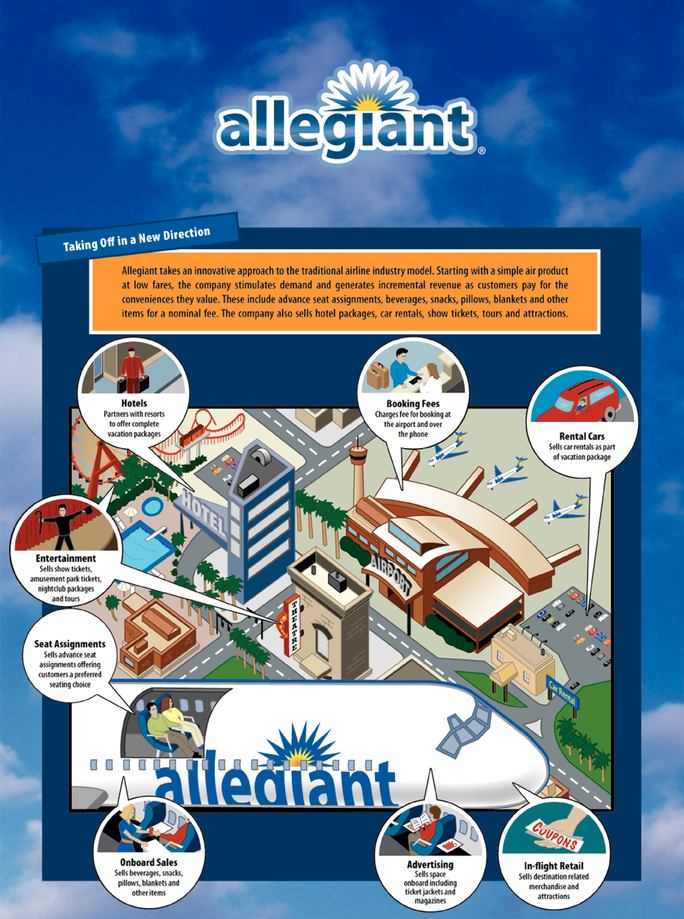
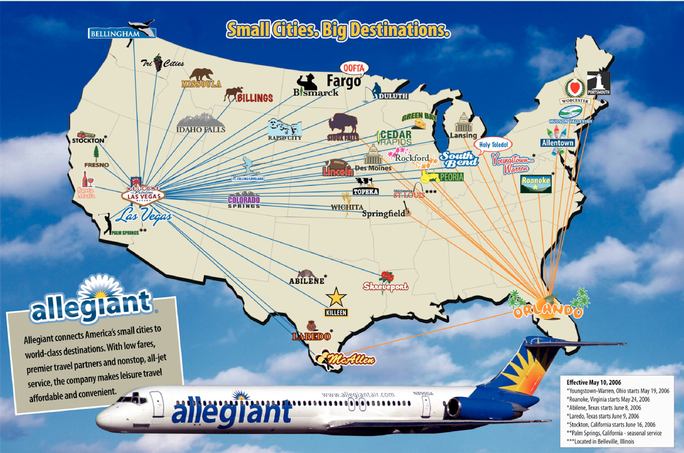
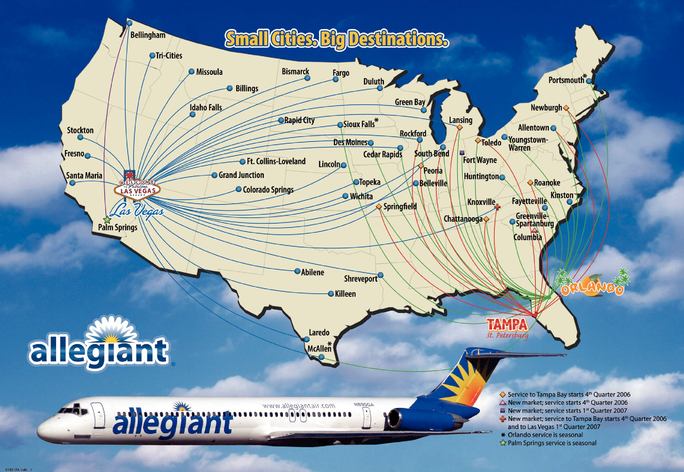
We are a leisure travel company focused on linking travelers in small cities to world-class leisure destinations such as Las Vegas, Nevada, Orlando, Florida and Orlando,Tampa/St. Petersburg, Florida. We operate a low-cost passenger airline marketed to leisure travelers in small cities, allowing us to sell air travel both on a stand-alone basis orand bundled with hotel rooms, rental cars and other travel related services. Our route network, pricing philosophy, advertising and diversified product offering built around relationships with premier leisure companies are all intended to appeal to leisure travelers and make it attractive for them to purchase air travel and related services from us.
Our business model provides for diversified revenue streams, which we believe distinguishes us from other U.S. airlines and other travel companies.
Our business strategy has evolved as our experienced management team has taken a different approach to the traditional way business has been conducted in the airline industry. In contrast to the traditional airline strategy, we focus primarily on the leisure traveler, provide low frequency nonstop service from small cities in larger jet aircraft, sell direct to travelers, do not offer connections, do not code share,code-share, and provide amenities at a small charge to our passengers. We have developed relationships with many premier leisure companies to generate revenue beyond just air fares. In 2005, weWe generated $11.55 of ancillary revenue per scheduled service passenger.passenger in 2005 and $15.08 per scheduled service passenger in the first nine months of 2006.
We provide scheduled air service to customers in 3545 small cities withand have announced service from three additional small cities to commence in December 2006 and first quarter 2007. These 48 cities have an aggregate population of over 4050 million within a 50-mile radius of the airports in those cities. We have identified anat least 52 additional 65 cities in the United States and Canada with similar characteristics representing and where we do not presently have any arrangements for service. These cities represent
an estimated population of over 6050 million people we could potentially serve to our existing Las Vegas, Orlando and OrlandoTampa/St. Petersburg destinations.
Our business model has allowed us to grow rapidly and to achieve attractive rates of profitability, even during the present climate of record high fuel costs. For the year ended December 31, 2005, we
had revenue of $132.5 million, representing substantial growth of 46.6% over the year ended December 31, 2004, while maintaining an operating margin of 6.4% which was higher than the U.S. legacy carriers and U.S. low costlow-cost carriers other than Southwest Airlines Co. Further,We had operating income of $6.1 million in 2004 and $8.5 million in 2005. Our net income was $9.1 million in 2004 and $7.3 million in 2005, the decline attributable to a substantially higher gain on fuel derivatives in 2004. In the first nine months of 2006, we had revenue of $180.2 million, operating income of $15.2 million and net income of $7.3$10.3 million, in 2005.which was 94.9%, 134.3% and 33.7% higher than the first nine months of 2005, respectively.
We have developed a unique business model that focuses on leisure travelers in small cities. We believe the following strengths allow us to maintain a competitive advantage in the markets we serve:
Focus on Linking Small Cities to World-Class Leisure Destinations. We currently provide nonstop low fare scheduled air service from 3545 small cities (including seasonal service) to the world-class leisure destinations of Las Vegas, Nevada, Orlando, Florida, and Orlando,Tampa/St. Petersburg, Florida. We have announced service from three new small cities to commence in December 2006 and first quarter 2007. Frequently, when we enter a new market, we introduce nonstop service to Las Vegas or Orlandoour leisure destinations which previously did not exist. We believe this nonstop service, combined with our pricing philosophy and premier leisure company relationships, makes it attractive for leisure travelers to purchase air travel and related services from us. As a result, we believe we stimulate new traffic. By focusing on underserved small cities, we believe we avoid the overcapacity and intense competition presently seen in high traffic domestic air corridors. On 3755 of our 4358 routes, we are the only carrier providing nonstop service to Las Vegas, Orlando or Orlando.Tampa/St. Petersburg. Of the 70 routes we will be serving by the end of first quarter 2007, there are only six routes with existing or announced service by other airlines.
We believe it would be difficult for potential competitors to profitably contest our market positions with nonstop service as our markets are generally too small to support either two carriers or the high frequency service provided by most U.S. legacy carriers and U.S. low costlow-cost carriers ("LCCs"). In addition, leisure routes from small cities are generally too low-yielding to be a priority for most carriers to prioritize.carriers. Moreover, while some of these markets may be suitable for service with regional jet equipment,jets, we believe our unit costs are significantly less than the unit costs for most regional jets, making it difficult for the regional jetjets to effectively compete.
Low Operating Costs. We believe low costs are essential to competitive success in the airline industry today. Our cost per available seat mile, or "CASM," was 6.82¢6.92¢ and 7.41¢ for the years ended December 31, 2004 and 2005, respectively. We believe our CASM for the year ended December 31, 2005 was approximately 31.2% lower than the average of the U.S. legacy carriers, and was approximately 18.3% lower than the average of the LCCs. Our CASM for the first nine months of 2006 increased only 3.9% to 7.73¢ despite significantly higher fuel costs. Excluding the cost of fuel, our CASM was 4.63¢ for the year ended December 31, 2004, 4.27¢ for the year ended December 31, 2005 was 4.27¢.and 4.09¢ for the first nine months of 2006.
Our low operating costs are the result of our focus on the following factors:
full-time equivalent employees per aircraft, based on publicly available information. Our high level of employee productivity is created by fleet commonality, fewer unproductive labor work rules, cost-driven scheduling, and the effective use of automation and part-time employees.
Growing Ancillary Revenues. Ancillary revenues are earned in conjunction with our sale of scheduled air service and represent a significant, growing revenue stream. OurOn a per scheduled service passenger basis, our ancillary revenues have grownincreased by 96.8% from $3.1 million, or 3.5% of total revenue$5.87 per scheduled service passenger in 2004, to $11.2 million, or 8.4%$11.55 in 2005 and increased further to $15.08 in the first nine months of total revenue in 2005. In the fourth quarter of 2005, ancillary revenues were $4.5 million, or 11.3% of our total revenue.2006. Ancillary revenue is derived from the sale of vacation packages including hotels, rental cars, show tickets, night club packages and other attractions; the sale of advance seat assignments; the sale of beverages, snacks and other products on board the aircraft; charging a fee for using our reservation center or website to purchase air travel; the collection of excess checked bag and overweight bag charges; and several smallerother revenue streams. The largest component of our ancillary revenue is from the sale of hotel rooms packaged with air travel. We have agreements with 3538 hotels in Las Vegas, including hotels managed by MGM MIRAGE, Harrah's Entertainment Inc., Boyd's Gaming Corp., Wynn Resorts, Limited, and Las Vegas Sands Corp. and 22, 18 hotels in Orlando.Orlando (plus 20 additional hotels in nearby Daytona Beach, Florida), seven hotels in Tampa/St. Petersburg and five in Palm Springs, California. For the monththe first ten months of March 2006, we generated revenue from the sale of more than 27,000283,000 hotel room nights in the Las Vegas market.nights.
Strong Financial Position. We have a strong financial position with significant cash balances. On December 31, 2005,September 30, 2006, we had $53.3$45.0 million of unrestricted cash and investments. On a pro forma as adjusted basis as of December 31, 2005,September 30, 2006, to give effect to the receipt of approximately $$73.0 million in net proceeds from the sale of 5,000,000 shares of our common stock in this offering at an initial public offering price of $$16.00 per share, the midpoint of the range set forth on the cover page of this prospectus, and the conversion of our preferred shares in the reorganization, our unrestricted cash would have been $$117.1 million, our total debt would have been $61.3 million and our debt to total capitalization ratio would have been %.32.5%. We also have a history of growing profitably, having generated 12 consecutive quartersnet income in 13 of profits.the last 15 quarters. We believe our strong financial position allows us to have greater financial flexibility to grow the business and weather sudden industry disruptions.
Proven Management Team and Financial Sponsors. We have a strong management team comprised of experienced and motivated individuals. Our management team is led by Maurice J. Gallagher, Jr., who has an extensive background in the airline industry. Mr. Gallagher was the president of WestAir Holdings, Inc. and built WestAir into one of the largest regional airlines in the U.S., prior to its sale in 1992 to Mesa Air Group. He was also one of the founders of ValuJet, Inc., known today as AirTran Holdings, Inc., which we believe was one of the most successful start-ups of a low-cost airlinecarrier in industry history. Three of our other executive officers are former managers of ValuJet or WestAir. Our investors also have significant experience in the airline industry and were intimately involved in several airline successes. These include Robert L. Priddy, a founder and former chairman and chief executive
officer of ValuJet, Inc. and Declan F. Ryan, a co-founder and former chief executive officer of Ryanair, the successful European low-cost carrier.
To continue the growth of our business and increase our profitability, our strategy will be to continue to offer a single class of air travel service at low fares, while maintaining high-qualityhigh quality standards, keeping our operating costs low and pursuing ways to make our operations more efficient. We intend to grow by adding flights on existing routes, entering additional small cities, expanding our relationships with premier leisure companies, and providing service to more world-class leisure destinations.
The following are the key elements of our strategy:
Capitalize on Significant Growth Opportunities in Linking Small Cities to Leisure Destinations. We believe small cities represent a large untapped market, especially for leisure travel. We believe small city travelers have limited options to world-class leisure destinations as existing carriers are generally focused on connecting small city "spokes" to their business hubs. We aim to become the premier travel brand for leisure travelers in small cities. We have identified at least 6552 additional small cities in the U.S. and Canada where we cancould potentially offer our low fare nonstop service to Las Vegas, Orlando or Orlando.Tampa/St. Petersburg. We also believe there are several other world-class leisure destinations we could serve that share many of the same characteristics as Las Vegas, Orlando and Orlando.Tampa/St. Petersburg. These potential markets include several popular vacation destinations in the U.S., Mexico and the Caribbean.
Develop New Sources of Revenue. We have identified three key areas where we believe we can grow our ancillary revenues:
demand and generate incremental revenue as customers pay additional amounts for conveniences they value. We aim to continue to create new revenue sources by further unbundling our product.
Continue to Reduce Our Operating Costs. We intend to continue to focus on lowering our costs to remain one of the lowest cost airlines in the world, which we believe is instrumental to increasing profitability. We will drive operational efficiency and lower costs principally by growing our network.
We will expand our network by increasing the frequency of our flights in existing markets, expanding the number of small cities we serve, and serving additional world-class leisure destinations, all of which permits us to increase the utilization of our employees and assets, spreading our fixed costs over a larger number of available seat miles. In 2005, we averaged only 183.7184.7 block hours per aircraft per month while in the first nine months of 2006, we averaged 204.0 block hours per aircraft per month.
Minimize Fixed Costs to Increase Strategic Flexibility. We believe our low aircraft ownership costs and the lower fixed costs associated with our small city market strategy provide us with a lower level of fixed costs than other U.S. airlines. We believe minimizing our level of fixed costs will provide us with added flexibility in scheduling our services and controlling our profitability. For example, with lower fixed costs we are better able to enter or exit markets as well as match the size and utilization of our fleet to limit unprofitable flying and maximize profitability. We match our frequency with the market demand on a daily and seasonal basis.
Our principal executive offices are located at 3301 N. Buffalo Drive, Suite B-9 Las Vegas, Nevada 89129. Our telephone number is (702) 851-7300. Our website's address is http://www.allegiantair.com. We have not incorporated by reference into this prospectus the information on our website and you should not consider it to be a part of this document. Our website address is included in this document for reference only.
Allegiant Travel Company, Allegiant Air and Allegiant Vacations are service marks of Allegiant Travel Company in the U.S. This prospectus also contains trademarks and tradenames of other companies.
In May 2005, we completed a private placement under which ComVest Allegiant Holdings, Inc., Viva Air Limited and Timothy P. Flynn invested $34.5 million in preferred shares of our limited liability company predecessor. Simultaneously, Maurice J. Gallagher, Jr., our chief executive officer, converted $5.0 million of debt owed to him into preferred shares. All of our current directors were selected by these shareholders. The representation of these shareholders on our board of directors and the
ownership by these shareholders of approximately 51.3% of our stock after this offering will allow these shareholders to exert significant control over our business in the future.
Certain of our existing stockholders have entered into a stock purchase agreement with PAR Investment Partners, L.P. ("PAR") for the private sale of 1,750,000 shares of our common stock. The closing of the transaction will occur simultaneously with the closing of this offering and is conditioned on the closing of this offering and certain other customary closing conditions. Following the closing of this offering and the sale of shares to PAR, it will beneficially own approximately 9.2% of the outstanding shares of our common stock, or approximately 8.8% if the underwriters exercise in full their option to purchase additional shares. In the event we file an amendment to the registration statement of which this prospectus forms a part because of a material change in the price range reflected on the cover page of this prospectus or in the number of shares being sold, PAR will have the option to terminate the stock purchase transaction.
We currently conduct our business through a limited liability company, Allegiant Travel Company, LLC, and its consolidated subsidiaries. At or immediately prior to the closing of this offering, we will complete a merger in order to have Allegiant Travel Company (a Nevada corporation) succeed to the business of Allegiant Travel Company, LLC and its consolidated subsidiaries and to have our members become stockholders of Allegiant Travel Company, a Nevada corporation. For further details on these transactions, see "Company History and Reorganization" and "Related Party Transactions—Reorganization Transactions" in this prospectus.
| Common stock offered | ||||||
5,000,000 shares | ||||||
Shares outstanding after the offering | 19,045,933 shares | |||||
Use of proceeds | We estimate our net proceeds from this offering without exercise of the overallotment will be approximately | |||||
• | retire $0.9 million of our secured debt owed to our chief executive officer; | |||||
| • | purchase additional aircraft consistent with our growth strategy and acquisition criteria; and | |||||
• | fund general corporate purposes, including working capital. | |||||
Risk Factors | See "Risk Factors" and other information included in this prospectus for a discussion of factors you should carefully consider before deciding to invest in shares of our common stock. | |||||
Proposed Nasdaq National Market Symbol | "ALGT" | |||||
The number of shares outstanding after this offering:
Summary Consolidated Financial Information
| | | | | | | | | | Nine Months Ended September 30, | |||||||||||||||||||||||||||
|---|---|---|---|---|---|---|---|---|---|---|---|---|---|---|---|---|---|---|---|---|---|---|---|---|---|---|---|---|---|---|---|---|---|---|---|---|
| | | | | | Year Ended December 31, | | | | | Year Ended December 31, | ||||||||||||||||||||||||||
| | | Predecessor January 1- June 30, 2001(2) | | Successor July 1- December 31, 2001(2) | | Predecessor January 1- June 30, 2001(2) | | Successor July 1- December 31, 2001(2) | Nine Months Ended September 30, | |||||||||||||||||||||||||||
| | | | 2002 | 2003 | 2004 | 2005 | | | 2002 | 2003 | 2004 | 2005 | 2005 | 2006 | ||||||||||||||||||||||
| | | (unaudited) | | (unaudited) | (unaudited) | | | | | (unaudited) | | (unaudited) | (unaudited) | | | | (unaudited) | |||||||||||||||||||
| | | (in thousands, except share and per share data) | | (in thousands, except share and per share data) | ||||||||||||||||||||||||||||||||
| Statement of Operations Data: | Statement of Operations Data: | Statement of Operations Data: | ||||||||||||||||||||||||||||||||||
| Operating revenue: | Operating revenue: | Operating revenue: | ||||||||||||||||||||||||||||||||||
| Scheduled service revenues | $1,254 | $1,244 | $6,007 | $22,515 | $46,236 | $90,664 | Scheduled service revenues | $1,254 | $1,244 | $6,007 | $22,515 | $46,236 | $90,664 | $61,003 | $131,729 | |||||||||||||||||||||
| Fixed fee contract revenues | 1,688 | 1,922 | 16,081 | 26,569 | 40,987 | 30,642 | Fixed fee contract revenues | 1,688 | 1,922 | 16,081 | 26,569 | 40,987 | 30,642 | 24,774 | 27,246 | |||||||||||||||||||||
| Ancillary revenues | 62 | 43 | 89 | 886 | 3,142 | 11,194 | Ancillary revenues | 62 | 43 | 89 | 886 | 3,142 | 11,194 | 6,669 | 21,239 | |||||||||||||||||||||
| Total operating revenue | Total operating revenue | 3,004 | 3,209 | 22,177 | 49,970 | 90,365 | 132,500 | Total operating revenue | 3,004 | 3,209 | 22,177 | 49,970 | 90,365 | 132,500 | 92,446 | 180,214 | ||||||||||||||||||||
| Operating expenses: | Operating expenses: | Operating expenses: | ||||||||||||||||||||||||||||||||||
| Aircraft fuel | 727 | 699 | 4,761 | 11,755 | 27,914 | 52,568 | Aircraft fuel | 727 | 699 | 4,761 | 11,755 | 27,914 | 52,568 | 34,599 | 77,661 | |||||||||||||||||||||
| Salary and benefits | 1,071 | 1,225 | 4,320 | 8,176 | 15,379 | 21,718 | Salary and benefits | 1,071 | 1,225 | 4,320 | 8,176 | 15,379 | 21,718 | 15,293 | 24,845 | |||||||||||||||||||||
| Station operations | 286 | 314 | 2,852 | 8,042 | 13,608 | 14,090 | Station operations | 286 | 314 | 2,852 | 8,042 | 13,608 | 14,090 | 10,262 | 18,730 | |||||||||||||||||||||
| Maintenance and repairs | 729 | 766 | 2,275 | 5,140 | 8,220 | 9,022 | Maintenance and repairs | 729 | 766 | 2,589 | 6,136 | 9,367 | 9,022 | 7,054 | 14,234 | |||||||||||||||||||||
| Sales and marketing | 28 | 73 | 632 | 2,385 | 3,548 | 5,625 | Sales and marketing | 28 | 73 | 632 | 2,385 | 3,548 | 5,625 | 3,923 | 6,955 | |||||||||||||||||||||
| Aircraft lease rentals | 885 | 459 | 3,033 | 3,137 | 3,847 | 4,987 | Aircraft lease rentals | 885 | 459 | 3,033 | 3,137 | 3,847 | 4,987 | 3,386 | 4,277 | |||||||||||||||||||||
| Depreciation and amortization | 240 | 125 | 260 | 1,181 | 2,183 | 5,088 | Depreciation and amortization | 240 | 125 | 260 | 1,181 | 2,183 | 5,088 | 3,578 | 7,599 | |||||||||||||||||||||
| Other | 1,484 | 1,060 | 4,661 | 6,258 | 8,441 | 10,901 | Other | 1,484 | 1,060 | 4,661 | 6,258 | 8,441 | 10,901 | 7,872 | 10,730 | |||||||||||||||||||||
| Total operating expense | Total operating expense | 5,450 | 4,721 | 22,794 | 46,074 | 83,140 | 123,999 | Total operating expense | 5,450 | 4,721 | 23,108 | 47,070 | 84,287 | 123,999 | 85,967 | 165,031 | ||||||||||||||||||||
| Operating income (loss) | Operating income (loss) | (2,446 | ) | (1,512 | ) | (617 | ) | 3,896 | 7,225 | 8,501 | Operating income (loss) | (2,446 | ) | (1,512 | ) | (931 | ) | 2,900 | 6,078 | 8,501 | 6,479 | 15,183 | ||||||||||||||
| Other (income) expense: | Other (income) expense: | Other (income) expense: | ||||||||||||||||||||||||||||||||||
| Gain on fuel derivatives, net | — | — | — | (314 | ) | (4,438 | ) | (612 | ) | (Gain)/loss on fuel derivatives, net | — | — | — | (314 | ) | (4,438 | ) | (612 | ) | (2,575 | ) | 2,927 | ||||||||||||||
| Other (income) expense, net | 489 | 609 | (9 | ) | (913 | ) | — | — | Other (income) expense, net | 489 | 609 | (9 | ) | (913 | ) | — | — | — | — | |||||||||||||||||
| Interest income | (1 | ) | (1 | ) | — | (9 | ) | (30 | ) | (1,225 | ) | Interest income | (1 | ) | (1 | ) | — | (9 | ) | (30 | ) | (1,225 | ) | (647 | ) | (2,043 | ) | |||||||||
| Interest expense | 13 | 127 | 367 | 831 | 1,399 | 3,009 | Interest expense | 13 | 127 | 367 | 831 | 1,399 | 3,009 | 1,968 | 3,970 | |||||||||||||||||||||
| Total other (income) expense | Total other (income) expense | 501 | 735 | 358 | (405 | ) | (3,069 | ) | 1,172 | Total other (income) expense | 501 | 735 | 358 | (405 | ) | (3,069 | ) | 1,172 | (1,254 | ) | 4,854 | |||||||||||||||
| Income (loss) before income taxes | Income (loss) before income taxes | (2,947 | ) | (2,247 | ) | (975 | ) | 4,301 | 10,294 | 7,329 | Income (loss) before income taxes | (2,947 | ) | (2,247 | ) | (1,289 | ) | 3,305 | 9,147 | 7,329 | 7,733 | 10,329 | ||||||||||||||
| Provision for state income taxes | Provision for state income taxes | 1 | 0 | 1 | 1 | 12 | 37 | Provision for state income taxes | 1 | 0 | 1 | 1 | 12 | 37 | 37 | 43 | ||||||||||||||||||||
| Net income (loss) | Net income (loss) | ($2,948 | ) | ($2,247 | ) | ($976 | ) | $4,300 | $10,282 | $7,292 | Net income (loss) | ($2,948 | ) | ($2,247 | ) | ($1,290 | ) | $3,304 | $9,135 | $7,292 | $7,696 | $10,286 | ||||||||||||||
| Earnings (loss) per share: | Earnings (loss) per share: | Earnings (loss) per share: | ||||||||||||||||||||||||||||||||||
| Basic | ($0.44 | ) | ($0.33 | ) | ($0.14 | ) | $0.64 | $1.53 | $1.11 | Basic | ($0.44 | ) | ($0.33 | ) | ($0.14 | ) | $0.49 | $1.36 | $1.11 | $1.17 | $1.60 | |||||||||||||||
| Diluted(1) | ($0.44 | ) | ($0.33 | ) | ($0.14 | ) | $0.64 | $1.53 | $0.56 | Diluted(1) | ($0.44 | ) | ($0.33 | ) | ($0.14 | ) | $0.49 | $1.36 | $0.56 | $0.64 | $0.62 | |||||||||||||||
| Other Financial Data: | |||||||||||||||||
| Operating margin | ($2,446 | ) | ($1,512 | ) | ($617 | ) | $3,896 | $7,225 | $8,501 | ||||||||
| Operating margin % | (81.4 | %) | (47.1 | %) | (2.8 | %) | 7.8 | % | 8.0 | % | 6.4 | % | |||||
| EBITDA (unaudited) | ($2,695 | ) | ($1,996 | ) | ($348 | ) | $6,304 | $13,846 | $14,201 | ||||||||
| EBITDAR (unaudited) | ($1,810 | ) | ($1,537 | ) | $2,685 | $9,441 | $17,693 | $19,188 | |||||||||
Net cash from: | |||||||||||||||||
| Operating activities | $4,172 | $10,484 | $44,027 | ||||||||||||||
| Investing activities | (7,380 | ) | (9,675 | ) | (47,706 | ) | |||||||||||
| Financing activities | 3,380 | 480 | 23,369 | ||||||||||||||
| Other Financial Data: | |||||||||||||||||||||
| Operating margin | ($2,446 | ) | ($1,512 | ) | ($931 | ) | $2,900 | $6,078 | $8,501 | $6,479 | $15,183 | ||||||||||
| Operating margin % | (81.4 | %) | (47.1 | %) | (4.2 | %) | 5.8 | % | 6.7 | % | 6.4 | % | 7.0 | % | 8.4 | % | |||||
| EBITDA (unaudited) | ($2,695 | ) | ($1,996 | ) | ($662 | ) | $5,308 | $12,699 | $14,201 | $12,632 | $19,855 | ||||||||||
Net cash provided by (used in): | |||||||||||||||||||||
| Operating activities | ($5,521 | ) | ($1,418 | ) | $1,686 | $4,172 | $10,484 | $44,027 | $35,007 | $24,306 | |||||||||||
| Investing activities | (728 | ) | (693 | ) | (1,844 | ) | (7,380 | ) | (9,675 | ) | (47,706 | ) | (41,678 | ) | (20,602 | ) | |||||
| Financing activities | 6,719 | 240 | 201 | 3,380 | 480 | 23,369 | 25,100 | (13,108 | ) | ||||||||||||
As of December 31, | |||||||||||
|---|---|---|---|---|---|---|---|---|---|---|---|
| | 2001 | 2002 | 2003 | 2004 | 2005 | ||||||
| | (unaudited) | (unaudited) | | | | ||||||
| | (in thousands) | ||||||||||
| Balance Sheet Data: | |||||||||||
| Cash, cash equivalents and short-term investments | $66 | $108 | $280 | $1,569 | $53,325 | ||||||
| Total assets | 2,936 | 5,800 | 31,621 | 67,931 | 172,540 | ||||||
| Long-term debt (including capital leases) | 3,715 | 3,915 | 18,981 | 31,992 | 59,747 | ||||||
| Redeemable convertible preferred shares | — | — | — | — | 39,540 | ||||||
| Shareholders'/members' equity (deficit) | (2,253 | ) | (4,308 | ) | (713 | ) | 11,950 | 17,064 | |||
Year Ended December 31, | ||||||||||||
|---|---|---|---|---|---|---|---|---|---|---|---|---|
| | 2001 | 2002 | 2003 | 2004 | 2005 | |||||||
| Operating Statistics (unaudited): | ||||||||||||
| Total system statistics: | ||||||||||||
| Passengers | 59,958 | 200,872 | 472,078 | 840,939 | 1,199,574 | |||||||
| Revenue passenger miles (RPMs) (thousands) | 20,706 | 149,158 | 436,740 | 914,897 | 1,295,633 | |||||||
| Available seat miles (ASMs) (thousands) | 49,357 | 222,216 | 614,280 | 1,218,560 | 1,674,376 | |||||||
| Load factor | 42.0 | % | 67.1 | % | 71.1 | % | 75.1 | % | 77.4 | % | ||
| Operating revenue per ASM (cents) | 12.59 | 9.98 | 8.13 | 7.42 | 7.91 | |||||||
| Operating expense per ASM (cents) | 20.61 | 10.26 | 7.50 | 6.82 | 7.41 | |||||||
| Operating expense per ASM, excluding fuel (cents) | 17.72 | 8.12 | 5.59 | 4.53 | 4.27 | |||||||
| Departures | 1,346 | 3,308 | 5,307 | 8,369 | 11,646 | |||||||
| Block hours | 1,605 | 5,486 | 11,160 | 20,784 | 29,472 | |||||||
| Average stage length (miles) | 347 | 564 | 779 | 948 | 977 | |||||||
| Average number of operating aircraft during period | 1.4 | 2.8 | 4.8 | 8.0 | 13.3 | |||||||
| Total aircraft in service end of period | 1 | 3 | 7 | 9 | 17 | |||||||
| Full-time equivalent employees at period end | 52 | 107 | 282 | 391 | 596 | |||||||
| Fuel gallons consumed (thousands) | 1,391 | 4,548 | 10,490 | 19,789 | 28,172 | |||||||
| Average fuel cost per gallon | $1.03 | $1.05 | $1.12 | $1.41 | $1.87 | |||||||
Scheduled service statistics: | ||||||||||||
| Passengers | 32,941 | 83,779 | 260,850 | 535,602 | 969,393 | |||||||
| Revenue passenger miles (RPMs) (thousands) | 8,483 | 33,687 | 202,997 | 517,301 | 1,029,625 | |||||||
| Available seat miles (ASMs) (thousands) | 16,221 | 57,566 | 274,036 | 694,949 | 1,294,064 | |||||||
| Load factor | 52.3 | % | 58.5 | % | 74.1 | % | 74.4 | % | 79.6 | % | ||
| Departures | 606 | 1,433 | 2,553 | 4,803 | 8,388 | |||||||
| Block hours | 612 | 1,897 | 5,141 | 11,827 | 22,465 | |||||||
| Yield (cents) | 29.45 | 17.83 | 11.09 | 8.94 | 8.81 | |||||||
| Scheduled service revenue per ASM (cents) | 15.40 | 10.43 | 8.22 | 6.65 | 7.01 | |||||||
| Ancillary revenue per ASM (cents) | 0.65 | 0.15 | 0.32 | 0.45 | 0.87 | |||||||
| Total revenue per ASM (cents) | 16.05 | 10.59 | 8.54 | 7.11 | 7.87 | |||||||
| Average fare—scheduled service | $75.83 | $71.70 | $86.31 | $86.33 | $93.53 | |||||||
| Average fare—ancillary | $3.19 | $1.06 | $3.40 | $5.87 | $11.55 | |||||||
| Average fare—total | $79.02 | $72.76 | $89.71 | $92.19 | $105.07 | |||||||
| Average stage length (miles) | 258 | 403 | 725 | 913 | 1,045 | |||||||
| Percent of sales through website during period | — | — | 53.2 | % | 68.4 | % | 81.0 | % | ||||
| | | | | | | | As of September 30, 2006 Pro Forma As Adjusted* | ||||||||
|---|---|---|---|---|---|---|---|---|---|---|---|---|---|---|---|
| | As of December 31, | | |||||||||||||
| | As of September 30, 2006 | ||||||||||||||
| | 2001 | 2002 | 2003 | 2004 | 2005 | ||||||||||
| | (unaudited) | (unaudited) | | | | (unaudited) | (unaudited) | ||||||||
| | (in thousands) | | |||||||||||||
| Balance Sheet Data: | |||||||||||||||
| Cash, cash equivalents and short-term investments | $66 | $108 | $280 | $1,569 | $53,325 | $44,980 | $44,980 | ||||||||
| Total assets | 2,936 | 5,840 | 32,689 | 65,474 | 170,083 | 189,752 | 189,752 | ||||||||
| Long-term debt (including capital leases) | 3,715 | 3,915 | 18,981 | 31,992 | 59,747 | 48,221 | 48,221 | ||||||||
| Redeemable convertible preferred shares | — | — | — | — | 39,540 | 39,540 | — | ||||||||
| Shareholders'/members' equity (deficit) | (2,253 | ) | (2,951 | ) | 355 | 9,493 | 14,607 | 20,881 | 54,255 | ||||||
| | | | | | | | | Nine Months Ended September 30, | ||||||||||||
|---|---|---|---|---|---|---|---|---|---|---|---|---|---|---|---|---|---|---|---|---|
| | Predecessor January 1- June 30, 2001 | | | Year Ended December 31, | ||||||||||||||||
| | | Successor July 1- December 31, 2001 | ||||||||||||||||||
| | | 2002 | 2003 | 2004 | 2005 | 2005 | 2006 | |||||||||||||
| Operating Statistics (unaudited): | ||||||||||||||||||||
| Total system statistics: | ||||||||||||||||||||
| Passengers | 27,027 | 32,931 | 200,872 | 472,078 | 840,939 | 1,199,574 | 828,218 | 1,599,851 | ||||||||||||
| Revenue passenger miles (RPMs) (thousands) | 9,555 | 11,151 | 149,158 | 436,740 | 914,897 | 1,295,633 | 894,913 | 1,690,603 | ||||||||||||
| Available seat miles (ASMs) (thousands) | 22,807 | 26,550 | 222,216 | 614,280 | 1,218,560 | 1,674,376 | 1,156,170 | 2,136,309 | ||||||||||||
| Load factor | 41.9 | % | 42.0 | % | 67.1 | % | 71.1 | % | 75.1 | % | 77.4 | % | 77.4 | % | 79.1 | % | ||||
| Operating revenue per ASM (cents) | 13.17 | 12.09 | 9.98 | 8.13 | 7.42 | 7.91 | 8.00 | 8.44 | ||||||||||||
| Operating expense per ASM (cents) | 23.90 | 17.78 | 10.40 | 7.66 | 6.92 | 7.41 | 7.44 | 7.73 | ||||||||||||
| Operating expense per ASM, excluding fuel (cents) | 20.71 | 15.15 | 8.26 | 5.75 | 4.63 | 4.27 | 4.44 | 4.09 | ||||||||||||
| Departures | 552 | 794 | 3,308 | 5,307 | 8,369 | 11,646 | 8,142 | 14,632 | ||||||||||||
| Block hours | 688 | 917 | 5,486 | 11,160 | 20,784 | 29,472 | 20,390 | 37,454 | ||||||||||||
| Average stage length (miles) | 369 | 332 | 564 | 779 | 948 | 977 | 967 | 986 | ||||||||||||
| Average number of operating aircraft during period | 1.0 | 1.7 | 2.8 | 4.8 | 8.0 | 13.3 | 12.6 | 20.4 | ||||||||||||
| Total aircraft in service end of period | 1 | 1 | 3 | 7 | 9 | 17 | 15 | 21 | ||||||||||||
| Full-time equivalent employees end of period | 59 | 52 | 107 | 282 | 391 | 596 | 510 | 787 | ||||||||||||
| Fuel gallons consumed (thousands) | 563 | 556 | 4,548 | 10,490 | 19,789 | 28,172 | 19,535 | 35,638 | ||||||||||||
| Average fuel cost per gallon | $1.29 | $1.26 | $1.05 | $1.12 | $1.41 | $1.87 | $1.77 | $2.18 | ||||||||||||
Scheduled service statistics: | ||||||||||||||||||||
| Passengers | 16,631 | 16,310 | 83,779 | 260,850 | 535,602 | 969,393 | 645,988 | 1,408,738 | ||||||||||||
| Revenue passenger miles (RPMs) (thousands) | 4,291 | 4,192 | 33,687 | 202,997 | 517,301 | 1,029,625 | 679,957 | 1,483,902 | ||||||||||||
| Available seat miles (ASMs) (thousands) | 8,553 | 7,668 | 57,566 | 274,036 | 694,949 | 1,294,064 | 847,384 | 1,821,817 | ||||||||||||
| Load factor | 50.2 | % | 54.7 | % | 58.5 | % | 74.1 | % | 74.4 | % | 79.6 | % | 80.2 | % | 81.5 | % | ||||
| Departures | 298 | 308 | 1,433 | 2,553 | 4,803 | 8,388 | 5,553 | 11,967 | ||||||||||||
| Block hours | 302 | 310 | 1,897 | 5,141 | 11,827 | 22,465 | 14,686 | 31,776 | ||||||||||||
| Yield (cents) | 29.22 | 29.68 | 17.83 | 11.09 | 8.94 | 8.81 | 8.97 | 8.88 | ||||||||||||
| Scheduled service revenue per ASM (cents) | 14.66 | 16.22 | 10.43 | 8.22 | 6.65 | 7.01 | 7.20 | 7.23 | ||||||||||||
| Ancillary revenue per ASM (cents) | 0.72 | 0.56 | 0.15 | 0.32 | 0.45 | 0.87 | 0.79 | 1.17 | ||||||||||||
| Total revenue per ASM (cents) | 15.39 | 16.78 | 10.59 | 8.54 | 7.11 | 7.87 | 7.99 | 8.40 | ||||||||||||
| Average fare—scheduled service | $75.40 | $76.27 | $71.70 | $86.31 | $86.33 | $93.53 | $94.43 | $93.51 | ||||||||||||
| Average fare—ancillary | $3.73 | $2.64 | $1.06 | $3.40 | $5.87 | $11.55 | $10.32 | $15.08 | ||||||||||||
| Average fare—total | $79.13 | $78.91 | $72.76 | $89.71 | $92.19 | $105.07 | $104.76 | $108.59 | ||||||||||||
| Average stage length (miles) | 258 | 258 | 403 | 725 | 913 | 1,045 | 1,034 | 1,030 | ||||||||||||
| Percent of sales through website during period | — | — | — | 53.2 | % | 68.4 | % | 81.0 | % | 81.5 | % | 84.8 | % | |||||||
The following terms used in this section and elsewhere in this prospectus have the meanings indicated below:
"Available seat miles" or "ASMs" represents the number of seats available for passengers multiplied by the number of miles the seats are flown.
"Average fuel cost per gallon" represents total aircraft fuel costs including taxes divided by the total number of fuel gallons consumed.
"Average stage length" represents the average number of miles flown per flight.
"EBITDA" represents earnings before interest expense, income taxes, depreciation and amortization. EBITDA is not a calculation based on generally accepted accounting principles and should not be considered as an alternative to net income (loss) or operating income (loss) as indicators of our financial performance or to cash flow as a measure of liquidity. In addition, our calculation may not be comparable to other similarly titled measures of other companies. EBITDA is included as a supplemental disclosure because we believe it may provideis a useful information regardingindicator of our ability to service debt payments and to fund capital expenditures. Our ability to service debt payments and to fund capital expendituresoperating performance. Further, EBITDA is a well recognized performance measurement in the future, however,airline industry that is frequently used by securities analysts, investors and other interested parties in comparing the operating performance of companies in our industry. We believe EBITDA is useful in evaluating our operating performance compared to our competitors because its calculation generally eliminates the effects of financing and income taxes and the accounting effects of capital spending and acquisitions, which items may be affected by othervary between periods and for different companies for reasons unrelated to overall operating or legal requirements or uncertainties.performance. The following represents the reconciliation of EBITDA to net income (loss) to EBITDA for the periods indicated below.
| | | | | | | | | Nine Months Ended September 30, | ||||||||||||||||||||||||||
|---|---|---|---|---|---|---|---|---|---|---|---|---|---|---|---|---|---|---|---|---|---|---|---|---|---|---|---|---|---|---|---|---|---|---|
| | | | | | Year Ended December 31, | | | | Year Ended December 31, | |||||||||||||||||||||||||
| | | Predecessor January 1- June 30, 2001 | | Successor July 1- December 31, 2001 | Predecessor January 1- June 30, 2001 | | Successor July 1- December 31, 2001 | Nine Months Ended September 30, | ||||||||||||||||||||||||||
| | | | 2002 | 2003 | 2004 | 2005 | | 2002 | 2003 | 2004 | 2005 | 2005 | 2006 | |||||||||||||||||||||
| | | (unaudited) | | (unaudited) | (unaudited) | | | | (unaudited) | | (unaudited) | (unaudited) | | | | (unaudited) | ||||||||||||||||||
| | | (in thousands, except share and per share data) | (in thousands, except share and per share data) | |||||||||||||||||||||||||||||||
| | | | | | | | | | | | | | | | | | | |||||||||||||||||
| EBITDA Reconciliation: | EBITDA Reconciliation: | |||||||||||||||||||||||||||||||||
| Net income (loss) | Net income (loss) | ($2,948 | ) | ($2,247 | ) | ($976 | ) | $4,300 | $10,282 | $7,292 | $(2,948 | ) | $(2,247 | ) | $(1,290 | ) | $3,304 | $9,135 | $7,292 | $7,696 | $10,286 | |||||||||||||
| Plus (minus): | Plus (minus): | |||||||||||||||||||||||||||||||||
| Interest, net | 12 | 126 | 367 | 822 | 1,369 | 1,784 | ||||||||||||||||||||||||||||
| Income tax expense | 1 | — | 1 | 1 | 12 | 37 | ||||||||||||||||||||||||||||
| Depreciation and amortization | 240 | 125 | 260 | 1,181 | 2,183 | 5,088 | ||||||||||||||||||||||||||||
| Interest income | (1 | ) | (1 | ) | — | (9 | ) | (30 | ) | (1,225 | ) | (647 | ) | (2,043 | ) | |||||||||||||||||||
| Interest expense | 13 | 127 | 367 | 831 | 1,399 | 3,009 | 1,968 | 3,970 | ||||||||||||||||||||||||||
| Provision for state income taxes | 1 | — | 1 | 1 | 12 | 37 | 37 | 43 | ||||||||||||||||||||||||||
| Depreciation and amortization | 240 | 125 | 260 | 1,181 | 2,183 | 5,088 | 3,578 | 7,599 | ||||||||||||||||||||||||||
| EBITDA | EBITDA | ($2,695 | ) | ($1,996 | ) | ($348 | ) | $6,304 | $13,846 | $14,201 | $(2,695 | ) | $(1,996 | ) | $(662 | ) | $5,308 | $12,699 | $14,201 | $12,632 | $19,855 | |||||||||||||
"EBITDAR"Aircraft lease rentals expense represents earnings before interesta significant operating expense income taxes, depreciation, amortization andof our business. Because we leased aircraft during the periods presented, we believe that when assessing EBITDA you should also consider the impact of our aircraft lease rental expense. EBITDAR is not a calculation based on generally accepted accounting principles and should not be considered as an alternative to net income (loss) or operating income (loss) as indicators of our financial performance or to cash flow as a measure of liquidity. In addition, our calculation may not be comparable to other similarly titled measures of other companies. EBITDAR is included as a supplemental disclosure because it may provide useful information regarding our ability to service debt and lease payments and to fund capital expenditures. Our ability to service debt and lease payments and to fund capital expendituresrentals expense, which was (in thousands) $885 from January 1 - -June 30, 2001, $459 from July 1 - December 31, 2001, $3,033 in 2002, $3,137 in 2003, $3,847 in 2004, $4,987 in 2005, $3,386 in the future, however, may be
affected by other operating or legal requirements or uncertainties. The following representsfirst nine months of 2005 and $4,277 in the reconciliationfirst nine months of net income (loss) to EBITDAR for the periods indicated below.2006.
| | | | | Year Ended December 31, | |||||||||||
|---|---|---|---|---|---|---|---|---|---|---|---|---|---|---|---|
| | Predecessor January 1- June 30, 2001 | | Successor July 1- December 31, 2001 | ||||||||||||
| | | 2002 | 2003 | 2004 | 2005 | ||||||||||
| | (unaudited) | | (unaudited) | (unaudited) | | | | ||||||||
| | (in thousands, except share and per share data) | ||||||||||||||
| EBITDAR Reconciliation | |||||||||||||||
| Net income (loss) | ($2,948 | ) | ($2,247 | ) | ($976 | ) | $4,300 | $10,282 | $7,292 | ||||||
| Plus (minus): | |||||||||||||||
| Interest, net | 12 | 126 | 367 | 822 | 1,369 | 1,784 | |||||||||
| Income tax expense | 1 | — | 1 | 1 | 12 | 37 | |||||||||
| Depreciation and amortization | 240 | 125 | 260 | 1,181 | 2,183 | 5,088 | |||||||||
| Aircraft lease rentals | 885 | 459 | 3,033 | 3,137 | 3,847 | 4,987 | |||||||||
| EBITDAR | ($1,810 | ) | ($1,537 | ) | $2,685 | $9,441 | $17,693 | $19,188 | |||||||
"Load factor" represents the percentage of aircraft seating capacity that is actually utilized (revenue passenger miles divided by available seat miles).
"Operating expense per ASM" represents operating expenses divided by available seat miles.
"Operating expense per ASM, excluding fuel" represents operating expenses, less aircraft fuel, divided by available seat miles.
"Operating revenue per ASM" represents operating revenue divided by available seat miles.
"Revenue passengers" represents the total number of passengers flown on all flight segments.
"Revenue passenger miles" or"RPMs" represents the number of miles flown by revenue passengers.
"Yield" represents scheduled service revenue divided by scheduled service revenue passenger miles.
An investment in our common stock involves a high degree of risk. You should carefully consider the risks described below before making an investment decision. The risks described below are not the only ones facing our company. Additional risks not presently known to us or that we currently deem immaterial may also impair our business and operations. Our business, financial condition or results of operations could be materially and adversely affected by any of these risks. The trading price of our common stock could decline due to any of these risks, and you may lose all or part of your investment.
Risks Related to Allegiant
Increases in fuel prices or unavailability of fuel would harm our business and profitability.
Fuel costs constitute a significant portion of our total operating expenses (42.4%(47.1% for the yearnine months ended December 31, 2005)September 30, 2006). Significant increases in fuel costs would harm our financial condition and results of operations.
Our MD80 series aircraft are relativelyless fuel inefficient compared toefficient than new aircraft. An increase in the price of aircraft fuel would therefore result in a disproportionately higher increase in our average total costs than our competitors using more fuel efficient aircraft.
Historically, fuel costs have been subject to wide price fluctuations. Aircraft fuel availability is also subject to periods of market surplus and shortage and is affected by demand for heating oil, gasoline and other petroleum products. Because of the effect of these events on the price and availability of aircraft fuel, the cost and future availability of fuel cannot be predicted with any degree of certainty. A fuel supply shortage or higher fuel prices could result in the curtailment of our service. Some of our competitors may be better positioned to obtain fuel in the event of a shortage. We cannot assure you increases in the price of fuel can be offset by higher revenue.
In addition, although we implemented a fuel derivatives program in 2003 to partially protect against fuel price volatility, our hedging program does not protect us against ordinary course price increases and is limited in fuel volume and duration. We cannot assure you our fuel hedging program is sufficient to protect us against increases in the price of fuel.
We carry limited fuel inventory and we rely heavily on our fuel suppliers. We cannot assure you we will always have access to adequate supplies of fuel in the event of shortages or other disruptions in the fuel supply.
We may be subject to unionization, work stoppages, slowdowns or increased labor costs.
Unlike most airlines, we have a non-union workforce. If our employees unionize, it could result in demands that may increase our operating expenses and adversely affect our profitability. Each of our different employee groups could unionize at any time and would require separate collective bargaining agreements. If any group of our employees were to unionize and we were unable to agree on the terms of their collective bargaining agreement or we were to experience widespread employee dissatisfaction, we could be subject to work slowdowns or stoppages. In addition, we may be subject to disruptions by organized labor groups protesting our non-union status. Any of these events would be disruptive to our operations and could harm our business.
If our credit card processing company were to require significant holdbacks for processing credit card transactions for the purchase of air travel and other services, our cash flow would be adversely affected.
Credit card companies frequently require significant holdbacks when future air travel and other future services are purchased through credit card transactions. We rely on a single credit card processing company at this time, and our agreement is terminable on 30 days notice. As virtually all of our scheduled service and ancillary revenue is paid with credit card transactionscards and our credit card processing agreement does not require a
significant holdback, our cash flow would suffer in the event the terms of our current agreement were changed.changed or terminated. Although we believe that we would be able to secure a replacement credit card processing agreement if our current agreement is terminated, the terms of any new agreement may not be as favorable to us. These cash flow issues could be exacerbated during periods of rapid growth as we would be incurring additional costs associated with our growth, but our receipt of these revenues would be delayed.
Our failure to successfully implement our growth strategy and generate demand for our services could harm our business.
Successfully implementing our growth strategy is critical for our business to achieve economies of scale and to sustain or increase our profitability. Increasing the number of small city markets we serve depends on our ability to identify and effectively evaluate new target markets and then access suitable airports located in these markets in a manner consistent with our cost strategy.
Most of our scheduled air service is sold to customers traveling from our small city markets to eitherour leisure destinations of Las Vegas, Orlando or Orlando.Tampa/St. Petersburg. While we seek to generate demand for our services in these markets, the smaller size of these markets makes it more difficult to create this demand. If we are unable to do so in a particular market, our revenues could be negatively affected and our ability to grow could be constrained. Under those circumstances, we may decide to reduce or terminate service to that market, which could result in additional costs.
We will also need to obtain additional gates in Las Vegas, Orlando and Orlando,Tampa/St. Petersburg, and obtain access to markets we seek to serve in the future. Any condition that would deny, limit or delay our access to airports we seek to serve in the future willwould constrain our ability to grow. Opening new markets may require us to commit a substantial amount of resources, even before the new services commence, including additional skilled personnel, equipment and facilities. An inability to hire and retain skilled personnel or to secure the required equipment and facilities efficiently and cost-effectively may affect our ability to implement our growth strategy. We cannot assure you we will be able to successfully establish new markets and our failure to do so could harm our business.
Over timeWe have recently announced or commenced service from 12 small cities to Tampa/St. Petersburg. As we do not have historical data on the performance of Tampa/St. Petersburg as one of our leisure destinations, we may not be able to profitably operate these routes.
We expect to serve other leisure destinations, in addition to Las Vegas, Orlando and Orlando,Tampa/St. Petersburg, which we believe are attractive to small city markets. However, if we fail to successfully implement service to additional leisure destinations, our growth prospects will be limited and our profitability could be adversely impacted.
Expansion of our markets and services may also strain our existing management resources and operational, financial and management information systems to the point they may no longer be adequate to support our operations, requiring us to make significant expenditures in these areas. We expect we will need to develop further financial, operational and management controls, reporting systems and procedures to accommodate future growth. We cannot assure you we will be able to develop these controls, systems or procedures on a timely basis and the failure to do so could harm our business.
Additionally, we are subject to regulation by the Federal Aviation Administration ("FAA") and must receive its approval to add aircraft to our operating certificate. If the FAA does not grant us approval to add aircraft to our fleet as quickly as we desire, our growth may be limited and our profitability could be adversely impacted.
Any inability to acquire and maintain additional compatible aircraft, engines or parts on favorable terms or at all would increase our operating costs and could harm our profitability.
Our fleet currently consists of MD80 series aircraft equipped with Pratt & Whitney JT8D-200 series engines. Although our management believes there is currently an adequate supply of suitable MD80 series aircraft available at favorable prices and terms, we are unable to predict how long these conditions will continue. Any increase in demand for the MD80 aircraft or the Pratt & Whitney JT8D-200 series engine could restrict our ability to obtain additional MD80 aircraft, engines and spare
parts. Because the aircraft and the engine are no longer being manufactured, we may be unable to
obtain additional suitable aircraft, engines or spare parts on satisfactory terms or at the time needed for our operations or for our implementation of our growth plan.
In April 2006, the FAA indicated it intends to issue regulations limiting the age of aircraft that may be flown in the U.S. The announcement did not indicate the maximum age that would be allowed, the effective date of the regulation or any grandfathering provisions. These regulations, if and when implemented, may have a material effect on our future operations.
We cannot assure you we will be able to purchase additional MD80s on favorable terms, or at all. Instead, we may be required to lease MD80s from current owners. Because, in our experience, the cost of leasing generally exceeds the ownership costs associated with the purchase of the MD80, our operating costs would increase if we are required to lease, instead of purchase, additional MD80 aircraft, and this could harm our profitability.
If the available MD80 series aircraft, whether by purchase or lease, are not compatible with the rest of our fleet in terms of takeoff weight, avionics, engine type or other factors, the costs of operating and maintaining our fleet willwould likely increase. Similarly, our aircraft ownership costs will likely increase if we decide to acquire aircraft which are not MD80 series aircraft.
There is also a greater risk with acquiring used aircraft because we may incur additional costs to remedy any mechanical issues not found in our inspection and acceptance process and, generally, the cost to maintain used aircraft exceeds the cost to maintain newernew aircraft.
Any inability to obtain financing for additional aircraft could harm our growth plan.
We typically finance our aircraft through either mortgage debt or lease financing. Although we believe debt and/or lease financing will be available for the aircraft we will acquire, we cannot assure you we will be able to secure such financing on terms attractive to us or at all. To the extent we cannot secure such financing on acceptable terms or at all, we may be required to modify our aircraft acquisition plans, incur higher than anticipated financing costs or use more of our cash balances for aircraft acquisitions than we currently expect.
Aircraft lenders often require that they receive the benefit of Section 1110 protection under the U.S. Bankruptcy Code. It is more difficult to provide lenders Section 1110 protection for aircraft manufactured before 1994. Most MD80s, and almost all of our MD80s, were manufactured before 1994. As a result, we may face difficulty obtaining financing for aircraft transactions.
Our maintenance costs will increase as our fleet ages.
Our aircraft range from 10 to 20 years old, with an average age of 16 years. The average age of aircraft fleets among U.S. legacy carriers and LCCs ranges from 2.6 years old to 13.3 years old. In general, the cost to maintain aircraft increases as they age and exceeds the cost to maintain new aircraft. FAA regulations require additional maintenance inspections for older aircraft. For example, a repair assessment program must be implemented for each of our aircraft once they reach 60,000 cycles. A cycle is defined as one take-off and landing. The average cycles on our fleet is approximately 25,000 cycles and the highest number of cycles on any of our aircraft is approximately 43,000. Based on our current and expected aircraft utilization rates of approximately 1,000 cycles per year, we will not have to comply with the repair assessment program for several years. We will also need to comply with other programs which require enhanced inspections of aircraft including Aging Aircraft Airworthiness Directives, which typically increase as an aircraft ages and vary by aircraft or engine type depending on the unique characteristics of each aircraft and/or engine.
In addition, we may be required to comply with any future aging aircraft issues, law changes, regulations or airworthiness directives. We cannot assure you our maintenance costs will not exceed our expectations.
We believe our aircraft are and will be mechanically reliable based on the percentage of scheduled flights completed. We cannot assure you our aircraft will continue to be sufficiently reliable over longer periods of time. Furthermore, given the age of our fleet, any public perception that our aircraft are less than completely reliable could have an adverse effect on our profitability.
We may be subject to unionization, work stoppages, slowdowns or increased labor costs.
Unlike most airlines, we have a non-union workforce. If our employees unionize, it could result in demands that may increase our operating expenses and adversely affect our profitability. Our pilots have formed an in-house pilot association and our flight attendants are in the process of voting to determine if they will be represented by a union. Although we have negotiated a mutually acceptable arrangement with our pilots, our costs could be adversely affected by the cumulative results of discussions with our flight attendants and any other employee groups in the future. In particular, if our flight attendants vote to approve third party representation, particularly from the Association of Flight Attendants, we believe this action could reduce our current flexibility and productivity regarding work rules and compensation structure for this particular employee group.
Each of our different employee groups could unionize at any time and would require separate collective bargaining agreements. If any group of our employees were to unionize and we were unable to agree on the terms of their collective bargaining agreement or we were to experience widespread employee dissatisfaction, we could be subject to work slowdowns or stoppages. In addition, we may be subject to disruptions by organized labor groups protesting our non-union status. Any of these events would be disruptive to our operations, could harm our business, and therefore have an adverse effect on our future results.
Our reputation and financial results could be harmed in the event of an accident or incident involving our aircraft or other MD80 aircraft.
AnAlthough we have not had any accidents or material incidents to date, an accident or incident involving one of our aircraft could involve repair or replacement of a damaged aircraft and its consequential temporary or permanent loss from service, and significant
potential claims of injured passengers and others. Although we believe we currently maintain liability insurance in amounts and of the type generally consistent with industry practice, the amount of such coverage may not be adequate and we may be forced to bear substantial losses from an accident. Substantial claims resulting from an accident in excess of our related insurance coverage would harm our business and financial results. Moreover, any aircraft accident or incident, even if fully insured, could cause a public perception that we are less safe or reliable than other airlines, which would harm our business. Because we are a relatively new company and because we are smaller than most airlines, an accident would be likely to adversely affect us to a greater degree than a larger, more established airline.
Additionally, our dependence on this single type of aircraft and engine for all of our flights makes us particularly vulnerable to any problems that might be associated with this aircraft type or these engines. Our business would be significantly harmed if a mechanical problem with the MD80 series aircraft or the Pratt & Whitney JT8D-200 series engine were discovered causing our aircraft to be grounded while any such problem is being corrected, assuming it could be corrected at all. The FAA could also suspend or restrict the use of our aircraft in the event of any actual or perceived mechanical problems, whether involving our aircraft or another U.S. or foreign airline's aircraft, while it conducts its own investigation. Our business would also be significantly harmed if the public avoids flying our aircraft due to an adverse perception of the MD80 series aircraft or the Pratt & Whitney JT8D-200 series engine because of safety concerns or other problems, whether real or perceived, or in the event of an accident involving an MD80 aircraft.
We depend on our ability to maintain existing and develop new relationships with hotels and other providers of travel related services. Any adverse changes in these relationships could adversely affect our business, financial condition and results of operations, as well as our ability to provide air-hotel packages in our leisure destination markets.
An important component of our business success depends on our ability to maintain our existing, as well as build new, relationships with hotels and other travel suppliers in our leisure destination markets. We do not currently have long-term contracts with any of our hotel room suppliers, nor do we anticipate entering into long-term contracts with them in the future. Adverse changes in or the failure to renew existing relationships, or our inability to enter into arrangements with new hotel suppliers on favorable terms, if at all, could reduce the amount, quality and breadth of attractively priced travel products and services we are able to offer, which could adversely affect our business, financial condition and results of operations. Our ability to continue to grow and enter new markets also depends on our ability to obtain a sufficient supply of suitable hotel rooms on favorable terms in our existing and new leisure destinations.
Hotels and other travel suppliers are increasingly seeking to lower their distribution costs by promoting direct online bookings through their own websites, and we expect this trend to continue. Hotels and travel suppliers may choose not to make their travel products and services available through our distribution channels. To the extent consumers increase the percentage of their travel purchases through supplier direct websites and/or if travel suppliers choose not to make their products and services available to us, our business may suffer.
We have a significant amount of fixed obligations and we expect to incur significantly more fixed obligations which could hurt our ability to meet our strategic goals.
As of December 31, 2005, maturities of our long-term debt (including capital leases) were $10.6 million in 2006, $11.2 million in 2007, $10.4 million in 2008, $12.5 million in 2009, $9.6 million in 2010 and an aggregate of $5.4 million for years thereafter. All of our long-term and short-term debt has fixed interest rates. In addition to long-term debt, we have a significant amount of other fixed obligations under operating leases related to our aircraft, airport terminal space, other airport facilities
and office space. As of December 31, 2005, future minimum lease payments under noncancelable operating leases with initial or remaining terms in excess of one year were approximately $6.7 million in 2006, $6.6 million in 2007, $2.9 million in 2008, $0.8 million in 2009 and $0.6 million in 2010. We expect to incur additional debt and other fixed obligations as we take delivery of additional aircraft and other equipment and continue to expand into new markets.
The amount of our debt and other fixed obligations could:
Our ability to make scheduled payments on our debt and other fixed obligations will depend upon our future operating performance and cash flow, which in turn will depend upon prevailing economic and political conditions and financial, competitive, regulatory, business and other factors, many of which are beyond our control. We cannot assure you we will be able to generate sufficient cash flow from our operations to pay our debt and other fixed obligations as they become due, and our failure to
do so could harm our business. If we are unable to make payments on our debt and other fixed obligations, we could be forced to renegotiate those obligations or obtain additional equity or debt financing. To the extent we finance our activities or future aircraft acquisitions with additional debt, we may become subject to financial and other covenants that may restrict our ability to pursue our growth strategy. We cannot assure you any renegotiation efforts would be successful or timely or that we could refinance our obligations on acceptable terms, if at all.
Our lack of an established line of credit or borrowing facility makes us highly dependent upon our operating cash flows.
We have no lines of credit and rely on operating cash flows to provide working capital. Unless we secure a line of credit or borrowing facility, we will be dependent upon our operating cash flows and cash balances to fund our operations and to make scheduled payments on our debt and other fixed obligations. If we fail to generate sufficient funds from operations to meet these cash requirements or do not secure a line of credit, other borrowing facility or equity financing, we could default on our debt and other fixed obligations. Our inability to meet our obligations as they become due would materially restrict our ability to grow and seriously harm our business and financial results.
Our business is heavily dependent on the Las Vegas and Orlando marketsthe attractiveness of our leisure destinations and a reduction in demand for air travel to these markets would harm our business.
AllAlmost all of our scheduled flights have Las Vegas, Orlando or OrlandoTampa/St. Petersburg as either their destination or origin. Our business would be harmed by any circumstances causing a reduction in demand for air transportation to the Las Vegas, Orlando or OrlandoTampa/St. Petersburg markets, such as adverse changes in local economic conditions, negative public perception of the particular city, significant price increases, or the impact of past or future terrorist attacks.
We serve Orlando Sanford International Airport, which is not the principal airport in the Orlando market. A refusal by passengers to view Orlando Sanford International Airport as a reasonable alternative to Orlando International Airport, the main airport serving Orlando, could harm our business.
We serve St. Petersburg-Clearwater International Airport, which is not the principal airport in the Tampa Bay market. A refusal by passengers to view the St. Petersburg-Clearwater International Airport as a reasonable alternative to Tampa International Airport, the main airport serving the Tampa Bay area, could harm our business.
We may face increased competition in our markets which could harm our business.
The small cities we serve on a scheduled basis have traditionally attracted considerably less attention from our potential competitors than larger markets, and in most of our markets, we are the only provider of nonstop service to Las Vegas, Orlando or Orlando.Tampa/St. Petersburg. It is possible other airlines will begin to provide nonstop services to and from these markets or otherwise target these markets. An increase in the amount of direct or indirect competition could harm our business.
We may be unable to renew our lease or increase our facilities at Las Vegas' McCarran International Airport.
McCarran International Airport iswas the 9th busiest airport in the world in 2005 and its gate space, terminal space, aircraft parking space and facilities in general are constrained. To meet our growth plan, we will require additional facilities at McCarran. However, we may not be able to maintain sufficient or obtain additional facilities at McCarran on favorable terms, or at all. In addition, our present agreement can be terminated at any time upon 30 days' notice. Since Las Vegas is one of our principal destinations, our inability to maintain sufficient facilities or to obtain additional facilities as needed would harm our business by limiting our ability to grow and increasing our costs.
We also currently rely on the availability of overnight aircraft parking space at McCarran. However, due to anticipated airport growth, we may find it difficult to obtain sufficient overnight aircraft parking space in the future. Over time, this may result in our having to overnight aircraft in other cities, which would increase our costs and could adversely impact our business and results of operations.
Our business could be harmed if we lose the services of our key personnel.
Our business depends upon the efforts of our chief executive officer, Maurice J. Gallagher, Jr., and a small number of management and operating personnel. We do not currently have an employment agreementsagreement with or maintain key-man life insurance on Mr. Gallagher or our other executive officers.Gallagher. We may have difficulty replacing management or other key personnel who leave and, therefore, the loss of the services of any of these individuals could harm our business.
Our results of operations will fluctuate.
We expect our quarterly operating results to fluctuate in the future based on a variety of factors, including:
In addition, seasonal variations in traffic, the timing of significant repair events and weather affect our operating results from quarter to quarter. Quarter-to-quarter comparisons of our operating results may not be good indicators of our future performance. In addition, it is possible our operating results in any future quarter could be below the expectations of investors and any published reports or analyses regarding Allegiant. In that event, the price of our common stock could decline, perhaps substantially.
Due to our limited fleet size, if any of our aircraft becomes unavailable, we may suffer greater damage to our service, reputation and profitability than airlines with larger fleets.
We operate a fleet of 2122 aircraft. Given the limited number of aircraft we operate, if an aircraft becomes unavailable due to unscheduled maintenance, repairs or other reasons, we could suffer greater adverse financial and reputational impacts than larger airlines if our flights are delayed or cancelled due to the absence of replacement aircraft. Our business strategy involves concentrating our aircraft overnight at our destination airports. If we are unable to operate those aircraft for a prolonged period of time for reasons outside of our control, for example, a catastrophic event or a terrorist act, our results of operations and business could be disproportionately harmed.
We rely heavily on automated systems to operate our business and any failure of these systems could harm our business.
We depend on automated systems to operate our business, including our computerized airline reservation system, our telecommunication systems, our website and other automated systems. We rely on a single vendor to support many of these systems.systems and it would be difficult to readily replace this vendor on whom we have relied since our inception. A failure of this vendor to satisfactorily service our automation needs could negatively affect our Internet sales and customer service and result in increased costs.
Unlike many other airlines, which issue traditional paper tickets to some or all of their passengers, we issue only electronic tickets. Our website and reservation system must be able to accommodate a high volume of traffic and deliver important flight information. Substantial or repeated website, reservations system or telecommunication systems failures or a failure by our vendor could reduce the attractiveness of our services. Any disruption in these systems could result in the loss of important data, increase our expenses and generally harm our business.
Currently, our fixed fee flying business is substantially dependent on a single customer and the loss of this business could have a material adverse effect on our continuing fixed fee contract revenue.
During 2005, 64.4% of our fixed fee contract revenue was derived from Harrah's Entertainment Inc. We provide these services under contracts which expire in December 2008. If Harrah's suffers a decline in business, decides to change its strategy or otherwise decides to reduce or terminate the fixed fee flying services provided by us, our revenues from fixed fee flying operations could be adversely affected.
If we are unable to attract and retain qualified personnel at reasonable costs or fail to maintain our company culture, our business could be harmed.
Our business is labor intensive, with labor costs representing 17.5%15.1% of our operating expenses for the yearnine months ended December 31, 2005.September 30, 2006. We expect wages and benefits to increase on a gross basis; these costs could also increase as a percentage of our overall costs, which could harm our business. Our expansion plans will require us to hire, train and retain a significant number of new employees in the future. From time to time, the airline industry has experienced a shortage of personnel licensed by the FAA, especially pilots and mechanics. We compete against other U.S. airlines for labor in these highly skilled positions. Many U.S. airlines offer wage and benefit packages that exceed our wage and benefit packages. As a result, in the future, we may have to significantly increase wages and benefits in order to attract and retain qualified personnel or risk considerable employee turnover. If we are unable to hire, train and retain qualified employees at a reasonable cost, we may be unable to complete our expansion plans and our business could be harmed.
In addition, as we hire more people and grow, we believe it may be increasingly challenging to continue to hire people who will maintain our company culture. One of our principal competitive strengths is our service-oriented company culture that emphasizes friendly, helpful, team-oriented and customer-focused employees. Our company culture is important to providing high quality customer service and having a highly productive workforce that helps keep our costs low. As we grow, we may be unable to identify, hire or retain enough people who meet the above criteria, and our company culture could otherwise be adversely affected by our growing operations and geographic diversity. If we fail to maintain the strength of our company culture, our competitive ability and business may be harmed.
We rely on third parties to provide us with facilities and services that are integral to our business and can be withdrawn on short notice.
We have entered into agreements with more than 30 third-party contractors, including other airlines, to provide certain facilities and services required for our operations, such as aircraft maintenance, ground handling, flight dispatch, baggage services and ticket counter space. We will likely need to enter into similar agreements in any new markets we decide to serve. All of these agreements are subject to termination upon short notice. TheAlthough we believe there are alternative service providers available to perform these services for us in the event of a contract termination or failure by a service provider, the loss or expiration of these contracts, the loss of FAA certification by our outside maintenance providers or any inability to renew our contracts or negotiate contracts with other providers at comparable rates could harm our business. Our reliance uponon others to provide essential services on our behalf also gives us less control over costs and the efficiency, timeliness and quality of
contract services. Recently, failures by our flight dispatch vendor significantly delayed all of our flights on a particular day. Although we seek to have redundant processes in place to protect against such failures, we remain subject to the performance by our outside vendors.
Imposition of additional sales and hotel occupancy and other related taxes may increase our expenses.
Currently, hotels collect and remit hotel occupancy and related taxes to the various tax authorities based on the amounts collected by the hotels. Consistent with this practice, we recover the taxes on the underlying cost of the hotel room night from customers and remit the taxes to the hotel operators for payment to the appropriate tax authorities. We understand some jurisdictions have indicated to the public that they may take the position that sales or hotel occupancy tax may also be applicable to the differential between the price paid by a customer for our service and the cost to us for the underlying room. Historically, we have not collected taxes on this differential. Some state and local jurisdictions could assert we are subject to hotel occupancy taxes on this differential and could seek to collect such taxes, either retroactively or prospectively or both. Such actions may result in substantial liabilities for past sales and could have a material adverse effect on our business and results of operations. To the extent any tax authority succeeds in asserting such a tax collection responsibility exists, it is likely, with respect to future transactions, we would collect any such additional tax obligation from our customers, which would increase the price of hotel room nights we charge our customers and, consequently, could reduce hotel sales and our profitability. We will continue to assess the risks of the potential financial impact of additional tax exposure, and to the extent appropriate, reserve for those estimates of liabilities.
We employ a non-traditional distribution system, which could negatively affect our ability to sell our services.
We employ a computerized airline reservation system designed to meet our specifications. Under this system, we do not issue paper airline tickets. Furthermore, we do not participate in the global airline reservation systems such as Sabre or Galileo,Worldspan, nor can travel on us be purchased underthrough Expedia, Travelocity, or similar air travel services. The inability to make reservations for travel on us through the global reservation systems or travel websites may harm our competitive position. Alternatively, if we decide to later participate in the global reservation systems or travel websites, we would be forced to pay fees charged by these systems or websites. As a result, our costs would increase and this may adversely affect our business and results of operations.
Our processing, storage, use and disclosure of personal data could give rise to liabilities as a result of governmental regulation, conflicting legal requirements or differing views of personal privacy rights.
In the processing of our customer transactions, we receive and store a large volume of identifiable personal data. This data is increasingly subject to legislation and regulation. This government action is typically intended to protect the privacy of personal data that is collected, processed and transmitted. We could be adversely affected if legislation or regulations are expanded to require changes in our business practices in ways that negatively affect our business, financial condition and results of operations. As privacy and data protection become more sensitive issues, we may also become exposed to potential liabilities as a result of differing views on the privacy of travel data. These and other privacy developments are difficult to anticipate and could adversely affect our business, financial condition and results of operations.
The Internet as a medium for commerce is subject to uncertainty.
Consumer use of the Internet as a medium for commerce is subject to uncertainty. While the number of Internet users has been rising, the Internet infrastructure may not expand fast enough to meet the increased levels of demand. In addition, activities that diminish the experience for Internet
users, such as spyware, spoof emails, viruses and spam directed at Internet users, as well as viruses and "denial of service" attacks directed at Internet companies and service providers, may discourage people from using the Internet, including for commerce. If consumer use diminishes or grows at a slower rate, then our business and results of operations could be adversely affected.
Our lack of a marketing alliance and frequent flyer program could harm our business and competitive ability.position.
Many airlines have marketing alliances with other airlines, under which they market and advertise their status as marketing alliance partners. Among other things, they share the use of two-letter flight designator codes to identify their flights and fares in the computerized reservation systems, and permit reciprocity in their frequent flyer programs. Our business and competitive ability could be harmed since we are not a member of any marketing alliance. In addition, our lack of a frequent flyer program could harm our business and competitive ability.position.
We will be controlled by our management as long as they own or control a majority of our common stock, and they may make decisions with which you disagree.
After the completion of this offering, the members of our board of directors and our executive officers will own beneficially approximately %at least 59% of the outstanding shares of our common stock, or approximately %at least 56% if the underwriters exercise in full their option to purchase additional shares. As a result, our management will control all matters affecting us, including the election of directors as long as they continue to own or control a majority of our common stock. They may make decisions you and other stockholders will not be able to affect by voting your shares.
The historical consolidated financial information in this prospectus does not reflect the added costs and internal control reporting standards we expect to incur or will be required to comply with as a public company or the resulting changes that will occur in our capital structure and operations.
We will face increased legal, accounting, administrative and other expenses as a public company we did not incur as a private company. The Sarbanes-Oxley Act of 2002 (the "Sarbanes-Oxley Act"), as well as new rules subsequently implemented by the Securities and Exchange Commission ("SEC" or the "Commission"), the Public Company Accounting Oversight Board ("PCAOB") and the Nasdaq National Market, require changes in the corporate governance practices of public companies. We expect these new rules and regulations to result in both a significant initial cost, as we initiate certain internal controls and other procedures
designed to comply with the requirements of the Sarbanes-Oxley Act, and an ongoing increase in our legal, audit and financial compliance costs. Compliance will also divert management attention from operations and strategic opportunities and will make legal, accounting and administrative activities more time-consuming and costly. We also expect to incur substantially higher costs to maintain directors and officers insurance. We currently anticipate increased annual costs following this offering and we expect to incur additional costs during the first year following the offering in implementing and verifying internal control procedures as required by Section 404 of the Sarbanes-Oxley Act, and the rules and regulations thereunder, and in connection with preparing our financial statements on a timely basis to meet the SEC's reporting requirements.
We will be required to furnish a report by our management on our internal control over financial reporting. This report will contain, among other matters, an assessment of the effectiveness of our internal controls over financial reporting as of the end of each fiscal year, including a statement as to whether or not our internal controls over financial reporting are effective. Any failure to implement and maintain effective controls over our financial reporting, or difficulties encountered in the implementation of these controls, could result in a material misstatement to the annual or interim financial statements that could cause us to fail to meet our reporting obligations under applicable securities laws. Any failure to maintain our internal controls could result in our incurring substantial
liability for not having met our legal obligations and could also cause investors to lose confidence in our reported financial information, which could have a negative impact on the trading price of our stock. Similar adverse effects could result if our auditors express an adverse opinion or disclaim or qualify an opinion on management's assessment or on the effectiveness of our internal control over financial reporting.
In addition, we will be required under these new rules and regulations to attract and retain independent directors to serve on our board of directors and our audit committee, in particular. If we fail to retain independent directors, we may be subject to SEC enforcement proceedings and delisting by the Nasdaq National Market.
Because we were a limited liability company prior to our transition to corporate form, we paid minimal taxes on profits. In preparing our unaudited pro forma condensed consolidated financial information, we deducted and charged to earnings estimated statutory income taxes based on an estimated blended tax rate, which may be different from our actual tax rate in the future. The estimates we used in our unaudited pro forma consolidated financial information may not be similar to our actual experience as a public corporation. For more information on our historical financial statements and unaudited pro forma condensed consolidated financial information, see "Unaudited Pro Forma Condensed Consolidated Financial Information" and our historical consolidated financial statements and related notes included elsewhere in this prospectus.
We may be required to make substantial payments under certain indemnification agreements.
In connection with this offering and our conversion to corporate form, we will enter into agreements that provide for the indemnification of our members, managers, officers and certain other persons authorized to act on our behalf against certain losses that may arise out of this offering or the reorganization transactions, and certain tax liabilities of our members that may arise in respect of periods prior to this offering when we operated as a limited liability company. We may be required to make substantial payments under these indemnification agreements, which could adversely affect our financial condition. For more information on our indemnification arrangements, see "Related Party Transactions—Reorganization Transactions" and "Related Party Transactions—Tax Indemnification Agreement and Related Matters."
Failure to achieve and maintain effective internal control over financial reporting in accordance with Section 404 of the Sarbanes-Oxley Act could have a material adverse effect on our business and stock price, and could subject us to liability.
Once we become a public company, Section 404 of the Sarbanes-Oxley Act and the related rules of the Securities and Exchange Commission will require our management to conduct annual assessments of the effectiveness of our internal control over financial reporting and will require a report by our independent registered public accounting firm addressing these assessments, beginning as early as our fiscal year ending December 31, 2007. During the course of documenting and testing our internal control procedures to satisfy the requirements of Section 404, we may identify deficiencies which we may not be able to remediate in time to meet the deadline imposed by the Sarbanes-Oxley Act for compliance with the requirements of Section 404. In addition, if we fail to maintain the adequacy of our internal control over financial reporting, as these standards are modified, supplemented or amended from time to time, we may not be able to conclude on an ongoing basis that we have effective internal control over financial reporting in accordance with Section 404. If we fail to achieve and maintain an effective internal control environment, we could suffer material misstatements in our financial statements and fail to meet our reporting obligations, which would likely cause investors to lose confidence in our reported financial information. This could harm our operating results and lead to a decline in our stock price. Additionally, ineffective internal control over financial reporting could
expose us to increased risk of fraud or misuse of corporate assets and subject us to potential delisting from the Nasdaq National Market, regulatory investigations and civil or criminal sanctions.
Changing laws, rules and regulations, and legal uncertainties relating to the way we do business may adversely impact our business, financial condition and results of operations.
Unfavorable changes in existing, or the promulgation of new, laws, rules and regulations applicable to us, including those relating to the Internet and online commerce, consumer protection and privacy, and sales, use, occupancy, value-added and other taxes, could decrease demand for our products and services, increase our costs and/or subject us to additional liabilities, which could adversely impact our business. For example, there is, and will likely continue to be, an increasing number of laws and regulations pertaining to Internet and online commerce, which may relate to liability for information retrieved from or transmitted over the Internet, user privacy, taxation and the quality of products and services. Furthermore, the growth and development of online commerce may prompt calls for more stringent consumer protection laws that may impose additional burdens on online businesses generally.
In addition, the application of various sales, use, occupancy, value-added and other tax laws, rules and regulations to our products and services is subject to interpretation by the applicable taxing authorities. While we believe we are compliant with these tax provisions, we cannot assure you taxing authorities will not take a contrary position, or that such positions willwould not have an adverse effect on our business, financial condition and results of operations.
Risks Associated with the Airline and Travel Industry
The airline industry has incurred significant losses resulting in airline restructurings and bankruptcies, which could result in changes in our industry.
We believe airline traffic is particularly sensitive to changes in economic growth and expectations. In addition, the war in Iraq or other conflicts or events in the Middle East or elsewhere may impact the economy and result in an adverse impact on the airline business. In 2005, the domestic airline industry reported its fifth consecutive year of losses, which is causing significant changes in the industry. Low fares and escalating fuel prices contributed to these losses. As a result, many airlines are renegotiating or attempting to renegotiate labor contracts, reconfiguring flight schedules, furloughing or terminating employees, as well as considering other efficiency and cost-cutting measures. Despite these
actions, several airlines have sought reorganization under Chapter 11 of the U.S. Bankruptcy Code permitting them to reduce labor rates, restructure debt, terminate pension plans and generally reduce their cost structure. Additionally, other airlines have consolidated in an attempt to lower costs and rationalize their route structures in order to improve their results. It is foreseeable that further airline reorganizations, bankruptcies or consolidations may occur, the effects of which we are unable to predict. The occurrence of these events, or potential changes resulting from these events, may harm our business or the industry.
The airline industry is highly competitive, is characterized by low profit margins and high fixed costs, and we may be unable to compete effectively against other airlines with greater financial resources or lower operating costs.
The airline industry is characterized generally by low profit margins and high fixed costs, primarily for personnel, aircraft fuel, debt service and rent.aircraft lease rentals. The expenses of an aircraft flight do not vary significantly with the number of passengers carried and, as a result, a relatively small change in the number of passengers or in pricing could have a disproportionate effect on an airline's operating and financial results. Accordingly, a minor shortfall in expected revenue levels could harm our business.
In addition, the airline industry is highly competitive and is particularly susceptible to price discounting because airlines incur only nominal costs to provide service to passengers occupying
otherwise unsold seats. Although there isWe currently other competingface nonstop servicecompetition on only sixthree of our routes between ourfrom small city markets andcities to Las Vegas, Orlando or Orlando,Tampa/St. Petersburg, and we will face competition on one other route we will begin to serve in December 2006. However, competing airlines provide connecting service to these destinationson many of our routes or serve nearby airports. In addition, we cannot assure you other airlines will not begin to provide nonstop service in the future on the routes we currently serve. Indeed, competitors have recently announced competing nonstop service on two of our routes to start in first quarter 2007, and we have faced other competing services in the past. Many of these competing airlines are larger and have significantly greater financial resources and name recognition. We may, therefore, be unable to compete effectively against other airlines that introduce service or discounted fares in the markets we serve.
A future act of terrorism, the threat of such acts or escalation of U.S. military involvement overseas could adversely affect our industry.
Even if not directed at the airline industry, a future act of terrorism, the threat of such acts or escalation of U.S. military involvement overseas could have an adverse effect on the airline industry. In the event of a terrorist attack, the industry would likely experience significantly reduced demand for our travel services. These actions, or consequences resulting from these actions, would likely harm our business and the airline and travel industry.
Changes in government regulations imposing additional requirements and restrictions on our operations could increase our operating costs and result in service delays and disruptions.
Airlines are subject to extensive regulatory and legal compliance requirements, both domestically and internationally, that involve significant costs. In the last several years, the FAA has issued a number of directives and other regulations relating to the maintenance and operation of aircraft, including rules regarding assumed average passenger weight, that have required us to make significant expenditures. FAA requirements cover, among other things, retirement of older aircraft, security measures, collision avoidance systems, airborne windshear avoidance systems, noise abatement, weight and payload limits, and increased inspection and maintenance procedures to be conducted on olderaging aircraft.
We incur substantial costs in maintaining our current certifications and otherwise complying with the laws, rules and regulations to which we are subject. We cannot predict whether we will be able to comply with all present and future laws, rules, regulations and certification requirements or that the cost of continued compliance will not significantly increase our costs of doing business.
The FAA has the authority to issue mandatory orders relating to, among other things, the grounding of aircraft, inspection of aircraft, installation of new safety-related items and removal and replacement of aircraft parts that have failed or may fail in the future. A decision by the FAA to ground, or require time consuming inspections of or maintenance on, all or any of our MD80 series aircraft, for any reason, could negatively impact our results of operations. In addition to state and federal regulation, airports and municipalities enact rules and regulations that affect our operations.
Additional laws, regulations, taxes and airport rates and charges have been proposed from time to time that could significantly increase the cost of airline operations or reduce revenues. For example, the FAA has recently adopted regulations requiring airlines to monitor the compliance with drug testing standards of all mechanics and maintenance personnel, including those of third party vendors. In addition, as a result of the terrorist attacks in New York and Washington, D.C. in September 2001, the FAA and the Transportation Security Administration ("TSA") have imposed more stringent security procedures on airlines. We cannot predict what other new regulations may be imposed on airlines and we cannot assure you these laws or regulations, or any laws or regulations enacted in the future, will not materially adversely affect our financial condition, results of operations.
Our ability to operate as an airline is dependent upon our maintaining certifications issued to us by the Department of Transportation ("DOT") and the FAA. Federal law requires that air carriers operating large aircraft, such as our MD80 series aircraft, be continuously "fit, willing and able" to provide the services for which they are licensed. Our "fitness" is monitored by the DOT, which considers factors such as consumer-relations practices, legal and regulatory compliance disposition, financial resources and U.S. citizenship in making its determinations. While DOT has seldom revoked a carrier's certification for lack of fitness, such an occurrence would render it impossible for us to continue operating as an airline. Similarly, in a worst-case scenario, the FAA could restrict or suspend our ability to operate as an airline, and could do so on an emergency basis with little or no advance warning, in the event the FAA should consider our operations unsafe. While under such circumstances we would have a right to expedited judicial review of the legality of the FAA's actions, such a development would likely harm our business severely regardless of the outcome of such review.
In the event we elect in the future to expand our scheduled service offerings into international markets, we would be subject to increased regulation by U.S. and foreign aeronautical authorities as well as customs, immigration and other border-protection agencies. Additionally, there is no assurance we would be able to obtain the right to serve all routes we may wish to serve. These factors, alone or in combination, could materially adversely affect any international scheduled service we may choose to pursue in the future.
Airlines are often affected by factors beyond their control, including traffic congestion at airports, weather conditions, increased security measures or the outbreak of disease, any of which could harm our operating results and financial condition.
Like other airlines, we are subject to delays caused by factors beyond our control, including air traffic congestion at airports, adverse weather conditions, increased security measures or the outbreak of disease. Delays frustrate passengers and increase costs, which in turn could affect profitability. During periods of fog, snow, rain, storms or other adverse weather conditions, flights may be cancelled or significantly delayed. Cancellations or delays due to weather conditions, traffic control problems and breaches in security could harm our operating results and financial condition. An outbreak of a disease that affects travel behavior, such as severe acute respiratory syndrome ("SARS") or avian flu, could have a material adverse impact on the airline industry. Any general reduction in airline passenger traffic as a result of an outbreak of disease could harm our business, financial condition and results of operations.
The airline and travel industry tends to experience adverse financial results during general economic downturns.
Since a substantial portion of airline travel, for both business and leisure, is discretionary, the airline and travel industries tend to experience adverse financial results during general economic downturns. Any general reduction in airline passenger traffic would likely harm our business.
Risks Related to this Offering
There has been no prior market for our common stock and our stock may experience extreme price and volume fluctuations.
After this offering, an active trading market in our common stock might not develop or continue. If a market does not develop or is not sustained, it may be difficult for you to sell your shares of common stock at a price that is attractive to you, or at all. The initial public offering price of our common stock has been determined through negotiations between the representatives of the underwriters and us and may not be representative of the price that will prevail after this offering.
The market price of our common stock may be volatile, which could cause the value of your investment in Allegiant to decline.
The market price of our common stock may fluctuate substantially due to a variety of factors, many of which are beyond our control, including:
The stock markets in general have experienced substantial volatility that has often been unrelated to the operating performance of particular companies. These types of broad market fluctuations may adversely affect the trading price of our common stock.
In the past, stockholders have sometimes instituted securities class action litigation against companies following periods of volatility in the market price of their securities. Any similar litigation against us could result in substantial costs, divert management's attention and resources, and harm our business or results of operations.
You will suffer immediate and substantial dilution.
The initial public offering price of our common stock is substantially higher than the net tangible book value per share of our outstanding common stock, which results in immediate and substantial dilution. The net tangible book value of a share of our common stock purchased at an initial public offering price of $ ,$16.00, the midpoint of the range set forth on the cover page of this prospectus, will be only $ ,$6.72, resulting in immediate dilution of $$9.28 per share. Additional dilution may be incurred if we issue additional shares of common stock in the future or if stock options or warrants
with an exercise price less than the initial public offering price, whether currently outstanding or subsequently granted, are exercised.
Other companies may have difficulty acquiring us, even if doing so would benefit our stockholders, due to provisions under our corporate charter, bylaws and option plans, as well as Nevada law.
Provisions in our articles of incorporation, our bylaws, and under Nevada law could make it more difficult for other companies to acquire us, even if doing so would benefit our stockholders. Our articles of incorporation and bylaws contain the following provisions, among others, which may inhibit an acquisition of our company by a third party:
We are also subject to provisions of Nevada law that prohibit us from engaging in any business combination with any "interested stockholder," meaning generally that a stockholder who beneficially
owns more than 10% of our stock cannot acquire us for a period of time after the date this person became an interested stockholder, unless various conditions are met, such as approval of the transaction by our board of directors. For a more complete discussion of these provisions of Nevada law, please see "Description of Capital Stock—Anti-Takeover Effects of Certain Provisions of Nevada Law and our Articles of Incorporation and Bylaws."
Under U.S. laws and the regulations of the DOT, U.S. citizens must effectively control us. As a result, our president and at least two-thirds of our board of directors must be U.S. citizens and not more than 25% of our voting stock may be owned by non-U.S. citizens (although subject to DOT approval, the percent of foreign economic ownership may be as high as 49%). Any of these restrictions could have the effect of delaying or preventing a change in control.
In addition, options under our Long-Term Incentive Plan may have a special acceleration feature pursuant to which those options will vest in full in the event we are acquired. The accelerated vesting of our employee stock options may prove to be a deterrent to a potential acquisition of us because the acquiring company may have to implement additional retention programs to ensure the continued service of our employees, and the additional dilution that will result from the accelerated vesting of our outstanding employee stock options will likely reduce the amount otherwise payable to our stockholders in an acquisition. For a more complete discussion of our plans, see "Management—Employee Benefit Plans."
Our corporate charter and bylaws include provisions limiting voting by non-U.S. citizens.
To comply with restrictions imposed by federal law on foreign ownership of U.S. airlines, our articles of incorporation and bylaws restrict voting of shares of our capital stock by non-U.S. citizens. The restrictions imposed by federal law currently require no more than 25% of our stock be voted, directly or indirectly, by persons who are not U.S. citizens, and that our president and at least two-thirds of the members of our board of directors be U.S. citizens. Our bylaws provide no shares of our capital stock may be voted by or at the direction of non-U.S. citizens unless such shares are registered on a separate stock record, which we refer to as the foreign stock record. Our bylaws further provide no shares of our capital stock will be registered on the foreign stock record if the amount so registered would exceed the foreign ownership restrictions imposed by federal law. Registration on the foreign stock record is made in chronological order based on the date we receive a written request for registration. See "Business—Government Regulation—Foreign Ownership" and "Description of Capital Stock—Anti-Takeover Effects of Certain Provisions of Nevada Law and Our Articles of Incorporation
and Bylaws—Limited Voting by Foreign Owners." One of our significant stockholders, Viva Air Limited, is a non-U.S. citizen and will own approximately %at least 5.6% of our outstanding common stock after this offering. See "Principal and Selling Stockholders." Other non-U.S. citizens will be able to own and vote shares of our common stock, only if the combined ownership by all non-U.S. citizens does not violate these requirements.
Substantial sales of our common stock after this offering could cause our stock price to fall.
If our existing stockholders sell a large number of shares of our common stock or the public market perceives existing stockholders might sell shares of common stock, the market price of our common stock could decline significantly. The shares sold in this offering will be freely tradable without restriction or further registration under the federal securities laws, unless purchased by our "affiliates" as that term is defined in Rule 144 under the Securities Act of 1933, as amended, or the Securities Act. In addition, a substantial number of shares held by our current stockholders or issuable upon exercise of options are eligible for sale and could be sold pursuant to registration under the Securities Act or an exemption from registration. We, our executive officers and directors and substantially all of our existing stockholders have agreed not to sell or transfer any common stock or securities convertible into, exchangeable for, exercisable for, or repayable with common stock, for 180 days after the date of
this prospectus without first obtaining the written consent of Merrill Lynch. Immediately following this offering, we will have outstanding 19,045,933 shares of common stock. Of these shares, the 5,000,000 shares of common stock sold in this offering will initially be freely tradable, without restriction, in the public market. After the lock-up agreements pertaining to this offering expire 180 days from the date of this prospectus, an additional 12,195,933 shares of common stock (13,945,933 shares if the sale to PAR fails to close) will be eligible for sale in the public market at various times, subject, in some cases, to volume limitations under Rule 144 of the Securities Act of 1933, as amended. For a more detailed description, please see "Shares Eligible for Future Sale" and "Underwriting—No Sales of Similar Securities."
We cannot predict whether future sales of our common stock or the availability of our common stock for sale will adversely affect the market price for our common stock or our ability to raise capital by offering equity securities.
Registration of shares of our common stock subject to registration rights may depress the trading price of our stock.
We entered into an investors agreement with our existing preferred stockholders and PAR. After this offering, the holders of up to 7,612,600 shares of common stock will be entitled to registration rights pursuant to the investors agreement with respect to their shares. The investors agreement provides, among other things, that holders of 25% of the securities with registration rights can require us, subject to certain limitations, to register with the Commission all or a portion of their shares of common stock following six months after this offering. Additionally, these stockholders may also require us, subject to certain limitations, to include their shares in future registration statements we file. In addition, we have agreed with PAR to file by February 9, 2007, a shelf registration statement covering their 1,750,000 shares of common stock and to keep the registration statement in effect for up to two years after the date of the purchase of their shares. Upon any of these registrations, these shares would be freely tradable in the public market without restrictions. If these stockholders exercise these or other similar rights under the investors agreement to sell substantial amounts common stock in the public market, or if it is perceived that such exercise or sale could occur, the market price of our common stock may fall. See "Description of Capital Stock—Registration Rights" for a summary of the terms of the registration rights included in the investors agreement.
COMPANY HISTORY AND REORGANIZATION
Company History
We were founded in 1997 and initially operated as Allegiant Air, Inc. under a different business strategy with a different management team. This strategy was ultimately unsuccessful, and we filed for bankruptcy court protection in December 2000. A plan of reorganization was approvedconfirmed in June 2001. The key elements of the plan were: (i) debt held by Maurice J. Gallagher, Jr. was restructured and Mr. Gallagher injected additional capital into our company; (ii) Mr. Gallagher became our majority owner; and (iii) a new management team led by Mr. Gallagher was installed in June 2001. The reorganization plan was confirmed in June 2001, and weWe emerged from bankruptcy in March 2002. Allegiant Air, Inc. elected to be taxed as a subchapter S corporation. In May 2004, Allegiant Air, Inc. merged into Allegiant Air, LLC to change our entity type and state of organization. In May 2005, we created a holding company format under which Allegiant Travel Company, LLC was formed coincident with our issuance of preferred shares to outside investors. In anticipation of this offering, Allegiant Travel Company, LLC will merge into the corporate entity issuing shares in this offering as discussed below.
Reorganization
Prior to the completion of this offering, we intend to convert from a Nevada limited liability company to a Nevada corporation. In connection with the conversion, our common shares and preferred shares will be exchanged for shares of our common stock, pursuant to the terms of a merger agreement between Allegiant Travel Company, LLC and Allegiant Travel Company (a Nevada corporation). The reorganization will not affect our operations, which we will continue to conduct through our operating subsidiaries.
After our corporate reorganization, and the completion of this offering and the simultaneous sale of shares to PAR in a private transaction, our existing equity investors will own 12,195,933 shares of our common stock, representing 64.0% of the voting power of our outstanding capital stock. If the private sale does not close simultaneously with this offering, our existing equity investors willwould own 13,945,933 shares of our common stock, representing %73.6% of the voting power of our outstanding capital stock andupon completion of this offering.
Upon the completion of this offering, we will have no shares of preferred stock issued and outstanding. In the event the underwriters elect to exercise their overallotment option in full, the existing equity investors will sell an additional shares of common stock they received in connection with the reorganization. See "Principal and Selling Stockholders" for more information regarding the holders of our common stock.
Our net proceeds from the sale of common stock in this offering at an initial public offering price of $$16.00 per share, the midpoint of the range set forth on the cover page of this prospectus, will be $$73.0 million, or $$84.2 million if the underwriters exercise their overallotment option in full, after deducting the underwriting discounts and commissions and offering expenses payable by us. We intend to use $0.9 million of the net proceeds to retire secured debt to our chief executive officer, which bears interest at 8% per annum and would otherwise be due not later than April 30, 2007. The balance of the net proceeds from this offering will be used to purchase additional aircraft consistent with our growth strategy and acquisition criteria, and to fund working capital and general corporate purposes. Although we have no present commitments for the purchase of aircraft, we continue to seek to purchase suitable aircraft at reasonable prices to expand our business. We intend to apply proceeds of this offering to the purchase of aircraft as we identify aircraft for purchase in the future and to the extent we choose not to finance the purchase price. Pending the use of such net proceeds, we intend to invest these funds in investment-grade, short-term interest bearing securities.
We will not receive any proceeds from the sale of shares by the selling stockholders.
Other than distributions paid or to be paid to our owners to defray the income taxes payable by them with respect to our taxable income while we were a pass-through entity for income tax purposes, we have not declared or paid any dividends on our equity since our inception. We do not intend to pay any dividends on our common stock in the foreseeable future. We currently intend to retain our future earnings, if any, to finance the further expansion and continued growth of our business.
The following table sets forth our capitalization as of December 31, 2005:September 30, 2006:
The number of shares of common stock to be outstanding after this offering reflects the conversion of the preferred shares on a 0.76 to 1 basis and excludes 389,000414,000 shares of common stock subject to outstanding options at a weighted average exercise price of $3.78$4.66 per share as of April 30,November 20, 2006, and warrants to purchase 162,500 shares of common stock at an exercise price of $4.40 per share.
The figures below assume no exercise of outstanding options.
You should read this table in conjunction with the "Selected Financial and Operating Data," "Management's Discussion and Analysis of Financial Condition and Results of Operations" and the financial statements and the notes to those statements, which are included elsewhere in this prospectus.
| | As of September 30, 2006 | ||||
|---|---|---|---|---|---|
| | Actual | Pro Forma As Adjusted | |||
| | (in thousands) | ||||
| Cash, cash equivalents and short-term investments | $44,980 | $117,089 | |||
Current maturities of long-term debt | 13,993 | 13,102 | |||
| Long-term debt, less current maturities | 48,221 | 48,221 | |||
| Redeemable convertible preferred shares | 39,540 | — | |||
Shareholders'/members' equity | |||||
| Common stock, par value $.001 per share | — | 19 | |||
| Contributed capital | 2,355 | — | |||
| Additional paid-in capital | — | 113,869 | |||
| Accumulated comprehensive income | 474 | 299 | |||
| Treasury shares | (1,007 | ) | — | ||
| Retained/undistributed earnings | 19,059 | 13,068 | |||
| Total shareholders'/members' equity | 20,881 | 127,255 | |||
| Total capitalization | $122,635 | $188,578 | |||
If you invest in our common stock in this offering, upon the completion of this offering, your interest will be diluted to the extent of the difference between the initial public offering price per share and the pro forma net tangible book value per share of our common stock.
Our net tangible book value as of September 30, 2006, was $60.4 million, or $9.39 per share of common stock calculated without regard to the conversion of our preferred shares. Our pro forma net tangible book value per share as of December 31, 2005,September 30, 2006, was $$54.3 million, or $$3.89 per share of common stock, after giving effect to the reorganization into a corporation, the conversion of all outstanding redeemable convertible preferred shares into shares of common stock immediately prior to the closing of this offering and the other Pro Forma Adjustments described under "Unaudited Pro Forma Condensed Consolidated Financial Information." Pro forma net tangible book value per share represents the amount of total tangible assets, less total liabilities, divided by the pro forma number of shares of our outstanding common stock. After giving effect to the sale of our common stock in this offering at an initial public offering price of $$16.00 per share, the midpoint of the range set forth on the cover page of this prospectus, and receipt of approximately $$73.0 million in net proceeds from this offering, our pro forma net tangible book value as of December 31, 2005September 30, 2006 would have been $$127.3 million, or $$6.72 per share, representing an immediate increase in the pro forma net tangible book value of $$2.83 to existing stockholders and an immediate dilution of $$9.28 per share to new investors purchasing our common stock in this offering. The following table illustrates this per share dilution:
| Assumed initial public offering price per share | $ | 16.00 | |||
| Pro forma net tangible book value per share as of September 30, 2006 | $3.89 | ||||
| Increase in pro forma net tangible book value per share attributable to new investors | 2.83 | ||||
| Pro forma net tangible book value per share after this offering | 6.72 | ||||
| Dilution per share to new investors | $9.28 | ||||
The following table summarizes, on the pro forma basis described above as of December 31, 2005,September 30, 2006, the difference between the number of shares of common stock purchased from us, the total consideration paid to us, and the average price per share paid, by existing stockholders and by new investors, at an assumed initial public offering price of $$16.00 per share before deducting underwriting discounts and commissions and offering expenses payable by us:
| | Shares Purchased | Total Consideration | | |||||||||
|---|---|---|---|---|---|---|---|---|---|---|---|---|
| | Average Price Per Share | |||||||||||
| | Number | Percent | Amount | Percent | ||||||||
| | (in thousands) | |||||||||||
| Existing stockholders | 13,945,933 | 73.6% | $41,257.3 | 34.0% | $2.96 | |||||||
| New investors | 5,000,000 | 26.4% | 80,000.0 | 66.0% | $ | 16.00 | ||||||
| Total | 18,945,933 | 100% | $ | 121,257.3 | 100% | $6.40 | ||||||
The tables and calculations above assume no exercise by the underwriters of their overallotment option and no exercise of stock options outstanding on December 31, 2005.September 30, 2006. As of December 31, 2005,September 30, 2006, there were 381,000414,000 shares of common stock subject to outstanding options at a weighted average exercise price of $3.59$4.66 per share and outstanding warrants to purchase 162,500 shares at an exercise price of $4.40 per share.
To the extent any of these options or warrants are exercised, there will be further dilution to new investors. If all of these outstanding options and warrants had been exercised as of December 31, 2005,September 30, 2006, our pro forma net tangible book value per share after this offering would be $$129.9 million and total dilution per share to new investors would be $$9.38 per share.
SELECTED FINANCIAL AND OPERATING DATA
You should read the following selected financial and operating data in conjunction with our financial statements and related notes and "Management's Discussion and Analysis of Financial Condition and Results of Operations" included elsewhere in this prospectus. The financial data for the period from January 1, 2001 through June 30, 2001, for the period from July 1, 2001 through December 31, 2001, as of December 31, 2001 and as of, and for the yearsyear ended December 31, 20012002 and 2002the nine months ended September 30, 2005 and 2006 are derived from our unaudited financial statements for such years.periods. The financial data as of, and for the years ended, December 31, 2003, 2004 and 2005 are derived from our audited financial statements appearing elsewhere in this registration statement.statement (except for balance sheet data as of December 31, 2003).
| | | | | | | | | | Nine Months Ended September 30, | |||||||||||||||||||||||||||
|---|---|---|---|---|---|---|---|---|---|---|---|---|---|---|---|---|---|---|---|---|---|---|---|---|---|---|---|---|---|---|---|---|---|---|---|---|
| | | | | | Year Ended December 31, | | | | | Year Ended December 31, | ||||||||||||||||||||||||||
| | | Predecessor January 1- June 30, 2001(2) | | Successor July 1- December 31, 2001(2) | | Predecessor January 1- June 30, 2001(2) | | Successor July 1- December 31, 2001(2) | Nine Months Ended September 30, | |||||||||||||||||||||||||||
| | | | 2002 | 2003 | 2004 | 2005 | | | 2002 | 2003 | 2004 | 2005 | 2005 | 2006 | ||||||||||||||||||||||
| | | (unaudited) | | (unaudited) | (unaudited) | | | | | (unaudited) | | (unaudited) | (unaudited) | | | | (unaudited) | |||||||||||||||||||
| | | (in thousands, except share and per share data) | | (in thousands, except share and per share data) | ||||||||||||||||||||||||||||||||
| Statement of Operations Data: | Statement of Operations Data: | Statement of Operations Data: | ||||||||||||||||||||||||||||||||||
| Operating revenue: | Operating revenue: | Operating revenue: | ||||||||||||||||||||||||||||||||||
| Scheduled service revenues | $1,254 | $1,244 | $6,007 | $22,515 | $46,236 | $90,664 | Scheduled service revenues | $1,254 | $1,244 | $6,007 | $22,515 | $46,236 | $90,664 | $61,003 | $131,729 | |||||||||||||||||||||
| Fixed fee contract revenues | 1,688 | 1,922 | 16,081 | 26,569 | 40,987 | 30,642 | Fixed fee contract revenues | 1,688 | 1,922 | 16,081 | 26,569 | 40,987 | 30,642 | 24,774 | 27,246 | |||||||||||||||||||||
| Ancillary revenues | 62 | 43 | 89 | 886 | 3,142 | 11,194 | Ancillary revenues | 62 | 43 | 89 | 886 | 3,142 | 11,194 | 6,669 | 21,239 | |||||||||||||||||||||
| Total operating revenue | Total operating revenue | 3,004 | 3,209 | 22,177 | 49,970 | 90,365 | 132,500 | Total operating revenue | 3,004 | 3,209 | 22,177 | 49,970 | 90,365 | 132,500 | 92,446 | 180,214 | ||||||||||||||||||||
| Operating expenses: | Operating expenses: | Operating expenses: | ||||||||||||||||||||||||||||||||||
| Aircraft fuel | 727 | 699 | 4,761 | 11,755 | 27,914 | 52,568 | Aircraft fuel | 727 | 699 | 4,761 | 11,755 | 27,914 | 52,568 | 34,599 | 77,661 | |||||||||||||||||||||
| Salary and benefits | 1,071 | 1,225 | 4,320 | 8,176 | 15,379 | 21,718 | Salary and benefits | 1,071 | 1,225 | 4,320 | 8,176 | 15,379 | 21,718 | 15,293 | 24,845 | |||||||||||||||||||||
| Station operations | 286 | 314 | 2,852 | 8,042 | 13,608 | 14,090 | Station operations | 286 | 314 | 2,852 | 8,042 | 13,608 | 14,090 | 10,262 | 18,730 | |||||||||||||||||||||
| Maintenance and repairs | 729 | 766 | 2,275 | 5,140 | 8,220 | 9,022 | Maintenance and repairs | 729 | 766 | 2,589 | 6,136 | 9,367 | 9,022 | 7,054 | 14,234 | |||||||||||||||||||||
| Sales and marketing | 28 | 73 | 632 | 2,385 | 3,548 | 5,625 | Sales and marketing | 28 | 73 | 632 | 2,385 | 3,548 | 5,625 | 3,923 | 6,955 | |||||||||||||||||||||
| Aircraft lease rentals | 885 | 459 | 3,033 | 3,137 | 3,847 | 4,987 | Aircraft lease rentals | 885 | 459 | 3,033 | 3,137 | 3,847 | 4,987 | 3,386 | 4,277 | |||||||||||||||||||||
| Depreciation and amortization | 240 | 125 | 260 | 1,181 | 2,183 | 5,088 | Depreciation and amortization | 240 | 125 | 260 | 1,181 | 2,183 | 5,088 | 3,578 | 7,599 | |||||||||||||||||||||
| Other | 1,484 | 1,060 | 4,661 | 6,258 | 8,441 | 10,901 | Other | 1,484 | 1,060 | 4,661 | 6,258 | 8,441 | 10,901 | 7,872 | 10,730 | |||||||||||||||||||||
| Total operating expense | Total operating expense | 5,450 | 4,721 | 22,794 | 46,074 | 83,140 | 123,999 | Total operating expense | 5,450 | 4,721 | 23,108 | 47,070 | 84,287 | 123,999 | 85,967 | 165,031 | ||||||||||||||||||||
| Operating income (loss) | Operating income (loss) | (2,446 | ) | (1,512 | ) | (617 | ) | 3,896 | 7,225 | 8,501 | Operating income (loss) | (2,446 | ) | (1,512 | ) | (931 | ) | 2,900 | 6,078 | 8,501 | 6,479 | 15,183 | ||||||||||||||
| Other (income) expense: | Other (income) expense: | Other (income) expense: | ||||||||||||||||||||||||||||||||||
| Gain on fuel derivatives, net | — | — | — | (314 | ) | (4,438 | ) | (612 | ) | (Gain)/loss on fuel derivatives, net | — | — | — | (314 | ) | (4,438 | ) | (612 | ) | (2,575 | ) | 2,927 | ||||||||||||||
| Other (income) expense, net | 489 | 609 | (9 | ) | (913 | ) | — | — | Other (income) expense, net | 489 | 609 | (9 | ) | (913 | ) | — | — | — | — | |||||||||||||||||
| Interest income | (1 | ) | (1 | ) | — | (9 | ) | (30 | ) | (1,225 | ) | Interest income | (1 | ) | (1 | ) | — | (9 | ) | (30 | ) | (1,225 | ) | (647 | ) | (2,043 | ) | |||||||||
| Interest expense | 13 | 127 | 367 | 831 | 1,399 | 3,009 | Interest expense | 13 | 127 | 367 | 831 | 1,399 | 3,009 | 1,968 | 3,970 | |||||||||||||||||||||
| Total other (income) expense | Total other (income) expense | 501 | 735 | 358 | (405 | ) | (3,069 | ) | 1,172 | Total other (income) expense | 501 | 735 | 358 | (405 | ) | (3,069 | ) | 1,172 | (1,254 | ) | 4,854 | |||||||||||||||
| Income (loss) before income taxes | Income (loss) before income taxes | (2,947 | ) | (2,247 | ) | (975 | ) | 4,301 | 10,294 | 7,329 | Income (loss) before income taxes | (2,947 | ) | (2,247 | ) | (1,289 | ) | 3,305 | 9,147 | 7,329 | 7,733 | 10,329 | ||||||||||||||
| Provision for state income taxes | Provision for state income taxes | 1 | — | 1 | 1 | 12 | 37 | Provision for state income taxes | 1 | 0 | 1 | 1 | 12 | 37 | 37 | 43 | ||||||||||||||||||||
| Net income (loss) | Net income (loss) | ($2,948 | ) | ($2,247 | ) | ($976 | ) | $4,300 | $10,282 | $7,292 | Net income (loss) | ($2,948 | ) | ($2,247 | ) | ($1,290 | ) | $3,304 | $9,135 | $7,292 | $7,696 | $10,286 | ||||||||||||||
| Earnings (loss) per share: | Earnings (loss) per share: | Earnings (loss) per share: | ||||||||||||||||||||||||||||||||||
| Basic | ($0.44 | ) | ($0.33 | ) | ($0.14 | ) | $0.64 | $1.53 | $1.11 | Basic | ($0.44 | ) | ($0.33 | ) | ($0.14 | ) | $0.49 | $1.36 | $1.11 | $1.17 | $1.60 | |||||||||||||||
| Diluted(1) | ($0.44 | ) | ($0.33 | ) | ($0.14 | ) | $0.64 | $1.53 | $0.56 | Diluted(1) | ($0.44 | ) | ($0.33 | ) | ($0.14 | ) | $0.49 | $1.36 | $0.56 | $0.64 | $0.62 | |||||||||||||||
| Other Financial Data: | |||||||||||||||||
| Operating margin | ($2,446 | ) | ($1,512 | ) | ($617 | ) | $3,896 | $7,225 | $8,501 | ||||||||
| Operating margin % | (81.4 | %) | (47.1 | %) | (2.8 | %) | 7.8 | % | 8.0 | % | 6.4 | % | |||||
| EBITDA (unaudited) | ($2,695 | ) | ($1,996 | ) | ($348 | ) | $6,304 | $13,846 | $14,201 | ||||||||
| EBITDAR (unaudited) | ($1,810 | ) | ($1,537 | ) | $2,685 | $9,441 | $17,693 | $19,188 | |||||||||
Net cash from: | |||||||||||||||||
| Operating activities | $4,172 | $10,484 | $44,027 | ||||||||||||||
| Investing activities | (7,380 | ) | (9,675 | ) | (47,706 | ) | |||||||||||
| Financing activities | 3,380 | 480 | 23,369 | ||||||||||||||
As of December 31, | |||||||||||
|---|---|---|---|---|---|---|---|---|---|---|---|
| | 2001 | 2002 | 2003 | 2004 | 2005 | ||||||
| | (unaudited) | (unaudited) | | | | ||||||
| | (in thousands) | ||||||||||
| Balance Sheet Data: | |||||||||||
| Cash, cash equivalents and investment securities | $66 | $108 | $280 | $1,569 | $53,325 | ||||||
| Total assets | 2,936 | 5,800 | 31,621 | 67,931 | 172,540 | ||||||
| Long-term debt (including capital leases) | 3,715 | 3,915 | 18,981 | 31,992 | 59,747 | ||||||
| Redeemable convertible preferred shares | — | — | — | — | 39,540 | ||||||
| Shareholders'/members' equity (deficit) | (2,253 | ) | (4,308 | ) | (713 | ) | 11,950 | 17,064 | |||
| Other Financial Data: | |||||||||||||||||||||
| Operating margin | ($2,446 | ) | ($1,512 | ) | ($931 | ) | $2,900 | $6,078 | $8,501 | $6,479 | $15,183 | ||||||||||
| Operating margin % | (81.4 | %) | (47.1 | %) | (4.2 | %) | 5.8 | % | 6.7 | % | 6.4 | % | 7.0 | % | 8.4 | % | |||||
| EBITDA (unaudited) | ($2,695 | ) | ($1,996 | ) | ($662 | ) | $5,308 | $12,699 | $14,201 | $12,632 | $19,855 | ||||||||||
Net cash provided by (used in): | |||||||||||||||||||||
| Operating activities | ($5,521 | ) | ($1,418 | ) | $1,686 | $4,172 | $10,484 | $44,027 | $35,007 | $24,306 | |||||||||||
| Investing activities | (728 | ) | (693 | ) | (1,844 | ) | (7,380 | ) | (9,675 | ) | (47,706 | ) | (41,678 | ) | (20,602 | ) | |||||
| Financing activities | 6,719 | 240 | 201 | 3,380 | 480 | 23,369 | 25,600 | (13,108 | ) | ||||||||||||
Year Ended December 31, | ||||||||||||
|---|---|---|---|---|---|---|---|---|---|---|---|---|
| | 2001 | 2002 | 2003 | 2004 | 2005 | |||||||
| Operating Statistics (unaudited): | ||||||||||||
| Total system statistics: | ||||||||||||
| Passengers | 59,958 | 200,872 | 472,078 | 840,939 | 1,199,574 | |||||||
| Revenue passenger miles (RPMs) (thousands) | 20,706 | 149,158 | 436,740 | 914,897 | 1,295,633 | |||||||
| Available seat miles (ASMs) (thousands) | 49,357 | 222,216 | 614,280 | 1,218,560 | 1,674,376 | |||||||
| Load factor | 42.0 | % | 67.1 | % | 71.1 | % | 75.1 | % | 77.4 | % | ||
| Operating revenue per ASM (cents) | 12.59 | 9.98 | 8.13 | 7.42 | 7.91 | |||||||
| Operating expense per ASM (cents) | 20.61 | 10.26 | 7.50 | 6.82 | 7.41 | |||||||
| Operating expense per ASM, excluding fuel (cents) | 17.72 | 8.12 | 5.59 | 4.53 | 4.27 | |||||||
| Departures | 1,346 | 3,308 | 5,307 | 8,369 | 11,646 | |||||||
| Block hours | 1,605 | 5,486 | 11,160 | 20,784 | 29,472 | |||||||
| Average stage length (miles) | 347 | 564 | 779 | 948 | 977 | |||||||
| Average number of operating aircraft during period | 1.4 | 2.8 | 4.8 | 8.0 | 13.3 | |||||||
| Total aircraft in service end of period | 1 | 3 | 7 | 9 | 17 | |||||||
| Full-time equivalent employees at period end | 52 | 107 | 282 | 391 | 596 | |||||||
| Fuel gallons consumed (thousands) | 1,391 | 4,548 | 10,490 | 19,789 | 28,172 | |||||||
| Average fuel cost per gallon | $1.03 | $1.05 | $1.12 | $1.41 | $1.87 | |||||||
Scheduled service statistics: | ||||||||||||
| Passengers | 32,941 | 83,779 | 260,850 | 535,602 | 969,393 | |||||||
| Revenue passenger miles (RPMs) (thousands) | 8,483 | 33,687 | 202,997 | 517,301 | 1,029,625 | |||||||
| Available seat miles (ASMs) (thousands) | 16,221 | 57,566 | 274,036 | 694,949 | 1,294,064 | |||||||
| Load factor | 52.3 | % | 58.5 | % | 74.1 | % | 74.4 | % | 79.6 | % | ||
| Departures | 606 | 1,433 | 2,553 | 4,803 | 8,388 | |||||||
| Block hours | 612 | 1,897 | 5,141 | 11,827 | 22,465 | |||||||
| Yield (cents) | 29.45 | 17.83 | 11.09 | 8.94 | 8.81 | |||||||
| Scheduled service revenue per ASM (cents) | 15.40 | 10.43 | 8.22 | 6.65 | 7.01 | |||||||
| Ancillary revenue per ASM (cents) | 0.65 | 0.15 | 0.32 | 0.45 | 0.87 | |||||||
| Total revenue per ASM (cents) | 16.05 | 10.59 | 8.54 | 7.11 | 7.87 | |||||||
| Average fare—scheduled service | $75.83 | $71.70 | $86.31 | $86.33 | $93.53 | |||||||
| Average fare—ancillary | $3.19 | $1.06 | $3.40 | $5.87 | $11.55 | |||||||
| Average fare—total | $79.02 | $72.76 | $89.71 | $92.19 | $105.07 | |||||||
| Average stage length (miles) | 258 | 403 | 725 | 913 | 1,045 | |||||||
| Percent of sales through website during period | — | — | 53.2 | % | 68.4 | % | 81.0 | % | ||||
| | | | | | | | As of September 30, 2006 Pro Forma As Adjusted* | ||||||||
|---|---|---|---|---|---|---|---|---|---|---|---|---|---|---|---|
| | As of December 31, | | |||||||||||||
| | As of September 30, 2006 | ||||||||||||||
| | 2001 | 2002 | 2003 | 2004 | 2005 | ||||||||||
| | (unaudited) | (unaudited) | | | | (unaudited) | (unaudited) | ||||||||
| | (in thousands) | ||||||||||||||
| Balance Sheet Data: | |||||||||||||||
| Cash, cash equivalents and short-term investments | $66 | $108 | $280 | $1,569 | $53,325 | $44,980 | $44,980 | ||||||||
| Total assets | 2,936 | 5,840 | 32,689 | 65,474 | 170,083 | 189,752 | 189,752 | ||||||||
| Long-term debt (including capital leases) | 3,715 | 3,915 | 18,981 | 31,992 | 59,747 | 48,221 | 48,221 | ||||||||
| Redeemable convertible preferred shares | — | — | — | — | 39,540 | 39,540 | — | ||||||||
| Shareholders'/members' equity (deficit) | (2,253 | ) | (2,951 | ) | 355 | 9,493 | 14,607 | 20,881 | 54,255 | ||||||
| | | | | | | | | Nine Months Ended September 30, | ||||||||||||
|---|---|---|---|---|---|---|---|---|---|---|---|---|---|---|---|---|---|---|---|---|
| | Predecessor January 1- June 30, 2001 | | | Year Ended December 31, | ||||||||||||||||
| | | Successor July 1- December 31, 2001 | ||||||||||||||||||
| | | 2002 | 2003 | 2004 | 2005 | 2005 | 2006 | |||||||||||||
| Operating Statistics (unaudited): | ||||||||||||||||||||
| Total system statistics: | ||||||||||||||||||||
| Passengers | 27,027 | 32,931 | 200,872 | 472,078 | 840,939 | 1,199,574 | 828,218 | 1,599,851 | ||||||||||||
| Revenue passenger miles (RPMs) (thousands) | 9,555 | 11,151 | 149,158 | 436,740 | 914,897 | 1,295,633 | 894,913 | 1,690,603 | ||||||||||||
| Available seat miles (ASMs) (thousands) | 22,807 | 26,550 | 222,216 | 614,280 | 1,218,560 | 1,674,376 | 1,156,170 | 2,136,309 | ||||||||||||
| Load factor | 41.9 | % | 42.0 | % | 67.1 | % | 71.1 | % | 75.1 | % | 77.4 | % | 77.4 | % | 79.1 | % | ||||
| Operating revenue per ASM (cents) | 13.17 | 12.09 | 9.98 | 8.13 | 7.42 | 7.91 | 8.00 | 8.44 | ||||||||||||
| Operating expense per ASM (cents) | 23.90 | 17.78 | 10.40 | 7.66 | 6.92 | 7.41 | 7.44 | 7.73 | ||||||||||||
| Operating expense per ASM, excluding fuel (cents) | 20.71 | 15.15 | 8.26 | 5.75 | 4.63 | 4.27 | 4.44 | 4.09 | ||||||||||||
| Departures | 552 | 794 | 3,308 | 5,307 | 8,369 | 11,646 | 8,142 | 14,632 | ||||||||||||
| Block hours | 688 | 917 | 5,486 | 11,160 | 20,784 | 29,472 | 20,390 | 37,454 | ||||||||||||
| Average stage length (miles) | 369 | 332 | 564 | 779 | 948 | 977 | 967 | 986 | ||||||||||||
| Average number of operating aircraft during period | 1.0 | 1.7 | 2.8 | 4.8 | 8.0 | 13.3 | 12.6 | 20.4 | ||||||||||||
| Total aircraft in service end of period | 1 | 1 | 3 | 7 | 9 | 17 | 15 | 21 | ||||||||||||
| Full-time equivalent employees end of period | 59 | 52 | 107 | 282 | 391 | 596 | 510 | 787 | ||||||||||||
| Fuel gallons consumed (thousands) | 563 | 556 | 4,548 | 10,490 | 19,789 | 28,172 | 19,535 | 35,658 | ||||||||||||
| Average fuel cost per gallon | $1.29 | $1.26 | $1.05 | $1.12 | $1.41 | $1.87 | $1.77 | $2.18 | ||||||||||||
Scheduled service statistics: | ||||||||||||||||||||
| Passengers | 16,631 | 16,310 | 83,779 | 260,850 | 535,602 | 969,393 | 645,988 | 1,408,738 | ||||||||||||
| Revenue passenger miles (RPMs) (thousands) | 4,291 | 4,192 | 33,687 | 202,997 | 517,301 | 1,029,625 | 679,957 | 1,483,902 | ||||||||||||
| Available seat miles (ASMs) (thousands) | 8,553 | 7,668 | 57,566 | 274,036 | 694,949 | 1,294,064 | 847,384 | 1,821,817 | ||||||||||||
| Load factor | 50.2 | % | 54.7 | % | 58.5 | % | 74.1 | % | 74.4 | % | 79.6 | % | 80.2 | % | 81.5 | % | ||||
| Departures | 298 | 308 | 1,433 | 2,553 | 4,803 | 8,388 | 5,553 | 11,967 | ||||||||||||
| Block hours | 302 | 310 | 1,897 | 5,141 | 11,827 | 22,465 | 14,686 | 31,776 | ||||||||||||
| Yield (cents) | 29.22 | 29.68 | 17.83 | 11.09 | 8.94 | 8.81 | 8.97 | 8.88 | ||||||||||||
| Scheduled service revenue per ASM (cents) | 14.66 | 16.22 | 10.43 | 8.22 | 6.65 | 7.01 | 7.20 | 7.23 | ||||||||||||
| Ancillary revenue per ASM (cents) | 0.72 | 0.56 | 0.15 | 0.32 | 0.45 | 0.87 | 0.79 | 1.17 | ||||||||||||
| Total revenue per ASM (cents) | 15.39 | 16.78 | 10.59 | 8.54 | 7.11 | 7.87 | 7.99 | 8.40 | ||||||||||||
| Average fare—scheduled service | $75.40 | $76.27 | $71.70 | $86.31 | $86.33 | $93.53 | $94.43 | $93.51 | ||||||||||||
| Average fare—ancillary | $3.73 | $2.64 | $1.06 | $3.40 | $5.87 | $11.55 | $10.32 | $15.08 | ||||||||||||
| Average fare—total | $79.13 | $78.91 | $72.76 | $89.71 | $92.19 | $105.07 | $104.76 | $108.59 | ||||||||||||
| Average stage length (miles) | 258 | 258 | 403 | 725 | 913 | 1,045 | 1,034 | 1,030 | ||||||||||||
| Percent of sales through website during period | — | — | — | 53.2 | % | 68.4 | % | 81.0 | % | 81.5 | % | 84.8 | % | |||||||
The following terms used in this section and elsewhere in this prospectus have the meanings indicated below:
"Available seat miles" or "ASMs" represents the number of seats available for passengers multiplied by the number of miles the seats are flown.
"Average fuel cost per gallon" represents total aircraft fuel costs divided by the total number of fuel gallons consumed.
"Average stage length" represents the average number of miles flown per flight.
"EBITDA" represents earnings before interest expense, income taxes, depreciation, and amortization. EBITDA is not a calculation based on generally accepted accounting principles and should not be considered as an alternative to net income (loss) or operating income (loss) as indicators of our financial performance or to cash flow as a measure of liquidity. In addition, our calculation may not be comparable to other similarly titled measures of other companies. EBITDA is included as a supplemental disclosure because we believe it may provideis a useful information regardingindicator of our ability to service debt payments and to fund capital expenditures. Our ability to service debt payments and to fund capital expendituresoperating performance. Further, EBITDA is a well recognized performance measurement in the future, however,airline industry that is frequently used by securities analysts, investors and other interested parties in comparing the operating performance of companies in our industry. We believe EBITDA is useful in evaluating our operating performance compared to our competitors because its calculation generally eliminates the effects of financing and income taxes and the accounting effects of capital spending and acquisitions, which items may be affected by othervary between periods and for different companies for reasons unrelated to overall operating or legal requirements or uncertainties.performance. The following represents the reconciliation of EBITDA to net income (loss) to EBITDA for the periods indicated below.
| | | | | | | | | Nine Months Ended September 30, | ||||||||||||||||||||||||||
|---|---|---|---|---|---|---|---|---|---|---|---|---|---|---|---|---|---|---|---|---|---|---|---|---|---|---|---|---|---|---|---|---|---|---|
| | | | | Year Ended December 31, | ||||||||||||||||||||||||||||||
| | | | | | Year Ended December 31, | Predecessor January 1- June 30, 2001 | | Successor July 1- December 31, 2001 | Nine Months Ended September 30, | |||||||||||||||||||||||||
| | | Predecessor January 1- June 30, 2001 | | Successor July 1- December 31, 2001 | | 2002 | 2003 | 2004 | 2005 | 2005 | 2006 | |||||||||||||||||||||||
| | | | 2002 | 2003 | 2004 | 2005 | (unaudited) | | (unaudited) | (unaudited) | | | | (unaudited) | ||||||||||||||||||||
| | | (unaudited) | | (unaudited) | (unaudited) | | | | (in thousands, except share and per share data) | |||||||||||||||||||||||||
| | | (in thousands, except share and per share data) | | | | | | | | | | |||||||||||||||||||||||
| EBITDA Reconciliation: | EBITDA Reconciliation: | |||||||||||||||||||||||||||||||||
| Net income (loss) | Net income (loss) | ($2,948 | ) | ($2,247 | ) | ($976 | ) | $4,300 | $10,282 | $7,292 | $(2,948 | ) | $(2,247 | ) | $(1,290 | ) | $3,304 | $9,135 | $7,292 | $7,696 | $10,286 | |||||||||||||
| Plus (minus): | Plus (minus): | |||||||||||||||||||||||||||||||||
| Interest, net | 12 | 126 | 367 | 822 | 1,369 | 1,784 | ||||||||||||||||||||||||||||
| Income tax expense | 1 | — | 1 | 1 | 12 | 37 | ||||||||||||||||||||||||||||
| Depreciation and amortization | 240 | 125 | 260 | 1,181 | 2,183 | 5,088 | ||||||||||||||||||||||||||||
| Interest income | (1 | ) | (1 | ) | — | (9 | ) | (30 | ) | (1,225 | ) | (647 | ) | (2,043 | ) | |||||||||||||||||||
| Interest expense | 13 | 127 | 367 | 831 | 1,399 | 3,009 | 1,968 | 3,970 | ||||||||||||||||||||||||||
| Provision for state income taxes | 1 | — | 1 | 1 | 12 | 37 | 37 | 43 | ||||||||||||||||||||||||||
| Depreciation and amortization | 240 | 125 | 260 | 1,181 | 2,183 | 5,088 | 3,578 | 7,599 | ||||||||||||||||||||||||||
| EBITDA | EBITDA | ($2,695 | ) | ($1,996 | ) | ($348 | ) | $6,304 | $13,846 | $14,201 | $(2,695 | ) | $(1,996 | ) | $(662 | ) | $5,308 | $12,699 | $14,201 | $12,632 | $19,855 | |||||||||||||
"EBITDAR"Aircraft lease rentals expense represents earnings before interesta significant operating expense income taxes, depreciation, amortization andof our business. Because we leased aircraft during the periods presented, we believe that when assessing EBITDA you should also consider the impact of our aircraft lease rental expense. EBITDAR is not a calculation based on generally accepted accounting principles and should not be considered as an alternative to net income (loss) or operating income (loss) as indicators of our financial performance or to cash flow as a measure of liquidity. In addition, our calculation may not be comparable to other similarly titled measures of other companies. EBITDAR is included as a supplemental disclosure because it may provide useful information regarding our ability to service debt and lease payments and to fund capital expenditures. Our ability to service debt and lease payments and to fund capital expendituresrentals expense, which was (in thousands) $885 from January 1 -June 30, 2001, $459 from July 1 - December 31, 2001, $3,033 in 2002, $3,137 in 2003, $3,847 in 2004, $4,987 in 2005, $3,386 in the future, however, may be affected by other operating or legal requirements or uncertainties. The following representsfirst nine months of 2005 and $4,277 in the reconciliationfirst nine months of net income (loss) to EBITDAR for the periods indicated below.2006.
| | | | | Year Ended December 31, | |||||||||||
|---|---|---|---|---|---|---|---|---|---|---|---|---|---|---|---|
| | Predecessor January 1- June 30, 2001 | | Successor July 1- December 31, 2001 | ||||||||||||
| | | 2002 | 2003 | 2004 | 2005 | ||||||||||
| | (unaudited) | | (unaudited) | (unaudited) | | | | ||||||||
| | (in thousands) | ||||||||||||||
| EBITDAR Reconciliation: | |||||||||||||||
| Net income (loss) | ($2,948 | ) | ($2,247 | ) | ($976 | ) | $4,300 | $10,282 | $7,292 | ||||||
| Plus (minus): | |||||||||||||||
| Interest, net | 12 | 126 | 367 | 822 | 1,369 | 1,784 | |||||||||
| Income tax expense | 1 | — | 1 | 1 | 12 | 37 | |||||||||
| Depreciation and amortization | 240 | 125 | 260 | 1,181 | 2,183 | 5,088 | |||||||||
| Aircraft lease rentals | 885 | 459 | 3,033 | 3,137 | 3,847 | 4,987 | |||||||||
| EBITDAR | ($1,810 | ) | ($1,537 | ) | $2,685 | $9,441 | $17,693 | $19,188 | |||||||
"Load factor" represents the percentage of aircraft seating capacity that is actually utilized (revenue passenger miles divided by available seat miles).
"Operating expense per ASM" represents operating expenses divided by available seat miles.
"Operating expense per ASM, excluding fuel" represents operating expenses, less aircraft fuel, divided by available seat miles.
"Operating revenue per ASM" represents operating revenue divided by available seat miles.
"Revenue passengers" represents the total number of passengers flown on all flight segments.
"Revenue passenger miles" or"RPMs" represents the number of miles flown by revenue passengers.
"Yield" represents scheduled service revenue divided by scheduled service revenue passenger miles.
UNAUDITED PRO FORMA CONDENSED CONSOLIDATED FINANCIAL INFORMATION
The following Unaudited Pro Forma Condensed Consolidated Financial Information is based upon our historical consolidated financial statements. The Unaudited Pro Forma Condensed Consolidated Statement of Operations Information for the year ended December 31, 2005 and for the nine month period ended September 30, 2006, was prepared as if the reorganization and related transactions described under "Related Party Transactions—Reorganization Transactions" had taken place on January 1, 2005.2005 and January 1, 2006, respectively. The Unaudited Pro Forma Condensed Consolidated Statement of Financial ConditionBalance Sheet Information was prepared as if those transactions had occurred as of December 31, 2005.September 30, 2006. As permitted by the rules and regulations of the SEC, the Unaudited Pro Forma Condensed Consolidated Financial Information is presented on a condensed basis.
The Unaudited Pro Forma Condensed Consolidated Financial Information assumes an initial public offering price of $ per share, the midpoint of the range set forth on the cover page of this prospectus.
Prior to this offering, we were organized as a limited liability company. As a limited liability company, we were not subject to U.S. federal or state income taxes. As a result, our reported tax expense understates the level of taxes that we will pay as a public corporation after this offering.
In order to reflect our expected post-offering tax and capital structure, the Unaudited Pro Forma Condensed Consolidated Financial Information gives effect to the following items:
The Pro Forma Adjustments are based upon available information and certain assumptions that management believes are reasonable. The Unaudited Pro Forma Condensed Consolidated Financial Information and accompanying notes should be read in conjunction with the consolidated financial statements and related notes included elsewhere in this prospectus.
The Unaudited Pro Forma Condensed Consolidated Financial Information presented is not necessarily indicative of the results of operations or financial position that might have occurred had the Pro Forma Adjustments actually taken place as of the dates specified, or that may be expected to occur in the future.
Unaudited Pro Forma Condensed Consolidated Statement of Operations Information
| | Year Ended December 31, 2005 | ||||||||||
|---|---|---|---|---|---|---|---|---|---|---|---|
| | Historical | Pro Forma Adjustment for Corporate Taxes | Pro Forma, as Adjusted for Corporate Taxes | Pro Forma Adjustment for the Reorganization | Total Pro Forma, as Adjusted | ||||||
| | (in thousands, except share and per share data) | ||||||||||
| Total operating revenue | $132,500 | $— | $132,500 | ||||||||
| Total operating expenses | 123,999 | — | 123,999 | ||||||||
| Operating income (loss) | 8,501 | — | 8,501 | ||||||||
| Total other (income) expense | 1,172 | — | 1,172 | ||||||||
| Income (loss) before income taxes | 7,329 | — | 7,329 | ||||||||
| Income tax expense (benefit) | 37 | 2,690 | 2,727 | ||||||||
| Net income (loss) | $7,292 | ($2,690 | ) | $4,602 | |||||||
| Weighted average shares outstanding: | |||||||||||
| Basic | 6,557,306 | 6,557,306 | |||||||||
| Diluted | 13,111,196 | 13,111,196 | |||||||||
Earnings (loss) per common share: | |||||||||||
| Basic | $1.11 | ($0.41 | ) | $0.70 | |||||||
| Diluted | $0.56 | ($0.21 | ) | $0.35 | |||||||
| | Year Ended December 31, 2005 | ||||||
|---|---|---|---|---|---|---|---|
| | Historical | Pro Forma Adjustment | Pro Forma, As Adjusted | ||||
| | (in thousands, except share and per share data) | ||||||
| Total operating revenue | $132,500 | $— | $132,500 | ||||
| Total operating expense | 123,999 | — | 123,999 | ||||
| Operating income | 8,501 | — | 8,501 | ||||
| Total other expense | 1,172 | — | 1,172 | ||||
| Income before income taxes | 7,329 | — | 7,329 | ||||
| Income tax expense(a) | 37 | 2,693 | 2,730 | ||||
| Net income (loss) | $7,292 | ($2,693 | ) | $4,599 | |||
| Weighted average shares outstanding: | |||||||
| Basic(b) | 6,557,306 | 11,538,262 | |||||
| Diluted(b)(c) | 13,111,196 | 11,538,262 | |||||
Earnings (loss) per common share: | |||||||
| Basic | $1.11 | $0.40 | |||||
| Diluted(c) | $0.56 | $0.40 | |||||
| | Nine Months Ended September 30, 2006 | ||||||
|---|---|---|---|---|---|---|---|
| | Historical | Pro Forma Adjustment | Pro Forma, As Adjusted | ||||
| | (in thousands, except share and per share data) | ||||||
| Total operating revenue | $180,214 | $— | $180,214 | ||||
| Total operating expense | 165,031 | — | 165,031 | ||||
| Operating income | 15,183 | — | 15,183 | ||||
| Total other expense | 4,854 | — | 4,854 | ||||
| Income before income taxes | 10,329 | — | 10,329 | ||||
| Income tax expense(a) | 43 | 3,791 | 3,834 | ||||
| Net income (loss) | $10,286 | ($3,791 | ) | $6,495 | |||
| Weighted average shares outstanding: | |||||||
| Basic(b) | 6,433,333 | 13,945,933 | |||||
| Diluted(b) | 16,703,360 | 14,330,960 | |||||
Earnings (loss) per common share: | |||||||
| Basic | $1.60 | $0.47 | |||||
| Diluted | $0.62 | $0.45 | |||||
The accompanying notes are an integral part of the Unaudited Pro Forma Condensed Consolidated Financial Statements.
Notes to Unaudited Pro Forma Condensed Consolidated Statement of Operations Information
Unaudited Pro Forma Condensed Consolidated Statement of Financial ConditionBalance Sheet Information
| | | Year Ended December 31, 2005 | | As of September 30, 2006 | ||||||||||||||||||
|---|---|---|---|---|---|---|---|---|---|---|---|---|---|---|---|---|---|---|---|---|---|---|
| | | Historical | Pro Forma Adjustment for Corporate Taxes | Pro Forma, as Adjusted for Corporate Taxes | Pro Forma Adjustment for the Reorganization | Total Pro Forma, as Adjusted | | Historical | Pro Forma Adjustment for Corporate Taxes | Pro Forma, as Adjusted for Corporate Taxes | Pro Forma Adjustment for the Reorganization | Total Pro Forma, As Adjusted | ||||||||||
| | | (in thousands, except share and per share data) | | (in thousands, except share and per share data) | ||||||||||||||||||
| Cash and cash equivalents, restricted cash and short-term investments | $53,325 | — | $53,325 | |||||||||||||||||||
| Cash, cash equivalents and short-term investments | Cash, cash equivalents and short-term investments | $44,980 | $— | $44,980 | $— | $44,980 | ||||||||||||||||
| Other assets | Other assets | 119,215 | — | 119,215 | Other assets | 144,772 | — | 144,772 | — | 144,772 | ||||||||||||
| Total assets | Total assets | $172,540 | — | $172,540 | Total assets | $189,752 | — | $189,752 | — | $189,752 | ||||||||||||
| Current liabilities | Current liabilities | $66,816 | — | $66,816 | Current liabilities | $81,110 | — | $81,110 | — | $81,110 | ||||||||||||
| Long-term debt | Long-term debt | 49,120 | — | 49,120 | Long-term debt | 48,221 | — | 48,221 | — | 48,221 | ||||||||||||
| Deferred tax liability | Deferred tax liability | — | 1,755 | 1,755 | Deferred tax liability | — | 6,166 | 6,166 | — | 6,166 | ||||||||||||
| 115,936 | 1,755 | 117,691 | 129,331 | 6,166 | 135,497 | — | 135,497 | |||||||||||||||
| Redeemable convertible preferred shares | Redeemable convertible preferred shares | 39,540 | — | 39,540 | Redeemable convertible preferred shares | 39,540 | — | 39,540 | (39,540 | ) | — | |||||||||||
Shareholders'/members' equity: | Shareholders'/members' equity: | Shareholders'/members' equity: | ||||||||||||||||||||
| Common stock, par value $.001 per share | Common stock, par value $.001 per share | — | — | — | Common stock, par value $.001 per share | — | — | — | 14 | 14 | ||||||||||||
| Contributed capital | Contributed capital | 1,766 | — | 1,766 | Contributed capital | 2,355 | — | 2,355 | (2,355 | ) | — | |||||||||||
| Additional paid-in capital | Additional paid-in capital | — | — | — | Additional paid-in capital | — | — | — | 40,874 | 40,874 | ||||||||||||
| Accumulated comprehensive income | Accumulated comprehensive income | 104 | 38 | * | 142 | Accumulated comprehensive income | 474 | (175 | ) | 299 | — | 299 | ||||||||||
| Retained/undistributed earnings | Retained/undistributed earnings | 15,194 | (1,793 | ) | 13,401 | Retained/undistributed earnings | 19,059 | (5,991 | ) | 13,068 | — | 13,068 | ||||||||||
| Less: treasury shares(b) | Less: treasury shares(b) | (1,007 | ) | — | (1,007 | ) | 1,007 | — | ||||||||||||||
| Total shareholders'/members' equity | Total shareholders'/members' equity | 17,064 | (1,755 | ) | 15,309 | Total shareholders'/members' equity | 20,881 | (6,166 | ) | 14,715 | 39,540 | 54,255 | ||||||||||
| Total liabilities and shareholders'/members' equity | Total liabilities and shareholders'/members' equity | $172,540 | — | $172,540 | Total liabilities and shareholders'/members' equity | $189,752 | — | $189,752 | $— | $189,752 | ||||||||||||
| Shares outstanding: | Shares outstanding: | Shares outstanding: | ||||||||||||||||||||
| Basic | Basic | 6,433,333 | 13,945,933 | |||||||||||||||||||
| Pro forma book value per share | Pro forma book value per share | Pro forma book value per share | $3.25 | $3.89 | ||||||||||||||||||
Notes to Unaudited Pro Forma Condensed Consolidated Balance Sheet Information
The accompanying notes are an integral part of theUnaudited Pro Forma Condensed Consolidated Financial Statements.
Notes to Unaudited Pro Forma Condensed Consolidated Statement of Financial Condition Information
MANAGEMENT'S DISCUSSION AND ANALYSIS OF FINANCIAL CONDITION
AND RESULTS OF OPERATIONS
The following discussion and analysis presents factors that had a material effect on our results of operations during the years ended December 31, 2005, 2004 and 2003.2003 and for the nine months ended September 30, 2006 and 2005. Also discussed is our financial position as of December 31, 2005 and 2004.2004 and as of September 30, 2006. You should read this discussion in conjunction with our consolidated financial statements, including the notes thereto, appearing elsewhere in this prospectus or incorporated herein by reference.prospectus. This discussion and analysis contains forward-looking statements. Please refer to the section entitled "Special Note About Forward-Looking Statements" for a discussion of the uncertainties, risks and assumptions associated with these statements.
Overview
Who We Are. We are a leisure travel company. The focus of our business is a low-cost passenger airline marketed to leisure travelers in small cities. Our business model emphasizes low operating costs, diversified revenue sources, and the transport of passengers from small cities to world-class leisure destinations. Our route network, pricing philosophy, product offering and advertising are all intended to appeal to leisure travelers and make it attractive for them to purchase air travel and related services from us.
Our strategy is to develop the leisure travel market in small cities by providing nonstop low fare scheduled service to world-class leisure destinations. We currently provide service to Las Vegas, Nevada and Orlando, Florida, two of the largest and most popular leisure destinations in the United States.States, and have recently commenced service to Tampa/St. Petersburg, Florida, our third leisure destination. We have positioned our business to take advantage of current lifestyle and demographic trends in the U.S. we believe are positive drivers for the leisure travel industry. The most notable demographic shift occurring in the U.S. is the aging of the baby boomer generation as they enter their peak earning years and have more time and disposable income to spend on leisure travel. We believe a large percentage of our customers fall within the baby boomer demographic and we target these customers through the use of advertisements in approximately 290more than 410 print circulations.
Our Fleet. The following table sets forth the number and type of aircraft in service and operated by us at the dates indicated:
| | December 31, 2003 | December 31, 2004 | December 31, 2005 | December 31, 2003 | December 31, 2004 | December 31, 2005 | September 30, 2006 | |||||||||||||||||||||||||||||||||||
|---|---|---|---|---|---|---|---|---|---|---|---|---|---|---|---|---|---|---|---|---|---|---|---|---|---|---|---|---|---|---|---|---|---|---|---|---|---|---|---|---|---|---|
| | Own | Lease | Total | Own | Lease | Total | Own* | Lease | Total | Own | Lease | Total | Own | Lease | Total | Own(a) | Lease | Total | Own(b) | Lease | Total | |||||||||||||||||||||
| MD83s | 3 | 2 | 5 | 5 | 2 | 7 | 9 | 6 | 15 | 3 | 2 | 5 | 5 | 2 | 7 | 9 | 6 | 15 | 16 | 3 | 19 | |||||||||||||||||||||
| MD87s | 0 | 2 | 2 | 0 | 2 | 2 | 0 | 2 | 2 | 0 | 2 | 2 | 0 | 2 | 2 | 0 | 2 | 2 | 0 | 2 | 2 | |||||||||||||||||||||
| Total | 3 | 4 | 7 | 5 | 4 | 9 | 9 | 8 | 17 | 3 | 4 | 7 | 5 | 4 | 9 | 9 | 8 | 17 | 16 | 5 | 21 | |||||||||||||||||||||
Our Markets. Our scheduled service consists of limited frequency nonstop flights into world-class leisure destinations from small cities. As of December 31, 2005,September 30, 2006, we offered scheduled service into Las Vegas and Orlando from 2939 small cities. The following shows the number of destinations and small cities served as of December 31, 2003, 2004 and 2005.(including seasonal service).
| | 2003 | 2004 | 2005 | |||
|---|---|---|---|---|---|---|
| Destinations | 1 | 1 | 2 | |||
| Small Cities | 6 | 13 | 29 |
| | As of December 31, | As of September 30, | ||||||
|---|---|---|---|---|---|---|---|---|
| | 2003 | 2004 | 2005 | 2006 | ||||
| Destinations | 1 | 1 | 2 | 2 | ||||
| Small Cities | 6 | 13 | 29 | 39 | ||||
Our Fiscal Year. We operate on a calendar year ending on the last day in December. For convenience, we refer to the fiscal years ended December 31, 2005, December 31, 2004 and December 31, 2003 as 2005, 2004 and 2003, respectively.
Our Operating Revenue
Our operating revenue is comprised of both air travel on a stand-alone basis orand bundled with hotels, rental cars and other travel-related services. We believe our diversified revenue streams distinguish us from other U.S. airlines and other travel companies.
Seasonality. Our business is seasonal in nature with operating revenuetraffic demand being lower in the third and fourth fiscal quarters. Our operating revenue is largely driven by perceived product value, advertising and promotional activities and can be adversely impacted during periods with reduced discretionary leisure travel spending, such as the back-to-school season.
Our Operating Expenses
A brief description of the items included in our operating expense line items follows. Our cost structure is highly variable with approximately 46.9%as we consider our fixed costs to have represented only 3.93¢ of our cost per available seat mile ("CASM") in 2005, or 53.0% of our 2005 operating expenses considered by us to be variable.expenses.
Aircraft fuel expense. Aircraft fuel expense includes the cost of aircraft fuel, fuel taxes, into plane fees and airport fuel flowage, storage or through-put fees. Under certain of our fixed fee flying agreements, we are reimbursed by our customers if fuel exceeds a pre-determined cost per gallon, and these reimbursements are netted against fuel expense.
Salary and benefits expense. Salary and benefits expense includes wages and salaries as well as expenses associated with employee benefit plans and employer payroll taxes.
Station operations expense. Station operations expense includes the fees charged by airports for the use or lease of airport facilities and fees charged by third party vendors for ground handling services and commissary expenses.
Maintenance and repairs expense. Maintenance and repairs expense includes all parts, materials and spares required to maintain our aircraft. Also included are fees for repairs performed by third party vendors.
Sales and marketing expense. Sales and marketing expense includes all advertising, promotional expenses, travel agent commissions, and credit card discount fees associated with sale of scheduled service.
Aircraft lease rentals expense. Aircraft lease rentals expense consists of the cost of leasing aircraft which are operated under both short and long-term operating leases with third parties.
Depreciation and amortization expense. This expense includes the depreciation of all fixed assets, including aircraft that we own, and amortization on aircraft that we operate under capital leases.
Other expense. Other expense includes the cost of passenger liability insurance, aircraft hull insurance, and all other insurance policies except for employee welfare insurance. Additionally, this expense includes travel and training expenses for crews and ground personnel, facility lease expenses, professional fees, personal property taxes and all other administrative and operational overhead expenses not included in other line items above.
Trends and Uncertainties Affecting Our Business
We believe our financial success is driven by variable factors that affect airlines and their markets, and by trends affecting the travel industry. The following discussion describes certain key factors we believe may affect our future performance.
Demographics and Consumer Behavior
The airline industry is influenced by lifestyle and demographic trends, and the performance of the broader U.S. economy. We believe the current demographic and lifestyle trends are positive drivers of the leisure travel industry. The aging of the baby boomers as they enter their peak earning years with more disposable income, and the recent economic expansion have both had a positive impact on growing consumer demand for leisure travel.
Aircraft Fuel
The airline industry is heavily dependent on the use of jet fuel and fuel costs represent a significant portion of the total operating expenses for airlines. Fuel costs have been subject to wide price fluctuations. Fuel availability is also subject to periods of market surplus and shortage and is affected by demand for heating oil, gasoline and other petroleum products. The cost and future availability of fuel cannot be predicted with any degree of certainty.
Labor
The airline industry is heavily unionized and the wages and benefits of unionized airline industry employees are determined by collective bargaining agreements. DifferencesConflicts between unionized airlines and their unions can lead to work slowdowns or stoppages. Although we currently have a non-unionized work force and are not subject to collective bargaining agreements at the present time, if our employees were to unionize in the future and we were unable to reach agreement on the terms of their collective bargaining agreement, or we were to experience wide-spread employee dissatisfaction, we could be subject to work slowdowns or stoppages. ThisIn addition, we may be subject to disruption by organized labor groups protesting our non-union status. Any of these events could have an adverse effect on our future results. Our flight attendants are in the process of a union election with the results to be known in early December 2006.
Competition
The airline industry is highly competitive. Passenger demand and fare levels have historically been influenced by, among other things, industry capacity and pricing actions taken by other airlines. The principal competitive factors in the airline industry are fare pricing, customer service, routes served, flight schedules, types of aircraft, safety record and reputation, code-sharing relationships, and frequent flyer programs.
RESULTS OF OPERATIONS
The table below presents our operating expenses as a percentage of operating revenue for the last three fiscal years.years and for the nine month periods ended September 30, 2005 and 2006.
| | | Year Ended December 31, | | Year Ended December 31, | Nine Months Ended September 30, | |||||||||||||||
|---|---|---|---|---|---|---|---|---|---|---|---|---|---|---|---|---|---|---|---|---|
| | | 2003 | 2004 | 2005 | | 2003 | 2004 | 2005 | 2005 | 2006 | ||||||||||
| Operating revenue | Operating revenue | 100.0 | % | 100.0 | % | 100.0 | % | Operating revenue | 100.0 | % | 100.0 | % | 100.0 | % | 100.0 | % | 100.0 | % | ||
| Operating expenses: | Operating expenses: | Operating expenses: | ||||||||||||||||||
| Aircraft fuel | 23.5 | 30.9 | 39.7 | Aircraft fuel | 23.5 | 30.9 | 39.7 | 37.4 | 43.1 | |||||||||||
| Salary and benefits | 16.4 | 17.0 | 16.4 | Salary and benefits | 16.4 | 17.0 | 16.4 | 16.5 | 13.8 | |||||||||||
| Station operations | 16.1 | 15.1 | 10.6 | Station operations | 16.1 | 15.1 | 10.6 | 11.1 | 10.4 | |||||||||||
| Maintenance and repairs | 10.3 | 9.1 | 6.8 | Maintenance and repairs | 12.3 | 10.4 | 6.8 | 7.6 | 7.9 | |||||||||||
| Sales and marketing | 4.8 | 3.9 | 4.2 | Sales and marketing | 4.8 | 3.9 | 4.2 | 4.2 | 3.9 | |||||||||||
| Aircraft lease rentals | 6.3 | 4.3 | 3.8 | Aircraft lease rentals | 6.3 | 4.3 | 3.8 | 3.7 | 2.4 | |||||||||||
| Depreciation and amortization | 2.4 | 2.4 | 3.8 | Depreciation and amortization | 2.4 | 2.4 | 3.8 | 3.9 | 4.2 | |||||||||||
| Other | 12.5 | 9.3 | 8.2 | Other | 12.5 | 9.3 | 8.2 | 8.5 | 6.0 | |||||||||||
| Total operating expenses | 92.2 | % | 92.0 | % | 93.6 | % | ||||||||||||||
| Total operating expense | Total operating expense | 94.2 | % | 93.3 | % | 93.6 | % | 93.0 | % | 91.6 | % | |||||||||
Nine Months Ended September 30, 2006 Compared to Nine Months Ended September 30, 2005
Summary
We recorded total operating revenue of $180.2 million, income from operations of $15.2 million and net income of $10.3 million for the first nine months of 2006. By comparison, in the first nine months of 2005, we recorded total operating revenue of $92.4 million, income from operations of $6.5 million and net income of $7.7 million.
As of September 30, 2006, we had a fleet of 25 aircraft with 21 in service compared with a fleet of 15 aircraft with 15 in service as of September 30, 2005. The growth of our fleet enabled a 84.8% increase in available seat miles ("ASMs") for first nine months of 2006 compared to the same period in 2005 as departures increased by 79.7% and average stage length increased by 2.0%.
Substantially all of our ASM growth in the nine month period ended September 30, 2006 compared to the corresponding period in 2005 was in scheduled service which represented 85.3% of total ASMs in 2006 compared to 73.3% in 2005. Fixed fee contract flying ASMs increased by 1.8%, and scheduled service ASMs increased by 115.0%.
Operating Revenue
Our operating revenue increased 94.9%, or $87.8 million, to $180.2 million for the nine month period ended September 30, 2006 from $92.4 million during the same period in 2005. This was driven by a 88.9% increase in revenue passenger miles ("RPMs") and a 5.5% increase in revenue per ASM ("RASM").
Scheduled service revenues:
Scheduled service revenues increased 115.9%, or $70.7 million, to $131.7 million for the nine months ended September 30, 2006 from $61.0 million during the same period in 2005 due to a 118.2% increase in RPMs. Yield declined 1.0% during the first nine months of 2006 versus 2005 due to the effect of introductory pricing on 11 new routes to Las Vegas and three new routes to Orlando started during the first nine months of 2006 and offset by a slight decrease in average scheduled service stage length of 0.4%. The decrease in average stage length coupled with an increase in load factor of 1.2 percentage points resulted in a 0.5% increase in scheduled service RASM from 7.20¢ to 7.23¢.
Fixed fee contract revenues:
Fixed fee contract revenues increased 10.0%, or $2.5 million, to $27.2 million for the nine months ended September 30, 2006 compared to $24.8 million during the same period in 2005. Revenues increased as operations under a new short-term contract running from May through August 2006 more than offset a reduction in flying by one of our existing fixed fee customers. We are close to finalizing an agreement with Harrah's Laughlin to increase our fixed fee flying beginning in January 2007. We expect this will produce incremental fixed fee flying revenue in 2007.
Ancillary revenues:
Ancillary revenues increased 218.5% to $21.2 million for the nine months ended September 30, 2006 compared to $6.7 million during the same period in 2005. The increase in ancillary revenue was due to a 118.1% increase in scheduled service passengers and a 46.1% increase in ancillary revenue per passenger from $10.32 to $15.08 due primarily to the sale of several new products.
Operating Expenses
Our operating expenses increased by 92.0%, or $79.1 million, to $165.0 million for the nine months ended September 30, 2006 compared to $86.0 million during the same period in 2005. During the first nine months of 2006, our financial results were significantly impacted by the dramatic increase in the price of aircraft fuel over the prior year.
In general, our operating expenses are significantly affected by changes in our capacity, as measured by ASMs. The following table presents our unit costs, defined as operating expense per ASM, for the indicated periods.
| | Nine Months Ended September 30, | | |||||
|---|---|---|---|---|---|---|---|
| | Percent Change | ||||||
| | 2005 | 2006 | |||||
| Aircraft fuel | 2.99 | ¢ | 3.64 | ¢ | 21.5 | % | |
| Salaries and benefits | 1.32 | 1.16 | (12.1 | ) | |||
| Station operations | 0.89 | 0.88 | (1.2 | ) | |||
| Maintenance and repairs | 0.61 | 0.67 | 9.2 | ||||
| Sales and marketing | 0.34 | 0.33 | (4.1 | ) | |||
| Aircraft lease rentals | 0.29 | 0.20 | (31.6 | ) | |||
| Depreciation and amortization | 0.31 | 0.36 | 14.9 | ||||
| Other | 0.68 | 0.50 | (26.2 | ) | |||
| Operating cost per ASM ("CASM") | 7.44 | ¢ | 7.73 | ¢ | 3.9 | % | |
| Operating CASM, excluding fuel | 4.44 | ¢ | 4.09 | ¢ | (7.9 | %) | |
Aircraft fuel expense. Aircraft fuel expense increased 124.5%, or $43.1 million, to $77.7 million during the nine months ended September 30, 2006 compared to $34.6 million during the same period
in 2005. This change was due to a 82.5% increase in gallons consumed and a 23.0% increase in the average cost per gallon to $2.18 per gallon during 2006 compared to $1.77 in 2005.
Salary and benefits expense. Salary and benefits expense increased 62.5%, or $9.6 million, to $24.8 million during the nine months ended September 30, 2006 compared to $15.3 million during the same period in 2005. This increase is largely attributable to a 54.3% increase in full-time equivalent employees to support our growth. We employed approximately 787 full-time equivalent employees as of September 30, 2006, compared to 510 full-time equivalent employees as of September 30, 2005.
Station operations expense. Station operations expense increased 82.5%, or $8.5 million, to $18.7 million during the nine months ended September 30, 2006 compared to $10.3 million during the same period in 2005. The increase in station operations expense exceeded the 79.7% increase in departures but station operation expenses declined 1.1% on a CASM basis due to a higher percentage of scheduled service flying (which typically has a lower expense per departure compared with our fixed fee flying contract).
Maintenance and repairs expense. Maintenance and repairs expense increased by 101.8%, or $7.2 million, to $14.2 million during the nine months ended September 30, 2006 compared to $7.1 million during the same period in 2005. The increase is largely attributed to heavy maintenance checks on 10 aircraft during 2006 versus four heavy checks during 2005 and the substantially larger fleet as of September 30, 2006 when compared to 2005. Maintenance and repairs CASM increased 9.8% as increased maintenance expense outpaced an increase in aircraft utilization.
Sales and marketing expense. Sales and marketing expense increased 77.3%, or $3.0 million, to $7.0 million during the nine months ended September 30, 2006 compared to $3.9 million during the corresponding period in 2005. On a CASM basis, sales and marketing expense declined 2.9% primarily due to the elimination of travel agency commissions for air only sales, a decrease in credit card processing fees and an increase in the percentage of sales through our website, our lowest cost distribution channel.
Aircraft lease rentals expense. Aircraft lease rentals expense increased by 26.3%, or $0.9 million, to $4.3 million during the nine months ended September 30, 2006 compared to $3.4 million during the corresponding period in 2005. On a CASM basis, aircraft lease rentals expense decreased 31.0% to 0.20¢ for the nine months ended September 30, 2006 compared to 0.29¢ in 2005 due to an increase in the percentage of owned versus leased aircraft and the benefits of higher aircraft utilization. During the nine months ended September 30, 2006, average block hours for aircraft in service increased 13.6%, or 24.5 hours, to 204.0 hours per month compared to 179.6 hours per month during the same period in 2005.
Depreciation and amortization expense. Depreciation and amortization expense was $7.6 million for the nine months ended September 30, 2006 compared to $3.6 million in 2005, an increase of 112.4% as the number of in-service aircraft owned or subject to capital leases increased from seven as of September 30, 2005 to 16 as of September 30, 2006.
Other expense. Other expense increased by 36.3% to $10.7 million for the nine months ended September 30, 2006 compared to $7.9 million during the same period in 2005 due mainly to increased aviation insurance, administrative, facilities and training expenses associated with our company's growth.
Other (Income) Expense
Other (income) expense increased from $(1.3) million from the nine months ended September 30, 2005 to $4.9 million during the same period in 2006. This change is attributable to three factors: (1) a change in net gain on fuel derivatives from a gain of $2.8 million in the nine months ended September 30, 2005 to a loss of $2.9 million in the corresponding period in 2006, (2) an increase in
interest expense from $2.0 million in 2005 to $4.0 million in 2006 relating to interest on aircraft purchased and acquired under capital leases during the period and (3) an increase in interest income from $0.6 million in 2005 to $2.0 million in 2006 as a result of increased cash and short-term investment balances.
Our fuel derivative contracts do not qualify for hedge accounting under Statement of Financial Standards No. 133,Accounting for Derivative Instruments and Hedging Activities. Therefore, we recognize changes in the fair value of our derivatives when they occur, as a component of other (income) expense. We also recognize gain or loss from a mark-to-market adjustment at the end of each period, which estimates as of that date the future value of open contracts which will settle in subsequent periods. Gain or loss is also recognized as contracts settle and the amount can vary depending on the market value of fuel at that time. We recognized a $0.8 million loss on the mark-to-market adjustment for our open fuel derivative contracts and we recognized $3.4 million in net gains for contracts settled in the nine months ending September 30, 2005. By contrast, we recognized a $2.6 million loss on the mark-to-market adjustment for our open fuel derivative contracts and we recognized $0.3 million in net losses for contracts settled in the nine months ending September 30, 2006. The change from an overall gain on fuel derivatives to a loss from 2005 to 2006 is due to the fact that fuel prices predominantly increased over the nine months ending September 30, 2005 and predominantly decreased over the nine months ending September 30, 2006.
Income Tax Expense
During the nine months ended September 30, 2006 and 2005, we operated as a limited liability company or subchapter S corporation. Under these structures, we did not pay federal corporate income tax for these periods. Instead, the members of the limited liability company or stockholders of the subchapter S corporation were liable for income tax on the taxable income as it affected their individual income tax returns. Accordingly, our income tax provision reflects state taxes owed by us in certain states in which we operate.
2005 Compared to 2004
Summary
We recorded total operating revenue of $132.5 million, income from operations of $8.5 million and net income of $7.3 million for 2005. By comparison, in 2004, we recorded total operating revenue of $90.4 million, income from operations of $7.2$6.1 million and net income of $10.3$9.1 million. Net income decreased despite a 39.9% increase in operating income principally as a result of a lower amount of non-cash gain on fuel derivatives.
During 2005, we added 12 aircraft to our fleet, eight of which were placed into service, bringing the total number of aircraft in the fleet to 22 and the total number of aircraft in service to 17. Four of these aircraft were introduced into service in early 2006. The growth in our fleet generated an increase of 3,277 departures, or 39.2%, and an increase of 455.8 million available seat miles ("ASMs"),ASMs, or 37.4% in 2005 compared to 2004. Average stage length increased by 3.1% from 948 to 977 miles in 2005. ASM growth trailed the growth in departures despite the increase in stage length due to the reconfiguration of our MD83 fleet in late 2004, which reduced the number of seats from 162 to 150.
Our mix of business changed in 2005. Scheduled service ASMs increased 86.2% and represented 77.3% of total ASMs in 2005 versus 57.0% in 2004. This change was due to both to an increase in scheduled service flying and a decrease in certain fixed fee flying.
Operating Revenue
Our operating revenue for 2005 increased $42.1 million or 46.6% compared to 2004. This was driven by a 41.6% increase in revenue passenger miles ("RPMs")RPMs and an increase in revenue per ASM ("RASM")RASM of 6.6% largely due to a 2.3 percentage point improvement in load factor.
Schedule service revenues:
Scheduled service revenues increased 96.1% in 2005 compared to 2004, driven by a 99.0% increase in RPMs and an increase in ASMs of 86.2%. Yields were as we added aircraft and scheduled service to Orlando and more small cities. Yield was down 1.5% in 2005 versus 2004 while average stage length increased 14.5%. Load factor increased by 5.2 percentage points and scheduled service RASM increased by 5.4%.
Fixed fee contract revenues:
Fixed fee contract revenues represented 23.1% of total revenue, or $30.6 million in 2005, a 25.2 percentage point decrease from 2004 in which we had $41.0 million of fixed fee contract revenues. This decrease results from reduced flight hours associated with one of our fixed fee flying agreements.agreements as we operated two major programs for Apple Vacations West in 2004, but only one in 2005.
Ancillary revenues:
Ancillary revenues increased 256.3% to $11.2 million for 2005 or 12.3% of scheduled service revenue, compared to $3.1 million for 2004, or 6.8% of scheduled service revenue.2004. The increase in ancillary revenue was due to an 81.0% increase in scheduled service passengers and a 96.8% increase in ancillary revenue per passenger from $5.87 to $11.55 due primarily to the sale of several new products.
Operating Expenses
Our operating expenses for 2005 increased $40.9$39.7 million or 49.1%47.1% compared to 2004. During 2005, our financial results were significantly impacted by the dramatic increase in the price of aircraft fuel.
In general, our operating expenses are significantly affected by changes in our capacity, as measured by ASMs. The following table presents our unit costs, defined as operating expense per ASM, for the indicated periods:
| | Twelve months ended December 31, | | Twelve months ended December 31, | | ||||||||||
|---|---|---|---|---|---|---|---|---|---|---|---|---|---|---|
| | Percentage Change | Percentage Change | ||||||||||||
| | 2004 | 2005 | 2004 | 2005 | ||||||||||
| Aircraft fuel | 2.29 | ¢ | 3.14 | ¢ | 37.1 | % | 2.29 | ¢ | 3.14 | ¢ | 37.1 | % | ||
| Salary and benefits | 1.26 | 1.30 | 3.2 | 1.26 | 1.30 | 3.2 | ||||||||
| Station operations | 1.12 | 0.84 | (25.0 | ) | 1.12 | 0.84 | (25.0 | ) | ||||||
| Maintenance and repairs | 0.67 | 0.54 | (19.4 | ) | 0.77 | 0.54 | (29.9 | ) | ||||||
| Sales and marketing | 0.29 | 0.34 | 17.2 | 0.29 | 0.34 | 17.2 | ||||||||
| Aircraft lease rentals | 0.32 | 0.30 | (6.3 | ) | 0.32 | 0.30 | (6.3 | ) | ||||||
| Depreciation and amortization | 0.18 | 0.30 | 66.7 | 0.18 | 0.30 | 66.7 | ||||||||
| Other | 0.69 | 0.65 | (5.8 | ) | 0.69 | 0.65 | (5.8 | ) | ||||||
| Operating cost per ASM ("CASM") | 6.82 | ¢ | 7.41 | ¢ | 8.7 | % | ||||||||
| Operating CASM, excluding fuel | 4.53 | ¢ | 4.27 | ¢ | (5.7 | %) | ||||||||
| CASM | 6.92 | ¢ | 7.41 | ¢ | 7.1 | % | ||||||||
| CASM, excluding fuel | 4.63 | ¢ | 4.27 | ¢ | (7.8 | %) | ||||||||
Aircraft fuel expense. Aircraft fuel expense increased 88.3%, or $24.7 million, to $52.6 million in 2005 compared to $27.9 million in 2004. This change was due to a 42.4% increase in gallons consumed
and a 32.6% increase in the average cost per gallon to $1.87 per gallon in 2005 compared to $1.41 per gallon in 2004.
Salary and benefits expense. Salary and benefits expense increased 41.2%, or $6.3 million, to $21.7 million for 2005 compared to $15.4 million for 2004. This increase is largely attributable to a 52.4% increase in full timefull-time equivalent employees to support our growth. We employed approximately 596 full-time equivalent employees as of December 31, 2005, compared to 391 full-time equivalent employees as of December 31, 2004.
Station operations expense. Station operations expense increased by only 3.5%, or $0.5 million, to $14.1 million despite a 39.2% increase in departures. On a CASM basis, this expense decreased 25.0% from 1.12¢ in 2004 to 0.84¢ in 2005. The decline in station operations expense on a CASM basis was partially attributable to reduced fixed fee flying in 2005 for Apple Vacations West as this fixed fee flying arrangement resulted in a higher per departure expense.
Maintenance and repairs expense. Maintenance and repairs expense increaseddecreased by $0.8$0.4 million in 2005 to $9.0 million compared with $8.2$9.4 million in 2004, butand decreased 19.4%29.9% on a CASM basis. The
decrease on a CASM basis is due to growth of the fleet and an FAA approved extension of our airframe heavy maintenance check intervals from 15 to 18 months.
Sales and marketing expense. Sales and marketing expense increased by 58.5% in 2005 to $5.6 million compared to $3.5 million in 2004. This resulted in an increase on a CASM basis of 17.2%. The increase on a CASM basis resulted largely from a higher percentage of scheduled service revenue as a percentage of total revenue (68.4% in 2005 and 51.2% in 2004) as there is less sales and marketing expense associated with our fixed fee flying which constituted a smaller percentage of revenue in 2005. In addition, increased credit card discount fees.fees contributed to the increase. The increase in credit card discount fees was attributable to the 96.1% increase in scheduled service revenue in 2005 compared to 2004. CostSales and marketing expense per scheduled service departure decreased by 9.2% from $739 in 2004 to $671 in 2005 due in part to the elimination of air only travel agency commissions and a further increase in sales through our website, our least expensive distribution channel.
Aircraft lease rentals expense. Aircraft lease rentals expense increased by 29.6% to $5.0 million in 2005 compared to $3.8 million in 2004 due to the addition of five leased MD80 series aircraft in 2005. On a CASM basis, aircraft lease rentals expense decreased 6.3% to 0.30¢ in 2005 compared to 0.32¢ for 2004 due to an increase in the number of owned versus leased aircraft in 2005 compared with 2004.
Depreciation and amortization expense. Depreciation and amortization expense was $5.1 million in 2005 compared to $2.2 million in 2004, representing an increase of 133.1%. This resulted in an increase on a CASM basis of 66.7%. This increase was primarily due to the purchase of two aircraft, one of which was under an operating lease in 2004, and the recognition of a full year's depreciation on three aircraft that were placed into service during varying times throughout 2004. Additionally, spare aircraft parts inventories were substantially increased during 2005 to support the expanded fleet. In addition, we increased the amount of ground equipment and office equipment during 2005 to support the number of increased markets served and increased employee base.
Other expense. Other expense increased by 29.1% to $10.9 million in 2005 compared to $8.4 million in 2004 due mainly to the increased aviation insurance, administrative, facilities and training expenses associated with our company's growth.
Other (Income) Expense
Other (income) expense decreased from income of $3.1 million in 2004 to an expense of $1.2 million in 2005. Realized and unrealized gains on fuel derivative contracts that did not qualify for
hedge accounting treatment decreased from $4.4 million in 2004 to $0.6 million in 2005. Because our fuel derivative contracts do not qualify for hedge accounting under Statement of Financial Standards No. 133,Accounting for Derivative Instruments and Hedging Activities, we recognize changes in the fair value of our derivatives when they occur, rather than whenas a component of other (income) expense. Therefore, a large part of the gain recognized at year end is a mark to market calculation which estimates as of that date the future value of open contracts settle.which will settle in subsequent periods. Gain or loss is also recognized as contracts settle and the amount can vary depending on the market value of fuel at that time. On December 31, 2004, we recognized a $2.5 million gain on the mark to market adjustment for our open fuel derivative contracts, and we recognized $1.9 million in net gains for contracts settled during 2004. We recognized a minimal gain on the mark to market adjustment for our open fuel derivative contracts as of December 31, 2005, and recognized $0.5 million in net gains for contracts settled during 2005. The factors contributing to the significant mark to market adjustment at December 31, 2004 were that we had a higher percentage of our projected fuel requirements hedged at that time, we had longer term fuel derivative contracts in place at that time (up to one year compared to three to six month contracts that we now typically use) and there was a significant upward price move in the futures market for fuel at the time of the mark to market adjustment compared with the time the individual trades were executed.
Interest income increased $1.2 million in 2005 due to increases in rates earned on cash and higher investment balances due to funds raised during our private placement transaction in May 2005 (net proceeds to us totaled $33.2 million). Interest expense increased by $1.6 million in 2005 primarily due to the issuance of new debt and capital leases relating to aircraft financed during 2005.
Income Tax Expense
During 2005 and 2004, we operated as a limited liability company or subchapter S corporation. Under these structures, we did not pay federal corporate income tax for 2005 and 2004. Instead, the members of the limited liability company or stockholders of the subchapter S corporation were liable for income tax on the taxable income as it affected their individual income tax returns. Accordingly, our income tax provision reflects state taxes owed by us in certain states in which we operate.
2004 Compared to 2003
Summary
We recorded total operating revenue of $90.4 million, income from operations of $7.2$6.1 million and net income of $10.3$9.1 million in 2004. By comparison, in 2003, we recorded total operating revenue of $50.0 million, income from operations of $3.9$2.9 million and net income of $4.3$3.3 million.
During 2004, we added two aircraft to our fleet, bringing the total number of aircraft in the fleet to ten and the total number of aircraft in service to nine. The growth in our fleet generated an increase of 3,062 departures, or 57.7%, and an increase of 604.3 million ASMs, or 98.4% in 2004 compared to 2003. ASM growth exceeded the growth in departures due to a 21.7% increase in average stage length from 779 in 2003 to 948 miles in 2004.
Our mix of business changed in 2004 as scheduled service ASMs increased 153.6% and represented 57.0% of total ASMs in 2004 compared to 44.6% in 2003.
Operating Revenue
Our operating revenue for 2004 increased $40.4 million or 80.8% compared to 2003, which was driven by a 109.5% increase in RPMs. Load factor improved by 4.0 percentage points, but RASM decreased 8.7% due largely to the longer average stage length in 2004 compared to 2003.
Scheduled service revenues increased 105.4% in 2004 to $46.2 million compared to $22.5 million in 2003.2003 as we added aircraft and scheduled service to more small cities. RPMs increased by 154.8% on a 153.6% increase in ASMs, which resulted in a relatively unchanged load factor. Average stage length increased 25.9% from 725 in 2003 to 913 in 2004 contributing to a decline in yield of 19.4% in 2004 compared to 2003. RASM decreased 19.1%.
Fixed fee contract revenues:
Fixed fee contract revenues were $41.0 million in 2004, up 54.3% versus $26.6 million in 2003 due primarily to an increase in flying.flying for Apple Vacations West as we operated one major program for them in 2003 and two major programs in 2004. Fixed fee contract revenues as a percentage of total revenues decreased 7.8 percentage points to 45.4% in 2004 from 53.2% in 2003.
Ancillary revenues:
Ancillary revenues increased 254.6% to $3.1 million in 2004 or 6.8% of scheduled service revenue, compared to $0.9 million for 2003, or 3.9% of scheduled service revenue.2003. The increase in ancillary revenues resulted from a 105.3% increase in the number of scheduled service passengers and a 72.6% increase in ancillary revenue per passenger from $3.40 to $5.87 due primarily to the sale of new products.
Operating Expenses
Our operating expenses for 2004 increased $37.1$37.2 million or 80.4%79.1% compared to 2003. During 2004 our financial results were significantly impacted by the dramatic increase in the price of aircraft fuel.
In general, our operating expenses are significantly affected by changes in our capacity, as measured by ASMs. The following table presents our unit costs, defined as operating expense per ASM, for the indicated periods.
| | Twelve months ended December 31, | | Twelve months ended December 31, | | ||||||||||
|---|---|---|---|---|---|---|---|---|---|---|---|---|---|---|
| | Percentage Change | Percentage Change | ||||||||||||
| | 2003 | 2004 | 2003 | 2004 | ||||||||||
| Aircraft fuel | 1.91 | ¢ | 2.29 | ¢ | 19.9 | % | 1.91 | ¢ | 2.29 | ¢ | 19.9 | % | ||
| Salary and benefits | 1.33 | 1.26 | (5.3 | ) | 1.33 | 1.26 | (5.3 | ) | ||||||
| Station operations | 1.31 | 1.12 | (14.5 | ) | 1.31 | 1.12 | (14.5 | ) | ||||||
| Maintenance and repairs | 0.84 | 0.67 | (20.2 | ) | 1.00 | 0.77 | (23.0 | ) | ||||||
| Sales and marketing | 0.39 | 0.29 | (25.6 | ) | 0.39 | 0.29 | (25.6 | ) | ||||||
| Aircraft lease rentals | 0.51 | 0.32 | (37.3 | ) | 0.51 | 0.32 | (37.3 | ) | ||||||
| Depreciation and amortization | 0.19 | 0.18 | (5.3 | ) | 0.19 | 0.18 | (5.3 | ) | ||||||
| Other | 1.02 | 0.69 | (32.4 | ) | 1.02 | 0.69 | (32.4 | ) | ||||||
| Operating CASM | 7.50 | ¢ | 6.82 | ¢ | (9.1 | %) | ||||||||
| Operating CASM, excluding fuel | 5.59 | ¢ | 4.53 | ¢ | (19.0 | %) | ||||||||
| CASM | 7.66 | ¢ | 6.92 | ¢ | (9.7 | %) | ||||||||
| CASM, excluding fuel | 5.75 | ¢ | 4.63 | ¢ | (19.5 | %) | ||||||||
Aircraft fuel expense. Aircraft fuel expense increased 137.5%, or $16.2 million, to $27.9 million in 2004 compared to $11.8 million in 2003. This change was due to an 88.6% increase in gallons consumed and a 25.9% increase in the average cost per gallon to $1.41 per gallon in 2004 compared to $1.12 per gallon in 2003.
Salary and benefits expense. Salary and benefits expense increased 88.1% to $15.4 million for 2004 compared to $8.2 million for 2003. This increase is largely attributable to a 38.7% increase in full timefull-time equivalent employees in connection with our growth. We employed approximately 391 full-time
equivalent employees as of December 31, 2004, compared to 282 full-time equivalent employees as of December 31, 2003.
Station operations expense. Station operations expense increased by 69.2%, or $5.6 million, to $13.6 million due to a 57.7% increase in departures. On a CASM basis, this expense decreased 14.5% from 1.31¢ in 2003 to 1.12¢ in 2004.2004, despite greater fixed fee flying which generally has a higher per departure cost.
Maintenance and repairs expense. Maintenance and repairs expense increased 59.9%52.7% to $8.2$9.4 million in 2004 compared to 2003, but declined 20.2%23.0% on a CASM basis. The increase in expense was due to fleet growth and the decrease in CASM was due to the longer average stage length.
Sales and marketing expense. Sales and marketing expense increased 48.8% to $3.5 million for 2004 compared to $2.4 million for 2003. However, this resulted in a 25.6% decrease on a CASM basis due to a longer average stage length. The increase in expense results from a higher percentage of scheduled service revenue as a percentage of total revenue (51.2% in 2004 and 45.1% in 2003) as there is less sales and marketing expense associated with our fixed fee flying which constituted a smaller percentage of revenue in 2004. In addition, increased credit card discount fees.fees contributed to the increase. The increase in credit card fees was associated with a 105.4% increase in scheduled service revenue in 2004 compared to 2003. Expense per scheduled service departure declined 20.9% from $934 to $739, partially attributable to a further increase in sales through our website, our least expensive distribution channel.
Aircraft lease rentals expense. Aircraft lease rentals expense increased by 22.6% to $3.8 million in 2004 compared to $3.1 million in 2003 due to the addition of two leased aircraft in 2004 and the full year expense in 2004 for one aircraft leased in late 2003. On a CASM basis, aircraft lease rentals expense decreased 37.3% in 2004 versus 2003 due to an increase in the number of owned versus leased aircraft in 2004 versus 2003.
Depreciation and amortization expense. Depreciation and amortization expense was $2.2 million in 2004 compared to $1.2 million in 2003, representing an 84.8% increase but a 5.3% decrease on a CASM basis. The increase in expense in 2004 was primarily due to the impact of a full year's depreciation on three aircraft purchased during 2003.
Other expense. Other expense increased by 34.9% to $8.4 million in 2004 compared to $6.3 million in 2003 due mainly to increases in aviation insurance, administrative, facilities and training expenses associated with our company's growth.
Other (Income) Expense
Other income increased by $2.7 million. Realized and unrealized gains on fuel derivative contracts that did not qualify for hedge accounting treatment increased from $0.3 million in 2003 to $4.4 million in 2004. Because our fuel derivative contracts do not qualify for hedge accounting under Statement of Financial Standards No. 133,Accounting for Derivative Instruments and Hedging Activities, we recognize changes in the fair value of our derivatives when they occur, rather than when the contracts settle. Other (income) expense in 2003 included income of $0.9 million as a government reimbursement under the Emergency Wartime Supplemental Appropriations Act (the "Wartime Act"). The Wartime Act provided for compensation to domestic air carriers based on their proportionate share of passenger security and air carrier infrastructure security fees paid by those carriers through the April 16, 2003 date of enactment of the legislation. Interest expense increased from $0.8 million in 2003 to $1.4 million in 2004 due to aircraft purchases and financings.
LIQUIDITY AND CAPITAL RESOURCES
Our primary sources of funds are cash provided by operations and cash provided by financing activities. Our primary uses of cash are for working capital, capital expenditures and general corporate purposes. Historically, we have been able to fund our short-term needs for capital by way of cash generated from operations. Our long-term needs for capital would generally be for the purchase of additional aircraft. To the extent financing is not available on acceptable terms, we would apply our cash assets to the purchase of aircraft. If we do not have sufficient cash assets available for this purpose at that time, then we would consider leasing aircraft or deferring their acquisition.
Our total cash, including cash and cash equivalents, restricted cash and short-term investments totaled $53.0 million, $56.9 million and $13.4 million at September 30, 2006, and December 31, 2005, and 2004, respectively. Short-term investments represent marketable securities which are available for sale. Restricted cash represents credit card deposits, escrowed funds under fixed fee flying contracts and other deposits.cash collateral against letters of credit.
Our restricted cash balances declined by $8.2 million from December 31, 2004 to December 31, 2005, as a result of more favorable terms with our credit card processing bank. Restricted cash balances increased $4.4 million from December 31, 2005 to September 30, 2006 due primarily to increased letters of credit issued to our hotel vendors. As of September 30, 2006 and December 31, 2005, we had $8.0 million and $3.4 million of restricted cash related to letters of credit, respectively.
Under our fixed fee flying contracts, we require our customers to prepay for flights to be provided by us. The prepayments are escrowed until the flight is completed. Prepayments are recorded as restricted cash and a corresponding amount is recorded as air traffic liability.
Operating activities. During the nine months ended September 30, 2006, we generated $24.3 million in cash from operating activities primarily as a result of increased passenger bookings for future travel. Operating activities in 2005 provided $44.0 million of cash compared to $10.5 million in 2004. The increase was primarily due to an increase in netoperating income and an increase in passenger bookings for future travel, coupled with reduced cash collateral requirements under a new credit card processing agreement.
Investing activities. Cash used by investing activities totaled $20.6 million for the nine months ended September 30, 2006. Investing activities in 2005 used $47.7 million in cash compared to $9.7 million in 2004. Our investing activities primarily consist of capital expenditures related to aircraft, aircraft purchase deposits and purchases of marketable securities for cash investments. Additionally, cash is used for the purchase of spare parts and equipment related to expanding our aircraft fleet. The increase in investing activities in 2005 was primarily driven by a $32.0 million increase in the purchase of investments available-for-sale.short-term investments.
Financing activities. During the nine months ended September 30, 2006, cash used by financing activities was $13.1 million consisting of principal payments on outstanding notes payable and capital lease obligations. Financing activities in 2005 provided $23.4 million of cash compared to $0.5 million in 2004. During 2005, we generated cash from the issuance of redeemable convertible preferred shares for $34.5 million, net of offering expenses, which was offset by debt repayments of $7.4 million.
Debt
Of the 2225 aircraft we have accepted delivery of as of December 31, 2005,September 30, 2006, we have secured debt financing on eight11 aircraft, and capital lease financing on five aircraft.aircraft, five aircraft are subject to operating leases and the remaining four aircraft are owned free and clear. We have financed the purchase of
eight 11 aircraft with notes for an aggregate amount of $37.2$35.9 million, which are scheduled to mature between
2008 and 2010.2011. The equipment notes bear interest at a fixed rate of 8.0% with principal and interest payable monthly. Each note is secured by a first mortgage on the aircraft to which it relates, and indebtedness for these aircraft is approximately $29.4 million as of December 31, 2005.relates.
Commitments and Contractual Obligations
The following table discloses aggregate information about our contractual cash obligations as of December 31, 2005 and the periods in which payments are due (in thousands):
| | Total | Less than 1 yr | 1 to 3 yrs | 3 to 5 yrs | More than 5 yrs | Total | Less than 1 yr | 1 to 3 yrs | 3 to 5 yrs | More than 5 yrs | ||||||||||
|---|---|---|---|---|---|---|---|---|---|---|---|---|---|---|---|---|---|---|---|---|
| Long-term debt obligations | $37,139 | $9,625 | $15,864 | $11,650 | $0 | $37,139 | $9,625 | $15,864 | $11,650 | $— | ||||||||||
| Capital lease obligations | 35,950 | 5,810 | 11,760 | 12,900 | 5,480 | 35,950 | 5,810 | 11,760 | 12,900 | 5,480 | ||||||||||
| Operating lease obligations | 17,684 | 6,725 | 9,569 | 1,390 | 0 | 17,684 | 6,725 | 9,569 | 1,390 | — | ||||||||||
| Total future payments on contractual obligations | $90,773 | $22,160 | $37,193 | $25,940 | $5,480 | $90,773 | $22,160 | $37,193 | $25,940 | $5,480 | ||||||||||
The long-term debt obligations listed in the above table include scheduled interest payments.
Off-Balance Sheet Arrangements
We have significant obligations for aircraft that are classified as operating leases and therefore are not reflected on our balance sheet. As of December 31, 2005, eight of the 22 aircraft in our fleet (of which 17 were in revenue service) were subject to operating leases. These leases expire in 2007 or 2008. Payments due under these operating leases are as follows (in thousands): 2006—$5,643; 2007—$5,763; and 2008—$2,081.
Since December 31, 2005, we purchased three of our aircraft that were previously under operating leases. As a result, the payments due under operating leases will be reduced by (in thousands) $980 in 2006, $1,680 in 2007 and $980 in 2008.
Critical Accounting Policies and Estimates
The discussion and analysis of our financial condition and results of operations is based upon the our consolidated financial statements, which have been prepared in accordance with accounting principles generally accepted in the United States. The preparation of these financial statements requires us to make estimates and judgments that affect the reported amount of assets and liabilities, revenues and expenses, and related disclosure of contingent assets and liabilities at the date of our financial statements. Note 1 to our Consolidated Financial Statements provides a detailed discussion of our significant accounting policies for the year ended December 31, 2005.policies.
Critical accounting policies are defined as those policies that reflect significant judgments about matters that are inherently uncertain. These estimates and judgments affect the reported amount of assets and liabilities, revenues and expenses, and related disclosure of contingent assets and liabilities at the date of our financial statements. Our actual results may differ from these estimates under different assumptions or conditions. We believe our critical accounting policies are limited to those described below.
Revenue Recognition. PassengerScheduled service revenues consist of passenger revenue from air travel sold and ancillary revenueswhich is recognized when the travel-related service or transportation is provided or when the ticket expires unused. Nonrefundable tickets expire on the date of the intended flight, unless the date is extended by notification from the salecustomer in advance of hotel rooms, rental cars and other travel related services are recognized when service is provided. Cash collections and accounts receivable related to transportation servicesthe intended flight. Tickets sold, but not yet used, as well as unexpired credits, are included in air traffic liability.
Fixed fee contract revenues consists largely of long term agreements to provide charter service on a seasonal and ad hoc basis. Fixed fee contract revenues are recognized when the transportation is
provided. Under certain of our fixed fee contracts, if fuel exceeds a predetermined cost per gallon, reimbursements are received from the customer and netted against fuel expense.
Ancillary revenues are reportedgenerated from the sale of hotel rooms and rental cars, advance seat assignments, in-flight products and other items. Revenues from the sale of hotel rooms and rental cars are recognized at the time the room is occupied or rental car utilized. The amount of revenues attributed to each element of a bundled sale involving hotel rooms and rental cars in addition to airfare is determined in accordance with Emerging Issues Task Force ("EITF") No. 00-21:Revenue Arrangements with Multiple Deliverables. The sale of hotel rooms, rental cars and other ancillary products are recorded net of the direct cost attributableamounts paid to providing the ancillary products or services. Travelwholesale providers, travel agent commissions and relatedcredit card processing fees and are expensed when the associated revenue is recognized.reported in accordance with EITF No. 99-19:Reporting Revenue Gross As A Principal Versus Net As An Agent.
Accounting for Long-Lived Assets. When appropriate, we evaluate our long-lived assets in accordance with SFAS 144,Accounting for the Impairment or Disposal of Long-Lived Assets. We record impairment losses on long-lived assets used in operations when events or circumstances indicate that the assets may be impaired and the undiscounted cash flows estimated to be generated by those assets are less than the net book value of those assets. In making these determinations, we utilize certain
assumptions, including, but not limited to: (i) estimated fair market value of the assets; and (ii) estimated future cash flows expected to be generated by these assets, which are based on additional assumptions such as asset utilization, length of service the asset will be used in our operations, and estimated salvage values.
We have approximately $95.5 million of long-lived assets as of December 31, 2005 on a cost basis, which includes approximately $93.0 million of aircraft and related flight equipment.
MaintenanceAircraft maintenance and Repair Costs.repair costs. Maintenance activitiesand repair costs for flight equipment are accounted for underusing the direct expense method. Under this method, which involves chargingmaintenance and repair costs for owned and leased aircraft, including major overhaul maintenance costs, are charged to operating expenses as incurred. Maintenance payments required underdeposits paid to aircraft lessors in advance of the performance of major maintenance activities are recorded as prepaid maintenance deposits, and then recognized as maintenance expense when the underlying maintenance is performed. These deposits are calculated based on a performance measure, such as flight hours or cycles, and are available for reimbursement to us upon the completion of the maintenance of the leased aircraft. If there are sufficient funds on deposit to reimburse us for the invoices initially paid by us for these maintenance events, they are reimbursed to us. Under most of our existing aircraft lease agreements, if we exercise our option to purchase the aircraft and there are recordedexcess prepaid balances at the exercise of our purchase option, any excess amounts are applied to the purchase price as an additional down payment. If at any point we determine it is not probable we will recover amounts retained by the lessor through future maintenance events, such amounts are expensed.
The maintenance deposits paid under our lease agreements do not transfer either the obligation to maintain the aircraft or the cost risk associated with the maintenance activities to the aircraft lessor. In addition, we maintain the right to select any third-party maintenance provider. Therefore, we record these amounts as deposits untilon our balance sheet and then recognize maintenance expense when the underlying maintenance is performed, in accordance with our maintenance accounting policy. Maintenance deposits totaled $3.2 million and $4.4 million as of December 31, 2005 and September 30, 2006, respectively. Any amounts that are not probable of being used to fund future maintenance expense would be recognized as additional aircraft rental expense.
In determining whether it is probable that maintenance deposits will be used to fund the cost of maintenance events, we conduct the following analysis:
We have determined it is probable that all but an immaterial amount of the maintenance event occurs.deposits would be used to pay the expected costs of maintenance events during the term of the aircraft leases.
We review this asset (the maintenance deposits) for potential impairment in the preparation of our financial statements. Because there have been no material changes to the estimated cost of expected maintenance events during the remaining term of the leases, no impairment charge was recognized for the years ended December 31, 2003, 2004 and 2005, or for the nine months ended September 30, 2005 and 2006 (unaudited).
Fuel Derivatives. We account for fuel derivatives pursuant to the provisions of SFAS No. 133,Accounting For Derivative Instruments and Hedging Activities. Since we have not historically qualified for hedge accounting, changes in the fair value of these derivative contracts are required to be included in "Other (income) expense."
Short-term Investments. We maintain a liquid portfolio of investments that are available for current operations and to satisfy on-going obligations. We have classified our short-term investments as "available for sale" and accordingly, unrealized gains or losses are reported as a component of comprehensive income in shareholders'/members' equity.
Share-based compensation. We have issued common stock and stock options to executives and employees pursuant to our share option program. In addition we have issued warrants to the placement agent involved in our May 2005 issuance of redeemable convertible preferred shares. In July 2006, our board of directors authorized the issuance of 100,000 shares of restricted stock upon the effective date of our proposed initial public offering.
Prior to January 1, 2006, we accounted for our share-based compensation pursuant to the provisions of APB Opinion No. 25Accounting for Stock Issued to Employees, FIN No. 44Accounting for Certain Transactions involving Stock Compensation an Interpretation of APB No. 25 and SFAS No. 123.Accounting For Stock-Based Compensation. In addition, for equity based instruments issued to non-employees, we evaluate the guidance in EITF 96-18Accounting For Equity Instruments that are issued to other than Employees for acquiring, or in conjunction with selling, goods or services.
Our share based compensation programs are intended to grant awards priced at or above the fair market value of our common stock at the date of grant. Because our common stock is not publicly traded, we measure fair value based on a variety of metrics including the share price of "peer" group publicly traded airline companies and airline stock prices in general, consultation with third parties such as our investment advisors and outside consultants and individual attributes of our company including our existing financial condition as well as future operating prospects. We have historically used the Black Scholes option pricing model to establish the fair market value of our stock options and warrants and have supported our valuation assumptions based on the information sources identified above. In those situations where the fair market value of the common stock is equal to or less than the exercise
price of the stock option at the date of grant, no compensation expense has been recognized. Compensation expense would be recognized when the fair market value is greater than the exercise price of the stock option award and would be amortized over the vesting period. For direct purchases of common stock awarded to executives, the difference would be recognized immediately as compensation expense.
Our adoption of SFAS No. 123(R),Share Based Payment, as of January 1, 2006 requires the recording of stock-based compensation expense for issuances under our long-term incentive plan over the requisite service period using a fair value approach similar to the prior pro forma disclosure requirements of SFAS No. 123,Accounting for Stock-Based Compensation. SFAS No. 123(R) does not mandate an option-pricing model to be used in determining fair value, but requires that the model selected consider certain variables. Different models would result in different valuations. Regardless of the method selected, significant judgment is required for some of the valuation variables. The most significant of these is the volatility of our common stock and the estimated term over which our stock options will be outstanding. The valuation calculation is sensitive to even slight changes in these estimates. Although there will be no impact to our overall cash flows, the adoption of SFAS No. 123(R) will have a significant impact on our results of operations.
In July 2006, our board approved the grant of 100,000 restricted shares under our long-term incentive plan to be allocated as of the date of our initial public offering among our employees at the manager level or below. As required by SFAS No. 123(R), the fair value of the shares at the date of issuance, which will be based on our initial offering price, will be expensed ratably over the three-year vesting period. The total compensation expense from this restricted share grant would be $16.00 per share based on the midpoint of the range set forth on the cover page of this prospectus for a total expense of $1.6 million which will be recognized over a three-year period.
Prior to this offering there was no public market for our common stock, and in connection with our issuance of stock or granting of stock options, the fair value for our common stock was estimated by our board of directors. Our board of directors exercised judgment in determining the estimated fair value of our common stock on the date of sale or grant. Stock-based compensation expense, which is a non-cash charge, is to be recognized upon the sale of shares to management or the grant of stock options at prices that, for financial reporting purposes, are deemed to be below the estimated fair value of the underlying common stock on the date of sale or grant.
In August 2003, we sold 1,750,000 shares of our stock to four of our officers at a price of $0.10 per share. In establishing this per share price, we determined that the value of our company at that time was $675,000. In making this determination, our board considered the following factors:
We did not obtain a contemporaneous valuation from an independent valuation specialist at the issuance date because we believed our estimate of the fair value of our common stock to be reasonable
and consistent with our understanding of how similarly situated companies in our industry are valued. We also considered additional factors, such as: (i) Maurice Gallagher, Jr., who owned 80% of our company at that time, was an active and experienced investor in privately held companies and was familiar with valuation techniques; (ii) the sale of the shares was an arms-length transaction in that a majority of the members of the board at that time owned 100% of the stock of our company prior to that point and the sale of shares at below fair market value would have adversely affected the value of their personal holdings of the stock; and (iii) it is common practice for privately held companies in early stages to avoid the cost and delay of obtaining independent valuations of stock when issuing stock to management.
To support this valuation, we have performed a retrospective valuation with the assistance of our investment bankers. The valuation analysis was conducted by analyzing public market comparable valuations of public airline companies that we viewed, at the relevant specific point in time, as having similar businesses and operations to us. Specifically, the valuation model we used in the retrospective analysis derived our enterprise value at the date the common stock was issued and then divided the result by the then common stock equivalents to determine the "market value" of our common stock at that point in time. The enterprise value at the time of issuance of the common stock to our officers was based on a multiple of EBITDAR for the preceding four quarters, with adjustments to the value for the amount of our cash, cash equivalents, short-term investments and long-term debt. The EBITDAR multiple was determined by reference to a peer group of public companies with businesses and operations we believed to be comparable to ours at the time and with discounts to the public company EBITDAR multiples to take into account our private company and small cap status. As a result of this valuation analysis, we have determined that the fair market value of our common stock as of August 2003 was equal to or less than the sale price of the stock issued and there was no stock based compensation to be recognized and recorded in operating expenses from this transaction.
During 2005 and 2006, we granted stock options to various employees. In determining the price at which stock options were granted, our board considered various factors, including, among others, transactions in our securities, key milestones achieved in our business and our financial performance. Below is a chart listing the stock options granted during 2005 and 2006 and their respective exercise prices:
| Date of Grant | Shares Granted | Exercise Price | ||
|---|---|---|---|---|
| February 2005 | 339,000 | $3.50 | ||
| June 2005 | 25,000 | $4.00 | ||
| September 2005 | 20,000 | $4.50 | ||
| April and May 2006 | 47,000 | $13.00 |
In connection with the preparation for the initial public offering of our common stock, we reassessed the valuations of our common stock during 2005 and 2006, in light of the AICPA's Practice Aid Valuation of Privately-Held-Company Equity Securities Issued as Compensation, which we refer to as the practice aid. The reassessed value, which is the per share fair value of our common stock determined in hindsight, is for the purpose of financial accounting for employee stock-based compensation. In conducting this assessment, we took into consideration the market approach to valuation as set forth in the practice aid, determining the enterprise value and "market value" as described above. We believe the valuation methodologies we used prior to this public offering are consistent with the practice aid. Based on the foregoing analysis, we concluded that for all options granted during 2005 and 2006, in no case did the fair value of our common stock, for financial reporting purposes, exceed the exercise price for these options at the time of grant.
We believe that the increase in fair value per share from the $0.10 per share value used in the sale of shares to our officers in August 2003 to the $3.50 per share value used for the options granted in February 2005 was attributable to the following factors:
We believe that the increase in fair value per share from the $3.50 per share value used for the options granted in February 2005 to the $4.00 per share value used for the options granted in June 2005 was attributable to the following factors:
We believe that the increase in fair value per share from the $4.00 per share value used for the options granted in June 2005 to the $4.50 per share value used for the options granted in September 2005 was attributable to the following factors:
We believe that the increase in fair value per share from the $4.50 per share value used for the options granted in September 2005 to the $13.00 per share value used for the options granted in April and May 2006 was attributable to the following factors:
We believe that we have used reasonable methodologies, approaches and assumptions consistent with the practice aid to determine the fair value of our common stock. For this reason, we have determined that all of our stock options have been granted at a price per share equal to or in excess of the fair market value of our common stock at the time of grant.
Newly Issued Accounting Pronouncements
In December 2004, the FASB issued SFAS No. 123(R),Share-Based Payments. SFAS No. 123(R) revised FASB Statement No. 123,Accounting for Stock-Based Compensation and supersedes APB Opinion No. 25,Accounting for Stock Issued to Employees. SFAS No. 123(R) focuses primarily on the accounting for transactions in which an entity obtains employee services in share-based payment transactions. SFAS No. 123(R) requires non-public companies to recognize in the statement of operations the cost of employee services received in exchange for awards of equity instruments based on the grant-date fair value of those awards (with limited exceptions). SFAS No. 123(R) is effective as of the first fiscal year beginning after December 15, 2005. Accordingly, we will adoptadopted SFAS No. 123(R) in the first quarter of fiscal 2006. We are currently evaluating the impact of adopting SFAS No. 123(R). However, the amount of future stock based compensation expense pursuant to SFAS No. 123(R) will be largely dependent upon the amount and timing of stock awards issued in future periods.
In May 2005, the FASB issued SFAS No. 154,Accounting Changes and Error Corrections. SFAS No. 154 replaces APB Opinion No. 20,Accounting Changes and SFAS No. 3,Reporting Accounting Changes in Interim Financial Statements. SFAS No. 154 requires that a voluntary change in accounting principle be applied retrospectively, with all prior period financial statements presented on the basis of the new accounting principle unless it is impracticable to do so. SFAS No. 154 also provides that a change in method of depreciating or amortizing a long-lived nonfinancial asset be accounted for as a change in estimate effected by a change in accounting principle and that correction of errors in previously issued financial statement should be termed a "restatement." SFAS No. 154 is effective for accounting changes and correction of errors made in fiscal years beginning after December 15, 2005. The adoption of SFAS No. 154 may impact our future results of operations, financial position or cash flows depending on changes or corrections made in future periods.
In June 2006, the FASB issued Interpretation No. 48,Accounting for Uncertainty in Incomes Taxes—An interpretation of FASB Statement No. 109, or FIN 48, which clarifies the accounting and disclosure requirements for uncertainty in tax positions, as defined. Under FIN 48, a tax position must be at least more-likely-than-not to be sustained, based solely on its technical merits, upon examination by the relevant taxing authority before a benefit is recognized in the financial statements. FIN 48 also provides guidance on derecognition, measurement, classification, interest and penalties, accounting in interim periods, disclosure and transition. We are currently evaluating the provisions of FIN 48, which is effective for fiscal years beginning after December 15, 2006.
In September 2006, the FASB issued SFAS No. 157,Fair Value Measurements, or SFAS 157, which clarifies the definition of fair value, establishes guidelines for measuring fair value, and expands disclosures regarding fair value measurements. SFAS 157 does not require any new fair value measurements and eliminates inconsistencies in guidance found in various prior accounting pronouncements. SFAS 157 will be effective for the Company on January 1, 2008. We are currently evaluating the impact of adopting SFAS 157 on our financial position, cash flows, and results of operations.
In September 2006, the Securities and Exchange Commission ("SEC") released Staff Accounting Bulletin No. 108,Considering the Effects of Prior Year Misstatements when Quantifying Misstatements in Current Year Financial Statements, or SAB 108. SAB 108 provides interpretive guidance on the SEC's views on how the effects of the carryover or reversal of prior year misstatements should be considered in quantifying a current year misstatement. The provisions of SAB 108 will be effective for us for the
fiscal year ended December 31, 2006. We are currently evaluating the impact of applying SAB 108 but do not believe that the application of SAB 108 will have a material effect on our financial position, cash flows, and results of operations.
Market Risk-Sensitive Instruments and Positions
We are subject to certain market risks, including commodity prices (specifically, aircraft fuel). The adverse effects of changes in these markets pose a potential loss as discussed below. The sensitivity analysis does not consider the effects that such adverse changes may have on overall economic activity,
nor does it consider additional actions we may take to mitigate our exposure to such changes. Actual results may differ. See the Notes to the Consolidated Financial Statements for a description of our financial accounting policies and additional information.
Aircraft Fuel
Our results of operations can be significantly impacted by changes in the price and availability of aircraft fuel. Aircraft fuel expense for the years ended 2005 and 2004 represented approximately 42.4% and 33.6%33.1% of our operating expenses, respectively. Increases in fuel prices or a shortage of supply could have a material effect on our operations and operating results. Based on our 2005 fuel consumption, a 10% increase in the average price per gallon of aircraft fuel for the year ended December 31, 2005, would have increased fuel expense for the twelve month period by approximately $5.3 million. To manage the aircraft fuel price risk, we use jet fuel and heating oil option contracts or swap agreements. As of December 31, 2005, we had hedged approximately 6.4% of our projected 2006 fuel requirements. All existing hedge contracts settle by the end of 2006.April, 2007.
The fair value of our fuel derivative contracts as of December 31, 2005 was $20,000. We measure the fair value of the derivative instruments based on either quoted market prices or values provided by the counterparty. Changes in the related commodity derivative instrument cash flows may change by more or less than this amount based upon further fluctuations in futures prices. Outstanding financial derivative instruments expose us to credit loss in the event of nonperformance by the counterparties to the agreements. However, we do not expect the counterparties to fail to meet their obligations. The credit exposure related to these jet fuel forward contracts is $160,000, represented by the fair value of contracts with a positive fair value at December 31, 2005.
Interest Rates
We do not believe we have significant exposure to changing interest rates as our long-term debt consists principally of fixed rate notes payable and capital lease arrangements at December 31, 2005.September 30, 2006. We do not purchase or hold any derivative instruments to protect against the effects of changes in interest rates.
We provide leisure travel solutions to people living in small cities across the United States. We currently provide service to customers in 3545 small cities with(including seasonal service) and have announced the commencement of service to three additional small cities in December 2006 and first quarter 2007. These 48 small cities have an aggregate population of over 4050 million within a 50-mile radius of the airports in those cities. We have identified anat least 52 additional 65 cities in the United States and Canada with similar characteristics representingand where we do not presently have any arrangements for service. These cities represent an estimated population of over 6050 million people that we could potentially serve to our existing Las Vegas, Orlando and OrlandoTampa/St. Petersburg destinations. We serve our customers by offering nonstop low fare scheduled air service to world-class leisure destinations and selling vacation packages connected to our air service.
Airline Industry:
TheWe believe the scheduled passenger airline industry in the U.S. can be divided into three categories—legacy carriers, regional airlines and low-cost carriers, or LCCs. The U.S. airline industry has long been dominated by legacy carriers, which consist of Alaska Airlines, Inc., American Airlines, Inc., Continental Airlines, Inc., Delta Air Lines, Inc., Northwest Airlines, Inc., Trans World Airlines, Inc. prior to its acquisition by AMR Corp., United Air Lines Inc., and US Airways, Inc. (prior to 2005). The legacy carriers offer scheduled flights to most large cities within the United States and abroad and also serve numerous smaller cities. All legacy carriers have adopted the "hub and spoke" route system. This system concentrates most of an airline's operations at a limited number of hub cities, serving most other destinations in the system by providing one-stop or connecting service through the hub.
Regional airlines, such as Chautauqua Airlines, Inc., ExpressJet Airlines, Inc., Mesa Air Group, Inc. and SkyWest Airlines, Inc., typically operate smaller aircraft on lower-volume routes under contract with major U.S. airlines. In contrast to LCCs, regional airlines generally do not try to establish an independent route system to compete with U.S. legacy carriers. Rather, regional airlines typically enter into relationships with one or more legacy carriers under which the regional airline agrees to use its smaller aircraft to carry passengers booked and ticketed by the legacy carrier between one of its hubs and a smaller outlying city.
We believe we are considered a member of the third category, the LCCs. The principal LCCs in the U.S. today are AirTran Airways, Inc., America West Airlines, Inc., Frontier Airlines, Inc., JetBlue Airways Corporation, Southwest Airlines Co., and US Airways, Inc. (starting in 2005). Previously, the airlines referred to as LCCs were also referred to as "low fare airlines." However since the spring of 2001, all U.S. airlines have offered low fares, as fares declined from the high levels of the late 1990s and the year 2000. Only a small group of carriers, typically airlines founded since deregulation of U.S. airfares in 1978, have low costs as well. Hence, the industry players formerly known as "low fare airlines" are now more aptly known as low costlow-cost carriers. Some of the legacy carriers have attempted to operate in-house LCCs. Examples include Metrojet (US Airways), Song (Delta), Delta Express, Shuttle by United, Continental Lite, Ted (United) and others. We believe most of these efforts have been unsuccessful.
In the year ended December 31, 2005, the total market for air travel was 746.9 million passengers, ahead of 634.5 million in 2004 and 599.9 million total passengers carried in the full year 2000, the last full year before the 9/11 attacks. We believe the market will continue its recent passenger growth rate, and overall industry growth stands to be favorably influenced by the spread of LCCs as low fares tend to stimulate more overall trips taken.
LCCs have been gaining market share versus legacy carriers since 1995, gaining an average of 9.1 million domestic passengers a year between 1995 and 2005. However, the shift accelerated sharply
in 2001 following the events of 9/11, which caused the legacy carriers to cut mainline capacity. Mainline capacity at the legacy carriers decreased 18.0% between 2000 and 2005, while the publicly-traded LCCs grew their capacity 106.5% and, in general, prospered. The shift in market share also accelerated, with
LCCs now possessing 34.2% domestic market share in 2005 when compared against the mainline operations of the legacy carriers.
The graph below presents total domestic passenger traffic (excluding traffic carried by regional airlines), and illustrates the growing market share of the LCCs.
Total Domestic Mainline Passenger Volume (in millions)(1)
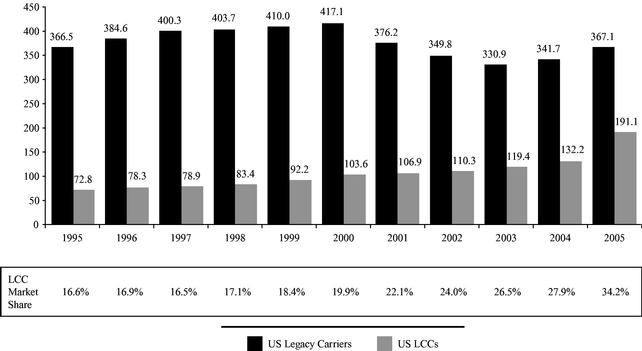
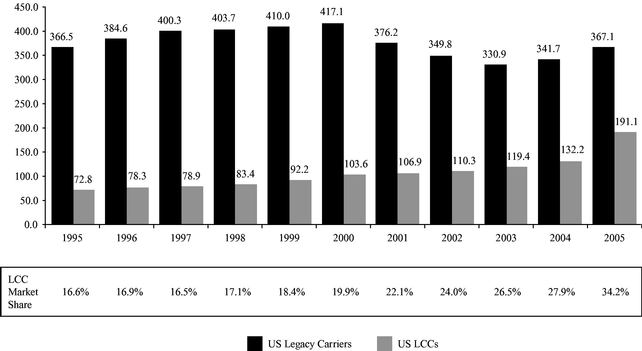
The reduction of industry airfares in the face of high costs explains the reduction in market share for the legacy carriers and their ongoing financial difficulties. This price/cost squeeze was brought about by rising labor costs and record fuel prices coupled with a drop in airfares. The reduction in airfares can be attributed to the slow down in the economy following the burst of the technology bubble in 2000, the 9/11 attacks, the growing fare transparency due to the Internet, and the proliferation of LCCs. We believe that LCCs are currently the driving force changing the structure of the U.S. airline industry as a group and are well positioned to continue the trend of gaining market share from the legacy carriers.
Leisure Air Travel
For decades, the legacy carriers built their airlines to focus on delivering services primarily to the business passenger. Historically these passengers have been responsible for a disproportionate percentage of revenue due to the premium fares they have been willing to pay for such benefits as schedule frequency, frequent flyer programs, meals and first-class upgrades.
We believe leisure passengers are fundamentally different as they are generally more price sensitive than business travelers. While they consider the schedule offered, we do not believe that having
multiple frequencies and flight options is their first priority. As a result, they are typically unwilling to pay a premium for the benefit of multiple frequencies.
While focusing their efforts on serving the needs of the business passenger, the legacy carriers have also tried to serve the leisure customer by selling spare capacity at lower rates. Although this approach may be effective when marketing to leisure customers who reside in hubs, leisure passengers residing in smaller, non-hub cities are forced to connect at a hub city in order to reach the most popular leisure destinations. Additionally, recent trends have been toward replacing larger jets with smaller regional jets flying from spoke markets into hubs. Smaller jets have less spare capacity with which to serve leisure customers. The smaller regional jets also require higher fares to cover their more expensive unit costs. Alternatively, LCCs have historically focused on serving leisure travelers in larger cities, as have tour operators, such as Funjet Vacations and Apple Vacations. As a result, we believe there is an opportunity to provide leisure travelers in small cities nonstop low fare travel to world-class leisure destinations.
Travel & Tourism Industry
The travel and tourism industry is among the largest in the U.S. According to the World Travel & Tourism Council, travel and tourism industry jobs are estimated to account for 4.1% of total employment in 2006, or 5,834,000 jobs. Personal travel and tourism consumption is estimated to be $862.0 billion or 9.4% of total personal consumption in 2006, up from $763.6 billion in 2004 and an estimated $815.9 billion in 2005. We believe current demographic trends in the U.S., namely the aging of baby boomers, will support the growth of the travel and tourism industry going forward. As the baby boomer demographic enters into peak earning years we believe they will have more disposable income and time to spend on leisure travel. The World Travel & Tourism Council estimates by 2016, personal travel and tourism consumption will reach $1,437.4 billion or 9.5% of total consumption.
Las Vegas
Las Vegas is a world-class leisure destination that has exhibited strong and consistent growth over the last 25 years. With its gaming attractions, convention facilities, various shows and attractions, Las Vegas drew 38.6 million visitors in 2005, up from 37.4 million and 35.5 million in 2004 and 2003 respectively, according to the Las Vegas Convention and Visitors Authority.
Las Vegas Visitor Volume (in millions)
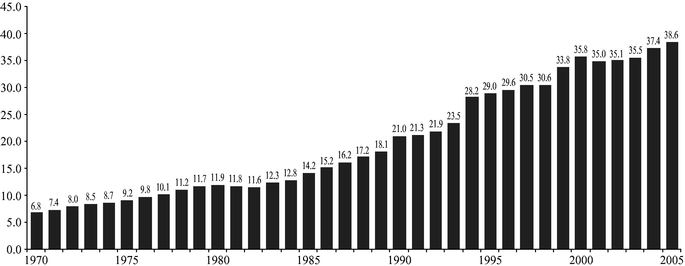
McCarran International Airport, which began operations in 1948 with 35,000 passengers a year, now serves more than 44 million passengers annually. McCarran was the 9th busiest airport in the world in 2005 according to the Airports Council International despite the fact that Las Vegas is a community with fewer than two million permanent residents. Approximately 80% of McCarran International Airport's traffic is tourism and convention-related. Airline traffic into Las Vegas continues to grow as McCarran's total passenger traffic increased 7.0% to 44.3 million in 2005 from 41.4 million in 2004. The chart below shows total enplaned/deplaned passengers at McCarran on an annual basis since 1970.
Las Vegas Enplaned/Deplaned Passengers (in millions)
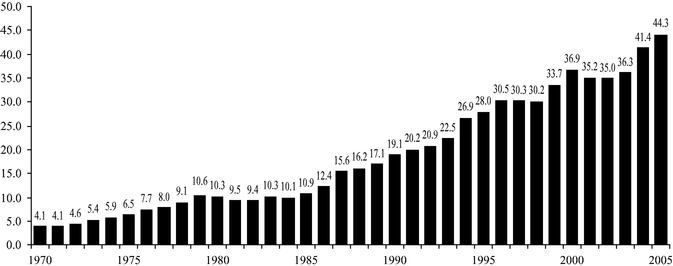
Historically, there has been a strong long-term correlation between the number of Las Vegas hotel rooms and Las Vegas commercial air passenger volume. We believe there is a correlation between new hotel rooms and the number of airline passengers per year, such that each new hotel room has resulted in an increase of 320 new (one-way) airline passengers per year. Las Vegas currently has over 130,000 hotel/motel rooms with publicly announced plans for construction of an additional 37,000 new rooms and 1,200 time share units over the next four years.
Las Vegas Hotel and Motel Room Supply (in thousands)
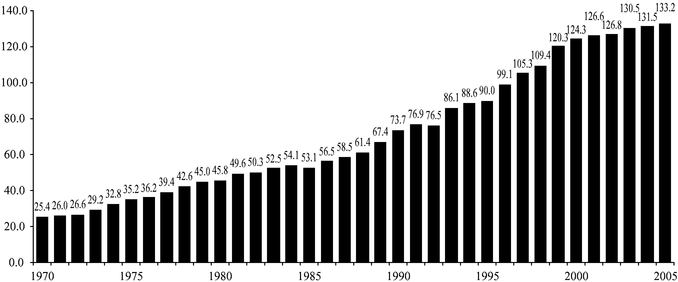
Las Vegas continues to demonstrate noteworthy hotel occupancy rates, a sign of the strength of the Las Vegas tourism market and economy, and an indication that planned new hotel rooms will be readily absorbed into the market. The Las Vegas market has not historically shown much seasonality, and travel to Las Vegas has demonstrated good performance during recessions. Las Vegas' total occupancy rate, including hotels and motels, increased to 89.2% in 2005 from 88.6% for 2004. The occupancy rate for hotels alone in 2005 was 91.8%. The graph below illustrates Las Vegas' average hotel/motel occupancy rate as published by the Las Vegas Convention and Visitors Authority.
Las Vegas Hotel and Motel Occupancy
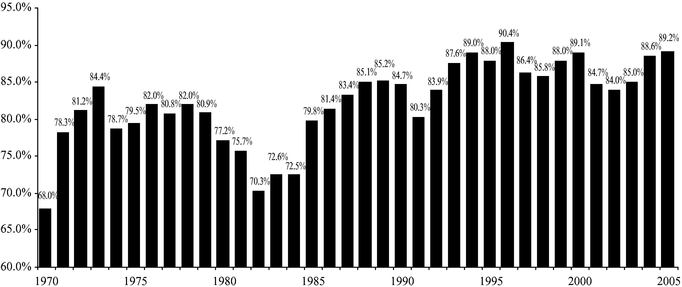
Orlando
Orlando is also a world-class leisure center and one of America's foremost family destinations. With its various theme parks and attractions, the metropolitan Orlando area drew 46.6 million domestic visitors in 2005, up from 29.2 million and 39.8 million in 1995 and 2000 respectively, according to the Orlando/Orange County Convention & Visitors Bureau, Inc.
Metro Orlando Domestic Visitor Volume (in millions)
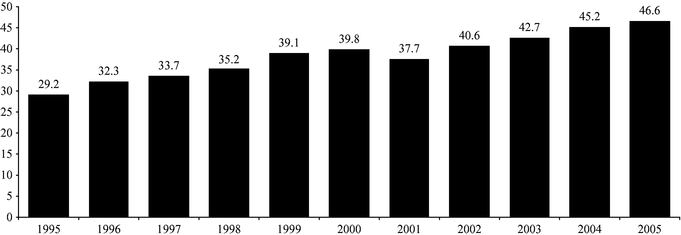
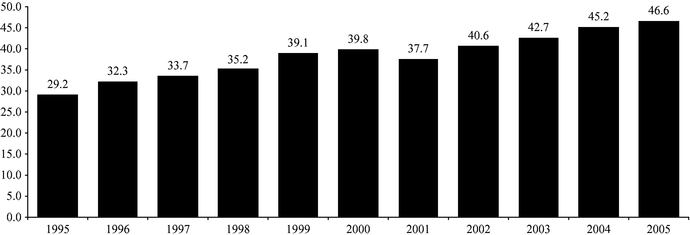
The Orlando market is served by two primary airports, Orlando International Airport and Orlando Sanford International Airport. We currently utilize Orlando Sanford International Airport, which is located 18 miles northeast of Orlando and is convenient to Daytona Beach and many other popular Atlantic beaches. The following chart shows total enplaned/deplaned passengers at Orlando International and Orlando Sanford International on an annual basis since 1971.
Orlando Enplaned/Deplaned Passengers (in millions)
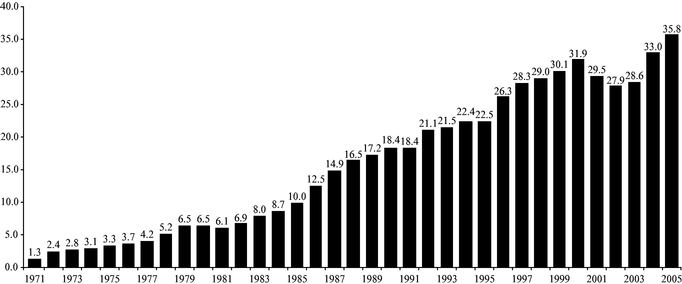
Tampa/St. Petersburg
Tampa/St. Petersburg is a popular beach vacation destination. For this reason we believe Tampa/St. Petersburg provides a distinct vacation alternative for our customers to Orlando, which is activity-focused.
The Tampa Bay area (in which Tampa/St. Petersburg lies) comprises four counties, Pinellas, Hillsborough, Manatee and Sarasota. Between the four counties, the Tampa Bay region has over 75,000 hotels, motels and other rooms available for visitor accommodation, compared to Orlando at over 110,000. The following graph shows overnight visitor volume for Pinellas and Hillsborough counties, according to the convention and visitors bureaus of each county.
Pinellas and Hillsborough Counties Visitor Volume (in millions)

The Tampa Bay market is served by three primary airports, Tampa International Airport, Sarasota Bradenton International Airport and St. Petersburg-Clearwater International Airport. We serve St. Petersburg-Clearwater International Airport, located in St. Petersburg and the closest of the three airports to the Gulf Coast beaches of Clearwater and nearby coastal communites. The following chart shows total enplaned/deplaned passengers at Tampa International, Sarasota Bradenton International and St. Petersburg-Clearwater International on an annual basis since 1985.
Tampa Area Enplaned/Deplaned Passengers (in millions)
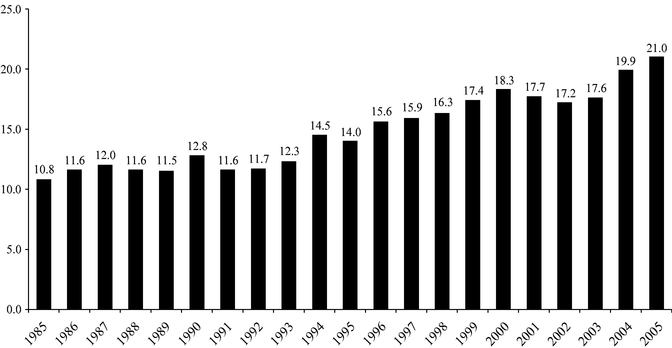
Business Overview
We are a leisure travel company focused on linking travelers in small cities to world-class leisure destinations such as Las Vegas, Nevada, Orlando, Florida and Orlando,Tampa/St. Petersburg, Florida. We operate a low-cost passenger airline marketed to leisure travelers in small cities, allowing us to sell air travel both on a stand-alone basis orand bundled with hotel rooms, rental cars and other travel related services. Our route network, pricing philosophy, advertising and diversified product offering built around relationships with premier leisure companies are all intended to appeal to leisure travelers and make it attractive for them to purchase air travel and related services from us.
Our business model provides for diversified revenue streams, which we believe distinguishes us from other U.S. airlines and other travel companies:
Our strategy is to develop the leisure travel market in small cities by providing nonstop low fare scheduled service to world-class leisure destinations. We currently provide service to Las Vegas, Nevada, and Orlando, Florida, twoand Tampa/St. Petersburg, Florida, three of the largest and most popular leisure destinations in the United States. We have positioned our business to take advantage of current lifestyle and demographic trends in the U.S. we believe are positive drivers for the leisure travel industry. The most notable demographic shift occurring in the U.S. is the aging of the baby boom generation as they enter their peak earning years and have more time and disposable income to spend on leisure travel. We believe a large percentage of our customers fall within the baby boomer demographic and we target these customers through the use of advertisements in approximately 290more than 410 print circulations.
Our business strategy has evolved as our experienced management team has looked differently at the traditional way business has been conducted in the airline industry. We have consciously strived to develop a different business model:
| Traditional Airline Approach | Allegiant Approach | |||||
|---|---|---|---|---|---|---|
| • | Focus on business traveler | • | Focus on leisure traveler | |||
| • | Provide high frequency service | • | Provide low frequency service from small cities | |||
| • | Use smaller aircraft to provide connecting service from smaller markets through business hubs | • | Use larger jet aircraft to provide nonstop service from small cities direct to leisure destinations | |||
| • | Sell through various intermediaries | • | Sell only directly to travelers without participation in global distribution systems | |||
| • | Offer flight connections | • | No connecting flights offered | |||
| • | Use frequent flyer programs and | • | Do not use frequent flyer programs or | |||
| • | Provide amenities to passengers free of charge whether or not they are of value to them | • | Provide amenities such as advance seat assignments, snacks, and drinks, at a small charge to passengers | |||
Our business model has allowed us to grow rapidly and to achieve attractive rates of profitability, even during the present climate of record high fuel costs. For the year ending December 31, 2005, we had revenue of $132.5, representing substantial growth of 46.6% over the year ended December 31, 2004, while maintaining an operating margin of 6.4%, which was higher than the U.S. legacy carriers and U.S. low costlow-cost carriers other than Southwest Airlines Co. Further,We had operating income of $6.1 million in 2004 and $8.5 million in 2005. Our net income was $9.1 million in 2004 and $7.3 million in 2005, the decline attributable to a substantially higher gain on fuel derivatives in 2004. In the first nine months of 2006, we had revenue of $180.2 million, operating income of $15.2 million and net income of $7.3$10.3 million, which was 94.9%, 134.3% and 33.7% higher than the first nine months of 2005, respectively.
We currently have fixed fee flying contracts with two separate subsidiaries of Harrah's Entertainment Inc., which collectively accounted for 20.6% of our total revenues in 2005.2004, 14.9% of our total revenues in 2005, and 8.5% of total revenues for the nine months ended September 30, 2006.
Our Competitive Strengths
We have developed a unique business model that focuses on leisure travelers in small cities. We believe the following strengths allow us to maintain a competitive advantage in the markets we serve:
Focus on Linking Small Cities to World-Class Leisure Destinations. We currently provide nonstop low fare scheduled air service from 3545 small cities (including seasonal service) to the world-class leisure destinations of Las Vegas, Nevada, Orlando, Florida, and Orlando,Tampa/St. Petersburg, Florida. We have announced service from three new small cities to commence in December 2006 and first quarter 2007. Frequently, when we enter a new market, we introduce nonstop service to Las Vegas or Orlandoour leisure destinations which previously did not exist. We believe this nonstop service, combined with our pricing philosophy and premier leisure company relationships, makes it attractive for leisure travelers to purchase air travel and related services from us. We selected Las Vegas and Orlando as our initial destination cities to capitalize on the popularity and promotion of both markets as leisure destinations. We expect to benefit from the strong projected growth of tourist visits to these markets. We believe Tampa/St. Petersburg will also be an attractive leisure destination for our small city markets.
By focusing on underserved small cities, we believe we avoid the overcapacity and intense competition presently seen in high traffic domestic air corridors (for example, New York to the Los Angeles basin). In our typical small city market, travelers faced high airfares, cumbersome connections and long drives to major airports to reach Las Vegas, Orlando or OrlandoTampa/St. Petersburg before the introduction of our service. In 3755 of our 4358 routes, we are the only carrier providing nonstop service to Las Vegas, Orlando or Orlando.Tampa/St. Petersburg. Of the 70 routes we will be serving by the end of first quarter 2007, there are only six routes with existing or announced service by other airlines. As a result, we believe we stimulate new traffic. Based on published data from the DOT, we believe the initiation of our service stimulates demand as there has been a substantial increase in traffic on the routes we serve. For these reasons, we believe our market strategy has had the benefit of not appearing
hostile to either legacy carriers, whose historical focus has been connecting small cities to business markets, or traditional LCCs, which have tended to focus on larger markets.
We believe it would be difficult for potential competitors to profitably contest our market positions with nonstop service as our markets are generally too small to support either two entrants or the high frequency service provided by most legacy carriers and LCCs. In addition, theseleisure routes from small city marketscities are generally too low-yielding for most carriers to prioritize. Moreover, while some of these markets may be suitable for service with regional jet equipment, we believe our unit costs are significantly less than the unit costs for most regional jets, making it difficult for the regional jet to effectively compete. Further, many of our markets have a stage length beyond the comfortable range of regional jet equipment.
Low Operating Costs. We believe low costs are essential to competitive success in the airline industry today. Our cost per available seat mile was 6.82��6.92¢ and 7.41¢ for the years ended December 31, 2004 and 2005, respectively. We believe our CASM for the year ended December 31, 2005 was approximately 31.2% lower than the average of the U.S. legacy airlines, and was approximately 18.3% lower than the average of the other LCCs. Our CASM for the first nine months of 2006 increased only 3.9% to 7.73¢ despite significantly higher fuel costs. Excluding the cost of fuel, our CASM was 4.63¢ for the year ended December 31, 2004, 4.27¢ for the year ended December 31, 2005, was 4.27¢.and 4.09¢ for the first nine months of 2006.
Our low operating costs are the result of our focus on the following factors:
weighing the performance and profitability benefits of doing so against the cost benefits of maintaining simplified operations.
aircraft as of December 31, 2005,September 30, 2006, which compares to an industry range of from 60 to more than 100 full-time equivalent employees per aircraft, based on publicly available information. Our high level of employee productivity is created by fleet commonality, fewer unproductive labor work rules, cost-driven scheduling, and the effective use of automation and part-time employees. Additionally, our highly integrated automation system allows us to minimize corporate overhead functions. We benefit from a highly motivated, enthusiastic workforce committed to high
standards of friendly and reliable service. We invest a significant amount of time and resources into carefully developing our training practices and selecting individuals to join our team who share our focus on ingenuity and continuous improvement. We conduct ongoing training programs to incorporate industry best practices and encourage strong and open communication channels among all of the members of our team so we can continue to improve the quality of the services we provide.
Growing Ancillary Revenues. Ancillary revenues are earned in conjunction with the sale of scheduled air service and represent a significant, growing revenue stream. Our ancillary revenues have grown from $3.1 million or 3.5% of total revenue in 2004, to $11.2 million or 8.4% of total revenue in 2005. In the fourth quarterfirst nine months of 2005,2006, ancillary revenues were $4.5 million, or 11.3%$21.2 million. On a per scheduled service passenger basis, our ancillary revenues increased by 96.8% from $5.87 per scheduled service passenger in 2004, to $11.55 in 2005 and increased further to $15.08 in the first nine months of our total revenue.2006. Ancillary revenue is derived from the sale of vacation packages including hotels, rental cars, show tickets, night club packages and other attractions; the sale of advance seat assignments; the sale of beverages, snacks and other products on board the aircraft; charging a fee for using our reservation center or website to purchase air travel; the collection of excess checked bag and overweight bag charges; and several smallerother revenue streams. The largest component of our ancillary revenue is from the sale of hotel rooms packaged with air travel. We have agreements with 3538 hotels in Las Vegas, including hotels managed by MGM MIRAGE, Harrah's Entertainment Inc., Boyd's Gaming Corp., Wynn Resorts, Limited, and Las Vegas Sands Corp., and 2218 hotels in Orlando.Orlando (plus 20 additional hotels in nearby Daytona Beach, Florida), seven hotels in Tampa/St. Petersburg and five in Palm Springs, California. For the monthfirst ten months of March 2006, we generated revenue from the sale of more than 27,000283,000 hotel room nights in the Las Vegas market.nights. We believe the favorable breadth and terms of these contracts would be difficult for others to replicate quickly. For the year ended
December 31, 2005, approximately 27.6% of our customers traveled on an itinerary that included a hotel room purchased from us.
Strong Financial Position. We have a strong financial position with significant cash balances. On December 31, 2005,September 30, 2006, we had $53.3$45.0 million of unrestricted cash and investments. On a pro forma basis as of December 31, 2005,September 30, 2006, to give effect to the receipt of approximately $$73.0 million in net proceeds from the sale of 5,000,000 shares of our common stock in this offering at an initial public offering price of $$16.00 per share, the midpoint of the range set forth on the cover page of this prospectus and the conversion of our preferred shares in the reorganization, our unrestricted cash would have been $$117.1 million, our total debt would have been $61.3 million and our debt to total capitalization ratio would have been %.32.5%. We also have a history of growing profitably, having generated 12 consecutive quartersnet income in 13 of profits.the last 15 quarters. We believe our strong financial position allows us to have greater financial flexibility to grow the business and weather sudden industry disruptions.
Proven Management Team and Financial Sponsors. We have a strong management team comprised of experienced and motivated individuals. Our management team is led by Maurice J. Gallagher, Jr., who has an extensive background in the airline industry. Mr. Gallagher was the president of WestAir Holdings, Inc. and built WestAir into one of the largest regional airlines in the U.S., prior to its sale in 1992 to Mesa Air Group. He was also one of the founders of ValuJet, Inc., which is known today as AirTran Holdings, Inc., which we believe was one of the most successful start-ups of a low-cost airlinecarrier in industry history. Three of our other executive officers are former managers of ValuJet or WestAir. Our early investors also have significant experience in the airline industry and were intimately involved in several airline successes. These include Robert L. Priddy, a founder and former chairman and chief executive officer of ValuJet, Inc. and Declan F. Ryan, a co-founder and former chief executive officer of Ryanair, the successful European low-cost carrier.
Our Business Strategy
To continue the growth of our business and increase our profitability, our strategy will be to continue to offer a single class of air travel service at low fares, while maintaining high-qualityhigh quality standards, keeping our operating costs low and pursuing ways to make our operations more efficient. We intend to grow by adding flights on existing routes, entering additional small cities, expanding our relationships with premier leisure companies, and providing service to more world-class leisure destinations.
The following are the key elements of our strategy:
Capitalize on Significant Growth Opportunities in Linking Small Cities to Leisure Destinations. We believe small cities represent a large untapped market, especially for leisure travel. We believe small city travelers have limited options to world-class leisure destinations as existing carriers are generally focused on connecting the small city "spokes" to their business hubs. We aim to become the premier travel brand for leisure travelers in small cities.
Since the beginning of 2004, we have expanded our scheduled air service to Las Vegas, Orlando or OrlandoTampa/St. Petersburg from six to 3545 small cities which(including seasonal service) and have announced service from three additional small cities to commence in December 2006 and first quarter 2007. These 48 small cities have an aggregate population in excess of 4050 million people within a 50-mile radius of the airports in those cities. In several of these cities, we provide service to both Las Vegas and Orlando.more than one of our leisure destinations. We expect to grow our current Las Vegas and Orlandothree initial leisure destinations by adding frequency from some existing markets and adding service from additional small cities. We have identified at least 6552 additional small cities in the U.S. and Canada where we cancould potentially offer our low fare nonstop service to Las Vegas or Orlando.our leisure destinations.
We also believe there are several other world-class leisure destinations that share many of the same characteristics as Las Vegas, Orlando and Orlando.Tampa/St. Petersburg. These potential markets include several popular vacation destinations in the U.S., Mexico and the Caribbean.
Develop New Sources of Revenue. We have identified three key areas where we believe we can grow our ancillary revenues:
Continue to Reduce Our Operating Costs. We intend to continue to focus on lowering our costs to remain one of the lowest cost airlines in the world, which we believe is instrumental to increasing profitability. We will drive operational efficiency and lower costs principally by growing our network. We will expand our network by increasing the frequency of our flights in existing markets, expanding the number of small cities we serve, and increasing the number of leisure destinations, all of which permits us to increase the utilization of our employees and assets, spreading our fixed costs over a larger number of available seat miles. In 2005 we averaged 183.7184.7 block hours per aircraft per month, whichwhile in the first nine months of 2006, we believe can be increased.averaged 204.0 block hours per aircraft per month.
Minimize Fixed Costs to Increase Strategic Flexibility. We believe our low aircraft ownership costs and the lower fixed costs associated with our small city market strategy provide us with a lower level of fixed costs than other U.S. airlines. We believe minimizing our level of fixed costs will provide us with added flexibility in scheduling our services and controlling our profitability. For example, with lower fixed costs we are better able to enter or exit markets as well as match the size and utilization of our fleet to limit unprofitable flying and maximize profitability. We match our frequency with the market demand on a daily and seasonal basis.
Business History
We were founded in 1997 and initially operated as Allegiant Air, Inc. under a different business strategy with a different management team. Prior to our bankruptcy filing in December 2000, we were owned by a single individual. Although Maurice J. Gallagher, Jr. provided some financing to us, neither he nor any other members of our current management were actively involved in our business. Prior to 2001, the focus of our business was ad hoc charters and a more traditional scheduled service product catering to the business traveler with multiple flights a day. At that time, we used DC-9 aircraft with a two-class configuration and served a small number of cities in the West.
This strategy was ultimately unsuccessful, and we filed for bankruptcy court protection in December 2000. A plan of reorganization was confirmed in June 2001. The key elements of the plan were: (i) debt held by Mr. Gallagher was restructured and Mr. Gallagher injected additional capital into our company; (ii) Mr. Gallagher became our majority owner; and (iii) a new management team was installed in June 2001. We emerged from bankruptcy in March 2002.
In May 2005, we completed a private placement under which ComVest Allegiant Holdings, Inc., Viva Air Limited and Timothy P. Flynn invested $34.5 million in preferred shares of our limited liability company predecessor. Simultaneously, Maurice J. Gallagher, Jr., our chief executive officer, converted $5.0 million of debt owed to him into preferred shares. All of our current directors were selected by these shareholders. The representation of these shareholders on our board of directors and the ownership by these shareholders of approximately 51.3% of our stock after this offering will allow these shareholders to exert significant control over our business in the future.
Certain of our existing stockholders have entered into a stock purchase agreement with PAR Investment Partners, L.P. ("PAR") for the private sale of 1,750,000 shares of our common stock. The proceeds to the selling stockholders, net of fees and discounts, will be approximately 93.0% of the initial public offering price. The closing of the transaction will occur simultaneously with the closing of this offering and is conditioned on the closing of this offering and certain other customary closing conditions. Following the closing of this offering and the sale of shares to PAR, it will beneficially own approximately 9.2% of the outstanding shares of our common stock, or approximately 8.8% if the underwriters exercise in full their option to purchase additional shares. In the event we file an amendment to the registration statement of which this prospectus forms a part because of a material change in the price range reflected on the cover page of this prospectus or in the number of shares being sold, PAR will have the option to terminate the stock purchase transaction.
In connection with the stock purchase transaction, we and the selling stockholders entered into an agency agreement with Merrill Lynch, Pierce, Fenner & Smith Incorporated, one of the underwriters of this offering, pursuant to which Merrill Lynch will receive a fee for arranging the stock purchase by PAR. Under the agency agreement, we have agreed to indemnify Merrill Lynch and the selling stockholders against certain liabilities, including liabilities under the Securities Act.
Routes and Schedules
Our current scheduled air service predominantly consists of limited frequency, nonstop flights into Las Vegas, Orlando and OrlandoTampa/St. Petersburg from 3545 small cities.cities (including seasonal service). Our route network, including announced service to be commenced in December 2006 and first quarter 2007, consists of the following:
LAS VEGAS
| Market | State | Departures per Week | ||
|---|---|---|---|---|
| Abilene | Texas | 2 | ||
| Bellingham | Washington | |||
| Belleville | Illinois | 2 | ||
| Billings | Montana | |||
| Bismarck | North Dakota | |||
| Cedar Rapids | Iowa | 4 | ||
| Colorado Springs | Colorado | 5 | ||
| Des Moines | Iowa | |||
| Duluth | Minnesota | 2 | ||
| Fargo | North Dakota | 2 | ||
| Fresno | California | |||
| Ft. | Colorado | 5 | ||
| Grand Junction | Colorado | 2 | ||
| Green Bay | Wisconsin | 4 | ||
| Idaho Falls | Idaho | 2 | ||
| Killeen | Texas | 2 | ||
| Knoxville(a) | Tennessee | 4 | ||
| Lansing | Michigan | |||
| Laredo | Texas | 2 | ||
| Lincoln | Nebraska | 2 | ||
| McAllen | Texas | 4 | ||
| Missoula | Montana | |||
| Palm | California | 2 | ||
| Peoria | Illinois | |||
| Rapid City | South Dakota | 2 | ||
| Rockford | Illinois | 4 | ||
| Santa Maria | California | |||
| Shreveport | Louisiana | 2 | ||
| Sioux Falls | South Dakota | 4 | ||
| South Bend | Indiana | 4 | ||
| Springfield | Missouri | 4 | ||
| Topeka | Kansas | 2 | ||
| Tri-Cities | Washington | |||
| Wichita | Kansas |
| Market | State | Departures per Week | ||
|---|---|---|---|---|
| Allentown | Pennsylvania | 4 | ||
| Belleville | Illinois | 2 | ||
| Cedar Rapids | Iowa | 2 | ||
| Chattanooga | Tennessee | 4 | ||
| Des Moines | Iowa | 4 | ||
| 3 | ||||
| Ft. Wayne(a) | Indiana | 2 | ||
| Greenville-Spartanburg | South Carolina | 4 | ||
| Huntington | West Virginia | 2 | ||
| Kinston | North Carolina | 2 | ||
| Lansing | Michigan | 4 | ||
| Texas | 2 | |||
| Newburgh | New York | 4 | ||
| Portsmouth(b) | New Hampshire | 2 | ||
| Roanoke | Virginia | 4 | ||
| Rockford | Illinois | |||
| Shreveport | Louisiana | 2 | ||
| Sioux | South Dakota | 2 | ||
| South Bend | Indiana | 2 | ||
| Springfield | Missouri | 2 | ||
| Ohio | 4 | |||
| Youngstown-Warren | Ohio | 2 |
TAMPA/ST. PETERSBURG
| Market | State | Departures per Week | ||
|---|---|---|---|---|
| Allentown | Pennsylvania | 4 | ||
| Chattanooga(a) | Tennessee | 4 | ||
| Columbia(a) | South Carolina | 3 | ||
| Knoxville(a) | Tennessee | 4 | ||
| Lansing(a) | Michigan | 2 | ||
| Newburgh(a) | New York | 3 | ||
| Peoria(a) | Illinois | 2 | ||
| Virginia | 2 | |||
| Rockford | Illinois | 3 | ||
| South Bend | Indiana | 2 | ||
| Springfield(a) | Missouri | 2 | ||
| Toledo(a) | Ohio |
OTHER
| Market | Departures per Week | |||
|---|---|---|---|---|
NineCurrently, 11 aircraft are dedicated to serving Las Vegas from 3034 small cities, and fourfive are dedicated to serving Orlando from 1321 small cities.cities and one aircraft (increasing to two by the end of 2006) is dedicated to serving Tampa/St. Petersburg. We attempt to match the frequency of flights with the market demand. We presently do not have daily flights in any of our markets, nor do we generally offer multiple flights each day. In most cases, we offer two to four flights per week in each of our markets. We anticipate increasing frequency over time as demand warrants, sometimes on a seasonal basis. Some markets are only served on a seasonal basis.
We generally begin our route selection process by identifying markets in which there is no nonstop service to Las Vegas, Orlando and/or Orlando,Tampa/St. Petersburg, or other potential destinations, which have a large enough population in the airport's catchment area to support at least two weekly flights, and which are no more than eight hours round-trip flight time from the destination. The eight hour limit permits one flight crew to perform the mission, avoiding costly crew overnight expenses and increasing crew utilization and efficiency. We then study publicly available data from the DOT showing the historical number of passengers, capacity, and average fares over time in the identified markets. We also study general demographic information about the population base for the targeted market area, including household incomes and unemployment rates, to assist in our determination whether we believe a service from a particular market would likely be successful.
We forecast the level of demand in a particular market that will result from the introduction of our service as well as our judgment of the likely competitive response of other airlines. We focus on markets where competitors are unlikely to initiate service and we prioritize routes that can be started at low marginal crew and ground operations costs.
Once a market is classified as attractive, we begin a rigorous analysis of the costs of providing service to that market. The major costs under consideration would be the initial and ongoing advertising costs to gain and maintain name recognition, airport charges, ground handling and fuel costs. The demand for nonstop air service in our markets often gives us leverage to attract financial support from the cities and airports we serve in the form of shared advertising costs and abatement of landing fees and other facility use fees and cash subsidies.airport fees.
Safety and Security
We believe we provide a safe working environment for our employees. We are committed to an accident prevention program which includes the identification and correction of hazards and the training of employees in safe work practices. We strive to comply with or exceed health and safety regulation standards. In pursuing these goals, we maintain an active aviation safety program and all company personnel are expected to participate in the program and take an active role in the identification, reduction and elimination of hazards.
Our ongoing focus on safety relies on hiring good people, training them to proper standards, and providing them with the tools and equipment they require so they can perform their job functions in a safe and efficient manner. Safety in the workplace targets five areas of our operation: flight operations, maintenance, in-flight, dispatch, and station operations. In 2005, we introduced a formal internal evaluation program which focuses on these operational areas. In the maintenance area, we maintain an active Continuing Analysis and Surveillance Program with plans of enhancement during 2006 along with an Aircraft Reliability program. In the flight operations department, we introduced a new event reporting program in 2005, and we maintain an active Operational Performance Enhancement Committee and a Flight Standards Board comprised of management and check airmen. We plan to install electronic flight bags in all of our aircraft in 2006.within the next 12 months. The station operations area conducts safety meetings and completes a safety checklist at all locations on a monthly basis. Dispatch and in-flight also perform documented monthly evaluations of various functions and documentation within their areas to ensure compliance with company policies and regulatory requirements.
The TSA continues to enhance aviation security for both airlines and airports. In 2005, by direction of the TSA, we instituted a self defense program for our crewmembers. Also, in early 2005, we completed a revalidation of all company issued identification media to ensure control of this process with our continued growth and expansion. We maintain active, open lines of communication with the TSA at all of our locations to ensure proper standards for security of our personnel, customers, equipment and facilities are exercised throughout the operation.
Sales and Distribution
We sell air transportation that may be packaged, at the passenger's discretion, with other products such as hotels, rental cars, and tickets to popular tourist attractions in Las Vegas and Orlando.our leisure destinations. We have chosen to maintain full control over our inventory and only distribute our product through our website and call center.center or at our airport ticket counters. Therefore, we do not presently sell through Expedia, Travelocity, Orbitz or any other internet travel agencies nor is our product displayed and sold through the global distribution systems ("GDS") which include Sabre, Apollo, GalileoWorldspan and Amadeus. This distribution strategy results in reduced expenses by avoiding the fees associated with the use of GDS distribution points and also permits us to develop and maintain a direct relationship with our customers. The direct relationship enables us to engage continuously in communications with our customers which we believe will result in substantial benefits over time.
We market our services through advertising and promotions in newspapers, magazines, television and radio and through targeted public relations and promotional efforts in our small city markets. We also rely on public relations and word-of-mouth to promote our brand. We generally run special promotions in coordination with the inauguration of service into new markets. Starting approximately five weeks60 days before the launch of a new route, we undertake a major advertising campaign in the target market and local media attention frequently focuses on the introduction of our low fares.
While many airlines have discontinued paying commissions to travel agents, we continue to pay a commission for vacation packages sold through travel agencies. Traditional travel agencies remain an important marketing channel for us, especially given our high rate of tour package sales and a generally less-traveled target clientele. Travel agencies assist with the initial marketing in new markets and help us generate brand awareness. We believe travel agencies tend to have more influence in smaller makets.cities.
Approximately 10% and 20% of our passengers originate their travel in Las Vegas and Orlando, respectively, which is consistent with the overall passenger traffic data for these markets. We anticipate a similar level of origination from Tampa/St. Petersburg. Since most of our traffic originates elsewhere, we commit very few resources towards marketing our services in our destination markets, and concentrate nearly all of our efforts in the small cities we serve.
We have a database of approximately 370,000more than 525,000 email addresses from past customers and visitors to our website, and use blast emails to communicate special offers to this group. The heaviest
concentration of air-only sales occurs in the period 30 to 60 days before departure, and occurs 45 to 90 days before departure for air-hotel package sales. We commonly use email promotions directed toward the customers in our database as a vehicle for selling unsold seats in the period two to three weeks before departure.
All of our bookings must be made on our website, or through our call center or at our airport ticket counters, even if booked through travel agents. The percentage of our scheduled service bookings on our website increased significantly throughout 2005 and averaged 81.0% for the full year. Ofyear and 84.8% for the first nine months of 2006. Approximately 14.7% of our scheduled service bookings in 2005, approximately 14.7% were booked by travel agents.agents in 2005 and 10.2% during the first nine months of 2006. This distribution mix creates significant cost savings for us and enables us to continue to build loyalty with our customers through increased interaction with them. We plan to continue to increase the percentage of sales booked directly with us.
Pricing and Revenue Management
Our low fares are designed to stimulate demand from price-sensitive leisure travelers who might not have traveled to Las Vegas and/or Orlandoour leisure destinations due to the expense and hassle involved in traveling there. Our fare structure is comprised of six "buckets," with prices generally increasing as the number of days prior to travel decreases. Prices in the highest bucket are typically less than three times the prices in the lowest bucket and our highest one-way fare currently is $234.$239. All of our fares are one-way and non-refundable, although they may be changed for a $50 one-way fee.
We try to maximize the overall revenue of our flights by utilizing yield management techniques. Yield management is an integrated set of business processes that provides us with the ability to understand markets, anticipate customer behavior and respond quickly to opportunities. We use yield management in an effort to maximize passenger revenues by flight, by market and across the entire system while seeking to maintain high load factors.
The number of seats offered at each fare is established through a continual process of forecasting, optimization and competitive analysis. Generally, past booking history and seasonal trends are used to forecast anticipated demand. These historical forecasts are combined with current bookings, upcoming events, competitive pressures and other factors to establish a mix of fares designed to maximize revenue. This ability to accurately adjust prices based on fluctuating demand patterns allows us to balance loads and capture more revenue from existing capacity.
We believe effective yield management has contributed to our strong financial operating performance and is a key to our continued success.
Competition
The airline industry is highly competitive. Airline profit levels are sensitive to adverse changes in fuel costs, average fare levels and passenger demand. Passenger demand and fare levels have historically been influenced by, among other things, the general state of the economy, international events, industry capacity and pricing actions taken by other airlines. The principal competitive factors in the airline industry are fare pricing, customer service, routes served, flight schedules, types of aircraft, safety record and reputation, code-sharing relationships and frequent flyer programs.
Our competitors and potential competitors include legacy airlines, LCCs, regional airlines and new entrant airlines. Many of these airlines are larger, have significantly greater financial resources and serve more routes than we do. Some of these competitors have chosen to add service, reduce their fares or both, in some of our markets following our entry.
We believe a key to our initial and long-term success is that we seek to offer customers in our markets a better alternative for airline travel. We offer a simple, affordable product with excellent customer service and reliability using clean and comfortable aircraft. We do not sell one-stop or connecting flights. We do not require Saturday night stays or the purchase of round-trip travel. We do not overbook our flights. We understand that our leisure customer only has a limited number of vacation days and relies on us to get them to their destination and back in a timely manner.
Our 150-seat MD80 aircraft, with an average seat pitch of 31 to 32 inches, offer a comfortable alternative to the 4037 to 7086 seat regional jets that secondary market travelers are accustomed to flying as part of the hub and spoke networks of the legacy carriers. Additionally, we believe the MD80's three-by-two seating configuration is well liked by the traveling public because 80% of all seats are window or aisle seats. We adhere to the successful model pioneered by Southwest by offering a single class of service; yet,however, unlike Southwest, we offer assigned seating at the airport. We also offer advance seat assignments for a $11 fee per flight. Customers who purchase an advance seat assignment are given priority boarding at the airport.
Our small city strategy has reduced the intensity of competition we would otherwise face. We are the only scheduled carrier in fourseven of the airports we serve, and the only domestic scheduled carrier operating out of the Orlando Sanford airport.airport and one of three carriers serving the St. Petersburg-Clearwater International Airport. While virtually all U.S. airlines serve both Las Vegas, Orlando and Orlando,the Tampa/St. Petersburg area, only US Airways and Southwest utilizeuse Las Vegas as a hub or focus city and only AirTran and Delta Air Lines use Orlando in the same manner. We do not currently compete directly with AirTran Delta or Southwest in any of our markets. We compete with US Airways in only threetwo markets to Las Vegas (Fresno Colorado Springs and PalmColorado Springs); however, the majoritymost of the flights US Airways operates in those markets utilizesuse smaller regional jet aircraft against which we believe we have a unit cost advantage. We compete with United Express regional jets and turbo-props in two marketsthe Fresno to Las Vegas (Fresnomarket. On our route from Greenville/Spartanburg to Orlando, we compete with Delta Air Lines which provides regional jet service to Orlando International Airport.
On our announced service from Knoxville to Tampa/St. Petersburg (starting in December 2006), we will compete with regional jet service by Delta which serves Tampa International Airport. On our existing service from Newburgh to Orlando, both JetBlue and Palm Springs). Northwest AirlinesAirTran have announced service to Orlando International Airport starting in 2005 added nonstopDecember 2006 and the first quarter of 2007, respectively, using full-sized jets. On our future service into Las Vegas from Sioux Falls, Des Moines, and Fargo. We believe these flights were addedNewburgh to Tampa/St. Petersburg (starting in responseDecember 2006), AirTran has announced service to our service. We have sought to avoid direct competitionTampa International Airport starting in the small cities we serve. However, we believe there are many small cities we could serve where existing carriers would provide direct competition primarilyfirst quarter 2007, also using regional aircraft. In such cities, we believe we could take advantage of the lower unit costs associated with our larger aircraft.full-sized jets.
Indirectly, we compete with Southwest, US Airways, AirTran, Delta and other carriers that provide nonstop service fromto Las Vegas, Orlando and Orlando tothe Tampa/St. Petersburg area from airports near our destinations.small city markets. For example, we fly to Bellingham, Washington, which is a two-hour drive from Seattle-Tacoma International Airport, where travelers can access nonstop service to Las Vegas on Alaska Airlines, Southwest or US Airways. We also face indirect competition from legacy carriers offering hub-and-spoke connections to our markets. For example, travelers can travel to Las Vegas from Peoria on United, American or Northwest, although all of these legacy carriers currently utilize regional jets to access their hubs and then mainline jets to access Las Vegas, tend to charge higher and restrictive fares, and have a much longer elapsed time of travel. Except for our service to Las Vegas from our Fresno, and Palm Springs, California markets,market, we do not believe we face indirect competition from automobile travel.
In our fixed fee operations, we compete with independent passenger charter airlines such as Champion and Pace. We also compete with aircraft owned or controlled by large tour companies. The basis of competition in the fixed fee market are cost, equipment capabilities, service and reputation.
People
We believe our employees' high-qualityhigh quality service differentiates us from our competitors. We believe our growth potential and the achievement of our corporate goals are directly linked to our ability to attract and maintain the best professionals available in the airline business. Full-time equivalent employees at DecemberOctober 31, 20052006 consisted of 134156 pilots, 125169 flight attendants, 123220 airport operations personnel, 7198 mechanics, 5774 reservation agents, and 86111 management and other personnel. At DecemberOctober 31, 2005,2006, we employed 520685 full-time and 151285 part-time employees.
We place great emphasis on the selection and training of enthusiastic employees with potential to add value to our business and who we believe fit in with and contribute to our business culture. The recruiting and training process begins with an evaluation and screening process, followed by multiple interviews and experience verification. We provide extensive training intended to meet all FAA requirements for security, safety and operations for our pilots, flight attendants and customer service agents.
To help retain talented and highly motivated employees, we offer competitive compensation packages as well as affordable health and retirement savings options. We offer medical, dental and
401(k) plans to full-time employees. Other salaried benefits include paid time off, as well as supplemental life insurance and long-term disability. We do not have a defined benefit pension plan for any employees. We review our compensation packages on a regular basis in an effort to ensure that we remain competitive and are able to hire and retain the best people possible.
In addition to offering competitive compensation and benefits, we take a number of steps to make our company an attractive place to work and build a career such as maintaining various employee recognition programs and consistently communicating our vision and mission statement to our associates. We believe creating a great place for our people to work motivates them to treat our customers beyond their expectations.
We have never experienced an organized work stoppage, strike or labor dispute. We currently do not have any labor unionsunions. We have an in-house pilot association with whom we have recently negotiated a mutually satisfactory arrangement for pay increases.
On October 10, 2006, the National Mediation Board, or NMB, a federal agency in Washington, DC, notified us it had received an application filed on behalf of the Association of Flight Attendants-CWA, AFL-CIO, for the services of the NMB under the provisions of the Railway Labor Act, or RLA. The applicant alleges a representation dispute involving our flight attendants.
The application asks the NMB to hold an election and the NMB has authorized an election which will be conducted under the RLA to determine if our flight attendants desire third party representation. If less than a majority of eligible employees cast valid votes, no representative will be certified. Should a majority of eligible employees vote to be represented, the representative receiving a majority of the votes cast will be the representative. We believe there are not aware149 flight attendants potentially eligible to vote in this election, but no eligible employee is required to vote.
Voting instructions were mailed on November 13, 2006 to all eligible employees. The voting period began November 13, 2006 and will continue through December 4, 2006. The final vote tally will take place at the NMB's offices on December 4, 2006.
If our flight attendants vote to approve third party representation, particularly from the Association of any campaigns to establish union representation amongFlight Attendants, we believe this action could reduce our current flexibility and productivity regarding work groups.rules and compensation structure for this particular employee group.
Aircraft and Fleet
We operate two MD87 and 1920 MD83 aircraft, all powered by Pratt & Whitney JT8D-219 engines. We have one additional MD87 and onetwo MD83 aircraft currently in short-term storage. One additional MD83 is leased out on a short-term basis through September 2006. We anticipate placing both of these aircraft into service in the fourth quarter ofDecember 2006. We currently own 11and operate 14 of our aircraft—three are owned free and clear, and eight11 are owned subject to financing scheduled to be fully paid over the next five years. An additional five aircraft are subject to capital leases under which we expect to take ownership within the next five years. We also have fivethree aircraft currently under operating leases which havewith purchase options withand seller financing in place, and we intend to exercise the purchase options by the end of 2006. We lease the remaining threetwo aircraft under operating leases, one of which expires in August 2006 and the two others of which expire on December 31, 2007, but can be returned to the lessor with 90 days advance notice. We will attempt to negotiate a purchase or new lease on the August return aircraft, but if we are unsuccessful in these negotiations, we will seek to introduce a replacement aircraft later in 2006. We believe conditions in the market for high quality used MD80 class aircraft are very favorable from the standpoint of buyers and lessees. Thus, we do not believe availability of suitable aircraft will be a growth constraint. However, the MD80 series aircraft and the Pratt & Whitney JT8D-219 engines are no longer being manufactured. This could cause a shortage of additional suitable aircraft, engines or spare parts over time.the long term. If the FAA adopts regulations to limit the age of aircraft in the U.S., we may need to seek replacement of some of our current aircraft fleet sooner than anticipated and to seek a newer aircraft type to replace our existing fleet and to expand our operations.
Our aircraft range from 10 to 20 years old with an average age of 16 years. The average number of cycles on our fleet is approximately 25,000 cycles and the highest number of cycles on any of our aircraft is approximately 43,000. A cycle is defined as one take-off and landing and is a measure often used by regulators in determining the applicability of aging aircraft requirements.
Maintenance
We have an FAA-approved maintenance program, which is administered by our maintenance department headquartered in Las Vegas. Consistent with our core value of safety, all mechanics and avionics specialists employed by us have appropriate training and experience and hold required licenses issued by the FAA. We provide them with comprehensive training and maintain our aircraft and associated maintenance records in accordance with FAA regulations. The maintenance performed on our aircraft can be divided into three general categories: line maintenance, heavy maintenance, and component and engine overhaul and repair. With the exception of scheduled line maintenance, which is generally performed by our personnel, we contract with outside organizations to provide heavy maintenance and component and engine overhaul and repair. We have chosen not to invest in facilities or equipment to perform our own heavy maintenance, engine overhaul or component work. Our senior management closely supervises all maintenance functions performed by our personnel and contractors employed by us, and by outside organizations. We closely supervise the outsourced work performed by our heavy maintenance and engine overhaul contractors.
Line maintenance consists of routine daily and weekly scheduled maintenance checks on our aircraft, including pre-flight, daily, weekly and overnight checks and any diagnostics and routine repairs. We perform this work at our maintenance bases in Las Vegas, Orlando, Tampa/St. Petersburg, Reno (Nevada) and Laughlin (Nevada) with the Reno and Laughlin bases supporting our fixed fee flying services. For unscheduled requirements that arise away from our maintenance bases, in Las Vegas, Orlando, Reno and Laughlin, we subcontract our line maintenance to outside organizations under customary industry terms.
Heavy maintenance checks consist of more complex inspections and servicing of the aircraft that cannot be accomplished during an overnight visit. These checks occur approximately every 18 months on each aircraft and can range in duration from two to six weeks, depending on the magnitude of the work prescribed in the particular check. We currently usehave contracted with American Airlines, Inc., the world's largest MD80 operator, and TIMCO Aviation Services, Inc., to perform heavy maintenance checks and overhaul of wheels, tires and brakes on a non-exclusive basis.an on exclusive basis through 2009.
Component and engine overhaul and repair involves sending certain parts, such as engines, landing gear and avionics, to FAA-approved maintenance repair stations for repair and overhaul. We presently utilize AeroThrust Corporation and Pacific Gas & Turbine Center, LLC for overhaul and repair of our engines on a non-exclusive basis.
In addition to the maintenance contractors we presently utilize, we believe there are sufficient qualified alternative providers of maintenance services that we can use to satisfy our ongoing maintenance needs.
Facilities
We lease facilities at several of the airports we serve. Our leases for our terminal passenger services facilities, which include ticket counter and gate space, and operations support areas, generally have terms of less than two years in duration. We have also entered into use agreements at each of the airports we serve that provide for non-exclusive use of runways, taxiways and other facilities. Landing fees under these agreements are based on the number of landings and weight of the aircraft.
Our principal base of operations in Las Vegas is Terminal 21 at McCarran International Airport. We share the terminal with several other carriers. We currently lease two gates, and have access to two
additional gates. We believe we can operate ten departures per day per gate giving us current capacity to operate up to 20 departures per day on our leased gates and a similar number of departures per day on the gates we have access to use. While we currently have sufficient gate space to accommodate our near term requirements, we believe gate space may become more difficult to obtain due to the growth expected at McCarran. We also lease space at the cargo area on the field at McCarran which is used for line maintenance operations. We currently rely on the availability of overnight aircraft parking space at the Las Vegas airport. However, due to the anticipated growth of McCarran we may encounter difficulty in obtaining sufficient overnight aircraft parking space in the future. Over time, this may result in our having to overnight more of our aircraft in other cities, which would increase our costs.
Our principal base of operations in Orlando is Terminal B at Orlando Sanford International Airport. We are the only scheduled domestic carrier operating at Orlando Sanford International Airport. The terminal has 12 gates, and we currently utilize up to three gates. We believe we have sufficient gate space to accommodate several years of growth at this airport. We also lease space in a nearby cargo building that supports our line maintenance and commissary operations.
We use two gates at the St. Petersburg-Clearwater International Airport. We believe we have access to sufficient gate space to accomodate several years of growth at this airport.
Our primary corporate offices are located in Las Vegas, where we lease 16,225 square feet of space under a lease that expires in June 2009. We also lease 18,500 square feet of office space near the airport where our maintenance, in-flight and training staff are located, under a lease that expires in September 2010. We also lease 5,000 square feet of space in Reno Nevada for our call center and additional space near the Las Vegas airport for our commissary and parts warehouse, under a lease that expires in August 2009.
None of the airports in the small cities in which we operate have slot control, gate availability or curfews that pose meaningful limitations on our operations. However, some small city airports have shortershort runways that require us to operate some flights at less than full capacity.
Aircraft Fuel
Fuel is our largest operating expense. We contract withuse a third party to provide fuel management services and assist with negotiations with suppliers to provide fuel at the many locations we serve. The cost of fuel is volatile, as it is subject to many economic and geopolitical factors we can neither control nor predict.
Beginning in 2002,2003, we implemented a fuel hedging program under which we enter into forward contracts or other financial products to reduce our exposure to fuel price volatility. We typically enter into short-term swap agreements for either jet fuel or heating oil (lasting up to one year) where we fix our price based on a percentage of our projected consumption amount. We sometimes enter into heating oil forward contracts, instead of jet fuel, because heating oil prices historically have had a strong correlation to jet fuel prices. Our fuel hedging program may not be sufficient to protect us against significant increases in the price of fuel. Significant increases in fuel costs would have a material adverse effect on our operating results and profitability.
In an effort to reduce our fuel costs, we have initiated discussions with other parties to become involved at an earlier stage in the fuel distribution channels. In this regard, we have formed a wholly owned subsidiary which has entered into a limited liability company operating agreement with an affiliate of Orlando Sanford International Airport to engage in contract fueling transactions for the provision of aviation fuel to airline users at that airport. In addition, these efforts could result in our investing in fuel storage units or fuel transportation facilities or in joint ventures involved in the fuel distribution process. These efforts may not be successful in reducing our fuel costs. In addition, even if
these efforts succeed in lowering our fuel costs, we could potentially incur material liabilities, including possible enviromental liabilities to which we are not now subject.
Government Regulation
We are subject to regulation by the DOT, FAA and other governmental agencies.
DOT. The DOT primarily regulates economic issues affecting air transportation such as certification and fitness of carriers, insurance requirements, consumer protection, competitive practices and statistical reporting. The DOT also regulates requirements for accommodation of passengers with disabilities. The DOT has the authority to investigate and institute proceedings to enforce its regulations and may assess civil penalties, suspend or revoke operating authority and seek criminal sanctions. DOT also has authority to restrict or prohibit a carrier's cessation of service to a particular community if such cessation would leave the community without scheduled airline service.
WeIn 1998, we were granted a DOT certificate of public convenience and necessity authorizing us to engage in charter air transportation within the United States, its territories and possessions in 1998.possessions. Our DOT authority has subsequently been expanded to include scheduled air transportation of passengers, property and mail within the United States, its territories and possessions and between the United States and Canada, and charter air transportation of passengers, property and mail on a domestic and international basis.
FAA. The FAA primarily regulates flight operations and safety, including matters such as airworthiness and maintenance requirements for aircraft, pilot, mechanic, dispatcher and flight attendant training and certification, flight and duty time limitations and air traffic control. The FAA requires each commercial airline to obtain and hold an FAA air carrier certificate. ThatThis certificate, in combination with operations specifications issued to the airline by the FAA, authorizes the airline to operate at specific airports using aircraft approved by the FAA. We have and maintain in effect FAA certificates of airworthiness for all of our aircraft, and we hold the necessary FAA authority to fly to all of the cities we currently serve. Like all U.S. certificated carriers, we cannot provide scheduled service to new destinations without the authorization of the FAA. The FAA has the authority to investigate all matters within its purview and to modify, suspend or revoke our authority to provide air transportation, or to modify, suspend or revoke FAA licenses issued to individual personnel, for failure to comply with FAA regulations. The FAA can assess civil penalties for such failures and institute proceedings for the collection of monetary fines after notice and hearing. The FAA also has authority to seek criminal sanctions. The FAA can suspend or revoke our authority to provide air transportation on an emergency basis, without notice and hearing, if, in the FAA's judgment, safety requires such action. A legal right to an independent, expedited review of such FAA action exists. Emergency suspensions or revocations
have been upheld with few exceptions. The FAA monitors our compliance with maintenance, flight operations and safety regulations on an ongoing basis, maintains a continuous working relationship with our operations and maintenance management personnel, and performs frequent spot inspections of our aircraft, employees and records.
The FAA also has the authority to issue maintenance directives and other mandatory orders relating to, among other things, inspection, repair and modification of aircraft and engines, increased security precautions, aircraft equipment requirements, noise abatement, mandatory removal and replacement of aircraft parts and components, mandatory retirement of aircraft and operational requirements and procedures. Such directives and orders can be issued without advance notice or opportunity for comment if, in the FAA's judgment, safety requires such action.
We believe we are operating in compliance with applicable DOT and FAA regulations, interpretations and policies and we hold all necessary operating and airworthiness authorizations, certificates and licenses.
Security. Within the United States, civil aviation security functions, including review and approval of the content and implementation of air carriers' security programs, passenger and baggage screening, cargo security measures, airport security, assessment and distribution of intelligence, threat response, and security research and development are the responsibility of the TSA of the Department of Homeland Security. The TSA has enforcement powers similar to DOT's and FAA's described above. It also has the authority to issue regulations, including in cases of emergency, the authority to do so without advance notice, including issuance of a grounding order as occurred on September 11, 2001.
Environmental. We are subject to various federal, state and local laws and regulations relating to the protection of the environment and affecting matters such as aircraft engine emissions, aircraft noise emissions, and the discharge or disposal of materials and chemicals, which laws and regulations are administered by numerous state and federal agencies. These agencies have enforcement powers similar to DOT's and FAA's described above. In addition, prior to receiving authorization from the FAA to begin service at an airport we have not previously served, we may be required to conduct an environmental review of the effects projected from our addition of service at that airport.
Federal law recognizes the right of airport operators with special noise problems to implement local noise abatement procedures so long as those procedures do not interfere unreasonably with interstate and foreign commerce and the national air transportation system. These restrictions can include limiting nighttime operations, directing specific aircraft operational procedures during takeoff and initial climb, and limiting the overall number of flights at an airport. None of the airports we serve currently restricts the number of flights or hours of operation, although it is possible one or more of such airports may do so in the future with or without advance notice.
Foreign Ownership. To maintain our DOT and FAA certificates, our airline operating subsidiary and we (as the airline's holding company) must qualify continuously as a citizen of the United States within the meaning of U.S. aeronautical laws and regulations. This means we must be under the actual control of U.S. citizens and we must satisfy certain other requirements, including that our president and at least two-thirds of our board of directors and other managing officers must be U.S. citizens, and that not more than 25% of our voting stock may be owned or controlled by non-U.S. citizens. The amount of non-voting stock that may be owned or controlled by non-U.S. citizens is strictly limited as well. We are in compliance with these ownership and control criteria. For a discussion of the procedures we instituted to ensure compliance with the foreign ownership limitations, see "Description of Capital Stock—Limited Voting by Foreign Owners."
Other Regulations. Air carriers are subject to certain provisions of federal laws and regulations governing communications because of their extensive use of radio and other communication facilities, and are required to obtain an aeronautical radio license from the Federal Communications Commission
("FCC"). To the extent we are subject to FCC requirements, we will continue to comply with those requirements.
The quality of water used for drinking and hand-washing aboard aircraft is subject to regulation by the Environmental Protection Agency ("EPA"). To the extent we are subject to EPA requirements, we will continue to comply with those requirements.
We are responsible for collection and remittance of federally imposed and federally approved taxes and fees applicable to air transportation passengers. We believe we are in compliance with these requirements, and we will continue to comply with them.
Our operations may become subject to additional federal requirements in the future under certain circumstances. For example, our labor relations are covered under Title II of the Railway Labor Act of 1926, as amended, and are subject to the jurisdiction of the National Mediation Board. During a period of past fuel scarcity, air carrier access to jet fuel was subject to allocation regulations promulgated by the Department of Energy. We are also subject to state and local laws, regulations and ordinances at
locations where we operate and to the rules and regulations of various local authorities that operate airports we serve.
International air transportation, whether provided on a scheduled or charter basis, is subject to the laws, rules and regulations of the foreign countries to, from and over which the international flights operate. Foreign laws, rules and regulations governing air transportation are generally similar, in principle, to the regulatory scheme of the United States as described above, although in some cases foreign requirements are comparatively less onerous and in others, more onerous. We must comply with the laws, rules and regulations of each country to, from or over which we operate. International flights are also subject to U.S. Customs and Border Protection, Immigration and Agriculture requirements and the requirements of equivalent foreign governmental agencies.
Future Regulation. Congress, the DOT, the FAA and other governmental agencies have under consideration, and in the future may consider and adopt, new laws, regulations, interpretations and policies regarding a wide variety of matters that could affect, directly or indirectly, our operations, ownership and profitability. We cannot predict what other matters might be considered in the future by the FAA, the DOT, other agencies or Congress, nor can we judge what impact, if any, the implementation of any of these proposals or changes might have on our business.
Civil Reserve Air Fleet. We are seeking to be a participant in the Civil Reserve Air Fleet ("CRAF") Program which affords the U.S. Department of Defense the right to charter our aircraft during national emergencies when the need for military airlift exceeds the capability of available military resources. During the Persian Gulf War of 1990-91 and on other occasions, CRAF carriers were required to permit the military to use their aircraft in this manner. If we are approved to participate in this program, we would be eligible to bid on and be awarded peacetime airlift contracts with the military.
Insurance
We maintain insurance policies we believe are of types customary in the industry and as required by the DOT and in amounts we believe are adequate to protect us against material loss. The policies principally provide coverage for public liability, passenger liability, baggage and cargo liability, property damage, including coverages for loss or damage to our flight equipment and workers' compensation insurance. There is no assurance, however, that the amount of insurance we carry will be sufficient to protect us from material loss.
Legal Proceedings
We are subject to certain legal and administrative actions we consider routine to our business activities. We believe the ultimate outcome of any pending legal or administrative matters will not have a material adverse effect on our financial position, liquidity or results of operations.
Directors and Executive Officers
The following table sets forth information regarding our directors and executive officers as of April 30,November 20, 2006.
| Name | Age | Position | ||
|---|---|---|---|---|
| Maurice J. Gallagher, Jr. | President, | |||
| M. Ponder Harrison | Managing Director—Marketing & Sales | |||
| Andrew C. Levy | Managing Director—Planning | |||
| Linda A. Marvin | Chief Financial Officer and Managing Director | |||
| Michael P. Baxter | Senior Vice President of Operations | |||
| Michael S. Falk | 44 | Director | ||
| Timothy P. Flynn | 56 | Director | ||
| A. Maurice Mason | 42 | Director | ||
| Robert L. Priddy | Director | |||
| Declan F. Ryan | 42 | Director |
Maurice J. Gallagher, Jr. has been actively involved in the management of our company since he became our majority owner and joined our board of directors in June 2001 and2001. He has served as our chief executive officer since August 2003.2003 and was designated Chairman of the Board in September 2006. Prior to his involvement with Allegiant, Mr. Gallagher devoted his time to his investment activities, including companies which he founded. One of these companies was Mpower Communications Corp., a telecommunications company, for which he served as acting chief executive officer from 1997 to 1999 and as chairman of the board from its inception in 1996 until March 2002. Mr. Gallagher was one of the founders of ValuJet Airlines, Inc. (one of the predecessors to AirTran Airways, Inc.) and served as an officer and director of ValuJet from its inception in 1993 until 1997. From 1983 until 1992, Mr. Gallagher was a principal owner and executive of WestAir, a commuter airline. The agreements under which investors acquired shares in our company in May 2005 provide that Mr. Gallagher beis entitled to a seat on our board of directors. He had served on our board prior to that time.
M. Ponder Harrison has served as an officer of Allegiant since October 2002 and is responsible for marketing and sales, pricing and revenue management, in-flight service, internet and intranet technologies. From June 2001 through August 2002, Mr. Harrison was president of Corporate Aircraft Partners, which was a fractional aircraft leasing and charter airline. Prior to his involvement with Corporate Aircraft Partners, Mr. Harrison devoted his time to investment activities. One of his investments is Virtual Premise, Inc., an enterprise software company, for which he has served as and remains chairman of the board. Mr. Harrison was vice president of sales and marketing for ValuJet Airlines from its commencement of business in 1993 until 1998 after its merger with AirTran. Prior to leaving AirTran in 1998, Mr. Harrison was also directly responsible for all internet-related activities. Before joining ValuJet, Mr. Harrison worked in various marketing roles at Delta Air Lines from 1983 through 1992.
Andrew C. Levy has served as an officer of Allegiant since June 2001 and is responsible for our market planning, fleet planning, scheduling, fuel risk management and corporate development. From February 1998 to March 2001, Mr. Levy held various management positions at Mpower Communications. From July 1996 to February 1998, Mr. Levy worked on airline advisory and transactional work as a vice president with Savoy Capital, an investment company focused on the aviation sector. From 1994 to 1996, Mr. Levy held various positions with ValuJet Airlines including director of contracts with responsibilities for stations agreements, insurance, fuel purchasing and other related activities.
Linda A. Marvin has served as an officer of Allegiant since September 2001. Ms. Marvin is our chief financial officer overseeing our finance, accounting, information technology and insurance areas. From June 1996 through September 2001, Ms. Marvin held various management positions for Mpower Communications, including chief financial officer and senior vice president of finance. From
September 1988 through June 1996, Ms. Marvin was involved in the airline industry in various finance and accounting roles with Business Express/Delta Connection and with WestAir/United Express. Prior to her airline industry experience, she was an audit manager with KPMG Peat Marwick.
Michael P. Baxter has been employed by us since July 2003, and has served as our senior vice president of operations since February 2005. From July 2000 to July 2003, he served as vice president of maintenance and engineering for National Airlines, Inc. He began his career as a flight mechanic for the U.S. Air Force, after which he worked for 25 years for United Airlines, culminating as senior director of customer aircraft maintenance at United's main maintenance facility.
Michael S. Falk has served on our board since May 2005. Mr. Falk is chairman of The ComVest Group and the managing partner of ComVest Investment Partners (a private equity fund)Holdings LLC, whose affiliates manage Commonwealth Associates (a merchant and investment bank) and various ComVest investment partnerships (collectively, "ComVest Investment Partners"), including the ComVest entity which has invested in our company. Mr. Falk co-founded Commonwealth Associates in 1988 and has managed its affiliates since that time. Mr. Falk serves as chairman of IT&E International Group, Inc. which provides research services to pharmaceutical and biotechnology businesses, and as a director of Catalyst International, Inc.
Timothy P. Flynn was elected to our board in July 2006. Since 1992, Mr. Flynn has devoted his time to his private investments. Mr. Flynn was one of the founders of ValuJet Airlines, Inc. and served as a director from its inception in 1992 until 1997. From 1982 until 1992, he served as an executive officer and director of WestAir, a commuter airline, which he founded with Mr. Gallagher in 1982. Prior to 1982, he served as an executive officer of Pacific Express Holding, Inc., the parent company of WestAir Commuter Airlines, Inc., from 1979 to 1982.
A. Maurice Mason was elected to our board in July 2006. Mr. Mason is the managing director of Kite Investments, his personal investment company which he founded in September 2002. Mr. Mason worked at Morgan Stanley Ltd. from 1994 until September 2002, last serving as a managing director. Prior to that, Mr. Mason was employed for seven years in the financial services division of GPA Group plc, an aircraft lessor. Mr. Mason also serves as a director of XS Direct Holdings Limited and Geneva Technology Limited (dba AirVOD) and as an alternate director of Tiger Airways Pte. Ltd. (Singapore). Mr. Mason is not a citizen of the United States.
Robert L. Priddy has served on our board since May 2005. Mr. Priddy has served as a managing partner of ComVest Investment Partners since November 2003. Mr. Priddy is also an investor and owner of RMC Capital, LLC, an investment company which he founded in February 1998. Mr. Priddy was employed as the chairman of the board and chief executive officer of ValuJet, Inc. (now known as AirTran Holdings, Inc.) from its inception in 1993 until November 1997. Mr. Priddy also serves as a director of CorVu® Corporation, a performance software company (since February 2005).
Declan F. Ryan has served on our board since May 2005. Mr. Ryan has served as a director and managed Irelandia Investments (since 1991) and Irelandia II Ltd. (since 2001), private investment companies. Mr. Ryan served as a director of Ryanair Holdings Plc from 1996 until 2003. From 1985 until 1996, he held several senior management positions in Ryanair.Ryanair including having served as chief executive officer in 1988 and 1989. Mr. Ryan also serves on the board of directors of Tiger Airways in Singapore, which is one of the largest LCCs in Asia. Mr. Ryan is not a citizen of the United States.
Michael S. Falk, Robert L. Priddy and Declan F. Ryan were elected to our board of directors pursuant to the terms of the investment agreements under which ComVest Allegiant Holdings, LLC and Viva Air Limited acquired its shares in our company in May 2005. The provisions of these
agreements assuring board representation for Messrs. Gallagher, Falk, Priddy and Ryan will terminate upon the closing of this offering.
For administrative reasons, we arranged for the payment of the salaries and benefits for Ponder Harrison, Andrew Levy and Linda Marvin through a related party. See "Related Party Transactions." As such, these individuals have not been directly employed by us since that time, but have nevertheless devoted their full-time employment to us through this arrangement with the related party. This arrangement will continue until the completion of our reorganization into a corporation, which will become effective at or immediately before the closing of this offering.
Committees of the Board of Directors
Our board of directors has established an audit committee, a compensation committee and a compensationnominating committee. The audit committee provides assistance to the board of directors in fulfilling its legal and fiduciary obligations in matters involving our accounting, auditing, financial reporting, internal control and legal compliance functions. The audit committee also oversees the audit efforts of our independent auditorsregistered public accounting firm and takes those actions as it deems necessary to satisfy itself that the auditors are independent of management. The audit committee currently consists of Michael Falk,Timothy Flynn, Maurice Mason and Robert Priddy and .Priddy.
The compensation committee determines our compensation policies and forms of compensation provided to our directors and officers. The compensation committee also reviews and determines bonuses for our officers and other employees. In addition, the compensation committee reviews and determines stock-based compensation for our directors, officers, employees and consultants and
administers our stock option plan. The current members of the compensation committee are Robert Priddy and Declan Ryan.
The nominating committee is to assist our board of directors in fulfilling its responsibilities relating to identification of individuals qualified to become board members and recommendation of director nominees to the board of directors prior to each annual meeting of stockholders and recommendation of nominees for any committee of the board. The nominating committee currently consists of Declan Ryan and Michael Falk.
Compensation of Executive Officers and Other Information
The following table shows the cash compensation paid or to be paid by us, as well as certain other compensation paid or accrued, during the fiscal year ended December 31, 2005 to our chief executive officer and each of our four other executive officers, in all capacities in which they served.
| | | | | Long-Term Compensation Awards Securities Underlying Options (#) | | | | Long-Term Compensation Awards Securities Underlying Options (#) | ||||||||
|---|---|---|---|---|---|---|---|---|---|---|---|---|---|---|---|---|
| | Annual Compensation | Annual Compensation | ||||||||||||||
| Name and Principal Position | Salary | Bonus | Other Annual Compensation | Salary | Bonus | Other Annual Compensation | ||||||||||
| Maurice J. Gallagher, Jr. President and Chief Executive Officer | — | — | — | — | — | — | — | — | ||||||||
| M. Ponder Harrison Managing Director | $149,996 | $98,150 | (1) | — | — | |||||||||||
| Andrew C. Levy Managing Director | 147,500 | 98,150 | (1) | $1,229 | (2) | — | ||||||||||
| M. Ponder Harrison Managing Director—Marketing and Sales | $149,996 | $98,150 | (1) | — | — | |||||||||||
| Andrew C. Levy Managing Director—Planning | 147,500 | 98,150 | (1) | $1,229 | (2) | — | ||||||||||
| Linda A. Marvin Chief Financial Officer and Managing Director | 120,833 | 92,363 | (1) | 2,042 | (2) | — | 120,833 | 92,363 | (1) | 2,042 | (2) | — | ||||
| Michael P. Baxter Senior Vice President of Operations | 145,000 | 45,000 | 4,350 | (2) | 36,000 | 145,000 | 45,000 | 4,350 | (2) | 36,000 | ||||||
Stock Option Grants
The table below sets forth information regarding all stock options granted during 2005 under our Long-Term Incentive Plan to our executive officers.
| | Number of Securities Underlying Options Granted in 2005 | | | | | Potential Realized Assumed Annual Rates of Stock Price Appreciation(1) | Number of Securities Underlying Options Granted in 2005 | | | | | Potential Realized Assumed Annual Rates of Stock Price Appreciation(1) | ||||||||||||||||||||||||
|---|---|---|---|---|---|---|---|---|---|---|---|---|---|---|---|---|---|---|---|---|---|---|---|---|---|---|---|---|---|---|---|---|---|---|---|---|
| | % of Total Options Granted to Employees in Fiscal Year | | | | % of Total Options Granted to Employees in Fiscal Year | | | | ||||||||||||||||||||||||||||
| Name | Exercise Price | Market Price or Fair Value on Date of Grant | Expiration Date | Exercise Price | Market Price or Fair Value on Date of Grant | Expiration Date | ||||||||||||||||||||||||||||||
| % of Total Options Granted to Employees in Fiscal Year | 10% | 5% | % of Total Options Granted to Employees in Fiscal Year | 5% | 10% | |||||||||||||||||||||||||||||||
| Maurice J. Gallagher, Jr. | — | — | — | — | — | — | — | — | — | — | — | — | — | — | ||||||||||||||||||||||
| M. Ponder Harrison | — | — | — | — | — | — | — | — | — | — | — | — | — | — | ||||||||||||||||||||||
| Andrew C. Levy | — | — | — | — | — | — | — | — | — | — | — | — | — | — | ||||||||||||||||||||||
| Linda A. Marvin | — | — | — | — | — | — | — | — | — | — | — | — | — | — | ||||||||||||||||||||||
| Michael P. Baxter | 36,000 | 9.4 | % | $ | 3.50 | $ | 3.50 | 2/1/15 | $ | 79,241 | $ | 200,812 | 36,000 | 9.4 | % | $ | 3.50 | $ | 3.50 | (2) | 2/1/15 | $ | 79,241 | $ | 200,812 | |||||||||||
We have granted stock options to our employees as follows:
| Year | Shares Underlying Options | Weighted Average Exercise Price | Range of Exercise Prices | Shares Underlying Options | Weighted Average Exercise Price | Range of Exercise Prices | ||||||||
|---|---|---|---|---|---|---|---|---|---|---|---|---|---|---|
| 2002 | — | — | — | — | — | — | ||||||||
| 2003 | — | — | — | — | — | — | ||||||||
| 2004 | — | — | — | — | — | — | ||||||||
| 2005 | 384,000 | $ | 3.58 | $ | 3.50 - $4.50 | 384,000 | $3.58 | $3.50 - $4.50 | ||||||
| 2006 (through April 30) | 8,000 | $ | 13.00 | $13.00 | ||||||||||
| 2006 (through November 20) | 47,000 | $13.00 | $13.00 | |||||||||||
Stock Option Exercises and Holdings
None of our executive officers exercised any options in fiscal year 2005. The following table shows the value of unexercised in-the-money options at December 31, 2005, calculated based on an assumed value of $8.75 per share of our common stock equal to the midpoint of the range set forth on the cover page of this prospectus, less the per share exercise price multiplied by the number of shares issued upon exercise of the options.
| | Number of Securities Underlying Unexercised Options at Fiscal Year End | Value of Unexercised In-the-Money Options at Fiscal Year End | Number of Securities Underlying Unexercised Options at Fiscal Year End | Value of Unexercised In-the-Money Options at Fiscal Year End | ||||||||||||||
|---|---|---|---|---|---|---|---|---|---|---|---|---|---|---|---|---|---|---|
| Name | ||||||||||||||||||
| Exercisable | Unexercisable | Exercisable | Unexercisable | Exercisable | Unexercisable | Exercisable | Unexercisable | |||||||||||
| Maurice J. Gallagher, Jr. | — | — | — | — | — | — | — | — | ||||||||||
| M. Ponder Harrison | — | — | — | — | — | — | — | — | ||||||||||
| Andrew C. Levy | — | — | — | — | — | — | — | — | ||||||||||
| Linda A. Marvin | — | — | — | — | — | — | — | — | ||||||||||
| Michael P. Baxter | — | 36,000 | — | $ | 189,000 | — | 36,000 | — | $ | 450,000 | ||||||||
Employee Benefit Plans
Long-Term Incentive Plan
Our Long-Term Incentive Plan (the "2006 Plan") was adopted by our board of directors and approved by the stockholders in April 2006. Our 2006 Plan will become effective on the date the underwriting agreement for this offering is signed. At that time, all outstanding options under the predecessor Allegiant Air 2004 Share Option Plan will be transferred to our 2006 Plan, and no further option grants will be made under that predecessor plan. The transferred options will continue to be governed by their existing terms, unless our compensation committee elects to extend one or more features of our 2006 Plan to those options. Except as otherwise noted below, the transferred options have substantially the same terms as will be in effect for grants made under our 2006 Plan.
We have reserved 3,000,000 shares of our common stock for issuance under our 2006 Plan. Such share reserve consists of 500,000 shares that will be carried over from our predecessor plan, including the shares subject to outstanding options thereunder. In addition, no participant in our 2006 Plan may be granted stock options for more than 100,000 shares of our common stock per calendar year.
The individuals eligible to participate in our 2006 Plan include our officers and other employees, our non-employee board members and any consultants we engage.
Our 2006 Plan will be administered by the compensation committee. This committee will determine which eligible individuals are to receive option grants, the time or times when such option grants are to be made, the number of shares subject to each such grant, the status of any granted option as either an incentive stock option or a non-statutory stock option under the federal tax laws, and the terms and conditions of each award including, without limitation, the vesting schedule to be in
effect for the option grant or stock issuance and the maximum term for which any granted option is to remain outstanding, provided that no option term may exceed ten years measured from the date of grant.
Vesting of any option grant is contingent on continued service with us. Upon the cessation of an optionee's service, any unvested options will terminate and will be forfeited. Any vested, but unexercised options (i) will terminate immediately if the optionee is terminated for misconduct, or (ii) if the cessation of service is other than for misconduct, will remain exercisable for such period of time as determined by the compensation committee at the time of grant and set forth in the documents evidencing the option. The compensation committee has the discretion, however, at any time while the option remains outstanding to (i) extend the period of time that the option may be exercisable following the cessation of an optionee's service (but not beyond the term of the option) and (ii) permit the optionee to exercise following a cessation of service options that were not vested at the time of the cessation of service.
The exercise price for the shares of the common stock subject to option grants made under our 2006 plan may be paid in cash or in shares of common stock valued at fair market value on the exercise date.
The compensation committee will have the authority to cancel outstanding options under our option plan, in return for the grant of new options for the same or a different number of option shares with an exercise price per share based upon the fair market value of our common stock on the new grant date.
In the event we are acquired by a merger, a sale by our stockholders of more than 50% of our outstanding voting stock or a sale of all or substantially all of our assets, each outstanding option under our option plan which will not be assumed by the successor corporation or otherwise continued in effect may accelerate in full. However, the compensation committee will have complete discretion to structure any or all of the options under the option plan so those options will immediately vest in the
event we are acquired, whether or not those options are assumed by the successor corporation or otherwise continued in effect. Alternatively, the compensation committee may condition such accelerated vesting upon the subsequent termination of the optionee's service with us or the acquiring entity.
We intend that any compensation deemed paid by us in connection with the exercise of options granted under our option plan for the disposition of the shares purchased under those options will be regarded as "performance-based," within the meaning of Section 162(m) of the Internal Revenue Code and that such compensation will not be subject to the annual $1 million limitation on the deductibility of compensation paid to covered executive officers which otherwise would be imposed pursuant to Section 162(m).
For accounting purposes, compensation expense related to equity based awards under the 2006 Plan will be measured and recognized in accordance with SFAS No. 123(R).
Our board may amend or modify the 2006 Plan at any time, subject to any required stockholder approval, or participant consent. The 2006 Plan will terminate no later than March 31, 2016.
In July 2006, our board approved the grant of 100,000 restricted shares to be allocated among our employees under the 2006 Plan. The shares will be allocated to employees at the manager level or below with at least six months of service. The allocation will be based on compensation levels and period of service. The restricted shares will vest over a three year period.
Director Compensation
The current members of our board of directors are either management or represent substantial investors in our company prior to this offering. As such, they will not receive any compensation as directors, but will be reimbursed for their out-of-pocket expenses incurred in participating in our meetings. New members of our board of directors will receive compensation of $5,000 per quarter for their service on our board of directors or any committee of our board, and will also be reimbursed for their out-of-pocket expenses. Any new director who has not been in our prior employ will receive an initial grant of options to purchase 20,0001,000 shares of our commonrestricted stock on the date such individual joins the board.board or the date of our initial public offering, if later. The optionsrestricted stock will vest over a period of fourtwo years upon the director's completion of each year
of board service over the four-yeartwo-year period measured from the grant date. In addition, on the date of each annual stockholders meeting held after the completion of this offering, each board member (other than board members who are management or represent our pre-public offering investors) who is to continue to serve as a board member will automatically be granted an option to purchase 10,0001,000 shares of our commonrestricted stock, provided such individual has served on our board for at least six months. The restricted shares subject to each annual 10,000 share automatic option grant will vest upon the optionee'sdirector's completion of one year of board service measured from the grant date. See "Management—Employee Benefit Plans—Long-Term Incentive Plan."
Compensation Committee Interlocks and Insider Participation
No member of our compensation committee serves as a member of the board of directors or compensation committee of any entity that has one or more executive officers serving as members of our board of directors or compensation committee.
Employment Arrangements, Termination of Employment Arrangements and Change in Control Arrangements
At or prior to the closing of this offering, we expect to enter into employment agreements with M. Ponder Harrison, Andrew C. Levy, Linda A. Marvin and Michael P. Baxter. Under each agreement, the officer will be entitled to a base salary and to participate in any bonus program we may adopt. Each officer would receive six months severance pay in the event of termination without cause, resignation for good reason or a change in control. Each officer will agree not to compete with us for a period of one yearsix months after termination of employment.
PRINCIPAL AND SELLING STOCKHOLDERS
Set forth below is information relating to the beneficial ownership of our common stock as of April 30,November 20, 2006, by each person known by us to beneficially own more than 5% of our outstanding shares of common stock, each of our directors, our chief executive officer and each of our four other highest paid executive officers, together the "Named Executive Officers," and all directors and executive officers as a group, and each selling stockholder.group.
Each stockholder's percentage ownership in the following table is based on an assumed 13,945,933 shares of common stock outstanding as of April 30,November 20, 2006, as adjusted to reflect the conversion of all outstanding preferred shares in the reorganization into a corporation to be effective at or immediately prior to the closing of this offering and treating as outstanding all options held by that stockholder and exercisable within 60 days of April 30,November 20, 2006.
Except as otherwise indicated, and subject to applicable community property laws, the persons named in the table have sole voting and investment power with respect to all shares of common stock held by them.
| | | Shares Beneficially Owned Before the Offering(1) | | Shares Beneficially Owned After the Offering(1) | | Shares Beneficially Owned Before the Offering(1) | Shares Beneficially Owned After the Offering(1) | |||||||||||||||
|---|---|---|---|---|---|---|---|---|---|---|---|---|---|---|---|---|---|---|---|---|---|---|
| Name of Beneficial Owner | Name of Beneficial Owner | Shares Offered by Selling Stockholders | Name of Beneficial Owner | |||||||||||||||||||
| Shares | (%) | Shares | (%) | Shares | (%) | Shares | (%) | |||||||||||||||
| 5% Stockholders: | 5% Stockholders: | 5% Stockholders: | ||||||||||||||||||||
| Maurice J. Gallagher, Jr.(2) | 4,845,583 | 34.7 | % | Maurice J. Gallagher, Jr.(2) | 4,845,583 | 34.7 | % | 4,845,583 | 25.4 | % | ||||||||||||
| ComVest Allegiant Holdings, LLC(3) | 4,750,000 | 34.1 | % | ComVest Allegiant Holdings, LLC(3)(4) | 4,750,000 | 34.1 | % | 3,571,429 | 18.8 | % | ||||||||||||
| Viva Air Limited(4) | 1,425,000 | 10.2 | % | Viva Air Limited(3)(5) | 1,425,000 | 10.2 | % | 1,071,429 | 5.6 | % | ||||||||||||
| Mitchell Allee(5) | 937,500 | 6.7 | % | Mitchell Allee(3)(6) | 937,500 | 6.7 | % | 837,500 | 4.4 | % | ||||||||||||
Other Selling Stockholders: | ||||||||||||||||||||||
Executive Officers and Directors: | Executive Officers and Directors: | Executive Officers and Directors: | ||||||||||||||||||||
| Maurice J. Gallagher, Jr.(2) | 4,845,583 | 34.7 | % | Maurice J. Gallagher, Jr.(2) | 4,845,583 | 34.7 | % | 4,845,583 | 25.4 | % | ||||||||||||
| Michael S. Falk(6) | 4,750,000 | 34.1 | % | Michael S. Falk(3)(7) | 4,750,000 | 34.1 | % | 3,571,429 | 18.8 | % | ||||||||||||
| Robert L. Priddy(7) | 4,750,000 | 34.1 | % | Timothy P. Flynn(3) | 380,000 | 2.7 | % | 285,714 | 1.5 | % | ||||||||||||
| Declan F. Ryan(8) | 1,425,000 | 10.2 | % | A. Maurice Mason(8) | 142,500 | 1.0 | % | 10,714 | * | |||||||||||||
| M. Ponder Harrison | 537,500 | 3.9 | % | Robert L. Priddy(3)(9) | 4,750,000 | 34.1 | % | 3,571,429 | 18.8 | % | ||||||||||||
| Andrew M. Levy | 537,500 | 3.9 | % | Declan F. Ryan(3)(10) | 1,425,000 | 10.2 | % | 1,071,429 | 5.6 | % | ||||||||||||
| Linda A. Marvin | 387,500 | 2.8 | % | M. Ponder Harrison | 537,500 | 3.9 | % | 537,500 | 2.8 | % | ||||||||||||
| Michael P. Baxter(9) | 12,000 | * | Andrew C. Levy | 537,500 | 3.9 | % | 537,500 | 2.8 | % | |||||||||||||
| All executive officers and directors as a group (8 persons)(10) | 12,495,083 | 89.6 | % | |||||||||||||||||||
| Linda A. Marvin | 387,500 | 2.8 | % | 387,500 | 2.0 | % | ||||||||||||||||
| Michael P. Baxter(11) | 12,000 | * | 12,000 | * | ||||||||||||||||||
| All executive officers and directors as a group (10 persons)(12) | All executive officers and directors as a group (10 persons)(12) | 12,875,083 | 92.2 | % | 11,248,655 | 59.1 | % | |||||||||||||||
agreement. The number of shares beneficially owned by these stockholders after the offering reflects the sale of these shares. After the closing of this offering and the purchase of these shares by PAR Investment Partners, L.P., it will own 9.2% of our outstanding shares. The address of PAR Investment Partners, L.P. is One International Place, Suite 2401, Boston, MA 02110. In the event the private sale to PAR Investment Partners, L.P. fails to close, then the number of shares and percentage of shares beneficially owned by the following shareholders after the offering will be as follows: ComVest Allegiant Holdings, LLC—4,750,000 shares and 25.1%; Viva Air Limited—1,425,000 shares and 7.5%; Mitchell Allee—937,500 shares and 4.9%; Michael S. Falk—4,750,000 shares and 25.1%; Timothy P. Flynn—380,000 shares and 2.0%; A. Maurice Mason—142,500 shares and less than 1.0%; Robert L. Priddy—4,750,000 shares and 25.1%; and Declan F. Ryan—1,425,000 shares and 7.5%.
Since January 1, 2005, we have been a party to several transactions in which the amount involved exceeded $60,000 and in which any of our directors or executive officers, any holder of more than 5% of our capital stock or any member of their immediate families had a direct or indirect material interest. Other than the indemnification, employment and consulting agreements described herein, theThe related party transactions since January 2005 are described below.
In June 2006, we purchased an MD83 aircraft from an entity in which Maurice J. Gallagher, Jr. and Timothy P. Flynn are principals. The purchase price was $3.5 million, all of which was paid to the secured lender. None of the proceeds were paid to the entity with which Messrs. Gallagher and Flynn are principals.
The landlord under the lease of our office headquarters was a company in which Maurice J.Messrs. Gallagher Jr. is a principal.and Flynn are principals. In April 2005, the office park was sold and, as a result, the lease is no longer with a related party. During 2005, we paid $117,171 of lease payments to the company in which Mr.Messrs. Gallagher is a principal.and Flynn are principals.
We are considering moving all of our Las Vegas operations into a single premise owned by a partnership in which Maurice J. Gallagher, Jr., Timothy P. Flynn and M. Ponder Harrison own a significant interest as limited partners. This agreement has not been finalized, but we would not enter into this transaction unless we believed that the terms will be at least as favorable as we could receive in an arms' length transaction and the transaction is approved by a majority of our board of directors, including a majority of our independent and disinterested outside directors.
From time to time, Mr. Gallagher has provided loans to us for working capital purposes or to finance a part of the purchase price of aircraft. The largest amount outstanding during 2005 was $8,571,019. During 2005, Mr. Gallagher converted $5.0 million of debt into preferred shares at $4.00 per share. The balance of our debt to Mr. Gallagher as of December 31, 2005November 20, 2006, was $1.7$0.9 million. The debt bears interest at 8% per annum, is payable monthly and is payable monthly.secured by our assets. We intend to fully repay Mr. Gallagher at or immediately prior to this offering.
We loaned M. Ponder Harrison, Andrew C. Levy and Linda A. Marvin the funds used to purchase stock in our corporate predecessor in 2003. The loans bore interest at 6% per annum. All of these loans were repaid during 2005. The largest amount outstanding during 2005 from each of these officers was as follows: Harrison—$66,300, Levy—$66,300 and Marvin—$49,725.
We use software developed and maintained by CMS Solutions, a corporation owned by Mitchell Allee. System development and maintenance expenses for services rendered by CMS in 2005 were $285,000. Mr. Allee was the founder of our company, formerly served as our chief executive officer and chairman of the board and continues to own more than 5% of our shares prior to this offering.
We periodically use a private aircraft owned by a corporation in which Mr.Messrs. Gallagher is an owner and principalFlynn are owners and principals for time-sensitive parts deliveries and other critical travel situations, for which we reimburse himthe corporation for customary costs. We did not make any payments for the use of this aircraft during 2005.
For administrative reasons, we arranged for the payment of the salaries and benefits for M. Ponder Harrison, Andrew C. Levy and Linda A. Marvin and the payment of certain other management bonuses through Flynn Gallagher Associates, of which Maurice J.Messrs. Gallagher is an owner and principal.Flynn are owners and principals. We reimbursed Flynn Gallagher Associates for the actual cost paid by it for the benefit of these employees. During 2005, the total amount paid by us under this arrangement was $757,682. This arrangement for salaries and benefits for these executive officers will continue in 2006 until the completion of our reorganization into a corporation, which will be effective at or immediately before the closing of this offering.
Mr. Flynn was not affiliated with us at the time the above arrangements were entered into.
During 2005, we repurchased 62,500 shares from each of Mitchell Allee, M. Ponder Harrison, Andrew C. Levy and Linda A. Marvin for $250,000 each.
ComVest Allegiant Holdings, LLC, and Viva Air Limited and Timothy P. Flynn purchased their shares in us in a private placement transaction completed in May 2005, pursuant to the terms of a Securities Purchase
Agreement dated as of April 4, 2005. Each party paid $4.00 per share for its preferred shares in Allegiant Travel Company, LLC (6,250,000 shares for ComVest, and 1,875,000 shares for Viva)Viva and 500,000 shares for Flynn). Neither ComVest, Viva nor VivaFlynn was affiliated with us prior to the purchase of shares.
Each holder of shares of our preferred shares and our common stock issued or issuable upon conversion thereof is entitled to registration rights, including Maurice J. Gallagher, Jr., ComVest, Viva and Viva.Timothy P. Flynn. See "Description of Capital Stock—Registration Rights."
At or prior to the closing of this offering, we expect to enter into employment agreements with M. Ponder Harrison, Andrew C. Levy, Linda A. Marvin and Michael P. Baxter. See "Management—Employment Arrangements, Termination of Employment Arrangements and Change in Control Arrangements."
We expect to enter into agreements that provide indemnification to our directors, officers and other persons requested or authorized by our board of directors to take actions on behalf of us for all losses, damages, costs and expenses incurred by the indemnified person arising out of such person's service in such capacity. See "—Director and Officer Indemnification."
As our predecessor was a limited liability company, our members were taxable on the income earned by us until our reorganization into a corporation at or immediately prior to this offering. We make distributions to our members to enable them to pay their respective taxes. These distributions are reflected in our statements of cash flows and statements of shareholders'/members' equity. We made $1.4 million of distributions to our members during 2005 and $5.0 million of distributions to our members from January 1, 2006 to November 20, 2006. We intend to make one or more additional distributions based on the amount of taxable income ultimately allocable to our members for periods prior to this offering. The amount of subsequent distributions has not yet been determined.
In connection with this offering, we will enter into a tax indemnification agreement to indemnify the members of Allegiant Travel Company, LLC against certain increases in taxes that relate to activities of Allegiant Travel Company, LLC and its affiliates prior to this offering. See "—Tax Indemnification Agreement and Related Matters."
Reorganization Transactions
Prior to this offering, we have conducted our business through a limited liability company, Allegiant Travel Company, LLC. In connection with the completion of this offering, we will complete a reorganization transaction to have Allegiant Travel Company (a Nevada corporation) succeed to the business of Allegiant Travel Company, LLC and to have our members become stockholders of Allegiant Travel Company (a Nevada corporation).
Travel Company (a Nevada corporation) will succeed to all of the assets and liabilities held by Allegiant Travel Company, LLC at the time of the merger.
Consummation of the transactions contemplated in the plan of reorganization is a condition to the closing of this offering. In addition, we have agreed to indemnify our members, managers, officers and their representatives with respect to any action, existing or occurring at or prior to the closing of the merger, which may be brought against them and which arises out of or pertains to our plan of reorganization and merger agreement, the limited liability company agreement of Allegiant Travel Company, LLC or our reorganization transaction, subject to limitations imposed by Nevada law and our articles of incorporation and bylaws.
Director and Officer Indemnification
We expect to enter into agreements that provide indemnification to our directors, officers and other persons requested or authorized by our board of directors to take actions on behalf of us for all losses, damages, costs and expenses incurred by the indemnified person arising out of such person's service in such capacity, subject to the limitations imposed by Nevada law. This agreement will be in addition to our indemnification obligations under our bylaws as described under "Description of Capital Stock—Anti-Takeover Effects of Certain Provisions of Nevada Law and Our Articles of Incorporation and Bylaws—Indemnification Arrangements."
Tax Indemnification Agreement and Related Matters
An entity that has historically operated in corporate form generally is liable for any adjustments to the corporation's taxes for periods prior to its initial public offering. In contrast, our members, rather than us, generally will be liable for adjustments to taxes (including U.S. federal and state income taxes) attributable to the operations of Allegiant Travel Company, LLC and its affiliates prior to this offering. In connection with this offering, we will enter into a tax indemnification agreement to indemnify the members of Allegiant Travel Company, LLC against certain increases in taxes that relate to activities of Allegiant Travel Company, LLC and its affiliates prior to this offering.
The tax indemnification agreement will include provisions that permit us to control any tax proceeding or contest which might result in being required to make a payment under the tax indemnification agreement.
Other Relationships and Transactions
We expect to enter into employment agreements with some of our executive officers and we have granted options under our stock option plan. See "Management—Director Compensation" and "—Employment Arrangements, Termination of Employment Arrangements and Change in Control Arrangements" and "Description of Capital Stock—Anti-Takeover Effects of Certain Provisions of Nevada Law and Our Articles of Incorporation and Bylaws—Indemnification Arrangements."
We believe all of the transactions set forth above were made on terms no less favorable to us than could have been otherwise obtained from unaffiliated third parties. All future transactions, including loans, if any, between us and our officers, directors and principal stockholders and their affiliates and any transactions between us and any entity with which our officers, directors or five percent stockholders are affiliated, will be approved by a majority of the board of directors, including a majority of the independent and disinterested outside directors, and will be on terms no less favorable to us than could be obtained from unaffiliated third parties.
Authorized Capitalization
At the closing of this offering, our capital structure will consist of 100,000,000 authorized shares of common stock and 5,000,000 shares of undesignated preferred stock. Immediately following the completion of this offering, an aggregate of 19,045,933 shares of common stock will be issued and outstanding and no shares of preferred stock will be issued and outstanding.
Common Stock
The holders of our common stock are entitled to dividends as our board of directors may declare from time to time from legally available funds subject to the preferential rights of the holders of any shares of our preferred stock that we may issue in the future. The holders of our common stock are entitled to one vote per share on any matter to be voted upon by stockholders, subject to the restrictions described below under the caption "Anti-Takeover Effects of Certain Provisions of Nevada Law and Our Articles of Incorporation and Bylaws—Limited Voting by Foreign Owners."
Our articles of incorporation do not provide for cumulative voting in connection with the election of directors. Accordingly, directors will be elected by a plurality of the shares voting once a quorum is present. No holder of our common stock will have any preemptive right to subscribe for any shares of capital stock issued in the future.
Upon any voluntary or involuntary liquidation, dissolution or winding up of our affairs, the holders of our common stock are entitled to share, on a pro rata basis, all assets remaining after payment to creditors and subject to prior distribution rights of any shares of preferred stock that we may issue in the future. All of the outstanding shares of common stock are, and the shares offered by us in this offering will be, fully paid and non-assessable.
Preferred Stock
As of the closing of this offering, no shares of our preferred stock will be outstanding. Under our articles of incorporation, our board of directors, without further action by our stockholders, will be authorized to issue shares of preferred stock in one or more classes or series. The board may fix the rights, preferences and privileges of the preferred stock, along with any limitations or restrictions, including voting rights, dividend rights, conversion rights, redemption privileges and liquidation preferences of each class or series of preferred stock. The preferred stock could have voting or conversion rights that could adversely affect the voting power or other rights of holders of our common stock. The issuance of preferred stock could also have the effect, under certain circumstances, of delaying, deferring or preventing a change of control of our company. We currently have no plans to issue any shares of preferred stock.
Registration Rights
We have entered into an investors agreement with the investors in preferred shares of our limited liability company predecessor.predecessor and PAR. After this offering, thethese holders of up to 7,612,600 shares of common stock issuable upon conversion of the preferred shares in the reorganization will be entitled to registration rights with respect to their shares. Any group of holders of at least 25% of the securities with registration rights can require us to register all or part of their shares at any time following six months after this offering, so long as the holders propose to sell shares at an aggregate price of at least $30,000,000. After we have completed two such registrations we are no longer subject to these demand registration rights. In addition, holders of the securities with registration rights may also require us to include their shares in future registration statements that we file, subject to cutback at the option of the underwriters of such an offering. Subject to our eligibility to do so, holders of registrable securities may
also require us once in any 12-month period to register
their shares with the Securities and Exchange Commission on Form S-3 so long as the holders propose to sell shares at an aggregate price of at least $30,000,000. Upon any of these registrations, these shares will be freely tradable in the public market without restriction. All registration rights will expire no later than two years after the closing of this offering.
In addition, we have agreed with PAR to file by February 9, 2007, a shelf registration statement covering their 1,750,000 shares of common stock and to keep the registration statement in effect for up to two years after the date of their purchase of shares.
Anti-Takeover Effects of Certain Provisions of Nevada Law and Our Articles of Incorporation and Bylaws
Effect of Nevada Anti-takeover Statute. We are subject to Section 78.438 of the Nevada Revised Statutes, an anti-takeover law. In general, Section 78.438 prohibits a Nevada corporation from engaging in any business combination with any interested stockholder for a period of three years following the date that the stockholder became an interested stockholder, unless prior to that date, the board of directors of the corporation approved either the business combination or the transaction that resulted in the stockholder becoming an interested stockholder. Section 78.439 provides that business combinations after the three year period following the date that the stockholder becomes an interested stockholder may also be prohibited unless approved by the corporation's directors or other stockholders or unless the price and terms of the transaction meet the criteria set forth in the statute.
Section 78.416 defines "business combination" to include the following:
In general, Section 78.423 defines an interested stockholder as any entity or person beneficially owning, directly or indirectly, 10% or more of the outstanding voting stock of the corporation and any entity or person affiliated with or controlling or controlled by any of these entities or persons.
Control Share Acquisitions. Sections 78.378 through 78.3793 of the Nevada Revised Statutes limit the voting rights of certain acquired shares in a corporation. The provisions apply to any acquisition of outstanding voting securities of a Nevada corporation that has 200 or more stockholders, at least 100 of which are Nevada residents, and conducts business in Nevada (an "issuing corporation") resulting in
ownership of one of the following categories of an issuing corporation's then outstanding voting securities: (i) twenty percent or more but less than thirty-three percent; (ii) thirty-three percent or more but less than fifty percent; or (iii) fifty percent or more. The securities acquired in such
acquisition are denied voting rights unless a majority of the security holders approve the granting of such voting rights. Unless an issuing corporation's articles of incorporation or bylaws then in effect provide otherwise: (i) voting securities acquired are also redeemable in part or in whole by an issuing corporation at the average price paid for the securities within 30 days if the acquiring person has not given a timely information statement to an issuing corporation or if the stockholders vote not to grant voting rights to the acquiring person's securities, and (ii) if outstanding securities and the security holders grant voting rights to such acquiring person, then any security holder who voted against granting voting rights to the acquiring person may demand the purchase from an issuing corporation, for fair value, all or any portion of his securities. These provisions do not apply to acquisitions made pursuant to the laws of descent and distribution, the enforcement of a judgment, or the satisfaction of a security interest, or made in connection with certain mergers or reorganizations.
Articles of Incorporation and Bylaw Provisions. Our articles of incorporation and bylaws include provisions that may have the effect of discouraging, delaying or preventing a change in control or an unsolicited acquisition proposal that a stockholder might consider favorable, including a proposal that might result in the payment of a premium over the market price for the shares held by stockholders. These provisions are summarized in the following paragraphs.
Authorized but Unissued or Undesignated Capital Stock. At the closing of this offering, our authorized capital stock consists of 100,000,000 shares of common stock and 5,000,000 shares of preferred stock. No preferred stock will be designated upon consummation of this offering. After this offering, we will have outstanding 19,045,933 shares of common stock. The authorized but unissued (and in the case of preferred stock, undesignated) stock may be issued by the board of directors in one or more transactions. In this regard, our articles of incorporation grant the board of directors broad power to establish the rights and preferences of authorized and unissued preferred stock. The issuance of shares of preferred stock pursuant to the board's authority described above could decrease the amount of earnings and assets available for distribution to holders of common stock and adversely affect the rights and powers, including voting rights, of such holders and may have the effect of delaying, deferring or preventing a change in control. The board of directors does not currently intend to seek stockholder approval prior to any issuance of preferred stock, unless otherwise required by law.
Special Meetings of Stockholders. Our bylaws provide that special meetings of our stockholders may be called only by our board of directors, by our chairman of the board of directors or by our chief executive officer.
Notice Procedures. Our bylaws establish advance notice procedures with regard to all stockholder proposals to be brought before meetings of our stockholders, including proposals relating to the nomination of candidates for election as directors, the removal of directors and amendments to our articles of incorporation or bylaws. These procedures provide that notice of such stockholder proposals must be timely given in writing to our secretary prior to the meeting. Generally, to be timely, notice must be received by our secretary not less than 120 days prior to the meeting. The notice must contain certain information specified in the bylaws.
Other Anti-Takeover Provisions. See "Management—Employee Benefit Plans" for a discussion of certain provisions of our Stock Option Planlong-term incentive plan which may have the effect of discouraging, delaying or preventing a change in control or unsolicited acquisition proposals.
Limitation of Director Liability. Our articles of incorporation limit the liability of our directors (in their capacity as directors but not in their capacity as officers) to us or our stockholders to the fullest extent permitted by Nevada law. Specifically, our directors will not be personally liable for monetary damages for breach of a director's fiduciary duty as a director, except for liability:
Indemnification Arrangements. Our bylaws provide that our directors and officers shall be indemnified and provide for the advancement to them of expenses in connection with actual or threatened proceedings and claims arising out of their status as such to the fullest extent permitted by the Nevada Revised Statutes. We expect to enter into indemnification agreements with each of our directors and executive officers that provide them with rights to indemnification and expense advancement to the fullest extent permitted under the Nevada Revised Statutes.
Limited Voting by Foreign Owners. To comply with restrictions imposed by federal law on foreign ownership of U.S. airlines, our articles of incorporation and bylaws restrict voting of shares of our capital stock by non-U.S. citizens. The restrictions imposed by federal law currently require that no more than 25% or our voting stock be voted, directly or indirectly, by persons who are not U.S. citizens, and that our president and at least two-thirds of the members of our board of directors be U.S. citizens. Our articles of incorporation provide that no shares of our capital stock may be voted by or at the direction of non-U.S. citizens unless such shares are registered on a separate stock record, which we refer to as the foreign stock record. Our bylaws further provide that no shares of our capital stock will be registered on the foreign stock record if the amount so registered would exceed the foreign ownership restrictions imposed by federal law. Prior to this offering, 11.3% of our stock was owned by a non-U.S. citizen. This non-U.S. citizen will own %5.6% of our stock after this offering and after the sale of shares to PAR (or 7.5% if the sale of shares to PAR fails to close) assuming that the underwriters' overallotment option is not exercised. This will limit the amount of voting stock that may be owned by other non-U.S. citizens. In addition, Declan Ryan a memberand Maurice Mason, members of our board of directors, isare not a U.S. citizen.citizens. As a result we will not be able to appoint any other non-U.S. citizen to our board unless the size of our board is increased, which is not expected.
Listing
We expect our common stock to be approved for quotation on the Nasdaq National Market under the symbol "ALGT."
Transfer Agent and Registrar
The transfer agent and registrar for our common stock is .American Stock Transfer & Trust Company. Its address is .59 Maiden Lane, Plaza Level, New York, New York 10038.
SHARES ELIGIBLE FOR FUTURE SALE
Prior to this offering, there has been no public market for our common stock, and we cannot predict the effect, if any, that market sales of shares of our common stock or the availability of shares of our common stock for sale will have on the market price of our common stock prevailing from time to time. Nevertheless, sales of substantial amounts of our common stock in the public market could adversely affect the market price of our common stock and could impair our future ability to raise capital through the sale of our equity securities.
Upon the completion of this offering, we will have 19,045,933 shares of common stock outstanding, assuming no exercise of the underwriters' overallotment option. The number of shares of common stock to be outstanding after this offering is based on the number of shares outstanding as of April 30,November 20, 2006, and excludes 3,000,000 shares of common stock authorized for issuance under our stock optionlong-term incentive plan, of which 389,000414,000 shares were subject to outstanding options at a weighted average exercise price of $3.78$4.66 per share. The number of shares to be outstanding also excluding outstanding warrants to purchase 162,500 shares of common stock at an exercise price of $4.40 per share.
Of the outstanding shares, the 5,000,000 shares sold in this offering and any shares issued upon exercise of the underwriters' overallotment option will be freely tradable without restriction under the Securities Act, except that any shares held by our "affiliates," as that term is defined in Rule 144 promulgated under the Securities Act, may only be sold in compliance with the limitations described below. The remaining 14,045,033 shares of common stock will be deemed "restricted securities" as defined under Rule 144. Restricted shares may be sold in the public market only if registered or if they qualify for a resale under Rules 144 or 144(k) promulgated under the Securities Act, which rules are summarized below. Subject to the lock-up agreements described below and the provisions of Rules 144 and 144(k), all of these12,195,933 shares (13,945,933 shares if the sale to PAR fails to close) will be available for sale in the public market after 180 days from the date of this prospectus when the 180-day lock-up is released as these shares will be freely tradeable under Rule 144 (subject to volume limitations).
Rule 144
In general, under Rule 144, as currently in effect, beginning 90 days after the date of this prospectus, a person who has beneficially owned shares of our common stock for at least one year would be entitled to sell, within any three-month period, a number of shares that does not exceed the greater of:
Rule 144(k)
Under Rule 144(k), a person who is not deemed to have been one of our "affiliates" at any time during the 90 days preceding a sale, and who has beneficially owned the shares proposed to be sold for at least two years, generally including the holding period of any prior owner other than an "affiliate," is entitled to sell such shares without complying with the manner of sale, notice filing, volume limitation or notice provisions of Rule 144.
Stock Options
As of April 30,November 20, 2006, options to purchase a total of 389,000414,000 shares of common stock were outstanding, 112,000127,000 of which are currently exercisable. We intend to file a Form S-8 registration
statement under the Securities Act to register all shares of common stock issuable under our 2006 Plan.
Accordingly, shares of common stock underlying these options will be eligible for sale in the public markets, subject to vesting restrictions or the lock-up agreements described below. See "Management—Employee Benefit Plans."
Lock-up Agreements
We and our officers, directors, stockholders, warrant holders and option holders who hold an aggregate of approximately 12,150,000 shares of our common stock, on a fully diluted basis, have agreed, subject to limited exceptions, not to offer, pledge, sell, contract to sell, sell any option or contract to purchase, purchase any option or contract to sell, grant any option, right or warrant to purchase, or otherwise transfer or dispose of, directly or indirectly, or enter into any swap or other arrangement that transfers to another, in whole or in part, any of the economic consequences of ownership of any shares of common stock or any securities convertible into or exercisable or exchangeable for shares of common stock held prior to the offering for a period of 180 days after the date of this prospectus, without the prior written consent of Merrill Lynch. In the event either (x) during the last 17 days of the 180-day period referred to above, we issue an earnings release or material news or a material event relating to us occurs or (y) prior to the expiration of the 180-day restricted period, we announce that we will release earnings results or become aware that material news or a material event will occur during the 16-day period beginning on the last day of the 180-day restricted period, the restrictions described above shall continue to apply until the expiration of the 18-day period beginning on the issuance of the earnings release or the occurrence of the material news or material event.
If the private sale of 1,750,000 shares of our common stock to PAR closes simultaneously with this offering, PAR has agreed to a similar lock-up for a period of 120 days after the date of this prospectus.
Merrill Lynch, in its sole discretion, at any time or from time to time and without notice, may release for sale in the public market all or any portion of the shares restricted by the terms of the lock-up agreements. The lock-up restrictions will not apply to transactions relating to common stock acquired in open market transactions after the closing of this offering provided that no filing by the transferor under Rule 144 of the Securities Act or Section 16 of the Securities Exchange Act is required or will be voluntarily made in connection with such transactions. The lock-up restrictions also will not apply to certain transfers not involving a disposition for value, provided that the recipient agrees to be bound by these lock-up restrictions and provided that no filing by the transferor under Rule 144 of the Securities Act or Section 16 of the Securities Exchange Act is required or will be voluntarily made in connection with such transfers.
Registration Rights
Following this offering, under specified circumstances and subject to customary conditions, holders of up to 7,612,600 shares of our outstanding common stock will have demand registration rights with respect to their shares of common stock, subject to the 180-day lock-up arrangementarrangements described above, to require us to register their shares of common stock under the Securities Act, and will have rights to participate in any future registrations of securities. If the holders of these registrable securities request that we register their shares, and if the registration is effected, these shares will become freely tradable without restriction under the Securities Act. Any sales of securities by these stockholders could have a material adverse effect on the trading price of our common stock. See "Description of Capital Stock—Registration Rights."
In addition, we have agreed with PAR to file by February 9, 2007, a shelf registration statement covering their 1,750,000 shares of common stock and to keep the registration statement in effect for up to two years after the date of the purchase of their shares.
MATERIAL UNITED STATES FEDERAL TAX CONSIDERATIONS FOR
NON-U.S. HOLDERS OF COMMON STOCK
The following is a general discussion of the material U.S. federal income and estate tax considerations applicable to non-U.S. holders with respect to their ownership and disposition of shares of our common stock. In general, a "non-U.S. holder" is any holder other than:
This discussion is based on current provisions of the Internal Revenue Code of 1986, as amended, existing and proposed Treasury regulations promulgated thereunder, current administrative rulings and judicial decisions, all of which are subject to change. Any change, which may or may not be retroactive, could alter the tax consequences to non-U.S. holders described in this prospectus. We assume in this discussion that a non-U.S. holder holds shares of our common stock as a capital asset (generally property held for investment). This discussion does not address all aspects of U.S. federal income and estate taxation that may be relevant to a particular non-U.S. holder in light of that non-U.S. holder's individual circumstances nor does it address any aspects of U.S. state, local or non-U.S. taxes. This discussion also does not consider any specific facts or circumstances that may apply to a non-U.S. holder subject to special treatment under the U.S. federal income tax laws (such as insurance companies, tax-exempt organizations, financial institutions, brokers, dealers in securities, partnerships, owners of more than 5% of our common stock and certain U.S. expatriates). Accordingly, we urge prospective investors to consult with their own tax advisor regarding the U.S. federal, state, local and non-U.S. income and other tax considerations of acquiring, holding and disposing of shares of our common stock.
Distributions on Our Common Stock
As previously discussed, we have not declared or paid distributions on our common stock since our inception (other than to defray the income tax liability incurred by our owners as a result of the portion of our taxable income allocated to them). We do not intend to pay any distributions on our common stock in the foreseeable future. See "Dividend Policy." In the event we do pay distributions on our common stock, however, these distributions generally will constitute dividends for U.S. federal income tax purposes to the extent paid from our current or accumulated earnings and profits, as determined under U.S. federal income tax principles. If a distribution exceeds our current and accumulated earnings and profits, the excess will be treated as a tax-free return of the holder's investment, up to the holder's basis in the common stock. Any remaining excess will be treated as capital gain. Dividends paid to non-U.S. holders on our common stock that are not effectively connected with the conduct of a U.S. trade or business will be subject to U.S. withholding tax at a 30% rate or, if a tax treaty applies, a lower rate specified by the treaty. To receive a reduced treaty rate, non-U.S. holders must furnish to us or our paying agent a duly completed IRS Form W-8BEN or substitute form certifying the holder's qualification for the reduced rate. Where dividends are paid to a
non-U.S. holder that is a partnership or other pass-through entity, persons holding an interest in the entity may also be required to provide the certification.
Gain On Sale or Other Disposition of Common Stock
In general, a non-U.S. holder will not be subject to U.S. federal income tax on any gain realized upon such holder's sale or other disposition of shares of our common stock unless:
Income or Gain Effectively Connected With a U.S. Trade or Business
If a non-U.S. holder of our common stock is engaged in a trade or business in the United States and if dividends on the common stock or gain realized on the sale, exchange or other disposition of the common stock is effectively connected with the non-U.S. holder's conduct of such trade or business (and, if an applicable tax treaty requires, is attributable to a U.S. permanent establishment maintained by the non-U.S. holder in the U.S.), the non-U.S. holder, although exempt from U.S. withholding tax (provided that the certification requirements discussed in the next sentence are met), will generally be subject to U.S. federal income tax on such dividends or gain on a net income basis in the same manner as if it were a resident of the United States. The non-U.S. holder will be required, under currently effective Treasury regulations, to provide a properly executed Internal Revenue Service Form W-8ECI or successor form in order to claim an exemption from U.S. withholding tax. In addition, if such non-U.S. holder is a foreign corporation, it may be subject to a branch profits tax equal to 30 percent (or such lower rate provided by an applicable U.S. income tax treaty) of a portion of its effectively connected earnings and profits for the taxable year.
Estate Tax
Shares of our common stock that are owned or treated as owned by an individual non-U.S. holder at the time of death will be included in the individual's gross estate for U.S. federal estate tax purposes, unless an applicable estate tax treaty provides otherwise, and therefore may be subject to U.S. federal estate tax.
Backup Withholding, Information Reporting And Other Reporting Requirements
A non-U.S. holder may have to comply with specific certification procedures to establish that the holder is not a United States person in order to avoid backup withholding with respect to our payments
of dividends on the common stock. We must report annually to the Internal Revenue Service and to each non-U.S. holder the amount of any dividends paid to such holder and the tax withheld with respect to such dividends, regardless of whether withholding was not required because the dividends were effectively connected dividends or withholding was reduced or eliminated by an applicable tax treaty. Copies of this information also may be made available under the provisions of a specific treaty or agreement with the tax authorities in the country in which the non-U.S. holder resides or is established.
The payment of proceeds from the disposition of shares of our common stock to or through a U.S. office of a broker will be subject to information reporting and backup withholding, unless the non-U.S. holder, under penalties of perjury, certifies, among other things, its status as a non-U.S. holder or otherwise establishes an exemption. The payment of proceeds from the disposition of shares of our common stock to or through a foreign office of a foreign broker generally will not be subject to backup withholding and information reporting. However, information reporting (but not backup withholding) will apply to the payment of proceeds from a disposition of shares of our common stock effected outside the United States by a foreign office of a broker if the broker is:
unless the broker has documentary evidence in its files that the owner is a non-U.S. holder and certain other conditions are satisfied, or the non-U.S. holder otherwise establishes an exemption (and the broker has no actual knowledge to the contrary).
Backup withholding is not an additional tax. Any amounts withheld under the backup withholding rules from a payment to a non-U.S. holder can be refunded or credited against the non-U.S. holder's U.S. federal income tax liability, if any, provided that the required information is furnished to the IRS in a timely manner.
The foregoing discussion of certain U.S. federal income tax considerations is for general information only. Accordingly, all prospective non-U.S. holders of our common stock should consult their own tax advisors with respect to the U.S. federal, state, local and foreign tax consequences of the acquisition, ownership and disposition of our common stock.
Merrill Lynch, Pierce, Fenner & Smith Incorporated, Bear, Stearns & Co. Inc., and Raymond James & Associates, Inc. are acting as representatives of the underwriters named below.in connection with this offering. Subject to the terms and conditions set forth in a purchase agreement among us the selling stockholders and the underwriters, we and the selling stockholders have agreed to sell to the underwriters, and each of the underwriters, severally and not jointly, have agreed to purchase from us, and the selling stockholders, the number of shares listed opposite their names below.
| | Underwriter | Number of Shares | |
|---|---|---|---|
| Merrill Lynch, Pierce, Fenner & Smith Incorporated | |||
| Bear, Stearns & Co. Inc. | |||
| Raymond James & Associates, Inc. | |||
| Total | |||
Subject to the terms and conditions in the purchase agreement, the underwriters have agreed, severally and not jointly, to purchase all the shares of our common stock being sold pursuant to the purchase agreement if any of these shares of our common stock are purchased. If an underwriter defaults, the purchase agreement provides that the purchase commitments of the nondefaulting underwriters may be increased or the purchase agreement may be terminated.
We and the selling stockholders have agreed to indemnify the underwriters against certain liabilities, including liabilities under the Securities Act, or to contribute to payments the underwriters may be required to make in respect of those liabilities.
The underwriters are offering the shares, subject to prior sale, when, as and if issued to and accepted by them, subject to approval of legal matters by their counsel, including the validity of the shares, and other conditions contained in the purchase agreement, such as the receipt by the underwriters of officers' certificates and legal opinions. The underwriters reserve the right to withdraw, cancel or modify offers to the public and to reject orders in whole or in part.
Commissions and Discounts
The representativesunderwriters have advised us and the selling stockholders that the underwritersthey propose initially to offer the shares to the public at the initial public offering price on the cover page of this prospectus and to dealers at that price less a concession not in excess of $ per share. The underwriters may allow, and the dealers may reallow, a discount not in excess of $ per share to other dealers. After the initial public offering, the public offering price, concession and discount may be changed.
The following table shows the public offering price, underwriting discount and the proceeds before expenses to us and the selling stockholders.expenses. The information assumes either no exercise or full exercise by the underwriters of their overallotment option.
| | Per Share | Without Option | With Option | |||
|---|---|---|---|---|---|---|
| Public offering price | $ | $ | $ | |||
| Underwriting discount | $ | $ | $ | |||
| Proceeds, before expenses, to Allegiant | $ | $ | $ | |||
The expenses of the offering, not including the underwriting discount, are estimated at $$1,400,000 and are payable by us.
Overallotment Option
We and the selling stockholders have granted an option to the underwriters to purchase up to 750,000 additional shares at the initial public offering price less the underwriting discount. The underwriters may exercise this option for 30 days from the date of this prospectus solely to cover any overallotments. If the underwriters exercise this option, each underwriter will be obligated, subject to conditions contained in the purchase agreement, to purchase a number of additional shares proportionate to that underwriter's initial amount reflected in the above table.
Reserved Shares
At our request, the underwriters have reserved for sale, at the initial public offering price, up to shares offered by this prospectus for sale to some of our directors, officers, employees, business associates and related persons. These shares will not be subject to a lock-up agreement. If these persons purchase reserved shares, this will reduce the number of shares available for sale to the general public. Any reserved shares that are not orally confirmed for purchase within one day of the pricing of this offering will be offered by the underwriters to the general public on the same terms as the other shares offered by this prospectus.
No Sales of Similar Securities
We, and the selling stockholders, our executive officers, directors and substantially all of our other existing securityholders have agreed, with certain exceptions, not to sell or transfer any common stock or securities convertible into, exchangeable for, exercisable for, or repayable with common stock for 180 days after the date of this prospectus without first obtaining the written consent of Merrill Lynch. Specifically, we and these other individuals have agreed, with certain limited exceptions, not to directly or indirectly
This lock-up provision applies to common stock and to securities convertible into or exchangeable or exercisable for or repayable with common stock. It also applies to common stock owned now or acquired later by the person executing the agreement or for which the person executing the agreement later acquires the power of disposition. In the event either (x) during the last 17 days of the 180-day period referred to above, we issue an earnings release or material news or a material event relating to us occurs or (y) prior to the expiration of the 180-day restricted period, we announce that we will release earnings results or become aware that material news or a material event will occur during the 16-day period beginning on the last day of the 180-day restricted period, the restrictions described above shall continue to apply until the expiration of the 18-day period beginning on the issuance of the earnings release or the occurrence of the material news or material event.
Electronic Distribution
Merrill Lynch will be facilitating Internet distribution for this offering to certain of its Internet subscription customers. Merrill Lynch intends to allocate a limited number of shares for sale to its online brokerage customers. An electronic prospectus is available on the Internet web site maintained by Merrill Lynch. Other than the prospectus in electronic format, the information on the Merrill Lynch web site is not a part of this prospectus.
Quotation on the Nasdaq National Market
We expect our common stock to be approved for quotation on the Nasdaq National Market, subject to official notice of issuance, under the symbol "ALGT"."ALGT."
Before this offering, there has been no public market for our common stock. The initial public offering price will be determined through negotiations among us the selling stockholders and the representatives. In addition to prevailing market conditions, the factors considered in determining the initial public offering price are
An active trading market for the shares of our common stock may not develop. It is also possible that after the offering the shares will not trade in the public market at or above the initial public offering price. The underwriters do not expect to sell more than 5% of the shares in the aggregate to accounts over which they exercise discretionary authority.
Price Stabilization, Short Positions and Penalty Bids
Until the distribution of the shares is completed, rules of the Securities and Exchange Commission may limit underwriters and selling group members from bidding for and purchasing our common stock. However, the representativesunderwriters may engage in transactions that stabilize the price of the common stock, such as bids or purchases to peg, fix or maintain that price.
In connection with the offering, the underwriters may purchase and sell our common stock in the open market. These transactions may include short sales, purchases on the open market to cover positions created by short sales and stabilizing transactions. Short sales involve the sale by the underwriters of a greater number of shares than they are required to purchase in the offering. Covered short sales are sales made in an amount not greater than the underwriters' option to purchase additional shares in the offering. The underwriters may close out any covered short position by either exercising their overallotment option or purchasing shares in the open market. In determining the source of shares to close out the covered short position, the underwriters will consider, among other things, the price of shares available for purchase in the open market as compared to the price at which they may purchase the shares through the overallotment option.
Naked short sales are sales in excess of the overallotment option. The underwriters must close out any naked short position by purchasing shares in the open market. A naked short position is more
likely to be created if the underwriters are concerned that there may be downward pressure on the price of our common stock in the open market after pricing that could adversely affect investors who purchase in the offering. Stabilizing transactions consist of various bids for or purchases of shares of common stock made by the underwriters in the open market prior to the completion of the offering.
The underwriters may also impose a penalty bid. This occurs when a particular underwriter repays to the underwriters a portion of the underwriting discount received by it because the representativesother underwriters have repurchased shares sold by or for the account of such underwriter in stabilizing or short covering transactions.
Similar to other purchase transactions, the purchases by the underwriters to cover the syndicate short sales may have the effect of raising or maintaining the market price of the common stock or preventing or retarding a decline in the market price of the common stock. As a result, the price of our common stock may be higher than the price that might otherwise exist in the open market.
Neither we nor any of the underwriters make any representation or prediction as to the direction or magnitude of any effect that the transactions described above may have on the price of the common stock. In addition, neither we nor any of the underwriters make any representation that the representativesunderwriters will engage in these transactions or that these transactions, once commenced, will not be discontinued without notice.
Other Relationships
Raymond James & Associates, Inc. served as our financial advisor in connection with our sale of preferred shares in May 2005. As compensation for their services, we paid Raymond James a cash fee of $1,300,000 and issued to them five-year warrants to purchase 162,500 shares of common stock at $4.40 per share.
In connection with the stock purchase agreement with PAR, we and the selling stockholders entered into an agency agreement with Merrill Lynch, Pierce, Fenner & Smith Incorporated, one of the underwriters of this offering, pursuant to which Merrill Lynch will receive a fee of approximately $700,000 for arranging the stock purchase by PAR, based on the midpoint of the range set forth on the cover page of this prospectus.
Some of the underwriters and their affiliates have engaged in, and may in the future engage in, investment banking and other commercial dealings in the ordinary course of business with us. They have received customary fees and commissions for these transactions.
The validity of the shares of common stock offered by this prospectus will be passed upon for us by Ellis Funk, P.C., Atlanta, Georgia. Members of Ellis Funk, P.C. will own 7,600 shares of our common stock upon the conversion of their preferred shares upon the closing of this offering. Certain legal matters related to the offering will be passed upon for the underwriters by Skadden, Arps, Slate, Meagher & Flom LLP, New York, New York.
The consolidated financial statements of Allegiant Travel Company, LLC as of December 31, 2004 and 2005, and for each of the three years in the period ended December 31, 2005, appearing in the Prospectus and Registration Statement have been audited by Ernst & Young LLP, independent registered public accounting firm, as set forth in their report thereon appearing elsewhere herein, and are included in reliance upon such report given on the authority of such firm as experts in accounting and auditing.
WHERE YOU CAN FIND ADDITIONAL INFORMATION
We have filed with the Commission a registration statement on Form S-1, which includes amendments, exhibits, schedules and supplements, under the Securities Act and the rules and regulations under the Securities Act, for the registration of the common stock offered by this prospectus. Although this prospectus, which forms a part of the registration statement, contains all material information included in the registration statement, parts of the registration statement have been omitted from this prospectus as permitted by the rules and regulations of the Commission. For further information about us and the common stock offered by this prospectus, please refer to the registration statement. Statements contained in this prospectus as to the contents of any contracts or other document referred to in this prospectus are not necessarily complete and, where such contract or other document is an exhibit to the registration statement, each such statement is qualified in all respects by the provisions of such exhibit, to which reference is now made. The registration statement can be inspected and copied at prescribed rates at the public reference facilities maintained by the Commission at Room 1024, 450 Fifth100 F Street, N.W.N.E., Washington, D.C. 20549, and at other public reference facilities maintained by the Commission. The public may obtain information regarding the Washington, D.C. Public Reference Room by calling the Commission at 1-800-SEC-0330. In addition, the registration statement is publicly available through the Commission's site on the Internet's World Wide Web, located at: http://www.sec.gov.
After the offering, we will be subject to the full informational requirements of the Securities Exchange Act. To comply with these requirements, we will file periodic reports, proxy statements and other information with the Commission.
INDEX TO CONSOLIDATED FINANCIAL STATEMENTS
| | Page | |
|---|---|---|
| Report of Independent Registered Public Accounting Firm | F-2 | |
Consolidated Balance Sheets as of December 31, 2004 and 2005 and (unaudited) September 30, 2006 | F-3 | |
Consolidated Statements of Operations for each of the three years in the period ended December 31, 2005 and for the (unaudited) nine months ended September 30, 2005 and 2006 | F-4 | |
Consolidated Statements of Shareholders'/Members' Equity (Deficit) and Comprehensive Income for each of the three years in the period ended December 31, 2005 and for the (unaudited) nine months ended September 30, 2006 | F-5 | |
Consolidated Statements of Cash Flows for each of the three years in the period ended December 31, 2005 and for the (unaudited) nine months ended September 30, 2005 and 2006 | F-6 | |
Notes to Consolidated Financial Statements |
REPORT OF INDEPENDENT REGISTERED PUBLIC ACCOUNTING FIRM
To the Managing Board of Allegiant Travel Company, LLC
We have audited the accompanying consolidated balance sheets of Allegiant Travel Company, LLC and its subsidiaries ("the Company") as of December 31, 2004 and 2005, and the related consolidated statements of operations, shareholders'/members' equity (deficit) and comprehensive income, and cash flows for each of the three years in the period ended December 31, 2005. These consolidated financial statements are the responsibility of the Company's management. Our responsibility is to express an opinion on these consolidated financial statements based on our audits.
We conducted our audits in accordance with the standards of the Public Company Accounting Oversight Board (United States). Those standards require that we plan and perform the audit to obtain reasonable assurance about whether the financial statements are free of material misstatement. We were not engaged to perform an audit of the Company's internal control over financial reporting. Our audits included consideration of internal control over financial reporting as a basis for designing audit procedures that are appropriate in the circumstances, but not for the purpose of expressing an opinion on the effectiveness of the Company's internal control over financial reporting. Accordingly, we express no such opinion. An audit also includes examining, on a test basis, evidence supporting the amounts and disclosures in the financial statements, assessing the accounting principles used and significant estimates made by management, and evaluating the overall financial statement presentation. We believe that our audits provide a reasonable basis for our opinion.
In our opinion, the financial statements referred to above present fairly, in all material respects, the consolidated financial position of the Company at December 31, 2004 and 2005, and the consolidated results of its operations and its cash flows for each of the three years in the period ended December 31, 2005, in conformity with U.S. generally accepted accounting principles.
/s/ ERNST & YOUNG LLP
Las Vegas, Nevada
May 12, 2006
ALLEGIANT TRAVEL COMPANY, LLC
CONSOLIDATED BALANCE SHEETSAS OF DECEMBER 31, 2004 AND 2005
(In thousands, except share and per share amounts)
| | | As of December 31, | As of September 30, | Pro Forma as of September 30, | |||||||||||||
|---|---|---|---|---|---|---|---|---|---|---|---|---|---|---|---|---|---|
| | | 2004 | 2005 | 2006 | 2006 | ||||||||||||
| | | 2004 | 2005 | | | | (unaudited) | See Note 1 (unaudited) | |||||||||
| ASSETS | ASSETS | ASSETS | |||||||||||||||
| Current assets: | Current assets: | Current assets: | |||||||||||||||
| Cash and cash equivalents | $1,569 | $21,259 | Cash and cash equivalents | $1,569 | $21,259 | $11,855 | $11,855 | ||||||||||
| Restricted cash | 11,830 | 3,612 | Restricted cash | 11,830 | 3,612 | 8,035 | 8,035 | ||||||||||
| Short-term investments | — | 32,066 | Short-term investments | — | 32,066 | 33,125 | 33,125 | ||||||||||
| Accounts receivable, net of allowance for doubtful accounts of $0 at December 31, 2004 and 2005 | 2,738 | 6,742 | Accounts receivable, net of allowance for doubtful accounts of none at December 31, 2004 and 2005 and September 30, 2006 | 2,738 | 6,742 | 5,914 | 5,914 | ||||||||||
| Expendable parts, supplies and fuel, net of allowance for obsolescence of $34 and $44 at December 31, 2004 and 2005, respectively | 1,547 | 1,387 | Expendable parts, supplies and fuel, net of allowance for obsolescence of $34 and $44 at December 31, 2004 and 2005, respectively and $155 at September 30, 2006 | 1,547 | 1,387 | 2,641 | 2,641 | ||||||||||
| Prepaid expenses | 6,940 | 11,741 | Prepaid expenses | 4,483 | 9,284 | 8,476 | 8,476 | ||||||||||
| Other current assets | 3,302 | 2,727 | Other current assets | 3,302 | 2,727 | 5,270 | 5,270 | ||||||||||
| Total current assets | 27,926 | 79,534 | Total current assets | 25,469 | 77,077 | 75,316 | 75,316 | ||||||||||
Property and equipment, net | Property and equipment, net | 38,484 | 87,069 | Property and equipment, net | 38,484 | 87,069 | 110,009 | 110,009 | |||||||||
| Restricted cash, net of current portion | Restricted cash, net of current portion | 435 | 1,225 | Restricted cash, net of current portion | 435 | 1,225 | 30 | 30 | |||||||||
| Deposits and other assets | Deposits and other assets | 1,086 | 4,712 | Deposits and other assets | 1,086 | 4,712 | 4,397 | 4,397 | |||||||||
| Total Assets | $67,931 | $172,540 | Total Assets | $65,474 | $170,083 | $189,752 | $189,752 | ||||||||||
| LIABILITIES AND SHAREHOLDERS'/MEMBERS' EQUITY | LIABILITIES AND SHAREHOLDERS'/MEMBERS' EQUITY | LIABILITIES AND SHAREHOLDERS'/MEMBERS' EQUITY | |||||||||||||||
| Current liabilities: | Current liabilities: | Current liabilities: | |||||||||||||||
| Current maturities of notes payable | $4,423 | $6,111 | Current maturities of notes payable | $4,423 | $6,111 | $9,055 | $9,055 | ||||||||||
| Current maturities of capital lease obligations | 3 | 3,232 | Current maturities of capital lease obligations | 3 | 3,232 | 4,047 | 4,047 | ||||||||||
| Current maturities of notes payable to related party | 3,246 | 1,284 | Current maturities of notes payable to related party | 3,246 | 1,284 | 891 | 891 | ||||||||||
| Accounts payable | 5,201 | 14,158 | Accounts payable | 5,201 | 14,158 | 14,821 | 14,821 | ||||||||||
| Accrued liabilities | 2,770 | 4,882 | Accrued liabilities | 2,770 | 4,882 | 7,519 | 7,519 | ||||||||||
| Air traffic liability | 15,918 | 37,149 | Air traffic liability | 15,918 | 37,149 | 44,527 | 44,527 | ||||||||||
| Refundable deposits | 100 | — | Refundable deposits | 100 | — | 250 | 250 | ||||||||||
| Total current liabilities | 31,661 | 66,816 | Total current liabilities | 31,661 | 66,816 | 81,110 | 81,110 | ||||||||||
Non-current liabilities | Non-current liabilities | Non-current liabilities | |||||||||||||||
| Long-term debt: | Long-term debt: | Long-term debt: | |||||||||||||||
| Notes payable, net of current maturities | 19,034 | 23,418 | Notes payable, net of current maturities | 19,034 | 23,418 | 26,017 | 26,017 | ||||||||||
| Capital lease obligations, net of current maturities | — | 25,251 | Capital lease obligations, net of current maturities | — | 25,251 | 22,204 | 22,204 | ||||||||||
| Notes payable to related party, net of current maturities | 5,286 | 451 | Notes payable to related party, net of current maturities | 5,286 | 451 | — | — | ||||||||||
| Deferred income taxes | — | — | — | 6,166 | |||||||||||||
| Total Liabilities | 55,981 | 115,936 | |||||||||||||||
| Total Liabilities | 55,981 | 115,936 | 129,331 | 135,497 | |||||||||||||
| Commitments and Contingencies | Commitments and Contingencies | Commitments and Contingencies | |||||||||||||||
Redeemable Convertible Preferred Shares (at liquidation value): | Redeemable Convertible Preferred Shares (at liquidation value): | Redeemable Convertible Preferred Shares (at liquidation value): | |||||||||||||||
| Series A, 8,635,000 shares issued and outstanding at December 31, 2005 | — | 34,540 | Series A, 8,635,000 shares issued and outstanding at December 31, 2005 | — | 34,540 | 34,540 | — | ||||||||||
| Series B, 1,250,000 shares issued and outstanding at December 31, 2005 | — | 5,000 | Series B, 1,250,000 shares issued and outstanding at December 31, 2005 | — | 5,000 | 5,000 | — | ||||||||||
Shareholders'/Members' Equity: | Shareholders'/Members' Equity: | Shareholders'/Members' Equity: | |||||||||||||||
| Contributed capital | 1,766 | 1,766 | Contributed capital | 1,766 | 1,766 | 2,355 | — | ||||||||||
| Accumulated comprehensive income | — | 104 | Common stock, par value $0.001, 100,000,000 shares authorized, no shares issued and outstanding; 13,945,933 issued and outstanding pro forma | — | — | — | 14 | ||||||||||
| Retained/undistributed earnings | 10,356 | 16,201 | Additional paid in capital | — | — | — | 40,874 | ||||||||||
| Accumulated comprehensive income | — | 104 | 474 | 299 | |||||||||||||
| 12,122 | 18,071 | Retained/undistributed earnings | 7,899 | 13,744 | 19,059 | 13,068 | |||||||||||
| Less: Treasury Shares | (7 | ) | (1,007 | ) | |||||||||||||
| Notes receivable for issuance of common stock | (165 | ) | — | 9,665 | 15,614 | 21,888 | 54,255 | ||||||||||
| Less: Treasury Shares | (7 | ) | (1,007 | ) | (1,007 | ) | — | ||||||||||
| Total shareholders'/members' equity | 11,950 | 17,064 | Notes receivable for issuance of common stock | (165 | ) | — | — | — | |||||||||
| Total Liabilities and Shareholders'/Members' Equity | $67,931 | $172,540 | Total shareholders'/members' equity | 9,493 | 14,607 | 20,881 | 54,255 | ||||||||||
| Total Liabilities and Shareholders'/Members' Equity | $65,474 | $170,083 | $189,752 | $189,752 | |||||||||||||
See accompanying notes to consolidated financial statements.
ALLEGIANT TRAVEL COMPANY, LLC
CONSOLIDATED STATEMENTS OF OPERATIONSFOR THE YEARS ENDED DECEMBER 31, 2003, 2004 AND 2005
(In thousands, except per share amounts)
| | | Year Ended December 31, | Nine Months Ended September 30, | |||||||||||||||||||
|---|---|---|---|---|---|---|---|---|---|---|---|---|---|---|---|---|---|---|---|---|---|---|
| | | 2003 | 2004 | 2005 | 2005 | 2006 | ||||||||||||||||
| | | 2003 | 2004 | 2005 | | | | | (unaudited) | |||||||||||||
| OPERATING REVENUE: | OPERATING REVENUE: | OPERATING REVENUE: | ||||||||||||||||||||
| Scheduled service revenues | $22,515 | $46,236 | $90,664 | Scheduled service revenues | $22,515 | $46,236 | $90,664 | $61,003 | $131,729 | |||||||||||||
| Fixed fee contract revenues | 26,569 | 40,987 | 30,642 | Fixed fee contract revenues | 26,569 | 40,987 | 30,642 | 24,774 | 27,246 | |||||||||||||
| Ancillary revenues | 886 | 3,142 | 11,194 | Ancillary revenues | 886 | 3,142 | 11,194 | 6,669 | 21,239 | |||||||||||||
| Total operating revenue | 49,970 | 90,365 | 132,500 | Total operating revenue | 49,970 | 90,365 | 132,500 | 92,446 | 180,214 | |||||||||||||
| OPERATING EXPENSES: | OPERATING EXPENSES: | OPERATING EXPENSES: | ||||||||||||||||||||
| Aircraft fuel | 11,755 | 27,914 | 52,568 | Aircraft fuel | 11,755 | 27,914 | 52,568 | 34,599 | 77,661 | |||||||||||||
| Salary and benefits | 8,176 | 15,379 | 21,718 | Salary and benefits | 8,176 | 15,379 | 21,718 | 15,293 | 24,845 | |||||||||||||
| Station operations | 8,042 | 13,608 | 14,090 | Station operations | 8,042 | 13,608 | 14,090 | 10,262 | 18,730 | |||||||||||||
| Maintenance and repairs | 5,140 | 8,220 | 9,022 | Maintenance and repairs | 6,136 | 9,367 | 9,022 | 7,054 | 14,234 | |||||||||||||
| Sales and marketing | 2,385 | 3,548 | 5,625 | Sales and marketing | 2,385 | 3,548 | 5,625 | 3,923 | 6,955 | |||||||||||||
| Aircraft lease rentals | 3,137 | 3,847 | 4,987 | Aircraft lease rentals | 3,137 | 3,847 | 4,987 | 3,386 | 4,277 | |||||||||||||
| Depreciation and amortization | 1,181 | 2,183 | 5,088 | Depreciation and amortization | 1,181 | 2,183 | 5,088 | 3,578 | 7,599 | |||||||||||||
| Other | 6,258 | 8,441 | 10,901 | Other | 6,258 | 8,441 | 10,901 | 7,872 | 10,730 | |||||||||||||
| Total operating expense | 46,074 | 83,140 | 123,999 | Total operating expense | 47,070 | 84,287 | 123,999 | 85,967 | 165,031 | |||||||||||||
OPERATING INCOME | OPERATING INCOME | 3,896 | 7,225 | 8,501 | OPERATING INCOME | 2,900 | 6,078 | 8,501 | 6,479 | 15,183 | ||||||||||||
OTHER (INCOME) EXPENSE: | OTHER (INCOME) EXPENSE: | OTHER (INCOME) EXPENSE: | ||||||||||||||||||||
| Gain on fuel derivatives, net | (314 | ) | (4,438 | ) | (612 | ) | (Gain)/loss on fuel derivatives, net | (314 | ) | (4,438 | ) | (612 | ) | (2,575 | ) | 2,927 | ||||||
| Other (income) expense, net | (913 | ) | — | — | Other (income) expense, net | (913 | ) | — | — | — | — | |||||||||||
| Interest income | (9 | ) | (30 | ) | (1,225 | ) | Interest income | (9 | ) | (30 | ) | (1,225 | ) | (647 | ) | (2,043 | ) | |||||
| Interest expense | 831 | 1,399 | 3,009 | Interest expense | 831 | 1,399 | 3,009 | 1,968 | 3,970 | |||||||||||||
| Total other (income) expense | (405 | ) | (3,069 | ) | 1,172 | Total other (income) expense | (405 | ) | (3,069 | ) | 1,172 | (1,254 | ) | 4,854 | ||||||||
INCOME BEFORE INCOME TAXES | INCOME BEFORE INCOME TAXES | 4,301 | 10,294 | 7,329 | INCOME BEFORE INCOME TAXES | 3,305 | 9,147 | 7,329 | 7,733 | 10,329 | ||||||||||||
PROVISION FOR STATE INCOME TAXES | PROVISION FOR STATE INCOME TAXES | 1 | 12 | 37 | PROVISION FOR STATE INCOME TAXES | 1 | 12 | 37 | 37 | 43 | ||||||||||||
| NET INCOME | NET INCOME | $4,300 | $10,282 | $7,292 | NET INCOME | $3,304 | $9,135 | $7,292 | $7,696 | $10,286 | ||||||||||||
| Earnings Per Share: | Earnings Per Share: | Earnings Per Share: | ||||||||||||||||||||
| Basic | $0.64 | $1.53 | $1.11 | Basic | $0.49 | $1.36 | $1.11 | $1.17 | $1.60 | |||||||||||||
| Diluted | $0.64 | $1.53 | $0.56 | Diluted | $0.49 | $1.36 | $0.56 | $0.64 | $0.62 | |||||||||||||
| Unaudited pro forma earnings per share—see Note 1: | Unaudited pro forma earnings per share—see Note 1: | |||||||||||||||||||||
| Basic | $0.40 | $0.47 | ||||||||||||||||||||
| Diluted | $0.40 | $0.45 | ||||||||||||||||||||
| Unaudited pro forma income tax provision | $2,693 | $3,791 | ||||||||||||||||||||
See accompanying notes to consolidated financial statements.
ALLEGIANT TRAVEL COMPANY, LLC
CONSOLIDATED STATEMENTS OF SHAREHOLDERS'/MEMBERS' EQUITY
(DEFICIT) AND COMPREHENSIVE INCOME
(In thousands)
| | | | | | | | | | Notes Receivable for Issuance of Common Stock | | | | | | | | | | Notes Receivable for Issuance of Common Stock | | ||||||||||||||||||||
|---|---|---|---|---|---|---|---|---|---|---|---|---|---|---|---|---|---|---|---|---|---|---|---|---|---|---|---|---|---|---|---|---|---|---|---|---|---|---|---|---|
| | | Common Stock | | | | | | | Common Stock | | | | | | ||||||||||||||||||||||||||
| | | | Accumulated Other Comprehensive Income | | | Notes Receivable for Issuance of Common Stock | | | Accumulated Other Comprehensive Income | | | Notes Receivable for Issuance of Common Stock | ||||||||||||||||||||||||||||
| | | Shares | Par Value | APIC | Members' Contributed Capital | Retained/ Undistributed Earnings (Deficit) | Less: Treasury Shares | | Shares | Par Value | APIC | Members' Contributed Capital | Retained/ Undistributed Earnings (Deficit) | Less: Treasury Shares | ||||||||||||||||||||||||||
| Balance at December 31, 2002 | Balance at December 31, 2002 | 5,000 | $— | td,591 | $— | $— | ($4,226 | ) | $— | $— | Balance at December 31, 2002 | 5,000 | $— | td,591 | $— | $— | ($4,540 | ) | $— | $— | ||||||||||||||||||||
| Redemption of common stock, no par value, for common stock, $.001 par value | Redemption of common stock, no par value, for common stock, $.001 par value | — | 5 | (5 | ) | — | — | — | — | — | Redemption of common stock, no par value, for common stock, $.001 par value | — | 5 | (5 | ) | — | — | — | — | — | ||||||||||||||||||||
| Common stock issued for notes receivable | Common stock issued for notes receivable | 1,750 | 2 | 173 | — | — | — | — | (175 | — | Common stock issued for notes receivable | 1,750 | 2 | 173 | — | — | — | — | (175 | — | ||||||||||||||||||||
| Net Income | Net Income | — | — | — | — | — | 4,300 | — | — | 4,300 | Net Income | — | — | — | — | — | 3,304 | — | — | 3,304 | ||||||||||||||||||||
| Balance at December 31, 2003 | Balance at December 31, 2003 | 6,750 | 7 | 1,759 | — | — | 74 | — | (175 | ) | 1,665 | Balance at December 31, 2003 | 6,750 | 7 | 1,759 | — | — | (1,236 | ) | — | (175 | ) | 355 | |||||||||||||||||
| Merger of Allegiant Air, Inc. into Allegiant Air, LLC | Merger of Allegiant Air, Inc. into Allegiant Air, LLC | — | (7 | ) | (1,759 | ) | 1,766 | — | — | — | — | — | Merger of Allegiant Air, Inc. into Allegiant Air, LLC | — | (7 | ) | (1,759 | ) | 1,766 | — | — | — | — | — | ||||||||||||||||
| Purchase of members' capital, at cost | Purchase of members' capital, at cost | (67 | ) | — | — | — | — | — | (7 | ) | 10 | 3 | Purchase of members' capital, at cost | (67 | ) | — | — | — | — | — | (7 | ) | 10 | 3 | ||||||||||||||||
| Net Income | Net Income | — | — | — | — | — | 10,282 | — | — | 10,282 | Net Income | — | — | — | — | — | 9,135 | — | — | 9,135 | ||||||||||||||||||||
| Balance at December 31, 2004 | Balance at December 31, 2004 | 6,683 | — | — | 1,766 | — | 10,356 | (7 | ) | (165 | ) | 11,950 | Balance at December 31, 2004 | 6,683 | — | — | 1,766 | — | 7,899 | (7 | ) | (165 | ) | 9,493 | ||||||||||||||||
| Payments received on notes receivable for issuance of common shares | Payments received on notes receivable for issuance of common shares | — | — | — | — | — | — | — | 165 | 165 | Payments received on notes receivable for issuance of common shares | — | — | — | — | — | — | — | 165 | 165 | ||||||||||||||||||||
| Distributions to members | Distributions to members | — | — | — | — | — | (1,447 | ) | — | — | (1,447 | ) | Distributions to members | — | — | — | — | — | (1,447 | ) | — | — | (1,447 | ) | ||||||||||||||||
| Membership shares redeemed for cash | Membership shares redeemed for cash | (250 | ) | — | — | — | — | — | (1,000 | ) | — | (1,000 | ) | Membership shares redeemed for cash | (250 | ) | — | — | — | — | — | (1,000 | ) | — | (1,000 | ) | ||||||||||||||
| Comprehensive income: | Comprehensive income: | Comprehensive income: | ||||||||||||||||||||||||||||||||||||||
| Unrealized gain on short-term investments | — | — | — | — | 104 | — | — | — | 104 | Unrealized gain on short-term investments | — | — | — | — | 104 | — | — | — | 104 | |||||||||||||||||||||
| Net Income | — | — | — | — | — | 7,292 | — | — | 7,292 | Net Income | — | — | — | — | — | 7,292 | — | — | 7,292 | |||||||||||||||||||||
| Total comprehensive income | 7,396 | Total comprehensive income | 7,396 | |||||||||||||||||||||||||||||||||||||
| Balance at December 31, 2005 | Balance at December 31, 2005 | 6,433 | $— | $— | $1,766 | $104 | $16,201 | ($1,007 | ) | $— | $17,064 | Balance at December 31, 2005 | 6,433 | — | — | 1,766 | 104 | 13,744 | (1,007 | ) | — | 14,607 | ||||||||||||||||||
| Adjustment to value of warrants (unaudited) | Adjustment to value of warrants (unaudited) | — | — | — | 329 | — | — | — | — | 329 | ||||||||||||||||||||||||||||||
| Stock compensation expense (unaudited) | Stock compensation expense (unaudited) | — | — | — | 260 | — | — | — | — | 260 | ||||||||||||||||||||||||||||||
| Distributions to members (unaudited) | Distributions to members (unaudited) | — | — | — | — | — | (4,971 | ) | — | — | (4,971 | ) | ||||||||||||||||||||||||||||
| Comprehensive income: | Comprehensive income: | |||||||||||||||||||||||||||||||||||||||
| Unrealized gain on short-term investments (unaudited) | — | — | — | — | 370 | — | — | — | 370 | |||||||||||||||||||||||||||||||
| Net Income (unaudited) | — | — | — | — | — | 10,286 | — | — | 10,286 | |||||||||||||||||||||||||||||||
| Total comprehensive income (unaudited) | 10,656 | |||||||||||||||||||||||||||||||||||||||
| Balance at September 30, 2006 (unaudited) | Balance at September 30, 2006 (unaudited) | 6,433 | $— | $— | $2,355 | $474 | $19,059 | ($1,007 | ) | $— | $20,881 | |||||||||||||||||||||||||||||
See accompanying notes to consolidated financial statements.
ALLEGIANT TRAVEL COMPANY, LLC
CONSOLIDATED STATEMENTS OF CASH FLOWSFOR THE YEARS ENDED DECEMBER 31, 2003, 2004 AND 2005
(In thousands)
| | | Year Ended December 31, | Nine Months Ended September 30, | |||||||||||||||||||||||
|---|---|---|---|---|---|---|---|---|---|---|---|---|---|---|---|---|---|---|---|---|---|---|---|---|---|---|
| | | 2003 | 2004 | 2005 | 2005 | 2006 | ||||||||||||||||||||
| | | 2003 | 2004 | 2005 | | | | | (unaudited) | |||||||||||||||||
| OPERATING ACTIVITIES: | OPERATING ACTIVITIES: | OPERATING ACTIVITIES: | ||||||||||||||||||||||||
| Net income | $3,304 | $9,135 | $7,292 | $7,696 | $10,286 | |||||||||||||||||||||
Adjustments to reconcile net income to net cash provided by operating activities: | ||||||||||||||||||||||||||
| Depreciation and amortization | 1,181 | 2,183 | 5,088 | 3,578 | 7,599 | |||||||||||||||||||||
| Net income | $4,300 | $10,282 | $7,292 | (Gain)/loss on aircraft and other equipment disposals | — | 21 | 89 | (82 | ) | 2 | ||||||||||||||||
Adjustments to reconcile net income to net cash provided by operating activities: | Provision for obsolescence of expendable parts, supplies and fuel | 35 | — | 10 | — | 111 | ||||||||||||||||||||
| Depreciation and amortization | 1,181 | 2,183 | 5,088 | Deferred issuance cost amortization | — | — | — | — | 381 | |||||||||||||||||
| Loss on aircraft and other equipment disposals | — | 21 | 89 | Warrant amortization | — | — | — | — | 93 | |||||||||||||||||
| Provision for obsolescence of expendable parts, supplies and fuel | 35 | — | 10 | Stock compensation expense | — | — | — | — | 260 | |||||||||||||||||
| Changes in certain assets and liabilities: | Changes in certain assets and liabilities: | |||||||||||||||||||||||||
| Restricted cash | (5,757 | ) | (4,498 | ) | 7,428 | Restricted cash | (5,757 | ) | (4,498 | ) | 7,428 | 7,860 | (3,228 | ) | ||||||||||||
| Accounts receivable | (312 | ) | (1,245 | ) | (4,004 | ) | Accounts receivable | (312 | ) | (1,245 | ) | (4,004 | ) | (2,076 | ) | 828 | ||||||||||
| Expendable parts, supplies and fuel | (188 | ) | (1,244 | ) | 150 | Expendable parts, supplies and fuel | (188 | ) | (1,244 | ) | 150 | (288 | ) | (1,365 | ) | |||||||||||
| Prepaid expenses | (3,001 | ) | (3,022 | ) | (4,801 | ) | Prepaid expenses | (2,005 | ) | (1,876 | ) | (4,801 | ) | (692 | ) | 808 | ||||||||||
| Other current assets | (502 | ) | (2,631 | ) | 575 | Other current assets | (502 | ) | (2,631 | ) | 575 | (1,220 | ) | (2,397 | ) | |||||||||||
| Accounts payable | 2,490 | 1,690 | 8,957 | Accounts payable | 2,490 | 1,690 | 8,957 | 1,658 | 663 | |||||||||||||||||
| Accrued liabilities | 78 | 1,351 | 2,112 | Accrued liabilities | 78 | 1,352 | 2,112 | 1,507 | 2,637 | |||||||||||||||||
| Air traffic liability | 5,848 | 7,497 | 21,231 | Air traffic liability | 5,848 | 7,497 | 21,231 | 17,166 | 7,378 | |||||||||||||||||
| Refundable deposits | — | 100 | (100 | ) | Refundable deposits | — | 100 | (100 | ) | (100 | ) | 250 | ||||||||||||||
| Net cash provided by operating activities | 4,172 | 10,484 | 44,027 | Net cash provided by operating activities | 4,172 | 10,484 | 44,027 | 35,007 | 24,306 | |||||||||||||||||
| INVESTING ACTIVITIES: | INVESTING ACTIVITIES: | INVESTING ACTIVITIES: | ||||||||||||||||||||||||
| Purchase of investments available-for-sale | — | — | (31,962 | ) | Purchase of short-term investments | — | — | (41,062 | ) | (37,587 | ) | (35,829 | ) | |||||||||||||
| Purchase of property and equipment | (7,496 | ) | (9,384 | ) | (15,060 | ) | Maturities of short-term investments | — | — | 9,100 | — | 35,140 | ||||||||||||||
| Proceeds from sale of property and equipment | — | — | 1,582 | Purchase of property and equipment | (7,496 | ) | (9,384 | ) | (15,060 | ) | (3,950 | ) | (20,083 | ) | ||||||||||||
| (Increase) decrease in lease and equipment deposits | 116 | (291 | ) | (2,266 | ) | Proceeds from sale of property and equipment | — | — | 1,582 | 1,582 | — | |||||||||||||||
| (Increase) decrease in lease and equipment deposits | 116 | (291 | ) | (2,266 | ) | (1,723 | ) | 170 | ||||||||||||||||||
| Net cash used by investing activities | (7,380 | ) | (9,675 | ) | (47,706 | ) | ||||||||||||||||||||
| Net cash used by investing activities | (7,380 | ) | (9,675 | ) | (47,706 | ) | (41,678 | ) | (20,602 | ) | ||||||||||||||||
| FINANCING ACTIVITIES: | FINANCING ACTIVITIES: | FINANCING ACTIVITIES: | ||||||||||||||||||||||||
| Repurchase of membership units | — | (7 | ) | (1,000 | ) | Repurchase of membership units | — | (7 | ) | (1,000 | ) | (1,000 | ) | — | ||||||||||||
| Distributions to members | — | — | (1,447 | ) | Distributions to members | — | — | (1,447 | ) | (1,447 | ) | (4,971 | ) | |||||||||||||
| Proceeds from issuance of Series A redeemable convertible preferred shares | — | — | 34,540 | Proceeds from issuance of Series A redeemable convertible preferred shares | — | — | 34,540 | 34,540 | — | |||||||||||||||||
| Deferred issuance costs—redeemable convertible preferred shares | — | — | (1,360 | ) | Deferred issuance costs—redeemable convertible preferred shares | — | — | (1,360 | ) | (1,344 | ) | — | ||||||||||||||
| Proceeds from issuance of notes payable | 3,697 | 2,987 | — | Proceeds from issuance of notes payable | 3,697 | 2,987 | — | — | — | |||||||||||||||||
| Proceeds from related party borrowings | 1,250 | 2,100 | — | Proceeds from related party borrowings | 1,250 | 2,100 | — | — | — | |||||||||||||||||
| Principal payments on notes payable | (1,250 | ) | (2,661 | ) | (5,568 | ) | Principal payments on notes payable | (1,250 | ) | (2,661 | ) | (5,568 | ) | (4,158 | ) | (5,060 | ) | |||||||||
| Principal payments on related party notes payable | (300 | ) | (1,939 | ) | (1,796 | ) | Principal payments on related party notes payable | (300 | ) | (1,939 | ) | (1,796 | ) | (1,491 | ) | (845 | ) | |||||||||
| Principal payments on capital lease obligations | (17 | ) | — | — | Principal payments on capital lease obligations | (17 | ) | — | — | — | (2,232 | ) | ||||||||||||||
| Net cash provided by financing activities | 3,380 | 480 | 23,369 | Net cash provided (used) by financing activities | 3,380 | 480 | 23,369 | 25,100 | (13,108 | ) | ||||||||||||||||
| Net change in cash and cash equivalents | Net change in cash and cash equivalents | 172 | 1,289 | 19,690 | Net change in cash and cash equivalents | 172 | 1,289 | 19,690 | 18,429 | (9,404 | ) | |||||||||||||||
| CASH AND CASH EQUIVALENTS AT BEGINNING OF PERIOD | CASH AND CASH EQUIVALENTS AT BEGINNING OF PERIOD | 108 | 280 | 1,569 | CASH AND CASH EQUIVALENTS AT BEGINNING OF PERIOD | 108 | 280 | 1,569 | 1,569 | 21,259 | ||||||||||||||||
| CASH AND CASH EQUIVALENTS AT END OF PERIOD | CASH AND CASH EQUIVALENTS AT END OF PERIOD | $280 | $1,569 | $21,259 | CASH AND CASH EQUIVALENTS AT END OF PERIOD | $280 | $1,569 | $21,259 | $19,998 | $11,855 | ||||||||||||||||
| SUPPLEMENTAL DISCLOSURES OF CASH FLOW INFORMATION: | ||||||||||||||||||||||||||
| Cash Transactions: | ||||||||||||||||||||||||||
| Interest paid, net of capitalized interest | $532 | $1,911 | $3,450 | |||||||||||||||||||||||
| State income taxes paid | $1 | $12 | $37 | |||||||||||||||||||||||
| Non-Cash Transactions: | ||||||||||||||||||||||||||
| Stock issued for notes receivable | $175 | $— | $— | |||||||||||||||||||||||
| Notes payable issued for aircraft and equipment | $11,600 | $12,525 | $11,638 | |||||||||||||||||||||||
| Acquisition of aircraft under capital lease | $— | $— | $28,530 | |||||||||||||||||||||||
| Exchange of note payable from related party for Series B redeemable convertible preferred shares | $— | $— | $5,000 | |||||||||||||||||||||||
| Warrants issued to placement agent | $— | $— | $57 | |||||||||||||||||||||||
| SUPPLEMENTAL DISCLOSURES OF CASH FLOW INFORMATION: | |||||||||||||||
| Cash Transactions: | |||||||||||||||
| Interest paid, net of capitalized interest | $532 | $1,911 | $3,450 | $1,999 | $3,022 | ||||||||||
| State income taxes paid | $1 | $12 | $37 | $37 | $42 | ||||||||||
| Non-Cash Transactions: | |||||||||||||||
| Stock issued for notes receivable | $175 | $— | $— | $— | $— | ||||||||||
| Notes payable issued for aircraft and equipment | $11,600 | $12,525 | $11,638 | $6,006 | $10,602 | ||||||||||
| Acquisition of aircraft under capital lease | $— | $— | $28,530 | $— | $— | ||||||||||
| Exchange of note payable from related party for Series B redeemable convertible preferred shares | $— | $— | $5,000 | $5,000 | $— | ||||||||||
| Warrants issued to placement agent | $— | $— | $329 | $329 | $— | ||||||||||
See accompanying notes to consolidated financial statements.
ALLEGIANT TRAVEL COMPANY, LLC
NOTES TO CONSOLIDATED FINANCIAL STATEMENTS
For the years ended December 31, 2003, 2004 and 2005 and the (unaudited)
nine months ended September 30, 2005 and 2006
(Dollars in thousands except share and per share amounts)
The unaudited consolidated financial statements of Allegiant Travel Company LLC (the "Company") as of September 30, 2006 and for the nine months ended September 30, 2005 and 2006 included herein have been prepared, without audit, pursuant to the rules and regulations of the Securities and Exchange Commission. Certain information and disclosures normally included in the consolidated financial statements prepared in accordance with accounting principles generally accepted in the United States of America have been condensed or omitted pursuant to such rules and regulations, although the Company believes that the following disclosures are adequate to make the information presented not misleading. These unaudited consolidated financial statements reflect all adjustments that in the opinion of management, are necessary to present fairly the results of operations for the interim periods presented. All adjustments are of a normal recurring nature, unless otherwise disclosed. The results of operations for the nine months ended September 30, 2006 are not necessarily indicative of the results that may be expected for the year ending December 31, 2006.
1. Summary of Significant Accounting Policies
Organization and Basis of Presentation
Allegiant Travel Company, LLC is a leisure travel company providing scheduled passenger service from small cities to the world-class leisure destinations of Las Vegas, Nevada and Orlando, Florida. The Company sells air travel on a stand alone basis or bundled with hotel rooms, rental cars and other travel related services. The Company also provides charter service under long-term contracts as well as on a seasonal and ad-hoc basis. TheBecause the Company does not separately track expenses for scheduled and chartered air service and these revenue sources have similar operating margins, economic characteristics, "production processes" involving check-in, baggage handling, flight services which target the same class of customers and are subject to the same regulatory environment, the Company believes it operates in one reportable segment.
As of December 31, 2005, the Company had a fleet of 22 MD80 series aircraft, of which 17 were in revenue service, and served thirty-one scheduled service cities. As of September 30, 2006, the Company had a fleet of 25 MD80 series aircraft, of which 21 were in revenue service, and served 41 scheduled service cities. The Company markets scheduled service products through direct advertising while charter services are sold directly or via brokers.
Allegiant Air, Inc. (the "Predecessor") was formed in 1997 under a different business strategy with a different management team. The Predecessor filed for bankruptcy court protection in December 2000. A plan of reorganization was confirmed by the bankruptcy court in June 2001, and involved the injection of additional captial, a new business strategy and a new executive team to manage the Predecessor.
On May 3, 2004, Allegiant Air, Inc., a California corporation, merged into Allegiant Air, LLC, a newly formed Nevada limited liability company. The purpose of the transaction was to change the form of the business from a corporation to a limited liability company and to change the state of incorporation to Nevada. By virtue of the merger, all of the operations, assets and liabilities of Allegiant Air, Inc. were transferred to Allegiant Air, LLC. The merger was accounted for as a transfer of assets and liabilities among entities under common control and accordingly was recorded at historical cost. The management and ownership did not change as a result of this merger.
On May 4, 2005, Allegiant Travel Company, LLC and Allegiant Vacations, LLC were formed as Nevada limited liability companies. Allegiant Travel Company, LLC was designated to serve as the holding company for Allegiant Air, LLC and Allegiant Vacations, LLC. To effectuate this, all outstanding shares of Allegiant Air, LLC were exchanged for shares of Allegiant Travel Company, LLC and thereafter Allegiant Air, LLC and Allegiant Vacations, LLC became wholly owned subsidiaries of Allegiant Travel Company, LLC (hereafter collectively referred to as "Allegiant" or the "Company").
Principles of Consolidation
The accompanying consolidated financial statements have been prepared in accordance with accounting principles generally accepted in the United States and include the accounts of Allegiant Travel Company, LLC and its wholly owned operating subsidiaries Allegiant Air, LLC, and Allegiant Vacations, LLC. All intercompany accounts and transactions between and among the consolidated entities have been eliminated in consolidation.
Use of Estimates
The preparation of financial statements in conformity with accounting principles generally accepted in the United States (GAAP) requires management to make estimates and assumptions that affect the
amounts reported in the financial statements and accompanying notes. Due to the prospective nature of these estimates, actual results could differ from those estimates.
Cash and Cash Equivalents and Restricted Cash
Cash and cash equivalents include investments and interest bearing instruments with maturities of three months or less at the date of acquisition. Such investments are carried at cost which approximates market value. Restricted cash represents amounts escrowed relating to air traffic liability, as required by fixed fee contract customers, and letters of credit required by hotel properties for guaranteed room availability.
Short-term Investments
The Company's investments in marketable debt and equity securities are classified as available for sale and are reported at fair market value with the net unrealized gain or (loss) reported as a
component of accumulated comprehensive income in shareholders'/members' equity. Short-term investments as of December 31, 2005 consisted of the following:
| | As of December 31, 2005 | As of September 30, 2006 | ||||||||||||||||||
|---|---|---|---|---|---|---|---|---|---|---|---|---|---|---|---|---|---|---|---|---|
| | | Gross Unrealized | | | Gross Unrealized | | ||||||||||||||
| | | Market Value | | Market Value | ||||||||||||||||
| | 2005 | Cost | Gains | Losses | Cost | Gains | Losses | |||||||||||||
| | Cost | Market Value | | | | | (unaudited) | |||||||||||||
| Commercial paper | $6,475 | $6,650 | $6,476 | $175 | $— | $6,650 | $3,445 | $470 | $— | $3,915 | ||||||||||
| Corporate bonds | 12,476 | 12,358 | 12,476 | — | (119 | ) | 12,358 | 8,928 | 30 | (132 | ) | 8,826 | ||||||||
| Government securities | 13,011 | 13,058 | 13,012 | 116 | (70 | ) | 13,058 | 20,278 | 220 | (114 | ) | 20,385 | ||||||||
| 31,962 | 32,066 | |||||||||||||||||||
| Unrealized gain | 104 | — | ||||||||||||||||||
| Total | $32,066 | $32,066 | $31,964 | $291 | $(189 | ) | $32,066 | $32,651 | $720 | $(246 | ) | $33,125 | ||||||||
For the years ended December 31, 2003, 2004 and 2005, proceeds from maturities of short-term investments totaled $0, $0 and $9,100, respectively. For the nine months ended September 30, 2006, proceeds from maturities of short-term investments totaled $35,140.
The cost of marketable securities sold is determined by the specific identification method with any realized gains or losses reflected in income. There were no realized gains or losses for the periods presented as the Company held all short-term investments to maturity.
Short-term investments had the following maturities as of December 31, 2005:
| Maturities | Maturities | Amount | Maturities | Amount | ||||
|---|---|---|---|---|---|---|---|---|
| Year 2006 | Year 2006 | $ | 25,172 | Year 2006 | $ | 25,172 | ||
| Year 2007 through 2010 | — | |||||||
| Years 2007 through 2010 | Years 2007 through 2010 | — | ||||||
| Years 2011 through 2015 | Years 2011 through 2015 | 1,997 | Years 2011 through 2015 | 1,997 | ||||
| Thereafter | Thereafter | 4,897 | Thereafter | 4,897 | ||||
| Total | $ | 32,066 | Total | $ | 32,066 | |||
Short-term investments had the following maturities as of September 30, 2006:
| Maturities | Amount | |||
|---|---|---|---|---|
| | (unaudited) | |||
| Year 2006 | $ | 22,739 | ||
| Years 2007 through 2010 | 3,484 | |||
| Years 2011 through 2015 | 4,002 | |||
| Thereafter | 2,900 | |||
| Total | $ | 33,125 | ||
The Company has classified investments as short-term since it maintains a liquid portfolio of investments that are available for current operations.
Expendable Parts, Supplies and Fuel
Expendable parts, supplies and fuel inventories are valued at cost using the first-in, first-out method. An allowance for obsolescence has been recorded based upon historical results and
management's expectations of future operations. Such inventories are charged to expense as they are used in operations.
Property and Equipment
Property and equipment are recorded at cost and depreciated using the straight-line method to their estimated residual values over their estimated useful lives as follows:
| Aircraft | 10 years | |
| Flight equipment | 5-7 years | |
| Equipment and leasehold improvements | 5-7 years |
Aircraft and jet engines have an estimated average residual value of 18% of original cost; other categories of property and equipment are assumed to have no residual value.
Aircraft under capital lease arrangements are depreciated over the shorter of the useful life of the aircraft or remaining lease term.
Capitalized Interest
Interest attributable to funds used to finance the refurbishment of aircraft prior to revenue service is capitalized as an additional cost of the related asset provided the refurbishment is extensive or requires an extended period of time to complete, generally longer than 90 days. Interest is capitalized at the Company's average interest rate on long-term debt. Capitalization of interest ceases when the asset is ready for service. For the years ended December 31, 2003, 2004 and 2005 the Company incurred interest expense of $831, $1,399 and $3,009, respectively, net of capitalized interest of $59 in 2005. For the nine months ended September 30, 2006, the Company incurred interest expense of $3,970 (unaudited), net of capitalized interest of $31 (unaudited).
Measurement of Impairment of Long-Lived Assets
The Company records impairment losses on long-lived assets used in operations, consisting principally of property and equipment, when events or changes in circumstances indicate, in management's judgment, that the assets might be impaired and the undiscounted cash flows estimated to be generated by those assets are less than the carrying amount of those assets. Cash flow estimates are based on historical results adjusted to reflect the Company's best estimate of future market and operating conditions. The net carrying value of assets not recoverable is reduced to fair value if lower than carrying value. Estimates of fair value represent the Company's best estimate based on industry trends and reference to market rates and transactions and are subject to change.
Revenue Recognition
Scheduled service revenues consist of passenger revenue involving limited frequency non-stopnonstop flights between Las Vegas, Nevada and Orlando, Florida and 2939 small cities as of September 30, 2006 and is recognized when the travel-related service or transportation is provided or when the ticket expires unused. Nonrefundable tickets expire on the date of the intended flight, unless the date is extended by notification from the
customer in advance of the intended flight. Tickets sold, but not yet used, as well as unexpired credits, are included in air traffic liability.
Fixed fee contract revenues consists largely of long term agreements to provide charter service on a seasonal and ad hoc basis to affiliates of Harrah's Entertainment Inc., Apple Vacations West, Inc. and others. Fixed fee contract revenues are recognized when the transportation is provided. Under certain of our fixed fee contracts, if fuel exceeds a predetermined cost per gallon, reimbursements are received from the customer and netted against fuel expense.
Ancillary revenues are generated from the sale of hotel rooms and rental cars, advance seat assignments, in-flight products and other items. InRevenues from the sale of hotel rooms and rental cars are recognized at the time the room is occupied or rental car utilized. The amount of revenues attributed to each element of a bundled sale involving hotel rooms and rental cars in addition to airfare is determined in accordance with the Emerging IssueIssues Task Force ("EITF") No. 99-19:00-21,Reporting Revenue Gross As A Principal Versus Net As An AgentArrangements with Multiple Deliverables, the. The sale of hotel rooms, rental cars and other ancillary products are recorded net of amounts paid to wholesale providers, travel agent commissions and credit card processing fees.fees in accordance with EITF No. 99-19,Reporting Revenue Gross As A Principal Versus Net As An Agent.
Concentration of Credit Risk
Services provided to affiliates of Harrah's Entertainment Inc. and Apple Vacations West, Inc. separately exceeded 10% of the Company's consolidated revenue for the years ended December 31, 2003 and 2004. In addition, services provided to affiliates of Harrah's Entertainment Inc. exceeded 10% of the Company's consolidated revenue for the year ended December 31, 2005. For the years ended December 31, 2003, 2004 and 2005, the Company's contract relationships with these third parties accounted for 48%, 43%, and 19% of total revenues, respectively. For the nine months ended September 30, 2006, the Company's contract relationships with these third parties accounted for 13% (unaudited) of total revenues.
Financial Instruments
The Company accounts for financial instruments under Statement of Financial Accounting Standards Board ("SFAS") No. 133, —Accounting For Derivative Instruments and Hedging Activities, as amended. Such instruments consist principally of fuel derivative contracts as described in Note 8.
Maintenance and Repair Costs
Aircraft maintenance and repair costs. The Company accounts for maintenance activities under the direct expense method. Under this method, maintenance and repair costs for owned and leased aircraft, including major overhaul maintenance costs, are charged to operating expenses as incurred. Maintenance payments required underdeposits paid to aircraft lessors in advance of the performance of major maintenance activities are recorded as prepaid maintenance deposits, and then recognized as maintenance expense when the underlying maintenance is performed. These deposits are calculated based on a performance measure, such as flight hours or cycles, and are available for reimbursement to the Company upon the completion of the maintenance of the leased aircraft. If there are sufficient funds on deposit to reimburse the Company for the invoices initially paid by the Company for these maintenance events, they are reimbursed to the Company by the lessor. Under most of the Company's existing aircraft lease agreements, if the Company exercises the option to purchase the aircraft and there are excess prepaid balances at the exercise of the purchase option, any excess amounts are applied to the purchase price as an additional down payment. If at any point the Company determines it is not probable it will recover amounts retained by the lessor through future maintenance events, such amounts are expensed.
The maintenance deposits paid under the Company's lease agreements do not transfer either the obligation to maintain the aircraft or the cost risk associated with the maintenance activities to the aircraft lessor. In addition, the Company maintains the right to select any third-party maintenance provider. Therefore, the amounts paid as deposits are recorded on the balance sheet and then recognized as maintenance expense when the underlying maintenance is performed, in accordance with the Company's maintenance accounting policy. Maintenance deposits untiltotaled $3.2 million and $4.4 million as of December 31, 2005 and September 30, 2006, respectively. Any amounts that are not probable of being used to fund future maintenance expense, would be recognized as additional aircraft rental expense.
In determining whether it is probable maintenance deposits will be used to fund the cost of maintenance events, the Company conducts the following analysis:
The Company has determined it is probable that all but an immaterial amount of the maintenance event occurs.deposits would be used to pay the expected costs of maintenance events during the term of the aircraft leases.
The Company reviews this asset (the maintenance deposits) for potential impairment in the preparation of its financial statements. Because there have been no material changes to the estimated cost of expected maintenance events during the remaining term of the leases, no impairment charge was recognized for the years ended December 31, 2003, 2004 and 2005, or for the nine months ended September 30, 2005 and 2006 (unaudited).
Advertising Costs
Advertising costs are charged to expense in the period incurred. Advertising expense was $952, $1,096 and $1,893 for the years ended December 31, 2003, 2004 and 2005, respectively. Advertising expense for the nine months ended September 30, 2005 and 2006 was $1,215 (unaudited) and $2,549 (unaudited), respectively.
Earnings per Share
The following table sets forth the computation of net income per share, on a basic and diluted basis (in thousands, except share and per share data):
| | 2003 | 2004 | 2005 | ||||
|---|---|---|---|---|---|---|---|
| Numerator: | |||||||
| Net income | $4,300 | $10,282 | $7,292 | ||||
| Denominator: | |||||||
| Weighted-average shares outstanding | 6,750,000 | 6,722,055 | 6,557,306 | ||||
| Weighted average effect of dilutive securities: | |||||||
| Redeemable convertible preferred shares | — | — | 6,553,890 | ||||
| Employee stock options | — | — | — | ||||
| Stock purchase warrants | — | — | — | ||||
| Adjusted weighted-average shares outstanding, diluted | 6,750,000 | 6,722,055 | 13,111,196 | ||||
| Net income per share, basic | $0.64 | $1.53 | $1.11 | ||||
| Net income per share, diluted | $0.64 | $1.53 | $0.56 | ||||
Employee Year Ended December 31, Nine Months Ended
September 30, 2003 2004 2005(1) 2005(1) 2006 (unaudited) Numerator: Net income $3,304 $9,135 $7,292 $7,696 $10,286 Denominator: Weighted-average shares outstanding 6,750,000 6,722,055 6,557,306 6,598,168 6,433,333 Weighted average effect of dilutive securities: Redeemable convertible preferred shares — — 6,553,890 5,431,319 9,885,000 Employee stock options — — — — 274,301 Stock purchase warrants — — — — 110,726 Adjusted weighted-average shares outstanding, diluted 6,750,000 6,722,055 13,111,196 12,029,487 16,703,360 Net income per share, basic $0.49 $1.36 $1.11 $1.17 $1.60 Net income per share, diluted $0.49 $1.36 $0.56 $0.64 $0.62
Stock-Based Compensation
Effective January 1, 2006, the Company adopted the provisions of SFAS No. 123(R),Share-Based Payments, requiring the compensation cost relating to share-based payment transactions be recognized in the statement of operations. The cost is measured at the grant date, based on the calculated fair value of the award using the Black-Scholes option pricing model, and is recognized as an expense over the employee's requisite service period (the vesting period of the equity award). The Company appliesadopted SFAS 123(R) using the modified prospective method and accordingly, financial statement amounts for the prior periods have not been restated to reflect the fair value method of recognizing compensation cost relating to stock options issued in 2005.
Prior to January 1, 2006, the Company accounted for share-based compensation to employees in accordance with Accounting Principles Board ("APB") Opinion No. 25,Accounting for Stock Issued to Employees, and related interpretations in accounting for stock options. As such, compensation expense iswas recorded on the date of grant only if the current market price of the underlying stock exceedsexceeded the exercise price. No compensation cost has been recognized for stock option grants to employees in the accompanying consolidated financial statements for periods prior to January 1, 2006, as all options granted had an exercise price equal to or above the market value of the underlying common stock on the date of grant. Under SFAS No. 123,Accounting for Stock-Based Compensation and SFAS No. 148,Accounting for Stock-Based Compensation—Transition and Disclosure, an amendment of SFAS No. 123, entities are permitted to recognize as expense the fair value of all stock-based awards on the date of grant over the vesting period. Alternatively, SFAS No. 123, as amended, also allows entities to continue to apply the provisions of APB No. 25 and provide pro forma earnings (loss) and pro forma earnings (loss) per share disclosures for employee stock option grants as if the fair-value-based method defined in SFAS No. 123, as amended had been applied. The Company has elected to continue to apply the provisions of APB No. 25 and provide the pro forma disclosures required by SFAS No. 123, as amended. See Note 10 for information describing the Company's Share Option Program.
The pro forma effects on net income and net income per share for all outstanding and unvested stock options which are as follows:
| | Year Ended December 31, | Nine Months Ended September 30, | ||||||||||||||
|---|---|---|---|---|---|---|---|---|---|---|---|---|---|---|---|---|
| | 2003 | 2004 | 2005 | 2003 | 2004 | 2005 | 2005 | |||||||||
| (In thousands, except per share amounts) | ||||||||||||||||
| Net income as reported | $4,300 | $10,282 | $7,292 | $3,304 | $9,135 | $7,292 | $7,696 | |||||||||
| Stock option compensation expense determined under fair value method | — | — | (228 | ) | — | — | (228 | ) | (159 | ) | ||||||
| Pro forma | $4,300 | $10,282 | $7,064 | $3,304 | $9,135 | $7,064 | $7,537 | |||||||||
| Income per share—basic: | ||||||||||||||||
| As reported | $0.64 | $1.53 | $1.11 | $0.49 | $1.36 | $1.11 | $1.17 | |||||||||
| Pro forma | $0.64 | $1.53 | $1.08 | $0.49 | $1.36 | $1.08 | $1.14 | |||||||||
| Income per share—diluted: | ||||||||||||||||
| As reported | $0.64 | $1.53 | $0.56 | $0.49 | $1.36 | $0.56 | $0.64 | |||||||||
| Pro forma | $0.64 | $1.53 | $0.54 | $0.49 | $1.36 | $0.54 | $0.63 | |||||||||
For the nine months ended September 30, 2006 there was $260 (unaudited) of compensation cost related to non-qualified stock options recognized in the statement of operations (included in salary and benefits expenses). Basic and diluted earnings per common share for the nine months ended September 30, 2006 was $1.60 (unaudited) and $0.62 (unaudited) respectively. As of September 30, 2006, there were approximately $692 (unaudited) of total unrecognized compensation cost related to nonvested share-based compensation arrangements granted under the Company's stock incentive plan.
Accumulated Comprehensive Income
Comprehensive income is comprised of changes in the fair value of short-term investments and marketable securities deemed to be available for sale by management.
Newly Issued Accounting Pronouncements
In December 2004, the FASB issued SFAS No. 123(R),Share-Based Payments. SFAS No. 123(R), revised FASB Statement No. 123,Accounting for Stock-Based Compensation and supersedes APB Opinion No. 25,Accounting for Stock Issued to Employees. SFAS No. 123(R) focuses primarily on the accounting for transactions in which an entity obtains employee services in share-based payment transactions. SFAS No. 123(R) requires non-public companies to recognize in the statement of operations the cost of employee services received in exchange for awards of equity instruments based on the grant-date fair value of those awards (with limited exceptions). SFAS No. 123(R) is effective as of the first fiscal year beginning after December 15, 2005. Accordingly, the Company will adopt SFAS No. 123(R) in the first quarter of fiscal 2006. The Company is currently evaluating the impact of adopting SFAS No. 123(R). However, the amount of future stock based compensation expense pursuant to SFAS No. 123R will be largely dependent upon the amount and timing of stock awards issued in future periods.
In May 2005, the FASB issued SFAS No. 154,Accounting Changes and Error Corrections. SFAS No. 154 replaces APB Opinion No. 20,Accounting Changes and SFAS No. 3,Reporting Accounting Changes in Interim Financial Statements. SFAS No. 154 requires that a voluntary change in accounting principle be applied retrospectively, with all prior period financial statements presented on the basis of the new accounting principle unless it is impracticable to do so. SFAS No. 154 also provides that a change in method of depreciating or amortizing a long-lived nonfinancial asset be accounted for as a
change in estimate effected by a change in accounting principle and that correction of errors in previously issued financial statement should be termed a "restatement." SFAS No. 154 is effective for accounting changes and correction of errors made in fiscal years beginning after December 15, 2005.
The adoption of SFAS No. 154 may impact the Company's future results of operations, financial position or cash flows depending on changes or corrections made in future periods.
In June 2006, the FASB issued Interpretation No. 48,Accounting for Uncertainty in Income Taxes — An interpretation of FASB Statement No. 109, or FIN 48, which clarifies the accounting and disclosure requirements for uncertainty in tax positions, as defined. Under FIN 48, a tax position must be at least more-likely-than-not to be sustained, based solely on its technical merits, upon examination by the relevant taxing authority before a benefit is recognized in the financial statements. FIN 48 also provides guidance on derecognition, measurement, classification, interest and penalties, accounting in interim periods, disclosure and transition. The Company is currently evaluating the provisions of FIN 48, which is effective for fiscal years beginning after December 15, 2006.
In September 2006, the FASB issued SFAS No. 157,Fair Value Measurements, or SFAS 157, which clarifies the definition of fair value, establishes guidelines for measuring fair value, and expands disclosures regarding fair value measurements. SFAS 157 does not require any new fair value measurements and eliminates inconsistencies in guidance found in various prior accounting pronouncements. SFAS 157 will be effective for the Company on January 1, 2008. The Company is currently evaluating the impact of adopting SFAS 157 on its financial position, cash flows, and results of operations.
In September 2006, the Securities and Exchange Commission ("SEC") released Staff Accounting Bulletin No. 108,Considering the Effects of Prior Year Misstatements when Quantifying Misstatements in Current Year Financial Statements, or SAB 108. SAB 108 provides interpretive guidance on the SEC's views on how the effects of the carryover or reversal of prior year misstatements should be considered in quantifying a current year misstatement. The provisions of SAB 108 will be effective for the Company for the fiscal year ended December 31, 2006. The Company is currently evaluating the impact of applying SAB 108 but does not believe that the application of SAB 108 will have a material effect on its financial position, cash flows, and results of operations.
Unaudited Pro Forma Information
The Company will have completed a merger with a wholly owned corporate subsidiary immediately prior to the consummation of its initial public offering to convert to a corporation from a limited liability company. The unaudited pro forma balance sheet and unaudited pro forma net earnings per share have been presented to give effect to certain of these corporate actions as if they occurred on January 1, 2005 and January 1, 2006, respectively. The pro forma information reflects the issuance of common stock related to the exchange of all of the Company's redeemable convertible preferred shares on a 0.76 to one basis. The pro forma information excludes any proceeds or use of proceeds from the initial public offering.
The following table sets forth the computation of pro forma net income per share, on a basic and diluted basis (in thousands, except per share data):
| | Year Ended December 31, 2005 | Nine Months Ended September 30, 2006 | ||||
|---|---|---|---|---|---|---|
| | (In thousands, except per share amounts) | |||||
| Net income, as reported | $7,292 | $10,286 | ||||
| Pro forma adjustment for corporate taxes | (2,693 | ) | (3,791 | ) | ||
| Pro forma net income | $4,599 | $6,495 | ||||
| Pro forma weighted average shares outstanding: | ||||||
| Basic | 11,538,262 | 13,945,933 | ||||
| Diluted | 11,538,262 | 14,330,960 | ||||
| Pro forma income per share: | ||||||
| Basic | $0.40 | $0.47 | ||||
| Diluted | $0.40 | $0.45 | ||||
2. Property and Equipment
At December 31, 2005, the Company's fleet consisted of 22 MD80 series aircraft, 17 of which were in revenue service. As of September 30, 2006, the Company's fleet consisted of 25 MD80 series aircraft, 21 of which were in revenue service. The Company owns nine15 of these aircraft while five are subject to capital leases and eightfive subject to operating lease agreements.
Property and equipment as of December 31 consist of the following:
| | | As of December 31, | | |||||||||||||||
|---|---|---|---|---|---|---|---|---|---|---|---|---|---|---|---|---|---|---|
| | | As of September 30, 2006 | ||||||||||||||||
| | | 2004 | 2005 | |||||||||||||||
| | | 2004 | 2005 | | | | (unaudited) | |||||||||||
| Aircraft: | Aircraft: | Aircraft: | ||||||||||||||||
| Owned | $ | 33,143 | $ | 48,728 | Owned | $ | 33,143 | $ | 48,728 | $74,127 | ||||||||
| Under capital lease agreements | — | 28,530 | Under capital lease agreements | — | 28,530 | 28,561 | ||||||||||||
| 33,143 | 77,258 | 33,143 | 77,258 | 102,688 | ||||||||||||||
| Flight equipment | Flight equipment | 7,428 | 15,700 | Flight equipment | 7,428 | 15,700 | 19,873 | |||||||||||
| Equipment and leasehold improvements | Equipment and leasehold improvements | 1,534 | 2,555 | Equipment and leasehold improvements | 1,534 | 2,555 | 3,355 | |||||||||||
| Total property and equipment | Total property and equipment | 42,105 | 95,513 | Total property and equipment | 42,105 | 95,513 | 125,916 | |||||||||||
| Less accumulated depreciation and amortization | Less accumulated depreciation and amortization | (3,621 | ) | (8,444 | ) | Less accumulated depreciation and amortization | (3,621 | ) | (8,444 | ) | (15,907 | ) | ||||||
| Property and equipment, net | Property and equipment, net | $ | 38,484 | $ | 87,069 | Property and equipment, net | $ | 38,484 | $ | 87,069 | $110,009 | |||||||
Depreciation and amortization expense for the years ended December 31, 2003, 2004 and 2005 was $1,181, $2,183 and $5,088 respectively and was $3,578 (unaudited) and $7,599 (unaudited) for the nine months ended September 30, 2005 and 2006, respectively.
3. Accrued Liabilities
Accrued liabilities as of December 31 consist of the following:
| | As of December 31, | | ||||||||
|---|---|---|---|---|---|---|---|---|---|---|
| | As of September 30, 2006 | |||||||||
| | 2004 | 2005 | ||||||||
| | 2004 | 2005 | | | (unaudited) | |||||
| Accrued aircraft lease rentals | $279 | $258 | $279 | $258 | $348 | |||||
| Accrued interest payable | 39 | 480 | 39 | 480 | 6 | |||||
| Accrued salaries, wages and benefits | 1,326 | 2,156 | 1,326 | 2,156 | 2,989 | |||||
| Other | 1,126 | 1,988 | 1,126 | 1,988 | 4,176 | |||||
| Total accrued liabilities | $2,770 | $4,882 | $2,770 | $4,882 | $7,519 | |||||
4. Long-Term Debt
Long-term debt, including capital lease obligations, consists of the following as of December 31,following:
| | As of December 31, | | |||||||||||||||
|---|---|---|---|---|---|---|---|---|---|---|---|---|---|---|---|---|---|
| | As of September 30, 2006 | ||||||||||||||||
| | 2004 | 2005 | |||||||||||||||
| | 2004 | 2005 | | | (unaudited) | ||||||||||||
| Notes payable, secured by aircraft, interest at 8%, due at varying dates through October, 2010 | $ | 23,420 | $ | 29,412 | $ | 23,420 | $ | 29,412 | $ | 24,903 | |||||||
| Notes payable, secured by aircraft, interest at 8%, due at varying dates through June, 2011 | — | — | 7,862 | ||||||||||||||
| Notes payable, secured by aircraft, interest at 9%, due July 2008 | — | — | 2,221 | ||||||||||||||
| Note payable to related party, secured by various assets, interest at 8%, due April, 2007 | 8,532 | 1,735 | 8,532 | 1,735 | 891 | ||||||||||||
| Other notes payable | 37 | 117 | 37 | 117 | 86 | ||||||||||||
| Capital lease obligations | 3 | 28,483 | 3 | 28,483 | 26,251 | ||||||||||||
| Total long-term debt | 31,992 | 59,747 | 31,992 | 59,747 | 62,214 | ||||||||||||
| Less current maturities | (7,672 | ) | (10,627 | ) | (7,672 | ) | (10,627 | ) | (13,993 | ) | |||||||
| Long-term debt, net of current maturities | $ | 24,320 | $ | 49,120 | $ | 24,320 | $ | 49,120 | $ | 48,221 | |||||||
Maturities of long-term debt and capital lease obligations, as of December 31, 2005, for the next five years and thereafter, in aggregate, are: 2006—$10,627; 2007—$11,182; 2008—$10,445; 2009—$12,458; 2010—$9,609; thereafter—$5,426.
In December 2002, the Company reached agreement with its principal shareholder for a $3.0 million line of credit. The agreement, which expired in December 2004, was for general working capital purposes, and there had been no draw-downs under this facility.
5. Capital and Operating Lease Obligations
Capital Leases
The Company has entered into five lease agreements for aircraft which are classified as capital leases under the provisions of SFAS No. 13,Accounting For Leases. The capital lease agreements are typically for a term of five years and the present value of the minimum lease payments exceed the fair market value of the aircraft at the inception of the lease. The carrying value at December 31, 2005 of aircraft under capital lease arrangements included in property and equipment totaled $28,471.$28,471 and $26,721 (unaudited) as of December 31, 2005 and September 30, 2006, respectively. Amortization of aircraft under capital lease arrangements is included in depreciation and amortization expense.
Operating Leases
As of December 31, 2005, the Company has entered into operating lease agreements for eight aircraft with varying terms extending through October 2008. Two of the lease agreements include renewal options for a period of not less than 24 months and three agreements include renewal options for 36 months. Because the lease renewals are not considered to be reasonably assured as defined in SFAS No. 13, the rental payments that would be due during the renewal periods are not included in the determination of rent expense until the leases are renewed. During 2005, the Company exercised the purchase option included in a lease agreement on one aircraft. Purchase options are included in the remaining lease agreements on all but one of the leased aircraft. Additionally, the Company leases office facilities, airport and terminal facilities and office equipment under operating lease arrangements with terms extending through 2010.
Airport and terminal facility leases are entered into with a variety of local governments and other third parties. These lease arrangements have a variety of terms and conditions. Leasehold improvements made at these facilities are not material.
Total rental expense charged to operations for aircraft and non-aircraft leases for the years ended December 31, 2003, 2004 and 2005 was $3,999,$4,046, $5,015 and $6,627, respectively. Total rent expense charged to operations for the nine months ended September 30, 2005 and 2006 was $4,481 (unaudited) and $6,337 (unaudited), respectively.
At December 31, 2005, scheduled future minimum lease payments under operating leases with initial or remaining non-cancelable lease terms in excess of one year and amounts due under capital lease arrangements are as follows:
| | Capital Leases | Operating Leases | Capital Leases | Operating Leases | ||||||||
|---|---|---|---|---|---|---|---|---|---|---|---|---|
| 2006 | $ | 5,810 | $ | 6,725 | $5,810 | $6,725 | ||||||
| 2007 | 5,880 | 6,637 | 5,880 | 6,637 | ||||||||
| 2008 | 5,880 | 2,932 | 5,880 | 2,932 | ||||||||
| 2009 | 5,880 | 828 | 5,880 | 828 | ||||||||
| 2010 | 7,020 | 562 | 7,020 | 562 | ||||||||
| Thereafter | 5,480 | — | 5,480 | — | ||||||||
| Total | 35,950 | $ | 17,684 | 35,950 | $ | 17,684 | ||||||
| Less: amount representing interest | 7,467 | 7,467 | ||||||||||
| Present value of future payments | 28,483 | 28,483 | ||||||||||
| Less: current obligations | 3,232 | 3,232 | ||||||||||
| Long-term obligations | $ | 25,251 | $ | 25,251 | ||||||||
6. Income Taxes
Prior to May 2004, the Company elected to be taxed under the provisions of Subchapter S of the Internal Revenue Code wherein the taxable income or loss of the Company was included in the income tax returns of the shareholders. In May 2004, the Company reorganized as a limited liability company
and is therefore taxed as a partnership for federal income tax purposes. Because the Company does not pay corporate federal income tax at the entity level on its taxable income, no provision for federal income taxes is reflected in the accompanying financial statements. A provision for state income taxes has been included in the financial statements for each of the three years ended December 31, 2005 as the Company electedwas also subject to be taxedtax at the entity level in certain states in which it operates. Deferred income taxes for such states are not material.
7. Related Party Transactions
The facility which houses the Company's Las Vegas, Nevada corporate headquarters was owned through April 2005 by an entity in which the Company's Chief Executive Officer is a principal.and another Director are principals. Rent expense paid to the related party for the years ended December 31, 2003, 2004 and 2005, was $228, $333 and $117, respectively.
The Company utilizes software developed and maintained by a corporation owned by the Company's founder and former Chief Executive Officer and Chairman of the Board. System development and maintenance expenses for the years ended December 31, 2003, 2004 and 2005 totaled $120,
$120, $190 and $285, respectively. System development and maintenance expenses for the (unaudited) nine months ended September 30, 2006 totaled $293 (unaudited).
The Company periodically utilizes private aircraft owned by a corporation principally owned by the Company's Chief Executive Officer and another Director for the time-sensitive delivery of aircraft parts. For the years ended December 31, 2003, 2004 and 2005 these expenses totaled $17, $66 and $0, respectively. The Company incurred no expense under the arrangement during the nine months ended September 30, 2006.
The Company also periodically utilizes the private aircraft owned by a company of which the Company's Chief Executive Officer is a part owner for the time-sensitive delivery of aircraft parts. For the years ended December 31, 2003, 2004 and 2005 these expenses totaled $0, $0 and $3, respectively.
The Company hashad notes payable to its Chief Executive Officer totaling $8,167, $8,532 and $1,735 as of December 31, 2003, 2004 and 2005, respectively. (See Note 4.)
Under an agreement which expired in December 2004, the Chief Executive Officer had entered into an agreement to provide the Company with a $3 million line of credit. No amounts were ever borrowed under this arrangement.
In June 2006, the Company purchased an MD83 aircraft from an entity in which the Chief Executive Officer and another Director are principals. The purchase price of $3,525 was paid directly to a secured lender, and none of the proceeds were paid to the entity with which the Company's Chief Executive Officer and Director are principals.
8. Financial Instruments and Risk Management
Fuel Price Risk Management
Airline operations are inherently dependent upon energy to operate and, therefore, are impacted by changes in jet fuel prices. Aircraft fuel consumed in 2003, 2004, and 2005expense represented approximately 25.5 percent, 33.6 percent,25.0%, 33.1%, and 42.4 percent42.4% of the Company's operating expenses for the years ended December 31, 2003, 2004 and 2005, respectively. For the (unaudited) nine months ended September 30, 2005 and 2006, aircraft fuel represented 40.2% and 47.1%, respectively, of the Company's operating expenses. The Company endeavors to acquire jet fuel at the lowest possible cost. Because jet fuel is not traded on an organized futures exchange, liquidity for hedging is limited. However, the Company has found commodities for effective hedging of jet fuel costs, primarily crude oil, and refined products such as heating oil and unleaded gasoline. The Company utilizes financial derivative instruments as economic
hedges to decrease its exposure to jet fuel price increases. The Company does not purchase or hold any derivative financial instruments for trading purposes.
The Company's derivatives have historically not qualified as hedges for financial reporting purposes in accordance with SFAS No. 133, "AccountingAccounting for Derivative Instruments and Hedging Activities."Activities. Accordingly, changes in the fair value of such derivative contracts, which amounted to gains of $314, $4,348$4,438 and $612 in years 2003, 2004 and 2005, respectively, and a loss of $2,927 (unaudited) for the nine months ended September 30, 2006 were recorded as a "Gain"(Gain)/loss on fuel derivatives, net" within Other income (expense) in the accompanying consolidated statements of operations. The fair value of hedge contracts at December 31 amounted to $2,451 and $20 inas of December 31, 2004 and 2005, respectively, and was recorded in "Other current assets" in the accompanying consolidated balance sheet. As of
September 30, 2006, the fair value of hedge contracts amounted to ($2,581) (unaudited) and was recorded in "Accrued liabilities" in the accompanying consolidated balance sheet.
As of December 31, 2005, the Company had derivative instruments on 6.4% of its projected 2006 fuel consumption.
Debt
The Company's debt with a carrying value of $31,989, $31,264 and $31,264$35,963 (unaudited) as of December 31, 2004 and 2005 and September 30, 2006, respectively, approximates fair value. These fair value estimates were based on the discounted amount of future cash flows using the Company's current incremental rate of borrowing for similar liabilities.
Other Financial Instruments
The carrying amounts of cash, cash equivalents, restricted cash, accounts receivables and accounts payable approximate fair value due to their short term nature.
9. Federal Grants
As a result of the large financial losses attributed to the terrorist attacks on the United States that occurred on September 11, 2001, H.R. 2626, the Air Transportation Safety and System Stabilization Act (the "Stabilization Act") was signed into law. The intent of the Act was to preserve the continued viability of the air transportation system of the United States by providing support to passenger airlines in the form of grant money, loan guarantees and assistance with increased insurance costs. The terrorist attacks of September 11, 2001 had a significant impact on the Company. Following the attacks, the air transportation system was temporarily shut down, resulting in the cancellation of flights. The cancelled flights as well as the loss of consumer confidence in the airline industry resulted in lost revenue, lower load factors and consequently, reduced revenues. The Company was also impacted because fixed costs continue during the affected period while revenue decreased.
Subsequent to September 11, 2001, the Company recorded $1,310 for amounts claimed under the Stabilization Act. This amount was recorded in "Other income (expense), net" in the accompanying statement of operations during 2003.
On April 16, 2003, as a result of the United States war with Iraq, the Emergency Wartime Supplemental Appropriations Act ("Wartime Act") was signed into law. Among other items, the
legislation included government grants for airlines. The Company received $900$703 as its proportional share of the grant during the second quarter of 2003. This amount is reimbursement for passenger security and air carrier security fees paid or collected by U.S. carriers as of the date of enactment of the law, together with other items. This amount is included in "Other income (expense)" in the accompanying statement of operations for 2003.
10. Employee Benefit Plans
401(k) Plan
The Company has a defined contribution plan covering substantially all eligible employees. Under the Plan, employees may contribute up to 18% of their eligible annual compensation with the Company
matching up to 3% of eligible employee wages. Employees generally vest in matching contributions ratably over five years. The Company recognized expense under this plan of $59, $125$66, $129 and $249$263 for the years ended December 31, 2003, 2004 and 2005, respectively. Expense recognized for the (unaudited) nine months ended September 30, 2005 and 2006 was $186 (unaudited) and $324 (unaudited), respectively.
Share Option Program
In February 2005, the Company adopted a share option program (the "Share Option Program") granting key employees the option to purchase shares of the Company's common stock. Under the plan, the Company reserved an aggregate of 500,000 shares of common stock for issuance pursuant to the exercise of options. The options are granted at exercise prices that approximate fair market value as of the grant date. The options vest ratably over the term specified in the option agreement, typically three years, and have a contractual life of 10 years.
The fair value of options granted were estimated as of the grant date using the Black-Scholes option pricing model with the following assumptions for 2005: no dividend yield; an expected life of 6 years; risk-free interest rates of 3.83%; and volatility of 60.3%. No options were granted or outstanding in 2003 and 2004.
In April 2006, Allegiant Travel Company's Board of Directors adopted, and the stockholders approved, a Long-Term Incentive Plan (the "2006 Plan"). Upon the merger of Allegiant Travel Company, LLC into Allegiant Travel Company (a Nevada corporation) at or immediately prior to Allegiant Travel Company's proposed initial public offering, all outstanding options under the Share Option Program will be transferred to the 2006 Plan and no further option grants will be made under the Share Option Program. The transferred options will continue to be governed by their existing terms, unless Allegiant Travel Company's compensation committee elects to extend one or more features of the 2006 Plan to those options. Allegiant Travel Company has reserved 3,000,000 shares of common stock for issuance under the 2006 Plan. Such shares include the 500,000 shares that will be transferred from the Share Option Program.
Share option activity for the year ended December 31, 2005 is summarized below.
| | Year Ended December 31, 2005 | Nine Months Ended September 30, 2006 | |||||||||||||
|---|---|---|---|---|---|---|---|---|---|---|---|---|---|---|---|
| | 2005 | Options | Wtd Avg Exercise Price | Options | Wtd Avg Exercise Price | ||||||||||
| | Options | Wtd Avg Exercise Price | | | (unaudited) | ||||||||||
| Outstanding, beginning of year | — | — | — | — | 381,000 | $3.59 | |||||||||
| Granted | 384,000 | $ | 3.58 | 384,000 | $ | 3.58 | 47,000 | $ | 13.00 | ||||||
| Exercised | — | — | — | — | — | — | |||||||||
| Forfeited/Expired | (3,000 | ) | $ | 3.50 | (3,000 | ) | $ | 3.50 | (14,000 | ) | $3.50 | ||||
| Outstanding, end of year | 381,000 | $ | 3.59 | 381,000 | $ | 3.59 | 414,000 | $4.66 | |||||||
| Weighted average remaining contractual life in years | 9.12 | 9.12 | 7.99 | ||||||||||||
| Options exercisable, end of year | — | ||||||||||||||
| Options exercisable, end of period | — | 127,000 | $3.59 | ||||||||||||
The range of exercise prices for options granted in 2005 was $3.50—$4.50, and the weighted average fair value of options granted in 2005 was $2.13. The range of exercise prices granted in 2006 was $13.00 (unaudited) and the weighted average fair value of options granted in 2006 was $7.63 (unaudited).
On July 31, 2006, the board of directors authorized the issuance of 100,000 shares of restricted stock upon the effective date of the Company's proposed initial public offering under the 2006 Long-Term Incentive Plan. The restricted stock will be allocated among the Company's employees, excluding employees above the level of director, based on the period of service and compensation pursuant to a formula approved by the board of directors.
11. Shareholders'/Members' Equity
In February 2003, the Company amended its Articles of Incorporation to authorize 15,000,000 shares of capital stock, consisting of 10,000,000 shares of common stock, $.001 par value, and 5,000,000 shares of preferred stock, $.001 par value. All shares of the Company's no par value common stock then outstanding were converted into newly issued shares of the Company's common stock, $.001 par value per share, simultaneously with the amendment. On June 1, 2003, the Company's Board of Directors declared a 2,500 to 1 stock split. As a result of the split, 4,998,000 additional common shares were issued. Shareholders'/members' equity has been restated to give retroactive recognition to the stock split at December 31, 2002.
In August 2003, the Company approved agreements with several key members of management to sell to the officers a total of 1,750,000 shares of stock. The Company retained the right to repurchase these shares in the event of termination of employment for any reason and agreed to finance the purchase price of the shares purchased at $.10 per share over a period of three years. In August 2004, one of these individuals left the Company at which time the Company repurchased 66,667 shares.
These notes were paid in full during 2005. Amounts owed to the Company of $175, $165 and $0 at December 31, 2003, 2004 and 2005, respectively, are classified in the accompanying consolidated balance sheet as "Notes receivable for issuance of common stock".stock."
In May 2004, the Company merged Allegiant Air, Inc. into Allegiant Air LLC (see Note 1). As a result of this merger, all shares of Allegiant Air, Inc.'s no par value common stock were converted into $.001 par value shares of Allegiant Air, LLC's.
During May 2005, the Members of Allegiant Air, LLC transferred and assigned all 6,683,333 outstanding shares of Allegiant Air, LLC to Allegiant Travel Company, LLC, in exchange for 6,683,333 newly issued common shares of Allegiant Travel Company, LLC.
In June 2005, the Company repurchased 250,000 common shares from three key members of management and the Company's founder for a total of $1.0 million, or $4.00 per share.
12. Redeemable Convertible Preferred Shares
In May 2005, the Company authorized the issuance of up to 9,885,000 shares of redeemable convertible preferred shares of which 8,635,000 were designated as Series A Convertible Preferred Shares and 1,250,000 were designated as Series B Convertible Preferred Shares (the "Preferred Shares"). In May 2005, the Company completed a private placement offering in which all authorized Series A shares were issued at $4.00 per share for total proceeds to the Company of $39,540.$34,540. Concurrently, all authorized Series B Convertible Preferred Shares were issued at $4.00 per share to the Company's Chief Executive Officer in exchange for the cancellation of $5,000 in outstanding debt. Expenses of the offering totaled $1,360. In connection with the issuance of the Series A Convertible Preferred Shares, the placement agent was issued 162,500 warrants to acquire the Company's common shares at $4.40 per share as part of the consideration for services provided. The warrants are exercisable through May 5, 2010. The share purchase warrant agreement includes anti-dilution provisions and piggyback
registration rights in the event of a primary or secondary registration of any class of securities as defined. The warrants were valued at approximately $57$329 at the date of grant using the Black-Scholes valuation method atbased on the datefollowing assumptions: no dividend yield; an expected life of grant.
Concurrently, all authorized Series B Convertible Preferred Shares were issued at $4.00 per share to the Company's Chief Executive Officer in exchange for the cancellation5 years; risk-free interest rate of $5.0 million in outstanding debt.3.93%; and volatility of 60%.
The Series A and Series B Convertible Preferred Shares have no stated dividend rate, have voting rights similar to common shares and can be converted into common shares at any time, at the option of the holder. Upon the consummation of a qualified public offering, the outstanding Series A and Series B Convertible Preferred Shares shall automatically be converted into common shares on a one-for-one basis. However, the holders have agreed to the cancellation of 24% of their shares in the event of an initial public offering of the Company's common stock in which the midpoint of the price range on the cover page of the preliminary prospectus is at least $15.79 per share. In the event the Company completes a qualified public offering prior to December 31, 2007 and has a filing range at or above a pre-determined price, 24% of the preferred sharesPreferred Shares will be cancelled.cancelled and the Preferred Shares would be converted into common shares in a ratio of 0.76 to 1. The Series A and Series B Convertible Preferred Shares contain redemption rights which become effective in May 2010. The redemption value
is the greater of the Liquidation Value (defined as $4.00 per share) or the Redemption Value (defined as the market value of the shares as agreed upon between the Company and the holders of the Convertible Preferred Shares at the time of redemption.)redemption). Because of this redemption feature and other rights associated with the Convertible Preferred Shares, the Company has classified the Convertible Preferred Shares in the mezzanine section of the accompanying consolidated balance sheet.
13. Commitments and Contingencies
Legal Matters
The Company is subject to certain legal and administrative actions which management considers routine to its business activities. As of December 31, 2005, managementManagement believes after consultation with legal counsel, the ultimate outcome of any pending legal matters will not have a material adverse impact on the Company's financial position, liquidity or results of operations.
14. Subsequent Events (unaudited)
Subsequent to December 31, 2005, the Company purchased two MD83 aircraft for $8.1 million. In April 2006, the$8,100. The Company leased one of these aircraft on a short-term basis to a certified air carrier. Negotiations are ongoing to leaseIn October 2006, the secondCompany took redelivery of the aircraft, under similar terms. Bothand the aircraft are being leased until they are placedprepared for placement into the Company's scheduled service.
In June 2006, the Company purchased an MD83 aircraft for $3,500 from an entity of which the Company's Chief Executive Officer is a part owner. The Company also purchased two MD83 aircraft for $9,200 with seller financing. The aircraft were previously operated by the Company under operating leases.
In July 2006, the Company purchased an MD83 aircraft for $4,475 that was previously operated by the Company subject to an operating lease. The purchase price was paid with cash and a $2,405 payable to the seller.
Subject to the terms of a Stock Purchase Agreement dated November 20, 2006, PAR Investment Partners, L.P., or PAR, has agreed to purchase 1,750,000 common shares, or approximately 9.2% of the outstanding shares, from certain existing stockholders of the Company simultaneously with the closing of the proposed initial public offering. The proceeds to the selling stockholders, net of fees and discounts, will be approximately 93.0% of the initial public offering price. Under certain conditions, PAR has the option to terminate the stock purchase transaction.


Through and including (the 25th day after the date of this prospectus), all dealers effecting transactions in these securities, whether or not participating in this offering, may be required to deliver a prospectus. This is in addition to the dealers' obligation to deliver a prospectus when acting as underwriters and with respect to their unsold allotments or subscriptions.
5,000,000 Shares
Common Stock
P R O S P E C T U S
Merrill Lynch & Co.
Bear, Stearns & Co. Inc.
Raymond James
, 2006
INFORMATION NOT REQUIRED IN PROSPECTUS
Item 13. Other Expenses of Issuance and Distribution.
The following table sets forth the various expenses, other than underwriting discounts and commissions, payable by the Registrant in connection with the sale of the common stock being registered. All of the amounts shown are estimated except the Securities and Exchange Commission registration fee and National Association of Securities Dealers filing fee.
| SEC registration fee | $ | 10,700 | |
| NASD filing fee | 10,500 | ||
| Listing fee | * | ||
| Printing and engraving expenses | * | ||
| Legal fees and expenses | * | ||
| Accounting fees and expenses | * | ||
| Blue Sky fees and expenses | * | ||
| Transfer agent and registrar fees | * | ||
| Miscellaneous fees and expenses | * | ||
| Total | $ | * | |
| Securities and Exchange Commission registration fee | $10,700 | ||
| National Association of Securities Dealers filing fee | 10,500 | ||
| Nasdaq National Market listing fee | 50,000 | ||
| Printing and engraving expenses | 250,000 | ||
| Legal fees and expenses | 400,000 | ||
| Accounting fees and expenses | 550,000 | ||
| Blue Sky fees and expenses | 15,000 | ||
| Transfer agent and registrar fees | 3,500 | ||
| Miscellaneous fees and expenses | 110,300 | ||
| Total | $ | 1,400,000 | |
Item 14. Indemnification of Directors and Officers.
The Company's Articles of Incorporation provide that directors of the Company will not be personally liable for monetary damages to the Company for certain breaches of fiduciary duty as directors to the fullest extent allowable by Nevada law. Under Nevada law, subject to specified exceptions, or unless the articles of incorporation provide for greater individual liability, a director or officer is not individually liable to the Company or its stockholders or creditors for any damages as a result of any act or failure to act in his capacity as a director or officer unless it is proven that (a) his act or failure to act constituted a breach of his fiduciary duties as a director or officer, and (b) his breach of those duties involved intentional misconduct, fraud, or a knowing violation of law. Under current Nevada law, directors and officers would remain liable for: (i) acts or omissions which constitute a breach of fiduciary and which involve intentional misconduct, fraud or a knowing violation of law, and (ii) approval of certain illegal dividends or redemptions. In appropriate circumstances, equitable remedies or non-monetary relief, such as an injunction, may remain available to a stockholder seeking redress from any such violation.
The Company also has the obligation, pursuant to Article Ten of the Company's By-Laws, to indemnify any officer or director of the Company for all expenses actually and reasonably incurred by them in connection with any legal action brought or threatened against such person for or on account of any action or omission alleged to have been committed because such person was an officer or director, if the person acted in good faith and in a manner which the person believed to be in, or believed was not opposed to, the best interests of the Company and, with respect to criminal actions, such person had no reasonable cause to believe his conduct was unlawful; provided that such indemnification shall not be made if a final adjudication establishes such person's acts or omissions involved intentional misconduct, fraud, or a knowing violation of law and was material to the cause of action.
II-1
Item 15. Recent Sales of Unregistered Securities.
The following is a summary of our sales of our securities during the past three years involving sales of our securities that were not registered under the Securities Act of 1933, as amended:
In May 2005, we entered into an agreement with ComVest Allegiant Holdings, LLC, Viva Air Limited and certain other individual investors to sell, in a private placement, an aggregate of 8,635,000 shares of our preferred shares in our limited liability company predecessor at a price of $4.00 per share. The total aggregate offering price for this sale was $34,540,000. In connection with this private placement, we paid a placement fee of $1,300,000 and issued warrants to purchase 162,500 shares of our common stock to Raymond James & Associates, Inc.
Simultaneously with the above private placement in May 2005 and as a condition to its completion, Maurice J. Gallagher, Jr. agreed to convert debt of $5,000,000 owed by us to him into 1,250,000 Series B Preferred Shares.
During 2005 and 2006, we issued stock options to purchase an aggregate of 392,000431,000 shares of our common stock. The exercise prices for thesestock as follows: options ranged fromto purchase 339,000 shares at $3.50 per share were issued to 30 employees in February 2005; options to purchase 25,000 shares at $4.00 per share were issued to one new employee in June 2005; options to purchase 20,000 shares at $4.50 per share were issued to one new employee in September 2005; and options to purchase an aggregate of 47,000 shares at $13.00 per share.share were issued to three new employees in April and May, 2006. No proceeds were received by us from these option grants.
In August 2003, we entered into an agreement with Ponder Harrison, Andrew Levy, Linda Marvin and one other former officer of ours to sell, in a private placement, an aggregate of 1,750,000 shares of common stock in our corporate predecessor at a price of $.10$0.10 per share. The total aggregate offering price for this sale was $175,000 and the purchase price was paid through the execution of promissory notes in favor of the Company.us. All of these notes have subsequently been paid in full.
As part of the reorganization transactions, the Companywe will issue shares of itsour common stock, par value $.001 per share, to the members of Allegiant Travel Company, LLC, upon the completion of the reorganization transactions.
All of the above-described issuances were or are expected to be exempt from registration (i) pursuant to Section 4(2) of the Securities Act, or Regulation D promulgated thereunder, as transactions not involving a public offering or (ii) Rule 701 promulgated under the Securities Act or (iii) as transactions not involving a sale of securities. With respect to each transaction listed above, no general solicitation was or will be made by either the Registrant or any person acting on its behalf; the securities sold are or will be subject to transfer restrictions, and the certificates for the shares contained or will contain an appropriate legend stating such securities have not been registered under the Securities Act and may not be offered or sold absent registration or pursuant to an exemption therefrom. Except as indicated above, no underwriters were or will be involved in connection with the sales of securities referred to in this Item 15.
II-2
Item 16. Exhibits and Financial Statement Schedules.
| Exhibit Number | Exhibit Description | |
|---|---|---|
| Form of Purchase Agreement. | ||
| 3.1** | Articles of Incorporation of Allegiant Travel Company. | |
| 3.2** | Bylaws of Allegiant Travel Company. | |
| 4.1* | Specimen Stock Certificate. | |
| Opinion of Ellis Funk, P.C. | ||
| 10.1** | Securities Purchase Agreement dated April 4, 2005, between Allegiant Air, LLC and the investors named therein. | |
| 10.2** | Closing Agreement dated May 4, 2005, between Allegiant Travel Company, LLC, Allegiant Air, LLC and the investors named therein. | |
| 10.3** | Investors Agreement dated as of May 4, 2005, between Allegiant Travel Company, LLC and the investors named therein. | |
| 10.4* | Merger Agreement between Allegiant Travel Company, LLC and Allegiant Travel Company | |
| 10.5** | Amendment and Restatement of Promissory Notes to Maurice J. Gallagher, Jr., dated May 4, 2005 | |
| 10.6** | Form of Tax Indemnification Agreement between Allegiant Travel Company and members of Allegiant Travel Company, LLC | |
| 10.7** | 2006 Long-Term Incentive Plan | |
| 10.8** | Allegiant | |
| Form of Indemnification Agreement | ||
| 10.10** | Aircraft Purchase Agreement dated as of June 8, 2006, between Allegiant Air, LLC and PCG Acquisition II, Inc. | |
| 10.11†** | Air Transportation Charter Agreement dated March 21, 2003, between Allegiant Air, Inc. and Harrah's Laughlin, Inc. and amendments thereto. | |
| 10.12†** | Air Transportation Charter Agreement dated March 21, 2003, between Allegiant Air, Inc. and Harrah's Operating Company, Inc. and amendment thereto. | |
| 10.13** | Airport Operating Permit between Allegiant Air, Inc. and Clark County Department of Aviation dated April 14, 2003. | |
| 10.14** | Permanent Software License Agreement between Allegiant Air, Inc. and CMS Solutions, Inc. dated August 1, 2001. | |
| 10.15** | Memorandum of Understanding between Allegiant Air, LLC and Sanford Airport Authority dated March 4, 2005. | |
| 10.16** | Employment Agreement dated July 31, 2006, between Allegiant Travel Company and M. Ponder Harrison. | |
| 10.17** | Employment Agreement dated July 31, 2006, between Allegiant Travel Company and Andrew C. Levy. | |
| 10.18** | Employment Agreement dated July 31, 2006, between Allegiant Travel Company and Linda A. Marvin. | |
| 10.19** | Employment Agreement dated July 31, 2006, between Allegiant Travel Company and Michael P. Baxter. | |
| 10.20† | Maintenance General Terms Agreement dated March 2006 between Allegiant Air, LLC and American Airlines, Inc. | |
| 10.21 | Stock Purchase Agreement dated November 20, 2006, among the Company, Allegiant Travel Company, LLC, PAR Investment Partners, L.P. and certain selling stockholders named therein. | |
| 21.1 | List of Subsidiaries | |
| Consent of Ellis Funk, P.C. (included in Exhibit 5.1). | ||
| 23.2 | Consent of Ernst & Young LLP. | |
| Powers of Attorney |
II-3
Item 17. Undertakings.
The undersigned Registrant hereby undertakes to provide to the underwriters at the closing specified in the underwriting agreements, certificates in such denominations and registered in such names as required by the underwriters to permit prompt delivery to each purchaser.
Insofar as indemnification for liabilities arising under the Securities Act of 1933 may be permitted to directors, officers and controlling persons of the Registrant pursuant to the foregoing provisions, or otherwise, the Registrant has been advised that in the opinion of the Securities and Exchange Commission such indemnification is against public policy as expressed in the Act and is, therefore, unenforceable. In the event that a claim for indemnification against such liabilities (other than the payment by the Registrant of expenses incurred or paid by a director, officer or controlling person of the Registrant in the successful defense of any action, suit or proceeding) is asserted by such director, officer or controlling person in connection with the securities being registered, the Registrant will, unless in the opinion of its counsel the matter has been settled by controlling precedent, submit to a court of appropriate jurisdiction the question whether such indemnification by it is against public policy as expressed in the Act and will be governed by the final adjudication of such issue.
The undersigned Registrant hereby undertakes that:
II-4
Pursuant to the requirements of the Securities Act, the Registrant has duly caused this Amendment No. 3 to Registration Statement to be signed on its behalf by the undersigned, thereunto duly authorized, in the City of Las Vegas, State of Nevada, on May 15,November 20, 2006.
| ALLEGIANT TRAVEL COMPANY | ||||
| By: | /s/ MAURICE J. GALLAGHER, JR. Maurice J. Gallagher, Jr. | |||
| Chief Executive Officer (Principal Executive Officer) | ||||
KNOW ALL MEN BY THESE PRESENTS, that each person whose signature appears below constitutes and appoints Maurice J. Gallagher, Jr. and Andrew C. Levy, his true and lawful attorneys-in-fact and agents, with full power of substitution and resubstitution for him, in his name, place and stead, in any and all capacities, to sign any and all amendments (including post-effective amendments) to this Registration Statement, and to file the same, with all exhibits thereto, and other documents in connection therewith, including a Registration Statement filed under Rule 462(b) of the Securities Act of 1933, as amended, with the Securities and Exchange Commission, granting unto said attorneys-in-fact and agents full power and authority to do and perform each and every act and thing requisite and necessary to be done in and about the premises as fully and to all intents and purposes as he might or could do in person, hereby ratifying and confirming all that said attorneys-in-fact and agents may lawfully do or cause to be done by virtue hereof.
Pursuant to the requirements of the Securities Act of 1933, this Amendment No. 3 to Registration Statement has been signed by the following persons in the capacities and on the dates indicated.
| Signature | Title | Date | ||
|---|---|---|---|---|
| /s/ MAURICE J. GALLAGHER, JR. Maurice J. Gallagher, Jr. | Chief Executive Officer and Director (Principal Executive Officer) | |||
/s/ LINDA MARVIN Linda Marvin | Chief Financial Officer (Principal Financial and Accounting Officer) | |||
Michael S. Falk | Director | |||
Timothy P. Flynn | Director | November 20, 2006 | ||
A. Maurice Mason | Director | November 20, 2006 | ||
Robert L. Priddy | Director | |||
Declan F. Ryan | Director |
*By: | /s/ MAURICE J. GALLAGHER, JR. Maurice J. Gallagher, Jr., Attorney in fact |
II-5