

As filed with the Securities and Exchange Commission on March 8,May 7, 2007
Registration Number 333- 333-141142
UNITED STATES
SECURITIES AND EXCHANGE COMMISSION
WASHINGTON, D.C. 20549
AMENDMENT NO. 3 TO
FORM S-1
REGISTRATION STATEMENT
UNDER
THE SECURITIES ACT OF 1933
AECOM TECHNOLOGY CORPORATION
(Exact name of Registrant as specified in its charter)
| Delaware | 8711 | 61-1088522 | ||
| (State or other jurisdiction of incorporation or organization) | (Primary Standard Industrial Classification Code Number) | (I.R.S. Employer Identification No.) |
555 South Flower Street, Suite 3700
Los Angeles, California 90071
(213) 589-8000593-8000
(Address of principal executive offices, including zip code and telephone number)
John M. Dionisio
President and Chief Executive Officer
AECOM Technology Corporation
555 South Flower Street, Suite 3700
Los Angeles, California 90071
(213) 593-8000
(Name, address and telephone number of agent for service)
Copies to:
| Jonathan K. Layne, Esq. Gibson, Dunn & Crutcher LLP 2029 Century Park East Los Angeles, CA 90067 (310) 552-8500 | Eric Chen, Esq. David Y. Gan, Esq. AECOM Technology Corporation 555 South Flower Street, Suite 3700 Los Angeles, CA 90071 (213) 593-8000 | J. Scott Hodgkins, Esq. Steven B. Stokdyk, Esq. Latham & Watkins LLP 633 West 5th Street, Suite 4000 Los Angeles, CA 90071 (213) 485-1234 |
Approximate date of proposed sale to the public:As soon as practicable after this Registration Statement becomes effective.
If any of the securities being registered on this Form are to be offered on a delayed or continuous basis pursuant to Rule 415 under the Securities Act of 1933, check the following box. o
If this Form is filed to register additional securities for an offering pursuant to Rule 462(b) under the Securities Act, please check the following box and list the Securities Act registration statement number of the earlier effective registration statement for the same offering. o
If this Form is a post-effective amendment filed pursuant to Rule 462(c) under the Securities Act of 1933, check the following box and list the Securities Act registration statement number of the earlier effective registration statement for the same offering. o
If this Form is a post-effective amendment filed pursuant to Rule 462(d) under the Securities Act of 1933, check the following box and list the Securities Act registration statement number of the earlier effective registration statement for the same offering. o
If delivery of the prospectus is expected to be made pursuant to Rule 434, please check the following box. o
CALCULATION OF REGISTRATION FEE
| Title of Shares to be Registered | Proposed Maximum Aggregate Offering Price(1)(2) | Amount of Registration Fee | ||
|---|---|---|---|---|
| Common Stock, $0.01 par value | $200,000,000 | $6,140 | ||
THE REGISTRANT HEREBY AMENDS THIS REGISTRATION STATEMENT ON SUCH DATE OR DATES AS MAY BE NECESSARY TO DELAY ITS EFFECTIVE DATE UNTIL THE REGISTRANT SHALL FILE A FURTHER AMENDMENT WHICH SPECIFICALLY STATES THAT THIS REGISTRATION STATEMENT SHALL THEREAFTER BECOME EFFECTIVE IN ACCORDANCE WITH SECTION 8(a) OF THE SECURITIES ACT OF 1933, OR UNTIL THE REGISTRATION STATEMENT SHALL BECOME EFFECTIVE ON SUCH DATE AS THE COMMISSION, ACTING PURSUANT TO SAID SECTION 8(a), MAY DETERMINE.
The information in this preliminary prospectus is not complete and may be changed. We may not sell these securities until the registration statement filed with the Securities and Exchange Commission is effective. This preliminary prospectus is not an offer to sell these securities and we and the selling stockholders are not soliciting an offer to buy these securities in any state where the offer or sale is not permitted.
Subject to Completion, Dated March 8,May 7, 2007
PROSPECTUS
35,150,000 Shares
AECOM TECHNOLOGY CORPORATION
COMMON STOCK
AECOM Technology Corporation is offering 19,888,797 shares of common stock and the selling stockholders are offering 15,261,203 shares of common stock. We will not receive any proceeds from the sale of shares by the selling stockholders. This is our initial public offering and no public market currently exists for our shares. We estimate that the initial public offering price will be between $$18.00 and $$20.00 per share.
We are applying to have ourOur common stock tradedhas been approved for trading on The New York Stock Exchange under the symbol "ACM."ACM," subject to official notice of issuance.
Investing in our common stock involves risks. See "Risk Factors" beginning on page 9.
PRICE $ A SHARE
| | Price to Public | Underwriting Discounts and Commissions | Proceeds to AECOM | Proceeds to Selling Stockholders | ||||||||
|---|---|---|---|---|---|---|---|---|---|---|---|---|
| Per Share | $ | $ | $ | $ | ||||||||
| Total | $ | $ | $ | $ | ||||||||
We have granted the underwriters the right to purchase up to an additional 5,272,500 shares of common stock to cover over-allotments.
The Securities and Exchange Commission and state securities regulators have not approved or disapproved these securities, or determined if this prospectus is truthful or complete. Any representation to the contrary is a criminal offense.
The underwriters expect to deliver the shares to purchasers on May , 2007.
| MORGAN STANLEY | MERRILL LYNCH & CO. | UBS INVESTMENT BANK |
GOLDMAN, SACHS & CO.
CREDIT SUISSE
D.A. DAVIDSON & CO.
, 2007

| | Page | |
|---|---|---|
| Summary | 1 | |
| Risk Factors | 9 | |
| Special Note Regarding Forward-Looking Statements | ||
| Use of Proceeds | ||
| Industry and Market Data | 19 | |
| Dividend Policy | 19 | |
| Capitalization | 20 | |
| Dilution | ||
| Selected Consolidated Financial Data | ||
| Management's Discussion and Analysis of Financial Condition and Results of Operations | ||
| Business | ||
| Management | ||
| Executive Compensation | ||
| Certain Relationships and Related Transactions | ||
| Principal and Selling Stockholders | ||
| Description of Capital Stock | ||
| United States Federal Income Tax Consequences to Non-U.S. Holders | ||
| Shares Eligible for Future Sale | ||
| Underwriters | ||
| Legal Matters | ||
| Experts | ||
| Where You Can Find Additional Information | ||
| Index to Consolidated Financial Statements | F-1 |
You should rely only on the information contained in this prospectus or any related free writing prospectus we may authorize to be delivered to you. We have not, and the underwriters have not, authorized anyone to provide you with information different from, or in addition to, that contained in this prospectus or any related free writing prospectus. If anyone provides you with different or inconsistent information, you should not rely on it. We are offering to sell, and are seeking offers to buy, shares of common stock only in jurisdictions where offers and sales are permitted. The information contained in this prospectus or any related free writing prospectus is accurate only as of its date, regardless of its time of delivery, or of any sale of the common stock. Our business, financial conditions, results of operations and prospects may have changed since that date.
Through and including , 2007 (25 days after the date of this prospectus), all dealers that buy, sell or trade our common stock, whether or not participating in this offering, may be required to deliver a prospectus. This delivery requirement is in addition to the obligation of dealers to deliver a prospectus when acting as underwriters and with respect to their unsold allotments or subscriptions.
For investors outside of the United States: Neither we nor any of the underwriters have done anything that would permit this offering or possession or distribution of this prospectus in any jurisdiction where action for that purpose is required, other than in the United States. You are required to inform yourselves about and to observe any restrictions relating to this offering and the distribution of this prospectus.
i
This summary highlights information contained elsewhere in this prospectus and does not contain all of the information you should consider before buying shares in this offering. You should read the entire prospectus carefully, especially the information under "Risk Factors." References in this prospectus to "AECOM," "the Company," "we," "us" or "our" refer to AECOM Technology Corporation and its consolidated subsidiaries, unless we indicate otherwise.
Unless otherwise noted, references to years are for fiscal years. Our fiscal year consists of 52 or 53 weeks, ending on the Friday closest to September 30. Our fiscal quarters end on the Friday closest to December 31, March 31, June 30 and September 30. For clarity of presentation, we refer to all fiscal years and fiscal quarters in this prospectus as ending on September 30, December 31, March 31 or June 30, regardless of the actual date.
Our Company
We are a leading global provider of professional technical and management support services to government and commercial clients on all seven continents. We provide planning, consulting, architectural and engineering design, and program and construction management services for a broad range of projects, including highways, airports, bridges, mass transit systems, government and commercial buildings, and water and wastewater facilities.facilities and power transmission and distribution. We also provide facilities management, training, logistics and other support services, primarily for agencies of the United States government.
Through our approximately 28,000more than 30,000 employees in over 60 countries, we provide our services to a number of end markets, with particular strength in the transportation, facilities, also referred to as general building, and environmental markets. With over 60% of our employees operating outside the United States, we believe we are well positioned to grow both in the United States and internationally. According toEngineering News-Record's (ENR) 20062007 Design Survey, we are the largest general architectural and engineering design firm in the world, ranked by 20052006 design revenue. In addition, we are ranked by ENR as the leading firm in a number of design end markets, including transportation and general building.
We are led by an experienced management team with a proven record of delivering growth in revenue and profits. Over the last five10 fiscal years, we have grown our revenue from $1.7$0.7 billion to $3.4 billion, reflecting a compound annual growth rate, or CAGR, of 20.0%. Furthermore, over the last five fiscal years, we have doubled our revenue from $1.7 billion to $3.4 billion, reflecting a CAGR of 18.3%. In that same five year period, our net income increased from $23.1 million to $53.7 million, reflecting a CAGR of 23.5%. Our revenue for the first quarter of fiscal 2007 grew 25.7% to $938.5 million, compared to $746.8 million for the same period last year. Over the past 10 years, we have enhanced our organic growth with the successful acquisition and integration of more than 30 complementary businesses. These acquisitions have enabled us to expand our professional service offerings, end market coverage and geographic presence. As of DecemberMarch 31, 2006,2007, we had a total backlog of $2.9$3.1 billion compared to $2.5$2.6 billion at DecemberMarch 31, 2005,2006, a 15.0%21.1% increase.
The following two charts illustrate the diversification of our fiscal 2006 revenue by client type and geography.
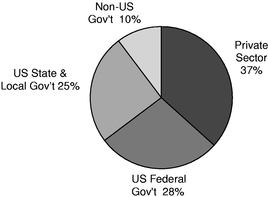 | 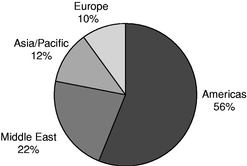 |
We offer our broad range of services through two business segments: Professional Technical Services and Management Support Services.
Professional Technical Services (PTS). Our PTS segment delivers planning, consulting, architectural and engineering design, and program and construction management services to government, institutional and commercial clients worldwide in end markets such as transportation, facilities, environmental—including water, wastewater and environmental management—and energy/power. We provide services in connection with some of the largest and most complex projects in the world. Our PTS segment contributed $2.8 billion, or 81.0%, of our revenue in fiscal 2006, which represents an
increase of 33.1% over fiscal 2005 PTS revenue. The following table highlights our principal PTS end markets along with a list of representative projects:
| End Market | Approximate Percentage of Fiscal 2006 PTS Segment Revenue (%) | Representative Projects | Project Locations | |||
|---|---|---|---|---|---|---|
| Transportation | • Second Avenue Subway • Sydney Orbital Bypass • Sutong Bridge • John F. Kennedy Airport | U.S. Australia China U.S. | ||||
| • 2012 London Olympics • Pentagon Renovation • British Broadcasting Company Headquarters • Los Alamos National Laboratory | U.K. U.S. U.K. U.S. | |||||
| Environmental | • Harbor Area Treatment Scheme • Chicago Calumet and Stickney Wastewater Treatment Plants • New York City Bowery Bay | Hong Kong U.S. U.S. | ||||
| Energy/Power | 4 | • Mutnovsky Independent Power Project • NY Public Schools Coal Conversion Project • Southern Provincial Rural Electrification Project | Russia U.S. Laos | |||
The following two charts illustrate the diversification of our PTS revenue for the first quarter of fiscal 2007, ended December 31, 2006, by client type and geography.
| First Quarter Fiscal 2007 Revenue by Client Type | First Quarter Fiscal 2007 Revenue by Geography | |
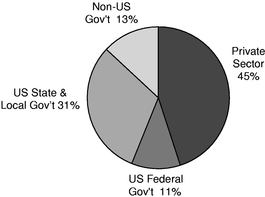 | 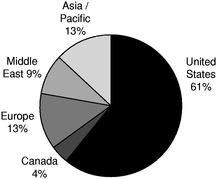 |
Management Support Services (MSS). Our MSS segment provides facilities management and maintenance, training, logistics, consulting, technical assistance and systems integration services, primarily for agencies of the U.S. government. We have over 9,000 employees managing projects for
over 400 contract-specific job sites for U.S. government clients such as the Department of Defense, Department of Energy and the Department of Homeland Security. Our MSS segment contributed $647 million, or 18.9% of our revenue in fiscal 2006, representing an increase of 109.4% over fiscal 2005 MSS revenue. The following table highlights representative projects in our MSS segment:
| Representative Projects | Project Locations | Clients | ||
|---|---|---|---|---|
| • Nevada Test Site | U.S. | U.S. Dept. of Energy | ||
| • Camp | Kuwait | U.S. Dept. of Defense | ||
| • Fort Polk Training Center | U.S. | U.S. Dept. of Defense | ||
| • International Civilian Police (CIVPOL) | Various worldwide | U.S. Dept. of State |
Our Market Opportunity
According to ENR, the top 500 design firms in the United States, ranked by revenue, generated revenue of approximately $59.8$69.6 billion in 2005, an 11.8%2006, a 17.5% increase over 2004.2005. The top five design firms, which includes us, accounted for 21% of this $69.6 billion market. Our core end markets, namely transportation, facilities, environmental, energy/power and government services, are anticipated to continue to grow, due to the following significant market trends:
The global market for our services is highly fragmented, with thousands of providers. While many of these providers focus on regional niche markets, we believe that clients are increasingly seeking out larger firms such as us that can meet their needs around the world by providing a diverse array of services. This is contributing to a consolidation trend in this market, particularly among mid-size firms without notable technical niche specialties. Furthermore, our client base is becoming increasingly reliant on professional technical services or management support services that are either not readily available from internal resources or are not among their core competencies, or both.
With our broad service offerings, end market coverage and geographic presence, we believe we are well positioned to capitalize on these favorable trends. Furthermore, we believe the industry consolidation trend will allow us to continue to advance our market leadership positions by selectively adding successful firms that are seeking a global platform for their services.
Our Competitive Strengths
We believe we have the experience, relationships, technical expertise and personnel to lead our clients through their most complicated and critical technical undertakings while also delivering the level of consistent, quality service necessary to maintain long-term relationships and secure repeat engagements. Our key competitive strengths include:
We have leadershipLeadership positions in large, growing markets. Based on ENR's rankings of firms by 20052006 revenue, we are ranked number one in two of our core end markets, transportation and general
building. We also have leadership positions based upon ENR's most recent available rankings by 2005 revenue in many key specialty technical areas within our core end markets, including:including being ranked first in mass transit, airports, highways, educational facilities, government offices and transmission and distribution.
| Transportation | General Building | Environmental | ||||||||
|---|---|---|---|---|---|---|---|---|---|---|
| | Ranking | | Ranking | | Ranking | |||||
| Mass Transit and Rail | 1 | Educational Facilities | 1 | Wastewater Treatment | 2 | |||||
| Airports | 1 | Government Offices | 1 | Sanitary and Storm Sewers | 2 | |||||
| Marine and Ports | 1 | Correctional Facilities | 1 | Sewerage and Solid Waste | 2 | |||||
| Highways | 1 | Hotels/Convention Centers | 3 | Water Supply | 4 | |||||
| Bridges | 2 | Commercial Offices | 4 | Clean Air Compliance | 4 | |||||
We are also ranked number one inNew Civil Engineer's 2006 global listing (by 2005 fees) in the areas of water, buildings and roads and number two in waste and rail.
We are diversifiedDiversification across service lines, end markets and geographies. We perform a broad range of services in over 60 countries for our clients, from planning and design to construction and project management and logistics.clients. In addition, our 25 largest projects by gross profit in fiscal 2006 accounted for only 14% of our consolidated gross profit. We believe this diversification enables us, to respond to and take advantage of changing business, technological and economic conditions worldwide, and allows usamong other things, to better manage our business through market cycles. We further believe we are well-positioned in geographic areas with favorable growth prospects such as China/Hong Kong and the United Arab Emirates, where we are among the largest engineering design firms. This diversification has been a key factor in our historical growth and positions us for future growth.
We combine globalGlobal reach with local presence. We combine local market knowledge and relationships with the technical expertise, scale, experience and resources of one of the world's largest global professional technical and support services firms. We believe that our ability to share capabilities and best practices across the firm delivers significant value to our clients and enables us to win and efficiently execute projects worldwide.
We have strongStrong and long-standing client relationships. We have developed strong and long-term relationships with a number of government entities and large corporations worldwide.worldwide that lead to repeat business. For example, we have provided services for over 30 years to clients such as the Illinois State Tollway Authority, U.S. Navy, Massachusetts Water Resources Authority and Port Authority of New York and New Jersey. We believe that these types of long-term relationships enable us to better understand and be more responsive to our clients' needs, which leads to repeat business and opportunities to expand the scope of services we provide to our clients.
We have a successfulSuccessful history of executing and integrating mergers and acquisitions. We believe one of our core competencies is successfully identifying, executing and integrating acquisition opportunities. We have consummated more than 30 mergers and acquisitions since 1998 that have enabled us to expand our end markets, service offerings and geographic reach. This acquisition activity has provided us with access to new markets at lower risk and faster speed relative to our entering the markets as a new participant. We have targeted, and we will continue to target, firms that enable us to add backlog, long-term client relationships and experienced executives who can provide leadership across our company. In addition, we derive our acquisition synergies throughby "cross selling" the capabilities of our newly acquired companies to our existing clients and our global capabilities to the clients of our newly acquired companies.
We benefit from our experiencedExperienced management team and employees. Our Chief Executive Officer and the 10 most senior members of our operating units have an average of more than 20 years of experience with us and more than 25 years in our industry. We also have a large, experienced and skilled workforce. This humanHuman capital is essential in winning the most attractive workcritical to success in our industry.
Risks Affecting Our Business
Our business is subject to numerous risks, as discussed more fully in the section entitled "Risk Factors" beginning on page 9 of this prospectus. In turn,particular:
The foregoing factors, as well as others described in "Risk Factors," could adversely affect the value of your investment in our common stock.
Our Growth Strategy
We intend to grow our business by leveraging our competitive strengths and leadership positions in our core markets while opportunistically entering new markets and geographies. Key elements of our growth strategy include:
Expand our long-standing client relationships and provide our clients with a broad range of services. We have long-standing relationships with a number of governmental agencies, large corporations and public and private institutions worldwide. We will continue to focus on client satisfaction along with opportunities to sell a greater range of services to clients and deliver full-service solutions for their needs. For example, as we have grown our environmental business, we have provided environmental services for transportation and other infrastructure projects in which such services have in the past been subcontracted to third parties.
Capitalize on growth opportunities in our core markets. Our core end markets, including transportation, general buildingfacilities and environmental, are expected to continue to grow. We intend to build on our leading positions in these markets to increase our market share. With our track record and our global resources, we believe we are well positioned to win projects in these core markets. We believe that the need for infrastructure upgrades, environmental management and increased government spending and outsourcing of support services, among other things, will result in continued growth opportunities in our core markets.
Continue to pursue our merger and acquisition strategy. We intend to continue to attract other successful companies whose growth can be enhanced by joining us. This approach has served us well as we have strengthened and diversified our leadership positions both geographically, technically and across end markets. We believe that the trend towards consolidation in our industry will continue to produce attractive candidates that align with our merger and acquisition strategy. For example, we significantly strengthened our presence in the fast-growing market in the United Arab Emirates with the addition of Cansult Limited in September 2006.
Strengthen and support human capital. Our experienced employees and management are our most valued resources. Attracting and retaining key personnel have been and will remain critical to our success. We will continue to focus on providing our personnel with training and other personal and professional growth opportunities, performance-based incentives, opportunities for stock ownership and other competitive benefits in order to strengthen and support our human capital base. During fiscal 2006, we expanded our multi-year employee engagement initiative to focus more intensely on this critical objective.
Corporate Information
We were formed in 1980 as Ashland Technology Corporation, a Delaware corporation and a wholly owned subsidiary of Ashland Inc., an oil and gas refining and distribution company. Since becoming independent of Ashland Inc. in 1990, we have grown by combination of organic growth and strategic mergers and acquisitions from approximately 3,300 employees and $363$387 million in revenue in fiscal 1991, the first full fiscal year of operations, to approximately 27,30030,200 employees at March 31, 2007 and $3.4 billion in revenue for fiscal 2006. Several of the operating companies within AECOM have histories going back more than 50 years. Our principal executive offices are located at 555 South Flower Street, 37th Floor, Los Angeles, California 90071 and our telephone number is (213) 593-8000. Our website is located at www.aecom.com. The information contained on our website is not a part of this prospectus.
The Offering
| Common stock offered | |||
| By AECOM | 19,888,797 shares | ||
| By the selling stockholders | 15,261,203 shares | ||
| Total | 35,150,000 shares | ||
Common stock to be outstanding after this offering | 92,335,201 shares | ||
Over-allotment option | 5,272,500 shares | ||
Net Proceeds | We expect the net proceeds to us from this offering to be $355.2 million ($449.4 million if the underwriters exercise their over-allotment option), after deducting underwriting discounts and commissions payable to the underwriters and our estimated offering expenses, based upon an assumed initial public offering price of $19.00 per share, which is the mid-point of the offering range indicated on the cover of this prospectus, and an assumed $1.14 per share in underwriting discounts and commissions. We will not receive any proceeds from the sale of shares by the selling stockholders. | ||
Use of proceeds | To repay borrowings under our credit facilities and our outstanding 83/8% senior notes due 2012, allow employees under our stock purchase plan to diversify their holdings and use the remaining proceeds for general corporate purposes, including possible future acquisitions. We will not receive any of the proceeds from the sale of shares by the selling stockholders. See "Use of Proceeds" for additional information. | ||
Dividends | We do not anticipate paying any cash dividends in the foreseeable future. | ||
ACM | |||
Common Stock to be outstanding after this offering does not include at December 31, 2006:include:
Except as otherwise indicated, all of the information in this prospectus assumes:
Summary Consolidated Financial Data
You should read the summary consolidated financial data presented below together with "Selected Consolidated Financial Data," "Management's Discussion and Analysis of Financial Condition and Results of Operations" and our audited consolidated financial statements, unaudited condensed consolidated financial statements and the related notes included elsewhere in this prospectus. The summary consolidated financial data presented below under "Consolidated Statement of Income Data" for the years ended September 30, 2006, 2005 and 2004 have been derived from our audited consolidated financial statements included elsewhere in this prospectus. We derived the consolidated statement of income data for each of the years ended September 30, 2003 and 2002 and the consolidated balance sheet data as of September 30, 2004, 2003 and 2002 from our audited consolidated financial statements not included in this prospectus.
The summary consolidated financial data presented below under "Consolidated Statement of Income Data" for the threesix months ended DecemberMarch 31, 2006 and 20052007 and "Consolidated Balance Sheet Data" as of DecemberMarch 31, 20062007 have been derived from our unaudited condensed consolidated financial statements that are included elsewhere in this prospectus and have been prepared on the same basis as our audited consolidated financial statements. In the opinion of management, the unaudited condensed consolidated financial statements reflect all adjustments, consisting only of normal and recurring adjustments, necessary to state fairly our results of operations for and as of the periods presented. The results for any interim period are not necessarily indicative of the results that may be expected for a full year.
| | | Year Ended September 30, | Three Months Ended December 31, | | Year Ended September 30, | Six Months Ended March 31, | ||||||||||||||||||||||||||||||||||||||
|---|---|---|---|---|---|---|---|---|---|---|---|---|---|---|---|---|---|---|---|---|---|---|---|---|---|---|---|---|---|---|---|---|---|---|---|---|---|---|---|---|---|---|---|---|
| | | 2002 | 2003 | 2004 | 2005 | 2006 | 2005 | 2006 | | 2002 | 2003 | 2004 | 2005 | 2006 | 2006 | 2007 | ||||||||||||||||||||||||||||
| | | (in millions, except share and per share data) | | (in millions, except share and per share data) | ||||||||||||||||||||||||||||||||||||||||
| Consolidated Statement of Income Data: | Consolidated Statement of Income Data: | Consolidated Statement of Income Data: | ||||||||||||||||||||||||||||||||||||||||||
| Revenues | $ | 1,747 | $ | 1,915 | $ | 2,012 | $ | 2,395 | $ | 3,421 | $ | 747 | $ | 939 | ||||||||||||||||||||||||||||||
| Cost of revenues | 1,269 | 1,381 | 1,443 | 1,718 | 2,515 | 547 | 691 | |||||||||||||||||||||||||||||||||||||
| Revenue | Revenue | $ | 1,747 | $ | 1,915 | $ | 2,012 | $ | 2,395 | $ | 3,421 | $ | 1,606 | $ | 2,022 | |||||||||||||||||||||||||||||
| Cost of revenue | Cost of revenue | 1,269 | 1,381 | 1,443 | 1,718 | 2,515 | 1,177 | 1,490 | ||||||||||||||||||||||||||||||||||||
| Gross profit | Gross profit | 478 | 534 | 569 | 677 | 906 | 200 | 248 | Gross profit | 478 | 534 | 569 | 677 | 906 | 429 | 532 | ||||||||||||||||||||||||||||
| Equity in earnings of joint ventures | Equity in earnings of joint ventures | 1 | 2 | 3 | 2 | 7 | 2 | 1 | Equity in earnings of joint ventures | 1 | 2 | 3 | 2 | 7 | 3 | 4 | ||||||||||||||||||||||||||||
| General and administrative expenses | General and administrative expenses | 430 | 467 | 485 | 581 | 810 | 177 | 219 | General and administrative expenses | 430 | 467 | 485 | 581 | 810 | 382 | 468 | ||||||||||||||||||||||||||||
| Income from operations | Income from operations | 49 | 69 | 87 | 98 | 103 | 25 | 30 | Income from operations | 49 | 69 | 87 | 98 | 103 | 50 | 68 | ||||||||||||||||||||||||||||
| Minority interest share of earnings | Minority interest share of earnings | 3 | 3 | 3 | 8 | 14 | 2 | 1 | Minority interest share of earnings | 3 | 3 | 3 | 8 | 14 | 5 | 5 | ||||||||||||||||||||||||||||
| Gain on the sale of equity investment | Gain on the sale of equity investment | — | — | — | — | — | — | 11 | Gain on the sale of equity investment | — | — | — | — | — | — | 11 | ||||||||||||||||||||||||||||
| Interest expense—net | Interest expense—net | 12 | 10 | 8 | 7 | 10 | 4 | 1 | Interest expense—net | 12 | 10 | 8 | 7 | 10 | 8 | 3 | ||||||||||||||||||||||||||||
| Income before income tax expense | Income before income tax expense | 34 | 56 | 76 | 83 | 79 | 19 | 39 | Income before income tax expense | 34 | 56 | 76 | 83 | 79 | 37 | 71 | ||||||||||||||||||||||||||||
| Income tax expense | Income tax expense | 11 | 19 | 26 | 29 | 25 | 6 | 13 | Income tax expense | 11 | 19 | 26 | 29 | 25 | 12 | 24 | ||||||||||||||||||||||||||||
| Net income | Net income | $ | 23 | $ | 37 | $ | 50 | $ | 54 | $ | 54 | $ | 13 | $ | 26 | Net income | $ | 23 | $ | 37 | $ | 50 | $ | 54 | $ | 54 | $ | 25 | $ | 47 | ||||||||||||||
Net income allocation: | Net income allocation: | Net income allocation: | ||||||||||||||||||||||||||||||||||||||||||
| Preferred stock dividend | $ | — | $ | 2 | $ | 5 | $ | 6 | $ | 2 | $ | 1 | $ | — | Preferred stock dividend | $ | — | $ | 2 | $ | 5 | $ | 6 | $ | 2 | $ | 2 | $ | — | |||||||||||||||
| Net income available for common stockholders | 23 | 35 | 45 | 48 | 52 | 12 | 26 | Net income available for common stockholders | 23 | 35 | 45 | 48 | 52 | 23 | 47 | |||||||||||||||||||||||||||||
| Net income | $ | 23 | $ | 37 | $ | 50 | $ | 54 | $ | 54 | $ | 13 | $ | 26 | Net income | $ | 23 | $ | 37 | $ | 50 | $ | 54 | $ | 54 | $ | 25 | $ | 47 | |||||||||||||||
Earnings per share available for common stockholders: | Earnings per share available for common stockholders: | Earnings per share available for common stockholders: | ||||||||||||||||||||||||||||||||||||||||||
| Basic | $ | 0.89 | $ | 1.34 | $ | 1.71 | $ | 1.86 | $ | 1.88 | $ | 0.43 | $ | 0.89 | Basic | $ | 0.45 | $ | 0.67 | $ | 0.86 | $ | 0.93 | $ | 0.94 | $ | 0.43 | $ | 0.82 | |||||||||||||||
| Diluted | $ | 0.86 | $ | 1.29 | $ | 1.57 | $ | 1.68 | $ | 1.48 | $ | 0.40 | $ | 0.65 | Diluted | $ | 0.43 | $ | 0.65 | $ | 0.78 | $ | 0.84 | $ | 0.74 | $ | 0.37 | $ | 0.60 | |||||||||||||||
Weighted average shares outstanding (in thousands): | Weighted average shares outstanding (in thousands): | Weighted average shares outstanding (in thousands): | ||||||||||||||||||||||||||||||||||||||||||
| Basic | 25,815 | 26,429 | 26,300 | 25,940 | 27,428 | 26,644 | 28,800 | Basic | 51,630 | 52,858 | 52,600 | 51,880 | 54,856 | 53,482 | 56,965 | |||||||||||||||||||||||||||||
| Diluted | 27,001 | 28,589 | 32,127 | 31,989 | 36,329 | 32,612 | 39,518 | Diluted | 54,002 | 57,178 | 64,254 | 63,978 | 72,658 | 67,765 | 78,500 | |||||||||||||||||||||||||||||
| | Year Ended or as of September 30, | Three Months Ended or as of December 31, | |||||||||||||||||||
|---|---|---|---|---|---|---|---|---|---|---|---|---|---|---|---|---|---|---|---|---|---|
| | 2002 | 2003 | 2004 | 2005 | 2006 | 2005 | 2006 | ||||||||||||||
| | (in millions, except employee data) | ||||||||||||||||||||
| Other Data: | |||||||||||||||||||||
| Depreciation and amortization | $ | 23 | $ | 13 | $ | 13 | $ | 20 | $ | 40 | $ | 9 | $ | 7 | |||||||
| Amortization expense of acquired intangible assets | — | — | — | 3 | 15 | 3 | 1 | ||||||||||||||
| Capital expenditures | 20 | 14 | 19 | 31 | 32 | 7 | 10 | ||||||||||||||
| Backlog | 1,710 | 1,660 | 1,620 | 2,000 | 2,500 | 2,480 | 2,851 | ||||||||||||||
| Number of full-time and part-time employees | 15,500 | 16,800 | 17,700 | 22,000 | 27,300 | 24,200 | 28,500 | ||||||||||||||
| | As of September 30, | As of December 31, | ||||||||||||||||||||||
|---|---|---|---|---|---|---|---|---|---|---|---|---|---|---|---|---|---|---|---|---|---|---|---|---|
| | 2002 | 2003 | 2004 | 2005 | 2006 | 2005 | 2006 | 2006 | ||||||||||||||||
| | (in millions, except employee data) | Actual | Pro Forma, as adjusted | |||||||||||||||||||||
| Consolidated Balance Sheet Data: | ||||||||||||||||||||||||
| Cash and cash equivalents | $ | 28 | $ | 120 | $ | 121 | $ | 54 | $ | 128 | $ | 67 | $ | 138 | ||||||||||
| Working capital | 113 | 213 | 225 | 171 | 201 | 224 | 178 | |||||||||||||||||
| Total assets | 965 | 1,056 | 1,115 | 1,425 | 1,826 | 1,585 | 1,879 | |||||||||||||||||
| Long-term debt excluding current portion | 171 | 122 | 105 | 216 | 123 | 313 | 104 | |||||||||||||||||
| Redeemable preferred and common stock and stock units, net of notes receivable | 378 | 547 | 576 | 661 | 970 | 668 | 1,014 | |||||||||||||||||
| Stockholders' (deficit) equity | (108 | ) | (181 | ) | (159 | ) | (240 | ) | (291 | ) | (237 | ) | (324 | ) | ||||||||||
| | Year Ended or as of September 30, | Six Months Ended or as of March 31, | |||||||||||||||||||
|---|---|---|---|---|---|---|---|---|---|---|---|---|---|---|---|---|---|---|---|---|---|
| | 2002 | 2003 | 2004 | 2005 | 2006 | 2006 | 2007 | ||||||||||||||
| | (in millions, except employee data) | ||||||||||||||||||||
| Other Data: | |||||||||||||||||||||
| Depreciation and amortization | $ | 23 | $ | 13 | $ | 13 | $ | 20 | $ | 40 | $ | 18 | $ | 19 | |||||||
| Amortization expense of acquired intangible assets(2) | — | — | — | 3 | 15 | 6 | 6 | ||||||||||||||
| Capital expenditures | 20 | 14 | 19 | 31 | 32 | 13 | 19 | ||||||||||||||
| Backlog | 1,710 | 1,660 | 1,620 | 1,980 | 2,480 | 2,585 | 3,131 | ||||||||||||||
| Number of full-time and part-time employees | 15,500 | 16,800 | 17,700 | 22,000 | 27,300 | 24,800 | 30,200 | ||||||||||||||
| | As of September 30, | As of March 31, | ||||||||||||||||||||
|---|---|---|---|---|---|---|---|---|---|---|---|---|---|---|---|---|---|---|---|---|---|---|
| | 2002 | 2003 | 2004 | 2005 | 2006 | 2007 | 2007 | |||||||||||||||
| | (in millions) | Pro Forma, as adjusted | ||||||||||||||||||||
| | | | | | | Actual | ||||||||||||||||
| Consolidated Balance Sheet Data: | ||||||||||||||||||||||
| Cash and cash equivalents | $ | 28 | $ | 120 | $ | 121 | $ | 54 | $ | 128 | $ | 116 | $ | 326 | ||||||||
| Working capital | 113 | 213 | 225 | 171 | 201 | 185 | 434 | (1) | ||||||||||||||
| Total assets | 965 | 1,056 | 1,115 | 1,425 | 1,826 | 2,076 | 2,088 | |||||||||||||||
| Long-term debt excluding current portion | 171 | 122 | 105 | 216 | 123 | 153 | 11 | |||||||||||||||
| Redeemable preferred and common stock and stock units, net of notes receivable | 378 | 547 | 576 | 661 | 970 | 1,068 | — | |||||||||||||||
| Stockholders' (deficit) equity | (108 | ) | (181 | ) | (159 | ) | (240 | ) | (291 | ) | (298 | ) | 1,116 | |||||||||
Investing in our common stock involves a high degree of risk. You should carefully consider the risks described below and the other information in this prospectus, including our financial statements and the related notes, before making a decision to buy our common stock. If any of the following risks actually occurs, our business could be harmed. In that case, the trading price of our common stock could decline, and you may lose all or part of your investment.
Risks Relating to Our Business and Industry
We depend on long-term government contracts, some of which are only funded on an annual basis. If appropriations for funding are not made in subsequent years of a multiple-year contract, we may not be able to realize all of our anticipated revenuesrevenue and profits from that project.
A substantial majority of our revenues arerevenue is derived from contracts with agencies and departments of national, state and local governments. During fiscal 2004, 2005 and 2006, approximately 76%, 75% and 63%, respectively, of our revenues wererevenue was derived from contracts with government entities.
Most government contracts are subject to the government's budgetary approval process. Legislatures typically appropriate funds for a given program on a year-by-year basis, even though contract performance may take more than one year. As a result, at the beginning of a program, the related contract is only partially funded, and additional funding is normally committed only as appropriations are made in each subsequent fiscal year. These appropriations, and the timing of payment of appropriated amounts, may be influenced by, among other things, the state of the economy, competing priorities for appropriation, changes in administration or control of legislatures and the timing and amount of tax receipts and the overall level of government expenditures. If appropriations are not made in subsequent years on our government contracts, then we will not realize all of our potential revenue and profit from that contract.
For instance, a significant portion of historical funding for state and local transportation projects has come from the U.S. federal government through its "SAFETEA-LU" infrastructure funding program and predecessor programs. This $286 billion program covers federal fiscal years 2004-2009. Approximately 79% of the SAFETEA-LU funding is for highway programs, 18.5% is for transit programs and 2.5% is for other programs such as motor carrier safety, national highway traffic safety and research. A key uncertainty in the outlook for federal transportation funding in the U.S. is the future viability of the Highway Trust Fund. The Highway Account within the Highway Trust Fund could have a negative balance as soon as 2009, based on the Department of Treasury projections of receipts and Department of Transportation projections of outlays. This raises concerns about whether funding for federal highway programs authorized by SAFETEA-LU will be met in future years.
Governmental agencies may modify, curtail or terminate our contracts at any time prior to their completion and, if we do not replace them, we may suffer a decline in revenues.revenue.
Most government contracts maybe modified, curtailed or terminated by the government either at its convenience or upon the default of the contractor. If the government terminates a contract at its convenience, then we typically are able to recover only costs incurred or committed, settlement expenses and profit on work completed prior to termination, which could prevent us from recognizing all of our potential revenuesrevenue and profits from that contract. If the government terminates the contract due to our default, we could be liable for excess costs incurred by the government in obtaining services from another source.
A delay in the completion of the budget process of the U.S. government could delay procurement of our services and have an adverse effect on our future revenues.revenue.
In years when the U.S. government does not complete its budget process before the end of its fiscal year on September 30, government operations are typically funded pursuant to a "continuing resolution" that authorizes agencies of the U.S. government to continue to operate, but does not authorize new spending initiatives. When the U.S. government operates under a continuing resolution, government agencies may delay the procurement of services, which could reduce our future revenues.revenue.
Our contracts with governmental agencies are subject to audit, which could result in adjustments to reimbursable contract costs or, if we are charged with wrongdoing, possible temporary or permanent suspension from participating in government programs.
Our books and records are subject to audit by the various governmental agencies we serve and their representatives. These audits can result in adjustments to the amount of contract costs we believe are reimbursable by the agencies and the amount of our overhead costs allocated to the agencies. In addition, if one of our subsidiaries is charged with wrongdoing as a result of an audit, that subsidiary, and possibly our company as a whole, could be temporarily suspended or could be prohibited from bidding on and receiving future government contracts for a period of time. Furthermore, as a government contractor, we are subject to an increased risk of investigations, criminal prosecution, civil fraud, whistleblower lawsuits and other legal actions and liabilities to which purely private sector companies are not, the results of which could harm our business.
Our business and operating results could be adversely affected by losses under fixed-price contracts.
Fixed-price contracts require us to either perform all work under the contract for a specified lump-sum or to perform an estimated number of units of work at an agreed price per unit, with the total payment determined by the actual number of units performed. In fiscal 2006, approximately one-third of our revenues wererevenue was recognized under fixed-price contracts. Fixed-price contracts expose us to a number of risks not inherent in cost-plus and time and material contracts, including underestimation of costs, ambiguities in specifications, unforeseen costs or difficulties, problems with new technologies, delays beyond our control, failures of subcontractors to perform and economic or other changes that may occur during the contract period. Losses under fixed-price construction contracts could be substantial and harm our results of operations.
We conduct a portion of our operations through joint venture entities, over which we may have limited control.
Approximately 24% of our fiscal 2006 revenue was derived from our operations through joint ventures or similar partner arrangements, where control may be shared with unaffiliated third parties. As with most joint venture arrangements, differences in views among the joint venture participants may result in delayed decisions or disputes. We also cannot control the actions of our joint venture partners, and we typically have joint and several liability with our joint venture partners under the applicable contracts for joint venture projects. These factors could potentially harm the business and operations of a joint venture and, in turn, our business and operations.
Operating through joint ventures in which we are minority holders results in us having limited control over many decisions made with respect to projects and internal controls relating to projects. Approximately 7% of our fiscal 2006 revenue was derived from our unconsolidated joint ventures where we generally do not have control of the entities. These joint ventures may not be subject to the same requirements regarding internal controls and internal control over financial reporting that we follow. As a result, internal control problems may arise with respect to the joint ventures, which could have a material adverse effect on our financial condition and results of operations.
Misconduct by our employees or consultants or our failure to comply with laws or regulations applicable to our business could cause us to lose customers or lose our ability to contract with government agencies.
As a government contractor, misconduct, fraud or other improper activities by our employees or consultants failure to comply with laws or regulations could have a significant negative impact on our business and reputation. Such misconduct could include the failure to comply with federal procurement regulations, regulations regarding the protection of classified information, legislation regarding the pricing of labor and other costs in government contracts, regulations on lobbying or similar activities, and any other applicable laws or regulations. Our failure to comply with applicable laws or regulations or misconduct by any of our employees or consultants could subject us to fines and penalties, loss of security clearance, cancellation of contracts and suspension or debarment from contracting with government agencies, any of which may adversely affect our business.
Our defined benefit plans currently have significant deficits that could grow in the future and cause us to incur additional costs.
We have defined benefit pension plans for employees in the United States, United Kingdom and Australia. At September 30, 2006, our defined benefit pension plans had an aggregate deficit (the excess of projected benefit obligations over the fair value of plan assets) of $117.2 million. At September 30, 2006, the excess of accumulated benefit obligations over the fair value of plan assets was $84.8 million. In the future, our pension deficits may increase or decrease depending on changes in the levels of interest rates, pension plan performance and other factors. If we are forced or elect to make up all or a portion of the deficit for unfunded benefit plans, our profits could be materially and adversely affected.
Our operations worldwide expose us to legal, political and economic risks in different countries as well as currency exchange rate fluctuations that could harm our business and financial results.
During fiscal 2006, revenuesrevenue attributable to our services provided outside of the United States werewas approximately 44% of our total revenue. Approximately 27% of our total fiscal 2006 revenue was contracted in non-U.S. dollar denominations. We expect the percentage of revenuesrevenue attributable to our non-U.S. operations to increase further as a result of our strategic focus in areas such as Eastern Europe, China and the Middle East. There are risks inherent in doing business internationally, including:
Any of these factors could have a material adverse effect on our business, results of operations or financial condition.
We work in international locations where there are high security risks, which could result in harm to our employees and contractors or material costs to us.
Some of our services are performed in high-risk locations, such as Iraq and Afghanistan, where the country or location is suffering from political, social or economic problems, or war or civil unrest. In those locations where we have employees or operations, we may incur material costs to maintain the safety of our personnel. Despite these precautions, the safety of our personnel in these locations may continue to be at risk, and we may suffer the loss of key employees and contractors, which could harm our business.
Failure to successfully execute our merger and acquisition strategy may inhibit our growth.
We have grown in part as a result of our mergers and acquisitions over the last several years, and we expect continued growth in the form of additional acquisitions and expansion into new markets. We cannot assure you that suitable mergers and acquisitions or investment opportunities will continue to be identified or that any of these transactions can be consummated on favorable terms or at all. Any future mergers and acquisitions will involve various inherent risks, such as:
Furthermore, during the mergers and acquisitions process and thereafter, our management may need to assume significant mergers and acquisitions related responsibilities, which may cause them to divert their attention from our existing operations. If our management is unable to successfully integrate acquired companies or implement our growth strategy, our operating results could be harmed. Moreover, we cannot assure you that we will continue to successfully expand or that growth or expansion will result in profitability.
Our ability to grow and to compete in our industry will be harmed if we do not retain the continued services of our key technical and management personnel and identify, hire and retain additional qualified personnel.
There is strong competition for qualified technical and management personnel in the sectors in which we compete. We may not be able to continue to attract and retain qualified technical and management personnel, such as engineers, architects and project managers, who are necessary for the development of our business or to replace qualified personnel. Our planned growth may place increased demands on our resources and will likely require the addition of technical and management personnel and the development of additional expertise by existing personnel. Also, some of our personnel hold security clearances required to obtain government projects; if we were to lose some or all of these personnel, they would be difficult to replace. Loss of the services of, or failure to recruit, key technical and management personnel could limit our ability to complete existing projects successfully and to compete for new projects.
Additionally, in the past, we have promoted our employee ownership culture as a competitive advantage in recruiting and retaining employees. Although we intend to retain the essential elements of an employee ownership culture and do not intend to change our core values and operating philosophy,
if our employees or recruits perceive that becoming a publicly-traded company will negatively impact our company culture, our ability to recruit and retain employees may be adversely impacted.
Our revenuesrevenue and growth prospects may be harmed if we or our employees are unable to obtain the security clearances or other qualifications we and they need to perform services for our customers.
A number of government programs require contractors to have security clearances. Depending on the level of required clearance, security clearances can be difficult and time-consuming to obtain. If we or our employees are unable to obtain or retain necessary security clearances, we may not be able to win new business, and our existing customers could terminate their contracts with us or decide not to renew them. To the extent we cannot obtain or maintain the required security clearances for our employees working on a particular contract, we may not derive the revenue anticipated from the contract.
Our industry is highly competitive and we may be unable to compete effectively, which could result in reduced revenue, profitability and market share.
We are engaged in a highly competitive business. The extent of competition varies with the types of services provided and the locations of the projects. Generally, we compete on the bases of technical and management capability, personnel qualifications and availability, geographic presence, experience and price. Increased competition may result in our inability to win bids for future projects and loss of revenue, profitability and market share.
Our services expose us to significant risks of liability and our insurance policies may not provide adequate coverage.
Our services involve significant risks of professional and other liabilities that may substantially exceed the fees that we derive from our services. In addition, we sometimes contractually assume liability under indemnification agreements. We cannot predict the magnitude of potential liabilities from the operation of our business.
Our professional liability policies cover only claims made during the term of the policy. Additionally, our insurance policies may not protect us against potential liability due to various exclusions in the policies and self-insured retention amounts. Partially or completely uninsured claims, if successful and of significant magnitude, could have a material adverse affect on our business.
Our backlog of uncompleted projects under contract is subject to unexpected adjustments and cancellations and thus, may not accurately reflect future revenuesrevenue and profits.
At DecemberMarch 31, 2006,2007, our backlog of uncompleted projects under contract was approximately $2.9$3.1 billion. We cannot guarantee that the revenuesrevenue attributed to uncompleted projects under contract will be realized or, if realized, will result in profits. Many projects may remain in our backlog for an extended period of time because of the size or long-term nature of the contract. In addition, from time to time projects are delayed, scaled back or cancelled. These types of backlog reductions adversely affect the revenuesrevenue and profits that we ultimately receive from contracts reflected in our backlog.
We have submitted claims to clients for work we performed beyond the scope of some of our contracts. If these clients do not approve these claims, our results of operations could be adversely impacted.
We typically have pending claims submitted under some of our contracts for payment of work performed beyond the initial contractual requirements for which we have already recorded revenues.revenue. In general, we cannot guarantee that such claims will be approved in whole, in part or at all. If these claims are not approved, our revenuesrevenue may be reduced in future periods.
In conducting our business, we depend on other contractors and subcontractors. If these parties fail to satisfy their obligations to us or other parties, or if we are unable to maintain these relationships, our revenues,revenue, profitability and growth prospects could be adversely affected.
We depend on contractors and subcontractors in conducting our business. There is a risk that we may have disputes with our subcontractors arising from, among other things, the quality and timeliness of work performed by the subcontractor, customer concerns about the subcontractor, or our failure to extend existing task orders or issue new task orders under a subcontract. In addition, if any of our subcontractors fail to deliver on a timely basis the agreed-upon supplies and/or perform the agreed-upon services, our ability to fulfill our obligations as a prime contractor may be jeopardized.
We also rely on relationships with other contractors when we act as their subcontractor or joint venture partner. Our future revenuesrevenue and growth prospects could be adversely affected if other contractors eliminate or reduce their subcontracts or joint venture relationships with us, or if a government agency terminates or reduces these other contractors' programs, does not award them new contracts or refuses to pay under a contract.
Systems and information technology interruption could adversely impact our ability to operate.
We rely heavily on computer, information and communications technology and related systems in order to properly operate. From time to time, we experience occasional system interruptions and delays. If we are unable to continually add software and hardware, effectively upgrade our systems and network infrastructure and take other steps to improve the efficiency of and protect our systems, systems operation could be interrupted or delayed. In addition, our computer and communications systems and operations could be damaged or interrupted by natural disasters, telecommunications failures, acts of war or terrorism, computer viruses, physical or electronic security breaches and similar events or disruptions. Any of these or other events could cause system interruption, delays and loss of critical data, could delay or prevent operations, and could adversely affect our operating results.
Risks Relating to this Offering and Our Common Stock
There has been no prior public market for our shares and an active market may not develop or be maintained, which could limit your ability to sell shares of our common stock.
Before this offering, there has not been a public market for our shares of common stock. Although we are applyingour common stock has been approved for listing on the New York Stock Exchange, an active public market for our shares may not develop or be sustained after this offering. The initial public offering price will be determined by negotiations between the underwriters and our board of directors and may not be representative of the market price at which our shares of common stock will trade after this offering. In particular, we cannot assure you that you will be able to resell our shares at or above the initial public offering price.
The value of our common stock could be volatile.
The overall market and the price of our common stock may fluctuate greatly. The trading price of our common stock may be significantly affected by various factors, including:
Our quarterly operating results may fluctuate significantly, which could have a negative effect on the price of our common stock.
Our quarterly revenues,revenue, expenses and operating results may fluctuate significantly because of a number of factors, including:
Variations in any of these factors could cause significant fluctuations in our operating results from quarter to quarter.quarter and could cause the price of our common stock to fluctuate and decline.
Our charter documents contain provisions that may delay, defer or prevent a change of control.
Provisions of our certificate of incorporation and bylaws could make it more difficult for a third party to acquire control of us, even if the change in control would be beneficial to stockholders. These provisions include the following:
Future sales of our common stock may lower our stock price.
If our existing stockholders sell a large number of shares of our common stock following this offering, the market price of our common stock could decline significantly. In addition, the perception in the public market that our existing stockholders might sell shares of common stock could depress the market price of our common stock, regardless of the actual plans of our existing stockholders. Immediately after this offering, approximately 92,335,201 shares of our common stock will be outstanding, or 97,607,701 if the underwriters' over-allotment option is exercised in full. Of these shares, approximately 40,252,191 shares will be available for immediate resale in the public market, including all of the shares in this offering, and 9,413,842 shares will be available for resale 90 days following completion of this offering, except those held by our "affiliates." Of the remaining shares outstanding, approximately 42,669,167 shares are subject to lock-up agreements restricting the sale of those shares for 180 days from the date of this prospectus. However, the underwriters may waive this restriction and allow the stockholders to sell their shares at any time.
After this offering, we intend to register approximatelyWe have registered 25,637,100 shares of common stock that are reserved for issuance upon exercise of options granted under our stock option plans. Once we registerUpon completion of this offering, these shares they can be sold in the public market upon issuance, subject to restrictions under the securities laws applicable to resales by affiliates.affiliates and applicable lock-up agreements.
Purchasers in this offering will experience immediate and substantial dilution in net tangible book value.
The initial public offering price per share is expected to be substantially higher than the net tangible book value per share of our outstanding common stock. Purchasers of shares in this offering will experience immediate dilution in the net tangible book value of their shares. Based on an assumed initial public offering price of $$19.00 per share, dilution per share in this offering will be $$14.16 per share (or %74.5% of the price). In addition, we have issued options to acquire 8,409,191 shares of our common stock at a weighted average exercise price of $$8.90 per share. To the extent these outstanding options are exercised, there will be further dilution to investors in this offering. Further, if we issue additional equity securities to raise additional capital, your ownership interest in our company may be diluted and the value of your investment may be reduced.
We do not expect to pay any cash dividends for the foreseeable future.
We do not anticipate paying any cash dividends to our stockholders for the foreseeable future. Our credit facilities also restrict our ability to pay dividends. Accordingly, you may have to sell some or all of your common stock in order to generate cash flow from your investment. You may not receive a gain on your investment when you sell our common stock and may lose some or all of the amount of your investment. Any determination to pay dividends in the future will be made at the discretion of our board of directors and will depend on our results of operations, financial conditions, contractual restrictions, restrictions imposed by applicable law and other factors our board of directors deems relevant.
We will incur increased costs as a result of being a publicly-traded company.
As a company with publicly-traded securities, we could incur significant legal, accounting and other expenses not presently incurred. In addition, the Sarbanes-Oxley Act of 2002, as well as rules promulgated by the U.S. Securities and Exchange Commission and the New York Stock Exchange, require us to adopt corporate governance practices applicable to U.S. public companies. These rules and regulations will increase our legal and financial compliance costs.
If we do not timely satisfy the requirements of Section 404 of the Sarbanes-Oxley Act of 2002, the trading price of our common stock could be adversely affected.
Section 404 of the Sarbanes-Oxley Act of 2002 requires us to document and test the effectiveness of our internal controls over financial reporting in accordance with an established internal control framework and to report on our conclusion as to the effectiveness of our internal controls. It also requires our independent registered public accounting firm to test our internal controls over financial reporting and report on the effectiveness of such controls as of September 30, 2008. Our independent registered public accounting firm is also required to test, evaluate and report on management's assessment of internal control. Any delays or difficulty in satisfying these requirements could cause some investors to lose confidence in, or otherwise be unable to rely on, the accuracy of our reported financial information, which could adversely affect the trading price of our common stock.
SPECIAL NOTE REGARDING FORWARD-LOOKING STATEMENTS
(Cautionary Statements Under the Private Securities Litigation Reform Act of 1995)
This prospectus contains statements which, to the extent that they do not recite historical fact, constitute "forward-looking statements" within the meaning of Section 27A of the Securities Act of 1933 and Section 21E of the Securities Exchange Act of 1934. The words "believe," "expect," "estimate," "may," "will," "could," "plan" or "continue" and similar expressions are intended to identify forward-looking statements. Such forward-looking information involves important risks and uncertainties that could materially alter results in the future from those expressed in any forward-looking statements made by us or on our behalf. These risks and uncertainties include, but are not limited to:
In addition, this prospectus contains industry data related to our business and the markets in which we operate. This data includes projections that are based on a number of assumptions. If these assumptions turn out to be incorrect, actual results could differ from the projections.
We caution you that forward-looking statements are only predictions and that actual events or results may differ materially. In evaluating these statements, you should specifically consider the various factors that could cause actual events or results to differ materially from those indicated by the forward-looking statements, including the factors that we discuss in the section entitled "Risk Factors."
We estimate that our net proceeds (after deducting underwriting discounts and commissions payable to the underwriters and our estimated offering expenses) from this offering will be $$355.2 million ($449.4 million if the underwriters exercise their option to acquire additional shares in full), based upon an assumed initial public offering price of $$19.00 per share, which is the mid-point of the offering range indicated on the cover of this prospectus.prospectus, and an assumed $1.14 per share in underwriting discounts and commissions, which is the mid-point of the range of the underwriting discounts and commissions we will pay of $1.09 per share to $1.19 per share, depending on the public offering price and subject to a performance increase payable at the discretion of the Company. We will not receive any proceeds from the sale of shares by the selling stockholders.
We expect to use approximately $$63.0 million (of which $50.0 million was outstanding as of March 31, 2007) of the net proceeds to repay amounts outstanding under our unsecured senior credit facility, which matures March 31, 2011, and currently bears interest at the Interbank Offered Rate plus %, or % per annum, at March 1, 2007.a weighted average interest rate of 6.80%. We also expect to use approximately $$57.0 million of the net proceeds to repay all our outstanding borrowings under our unsecured term credit agreement which matures September 22, 2011 and currently bears interest at a weighted average interest rate of 5.51%. Further, we expect to use approximately $39.0 million to repay all of our outstanding 83/8% senior notes due April 14, 2012 which includes principal, accrued interest and make-whole premiums.
We also expect to use $71.8 million of the net proceeds to fund elections made by employee participants in our stock purchase plan to diversify their holdings of plan units in connection with this offering. The diversification will be effected by our selling a make-whole premium.number of newly issued shares of common stock in this offering equal to the number of common stock units under the stock purchase plan that each employee has elected to diversify. The net proceeds from the sale of such shares will be delivered to a trust for the benefit of such employee's plan account and the plan account will be reduced by the corresponding number of stock units. Such net proceeds will be retained in the trust and will be invested to match the investment elections made by such employee. Since the plan units are currently included in our total shares outstanding and the number of newly issued shares equals the number of plan units deducted from employee plan accounts, this diversification has no net impact on our total shares outstanding.
We expect to use the remaining net proceeds to fund elections made by our employees under our stock purchase plan to diversify their holdings in connection with this offering, in an aggregate amount of approximately $ , and for general corporate purposes, which may include future acquisitions of businesses.acquisitions.
A $1.00 increase (decrease) in the assumed initial public offering price of $$19.00 per share would increase (decrease) the net proceeds to us from this offering by $$18.7 million, assuming the number of shares offered by us, as set forth on the cover page of this prospectus, remains the same and after deducting the estimated underwriting discounts and commissions and estimated expenses payable by us.
Until we use the net proceeds as described above, we intend to invest the net proceeds in short-term securities.
We obtained the market, demographic, competitive position and similar data used throughout this prospectus from our own research and from surveys or studies conducted by third parties and industry or general publications. We have also derived data regarding our competitors and customers from their press releases and other public filings. This market, demographic, competitive position and similar data include, among other things, statements regarding the global market for engineering, design and support services, our position in the relevant markets, including the transportation, facilities and environmental markets, and the historical and projected growth rate of our industry. While we believe that each of these surveys, studies and publications is reliable, we have not independently verified such data. Similarly, we believe our internal research is reliable, but it has not been verified by any independent sources.
We have not declared or paid any cash dividends on our common stock, and we do not anticipate doing so in the foreseeable future. We currently intend to retain future earnings, if any, to operate our business and finance future growth strategies. Our loan covenants require us to obtain the consent of the banks or the senior noteholders, as the case may be, prior to the payment of any cash dividends.
The following table sets forth our capitalization as of DecemberMarch 31, 20062007 on an actual basis and as adjusted to give effect to our sale of shares of common stock in this offering at an assumed initial offering price of $$19.00 per share and the application of the net proceeds from this offering as described under "Use of Proceeds." A $1.00 increase or decrease in the assumed public offering price of $$19.00 per share would increase or decrease each of additional paid-in capital, total stockholders' (deficit)/equity and total capitalization by approximately $$18.7 million, assuming the number of shares offered by us, as set forth on the cover page of this prospectus, remains the same and after deducting the estimated underwriting discount and estimated offering expenses payable by us.
| | | As of December 31, 2006 | | As of March 31, 2007 | |||||||||||||
|---|---|---|---|---|---|---|---|---|---|---|---|---|---|---|---|---|---|
| | | Actual | Pro Forma As Adjusted | | Actual | Pro Forma As Adjusted(3) | |||||||||||
| | | (in thousands, except share data) (unaudited) | | (in thousands, except share data) (unaudited) | |||||||||||||
| Cash and cash equivalents | Cash and cash equivalents | $ | 137,774 | $ | Cash and cash equivalents | $ | 116,264 | $ | 325,729 | ||||||||
| Share purchase liability | Share purchase liability | 56,634 | — | ||||||||||||||
| Debt: | Debt: | Debt: | |||||||||||||||
| Current portion of long-term debt | 23,626 | Current portion of long-term debt | 33,258 | 33,258 | |||||||||||||
| Long-term debt, less current portion | 104,115 | Long-term debt, less current portion | 153,118 | 11,118 | |||||||||||||
| Total debt | 127,741 | Total debt | 186,376 | 44,376 | |||||||||||||
Redeemable common and preferred stock and stock units | 818,901 | ||||||||||||||||
Redeemable common and preferred stock and stock units(1) | Redeemable common and preferred stock and stock units(1) | 832,624 | — | ||||||||||||||
| Notes receivable from stockholders | Notes receivable from stockholders | (36,607 | ) | Notes receivable from stockholders | — | — | |||||||||||
| Redeemable preferred stock, Class F—authorized, 200,000, issued and outstanding, 47,000 as of December 31, 2006, and shares as adjusted | 117,500 | ||||||||||||||||
| Redeemable preferred stock, Class G—authorized, 200,000, issued and outstanding 47,000 as of December 31, 2006, and shares as adjusted | 117,500 | ||||||||||||||||
| Redeemable preferred stock, Class F—47,000 authorized, issued and outstanding as of March 31, 2007, and 0 shares as adjusted(2) | Redeemable preferred stock, Class F—47,000 authorized, issued and outstanding as of March 31, 2007, and 0 shares as adjusted(2) | 117,500 | — | ||||||||||||||
| Redeemable preferred stock, Class G—47,000 authorized, issued and outstanding as of March 31, 2007, and 0 shares as adjusted(2) | Redeemable preferred stock, Class G—47,000 authorized, issued and outstanding as of March 31, 2007, and 0 shares as adjusted(2) | 117,500 | — | ||||||||||||||
Stockholders' (deficit)/equity: | Stockholders' (deficit)/equity: | Stockholders' (deficit)/equity: | |||||||||||||||
| Convertible preferred stock authorized 7,799,780 shares; issued and outstanding, 57,279 shares pro forma as adjusted, $100 liquidation preference value per share | — | 5,728 | |||||||||||||||
| Preferred stock, Class C-authorized 200 shares; issued and outstanding, 111.518 shares pro forma as adjusted, $1.00 liquidation preference value per share | — | — | |||||||||||||||
| Preferred stock, Class E-authorized 20 shares; issued and outstanding, 5.165 shares pro forma as adjusted, $1.00 liquidation preference value per share | — | — | |||||||||||||||
| Common stock, $0.01 par value, and common stock units, no par value, total authorized 150,000,000; issued and outstanding 91,135,704 shares pro forma as adjusted(2) | — | 840 | |||||||||||||||
| Common stock, $0.01 par value, authorized 150,000,000; issued and outstanding shares pro forma as adjusted(1) | — | Additional paid-in capital | (289,790 | ) | 1,121,219 | ||||||||||||
| Additional paid-in capital | (290,797 | ) | Retained earnings | 21,111 | 17,362 | ||||||||||||
| Retained earnings | — | Notes receivable from stockholders | — | — | |||||||||||||
| Accumulated other comprehensive loss | (33,694 | ) | Accumulated other comprehensive loss | (29,495 | ) | (29,495 | ) | ||||||||||
| Total stockholders' (deficit)/equity | (324,491 | ) | Total stockholders' (deficit)/equity | (298,174 | ) | 1,115,654 | |||||||||||
| Total capitalization | Total capitalization | $ | 820,544 | $ | Total capitalization | $ | 1,012,460 | $ | 1,160,030 | ||||||||
Our pro forma net tangible book value at DecemberMarch 31, 20062007 was $$85.5 million, or $$1.20 per share. Net tangible book value per share before the offering has been determined by dividingPro forma net tangible book value (total book valueassumes the conversion, concurrent with the offering, of tangible assets lessall redeemable common and preferred stock and stock units and the related share purchase liability resulting in total liabilities) by the numbercommon shares outstanding of shares71,246,907 as of common stock outstanding at DecemberMarch 31, 2006.2007. After giving effect to the sale of our common stock in this offering at an assumed initial public offering price of $$19.00 per share and after deducting estimated underwriting discounts and commissions and estimated offering expenses payable by us, our adjusted net tangible book value at DecemberMarch 31, 20062007 would have been $$440.7 million or $$4.84 per share. This represents an immediate increase in net tangible book value per share of $$3.64 to existing stockholders and dilution in net tangible book value per share of $$14.16 to new investors who purchase shares in the offering. The following table illustrates this per share dilution to new investors:
| Assumed initial public offering price per share | $ | 19.00 | |||||
| Pro forma net tangible book value per share at March 31, 2007 | $ | 1.20 | |||||
| Increase in net tangible book value per share attributable to new investors | 3.64 | ||||||
| Adjusted net tangible book value per share | 4.84 | ||||||
| Dilution per share to new investors | $ | 14.16 | |||||
The following table sets forth, on the as adjusted basis described above, at DecemberMarch 31, 2006,2007, the difference between the number of shares of common stock purchased, the total consideration paid, and the average price per share paid by the existing stockholders and by investors purchasing shares in this offering, before deducting estimated underwriting discounts and commissions and estimated offering expenses.
| | Shares Purchased | Total Consideration | | |||||||||
|---|---|---|---|---|---|---|---|---|---|---|---|---|
| | Average Price Per Share | |||||||||||
| | Number | Percent | Amount | Percent | ||||||||
| Existing stockholders | 71,246,907 | 78 | 655,262,022 | 63 | $ | 9.20 | ||||||
| New investors | 19,888,797 | 22 | 377,887,143 | 37 | $ | 19.00 | ||||||
| Total | 91,135,704 | 100 | % | 1,033,149,165 | 100 | % | $ | 11.34 | ||||
The discussions and tables above exclude the following at DecemberMarch 31, 2006:2007:
SELECTED CONSOLIDATED FINANCIAL DATA
You should read the following selected consolidated financial data along with "Management's Discussion and Analysis of Financial Condition and Results of Operations" and our consolidated financial statements and the accompanying notes, which is included in this prospectus. We derived the consolidated statement of income data for each of the three years ended September 30, 2006, 2005 and 2004 and the consolidated balance sheet data at September 30, 2006 and 2005 from our audited consolidated financial statements, which are included elsewhere in this prospectus. The data for the three months ended DecemberMarch 31, 20062007 and 20052006 have been derived from our unaudited consolidated financial statements included elsewhere in this prospectus. The unaudited consolidated financial statements have been prepared on the same basis as our audited consolidated financial statements and, in the opinion of our management, reflect all adjustments necessary for a fair presentation of this data. The results for any interim period are not necessarily indicative of the results that may be expected for a full year. We derived the consolidated statement of income data for each of the years ended September 30, 2003 and 2002 and the consolidated balance sheet data as of September 30, 2004, 2003 and 2002 from our audited consolidated financial statements not included in this prospectus.
| | | Year Ended September 30, | Three Months Ended December 31, | | Year Ended September 30, | Six Months Ended March 31, | ||||||||||||||||||||||||||||||||||||||
|---|---|---|---|---|---|---|---|---|---|---|---|---|---|---|---|---|---|---|---|---|---|---|---|---|---|---|---|---|---|---|---|---|---|---|---|---|---|---|---|---|---|---|---|---|
| | | 2002 | 2003 | 2004 | 2005 | 2006 | 2005 | 2006 | | 2002 | 2003 | 2004 | 2005 | 2006 | 2006 | 2007 | ||||||||||||||||||||||||||||
| | | (in millions, except share and per share data) | | (in millions, except share and per share data) | ||||||||||||||||||||||||||||||||||||||||
| Consolidated Statement of Income Data: | Consolidated Statement of Income Data: | Consolidated Statement of Income Data: | ||||||||||||||||||||||||||||||||||||||||||
| Revenues | $ | 1,747 | $ | 1,915 | $ | 2,012 | $ | 2,395 | $ | 3,421 | $ | 747 | $ | 939 | ||||||||||||||||||||||||||||||
| Cost of revenues | 1,269 | 1,381 | 1,443 | 1,718 | 2,515 | 547 | 691 | |||||||||||||||||||||||||||||||||||||
| Revenue | Revenue | $ | 1,747 | $ | 1,915 | $ | 2,012 | $ | 2,395 | $ | 3,421 | $ | 1,606 | $ | 2,022 | |||||||||||||||||||||||||||||
| Cost of revenue | Cost of revenue | 1,269 | 1,381 | 1,443 | 1,718 | 2,515 | 1,177 | 1,490 | ||||||||||||||||||||||||||||||||||||
| Gross profit | Gross profit | 478 | 534 | 569 | 677 | 906 | 200 | 248 | Gross profit | 478 | 534 | 569 | 677 | 906 | 429 | 532 | ||||||||||||||||||||||||||||
| Equity in earnings of joint ventures | Equity in earnings of joint ventures | 1 | 2 | 3 | 2 | 7 | 2 | 1 | Equity in earnings of joint ventures | 1 | 2 | 3 | 2 | 7 | 3 | 4 | ||||||||||||||||||||||||||||
| General and administrative expenses | General and administrative expenses | 430 | 467 | 485 | 581 | 810 | 177 | 219 | General and administrative expenses | 430 | 467 | 485 | 581 | 810 | 382 | 468 | ||||||||||||||||||||||||||||
| Income from operations | Income from operations | 49 | 69 | 87 | 98 | 103 | 25 | 30 | Income from operations | 49 | 69 | 87 | 98 | 103 | 50 | 68 | ||||||||||||||||||||||||||||
| Minority interest share of earnings | Minority interest share of earnings | 3 | 3 | 3 | 8 | 14 | 2 | 1 | Minority interest share of earnings | 3 | 3 | 3 | 8 | 14 | 5 | 5 | ||||||||||||||||||||||||||||
| Gain on the sale of equity investment | Gain on the sale of equity investment | — | — | — | — | — | — | 11 | Gain on the sale of equity investment | — | — | — | — | — | — | 11 | ||||||||||||||||||||||||||||
| Interest expense—net | Interest expense—net | 12 | 10 | 8 | 7 | 10 | 4 | 1 | Interest expense—net | 12 | 10 | 8 | 7 | 10 | 8 | 3 | ||||||||||||||||||||||||||||
| Income before income tax expense | Income before income tax expense | 34 | 56 | 76 | 83 | 79 | 19 | 39 | Income before income tax expense | 34 | 56 | 76 | 83 | 79 | 37 | 71 | ||||||||||||||||||||||||||||
| Income tax expense | Income tax expense | 11 | 19 | 26 | 29 | 25 | 6 | 13 | Income tax expense | 11 | 19 | 26 | 29 | 25 | 12 | 24 | ||||||||||||||||||||||||||||
| Net income | Net income | $ | 23 | $ | 37 | $ | 50 | $ | 54 | $ | 54 | $ | 13 | $ | 26 | Net income | $ | 23 | $ | 37 | $ | 50 | $ | 54 | $ | 54 | $ | 25 | $ | 47 | ||||||||||||||
Net income allocation: | Net income allocation: | Net income allocation: | ||||||||||||||||||||||||||||||||||||||||||
| Preferred stock dividend | $ | — | $ | 2 | $ | 5 | $ | 6 | $ | 2 | $ | 1 | $ | — | Preferred stock dividend | $ | — | $ | 2 | $ | 5 | $ | 6 | $ | 2 | $ | 2 | $ | — | |||||||||||||||
| Net income available for common stockholders | 23 | 35 | 45 | 48 | 52 | 12 | 26 | Net income available for common stockholders | 23 | 35 | 45 | 48 | 52 | 23 | 47 | |||||||||||||||||||||||||||||
| Net income | $ | 23 | $ | 37 | $ | 50 | $ | 54 | $ | 54 | $ | 13 | $ | 26 | Net income | $ | 23 | $ | 37 | $ | 50 | $ | 54 | $ | 54 | $ | 25 | $ | 47 | |||||||||||||||
Earnings per share available for common stockholders: | Earnings per share available for common stockholders: | Earnings per share available for common stockholders: | ||||||||||||||||||||||||||||||||||||||||||
| Basic | $ | 0.89 | $ | 1.34 | $ | 1.71 | $ | 1.86 | $ | 1.88 | $ | 0.43 | $ | 0.89 | Basic | $ | 0.45 | $ | 0.67 | $ | 0.86 | $ | 0.93 | $ | 0.94 | $ | 0.43 | $ | 0.82 | |||||||||||||||
| Diluted | $ | 0.86 | $ | 1.29 | $ | 1.57 | $ | 1.68 | $ | 1.48 | $ | 0.40 | $ | 0.65 | Diluted | $ | 0.43 | $ | 0.65 | $ | 0.78 | $ | 0.84 | $ | 0.74 | $ | 0.37 | $ | 0.60 | |||||||||||||||
Weighted average shares outstanding (in thousands): | Weighted average shares outstanding (in thousands): | Weighted average shares outstanding (in thousands): | ||||||||||||||||||||||||||||||||||||||||||
| Basic | 25,815 | 26,429 | 26,300 | 25,940 | 27,428 | 26,644 | 28,800 | Basic | 51,630 | 52,858 | 52,600 | 51,880 | 54,856 | 53,482 | 56,965 | |||||||||||||||||||||||||||||
| Diluted | 27,001 | 28,589 | 32,127 | 31,989 | 36,329 | 32,612 | 39,518 | Diluted | 54,002 | 57,178 | 64,254 | 63,978 | 72,658 | 67,765 | 78,500 | |||||||||||||||||||||||||||||
| | Year Ended or as of September 30, | Three Months Ended or as of December 31, | ||||||||||||
|---|---|---|---|---|---|---|---|---|---|---|---|---|---|---|
| | 2002 | 2003 | 2004 | 2005 | 2006 | 2005 | 2006 | |||||||
| | (in millions, except employee data) | |||||||||||||
| Other Data: | ||||||||||||||
| Depreciation and amortization | 23 | 13 | 13 | 20 | 40 | 9 | 7 | |||||||
| Amortization expense of acquired intangible assets | — | — | — | 3 | 15 | 3 | 1 | |||||||
| Capital expenditures | 20 | 14 | 19 | 31 | 32 | 7 | 10 | |||||||
| Backlog | 1,710 | 1,660 | 1,620 | 2,000 | 2,500 | 2,480 | 2,851 | |||||||
| Number of full-time and part-time employees | 15,500 | 16,800 | 17,700 | 22,000 | 27,300 | 24,200 | 28,500 | |||||||
| | As of September 30, | As of December 31, | ||||||||||||||||||||
|---|---|---|---|---|---|---|---|---|---|---|---|---|---|---|---|---|---|---|---|---|---|---|
| | 2002 | 2003 | 2004 | 2005 | 2006 | 2005 | 2006 | |||||||||||||||
| | (in millions) | |||||||||||||||||||||
| Consolidated Balance Sheet Data: | ||||||||||||||||||||||
| Cash and cash equivalents | $ | 28 | $ | 120 | $ | 121 | $ | 54 | $ | 128 | $ | 67 | $ | 138 | ||||||||
| Working capital | 113 | 213 | 225 | 171 | 201 | 224 | 178 | |||||||||||||||
| Total assets | 965 | 1,056 | 1,115 | 1,425 | 1,826 | 1,585 | 1,879 | |||||||||||||||
| Long-term debt excluding current portion | 171 | 122 | 105 | 216 | 123 | 313 | 104 | |||||||||||||||
| Redeemable preferred and common stock and stock units, net of notes receivable | 378 | 547 | 576 | 661 | 970 | 668 | 1,014 | |||||||||||||||
| Stockholders' deficit | (108 | ) | (181 | ) | (159 | ) | (240 | ) | (291 | ) | (237 | ) | (324 | ) | ||||||||
| | Year Ended or as of September 30, | Six Months Ended or as of March 31, | |||||||||||||||||||
|---|---|---|---|---|---|---|---|---|---|---|---|---|---|---|---|---|---|---|---|---|---|
| | 2002 | 2003 | 2004 | 2005 | 2006 | 2006 | 2007 | ||||||||||||||
| | (in millions, except employee data) | ||||||||||||||||||||
| Other Data: | |||||||||||||||||||||
| Depreciation and amortization | $ | 23 | $ | 13 | $ | 13 | $ | 20 | $ | 40 | $ | 18 | $ | 19 | |||||||
| Amortization expense of acquired intangible assets(1) | — | — | — | 3 | 15 | 6 | 6 | ||||||||||||||
| Capital expenditures | 20 | 14 | 19 | 31 | 32 | 13 | 19 | ||||||||||||||
| Backlog | 1,710 | 1,660 | 1,620 | 1,980 | 2,480 | 2,585 | 3,131 | ||||||||||||||
| Number of full-time and part-time employees | 15,500 | 16,800 | 17,700 | 22,000 | 27,300 | 24,800 | 30,200 | ||||||||||||||
| | As of September 30, | | | ||||||||||||||||||
|---|---|---|---|---|---|---|---|---|---|---|---|---|---|---|---|---|---|---|---|---|---|
| | As of March 31, 2007 | | |||||||||||||||||||
| | 2002 | 2003 | 2004 | 2005 | 2006 | | |||||||||||||||
| | (in millions) | | |||||||||||||||||||
| Consolidated Balance Sheet Data: | |||||||||||||||||||||
| Cash and cash equivalents | $ | 28 | $ | 120 | $ | 121 | $ | 54 | $ | 128 | $ | 116 | |||||||||
| Working capital | 113 | 213 | 225 | 171 | 201 | 185 | |||||||||||||||
| Total assets | 965 | 1,056 | 1,115 | 1,425 | 1,826 | 2,076 | |||||||||||||||
| Long-term debt excluding current portion | 171 | 122 | 105 | 216 | 123 | 153 | |||||||||||||||
| Redeemable preferred and common stock and stock units, net of notes receivable | 378 | 547 | 576 | 661 | 970 | 1,068 | |||||||||||||||
| Stockholders' deficit | (108 | ) | (181 | ) | (159 | ) | (240 | ) | (291 | ) | (298 | ) | |||||||||
MANAGEMENT'S DISCUSSION AND ANALYSIS
OF FINANCIAL CONDITION AND RESULTS OF OPERATIONS
You should read the following discussion in conjunction with our consolidated financial statements and the related notes and other financial information included in this prospectus. In addition to historical consolidated financial information, the following discussion contains forward-looking statements that reflect our plans, estimates and beliefs. Our actual results could differ materially. Factors that could cause or contribute to these differences include those discussed below and elsewhere in this prospectus, particularly in "Risk Factors."
Overview
We are a leading global provider of professional technical and management support services for commercial and government clients around the world. We provide our services in a broad range of end markets and strategic geographic markets through a global network of operating offices and approximately 28,000more than 30,000 employees and staff employed in the field on a project-by-project basis.
Our business focuses primarily on providing fee-based professional technical and support services and, as such, we are labor and not capital intensive. We derive income from our ability to generate revenuesrevenue and collect cash from our clients through the billing of our employees' time and our ability to manage our costs. We operate our business through two segments: Professional Technical Services (PTS) and Management Support Services (MSS).
Our PTS segment delivers planning, consulting, architecture and engineering design, and program and construction management services to institutional, commercial and government clients worldwide in major end markets such as transportation, facilities and environmental markets. PTS revenues arerevenue is primarily derived from fees from services that we provide, as opposed to pass-through fees from subcontractors and other direct costs. As a percentage of PTS revenue, our other direct costs, including subcontractor and consultant costs, typically range from 30% to 38%. Our gross margin as a percentage of PTS revenue typically ranges from 44%30% to 48%32%, depending on the nature and scope of the underlying projects.
Our MSS segment provides facilities management and maintenance, training, logistics, consulting, technical assistance and systems integration services, primarily for agencies of the U.S. government. MSS revenuesrevenue typically includeincludes a significant amount of pass-through fees from subcontractor and other direct costs. As a percentage of MSS revenue, other direct costs, including subcontractor, consultants and material costs typically range from 85% to 87%. Our gross margin as a percentage of MSS revenue typically ranges from 3% to 5%, depending on the level of other direct costs required, which can vary significantly from period to period.
In total, our revenues arerevenue is dependent on our ability to attract qualified and productive employees, identify business opportunities, allocate our labor resources to profitable markets, secure new contracts, renew existing client agreements and provide outstanding services. Moreover, as a professional services company, the quality of the work generated by our employees is integral to our revenue generation.
Our costs are driven primarily by the compensation we pay to our employees, including fringe benefits, the cost of hiring subcontractors and other project-related expenses, and sales, general and administrative overhead costs.
Components of Income and Expense
Our management analyzes the results of our operations using threetwo financial measures that are not in accordance with generally accepted accounting principles in the United States (GAAP).: revenue, net of other direct costs and cost of revenue, net of other direct costs.
The following table presents, for the periods indicated, a presentation of the non-GAAP financial measures reconciled to the closest GAAP measure:
| | Year Ended September 30, | Three Months Ended December 31, | |||||||||||||||||||
|---|---|---|---|---|---|---|---|---|---|---|---|---|---|---|---|---|---|---|---|---|---|
| | 2002 | 2003 | 2004 | 2005 | 2006 | 2005 | 2006 | ||||||||||||||
| | (in millions) | ||||||||||||||||||||
| Other Financial Data: | |||||||||||||||||||||
| Revenues | $ | 1,747 | $ | 1,915 | $ | 2,012 | $ | 2,395 | $ | 3,421 | $ | 747 | $ | 939 | |||||||
| Other direct costs | 671 | 725 | 776 | 933 | 1,521 | 332 | 436 | ||||||||||||||
| Net service revenues | 1,076 | 1,190 | 1,236 | 1,462 | 1,900 | 415 | 503 | ||||||||||||||
| Stock match expense—direct | 5 | 2 | 1 | 2 | 11 | 1 | 1 | ||||||||||||||
| Other cost of net service revenues | 593 | 654 | 666 | 783 | 983 | 214 | 254 | ||||||||||||||
| Cost of net service revenues | 598 | 656 | 667 | 785 | 994 | 215 | 255 | ||||||||||||||
| Gross profit | 478 | 534 | 569 | 677 | 906 | 200 | 248 | ||||||||||||||
| Equity in earnings of joint ventures | 1 | 2 | 3 | 2 | 7 | 2 | 1 | ||||||||||||||
| Amortization expense of acquired intangible assets | — | — | — | 3 | 15 | 3 | 1 | ||||||||||||||
| Stock match expense—general and administrative | 6 | 1 | 1 | 1 | 4 | 3 | 1 | ||||||||||||||
| Other general and administrative expenses | 424 | 466 | 484 | 577 | 791 | 171 | 217 | ||||||||||||||
| General and administrative expenses | 430 | 467 | 485 | 581 | 810 | 177 | 219 | ||||||||||||||
| Income from operations | $ | 49 | $ | 69 | $ | 87 | $ | 98 | $ | 103 | $ | 25 | $ | 30 | |||||||
| | Year Ended September 30, | Six Months Ended March 31, | ||||||||||||||||||||
|---|---|---|---|---|---|---|---|---|---|---|---|---|---|---|---|---|---|---|---|---|---|---|
| | 2002 | 2003 | 2004 | 2005 | 2006 | 2006 | 2007 | |||||||||||||||
| | (in millions) | |||||||||||||||||||||
| Other Financial Data: | ||||||||||||||||||||||
| Revenue | $ | 1,747 | $ | 1,915 | $ | 2,012 | $ | 2,395 | $ | 3,421 | $ | 1,606 | $ | 2,022 | ||||||||
| Other direct costs | 671 | 725 | 776 | 933 | 1,521 | 701 | 929 | |||||||||||||||
| Revenue, net of other direct costs | 1,076 | 1,190 | 1,236 | 1,462 | 1,900 | 905 | 1,093 | |||||||||||||||
| Cost of revenue, net of other direct costs | 598 | 656 | 667 | 785 | 994 | 476 | 561 | |||||||||||||||
| Gross profit | 478 | 534 | 569 | 677 | 906 | 429 | 532 | |||||||||||||||
| Equity in earnings of joint ventures | 1 | 2 | 3 | 2 | 7 | 3 | 4 | |||||||||||||||
| Amortization expense of acquired intangible assets | — | — | — | 3 | 15 | 6 | 6 | |||||||||||||||
| Other general and administrative expenses | 430 | 467 | 485 | 578 | 795 | 376 | 462 | |||||||||||||||
| General and administrative expenses | 430 | 467 | 485 | 581 | 810 | 382 | 468 | |||||||||||||||
| Income from operations | $ | 49 | $ | 69 | $ | 87 | $ | 98 | $ | 103 | $ | 50 | $ | 68 | ||||||||
| Reconciliation of Cost of Revenue: | ||||||||||||||||||||||
| Other direct costs | $ | 671 | $ | 725 | $ | 776 | $ | 933 | $ | 1,521 | $ | 701 | $ | 929 | ||||||||
| Cost of revenue, net of other direct costs | 598 | 656 | 667 | 785 | 994 | 476 | 561 | |||||||||||||||
| Cost of revenue | $ | 1,269 | $ | 1,381 | $ | 1,443 | $ | 1,718 | $ | 2,515 | $ | 1,177 | $ | 1,490 | ||||||||
RevenuesRevenue
We recognize revenuesrevenue using the percentage-of-completion method. Under this method, revenue is recorded generally on the basis of the ratio of direct labor dollars incurred to the estimated total direct labor dollars. We review our progress on each contract periodically and losses, if any, are recognized as soon as we determine that the contract will result in a loss. Our revenues arerevenue is primarily derived from fee-based professional and technical services that our employees provide to our portfolio of clients as well as from other direct costs such as subcontractor and direct material purchases. Increases in fees or billable hours of our employees tends to have a more positive impact on our profitability than do increases in other direct costs. Contracts that are more heavily weighted on other direct costs tend to have lower profit margins.
Other Direct Costs
On many projects we are responsible for other direct costs or pass-through costs that may include third party field labor, subcontracts, or the procurement of materials and equipment. We account for the reimbursement of these expenses as revenuesrevenue as these costs are incurred. On projects where the client elects to pay these costs directly, however, pass-through costs are not reflected in our revenuesrevenue or expenses. Thus, other direct costs can fluctuate significantly. We generally do not earn profits from pass-through costs with the exception when incremental costs are incurred relating to the level of effort expended by us on these pass-through costs for supervision, accounting services and similar activities. In the cases where we do mark-up costs and earn profits, the amount is typically insignificant.
Revenue, Net Service Revenuesof Other Direct Costs
In the course of providing our services, we routinely incur "other direct costs" (i.e. payments to subcontractors and other "pass-through" costs). Generally, these other direct costs are passed through to our clients and are included in our revenuesrevenue when it is our responsibility to procure or manage such costs under the contract. Because other direct costs can vary significantly from project to project and period to period, changes in revenue may not be indicative of our business trends. Accordingly, in addition to revenues,revenue, we report revenue, net service revenues,of other direct costs, and our discussion and analysis of financial condition and results of operations uses revenue, net services revenuesof other direct costs as a point of reference. Net service revenuesRevenue, net of other direct costs and gross margin (gross profit as a percentage of revenue, net service revenues)of other direct costs are non-GAAP measures and may not be comparable to similarly titled items reported by other companies. We believe that net service revenues are a more reflective measure of our business because total revenues include significant amounts of other direct or pass-through costs.
Cost of Revenue, Net Service Revenuesof Other Direct Costs
Cost of revenue, net service revenuesof other direct costs reflects the direct cost of our own personnel (including fringe benefits and overhead expense) associated with revenue, net service revenue.of other direct costs.
Stock Match Expense
Our total cost of revenue, net service revenues,of other direct costs, as well as in our general and administrative costs, includes an expense for company-provided stock matches. Our strategy as a privately-held company has been to encourage employee ownership of company stock by providing stock matches on certain purchases of our common stock and common stock units, as well as a means to raise capital as there has not been a public market to do so. To the extent that employees purchase stock and stock units directly or by designating previously earned retirement funds, we have provided a match on a portion of the stock purchased. In addition, in mergers and acquisitions, as well as key hires, we have from time to time, provided discretionary matches beyond the typical match. The standard matching percentage for fiscal years 2004, 2005 and 2006 was primarily 18%. Compensation expense associated with these stock matches, which is included in both cost of revenue, net service revenuesof other direct costs and general and administrative expenses under GAAP, is segregated because it is considered a function of the level of stock purchased by employees and not a cost of work performed.
Because it is difficult to predict with any precision the amount of stock that will be purchased by employees, our stock match expense can vary significantly from period to period and tends to be a function of the level of our mergers and acquisitions activity. We anticipate that, once there is a public market for our stock, towe will reduce the overall matches to employees, including those obtained through mergers and acquisitions. As discussed above in "Components of Income and Expense," management believes that segregating stock matches is appropriate in analyzing results of operations. Stock matches are non-GAAP measures and segregating them from compensation expense included in cost of revenues and general and administrative expenses may not provide an accurate comparison to similarly titled captions reported by other companies.
Equity in Earnings of Joint Ventures
Equity in earnings of joint ventures includes our portion of fees added by joint ventures in which we participate in client billings for services performed by joint venture partners and earnings from investments in non-controlled and non-consolidated joint ventures where the joint venture employs its own employees.
General and Administrative Expenses
General and administrative expenses include all corporate overhead expenses, including personnel, occupancy, administrative, performance earnings plan accruals, taxes, benefits and other operating
expenses, and prior to fiscal 2002, amortization expense of goodwill acquired through acquisitions. In fiscal 2002, we discontinued amortizing goodwill and commenced testing our goodwill for impairment in accordance with Financial Accounting Standards Board, or FASB, Statement of Financial Accounting Standards, or SFAS, No. 142, "Goodwill and Other Intangible Assets" (SFAS 142). To date, we have not recognized, nor do we expect to recognize in the future, any expense related to goodwill impairment.
Should we determine, however, that our goodwill is impaired the related expense would be a component of our general and administrative expense.
Amortization Expense of Acquired Intangible Assets
Included in our general and administrative expense is amortization expense of acquired intangible assets. Under SFAS No. 141,"Business Combinations" (SFAS 141) and the SEC's interpretations thereof, we must ascribe value to identifiable intangible assets other than goodwill in our purchase allocations for acquired companies. These assets include but are not limited to backlog, customer lists and trade names. To the extent we ascribe value to identifiable intangible assets that have finite lives, we amortize those values over the estimated useful lives of the assets. Such amortization expense, although non-cash in the period expensed, directly impacts our results of operations.
It is difficult to predict with any precision the amount of expense we may record relating to acquired intangible assets. As backlog is typically the shortest lived intangible asset in our business, we would expect to see higher amortization expense in the first 12 to 18 months after a merger or acquisition has been consummated. AmortizationDue to its volatility and significance of these amounts, we segregate amortization expense of acquired intangible assets is a non-GAAP measures and segregating them from general and administrative expenseexpense. This presentation may not provide an accurate comparison to similarly titled captions reported by other companies. In order to assess true operational performance, we segregate from general and administrative expense, as well as income from operations, the periodic amortization expense related to acquired intangible assets. These changes would have the effect of showing income from operations higher than it would have been under GAAP in actual dollars, as well as a percent of total revenue.
Income Tax Expense
Income tax expense varies as a function of income before income tax expense and permanent non-tax deductible expenses such as amortization expense of acquired intangible assets, certain amounts of meals and entertainment expense, valuation allowance requirements and other permanent differences. We anticipate to continue our merger and acquisition strategy and as such, we anticipate that there will be variability in our effective tax rate from quarter to quarter and year to year, especially to the extent that our permanent differences increase or decrease.
Mergers and Acquisitions
One of our key strategies is to focus on both organic growth and mergers and acquisitions of technical companies that complement our business sectors and/or expand our geographic presence.
In fiscal year 2004, we consummated the following two acquisitions:
In fiscal year 2005, we consummated seven mergers and acquisitions, including:
In fiscal year 2006, we consummated four mergers and acquisitions, including:
In fiscal year 2007, we have consummated fivesix mergers and acquisitions to date, including:
The purchase prices in certain of these mergers and acquisitions are subject to purchase allocation adjustments based upon the final determination of the acquired firm's tangible and intangible net asset values as of their respective closing dates. All of our mergers and acquisitions have been accounted for as purchases and the results of operations of the acquired companies have been included in our consolidated results since the dates of the merger and/or acquisition.
Critical Accounting Policies
Our financial statements are presented in accordance with GAAP. Highlighted below are the accounting policies that management considers significant to understanding the operations of our business.
Revenue Recognition
Contract revenues arerevenue is recognized on the percentage-of-completion method, measured generally by the ratio of direct labor dollars incurred to date to the total estimated direct labor dollars at completion. We include other direct costs (for example, third party field labor, subcontractors, or the procurement of materials or equipment) in contract revenuesrevenue when the costs of these items are incurred and we are responsible for the ultimate acceptability of such costs. We consider the percentage-of-completion method to be the best available measure of progress on these contracts. Changes in job performance, job conditions and estimated profitability, including those arising from final contract settlements, may result in revisions to estimated costs and revenuesrevenue and are recognized in the period in which the revisions are determined. Provisions for estimated losses on uncompleted contracts are made in the period in which such losses are determined.
In the ordinary course of business, and at a minimum on a quarterly basis, we prepare updated estimates of the total forecasted contract revenue, cost and profit or loss. The cumulative effect of
revisions in estimates of the total forecasted revenue and costs during the course of the work, including unapproved change orders and claims, is reflected in the accounting period in which the facts that caused the revision become known to us. The financial impact of these revisions to any one contract is a function of both the amount of the revision and the percentage of completion of the contract.
Claims Recognition
Claims are amounts in excess of the agreed contract price (or amounts not included in the original contract price) that we seek to collect from customers or others for delays, errors in specifications and designs, contract terminations, change orders in dispute or unapproved as to both scope and price or other causes of unanticipated additional costs. We record claims in accordance with paragraph 65 of the American Institute of Certified Public Accountants Statement of Position 81-1,"Accounting for Performance of Construction-Type and Certain Production-Type Contracts." This statement of position provides that recognition of amounts related to claims as additional contract revenue is appropriate only if it is probable that the claims will result in additional contract revenue and if the amount can be reliably estimated. Those two requirements are satisfied by management's determination of the existence of all of the following conditions: the contract or other evidence provides a legal basis for the claim; additional costs are caused by circumstances that were unforeseen at the contract date and are not the result of deficiencies in the contractor's performance; costs associated with the claim are identifiable or otherwise determinable and are reasonable in view of the work performed; and the evidence supporting the claim is objective and verifiable. If such requirements are met, revenue from a claim is recorded to the extent that contract costs relating to the claim have been incurred. The amounts recorded, if material, are disclosed in the notes to the financial statements. Costs attributable to claims are treated as costs of contract performance as incurred.
Unbilled Accounts Receivable and Billings in Excess of Costs on Uncompleted Contracts
Unbilled accounts receivable represents the excess of contract costs and profits (or contract revenue) recognized to date using the percentage-of-completion accounting method over billings to date. Unbilled work results when:
Billings in excess of costs on uncompleted contracts represent the excess of billings to date, as allowed under the terms of a contract, over the amount of contract costs and profits (or contract revenue) recognized to date using the percentage-of-completion accounting method on certain contracts.
Investments in Unconsolidated Joint Ventures
We establish arrangements with other service providers to provide architecture, engineering, program management, construction management and operations and maintenance services through joint ventures. These joint ventures, the combination of two or more partners, are generally formed for a specific project. Management of the joint venture is controlled by the joint venture executive committee which is typically comprised of a representative of each joint venture partner with equal voting rights, irrespective of the ownership percentage, which is generally based on the percentage split of work to be performed by each joint venture partner. The executive committee provides management oversight and assigns work efforts to the joint venture partners. In accordance with the FASB Interpretation No. 46 (revised December 2003)"Consolidation of Variable Interest Entities" (FIN 46R)
joint ventures in which we are not the primary beneficiary are accounted for using the equity method. Services performed by us and billed to the joint ventures with respect to work done by us for third party customers are recorded as our revenuesrevenue in the period such services are rendered. In certain joint ventures, a fee is added to the respective billings from us and the other joint venture partners on the amounts billed to third party customers. These fees result in earnings to the joint venture and are split
with each of the joint venture partners and paid to the joint venture partners upon collection from the third party customer. We record our allocated share of these fees as equity in earnings of joint ventures.
Under these arrangements, if one partner is financially unable to complete its share of the contract, the other partners will be required to complete those activities. Our policy is to enter into joint venture arrangements with partners who are financially sound and who carry appropriate levels of surety bonds for a project to adequately assure completion of their assignment. We have from time to time deviated from this policy at the request of our clients. In all instances, we attempt to structure our operating agreements among the joint venture partners to minimize risk.
Income Taxes
Valuation Allowance. Deferred income taxes are provided on the liability method whereby deferred tax assets and liabilities are established for the difference between the financial reporting and income tax basis of assets and liabilities, as well as operating loss and tax credit carry-forwards. Deferred tax assets and liabilities are adjusted for the effects of changes in tax laws and rates on the date of enactment.
Deferred tax assets are reduced by a valuation allowance when, in our opinion, it is more likely than not that some portion or all of the deferred tax assets may not be realized. Whether a deferred tax asset may be realized requires considerable judgment by us. In considering the need for a valuation allowance, we consider the future reversal of existing temporary differences, future taxable income exclusive of reversing temporary differences and carry-forwards, taxable income in carry-back years if carry-back is permitted under tax law, and prudent and feasible tax planning strategies that would not normally be taken by management, in the absence of the desire to realize the deferred tax asset. Whether a deferred tax asset will ultimately be realized is also dependent on varying factors, including, but not limited to, changes in tax laws and audits by tax jurisdictions in which we operate.
We review the need for a valuation allowance annually. If we determine we will not realize all or part of our net deferred tax asset in the future, we will record an additional valuation allowance. Conversely, if we determine that the ultimate realizability of all or part of the net deferred tax asset is more likely than not to be realized, then the amount of the valuation allowance will be reduced. This adjustment will increase or decrease income tax expense in the period of such determination.
Undistributed Foreign Earnings. The results of foreign operations are consolidated by us for financial reporting; however, earnings from investments in foreign operations are included in domestic taxable income only when actually or constructively received. No deferred taxes have been provided on the undistributed earnings of foreign operations of approximately $71.8 million because we plan to permanently reinvest these earnings overseas. If we were to repatriate these earnings additional taxes would be due at that time. However, these additional taxes may be offset in part by the use of foreign tax credits.
Goodwill
At September 30, 2006, we had recorded goodwill in the amount of approximately $466.5 million. SFAS 142 requires that we test our goodwill, at least annually, for potential impairment. The process of testing goodwill for impairment involves the determination of the fair value of our reporting units. Inherent in such fair value determinations are certain judgments and estimates, including assumptions
about our strategic plans with regard to our operations as well as the interpretation of current economic indicators and market valuations. To the extent economic conditions that would impact the future operations of our reporting units change, our goodwill may be deemed to be impaired and an impairment charge could result in a material adverse effect on our financial position or results of operations.
Accrued Professional Liability Costs
We carry professional liability insurance policies or self-insure for our initial layer of professional liability claims under our professional liability insurance policies and for a deductible for each claim even after exceeding the self-insured retention. We accrue for our portion of the estimated ultimate liability for the estimated potential incurred losses. We establish our estimate of loss for each potential claim in consultation with legal counsel handling the specific matters and on historic trends taking into account recent events. We also use an outside actuarial firm to assist us in estimating our future claims exposure. It is possible that our estimate of loss may be revised based on the actual or revised estimate of liability of the claims.
Results of Operations
ThreeSix months ended DecemberMarch 31, 20062007 compared to the threesix months ended DecemberMarch 31, 20052006
Consolidated Results
| | Three Months Ended | Change | | Six Months Ended | Change | ||||||||||||||||||||
|---|---|---|---|---|---|---|---|---|---|---|---|---|---|---|---|---|---|---|---|---|---|---|---|---|---|
| | December 31, 2005 | December 31, 2006 | $ | % | | March 31, 2006 | March 31, 2007 | $ | % | ||||||||||||||||
| | ($ in thousands) | | ($ in thousands) | ||||||||||||||||||||||
| Revenues | $ | 746,797 | $ | 938,549 | $ | 191,752 | 25.7 | % | |||||||||||||||||
| Other direct costs | 331,449 | 435,417 | 103,968 | 31.4 | |||||||||||||||||||||
| Revenue | Revenue | $ | 1,605,727 | $ | 2,022,258 | $ | 416,531 | 25.9 | % | ||||||||||||||||
| Other direct costs | 700,538 | 929,642 | 229,104 | 32.7 | |||||||||||||||||||||
| Net service revenues | 415,348 | 503,132 | 87,784 | 21.1 | |||||||||||||||||||||
| Cost of net service revenues | 215,309 | 254,713 | 39,404 | 18.3 | |||||||||||||||||||||
| Revenue, net of other direct costs | 905,189 | 1,092,616 | 187,427 | 20.7 | |||||||||||||||||||||
| Cost of revenue, net of other direct costs | 476,127 | 560,326 | 84,199 | 17.7 | |||||||||||||||||||||
| Gross profit | 200,039 | 248,419 | 48,380 | 24.2 | Gross profit | 429,062 | 532,290 | 103,228 | 24.1 | ||||||||||||||||
| Equity in earnings of joint ventures | 1,670 | 1,417 | (253 | ) | (15.1 | ) | Equity in earnings of joint ventures | 2,563 | 3,636 | 1,073 | 41.9 | ||||||||||||||
| General and administrative expenses | 176,983 | 219,828 | 42,845 | 24.2 | |||||||||||||||||||||
| General and administrative expense | General and administrative expense | 381,821 | 467,974 | 86,153 | 22.6 | ||||||||||||||||||||
| Income from operations | 24,726 | 30,008 | 5,282 | 21.4 | Income from operations | 49,804 | 67,952 | 18,148 | 36.4 | ||||||||||||||||
| Minority interest in share of earnings | 1,951 | 1,586 | (365 | ) | (18.7 | ) | Minority interest in share of earnings | 5,481 | 5,234 | (247 | ) | (4.5 | ) | ||||||||||||
| Gain on sale of equity investment | — | 11,286 | 11,286 | — | Gain on sale of equity investment | — | 11,286 | 11,286 | — | ||||||||||||||||
| Interest expense—net | 3,723 | 1,075 | (2,648 | ) | (71.1 | ) | Interest expense—net | 7,790 | 3,303 | (4,487 | ) | (57.6 | ) | ||||||||||||
| Income before income tax expense | 19,052 | 38,633 | 19,581 | 102.8 | Income before income tax expense | 36,533 | 70,701 | 34,168 | 93.5 | ||||||||||||||||
| Income tax expense | 6,097 | 13,113 | 7,016 | 115.1 | Income tax expense | 11,691 | 23,983 | 12,292 | 105.1 | ||||||||||||||||
| Net income | $ | 12,955 | $ | 25,520 | $ | 12,565 | 97.0 | % | Net income | $ | 24,842 | $ | 46,718 | $ | 21,876 | 88.1 | % | ||||||||
The following table presents the percentage relationship of certain items to revenue, net service revenues:of other direct costs:
| | Three Months Ended | Six Months Ended | ||||||||
|---|---|---|---|---|---|---|---|---|---|---|
| | December 31, 2005 | December 31, 2006 | March 31, 2006 | March 31, 2007 | ||||||
| Net service revenues | 100.0 | % | 100.0 | % | ||||||
| Cost of net service revenues | 51.8 | 50.6 | ||||||||
| Revenue, net of other direct costs | 100.0 | % | 100.0 | % | ||||||
| Cost of revenue, net of other direct costs | 52.6 | 51.3 | ||||||||
| Gross profit | 48.2 | 49.4 | 47.4 | 48.7 | ||||||
| Equity in earnings of joint ventures | 0.4 | 0.3 | 0.3 | 0.3 | ||||||
| General and administrative expenses | 42.6 | 43.7 | ||||||||
| General and administrative expense | 42.2 | 42.8 | ||||||||
| Income from operations | 6.0 | 6.0 | 5.5 | 6.2 | ||||||
| Minority interest in share of earnings | 0.5 | 0.3 | 0.6 | 0.5 | ||||||
| Gain on sale of equity investment | 0.0 | 2.2 | 0.0 | 1.0 | ||||||
| Interest expense—net | 0.9 | 0.2 | 0.9 | 0.2 | ||||||
| Income before income tax expense | 4.6 | 7.7 | 4.0 | 6.5 | ||||||
| Income tax expense | 1.5 | 2.6 | 1.3 | 2.2 | ||||||
| Net income | 3.1 | % | 5.1 | % | 2.7 | % | 4.3 | % | ||
RevenuesRevenue
For the threesix months ended DecemberMarch 31, 2006, revenues2007, revenue increased $191.8$416.5 million, or 25.7%25.9%, to $938.5 million$2.0 billion as compared to $746.8 million$1.6 billion for the threesix months ended DecemberMarch 31, 2005.2006. Of this increase, $50.8$110.4 million, or 26.5% was provided by companies acquired in the past twelve months. Excluding revenuesrevenue provided by companies acquired in the past 12 months, revenuesrevenue increased $141.0$306.2 million, or 18.9%19.1%. This increase was primarily attributable to continued economic growth in Australia and Canada including increased government and private sector spending for infrastructure development in infrastructure development;Australia and Canada as a result of continued economic growth in these regions; growth in our building and transportation business in the U.K.United Kingdom and significant growth in our combat support and global maintenance and supply services for the Department of Defense.
Revenue, Net Service Revenuesof Other Direct Costs
For the threesix months ended DecemberMarch 31, 2006,2007, revenue, net service revenuesof other direct costs increased $87.8$187.4 million, or 21.1%20.7%, to $503.1 million$1.1 billion as compared to $415.3$905.2 million for the threesix months ended DecemberMarch 31, 2005.2006. Of this increase, $37.5$87.0 million, or 42.7%46.4% was provided by companies acquired in the past twelve months. Excluding revenue, net service revenuesof other direct costs provided by companies acquired in the past 12 months, revenue, net service revenuesof other direct costs increased $50.3$100.4 million, or 12.1%11.1%. This increase was primarily attributable to continued economic growththe factors noted above and increases in our self-performed work for the above mentioned combat support and global maintenance and supply services for the Department of Defense.above.
Cost of Revenue, Net Service Revenuesof Other Direct Costs
For the threesix months ended DecemberMarch 31, 2006,2007, cost of revenue, net service revenuesof other direct costs increased $39.4$84.2 million, or 18.3%17.7%, to $254.7$560.3 million as compared to $215.3$476.1 million for the threesix months ended DecemberMarch 31, 2005.2006. Of this increase, $18.8$41.5 million, or 47.8%49.3% was incurred by companies acquired in the past 12 months. Excluding cost of revenue, net service revenuesof other direct costs associated with companies acquired in the past twelve months, cost of revenue, net service revenuesof other direct costs increased $20.6$42.7 million, or 9.6%9.0%. The preponderanceIncluded in cost of revenue, net of other direct costs is stock match expense of $5.2 million and $4.7 million for the six months ended March 31, 2007 and March 31, 2006, respectively. Most of our cost of revenue, net service revenuesof other direct costs is employee and employee related costs. As we realize increases in our revenue, net service revenues,of other direct costs, we will realize corresponding increases in our
headcount and employee and employee related costs. To the extent we increase our billable hours without increasing our headcount, our margins should improve. For the threesix months ended DecemberMarch 31, 2006,2007, cost of revenue, net service revenues,of other direct costs, as
a percentage of revenue, net services revenues, were 50.6%of other direct costs, was 51.3% as compared to 51.8%52.6% for the threesix months ended DecemberMarch 31, 2005.2006.
Gross Profit
For the threesix months ended DecemberMarch 31, 2006,2007, gross profit increased $48.4$103.2 million, or 24.2%24.1%, to $248.4$532.3 million as compared to $200.0$429.1 million for the threesix months ended DecemberMarch 31, 2005.2006. Of this increase, gross profit provided by companies acquired in the past 12 months was $18.6$45.5 million, or 38.5%44.1%. Excluding gross profit provided by companies acquired in the past 12 months, gross profit increased $29.8$57.7 million, or 14.9%13.5%. This increase was primarily attributable to higher gross profit margins in our environmental compliance projects as well as higher margins in certain combat support and global maintenance and supply services. For the threesix months ended DecemberMarch 31, 2006,2007, gross profit, as a percentage of revenue, net service revenues,of other direct costs, was 49.4%48.7% as compared to 48.2%47.4% for the threesix months ended DecemberMarch 31, 2005.2006.
Equity in Earnings of Joint Ventures
For the threesix months ended DecemberMarch 31, 2006,2007, equity in earnings of joint ventures decreased $0.3increased $1.0 million, or 15.1%41.9%, to $1.4$3.6 million as compared to $1.7$2.6 million for the threesix months ended DecemberMarch 31, 2005 resulting from lower2006 as a result of higher activities in non-consolidated/non-controlled joint ventures.
General and Administrative ExpenseExpenses
For the threesix months ended DecemberMarch 31, 2006,2007, general and administrative expenses increased $42.8$86.2 million, or 24.2%22.6%, to $219.8$468.0 million as compared to $177.0$381.8 million for the threesix months ended DecemberMarch 31, 2005.2006. Included in general and administrative expenses is stock match expense of $1.7 million in both the six months ended March 31, 2007 and March 31, 2006 and amortization expense of acquired intangible assets of $6.3 million and $7.0 million for the six months ended March 31, 2007 and March 31, 2006, respectively. For the threesix months ended DecemberMarch 31, 2006,2007, general and administrative expenses, as a percentage of revenue, net service revenues, were 43.7%of other direct costs was 42.8% as compared to 42.6%42.2% for the threesix months ended DecemberMarch 31, 2005.2006. The increase was primarily attributable to growth in revenuesrevenue noted above, increased headcount associated with acquired companies, continued investments throughout the organization to support strategic initiatives and expenses incurred related to our becoming a public reporting company, including Sarbanes-Oxley Act of 2002 (SOX) compliance efforts partially offset by a decrease of $2.5 million in amortization expense of acquired intangible assets.efforts.
Gain on Sale of Equity Investment
In the threesix months ended DecemberMarch 31, 2006, we sold our minority interest in an equity investment in the U.K. for 7.5 million GBP, or approximately $14.7 million. Related to this sale, we recorded a gain on the sale of $11.3 million.
Interest Expense—Net
For the threesix months ended DecemberMarch 31, 2006,2007, net interest expense decreased $2.6$4.5 million, or 71.1%57.6%, to $1.1$3.3 million as compared to $3.7$7.8 million for the threesix months ended DecemberMarch 31, 2005.2006. This decrease was primarily attributable to lower borrowings in the threesix months ended DecemberMarch 31, 20062007 as compared to the prior year. In threesix months ended DecemberMarch 31, 2005,2006, we had higher borrowings under our senior credit facility associated with acquisitions completed in the latter part of fiscal year 2005 and the first quarter of fiscal year 2006.2006, offset by repayment of such debt with the net proceeds from the issuance of our Class F and Class G redeemable preferred stock.
Income Tax Expense
For the threesix months ended DecemberMarch 31, 2006,2007, income tax expense increased $7.0$12.3 million, or 115.1%105.1%, to $13.1$24.0 million as compared to $6.1$11.7 million for the threesix months ended DecemberMarch 31, 2005.2006. The effective tax rate for the threesix months ending DecemberMarch 31, 20062007 was 33.9% as compared to 32.0% for the threesix months ended DecemberMarch 31, 2005.2006.
Net Income
The factors described above resulted in net income of $25.5$46.7 million for the threesix months ended DecemberMarch 31, 20062007 as compared to net income of $13.0$24.8 million for the threesix months ended DecemberMarch 31, 2005.2006.
Results of Operations by Reportable Segment:
Professional Technical Services
| | Three Months Ended | | | |||||||||
|---|---|---|---|---|---|---|---|---|---|---|---|---|
| | Change | |||||||||||
| | December 31, 2005 | December 31, 2006 | ||||||||||
| | $ | % | ||||||||||
| | ($ in thousands) | |||||||||||
| Revenues | $ | 612,264 | $ | 753,545 | $ | 141,281 | 23.1 | % | ||||
Net service revenues | $ | 399,599 | $ | 482,781 | $ | 83,182 | 20.8 | % | ||||
| Cost of net service revenues | 207,468 | 242,745 | 35,277 | 17.0 | % | |||||||
| Gross profit | $ | 192,131 | $ | 240,036 | $ | 47,905 | 24.9 | % | ||||
| | Six Months Ended | | | ||||||||||
|---|---|---|---|---|---|---|---|---|---|---|---|---|---|
| | Change | ||||||||||||
| | March 31, 2006 | March 31, 2007 | |||||||||||
| | $ | % | |||||||||||
| | ($ in thousands) | ||||||||||||
| Revenue | $ | 1,319,621 | $ | 1,594,564 | $ | 274,943 | 20.8 | % | |||||
| Other direct costs | 464,597 | 552,804 | 88,207 | 19.0 | |||||||||
| Revenue, net of other direct costs | 855,024 | 1,041,760 | 186,736 | 21.8 | |||||||||
| Cost of revenue, net of other direct costs | 443,132 | 528,531 | 85,399 | 19.3 | |||||||||
| Gross profit | $ | 411,892 | $ | 513,229 | $ | 101,337 | 24.6 | % | |||||
The following table presents the percentage relationship of certain items to revenue, net service revenue:of other direct costs:
| | Three Months Ended | ||||
|---|---|---|---|---|---|
| | December 31, 2005 | December 31, 2006 | |||
| Net service revenues | 100.0 | % | 100.0 | % | |
| Cost of net service revenues | 51.9 | 50.3 | |||
| Gross profit | 48.1 | % | 49.7 | % | |
| | Six Months Ended | ||||
|---|---|---|---|---|---|
| | March 31, 2006 | March 31, 2007 | |||
| Revenue, net of other direct costs | 100.0 | % | 100.0 | % | |
| Cost of revenue, net of other direct costs | 51.8 | 50.7 | |||
| Gross profit | 48.2 | % | 49.3 | % | |
RevenuesRevenue
For the threesix months ended DecemberMarch 31, 2006, revenues2007, revenue for our PTS segment increased $141.3$274.9 million, or 23.1%20.8%, to $753.5 million$1.6 billion as compared to $612.3 million$1.3 billion for the threesix months ended DecemberMarch 31, 2005.2006. Of this increase, $50.8$110.4 million, or 35.9%40.1% was provided by companies acquired in the past twelve months. Excluding revenuesrevenue provided by companies acquired in the past 12 months, revenuesrevenue for our PTS segment increased $90.5$164.6 million, or 14.8%12.5%. This increase was primarily attributable to continued economic growth in Australia and Canada including increased government and private sector spending infor infrastructure development in Australia and Canada as a result of continued economic growth and growth in our building and transportation business in the U.K.
Revenue, Net Service Revenuesof Other Direct Costs
For the threesix months ended DecemberMarch 31, 2006,2007, revenue, net service revenuesof other direct costs for our PTS segment increased $83.2$186.7 million, or 20.8%21.8%, to $482.8 million$1.0 billion as compared to $399.6$855.0 million for the threesix months ended DecemberMarch 31, 2005.2006. Of this increase, $37.4$87.0 million, or 45.0%46.6% was provided by companies acquired in
the past twelve months. Excluding revenue, net service revenuesof other direct costs provided by companies acquired in the past 12 months, revenue, net service revenuesof other direct for our PTS segment increased $45.7$99.8 million, or 11.4%11.7%. This increase was primarily attributable to the factors mentioned above.
Cost of Revenue, Net Service Revenuesof Other Direct Costs
For the threesix months ended DecemberMarch 31, 2006,2007, cost of revenue, net service revenuesof other direct costs for our PTS segment increased $35.3$85.4 million, or 17.0%19.3%, to $242.7$528.5 million as compared to $207.5$443.1 million in the threesix months ended DecemberMarch 31, 2005.2006. Of this increase, $18.8$41.5 million, or 53.3%48.6% was incurred by companies
acquired in the past twelve months. Excluding cost of revenue, net service revenuesof other direct costs incurred by companies acquired in the past twelve months, cost of revenue, net service revenuesof other direct costs increased by $16.5$43.9 million, or 7.9%9.9%. This lower rate of growth as compared to net service revenues was primarily attributable to higher margins of acquired companies, in particular those with an environmental management practice and margin improvement in our Canadian and U.K. operations. For the threesix months ended DecemberMarch 31, 2006,2007, cost of revenue, net service revenues,of other direct costs, as a percentage of revenue, net service revenues, were 50.3%of other direct costs, was 50.7% as compared to 51.9%51.8% for the threesix months ended DecemberMarch 31, 2005.2006.
Gross Profit
For the threesix months ended DecemberMarch 31, 2006,2007, gross profit for our PTS segment increased $47.9$101.3 million, or 24.9%24.6%, to $240.0$513.2 million as compared to $192.1$411.9 million for the threesix months ended DecemberMarch 31, 2005.2006. Of this increase, $18.6$45.5 million, or 38.8%44.9% was provided by companies acquired in the past 12 months. Excluding gross profit provided by companies acquired in the past 12 months, gross profit increased $29.3$55.8 million, or 15.2%13.6%. The increases were primarily attributable to success fees associated with a project in Australia, margin improvements in our Canadian and U.K. operations as well as our U.S. transportation sector. For the threesix months ended DecemberMarch 31, 2006,2007, gross profit, as a percentage of revenue, net service revenues,of other direct costs, was 49.7%49.3% as compared to 48.1%48.2% for the threesix months ended DecemberMarch 31, 2005.2006.
Equity in Earnings of Joint Ventures
For the threesix months ended DecemberMarch 31, 2006,2007, equity in earnings of joint ventures for our PTS segment decreased $0.4 million, or 47.5%27.8%, to $0.4$1.0 million as compared to $0.8$1.4 million for the threesix months ended DecemberMarch 31, 2005.2006.
Management Support Services
| | Three Months Ended | Change | ||||||||||
|---|---|---|---|---|---|---|---|---|---|---|---|---|
| | December 31, 2005 | December 31, 2006 | $ | % | ||||||||
| | ($ in thousands) | |||||||||||
| Revenues | $ | 134,479 | $ | 184,680 | $ | 50,201 | 37.3 | % | ||||
Net service revenues | $ | 13,574 | $ | 20,086 | $ | 6,512 | 48.0 | % | ||||
| Cost of net service revenues | 6,954 | 11,969 | 5,015 | 72.1 | % | |||||||
| Gross profit | $ | 6,620 | $ | 8,117 | $ | 1,497 | 22.6 | % | ||||
| | Six Months Ended | Change | |||||||||||
|---|---|---|---|---|---|---|---|---|---|---|---|---|---|
| | March 31, 2006 | March 31, 2007 | $ | % | |||||||||
| | ($ in thousands) | ||||||||||||
| Revenue | $ | 285,647 | $ | 425,171 | $ | 139,524 | 48.8 | % | |||||
| Other direct costs | 239,390 | 376,461 | 137,071 | 57.3 | |||||||||
| Revenue, net of other direct costs | 46,257 | 48,710 | 2,453 | 5.3 | |||||||||
| Cost of revenue, net of other direct costs | 28,896 | 27,751 | (1,145 | ) | (4.0 | ) | |||||||
| Gross profit | $ | 17,361 | $ | 20,959 | $ | 3,598 | 20.7 | % | |||||
The following table presents the percentage relationship of certain items to revenue, net service revenue:of other direct costs:
| | Three Months Ended | ||||
|---|---|---|---|---|---|
| | December 31, 2005 | December 31, 2006 | |||
| Net service revenues | 100.0 | % | 100.0 | % | |
| Cost of net service revenues | 51.2 | 59.6 | |||
| Gross profit | 48.8 | % | 40.4 | % | |
| | Six Months Ended | ||||
|---|---|---|---|---|---|
| | March 31, 2005 | March 31, 2006 | |||
| Revenue, net of other direct costs | 100.0 | % | 100.0 | % | |
| Cost of revenue, net of other direct costs | 62.5 | 57.0 | |||
| Gross profit | 37.5 | % | 43.0 | % | |
RevenuesRevenue
For the threesix months ended DecemberMarch 31, 2006,2007, revenues for our MSS segment increased $50.2$139.5 million, or 37.3%48.8%, to $184.7$425.2 million as compared to $134.5$285.6 million for the threesix months ended DecemberMarch 31, 2005, none of which was provided by companies acquired in the past 12 months.2006. This increase was primarily attributable to significant growth in the level of other direct costs associated with our war-related efforts in Kuwait, Iraq and Afghanistan offset by lower levels of self-performed work for combat support and global maintenance and supply services for the Department of Defense, offset by lower levels of other direct costs.Defense.
Revenue, Net Service Revenuesof Other Direct Costs
For the threesix months ended DecemberMarch 31, 2006,2007, revenue, net service revenuesof other direct costs for our MSS segment increased $6.5$2.5 million, or 48.0%5.3%, to $20.1$48.7 million as compared to $13.6$46.3 million for the threesix months ended DecemberMarch 31, 2005.2006. The remaining increasedecrease was primarily attributable to growththe completion of a contract in ourKuwait with higher levels of self-performed work forwhich represented approximately $5.0 million of the above mentioned combat support and global maintenance and supply services for the Departmentreduction in revenue, net of Defense.subcontractor costs.
Cost of Revenue, Net Service Revenuesof Other Direct Costs
For the threesix months ended DecemberMarch 31, 2006,2007, cost of net service revenuesrevenue for our MSS segment, increased $5.0net of other direct costs decreased $1.1 million, or 72.1%4.0%, to $12.0$27.8 million as compared to $7.0$28.9 million for the threesix months ended DecemberMarch 31, 2005.2006. For the threesix months ended DecemberMarch 31, 2006,2007, cost of revenue, net service revenues,of other direct costs, as a percentage of revenue, net service revenues, were 59.6%of other direct costs, was 57.0% as compared to 51.2%62.5% for the threesix months ended DecemberMarch 31, 2005.2006.
Gross Profit
For the threesix months ended DecemberMarch 31, 2006,2007, gross profit for our MSS segment increased $1.5$3.6 million, or 22.6%20.7%, to $8.1$21.0 million as compared to $6.6$17.4 million for the threesix months ended DecemberMarch 31, 2005.2006. For the threesix months ended DecemberMarch 31, 2006,2007, gross profit, as a percentage of revenue, net service revenues,of other direct costs, was 40.4%43.0% as compared to 48.8%37.5% for the threesix months ended DecemberMarch 31, 2005.2006. This increase in margin to revenue, net of other direct costs relates to fees charged on the increased other direct costs. However, for the threesix months ended DecemberMarch 31, 2006,2007, gross profit, as a percentage of revenues,revenue, was 4.4%4.9% as compared to 4.9%6.1% for the threesix months ended DecemberMarch 31, 2005. This decrease was primarily attributable to the completion of a higher margin project in the 2005 time period.2006.
Equity in Earnings of Joint Ventures
For the threesix months ended DecemberMarch 31, 2006,2007, equity in earnings of joint ventures for our MSS segment increased $1.3$2.6 million, or 144.4%223.3%, to $2.2$3.7 million as compared to $0.9$1.1 million for the threesix months ended DecemberMarch 31, 2005 primarily due2006 related to our participation in the Nevada Test Site project. Equity in earnings of joint ventures varies from period to period based upon the services performed for non-controlled and non-consolidated joint ventures.
Fiscal year ended September 30, 2006 compared to the fiscal year ended September 30, 2005
Consolidated Results
| | Fiscal Year Ended | Change | | Fiscal Year Ended | Change | ||||||||||||||||||||
|---|---|---|---|---|---|---|---|---|---|---|---|---|---|---|---|---|---|---|---|---|---|---|---|---|---|
| | September 30, 2005 | September 30, 2006 | $ | % | | September 30, 2005 | September 30, 2006 | $ | % | ||||||||||||||||
| | ($ in thousands) | | ($ in thousands) | ||||||||||||||||||||||
| Revenues | $ | 2,395,340 | $ | 3,421,492 | $ | 1,026,152 | 42.8 | % | |||||||||||||||||
| Other direct costs | 932,797 | 1,521,775 | 588,978 | 63.1 | |||||||||||||||||||||
| Revenue | Revenue | $ | 2,395,340 | $ | 3,421,492 | $ | 1,026,152 | 42.8 | % | ||||||||||||||||
| Other direct costs | 932,797 | 1,521,775 | 588,978 | 63.1 | |||||||||||||||||||||
| Net service revenues | 1,462,543 | 1,899,717 | 437,174 | 29.9 | |||||||||||||||||||||
| Cost of net service revenues | 785,066 | 993,909 | 208,843 | 26.6 | |||||||||||||||||||||
| Revenue, net of other direct costs | 1,462,543 | 1,899,717 | 437,174 | 29.9 | |||||||||||||||||||||
| Cost of revenue, net of other direct costs | 785,066 | 993,909 | 208,843 | 26.6 | |||||||||||||||||||||
| Gross profit | 677,477 | 905,808 | 228,331 | 33.7 | Gross profit | 677,477 | 905,808 | 228,331 | 33.7 | ||||||||||||||||
| Equity in earnings of joint ventures | 2,352 | 6,554 | 4,202 | 178.7 | Equity in earnings of joint ventures | 2,352 | 6,554 | 4,202 | 178.7 | ||||||||||||||||
| General and administrative expenses | 581,529 | 808,953 | 227,424 | 39.1 | General and administrative expenses | 581,529 | 808,953 | 227,424 | 39.1 | ||||||||||||||||
| Income from operations | 98,300 | 103,409 | 5,109 | 5.2 | Income from operations | 98,300 | 103,409 | 5,109 | 5.2 | ||||||||||||||||
| Minority interest in share of earnings | 8,453 | 13,924 | 5,471 | 64.7 | Minority interest in share of earnings | 8,453 | 13,924 | 5,471 | 64.7 | ||||||||||||||||
| Interest expense—net | 7,054 | 10,576 | 3,522 | 49.9 | Interest expense—net | 7,054 | 10,576 | 3,522 | 49.9 | ||||||||||||||||
| Income before income tax expense | 82,793 | 78,909 | (3,884 | ) | (4.7 | ) | Income before income tax expense | 82,793 | 78,909 | (3,884 | ) | (4.7 | ) | ||||||||||||
| Income tax expense | 28,979 | 25,223 | (3,756 | ) | (13.0 | ) | Income tax expense | 28,979 | 25,223 | (3,756 | ) | (13.0 | ) | ||||||||||||
| Net income | $ | 53,814 | $ | 53,686 | $ | (128 | ) | (0.2 | )% | Net income | $ | 53,814 | $ | 53,686 | $ | (128 | ) | (0.2 | )% | ||||||
The following table presents the percentage relationship of certain items to revenue, net service revenues:of other direct costs:
| | Fiscal Year Ended | Fiscal Year Ended | ||||||||
|---|---|---|---|---|---|---|---|---|---|---|
| | September 30, 2005 | September 30, 2006 | September 30, 2005 | September 30, 2006 | ||||||
| Net service revenues | 100.0 | % | 100.0 | % | ||||||
| Cost of net service revenues | 53.7 | 52.3 | ||||||||
| Revenue, net of other direct costs | 100.0 | % | 100.0 | % | ||||||
| Cost of revenue, net of other direct costs | 53.7 | 52.3 | ||||||||
| Gross profit | 46.3 | 47.7 | 46.3 | 47.7 | ||||||
| Equity in earnings of joint ventures | 0.2 | 0.3 | 0.2 | 0.3 | ||||||
| General and administrative expenses | 39.8 | 42.6 | 39.8 | 42.6 | ||||||
| Income from operations | 6.7 | 5.4 | 6.7 | 5.4 | ||||||
| Minority interest in share of earnings | 0.5 | 0.6 | 0.5 | 0.6 | ||||||
| Interest expense—net | 0.5 | 0.6 | 0.5 | 0.6 | ||||||
| Income before income tax expense | 5.7 | 4.2 | 5.7 | 4.2 | ||||||
| Income tax expense | 2.0 | 1.4 | 2.0 | 1.4 | ||||||
| Net income | 3.7 | % | 2.8 | % | 3.7 | % | 2.8 | % | ||
RevenuesRevenue
For fiscal 2006, revenues wererevenue was $3.4 billion, an increase of $1.0 billion, or 42.8%, over fiscal 2005. Of this increase, $414.4 million was provided by companies acquired in the past 12 months. Excluding revenuesrevenue provided by companies acquired in the past 12 months, revenuesrevenue increased $611.8 million, or 25.5% over fiscal 2005. RevenuesRevenue increased among most of our sectors and geographic markets. In particular, there was strong growth in our MSS segment due to increased revenuesrevenue in several existing and new contract awards.
Revenue, Net Service Revenuesof Other Direct Costs
For fiscal 2006, revenue, net service revenues wereof other direct costs was $1.9 billion, an increase of $437.2 million, or 29.9%, over fiscal 2005. Of this increase, $281.9 million was provided by companies acquired in the past 12 months. Excluding revenue, net service revenuesof other direct costs provided by companies acquired in the past 12 months, revenue, net service revenuesof other direct costs increased $155.3 million, or 10.6% over fiscal 2005. The difference between the growth rates of our revenuesrevenue and revenue, net services revenuesof other direct costs is primarily attributable to the level of subcontracted costs and other direct costs which can vary significantly from period to period depending on contract requirements and contract mix. In addition, as we realize variations in our billable hours or utilization rates, revenue, net service revenuesof other direct costs will vary.
Cost of Revenue, Net Service Revenuesof Other Direct Costs
For fiscal 2006, cost of revenue, net service revenuesof other direct costs was $993.9 million, an increase of $208.8 million, or 26.6%, over fiscal 2005. Of this increase, $128.2 million was incurred by companies acquired in the past 12 months. Excluding cost of revenue, net service revenuesof other direct costs incurred by companies acquired in the past 12 months, cost of revenue, net service revenuesof other direct costs increased $80.6 million, or 10.3% over fiscal 2005. Included in costs of revenue, net of other direct costs is stock match expense of $10.9 million and $2.4 million in fiscal 2006 and fiscal 2005, respectively. The cost of revenue, net service revenuesof other direct costs across our business segments was generally in line with the changes in revenue, net service revenuesof other direct costs for our business segments.
Gross Profit
Gross profit was $905.8 million in fiscal 2006, an increase of $228.3 million, or 33.7% over fiscal 2005. Of this increase, $153.7 million was provided by companies acquired in the past 12 months. Excluding gross profit provided by companies acquired in the past 12 months, gross profit increased $74.6 million, or 11.0% over fiscal 2005. As a percentage of revenue, net service revenue,of other direct costs, gross profit was 46.3% and 47.7% in fiscal 2005 and 2006, respectively. The increase in fiscal 2006 was primarily attributable to higher margins that were added through mergers and acquisitions in the past year in addition to margin improvements in our foreign operations.
Equity in Earnings of Joint Ventures
Equity in earnings of joint ventures was $6.5 million in fiscal 2006, an increase of $4.2 million over fiscal 2005 resulting from growth in our joint venture activities.
General and Administrative Expense
General and administrative expenses were $809.0 million in fiscal 2006, up $227.4 million, or 39.1%, over fiscal 2005. As a percentage of revenue, net service revenues,of other direct costs, general and administrative expenses increased from 39.8% in fiscal 2005 to 42.6% in fiscal 2006.
Included in general and administrative expense is amortization expense of acquired intangible assets. This amortization expense was $14.5 million in fiscal 2006, up $11.5 million, or 383.3%, over fiscal 2005 as a result of recent mergers and acquisitions. This expense will vary as we consummate mergers and acquisitions, however, we expect the amortization expense to be higher during the first 12 to 18 months following the acquisition due to the short-term nature of acquired backlog.
Also included in general and administrative expense is stock match expense of $3.8 million and $0.8 million in fiscal 2006 and fiscal 2005, respectively.
Also included in general and administrative expense is approximately $4.0 million in expense incurred related to our becoming a public reporting company, including our SOX compliance efforts.
We expect to continue to incur material levels of expense for our SOX compliance efforts through fiscal 2007 and 2008.
This overall increase in our general and administrative expense was largely the result of increased personnel, including personnel associated with acquired companies, the factors described above,
increased costs to support growth and compliance efforts, as well as one-time expenses related to recent mergers and acquisitions of $5.5 million.
Income From Operations
An overall increase in our business activity, higher gross profit, offset by higher general and administrative expenses, resulted in income from operations of $103.4 million in fiscal 2006, an increase of $5.1 million, or 5.2%, from $98.3 million in fiscal 2005.
Interest Expense—Net
Interest expense, net of $3.5 million of interest income, increased to $10.6 million in fiscal 2006, compared to $7.1 million in fiscal 2005. This increase is primarily attributable to higher average borrowings throughout the year to fund mergers and acquisitions, partially offset by strong cash flow from operations, $128.4 million in excess proceeds from the $235.0 million sale of our Class F and Class G convertible stock and a $1.1 million gain on the termination of our interest-rate swap contracts. At September 30, 2006, borrowings under our Amended and Restated Credit Agreement, our Term Credit Agreement and senior notes outstanding totaled $133.8 million, as compared to $229.7 million at September 30, 2005.
Income Tax Expense
Income tax expense was $25.2 million in fiscal 2006, compared to $29.0 million in fiscal 2005. The effective tax rate was 32.0% in fiscal 2006, as compared to 35.0% in fiscal 2005. The decrease in the effective tax rate was primarily attributable to the favorable resolution of certain contingencies relating to audits that were unresolved at September 30, 2005.
Net Income
The factors described above resulted in net income of $53.7 million in fiscal 2006, as compared to net income of $53.8 million in fiscal 2005.
Results of Operations by Reportable Segment
Professional Technical Services
| | Fiscal Year Ended | Change | ||||||||||
|---|---|---|---|---|---|---|---|---|---|---|---|---|
| | September 30, 2005 | September 30, 2006 | $ | % | ||||||||
| | ($ in thousands) | |||||||||||
| Revenues | $ | 2,082,618 | $ | 2,772,833 | $ | 690,215 | 33.1 | % | ||||
Net service revenues | $ | 1,415,450 | $ | 1,787,078 | $ | 371,628 | 26.3 | % | ||||
| Cost of net service revenues | 753,231 | 914,773 | 161,542 | 21.4 | % | |||||||
| Gross profit | $ | 662,219 | $ | 872,305 | $ | 210,086 | 31.7 | % | ||||
| | Fiscal Year Ended | Change | |||||||||||
|---|---|---|---|---|---|---|---|---|---|---|---|---|---|
| | September 30, 2005 | September 30, 2006 | $ | % | |||||||||
| | ($ in thousands) | ||||||||||||
| Revenue | $ | 2,082,618 | $ | 2,772,833 | $ | 690,215 | 33.1 | % | |||||
Revenue, net of other direct costs | $ | 1,415,450 | $ | 1,787,078 | $ | 371,628 | 26.3 | % | |||||
| Cost of revenue, net of other direct costs | 753,231 | 914,773 | 161,542 | 21.4 | % | ||||||||
| Gross profit | $ | 662,219 | $ | 872,305 | $ | 210,086 | 31.7 | % | |||||
The following table presents the percentage relationship of certain items to revenue, net of subcontractorother direct costs:
| | Fiscal Year Ended | ||||
|---|---|---|---|---|---|
| | September 30, 2005 | September 30, 2006 | |||
| Net service revenues | 100.0 | % | 100.0 | % | |
| Cost of net service revenues | 53.2 | 51.2 | |||
| Gross profit | 46.8 | % | 48.8 | % | |
| | Fiscal Year Ended | ||||
|---|---|---|---|---|---|
| | September 30, 2005 | September 30, 2006 | |||
| Revenue, net of other direct costs | 100.0 | % | 100.0 | % | |
| Cost of revenue, net of other direct costs | 53.2 | 51.2 | |||
| Gross profit | 46.8 | % | 48.8 | % | |
RevenuesRevenue
RevenuesRevenue for our PTS segment werewas $2.8 billion in fiscal 2006, an increase of $690.2 million, or 33.1%, over fiscal 2005. Of this increase, $414.4 million was provided by companies acquired in the past 12 months. Excluding revenuesrevenue provided by companies acquired in the past 12 months, revenuesrevenue increased $275.8 million, or 13.2% over fiscal 2005. PTS experienced growth throughout most of its business areas, with the exception of U.S. transportation operations due to temporary delays on certain large transportation projects.
Revenue, Net Service Revenuesof Other Direct Costs
Net service revenuesRevenue, net of other direct costs for our PTS segment werewas $1.8 billion in fiscal 2006, an increase of $371.6 million, or 26.3%, over fiscal 2005. Of this increase, $281.9 million was provided by companies acquired in the past 12 months. Excluding revenue, net service revenuesof other direct costs provided by companies acquired in the past 12 months, revenue, net service revenuesof other direct costs increased $89.7 million, or 6.3%, over fiscal 2005. Net service revenuesRevenue, net of other direct costs increased at a lower rate as compared to gross revenuesrevenue due to higher pass-through costs to subcontractors included in total revenues.revenue.
Cost of Revenue, Net Service Revenuesof Other Direct Costs
The cost of revenue, net service revenuesof other direct costs for our PTS segment was $914.8 million in fiscal 2006, an increase of $161.5 million, or 21.4%, over fiscal 2005. Of this increase, $128.2 million was incurred by companies acquired in the past 12 months. Excluding cost of revenue, net service revenuesof other direct costs incurred by companies acquired in the past 12 months, cost of revenue, net service revenuesof other direct costs increased $33.3 million, or 4.4%.
Gross Profit
Gross profit for our PTS segment was $872.3 million in fiscal 2006, an increase of $210.1 million, or 31.7% over fiscal 2005. Of this increase, $153.7 million was provided by companies acquired in the past 12 months. Excluding gross profit provided by companies acquired in the past 12 months, gross profit increased $56.4 million, or 8.5%. As a percentage of revenue, net service revenue,of other direct costs, gross profit was 48.8% of revenue, net service revenueof other direct costs in fiscal 2006 as compared to 46.8% in fiscal 2005. These changes were attributable to the factors described above.
Equity in Earnings of Joint Ventures
Equity in earnings of joint ventures for our PTS segment was $3.0 million in fiscal 2006, an increase of $0.6 million over fiscal 2005.
Management Support Services
| | Fiscal Year Ended | Change | ||||||||||
|---|---|---|---|---|---|---|---|---|---|---|---|---|
| | September 30, 2004 | September 30, 2005 | $ | % | ||||||||
| | ($ in thousands) | |||||||||||
| Revenues | $ | 309,053 | $ | 647,188 | $ | 338,135 | 109.4 | % | ||||
Net service revenues | $ | 42,977 | $ | 89,794 | $ | 46,817 | 108.9 | % | ||||
| Cost of net service revenues | 29,010 | 50,921 | 21,911 | 75.5 | % | |||||||
| Gross profit | $ | 13,967 | $ | 38,873 | $ | 24,906 | 178.3 | % | ||||
| | Fiscal Year Ended | Change | |||||||||||
|---|---|---|---|---|---|---|---|---|---|---|---|---|---|
| | September 30, 2005 | September 30, 2006 | $ | % | |||||||||
| | ($ in thousands) | ||||||||||||
| Revenue | $ | 309,053 | $ | 647,188 | $ | 338,135 | 109.4 | % | |||||
Revenue, net of other direct costs | $ | 42,977 | $ | 89,794 | $ | 46,817 | 108.9 | % | |||||
| Cost of revenue, net of other direct costs | 29,010 | 50,921 | 21,911 | 75.5 | % | ||||||||
| Gross profit | $ | 13,967 | $ | 38,873 | $ | 24,906 | 178.3 | % | |||||
The following table presents the percentage relationship of certain items to revenue, net of subcontractorother direct costs:
| | Fiscal Year Ended | ||||
|---|---|---|---|---|---|
| | September 30, 2004 | September 30, 2005 | |||
| Net service revenues | 100.0 | % | 100.0 | % | |
| Cost of net service revenues | 67.5 | 56.7 | |||
| Gross profit | 32.5 | % | 43.3 | % | |
| | Fiscal Year Ended | ||||
|---|---|---|---|---|---|
| | September 30, 2005 | September 30, 2006 | |||
| Revenue, net of other direct costs | 100.0 | % | 100.0 | % | |
| Cost of revenue, net of other direct costs | 67.5 | 56.7 | |||
| Gross profit | 32.5 | % | 43.3 | % | |
RevenuesRevenue
RevenuesRevenue for our MSS segment werewas $647.2 million in fiscal 2006, an increase of $338.1 million, or 109.4%, over fiscal 2005, none of which was provided by companies acquired in the past 12 months. The increase in revenuesrevenue was primarily attributable to the continuing military activities in the Middle East, resulting in demand for maintenance and operations of installations as well as modification work on military vehicles and systems. We also realized a substantial increase in the value of our indefinite delivery/indefinite quantity contracts. The nature of our work task orders focus on establishing facilities, general support and maintenance for U.S. military pre-positioned stocks, logistics, equipment and fleet management.
Revenue, Net Service Revenueof Other Direct Costs
Net service revenuesRevenue, net of other direct costs for our MSS segment werewas $89.8 million in fiscal 2006, an increase of $46.8 million, or 108.9% over fiscal 2005. Net service revenuesRevenue, net of other direct costs increased at a slower rate than gross revenuesrevenue due to a higher amount of pass-through costs that are included in gross revenues.revenue.
Cost of Revenue, Net Service Revenueof Other Direct Costs
The cost of revenue, net service revenuesof other direct costs for our MSS segment was $50.9 million in fiscal 2006, an increase of $21.9 million, or 75.5% over fiscal 2005. This increase was due to higher indirect expenses associated with the increase in business volume and employee-related expenses.
Gross Profit
Gross profit for our MSS segment was $38.9 million in fiscal 2006, an increase of $24.9 million, or 178.3% over fiscal 2005. As a percentage of revenue, net service revenue,of other direct costs, gross profit was 43.3% in fiscal 2006 as compared to 32.5% in fiscal 2005.
Equity in Earnings of Joint Ventures
Equity in earnings of joint ventures for our MSS segment was $4.9 million in fiscal 2006, an increase of $4.9 million over fiscal 2005. The increase was primarily attributable to earnings from recently formed unconsolidated joint ventures. Due to our minority interest in this joint venture, the earnings are not reflected in revenuesrevenue for our MSS segment. The joint ventures provide peacekeeping services, administrative support for civilian agencies and response training for law enforcement and military personnel. In addition, the award of the management and operations contract of the U.S. government's Nevada Test Site to the limited liability company for which we serve as a key partner provided earnings contribution through contract award fee performance.
Fiscal year ended September 30, 2005 compared to the fiscal year ended September 30, 2004
Consolidated Results
| | Fiscal Year Ended | Change | | Fiscal Year Ended | Change | ||||||||||||||||||||
|---|---|---|---|---|---|---|---|---|---|---|---|---|---|---|---|---|---|---|---|---|---|---|---|---|---|
| | September 30, 2004 | September 30, 2005 | $ | % | | September 30, 2004 | September 30, 2005 | $ | % | ||||||||||||||||
| | ($ in thousands) | | ($ in thousands) | ||||||||||||||||||||||
| Revenues | $ | 2,011,975 | $ | 2,395,340 | $ | 383,365 | 19.1 | % | |||||||||||||||||
| Other direct costs | 775,722 | 932,797 | 157,075 | 20.2 | |||||||||||||||||||||
| Revenue | Revenue | $ | 2,011,975 | $ | 2,395,340 | $ | 383,365 | 19.1 | % | ||||||||||||||||
| Other direct costs | 775,722 | 932,797 | 157,075 | 20.2 | |||||||||||||||||||||
| Net service revenues | 1,236,253 | 1,462,543 | 226,290 | 18.3 | |||||||||||||||||||||
| Cost of net service revenues | 667,697 | 785,066 | 117,369 | 17.6 | |||||||||||||||||||||
| Revenue, net of other direct costs | 1,236,253 | 1,462,543 | 226,290 | 18.3 | |||||||||||||||||||||
| Cost of revenue, net of other direct costs | 667,697 | 785,066 | 117,369 | 17.6 | |||||||||||||||||||||
| Gross profit | 568,556 | 677,477 | 108,921 | 19.2 | Gross profit | 568,556 | 677,477 | 108,921 | 19.2 | ||||||||||||||||
| Equity in earnings of joint ventures | 2,517 | 2,352 | (165 | ) | (6.6 | ) | Equity in earnings of joint ventures | 2,517 | 2,352 | (165 | ) | (6.6 | ) | ||||||||||||
| General and administrative expenses | 484,446 | 581,529 | 97,083 | 20.0 | General and administrative expenses | 484,446 | 581,529 | 97,083 | 20.0 | ||||||||||||||||
| Income from operations | 86,627 | 98,300 | 11,673 | 13.5 | Income from operations | 86,627 | 98,300 | 11,673 | 13.5 | ||||||||||||||||
| Minority interest in share of earnings | 3,239 | 8,453 | 5,214 | 161.0 | Minority interest in share of earnings | 3,239 | 8,453 | 5,214 | 161.0 | ||||||||||||||||
| Interest expense—net | 6,968 | 7,054 | 86 | 1.2 | Interest expense—net | 6,968 | 7,054 | 86 | 1.2 | ||||||||||||||||
| Income before income tax expense | 76,420 | 82,793 | 6,373 | 8.3 | Income before income tax expense | 76,420 | 82,793 | 6,373 | 8.3 | ||||||||||||||||
| Income tax expense | 25,984 | 28,979 | 2,995 | 11.5 | Income tax expense | 25,984 | 28,979 | 2,995 | 11.5 | ||||||||||||||||
| Net income | $ | 50,436 | $ | 53,814 | $ | 3,378 | 6.7 | % | Net income | $ | 50,436 | $ | 53,814 | $ | 3,378 | 6.7 | % | ||||||||
The following table presents the percentage relationship of certain items to revenue, net service revenues:of other direct costs:
| | Fiscal Year Ended | | | Fiscal Year Ended | | | ||||||||||
|---|---|---|---|---|---|---|---|---|---|---|---|---|---|---|---|---|
| | September 30, 2004 | September 30, 2005 | | | September 30, 2004 | September 30, 2005 | | | ||||||||
| Net service revenues | 100.0 | % | 100.0 | % | ||||||||||||
| Cost of net service revenues | 54.0 | 53.7 | ||||||||||||||
| Revenue, net of other direct costs | 100.0 | % | 100.0 | % | ||||||||||||
| Cost of revenue, net of other direct costs | 54.0 | 53.7 | ||||||||||||||
| Gross profit | 46.0 | 46.3 | 46.0 | 46.3 | ||||||||||||
| Equity in earnings of joint ventures | 0.2 | 0.2 | 0.2 | 0.2 | ||||||||||||
| General and administrative expenses | 39.2 | 39.8 | 39.2 | 39.8 | ||||||||||||
| Income from operations | 7.0 | 6.7 | 7.0 | 6.7 | ||||||||||||
| Minority interest in share of earnings | 0.2 | 0.5 | 0.2 | 0.5 | ||||||||||||
| Interest expense—net | 0.6 | 0.5 | 0.6 | 0.5 | ||||||||||||
| Income before income tax expense | 6.2 | 5.7 | 6.2 | 5.7 | ||||||||||||
| Income tax expense | 2.1 | 2.0 | 2.1 | 2.0 | ||||||||||||
| Net income | 4.1 | % | 3.7 | % | 4.1 | % | 3.7 | % | ||||||||
RevenuesRevenue
For fiscal 2005, revenues wererevenue was $2.4 billion, an increase of $383.4 million, or 19.1%, over fiscal 2004. Of this increase, $210.2 million was provided by companies acquired in the past 12 months. Excluding revenuesrevenue provided by companies acquired in the past 12 months, revenuesrevenue increased $173.2 million, or 8.6% over fiscal 2004.
Revenue, Net Service Revenuesof Other Direct Costs
For fiscal 2005, revenue, net service revenues wereof other direct costs was $1.5 billion, an increase of $226.3 million, or 18.3%, over fiscal 2004. Of this increase, $147.6 million was provided by companies acquired in the past 12 months. Excluding revenue, net service revenuesof other direct costs provided by companies acquired in the past 12 months, revenue, net service revenuesof other direct costs increased $78.7 million, or 6.4% over fiscal 2004.
Cost of Revenue, Net Service Revenuesof Other Direct Costs
The cost of revenue, net service revenuesof other direct costs was $785.1 million in fiscal 2005, an increase of $117.4 million, or 17.6%, over fiscal 2004. Of this increase, $74.6 million was incurred by companies acquired in the past 12 months. Excluding cost of revenue, net service revenuesof other direct costs incurred by companies acquired in the past 12 months, cost of revenue, net service revenuesof other direct costs increased $42.8 million, or 6.4% over fiscal 2004. Included in costs of revenue, net of other direct costs is stock match expense of $2.4 million and $1.3 million in fiscal 2005 and fiscal 2004, respectively. The cost of revenue, net service revenuesof other direct costs across our business segments was generally in line with the changes in revenue, net service revenuesof other direct costs for each business segment.
Gross Profit
Gross profit was $677.5 million in fiscal 2005, an increase of $108.9 million, or 19.2% over fiscal 2004. Of this increase, gross profit provided by companies acquired in the past 12 months was $73.0 million. Excluding gross profit provided by companies acquired in the past 12 months, gross profit increased $35.9 million, or 6.3% over fiscal 2004. As a percentage of revenue, net service revenue,of other direct costs, gross profit was 46.0% and 46.3% in fiscal 2004 and 2005, respectively. The slight increase in fiscal 2005 was primarily attributable to improvements in margins in our operations outside of the U.S.
Equity in Earnings of Joint Ventures
Equity in earnings of joint ventures was $2.4 million in fiscal 2005, a decrease of $0.2 million over fiscal 2004.
General and Administrative Expense
General and administrative expenses were $581.5 million in fiscal 2005, up $97.1 million, or 20.0%, over fiscal 2004. As a percentage of revenue, net service revenue,of other direct costs, general and administrative expenses increased from 39.2% in fiscal 2004 to 39.8% in fiscal 2005.
Included in general and administrative expense is amortization expense of acquired intangible assets. This amortization expense was $3.0 million in fiscal 2005 as compared to $0.0 million in fiscal 2004.
Also included in general and administrative expense is stock match expense of $0.8 million and $0.5 million in fiscal 2005 and fiscal 2004, respectively.
Also included in general and administrative expense was increased expenditures for new corporate initiatives, including transition costs associated with implementing a company-wide enterprise resource planning (ERP) platform. Higher gross profit, offset by higher general and administrative expenses, resulted in income from operations of $98.3 million in fiscal 2005, an increase of $11.7 million, or 13.5%, from $86.6 million of income from operations in fiscal 2004.
Interest Expense—Net
Interest expense, net of $2.1 million interest income, increased slightly to $7.1 million in fiscal 2005, compared to $7.0 million in fiscal 2004. Borrowings under our credit agreement and senior notes outstanding totaled $229.7 million at September 30, 2005 as compared to $108.3 million at September 30, 2004. The difference is primarily attributable to borrowings under our credit facility to finance an acquisition in September 2005.
Income Tax Expense
Income tax expense was $29.0 million in fiscal 2005, compared to $26.0 million in fiscal 2004. The effective tax rate was 32% both in fiscal 2005 and fiscal 2004.
Net Income
The factors described above resulted in net income of $53.8 million in fiscal 2005, compared to net income of $50.4 million in fiscal 2004.
Results of Operations by Reportable Segment
Professional Technical Services
| | Fiscal Year Ended | Change | ||||||||||
|---|---|---|---|---|---|---|---|---|---|---|---|---|
| | September 30, 2004 | September 30, 2005 | $ | % | ||||||||
| | ($ in thousands) | |||||||||||
| Revenues | $ | 1,777,718 | $ | 2,082,618 | $ | 304,900 | 17.2 | % | ||||
Net service revenues | $ | 1,198,354 | $ | 1,415,450 | $ | 217,096 | 18.1 | % | ||||
| Cost of net service revenues | 636,962 | 753,231 | 116,269 | 18.3 | % | |||||||
| Gross profit | $ | 561,392 | $ | 662,219 | $ | 100,827 | 18.0 | % | ||||
| | Fiscal Year Ended | Change | |||||||||||
|---|---|---|---|---|---|---|---|---|---|---|---|---|---|
| | September 30, 2004 | September 30, 2005 | $ | % | |||||||||
| | ($ in thousands) | ||||||||||||
| Revenue | $ | 1,777,718 | $ | 2,082,618 | $ | 304,900 | 17.2 | % | |||||
Revenue, net of other direct costs | $ | 1,198,354 | $ | 1,415,450 | $ | 217,096 | 18.1 | % | |||||
| Cost of revenue, net of other direct costs | 636,962 | 753,231 | 116,269 | 18.3 | % | ||||||||
| Gross profit | $ | 561,392 | $ | 662,219 | $ | 100,827 | 18.0 | % | |||||
The following table presents the percentage relationship of certain items to revenue, net of subcontractorother direct costs:
| | Fiscal Year Ended | | | |||||
|---|---|---|---|---|---|---|---|---|
| | September 30, 2004 | September 30, 2005 | | | ||||
| Net service revenues | 100.0 | % | 100.0 | % | ||||
| Cost of net service revenues | 53.2 | 53.2 | ||||||
| Gross profit | 46.8 | % | 46.8 | % | ||||
| | Fiscal Year Ended | | | |||||
|---|---|---|---|---|---|---|---|---|
| | September 30, 2004 | September 30, 2005 | | | ||||
| Revenue, net of other direct costs | 100.0 | % | 100.0 | % | ||||
| Cost of revenue, net of other direct costs | 53.2 | 53.2 | ||||||
| Gross profit | 46.8 | % | 46.8 | % | ||||
RevenuesRevenue
RevenuesRevenue for our PTS segment werewas $2.1 billion in fiscal 2005, an increase of $304.9 million, or 17.2%, over fiscal 2004. Of this increase, $210.2 million was provided by companies acquired in the past twelve months. Excluding revenuesrevenue of companies acquired in the past 12 months, revenuesrevenue for our PTS segment increased $94.7 million, or 5.3% over fiscal 2004. PTS experienced growth throughout most of its business areas, offset by decreases in state and local government spending due to continuing budget deficits.
Revenue, Net Service Revenuesof Other Direct Costs
Net service revenuesRevenue, net of other direct costs for our PTS segment was $1.4 billion in fiscal 2005, an increase of $217.1 million, or 18.1%, over fiscal 2004. Of this increase, $147.6 million was provided by companies acquired in the past 12 months. Excluding revenue, net service revenuesof other direct costs of companies acquired in the past 12 months, revenue, net service revenuesof other direct costs for our PTS segment increased $69.5 million, or 5.8% over fiscal 2004. Net service revenuesRevenue, net of other direct costs increased at a higher rate as compared to gross revenuesrevenue due to the inclusion of lower pass-through costs to subcontractors included in gross revenues.revenue.
Cost of Revenue, Net Service Revenuesof Other Direct Costs
The cost of revenue, net service revenuesof other direct costs for our PTS segment was $753.2 million in fiscal 2005, an increase of $116.3 million, or 18.3%, over fiscal 2004. Of this increase, $74.6 million was incurred by companies acquired in the past 12 months. Excluding cost of revenue, net service revenuesof other direct costs from companies acquired in the past 12 months, cost of revenue, net service revenuesof other direct costs for our PTS segment increased $41.7 million, or 6.5%, over fiscal 2004.
Gross Profit
Gross profit for our PTS segment was $662.2 million in fiscal 2005, an increase of $100.8 million, or 18.0% over fiscal 2004. Of this increase, $73.0 million was provided by companies acquired in the past 12 months. Excluding gross profit provided by companies acquired in the past 12 months, gross profit for our PTS segment increased $27.8 million, or 5.0%, over fiscal 2004. As a percentage of revenue, net service revenue,of other direct costs, gross profit was 46.8% in fiscal 2005 and fiscal 2004.
Equity in Earnings of Joint Ventures
Equity in earnings of joint ventures for our PTS segment was $2.4 million in fiscal 2005, a decrease of $0.2 million, or 6.6%, over fiscal 2004.
Management Support Services
| | Fiscal Year Ended | Change | ||||||||||
|---|---|---|---|---|---|---|---|---|---|---|---|---|
| | September 30, 2004 | September 30, 2005 | $ | % | ||||||||
| | ($ in thousands) | |||||||||||
| Revenues | $ | 232,143 | $ | 309,053 | $ | 76,910 | 33.1 | % | ||||
Net service revenues | $ | 35,785 | $ | 42,977 | $ | 7,192 | 20.1 | % | ||||
| Cost of net service revenues | 29,399 | 29,010 | (389 | ) | (1.3 | )% | ||||||
| Gross profit | $ | 6,386 | $ | 13,967 | $ | 7,581 | 118.7 | % | ||||
| | Fiscal Year Ended | Change | |||||||||||
|---|---|---|---|---|---|---|---|---|---|---|---|---|---|
| | September 30, 2004 | September 30, 2005 | $ | % | |||||||||
| | ($ in thousands) | ||||||||||||
| Revenue | $ | 232,143 | $ | 309,053 | $ | 76,910 | 33.1 | % | |||||
Revenue, net of other direct costs | $ | 35,785 | $ | 42,977 | $ | 7,192 | 20.1 | % | |||||
| Cost of revenue, net of other direct costs | 29,399 | 29,010 | (389 | ) | (1.3 | )% | |||||||
| Gross profit | $ | 6,386 | $ | 13,967 | $ | 7,581 | 118.7 | % | |||||
The following table presents the percentage relationship of certain items to revenue, net of subcontractorother direct costs:
| | Fiscal Year Ended | | | |||||
|---|---|---|---|---|---|---|---|---|
| | September 30, 2004 | September 30, 2005 | | | ||||
| Net service revenues | 100.0 | % | 100.0 | % | ||||
| Cost of net service revenues | 82.2 | 67.5 | ||||||
| Gross profit | 17.8 | % | 32.5 | % | ||||
| | Fiscal Year Ended | | | |||||
|---|---|---|---|---|---|---|---|---|
| | September 30, 2004 | September 30, 2005 | | | ||||
| Revenue, net of other direct costs | 100.0 | % | 100.0 | % | ||||
| Cost of revenue, net of other direct costs | 82.2 | 67.5 | ||||||
| Gross profit | 17.8 | % | 32.5 | % | ||||
RevenuesRevenue
RevenuesRevenue for our MSS segment werewas $309.1 million in fiscal 2005, an increase of $76.9 million, or 33.1%, over fiscal 2004, none of which was provided by companies acquired in the past 12 months. The increase in MSS revenuesrevenue resulted from increased revenuesrevenue in operations and maintenance services for the U.S. military that was associated with the continued high level of activities in the Middle East in addition to increased revenuesrevenue from our U.S. installation operation services.
Revenue, Net Service Revenuesof Other Direct Costs
Net service revenuesRevenue, net of other direct costs for our MSS segment werewas $43.0 million in fiscal 2005, an increase of $7.2 million, or 20.1%, over fiscal 2004.
Cost of Revenue, Net Service Revenuesof Other Direct Costs
The cost of revenue, net service revenuesof other direct costs for our MSS segment was $29.0 million in fiscal 2005, a decrease of $0.4 million, or 1.3% over fiscal 2004. This decrease in costs was primarily attributable to an increase in higher margin contracts for support service. The support contracts generally carry higher margins than operation and maintenance and field-based services contracts.
Gross Profit
Gross profit for our MSS segment was $14.0 million in fiscal 2005, an increase of $7.6 million, or 118.7%, over fiscal 2004. As a percentage of revenue, net service revenue,of other direct costs, gross profit was 32.5% in fiscal 2005 as compared to 17.8% in fiscal 2004.
Seasonality
We experience seasonal trends in our business. Our revenues arerevenue is typically lower in the first quarter of our fiscal year, primarily due to lower utilization rates attributable to holidays recognized around the world. Our revenues arerevenue is typically higher in the last half of the year. Many U.S. state governments with fiscal years ending on June 30 tend to accelerate spending during their first quarter, when new funding becomes available. In addition, we find that the U.S Federal government tends to authorize more work during the period preceding the end of its fiscal year, September 30. Further, our construction management revenue typically increases during the high construction season of the summer months. For these reasons coupled with the number and significance of client contracts commenced and completed during a period as well as the time of expenses incurred for corporate initiatives, it is not unusual for us to experience seasonal changes or fluctuations in our quarterly operating results.
Quarterly Results of Operations
The following table shows, for the periods indicated, unaudited selected quarterly financial data from our consolidated statements of income modified to display the effect of the non-GAAP measure net service revenues in which our management uses to analyze our results of operations (see "Components of Income and Expense" contained earlier in this discussion).income. We believe this data includes all adjustments, consisting only of normal recurring adjustments that are necessary for a fair presentation of the results of operations for these periods. The unaudited selected quarterly financial data below should be read in conjunction with our audited consolidated financial statements and
related notes included elsewhere in
this prospectus. Our operating results in any one quarter are not necessarily indicative of the results that may be expected for any future period.
| Fiscal Year 2006: | First Quarter | Second Quarter | Third Quarter | Fourth Quarter | ||||||||
|---|---|---|---|---|---|---|---|---|---|---|---|---|
| | (in thousands) | |||||||||||
| Revenues | $ | 746,797 | $ | 858,930 | $ | 911,486 | $ | 904,279 | ||||
| Other direct costs | 331,450 | 369,089 | 417,057 | 404,179 | ||||||||
| Net service revenues | 415,347 | 489,841 | 494,429 | 500,100 | ||||||||
| Cost of net service revenues | 215,308 | 260,818 | 261,524 | 256,259 | ||||||||
| Gross profit | 200,039 | 229,023 | 232,905 | 243,841 | ||||||||
| Equity in earnings of joint ventures | 1,670 | 893 | 1,554 | 2,437 | ||||||||
| General and administrative expenses | 176,983 | 204,838 | 209,340 | 217,792 | ||||||||
| Income from operations | 24,726 | 25,078 | 25,119 | 28,486 | ||||||||
| Minority interest in share of earnings | 1,951 | 3,530 | 3,022 | 5,421 | ||||||||
| Interest expense — net | 3,723 | 4,067 | 2,528 | 258 | ||||||||
| Income before income tax expense | 19,052 | 17,481 | 19,569 | 22,807 | ||||||||
| Income tax expense | 6,097 | 5,594 | 6,262 | 7,270 | ||||||||
| Net income | $ | 12,955 | $ | 11,887 | $ | 13,307 | $ | 15,537 | ||||
| Fiscal Year 2005: | First Quarter | Second Quarter | Third Quarter | Fourth Quarter | ||||||||
|---|---|---|---|---|---|---|---|---|---|---|---|---|
| | (in thousands) | |||||||||||
| Revenues | $ | 531,064 | $ | 579,507 | $ | 624,931 | $ | 659,838 | ||||
| Other direct costs | 205,983 | 214,702 | 247,920 | 264,192 | ||||||||
| Net service revenues | 325,081 | 364,805 | 377,011 | 395,646 | ||||||||
| Cost of net service revenues | 175,315 | 197,532 | 203,515 | 208,704 | ||||||||
| Gross profit | 149,766 | 167,273 | 173,496 | 186,942 | ||||||||
| Equity in earnings of joint ventures | 763 | 223 | 130 | 1,236 | ||||||||
| General and administrative expenses | 130,090 | 146,695 | 149,559 | 155,185 | ||||||||
| Income from operations | 20,439 | 20,801 | 24,067 | 32,993 | ||||||||
| Minority interest in share of earnings | 1,465 | 2,504 | 2,329 | 2,155 | ||||||||
| Interest expense — net | 1,763 | 2,286 | 1,366 | 1,639 | ||||||||
| Income before income tax expense | 17,211 | 16,011 | 20,372 | 29,199 | ||||||||
| Income tax expense | 6,023 | 5,604 | 7,130 | 10,222 | ||||||||
| Net income | $ | 11,188 | $ | 10,407 | $ | 13,242 | $ | 18,977 | ||||
| Fiscal Year 2006: | First Quarter | Second Quarter | Third Quarter | Fourth Quarter | ||||||||
|---|---|---|---|---|---|---|---|---|---|---|---|---|
| | (in thousands) | |||||||||||
| Revenue | $ | 746,797 | $ | 858,930 | $ | 911,486 | $ | 904,279 | ||||
| Cost of revenue | 546,758 | 629,907 | 678,581 | 660,438 | ||||||||
| Gross profit | 200,039 | 229,023 | 232,905 | 243,841 | ||||||||
| Equity in earnings of joint ventures | 1,670 | 893 | 1,554 | 2,437 | ||||||||
| General and administrative expenses | 176,983 | 204,838 | 209,340 | 217,792 | ||||||||
| Income from operations | 24,726 | 25,078 | 25,119 | 28,486 | ||||||||
| Minority interest in share of earnings | 1,951 | 3,530 | 3,022 | 5,421 | ||||||||
| Interest expense — net | 3,723 | 4,067 | 2,528 | 258 | ||||||||
| Income before income tax expense | 19,052 | 17,481 | 19,569 | 22,807 | ||||||||
| Income tax expense | 6,097 | 5,594 | 6,262 | 7,270 | ||||||||
| Net income | $ | 12,955 | $ | 11,887 | $ | 13,307 | $ | 15,537 | ||||
| Fiscal Year 2005: | First Quarter | Second Quarter | Third Quarter | Fourth Quarter | ||||||||
|---|---|---|---|---|---|---|---|---|---|---|---|---|
| | (in thousands) | |||||||||||
| Revenue | $ | 531,064 | $ | 579,507 | $ | 624,931 | $ | 659,838 | ||||
| Cost of revenue | 381,298 | 412,234 | 451,435 | 472,896 | ||||||||
| Gross profit | 149,766 | 167,273 | 173,496 | 186,942 | ||||||||
| Equity in earnings of joint ventures | 763 | 223 | 130 | 1,236 | ||||||||
| General and administrative expenses | 130,090 | 146,695 | 149,559 | 155,185 | ||||||||
| Income from operations | 20,439 | 20,801 | 24,067 | 32,993 | ||||||||
| Minority interest in share of earnings | 1,465 | 2,504 | 2,329 | 2,155 | ||||||||
| Interest expense — net | 1,763 | 2,286 | 1,366 | 1,639 | ||||||||
| Income before income tax expense | 17,211 | 16,011 | 20,372 | 29,199 | ||||||||
| Income tax expense | 6,023 | 5,604 | 7,130 | 10,222 | ||||||||
| Net income | $ | 11,188 | $ | 10,407 | $ | 13,242 | $ | 18,977 | ||||
Liquidity and Capital Resources
Cash Flows
We have historically relied on cash flow from operations, proceeds from sales of stock (both to employees and to institutional investors) and borrowings under debt facilities to satisfy our working capital requirements as well as to fund share repurchases and mergers and acquisitions. In the future, we may need to raise additional funds through public and/or additional private debt or equity financings to take advantage of business opportunities, including existing business growth and mergers and acquisitions.
At DecemberMarch 31, 2006,2007, cash and cash equivalents was $137.8$116.3 million, an increasea decrease of $9.9$11.6 million, or 7.7%9.1%, from $127.9 million September 30, 2006. This increasedecrease was primarily attributable to higher cash balances heldconsideration paid in consolidated joint ventures.mergers and acquisitions.
Net cash provided by operating activities was $43.7$53.7 million for the threesix months ended DecemberMarch 31, 2006,2007, an increase of $62.2$55.3 million from the net cash used in operating activities of $18.6$1.6 million for the three
six months ended DecemberMarch 31, 2005.2006. The increase was primarily attributable to higherincreased rate of collections of accounts receivable as compared to growth in both of our operating segments,revenue combined with advanced billings to clients in our MSS operating segment and lower income tax payments.
Net cash provided by operating activities was $121.3 million for the year ended September 30, 2006, an increase of $74.7 million from the net cash provided by operating activities of $46.6 million for the year ended September 30, 2005. The increase was primarily attributable to a more efficient use of working capital as well as higher earnings before non-cash expenses.
Net cash used in investing activities was $4.6$129.0 million for the threesix months ended DecemberMarch 31, 2006, a decrease2007, an increase of $36.2$82.8 million from the net cash used in investing activities of $40.9$46.2 million in the threesix months ended DecemberMarch 31, 2005.2006. For the threesix months ended DecemberMarch 31, 2006,2007, net cash used in business combinations was $6.2$125.8 million as compared to $34.1 million used in business combinations for the comparable period last year, primarily a result of cash used to facilitate the EDAW merger.HSMM, RETEC and STS transactions.
Net cash used in investing activities was $71.8 million for the year ended September 30, 2006, a decrease of $65.2 million from the net cash used in investing activities of $137.0 million in the year ended September 30, 2005. For the year ended September 30, 2006, net cash used in business combinations was $53.3 million as compared to $158.9 million used in business combinations for the prior fiscal year. We continue to invest in our initiative to re-design our business processes and to implement a global enterprise resource planning (ERP) system. In fiscal 2006, we capitalized $6.7 million in costs associated with our ERP system, as compared to $10.8 million in fiscal 2005. For the year ended September 30, 2006, proceeds from the sale of property and equipment totaled $21.3 million as compared to $0.8 million in the prior fiscal year. This increase was primarily related to the sale of an office building in Orange, California.
Net cash used inprovided by financing activities was $29.8$62.7 million, for the threesix months ended DecemberMarch 31, 2006,2007, a decrease of $102.6$7.5 million from cash provided by financing activities of $72.8$70.2 million in the comparable period last year, primarily as a result of lesseryear. Incremental borrowings under our credit facility were $51.9 million to facilitate mergers and acquisitions due to strong cash flow provided from operations.acquisitions.
Net cash provided by financing activities was $23.8 million for the year ended September 30, 2006, as compared to net cash provided by financing activities of $84.1 million in the year ended September 30, 2005. In fiscal 2006, net cash provided by financing activities was largely the result of proceeds from the sale of our stock, notably the Class F and Class G convertible preferred stock, offset by the redemption of our Class D convertible preferred stock and related warrants and net repayments of borrowings under our credit agreements.
Working Capital
Working capital, or current assets less current liabilities, decreased $23.2$9.9 million, or 11.5%4.9%, from $201.3 million at September 30, 2006 to $178.1$191.4 million at DecemberMarch 31, 20062007 largely as a result of greater scheduled amortization of senior notes and increases in taxes payable.newly acquired companies. Working capital increased $30.7 million, or 18.0%, from $170.6 million at September 30, 2005 to $201.3 million at September 30, 2006 largely as a result of merger and acquisition activity as well as strong revenue growth.
Net accounts receivable which includes billed and unbilled costs and fees, net of billings in excess of costs on uncompleted contracts, decreased $9.0increased $69.3 million, or 1.2%9.0% to $760.9$839.2 million at
December 30, 2006 March 31, 2007 from $769.9 million at September 30, 2006. Net accounts receivable increased $188.9 million, or 32.5% to $769.9 million at September 30, 2006 from $581.0 million at September 30, 2005. For the same period, annual revenuesrevenue increased at a notably higher level of $1.0 billion, or 43.1%, from $2.4 billion to $3.4 billion.
Because our revenues dependrevenue depends to a great extent on billable labor hours, most of our charges are invoiced following the end of the month in which the hours were worked, the majority usually within 15 days. Other direct costs are normally billed along with labor hours. However, as opposed to salary costs, which are generally paid on either a bi-weekly or monthly basis, other direct costs are generally not paid until we receive payment (in some cases in the form of advances) from our customer.
Borrowings and Lines of Credit
At September 30, 2006 and DecemberMarch 31, 2006,2007, our long-term obligations consisted of the following:
| | September 30, 2006 | December 31, 2006 | September 30, 2006 | March 31, 2007 | ||||||||||
|---|---|---|---|---|---|---|---|---|---|---|---|---|---|---|
| | (in thousands) | (in thousands) | ||||||||||||
| Amended and Restated Credit Agreement | $ | — | $ | — | $ | — | $ | 50,000 | ||||||
| Term Credit Agreement | 65,000 | 57,000 | 65,000 | 57,000 | ||||||||||
| Senior Notes | 68,810 | 68,810 | 68,810 | 68,810 | ||||||||||
| Bank Overdraft Facilities | 2,716 | 5,895 | ||||||||||||
| Other Debt | 929 | 1,931 | ||||||||||||
| Short-term Debt | 2,716 | 9,725 | ||||||||||||
| Other debt | 929 | 841 | ||||||||||||
| Total long-term obligations | 137,455 | 133,636 | 137,455 | 186,376 | ||||||||||
| Less: Current portion of long-term obligations | (14,665 | ) | (29,521 | ) | (14,665 | ) | (33,258 | ) | ||||||
| Long-term obligations, less current portion | $ | 122,790 | $ | 104,115 | $ | 122,790 | $ | 153,118 | ||||||
Amended and Restated Credit Agreement
We have an unsecured senior credit agreement with a syndicate of banks to support our working capital needs. On September 22, 2006, this facility was extended toneeds, which expires March 31, 2011. The facility consists of a revolving line of credit in the amount of $300.0 million which includes a sub-limit for standby letters of credit of $50.0 million. We may borrow, at our option, at either (a) a base rate (the greater of the Federal Funds rate plus 0.50% or the bank's reference rate) plus a margin which ranges from 0.00% to 0.25%, or (b) an offshore, or LIBOR, rate plus a margin which ranges from 0.75% to 1.75%, depending on our leverage ratio. In addition to these borrowing rates, there is a commitment fee which ranges from 0.175% to 0.375% on any unused commitment. Borrowings under the credit facility are limited by certain affirmative and negative financial covenants, which include maximum leverage restrictions, minimum fixed charge coverage and minimum net worth maintenance. At September 30, 2006 and DecemberMarch 31, 2006,2007, there were no$0.0 million and $50.0 million, respectively, borrowings under the credit facility. At September 30, 2006 and DecemberMarch 31, 2006,2007, outstanding standby letters of credit totaled $23.1 million and $23.9$24.4 million, respectively. At DecemberMarch 31, 2006,2007, we had $276.1$225.6 million available for borrowing under the credit facility.facility as compared to $276.9 million at September 30, 2006.
Term Credit Agreement
On September 22, 2006, certain of our wholly-owned subsidiaries closed an unsecured term credit agreement with a syndicate of banks to facilitate dividend repatriations under favorable tax terms. The term credit agreement provided for a $65.0 million, five-year term loan among four subsidiary borrowers and one subsidiary guarantor. In order to obtain more favorable pricing and other terms, we also provided a parent company guarantee. The terms and conditions of this agreement are substantially similar to those contained in our senior unsecured credit facility. Principal payments are
scheduled to begin June 30, 2007, or earlier at the borrowers' discretion. At DecemberMarch 31, 2006,2007, borrowings under this term credit agreement totaled $57.0 million.
Senior Notes
June 2008 Notes: On June 9, 1998, we issued $60.0 million of 6.93% senior notes due June 9, 2008. The June 2008 Notes are unsecured and have an average life of seven years. The annual principal payments of $8.6 million began June 9, 2002.
October 2008 Notes: On September 9, 2002, we issued $25.0 million of 6.23% senior notes due October 15, 2008. The October 2008 Notes are unsecured and have an average life of five years. The annual principal payments of $8.3 million were scheduled to begin October 15, 2006; however, we elected to pre-pay the first principal payment in September 2006.
April 2012 Notes: On April 14, 2000, we issued $35.0 million of 8.38% senior notes due April 14, 2012. The April 2012 Notes are unsecured and have an average life of 10 years. The annual principal payments of $7.0 million are scheduled to begin April 14, 2008.
All of the senior notes require interest to be paid either quarterly or semi-annually in arrears. The senior notes are also limited by certain affirmative and negative financial covenants, which include maximum leverage restrictions, minimum fixed charge coverage, minimum interest charge coverage and minimum net worth maintenance. Proceeds from the June 2008 Notes and the October 2008 Notes were used to repay revolving credit debt while proceeds of the April 2012 Notes were used to fund business acquisitions.
Bank Overdrafts and Other Debt
At December,March, 31, 2006,2007, we had three non-U.S. credit facilities used to cover periodic overdrafts and to issue letters of credit in the aggregate amount of $41.0 million.
Further, at DecemberMarch 31, 2006,2007, we had outstanding promissory notes of $0.9 million to former shareholders of Oscar Faber, predecessor to Faber Maunsell. These promissory notes have maturities ranging from January 2006 to April 2010.
Preferred Stock
In February 2006, we closed a $235.0 million private placement of our Class F and Class G convertible preferred stock. In connection with the private placement, we redeemed all outstanding shares of our Class D convertible preferred stock and repurchased associated warrants to purchase common stock. Approximately $114.7 million of the $231.2$232.1 million in net proceeds was used to repay indebtedness under our senior credit facility and approximately $116.5 million was used to redeem the Class D preferred and associated warrants. The terms of the Class D convertible preferred stock contained a 7% annual dividend whereas the terms of the Class F and Class G do not require annual dividend payments.
The Class F and Class G convertible preferred stock is redeemable on the earlier of February 9, 2012 or the date on which we sell substantially all of our assets and has other rights, privileges and preferences. See "Description of Capital Stock, Certificate of Incorporation and Bylaws" for a summary of the terms of the Class F and Class G convertible preferred stock.
Commitments and Contingencies
Other than normal property and equipment additions and replacements, expenditures to further the implementation of our ERP system, commitments under our incentive compensation programs, repurchases of shares of our common stock, and acquisitions from time to time, we currently do not
have any significant capital expenditures or outlays planned except as described below. However, if we acquire any additional businesses in the future or embark on other capital-intensive initiatives, additional working capital may be required.
In July 2006, we entered into an agreement to acquire an interest in Shanghai Tunnel Engineering Co., Ltd., or STEC. STEC is a Shanghai, China-based design, engineering and construction firm which specializes in transportation design. The agreement is subject to Chinese government regulatory approval and other conditions. If we receive regulatory approval and satisfy all closing conditions, the purchase would be valued at approximately 328.0 million Chinese renminbi, or approximately $42.0 million, based upon indicative exchange rates as of the date of this prospectus. As of the date of this prospectus, we have not funded the STEC investment.
As of DecemberMarch 31, 2006,2007, there was approximately $44.6$47.9 million outstanding under standby letters of credit issued primarily in connection with general and professional liability insurance programs and for contract performance guarantees. In addition, in some instances we guarantee that a project, when complete, will achieve specified performance standards. If the project subsequently fails to meet guaranteed performance standards, we may either incur significant additional costs or be held responsible for the costs incurred by the client to achieve the required performance standards.
At September 30, 2006, our defined benefit pension plans with benefit obligations in excess of plan assets had an aggregate deficit (where the projected benefit obligation exceeded the fair value of plan assets) of $117.2 million. At that same time, the excess of accumulated benefit obligations over fair value of plan assets was $84.8 million. See Note 9 to the Notes to Consolidated Financial Statements contained elsewhere in this prospectus. In the future, such pension under-funding may increase or decrease depending on changes in the levels of interest rates, pension plan performance and other factors.
Contractual Commitments
The following summarizes our contractual obligations and commercial commitments as of September 30, 2006:
| Contractual Obligations and Commitments | Total | Less than One Year | One to Three Years | Three to Five Years | More than Five Years | ||||||||||
|---|---|---|---|---|---|---|---|---|---|---|---|---|---|---|---|
| | (in thousands) | ||||||||||||||
| Long-term debt (including accrued interest) | $ | 137,455 | $ | 14,665 | $ | 56,290 | $ | 59,500 | $ | 7,000 | |||||
| Operating leases | 446,631 | 87,163 | 131,976 | 90,089 | 137,403 | ||||||||||
| Capital leases | 1,620 | 1,215 | 405 | — | — | ||||||||||
| Interest | 14,283 | 5,679 | 6,258 | 2,346 | — | ||||||||||
| Pension obligations(1) | 214,006 | 14,396 | 36,770 | 40,010 | 122,830 | ||||||||||
| Total Contractual Obligations and Commitments | $ | 813,995 | $ | 123,118 | $ | 231,699 | $ | 191,945 | $ | 267,233 | |||||
We believe that our cash generated from operations and amounts that we expect to be available for borrowing under credit facilities will be sufficient to meet our capital requirements, including our commitments and contingencies, for at least the next 12 months.
Recently Issued Accounting Pronouncements
In February 2007, the FASB issued SFAS No. 159, "The Fair Value Option for Financial Assets and Financial Liabilities—Including an amendment of FASB Statement No. 115" (SFAS 159). SFAS No. 159 permits entities to choose to measure eligible items at fair value at specified election dates and report unrealized gains and losses on items for which the fair value option has been elected in earnings at each subsequent reporting date. SFAS No. 159 is effective for fiscal year ending September 30, 2009. We are currently evaluating the impact of the provisions of SFAS 159 on our results of operations and financial position.
In September 2006, the FASB issued SFAS No. 158,"Employers' Accounting for Defined Benefit Pension and Other Postretirement Plans" (SFAS 158). SFAS 158 requires employers to fully recognize the
obligations associated with single-employer defined benefit pension retiree healthcare and other post-retirement plans in their financial statements. We will be subjectrequired to recognize such obligations as of September 30, 2007. Additionally, we will be required to measure such obligations as of the disclosure and recognition provisionsend of SFAS 158our fiscal year, rather than up to three months earlier as had been previously permitted, effective in our fiscal years beginning October 1, 2006 and 2007, respectively.year ending September 30, 2009. We are currently
evaluating the impact of the recognition provisions of SFAS 158 on our results of operations and financial position.
In September 2006, the FASB issued SFAS No. 157,"Fair Value Measurements" (SFAS 157). SFAS 157 defines fair value, establishes a framework for measuring fair value in accordance with GAAP, and expands disclosures about fair value measurements. The provisions of SFAS 157 will be effective for us in our fiscal year beginning October 1, 2008. We are currently evaluating the impact of the provisions of SFAS 157.
In June 2006, the FASB issued FASB Interpretation, or FIN, No. 48, "Accounting for Uncertainty in Income Taxes—an Interpretation of FASB Statement No. 109" (FIN 48). FIN 48 clarifies the accounting for uncertainty in income taxes recognized in an entity's financial statements. FIN 48 prescribes that a company should use a "more-likely-than-not" recognition threshold based on the technical merits of the tax position taken. Additionally, FIN 48 provides guidance on recognition or de-recognition of interest and penalties, changes in judgment in interim periods, and disclosures of uncertain tax positions. FIN 48 became effective for us in our fiscal year beginning October 1, 2007. We are currently in the process of determining the effect of the adoption of FIN 48 on our results of operations and financial position.
In May 2005, the FASB issued SFAS No. 154,"Accounting Changes and Error Corrections—a replacement of APB Opinion No. 20 and FASB Statement No. 3" (SFAS 154), which applies to all voluntary changes in accounting principles, as well as to changes required by an accounting pronouncement in the unusual instance that the pronouncement does not include specific transition provisions. APB Opinion No. 20 previously required that most voluntary changes in accounting principle be recognized in net income as a cumulative effect of changing to the new accounting principle. SFAS 154 now requires retrospective application to prior periods' financial statements for changes in accounting principle, unless it is impracticable to do so. SFAS 154 became effective for us in our fiscal year beginning October 1, 2006. We currently do not anticipate any voluntary changes in accounting principle or errors that would require such retroactive application.
In April 2006, the FASB issued FASB Staff Position No. FIN 46(R)-6,"Determining the Variability to Be Considered in Applying FASB Interpretation No. 46(R)" (FSP FIN 46(R)-6), which addresses how a reporting enterprise should determine the variability to be considered in applying FIN No. 46 (revised December 2003), "Consolidation of Variable Interest Entities," or FIN 46(R). The variability that is considered in applying FIN 46(R) affects the determination of (a) whether the entity is a variable interest entity, (b) which interests are variable interests in the entity and (c) which party, if any, is the primary beneficiary of the variable interest entity. That variability will affect any calculation of expected losses and expected residual returns, if such a calculation is necessary. FSP FIN 46(R)-6 provides additional guidance to consider for determining variability. FSP FIN 46(R)-6 is effective for us beginning the first day of our fiscal quarter beginning October 1, 2006. We are currently evaluating the impact of the provisions of FSP FIN 46(R)-6 on our results of operations and financial position.
Financial Market Risks
We are exposed to market risk, primarily related to foreign currency exchange rates and interest rate exposure of our debt obligations that bear interest based on floating rates. We actively monitor these exposures. To reduce our exposure to market risk, we have entered into derivative financial instruments such as forward contracts or interest rate hedge contracts. Our objective is to reduce, where we deem appropriate to do so, fluctuations in earnings and cash flows associated with changes in foreign exchange rates and interest rates. It is our policy and practice to use derivative financial
instruments only to the extent necessary to manage our exposures. We do not use derivative financial instruments for speculative purposes. We currently have no material derivative instruments outstanding.
Foreign Exchange Rate
We are exposed to foreign currency exchange rate risk resulting from our operations outside of the United States. We do not comprehensively hedge our exposure to currency rate changes; however, we limit exposure to foreign currency fluctuations in most of our contracts through provisions that require client payments to be in currencies corresponding to the currency in which costs are incurred. As a result, we typically do not need to hedge foreign currency cash flows for contract work performed. The functional currency of all significant foreign operations is the local currency.
Interest Rates
Our senior revolving credit facility and certain other debt obligations are subject to variable rate interest which could be adversely affected by an increase in interest rates. As of September 30, 2005, September 30, 2006 and DecemberMarch 31, 2006,2007, we had $130.0 million, $0.0$65.0 million and $0.0$107.0 million, respectively, outstanding in borrowings under our credit facility.facility and our term credit agreement. Interest on amounts borrowed under the credit facility and our term credit agreement is subject to adjustment based on certain levels of financial performance. For borrowings at offshore rates, the applicable margin added can range from 0.75% to 1.75%. For fiscal 2006, our weighted average borrowings on our senior credit facility were $132.8 million. If short termshort-term floating interest rates were to increase or decrease by 1%, our annual interest expense could have increased or decreased by $1.3 million. For the threesix months ended DecemberMarch 31, 2006,2007, our weighted average borrowings under our senior credit facility and our term credit agreement were $0.0.$85.3. If short-term floating interest rates were to increase or decrease by 1%, our annual interest expense could increase or decrease by $0.9 million. We invest our cash in money market securities or other high quality, short-term securities that are subject to minimal credit and market risk.
We have selectively managed our floating interest rate exposure through the use of derivative instruments. In October 2005, we entered into two floating-to-fixed interest rate hedge contracts. From the inception through our voluntary early termination, the interest rate hedges were effective. Upon our termination of these contracts in our fourth quarter of fiscal 2006, we received a net cash settlement of approximately $1.1 million.
Subsequent Event
As of February 20, 2007, all of our outstanding loans previously made to certain directors and senior officers under our Senior Executive Equity Investment Plan, or SEEIP, to fund purchases of Company stock were terminated and repaid.
Overview
We are a leading global provider of professional technical and management support services to government and commercial clients on all seven continents. We provide planning, consulting, architectural and engineering design, and program and construction management services for a broad range of projects including highways, airports, bridges, mass transit systems, government and commercial buildings, and water and wastewater facilities.facilities and power transmission and distribution. We also provide facilities management, training, logistics and other support services primarily for agencies of the United States government. Through our network of approximately 28,000more than 30,000 employees in over 60 countries, we provide our services to a number of end markets, with particular strength in the transportation, facilities and environmental markets. With over 60% of our employees operating outside the United States, we believe we are well positioned to grow both in the United States and internationally. According toEngineering News-Record's (ENR) 20062007 Design Survey, we are the largest general architectural and engineering design firm in the world, ranked by 20052006 design revenue. In addition, we are ranked by ENR as the leading firm in numerous design end markets including transportation and general building.
The following two charts illustrate the diversification of our fiscal 2006 revenue by client type and geography.
| |
We offer our broad range of services through our two business segments: Professional Technical Services and Management Support Services.
Professional Technical Services (PTS). Our PTS segment delivers planning, consulting, architectural and engineering design, and program and construction management services to institutional, commercial and government clients worldwide in major end markets such as transportation, facilities, environmental management and energy/power. The transportation market includes transit and rail, highways and bridges, airports, ports and harbors. The facilities market includes governmental, institutional, commercial and industrial facilities. The environmental market includes water supply and wastewater infrastructure, water resources, and environmental management. We also provide services for projects in the mining, power and energy end markets.
For example, we are providing master planning services for the 2012 London Summer Olympic Games, program management services through a joint venture for the Second Avenue subway line in New York City and engineering and environmental management services to support global energy infrastructure development for a number of large petroleum companies. Our PTS segment contributed
$2.8 billion, or 81.0% of our revenue, in fiscal 2006. The following table highlights our principal PTS end markets along with a list of additional representative projects:
| End Market | Approximate Percentage of Fiscal 2006 PTS Segment Revenue (%) | Representative Projects | Project Locations | |||
|---|---|---|---|---|---|---|
| Transportation | • Second Avenue Subway • Sydney Orbital Bypass • Sutong Bridge • John F. Kennedy Airport | U.S. Australia China U.S. | ||||
| • 2012 London Olympics • Pentagon Renovation • British Broadcasting Company Headquarters • Los Alamos National Laboratory | U.K. U.S. U.K. U.S. | |||||
| Environmental | • Harbor Area Treatment Scheme • Chicago Calumet and Stickney Wastewater Treatment Plants • New York City Bowery Bay | Hong Kong U.S. U.S. | ||||
| Energy/Power | 4 | • Mutnovsky Independent Power Project • NY Public Schools Coal Conversion Project • Southern Provincial Rural Electrification Project | Russia U.S. Laos | |||
The following two charts illustrate the diversification of our PTS revenue for the first quarter of fiscal 2007, ended December 31, 2006, by client type and geography.
| First Quarter Fiscal 2007 Revenue by Client Type | First Quarter Fiscal 2007 Revenue by Geography | |
| |
Management Support Services (MSS). Our MSS segment provides facilities management and maintenance, training, logistics, consulting, technical assistance and systems integration services, primarily for agencies of the U.S. government. We have over 9,000 employees managing projects for over 400 contract-specific job sites for U.S. government clients such as the Department of Defense, Department of Energy and the Department of Homeland Security. For example, we manage more than 6,000 employees in Kuwait who provide logistics, security, communications and information technology services for the U.S. Army Central Command-Kuwait. We also provide operations and maintenance services for the U.S. Army's Fort Polk Joint Readiness Training Center in Louisiana. Our MSS segment contributed $647 million, or 18.9% of our revenue, in fiscal 2006, representing an increase of 109.4%
over fiscal 2005 MSS revenue. The following table highlights representative projects in our MSS segment:
| Representative Projects | Project Locations | Clients | ||
|---|---|---|---|---|
| • Nevada Test Site | U.S. | U.S. Dept. of Energy | ||
| • Camp | Kuwait | U.S. Dept. of Defense | ||
| • Fort Polk Training Center | U.S. | U.S. Dept. of Defense | ||
| • International Civilian Police (CIVPOL) | Various worldwide | U.S. Dept. of State |
Our Market Opportunity
According to ENR, the top 500 design firms in the United States ranked by revenue generated revenue of approximately $59.8$69.6 billion in 2005,2006, which was an 11.8%a 17.5% increase over 2004.2005. The top five design firms, which includes us, accounted for 21% of this $69.6 billion market. Of this $60$70 billion in revenue, the largest two categories were general building and transportation, representing $23$16.5 billion and $20$13.4 billion, respectively. Water and wastewater combined represented an additional $13$9.1 billion in 2005 revenues.2006 revenue. According to ENR, based on 20052006 revenue, we were the #1 design firm in transportation, #1 in general building, #2#3 in wastewater and #4 in water supply.water.
We believe that the growth opportunities for these markets are significant, both in the United States and internationally, fueled by the increasing global spending on infrastructure, among other factors.
Professional Technical Services
The U.S. Department of Commerce forecasts that increases in work associated with the nonresidential building, power and highway markets will contribute to the overall value of new construction contracts awarded in the United States, which are expected to increase slightly to $1.17 trillion in 2007. The U.S. Department of Commerce projects that this growth in nonresidential construction will counter expected major declines in the value of residential construction during 2007. We are positioned to benefit from this trend in that we are focused on government, commercial and industrial projects, with no material exposure to the residential housing market.
Transportation. The transportation market is significant and growing, both domestically and internationally, and we expect this will continue in coming years. Transportation services include the design and construction management of a broad range of transportation infrastructure projects, including airports, seaports, bridges, tunnels, railway lines and highways. According to ENR, the top 500 engineering design firms earned $20.3$13.4 billion in revenue in 20052006 as a result of transportation work, an 11.7% increase over the $12.0 billion in revenue generated in 2005 from transportation work. The U.S. Department of Commerce projected in late 2006 that the dollar value of domestic transportation construction projects would grow 11.9% during 2006 and that it will grow an additional 3% in 2007, to a value of $31 billion. The Department of Commerce also predicted that highway and street spending, which it categorizes separately from transportation, would increase 16% in 2006 and will rise another 7% in 2007 to reach $81.5 billion. In addition, FMI Corp., a Denver-based management consulting firm specializing in the construction industry, projects that transportation and highway and street construction revenues will grow 7.3% in 2007, 5.6% in 2008, 4.9% in 2009 and 4.2% in 2010. Growth in domestic transportation spending is driven by such factors as the continuation of federal funding for SAFETEA-LU, a $286 billion highway funding bill. Growth is also driven by increased domestic spending on highway projects, the increased utilization of road, rail, airport and seaport facilities, combined with the obsolescence of many existing facilities. In addition, domestic growth is driven by significant increases in the use of aviation facilities. Domestic airline passenger traffic has returned to and surpassed the 65.4 million monthly travelers level achieved prior to September 2001. Healthier state budgets have also fueled infrastructure activity. California, for example,
passed a $20 billion bond measure for transportation in 2006 that has the potential to increase spending in this area substantially in the coming years.
The increased momentum of public private partnerships, or PPP, has fueled alternative sources of funding for major transportation projects. These have included the sale of toll highways in Chicago and Indiana and the privatization of airports, including Chicago's Midway Airport.
We expect growth in the U.S. transportation market will also be driven by clients seeking a broader range of services from engineering and construction firms. Clients are demanding an increased focus on program and construction management and are seeking a full range of services including project design, delivery, financing and procurement. We believe this trend will provide additional revenue for these firms.
The international transportation market also presents growth opportunities. International transportation growth is driven by both the need to upgrade existing facilities and the demand for new infrastructure, particularly in emerging markets. China, for example, annually constructs approximately 4,000 kilometers of highways and reported investing $12 billion in a rural road construction project intended to connect all Chinese cities with a population over 200,000 and 95% of rural towns by 2010. Emerging markets are also investing heavily in aviation infrastructure. According to the U.S. Embassy in China, the country will build 108 new airports between 2004 and 2009, including what will be the world's largest airport, the Beijing International Airport, that is scheduled to open in time for the Beijing Olympics and will cover more than 1 million square meters.
General building. We expect this market will exhibit significant strength in the next several years. ENR reports that $22.9$16.5 billion in revenue in 2006 was earned by the top-500 design firms from general building, a 21.3% increase over the $13.6 billion in revenue generated in 2005 from general building. General building includes the construction of commercial buildings, office complexes, schools, hotels and correctional facilities. The U.S. Department of Commerce projected in late 2006 that commercial construction spending would increase 11% in 2006 and rise another 10% during 2007 to
reach $90 billion, that education construction spending would rise 7% in 2006 and rise another 5% in 2007 to reach $88.3 billion, that office construction would rise 15.1% in 2006 and rise another 11.8% in 2007 to reach $61.4 billion and that lodging construction would rise 50% in 2006 and increase an additional 14.7% in 2007 to approach $22.6 billion. In addition, FMI Corp. projects that non-residential building construction revenues (excluding transportation construction revenues) will grow 9.2% in 2007, 8.6% in 2008, 8.2% in 2009 and 7.7% in 2010. Demand for commercial construction is driven by several factors, including lower commercial vacancy rates, greater investor interest in office and other commercial properties, low domestic unemployment rates, and historically low interest rates.
In the United States, public demand for general building services is also driven by increased federal, state and local government educational spending and continuing government expenditures in other facilities such as courthouses and correctional facilities. Growth in the latter is being driven by mandatory sentencing guidelines and other judicial trends resulting in longer incarceration periods for a greater number of offenders.
Internationally, strong global economic growth is fueling the demand for facilities design and construction. We believe we are well positioned to take advantage of international demand for such services. Over the next decade, over 400 new buildings more than 50 stories tall are expected to be built around the world in regions such as the Middle East and China, according to Emporis Buildings, an international database of building information. By 2015, half of the world's new building construction is expected to take place in China. Even today, the American Forest and Paper Association estimates that construction represents about 16% of China's GDP amid a national trend toward urbanization. We are well positioned globally to take advantage of these kinds of opportunities.
Water, Wastewater & Environmental Management. There is significant global demand for water, wastewater and environmental services. This market is characterized by projects including water treatment facilities, water distribution systems, desalination plants, solid waste disposal systems, environmental impact studies, remediation of hazardous materials and pollution control. ENR reports that the water and wastewater market contributed $13.4$9.1 billion in 20052006 revenue to the top-500 design firms. Growthfirms, a 13.8% increase over the $8.0 billion in this area is driven by the domestic water and wastewater sectors, which we believe are growing at a rate between 8% and 10% annually.revenue contributed in 2005. FMI Corp., a Denver-based industry management consultant, predicts projects that construction revenues from water supply construction spendingand sewage and waste disposal will increase 9%grow 9.6% in 2007, 7.6% in 2008, 6.6% in 2009 and that sewer system spending will rise 10%5.6% in 2007.2010.
Domestic growth in the water, wastewater and environmental markets is driven by government regulations, including the Clean Water Act and Clean Air Act, by a growing U.S. population, and by a shift of the U.S. population toward the Southeast and Southwest, where there are significant water supply challenges. In addition, a renewed focus on micro-contaminants and carcinogens has given rise to increased centralization and standardization efforts, including increased federal involvement in water quality regulation. Internationally, demand is driven by the need to repair and upgrade local water systems and increased global population and concomitant demand for water reuse and desalinization technologies. Urbanization and rapid economic growth resulting in higher standards of living in such developing countries as India and China will drive demand for water and wastewater infrastructure development in these regions. In addition, developing nations face significant environmental issues. Governments in developing regions are likely to seek to address environmental concerns as they gain the economic means to improve the quality of life of their citizens. For example, according to the World Health Organization, seven of the ten most polluted cities in the world are located in China.
Energy/Power. The International Energy Agency projects that, by 2030, global demand for energy will be 50% greater than it is now, and 75% of that increase will come from developing countries. As a result, the International Energy Agency projects that $20 trillion will be invested in energy through 2030. The surge in energy demand is not only sparking increased investment in generation, but also in conservation and energy efficient systems and building design, alternative/renewable energy and conversion of coal-fired to gas-fired systems, all to mitigate the growth in demand for energy from conventional sources.
The energy and power transmission and distribution systems in the United States are characterized by aged and deteriorating infrastructure. The poor condition of these systems is driving the need to add capacity and replace aged assets. For example, the recent failure of the Trans Alaska Pipeline, built in the late 1970's, due to internal corrosion led the U.S. Department of Transportation to order repairs and a significant new inspection regime. The Electric Power Research Institute projects $6 billion of annual transmission investments by U.S. utilities.
Alternative energy continues to draw significant attention due to the prospect of increased demand and resulting high prices for conventional energy sources. As a result, regulatory requirements, such as the U.S. Energy Policy Act of 2005, are driving demand for alternative energy production facilities.
Urbanization. While U.S. cities are relatively mature and historically have suffered from population flight to suburban and other outlying areas, that trend has reversed in recent years as "baby boomers" have returned to major urban areas. Outside the U.S.,United States, economic growth opportunities have caused an influx of people from rural to developing urban areas. In parts of Europe, government policy strongly encourages urban redevelopment. Urbanization creates significant opportunities for our PTS segment in all of our end markets as it creates increased demand in urban areas for transportation infrastructure, facilities and energy/power systems, greater pressure on water/wastewater systems and increased
environmental pollution that needs to be mitigated. It also creates demand for urban master planning and environmental assessments.
The table below highlights some of the key factors driving growth in our PTS core markets.
| Growth Drivers | ||||
|---|---|---|---|---|
| Market | Domestic | International | ||
Transportation | • Healthy state and local budgets • $286 billion of federal funding for SAFETEA-LU from 2006-2010 • Increased utilization of aging transportation • Introduction of public to private partnerships (PPP) to the United States | • Emerging markets creating demand for greenfield transportation infrastructure and large scale improvement projects • Global trend towards PPP and other private sector spending on infrastructure • Increased foreign direct investment | ||
General Building | • Historically low interest rate environment driving significant spending • Demand for nonresidential building space continues to expand • Increased spending in hospital healthcare infrastructure as • Strong demand for nonresidential / commercial space | • Healthy global economy • Continued population pressures in developing urban areas such as China, Russia and India • Urbanization trends fostering rapid residential construction spending | ||
Water/Wastewater/ Environmental | • Increasing federal regulatory pressure —Clean Water Act —Clean Air Act | • Global population growth • Increased focus on quality and safety | ||
Energy/Power | • Aged infrastructure • Regulatory requirements | • Developing nations' population and economic growth • Increased urbanization | ||
Management Support Services
We believe the market for our MSS segment is growing. MSS segment services include facilities management and maintenance, training, logistics, consulting, technical assistance and systems integration services, primarily for agencies of the U.S. government. The Center for Strategic and International Studies estimated that the domestic market for the kinds of facility-related services provided by our MSS segment was $36 billion in 2004, the most recent full year for which federal procurement data were available. Our MSS work is primarily for such federal government agencies as the Departments of Defense, Energy, Justice and Homeland Security. We believe that our MSS segment revenue will grow as a result of certain projected federal government budget increases, including projections by the Department of Defense that its expenditures on operations and maintenance will increase from $153 billion in 2007 to $174 billion in 2011. Growth in the MSS segment will also likely be driven by a continued government outsourcing trend due in part to an aging government workforce and on-going military operations in the Mideast and elsewhere as well as military force realignments. We believe these trends will enhance the demand for outsourcing in the government services area for firms with experience in security, logistics and overseas operations.
Our Competitive Strengths
We believe we have the experience, relationships, technical expertise and personnel to lead our clients through their most complicated and critical technical undertakings while also delivering the level
of consistent, quality service necessary to maintain long-term relationships and secure repeat engagements. Our key competitive strengths include:
We have leadershipLeadership positions in large, growing markets.
We believe the growing trend for outsourcing of professional technical and support services complements our capabilities, size and experience in providing these services and positions us to continue to strengthen our business. Based on ENR's rankings of firms by 20052006 revenue, we are highly ranked in a number of key engineering and consulting services sectors, including transportation (#1), general building (#1), wastewater (#2)(#3) and water supply (#4). We also have a leadership position according to ENR in many key specialty technical areas within our core end markets including:
| Transportation | Transportation | General Building | Environmental | Transportation | General Building | Environmental | ||||||||||||||
|---|---|---|---|---|---|---|---|---|---|---|---|---|---|---|---|---|---|---|---|---|
| | Ranking | | Ranking | | Ranking | Ranking | | Ranking | | Ranking | ||||||||||
| Mass Transit and Rail | 1 | Educational Facilities | 1 | Wastewater Treatment | 2 | 1 | Educational Facilities | 1 | Wastewater Treatment | 3 | ||||||||||
| Airports | 1 | Government Offices | 1 | Sanitary and Storm Sewers | 2 | 1 | Government Offices | 1 | Sanitary and Storm Sewers | 2 | ||||||||||
| Marine and Ports | 1 | Correctional Facilities | 1 | Sewerage and Solid Waste | 2 | 1 | Correctional Facilities | 1 | Sewerage and Solid Waste | 2 | ||||||||||
| Highways | 1 | Hotels/Convention Center | 3 | Water Supply | 4 | 1 | Hotels/Convention Center | 3 | Water Supply | 4 | ||||||||||
| Bridges | 2 | Commercial Offices | 4 | Clean Air Compliance | 4 | 2 | Commercial Offices | 4 | Clean Air Compliance | 4 | ||||||||||
We are also ranked number one inNew Civil Engineer's 2006 global listing (by 2005 fees) in the areas of water, buildings and roads and number two in waste and rail.
We are diversifiedDiversification across service lines, end markets and geographies.
We perform a broad spectrum of services for our clients, from planning and design to construction and project management and logistics. In fiscal 2006, excluding the U.S. federal government, no single customer accounted for more than 10% of our total revenue. The U.S. federal government, including the Department of Defense, Department of Energy and the Department of Homeland Security, accounted for approximately 28% of our total revenue in fiscal 2006. The U.S. federal government accounted for approximately 12% of the revenue of our PTS segment and almost all of the revenue of our MSS segment for fiscal 2006. In addition, our 25 largest projects by gross profit in fiscal 2006 accounted for only 14% of our consolidated gross profit. We believe this diversification enables us to take advantage of changing business, technological and economic conditions worldwide, and allows us to better manage our business through market cycles. We further believe we are well-positioned in geographic areas with favorable growth prospects such as China/Hong Kong and the United Arab Emirates, where we are among the largest engineering design firms. This diversification has been a key factor in our historical growth and positions us for future growth.
We combine globalGlobal reach with local presence.
We have a global network of approximately 28,000more than 30,000 employees with projects in over 60 countries. We combine intimate local market knowledge and relationships with the technical expertise, size, experience and resources of one of the world's largest engineering and design services companies. We believe that our ability to share capabilities and best practices across the firm delivers significant value to our clients and enables us to win and efficiently execute projects worldwide. As of September 30, 2006,March 31, 2007, approximately 62%63% of our employees were located outside the United States. We operate through a number of wholly-owned subsidiaries that have the advantage of competing under several internationally known brand names in our end markets, while maintaining the recognition that they are part of AECOM, a global company.
We have strongStrong and long-standing client relationships.
We have developed strong and long-term relationships with a number of large corporations and government entities worldwide.worldwide that can lead to repeat business. For example, several of our operating companies have been providing services for over 30 years to clients such as the Illinois State Tollway Authority, U.S. Navy, Massachusetts Water Resources Authority and the Port Authority of New York and New Jersey. We
believe that these types of long-term relationships allow us to better understand and be more responsive to our clients' needs and better manage their risks. These relationships also
lead to repeat business opportunities and opportunities to expand the scope of the value-added services we provide to existing clients.
We have a successfulSuccessful history of executing and integrating acquisitions.
We believe one of our core competencies is successfully identifying, executing and integrating acquisition opportunities. We have consummated more than 30 mergers and acquisitions since 1998 that have enabled us to expand our end markets, service offerings and geographic reach. This acquisition activity has provided us with access to new markets at lower risk and faster speed relative to our entering the markets as a new participant. We have targeted, and we will continue to target, firms that enable us to add backlog, long-term client relationships and experienced executives who can provide leadership across our company. In addition, we derive our acquisition synergies through "cross selling" the capabilities of our newly acquired companies to our existing clients and our global capabilities to clients of our newly acquired companies.
The following is a brief summary of some of our key mergers and acquisitions since 2000:
We benefit from our experiencedExperienced management team and employees.
We have a talented, dedicated and experienced work force, located across the globe, led by an experienced executive management team. Our Chief Executive Officer and the 10 most senior members of our operating units have an average of more than 20 years of experience with AECOM and more than 25 years in our industry. We also have a large, experienced and skilled workforce. This human capital is essential in winning the most attractive workto success in our industry. Our long-standing practice is to provide employee incentives, such as stock ownership, that are designed to optimize performance and to ensure our ability to attract and retain a quality work force.
Our talented workforce is essential in allowing us to obtain quality projects. In turn, our success in winning desirable and challenging projects assists us in attracting and retaining highly qualified people.
Our Growth Strategy
We intend to grow our business by leveraging our competitive strengths and leadership positions in our core markets while opportunistically entering new markets and geographies. Key elements of our growth strategy include:
Expand our long-standing client relationships and provide our clients with a broad range of services.
We have long-standing relationships with a number of large corporations, public and private institutions and governmental agencies worldwide. We will continue to focus on client satisfaction along with opportunities to sell a greater range of services to clients and deliver full-service solutions for their needs. For example, as we have grown our environmental business, we have provided environmental services for transportation and other infrastructure projects in which such services have in the past been subcontracted to third parties.
By integrating and providing a broad range of services, we believe we deliver maximum value to our clients at competitive costs. Also, by coordinating and consolidating our knowledge base, we believe we have the ability to export our leading edge technical skills to any region in the world in which our clients may need them. This advances our strategy of providing a full-service solution for our clients' needs.
Capitalize on growth opportunities in our core markets.
Our core end markets, including transportation, general building and environmental, are expected to continue to grow. We intend to build on our leading positions in these markets to increase our market share. With our track record and our global resources, we believe we are well positioned to win projects in these markets. We believe that the need for infrastructure upgrades, environmental management and increased government spending and outsourcing of support services, among other things, will result in continued growth opportunities in our core markets.
Continue to pursue our merger and acquisition strategy.
We intend to continue to attract other successful companies whose growth can be enhanced by joining us. This approach has served us well as we have strengthened and diversified our leadership positions both geographically, technically and across end markets. We believe that the trend towards consolidation in our industry will continue to produce attractive candidates that align with our merger and acquisition strategy. For example, we significantly strengthened our presence in the fast-growing market in the United Arab Emirates with the addition of Cansult Limited in September 2006.
Strengthen and support human capital.
Our experienced employees and management are our most valued resources. Attracting and retaining key personnel has been and will remain critical to our success. We will continue to focus on providing our personnel with training and other personal and professional growth opportunities, performance-based incentives, opportunities for stock ownership and other competitive benefits in order to strengthen and support our human capital base. Over the past five years, we have substantially increased our employee base. This increase comes from organic growth as well as growth from mergers and acquisitions. Our employee population has grown from approximately 12,700 employees as of September 30, 2001 to approximately 28,50030,200 as of DecemberMarch 31, 2006.2007. In 2006, we expanded our firm-wide employee engagement program to put increased focus and resources on this important strategic area. The program includes elements designed to foster professional and career development and advance leadership development, promote succession planning and firmly link employee engagement with our business objectives. We believe that our employee programs align the interests of our personnel with those of our clients and stockholders.
Our Business Segments
The following table sets forth the revenuesrevenue attributable to our business segments for the periods indicated(1):
| | Year Ended September 30, | Year Ended December 31, | |||||||||||||
|---|---|---|---|---|---|---|---|---|---|---|---|---|---|---|---|
| | 2004 | 2005 | 2006 | 2005 | 2006 | ||||||||||
| | (in thousands) | (in thousands) | |||||||||||||
| Professional Technical Services (PTS) | $ | 1,777,718 | $ | 2,082,618 | $ | 2,772,833 | $ | 612,264 | $ | 753,545 | |||||
| Management Support Services (MSS) | 232,143 | 309,053 | 647,188 | 134,479 | 184,680 | ||||||||||
| Total | $ | 2,009,861 | $ | 2,391,671 | $ | 3,420,021 | $ | 746,743 | $ | 938,225 | |||||
| | Year Ended September 30, | Six months Ended March 31, | |||||||||||||
|---|---|---|---|---|---|---|---|---|---|---|---|---|---|---|---|
| | 2004 | 2005 | 2006 | 2006 | 2007 | ||||||||||
| | (in thousands) | (in thousands) | |||||||||||||
| Professional Technical Services | $ | 1,777,718 | $ | 2,082,618 | $ | 2,772,833 | $ | 1,319,621 | $ | 1,594,464 | |||||
| Management Support Services | 232,143 | 309,053 | 647,188 | 285,647 | 425,171 | ||||||||||
| Total | $ | 2,009,861 | $ | 2,391,671 | $ | 3,420,021 | $ | 1,605,268 | $ | 2,019,735 | |||||
Our Professional Technical Services Segment (PTS)
Our PTS segment is comprised of a broad array of services, generally provided on a fee-for-service basis. These services include planning, design, consulting, program management and construction management for industrial, commercial, institutional and government clients worldwide. For each of these services, our technical expertise includes civil, structural, process, mechanical, geotechnical systems and electrical engineering, architecture, landscape and interior design, urban and regional planning, project economics, and environmental, health and safety work.
With our technical and management expertise, we are able to provide our clients with the full spectrum of services they may require. For example, within our environmental management service offerings, we provide regulatory compliance planning and management, environmental modeling, environmental impact assessment and environmental permitting for major capital/infrastructure projects. In addition, we provide specialized services in areas such as environmental toxicology, health and safety risk assessment, sanitary engineering, air quality analysis, water resources protection and development, remediation consulting, brownfield reclamation and sustainable land use development programs.
Our services may be sequenced over multiple phases. For example, in the area of program management and construction management services, these services may begin with a small consulting or planning contract, and may later develop into an overall management role for the project or a series of
projects, which we refer to as a program. Program and construction management contracts typically employ a staff of 10 to more than 100 and, in many cases, operate as an outsourcing arrangement with our staff located at the project site. For example, since 1990, we have been managing the renovation work at the Pentagon for the U.S. Department of Defense, and we currently have approximately 100 staff members located on-site. Another example of our program and construction management services would be our services related to the development of educational facilities for K-12 school districts and/or community colleges. We are performing these types of assignments throughout the U.S., including the cities of Dallas, Los Angeles and Houston.
We provide the services in our PTS segment both directly and through joint venture or similar partner arrangements to a broad range of diverse end markets, including:
Transportation. We serve several key transportation sectors, including:
Facilities.
and private sector clients. For example, we have provided planning and consulting services for the Olympic Games sites in Atlanta, Sydney, Beijing, Salt Lake City and London. We are providing strategic planning and master planning services for new cities and major mixed use developments in China, Southeast Asia, the Middle East, the U.K. and the U.S.
Environmental
Energy/Power
Our Management Support Services Segment (MSS)
Through our MSS segment, we offer infrastructure management and maintenance, training, logistics, consulting, technical assistance and systems integration services, primarily for agencies of the United States government.
We provide a wide array of services in our MSS segment, both directly and through joint venture or similar partner arrangements, including:
Installation, Operations and Maintenance. Projects include Department of Defense and Department of Energy installations where we provide comprehensive services for the operation and maintenance of complex government installations, including military bases, test ranges and equipment. We have undertaken assignments in this category in the Middle East and the U.S. We also provide services for the operations and maintenance of the Department of Energy's Nevada Test Site.
Logistics and Field Services. Projects include logistics support services for a number of Department of Defense agencies and defense prime contractors focused on developing and managing integrated supply and distribution networks. We oversee warehousing, packaging, delivery and traffic management for the distribution of government equipment and materials.
Training. Projects include training applications in live, virtual and simulation training environments. We have conducted training at the U.S. Army's Center for Security Training in Maryland for law enforcement and military personnel. We have also supported the training of international police officers and peacekeepers for deployment in various locations around the world in the areas of maintaining electronics and communications equipment.
Systems Support. Projects cover a diverse set of operational and support systems for the maintenance, operation and modernization of Department of Defense and Department of Energy installations. Our services in this area range from information technology and communications to life cycle optimization and engineering, including environmental management services. Through our joint venture operations at the Nevada Test Site and the Combat Support Services operation in Kuwait, our teams are responsible for facility and infrastructure support for critical missions of the U.S. government in its nonproliferation efforts, emergency response readiness, and force support and sustainment. Enterprise network operations and information systems support, including remote location engineering and operation in classified environments, are also areas of specialized services we provide.
Technical Personnel Placement. Projects include the placement of personnel in key functional areas of military and other government agencies, as these entities continue to outsource critical services to commercial entities. We provide systems, processes and personnel in support of the Department of Justice's management of forfeited assets recovered by law enforcement agencies. We also support the Department of State in its enforcement programs by recruiting, training and supporting police officers for international and homeland security missions.
Field Services. Projects include maintaining, modifying and overhauling ground vehicles, armored carriers and associated support equipment both within and outside of the United States under contracts with the Department of Defense. We also maintain and repair telecommunications systems for military and civilian entities. The ability to deploy highly mobile field response teams to locations across the world to supplement mission support and equipment readiness is a critical requirement in this service area.
Our Clients
Our clients consist primarily of national governments, state, regional and local governments, public and private institutions and major corporations. The following table sets forth our total revenuesrevenue attributable to these categories of clients for each of the periods indicated:
| | Year Ended September 30, | ||||||||||||||||
|---|---|---|---|---|---|---|---|---|---|---|---|---|---|---|---|---|---|
| | 2004 | % | 2005 | % | 2006 | % | |||||||||||
| | (dollars in thousands) | ||||||||||||||||
| U.S. Federal Government | |||||||||||||||||
| PTS | $ | 153,302 | 8 | % | $ | 215,951 | 9 | % | 319,675 | 9 | % | ||||||
| MSS | 232,143 | 11 | % | 309,052 | 13 | % | 641,764 | 19 | % | ||||||||
| U.S. State and Local Governments | 801,680 | 40 | % | 788,463 | 33 | % | 848,530 | 25 | % | ||||||||
| Non-U.S. Governments | 333,083 | 17 | % | 475,991 | 20 | % | 355,835 | 10 | % | ||||||||
| Subtotal Governments | 1,520,208 | 76 | % | 1,789,457 | 75 | % | 2,165,804 | 63 | % | ||||||||
| Private Entities (worldwide) | 491,767 | 24 | % | 605,883 | 25 | % | 1,255,688 | 37 | % | ||||||||
| Total | $ | 2,011,975 | 100 | % | $ | 2,395,340 | 100 | % | $ | 3,421,492 | 100 | % | |||||
Other than the U.S. government, no single client accounted for 10% or more of our revenuesrevenue in any of the past five fiscal years. The work attributed to the U.S. government for fiscal 2006 includes our work for the Department of Defense, Department of Energy and the Department of Homeland Security. The diversity of our client base is illustrated by the fact that for fiscal 2006, our 25 largest projects, as measured by gross profit, accounted for less than 15% of our consolidated gross profit.
Contracts
The price provisions of the contracts we undertake can be grouped into two broad categories: cost-reimbursable contracts and fixed-price contracts. The majority of our contracts fall under the relatively lower risk category of cost-reimbursable contracts.
Cost-Reimbursable Contracts
Cost-reimbursable contracts consist of two similar contract types, cost-plus and time and material.
Cost Plus. Cost plus is the predominant contracting method used by U.S. federal, state and local governments. These contracts provide for reimbursement of actual costs and overhead incurred by us, plus a predetermined fee. Under some cost-plus contracts, our fee may be based on quality, schedule and other performance factors.
Time and Material. Time and material is common for smaller scale engineering and consulting services. Under these types of contracts, we negotiate hourly billing rates and charge our clients based upon actual hours expended on a project; unlike cost-plus, however, there is no predetermined fee. In addition, any direct project expenditures are passed through to the client and are reimbursed. These contracts may have a fixed price element in the form of not-to-exceed or guaranteed maximum price provisions.
For fiscal 2006, cost-reimbursable contracts represented approximately 68% of our total revenues,revenue, with cost-plus contracts constituting approximately 50% and time and material contracts constituting approximately 18% of our total revenues.revenue.
Fixed-Price Contracts
Fixed-price contracts are the predominant contracting method outside of the United States. There are typically two types of fixed-price contracts. The first and more common type, lump-sum, involves
performing all of the work under the contract for a specified lump-sum fee. Lump-sum contracts are typically subject to price adjustments if the scope of the project changes or unforeseen conditions arise. The second type, fixed-unit price, involves performing an estimated number of units of work at an agreed price per unit, with the total payment under the contract determined by the actual number of units performed.
Many of our lump-sum contracts are negotiated and arise in the design of projects with a specified scope. Lump-sum contracts often arise in the area of construction management. Construction management services can be in the form of general administrative oversight (in which we do not assume responsibility for construction means and methods and is on a cost-reimbursable basis), or on a fixed price, "at risk" basis. We perform a limited amount of construction management "at risk." Under construction management at risk,our design-build projects, we are typically responsible for the design of the facility with the contract price negotiated after we have secured specific bids from various subcontractors and added a contingency and fee. This process is often referred to as "design-build."
Some of our fixed-price contracts require us to provide performance bonds or parent company guarantees to assure our clients that their project will be completed in accordance with the terms of our contracts. In such cases, we typically require our primary subcontractors to provide similar bonds and guarantees or be adequately insured, and we pass the terms and conditions set forth in our
agreement to our subcontractors. We typically mitigate the risks of fixed-price design-build contracts by contracting to complete the projects based on our design as opposed to a third party's design, by not self-performing the construction, by not guaranteeing new or untested processes or technologies and by working only with experienced subcontractors with sufficient bonding capacity. When public agencies seek a design-build approach for major infrastructure projects, we may act as a fixed-price design subcontractor to the general construction contractor and do not assume overall project or construction risk.
For fiscal 2006, fixed price contracts represented approximately 32% of our total revenue. Of this amount, less than 10% of our contracts have exposure to construction cost overruns. Of the remaining approximately 22%, there may be risks associated with our professional fees if we not able to perform our professional services for the amount of the fixed fee. However, we attempt to mitigate these risks as described above.
Joint Ventures
Some of our larger contracts may operate under joint ventures or other arrangements under which we team with other reputable companies, typically companies with which we have worked with for many years. This is often done where the scale of the project dictates such an arrangement or when we want to strengthen either our market position or our technical skills.
Backlog
At DecemberMarch 31, 2006,2007, our revenue backlog was approximately $2.9$3.1 billion, an increase of $0.4 billion, or 15.0%,21.1% from $2.5$2.6 billion at DecemberMarch 31, 2005.2006. Of this $2.9$3.1 billion, we estimate that approximately $2.0$2.3 billion will be completed by DecemberMarch 31, 2007.2008. Approximately $2.5$2.6 billion of our total backlog at DecemberMarch 31, 20062007 is attributable to our PTS segment, while the remaining $0.4$0.5 billion is attributable to our MSS segment. No assurance can be given that we will ultimately realize our full backlog.
Most of our government contracts are multi-year contracts for which funding is appropriated on an annual basis. In the case of these government contracts, our backlog includes only those amounts that have been funded and authorized and therefore does not reflect amounts we may receive over the term of the contracts. In the case of non-government contracts, our backlog includes future revenue at contract rates, excluding contract renewals or extensions that are at the discretion of the client. For contracts with a not-to-exceed maximum amount, we include revenue from such contracts in backlog to
the extent of the remaining estimated amount. We calculate backlog without regard to possible project reductions or expansions or potential cancellations until such changes or cancellations occur.
Backlog is expressed in terms of revenue and therefore may include significant estimated amounts of third party, or pass-through costs to subcontractors and other parties. Moreover, our backlog for the period beyond 12 months may be subject to variations from year to year as existing contracts are completed, delayed or renewed or new contracts are awarded, delayed or cancelled. As a result, we believe that year-to-year comparisons of the portion of backlog expected to be performed more than one year in the future are difficult to interpret and not necessarily indicative of future revenuesrevenue or profitability. Because backlog is not a defined accounting term, our computation of backlog may not necessarily be comparable to that of our peers.
Competition
The professional technical and management support services markets we serve are highly fragmented and we compete with a large number of regional, national and international companies. Certain of these competitors have greater financial and other resources than we do. Others are smaller and more specialized, and concentrate their resources in particular areas of expertise. The extent of our
competition varies according to the particular markets and geographic area. The degree and type of competition we face is also influenced by the type and scope of a particular project. Our clients make competitive determinations based upon experience, reputation and ability to provide the relevant services in a timely, safe and cost-efficient manner.
Seasonality
The fourth quarter of our fiscal year (July 1 to September 30) is typically our strongest quarter. The U.S. federal government tends to authorize more work during the period preceding the end of its fiscal year, September 30. In addition, many U.S. state governments with fiscal years ending on June 30 tend to accelerate spending during the fiscal first quarter when new funding budgets become available. Within the U.S., as well as other parts of the world, we generally benefit from milder weather conditions in our fiscal fourth quarter, which allows for more productivity from our field inspection and other on-site civil services. Our construction and project management services also typically expand during the high construction season of the summer months.
Insurance and Risk Management
We maintain insurance covering professional liability and claims involving bodily injury and property damage. We consider our present limits of coverage, deductibles, and reserves to be adequate. Wherever possible, we endeavor to eliminate or reduce the risk of loss on a project through the use of quality assurance/control, risk management, workplace safety and similar methods. A majority of our operating subsidiaries are quality certified under ISO 9001:2000 or an equivalent standard, and we plan to continue to obtain certification where applicable. ISO 9001:2000 refers to international quality standards developed by the International Organization for Standardization, or ISO.
Risk management is an integral part of our project pricingmanagement approach for fixed price contracts and our project execution process. We have a risk management group that reviews and oversees the risk profile of our operations. This group also participates in evaluating risk through internal risk analyses in which our corporate management reviews higher-risk projects, contracts or other business decisions that require corporate approval.
Regulation
We are regulated in a number of fields in which we operate. In the United States, we deal with numerous U.S. government agencies and entities, including branches of the U.S. military, the
Department of Defense, the Department of Energy, intelligence agencies and the Nuclear Regulatory Commission. When working with these and other U.S. government agencies and entities, we must comply with laws and regulations relating to the formation, administration and performance of contracts. These laws and regulations, among other things:
Internationally, we are subject to various government laws and regulations (including the U.S. Foreign Corrupt Practices Act and similar non-U.S. laws and regulations), local government regulations and procurement policies and practices and varying currency, political and economic risks.
To help ensure compliance with these laws and regulations, all of our employees are required to complete tailored ethics and other compliance training relevant to their position and our operations.
Personnel
Our principal asset is our employees. A large percentage of our employees have technical and professional backgrounds and bachelor and advanced degrees. We believe that we attract and retain talented employees by offering them the opportunity to work on highly visible and technically challenging projects in a stable work environment. The tables below identify our personnel by segment and geographic region.
Personnel by Segment
| | As of September 30, | | As of September 30, | | ||||||||||||
|---|---|---|---|---|---|---|---|---|---|---|---|---|---|---|---|---|
| | As of December 31, 2006 | As of March 31, 2007 | ||||||||||||||
| | 2004 | 2005 | 2006 | 2004 | 2005 | 2006 | ||||||||||
| Professional Technical Services | 13,000 | 16,300 | 19,000 | 19,400 | 13,000 | 16,300 | 19,000 | 20,400 | ||||||||
| Management Support Services | 4,700 | 5,700 | 8,300 | 9,100 | 4,700 | 5,700 | 8,300 | 9,800 | ||||||||
| Total | 17,700 | 22,000 | 27,300 | 28,500 | 17,700 | 22,000 | 27,300 | 30,200 | ||||||||
Personnel by Geographic Region
| | As of September 30, | | As of September 30, | | ||||||||||||
|---|---|---|---|---|---|---|---|---|---|---|---|---|---|---|---|---|
| | As of December 31, 2006 | As of March 31, 2007 | ||||||||||||||
| | 2004 | 2005 | 2006 | 2004 | 2005 | 2006 | ||||||||||
| Americas | 8,500 | 10,100 | 10,400 | 10,500 | 8,500 | 10,100 | 10,400 | 11,200 | ||||||||
| Europe | 1,900 | 2,700 | 3,100 | 3,000 | 1,900 | 2,700 | 3,100 | 3,100 | ||||||||
| Middle East | 3,600 | 5,200 | 8,800 | 9,700 | 3,600 | 5,200 | 8,800 | 10,400 | ||||||||
| Asia/Pacific | 3,700 | 4,000 | 5,000 | 5,300 | 3,700 | 4,000 | 5,000 | 5,500 | ||||||||
| Total | 17,700 | 22,000 | 27,300 | 28,500 | 17,700 | 22,000 | 27,300 | 30,200 | ||||||||
Personnel by Segment and Geographic Region
| | As of September 30, 2006 | As of December 31, 2006 | As of September 30, 2006 | As of March 31, 2007 | ||||||||||||||||||||
|---|---|---|---|---|---|---|---|---|---|---|---|---|---|---|---|---|---|---|---|---|---|---|---|---|
| | PTS | MSS | Total | PTS | MSS | Total | PTS | MSS | Total | PTS | MSS | Total | ||||||||||||
| Americas | 9,600 | 800 | 10,400 | 9,700 | 800 | 10,500 | 9,600 | 800 | 10,400 | 10,300 | 900 | 11,200 | ||||||||||||
| Europe | 3,100 | — | 3,100 | 3,000 | — | 3,000 | 3,100 | — | 3,100 | 3,100 | — | 3,100 | ||||||||||||
| Middle East | 1,300 | 7,500 | 8,800 | 1,400 | 8,300 | 9,700 | 1,300 | 7,500 | 8,800 | 1,500 | 8,900 | 10,400 | ||||||||||||
| Asia/Pacific | 5,000 | — | 5,000 | 5,300 | — | 5,300 | 5,000 | — | 5,000 | 5,500 | — | 5,500 | ||||||||||||
| Total | 19,000 | 8,300 | 27,300 | 19,400 | 9,100 | 28,500 | 19,000 | 8,300 | 27,300 | 20,400 | 9,800 | 30,200 | ||||||||||||
We have a number of personnel with "Top Secret" or "Q" security clearances. Some of our contracts with the U.S. government relate to projects that have elements that are classified for national security reasons. Although most of our contracts are not themselves classified, persons with high security clearances are often required to perform portions of the contracts.
A portion of our employees are employed on a project by project basis to meet our contractual obligations, generally in connection with government projects in our MSS segment. Approximately 200 of our employees are covered by collective bargaining agreements. We believe our employee relations are good.
Geographic Information
For geographic information, please refer to footnote 19 of our consolidated financial statements found elsewhere in this prospectus.
Properties
Our corporate offices are located in approximately 72,00083,000 square feet of space at 555 and 515 South Flower Street, Los Angeles, California. Our other offices consist of an aggregate of approximately 3.84.3 million square feet worldwide. We also maintain smaller administrative or project offices. Virtually all of our offices are leased. See Note 11 of the notes to our consolidated financial statements for information regarding our lease obligations. We believe our current properties are adequate for our business operations and are not currently underutilized. We may add additional facilities from time to time in the future as the need arises.
Legal Proceedings
As a government contractor, we are subject to various laws and regulations that are more restrictive than those applicable to non-government contractors. Intense government scrutiny of contractors' compliance with those laws and regulations through audits and investigations is inherent in government contracting, and, from time to time, we receive inquiries, subpoenas, and similar demands related to our ongoing business with government entities. Violations can result in civil or criminal liability as well as suspension or debarment from eligibility for awards of new government contracts or option renewals.
We are involved in various investigations, claims and lawsuits in the normal conduct of our business, none of which, in the opinion of our management, based upon current information and discussions with counsel, is expected to have a material adverse effect on our consolidated financial position, results of operations, cash flows or our ability to conduct business. From time to time we establish reserves for litigation when we consider it probable that a loss will occur.
Board of Directors and Executive Officers
The names, ages and positions of our directors and executive officers are as follows:
| Name | Age(1) | Position | ||
|---|---|---|---|---|
| John M. Dionisio | 58 | Director, President and Chief Executive Officer | ||
| Richard G. Newman | 72 | Director, Chairman | ||
| Francis S. Y. Bong | Director, Chairman Asia | |||
| H. Frederick Christie | 73 | Director | ||
| James H. Fordyce | Director | |||
| S. Malcolm Gillis | 66 | Director | ||
| Linda Griego | 59 | Director | ||
| Robert J. Lowe | Director | |||
| William G. Ouchi | 63 | Director | ||
| William P. Rutledge | Director | |||
| Lee D. Stern | 55 | Director | ||
| James R. Royer | 60 | Executive Vice President and Chief Operating Officer | ||
| Michael S. Burke | Executive Vice President, Chief Corporate Officer and Chief Financial Officer | |||
| Glenn R. Robson | Senior Vice President and Chief Strategy Officer | |||
| Raymond W. Holdsworth | Vice Chairman, Corporate | |||
John M. Dionisio was appointed our President and Chief Executive Officer on October 1, 2005 and was elected to our Board of Directors in December 2005. From October 2003 to October 2005, Mr. Dionisio served as our Executive Vice President and Chief Operating Officer. From October 2000 to October 2003, Mr. Dionisio served as President and Chief Executive Officer of our subsidiary, DMJM+Harris. Mr. Dionisio joined Frederic R. Harris, Inc., in 1971, predecessor company to DMJM+Harris where he served in many capacities, including Chief Executive Officer from October 1999 to October 2003, President from July 1996 to October 1999, Executive Vice President in charge of all U.S. operations from 1993 to 1996 and Manager of the New York Operations and Northern Region Manager from 1992 to 1993.
Richard G. Newman has been a member of our Board of Directors since May 1990 and currently is our Chairman. Mr. Newman was our President until 1993, and then Chairman, President and Chief Executive Officer from May 1993 to October 2000 and Chairman and CEO from 2000 to 2005. He served as a director of Ashland Technology Corporation from February 1989 until it became AECOM in April 1990. Mr. Newman was also President of Ashland Technology, which later became AECOM, from December 1988 until May 1990. Previously, he was President and Chief Operating Officer of Daniel, Mann, Johnson & Mendenhall from October 1985 to December 1988 and a Corporate Vice President or Vice President of DMJM from 1977 to 1985. Mr. Newman is also a director of Southwest Water Company, Sempra Energy Company and 14 mutual funds affiliated with Capital Research and Management Company.
Francis S. Y. Bong was named to our Board of Directors after our merger with Maunsell in May 2000. He serves as Chairman for our operations in Asia. Prior to our merger with Maunsell, Mr. Bong was Chairman and Chief Executive of Maunsell Consultants Asia Holding Ltd. from 1997 to 2000 and served as Managing Director of the same firm from 1987 to 1996. Mr. Bong started with
Maunsell in 1975. Mr. Bong also serves on the Board of Directors of Cosmopolitan International Holdings Ltd. as a non-executive director.
H. Frederick Christie was named to our Board of Directors in August 1990. From 1987 until his retirement in 1989, Mr. Christie served as President and Chief Executive Officer of The Mission Group, where he was responsible for all of the non-utility subsidiaries of SCEcorp., the parent company of Southern California Edison Company. Mr. Christie served as President and as a director of Southern California Edison Company from November 1984 until September 1987 after having previously served as Executive Vice President and Chief Financial Officer. He is also a member of the Board of Directors of IHOP Corp., Southwest Water Company, Ducommun Incorporated, and 21 mutual funds affiliated with Capital Research and Management Company.
James H. Fordyce was named to our Board of Directors in February 2006. Mr. Fordyce is a Managing Director with J.H. Whitney Capital Partners, LLC, a private investment firm. He has been with J.H. Whitney since July 1996. Mr. Fordyce began his career at Chemical Bank in 1981, where he spent eight years primarily in their leveraged buyout group before then joining Heller Financial, Inc. as a Senior Vice President where he spent his time investing both debt and equity. Mr. Fordyce is currently a director of several privately-held companies.
S. Malcolm Gillis was named to our Board of Directors in January 1998. From July 2004 to present, Dr. Gillis has been a University Professor at Rice University. Dr. Gillis served as President of Rice University from July 1993 to June 2004. Before assuming the presidency of Rice, Dr. Gillis was a professor at Duke University from 1984 to 1993, where he served as Dean of the Faculty of Arts and Sciences from 1991 to 1993. He was at Harvard University from 1969 to 1984, where he did extensive teaching and consulting in the area of international economics, with particular emphasis on Latin America and Asia, working with heads of state on economic policy issues. Dr. Gillis was a director of the Federal Reserve Bank of Dallas from 1998 to 2004. Dr. Gillis is a member of the board of directors of Halliburton Company, Electronic Data Systems Corporation, Introgen Therapeutics, Inc. and Service Corporation International. Dr. Gillis also serves on the boards of various educational and charitable organizations and government commissions and committees.
Linda Griego was named to our Board of Directors in JuneMay 2005. Ms. Griego has served as President and Chief Executive Officer of Griego Enterprises, Inc. since 1985 and is also Managing General Partner of Engine Co. No. 28, a restaurant that she founded in 1988. From July 1999 until January 2000, Ms. Griego served as interim President and Chief Executive Officer of the Los Angeles Community Development Bank. She is currently a director of CBS Corporation, Granite Construction Incorporated, City National Bank and Southwest Water Company. Ms. Griego has also served as a Los Angeles branch director of the Federal Reserve Bank of San Francisco.
Robert J. Lowe was named to our Board of Directors in February 1993. Mr. Lowe is Chairman and Chief Executive Officer of Lowe Enterprises, Inc. and its affiliated companies. He was the principal founding shareholder in 1972 of the corporation that became Lowe Enterprises, Inc. Mr. Lowe also serves on the Board of Claremont McKenna College and on the boards of various charitable organizations and government commissions and committees.
William G. Ouchi joined our Board of Directors in May 2003. Dr. Ouchi is the Sanford and Betty Sigoloff Distinguished Professor in Corporate Renewal in the Anderson School of Management at the University of California, Los Angeles. He has been on the faculty of UCLA since 1979. Dr. Ouchi is a director of Sempra Energy, FirstFed Financial Corp. and the Conrad N. Hilton Foundation. Dr. Ouchi has also been Vice Dean for Executive Education at UCLA and Chief of Staff for the Mayor of Los Angeles. Dr. Ouchi also serves on the boards of various charitable organizations.
William P. Rutledge was named to our Board of Directors in November 1998. Mr. Rutledge was President and Chief Executive Officer of Allegheny Teledyne, Inc. from August 1996 until his
retirement in 1997. Mr. Rutledge serves as Chief Executive Officer of Aquanano, LLC. Mr. Rutledge also serves on the Board of Directors of FirstFed Financial Corp., Communications & Power Industries, Sempra Energy Corporation and the board of trustees of Lafayette College, Saint John's Health Center Foundation and the World Affairs Council of Los Angeles.
Lee D. Stern was named to our Board of Directors in February 2006. Mr. Stern is a Managing Director at GSO Capital Partners LP., an investment advisor managing several private investment funds. Prior to joining GSO, Mr. Stern was the chief transaction officer of Technology Investment Capital Corp. from November 2003 to September 2005 and has over 20 years of financial and investment experience in leveraged finance and in financing technology companies. Prior to Technology Investment Capital Corp., Mr. Stern was with the boutique investment banking firm Hill Street Capital from March 2001 to November 2003. From 1997 to 2000, he was a partner of Thomas Weisel Partners and NationsBanc Montgomery, where he focused on leveraged transactions relating to acquisition finance and leveraged buyouts, including private and public mezzanine finance. From 1993 to 1997, Mr. Stern was a managing director at Nomura Securities International, where he played a key role in building the firm's merchant banking and principal debt investing business. He sat on Nomura Securities International's commitment and underwriting committees. Mr. Stern has also held managing director positions at Kidder, Peabody & Co., Inc. from 1990 to 1992 and Drexel Burnham Lambert from 1985 to 1990.
James R. Royer was appointed Executive Vice President and Chief Operating Officer in October 2005. From October 2004 to October 2005, Mr. Royer was Chief Executive of our Americas Facilities Group, Regional Group and Government Services Group. He was appointed Chairman of the Board of our subsidiary DMJM H&N in February 2002 and Chief Executive Officer in April 2003. Prior to that, he served as Chairman of the Board, President and Chief Executive Officer of our subsidiary TCB INC. from August 1991 to September 2003, and continued in his role as Chief Executive Officer of TCB INC. until October 2004. He was elected President of Turner Collie & Braden Inc. (TCB) in 1987. He served in various senior management positions with TCB, including Vice President from 1982 through 1987. Mr. Royer is a director and former Chairman of the Greater Houston Partnership and is also a member of the board of directors of Memorial Herman Health Care System in Houston.
Michael S. Burke was appointed Executive Vice President and Chief Corporate Officer in May 2006 and was appointed Chief Financial Officer in December 2006. Mr. Burke joined AECOM as Senior Vice President, Corporate Strategy in October 2005. From 1990 to 2005, Mr. Burke was with the accounting firm, KPMG LLP. He served in various senior leadership positions most recently as a Western Area Managing Partner from 2002 to 2005 and was a member of KPMG's Board of Directors from 2000 through 2005. While on the KPMG Board of Directors, Mr. Burke served as the Chairman of the Board Process and Governance Committee and a member of the Audit and Finance Committee. Mr. Burke also serves on the Board of Directors of Rentech, Inc. and is the Chairman of its Audit Committee. Mr. Burke also serves on various charitable and community boards.
Glenn R. Robson was appointed Senior Vice President and Chief Strategy Officer in December 2006. Mr. Robson joined AECOM in May 2002 as Senior Vice President and Chief Financial Officer. Prior to joining AECOM, Mr. Robson worked at Morgan Stanley & Co. Incorporated for twelve years, where he served most recently as a Managing Director in the investment banking division, and previously as a Principal and Vice President in the corporate finance department. Earlier in his career, Mr. Robson was a Business Analyst with McKinsey & Company.
Raymond W. Holdsworth was appointed Vice Chairman, Corporate Development in October 2005. Prior to this position, Mr. Holdsworth served as our President from March 2000 to October 2005. From January 1999 to March 2000, Mr. Holdsworth was Group Chief Executive for three of AECOM's operating companies. He was President & Chief Executive Officer of DMJM from April 1993 to 1997,
and Chairman & Chief Executive Officer from then until January 1999. Mr. Holdsworth served as DMJM's Vice President for Corporate Development from June 1992 to April 1993.
David N. Odgers was appointed Vice Chairman, Professional Development, in October 2005. From October 2005 to September 2006 he was also Chief Executive of our Global Group. From the time of our merger with Maunsell in April 2000 until September 2005, Mr. Odgers was responsible for our operations outside of the Americas. Mr. Odgers was Chief Executive of the Maunsell Group from 1998 until the merger, before which, from 1989, he was Chief Executive of Maunsell Pty Ltd in Australia. He served in a variety of positions of increasing responsibility with the Maunsell Group since he started with the Group in 1965.
Composition of the Board of Directors
In accordance with the terms of our Restated Certificate of Incorporation, the terms of office of members of our Board of Directors, other than the two members elected by holders of our Class F and Class G convertible preferred stock, are divided into three classes:
Our Class I directors are Richard G. Newman, Linda Griego and William G. Ouchi, our Class II directors are John M. Dionisio, Robert J. Lowe and William P. Rutledge, and our Class III directors are Francis S. Y. Bong, H. Frederick Christie and S. Malcolm Gillis. In addition, currently, holders of a majority of our Class F convertible preferred stock and holders of a majority of our Class G convertible preferred stock are each entitled to elect one director annually to our Board of Directors. These seats are currently held by James H. Fordyce for the Class G preferred stock and Lee D. Stern for the Class F preferred stock. Upon the sale of shares held by J.H. Whitney VI, L.P. in this offering, the current holders of our Class G convertible preferred stock will no longer be entitled to designate a member of our Board of Directors in future director elections. No decision has been made with regard to any change in the composition of our Board of Directors. At each annual meeting of stockholders, the successors to the directors whose terms will then expire will be elected to serve from the time of election and qualification until the third annual meeting following such election. Any vacancies in our classified Board will be filled by the remaining directors and the elected person will serve the remainder of the term of the class to which he or she is appointed. Any additional directorships resulting from an increase in the number of directors will be distributed among the three classes so that, as nearly as possible, each class will consist of one-third of the directors, subject to the rights of holders of Class F preferred stock and Class G preferred stock.
Our Board of Directors has determined that the following members are independent as determined in reference to the standards of the New York Stock Exchange: Mr. Christie, Mr. Fordyce, Mr. Gillis, Ms. Griego, Mr. Lowe, Mr. Ouchi, Mr. Rutledge and Mr. Stern.
Board Structure and Committee Composition
As of the date of this prospectus, our Board of Directors has eleven directors and the following four committees: Audit, Compensation and Organization, Nominating and Governance and Planning, Finance and Investments. The membership during the last fiscal year and the function of each of the
committees are described below. During fiscal 2006, our Board held five meetings. Each director attended at least 75% of all Board and applicable committee meetings.
| | Audit Committee | Compensation and Organization Committee | Nominating and Governance Committee | Planning, Finance and Investment Committee | ||||
|---|---|---|---|---|---|---|---|---|
| Francis S.Y. Bong | X | |||||||
| H. Frederick Christie* | X | Chairperson | ||||||
| James H. Fordyce | X | X | ||||||
| S. Malcolm Gillis | X | Chairperson | ||||||
| Linda Griego | X | X | X | |||||
| Robert J. Lowe | X | Chairperson | ||||||
| William G. Ouchi | X | X | X | |||||
| William P. Rutledge | Chairperson | X | ||||||
| Lee D. Stern | X | X | X |
Audit Committee. The Audit Committee of our Board of Directors consists of William P. Rutledge (Chairperson), H. Frederick Christie, S. Malcolm Gillis, Linda Griego and Lee D. Stern. The Audit Committee, which is composed solely of independent directors, makes recommendations to our Board of Directors regarding the selection of independent auditors, reviews the results and scope of the audit and other services provided by our independent auditors, and reviews and evaluates our audit and control functions. Our Audit Committee held five meetings during fiscal year 2006. Our Board of Directors has determined Mr. Rutledge, Chairperson of the Audit Committee, and several other members of the Audit Committee qualify as "audit committee financial experts" as defined by the rules under the Securities Exchange Act of 1934. The background and experience of each of our audit committee members are set forth above.
Compensation and Organization Committee. The Compensation and Organization Committee of our Board of Directors consists of H. Frederick Christie (Chairperson), James H. Fordyce, Linda Griego, Robert J. Lowe, William G. Ouchi and Lee D. Stern. The Compensation and Organization Committee, comprised solely of independent directors, oversees our compensation plans and organizational matters. Such oversight includes decisions regarding executive management salaries, incentive compensation and long-term compensation plans as well as company wide incentive and equity plans for our employees and consultants and appointments and promotions for senior management. Our Compensation and Organization Committee held seven meetings during fiscal year 2006.
Nominating and Governance Committee. The Nominating and Governance Committee of our Board of Directors consists of S. Malcolm Gillis (Chairperson), Linda Griego, William G. Ouchi, and Lee D. Stern. The Nominating and Governance Committee is comprised solely of independent directors and is responsible for recruiting and retention of qualified persons to serve on our Board of Directors, including proposing such individuals to the Board of Directors for nomination for election as directors, for evaluating the performance, size and composition of the Board of Directors and for oversight of our compliance activities. The Nominating and Governance Committee considers written suggestions from stockholders, including potential nominees for election, and oversees the corporation's governance programs. Our Nominating and Governance Committee held five meetings during fiscal year 2006.
Planning, Finance and Investment Committee. The Planning, Finance and Investment Committee of our Board of Directors consists of Robert J. Lowe (Chairperson), Francis S.Y. Bong, James H.
Fordyce, William G. Ouchi and William P. Rutledge. The Planning, Finance and Investment Committee reviews our financing programs, proposed investments, including mergers, and other strategic initiatives. Our Planning, Finance and Investment Committee held six meetings in fiscal year 2006.
Compensation Committee Interlocks and Insider Participation
None of the members of the Compensation and Organization Committee of our Board of Directors is an officer or employee of our company. No executive officer of our company serves as a member of the Board of Directors or compensation committee of any entity that has one or more executive officers serving on our Compensation and Organization Committee.
Executive Sessions
Executive sessions of non-management directors are included on the agenda for every regularly scheduled Board and Board committee meeting. The Board sessions are chaired by H. Frederick Christie the board's, lead independent director, and the chairperson of the applicable committee chairs the committee executive sessions. Any director can request that an additional executive sessions be scheduled.
Compensation of the Board of Directors
Those of our directors who also serve as our officers or consultants, or as officers or consultants of our subsidiaries, or those directors representing the Class F and G preferred stock are not compensated by us for attending meetings or performing any other function of the Board. All other directors are paid a retainer of $36,000 per year. In addition, non-employee directors (other than directors elected by holders of our Class F and Class G convertible preferred stock) receive the following meeting fees:
Our non-employee directors are entitled to defer some or all of their annual retainers and meeting fees to our Non-Qualified Stock Purchase Plan and receive common stock units, except for non-U.S. resident directors who may be permitted to defer into their local AECOM stock plans.
Each non-employee director, at the time he or she is first elected to our Board of Directors, receives options to purchase 5,00010,000 shares of our common stock under our Stock Incentive Plan for Non-Employee Directors and thereafter will receive annually options for a number of shares approved by the Board of Directors. The exercise price for such options is the market value of our common stock on the date of grant and the options are exercisable six months after the grant date. The compensation described above does not apply to the directors elected by the holders of the Class F and Class G convertible preferred stock.
Limitation of Directors' Liability and Indemnification
As permitted by Delaware law, our Certificate of Incorporation contains a provision eliminating the personal liability of our directors to us and our stockholders for monetary damages for breaches of their fiduciary duty as directors to the fullest extent permitted by the General Corporation Law of Delaware. Under the present provisions of the General Corporation Law of Delaware, our directors' personal liability to us and our stockholders for monetary damages may be so eliminated for any breach
of fiduciary duty as a director other than (i) any breach of a director's duty of loyalty to us or to the stockholders, (ii) acts or omissions not in good faith or that involve intentional misconduct or a knowing violation of the law, (iii) dividends or stock repurchases or redemptions that are illegal under Delaware law, and (iv) any transaction from which a director receives an improper personal benefit. This provision pertains only to breaches of duty by directors as directors and not in any other corporate capacity, such as being an officer. As a result of the inclusion of such provision in our Certificate of Incorporation, our stockholders may be unable to recover monetary damages against directors for actions taken by them that constitute gross negligence or that are in violation of their fiduciary duties, although it may be possible to obtain injunctive or other equitable relief with respect to such actions. If equitable remedies are found not to be available to stockholders in any particular case, stockholders may not have any effective remedy against the challenged conduct.
Our bylaws require us to indemnify our officers and directors against expenses and costs, judgments, settlements and fines reasonably incurred in the defense of any claim, including any claim brought by us or in our right, to which they were made parties by reason of being or having been officers or directors.
Compensation Discussion & Analysis
Overview
Our compensation programs are designed to provide an overall total direct compensation package that is competitive with our peer companies, allow us to attract and retain key talent, and provide incentives that promote short- and long-term financial growth and stability to continuously enhance stockholder value based on a pay-for-performance model. We refer to the executive officers named in the Summary Compensation Table that follows this Compensation Discussion & Analysis (such officers being our Chief Executive Officer (CEO) and President, Chairman, Chief Financial Officer, Chief Corporate Officer, Chief Operating Officer, and Chairman of Asia) as "Named Executive Officers." The Compensation and Organization Committee of the Board of Directors reviews and approves the compensation program for our Named Executive Officers and oversees our executive compensation strategy.
To implement these principles, we target base salary compensation for our Named Executive Officers at the 50th percentile of appropriate peer group companies taking into account the experience level of the individuals in their current positions. Short term compensation or annual incentive bonuses for the Named Executive Officers are based on a comparison to the peer group's prior twelve month performance in the areas of growth in earnings before interest, taxes and amortization (EBITA), return on investment (ROI) and growth in earnings per share. Similarly, long-term compensation for our Named Executive Officers is based on these same benchmarks comparing our performance over the prior five years against that of the peer group.
Our Compensation and Organization Committee then considers these quantitative performance comparisons and the compensation of executives of the peer group companies in similar positions, as well as qualitative performance factors they deem important to insure the alignment of our executives' compensation with the goals of our stockholders. The qualitative factors are developed with the CEO for the Named Executive Officers reporting to the CEO, and by the Compensation and Organization Committee for the CEO. These qualitative factors include items such as experience, leadership, integrity, strategic planning, team building, diversity, stability and succession planning.
The peer group companies considered in the performance comparisons and compensation of executives include Baker (Michael) Corporation, CH2M Hill Companies Limited, Fluor Corporation, Jacobs Engineering Group, Inc., Shaw Group, Tetra Tech, Inc, URS Corporation and Washington Group International, Inc. These firms are considered by the independent valuation firm hired to value AECOM Technology Corporation stock to be peers, potential competitors or partners in our business sector. In addition, the Compensation and Organization Committee believes this group of companies provides an appropriate peer group because they are competitors or other entities with which we compete for employees at the executive level, have similar or best market compensation practices and/or are similar in size to us.
Our compensation package for our Named Executive Officers generally consists of:
incentive compensation equal to their base salary. With unusual performance the Compensation and Organization Committee may provide incentive compensation in excess of base salary. We believe this pay-for-performance model encourages and motivates the executives' performance in alignment with the best interests of our stockholders and employees.
included in our five year strategic plan. Long-term compensation is determined by comparing the total direct compensation for the Named Executive Officer with compensation received by executives at comparable peer companies. The long-term compensation portion of total compensation may equal or exceed the executive's base salary. We believe tying our executives' total direct compensation with the short- and long-term objectives of our strategic plan aligns our executives' interests with our stockholders and provides strong retention and motivational incentives for our executives.
We evaluate each of these three components of compensation described above for each of our Named Executive Officers in determining a compensation program that will encourage the overall success of the individuals and our Company.
As our financial performance improves relative to the performance targets, the Named Executive Officers' potential for additional compensation under the short-term and long-term incentive programs will increase. To help establish and review the compensation paid to the Named Executive Officers, our Compensation and Organization Committee reviews an executive compensation report prepared by Towers Perrin, an independent third-party consulting firm. This report compares performance of the Company and each element of compensation to comparable positions within the general population of similarly sized companies and also to a group of peer companies in our sector including CH2M Hill, Fluor, Foster Wheeler, Jacobs Engineering, Michael Baker, Shaw Group, Tetra Tech, URS and Washington Group International.
Should actual performance fall short of performance targets, total compensation will be reduced. Base compensation is established for a fiscal year and is not adjusted based on performance for the current year. Short-term compensation may be reduced to zero should performance fall short of established targets. Long-term compensation, as described below, is generally subject to company-wide performance targets for the Named Executive Officers. If the Company falls short of its performance targets for the three year performance period, the payout of the restricted stock units will be reduced and may be reduced to zero for significant shortfalls based on a pre-established formula. Our Compensation and Organization Committee evaluates on an annual basis past performance, competitor performance and general market conditions to establish future performance targets.
The Company does not currently have a policy requiring a fixed course of action with respect to compensation adjustments following later restatements of performance targets. Under those circumstances, the Compensation and Organization Committee would evaluate whether compensation adjustments were appropriate based upon the facts and circumstances surrounding the restatement.
Elements of Compensation
Base salary
As described above, we strive to provide our Named Executive Officers with a competitive base salary that is in-line with their roles and responsibilities when compared to peer companies of comparable size. We view base salary as an important component to each Named Executive Officer's overall compensation package. The base salary level is established and reviewed based on the level of responsibilities, the experience and tenure of the individual, and the amount of performance based incentives received or granted each year. The base salary is compared annually to the list of similar positions within comparable peer companies and with consideration of the executive's relative experience in his or her position. Base salaries are reviewed annually and at the time of promotion or other changes in responsibilities.
Short-Term Incentive Compensation
Our short-term incentive compensation program allows us to create annual performance criteria that are flexible and that change with the needs of our business. By creating target awards and setting performance objectives at the beginning of each fiscal year, our Named Executive Officers understand the goals and priorities of the Company during the current fiscal year. Our CEO and his management team are responsible for the overall performance of the Company in accordance with our strategic operating plan, as approved annually by our Board of Directors, and are thus evaluated on these objectives.
Named Executive Officers may receive approximately 25 – 40% of their total compensation as incentive compensation. The measurement criteria for our CEO and our Chairman's incentive compensation bonuses for fiscal year 2006 were based on our overall corporate level performance measures including growth in EBITA, EBITA return compared to the total invested capital, and growth in earnings per share after adjustments for one-time merger related expenses. For our other Named Executive Officers (other than our CEO and our Chairman), the following criteria for incentive compensation bonuses for fiscal year 2006 were used: overall corporate level performance measures including EBITA vs. plan, annual growth in EBITA, cash flow, backlog and a discretionary component. The discretionary component took into account qualitative achievements such as seamless transition of the CEO, Chief Operating Officer and Chief Financial Officer positions in fiscal 2006; initiating and completing significant mergers, including effective integration; aggressive quality and safety development plans; development and implementation of our employee engagement programs; cross-selling and production sharing between our operating brands; and other personal accomplishments. The Compensation and Organization Committee determines the final incentive compensation for the Named Executive Officers.
Long-term Incentive Compensation—Performance Earnings Program (PEP) and Stock Options
We provide two types of long-term compensation pursuant to our Stock Incentive Plan: Performance Earnings Program (PEP) restricted stock units and options to purchase AECOM common stock.
Our long-term incentive compensation programs are designed to focus and reward our Named Executive Officers on our long-term goals. By creating a three-year performance period under our PEP (described below) to complement our stock option program, our goal is to encourage and to provide an incentive for our Named Executive Officers to advance AECOM's long-term goals and enhance stockholder value. Our Named Executive Officers may receive approximately 25 – 60% of their total compensation as long-term incentive compensation.
Once per year, our CEO provides the Compensation and Organization Committee with a recommended total dollar pool for long-term incentives to be awarded to all Named Executive Officers as well as other key executives, excluding the CEO and the Chairman. The Compensation and Organization Committee then reviews the report from the executive compensation consultants, including the comparable total direct compensation amounts of peer companies and determines the final total dollar amount of long-term incentives that are to be awarded to the Named Executive Officers, including the CEO's and Chairman's final total long-term incentive compensation.
they are key indicators of our financial and operational success and are key drivers of long-term stockholder value. The specific performance goal levels reflect confidential, internal financial targets at the time the awards are established. These goals require a high level of financial performance to be achieved over the three-year period. As was the case with the awards granted for prior performance periods, the goals for the PEP06 performance period are challenging but, we believe, achievable. Our performance for the first year of the three-year PEP06 program was at approximately 90% of the targeted level. The PEP awards generally vest on December 31st following the close of the three year performance period. The Named Executive Officer must be an active employee at the time the PEP is settled or the Named Executive Officer forfeits the PEP award, although exceptions may be made by the Compensation and Organization Committee, including exceptions for retirement, death or disablement. At the end of the three year performance period, the final amount of performance-based restricted stock units that are earned by each Named Executive Officer will be determined based on achievement of the performance criteria.
In 2006, the Board modified our 2005 PEP (PEP05, for fiscal years 2005-2007) and PEP06 (PEP05, for fiscal years 2006-2008) to provide for partial payments prior to January 2008. The PEP05 modification provides an interim payout in January 2007 based on two years of performance with the amount earned paid one half in cash and the other half in AECOM common stock. The remaining balance for the PEP05 award based on three years performance through September 2007 will be paid in January 2008 in AECOM common stock. PEP06 will similarly have one half of the amount earned for its first year of the three year performance period paid in cash in January 2007 and one half paid in AECOM common stock. The remaining amounts earned based on the PEP06 actual three year performance through September 2008 will be paid in January 2009 in AECOM common stock based on the actual three year performance.
The Board believed it was beneficial to amend the PEP program to more clearly align it with the specific guidelines of Statement of Financial Accounting Standards 123R (Share-Based Payment), which the Company was not subject to when the PEP program was first adopted. As originally structured, PEP awards were settled in cash rather than stock. Under SFAS 123R, changes in the Company's stock price cause variability in compensation expense relating to PEP awards that are settled in cash. Awards settled in stock that are based on performance and meet certain other criteria do not cause variability in compensation expense as a result of changes in stock price. The Board also believed it would be beneficial to settle future PEP awards 100% in stock to promote more employee equity ownership in the Company. In recognition of this change in settlement terms, the Board authorized a partial early settlement of the accrued portion of the PEP05 and PEP06 awards in an equal combination of cash and stock consistent with the performance results of the PEP program through fiscal year end 2006.
AECOM common stock received under the PEP05 and PEP06 will be eligible for repurchase by the Company after a minimum six month holding period, pursuant, in general to our stock repurchase program. In 2006, the Named Executive Officers receive all of their long-term compensation as PEP awards rather than options. In general, we consider that the PEPs link pay-for-performance directly and immediately to the Named Executive Officer while stock option awards might be used as part of a key executive hire package that provides an early equity interest in the Company for the new executive. Our 2007 PEP has a deferred compensation election which provides that our Named Executive Officers, as allowed under regulatory statutes, may retain restricted stock units and defer settlement until at least one year after the January 2010 settlement date.
Administrator of the Stock Incentive Plan, at or after age 55. The stock options are issued with an exercise price equal to the price of our common stock (based on the most recent valuation by our independent outside valuation firm) on the later of the date of approval by our Compensation and Organization Committee and the identification of the grantee. In 2006, stock options were not issued to Named Executive Officers as part of their long-term incentive compensation. A new hire grant to our Chief Corporate Officer as part of the offer agreement included stock options.
Generally, since the initiation of the PEP program, the stock options have not been issued to Named Executive Officers as part of their long-term incentive compensation. Effective September 28, 2006, our Board of Directors approved a one-time 100% acceleration of vesting of all employee stock options outstanding as of such date, including options held by Named Executive Officers. The decision to accelerate the vesting of stock options was taken by our Board of Directors with the belief that it is in the best interest of our shareholders to reduce non-cash compensation expense that otherwise would have been recorded beginning in fiscal year 2007 upon the adoption of Statement of Financial Accounting Standards 123R (Share-Based Payment).
Benefit and Retirement Programs
Executive Life Insurance. Our Named Executive Officers are eligible to participate in an Executive Life Insurance plan on an annual basis. This plan is in addition to the basic life insurance program which is open to a large majority of AECOM employees. The Executive Life Insurance plan provides up to an additional $800,000 in coverage.
Executive Medical Insurance. Our Named Executive Officers are eligible to participate in an Executive Medical Insurance plan on an annual basis. This plan is in addition to the basic medical insurance programs that are open to most AECOM employees. The Executive Medical Insurance plan provides up to 100% reimbursement for certain medical expenses up to $75,000 per calendar year.
Senior Executive Equity Investment Plan. We established the Senior Executive Equity Investment Plan (SEEIP) in March 1998 to encourage our senior officers to invest in AECOM common stock by providing loans to fund the purchase of the stock. All of the current Named Executive Officers have had at least one outstanding SEEIP loan note. Under the program, participants also received a company stock match on the amount of stock purchased with the SEEIP loan. The stock match was subject to 10-year cliff vesting period.
All of our outstanding SEEIP loans have been terminated and repaid. In connection with the termination and repayment of such loans or settlement with shares, our Board of Directors approved a 100% acceleration of vesting of all outstanding SEEIP Company stock matches effective on September 28, 2006. SEEIP or similar loans are no longer part of the compensation package awarded to any of our Named Executive Officers or directors.
AECOM Pension Plan. The AECOM Pension Plan is a defined benefit plan that was adopted in September 1990. Participation in the AECOM Pension Plan was frozen to new entrants effective April 1, 1998. Of our Named Executive Officers, only our CEO, Chairman and our Chief Operating Officer were employees as of April 1, 1998 and are eligible to receive a retirement pension benefit under the Pension Plan.
Depending on the participant's years of service to AECOM, the pension benefits will range from 26% to 30.5% of the employee's final capped average monthly compensation plus an additional 11% to 12.5% of the employee's final capped average monthly compensation in excess of specified Social Security base amounts. The final average monthly compensation was capped as of April 1, 2004 at the employee's highest compensation for one full calendar year from 1994 through 2003. If the employee's final average monthly compensation as of April 1, 2004 was lower than the cap, the employee's final average compensation will continue to increase until the participant's average compensation reaches the compensation cap. Pension benefits will generally be reduced for participants with less than 25 years of
service as required by plan rules. Employee contributions to the Pension Plan of up to 1.5% of compensation were required prior to April 1, 1998.
We have generally replaced the AECOM Pension Plan with a 401(k) pension component of our Retirement & Savings Plan (RSP). Employees are allowed to make pre-tax or after-tax contributions of 0.5%, 1.0% or 1.5% of their compensation to this 401(k) pension component. The Company matches
dollar for dollar any such contributions and our matching contributions will vest after three years of service with the Company.
AECOM Management Supplemental Executive Retirement Plan (MSERP). The Company amended the AECOM Pension Plan, effective July 1, 1998, to provide for certain participants including Named Executive Officers (our CEO, Chairman and COO), earning benefits under the AECOM Pension Plan to instead earn identical benefits under a non-qualified plan known as the Management Supplemental Executive Retirement Plan, or MSERP. The MSERP replaces and provides a benefit identical in nature to the AECOM Pension Plan but on an unfunded basis.
The benefits of each employee who participated in the AECOM Pension Plan or MSERP are reduced by the actuarial estimate of the equivalent of a hypothetical account balance, calculated to be what the employee would have in his or her 401(k) pension component from April 1, 1998 until the employee's retirement and if the 401(k) contributions had remained invested in a benchmark fund, which mirrors the AECOM Pension Plan investments.
AECOM Supplemental Executive Retirement Plans (92 SERP & 96 SERP). In October 1992 we established the unfunded Supplemental Executive Retirement Plan, or 92 SERP, and in July 1996 we established the unfunded Supplemental Executive Retirement Plan, or 96 SERP, in order to provide some of our U.S. resident executive officers with pre-retirement death benefits and retirement benefits consistent with the level provided by the previous AECOM Pension Plan formula. These Supplemental Executive Retirement Plans require a participant to have reached the minimum age of 50 and to have worked at AECOM for at least five years. The plans also include early retirement provisions at age 62 with full retirement benefits.
Of our Named Executive Officers, only our CEO is eligible to receive any benefits from the 92 SERP and only our Chief Operating Officer is eligible to receive any benefits from the 96 SERP.
In July of 1996 we established the AECOM Excess Benefit Plan for participants in the Supplemental Executive Retirement Plans in order to provide only those benefits which the AECOM Pension Plan cannot provide due to federal tax limits. Benefits from the Excess Benefit Plan are unfunded and will reduce, dollar-for-dollar, the pension benefit paid by the Supplemental Executive Retirement Plans.
Employment Agreements, Severance Benefits and Change in Control Provisions
Except with respect to our Chief Operating Officer, we do not have any employment agreements in effect with any of our Named Executive Officers. We entered into this agreement with our Chief Operating Officer in connection with his joining us upon the acquisition of TCB, Inc. The employment agreement provides for a severance payment equal to 12 months salary for termination of employment by the Company without cause or by "Constructive Discharge," such as a material reduction in job duties or a required relocation without consent.
Stock Ownership
There are no equity ownership requirements or guidelines that any of our employees must meet or maintain. We have a broad base of stock ownership by employees (including our Named Executive Officers) and believe that this enhances our success by aligning the interests of our employees and stockholders. We encourage Named Executive Officers to invest in our common stock through payroll deductions invested in our stock and matched by our typical company match formula, the grants of PEPs and in certain cases, stock options. In February 2007, we sold 16,22836,209 shares (including
3,753 company stock match shares) of our common stock to our Chief Corporate Officer, who paid $500,000 for such shares.
Review and Approval
Our Compensation and Organization Committee approves the compensation for the CEO and the Chairman and reviews and approves management's recommendations for the CEO's direct reports. In addition, the Compensation and Organization Committee approves compensation philosophy, programs, and ensures that proper due diligence, deliberations, and reviews of executive compensation are conducted.
The Compensation and Organization Committee uses Towers Perrin, an independent third-party consulting firm, to perform an analysis of comparable executive officer level positions within the general professional industry and a list of peer companies. The report of the consulting firm provides market survey information for base salary and short and long-term incentive compensation within the general industry companies and peer companies specified above.
For fiscal 2006, the general industry companies used by our compensation consultant were companies in our general industry, with us being near the median regarding the gross revenuesrevenue and profits of the group. The compensation consultant also provided comparisons of key performance metrics for the Company compared to the peer group. This established the basis for our overall performance which was considered when Compensation and Organization Committee reviewed the performance of and determined compensation for the Named Executive Officers.
Our Compensation and Organization Committee reviews compensation for the Named Executive Officers considering base salary and short- and long-term compensation in a total rewards package rather than making specific comparisons for each category. During fiscal 2006, Mr. Dionisio, our CEO, completed the transition of the CEO responsibilities from Mr. Newman, the prior CEO. The Compensation and Organization Committee, in considering Mr. Newman's base salary as Chairman, reviewed prior compensation practices for the transition of a CEO to Chairman for public companies and, based on a review by our independent consulting firm, determined that base salary typically remains unchanged, and adjustments to short- and long-term compensation are what reflect the transition of duties.
Stock awards granted for fiscal 2006 by the Compensation and Organization Committee to each of the Named Executive Officers were based upon the peer group study of comparable positions prepared by our independent consulting firm, as well as the executive's experience, qualitative results, individual contributions, scope of responsibility and retention risk. We believe that the stock award grants for our top two executives, the CEO and Chairman for fiscal 2006 were in line with peer corporations considering these criteria and the transition of the former CEO to the role of Chairman as noted above. We also believe that stock awards granted for the other Named Executive Officers for fiscal 2006 were in line with peer company compensation for executives in similar positions.
The following seven tables provide information regarding the compensation awarded to or earned during our fiscal year ended September 30, 2006 by our principal executive officer (PEO), principal financial officer (PFO) and the four most highly compensated executive officers other than the PEO and PFO.
Summary Compensation Table for Fiscal Year Ended September 30, 2006
| Name and Principal Position | Year | Salary ($)(1) | Bonus ($)(2) | Stock Awards ($)(3) | Option Awards ($)(4) | Non-Equity Incentive Plan Compensation ($) | Change in Pension Value and Non-Qualified Deferred Compensation Earnings ($) | All Other Compensation ($) | Total ($) | |||||||||||||||||
|---|---|---|---|---|---|---|---|---|---|---|---|---|---|---|---|---|---|---|---|---|---|---|---|---|---|---|
| John M. Dionisio President and Chief Executive Officer (PEO) | 2006 | $ | 718,760 | $ | 850,000 | $ | 1,600,278 | $ | — | $ | — | $ | 89,436 | $ | 103,117 | (5) | $ | 3,361,590 | ||||||||
| Richard G. Newman Chairman | 2006 | $ | 900,016 | $ | 850,000 | $ | 1,324,378 | $ | — | $ | — | $ | 3,674 | $ | 116,947 | (6) | $ | 3,195,015 | ||||||||
| James R. Royer Executive Vice President and Chief Operating Officer | 2006 | $ | 443,758 | $ | 450,000 | $ | 316,871 | $ | — | $ | — | $ | 83,325 | $ | 87,427 | (7) | $ | 1,381,381 | ||||||||
| Michael S. Burke Executive Vice President and Chief Corporate Officer(12) | 2006 | $ | 353,853 | $ | 400,000 | $ | 240,295 | $ | 93,700 | (8) | $ | — | $ | — | $ | 369,568 | (9) | $ | 1,457,416 | |||||||
| Francis S.Y. Bong Chairman Asia | 2006 | $ | 347,431 | $ | 408,218 | $ | 273,899 | $ | — | $ | — | $ | — | $ | 349,954 | (10) | $ | 1,379,502 | ||||||||
| Glenn R. Robson Senior Vice President and Chief Financial Officer (PFO)(12) | 2006 | $ | 343,751 | $ | 260,000 | $ | 219,584 | $ | — | $ | — | $ | — | $ | 62,340 | (11) | $ | 885,675 | ||||||||
"Compensation "Compensation Discussion & Analysis" section in this prospectus for more details regarding this program). The future value of these PEP grants is dependent upon the performance of the Company.
Although AECOM was not subject to FASSFAS 123R "Share-Based Payments" in FY 2006, the disclosures in the Stock Awards column are based on the dollar amounts that AECOM would have recognized as a compensation expense with respect to FY 2006 had AECOM been subject to FASSFAS 123R. The Outstanding Awards at Fiscal Year-End and Option Exercises and Stock Vested tables include additional information with respect to all awards outstanding as of September 30, 2006.
Grants of Plan-based Awards for Fiscal Year 2006
| | | Estimated Future Payouts Under Non-Equity Incentive Plan Awards | Estimated Future Payouts Under Equity Incentive Plan Awards(1) | | | | | | Estimated Future Payouts Under Non-Equity Incentive Plan Awards | Estimated Future Payouts Under Equity Incentive Plan Awards(1) | | | | | ||||||||||||||||||||||||||||||||||||||||||||||
|---|---|---|---|---|---|---|---|---|---|---|---|---|---|---|---|---|---|---|---|---|---|---|---|---|---|---|---|---|---|---|---|---|---|---|---|---|---|---|---|---|---|---|---|---|---|---|---|---|---|---|---|---|---|---|---|---|---|---|---|---|
| Name and Principal Position | Grant Date | Thresholds ($) | Targets ($) | Maximums ($) | Thresholds (#) | Targets (#) | Maximums (#) | All Other Stock Awards: Number of Shares or Stock/Units | All Other Stock Awards: Number of Securities Underlying Options | Exercise or Base Price of Options Awards ($/Sh)(2) | Grant Date Fair value of stock and option awards(3) | Grant Date | Thresholds ($) | Targets ($) | Maximums ($) | Thresholds (#) | Targets (#) | Maximums (#) | All Other Stock Awards: Number of Shares or Stock/Units | All Other Stock Awards: Number of Securities Underlying Options | Exercise or Base Price of Options Awards ($/Sh)(2) | Grant Date Fair value of stock and option awards(3) | ||||||||||||||||||||||||||||||||||||||
| John M. Dionisio President and Chief Executive Officer | 12/01/2005 | $ | — | $ | — | $ | — | 34,500 | 103,500 | 138,000 | — | — | $ | — | $ | 2,567,835 | 12/01/2005 | $ | — | $ | — | $ | — | 69,000 | 207,000 | 276,000 | — | — | $ | — | $ | 2,567,835 | ||||||||||||||||||||||||||||
Richard G. Newman Chairman | 12/01/2005 | $ | — | $ | — | $ | — | 20,450 | 61,350 | 81,800 | — | — | $ | — | $ | 1,522,094 | 12/01/2005 | $ | — | $ | — | $ | — | 40,900 | 122,700 | 163,600 | — | — | $ | — | $ | 1,522,094 | ||||||||||||||||||||||||||||
James R. Royer Executive Vice President and Chief Operating Officer | 12/01/2005 | $ | — | $ | — | — | 5,000 | 15,000 | 20,000 | — | — | $ | — | $ | 372,150 | 12/01/2005 | $ | — | $ | — | — | 10,000 | 30,000 | 40,000 | — | — | $ | — | $ | 372,150 | ||||||||||||||||||||||||||||||
Michael S. Burke Executive Vice President and Chief Corporate Officer | 10/30/2005 12/01/2005 12/01/2005 | $ | — | $ | — | $ | — | 0 2,500 3,375 | 0 7,500 10,125 | 0 10,000 13,500 | — | 10,000 0 0 | (4) | $ | 24.81 | $ $ $ | 93,700 186,075 251,201 | (5) | 10/30/2005 12/01/2005 12/01/2005 | $ | — | $ | — | $ | — | 0 5,000 6,750 | 0 15,000 20,250 | 0 20,000 27,000 | — | 20,000 0 0 | (4) | $ | 12.405 | $ $ $ | 93,700 186,075 251,201 | (5) | ||||||||||||||||||||||||
Francis S. Y. Bong Chairman Asia | 2/01/2005 | $ | — | $ | — | $ | — | 3,750 | 11,250 | 15,000 | $ | — | $ | — | $ | — | $ | 279,113 | 2/01/2005 | $ | — | $ | — | $ | — | 7,500 | 22,500 | 30,000 | $ | — | $ | — | $ | — | $ | 279,113 | ||||||||||||||||||||||||
Glenn R. Robson Senior Vice President and Chief Financial Officer | 12/01/2005 | $ | — | $ | — | $ | — | 3,375 | 10,125 | 13,500 | $ | — | $ | — | $ | — | $ | 251,201 | 12/01/2005 | $ | — | $ | — | $ | — | 6,750 | 20,250 | 27,000 | $ | — | $ | — | $ | — | $ | 251,201 | ||||||||||||||||||||||||
The threshold for the PEP awards was 25% of the total granted target credits. The target for the PEP awards was 75% of the total granted target credits. The maximum for the PEP awards was 100% of the total granted target credits. At the end of FY 2006, the Compensation and Organization Committee, with approval from the Board of Directors, determined that the payment terms for outstanding FY06 PEP awards would be modified. One-third of the opportunity under the 2006 PEP cycle was determined to have been earned at 85% of target based upon actual FY 2006 performance results and has been paid out 50% in cash and 50% in vested common stock in January 2007. Shares issued in settlement of the PEP award must be held for 6 months before recipients will be eligible for the annual diversification program.
Two-thirds of the opportunity under the 2006 PEP cycle will be settled solely in shares of AECOM stock in January 2009 based on the cumulative performance of the original three fiscal years (FY 2006-08) less the amount paid to the Named Executive Officer in January 2007. The remaining two-thirds balance will vest 100% on December 1 following the close of the three-year performance period. At the election of the participant, awards may be settled in shares net of minimum statutory tax withholding requirements. Any shares issued in settlement of the awards must be held for 6 months before recipients will be eligible for a one-time diversification of up to 50% of the shares received at the then-current AECOM stock price. Any remaining AECOM shares will qualify for the annual diversification program.
Outstanding Equity Awards at Fiscal Year-End 2006
| | | | | | | Stock Awards(2) | | | | | | Stock Awards(2) | ||||||||||||||||||||||||||||
|---|---|---|---|---|---|---|---|---|---|---|---|---|---|---|---|---|---|---|---|---|---|---|---|---|---|---|---|---|---|---|---|---|---|---|---|---|---|---|---|---|
| | | | | | | | | | Equity Incentive Plan Awards: Market or Payout Value of Unearned Shares, Units or Other Rights that Have Not Vested ($) | | | | | | | | | Equity Incentive Plan Awards: Market or Payout Value of Unearned Shares, Units or Other Rights that Have Not Vested ($) | ||||||||||||||||||||||
| | Option Awards(1) | | | Equity Incentive Plan Awards: Number of Unearned Shares, Units or Other Rights that Have Not Vested (#) | Option Awards(1) | | | Equity Incentive Plan Awards: Number of Unearned Shares, Units or Other Rights that Have Not Vested (#) | ||||||||||||||||||||||||||||||||
| Name and Principal Position | Number of Securities Underlying Unexercised Options Exercisable (#) | Number of Securities Underlying Unexercised Options Unexercisable (#) | Equity Incentive Plan Awards: Number of Securities Underlying Unexercised Unearned Options (#) | Option Exercise Price ($) | Option Expiration Date | Number of Shares or Units that Have Not Vested (#) | Market Value Shares or Units that Have Not Vested ($) | Number of Securities Underlying Unexercised Options Exercisable (#) | Number of Securities Underlying Unexercised Options Unexercisable (#) | Equity Incentive Plan Awards: Number of Securities Underlying Unexercised Unearned Options (#) | Option Exercise Price ($) | Option Expiration Date | Number of Shares or Units that Have Not Vested (#) | Market Value Shares or Units that Have Not Vested ($) | ||||||||||||||||||||||||||
| John M. Dionisio President and Chief Executive Officer | 10,000 25,000 30,000 15,000 25,000 20,000 50,000 50,000 | 0 0 0 0 0 0 0 0 | 0 0 0 0 0 0 0 0 | $ $ $ $ $ $ $ $ | 8.30 9.98 10.91 13.68 15.68 16.72 19.51 20.78 | 08/22/2007 08/20/2008 08/19/2009 11/14/2007 11/21/2009 11/15/2008 11/20/2010 12/02/2011 | 0 | $ | 0 | PEP 05 - 20,829 PEP 06 - 96,238 | PEP 05 - $ 591,542 PEP 06 - $2,733,151 | 20,000 50,000 60,000 30,000 50,000 40,000 100,000 100,000 | 0 0 0 0 0 0 0 0 | 0 0 0 0 0 0 0 0 | $ $ $ $ $ $ $ $ | 4.15 4.99 5.455 6.84 7.84 8.36 9.755 10.39 | 08/22/2007 08/20/2008 08/19/2009 11/14/2007 11/21/2009 11/15/2008 11/20/2010 12/02/2011 | 0 | $ | 0 | PEP 05 - 41,658 PEP 06 - 192,476 | PEP 05 - $ 591,542 PEP 06 - $2,733,151 | ||||||||||||||||||
Richard G. Newman Chairman | 35,000 50,000 60,000 50,000 150,000 50,000 180,000 75,000 | 0 0 0 0 0 0 0 0 | 0 0 0 0 0 0 0 0 | $ $ $ $ $ $ $ $ | 8.30 9.98 10.91 13.68 15.68 16.72 19.51 20.78 | 08/22/2007 08/20/2008 08/19/2009 11/14/2007 11/21/2009 11/15/2008 11/20/2010 12/02/2011 | 0 | $ | 0 | PEP 05 - 31,243 PEP 06 - 57,045 | PEP 05 - $ 887,313 PEP 06 - $1,620,085 | 70,000 100,000 120,000 100,000 300,000 100,000 360,000 150,000 | 0 0 0 0 0 0 0 0 | 0 0 0 0 0 0 0 0 | $ $ $ $ $ $ $ $ | 4.15 4.99 5.455 6.84 7.84 8.36 9.755 10.39 | 08/22/2007 08/20/2008 08/19/2009 11/14/2007 11/21/2009 11/15/2008 11/20/2010 12/02/2011 | 0 | $ | 0 | PEP 05 - 62,486 PEP 06 - 114,090 | PEP 05 - $ 887,313 PEP 06 - $1,620,085 | ||||||||||||||||||
James R. Royer Executive Vice President and Chief Operating Officer | 10,000 15,000 15,000 10,000 20,000 20,000 25,000 | 0 0 0 0 0 0 0 | 0 0 0 0 0 0 0 | $ $ $ $ $ $ $ | 8.30 9.98 10.91 13.68 15.68 16.72 19.51 | 08/22/2007 08/20/2008 08/19/2009 11/14/2007 11/21/2009 11/15/2008 11/20/2010 | 0 | $ | 0 | PEP 05 - 7,290 PEP 06 - 13,947 | PEP 05 - $ 207,040 PEP 06 - $ 396,109 | 20,000 30,000 30,000 20,000 40,000 40,000 50,000 | 0 0 0 0 0 0 0 | 0 0 0 0 0 0 0 | $ $ $ $ $ $ $ | 4.15 4.99 5.455 6.84 7.84 8.36 9.755 | 08/22/2007 08/20/2008 08/19/2009 11/14/2007 11/21/2009 11/15/2008 11/20/2010 | 0 | $ | 0 | PEP 05 - 14,580 PEP 06 - 27,894 | PEP 05 - $ 207,040 PEP 06 - $ 396,109 | ||||||||||||||||||
Michael S. Burke Executive Vice President and Chief Corporate Officer | 10,000 | 0 | 0 | $ | 24.81 | 10/03/2012 | 0 | $ | 0 | PEP 05 - 5,624 PEP 06 - 9,415 | PEP 05 - $ 159,731 PEP 06 - $ 267,373 | 20,000 | 0 | 0 | $ | 12.405 | 10/03/2012 | 0 | $ | 0 | PEP 05 - 11,248 PEP 06 - 18,830 | PEP 05 - $ 159,731 PEP 06 - $ 267,373 | ||||||||||||||||||
Francis S. Y. Bong Chairman Asia | 25,000 25,000 25,000 25,000 | 0 0 0 0 | 0 0 0 0 | $ $ $ $ | 13.68 15.68 16.72 19.51 | 11/14/2007 11/21/2009 11/15/2008 11/20/2010 | 0 | $ | 0 | PEP 05 - 7,290 PEP 06 - 10,461 | PEP 05 - $ 207,040 PEP 06 - $ 297,082 | 50,000 50,000 50,000 50,000 | 0 0 0 0 | 0 0 0 0 | $ $ $ $ | 6.84 7.84 8.36 9.755 | 11/14/2007 11/21/2009 11/15/2008 11/20/2010 | 0 | $ | 0 | PEP 05 - 14,580 PEP 06 - 20,922 | PEP 05 - $ 207,040 PEP 06 - $ 297,082 | ||||||||||||||||||
Glenn R. Robson Senior Vice President and Chief Financial Officer | 50,000 20,000 | 0 0 | 0 0 | $ $ | 17.58 19.51 | 08/22/2009 11/20/2010 | 0 | $ | 0 | PEP 05 - 5,207 PEP 06 - 9,415 | PEP 05 - $ 147,886 PEP 06 - $ 267,373 | 100,000 40,000 | 0 0 | 0 0 | $ $ | 8.79 9.755 | 08/22/2009 11/20/2010 | 0 | $ | 0 | PEP 05 - 10,414 PEP 06 - 18,830 | PEP 05 - $ 147,886 PEP 06 - $ 267,373 | ||||||||||||||||||
The values in the Equity Incentive Plan Awards: Number of Unearned Shares, Units or Other Rights that Have Not Vested (#) column represent the remaining portion of the original 2005 PEP and 2006 PEP grants that were not earned in FY 2006.
The values in the Equity Incentive Plan Awards: Market or Payout Value of Unearned Shares, Units or Other Rights that Have Not Vested ($) column represent the remaining portion of the original 2005 PEP and 2006 PEP grants that were not earned in FY 2006 multiplied by the September 29, 2006 common stock price of $28.40.$14.20.
The FY 05 PEP and FY 06 PEP awards become vested based upon the time and performance-based vesting criteria described under the heading "Performance Earnings Program" in the "Compensation Discussion & Analysis" above.
Options Exercises and Stock Vested for Fiscal Year 2006
| | Option Awards | Stock Awards(1) | Option Awards | Stock Awards(1) | ||||||||||||||
|---|---|---|---|---|---|---|---|---|---|---|---|---|---|---|---|---|---|---|
| Name and Principal Position | Number of Shares Acquired on Exercise (#) | Value Realized on Exercise ($) | Number of Shares Acquired on Vesting ($) | Value Realized on Vesting ($) | Number of Shares Acquired on Exercise (#) | Value Realized on Exercise ($) | Number of Shares Acquired on Vesting ($) | Value Realized on Vesting ($) | ||||||||||
| John M. Dionisio President and Chief Executive Officer | 15,000 | $ | 253,800 | PEP 05 - 14,586 PEP 06 - 20,881 | PEP 05 - $414,229 PEP 06 - $593,024 | 30,000 | $ | 253,800 | PEP 05 - 29,172 PEP 06 - 41,762 | PEP 05 - $414,229 PEP 06 - $593,024 | ||||||||
Richard G. Newman Chairman | 50,000 | $ | 846,000 | PEP 05 - 21,878 PEP 06 - 12,377 | PEP 05 - $621,343 PEP 06 - $351,517 | 100,000 | $ | 846,000 | PEP 05 - 43,756 PEP 06 - 24,754 | PEP 05 - $621,343 PEP 06 - $351,517 | ||||||||
James R. Royer Executive Vice President and Chief Operating Officer | 40,000 10,000 | $ $ | 712,000 169,200 | PEP 05 - 5,105 PEP 06 - 3,026 | PEP 05 - $144,980 PEP 06 - $ 85,946 | 80,000 20,000 | $ $ | 712,000 169,200 | PEP 05 - 10,210 PEP 06 - 6,052 | PEP 05 - $144,980 PEP 06 - $ 85,946 | ||||||||
Michael S. Burke Executive Vice President and Chief Corporate Officer | 0 | $ | 0 | PEP 05 - 2,188 PEP 06 - 2,043 | PEP 05 - $ 62,134 PEP 06 - $ 58,013 | 0 | $ | 0 | PEP 05 - 4,376 PEP 06 - 4,086 | PEP 05 - $ 62,134 PEP 06 - $ 58,013 | ||||||||
Francis S. Y. Bong Chairman Asia | 0 | $ | 0 | PEP 05 - 5,105 PEP 06 - 2,270 | PEP 05 - $144,980 PEP 06 - $ 64,459 | 0 | $ | 0 | PEP 05 - 10,210 PEP 06 - 4,540 | PEP 05 - $144,980 PEP 06 - $ 64,459 | ||||||||
Glenn R. Robson Senior Vice President and Chief Financial Officer | 0 | $ | 0 | PEP 05 - 3,646 PEP 06 - 2,043 | PEP 05 - $103,557 PEP 06 - $ 58,013 | 0 | $ | 0 | PEP 05 - 7,292 PEP 06 - 4,086 | PEP 05 - $103,557 PEP 06 - $ 58,013 | ||||||||
The values in the Number of Shares Acquired on Vesting ($) column represent the restricted stock units earned from the final calculations of the 2005 PEP grants and 2006 PEP grants at the end of FY 2006. These restricted stock units were fully vested as of September 29, 2006.
The values in the Value Realized on Vesting ($) column represent value of the restricted stock units earned from the final calculations of the FY 2005 PEP grants and FY 2006 PEP grants at the end of FY 2006 multiplied by the September 29, 2006 common stock price of $28.40.$14.20.
Pension Benefits for Fiscal Year 2006
| Name and Principal Position | Plan Name | Number of Years Credited Service (#) | Present Value of Accumulated Benefits ($)(1) | Payments During Last Fiscal Year ($) | |||||
|---|---|---|---|---|---|---|---|---|---|
John M. Dionisio President and Chief Executive Officer | AECOM Technology Corporation Pension Plan(2) | 19.5000 | $ | 133,718 | 0 | ||||
AECOM Technology Corporation Management Supplemental Executive Retirement Plan(3) | 19.5000 | $ | 104,286 | 0 | |||||
1992 AECOM Technology Corporation Supplemental Executive Retirement Plan(4) | 19.5000 | $ | 1,664,293 | 0 | |||||
Richard G. Newman Chairman | AECOM Technology Corporation Pension Plan | 29.2500 | $ | 969,552 | 0 | ||||
AECOM Technology Corporation Management Supplemental Executive Retirement Plan | 29.2500 | $ | 149,344 | 0 | |||||
James R. Royer Executive Vice President and Chief Operating Officer | AECOM Technology Corporation Pension Plan | 10.4167 | $ | 29,412 | 0 | ||||
AECOM Technology Corporation Management Supplemental Executive Retirement Plan | 10.4167 | $ | 91,159 | 0 | |||||
1996 AECOM Technology Corporation Supplemental Executive Retirement Plan(5) | 10.4167 | $ | 781,129 | 0 | |||||
Michael S. Burke Executive Vice President and Chief Corporate Officer | 0 | 0 | 0 | ||||||
Francis S. Y. Bong Chairman Asia | 0 | 0 | 0 | ||||||
Glenn R. Robson Senior Vice President and Chief Financial Officer | 0 | 0 | 0 | ||||||
Messrs. Robson, Burke and Bong are not eligible for any of the AECOM Pension Plans.
Early retirement age is the first day of any month after age 55, provided the participant has earned five years of service. Compensation is the participant's salary, plus sick pay, overtime pay, shift premiums, contract completion bonuses, incentive compensation bonuses, severance pay paid within 30 days of termination of employment, vacation pay, pre-tax contributions made on the participant's behalf to a Internal Revenue Code Section 125 cafeteria plan and pre-tax contributions to the Retirement and Savings Plan under Internal Revenue Code Section 401(k).
Nonqualified Deferred Compensation for Fiscal Year 2006
| Name and Principal Position | Executive Contributions in Last FY ($)(1) | Registrant Contributions in Last FY ($)(2) | Aggregate Earnings in Last FY ($)(3) | Aggregate Withdrawals/ Distributions ($)(4) | Aggregate Balance at Last FYE ($)(5) | ||||||||||
|---|---|---|---|---|---|---|---|---|---|---|---|---|---|---|---|
| John M. Dionisio President and Chief Executive Officer | $ | 285,080 | $ | 51,494 | $ | 452,908 | $ | (706 | ) | $ | 3,653,055 | ||||
Richard G. Newman Chairman | $ | 303,756 | $ | 52,156 | $ | 1,830,737 | $ | (701 | ) | $ | 14,535,060 | ||||
James R. Royer Executive Vice President and Chief Operating Officer | $ | 70,294 | $ | 12,833 | $ | 582,940 | $ | (217 | ) | $ | 4,619,241 | ||||
Michael S. Burke Executive Vice President and Chief Corporate Officer | $ | 0 | $ | 296,749 | (6) | $ | 15,477 | $ | 0 | $ | 311,666 | ||||
Francis S. Y. Bong(7) Chairman Asia | $ | 0 | $ | 0 | $ | 0 | $ | 0 | $ | 0 | |||||
Glenn R. Robson Senior Vice President and Chief Financial Officer | $ | 30,504 | $ | 5,491 | $ | 98,541 | $ | (229 | ) | $ | 779,995 | ||||
Directors Compensation for Fiscal Year 2006
| Name and Principal Position | Fees Earned or Paid in Cash ($)(1) | Stock Awards ($) | Option Awards ($)(2) | Non-Equity Incentive Plan Compensation ($) | Change in Pension Value & Non-Qualified Deferred Compensation Earnings | All Other Compensation ($)(3) | Total ($) | ||||||||||||||
|---|---|---|---|---|---|---|---|---|---|---|---|---|---|---|---|---|---|---|---|---|---|
| H. Frederick Christie(4) | $ | 66,000 | $ | 0 | $ | 48,600 | $ | 0 | $ | 0 | $ | 13,503 | $ | 128,103 | |||||||
| John W. Downer(7) | $ | 44,500 | $ | 0 | $ | 48,600 | $ | 0 | $ | 0 | $ | 13,335 | $ | 106,435 | |||||||
| James H. Fordyce(5) | $ | 0 | $ | 0 | $ | 0 | $ | 0 | $ | 0 | $ | 5,000 | $ | 5,000 | |||||||
| S. Malcolm Gillis(8) | $ | 55,000 | $ | 0 | $ | 48,600 | $ | 0 | $ | 0 | $ | 12,809 | $ | 116,409 | |||||||
| Linda Griego | $ | 55,000 | $ | 0 | $ | 48,600 | $ | 0 | $ | 0 | $ | 12,862 | $ | 116,462 | |||||||
| Robert J. Lowe(9) | $ | 58,500 | $ | 0 | $ | 48,600 | $ | 0 | $ | 0 | $ | 9,741 | $ | 116,841 | |||||||
| William G. Ouchi | $ | 55,500 | $ | 0 | $ | 48,600 | $ | 0 | $ | 0 | $ | 5,802 | $ | 109,902 | |||||||
| William P. Rutledge | $ | 64,500 | $ | 0 | $ | 48,600 | $ | 0 | $ | 0 | $ | 9,024 | $ | 122,124 | |||||||
| Lee D. Stern(6) | $ | 0 | $ | 0 | $ | 0 | $ | 0 | $ | 0 | $ | 0 | $ | 0 | |||||||
Messrs. Dionisio, Newman and Bong are employee directors and do not receive separate compensation (i.e. annual retainer fees, board and committee meeting fees) for participating as Board members.
The non-employee directors have the following aggregate number of stock option awards outstanding as of September 29, 2006: Christie—26,10052,200 exercisable stock options, Downer—37,00074,000 exercisable stock options, Gillis—18,60037,200 exercisable stock options, Griego—10,00020,000 exercisable stock options, Lowe—26,10052,200 exercisable stock options, Ouchi—18,00036,000 exercisable stock options and Rutledge—23,10046,200 exercisable stock options.
2006 Stock Incentive Plan
We established our AECOM Technology Corporation 2006 Stock Incentive Plan effective October 1, 2006 in order to promote the success of AECOM by providing additional long-term incentives for high levels of performance and for significant efforts to improve the financial performance of AECOM. Persons eligible to receive awards under the 2006 Stock Incentive Plan include key employees and officers of AECOM and its subsidiaries and to members of our Board of Directors who are not our employees. The 2006 Stock Incentive Plan replaced our previously existing equity compensation plans, the AECOM Technology Corporation 2000 Stock Incentive Plan and the Amended and Restated AECOM Technology Corporation Stock Incentive Plan for Non-Employee
Directors. No additional awards will be granted under either the AECOM Technology Corporation 2000 Stock Incentive Plan or the Amended and Restated AECOM Technology Corporation Stock Incentive Plan for Non-Employee Directors, however, the shares that remained available for issuance under those plans at the time the 2006 Stock Incentive Plan was adopted were absorbed by and are available for issuance under the 2006 Stock Incentive Plan.
The 2006 Stock Incentive Plan authorizes stock options, stock appreciation rights (SARs), restricted stock, restricted stock units, incentive bonuses and performance-based awards. We believe the various forms of awards that may be granted under the 2006 Stock Incentive Plan give us the flexibility to offer competitive incentives and to tailor benefits to specific needs and circumstances. Generally, an option or stock appreciation right will expire, or other award will vest, not more than ten years after the date of grant.
The 2006 Stock Incentive Plan can be administered by our Board of Directors or by one or more committees appointed by our Board of Directors. Currently the Compensation and Organization Committee of our Board of Directors administers the 2006 Stock Incentive Plan.
The current aggregate share limit under the 2006 Stock Incentive Plan is 10,750,00021,500,000 shares and the maximum number of shares subject to awards which may be granted to any individual during any calendar year is 2,000,000.4,000,000. At DecemberMarch 31, 2006,2007, there were 6,078,6036,240,084 shares available for issuance under this Plan. At DecemberMarch 31, 2006,2007, there were 232,510527,620 options outstanding under the 2006 Stock Incentive Plan with a weighted average exercise price of $28.40$14.35 per share. The maximum number of shares available for issuance under the 2006 Stock Incentive Plan will automatically increase on October 1, 2007 and on the first day of each fiscal year thereafter for nine more years, by the least of: (i) 5% of the our fully diluted shares outstanding as of the last day of the preceding fiscal year; (ii) 3,000,0006,000,000 shares, or (iii) a number determined by the Board of Directors or the plan's administrator.
Stock options and SARs granted under the 2006 Stock Incentive Plan have an exercise price equal to the fair market value of a share of our common stock on the later of the date of approval of the award by the Compensation and Organization Committee and the identification of the individual grantee, but in no event shall the exercise price be less than the fair market value of a share on the date of grant. An option may either be an Incentive Stock Option or a Nonqualified Stock Option. Incentive Stock Options are also subject to more restrictive terms and are limited in amount by the Internal Revenue Code and the Plan. Full payment for shares purchased on the exercise of an option must be made at the time of such exercise in a manner approved by the Committee.
Upon a participant's retirement after age 65, retirement at age 55 with approval from Compensation and Organization Committee, death or total disability, or upon the occurrence of other events specified in the 2006 Stock Incentive Plan and summarized below, the Compensation and Organization Committee may provide that each option and SAR will become immediately vested and exercisable, each award of restricted stock will immediately vest free of restrictions and each performance share award will become payable to the holder of the award.
Our Compensation and Organization Committee may amend or terminate the 2006 Stock Incentive Plan at any time. In addition, the Compensation and Organization Committee may generally amend or modify the 2006 Stock Incentive Plan from time to time. Stockholder approval for an amendment will generally not be obtained unless required by applicable law or deemed necessary or advisable by our Board of Directors. Unless previously terminated by our Compensation and Organization Committee, the Plan will terminate on September 30, 2016. Outstanding awards may be amended, however, only with the consent of the holder if the amendment alters or impairs the rights of the holder.
Upon our dissolution or liquidation, or if we are not the surviving entity as a result of a reorganization, merger or other consolidation with or into another corporation, the 2006 Stock Incentive Plan and all outstanding awards will terminate unless the successor corporation has provided for the assumption or substitution of the outstanding awards.
Stock Incentive Plan and 2000 Stock Incentive Plan
In February 2000, we adopted the 2000 Stock Incentive Plan that replaced our Stock Incentive Plan first adopted in 1990. The 2000 Stock Incentive Plan authorizes the issuance of stock options, stock appreciation rights (SARs), restricted stock and performance share awards to officers and key employees of AECOM and our subsidiaries and certain consultants and advisors to AECOM or any of our subsidiaries. The maximum number of shares authorized for issuance under the 2000 Stock Incentive Plan is 7,000,000.14,000,000. The remaining shares available for issuance under this plan as of October 1, 2006 were assumed into the 2006 Stock Incentive Plan.
Stock options granted under the 2000 Stock Incentive Plan have an exercise price equal to the fair market value of a share of our common stock on the later of the date of approval of the award by the Compensation and Organization Committee and the identification of the individual grantee, but in no event is the exercise price be less than the fair market value of a share on the date of grant. Generally, an option granted under the 2000 Stock Incentive Plan will expire not more than ten years after the date of grant.
At DecemberMarch 31, 2006,2007, there were 854,8501,592,100 options outstanding under the Stock Incentive Plan with a weighted average exercise price of $10.02$5.04 per share and 3,436,7126,697,792 options outstanding under the 2000 Stock Incentive Plan with a weighted average exercise price of $18.38$9.18 per share.
Stock Incentive Plan for Non-Employee Directors
On July 9, 2002, we adopted an amended and restated Stock Incentive Plan for Non-Employee Directors. The Stock Incentive Plan for Non-Employee Directors authorizes the issuance of options to purchase up to 250,000500,000 shares of our common stock to directors who are not our employees or who do not own more than 5% of our outstanding voting securities. This plan terminated on May 25, 2005, although options granted prior to that date will remain exercisable until their respective expiration dates.
At DecemberMarch 31, 2006,2007, there were 112,525182,100 options outstanding under the Stock Incentive Plan for Non-Employee Directors with a weighted average exercise price of $17.79$9.67 per share.
2006 Stock Incentive Plan for Non-Employee Directors
The 2006 Stock Incentive Plan for Non-Employee Directors (the "Directors Plan") authorizes the issuance of options to purchase up to 250,000500,000 shares of our common stock to directors who are not our employees or who do not own more than 5% of our outstanding voting securities.
The Directors Plan is administered by our Board of Directors or by one or more committees appointed by our Board of Directors. Currently the Compensation and Organization Committee of our Board of Directors administers the Directors Plan.
Under this plan, new directors will be granted options to purchase 5,00010,000 shares of our common stock with an exercise price equal to the fair market value of our common stock on the date of grant. On the first business day following our annual meeting of stockholders, each director will be granted options to purchase 5,00010,000 shares of our common stock with an exercise price that is equal to the fair market value of our common stock on the date of grant.
Options vest six months after date of grant. Revaluing of options is disallowed under this plan. Shares subject to options that have expired will become available for grant again under the Directors Plan. During fiscal year 2006, stock options in respect of 35,00070,000 shares were granted to seven of our directors with a weighted average exercise price of $25.07$12.535 per share.
The remaining shares available for issuance under this plan as of October 1, 2006 were assumed into the 2006 Stock Incentive Plan.
Performance Earnings Program
We established a Performance Earnings Program, or PEP, in December 2004 to issue incentives (pursuant to either our 2000 Stock Incentive Plan and 2006 Stock Incentive Plan) to our officers and key employees in lieu of stock options. Participants can earn up to 100% of the granted credits over a three year performance period. The performance periods for the fiscal 2005 and fiscal 2006 grants are fiscal years 2005, 2006 and 2007 and 2006, 2007 and 2008, respectively. The PEP is described in more detail in the "Compensation Discussion and Analysis" section of this prospectus.
Employee Investment Plans
Most full and part-time AECOM employees may purchase AECOM common stock through plans developed to comply with local laws and regulations. The largest such stock investment plan is in the United States, which we refer to as our Retirement & Savings Plan, and, together with all our non-U.S. plans, comprise the AECOM Global Stock Program. The Global Stock Program enables our employees to purchase our common stock through payroll deductions each pay period and contributions from year-end bonuses. After holding AECOM common stock for five years, participants may diversify some or all of those holdings into cash or other investment funds under a diversification program. Employee stock plans are currently established in the United States, Hong Kong, United Kingdom, Australia, New Zealand, United Arab Emirates, Qatar, Canada and Singapore.
In the United States, the Retirement & Savings Plan is a tax-qualified 401(k) plan. During the year, highly compensated employees (generally speaking, employees who earned more than $95,000 in fiscal 2006) may be disqualified from fully participating in the Retirement & Savings Plan. Due to this restriction, we have established a non-qualified plan, the Non-Qualified Stock Purchase Plan, to enable those highly compensated employees to defer compensation that they might otherwise have contributed to the Retirement & Savings Plan. For a further description of the Non-Qualified Stock Purchase Plan, see "Stock Purchase Plan" in Note 13 to the Financial Statements.
UMA Group Ltd. Employee Stock Purchase Plan
In the third fiscal quarter of fiscal year 2006, we implemented an employee stock plan in Canada. This plan, the UMA Group Ltd Employee Stock Purchase Plan, or UMA ESPP, was adopted as a result of our acquisition of UMA Group in Canada. The UMA ESPP is administered by our Board of Directors and up to 7,000,00014,000,000 shares of our common stock may be granted under the plan to eligible employees in Canada. We provide a stock match in the form of common stock at a percentage (currently 18%) equal to the stock match percentage under our Global Stock Incentive Plan on all purchases made under this plan. The company stock match will have a three year vesting period, and prior service with UMA will count towards the three year vesting period. None of our current directors or executive officers or any other employees eligible to participate in any other AECOM stock purchase plan will be eligible to participate in the UMA ESPP.
2005 ENSR Stock Purchase Plan
In connection with our September 2005 acquisition of Tiger Acquisition Corp. and its subsidiaries including ENSR International Corp., AECOM agreed to establish the ENSR 2005 Stock Purchase Plan,
or ENSR SPP, a non-qualified plan. The ENSR SPP is administered by our Board of Directors or by
one or more committees appointed by our Board of Directors. Under the terms of the plan, our Board of Directors, or a committee appointed by our Board, will allow those employees of Tiger Acquisition Corp. and its subsidiaries who were shareholders at the time of acquisition to purchase shares of our common stock at the fair market value of our common stock for a period of six months after the adoption of the plan. Currently, we will also provide an 18% stock match on all purchases made under this plan by crediting such employee's account under one of AECOM's Employee Investment Plans described above for U.S. employees and issuing shares for such stock match directly to non-U.S. employees.
Cansult Maunsell Merger Investment Plan
In connection with our September 2006 acquisition of Cansult Limited, AECOM agreed to establish the Cansult Maunsell Merger Investment Plan or MIP, a non-qualified plan. The MIP is administered by our Board of Directors or by one or more committees appointed by our Board of Directors. Under the terms of the plan, our Board of Directors, or a committee appointed by our Board, will allow those employees of Cansult Limited who were stockholders at the time of acquisition to purchase shares of our AECOM Global Holdings, Ltd. common stock at the fair market value of our common stock for a period of six months after the adoption of the plan.
Equity Investment Plan
In anticipation of future acquisitions, AECOM has established the Equity Investment Plan or EIP, a non-qualified plan. The EIP is administered by our Board of Directors or by one or more committees appointed by our Board of Directors. Under the terms of the plan, our Board of Directors, or a committee appointed by our Board, will allow those employees who join AECOM via mergers and acquisitions that were shareholders at the time of acquisition to purchase shares of our common stock at the fair market value of our common stock for a period of one month after the closing of the transaction.
U.S. Pension and Related Plans
A number of our employees participate in pension plans maintained by us and our overseas subsidiaries. In the United States, certain employees participate in the AECOM Pension Plan, a defined benefit plan that was effective on October 1, 1989. Depending on the participant's years of service to AECOM, the pension benefits will range from 26% to 30.5% of the employee's final capped average monthly compensation plus an additional 11% to 12.5% of the employee's final capped average monthly compensation in excess of specified Social Security base amounts. As of April 1, 2004, employees' pensionable compensation was capped at the employee's highest compensation for one full calendar year from 1994 through 2003. The employee's final average compensation will continue to increase until the participant's average compensation reaches the compensation cap. Pension benefits will generally be reduced for participants with less than 25 years of service as required by plan rules. Employee contributions to the Pension Plan of up to 1.5% of compensation were required prior to April 1, 1998.
On April 1, 1998, we amended our Investment Plan (now part of the Retirement & Savings Plan) to add what we refer to as a 401(k) pension component. This 401(k) pension component generally replaced the AECOM Pension Plan. New employees are not permitted to participate in the AECOM Pension Plan and, as described below, benefits under the 401(k) pension component reduce the AECOM Pension Plan benefits for existing AECOM Pension Plan participants. Employees are allowed to make pre-tax or after-tax contributions of 0.5%, 1.0% or 1.5% of their compensation to this 401(k) pension component. We will match dollar for dollar any such contributions and our matching contributions will vest after three years of service (as defined in the Retirement & Savings Plan).
We also amended the AECOM Pension Plan, effective July 1, 1998, to provide that those highly compensated employees who receive bonuses under our incentive compensation program cease earning benefits under the AECOM Pension Plan and instead earn identical benefits under a non-qualified plan, the Management Supplemental Executive Retirement Plan, or MSERP. The MSERP provides a benefit identical in nature to the AECOM Pension Plan but on an unfunded basis.
The terms of our Pension Plan, MSERP, and related plans are more fully described in the "Compensation Discussion and Analysis" section of this prospectus.
Non-U.S. Pension Plans
Our employees outside the United States participate in a variety of public and private retirement and pension plans, both mandatory and voluntary, which provide various benefit levels.
In Australia, many of our senior staff participate in the AECOM Australia Superannuation Fund which was established July 1, 1965. This plan provides a lump sum defined benefit (at the rate of either 18.5% or 16.5% of the employee's final average annual compensation per year of service, capped at 7.0 times and 6.6 times the employee's average annual compensation, respectively) to a small closed group of employees and lump sum defined contribution benefits to the remainder. In the report on the most recent actuarial valuation at July 1, 2004, the actuary stated that the plan was in a sound financial position.
In Hong Kong, most of our employees participate in a Defined Contribution Scheme established in December 2000 with employee contributions ranging from 3% to 6.5% of salary plus an employer match of 150% of the first 1% to 4% of employee contributions or for designated participants up to 23.5% of salary.
We maintain three principal defined benefit pension schemes in the United Kingdom: the Maunsell Ltd. Pension Scheme, the Oscar Faber Pension Fund and the Bullen Pension Plan. The schemes were closed to new participants in 2001, 1999 and 2002, respectively. The Maunsell Ltd. Pension Scheme was closed to future accruals in January 2007. In all schemes, increases in the pensionable salary are restricted to the annual increase in inflation, capped at 5% per annum, thus severing the link with final salary. The three year average of the pensionable salary, or Final Pensionable Salary, at retirement is utilized to calculate the annual pension. Participants generally accrue1/60 of Final Pensionable Salary for each year of pensionable service with an option to choose up to 25% of this benefit as a tax-free cash sum at retirement. All benefits payable are subject to overriding U.K. legislation and are currently restricted to a maximum of 40 years pensionable service (or less for certain participants eligible for higher accrual rates) for the calculation of the pension at retirement.
CERTAIN RELATIONSHIPS AND RELATED TRANSACTIONS
Related Party Transaction Policy
We have adopted a written related party transaction policy, which covers transactions between us and our directors, executive officers, 5% or greater stockholders and parties related to the foregoing, such as immediate family members and entities they control. The policy requires that any such transaction be considered and approved by our Audit Committee prior to entry into such transaction. In reviewing such transactions, the policy requires the Audit Committee to consider all of the relevant facts and circumstances available to the Audit Committee, including (if applicable) but not limited to the benefits to the Company, the availability of other sources for comparable products or services the terms of the transaction and the terms available to unrelated third parties or to employees generally.
Under the policy, if we should discover related party transactions that have not been approved, the Audit Committee will be notified and will determine the appropriate action, including ratification, rescission or amendment of the transaction.
Certain Relationships and Related Transactions
Mr. Ronald Yamiolkoski is employed by our subsidiary DMJM+Harris as an Associate Vice President and he is the brother-in-law of Mr. Richard Newman, our Chairman. Mr. Yamiolkoski has no reporting responsibility to Mr. Newman and in our fiscal years ended September 30, 2004, 2005 and 2006, Mr. Yamiolkoski received compensation from DMJM+Harris of approximately $129,000, $155,000 and $157,000, respectively. The employment of Mr. Yamiolkoski was entered into more than 25 years ago, prior to the adoption of our related party transaction policy and has since been ratified by the Audit Committee.
Two of our subsidiaries have performed design and other services in the ordinary course of business for Lowe Enterprises, which is affiliated with Robert Lowe, one of our directors. Our subsidiaries received fee payments from Lowe Enterprises in our fiscal years ended September 30, 2005 and 2006 in the amounts of approximately $470,000 and $800,000, respectively. In addition, one of our subsidiaries jointly pursued a project with an affiliate of Lowe Enterprises where our subsidiary received payments for design and other services from the project client (which was not affiliated with Lowe Enterprises) in our fiscal years ended 2004, 2005 and 2006 in the amounts of approximately $260,000, $1,700,000 and $610,000, respectively. The transactions with Lowe Enterprises have been ratified by our Audit Committee.
Entities affiliated with GSO Capital Partners and J.H. Whitney Capital Partners, LLC were the primary investors in our February 2006 sale of approximately $235 million of our Class F and Class G convertible preferred stock. Our board members Lee D. Stern and James H. Fordyce are affiliated with GSO Capital and J.H. Whitney, respectively, and have been designated by such investors pursuant to their respective rights under our Restated Certificate of Incorporation and an investor rights agreement as Class F and Class G convertible preferred stockholders to appoint representatives to our board of directors.
We previously established a Senior Executive Equity Investment Plan, under which we encouraged our senior officers to hold AECOM stock by providing loans to fund the purchases of the stock. As of February 20, 2007, all SEEIP loans have been terminated and repaid. At September 30, 2006, there were SEEIP loans outstanding with in aggregate principal amount of approximately $29.7 million.
PRINCIPAL AND SELLING STOCKHOLDERS
The following table sets forth information regarding the beneficial ownership of our common stock as of DecemberMarch 31, 20062007 with respect to:
Unless otherwise indicated below, the address of each beneficial owner listed in the table is c/o AECOM Technology Corporation, 555 S. Flower Street, Suite 3700, Los Angeles, California 90071.
Except as otherwise indicated in the footnotes to the table, each stockholder haswe believe, based on the information provided to us, that the persons and entities named in the table below have sole voting and investment power with respect to the shares they beneficially owned by such stockholder.own, subject to applicable community property laws.
| | Number of Shares of Common Stock(1) Beneficially Owned Prior to the Offering | | | | ||||||
|---|---|---|---|---|---|---|---|---|---|---|
| | | Number of Shares Beneficially Owned After the Offering | ||||||||
| | Number of Shares Offered | |||||||||
| | Number | Percentage | Number | Percentage | ||||||
| 5% Securityholders | ||||||||||
| United States Trust Company, N.A.(2) 555 S. Flower Street Suite 3700 Los Angeles, CA 90071 | 11,157,472 | 29.86 | % | |||||||
| Halifax EES Trustees International Limited(3) P.O. Box 827, Queensway House, Hilgrove Street St. Helier, Jersey JE4 OUB | 3,521,637 | 9.43 | % | |||||||
| CalPERS/PCG Corporate Partners LLC(4) 1200 Prospect, Ste 200 La Jolla, CA 92037 | 1,396,091 | 3.74 | % | |||||||
| GSO Capital Partners LP(5) 280 Park Avenue 11th Floor East Tower New York, NY 10017 | 3,988,831 | 10.68 | % | |||||||
| J.H Whitney VI, L.P.(6) 130 Main Street New Canaan, CT 06901 | 3,988,831 | 10.68 | % | |||||||
Directors and Named Executive Officers | ||||||||||
| John M. Dionisio(7) | 586,298 | 1.56 | % | |||||||
| Richard G. Newman(8) | 1,815,261 | 4.78 | % | |||||||
| Francis S.Y. Bong(9) | 783,674 | 2.09 | % | |||||||
| H. Frederick Christie(10) | 56,603 | 0.15 | % | |||||||
| James H. Fordyce(11) | 0 | 0.00 | % | |||||||
| S. Malcolm Gillis(12) | 36,905 | 0.10 | % | |||||||
| Linda Griego(13) | 13,659 | 0.04 | % | |||||||
| Robert J. Lowe(14) | 56,762 | 0.16 | % | |||||||
| William G. Ouchi(15) | 47,500 | 0.13 | % | |||||||
| William P. Rutledge(16) | 52,635 | 0.14 | % | |||||||
| Lee D. Stern | 0 | 0.00 | % | |||||||
| James R. Royer(17) | 501,070 | 1.34 | % | |||||||
| Michael S. Burke(18) | 75,729 | 0.20 | % | |||||||
| Glenn R. Robson(19) | 123,656 | 0.33 | % | |||||||
| All directors and executive officers as a group (16 persons) | 5,246,192 | 13.46 | % | |||||||
Selling Stockholders | ||||||||||
| | Number of Shares of Common Stock(1) Beneficially Owned Prior to the Offering | | | | |||||||
|---|---|---|---|---|---|---|---|---|---|---|---|
| | | Number of Shares Beneficially Owned After the Offering | |||||||||
| | Number of Shares Offered | ||||||||||
| | Number | Percentage | Number | Percentage | |||||||
| 5% Securityholders | |||||||||||
| United States Trust Company, N.A.(2) 555 S. Flower Street 3700 Los Angeles, CA 90071 | 22,743,241 | 30.07 | % | 4,890,924 | 17,852,316 | 19.51 | % | ||||
| Halifax EES Trustees International Limited(3) P.O. Box 827, Queensway House, Hilgrove Street St. Helier, Jersey JE4 OUB | 7,237,714 | 9.57 | % | 723,463 | 6,514,251 | 7.12 | % | ||||
| GSO Capital Partners LP(4) 280 Park Avenue 11th Floor East Tower New York, NY 10017 | 7,977,663 | 10.55 | % | 0 | 7,977,663 | 8.72 | % | ||||
| J.H. Whitney VI, L.P.(5) 130 Main Street New Canaan, CT 06901 | 7,977,663 | 10.55 | % | 7,339,450 | 638,213 | * | |||||
Directors and Named Executive Officers | |||||||||||
| John M. Dionisio(6) | 1,172,718 | 1.54 | % | — | 1,172,718 | 1.28 | % | ||||
| Richard G. Newman(7) | 3,677,410 | 4.78 | % | 163,108 | 3,514,302 | 3.79 | % | ||||
| Francis S.Y. Bong(8) | 1,590,281 | 2.10 | % | — | 1,590,281 | 1.73 | % | ||||
| H. Frederick Christie(9) | 114,947 | * | — | 114,947 | * | ||||||
| James H. Fordyce(10) | 0 | 0.00 | % | — | 0 | 0.0 | % | ||||
| S. Malcolm Gillis(11) | 74,908 | * | — | 74,908 | * | ||||||
| Linda Griego(12) | 28,776 | * | — | 28,776 | * | ||||||
| Robert J. Lowe(13) | 120,318 | * | — | 120,318 | * | ||||||
| William G. Ouchi(14) | 95,000 | * | — | 95,000 | * | ||||||
| William P. Rutledge(15) | 107,187 | * | — | 107,187 | * | ||||||
| Lee D. Stern | 0 | 0.00 | % | — | 0 | 0.00 | % | ||||
| James R. Royer(16) | 962,817 | 1.27 | % | — | 962,817 | 1.05 | % | ||||
| Michael S. Burke(17) | 198,309 | * | — | 198,309 | * | ||||||
| Glenn R. Robson(18) | 254,516 | * | — | 254,516 | * | ||||||
| All directors and executive officers as a group (15 persons) | 9,926,541 | 12.63 | % | 163,108 | 9,763,433 | 10.34 | % | ||||
Selling Stockholders(19) | 10,128,314 | 13.39 | % | 2,307,366 | 5,927,186 | 6.48 | % | ||||
Our convertible preferred stock may be converted into our common stock based on a liquidation preference of $100 per share and a conversion price of $30.81$15.405 per share, the common stock price as of December 31, 2006.
Our Class F and Class G convertible preferred stock may be converted into our common stock based on a liquidation preference of $2,500 per share and a conversion price of $25.07 per share, subject to certain anti-dilution adjustments.
Our certificate of incorporation authorizes us to issue 150,000,000 shares of Common Stock and 8,000,000 shares of preferred stock, or Preferred Stock. Our Board of Directors, without further approval of the stockholders, may establish the powers, preferences, rights, qualifications and limitations, including the dividend rights, dividend rates, conversion rights, conversion prices, voting rights and redemption rights, of any series of Preferred Stock and may authorize the issuance of any such series.
Common Stock
As of DecemberMarch 31, 2006,2007, we had 150,000,000 authorized shares of common stock, of which 21,858,97856,517,155 shares were outstanding.outstanding, including our common stock units. Holders of our common stock are entitled to one vote per share on all matters to be voted on by our stockholders. All shares of common stock have equal voting rights.
Subject to the rights pertaining to any series of preferred stock, in the event of our liquidation, holders of our common stock are entitled to share ratably in our assets legally available for distribution after the payment of our debts. The shares of common stock have no preemptive, subscription, conversion or redemption rights.
Subject to the rights of the holders of preferred stock, the holders of the common stock are entitled to receive dividends, when, as and if declared by our Board of Directors, from funds legally available for such dividend payments.
Convertible Preferred Stock
The following is a summary of the material terms of the Convertible Preferred Stock.
General. There are 2,500,000 authorized shares of our Convertible Preferred Stock, with a par value and liquidation preference of $100 per share, of which 55,93857,279 shares of our Convertible Preferred Stock were outstanding as of DecemberMarch 31, 2006.2007. Such shares convert into common stock at a ratio of $100 divided by the current common stock price per share.
Dividends. Holders of the Convertible Preferred Stock are entitled to receive dividends payable in additional shares of Convertible Preferred Stock quarterly at a rate determined by an independent appraiser. This rate is established at a level that the appraiser determines is necessary to ensure that the fair value of the Convertible Preferred Stock will be equal to its liquidation preference. In making this determination, the appraiser considers the creditworthiness of the Company and prevailing market interest rates (i.e., the return on 12-month U.S. Treasury Bills).
Redemption. After shares of Convertible Preferred Stock has been outstanding for at least three years, we may redeem such shares at a price equal to 102.5% of the liquidation preference of the shares, plus the payment of any accrued and unpaid dividends to the redemption date. After the Convertible Preferred Stock has been held at least one year, the holder of the shares may convert some or all of the shares to our Common Stock. In any event, at such time as a holder of Convertible Preferred Stock no longer meets the qualifications to be a holder of Employee Stock, the Convertible Preferred Stock held by such holder shall be repurchased by us.
Liquidation Rights. In the event of our voluntary or involuntary liquidation, dissolution or winding up, or a change in control, the holders of shares of Convertible Preferred Stock are entitled to receive out of our assets available for distribution to stockholders, on parity with holders of our Class C preferred stock, and before any distribution of assets is made to holders of our Common Stock or of any other shares of our stock ranking as to such a distribution junior to the shares of Convertible Preferred Stock, liquidating distributions in the amount of $100 per share plus accrued and unpaid
dividends. After payment of such liquidating distributions, the holders of shares of Convertible
Preferred Stock will not be entitled to any further participation in any distribution of assets by the Company.
Voting Rights. Except as otherwise required by applicable law, the holders of the Convertible Preferred Stock will be entitled to one vote per share on all matters to be voted upon by our common stockholders.
If the equivalent of six quarterly dividends payable on the Convertible Preferred Stock are in arrears, the number of our directors will be increased by two and the holders of Convertible Preferred Stock, voting as a class with the holders of shares of any other series of preferred stock ranking on a parity with the Convertible Preferred Stock as to dividends and distribution of assets, will be entitled to elect two directors to fill such vacancies. Such right to elect two additional directors will continue until all dividends in arrears have been paid or declared and set apart for payment.
Class F and Class G Convertible Preferred Stock
As of DecemberMarch 31, 2006,2007, we had 94,000 shares of Class F and Class G convertible preferred stock authorized, all of which were outstanding. Upon the completion of this offering, all then-outstanding shares of our Class F and Class G convertible preferred stock will be converted into common stock at a conversion rate of approximately 99.7199.4 shares of common stock for each share of Class F and Class G convertible preferred stock.
Registration Rights. The holders of the Class F and Class G convertible preferred stock have certain registration rights that may result in such holders being able to sell their shares of common stock issued upon conversion of the Class F or Class G convertible preferred stock in a registered offering after an initial public offering of our common stock before other holders of our common stock.
Class C Preferred Stock
Our Class C preferred stock provides certain voting rights for holders of our common stock units and preferred stock units purchased under our nonqualified Stock Purchase Plan. As of DecemberMarch 31, 2006,2007, we had 200 authorized shares of Class C preferred stock, no par value, authorized, of which 54.317111.518 shares were issued to U.S. Trust Company, N.A., as the trustee of the AECOM Technology Corporation Supplemental Trust, which holds shares on behalf of our employee stockholders. Each share of Class C preferred stock is entitled to 100,000 votes on all matters to be voted on by our holders of common stock, has no right to dividends and has a liquidation and redemption value of $1.00 per share, which will be paid on parity with our Convertible Preferred Stock before any assets are distributed to holders of our common stock upon our voluntary or involuntary liquidation. U.S. Trust Company has sole discretion as to how it votes each share of Class C preferred stock. We may redeem such shares of Class C preferred stock at our election, in whole or in part, at a redemption price equal to the liquidation preference of such shares. The Class C preferred stock is not convertible into common stock.
Class E Preferred Stock
As of DecemberMarch 31, 2006,2007, we had 20 shares of Class E preferred stock, no par value, $0 per share, authorized to be issued, of which 5.165 shares were issued to Computershare Trust Company of Canada in its capacity as trustee for UMA Group, Ltd. and UMA RRSPCO Ltd. The shares of Class E preferred stock were issued in connection with our acquisition of the UMA group of companies in September 2004 and provide certain voting rights to the former UMA shareholders. Each share of Class E preferred stock is entitled to 100,000 votes only on certain fundamental matters affecting the Company, such as change of control.
The Class E preferred stock has no right to dividends and has a liquidation and redemption value of $1.00 per share, which will be paid before any assets are distributed to holders of our common stock upon our voluntary or involuntary liquidation. We may redeem the Class E preferred stock at any time by paying the redemption value of $1.00 per share. The Class E stock is not convertible into common stock.
Class Y Shares of UMA Group, Ltd. and Class YY Shares of UMA RRSPCO Ltd.
The Class Y and Class YY shares were issued to former shareholders of the UMA group of companies in connection with our acquisition of the UMA group of companies in September 2004. As of September 30, 2006,March 31, 2007, there were 440,344417,992 and 102,37598,476 shares outstanding of Class Y and YY shares, respectively.
The Class Y and YY shares are not entitled to vote with the common stock of AECOM. AECOM, however, has issued to Computershare Trust Company of Canada one share of Class E preferred stock for each 100,000 shares of Class Y or Class YY stock. As described above, the Class E preferred stock indirectly provides each holder of Class Y and YY shares voting rights upon certain fundamental events of AECOM.
The Class Y and YY shares will be entitled to dividends when and if dividends are declared on the common stock of AECOM and in the same amount as the dividends declared on the common stock of AECOM, subject to the rights of AECOM's preferred stock currently outstanding or that may hereafter be issued.
Common Stock Units and Convertible Stock Units
We have a Non-Qualified Stock Purchase Plan (SPP) pursuant to which our highly compensated employees (those earning more than approximately $95,000 per year in fiscal 2006) may defer compensation that they might otherwise have contributed to our Retirement and Savings Plan but are disqualified under applicable law from doing so. As a result of these deferrals, employees are credited with common stock units on a tax-deferred basis. The common stock units may only be redeemed for common stock. The holders of common stock units are not entitled to vote but are credited with any dividends that are declared on the common stock. In the event of our liquidation, holders of common stock units will be entitled to the same rights as holders of our common stock.
Our highly compensated employees who receive common stock units through our SPP may elect to exchange their common stock units for convertible preferred stock units. The holders of convertible preferred stock units are not entitled to vote. The convertible preferred stock units may only be redeemed for shares of our convertible preferred stock.
Delaware Law
We are subject to the provisions of Section 203 of the Delaware General Corporation Law. In general, Section 203 prohibits a publicly held Delaware corporation from engaging in a "business combination" with an "interested stockholder" for a period of three years after the date on which the person becomes an interested stockholder, unless (i) prior to the time that such stockholder becomes an interested stockholder, the Board of Directors approves such transaction or business combination, (ii) the stockholder acquires more than 85% of the outstanding voting stock of the corporation (excluding shares held by directors who are officers or held in employee stock plans) upon consummation of such transaction, or (iii) at or subsequent to the time such stockholder becomes an interested stockholder, the business combination is approved by the Board of Directors and by two-thirds of the outstanding voting stock of the corporation (excluding shares held by the interested stockholder) at a meeting of stockholders (and not by written consent). A "business combination" includes a merger, asset sale or other transaction resulting in a financial benefit to such interested
stockholder. For purposes of Section 203, "interested stockholder" is a person who, together with affiliates and associates, owns (or within three years prior, did own) 15% or more of the corporation's voting stock.
Certificate of Incorporation and Bylaws
Various provisions of our Certificate of Incorporation and Bylaws, which are summarized in the following paragraphs, may be deemed to have an anti-takeover effect and may delay, defer or prevent a tender offer or takeover attempt that a stockholder might consider in its best interest, including those attempts that might result in a premium over the market price for the shares held by stockholders.
No Cumulative Voting. The Delaware General Corporation Law provides that stockholders are denied the right to cumulate votes in the election of directors unless our Certificate of Incorporation provides otherwise. Our Certificate of Incorporation does not expressly address cumulative voting.
No Stockholder Action by Written Consent; Calling of Special Meetings of Stockholders. Our Certificate of Incorporation prohibits stockholder action by written consent. It also provides that special meetings of our stockholders may be called only by the Board of Directors or the chief executive officer.
Advance Notice Requirements for Stockholder Proposals and Director Nominations. Our Bylaws provide that stockholders seeking to bring business before an annual meeting of stockholders must provide timely notice of their proposal in writing to the corporate secretary. To be timely, a stockholder's notice must be delivered or mailed and received at our principal executive offices not less than 60 nor more than 90 days prior to the meeting. Our Bylaws also specify requirements as to the form and content of a stockholder's notice. These provisions may impede stockholders' ability to bring matters before an annual meeting of stockholders or make nominations for directors at an annual meeting of stockholders.
Classified Board of Directors. Our Certificate of Incorporation divides our board of directors into three classes of directors who are elected for three-year terms. Therefore, the full board of directors is not subject to re-election at each annual meeting of our stockholders.
Limitations on Liability and Indemnification of Officers and Directors. The Delaware General Corporation Law authorizes corporations to limit or eliminate the personal liability of directors to corporations and their stockholders for monetary damages for breaches of directors' fiduciary duties. Our Certificate of Incorporation includes a provision that eliminates the personal liability of directors for monetary damages for actions taken as a director, except for liability:
Our Bylaws provide that we must indemnify our directors and officers to the fullest extent authorized by the Delaware General Corporation Law. We are also expressly authorized to carry directors' and officers' insurance providing indemnification for our directors, officers and certain employees for some liabilities. We believe that these indemnification provisions and insurance are useful to attract and retain qualified directors and officers.
The limitation of liability and indemnification provisions in our Certificate of Incorporation and Bylaws may discourage stockholders from bringing a lawsuit against directors for breach of their
fiduciary duty. These provisions may also have the effect of reducing the likelihood of derivative litigation against directors and officers, even though such an action, if successful, might otherwise benefit us and our stockholders.
There is currently no pending material litigation or proceeding involving any of our directors, officers or employees for which indemnification is sought.
Authorized But Unissued Shares. Our authorized but unissued shares of common stock and preferred stock will be available for future issuance without the approval of holders of common stock. We may use these additional shares for a variety of corporate purposes, including future offerings to raise additional capital, corporate acquisitions and employee benefit plans.
Supermajority Provisions. Under our Certificate of Incorporation, we must receive the consent of the holders of at least two-thirds of the outstanding shares of our capital stock, voting together as a single class, to approve a "business combination." A business combination is defined as:
Transfer Agent and Registrar
The transfer agent and registrar for our common stock is Computershare Investor Services.
UNITED STATES FEDERAL INCOME TAX CONSIDERATIONS FOR NON-U.S. HOLDERS
The following is a general discussion of the material United States federal income tax consequences of the ownership and disposition of our common stock to a non-United States holder. This discussion assumes that non-United States holders will hold our common stock issued pursuant to the offering as a capital asset (generally, property held for investment). This discussion does not address all aspects of United States federal income taxation that may be relevant in light of a non-United States holder's special tax status or special tax situations. For example, United States expatriates, life insurance companies, tax-exempt organizations, dealers in securities or currency, banks or other financial institutions, pass-through entities, trusts, estates, and investors that hold common stock as part of a hedge, straddle or conversion transaction are among those categories of potential investors that are subject to special rules not covered in this discussion. In addition, this discussion does not address tax consequences to a holder of the use of a functional currency other than the United States dollar. This discussion does not address any tax consequences arising under the laws of any state, local or non-United States taxing jurisdiction or any taxes other than income taxes. Furthermore, the following discussion is based on current provisions of the Internal Revenue Code of 1986, as amended, legislative history and Treasury Regulations and administrative and judicial interpretations thereof, all as in effect on the date hereof, and all of which are subject to change, possibly with retroactive effect. Accordingly, we urge each non-United States Holder to consult a tax advisor regarding the United States federal, state, local and non-United States income and other tax consequences of acquiring, holding and disposing of shares of our common stock.
For the purpose of this discussion, a non-United States holder is any individual, corporation, estate or trust that is a beneficial holder of our common stock and that for United States federal income tax purposes is not a United States person. For purposes of this discussion, the term United States person means:
If a partnership (or an entity treated as a partnership for United States federal income tax purposes) holds our common stock, the tax treatment of a partner will generally depend on the status of the partner and upon the activities of the partnership. Accordingly, we urge partnerships which hold our common stock and partners in such partnerships to consult their tax advisors.
Investors considering the purchase of common stock should consult their tax advisors regarding the application of the U.S. federal income tax laws to their particular situations and the consequences of U.S. federal estate and gift tax laws, foreign, state and local laws, and tax treaties.
Dividends
Distributions on our common stock, if any, generally will constitute dividends for U.S. federal income tax purposes to the extent paid from our current or accumulated earnings and profits, as determined under U.S. federal income tax principles. Amounts not treated as dividends for U.S. federal income tax purposes will constitute a return of capital and will first be applied against and reduce a
holder's adjusted tax basis in the common stock, but not below zero, and then the excess, if any, will be treated as gain from the sale of the common stock.
Amounts treated as dividends paid to a non-United States holder of common stock generally will be subject to United States withholding at a rate of 30% of the gross amount of the dividend, unless either: (a) an applicable income tax treaty reduces or eliminates such tax, and the non-United States holder properly claims the benefit of that treaty by providing a valid IRS Form W-8BEN (or suitable successor or substitute form) establishing qualification for the reduced rate, or (b) the dividend is effectively connected with the non-United States holder's conduct of a trade or business in the United States and the non-United States holder provides an appropriate statement to that effect on a valid IRS Form W-8ECI (or suitable successor form).
Dividends received by a non-United States holder that are effectively connected with a United States trade or business conducted by the non-United States holder are generally taxed at the same graduated rates applicable to United States persons, net of certain deductions and credits, subject to an applicable income tax treaty providing otherwise. In that case, the 30% withholding tax described above will not apply, provided the appropriate statement is provided to us. If a non-United States holder is eligible for the benefits of a tax treaty between the United States and its country of residence, any dividend income that is effectively connected with a United States trade or business will be subject to United States federal income tax in the manner specified by the treaty and generally will only be subject to such tax if such income is attributable to a permanent establishment (or a fixed base in the case of an individual) maintained by the non-United States holder in the United States and the non-United States holder claims the benefit of the treaty by properly submitting an IRS Form W-8BEN. In addition, dividends received by a corporate non-United States holder that are effectively connected with a United States trade or business of the corporate non-United States holder may also be subject to a branch profits tax at a rate of 30% or such lower rate as may be specified by an applicable tax treaty.
A non-United States holder may obtain a refund from the IRS to the extent that the amounts withheld as described above exceed that holder's tax liability if an appropriate claim for refund is timely filed with the IRS.
If a non-United States holder holds our common stock through a foreign partnership or other passthrough entity or a foreign intermediary, the foreign partnership or passthrough entity or foreign intermediary may also be required to comply with additional certification requirements.
Gain on Disposition of Common Stock
A non-United States holder generally will not be subject to United States federal income tax on any gain realized upon the sale or other disposition of our common stock unless:
We believe that we are not currently, and that we will not become, a USRPHC for United States federal income tax purposes.
If the first of these exceptions applies, the non-United States holder generally will be subject to tax at a rate of 30% on the amount by which the United States-source capital gains exceed capital losses allocable to United States sources.
If the second exception applies, generally the non-United States holder will be required to pay United States federal income tax on the net gain derived from the sale in the same manner as a United States person. If a non-United States Holder is eligible for the benefits of a tax treaty between the United States and its country of residence, any such gain will be subject to United States federal income tax in the manner specified by the treaty and generally will only be subject to such tax if such gain is attributable to a permanent establishment (or a fixed base in the case of an individual) maintained by the non-United States holder in the United States and the non-United States holder claims the benefit of the treaty by properly submitting an IRS Form W-8BEN (or suitable successor form). Additionally, non-United States holders that are treated for United States federal income tax purposes as corporations and that are engaged in a trade or business or have a permanent establishment in the United States could be subject to a branch profits tax on such income at a 30% rate or a lower rate if so specified by an applicable income tax treaty.
Backup Withholding and Information Reporting
Generally, we must report annually to the IRS the amount of dividends paid, the name and address of the recipient, and the amount, if any, of tax withheld. Subject to certain exceptions, a similar report is sent to the holder. Pursuant to tax treaties or other agreements, the IRS may make its reports available to tax authorities in the recipient's country of residence.
Payments of dividends or of proceeds on the disposition of stock made to a non-United States holder may be subject to backup withholding unless the non-United States holder establishes an exemption, for example, by properly certifying its non-United States status on a valid IRS Form W-8BEN or another appropriate version of IRS Form W-8. Notwithstanding the foregoing, backup withholding may apply if either we or our paying agent has actual knowledge, or reason to know, that the holder is a United States person.
Additional information reporting and backup withholding may apply in the case of dispositions of our common stock by non-United States brokers effected through certain brokers or a United States office of a broker. The backup withholding rate currently is 28%.
Backup withholding is not an additional tax. Rather, the United States income tax liability of persons subject to backup withholding will be reduced by the amount of tax withheld. If withholding results in an overpayment of taxes, a refund may be obtained, provided that the required information is timely furnished to the IRS.
SHARES ELIGIBLE FOR FUTURE SALE
Upon the consummation of the offering, we will have approximately 92,335,201 shares of common stock outstanding (assuming no exercise of the underwriters' over-allotment option). Of these shares, approximately 40,252,191 shares will be available for immediate resale in the public market, including all of the shares in this offering, and approximately 9,413,842 shares will be available for resale 90 days following completion of this offering, except those held by our "affiliates." Of the remaining shares outstanding, approximately 42,669,167 shares are subject to lock-up agreements restricting the sale of those shares for 180 days from the date of this prospectus. All of the shares of common stock sold in the offering will be freely tradable under the Securities Act. Upon the expiration of these lock-up agreements, between our directors, executive officers, certain of our stockholders who hold either certificated securities or who hold securities under one or more of our stock plans and the underwriters, which will occur 180 days after the date of this prospectus, or the Effective Date, all of the shares of common stock owned by theseour directors, executive officers, and certain of our stockholders, or Restricted Shares, will become eligible for sale, subject to compliance with Rule 144 of the Securities Act as described below.
In general, under Rule 144 as currently in effect, a person (or persons whose shares are aggregated) who has beneficially owned Restricted Shares for at least one year, will be entitled to sell in any three-month period a number of shares that does not exceed the greater of: (i) 1% of the number of shares of Common Stock then outstanding ((92,335,201 shares immediately after the offering or 97,607,701 if the underwriters' over-allotment is exercised in full) or (ii) the average weekly trading volume of our common stock on the NYSE during the four calendar weeks immediately preceding the date on which the notice of sale is filed with the Securities and Exchange Commission. Approximately 50,350,151 shares of the Restricted Shares have been held for over one year. Sales pursuant to Rule 144 are subject to requirements relating to manner of sale, notice and availability of current public information about us. A person (or persons whose shares are aggregated) who is not deemed to be an affiliate of ours preceding the sale, and who has beneficially owned Restricted Shares for at least two years is entitled to sell such shares pursuant to Rule 144(k) without regard to the limitations and requirements described above.
OurWe and our directors, executive officers, selling stockholders and certain other stockholders who hold either certificated securities or who hold securities under one or more of our stock plans have agreed with the underwriters not to directly or indirectly, offer to sell, contract to sell, sell or otherwise dispose of any common stock or any securities convertible into or exercisable or exchangeable for common stock without the prior written consent of Morgan Stanley & Co. Incorporated (and with respect to us and certain of our stockholders, without the further consent of Merrill Lynch, Pierce, Fenner & Smith Incorporated and UBS Securities LLC) until , 200 .
In addition, employees of ours who hold 32,673,022 outstanding shares of common stock and options to acquire 8,409,191 additional shares of common stock are entitled to rely on the resale provisions of Rule 701, which permit non-affiliates to sell their Rule 701 shares without having to comply with the public information, holding period, volume limitation or notice provisions of Rule 144 and permit affiliates to sell Rule 701 shares without having to comply with Rule 144's holding period restrictions, in each case commencing 90 days after the date of completion of this offering.
Not earlier than 90 days after the date of completion of this offering, we intend to fileWe have filed a registration statement on Form S-8 under the Securities Act to register shares of common stock reserved for issuance under our Stock Incentive Plans, thus permitting the resale of such shares by non-affiliates in the public market without restriction under the Securities Act. As of ,May 4, 2007, there were outstanding options to purchase 8,409,191 shares of our common stock under our Stock Incentive Plans. An additional 25,637,100 shares are reserved for issuance under our Stock Incentive Plans. This registration statement will become effective immediately upon filing.
We are unable to estimate the number of shares that may be sold in the future by the existing stockholders or the effect, if any, that sales of shares by such stockholders will have on the market price of our common stock. Sales of substantial amounts of common stock by such stockholders could adversely affect the market price of our common stock.
Under the terms and subject to the conditions in an underwriting agreement dated the date of this prospectus, the underwriters named below, for whom Morgan Stanley & Co. Incorporated, isMerrill Lynch, Pierce, Fenner & Smith Incorporated and UBS Securities LLC are acting as representative,representatives, have severally agreed to purchase, and we and the selling stockholders have agreed to sell to them, severally, the number of shares indicated below:
| Name | Number of Shares | |
|---|---|---|
| Morgan Stanley & Co. Incorporated | ||
| Merrill Lynch, Pierce, Fenner & Smith Incorporated | ||
| UBS Securities LLC | ||
| Goldman, Sachs & Co. | ||
| Credit Suisse Securities (USA) LLC | ||
| D.A. Davidson & Co. | ||
| Total: | 35,150,000 | |
The underwriters are collectively referred to as the "underwriters" and the representative is referred to as the "representative." The underwriters are offering the shares of common stock subject to their acceptance of the shares from us and subject to prior sale. The underwriting agreement provides that the obligations of the several underwriters to pay for and accept delivery of the shares of common stock offered by this prospectus are subject to the approval of certain legal matters by their counsel and to certain other conditions. The underwriters are obligated to take and pay for all of the shares of common stock offered by this prospectus if any such shares are taken. However, the underwriters are not required to take or pay for the shares covered by the underwriters' over-allotment option described below.
The underwriters initially propose to offer part of the shares of common stock directly to the public at the offering price listed on the cover page of this prospectus and part to certain dealers. After the initial offering of the shares of common stock, the offering price and other selling terms may from time to time be varied by the representative.
We have granted to the underwriters an option, exercisable for 30 days from the date of this prospectus, to purchase up to 5,272,500 additional shares of common stock at the public offering price listed on the cover page of this prospectus, less underwriting discounts and commissions. The underwriters may exercise this option solely for the purpose of covering over-allotments, if any, made in connection with the offering of the shares of common stock offered by this prospectus. To the extent the option is exercised, each underwriter will become obligated, subject to certain conditions, to purchase about the same percentage of the additional shares of common stock as the number listed next to the underwriter's name in the preceding table bears to the total number of shares of common stock listed next to the names of all underwriters in the preceding table.
The following table shows the per share and total public offering price, underwriting discounts and commissions, and proceeds before expenses to us and the selling stockholders. These amounts are
shown assuming both no exercise and full exercise of the underwriters' option to purchase up to an additional shares of common stock.
| | Total | |||||||||
|---|---|---|---|---|---|---|---|---|---|---|
| | Per Share | No Exercise | Full Exercise | |||||||
| Public offering price | $ | $ | $ | |||||||
| Underwriting discounts and commissions to be paid by: | ||||||||||
| Us | $ | $ | $ | |||||||
| The selling stockholders | $ | $ | $ | |||||||
| Proceeds, before expenses, to us | $ | $ | $ | |||||||
| Proceeds, before expenses, to selling stockholders | $ | $ | $ | |||||||
The estimated offering expenses payable by us, exclusive of the underwriting discounts and commissions, are approximately $ . This amount includes the registration and other offering expenses, other than underwriting discounts and commissions, of the selling stockholders.
The underwriters have informed us that they do not intend sales to discretionary accounts to exceed 5% of the total number of shares of common stock offered by them.
We are applying to have our common stock traded on the New York Stock Exchange under the symbol "ACM."
We and all directors, officers and officersselling stockholders and certain of our other stockholders who hold securities under one or more of our stock plans have agreed that, without the prior written consent of Morgan Stanley & Co. Incorporated (and with respect to us and certain of our stockholders, without the further consent of Merrill Lynch, Pierce, Fenner & Smith Incorporated and UBS Securities LLC) on behalf of the underwriters, we and they will not, during the period ending 180 days after the date of this prospectus:
whether any such transaction described above is to be settled by delivery of common stock or such other securities, in cash or otherwise. In addition, we and each such person agrees that, without the prior written consent of Morgan Stanley & Co. Incorporated (and with respect to us and certain of our stockholders, without the further consent of Merrill Lynch, Pierce, Fenner & Smith Incorporated and UBS Securities LLC) on behalf of the underwriters, it will not, during the period ending 180 days after the date of this prospectus, make any demand for, or exercise any right with respect to, the registration of any shares of common stock or any security convertible into or exercisable or exchangeable for common stock.
The restrictions described in the immediately preceding paragraph do not apply to:
The 180 day restricted period described in the preceding paragraph will be extended if:
in which case the restrictions described in the preceding paragraph will continue to apply until the expiration of the 18 day period beginning on the issuance of the earnings release or the occurrence of the material news or material event, unless such extension is waived, in writing, by Morgan Stanley & Co. Incorporated.Incorporated, Merrill Lynch, Pierce, Fenner & Smith Incorporated and UBS Securities LLC on behalf of the underwriters.
In order to facilitate the offering of the common stock, the underwriters may engage in transactions that stabilize, maintain or otherwise affect the price of the common stock. Specifically, the underwriters may sell more shares than they are obligated to purchase under the underwriting agreement, creating a short position. A short sale is covered if the short position is no greater than the number of shares available for purchase by the underwriters under the over-allotment option. The underwriters can close out a covered short sale by exercising the over-allotment option or purchasing shares in the open market. In determining the source of shares to close out a covered short sale, the underwriters will consider, among other things, the open market price of shares compared to the price available under the over-allotment option. The underwriters may also sell shares in excess of the over-allotment option, creating a naked short position. The underwriters must close out any naked short position by purchasing shares in the open market. A naked short position is more likely to be created if the underwriters are concerned that there may be downward pressure on the price of the common stock in the open market after pricing that could adversely affect investors who purchase in this offering. As an additional means of facilitating this offering, the underwriters may bid for, and purchase, shares of common stock in the open market to stabilize the price of the common stock. These activities may raise or maintain the market price of the common stock above independent market levels or prevent or retard a decline in the market price of the common stock. The underwriters are not required to engage in these activities and may end any of these activities at any time.
We, the selling stockholders and the underwriters have agreed to indemnify each other against certain liabilities, including liabilities under the Securities Act.
A prospectus in electronic format may be made available on websites maintained by one or more underwriters, or selling group members, if any, participating in this offering. The representative may agree to allocate a number of shares of common stock to underwriters for sale to their online brokerage account holders. Internet distributions will be allocated by the representative to underwriters that may make Internet distributions on the same basis as other allocations.
European Economic Area
In relation to each Member State of the European Economic Area which has implemented the Prospectus Directive, each Manager has represented and agreed that with effect from and including the date on which the Prospectus Directive is implemented in that Member State it has not made and will
not make an offer of Shares to the public in that Member State, except that it may, with effect from and including such date, make an offer of Shares to the public in that Member State:
For the purposes of the above, the expression an "offer of Shares to the public" in relation to any Shares in any Member State means the communication in any form and by any means of sufficient information on the terms of the offer and the Shares to be offered so as to enable an investor to decide to purchase or subscribe the Shares, as the same may be varied in that Member State by any measure implementing the Prospectus Directive in that Member State and the expression Prospectus Directive means Directive 2003/71/EC and includes any relevant implementing measure in that Member State.
United Kingdom
Each Manager has represented and agreed that it has only communicated or caused to be communicated and will only communicate or cause to be communicated an invitation or inducement to engage in investment activity (within the meaning of Section 21 of the Financial Services and Markets Act 2000) in connection with the issue or sale of the Shares in circumstances in which Section 21(1) of such Act does not apply to us and it has complied and will comply with all applicable provisions of such Act with respect to anything done by it in relation to any Shares in, from or otherwise involving the United Kingdom.
Pricing of the Offering
Prior to this offering, there has been no public market for our common stock. The initial public offering price was determined by negotiations between us and the representative. Among the factors considered in determining the initial public offering price were our future prospects and those of our industry in general, our sales, earnings and certain other financial and operating information in recent periods, and the price-earnings ratios, price-sales ratios, market prices of securities, and certain financial and operating information of companies engaged in activities similar to ours.
Other Relationships
Some of the underwriters and their affiliates have engaged in, and may in the future engage in, investment banking and other commercial dealings in the ordinary course of business with us. They have received customary fees and commissions for these transactions.
The validity of the shares of common stock offered hereby will be passed upon for us by Gibson, Dunn & Crutcher LLP, Los Angeles, California. Certain legal matters in connection with this offering will be passed upon for the underwriters by Latham & Watkins LLP, Los Angeles, California.
The consolidated financial statements of AECOM Technology Corporation at September 30, 2006 and 2005, and for the three year period ended September 30, 2006, appearing in this Prospectus and Registration Statement have been audited by Ernst & Young LLP, independent registered public accounting firm, as set forth in their report thereon appearing elsewhere herein, and are included in reliance upon such report given on the authority of such firm as experts in accounting and auditing.
WHERE YOU CAN FIND ADDITIONAL INFORMATION
We have filed with the Securities and Exchange Commission (the "Commission"), Washington, D.C. 20549, a registration statement on Form S-1 under the Securities Act with respect to the common stock offered by this prospectus. This prospectus does not contain all of the information set forth in the registration statement and the exhibits thereto. Certain items are omitted in accordance with the rules and regulations of the Commission. For further information with respect to us and the common stock offered by this prospectus, please refer to the registration statement and the exhibits filed herewith or incorporated by reference as a part hereof. Statements contained in this prospectus as to the contents of any contract or other document filed herewith or incorporated by reference as an exhibit to the registration statement is qualified in all respects by such reference to such exhibit.
The registration statement, including exhibits thereto, may be inspected without charge at the public reference facilities maintained by the Commission in Room 1024, 450 Fifth100 F. Street, N.W.N.E., Washington, D.C. 20549, and copies of all or any part thereof may be obtained from such office after payment of fees prescribed by the Commission. Please call the Commission at 1-800-SEC-0330 for further information on the operation of the public reference facilities. The Commission maintains a website at http://www.sec.gov that contains reports, proxy and information statements and other information regarding registrants that file electronically with the Commission. We will become subject to the information and reporting requirements of the Securities Exchange Act of 1934, as amended, and will file periodic reports, proxy statements and other information with the Commission.
We intend to issue to our stockholders annual reports, which will include audited financial statements and a report of our independent auditors with respect to the examination of such financial statements. In addition, we will issue such other interim reports as we deem appropriate.
AECOM Technology Corporation
Index to Consolidated Financial Statements
September 30, 2006
| Audited Annual Financial Statements | ||
Report of Independent Registered Public Accounting Firm | F-2 | |
Consolidated Balance Sheets at September 30, 2005 and 2006 | F-3 | |
Consolidated Statements of Income for the Years Ended September 30, 2004, 2005 and 2006 | F-4 | |
Consolidated Statements of Comprehensive Income for the Years Ended September 30, 2004, 2005 and 2006 | F-5 | |
Consolidated Statements of Changes in Stockholders' Deficit for the Years Ended September 30, 2004, 2005 and 2006 | F-6 | |
Consolidated Statements of Cash Flows for the Years Ended September 30, 2004, 2005 and 2006 | F-7 | |
Notes to Consolidated Financial Statements | F-8 | |
Unaudited Interim Financial Statements | ||
Condensed Consolidated Balance Sheets as of September 30, 2006 and | ||
Condensed Consolidated Statements of Income for the Three and Six Months Ended | ||
Condensed Consolidated Statements of Comprehensive Income for the Three and Six Months Ended | ||
Condensed Consolidated Statements of Cash Flows for the | ||
Notes to Condensed Consolidated Financial Statements |
REPORT OF INDEPENDENT REGISTERED PUBLIC ACCOUNTING FIRM
The Board of Directors and Shareholders of
AECOM Technology Corporation
We have audited the accompanying consolidated balance sheets of AECOM Technology Corporation (the "Company"), as of September 30, 2006 and 2005, and the related consolidated statements of income, comprehensive income, stockholders'shareholders' deficit, and cash flows for each of the three years in the period ended September 30, 2006. These financial statements are the responsibility of the Company's management. Our responsibility is to express an opinion on these financial statements based on our audits.
We conducted our audits in accordance with the standards of the Public Company Accounting Oversight Board (United States). Those standards require that we plan and perform the audit to obtain reasonable assurance about whether the financial statements are free of material misstatement. We were not engaged to perform an audit of the Company's internal control over financial reporting. Our audits included consideration of internal control over financial reporting as a basis for designing audit procedures that are appropriate in the circumstances, but not for the purpose of expressing an opinion on the effectiveness of the Company's internal control over financial reporting. Accordingly, we express no such opinion. An audit also includes examining, on a test basis, evidence supporting the amounts and disclosures in the financial statements, assessing the accounting principles used and significant estimates made by management, and evaluating the overall financial statement presentation. We believe that our audits provide a reasonable basis for our opinion.
In our opinion, the financial statements referred to above present fairly, in all material respects, the consolidated financial position of AECOM Technology Corporation at September 30, 2006 and 2005, and the consolidated results of its operations and its cash flows for each of the three years in the period ended September 30, 2006, in conformity with U.S. generally accepted accounting principles.
Los Angeles, California
March 5, 2007, except for paragraph two of Note 24
as to which the date is May 4, 2007
AECOM Technology Corporation
Consolidated Balance Sheets
(in thousands, except share data)
| | | September 30, 2005 | September 30, 2006 | | September 30, 2005 | September 30, 2006 | ||||||||||||
|---|---|---|---|---|---|---|---|---|---|---|---|---|---|---|---|---|---|---|
| ASSETS | ASSETS | ASSETS | ||||||||||||||||
| CURRENT ASSETS: | CURRENT ASSETS: | CURRENT ASSETS: | ||||||||||||||||
| Cash and cash equivalents | $ | 27,424 | $ | 118,427 | Cash and cash equivalents | $ | 27,424 | $ | 118,427 | |||||||||
| Cash in consolidated joint ventures | 26,878 | 9,393 | Cash in consolidated joint ventures | 26,878 | 9,393 | |||||||||||||
| Short-term investments | 50 | 50 | Short-term investments | 50 | 50 | |||||||||||||
| Total cash and cash equivalents | 54,352 | 127,870 | Total cash and cash equivalents | 54,352 | 127,870 | |||||||||||||
Accounts receivable—net | 703,837 | 913,178 | Accounts receivable—net | 703,837 | 913,178 | |||||||||||||
| Prepaid expenses and other current assets | 48,541 | 52,827 | Prepaid expenses and other current assets | 48,541 | 52,827 | |||||||||||||
| Deferred tax assets—net | 15,531 | — | Deferred tax assets—net | 15,531 | — | |||||||||||||
| TOTAL CURRENT ASSETS | 822,261 | 1,093,875 | TOTAL CURRENT ASSETS | 822,261 | 1,093,875 | |||||||||||||
| PROPERTY AND EQUIPMENT: | PROPERTY AND EQUIPMENT: | PROPERTY AND EQUIPMENT: | ||||||||||||||||
| Equipment, furniture and fixtures | 84,208 | 85,201 | Equipment, furniture and fixtures | 84,208 | 85,201 | |||||||||||||
| Leasehold improvements | 23,685 | 31,539 | Leasehold improvements | 23,685 | 31,539 | |||||||||||||
| Total | 107,893 | 116,740 | Total | 107,893 | 116,740 | |||||||||||||
| Accumulated depreciation and amortization | (28,365 | ) | (26,417 | ) | Accumulated depreciation and amortization | (28,365 | ) | (26,417 | ) | |||||||||
| PROPERTY AND EQUIPMENT—NET | 79,528 | 90,323 | PROPERTY AND EQUIPMENT—NET | 79,528 | 90,323 | |||||||||||||
| DEFERRED TAX ASSETS—NET | DEFERRED TAX ASSETS—NET | 36,459 | 98,449 | DEFERRED TAX ASSETS—NET | 36,459 | 98,449 | ||||||||||||
| DEFERRED LOAN COSTS—NET | DEFERRED LOAN COSTS—NET | 1,478 | 1,444 | DEFERRED LOAN COSTS—NET | 1,478 | 1,444 | ||||||||||||
| INVESTMENTS IN UNCONSOLIDATED JOINT VENTURES | INVESTMENTS IN UNCONSOLIDATED JOINT VENTURES | 19,230 | 19,943 | INVESTMENTS IN UNCONSOLIDATED JOINT VENTURES | 19,230 | 19,943 | ||||||||||||
| GOODWILL | GOODWILL | 404,063 | 466,508 | GOODWILL | 404,063 | 466,508 | ||||||||||||
| INTANGIBLE AND OTHER ASSETS—NET | INTANGIBLE AND OTHER ASSETS—NET | 32,216 | 18,168 | INTANGIBLE AND OTHER ASSETS—NET | 32,216 | 18,168 | ||||||||||||
| OTHER NON-CURRENT ASSETS | OTHER NON-CURRENT ASSETS | 29,689 | 37,064 | OTHER NON-CURRENT ASSETS | 29,689 | 37,064 | ||||||||||||
| TOTAL ASSETS | TOTAL ASSETS | $ | 1,424,924 | $ | 1,825,774 | TOTAL ASSETS | $ | 1,424,924 | $ | 1,825,774 | ||||||||
LIABILITIES AND STOCKHOLDERS' DEFICIT | LIABILITIES AND STOCKHOLDERS' DEFICIT | LIABILITIES AND STOCKHOLDERS' DEFICIT | ||||||||||||||||
| CURRENT LIABILITIES: | CURRENT LIABILITIES: | CURRENT LIABILITIES: | ||||||||||||||||
| Short-term debt | $ | 4,165 | $ | 2,716 | Short-term debt | $ | 4,165 | $ | 2,716 | |||||||||
| Accounts payable and other current liabilities | 179,810 | 265,192 | Accounts payable and other current liabilities | 179,810 | 265,192 | |||||||||||||
| Accrued expenses | 273,856 | 365,548 | Accrued expenses | 273,856 | 365,548 | |||||||||||||
| Billings in excess of costs on uncompleted contracts | 122,825 | 143,283 | Billings in excess of costs on uncompleted contracts | 122,825 | 143,283 | |||||||||||||
| Income taxes payable | 11,373 | 35,646 | Income taxes payable | 11,373 | 35,646 | |||||||||||||
| Deferred tax liability—net | — | 12,824 | Deferred tax liability—net | — | 12,824 | |||||||||||||
| Current portion of share purchase liability | 43,215 | 55,394 | Share purchase liability | 43,215 | 55,394 | |||||||||||||
| Current portion of long-term obligations | 16,374 | 11,949 | Current portion of long-term obligations | 16,374 | 11,949 | |||||||||||||
| TOTAL CURRENT LIABILITIES | 651,618 | 892,552 | TOTAL CURRENT LIABILITIES | 651,618 | 892,552 | |||||||||||||
OTHER LONG-TERM LIABILITIES | OTHER LONG-TERM LIABILITIES | 126,243 | 112,970 | OTHER LONG-TERM LIABILITIES | 126,243 | 112,970 | ||||||||||||
| LONG-TERM OBLIGATIONS | LONG-TERM OBLIGATIONS | 216,183 | 122,790 | LONG-TERM OBLIGATIONS | 216,183 | 122,790 | ||||||||||||
COMMITMENTS AND CONTINGENCIES (Notes 11, 18 and 22) | COMMITMENTS AND CONTINGENCIES (Notes 11, 18 and 22) | COMMITMENTS AND CONTINGENCIES (Notes 11, 18 and 22) | ||||||||||||||||
MINORITY INTEREST | MINORITY INTEREST | 9,724 | 18,701 | MINORITY INTEREST | 9,724 | 18,701 | ||||||||||||
| REDEEMABLE COMMON AND PREFERRED STOCK AND STOCK UNITS | REDEEMABLE COMMON AND PREFERRED STOCK AND STOCK UNITS | 622,140 | 771,207 | REDEEMABLE COMMON AND PREFERRED STOCK AND STOCK UNITS | 622,140 | 771,207 | ||||||||||||
| NOTES RECEIVABLE FROM STOCKHOLDERS | NOTES RECEIVABLE FROM STOCKHOLDERS | (36,103 | ) | (36,552 | ) | NOTES RECEIVABLE FROM STOCKHOLDERS | (36,103 | ) | (36,552 | ) | ||||||||
| REDEEMABLE PREFERRED STOCK, Class D—authorized, 120,000, issued and outstanding, 75,000 and 0 as of September 30, 2005 and September 30, 2006, respectively | REDEEMABLE PREFERRED STOCK, Class D—authorized, 120,000, issued and outstanding, 75,000 and 0 as of September 30, 2005 and September 30, 2006, respectively | 75,000 | — | REDEEMABLE PREFERRED STOCK, Class D—authorized, 120,000, issued and outstanding, 75,000 and 0 as of September 30, 2005 and September 30, 2006, respectively | 75,000 | — | ||||||||||||
| REDEEMABLE PREFERRED STOCK, Class F—authorized, 200,000, issued and outstanding, 0 and 47,000 as of September 30, 2005 and September 30, 2006, respectively, $2,500 liquidation preference value | — | 117,500 | ||||||||||||||||
| REDEEMABLE PREFERRED STOCK, Class G—authorized, 200,000, issued and outstanding, 0 and 47,000 as of September 30, 2005 and September 30, 2006, respectively, $2,500 liquidation preference value | — | 117,500 | ||||||||||||||||
| REDEEMABLE PREFERRED STOCK, Class F—0 and 47,000 authorized, issued and outstanding, as of September 30, 2005 and September 30, 2006, respectively, $2,500 liquidation preference value per share | REDEEMABLE PREFERRED STOCK, Class F—0 and 47,000 authorized, issued and outstanding, as of September 30, 2005 and September 30, 2006, respectively, $2,500 liquidation preference value per share | — | 117,500 | |||||||||||||||
| REDEEMABLE PREFERRED STOCK, Class G—0 and 47,000 authorized, issued and outstanding, as of September 30, 2005 and September 30, 2006, respectively, $2,500 liquidation preference value per share | REDEEMABLE PREFERRED STOCK, Class G—0 and 47,000 authorized, issued and outstanding, as of September 30, 2005 and September 30, 2006, respectively, $2,500 liquidation preference value per share | — | 117,500 | |||||||||||||||
STOCKHOLDERS' DEFICIT: | STOCKHOLDERS' DEFICIT: | STOCKHOLDERS' DEFICIT: | ||||||||||||||||
| Stock warrants issued with Class D convertible preferred stock | 1,605 | — | Stock warrants issued with Class D convertible preferred stock | 1,605 | — | |||||||||||||
| Additional paid-in capital | (176,089 | ) | (254,225 | ) | Additional paid-in capital | (176,089 | ) | (254,225 | ) | |||||||||
| Accumulated other comprehensive loss | (65,397 | ) | (36,669 | ) | Accumulated other comprehensive loss | (65,397 | ) | (36,669 | ) | |||||||||
| Retained earnings | — | — | Retained earnings | — | — | |||||||||||||
| TOTAL STOCKHOLDERS' DEFICIT | TOTAL STOCKHOLDERS' DEFICIT | (239,881 | ) | (290,894 | ) | TOTAL STOCKHOLDERS' DEFICIT | (239,881 | ) | (290,894 | ) | ||||||||
| TOTAL LIABILITIES AND STOCKHOLDERS' DEFICIT | TOTAL LIABILITIES AND STOCKHOLDERS' DEFICIT | $ | 1,424,924 | $ | 1,825,774 | TOTAL LIABILITIES AND STOCKHOLDERS' DEFICIT | $ | 1,424,924 | $ | 1,825,774 | ||||||||
See accompanying Notes to Consolidated Financial Statements.
AECOM Technology Corporation
Consolidated Statements of Income
(in thousands, except per share data)
| | | Fiscal Year Ended | | Fiscal Year Ended | ||||||||||||||||
|---|---|---|---|---|---|---|---|---|---|---|---|---|---|---|---|---|---|---|---|---|
| | | September 30, 2004 | September 30, 2005 | September 30, 2006 | | September 30, 2004 | September 30, 2005 | September 30, 2006 | ||||||||||||
| Revenue | Revenue | $ | 2,011,975 | $ | 2,395,340 | $ | 3,421,492 | Revenue | $ | 2,011,975 | $ | 2,395,340 | $ | 3,421,492 | ||||||
Cost of revenue | Cost of revenue | 1,443,419 | 1,717,863 | 2,515,684 | Cost of revenue | 1,443,419 | 1,717,863 | 2,515,684 | ||||||||||||
| Gross profit | 568,556 | 677,477 | 905,808 | Gross profit | 568,556 | 677,477 | 905,808 | |||||||||||||
Equity in earnings of joint ventures | Equity in earnings of joint ventures | 2,517 | 2,352 | 6,554 | Equity in earnings of joint ventures | 2,517 | 2,352 | 6,554 | ||||||||||||
| General and administrative expenses | General and administrative expenses | 484,446 | 581,529 | 808,953 | General and administrative expenses | 484,446 | 581,529 | 808,953 | ||||||||||||
| Income from operations | 86,627 | 98,300 | 103,409 | Income from operations | 86,627 | 98,300 | 103,409 | |||||||||||||
| Minority interest in share of earnings | Minority interest in share of earnings | 3,239 | 8,453 | 13,924 | Minority interest in share of earnings | 3,239 | 8,453 | 13,924 | ||||||||||||
| Interest expense—net | Interest expense—net | 6,968 | 7,054 | 10,576 | Interest expense—net | 6,968 | 7,054 | 10,576 | ||||||||||||
| Income before income tax expense | 76,420 | 82,793 | 78,909 | Income before income tax expense | 76,420 | 82,793 | 78,909 | |||||||||||||
Income tax expense | Income tax expense | 25,984 | 28,979 | 25,223 | Income tax expense | 25,984 | 28,979 | 25,223 | ||||||||||||
| Net income | Net income | $ | 50,436 | $ | 53,814 | $ | 53,686 | Net income | $ | 50,436 | $ | 53,814 | $ | 53,686 | ||||||
| Net income allocation: | Net income allocation: | Net income allocation: | ||||||||||||||||||
| Preferred stock dividend | $ | 5,443 | $ | 5,506 | $ | 2,205 | Preferred stock dividend | $ | 5,443 | $ | 5,506 | $ | 2,205 | |||||||
| Net income available for common stockholders | 44,993 | 48,308 | 51,481 | Net income available for common stockholders | 44,993 | 48,308 | 51,481 | |||||||||||||
| Net income | $ | 50,436 | $ | 53,814 | $ | 53,686 | Net income | $ | 50,436 | $ | 53,814 | $ | 53,686 | |||||||
| Net income per share: | Net income per share: | Net income per share: | ||||||||||||||||||
| Basic | $ | 1.71 | $ | 1.86 | $ | 1.88 | Basic | $ | 0.86 | $ | 0.93 | $ | 0.94 | |||||||
| Diluted | $ | 1.57 | $ | 1.68 | $ | 1.48 | Diluted | $ | 0.78 | $ | 0.84 | $ | 0.74 | |||||||
| Weighted average shares outstanding: | Weighted average shares outstanding: | Weighted average shares outstanding: | ||||||||||||||||||
| Basic | 26,300 | 25,940 | 27,428 | Basic | 52,600 | 51,880 | 54,856 | |||||||||||||
| Diluted | 32,127 | 31,989 | 36,329 | Diluted | 64,254 | 63,978 | 72,658 | |||||||||||||
See accompanying Notes to Consolidated Financial Statements.
AECOM Technology Corporation
Consolidated Statements of Comprehensive Income
(in thousands)
| | Fiscal Year Ended | ||||||||
|---|---|---|---|---|---|---|---|---|---|
| | September 30, 2004 | September 30, 2005 | September 30, 2006 | ||||||
| Net income | $ | 50,436 | $ | 53,814 | $ | 53,686 | |||
| Other comprehensive income (loss): | |||||||||
| Foreign currency translation adjustments | 2,183 | (7,308 | ) | 11,236 | |||||
| Minimum pension liability adjustments | 5,841 | (26,356 | ) | 17,492 | |||||
| Other comprehensive income (loss) | 8,024 | (33,664 | ) | 28,728 | |||||
| Comprehensive income | $ | 58,460 | $ | 20,150 | $ | 82,414 | |||
See accompanying Notes to Consolidated Financial Statements.
AECOM Technology Corporation
Consolidated Statements of Changes in Stockholders' Deficit
(in thousands)
| | September 30, 2004 | September 30, 2005 | September 30, 2006 | |||||||
|---|---|---|---|---|---|---|---|---|---|---|
| STOCK WARRANTS: | ||||||||||
| Balance at the beginning of the year | $ | 1,605 | $ | 1,605 | $ | 1,605 | ||||
| Liquidation of Class D preferred stock | — | — | (1,605 | ) | ||||||
| Balance at the end of the year | 1,605 | 1,605 | — | |||||||
| ADDITIONAL PAID-IN CAPITAL: | ||||||||||
| Balance at the beginning of the year | (142,877 | ) | (129,260 | ) | (176,089 | ) | ||||
| Tax benefit of exercise of non-qualified stock options | 2,893 | 2,853 | 3,479 | |||||||
| Adjustment of Class D preferred stock issuance costs | — | — | 2,100 | |||||||
| Redemption of Class D preferred stock | — | — | (41,486 | ) | ||||||
| Issuance costs of Class F and Class G preferred stock | — | — | (2,880 | ) | ||||||
| (Increase) decrease in carrying value of redeemable common and preferred stock and stock units | 10,724 | (49,682 | ) | (39,349 | ) | |||||
| Balance at the end of the year | (129,260 | ) | (176,089 | ) | (254,225 | ) | ||||
| ACCUMULATED OTHER COMPREHENSIVE (LOSS) INCOME: | ||||||||||
| Balance at the beginning of the year | (39,757 | ) | (31,733 | ) | (65,397 | ) | ||||
| Foreign currency translation adjustments | 2,183 | (7,308 | ) | 11,236 | ||||||
| Defined benefit minimum pension liability adjustment | 5,841 | (26,356 | ) | 17,492 | ||||||
| Balance at the end of the year | (31,733 | ) | (65,397 | ) | (36,669 | ) | ||||
| RETAINED EARNINGS: | ||||||||||
| Balance at the beginning of the year | — | — | — | |||||||
| Net income | 50,436 | 53,814 | 53,686 | |||||||
| Tax benefit related to appreciation in value under stock purchase plan | 5,258 | 16,427 | 14,807 | |||||||
| Paid-in-kind dividend on convertible preferred stock and preferred stock units | (193 | ) | (256 | ) | (305 | ) | ||||
| Dividend on Class D preferred stock | (5,250 | ) | (5,250 | ) | (1,900 | ) | ||||
| (Increase) decrease in carrying value of redeemable common and preferred stock and stock units | (50,251 | ) | (64,735 | ) | (66,288 | ) | ||||
| Balance at the end of the year | — | — | — | |||||||
| Total Stockholders' Deficit | $ | (159,388 | ) | $ | (239,881 | ) | $ | (290,894 | ) | |
See accompanying Notes to Consolidated Financial Statements.
AECOM Technology Corporation
Consolidated Statements of Cash Flows
(in thousands)
| | | Fiscal Year Ended | | Fiscal Year Ended | ||||||||||||||||||||
|---|---|---|---|---|---|---|---|---|---|---|---|---|---|---|---|---|---|---|---|---|---|---|---|---|
| | | September 30, 2004 | September 30, 2005 | September 30, 2006 | | September 30, 2004 | September 30, 2005 | September 30, 2006 | ||||||||||||||||
| CASH FLOWS FROM OPERATING ACTIVITIES: | CASH FLOWS FROM OPERATING ACTIVITIES: | CASH FLOWS FROM OPERATING ACTIVITIES: | ||||||||||||||||||||||
Net income | Net income | $ | 50,436 | $ | 53,814 | $ | 53,686 | Net income | $ | 50,436 | $ | 53,814 | $ | 53,686 | ||||||||||
| Adjustments to reconcile net income to net cash provided by operating activities: | Adjustments to reconcile net income to net cash provided by operating activities: | Adjustments to reconcile net income to net cash provided by operating activities: | ||||||||||||||||||||||
| Depreciation and amortization | 12,918 | 19,928 | 39,830 | Depreciation and amortization | 12,918 | 19,928 | 39,830 | |||||||||||||||||
| Equity in earnings of unconsolidated joint ventures | (2,517 | ) | (2,352 | ) | (6,554 | ) | Equity in earnings of unconsolidated joint ventures | (2,517 | ) | (2,352 | ) | (6,554 | ) | |||||||||||
| Stock match | 1,811 | 3,214 | 14,779 | Stock match | 1,811 | 3,214 | 14,779 | |||||||||||||||||
| Write-off of Class D preferred stock issuance costs | — | — | 2,100 | Write-off of Class D preferred stock issuance costs | — | — | 2,100 | |||||||||||||||||
| Interest income on notes from stockholders | (1,623 | ) | (2,008 | ) | (2,111 | ) | Interest income on notes from stockholders | (1,623 | ) | (2,008 | ) | (2,111 | ) | |||||||||||
| Deferred income tax expense (benefit) | 6,774 | 13,093 | (12,136 | ) | Deferred income tax expense (benefit) | 6,774 | 13,093 | (12,136 | ) | |||||||||||||||
| Gain on termination of interest rate hedge | — | — | (1,139 | ) | Gain on termination of interest rate hedge | — | — | (1,139 | ) | |||||||||||||||
Changes in operating assets and liabilities, net of effects of acquisitions: | Changes in operating assets and liabilities, net of effects of acquisitions: | Changes in operating assets and liabilities, net of effects of acquisitions: | ||||||||||||||||||||||
| Accounts receivable | 12,679 | (72,407 | ) | (135,418 | ) | Accounts receivable | 12,679 | (72,407 | ) | (135,418 | ) | |||||||||||||
| Prepaid expenses and other assets | (13,919 | ) | (15,418 | ) | (12,845 | ) | Prepaid expenses and other assets | (13,919 | ) | (15,418 | ) | (12,845 | ) | |||||||||||
| Distribution of earnings from unconsolidated affiliates | 1,734 | 364 | 6,867 | Distribution of earnings from unconsolidated joint ventures | 1,734 | 364 | 6,867 | |||||||||||||||||
| Accounts payable | (13,507 | ) | 18,757 | 47,433 | Accounts payable | (13,507 | ) | 18,757 | 47,433 | |||||||||||||||
| Accrued expenses | 1,977 | 35,593 | 74,550 | Accrued expenses | 1,977 | 35,593 | 74,550 | |||||||||||||||||
| Billings in excess of costs on uncompleted contracts | (1,081 | ) | 24,782 | 14,525 | Billings in excess of costs on uncompleted contracts | (1,081 | ) | 24,782 | 14,525 | |||||||||||||||
| Other liabilities | 10,029 | 34,545 | (16,060 | ) | Other liabilities | 10,029 | 34,545 | (16,060 | ) | |||||||||||||||
| Income taxes receivable/payable | 11,372 | (30,036 | ) | 29,822 | Income taxes receivable/payable | 11,372 | (30,036 | ) | 29,822 | |||||||||||||||
| Change in deferred foreign currency translation adjustment | (5,350 | ) | (8,926 | ) | 6,445 | Change in deferred foreign currency translation adjustment | (5,350 | ) | (8,926 | ) | 6,445 | |||||||||||||
| Change in defined benefit minimum pension liability adjustment | 5,841 | (26,356 | ) | 17,492 | Change in defined benefit minimum pension liability adjustment | 5,841 | (26,356 | ) | 17,492 | |||||||||||||||
| Net cash provided by operating activities | 77,574 | 46,587 | 121,266 | Net cash provided by operating activities | 77,574 | 46,587 | 121,266 | |||||||||||||||||
| CASH FLOWS FROM INVESTING ACTIVITIES: | CASH FLOWS FROM INVESTING ACTIVITIES: | CASH FLOWS FROM INVESTING ACTIVITIES: | ||||||||||||||||||||||
| Payments for business acquisitions, net of cash acquired | (14,467 | ) | (158,894 | ) | (53,296 | ) | Payments for business acquisitions, net of cash acquired | (14,467 | ) | (158,894 | ) | (53,296 | ) | |||||||||||
| (Payments to) proceeds from investments, net | (10,515 | ) | 60,538 | — | (Payments to) proceeds from investments, net | (10,515 | ) | 60,538 | — | |||||||||||||||
| Deferred income tax on gain from the sale of a building | — | — | (6,494 | ) | Deferred income tax on gain from the sale of a building | — | — | (6,494 | ) | |||||||||||||||
| Net investment in unconsolidated affiliates | (1,023 | ) | (8,249 | ) | (1,026 | ) | Net investment in unconsolidated joint ventures | (1,023 | ) | (8,249 | ) | (1,026 | ) | |||||||||||
| Payments for capital expenditures | (18,926 | ) | (31,175 | ) | (32,300 | ) | Payments for capital expenditures | (18,926 | ) | (31,175 | ) | (32,300 | ) | |||||||||||
| Proceeds on sale of property and equipment | 603 | 785 | 21,301 | Proceeds on sale of property and equipment | 603 | 785 | 21,301 | |||||||||||||||||
| Net cash used in investing activities | (44,328 | ) | (136,995 | ) | (71,815 | ) | Net cash used in investing activities | (44,328 | ) | (136,995 | ) | (71,815 | ) | |||||||||||
| CASH FLOWS FROM FINANCING ACTIVITIES: | CASH FLOWS FROM FINANCING ACTIVITIES: | CASH FLOWS FROM FINANCING ACTIVITIES: | ||||||||||||||||||||||
| Proceeds from borrowings under credit agreements | — | 130,000 | 342,161 | Proceeds from borrowings under credit agreements | — | 130,000 | 342,161 | |||||||||||||||||
| Repayments of borrowings under credit and senior note agreements | (24,482 | ) | (9,106 | ) | (442,013 | ) | Repayments of borrowings under credit and senior note agreements | (24,482 | ) | (9,106 | ) | (442,013 | ) | |||||||||||
| Proceeds from issuance of common stock and preferred stock, net of notes receivable | 19,938 | 13,986 | 51,070 | Proceeds from issuance of common stock and preferred stock, net of notes receivable | 19,938 | 13,986 | 51,070 | |||||||||||||||||
| Proceeds from issuance of stock upon exercise of stock options | 3,908 | 4,914 | 5,754 | Proceeds from issuance of stock upon exercise of stock options | 3,908 | 4,914 | 5,754 | |||||||||||||||||
| Proceeds from issuance of common and preferred stock units | 6,479 | 23,071 | 11,108 | Proceeds from issuance of common and preferred stock units | 6,479 | 23,071 | 11,108 | |||||||||||||||||
| Payments to repurchase of former employees' common stock and common stock units | (44,373 | ) | (70,913 | ) | (58,560 | ) | Payments to repurchase of former employees' common stock and common stock units | (44,373 | ) | (70,913 | ) | (58,560 | ) | |||||||||||
| Payments to redeem stockholders' notes issued in acquisitions | (1,002 | ) | (2,625 | ) | (595 | ) | Payments to redeem stockholders' notes issued in acquisitions | (1,002 | ) | (2,625 | ) | (595 | ) | |||||||||||
| Proceeds from issuance of convertible preferred stock | — | — | 235,000 | Proceeds from issuance of convertible preferred stock | — | — | 235,000 | |||||||||||||||||
| Payments of issuance costs of convertible preferred stock | — | — | (2,880 | ) | Payments of issuance costs of convertible preferred stock | — | — | (2,880 | ) | |||||||||||||||
| Payments to redeem preferred stock | — | — | (116,486 | ) | Payments to redeem preferred stock | — | — | (116,486 | ) | |||||||||||||||
| Proceeds from terminating interest rate hedge | — | — | 1,139 | Proceeds from terminating interest rate hedge | — | — | 1,139 | |||||||||||||||||
| Payments of dividends on convertible preferred stock | (5,250 | ) | (5,250 | ) | (1,900 | ) | Payments of dividends on convertible preferred stock | (5,250 | ) | (5,250 | ) | (1,900 | ) | |||||||||||
| Net cash (used in) provided by financing activities | (44,782 | ) | 84,077 | 23,798 | Net cash (used in) provided by financing activities | (44,782 | ) | 84,077 | 23,798 | |||||||||||||||
| EFFECT OF EXCHANGE RATE CHANGES ON CASH | EFFECT OF EXCHANGE RATE CHANGES ON CASH | 2,318 | 196 | 269 | EFFECT OF EXCHANGE RATE CHANGES ON CASH | 2,318 | 196 | 269 | ||||||||||||||||
NET (DECREASE) INCREASE IN CASH AND CASH EQUIVALENTS | NET (DECREASE) INCREASE IN CASH AND CASH EQUIVALENTS | (9,218 | ) | (6,135 | ) | 73,518 | NET (DECREASE) INCREASE IN CASH AND CASH EQUIVALENTS | (9,218 | ) | (6,135 | ) | 73,518 | ||||||||||||
| CASH AND CASH EQUIVALENTS AT BEGINNING OF YEAR | CASH AND CASH EQUIVALENTS AT BEGINNING OF YEAR | 69,705 | 60,487 | 54,352 | CASH AND CASH EQUIVALENTS AT BEGINNING OF YEAR | 69,705 | 60,487 | 54,352 | ||||||||||||||||
| CASH AND CASH EQUIVALENTS AT END OF YEAR | CASH AND CASH EQUIVALENTS AT END OF YEAR | $ | 60,487 | $ | 54,352 | $ | 127,870 | CASH AND CASH EQUIVALENTS AT END OF YEAR | $ | 60,487 | $ | 54,352 | $ | 127,870 | ||||||||||
| SUPPLEMENTAL CASH FLOW INFORMATION: | SUPPLEMENTAL CASH FLOW INFORMATION: | SUPPLEMENTAL CASH FLOW INFORMATION: | ||||||||||||||||||||||
| Retirement of fully depreciated equipment (non-cash) | $ | 27,012 | $ | 11,554 | $ | 8,122 | Retirement of fully depreciated equipment (non-cash) | $ | 27,012 | $ | 11,554 | $ | 8,122 | |||||||||||
| Interest paid | $ | 9,192 | $ | 8,788 | $ | 14,584 | Interest paid | $ | 9,192 | $ | 8,788 | $ | 14,584 | |||||||||||
| Income taxes paid, net of refunds received | $ | 16,142 | $ | 20,182 | $ | 16,366 | Income taxes paid, net of refunds received | $ | 16,142 | $ | 20,182 | $ | 16,366 | |||||||||||
See accompanying Notes to Consolidated Financial Statements.
AECOM TECHNOLOGY CORPORATION
NOTES TO CONSOLIDATED FINANCIAL STATEMENTS
1. Significant Accounting Policies
Organization—AECOM Technology Corporation, or the Company, provides professional technical services to the United States government, state, local and non-U.S. governments and agencies and commercial customers. These services encompass a variety of technical disciplines, including consulting, planning, architecture, engineering, construction management, project management, asset management, environmental services and design-build services. These services are applied to a number of areas and industries, including transportation infrastructure; research, testing and defense facilities; water, wastewater and other environmental programs; land development; security and communication systems; institutional, mining, industrial and commercial and energy-related facilities. The Company also provides operations and maintenance services to governmental agencies throughout the United States and abroad.
Fiscal Year—The Company reports results of operations based on 52 or 53-week periods ending on the Friday nearest September 30. For clarity of presentation, all periods are presented as if the year ended on September 30. Fiscal years 2004, 2005 and 2006 contained 53, 52 and 52 weeks, respectively and ended on October 1, September 30 and September 29, respectively.
Use of Estimates—The preparation of financial statements in conformity with accounting principles generally accepted in the United States (GAAP), requires management to make estimates and assumptions that affect the reported amounts of assets and liabilities and disclosure of contingent assets and liabilities at the date of the financial statements and the reported amounts of revenuesrevenue and expenses during the reporting period. The more significant estimates affecting amounts reported in the consolidated financial statements relate to revenuesrevenue under long-term contracts and self-insurance accruals. Actual results could differ from those estimates.
Principles of Consolidation and Presentation—The consolidated financial statements include the accounts of all subsidiaries and material joint ventures in which the Company has control or is the primary beneficiary. All inter-company accounts have been eliminated in consolidation.
Investments in Unconsolidated Joint Ventures—The Company has non-controlling operational interests in joint ventures accounted for under the equity method. Services performed by the Company and billed to joint ventures with respect to work done by the Company for third-party customers are recorded as revenuesrevenue of the Company in the period in which such services are rendered. In certain joint ventures, a fee is added to the respective billings from the Company and the other joint venture partners on the amounts billed to the third- party customers. These fees result in earnings to the joint venture and are split with each of the joint venture partners and paid to the joint venture partners upon collection from the third-party customer. The Company records its allocated share of these fees as equity in earnings of joint ventures.
Variable Interest Entities—The Financial Accounting Standards Board (FASB) Financial Interpretation No. 46 (revised December 2003)"Consolidation of Variable Interest Entities," (FIN 46R) requires the primary beneficiary of a variable interest entity (VIE) among other things, to consolidate into its financial statements the financial results of the VIE and to make certain disclosures regarding the VIEs (unless the primary beneficiary also holds a majority voting interest). At September 30, 2006, the total assets and liabilities of VIEs where the Company was the primary beneficiary were
$34.0 million and $22.8 million, respectively, as compared to total assets of $88.7 million and total liabilities of $69.9 million at September 30, 2005.
Revenue Recognition and Costs—In the course of providing its services, the Company routinely subcontracts for services and incurs other direct costs on behalf of its clients. These costs are passed through to clients and are included in the Company's revenue when it is the Company's responsibility to procure or manage such costs. Because subcontractor services and other direct costs can change significantly from project to project and period to period, changes in revenue may not be indicative of business trends.
The Company's contract revenues arerevenue is determined using the percentage-of-completion method based generally on the ratio of direct labor dollars incurred to estimated total direct labor dollars at the completion of the contract. Recognition of revenue and profit under this revenue recognition method is dependent upon the accuracy of a variety of estimates, including engineering progress, materials quantities, the achievement of milestones, penalty provisions, labor productivity and cost estimates. Due to uncertainties inherent in the estimation progress, it is possible that actual completion costs may vary from estimates. If estimated total costs on contracts indicate a loss, the Company recognizes that estimated loss in the period the estimated loss first becomes known.
Cost-Plus Contracts. The Company enters into two major types of cost-plus contracts:
Cost-Plus Fixed Fee. Under cost-plus fixed fee contracts, the Company charges clients for its costs, including both direct and indirect costs, plus a fixed negotiated fee. The total estimated cost plus the fixed negotiated fee represents the total contract value. The Company recognizes revenue based on the actual labor and other direct costs incurred, plus the portion of the fixed fee it has earned to date.
Cost-Plus Fixed Rate. Under the Company's cost-plus fixed rate contracts, the Company charges clients for its direct and indirect costs based upon a negotiated rate. The Company recognizes revenue based on the actual total costs it has expended and the applicable fixed rate.
Certain cost-plus contracts provide for award fees or a penalty based on performance criteria in lieu of a fixed fee or fixed rate. Other contracts include a base fee component plus a performance-based award fee. In addition, the Company may share award fees with subcontractors. The Company records accruals for fee-sharing as fees are earned. The Company generally recognizes revenue to the extent of costs actually incurred plus a proportionate amount of the fee expected to be earned. The Company takes the award fee or penalty on contracts into consideration when estimating revenue and profit rates, and it records revenue related to the award fees when there is sufficient information to assess anticipated contract performance. On contracts that represent higher than normal risk or technical difficulty, the Company may defer all award fees until an award fee letter is received. Once an award letter is received, the estimated or accrued fees are adjusted to the actual award amount.
Certain cost-plus contracts provide for incentive fees based on performance against contractual milestones. The amount of the incentive fees varies, depending on whether the Company achieves above, at, or below target results. The Company originally recognizes revenue on these contracts based upon expected results. These estimates are revised when necessary based upon additional information that becomes available as the contract progresses.
Fixed-Price Contracts. The Company enters into fixed-price contracts:
Firm Fixed-Price. The Company's firm fixed-price contracts have historically accounted for most of its fixed-price contracts. Under firm fixed-price contracts, clients pay the Company an agreed amount negotiated in advance for a specified scope of work. The Company recognizes revenue on firm fixed-price contracts using the percentage-of-completion method described above. Prior to completion, recognized profit margins on any firm fixed-price contract depend on the accuracy of the Company's estimates and will increase to the extent that its actual costs are below the estimated amounts. Conversely, if the Company's costs exceed these estimates, its profit margins will decrease and the Company may realize a loss on a project.
Time-and-Materials Contracts. The Company enters into time-and-materials contracts:
Time-and-Materials Contracts. Under the Company's time-and-materials contracts, the Company negotiates hourly billing rates and charges its clients based on the actual time that it expends on a project. In addition, clients reimburse the Company for its actual out-of-pocket costs of materials and other direct incidental expenditures that it incurs in connection with its performance under the contract. The Company's profit margins on time-and-materials contracts fluctuate based on actual labor and overhead costs that it directly charges or allocates to contracts compared to negotiated billing rates. Many of the Company's time-and-materials contracts are subject to maximum contract values and, accordingly, revenue relating to these contracts is recognized as if these contracts were a fixed-price contract.
Service-Related Contracts. The Company enters into service-related contracts:
Service-Related Contracts. Service-related contracts, including operations and maintenance services and a variety of technical assistance services, are accounted for over the period of performance, in proportion to the costs of performance.
Contract Claims—In accordance with the American Institute of Certified Public Accountants Statement of Position No. 81-1,"Accounting for Performance of Construction-Type and Certain Production-Type Contracts," the Company records contract revenue related to claims only if it is probable that the claim will result in additional contract revenue and if the amount can be reliably estimated. If both criteria are met, the Company records revenue only to the extent that contract costs relating to the claim have been incurred. As of September 30, 2005 and September 30, 2006, the Company had no significant receivables related to contract claims.
Government Contract Matters—The Company's federal government and certain state and local agency contracts are subject to among other regulations, regulations issued under the Federal Acquisition Regulations (FAR). These regulations can limit the recovery of certain specified indirect costs on contracts and subjects the Company to multiple audits by government agencies such as the Defense Contract Audit Agency (DCAA). In addition, most of the Company's federal and state and local contracts are subject to termination at the discretion of the client.
Audits by the DCAA and other agencies consist of reviews of the Company's overhead rates, operating systems and cost proposals to ensure that the Company accounted for such costs in accordance with the Cost Accounting Standards of the FAR (CAS). If the DCAA determines the
Company has not accounted for such costs consistent with CAS, the DCAA may disallow these costs. Historically, the Company has not had any material cost disallowances by the DCAA as a result of audit. However, there can be no assurance that audits by the DCAA or other governmental agencies will not result in material cost disallowances in the future.
Cash and Cash Equivalents—The Company's cash equivalents include highly liquid investments which have an initial maturity of 90 days or less.
Allowance for Doubtful Accounts—The Company records its accounts receivable net of an allowance for doubtful accounts. This allowance for doubtful accounts is estimated based on management's evaluation of the contracts involved and the financial condition of its clients. The factors the Company considers in its contract evaluations include, but are not limited to:
Concentration of Credit Risk—Financial instruments, which subject the Company to credit risk, consist primarily of cash and cash equivalents and net accounts receivable. The Company places its temporary cash investments with high credit quality financial institutions. As of September 30, 2005 and September 30, 2006, no accounts receivable from a single commercial client exceeded 10% of the Company's total accounts receivable. The Company regularly performs credit evaluations of its clients and considers these evaluations in the determination of its allowance for doubtful accounts.
Fair Value of Financial Instruments—The carrying amounts of cash and cash equivalents, accounts receivable and accounts payable approximate fair value because of the short maturities of these instruments. The carrying amount of the revolving credit facility and loans under the Senior Executive Equity Investment Plan approximates fair value because the interest rates are based upon variable reference rates. The fair value of the senior secured notes as of September 30, 2005 and September 30, 2006 was not materially different than the carrying value.
Property and Equipment—Property and equipment are recorded at cost and are depreciated over their estimated useful lives using the straight-line method. Expenditures for maintenance and repairs are expensed as incurred. Typically, estimated useful lives range from three to ten years for equipment, furniture and fixtures. Leasehold improvements are amortized on a straight-line basis over the shorter of their estimated useful lives or the remaining terms of the underlying lease agreement.
Deferred Loan Costs—Deferred loan costs that relate to the Company's Amended and Restated Credit Agreement, Term Credit Agreement and the Senior Notes due 2008 and 2012 are being amortized over the terms of their respective agreements.
Long-lived Assets—Long-lived assets to be held and used are reviewed for impairment whenever events or circumstances indicate that the assets may be impaired. For assets to be held and used, impairment losses are recognized based upon the excess of the asset's carrying amount over the fair value of the asset. For long-lived assets to be disposed, impairment losses are recognized at the lower of the carrying amount or fair value less cost to sell.
Goodwill and Related Intangible Assets—Goodwill represents the excess amounts paid over the fair value of net assets acquired in mergers and acquisitions. In order to determine the amount of goodwill resulting from a merger or acquisition, the Company performs an assessment to determine the value of the acquired company's tangible and identifiable intangible assets and liabilities. In its assessment, the Company determines whether identifiable intangible assets exist, such as backlog and customer relationships, established workforce, patents, trademarks/trade names and other assets.
Statement of Financial Accounting Standards, or SFAS, No. 142, "Goodwill and Other Intangible Assets", requires that the Company perform an impairment test of its goodwill at least annually for each reporting unit of the Company. Reporting units for purposes of this test are consistent with the Company's reportable segments and consist of Professional Technical Services and Management Support Services. The impairment test is a two-step process. During the first step, the Company estimates the fair value of the reporting unit and compares that amount to the carrying value of that reporting unit's goodwill. In the event the fair value of the reporting unit is determined to be less than the carrying value, a second step is required. The second step requires the Company to perform a hypothetical purchase allocation to compare the current implied fair value of the goodwill to the current carrying value of the goodwill. In the event that the current fair value of the goodwill is less than the carrying value, an impairment charge is recognized. The Company performs this test annually in its fiscal fourth quarter.
Pension Plans—The Company has certain defined benefit pension plans. The Company calculates the market-related value of assets, which is used to determine the return-on-assets component of annual pension expense and the cumulative net unrecognized gain or loss subject to amortization. This calculation reflects the Company's anticipated long-term rate of return and amortization of the difference between the actual return (including capital, dividends, and interest) and the expected return over a five-year period. Cumulative net unrecognized gains or losses that exceed 10% of the greater of the projected benefit obligation or the market related value of plan assets are subject to amortization.
Insurance Reserves—The Company maintains insurance for business risks. Insurance coverage contains various retention and deductible amounts for which the Company provides accruals based upon reported claims and an actuarially determined estimated liability for certain claims incurred but not reported. For certain professional liability risks, the Company's retention amount under its claims-made insurance policies does not include an accrual for claims incurred but not reported due to the Company's inability to reliably estimate any potential liability including any potential legal expense to be incurred in defending the Company's position against such claims if they occur. The Company believes that its accruals for estimated liabilities associated with professional and other liabilities are sufficient and any excess liability beyond the accrual is not expected to have a material adverse effect on the Company's results of operations or financial position.
Foreign Currency Translation—Results of operations for foreign entities are translated to U.S. dollars using the average exchange rates during the period. Assets and liabilities for foreign entities are translated using the exchange rates in effect as of the date of the balance sheet. Resulting translation adjustments are recorded as a foreign currency translation adjustment into other comprehensive income/(loss) in stockholders' equity. The cumulative foreign currency translation adjustments at September 30, 2005 and 2006, was $(1.8) million and $9.4 million, respectively.
Accounting for Derivative Instruments and Hedging—SFAS No. 133,Accounting for Derivative Instruments and Hedging requires all derivatives to be stated on the balance sheet at fair value. Derivatives that are not hedges or are ineffective hedges must be adjusted to fair value through income. If the derivative is a hedge, depending on the nature of the hedge, changes in the fair value of derivatives will either be offset against the change in fair value of the hedged assets, liabilities, or firm commitments through income or recognized in other comprehensive income/(loss) until the hedged item is recognized in earnings. The Company's derivatives are recorded on the balance sheet at fair value and changes in the value of the derivatives are adjusted through income. As of September 30, 2006, the Company had no derivative instruments reflected on its balance sheet.
Selling, General and Administrative Expenses—Selling, general and administrative expenses are expensed in the period incurred.
Income Taxes—The Company files a consolidated federal income tax return and combined California franchise tax return. In addition, the Company files other returns that are required in the states and jurisdictions in which it does business, which includes the Company and its subsidiaries. The Company accounts for certain income and expense items differently for financial reporting and income tax purposes. Deferred tax assets and liabilities are determined based on the difference between the financial statement and tax basis of assets and liabilities, applying enacted statutory tax rates in effect for the year in which the differences are expected to reverse. In determining the need for a valuation allowance, management reviewed both positive and negative evidence, including current and historical results of operations, future income projections, and potential tax planning strategies. Based upon management's assessment of all available evidence, the Company has concluded that it is more likely than not that the deferred tax assets will be realized, net of valuation allowance.
Earnings Per Share—Basic earnings per share (EPS) excludes dilution and is computed by dividing the income available to common stock and common stock unit holders by the weighted average number of shares and units outstanding for the period. Diluted EPS is computed by dividing income available to common stock and common stock unit holders by the weighted average number of shares and units outstanding and the weighted average number of potential common shares. Potential common shares include the dilutive effects of outstanding stock options, stock match shares and units, preferred stock and warrants. The issuance of stock match shares and units is reflected in basic EPS on the last day of the fiscal quarter when the actual number of shares and units is determined based on the quarter-end price per share and in diluted EPS when the match is accrued based on the then current price per share.
Stock-Based Compensation—The Company's stock compensation plans including its employee stock option plan are accounted for in accordance with Accounting Principles Board Opinion No. 25,
"Accounting for Stock Issued to Employees" (APB 25) and related interpretations. Under APB 25, to the extent the exercise price equals or exceeds the market price of the underlying stock on the date of the grant, no compensation expense is recognized for options granted to employees.
Recently Issued Accounting Pronouncements—In September 2006, the Financial Accounting Standards Board, or FASB, issued SFAS No. 158,"Employers' Accounting for Defined Benefit Pension and Other Postretirement Plans" (SFAS 158). SFAS 158 requires employers to fully recognize the obligations associated with defined benefit pension plans in their financial statements. The Company will be required to recognize such obligations as of September 30, 2007. Additionally, the Company will be required to measure such obligations as of the end of its fiscal year, rather than up to three months earlier as had been previously permitted, effective in its fiscal year ending September 30, 2009. The Company is currently evaluating the impact of the provisions of SFAS 158 on its results of operations and financial position.
In September 2006, the FASB issued SFAS No. 157,"Fair Value Measurements" (SFAS 157). SFAS 157 defines fair value, establishes a framework for measuring fair value in accordance with GAAP, and expands disclosures about fair value measurements. The provisions of SFAS 157 are effective for the fiscal year ending September 30, 2009. The Company is currently evaluating the impact of the provisions of SFAS 157 on its results of operations and financial position.
In June 2006, the FASB issued FASB Interpretation FIN, No. 48, "Accounting for Uncertainty in Income Taxes—an Interpretation of FASB Statement No. 109" (FIN 48). FIN 48 clarifies the accounting for uncertainty in income taxes recognized in an entity's financial statements. FIN 48 prescribes that a company should use a more-likely-than-not recognition threshold based on the technical merits of the tax position taken. Additionally, FIN 48 provides guidance on recognition or de-recognition of interest and penalties, changes in judgment in interim periods, and disclosures of uncertain tax positions. FIN 48 becomes effective for the Company in fiscal year beginning October 1, 2007. The Company is in the process of determining the effect of the adoption of FIN 48 on its results of operations and financial position.
In May 2005, the FASB issued SFAS No. 154,"Accounting Changes and Error Corrections—a replacement of APB Opinion No. 20 and FASB Statement No. 3" (SFAS 154), which applies to all voluntary changes in accounting principle, as well as to changes required by an accounting pronouncement in the unusual instance that the pronouncement does not include specific transition provisions. APB Opinion No. 20 previously required that most voluntary changes in accounting principle be recognized in net income as a cumulative effect of changing to the new accounting principle. SFAS 154 now requires retrospective application to prior periods' financial statements for changes in accounting principle, unless it is impracticable to do so. SFAS 154 becomes effective for the Company in fiscal year beginning October 1, 2007. The Company does not currently anticipate any voluntary changes in accounting principle or errors that would require such retroactive application.
In December 2004, the FASB issued its final SFAS on accounting for share-based payments (SBPs) SFAS No. 123 (revised 2004), "Share-Based Payments" (SFAS 123R) that requires the Company to expense the value of employee stock options and similar awards. Under SFAS 123R, SBP awards result in a cost that will be measured at fair value on the awards' grant date, based on the estimated number of awards that are expected to vest. Compensation expense for awards that vest would not be reversed if the awards expire without being exercised. SFAS 123R becomes effective for the Company in its
fiscal year beginning October 1, 2006. Upon adoption of SFAS 123R, the Company will adopt the prospective transition method. Under this method, prior periods will not be restated to reflect the impact of SFAS 123R. To the extent that the Company issues stock options after October 1, 2006, results of operations will be negatively impacted.
2. Mergers and Acquisitions
In fiscal year 2004, the Company consummated the following two strategic merger and acquisition transactions:
The aggregate value of all consideration for the fiscal 2004 mergers and acquisitions was approximately $35.5 million.
In fiscal year 2005, the Company consummated seven merger and acquisition transactions, the largest of which was:
Tiger Acquisition Corp. In September 2005, the Company acquired 100% of the capital stock of Tiger Acquisition Corp., parent company of ENSR International, a U.S.-based professional technical services firm and a leader in the environmental management market. The consideration was valued at $135.0 million and consisted of cash.
In addition, in fiscal year 2005, the Company consummated other strategic merger and acquisition transactions including the following:
Further, in fiscal year 2005, small niche acquisitions included JWD Group, a California-based professional technical services firm, Entranco, Inc. a Washington-based professional technical services firm and JF Thompson, a Texas-based professional technical services firm.
The aggregate value of all consideration for the fiscal 2005 mergers and acquisitions was approximately $176.7 million.
In fiscal year 2006, the Company consummated four merger and acquisition transactions, the largest of which was:
EDAW, Inc. (EDAW). In December 2005, the Company acquired 100% of the capital stock of EDAW, a San-Francisco based professional technical services firm which specializes in global urban development and planning projects. The consideration was valued at $70.0 million and consisted of cash and Company common stock and is subject to a purchase allocation adjustment based upon the final determination of its tangible and intangible net asset value as of the date of acquisition.
In addition, in fiscal year 2006 the Company consummated the following strategic merger and acquisition transaction:
Cansult Limited (Cansult). In September 2006, the Company, through its wholly-owned subsidiary AECOM CM Holding Corporation, acquired 100% of the capital stock of Cansult, a Toronto, Canada-based professional technical services firm that is a market leader in the infrastructure development in the UAE. The consideration consisted of cash and is subject to a purchase allocation adjustment based upon the final determination of its tangible and intangible net asset value as of the date of acquisition. Simultaneous with the transaction, the Company made a capital contribution into Cansult. The proceeds of this capital contribution were primarily used to fund the payment of certain employment- related liabilities. Subsequent to the transaction, Cansult was combined with certain of the Company's Middle Eastern subsidiaries to form the operating company Cansult Maunsell.
Further, in fiscal year 2006, small niche acquisitions included Pittndrigh, Shinkfield and Bruce, a Sydney, Australia based professional technical services firm and City Planning Consultants Limited, a Hong-Kong, China-based professional technical services firm.
The aggregate value of all consideration for the fiscal 2006 mergers and acquisitions was approximately $89.5 million.
The following table summarizes the estimated fair values, in thousands, of the assets acquired and liabilities assumed as of the dates of the acquisitions:
| | Fiscal Year Ended | |||||||
|---|---|---|---|---|---|---|---|---|
| | September 30, 2005 | September 30, 2006 | ||||||
| Current assets | $ | 99,158 | $ | 91,064 | ||||
| Property and equipment | 10,175 | 7,062 | ||||||
| Other non-current assets | 7,284 | 931 | ||||||
| Goodwill | 101,628 | 55,643 | ||||||
| Other intangible assets | 20,290 | 9,600 | ||||||
| Current liabilities | (59,529 | ) | (72,824 | ) | ||||
| Other non-current liabilities | (2,319 | ) | (1,982 | ) | ||||
| Net assets acquired | $ | 176,687 | $ | 89,494 | ||||
All of the acquisitions above were accounted for under the purchase method of accounting. As such, the purchase consideration of each acquired company was allocated to acquired tangible and intangible assets and liabilities based upon their fair values. The excess of the purchase consideration over the fair value of the net tangible and identifiable intangible assets acquired was recorded as goodwill and is included in the accompanying consolidated balance sheets. The results of operations of each of the companies acquired have been included in the Company's financial statements from the dates of acquisition.
The table below presents summarized unaudited pro forma operating results assuming that the Company had acquired UMA, ENSR, EDAW and Cansult at the beginning of the fiscal years immediately preceding each acquisition (the beginning of fiscal year 2004, 2004, 2005 and 2006, respectively) presented (in thousands, except per share data-unaudited):
| | | Fiscal Year Ended | | Fiscal Year Ended | ||||||||||||||||
|---|---|---|---|---|---|---|---|---|---|---|---|---|---|---|---|---|---|---|---|---|
| | | September 30, 2004 | September 30, 2005 | September 30, 2006 | | September 30, 2004 | September 30, 2005 | September 30, 2006 | ||||||||||||
| Revenue | Revenue | $ | 2,254,285 | $ | 2,769,800 | $ | 3,508,587 | Revenue | $ | 2,254,285 | $ | 2,769,800 | $ | 3,508,587 | ||||||
| Income from operations | Income from operations | $ | 83,064 | $ | 96,756 | $ | 119,729 | Income from operations | $ | 83,064 | $ | 96,756 | $ | 119,729 | ||||||
| Net income available for common stockholders | Net income available for common stockholders | $ | 43,300 | $ | 49,755 | $ | 60,478 | Net income available for common stockholders | $ | 43,300 | $ | 49,755 | $ | 60,478 | ||||||
Earnings per share: | Earnings per share: | Earnings per share: | ||||||||||||||||||
| Basic | $ | 1.61 | $ | 1.81 | $ | 2.18 | Basic | $ | 0.81 | $ | 0.91 | $ | 1.09 | |||||||
| Diluted | $ | 1.49 | $ | 1.65 | $ | 1.71 | Diluted | $ | 0.74 | $ | 0.82 | $ | 0.86 | |||||||
Weighted average shares outstanding: | Weighted average shares outstanding: | Weighted average shares outstanding: | ||||||||||||||||||
| Basic | 26,890 | 27,476 | 27,694 | Basic | 53,780 | 54,952 | 55,388 | |||||||||||||
| Diluted | 32,717 | 33,525 | 36,598 | Diluted | 65,434 | 67,050 | 73,196 | |||||||||||||
3. Goodwill and Other Intangible Assets
Effective October 1, 2001, the Company adopted SFAS No. 142, "Goodwill and Other Intangible Assets." This statement changed the accounting method for goodwill and indefinite-lived intangible assets from an amortization approach to an impairment-only approach. The Company did not record a
transitional goodwill impairment charge nor has it incurred any goodwill impairment charges since its adoption of this standard.
The changes in the carrying value of goodwill by segment for the fiscal years ended September 30, 2005 and September 30, 2006 were as follows:
| | Fiscal Year 2005 | ||||||||||||
|---|---|---|---|---|---|---|---|---|---|---|---|---|---|
| | September 30, 2004 | Goodwill Additions | Post- Acquisition Adjustments | September 30, 2005 | |||||||||
| | (in thousands) | ||||||||||||
| Reporting Unit: | |||||||||||||
| Professional Technical Services | $ | 284,411 | $ | 88,958 | $ | 21,761 | $ | 395,130 | |||||
| Management Support Services | 8,933 | — | — | 8,933 | |||||||||
| Total | $ | 293,344 | $ | 88,958 | $ | 21,761 | $ | 404,063 | |||||
| | Fiscal Year 2006 | ||||||||||||
|---|---|---|---|---|---|---|---|---|---|---|---|---|---|
| | September 30, 2005 | Goodwill Additions | Post- Acquisition Adjustments | September 30, 2006 | |||||||||
| | (in thousands) | ||||||||||||
| Reporting Unit: | |||||||||||||
| Professional Technical Services | $ | 395,130 | $ | 61,273 | $ | 1,172 | $ | 457,575 | |||||
| Management Support Services | 8,933 | — | — | 8,933 | |||||||||
| Total | $ | 404,063 | $ | 61,273 | $ | 1,172 | $ | 466,508 | |||||
The gross amounts and accumulated amortization of the Company's acquired identifiable intangible assets with finite useful lives as of September 30, 2005 and September 30, 2006, included in Intangible and other assets—net in the accompanying Consolidated Balance Sheets, were as follows:
| | September 30, 2005 | September 30, 2006 | |||||||||||
|---|---|---|---|---|---|---|---|---|---|---|---|---|---|
| Identifiable Intangible Assets: | Gross Amount | Accumulated Amortization | Gross Amount | Accumulated Amortization | |||||||||
| | (in thousands) | ||||||||||||
| Backlog | $ | 8,052 | $ | 2,348 | $ | 16,687 | $ | 15,254 | |||||
| Customer relationships | 22,313 | 619 | 18,179 | 2,180 | |||||||||
| Trademarks/Trade-names | 4,900 | 82 | 899 | 163 | |||||||||
| Total | $ | 35,265 | $ | 3,049 | $ | 35,765 | $ | 17,597 | |||||
Identifiable intangible assets acquired during the fiscal years ended September 30, 2005 and September 30, 2006 consisted of the following amounts, in thousands, with the following weighted average amortization periods:
| | September 30, 2005 | September 30, 2006 | |||||||||
|---|---|---|---|---|---|---|---|---|---|---|---|
| Identifiable Intangible Assets: | Value Ascribed | Weighted Average Life | Value Ascribed | Weighted Average Life | |||||||
| Backlog | $ | 9,283 | 1.1 years | $ | 5,485 | 0.9 years | |||||
| Customer relationships | 10,407 | 10.0 years | 3,816 | 10.0 years | |||||||
| Trademarks/Trade-names | 600 | 5.0 years | 299 | 5.0 years | |||||||
| Total | $ | 20,290 | 5.8 years | $ | 9,600 | 4.7 years | |||||
At the time of acquisition, the Company estimates the amount of the identifiable intangible assets acquired based upon historical valuations and the facts and circumstances available at the time. The Company concludes the value of identifiable intangible assets during the purchase allocation period. This period may cross into the next fiscal year. For the years ended September 30, 2005 and September 30, 2006, the Company's amortization expense for acquired intangible assets with finite useful lives was $3.0 million and $14.5 million, respectively.respectively which is included in general and administrative expense. The following table presents, in thousands, estimated future amortization expense for acquired intangibles:
| 2007 | $ | 2,969 | |
| 2008 | 2,459 | ||
| 2009 | 1,998 | ||
| 2010 | 1,988 | ||
| 2011 | 1,844 | ||
| Thereafter | 6,910 | ||
| Total | $ | 18,168 | |
The goodwill and other identifiable intangible assets created in the acquisitions are amortizable for tax purposes relative to the Austin and Entranco acquisitions. The goodwill and other identifiable intangibles created in the acquisitions, relative to the remaining acquisitions, are not amortizable for tax purposes.
4. Accounts Receivable—Net
Net accounts receivable consisted of the following as of September 30, 2005 and September 30, 2006:
| | Fiscal Year Ended | |||||||
|---|---|---|---|---|---|---|---|---|
| | September 30, 2005 | September 30, 2006 | ||||||
| | (in thousands) | |||||||
| Billed | $ | 408,337 | $ | 543,606 | ||||
| Unbilled | 291,495 | 372,034 | ||||||
| Contract retentions | 31,096 | 38,921 | ||||||
| Total accounts receivable—gross | 730,928 | 954,561 | ||||||
Allowance for doubtful accounts | (27,091 | ) | (41,383 | ) | ||||
| Total accounts receivable—net | $ | 703,837 | $ | 913,178 | ||||
| Billings in excess of costs on uncompleted contracts | $ | 122,825 | $ | 143,283 | ||||
Billed accounts receivable represent amounts invoiced to clients that have yet to be collected. Contract retentions represent amounts invoiced to clients; however payment has been withheld pending the completion of certain milestones, other contractual conditions or upon the completion of the project. These retention agreements vary from project to project and could be outstanding several months or years. Unbilled accounts receivable represents revenue recognized but not yet invoiced to the client due to contract terms or the timing of accounting invoicing cycles. Substantially all unbilled receivables as of September 30, 2006 are expected to be billed and collected within twelve months.
Other than U.S. government, no single client accounted for more than 10% of the Company's outstanding receivables at September 30, 2005 and September 30, 2006.
5. Off Balance Sheet Risk and Concentration of Credit Risk
Financial instruments which potentially subject the Company to concentrations of credit risk consist principally of temporary cash investments and trade receivables. The Company's cash balances and short-term investments are maintained in accounts held by major banks and financial institutions located primarily in the United States, Europe, Australia, New Zealand and Hong Kong. In the U.S., the Company invests its excess cash through a major bank in commercial paper of companies with strong credit ratings and in a variety of industries, and through a large financial asset manager in various marketable debt securities. These securities typically mature within 30 days and, therefore, bear minimal risk. If the Company extends a significant portion of its credit to clients in a specific geographic area or industry, the Company may experience disproportionately high levels of default if those clients are adversely affected by factors particular to their geographic area or industry. Concentrations of credit risk with respect to trade receivables are limited due to the large number of customers comprising the Company's customer base, including, in large part, governments, government agencies and quasi-government organizations, and their dispersion across many different industries and geographies. In fiscal year 2006, foreign revenuesrevenue represented approximately 27.0% of the Company's total revenues.revenue. In order to mitigate credit risk, the Company continually reviews the credit worthiness of its major private clients
6. Income Taxes
Income tax expense for fiscal years 2004, 2005 and 2006 consisted of the following:
| | Fiscal Year Ended | |||||||||||
|---|---|---|---|---|---|---|---|---|---|---|---|---|
| | September 30, 2004 | September 30, 2005 | September 30, 2006 | |||||||||
| | (in thousands) | |||||||||||
| Current: | ||||||||||||
| Federal | $ | 9,547 | $ | 3,399 | $ | 19,135 | ||||||
| State | 3,078 | 3,219 | 5,916 | |||||||||
| Foreign | 6,585 | 9,268 | 12,308 | |||||||||
| Total current income tax expense | 19,210 | 15,886 | 37,359 | |||||||||
| Deferred: | ||||||||||||
| Federal | 3,541 | 13,223 | (10,388 | ) | ||||||||
| State | 3,233 | (130 | ) | (3,165 | ) | |||||||
| Foreign | — | — | 1,417 | |||||||||
| Total deferred income tax expense/(benefit) | 6,774 | 13,093 | (12,136 | ) | ||||||||
| �� | Total income tax expense | $ | 25,984 | $ | 28,979 | $ | 25,223 | |||||
Temporary differences comprising the net deferred income tax asset (liability) shown on the accompanying consolidated balance sheets were as follows:
| | Fiscal Year Ended | ||||||||
|---|---|---|---|---|---|---|---|---|---|
| | September 30, 2005 | September 30, 2006 | |||||||
| | (in thousands) | ||||||||
| Deferred Tax Asset: | |||||||||
| Compensation and benefit accruals not currently deductible | $ | 64,025 | $ | 94,124 | |||||
| Gain on the disposal of assets | — | 6,892 | |||||||
| Net operating loss carryover | 40,996 | 44,854 | |||||||
| Self insurance reserves | 14,398 | 22,511 | |||||||
| R&D tax credit carryover | 24,906 | 7,680 | |||||||
| Pension liability | 30,896 | 23,918 | |||||||
| Foreign tax attributes | 1,997 | 1,817 | |||||||
| Accrued liabilities | 7,929 | 12,816 | |||||||
| Foreign and other tax credits | 391 | 256 | |||||||
| Investments in joint ventures/non-controlled subsidiaries | 540 | 554 | |||||||
| Other | — | 156 | |||||||
| Total deferred tax asset | 186,078 | 215,578 | |||||||
| Deferred Tax Liability: | |||||||||
| Unearned revenue | (50,490 | ) | (75,388 | ) | |||||
| Depreciation and amortization | (13,266 | ) | (18,842 | ) | |||||
| Acquired intangible assets | (12,835 | ) | — | ||||||
| State taxes | (130 | ) | (4,611 | ) | |||||
| Other | (187 | ) | — | ||||||
| Total deferred tax liability | (76,908 | ) | (98,841 | ) | |||||
| Valuation allowance | (57,180 | ) | (31,112 | ) | |||||
| Net deferred tax asset | $ | 51,990 | $ | 85,625 | |||||
As of September 30, 2006, the Company had state research & development (R&D) credit carry-forwards for income tax purposes of approximately $7.7 million, which will begin to expire in 2020, Federal net operating loss carry-forwards of approximately $103.8 million and state net operating loss carry-forwards of approximately $123.9 million, both of which will begin to expire in 2007. Under the Tax Reform Act of 1986, Federal and California tax credits may be subject to a future annual limitation on their usage if the Company has an ownership change as defined in the Internal Revenue Code, or IRC.
As of September 30, 2006, the deferred tax asset was $215.6 million. The Company has recorded a valuation allowance of approximately $31.1 million related to state R&D tax credits, net operating loss carryovers and foreign tax attributes. The Company has performed the required assessment of positive and negative evidence regarding the realization of the net deferred tax asset in accordance with SFAS No. 109,"Accounting for Income Taxes." This assessment included the evaluation of scheduled reversals of deferred tax liabilities, the availability of carry-forwards and estimates of projected future
taxable income. Although realization is not assured, based on the Company's assessment, the Company has concluded that it is more likely than not that the remaining asset of $184.5 million will be realized and, as such, no additional valuation allowance has been provided.
Total income tax expense was different than the amount computed by applying the Federal statutory rate as follows:
| | Fiscal Year Ended | ||||||||||||||||
|---|---|---|---|---|---|---|---|---|---|---|---|---|---|---|---|---|---|
| | September 30, 2004 | September 30, 2005 | September 30, 2006 | ||||||||||||||
| | Amount | % | Amount | % | Amount | % | |||||||||||
| | ($ in thousands) | ||||||||||||||||
| Tax at federal statutory rate | $ | 26,747 | 35 | % | $ | 28,977 | 35 | % | $ | 27,619 | 35 | % | |||||
| Tax credits | (759 | ) | (1 | )% | — | — | % | — | — | % | |||||||
| State taxes, net of Federal benefit | 3,078 | 4 | % | 3,219 | 4 | % | 1,788 | 2 | % | ||||||||
| Foreign income tax | (4,597 | ) | (6 | )% | (5,528 | ) | (7 | )% | (2,498 | ) | (3 | )% | |||||
| Foreign tax attributes | 1,450 | 2 | % | — | — | % | — | — | % | ||||||||
| Section 965 dividend | — | — | % | — | — | % | 2,495 | 3 | % | ||||||||
| Disallowance of meals & entertainment expense | 774 | 1 | % | 827 | 1 | % | 770 | 1 | % | ||||||||
| Other permanent differences | 740 | 1 | % | 1,484 | 2 | % | (1,105 | ) | (1 | )% | |||||||
| Valuation allowance | (1,449 | ) | (2 | )% | — | — | % | (3,846 | ) | (5 | )% | ||||||
| Total income tax expense | $ | 25,984 | 34 | % | $ | 28,979 | 35 | % | $ | 25,223 | 32 | % | |||||
The Company's income tax returns are regularly audited and reviewed by the Internal Revenue Service (IRS) and state taxing authorities. During the fourth quarter of 2006, the IRS completed an examination and its Joint Committee review for fiscal years 1996 through 2004. The major issue raised by the IRS related to R&D tax credits recognized during fiscal years 2000 through 2004. The amount of R&D tax credits recognized for financial statement purposes represented the amount that the Company estimated would be ultimately realized. However, with the completion of the examination and review, the Company has determined that the amount of R&D tax credits to which the Company is entitled to is more than the estimated realizable amount. Consequently, the Company has recognized a decrease in the valuation allowance for the Federal R&D tax credits of $3.8 million.
The Company has not provided for U.S. taxes or foreign withholding taxes on approximately $71.8 million of undistributed earnings from non-U.S. subsidiaries because such earnings are intended to be reinvested indefinitely. If these earnings were distributed, foreign tax credits may become available under current law to reduce the resulting U.S. income tax liability.
During October 2004, The American Jobs Creation Act of 2004 (the Act) was signed into law, adding Section 965 to the IRC. Section 965 of the IRC provides a special one-time deduction of 85.0% of certain foreign earnings that are repatriated under a domestic reinvestment plan, as defined therein. The effective Federal tax rate on any qualified repatriated foreign earnings under Section 965 equals 5.25%. The Company could elect to apply this provision to a qualified earnings repatriation made during its fiscal year 2006. During the fourth quarter of 2006, the Company and its Board of Directors approved a plan to repatriate approximately $67.0 million in previously un-remitted foreign earnings under the Act, which were remitted in the Company's fourth quarter of 2006. Of the $67.0 million of earnings repatriated from its foreign subsidiaries, approximately $61.7 million qualifies for the 85.0%
dividends received deduction under Section 965. A tax provision of approximately $2.5 million for the repatriation of certain foreign earnings has been recorded as income tax expense for year ended September 30, 2006.
7. Investments in Unconsolidated Joint Ventures
The Company's unconsolidated joint ventures provide architecture, engineering, program management, construction management and operations and maintenance services. Joint ventures, the combination of two or more partners, are generally formed for a specific project. Management of the joint venture is typically controlled by a joint venture executive committee, comprised of a representative from each joint venture partner with equal voting rights, irrespective of the ownership percentage. The ownership percentage is typically representative of the work to be performed or the amount of risk assumed by each joint venture partner. The executive committee provides management oversight and assigns work efforts to the joint venture partners.
The majority of the Company's unconsolidated joint ventures have no employees and minimal operating expenses. For these joint ventures, the Company's own employees perform work for the joint venture, which is then billed to a third-party customer by the joint venture. These joint ventures function as pass through entities to bill the third-party customer. The Company includes the services performed for these joint ventures, and the costs associated with these services, in the Company's results of operations. In certain joint ventures where a fee is added by the joint venture to client billings, the Company's portion of that fee is recorded in equity in earnings of joint ventures.
The Company also has unconsolidated joint ventures that have their own employees and operating expenses and to which the Company generally makes a capital contribution. These joint ventures generally provide operations and maintenance services for governmental facilities. The Company accounts for these joint ventures using the equity method.
Summary financial information on the unconsolidated joint ventures is as follows:
| | | Fiscal Year Ended | | Fiscal Year Ended | ||||||||||||||||||||
|---|---|---|---|---|---|---|---|---|---|---|---|---|---|---|---|---|---|---|---|---|---|---|---|---|
| | | September 30, 2004 | September 30, 2005 | September 30, 2006 | | September 30, 2004 | September 30, 2005 | September 30, 2006 | ||||||||||||||||
| | | (in thousands) | | (in thousands) | ||||||||||||||||||||
| Financial position: | Financial position: | Financial position: | ||||||||||||||||||||||
| Current assets | $ | 23,271 | $ | 82,566 | $ | 149,547 | Current assets | $ | 23,271 | $ | 82,566 | $ | 149,547 | |||||||||||
| Current liabilities | (17,787 | ) | (44,864 | ) | (105,767 | ) | Current liabilities | (17,787 | ) | (44,864 | ) | (105,767 | ) | |||||||||||
| Working capital | 5,484 | 37,702 | 43,780 | Working capital | 5,484 | 37,702 | 43,780 | |||||||||||||||||
| Non-current assets | 5,466 | 6,632 | 9,794 | Non-current assets | 5,466 | 6,632 | 9,794 | |||||||||||||||||
| Non-current liabilities | (214 | ) | (1,384 | ) | (3,047 | ) | Non-current liabilities | (214 | ) | (1,384 | ) | (3,047 | ) | |||||||||||
| Joint ventures' equity | $ | 10,736 | $ | 42,950 | $ | 50,527 | Joint ventures' equity | $ | 10,736 | $ | 42,950 | $ | 50,527 | |||||||||||
| Amount recorded as investment in joint ventures | Amount recorded as investment in joint ventures | $ | 8,993 | $ | 19,230 | $ | 19,943 | Amount recorded as investment in joint ventures | $ | 8,993 | $ | 19,230 | $ | 19,943 | ||||||||||
Joint Ventures' | Joint Ventures' | Joint Ventures' | ||||||||||||||||||||||
| Total revenues | $ | 421,536 | $ | 508,007 | $ | 966,938 | Total revenue | $ | 421,536 | $ | 508,007 | $ | 966,938 | |||||||||||
| Cost of revenues | 414,576 | 495,794 | 947,415 | Cost of revenue | 414,576 | 495,794 | 947,415 | |||||||||||||||||
| Net income | $ | 6,960 | $ | 12,213 | $ | 19,523 | Net income | $ | 6,960 | $ | 12,213 | $ | 19,523 | |||||||||||
| Equity in earnings of joint ventures | Equity in earnings of joint ventures | $ | 2,517 | $ | 2,352 | $ | 6,554 | Equity in earnings of joint ventures | $ | 2,517 | $ | 2,352 | $ | 6,554 | ||||||||||
8. Property and Equipment
Property and equipment, at cost, consists of the following:
| | Fiscal Year Ended | ||||||
|---|---|---|---|---|---|---|---|
| | September 30, 2005 | September 30, 2006 | |||||
| | (in thousands) | ||||||
| Land | $ | 1,354 | $ | — | |||
| Buildings | 11,029 | — | |||||
| Leasehold improvements | 23,685 | 31,539 | |||||
| Computer systems and equipment | 55,743 | 72,359 | |||||
| Furniture and fixtures | 14,095 | 10,923 | |||||
| Automobiles | 1,987 | 1,919 | |||||
| Total | 107,893 | 116,740 | |||||
| Accumulated depreciation and amortization | (28,365 | ) | (26,417 | ) | |||
| Property and equipment, net | $ | 79,528 | $ | 90,323 | |||
Depreciation expense for the fiscal years ended September 30, 2005 and September 30, 2006 was $16.3 million and $24.2 million, respectively. Amortization expense of capitalized software costs for fiscal years ended September 30, 2005 and September 30, 2006 was $2.3 million and $3.9 million, respectively. The unamortized capitalized software costs at September 30, 2005 and September 30, 2006 were $19.9 million and $21.5 million, respectively. During the fiscal years ended September 30, 2005
and September 30, 2006, the Company retired $11.6 million and $8.1 million, respectively, of fully depreciated equipment.
Depreciation and amortization are provided using primarily the straight-line method over the estimated useful lives of the assets, or, in the case of leasehold improvements and capitalized leases, the lesser of the remaining life of the lease or its estimated useful life. Estimated useful lives for the building was 20 years and ranges from two to 12 years for leasehold improvements, three to seven years for machinery and equipment, five to 10 years for furniture and fixtures and three to 10 years for automobiles and trucks.
9. Employee Benefit Plans
Pension Plan—In the United States, the Company sponsors a Defined Benefit Pension Plan (the Pension Plan) which covers substantially all permanent employees hired as of March 1, 1998, is subject to eligibility and vesting requirements, and required contributions from participating employees through March 31, 1998. Benefits under this plan generally are based on the employee's years of creditable service and compensation. Effective April 1, 2004, the Company set a maximum on the amount of compensation used to determine pension benefits based on the highest calendar year of compensation earned in the 10 completed calendar years from 1994 through 2003, or the relevant IRS annual compensation limit, currently $200,000, whichever is lower.
Effective April 1, 1998, the Company adopted a new Floor Offset Defined Contribution Pension Plan (the 401k Pension Plan) to replace the Pension Plan. The 401(k) Pension Plan accepts pre-tax and after-tax contributions from participants in amounts up to 1.5% of compensation, which are then matched dollar for dollar by the Company, and are invested in the Defined Contribution 401 (k) account. Company matches become vested five years after participant's date of hire. The benefits of participants who were enrolled in the Pension Plan as of March 1, 1998, are grandfathered: i.e., upon retirement, the participant will receive the balance in the participant's Defined Contribution Account and, in addition, the Pension Plan will pay the participant a benefit actuarially based on the difference between the benefit calculated under the Pension Plan and the balance that the participant will have in his or her Defined Contribution Account, if the participant contributes 1.5% from April 1, 1998, until the participant's retirement, and, if the Defined Contribution Account remains invested in the Retirement Benchmark Fund. In the event that a participant elects to contribute less than 1.5% or moves the participant's Defined Contribution Account out of the Retirement Benchmark Fund prior to retirement, the Pension Plan will pay the participant a differential, wherein the total benefit may be more or less than the benefit provided for under the Pension Plan depending on the amount of the participant's contributions and the performance of the participant's self-directed investment. In the case of highly compensated employees, in order to comply with IRS requirements, some, or all, of this differential may be paid by the Company rather than by the Pension Plan. Employees who were not participants in the Pension Plan as of March 1, 1998, will be entitled to receive only the vested balance in their Defined Contribution Account. Outside the United States, the Company sponsors various pension plans which are appropriate to the country in which the Company operates, some of which are government mandated.
The following tables provide reconciliations of the changes in the total Company's, U.S.' and non-U.S.' plans' benefit obligations and reconciliations of the changes in the fair value of assets for the years ending September 30, 2004, 2005, and 2006, and reconciliations of the funded status as of September 30 of each year.
| | Fiscal Year Ended | ||||||||||
|---|---|---|---|---|---|---|---|---|---|---|---|
| | September 30, 2004 | September 30, 2005 | September 30, 2006 | ||||||||
| | (in thousands) | ||||||||||
| Total Company | |||||||||||
| Change in Benefit Obligation: | |||||||||||
Benefit obligation at beginning of year | $ | 300,499 | $ | 324,687 | $ | 432,896 | |||||
| Service cost | 8,283 | 7,722 | 8,325 | ||||||||
| Participant contributions | 3,081 | 3,706 | 2,980 | ||||||||
| Interest cost | 16,697 | 19,989 | 21,959 | ||||||||
| Plan amendments | (16,968 | ) | — | 424 | |||||||
| Benefits paid | (9,525 | ) | (12,599 | ) | (14,752 | ) | |||||
| Actuarial (gain) loss | 7,549 | 56,005 | (24,569 | ) | |||||||
| Acquisitions | — | 38,452 | (277 | ) | |||||||
| Foreign currency translation loss (gain) | 15,071 | (5,066 | ) | 17,760 | |||||||
| Benefit obligation at end of year | $ | 324,687 | $ | 432,896 | $ | 444,746 | |||||
| U.S. Plans | |||||||||||
| Change in Benefit Obligation: | |||||||||||
Benefit obligation at beginning of year | $ | 115,712 | $ | 110,164 | $ | 130,109 | |||||
| Service cost | 3,624 | 2,987 | 3,060 | ||||||||
| Participant contributions | 444 | 406 | 243 | ||||||||
| Interest cost | 6,534 | 6,710 | 6,711 | ||||||||
| Plan amendments | (8,665 | ) | — | 424 | |||||||
| Benefits paid | (5,255 | ) | (6,025 | ) | (7,526 | ) | |||||
| Actuarial (gain) loss | (2,230 | ) | 15,867 | (10,042 | ) | ||||||
| Acquisitions | — | — | — | ||||||||
| Foreign currency translation loss (gain) | — | — | — | ||||||||
| Benefit obligation at end of year | $ | 110,164 | $ | 130,109 | $ | 122,979 | |||||
| Non-U.S. Plans | |||||||||||
| Change in Benefit Obligation: | |||||||||||
Benefit obligation at beginning of year | $ | 184,787 | $ | 214,523 | $ | 302,787 | |||||
| Service cost | 4,659 | 4,735 | 5,265 | ||||||||
| Participant contributions | 2,637 | 3,300 | 2,737 | ||||||||
| Interest cost | 10,163 | 13,279 | 15,248 | ||||||||
| Plan amendments | (8,303 | ) | — | — | |||||||
| Benefits paid | (4,270 | ) | (6,574 | ) | (7,226 | ) | |||||
| Actuarial (gain) loss | 9,779 | 40,138 | (14,527 | ) | |||||||
| Acquisitions | — | 38,452 | (277 | ) | |||||||
| Foreign currency translation loss (gain) | 15,071 | (5,066 | ) | 17,760 | |||||||
| Benefit obligation at end of year | $ | 214,523 | $ | 302,787 | $ | 321,767 | |||||
| | Fiscal Year Ended | ||||||||||
|---|---|---|---|---|---|---|---|---|---|---|---|
| | September 30, 2004 | September 30, 2005 | September 30, 2006 | ||||||||
| | (in thousands) | ||||||||||
| Total Company | |||||||||||
| Change in Plan Assets: | |||||||||||
Fair value of plan assets at beginning of year | $ | 172,055 | $ | 215,246 | $ | 278,703 | |||||
| Actual return on plan assets | 26,726 | 26,101 | 27,523 | ||||||||
| Acquisitions | — | 27,250 | (277 | ) | |||||||
| Employer contributions | 15,336 | 23,079 | 22,282 | ||||||||
| Participant contributions | 3,081 | 3,706 | 2,980 | ||||||||
| Benefits paid | (9,525 | ) | (12,599 | ) | (14,752 | ) | |||||
| Administrative expenses | (1,236 | ) | (1,249 | ) | — | ||||||
| Foreign currency translation (loss) gain | 8,809 | (2,831 | ) | 12,154 | |||||||
| Fair value of plan assets at end of year | $ | 215,246 | $ | 278,703 | $ | 328,613 | |||||
| U.S. Plans | |||||||||||
| Change in Plan Assets: | |||||||||||
Fair value of plan assets at beginning of year | $ | 63,263 | $ | 75,049 | $ | 80,662 | |||||
| Actual return on plan assets | 10,897 | 5,868 | 8,132 | ||||||||
| Acquisitions | — | — | — | ||||||||
| Employer contributions | 6,936 | 6,613 | 7,864 | ||||||||
| Participant contributions | 444 | 406 | 243 | ||||||||
| Benefits paid | (5,255 | ) | (6,025 | ) | (7,526 | ) | |||||
| Administrative expenses | (1,236 | ) | (1,249 | ) | — | ||||||
| Foreign currency translation (loss) gain | — | — | — | ||||||||
| Fair value of plan assets at end of year | $ | 75,049 | $ | 80,662 | $ | 89,375 | |||||
| Non-U.S. Plans | |||||||||||
| Change in Plan Assets: | |||||||||||
Fair value of plan assets at beginning of year | $ | 108,792 | $ | 140,197 | $ | 198,041 | |||||
| Actual return on plan assets | 15,829 | 20,233 | 19,391 | ||||||||
| Acquisitions | — | 27,250 | (277 | ) | |||||||
| Employer contributions | 8,400 | 16,466 | 14,418 | ||||||||
| Participant contributions | 2,637 | 3,300 | 2,737 | ||||||||
| Benefits paid | (4,270 | ) | (6,574 | ) | (7,226 | ) | |||||
| Administrative expenses | — | — | — | ||||||||
| Foreign currency translation (loss) gain | 8,809 | (2,831 | ) | 12,154 | |||||||
| Fair value of plan assets at end of year | $ | 140,197 | $ | 198,041 | $ | 239,238 | |||||
| | Fiscal Year Ended | ||||||||||
|---|---|---|---|---|---|---|---|---|---|---|---|
| | September 30, 2004 | September 30, 2005 | September 30, 2006 | ||||||||
| | (in thousands) | ||||||||||
| Total Company | |||||||||||
| Reconciliation of Funded Status: | |||||||||||
Funded status at end of year | $ | (109,441 | ) | $ | (154,193 | ) | $ | (116,133 | ) | ||
| Unrecognized actuarial loss | 84,928 | 113,805 | 84,033 | ||||||||
| Unrecognized prior service cost | (18,060 | ) | (15,768 | ) | (13,838 | ) | |||||
| Accrued benefit cost | (42,573 | ) | (56,156 | ) | (45,938 | ) | |||||
| Contribution made after measurement date | 10,100 | 7,124 | 12,586 | ||||||||
| Accrued benefit cost | $ | (32,473 | ) | $ | (49,032 | ) | $ | (33,352 | ) | ||
| U.S. Plans | |||||||||||
| Reconciliation of Funded Status: | |||||||||||
Funded status at end of year | $ | (35,115 | ) | $ | (49,447 | ) | $ | (33,604 | ) | ||
| Unrecognized actuarial loss | 33,004 | 40,713 | 28,949 | ||||||||
| Unrecognized prior service cost | (8,116 | ) | (6,877 | ) | (5,295 | ) | |||||
| Accrued benefit cost | (10,227 | ) | (15,611 | ) | (9,950 | ) | |||||
| Contribution made after measurement date | 27 | 28 | 159 | ||||||||
| Accrued benefit cost | $ | (10,200 | ) | $ | (15,583 | ) | $ | (9,791 | ) | ||
| Non-U.S. Plans | |||||||||||
| Reconciliation of Funded Status: | |||||||||||
Funded status at end of year | $ | (74,326 | ) | $ | (104,746 | ) | $ | (82,529 | ) | ||
| Unrecognized actuarial loss | 51,924 | 73,092 | 55,084 | ||||||||
| Unrecognized prior service cost | (9,944 | ) | (8,891 | ) | (8,543 | ) | |||||
| Accrued benefit cost | (32,346 | ) | (40,545 | ) | (35,988 | ) | |||||
| Contribution made after measurement date | 10,073 | 7,096 | 12,427 | ||||||||
| Accrued benefit cost | $ | (22,273 | ) | $ | (33,449 | ) | $ | (23,561 | ) | ||
In accordance with the provisions of SFAS No. 87,"Employers Accounting for Pensions" (SFAS 87) the Company recorded a minimum pension liability representing the excess of the accumulated benefit obligation over the fair value of plan assets. The liability has been offset by intangible assets to the extent possible. Because the asset recognized may not exceed the amount of unrecognized past service cost, the balance of the liability is reported in accumulated other comprehensive income, net of applicable deferred income taxes.
The following table sets forth the amounts recognized in the balance sheet as of September 30 of each year:
| | Fiscal Year Ended | ||||||||||
|---|---|---|---|---|---|---|---|---|---|---|---|
| | September 30, 2004 | September 30, 2005 | September 30, 2006 | ||||||||
| | (in thousands) | ||||||||||
| Total Company | |||||||||||
| Amounts Recognized in the Balance Sheet: | |||||||||||
Prepaid benefit costs | $ | 4,740 | $ | 5,585 | $ | 6,040 | |||||
| Accrued benefit liability (included in other long-term liabilities) | (84,591 | ) | (126,642 | ) | (99,117 | ) | |||||
| Intangible assets | 11 | 1,278 | 1,008 | ||||||||
| Accumulated other comprehensive income | 37,267 | 63,623 | 46,131 | ||||||||
| Contribution made after measurement date | 10,100 | 7,124 | 12,586 | ||||||||
| Net amount recognized at year-end | $ | (32,473 | ) | $ | (49,032 | ) | $ | (33,352 | ) | ||
| U.S. Plans | |||||||||||
| Amounts Recognized in the Balance Sheet: | |||||||||||
Prepaid benefit costs | $ | — | $ | — | $ | — | |||||
| Accrued benefit liability (included in other long-term liabilities) | (28,330 | ) | (43,809 | ) | (29,392 | ) | |||||
| Intangible assets | 11 | 1,278 | 1,008 | ||||||||
| Accumulated other comprehensive income | 18,092 | 26,920 | 18,434 | ||||||||
| Contribution made after measurement date | 27 | 28 | 159 | ||||||||
| Net amount recognized at year-end | $ | (10,200 | ) | $ | (15,583 | ) | $ | (9,791 | ) | ||
| Non-U.S. Plans | |||||||||||
| Amounts Recognized in the Balance Sheet: | |||||||||||
Prepaid benefit costs | $ | 4,740 | $ | 5,585 | $ | 6,040 | |||||
| Accrued benefit liability (included in other long-term liabilities) | (56,261 | ) | (82,833 | ) | (69,725 | ) | |||||
| Intangible assets | — | — | — | ||||||||
| Accumulated other comprehensive income | 19,175 | 36,703 | 27,697 | ||||||||
| Contribution made after measurement date | 10,073 | 7,096 | 12,427 | ||||||||
| Net amount recognized at year-end | $ | (22,273 | ) | $ | (33,449 | ) | $ | (23,561 | ) | ||
The following table details the components of net periodic benefit cost for the plans in fiscal years 2004, 2005 and 2006:
| | Fiscal Year Ended | ||||||||||
|---|---|---|---|---|---|---|---|---|---|---|---|
| | September 30, 2004 | September 30, 2005 | September 30, 2006 | ||||||||
| | (in thousands) | ||||||||||
| Total Company | |||||||||||
| Components of Net Periodic Benefit Cost: | |||||||||||
Service cost | $ | 8,283 | $ | 7,722 | $ | 8,325 | |||||
| Interest cost | 16,697 | 19,989 | 21,959 | ||||||||
| Expected return on plan assets | (16,274 | ) | (18,989 | ) | (20,191 | ) | |||||
| Amortization of prior service costs | (1,198 | ) | (2,122 | ) | (2,037 | ) | |||||
| Recognized actuarial loss | 5,108 | 5,908 | 11,565 | ||||||||
| Settlement loss | — | 399 | — | ||||||||
| Net periodic benefit cost | 12,616 | 12,907 | 19,621 | ||||||||
| Company matches in 401(k) plan | 5,041 | 5,234 | 6,474 | ||||||||
| Total net periodic benefit cost and company matches | $ | 17,657 | $ | 18,141 | $ | 26,095 | |||||
| U.S. Plans | |||||||||||
| Components of Net Periodic Benefit Cost: | |||||||||||
Service cost | $ | 3,624 | $ | 2,987 | $ | 3,060 | |||||
| Interest cost | 6,534 | 6,710 | 6,711 | ||||||||
| Expected return on plan assets | (5,800 | ) | (6,167 | ) | (6,482 | ) | |||||
| Amortization of prior service costs | (642 | ) | (1,239 | ) | (1,158 | ) | |||||
| Recognized actuarial loss | 4,247 | 3,821 | 5,730 | ||||||||
| Settlement loss | — | — | — | ||||||||
| Net periodic benefit cost | 7,963 | 6,112 | 7,861 | ||||||||
| Company matches in 401(k) plan | 5,041 | 5,234 | 6,474 | ||||||||
| Total net periodic benefit cost and company matches | $ | 13,004 | $ | 11,346 | $ | 14,335 | |||||
| Non-U.S. Plans | |||||||||||
| Components of Net Periodic Benefit Cost: | |||||||||||
| Service cost | $ | 4,659 | $ | 4,735 | $ | 5,265 | |||||
| Interest cost | 10,163 | 13,279 | 15,248 | ||||||||
| Expected return on plan assets | (10,474 | ) | (12,822 | ) | (13,709 | ) | |||||
| Amortization of prior service costs | (556 | ) | (883 | ) | (879 | ) | |||||
| Recognized actuarial loss | 861 | 2,087 | 5,835 | ||||||||
| Settlement loss | — | 399 | — | ||||||||
| Net periodic benefit cost | 4,653 | 6,795 | 11,760 | ||||||||
| Company matches in 401(k) plan | — | — | — | ||||||||
| Total net periodic benefit cost and company matches | $ | 4,653 | $ | 6,795 | $ | 11,760 | |||||
The amount, net of applicable deferred income taxes, included in other comprehensive income arising from a change in the additional minimum pension liability was $(5.8) million, $26.4 million and $(17.5) million in fiscal 2004, 2005 and 2006, respectively.
The table below provides additional year-end information for pension plans with accumulated benefit obligations in excess of plan assets.
| | Fiscal Year Ended | ||||||||
|---|---|---|---|---|---|---|---|---|---|
| | September 30, 2004 | September 30, 2005 | September 30, 2006 | ||||||
| | (in thousands) | ||||||||
| Total Company | |||||||||
| Projected benefit obligation | $ | 307,015 | $ | 414,125 | $ | 423,323 | |||
| Accumulated benefit obligation | $ | 280,821 | $ | 376,265 | $ | 390,956 | |||
| Fair value of plan assets | $ | 197,428 | $ | 258,236 | $ | 306,146 | |||
U.S. Plans | |||||||||
| Projected benefit obligation | $ | 110,164 | $ | 130,108 | $ | 122,979 | |||
| Accumulated benefit obligation | $ | 103,379 | $ | 124,471 | $ | 118,767 | |||
| Fair value of plan assets | $ | 75,049 | $ | 80,662 | $ | 89,375 | |||
Non-U.S. Plans | |||||||||
| Projected benefit obligation | $ | 196,851 | $ | 284,017 | $ | 300,344 | |||
| Accumulated benefit obligation | $ | 177,442 | $ | 251,794 | $ | 272,189 | |||
| Fair value of plan assets | $ | 122,379 | $ | 177,574 | $ | 216,771 | |||
The table below provides the expected future benefit payments:
| | Total | U.S. | Non-U.S | ||||||
|---|---|---|---|---|---|---|---|---|---|
| | (in thousands) | ||||||||
| 2007 | $ | 14,396 | $ | 6,090 | $ | 8,306 | |||
| 2008 | 19,311 | 11,423 | 7,888 | ||||||
| 2009 | 17,459 | 8,052 | 9,407 | ||||||
| 2010 | 18,602 | 8,588 | 10,014 | ||||||
| 2011 | 21,408 | 8,847 | 12,561 | ||||||
| 2012 - 2016 | 122,830 | 52,149 | 70,681 | ||||||
The underlying assumptions for the pension plans are as follows:
| | Fiscal Year Ended | ||||||
|---|---|---|---|---|---|---|---|
| | September 30, 2004 | September 30, 2005 | September 30, 2006 | ||||
| Major assumptions for U.S.-based plans at plan year-end: | |||||||
Discount rate | 6.25% | 5.25% | 5.25% | ||||
| Rate of increase in compensation levels | 4.00% | 4.00% | 4.00% | ||||
| Expected long-term rate of return on plan assets | 8.00% | 8.00% | 8.00% | ||||
Major assumptions for U.K./Australia-based plans at plan year-end: | |||||||
Discount rate | 5.75%/5.50% | 5.75%/5.50% | 5.00% | ||||
| Rate of increase in compensation levels | 3.50% | 3.50% | n/a/3.50% | ||||
| Expected long-term rate of return on plan assets | 7.25% | 7.25% | 5.00%/7.00% | ||||
Pension costs are determined using the assumptions as of the beginning of the plan year (October 1). The funded status is determined using the assumptions as of the end of the plan year.
The following supplemental information is provided for the qualified plan in the U.S.:
| | Fiscal Year Ended | ||||||
|---|---|---|---|---|---|---|---|
| | September 30, 2005 | September 30, 2006 | |||||
| Asset Allocation Information: | |||||||
| Actual asset allocations: | |||||||
| Domestic equity | 54 | % | 54 | % | |||
| International equity | 15 | % | 15 | % | |||
| Debt | 30 | % | 27 | % | |||
| Cash | 1 | % | 4 | % | |||
| Total | 100 | % | 100 | % | |||
The following supplemental information is provided for the qualified plan in the U.K.:
| | Fiscal Year Ended | ||||||
|---|---|---|---|---|---|---|---|
| | September 30, 2005 | September 30, 2006 | |||||
| Asset Allocation Information: | |||||||
| Actual asset allocations: | |||||||
| Domestic equity | 40%/43 | % | 36 | % | |||
| International equity | 25%/29 | % | 26 | % | |||
| Debt | 31%/32 | % | 38 | % | |||
| Cash | — | % | — | % | |||
| Total | 100 | % | 100 | % | |||
The following supplemental information is provided for the qualified plan in Australia:
| | Fiscal Year Ended | ||||||
|---|---|---|---|---|---|---|---|
| | September 30, 2005 | September 30, 2006 | |||||
| Asset Allocation Information: | |||||||
| Actual asset allocations: | |||||||
| Domestic equity | 38 | % | 38 | % | |||
| International equity | 24 | % | 25 | % | |||
| Property | 7 | % | 7 | % | |||
| Debt | 24 | % | 28 | % | |||
| Cash | 7 | % | 2 | % | |||
| Total | 100 | % | 100 | % | |||
The Company's policy is to minimize the risk of large losses through diversification in a portfolio of stocks, bonds, and cash equivalents which may reflect varying rates of return. The percentage of assets allocated to cash is to assure liquidity to meet benefit disbursements and general operating expenses.
To develop the expected long-term rate of return on assets assumption, the Company considered the historical returns and the future expectations for returns for each asset class, as well as the target asset allocation of the pension portfolio and the diversification of the portfolio. This resulted in the selection of an 8% long-term rate of return on assets assumption for the fiscal year ending September 2006.
Other Plans—In addition, substantially all permanent employees are eligible to participate in other defined contribution plans provided by the Company. Under these plans, participants may make certain contributions as a percentage of their salary. The Company does not make direct cash contributions to these plans; however, it is anticipated that the "Retirement and Savings Plan," or RSP, (Note 13—Stock Plans) will make allocations of the Company's Common Stock (based on Company Contributions of Common Stock to the RSP and/or forfeitures of Common Stock within the RSP) to employee accounts in the RSP and the Company may also make matching contributions of Common Stock Units to the Stock Purchase Plan (Note 13—Stock Plans) both based, in part, on the employee's contributions to these other defined contribution plans.
10. Accrued Expenses
Accrued expenses of the Company consist of the following:
| | September 30, 2005 | September 30, 2006 | ||||
|---|---|---|---|---|---|---|
| | (in thousands) | |||||
| Accrued salaries and benefits | $ | 153,906 | $ | 190,504 | ||
| Accrued contract costs | 98,015 | 153,071 | ||||
| Other accrued expenses | 21,935 | 21,973 | ||||
| Total accrued expenses | $ | 273,856 | $ | 365,548 | ||
11. Leases
The Company and its subsidiaries are lessees in non-cancelable leasing agreements for office buildings and equipment which expire at various dates. The following table presents, in thousands, amounts payable under non-cancelable operating lease commitments during the following fiscal years:
| Fiscal Year: | Operating | |||
|---|---|---|---|---|
| 2007 | $ | 87,163 | ||
| 2008 | 71,905 | |||
| 2009 | 60,071 | |||
| 2010 | 48,580 | |||
| 2011 | 41,509 | |||
| Thereafter | 137,403 | |||
| Total | $ | 446,631 | ||
Included in the above table are commitments totaling $33.3 million related to the sale-leaseback of the Company's Orange, California facility during fiscal 2006. The sales price of this facility was $20.1 million of which $16.9 million in gain on sale-leaseback was deferred and is being amortized over the 12-year term of the lease. See Note 12 for further information.
The Company also has similar non-cancelable leasing agreements that due to the terms of the underlying leases, are accounted for as capital lease obligations. At September 30, 2006, the Company had total lease obligations under capital leases of $1.7 million. Rent expense for the years ended September 30, 2004, 2005, and 2006, was approximately $62.5 million, $65.7 million and $90.6 million, respectively.
12. Long-Term Obligations
Long-term obligations consisted of the following:
| | September 30, 2005 | September 30, 2006 | |||||
|---|---|---|---|---|---|---|---|
| | (in thousands) | ||||||
| Amended and Restated Credit Agreement | $ | 130,000 | $ | — | |||
| Senior Notes | 99,714 | 68,810 | |||||
| Term Credit Agreement | — | 65,000 | |||||
| Short-term borrowings | 4,165 | 2,716 | |||||
| Other Debt | 2,843 | 929 | |||||
| Total long-term obligations | 236,722 | 137,455 | |||||
| Less: Current portion of long-term obligations and short-term borrowings | (20,539 | ) | (14,665 | ) | |||
| Long-term obligations, less current portion | $ | 216,183 | $ | 122,790 | |||
Amended and Restated Credit Agreement
The Company has an unsecured credit agreement with a syndicate of banks to support its working capital and acquisition needs. On September 22, 2006, the Company amended and restated this agreement, or ARCA, primarily to modify pricing, certain technical terms and to extend the maturity to
March 31, 2011, or earlier, at the Company's discretion. As of September 30, 2006, the ARCA provided a revolving line of credit in the amount of $300.0 million which included a sub-limit for standby letters of credit of $50.0 million. The Company may borrow, at its option, at either (a) a base rate (the greater of the federal funds rate plus 0.50% or the bank's reference rate) plus a margin which ranges from 0.00% to 0.25%, or (b) an offshore, or LIBOR, rate plus a margin which ranges from 0.75% to 1.75%. In addition to these borrowing rates, there is a commitment fee which ranges from 0.175% to 0.375% on any unused commitment. Borrowings under the ARCA are limited by certain financial covenants. At September 30, 2005 and September 30, 2006, borrowings under this ARCA totaled $130.0 million and $0.0, respectively. At September 30, 2005 and September 30, 2006, outstanding standby letters of credit totaled $21.1 million and $23.1 million, respectively. At September 30, 2006, the Company had $276.9 million available for borrowing under this ARCA.
Senior Notes
On September 9, 2002, the Company issued $25.0 million of 6.23% senior notes due October 15, 2008, or the October 2008 Notes. The October 2008 Notes are unsecured and have an average life of five years. The annual principal payments of $8.3 million were scheduled to begin October 15, 2006, however, the Company elected to pre-pay the first principal payment in September 2006.
On September 7, 2001, the Company issued $21.0 million of 6.47% senior notes due October 7, 2006, or the October 2006 Notes. The October 2006 Notes were paid in full on September 29, 2006. The October 2006 Notes were unsecured and had an average life of four years. The annual principal payments of $7.0 million began October 7, 2004. The first principal and last principal payments due on the October 2006 Notes were prepaid.
On April 14, 2000, the Company issued $35.0 of 8.38% senior notes due April 14, 2012, or the April 2012 Notes. The April 2012 Notes are unsecured and have an average life of 10 years. The annual principal payments of $7.0 million will begin April 14, 2008.
On June 9, 1998, the Company issued $60.0 million of 6.93% senior notes due June 9, 2008, or the June 2008 Notes. The June 2008 Notes are unsecured and have an average life of seven years. The annual principal payments of $8.6 million began June 9, 2002.
All of the senior notes require interest to be paid either quarterly or semi-annually in arrears and are subject to certain financial covenants. Proceeds from the October 2006 Notes, the June 2008 Notes and the October 2008 Notes were used to repay outstanding debt borrowed under the then bank credit agreement while proceeds of the April 2012 Notes were used to fund business acquisitions.
Term Credit Agreement
On September 22, 2006, the Company, through certain of its wholly-owned subsidiaries, closed an unsecured term credit agreement with a syndicate of banks to facilitate dividend repatriations under section 965 of the American Jobs Creation Act. The term credit agreement, or AJCA, provides for a $65.0 million, five-year term loan amongst four subsidiary borrowers and one subsidiary guarantor. In order to obtain favorable pricing, the Company also provided a parent-company guarantee. The terms and conditions of the agreement are substantially similar to those contained in the ARCA. Principal payments are scheduled to begin June 30, 2007, or earlier at the borrowers discretion. At September 30, 2006, borrowings under this AJCA totaled $65.0 million.
Other Debt
The Company also has a $25.0 million unsecured line of credit and a $10.0 million letter of credit line for use outside of the United States.
The Company also issued promissory notes to certain former shareholders of Maunsell and other acquired companies in connection with those mergers and mortgage debt. The promissory notes of $0.9 million due to the former Oscar Faber shareholders carry fixed and LIBOR-indexed interest rates, which at September 30, 2006, was 4.5%. These promissory notes have maturities ranging from January 2006 to April 2010. The mortgage debt of $1.4 million at September 30, 2005 was assumed when the Company bought out its joint venture partner as co-owner of its Orange, California, facility. The Company had previously recorded its interest as a capitalized lease. The mortgage debt required equal monthly payments of principal and interest at 8.75% through September 2008. This debt was repaid in full upon the sale of the facility in May 2006. See Note 11 for further information.
The following table presents, in thousands, scheduled maturities of the Company's long-term obligations:
| Fiscal Year: | | ||
|---|---|---|---|
| 2007 | $ | 14,665 | |
| 2008 | 30,805 | ||
| 2009 | 25,485 | ||
| 2010 | 20,000 | ||
| 2011 | 39,500 | ||
| Thereafter | 7,000 | ||
| Total | $ | 137,455 | |
13. Stock Plans
Global Stock Program—In 1990, the Company adopted the AECOM Technology Corporation Employee Stock Ownership Plan (the ESOP) covering substantially all permanent U.S. based employees and as of September 30, 1998, all shares in the ESOP had been released to ESOP participants' accounts.
On October 1, 2000, the Company's Stock Investment Plan, the 401(k) Pension Plan, and the Investment Plan were merged with and into the ESOP; however, individual plan account balances continue to be separately maintained. Also effective October 1, 2000, the Company adopted the AECOM Technology Corporation Global Stock Plans (the Global Plans). The Global Plans provide a vehicle for non-U.S. employees to purchase stock in accordance with AECOM bylaws and local laws. The Global Plans are available to employees under plans in Australia, Hong Kong, New Zealand, Qatar, Singapore, United Arab Emirates and the United Kingdom.
Effective May 1, 2002 the ESOP component was amended so that it no longer qualified as a stock bonus plan or an employee stock ownership plan but rather as a profit sharing plan. The ESOP was renamed the AECOM Technology Corporation Retirement & Savings Plan (RSP).
The RSP and the Global Plans comprise AECOM's Global Stock Program, or the GSP.
During fiscal 2005 and 2006, the GSP sold to the Company 912,8171,825,634 and 814,1701,628,340 shares of Common Stock for $18.9 million and $20.3 million, respectively. These shares, which were attributable to former employees entitled to distributions under the GSP, were canceled.
For individuals who no longer qualify to be employees of the Company and whose vested shares have an initial value in excess of $5,000, the Company will repurchase the shares, the majority of which were terminated or retired, ratably over five years at the then current share price. At September 30, 2006, the Company's repurchase obligation covered 4,025,6648,051,328 Common Shares allocated to former employees by the GSP. The fair value of these shares at September 30, 2006, was $114.3 million included in Redeemable common stock and common stock units.
Stock Match Program—Effective as of October 3, 1998, the Company implemented a Stock Match Program that provided stock matches on participants' contributions to the Company's Stock Investment Plan and Stock Purchase Plan. Effective October 1, 2002, the Board of Directors approved a new Stock Match Program (18% for common stock purchases and 10% for preferred stock purchases) and allocation of the stock matches quarterly.
Stock matches are made at the end of each quarter. The expense is based upon the value of the stock at the end of such quarter and is expensed in the period the match is made. For fiscal years ended September 30, 2004, September 30, 2005 and September 30, 2006, stock match expense was $1.8 million, $3.2 million and $14.8 million, respectively.
Stock Purchase Plan—Effective June 1, 1991, the Company adopted the Stock Purchase Plan to provide an opportunity for eligible employees to continue to invest in the Company when the Company's qualified Investment Plan and/or Stock Investment Plan are no longer available to them due to limitations contained in the U.S. Internal Revenue Code. Under the Stock Purchase Plan, participants are permitted to defer compensation, on a pre-tax basis, for investment in Common Stock Units. These amounts will not be held in trust and would be subject to the general creditors of the Company.
The number of Common Stock Units issued corresponds to an equal number of shares of Common Stock based on the valuation of Common Stock determined at the next valuation date for Stock Purchase Plan purposes. Effective December 31, 1999, shares of the Company's Common Stock have been valued quarterly and purchases of Common Stock and Common Stock Units are valued at the then most recent valuation.
When a participant in the Stock Purchase Plan ends employment, the Company will make a single sum payment in whole shares of AECOM Common Stock based on the total number of share units credited to his/her account. These shares will be subject to the buyback provisions under the bylaws of the Company. In the alternative, a participant's Common Stock Units may be converted to a cash book account entry, determined as though the share units were shares of Common Stock and will be redeemed under the same buyback provisions for Common Stock as allowed by the Company's bylaws. During fiscal 2005 and 2006, the Stock Purchase Plan sold to the Company 497,014944,028 and 348,642697,284 shares of Common Stock for $10.3 million and $8.6 million, respectively. These shares, which were attributable to former employees entitled to distributions under the Stock Purchase Plan, were canceled.
For individuals who no longer qualify to be employees of the Company, and whose vested Common Stock Units have a value at the end of the fiscal year in which such person ceased to qualify
as an employee in excess of $5,000, the Company will repurchase the Common Stock Units ratably over five or 10 years at the then current share price. At September 30, 2006 the Company's repurchase obligation covered 1,433,2722,866,544 Common Stock Units allocated to former employees by the Stock Purchase Plan. The fair value of these shares at September 30, 2006 was $40.7 million. The Stock Purchase Plan has been extended indefinitely by the Board of Directors.
The Company also has a program in which non-employee directors can elect, in lieu of cash compensation, to have all or a portion of their director compensation contributed to the Stock Purchase Plan to acquire Common Stock Units of the Company. A total of 5,629,73411,259,468 Common Stock Units have been issued to the Stock Purchase Plan as of September 30, 2006.
Direct Ownership—The Company has shareholders who hold their shares directly, the majority of whom acquired these shares through a merger or acquisition. When a direct shareholder ends employment, these direct ownership shares will be subject to the buyback provisions under the bylaws of the Company.
During fiscal 2005 and 2006, the direct shareholders sold to the Company 1,577,8033,155,606 and 636,4031,272,806 shares of Common Stock for $32.9 million and $16.1 million, respectively. These shares, which were attributable to share diversification, the special liquidity program and former employees entitled to distributions under the bylaws, were canceled.
For individuals who no longer qualify to be employees of the Company, and whose direct ownership shares have an initial value in excess of $5,000, the Company will repurchase the direct ownership shares ratably over five years at the then current share price. At September 30, 2006 the Company's repurchase obligation covered 2,155,8354,311,670 direct ownership shares allocated to former employees. The fair value of these shares at September 30, 2006 was $61.2 million.
Stock Incentive Plans—The Company has stock incentive plans under which key employees can purchase up to 9,700,00019,400,000 shares of Common Stock under stock options or restricted stock awards while non-employee directors can purchase up to 250,000500,000 shares of Common Stock under stock options. Stock options may be granted to employees and non-employee directors at a price not less than the fair market value of the stock on the date of grant, and, for employees, options may be accompanied by stock appreciation rights (SARs). SARs entitle employees to surrender stock options and receive cash or stock in an amount equal to the excess of the market value of the optioned shares over their option price. Unexercised options and any accompanying SARs lapse not later than 10 years after the date of grant (seven years if granted subsequent to March 2000). The stock purchase options are accounted for under the intrinsic value based method under APB25.
Options granted to non-employee directors vest six months after the date of grant. Restricted stock awards entitle employees to purchase shares at a cost, if any, that may be less than fair market value, to vote such shares and to receive any dividends thereon, but such shares are subject to forfeiture upon completion of service before the restriction period ends. No SARs or restricted stock awards have been granted.
During the three years in the period ended September 30, 2006, option activity was as follows:
| | Number of Options | Weighted Average Exercise Price | Number of Options | Weighted Average Exercise Price | ||||||
|---|---|---|---|---|---|---|---|---|---|---|
| Balance, September 30, 2003 | 4,588,200 | $ | 11.84 | 9,176,400 | $ | 5.92 | ||||
| Granted | 842,000 | $ | 19.58 | 1,684,000 | $ | 9.79 | ||||
| Exercised | (203,610 | ) | $ | 16.16 | (1,075,180 | ) | $ | 3.64 | ||
| Cancelled | (537,590 | ) | $ | 7.28 | (407,220 | ) | $ | 8.08 | ||
| Balance, September 30, 2004 | 4,689,000 | $ | 13.56 | 9,378,000 | $ | 6.78 | ||||
| Granted | 549,000 | $ | 21.02 | 1,098,000 | $ | 10.51 | ||||
| Exercised | (119,660 | ) | $ | 16.49 | (1,120,530 | ) | $ | 4.06 | ||
| Cancelled | (560,265 | ) | $ | 8.11 | (239,320 | ) | $ | 8.25 | ||
| Balance, September 30, 2005 | 4,558,075 | $ | 15.05 | 9,116,150 | $ | 7.53 | ||||
| Granted | 525,545 | $ | 25.43 | 1,051,090 | $ | 12.72 | ||||
| Exercised | (566,020 | ) | $ | 18.94 | (1,132,040 | ) | $ | 5.08 | ||
| Cancelled | (53,280 | ) | $ | 10.16 | (106,560 | ) | $ | 9.47 | ||
| Balance, September 30, 2006 | 4,464,320 | $ | 16.85 | 8,928,640 | $ | 8.43 | ||||
| Exercisable as of September 30, 2004 | 2,315,615 | $ | 10.27 | 4,631,230 | $ | 5.14 | ||||
| Exercisable as of September 30, 2005 | 2,172,780 | $ | 11.88 | 4,345,560 | $ | 5.94 | ||||
| Exercisable as of September 30, 2006 | 4,464,320 | $ | 16.85 | 8,928,640 | $ | 8.43 | ||||
The following table summarizes information concerning outstanding and exercisable options as of September 30, 2006:
| | Options Outstanding | Options Exercisable | ||||||||||
|---|---|---|---|---|---|---|---|---|---|---|---|---|
| Range of Exercise Prices | Number Outstanding | Weighted Average Remaining Contractual Life (Years) | Weighted Average Exercise Price | Number Exercisable | Weighted Average Exercise Price | |||||||
| $ 8.15 - $ 8.30 | 190,875 | 1.85 | $ | 8.30 | 190,875 | $ | 8.30 | |||||
| $ 9.22 - $ 9.98 | 308,875 | 2.88 | $ | 9.97 | 308,875 | $ | 9.97 | |||||
| $10.06 - $10.91 | 331,225 | 3.81 | $ | 10.82 | 331,225 | $ | 10.82 | |||||
| $11.75 - $12.76 | 222,250 | 2.17 | $ | 12.57 | 222,250 | $ | 12.57 | |||||
| $13.68 - $17.51 | 1,548,300 | 3.28 | $ | 15.57 | 1,548,300 | $ | 15.57 | |||||
| $17.58 - $20.67 | 843,750 | 5.01 | $ | 19.37 | 843,750 | $ | 19.37 | |||||
| $20.78 - $22.97 | 506,000 | 6.21 | $ | 21.06 | 506,000 | $ | 21.06 | |||||
| $24.81 - $27.68 | 513,045 | 7.37 | $ | 25.47 | 513,045 | $ | 25.47 | |||||
| $ 8.15 - $27.68 | 4,464,320 | 4.31 | $ | 16.85 | 4,464,320 | $ | 16.85 | |||||
| | Options Outstanding | Options Exercisable | ||||||||||
|---|---|---|---|---|---|---|---|---|---|---|---|---|
| Range of Exercise Prices | Number Outstanding | Weighted Average Remaining Contractual Life (Years) | Weighted Average Exercise Price | Number Exercisable | Weighted Average Exercise Price | |||||||
| $ 4.08 - $ 4.15 | 381,750 | 1.85 | $ | 4.15 | 381,750 | $ | 4.15 | |||||
| $ 4.61 - $ 4.99 | 617,750 | 2.88 | $ | 4.99 | 617,750 | $ | 4.99 | |||||
| $ 5.03 - $ 5.46 | 662,450 | 3.81 | $ | 5.41 | 662,450 | $ | 5.41 | |||||
| $ 5.88 - $ 6.38 | 444,500 | 2.17 | $ | 6.29 | 444,500 | $ | 6.29 | |||||
| $ 6.84 - $ 8.76 | 3,096,600 | 3.28 | $ | 7.79 | 3,096,600 | $ | 7.79 | |||||
| $ 8.79 - $10.34 | 1,687,500 | 5.01 | $ | 9.69 | 1,687,500 | $ | 9.69 | |||||
| $10.39 - $11.49 | 1,012,000 | 6.21 | $ | 10.53 | 1,012,000 | $ | 10.53 | |||||
| $12.41 - $13.84 | 1,026,090 | 7.37 | $ | 12.74 | 1,026,090 | $ | 12.74 | |||||
| $ 4.08 - $13.84 | 8,928,640 | 4.31 | $ | 8.43 | 8,928,640 | $ | 8.43 | |||||
The remaining contractual life of options outstanding at September 30, 2006, range from 0.3 to 7.0 years and have a weighted average remaining contractual life of 3.3 years.
Effective as of March 2, 1998, the Company established the Executive/Director Loan Program and Stock Repurchase Program to facilitate the exercise of options. Loans, with full recourse, will be for a term of not less than six months or more than 12 months and will bear interest at a rate of six-month LIBOR plus 1%. Upon maturity of a loan, the Company will offer to repurchase the number of shares which, when multiplied by the then-current fair market value of the shares of Common Stock, will equal the principal and accrued interest on the loan and the loan will be retired from the proceeds of the repurchase. The Board of Directors established a revolving loan pool of up to $10.0 million under this program. As of September 30, 2006, loans totaling $1.2 million were outstanding. At September 30, 2006, 4,464,3208,928,640 shares of Common Stock had been reserved for the exercise of Stock Options.
The following pro forma information regarding net income has been calculated as if the Company had accounted for its employee stock options and stock purchase plan using the fair value method under SFAS No. 123, "Accounting for Stock-Based Compensation" (SFAS 123):
| | Fiscal Year Ended | Fiscal Year Ended | ||||||||||||||||||
|---|---|---|---|---|---|---|---|---|---|---|---|---|---|---|---|---|---|---|---|---|
| | September 30, 2004 | September 30, 2005 | September 30, 2006 | September 30, 2004 | September 30, 2005 | September 30, 2006 | ||||||||||||||
| | (in thousands, except per share data) | (in thousands, except per share data) | ||||||||||||||||||
| Net income as reported | $ | 50,436 | $ | 53,814 | $ | 53,686 | $ | 50,436 | $ | 53,814 | $ | 53,686 | ||||||||
| Deduct: Stock-based employee compensation expense determined under fair value based method for all awards, net of related tax effects | (1,315 | ) | (1,303 | ) | (1,392 | ) | (1,315 | ) | (1,303 | ) | (1,392 | ) | ||||||||
| Pro forma net income | $ | 49,121 | $ | 52,511 | $ | 52,294 | $ | 49,121 | $ | 52,511 | $ | 52,294 | ||||||||
| Earnings per share: | ||||||||||||||||||||
| Basic—as reported | $ | 1.71 | $ | 1.86 | $ | 1.88 | $ | 0.86 | $ | 0.93 | $ | 0.94 | ||||||||
| Basic—pro forma | $ | 1.66 | $ | 1.81 | $ | 1.83 | $ | 0.83 | $ | 0.91 | $ | 0.91 | ||||||||
Diluted—as reported | $ | 1.57 | $ | 1.68 | $ | 1.48 | $ | 0.78 | $ | 0.84 | $ | 0.74 | ||||||||
| Diluted—pro forma | $ | 1.53 | $ | 1.64 | $ | 1.44 | $ | 0.76 | $ | 0.82 | $ | 0.72 | ||||||||
The results of applying the fair value method could have a materially different effect on pro forma net income in future years.
The fair value of the Company's stock options used to compute pro forma net income and pro forma earnings per share disclosures is the estimated value using the "Minimum Value" method as allowed for non-public companies' option-pricing model. The weighted average fair values per share of options granted in fiscal 2004, 2005 and 2006 are $2.85, $4.34$1.43, $2.17 and $5.91,$2.96, respectively. The following assumptions were used in completing the model:
| | Fiscal Year Ended | ||||||
|---|---|---|---|---|---|---|---|
| | September 30, 2004 | September 30, 2005 | September 30, 2006 | ||||
| Dividend yield | 0.0 | % | 0.0 | % | 0.0 | % | |
| Risk-free rate of return, annual | 3.39 | % | 3.93 | % | 4.52 | % | |
| Expected life | 6 years | 6 years | 6 years | ||||
Senior Executive Equity Investment Plan—Effective as of March 2, 1998, the Company established the Senior Executive Equity Investment Program (SEEIP) to encourage senior executives, primarily its executive officers, to increase their ownership interests in the Company. Executives who qualify for this program are extended a full recourse, unsecured loan, which bears a fixed interest rate approximating the most recent placement of the Company's long-term debt. The principal and accrued interest on the loan will be due upon the sale of the Common Stock acquired under this program. If an executive terminates employment with AECOM prior to normal retirement, the principal and accrued interest will become due and payable. The Board of Directors has established a loan pool of up to $30.0 million to fund this program. As of September 30, 2006, loans totaling $26.7 million (plus accrued interest of $9.9 million) with an average interest rate of 6% had been extended under the Senior Executive Equity Investment Program. The Company recorded interest income of $1.6 million and $2.0 million in fiscal years 2005 and 2006, respectively. Common Stock purchased under this program was eligible for a Company stock match and is fully vested. See Note 24 for further information.
During fiscal years ending September 30, 2005 and 2006, the Company awarded performance unit awards under its Performance Earnings Program (PEP) and had accrued approximately $12.0 million relating to the PEP at September 30, 2006.
14. Redeemable Common and Preferred Stock and Stock Units
Since Company securities are not freely tradable, the Company implemented a program to repurchase such securities from former employees by means of a five-year interest-bearing note. Alternatively, the former employee may elect to sell, in equal installments, his or her (a) shares of stock over five or nine years or (b) stock units over five or ten years.
The repurchase obligations for redeemable common stock and stock units at September 30, 2006 are based on a stock and unit price of $28.40$14.20 per share, as determined by an independent valuation firm. The repurchase obligations for redeemable preferred stock and stock units at September 30, 2006 are based on the liquidation preference of $102.50. Repurchase obligations infor stock and stock units over the next five years and later years for former employeesthereafter where payoutredemption dates have been determined, based onas well as where the agreed upon repurchaseredemption dates have not been determined, are as follows:
| Repurchase Date: | Shares/Units | Carrying Value (000's) | ||||
|---|---|---|---|---|---|---|
| December 2006 | 3,900,986 | $ | 55,394 | |||
| December 2007 | 3,400,298 | 48,284 | ||||
| December 2008 | 2,994,316 | 42,519 | ||||
| December 2009 | 2,680,292 | 38,060 | ||||
| December 2010 | 2,296,754 | 32,614 | ||||
| Thereafter | 54,286 | 771 | ||||
| 15,326,932 | 217,642 | |||||
| Redemption date not determined | 42,534,874 | 608,959 | ||||
| Total | 57,861,806 | 826,601 | ||||
| Less: Share repurchase liability | (3,900,986 | ) | (55,394 | ) | ||
| Redeemable common and preferred stock and stock units | 53,960,820 | $ | 771,207 | |||
In accordance with Emerging Issues Task Force D-98 "Classification and Measurement of Redeemable Securities," since the redemption of the Company's common and preferred stock and stock units is not solely within the control of the Company, such amounts are classified outside of permanent stockholders' equity. For shares put back to the Company upon termination of employment, the redemption feature is not mandatory since the level of repurchases is contingently redeemable by the Company (whether with cash or a note) subject to the Company's election and limitations on available liquidity governed by debt agreements and covenant requirements. Therefore, the shares are not considered to be mandatorily redeemable under SFAS 150, "Accounting for Certain Financial Instruments with Characteristics of Both Liabilities and Equity." When redemptions are no longer contingent, related amounts are reflected as a liability.
15. Stockholders' Equity
Preferred Stock—The Restated Certificate of Incorporation of the Company authorizes the issuance of 8,000,000 shares of Preferred Stock, par value $.01 per share (the Preferred Stock). The holders of Preferred Stock are generally entitled to one vote per share on all matters to be voted on by the Company's stockholders and will vote as one class with the Common Stock.
Convertible Preferred Stock—Convertible Preferred Stock is limited to an aggregate of 2,500,000 shares with a par value and liquidation preference of $100 per share. Holders of the Convertible Preferred Stock are entitled to receive dividends payable in additional shares of Convertible Preferred Stock at the Applicable Rate determined as set forth below. Dividends on the Convertible Preferred Stock are payable quarterly on January 1, April 1, July 1, and October 1 of each year.
The Applicable Rate will be set annually by the independent appraiser engaged by the Trustee of AECOM Common Stock in the Retirement & Savings Plan at a level that it determines is necessary for the fair value of the Convertible Preferred Stock to be equal to its par value.
After a share of Convertible Preferred Stock has been outstanding for at least three years, the Company may redeem such Convertible Preferred Stock at the Company's election, in whole or in part, upon not less than 30 or more than 60 days' written notice. The redemption price shall be equal to 102.5% of the liquidation preference of the share of Convertible Preferred Stock to be redeemed, plus the payment of any accrued and unpaid dividends to the redemption date. In any event, at such time as a holder of Convertible Preferred Stock no longer meets the qualifications to be a holder of Employee Stock, the Convertible Preferred Stock held by such holder shall be repurchased by the Company.
If the Convertible Preferred Stock has been held at least one year, on each January 1, April 1, July 1, and October 1, or a Preferred Conversion Date, the holder of shares of Convertible Preferred Stock may convert some or all of the shares of Convertible Preferred Stock held into shares of the Company's Common Stock. The number of shares of the Company's Common Stock to be received upon conversion shall be determined by dividing (i) the aggregate liquidation preferences and accrued and unpaid dividends to the applicable Preferred Conversion Date of the shares of Convertible Preferred Stock to be converted, by (ii) the per share price of the Company's Common Stock on the applicable Preferred Conversion Date.
In the event of any voluntary or involuntary liquidation, dissolution or winding up of the Company, the holders of shares of Convertible Preferred Stock are entitled to receive out of assets of the Company available for distribution to stockholders, before any distribution of assets is made to holders
of the Company's Common Stock or of any other shares of stock of the Company ranking as to such a distribution junior to the shares of Convertible Preferred Stock, liquidating distributions in the amount of $100 per share plus accrued and unpaid dividends. After payment of such liquidating distributions, the holders of shares of Convertible Preferred Stock will not be entitled to any further participation in any distribution of assets by the Company.
Except as expressly required by applicable law, the holders of the Convertible Preferred Stock will be entitled to one vote per share.
If the equivalent of six quarterly dividends payable on the Convertible Preferred Stock are in arrears, the number of directors of the Company will be increased by two and the holders of Convertible Preferred Stock, voting as a class with the holders of shares of any one or more other series of preferred stock ranking on a parity with the Convertible Preferred Stock as to payment of dividends and the distribution of assets and upon which like voting rights have been conferred and are exercisable, will be entitled to elect two directors to fill such vacancies. Such right to elect two additional directors shall continue until all dividends in arrears have been paid or declared and set apart for payment. Each director elected by the holders of shares of the Convertible Preferred Stock and all other classes of preferred stock whose holders are entitled to vote shall continue to serve as such director for the full term for which he or she shall have been elected, notwithstanding that prior to the end of such term such default shall cease to exist.
Class B and Class C Stock—Effective as of September 10, 1999, the Company established a new class of Preferred Stock, Class B Stock, and issued the shares to U.S. Trust Company, N.A., as Trustee of the AECOM Technology Corporation Supplemental Trust. This Class B Stock has been issued to secure, in part, the Company's obligation under the Stock Purchase Plan, although the stock is subject to the claims of the Company's creditors. Only the Trustee is eligible to hold this stock. The participants in the Stock Purchase Plan have no ownership interest in this stock. The shares carry one vote per share and are voted by the Trustee in its sole discretion. Upon distribution or reduction of Common Stock Units by the Stock Purchase Plan, the corresponding number of shares of Class B Stock will be returned by the Trustee to the Company for cancellation. Upon issuance of additional Common Stock Units to the Stock Purchase Plan, a like number of shares of Class B Stock will be issued to the Trustee. The Class B Stock has a par value of $.01 per share, carries with it a liquidation preference and redemption value of $.01 per share, and has no right to any dividend.
On April 15, 2003, the Company amended its Certificate of Incorporation to authorize the issuance of Class C Stock. The Class C Stock has no par value, each share is entitled to 100,000 votes on all matters to be voted on by the Company's shareholders, has no right to any dividend and enjoys a liquidation and redemption value of $1.00 per share.
Both the Class B Stock and the Class C Stock exist as part of the Company's Stock Purchase Plan, or SPP. Until the Class B authorized share limit is reached for each Common Stock Unit acquired under the SPP, a share of Class B Stock was issued to the trustee of the Company's stock plan (the only entity eligible to hold such stock) and once the Class B authorized share limit is reached, for each 100,000 Common Stock Units acquired under the SPP, a share of Class C Stock will be issued to the
trustee. Conversely, upon cancellation of (i) a common stock unit or (ii) 100,000 common stock units, the trustee will return a share of Class B Stock or one share of Class C Stock, respectively, to the
Company for cancellation. The trustee has sole discretion as how it votes each share of Class B Stock and Class C Stock.
Pursuant to an exchange agreement dated January 14, 2004, U.S. Trust exchanged the 5.010.0 million shares of Class B preferred stock held by it in exchange for 50100 shares of Class C preferred stock. Shortly after such exchange, the Company deposited $49,950, representing the additional liquidation preference of the Class B preferred stock tendered by U.S. Trust over the liquidation preference of the Class C preferred stock received by it, into the Supplemental Trust in respect of the common stock units. Thereafter, a certificate of elimination was filed by the Company with the Delaware Secretary of State eliminating the Class B preferred stock and the Company withdrew $49,950 from the Supplemental Trust in accordance with the trust rules. This has the effect of restoring Class B shares exchanged to the status of authorized but unissued shares of preferred stock, which can be issued by the Company in the future. The only voting stock associated with our SPP units going forward will be the Class C stock.
Redeemable Preferred Stock, Class D—Prior to February 9, 2006, the Company had outstanding Class D convertible preferred stock which was limited to an aggregate of 120,000 shares with a par value of $0.01 per share and a liquidation preference of $1,000 per share. Holders of the convertible preferred stock were entitled to receive dividends payable at the rate of 7% per annum on the liquidation preference either in cash or in additional shares of Class D stock, at the Company's election; provided, however, that so long as a Default Rate Event (as defined below) had occurred and continued, the dividend rate would increase to 10% per annum. The terms of the Class D stock prohibited the Company from paying cash dividends in respect of its common stock until the Company consummated an Initial Public Offering (IPO). "Default Rate Event" means (i) the Company's failure to redeem all the outstanding shares of the Class D stock on June 25, 2010; (ii) the Company's failure to meet its obligations upon a liquidation event; and (iii) the Company's material breach of the special class voting rights provisions. Dividends on the Class D stock weewere payable quarterly on last day of February, May, August, and November of each year. On February 9, 2006, the Company redeemed all of the outstanding shares of the Class D convertible preferred stock and repurchased all of the outstanding warrants held by the holders of the Class D convertible preferred stock to purchase its common stock.
Class E Stock—The Class E preferred stock is limited to an aggregate of 20 shares, has no par value, and has a liquidation preference of $1.00 per share. These shares may only be issued to and held by the Trustee of the AECOM Technology Corporation Supplemental Trust and are not entitled to receive any dividends. These shares have limited voting rights primarily involving voluntary liquidation, dissolution or winding up the affairs of the Company; sale of all or substantially all of the properties of the Company; change in beneficial ownership of more than fifty percent of the voting stock of the Company; and the issuance on sale of stock in an initial public offering in which the Company's common stock is listed on the New York Stock Exchange or the NASDAQ National Market. In such cases, each share is entitled 100,000 votes per share on all matters voted on by holders of Class E stock. The Company, with notice, may redeem Class E stock by paying the liquidation preference. The holders of Class E stock have no conversion rights.
All shares of Class E stock redeemed or repurchased by the Corporation shall be restored to the status of authorized but un-issued shares of Preferred Stock, without designation as to series.
Class F and Class G Convertible Preferred Stock
Dividends. The Class F and Class G convertible preferred stock do not receive a stated dividend. If, however, we should declare or pay dividends on our common stock, then holders of our Class F and Class G convertible preferred stock will be entitled to receive dividends equal to the amount that would have been payable had the Class F and Class G preferred shares been converted into common stock immediately prior to the record date for such dividend.
Mandatory Redemption. We must redeem all outstanding shares of the Class F and Class G convertible preferred stock upon the earlier of (a) February 9, 2012 or (b) the sale of substantially all of our assets. The redemption price will equal the greater of (i) the liquidation preference of such share of Class F or Class G preferred stock, which is $2,500 per share, and (ii) (A) if the redemption occurs on the maturity date of February 9, 2012, the fair market value of the shares of common stock into which such shares of Class F and Class G would have converted on February 8, 2012 or (B) if the redemption occurs as a result of a sale of substantially all of our assets, the amount (on an as converted to common stock basis) that each share of common stock would be entitled to receive on the date of such sale of substantially all of our assets.
Conversion. Each share of the Class F and Class G convertible preferred stock is convertible, at the election of the holder thereof, into our common stock at an initial conversion rate of approximately 99.7199.4 shares of common stock for each share of Class F and G preferred stock. The conversion rate is determined by dividing the liquidation preference of $2,500 per share by the initial conversion price of $25.07$12.54 per share. The conversion rate and conversion price are subject to certain anti-dilution adjustments, based on future issuances of our common stock (other than issuances at fair market value to employees, directors, consultants participating in our stock plans or shareholders of a firm we acquire in the ordinary course of business).
In addition the Class F and Class G convertible preferred stock will automatically be converted into our common stock (A) if our common stock is listed on the New York Stock Exchange, American Stock Exchange or NASDAQ in connection with a public offering with aggregate gross proceeds to us of at least $50,000,000 or (B) the affirmative written election of the holders of the Class F and/or Class G preferred stock, as applicable.
Liquidation Rights. In the event of our voluntary or involuntary liquidation, dissolution or winding up, or a change of control, the holders of shares of the Class F and Class G convertible preferred stock are entitled to receive, out of our assets available for distribution to stockholders before any distribution of assets or any payments are made to holders of our common stock or of any other shares of our stock ranking as to such a distribution junior to the shares of Class F and Class G convertible preferred stock, liquidating distributions in an amount equal to $2,500 per share. After payment of such liquidating distributions, the holders of shares of Class F and Class G convertible preferred stock will not be entitled to any further participation in any distribution of assets by us.
Voting Rights. The Class F and Class G convertible preferred stock vote together with our common stock as a single class on all matters voted on by holders of our common stock. The shares so
voted will be the number of shares of our common stock into which such Class F and Class G convertible preferred stock is then convertible. In addition, the approval of the holders of a majority of our Class F and Class G convertible preferred stock, each voting as a separate class, as applicable will
be required for certain actions by the Company that materially affect the Class F or Class G convertible preferred stock.
Designation of Board Members. The holders of a majority of our Class F convertible preferred stock and the holders of a majority of our Class G convertible preferred stock are each entitled to appoint one member to our board of directors. Each group of holders will maintain this board appointment right so long as it continues to hold Class F and Class G convertible preferred stock, as applicable, with a liquidation preference equal to at least 50% of the aggregate liquidation preference of the Class F or Class G shares, as applicable, initially purchased by it.
Registration Rights. The holders of the Class F and Class G convertible preferred stock have certain registration rights that may result in such holders being able to sell their shares of common stock in a registered offering after an initial public offering of our common stock before other holders of our common stock.
Preemptive Rights. If we issue shares of common stock or securities convertible or exercisable into common stock at a price per share below fair market value, then the holders of Class F and G convertible preferred stock will have a preemptive right to purchase a pro rata share of such new securities, subject to customary exceptions including an exception for shares issued pursuant to our stock plans.
Common and Preferred Stock Units—Common and Preferred Stock Units (Stock Units) under the Stock Purchase Plan may only be redeemed for Common Stock. The holders of Stock Units are not entitled to vote but are entitled to dividends if dividends are declared on Common Stock. In the event of the liquidation of the Company, holders of the Stock Units are entitled to no right greater than holders of Common Stock.
Stock Warrants—The Company issued 500,0001,000,000 warrants in conjunction with the sale of Class D convertible preferred stock. The warrants entitled the holders to purchase Common Stock of the Company at $16.74$8.37 per share, in whole or in part, at any time and from time to time on or before the expiration date of the Warrants on June 24, 2010, as long as all the Class D stock had been redeemed. If all the Class D stock had not been redeemed, then the proportional amount of Warrants associated with the unredeemed Class D stock would have expired when all the Class D convertible preferred stock had been redeemed, but in no event later than June 24, 2011. Until exercise of the Warrants, the holders of the Warrants did not have nor exercise any rights as a stockholder of the Company, either at law or in equity. The Warrants were valued at issuance using the Black-Scholes Warrant pricing model. On February 9, 2006, the Company repurchased 100% of the outstanding warrants.
16. Earnings Per Share
Basic EPS excludes dilution and is computed by dividing the income available to common stock and common stock unit holders by the weighted average number of shares and units outstanding for the period. Diluted EPS is computed by dividing income available to common stock and common stock unit holders by the weighted average number of shares and units outstanding and the weighted average
potential common shares. Potential common shares include the dilutive effects of outstanding stock options, stock match shares and units, preferred stock and warrants. The issuance of stock match shares and units is reflected in basic EPS on the last day of the fiscal quarter when the actual number of
shares and units is determined based on the quarter-end price per share and in diluted EPS when the match is accrued based on the then current price per share.
The following table sets forth a reconciliation of the numerators and denominators of the basic and diluted earnings per share computations:
| | | Fiscal Year Ended | | Fiscal Year Ended | ||||||||||||||||||||
|---|---|---|---|---|---|---|---|---|---|---|---|---|---|---|---|---|---|---|---|---|---|---|---|---|
| | | September 30, 2004 | September 30, 2005 | September 30, 2006 | | September 30, 2004 | September 30, 2005 | September 30, 2006 | ||||||||||||||||
| | | (in thousands, except per share data) | | (in thousands, except per share data) | ||||||||||||||||||||
| Numerator for basic earnings per share: | Numerator for basic earnings per share: | Numerator for basic earnings per share: | ||||||||||||||||||||||
| Net income | $ | 50,436 | $ | 53,814 | $ | 53,686 | Net income | $ | 50,436 | $ | 53,814 | $ | 53,686 | |||||||||||
| Preferred stock dividends | (5,443 | ) | (5,506 | ) | (2,205 | ) | Preferred stock dividends | (5,443 | ) | (5,506 | ) | (2,205 | ) | |||||||||||
| Net income available for common stockholders | $ | 44,993 | $ | 48,308 | $ | 51,481 | Net income available for common stockholders | $ | 44,993 | $ | 48,308 | $ | 51,481 | |||||||||||
| Denominator for basic earnings per share: | Denominator for basic earnings per share: | Denominator for basic earnings per share: | ||||||||||||||||||||||
| Weighted average shares | 26,300 | 25,940 | 27,428 | Weighted average shares | 52,600 | 51,880 | 54,856 | |||||||||||||||||
| Numerator for diluted earnings per share: | Numerator for diluted earnings per share: | Numerator for diluted earnings per share: | ||||||||||||||||||||||
| Net income | $ | 50,436 | $ | 53,814 | $ | 53,686 | Net income | $ | 50,436 | $ | 53,814 | $ | 53,686 | |||||||||||
| Denominator for diluted earnings per share: | Denominator for diluted earnings per share: | Denominator for diluted earnings per share: | ||||||||||||||||||||||
| Denominator for basic earnings per share | 26,300 | 25,940 | 27,428 | Denominator for basic earnings per share | 52,600 | 51,880 | 54,856 | |||||||||||||||||
| Potential common shares: | Potential common shares: | |||||||||||||||||||||||
| Preferred stock, Class D | 4,480 | 4,480 | 1,582 | Preferred stock, Class D | 8,960 | 8,960 | 3,164 | |||||||||||||||||
| Preferred stock, Class F and Class G | — | — | 5,963 | Preferred stock, Class F and Class G | — | — | 11,926 | |||||||||||||||||
| Stock options | 1,103 | 1,242 | 1,079 | Stock options | 2,206 | 2,484 | 2,158 | |||||||||||||||||
| Preferred stock, other | 138 | 171 | 184 | Preferred stock, other | 276 | 342 | 368 | |||||||||||||||||
| Stock matches | 16 | 14 | 20 | Stock matches | 32 | 28 | 40 | |||||||||||||||||
| Stock units | 11 | 15 | 14 | Stock units | 22 | 30 | 28 | |||||||||||||||||
| Stock warrants | 79 | 127 | 59 | Stock warrants | 158 | 254 | 118 | |||||||||||||||||
| Denominator for diluted earnings per share | 32,127 | 31,989 | 36,329 | Denominator for diluted earnings per share | 64,254 | 63,978 | 72,658 | |||||||||||||||||
| Earnings per share: | Earnings per share: | Earnings per share: | ||||||||||||||||||||||
| Basic | $ | 1.71 | $ | 1.86 | $ | 1.88 | Basic | $ | 0.86 | $ | 0.93 | $ | 0.94 | |||||||||||
| Diluted | $ | 1.57 | $ | 1.68 | $ | 1.48 | Diluted | $ | 0.78 | $ | 0.84 | $ | 0.74 | |||||||||||
For the fiscal years ended September 30, 2004, September 30, 2005 and September 30, 2006, no options were excluded from the calculation of potential common shares because their exercise prices exceeded the average market price for that period.
17. Foreign Currency
The Company uses forward exchange contracts from time to time to mitigate foreign currency risk. The Company limits exposure to foreign currency fluctuations in most of its contracts through provisions that require client payments in currencies corresponding to the currency in which costs are incurred. As a result of this natural hedge, the Company generally does not need to hedge foreign currency cash flows for contract work performed. The functional currency of all significant foreign operations is the respective local currency.
18. Commitments and Contingencies
The Company is a defendant in various lawsuits arising in the normal course of business. In the opinion of management, the ultimate resolution of these matters will not have a material adverse effect on the financial position of the Company.
The Company is contingently liable in the amount of approximately $43.6 million under standby letters of credit issued primarily in connection with general and professional liability insurance programs and for payment and performance guarantees relating to domestic and overseas contracts. In addition, in some instances the Company guarantees that a project, when complete, will achieve specified performance standards. If the project subsequently fails to meet guaranteed performance standards, the Company may either incur significant additional costs or be held responsible for the costs incurred by the client to achieve the required performance standards.
Under joint venture arrangements, if a partner is financially unable to complete its share of the contract, the other partner(s) will be required to complete those activities. The Company generally only enters into joint venture arrangements with partners who are reputable, financially sound and who carry appropriate levels of surety bonds for the project in order to adequately assure completion of their assignments. The Company is a partner in certain joint ventures where the joint venture has contracted with sub-consultants for certain specialized professional services. The joint venture, or the Company to the extent that the joint venture partner (s) are unable to fulfill their responsibilities, is liable to the third-party customer for performance of the sub-consultant and would be liable to the sub-consultant if the third-party customer failed to make payments due the joint venture for sub-consultant services.
Prior to fiscal 2002 the Company had Performance Unit Plans (PUPs) under which the Board of Directors granted performance unit awards to executive officers and key employees of AECOM and its subsidiaries. In the first quarter of fiscal 2002, the Company terminated the PUPs and accrued and fully vested all participants, as a group, at the projected level of each participant's award. At September 30, 2005, the Company had awards outstanding under the PUP in the amount of $3.0 million which was paid prior to September 30, 2006.
In July 2006, the Company executed a purchase agreement, subject to, among other conditions, Chinese government regulatory approvals, to acquire a 10% interest in Shanghai Tunnel Engineering Co., Ltd., or STEC. STEC is a Shanghai, China-based professional technical services firm which specializes in transportation design. If we receive regulatory approval, the consideration would consist of cash that would be paid no later than 120 days after the effective date of such approval.
19. Reportable Segments and Geographic Information
The Company's management has organized its operations into two reportable segments: Professional Technical Services and Management Support Services. This segmentation corresponds to how the Company manages its business as well as the underlying characteristics of its markets.
Management internally analyzes the results of its operations using several non-GAAP measures. A significant portion of the Company's revenuesrevenue relates to services provided by subcontractors and other non-employees that it categorizes as other direct costs. Those pass-through costs are typically paid to service providers upon our receipt of payment from the client. Other direct costs are segregated from cost of revenuesrevenue resulting in revenue, net service revenuesof other direct costs which is a measure of work performed by AECOM employees. The Company has included information on revenue, net service revenues as it believes that it is a more accurate measure on which to base gross margin.of other direct costs. In addition, compensation expense, included in both cost of revenuesrevenue and general and administrative expense, associated with the non-cash stock matches, is segregated and shown below general and administrative expense as it is considered by management to be a function of the level of stock purchased by employees and not a cost of work performed.
The following tables set forth summarized financial information concerning the Company's reportable segments:
| Reportable Segments: | Professional Technical Services | Management Support Services | Total | Professional Technical Services | Management Support Services | Total | ||||||||||||||
|---|---|---|---|---|---|---|---|---|---|---|---|---|---|---|---|---|---|---|---|---|
| | (in thousands) | (in thousands) | ||||||||||||||||||
| Fiscal Year Ended September 30, 2004: | ||||||||||||||||||||
| Revenue | $ | 1,777,718 | $ | 232,143 | $ | 2,009,861 | $ | 1,777,718 | $ | 232,143 | $ | 2,009,861 | ||||||||
| Net service revenue | 1,198,354 | 35,785 | 1,234,139 | |||||||||||||||||
| Revenue, net of other direct costs | 1,198,354 | 35,785 | 1,234,139 | |||||||||||||||||
| Gross profit | 561,392 | 6,386 | 567,778 | 561,392 | 6,386 | 567,778 | ||||||||||||||
| Gross profit as a % of revenue | 31.6 | % | 2.8 | % | 28.2 | % | 31.6 | % | 2.8 | % | 28.2 | % | ||||||||
| Gross profit as a % of net service revenue | 46.8 | % | 17.8 | % | 46.0 | % | ||||||||||||||
| Gross profit as a % of revenue, net of other direct costs | 46.8 | % | 17.8 | % | 46.0 | % | ||||||||||||||
| Equity in earnings of joint ventures | 2,517 | — | 2,517 | 2,517 | — | 2,517 | ||||||||||||||
| General and administrative expenses | 460,331 | 5,636 | 465,967 | 460,331 | 5,636 | 465,967 | ||||||||||||||
| Segment income from operations | 100,270 | 1,944 | 102,214 | 100,270 | 1,944 | 102,214 | ||||||||||||||
| Segment assets | 910,554 | 69,352 | 979,906 | 910,554 | 69,352 | 979,906 | ||||||||||||||
Fiscal Year Ended September 30, 2005: | ||||||||||||||||||||
| Revenue | $ | 2,082,618 | $ | 309,053 | $ | 2,391,671 | $ | 2,082,618 | $ | 309,053 | $ | 2,391,671 | ||||||||
| Net service revenue | 1,415,450 | 42,977 | 1,458,427 | |||||||||||||||||
| Revenue, net of other direct costs | 1,415,450 | 42,977 | 1,458,427 | |||||||||||||||||
| Gross profit | 662,219 | 13,967 | 676,186 | 662,219 | 13,967 | 676,186 | ||||||||||||||
| Gross profit as a % of revenue | 31.8 | % | 4.5 | % | 28.3 | % | 31.8 | % | 4.5 | % | 28.3 | % | ||||||||
| Gross profit as a % of net service revenue | 46.8 | % | 32.5 | % | 46.4 | % | ||||||||||||||
| Gross profit as a % of revenue, net of other direct costs | 46.8 | % | 32.5 | % | 46.4 | % | ||||||||||||||
| Equity in earnings of joint ventures | 2,352 | — | 2,352 | 2,352 | — | 2,352 | ||||||||||||||
| General and administrative expenses | 555,642 | 8,129 | 563,771 | 555,642 | 8,129 | 563,771 | ||||||||||||||
| Segment income from operations | 106,228 | 5,838 | 112,066 | 106,228 | 5,838 | 112,066 | ||||||||||||||
| Segment assets | 1,257,093 | 87,685 | 1,344,778 | 1,257,093 | 87,685 | 1,344,778 | ||||||||||||||
Fiscal Year Ended September 30, 2006: | ||||||||||||||||||||
| Revenue | $ | 2,772,833 | $ | 647,188 | $ | 3,420,021 | $ | 2,772,833 | $ | 647,188 | $ | 3,420,021 | ||||||||
| Net service revenue | 1,787,078 | 89,794 | 1,876,872 | |||||||||||||||||
| Revenue, net of other direct costs | 1,787,078 | 89,794 | 1,876,872 | |||||||||||||||||
| Gross profit | 872,305 | 38,873 | 911,178 | 872,305 | 38,873 | 911,178 | ||||||||||||||
| Gross profit as a % of revenue | 31.5 | % | 6.0 | % | 26.6 | % | 31.5 | % | 6.0 | % | 26.6 | % | ||||||||
| Gross profit as a % of net service revenue | 48.8 | % | 43.3 | % | 48.5 | % | ||||||||||||||
| Gross profit as a % of revenue, net of other direct costs | 48.8 | % | 43.3 | % | 48.5 | % | ||||||||||||||
| Equity in earnings of joint ventures | 2,958 | 4,942 | 7,900 | 2,958 | 4,942 | 7,900 | ||||||||||||||
| General and administrative expenses | 745,237 | 20,886 | 766,123 | 745,237 | 20,886 | 766,123 | ||||||||||||||
| Segment income from operations | 130,026 | 22,929 | 152,955 | 130,026 | 22,929 | 152,955 | ||||||||||||||
| Segment assets | 1,601,634 | 111,726 | 1,713,360 | 1,601,634 | 111,726 | 1,713,360 | ||||||||||||||
Reconciliations:
| | Fiscal Year Ended | ||||||||||
|---|---|---|---|---|---|---|---|---|---|---|---|
| | September 30, 2004 | September 30, 2005 | September 30, 2006 | ||||||||
| | (in thousands) | ||||||||||
| Revenue: | |||||||||||
| Revenue from reportable segments | $ | 2,009,861 | $ | 2,391,671 | $ | 3,420,021 | |||||
| Other revenue | 2,114 | 3,669 | 1,471 | ||||||||
| Total consolidated revenue | $ | 2,011,975 | $ | 2,395,340 | $ | 3,421,492 | |||||
| Gross profit: | |||||||||||
| Gross profit from reportable segments | $ | 567,778 | $ | 676,186 | $ | 911,178 | |||||
| Other contributions to gross profit | 778 | 1,291 | (5,370 | ) | |||||||
| Total consolidated gross profit | $ | 568,556 | $ | 677,477 | $ | 905,808 | |||||
| General and administrative expenses: | |||||||||||
| G&A expenses from reportable segments | $ | 465,967 | $ | 563,771 | $ | 766,123 | |||||
| Unallocated corporate general and administrative expenses | 18,479 | 17,758 | 42,830 | ||||||||
| Total consolidated general and administrative expenses | $ | 484,446 | $ | 581,529 | $ | 808,953 | |||||
| Income from operations: | |||||||||||
| Income from operations from reportable segments | $ | 102,214 | $ | 112,066 | $ | 152,955 | |||||
| Expenses not allocated to reportable segments | (15,587 | ) | (13,766 | ) | (49,546 | ) | |||||
| Total consolidated income from operations | $ | 86,627 | $ | 98,300 | $ | 103,409 | |||||
| Total assets: | |||||||||||
| Total assets from reportable segments | $ | 979,906 | $ | 1,344,778 | $ | 1,713,360 | |||||
| Total assets not allocated to segments and eliminations | 141,973 | 80,146 | 112,414 | ||||||||
| Total consolidated assets | $ | 1,121,879 | $ | 1,424,924 | $ | 1,825,774 | |||||
Geographic Information, by location of client:
| | Fiscal Year Ended | |||||||||||||||||
|---|---|---|---|---|---|---|---|---|---|---|---|---|---|---|---|---|---|---|
| | September 30, 2004 | September 30, 2005 | September 30, 2006 | |||||||||||||||
| | Revenue | Long-Lived Assets | Revenue | Long-Lived Assets | Revenue | Long-Lived Assets | ||||||||||||
| | (in thousands) | |||||||||||||||||
| United States | $ | 1,492,953 | $ | 189,809 | $ | 1,680,452 | $ | 326,168 | $ | 2,497,769 | $ | 377,375 | ||||||
| Foreign Countries | 519,022 | 192,754 | 714,888 | 220,655 | 923,723 | 256,075 | ||||||||||||
| Total | $ | 2,011,975 | $ | 382,563 | $ | 2,395,340 | $ | 546,823 | $ | 3,421,492 | $ | 633,450 | ||||||
20. Major Clients
Approximately, 19%, 22% and 28% of the Company's revenue was derived through direct contracts with agencies of the U.S. Federal Government in the years ended September 30, 2004, 2005, and 2006, respectively. One of these contracts accounted for approximately 9% of the Company's revenue in each of the years ended September 30, 2004, 2005, and 2006. No single client accounted for more than 10% of the Company's revenue.
21. Quarterly Financial Information—Unaudited
In the opinion of management, the following unaudited quarterly data for the fiscal years ended September 30, 2005 and September 30, 2006 reflect all adjustments necessary for a fair statement of the results of operations. All such adjustments are of a normal recurring nature.
| Fiscal Year 2005: | Fiscal Year 2005: | First Quarter | Second Quarter | Third Quarter | Fourth Quarter | Fiscal Year 2005: | First Quarter | Second Quarter | Third Quarter | Fourth Quarter | ||||||||||||||||
|---|---|---|---|---|---|---|---|---|---|---|---|---|---|---|---|---|---|---|---|---|---|---|---|---|---|---|
| | | (in thousands, except per share data) | | (in thousands, except per share data) | ||||||||||||||||||||||
| Revenue | Revenue | $ | 531,064 | $ | 579,507 | $ | 624,931 | $ | 659,838 | Revenue | $ | 531,064 | $ | 579,507 | $ | 624,931 | $ | 659,838 | ||||||||
| Cost of revenue | Cost of revenue | 381,298 | 412,234 | 451,435 | 472,896 | Cost of revenue | 381,298 | 412,234 | 451,435 | 472,896 | ||||||||||||||||
| Gross profit | Gross profit | 149,766 | 167,273 | 173,496 | 186,942 | Gross profit | 149,766 | 167,273 | 173,496 | 186,942 | ||||||||||||||||
| Equity in earnings of joint ventures | Equity in earnings of joint ventures | 763 | 223 | 130 | 1,236 | Equity in earnings of joint ventures | 763 | 223 | 130 | 1,236 | ||||||||||||||||
| General and administrative expenses | General and administrative expenses | 130,090 | 146,695 | 149,559 | 155,185 | General and administrative expenses | 130,090 | 146,695 | 149,559 | 155,185 | ||||||||||||||||
| Income from operations | Income from operations | 20,439 | 20,801 | 24,067 | 32,993 | Income from operations | 20,439 | 20,801 | 24,067 | 32,993 | ||||||||||||||||
| Minority interest in share of earnings | Minority interest in share of earnings | 1,465 | 2,504 | 2,329 | 2,155 | Minority interest in share of earnings | 1,465 | 2,504 | 2,329 | 2,155 | ||||||||||||||||
| Interest expense, net | Interest expense, net | 1,763 | 2,286 | 1,366 | 1,639 | Interest expense, net | 1,763 | 2,286 | 1,366 | 1,639 | ||||||||||||||||
| Income before income tax expense | Income before income tax expense | 17,211 | 16,011 | 20,372 | 29,199 | Income before income tax expense | 17,211 | 16,011 | 20,372 | 29,199 | ||||||||||||||||
| Income tax expense | Income tax expense | 6,023 | 5,604 | 7,130 | 10,222 | Income tax expense | 6,023 | 5,604 | 7,130 | 10,222 | ||||||||||||||||
| Net income | Net income | $ | 11,188 | $ | 10,407 | $ | 13,242 | $ | 18,977 | Net income | $ | 11,188 | $ | 10,407 | $ | 13,242 | $ | 18,977 | ||||||||
| Net income allocation: | Net income allocation: | Net income allocation: | ||||||||||||||||||||||||
| Preferred stock dividend | $ | 1,373 | $ | 1,373 | $ | 1,378 | $ | 1,382 | Preferred stock dividend | $ | 1,373 | $ | 1,373 | $ | 1,378 | $ | 1,382 | |||||||||
| Net income available to common stockholders | 9,814 | 9,034 | 11,864 | 17,595 | Net income available to common stockholders | 9,815 | 9,034 | 11,864 | 17,595 | |||||||||||||||||
| Net income | $ | 11,188 | $ | 10,407 | $ | 13,242 | $ | 18,977 | Net income | $ | 11,188 | $ | 10,407 | $ | 13,242 | $ | 18,977 | |||||||||
| Basic earnings per share | $ | 0.37 | $ | 0.36 | $ | 0.46 | $ | 0.67 | Basic earnings per share | $ | 0.18 | $ | 0.18 | $ | 0.23 | $ | 0.34 | |||||||||
| Diluted earnings per share | $ | 0.34 | $ | 0.34 | $ | 0.42 | $ | 0.59 | Diluted earnings per share | $ | 0.17 | $ | 0.17 | $ | 0.21 | $ | 0.29 | |||||||||
| Weighted average common shares outstanding: | Weighted average common shares outstanding: | Weighted average common shares outstanding: | ||||||||||||||||||||||||
| Basic | 26,835 | 24,822 | 25,846 | 26,259 | Basic | 53,670 | 49,644 | 51,692 | 52,518 | |||||||||||||||||
| Diluted | 32,585 | 30,709 | 31,764 | 32,174 | Diluted | 65,170 | 61,418 | 63,528 | 64,348 | |||||||||||||||||
| Fiscal Year 2006: | Fiscal Year 2006: | First Quarter | Second Quarter | Third Quarter | Fourth Quarter | Fiscal Year 2006: | First Quarter | Second Quarter | Third Quarter | Fourth Quarter | ||||||||||||||||
|---|---|---|---|---|---|---|---|---|---|---|---|---|---|---|---|---|---|---|---|---|---|---|---|---|---|---|
| | | (in thousands, except per share data) | | (in thousands, except per share data) | ||||||||||||||||||||||
| Revenue | Revenue | $ | 746,797 | $ | 858,930 | $ | 911,486 | $ | 904,279 | Revenue | $ | 746,797 | $ | 858,930 | $ | 911,486 | $ | 904,279 | ||||||||
| Cost of revenue | Cost of revenue | 546,758 | 629,907 | 678,581 | 660,438 | Cost of revenue | 546,758 | 629,907 | 678,581 | 660,438 | ||||||||||||||||
| Gross profit | Gross profit | 200,039 | 229,023 | 232,905 | 243,841 | Gross profit | 200,039 | 229,023 | 232,905 | 243,841 | ||||||||||||||||
| Equity in earnings of joint ventures | Equity in earnings of joint ventures | 1,670 | 893 | 1,554 | 2,437 | Equity in earnings of joint ventures | 1,670 | 893 | 1,554 | 2,437 | ||||||||||||||||
| General and administrative expenses | General and administrative expenses | 176,983 | 204,838 | 209,340 | 217,792 | General and administrative expenses | 176,983 | 204,838 | 209,340 | 217,792 | ||||||||||||||||
| Income from operations | Income from operations | 24,726 | 25,078 | 25,119 | 28,486 | Income from operations | 24,726 | 25,078 | 25,119 | 28,486 | ||||||||||||||||
| Minority interest in share of earnings | Minority interest in share of earnings | 1,951 | 3,530 | 3,022 | 5,421 | Minority interest in share of earnings | 1,951 | 3,530 | 3,022 | 5,421 | ||||||||||||||||
| Interest expense, net | Interest expense, net | 3,723 | 4,067 | 2,528 | 258 | Interest expense, net | 3,723 | 4,067 | 2,528 | 258 | ||||||||||||||||
| Income before income tax expense | Income before income tax expense | 19,052 | 17,481 | 19,569 | 22,807 | Income before income tax expense | 19,052 | 17,481 | 19,569 | 22,807 | ||||||||||||||||
| Income tax expense | Income tax expense | 6,097 | 5,594 | 6,262 | 7,270 | Income tax expense | 6,097 | 5,594 | 6,262 | 7,270 | ||||||||||||||||
| Net income | Net income | $ | 12,955 | $ | 11,887 | $ | 13,307 | $ | 15,537 | Net income | $ | 12,955 | $ | 11,887 | $ | 13,307 | $ | 15,537 | ||||||||
| Net income allocation: | Net income allocation: | Net income allocation: | ||||||||||||||||||||||||
| Preferred stock dividend | $ | 1,384 | $ | 663 | $ | 78 | $ | 80 | Preferred stock dividend | $ | 1,384 | $ | 663 | $ | 78 | $ | 80 | |||||||||
| Net income available to common stockholders | 11,571 | 11,224 | 13,229 | 15,457 | Net income available to common stockholders | 11,571 | 11,224 | 13,229 | 15,457 | |||||||||||||||||
| Net income | $ | 12,955 | $ | 11,887 | $ | 13,307 | $ | 15,537 | Net income | $ | 12,955 | $ | 11,887 | $ | 13,307 | $ | 15,537 | |||||||||
| Basic earnings per share | $ | 0.43 | $ | 0.42 | $ | 0.47 | $ | 0.55 | Basic earnings per share | $ | 0.22 | $ | 0.21 | $ | 0.24 | $ | 0.27 | |||||||||
| Diluted earnings per share | $ | 0.40 | $ | 0.34 | $ | 0.36 | $ | 0.40 | Diluted earnings per share | $ | 0.20 | $ | 0.17 | $ | 0.18 | $ | 0.20 | |||||||||
| Weighted average common shares outstanding: | Weighted average common shares outstanding: | Weighted average common shares outstanding: | ||||||||||||||||||||||||
| Basic | 26,644 | 26,838 | 27,881 | 28,350 | Basic | 53,288 | 53,676 | 55,762 | 56,700 | |||||||||||||||||
| Diluted | 32,612 | 35,153 | 36,941 | 39,018 | Diluted | 65,224 | 70,306 | 73,882 | 78,036 | |||||||||||||||||
22. Related Party Transactions
In conjunction with an acquisition made in fiscal 2005, the Company assumed an operating lease in which the lessor is a company affiliated with the former shareholder of the acquired entity, who now serves as the President of one of the Company's operating subsidiaries. Remaining amounts payable under the lease, which expires in August 2015, are $6.2 million. In the fiscal years ended September 30, 2005 and 2006, lease payments to this related party totaled $0.0 million and $0.7 million, respectively.
23. Litigation and Legal Proceedings
The Company is subject to certain claims and lawsuits filed against engineering and technical services firms. From time to time, the Company is a defendant in lawsuits involving its alleged professional liability, personal injury, contract and other disputes arising in the normal course of business. To some extent, these matters are covered by insurance, and in other cases, the Company is self-insured.
24. Subsequent Events—UnauditedEvents
In December 2006, the Company sold its equity investment in a U.K. based company for approximately 7.5 million GBP, or approximately $14.7 million.million (Unaudited).
The Company's board of directors approved a two-for-one stock split, effected as a 100-percent dividend on the Company's common stock, effective May 4, 2007. All share and per share amounts presented have been adjusted accordingly, on a retroactive basis, to reflect this stock dividend.
AECOM Technology Corporation
Condensed Consolidated Balance Sheets
(in thousands, except share data)
| | | September 30, 2006 | December 31, 2006 | | September 30, 2006 | March 31, 2007 | ||||||||||||
|---|---|---|---|---|---|---|---|---|---|---|---|---|---|---|---|---|---|---|
| | | | (Unaudited) | | | (Unaudited) | ||||||||||||
| ASSETS | ASSETS | ASSETS | ||||||||||||||||
| CURRENT ASSETS: | CURRENT ASSETS: | CURRENT ASSETS: | ||||||||||||||||
| Cash and cash equivalents | $ | 118,427 | $ | 107,377 | ||||||||||||||
| Cash in consolidated joint ventures | 9,393 | 30,347 | Cash and cash equivalents | $ | 118,427 | $ | 84,472 | |||||||||||
| Short-term investments | 50 | 50 | Cash in consolidated joint ventures | 9,393 | 31,742 | |||||||||||||
| Short-term investments | 50 | 50 | ||||||||||||||||
| Total cash and cash equivalents | 127,870 | 137,774 | ||||||||||||||||
Accounts receivable—net | 913,178 | 928,404 | Total cash and cash equivalents | 127,870 | 116,264 | |||||||||||||
| Prepaid expenses and other current assets | 52,827 | 58,529 | Accounts receivable—net | 913,178 | 1,040,079 | |||||||||||||
| Deferred tax asset | — | 121 | Prepaid expenses and other current assets | 52,827 | 56,665 | |||||||||||||
| TOTAL CURRENT ASSETS | 1,093,875 | 1,124,828 | TOTAL CURRENT ASSETS | 1,093,875 | 1,213,008 | |||||||||||||
| PROPERTY AND EQUIPMENT: | PROPERTY AND EQUIPMENT: | PROPERTY AND EQUIPMENT: | ||||||||||||||||
| Equipment, furniture and fixtures | 85,201 | 85,570 | Equipment, furniture and fixtures | 85,201 | 109,214 | |||||||||||||
| Leasehold improvements | 31,539 | 36,677 | Leasehold improvements | 31,539 | 38,147 | |||||||||||||
| Total | 116,740 | 122,247 | Total | 116,740 | 147,361 | |||||||||||||
| Accumulated depreciation and amortization | (26,417 | ) | (27,825 | ) | Accumulated depreciation and amortization | (26,417 | ) | 38,276 | ||||||||||
| PROPERTY AND EQUIPMENT—NET | 90,323 | 94,422 | PROPERTY AND EQUIPMENT—NET | 90,323 | 109,085 | |||||||||||||
| DEFERRED INCOME TAXES | DEFERRED INCOME TAXES | 98,449 | 105,528 | DEFERRED INCOME TAXES | 98,449 | 110,178 | ||||||||||||
| DEFERRED LOAN COSTS | DEFERRED LOAN COSTS | 1,444 | 1,424 | DEFERRED LOAN COSTS | 1,444 | 1,404 | ||||||||||||
| INVESTMENTS IN UNCONSOLIDATED SUBSIDIARIES | INVESTMENTS IN UNCONSOLIDATED SUBSIDIARIES | 19,943 | 21,389 | INVESTMENTS IN UNCONSOLIDATED SUBSIDIARIES | 19,943 | 20,589 | ||||||||||||
| GOODWILL | GOODWILL | 466,508 | 472,178 | GOODWILL | 466,508 | 534,575 | ||||||||||||
| INTANGIBLE AND OTHER ASSETS—NET | INTANGIBLE AND OTHER ASSETS—NET | 18,168 | 17,414 | INTANGIBLE AND OTHER ASSETS—NET | 18,168 | 44,068 | ||||||||||||
| OTHER NON-CURRENT ASSETS | OTHER NON-CURRENT ASSETS | 37,064 | 41,447 | OTHER NON-CURRENT ASSETS | 37,064 | 43,289 | ||||||||||||
| TOTAL ASSETS | TOTAL ASSETS | $ | 1,825,774 | $ | 1,878,630 | TOTAL ASSETS | $ | 1,825,774 | $ | 2,076,196 | ||||||||
LIABILITIES AND STOCKHOLDERS' DEFICIT | LIABILITIES AND STOCKHOLDERS' DEFICIT | LIABILITIES AND STOCKHOLDERS' DEFICIT | ||||||||||||||||
| CURRENT LIABILITIES: | CURRENT LIABILITIES: | CURRENT LIABILITIES: | ||||||||||||||||
| Bank overdraft | $ | 2,716 | $ | 5,895 | Short-term debt | $ | 2,716 | $ | 9,725 | |||||||||
| Accounts payable and other current liabilities | 265,192 | 270,203 | Accounts payable | 265,192 | 264,930 | |||||||||||||
| Accrued expenses | 365,548 | 357,228 | Accrued expenses and other current liabilities | 365,548 | 413,323 | |||||||||||||
| Billings in excess of costs on uncompleted contracts | 143,283 | 167,466 | Billings in excess of costs on uncompleted contracts | 143,283 | 200,891 | |||||||||||||
| Income taxes payable | 35,646 | 51,794 | Income taxes payable | 35,646 | 40,977 | |||||||||||||
| Deferred tax liability—net | 12,824 | 13,267 | Deferred tax liability—net | 12,824 | 11,551 | |||||||||||||
| Current portion of share purchase liability | 55,394 | 57,253 | Share purchase liability | 55,394 | 56,634 | |||||||||||||
| Current portion of long-term obligations | 11,949 | 23,626 | Current portion of long-term obligations | 11,949 | 23,533 | |||||||||||||
| TOTAL CURRENT LIABILITIES | 892,552 | 946,732 | TOTAL CURRENT LIABILITIES | 892,552 | 1,021,564 | |||||||||||||
OTHER LONG-TERM LIABILITIES | OTHER LONG-TERM LIABILITIES | 112,970 | 117,071 | OTHER LONG-TERM LIABILITIES | 112,970 | 115,160 | ||||||||||||
LONG-TERM OBLIGATIONS | LONG-TERM OBLIGATIONS | 122,790 | 104,115 | LONG-TERM OBLIGATIONS | 122,790 | 153,118 | ||||||||||||
COMMITMENTS AND CONTINGENCIES | COMMITMENTS AND CONTINGENCIES | COMMITMENTS AND CONTINGENCIES | ||||||||||||||||
| MINORITY INTEREST | MINORITY INTEREST | 18,701 | 17,909 | MINORITY INTEREST | 18,701 | 16,904 | ||||||||||||
REDEEMABLE COMMON AND PREFERRED STOCK AND STOCK UNITS | REDEEMABLE COMMON AND PREFERRED STOCK AND STOCK UNITS | 771,207 | 818,901 | REDEEMABLE COMMON AND PREFERRED STOCK AND STOCK UNITS | 771,207 | 832,624 | ||||||||||||
NOTES RECEIVABLE FROM STOCKHOLDERS | NOTES RECEIVABLE FROM STOCKHOLDERS | (36,552 | ) | (36,607 | ) | NOTES RECEIVABLE FROM STOCKHOLDERS | (36,552 | ) | — | |||||||||
REDEEMABLE PREFERRED STOCK, Class F—authorized, 200,000, issued and outstanding, 47,000 as of September 30, 2006 and December 31, 2006, $2,500 liquidation preference value | 117,500 | 117,500 | ||||||||||||||||
| REDEEMABLE PREFERRED STOCK, Class G—authorized, 200,000, issued and outstanding, 47,000 as of September 30, 2006 and December 31, 2006, $2,500 liquidation preference value | 117,500 | 117,500 | ||||||||||||||||
| REDEEMABLE PREFERRED STOCK, Class F—47,000 authorized, issued and outstanding as of September 30, 2006 and March 31, 2007, $2,500 liquidation preference value per share | REDEEMABLE PREFERRED STOCK, Class F—47,000 authorized, issued and outstanding as of September 30, 2006 and March 31, 2007, $2,500 liquidation preference value per share | 117,500 | 117,500 | |||||||||||||||
| REDEEMABLE PREFERRED STOCK, Class G—47,000 authorized, issued and outstanding as of September 30, 2006 and March 31, 2007, $2,500 liquidation preference value per share | REDEEMABLE PREFERRED STOCK, Class G—47,000 authorized, issued and outstanding as of September 30, 2006 and March 31, 2007, $2,500 liquidation preference value per share | 117,500 | 117,500 | |||||||||||||||
STOCKHOLDERS' DEFICIT: | STOCKHOLDERS' DEFICIT: | STOCKHOLDERS' DEFICIT: | ||||||||||||||||
| Additional paid-in capital | (254,225 | ) | (290,797 | ) | Additional paid-in capital | (254,225 | ) | (289,790 | ) | |||||||||
| Accumulated other comprehensive loss | (36,669 | ) | (33,694 | ) | Accumulated other comprehensive loss | (36,669 | ) | (29,495 | ) | |||||||||
| Retained earnings | — | — | Retained earnings | — | 21,111 | |||||||||||||
| TOTAL STOCKHOLDERS' DEFICIT | TOTAL STOCKHOLDERS' DEFICIT | (290,894 | ) | (324,491 | ) | TOTAL STOCKHOLDERS' DEFICIT | (290,894 | ) | (298,174 | ) | ||||||||
| TOTAL LIABILITIES AND STOCKHOLDERS' DEFICIT | TOTAL LIABILITIES AND STOCKHOLDERS' DEFICIT | $ | 1,825,774 | $ | 1,878,630 | TOTAL LIABILITIES AND STOCKHOLDERS' DEFICIT | $ | 1,825,774 | $ | 2,076,196 | ||||||||
See accompanying Notes to Condensed Consolidated Financial Statements.Statements (unaudited)
AECOM Technology Corporation
Condensed Consolidated Statements of Income
(unaudited—in thousands, except per share data)
| | | Three Months Ended December 31, | | Three Months Ended | Six Months Ended | |||||||||||||||
|---|---|---|---|---|---|---|---|---|---|---|---|---|---|---|---|---|---|---|---|---|
| | | 2005 | 2006 | | March 31, 2006 | March 31, 2007 | March 31, 2006 | March 31, 2007 | ||||||||||||
| Revenue | Revenue | $ | 746,797 | $ | 938,549 | Revenue | $ | 858,930 | $ | 1,083,709 | $ | 1,605,727 | $ | 2,022,258 | ||||||
| Cost of revenue | Cost of revenue | 546,758 | 690,130 | Cost of revenue | 629,907 | 799,838 | 1,176,665 | 1,489,968 | ||||||||||||
| Gross profit | 200,039 | 248,419 | Gross profit | 229,023 | 283,871 | 429,062 | 532,290 | |||||||||||||
| Equity in earnings of joint ventures | Equity in earnings of joint ventures | 1,670 | 1,417 | Equity in earnings of joint ventures | 893 | 2,219 | 2,563 | 3,636 | ||||||||||||
| General and administrative expenses | General and administrative expenses | 176,983 | 219,828 | General and administrative expenses | 204,838 | 248,146 | 381,821 | 467,974 | ||||||||||||
| Income from operations | 24,726 | 30,008 | Income from operations | 25,078 | 37,944 | 49,804 | 67,952 | |||||||||||||
Minority interest in share of earnings | Minority interest in share of earnings | 1,951 | 1,586 | Minority interest in share of earnings | 3,530 | 3,648 | 5,481 | 5,234 | ||||||||||||
| Gain on the sale of equity investment | Gain on the sale of equity investment | — | 11,286 | Gain on the sale of equity investment | — | — | — | 11,286 | ||||||||||||
| Interest expense—net | Interest expense—net | 3,723 | 1,075 | Interest expense—net | 4,067 | 2,228 | 7,790 | 3,303 | ||||||||||||
| Income before income tax expense | 19,052 | 38,633 | Income before income tax expense | 17,481 | 32,068 | 36,533 | 70,701 | |||||||||||||
| Income tax expense | Income tax expense | 6,097 | 13,113 | Income tax expense | 5,594 | 10,870 | 11,691 | 23,983 | ||||||||||||
| Net income | Net income | $ | 12,955 | $ | 25,520 | Net income | $ | 11,887 | $ | 21,198 | $ | 24,842 | $ | 46,718 | ||||||
| Net income allocation: | Net income allocation: | Net income allocation: | ||||||||||||||||||
| Preferred stock dividend | $ | 1,384 | $ | 29 | Preferred stock dividend | $ | 663 | $ | 87 | $ | 2,047 | $ | 116 | |||||||
| Net income available for common stockholders | 11,571 | 25,491 | Net income available for common stockholders | 11,224 | 21,111 | 22,795 | 46,602 | |||||||||||||
| Net income | $ | 12,955 | $ | 25,520 | Net income | $ | 11,887 | $ | 21,198 | $ | 24,842 | $ | 46,718 | |||||||
| Earnings per share: | Earnings per share: | Earnings per share: | ||||||||||||||||||
| Basic | $ | 0.43 | $ | 0.89 | Basic | $ | 0.21 | $ | 0.37 | $ | 0.43 | $ | 0.82 | |||||||
| Diluted | $ | 0.40 | $ | 0.65 | Diluted | $ | 0.17 | $ | 0.27 | $ | 0.37 | $ | 0.60 | |||||||
| Weighted average common shares outstanding: | Weighted average common shares outstanding: | Weighted average common shares outstanding: | ||||||||||||||||||
| Basic | 26,644 | 28,800 | Basic | 53,676 | 56,331 | 53,482 | 56,965 | |||||||||||||
| Diluted | 32,612 | 39,518 | Diluted | 70,306 | 77,964 | 67,765 | 78,500 | |||||||||||||
See accompanying Notes to Condensed Consolidated Financial Statements.Statements (unaudited)
AECOM Technology Corporation
Condensed Consolidated Statements of Comprehensive Income
(unaudited—in thousands)
| | Three Months Ended December 31, | Three Months Ended | Six Months Ended | |||||||||||||||
|---|---|---|---|---|---|---|---|---|---|---|---|---|---|---|---|---|---|---|
| | 2005 | 2006 | March 31, 2006 | March 31, 2007 | March 31, 2006 | March 31, 2007 | ||||||||||||
| Net income | $ | 12,955 | $ | 25,520 | $ | 11,887 | $ | 21,198 | $ | 24,842 | $ | 46,718 | ||||||
| Other comprehensive income: | ||||||||||||||||||
| Foreign currency translation adjustments | (1,725 | ) | 2,975 | 2,509 | 4,199 | 786 | 7,174 | |||||||||||
| Other comprehensive income | (1,725 | ) | 2,975 | 2,509 | 4,199 | 786 | 7,174 | |||||||||||
| Comprehensive income | $ | 11,230 | $ | 28,495 | $ | 14,396 | $ | 25,397 | $ | 25,628 | $ | 53,892 | ||||||
See accompanying Notes to Condensed Consolidated Financial Statements.Statements (unaudited)
AECOM Technology Corporation
Condensed Consolidated Statements of Cash Flows
(unaudited—in thousands)
| | | Three Months Ended December 31, | | Six Months Ended March 31, | ||||||||||||||
|---|---|---|---|---|---|---|---|---|---|---|---|---|---|---|---|---|---|---|
| | | 2005 | 2006 | | 2006 | 2007 | ||||||||||||
| CASH FLOWS FROM OPERATING ACTIVITIES: | CASH FLOWS FROM OPERATING ACTIVITIES: | CASH FLOWS FROM OPERATING ACTIVITIES: | ||||||||||||||||
| Net income | Net income | $ | 12,955 | $ | 25,520 | Net income | $ | 24,842 | $ | 46,718 | ||||||||
| Adjustments to reconcile net income to net cash (used in)/provided by operating activities: | Adjustments to reconcile net income to net cash (used in)/provided by operating activities: | Adjustments to reconcile net income to net cash (used in)/provided by operating activities: | ||||||||||||||||
| Depreciation and amortization | 17,982 | 18,972 | ||||||||||||||||
| Depreciation and amortization | 9,370 | 6,970 | Equity in earnings of unconsolidated joint ventures | (2,563 | ) | (3,636 | ) | |||||||||||
| Equity in earnings of unconsolidated joint ventures | (1,670 | ) | (1,417 | ) | Distribution of earnings from unconsolidated affiliates | 4,809 | 4,068 | |||||||||||
| Distribution of earnings from unconsolidated affiliates | 281 | 108 | Stock match and other non-cash stock compensation | 6,350 | 13,143 | |||||||||||||
| Stock match and other non-cash stock compensation | 1,379 | 7,048 | Write-off of deferred financing costs | 2,100 | — | |||||||||||||
| Interest income on notes from stockholders | (502 | ) | (532 | ) | Interest income on notes from stockholders | (1,036 | ) | (754 | ) | |||||||||
| Foreign currency translation | (2,588 | ) | (954 | ) | Foreign currency translation | 2,360 | 1,490 | |||||||||||
| Gain on sale of equity investment | — | (11,286 | ) | Gain on sale of equity investment | — | (11,286 | ) | |||||||||||
Changes in operating assets and liabilities, net of effects of acquisitions: | Changes in operating assets and liabilities, net of effects of acquisitions: | Changes in operating assets and liabilities, net of effects of acquisitions: | ||||||||||||||||
| Accounts receivable | (51,000 | ) | (8,626 | ) | Accounts receivable | (101,821 | ) | (75,211 | ) | |||||||||
| Prepaid expenses and other assets | 10,150 | (10,337 | ) | Prepaid expenses and other assets | 2,099 | (11,869 | ) | |||||||||||
| Accounts payable | 9,526 | 3,711 | Accounts payable | 49,103 | (11,395 | ) | ||||||||||||
| Accrued expenses | (11,284 | ) | (10,520 | ) | Accrued expenses and other current liabilities | (4,730 | ) | 31,928 | ||||||||||
| Billings in excess of costs on uncompleted contracts | (1,575 | ) | 24,183 | Billings in excess of costs on uncompleted contracts | (2,116 | ) | 51,903 | |||||||||||
| Income taxes payable | (371 | ) | 16,148 | Income taxes payable | (3,291 | ) | (171 | ) | ||||||||||
| Other long-term obligations | 6,753 | 3,652 | Other long-term obligations | 4,279 | (170 | ) | ||||||||||||
| Net cash (used in)/provided by operating activities | (18,576 | ) | 43,668 | Net cash (used in)/provided by operating activities | (1,633 | ) | 53,730 | |||||||||||
| CASH FLOWS FROM INVESTING ACTIVITIES: | CASH FLOWS FROM INVESTING ACTIVITIES: | CASH FLOWS FROM INVESTING ACTIVITIES: | ||||||||||||||||
| Payments for business acquisitions, net of cash acquired | (34,089 | ) | (6,200 | ) | Payments for business acquisitions, net of cash acquired | (34,089 | ) | (125,797 | ) | |||||||||
| Proceeds from the sale of equity investment | — | 14,683 | Proceeds from the sale of equity investment | — | 14,683 | |||||||||||||
| Net investments in unconsolidated affiliates | 95 | (3,034 | ) | Net investments in unconsolidated affiliates | 687 | 712 | ||||||||||||
| Payments for capital expenditures | (7,316 | ) | (10,093 | ) | Payments for capital expenditures | (13,210 | ) | (18,642 | ) | |||||||||
| Proceeds on sale of property and equipment | 429 | — | Proceeds on sale of property and equipment | 416 | — | |||||||||||||
| Net cash used in investing activities | (40,881 | ) | (4,644 | ) | Net cash used in investing activities | (46,196 | ) | (129,044 | ) | |||||||||
| CASH FLOWS FROM FINANCING ACTIVITIES: | CASH FLOWS FROM FINANCING ACTIVITIES: | CASH FLOWS FROM FINANCING ACTIVITIES: | ||||||||||||||||
| Proceeds from borrowings under credit agreements | 112,209 | 2,681 | Proceeds from borrowings under credit agreements | 142,014 | 51,858 | |||||||||||||
| Repayments of borrowings under other long-term obligations | (7,092 | ) | (7,000 | ) | Repayments of borrowings under other long-term obligations | (175,316 | ) | (8,500 | ) | |||||||||
| Proceeds from issuance of common stock and preferred stock | 10,266 | 20,210 | Proceeds from issuance of common stock and preferred stock | 31,132 | 42,157 | |||||||||||||
| Proceeds from issuance of stock upon exercise of stock options | 179 | 521 | Proceeds from issuance of stock upon exercise of stock options | 4,646 | 2,933 | |||||||||||||
| Excess tax benefits from the exercise of stock options | — | 178 | Net proceeds from the issuance of Class F and Class G preferred stock | 232,120 | — | |||||||||||||
| Repayment of notes receivable from stockholders | 359 | 477 | Repurchase of Class D preferred stock | (116,486 | ) | — | ||||||||||||
| Payments to repurchase common stock and common stock units | (41,831 | ) | (46,846 | ) | Repayment of notes receivable from stockholders | 1,039 | 22,663 | |||||||||||
| Payments of dividends on convertible preferred stock | (1,312 | ) | — | Payments to repurchase common stock and common stock units | (47,056 | ) | (48,455 | ) | ||||||||||
| Payments of dividends on convertible preferred stock | (1,900 | ) | — | |||||||||||||||
| Net cash provided by/(used in) financing activities | 72,778 | (29,779 | ) | |||||||||||||||
| Net cash provided by financing activities | 70,193 | 62,656 | ||||||||||||||||
| EFFECT OF EXCHANGE RATE CHANGES ON CASH | EFFECT OF EXCHANGE RATE CHANGES ON CASH | (349 | ) | 659 | EFFECT OF EXCHANGE RATE CHANGES ON CASH | (383 | ) | 1,052 | ||||||||||
NET INCREASE IN CASH AND CASH EQUIVALENTS | 12,972 | 9,904 | ||||||||||||||||
NET INCREASE (DECREASE) IN CASH AND CASH EQUIVALENTS | NET INCREASE (DECREASE) IN CASH AND CASH EQUIVALENTS | 21,981 | (11,606 | ) | ||||||||||||||
| CASH AND CASH EQUIVALENTS AT BEGINNING OF PERIOD | CASH AND CASH EQUIVALENTS AT BEGINNING OF PERIOD | 54,302 | 127,870 | CASH AND CASH EQUIVALENTS AT BEGINNING OF PERIOD | 54,352 | 127,870 | ||||||||||||
| CASH AND CASH EQUIVALENTS AT END OF PERIOD | CASH AND CASH EQUIVALENTS AT END OF PERIOD | $ | 67,274 | $ | 137,774 | CASH AND CASH EQUIVALENTS AT END OF PERIOD | $ | 76,333 | $ | 116,264 | ||||||||
See accompanying Notes to Condensed Consolidated Financial Statements.Statements (unaudited)
AECOM Technology CorporationTECHNOLOGY CORPORATIONNotes to Condensed Consolidated Financial StatementsNOTES TO CONDENSED CONSOLIDATED FINANCIAL STATEMENTS
(unaudited)
1. Basis of Presentation
The accompanying condensed consolidated balance sheet as of DecemberMarch 31, 2006,2007, the condensed consolidated statements of income for the three and six months ended DecemberMarch 31, 20052006 and 2006,2007, and the condensed consolidated statements of cash flows for the threesix months ended DecemberMarch 31, 20052006 and 20062007 of AECOM Technology Corporation, or the Company, are unaudited, and, in the opinion of management, include all adjustments necessary for a fair statement of the financial position and the results of operations for the periods presented.
The condensed consolidated financial statements should be read in conjunction with the consolidated financial statements and notes thereto included in the Company's Amendment No. 3 to Form 10S-1 as filed with the Securities and Exchange Commission on January 29,May 7, 2007 for the fiscal year ended September 30, 2006. Certain prior year amounts have been reclassified to conform to the current year presentation.
The results of operations for the three and six months ended DecemberMarch 31, 20062007 are not necessarily indicative of the results to be expected for the fiscal year ending September 30, 2007.
All share and per share amounts reflect, on a retroactive basis, the 2-for-1 stock split effected in the form of a 100% stock dividend wherein one additional share of stock was issued effective May 4, 2007 for each share outstanding as of the record date of May 4, 2007.
2. Cash and Cash Equivalents
The Company considers all highly liquid investments with an original maturity of three months or less to be cash equivalents. Cash and cash equivalents, including cash in consolidated joint ventures, totaled $127.9 million and $137.8$116.3 million as of September 30, 2006 and DecemberMarch 31, 2006,2007, respectively.
3. Accounts Receivable—Net
Net accounts receivable consisted of the following as of September 30, 2006 and DecemberMarch 31, 2006:2007:
| | | September 30, 2006 | December 31, 2006 | | September 30, 2006 | March 31, 2007 | ||||||||||
|---|---|---|---|---|---|---|---|---|---|---|---|---|---|---|---|---|
| | | (in thousands) | | (in thousands) | ||||||||||||
| Billed | Billed | $ | 543,606 | $ | 556,847 | Billed | $ | 543,606 | $ | 600,120 | ||||||
| Unbilled | Unbilled | 372,034 | 370,837 | Unbilled | 372,034 | 439,435 | ||||||||||
| Contract retentions | Contract retentions | 38,921 | 43,696 | Contract retentions | 38,921 | 46,568 | ||||||||||
| Total accounts receivable—gross | 954,561 | 971,380 | Total accounts receivable—gross | 954,561 | 1,086,123 | |||||||||||
| Allowance for doubtful accounts | Allowance for doubtful accounts | (41,383 | ) | (42,976 | ) | Allowance for doubtful accounts | (41,383 | ) | (46,044 | ) | ||||||
| Total accounts receivable—net | $ | 913,178 | $ | 928,404 | Total accounts receivable—net | $ | 913,178 | $ | 1,040,079 | |||||||
| Billings in excess of costs on uncompleted contracts | Billings in excess of costs on uncompleted contracts | $ | 143,283 | $ | 167,466 | Billings in excess of costs on uncompleted contracts | $ | 143,283 | $ | 200,891 | ||||||
Billed accounts receivable represent amounts billed to clients that have yet to be collected. Unbilled accounts receivable represent revenue recognized but not yet billed pursuant to contract terms or billed after the fiscal period end. Substantially all unbilled receivables as of September 30, 2006 and DecemberMarch 31, 20062007 are expected to be billed and collected within twelve months. Contract retentions represent amounts invoiced to clients; however payments have been withheld pending the completion
of certain milestones, other contractual conditions or upon the completion of the project. These retention agreements vary from project to project and could be outstanding several months or years.
Allowances for doubtful accounts have been determined through specific identification of amounts determined to be uncollectible and potential write-offs, plus a general allowance for other amounts for which some potential loss is determined to be probable based on current and historical events and circumstances. No single client accounted for more than 10% of the Company's accounts receivable as of September 30, 2006 or DecemberMarch 31, 2006.2007.
4. Goodwill and Acquired Intangible Assets
The changes in the carrying value of goodwill by reporting unit for the threesix months ended DecemberMarch 31, 20062007 were as follows:
| | | September 30, 2006 | Post-Acquisition Adjustments | Acquired | December 31, 2006 | | September 30, 2006 | Post-Acquisition Adjustments | Acquired | March 31, 2007 | ||||||||||||||||
|---|---|---|---|---|---|---|---|---|---|---|---|---|---|---|---|---|---|---|---|---|---|---|---|---|---|---|
| | | (in thousands) | | (in thousands) | ||||||||||||||||||||||
| Professional Technical Services | Professional Technical Services | $ | 457,575 | $ | 914 | $ | 5,256 | $ | 463,745 | Professional Technical Services | $ | 457,575 | $ | 1,239 | $ | 67,328 | $ | 526,142 | ||||||||
| Management Support Services | Management Support Services | 8,933 | (500 | ) | — | 8,433 | Management Support Services | 8,933 | (500 | ) | — | 8,433 | ||||||||||||||
| Total | $ | 466,508 | $ | 414 | $ | 5,256 | $ | 472,178 | Total | $ | 466,508 | $ | 739 | $ | 67,328 | $ | 534,575 | |||||||||
The gross amounts and accumulated amortization of the Company's acquired identifiable intangible assets with finite useful lives as of September 30, 2006 and DecemberMarch 31, 20062007 included in intangible and other assets—net in the accompanying condensed consolidated balance sheets, were as follows:
| | | September 30, 2006 | December 31, 2006 | September 30, 2006 | March 31, 2007 | ||||||||||||||||||||
|---|---|---|---|---|---|---|---|---|---|---|---|---|---|---|---|---|---|---|---|---|---|---|---|---|---|
| | | Gross Amount | Accumulated Amortization | Gross Amount | Accumulated Amortization | Gross Amount | Accumulated Amortization | Gross Amount | Accumulated Amortization | ||||||||||||||||
| | | (in thousands) | (in thousands) | ||||||||||||||||||||||
| Backlog | Backlog | $ | 16,687 | $ | 15,254 | $ | 16,687 | $ | 15,509 | $ | 16,687 | $ | 15,254 | $ | 34,916 | $ | 20,125 | ||||||||
| Customer Relationships | Customer Relationships | 18,179 | 2,180 | 18,179 | 2,634 | 18,179 | 2,180 | 31,228 | 3,410 | ||||||||||||||||
| Trade-Names | Trade-Names | 899 | 163 | 899 | 208 | 899 | 163 | 1,762 | 303 | ||||||||||||||||
| Total | $ | 35,765 | $ | 17,597 | $ | 67,906 | $ | 23,838 | |||||||||||||||||
| Total | $ | 35,765 | $ | 17,597 | $ | 35,765 | $ | 18,351 | |||||||||||||||||
At the time of acquisition, the Company estimates the amount of the identifiable intangible assets acquired based upon historical valuations and the facts and circumstances available at the time. The Company concludes the value of the identifiable intangible assets during the purchase allocation period, which does not extend beyond 12 months from the date of acquisition. However, based upon the date of acquisition, the purchase allocation period may cross into subsequent fiscal periods.
Estimated amortization expense for the remainder of fiscal 2007 and for the succeeding years is as follows:
| | | (in thousands) | | (in thousands) | ||||
|---|---|---|---|---|---|---|---|---|
| 2007 | 2007 | $ | 2,215 | 2007 | $ | 11,068 | ||
| 2008 | 2008 | 2,459 | 2008 | 8,952 | ||||
| 2009 | 2009 | 1,998 | 2009 | 3,481 | ||||
| 2010 | 2010 | 1,988 | 2010 | 3,471 | ||||
| 2011 | 2011 | 1,844 | 2011 | 3,328 | ||||
| Thereafter | Thereafter | 6,910 | Thereafter | 13,768 | ||||
| Total | $ | 17,414 | Total | $ | 44,068 | |||
5. Disclosures About Pension Benefit Obligations
The pension cost for the three and six months ended DecemberMarch 31, 20052006 and 20062007 includes the following components:components (in thousands):
| | Three Months Ended December 31, | Three Months Ended March 31, | Six Months Ended March 31, | |||||||||||||||||||||||
|---|---|---|---|---|---|---|---|---|---|---|---|---|---|---|---|---|---|---|---|---|---|---|---|---|---|---|
| | 2005 | 2006 | ||||||||||||||||||||||||
| | U.S. | Foreign | U.S. | Foreign | ||||||||||||||||||||||
| | (in thousands) | |||||||||||||||||||||||||
| U.S. Plans | Three Months Ended March 31, | Six Months Ended March 31, | ||||||||||||||||||||||||
| Service costs | $ | 765 | $ | 1,316 | $ | 651 | $ | 1,218 | $ | 765 | $ | 651 | $ | 1,530 | $ | 1,302 | ||||||||||
| Interest cost on projected benefit obligation | 1,678 | 3,812 | 1,876 | 4,282 | 1,678 | 1,876 | 3,356 | 3,752 | ||||||||||||||||||
| Expected return on plan assets | (1,621 | ) | (3,427 | ) | (1,719 | ) | (3,960 | ) | (1,621 | ) | (1,719 | ) | (3,242 | ) | (3,438 | ) | ||||||||||
| Amortization of prior service costs | (290 | ) | (220 | ) | (289 | ) | (97 | ) | (290 | ) | (289 | ) | (580 | ) | (578 | ) | ||||||||||
| Amortization of net gain | 1,433 | 1,459 | 982 | 949 | ||||||||||||||||||||||
| Amortization of net loss | 1,433 | 982 | 2,866 | 1,964 | ||||||||||||||||||||||
| Net periodic benefit costs | $ | 1,965 | $ | 2,940 | $ | 1,501 | $ | 2,392 | ||||||||||||||||||
| Net periodic benefit cost | $ | 1,965 | $ | 1,501 | $ | 3,930 | $ | 3,002 | ||||||||||||||||||
| | Three Months Ended March 31, | Six Months Ended March 31, | |||||||||||
|---|---|---|---|---|---|---|---|---|---|---|---|---|---|
| Non-U.S. Plans | |||||||||||||
| 2006 | 2007 | 2006 | 2007 | ||||||||||
| Service costs | $ | 1,316 | $ | 1,245 | $ | 2,632 | $ | 2,463 | |||||
| Interest cost on projected benefit obligation | 3,812 | 4,378 | 7,624 | 8,660 | |||||||||
| Expected return on plan assets | (3,427 | ) | (4,047 | ) | (6,854 | ) | (8,007 | ) | |||||
| Amortization of prior service costs | (220 | ) | (428 | ) | (440 | ) | (525 | ) | |||||
| Amortization of net gain | 1,459 | 970 | 2,918 | 1,919 | |||||||||
| Curtailment gain recognized | — | (2,646 | ) | — | (2,646 | ) | |||||||
| Net periodic benefit cost | $ | 2,940 | $ | (528 | ) | $ | 5,880 | $ | 1,864 | ||||
The total amounts of employer contributions paid for the three and six months ended DecemberMarch 31, 20062007 were $0.0 and $0.1 million, respectively, for U.S. subsidiaries and $3.8$3.9 and $7.7 million, respectively for foreignnon-U.S. subsidiaries. The expected remaining scheduled annual employer contributions
for fiscal year September 30, 2007 are $3.2 million for U.S. subsidiaries and $11.1$7.6 million for foreignnon-U.S. subsidiaries.
6. Reportable Segments
The Company's management has organized itsthe Company's operations into two reportable segments: Professional Technical Services and Management Support Services. This segmentation corresponds to how the Company manages its business as well as the underlying characteristics of its markets.
Management internally analyzes the results of itsthe Company's segments and operations using the non-GAAP measure of revenue, net service revenues which is revenues, lessof other direct costs. The Company believes net service revenuescosts which is a measure of work performed by the Company and is a more accurate measure on which to base gross margin.Company. All inter-company balances and transactions are eliminated in consolidation.
The following tables set forth summarized financial information concerning the Company's reportable segments:
Reportable Segments:
| | Professional Technical Services | Management Support Service | Total | |||||||
|---|---|---|---|---|---|---|---|---|---|---|
| | (in thousands) | |||||||||
| Three Months Ended December 31, 2005: | ||||||||||
| Revenues | $ | 612,264 | $ | 134,479 | $ | 746,743 | ||||
| Net service revenues | 399,599 | 13,574 | 413,173 | |||||||
| Gross profit | 192,131 | 6,620 | 198,751 | |||||||
| Gross profit as a % of revenues | 31.4 | % | 4.9 | % | 26.6 | % | ||||
| Gross profit as a % of net service revenues | 48.1 | % | 48.8 | % | 48.1 | % | ||||
| Equity in earnings of joint ventures | 749 | 921 | 1,670 | |||||||
| General and administrative expenses | 168,392 | 4,114 | 172,506 | |||||||
| Segment income from operations | 24,488 | 3,427 | 27,915 | |||||||
Three Months Ended December 31, 2006: | ||||||||||
| Revenues | $ | 753,545 | $ | 184,680 | $ | 938,225 | ||||
| Net service revenues | 482,781 | 20,086 | 502,867 | |||||||
| Gross profit | 240,036 | 8,117 | 248,153 | |||||||
| Gross profit as a % of revenues | 31.9 | % | 4.4 | % | 26.4 | % | ||||
| Gross profit as a % of net service revenues | 49.7 | % | 40.4 | % | 49.3 | % | ||||
| Equity in earnings of joint ventures | 393 | 2,202 | 2,595 | |||||||
| General and administrative expenses | 203,679 | 5,771 | 209,450 | |||||||
| Segment income from operations | 36,750 | 4,548 | 41,298 | |||||||
| Segment assets | 1,693,436 | 124,643 | 1,818,079 | |||||||
| Reportable Segments: | Professional Technical Services | Management Support Services | Total | |||||||
|---|---|---|---|---|---|---|---|---|---|---|
| | (in thousands) | |||||||||
| Three Months Ended March 31, 2006: | ||||||||||
| Revenue | $ | 707,357 | $ | 151,168 | $ | 858,525 | ||||
| Revenue, net of other direct costs | 455,424 | 32,683 | 488,107 | |||||||
| Gross profit | 219,761 | 10,741 | 230,502 | |||||||
| Gross profit as a % of revenue | 31.1 | % | 7.1 | % | 26.8 | % | ||||
| Gross profit as a % of revenue, net of other direct costs | 48.3 | % | 32.9 | % | 47.2 | % | ||||
| Equity in earnings of joint ventures | 656 | 236 | 892 | |||||||
| General and administrative expenses | 191,153 | 4,196 | 195,349 | |||||||
| Segment income from operations | 29,264 | 6,781 | 36,045 | |||||||
Three Months Ended March 31, 2007: | ||||||||||
| Revenue | $ | 841,019 | $ | 240,491 | $ | 1,081,510 | ||||
| Revenue, net of other direct costs | 558,978 | 28,624 | 587,602 | |||||||
| Gross profit | 273,193 | 12,842 | 286,035 | |||||||
| Gross profit as a % of revenue | 32.5 | % | 5.3 | % | 26.4 | % | ||||
| Gross profit as a % of revenue, net of other direct costs | 48.9 | % | 44.9 | % | 48.7 | % | ||||
| Equity in earnings of joint ventures | 622 | 1,538 | 2,160 | |||||||
| General and administrative expenses | 232,264 | 6,035 | 238,299 | |||||||
| Segment income from operations | 41,551 | 8,345 | 49,896 | |||||||
| Segment assets | 1,875,898 | 125,420 | 2,001,318 | |||||||
| Reportable Segments: | Professional Technical Services | Management Support Services | Total | |||||||
|---|---|---|---|---|---|---|---|---|---|---|
| | (in thousands) | |||||||||
| Six Months Ended March 31, 2006: | ||||||||||
| Revenue | $ | 1,319,621 | $ | 285,647 | $ | 1,605,268 | ||||
| Revenue, net of other direct costs | 855,024 | 46,257 | 901,281 | |||||||
| Gross profit | 411,892 | 17,361 | 429,253 | |||||||
| Gross profit as a % of revenue | 31.2 | % | 6.1 | % | 26.7 | % | ||||
| Gross profit as a % of revenue, net of other direct costs | 48.2 | % | 37.5 | % | 47.6 | % | ||||
| Equity in earnings of joint ventures | 1,405 | 1,157 | 2,562 | |||||||
| General and administrative expenses | 359,546 | 8,310 | 367,856 | |||||||
| Segment income from operations | 53,751 | 10,208 | 63,959 | |||||||
Six Months Ended March 31, 2007: | ||||||||||
| Revenue | $ | 1,594,564 | $ | 425,171 | $ | 2,019,735 | ||||
| Revenue, net of other direct costs | 1,041,760 | 48,710 | 1,090,470 | |||||||
| Gross profit | 513,229 | 20,959 | 534,188 | |||||||
| Gross profit as a % of revenue | 32.2 | % | 4.9 | % | 26.4 | % | ||||
| Gross profit as a % of revenue, net of other direct costs | 49.3 | % | 43.0 | % | 49.0 | % | ||||
| Equity in earnings of joint ventures | 1,014 | 3,740 | 4,754 | |||||||
| General and administrative expenses | 435,943 | 11,806 | 447,749 | |||||||
| Segment income from operations | 78,300 | 12,893 | 91,193 | |||||||
| Segment assets | 1,875,898 | 125,420 | 2,001,318 | |||||||
Reconciliations:
| | Three Months Ended December 31, | ||||||
|---|---|---|---|---|---|---|---|
| | 2005 | 2006 | |||||
| | (in thousands) | ||||||
| Revenues: | |||||||
| Revenues from reportable segments | $ | 746,743 | $ | 938,225 | |||
| Other revenue | 54 | 324 | |||||
| Total consolidated revenues | $ | 746,797 | $ | 938,549 | |||
| Gross profit: | |||||||
| Gross profit from reportable segments | $ | 198,751 | $ | 248,153 | |||
| Other contributions to gross profit | 1,288 | 266 | |||||
| Total consolidated gross profit | $ | 200,039 | $ | 248,419 | |||
| General and administrative expenses: | |||||||
| General and administrative expenses of reportable segments | $ | 172,506 | $ | 209,450 | |||
| Unallocated corporate general and administrative expense | 4,477 | 10,378 | |||||
| Total general and administrative expenses | $ | 176,983 | $ | 219,828 | |||
| Income from operations: | |||||||
| Segment income from operations | $ | 27,915 | $ | 41,298 | |||
| Loss from operations not allocated to reportable segments | (3,189 | ) | (11,290 | ) | |||
| Total consolidated income from operations | $ | 24,726 | $ | 30,008 | |||
| Segment assets: | |||||||
| Total assets of reportable segments | $ | 1,818,079 | |||||
| Other assets not allocated to reportable segments and eliminations | 60,551 | ||||||
| Total assets | $ | 1,878,630 | |||||
| | Three Months Ended | Six Months Ended | |||||||||||
|---|---|---|---|---|---|---|---|---|---|---|---|---|---|
| | March 31, 2006 | March 31, 2007 | March 31, 2006 | March 31, 2007 | |||||||||
| | (in thousands) | ||||||||||||
| Revenue: | |||||||||||||
| Revenue from reportable segments | $ | 858,525 | $ | 1,081,510 | $ | 1,605,268 | $ | 2,019,735 | |||||
| Other | 405 | 2,199 | 459 | 2,523 | |||||||||
| Total consolidated revenue | $ | 858,930 | $ | 1,083,709 | $ | 1,605,727 | $ | 2,022,258 | |||||
| Gross profit: | |||||||||||||
| Gross profit from reportable segments | $ | 230,502 | $ | 286,035 | $ | 429,253 | $ | 534,188 | |||||
| Other | (1,479 | ) | (2,164 | ) | (191 | ) | (1,898 | ) | |||||
| Total consolidated gross profit | $ | 229,023 | $ | 283,871 | $ | 429,062 | $ | 532,290 | |||||
| Equity in earnings of joint ventures: | |||||||||||||
| Equity in earnings of joint ventures from reportable segments | $ | 892 | $ | 2,160 | $ | 2,562 | $ | 4,754 | |||||
| Other equity in earnings of joint ventures | 1 | 59 | 1 | (1,118 | ) | ||||||||
| Total consolidated equity in earnings of joint ventures | $ | 893 | $ | 2,219 | $ | 2,563 | $ | 3,636 | |||||
| General and administrative expenses: | |||||||||||||
| General and administrative expenses of reportable segments | $ | 195,349 | $ | 238,299 | $ | 367,856 | $ | 447,749 | |||||
| Unallocated corporate general and administrative expense | 9,489 | 9,847 | 13,965 | 20,225 | |||||||||
| Total consolidated general and administrative expense | $ | 204,838 | $ | 248,146 | $ | 381,821 | $ | 467,974 | |||||
Reconciliations (continued):
| | Three Months Ended | Six Months Ended | |||||||||||
|---|---|---|---|---|---|---|---|---|---|---|---|---|---|
| | March 31, 2006 | March 31, 2007 | March 31, 2006 | March 31, 2007 | |||||||||
| | (in thousands) | ||||||||||||
| Income from operations: | |||||||||||||
| Segment income from operations | $ | 36,045 | $ | 49,896 | $ | 63,960 | $ | 91,193 | |||||
| Loss from operations not allocated to reportable segments | (10,967 | ) | (11,952 | ) | (14,156 | ) | (23,241 | ) | |||||
| Total consolidated income from operations | $ | 25,078 | $ | 37,944 | $ | 49,804 | $ | 67,952 | |||||
| | | | | March 31, 2007 | |||||
|---|---|---|---|---|---|---|---|---|---|
Segment assets: | |||||||||
| Total assets of reportable segments | $ | 2,001,318 | |||||||
| Other assets not allocated to reportable segments and eliminations | 74,878 | ||||||||
| Total assets | $ | 2,076,196 | |||||||
7. Recently Issued Accounting Pronouncements
In September 2006, theFebruary 2007, Financial Accounting Standards Board, or FASB, issued SFAS No. 158,159, ""Employers'The Fair Value Option for Financial Assets and Financial Liabilities—Including an amendment of FASB Statement No. 115" (SFAS 159). SFAS No. 159 permits entities to choose to measure eligible items at fair value at specified election dates and report unrealized gains and losses on items for which the fair value option has been elected in earnings at each subsequent reporting date. SFAS No. 159 is effective for fiscal year ending September 30, 2009. The Company is currently evaluating the impact of the provisions of SFAS 159 on its results of operations and financial position.
In September 2006, the FASB, issued SFAS No. 158, "Employers' Accounting for Defined Benefit Pension and Other Postretirement Plans" (SFAS 158). SFAS 158 requires employers to fully recognize the obligations associated with defined benefit pension plans in their financial statements. The Company will be required to recognize such obligations as of September 30, 2007. Additionally, the Company will be required to measure such obligations as of the end of its fiscal year, rather than up to three months earlier as had been previously permitted, effective in its fiscal year ending September 30, 2009. The Company is currently evaluating the impact of the provisions of SFAS 158 on its results of operations and financial position.
In September 2006, the FASB issued SFAS No. 157,"Fair "Fair Value Measurements" (SFAS 157). SFAS 157 defines fair value, establishes a framework for measuring fair value in accordance with GAAP, and expands disclosures about fair value measurements. The provisions of SFAS 157 are
effective for the fiscal year ending September 30, 2009. The Company is currently evaluating the impact of the provisions of SFAS 157 on its results of operations and financial position.
In June 2006, the FASB issued FASB Interpretation FIN, No. 48, "Accounting for Uncertainty in Income Taxes—an Interpretation of FASB Statement No. 109" (FIN 48). FIN 48 clarifies the accounting for uncertainty in income taxes recognized in an entity's financial statements. FIN 48 prescribes that a company should use a more-likely-than-not recognition threshold based on the technical merits of the tax position taken. Additionally, FIN 48 provides guidance on recognition or de-recognition of interest and penalties, changes in judgment in interim periods, and disclosures of uncertain tax positions. FIN 48 becomes effective for the Company in fiscal year beginning October 1, 2007. The Company is in the process of determining the effect of the adoption of FIN 48 on its results of operations and financial position.
In May 2005, the FASB issued SFAS No. 154,"Accounting Changes and Error Corrections—a replacement of APB Opinion No. 20 and FASB Statement No. 3" (SFAS 154), which applies to all voluntary changes in accounting principle, as well as to changes required by an accounting pronouncement in the unusual instance that the pronouncement does not include specific transition provisions. APB Opinion No. 20 previously required that most voluntary changes in accounting principle be recognized in net income as a cumulative effect of changing to the new accounting principle. SFAS 154 now requires retrospective application to prior periods' financial statements for changes in accounting principle, unless it is impracticable to do so. SFAS 154 became effective for the Company on October 1, 2006 and did not have any impact on its results of operations or financial position.
8. Stock-Based Compensation
�� In December 2004, the FASB issued its final SFAS on accounting for share-based payments (SBPs) SFAS No. 123 (revised 2004), "Share-Based Payment" (SFAS 123R) that requires the Company to expense the value of employee stock options and similar awards. Under SFAS 123R, SBP awards result in a cost that will be measured at fair value on the awards' grant date, based on the estimated number of awards that are expected to vest. Compensation expense for awards that vest would not be reversed if the awards expire without being exercised.
SFAS 123R became effective for the Company on October 1, 2006. Upon adoption of SFAS 123R, the Company adopted the prospective transition method. Under this method, prior periods were not restated to reflect the impact of SFAS 123R. Under SFAS 123R, options and similar awards result in a cost that will be measured at fair value on the SBP awards' grant dates, based on the estimated number of awards that are expected to vest. This statement requires that the Company recognize as compensation expense the fair value of all stock-based awards, including stock options, granted to employees and directors in exchange for services over the requisite service period, which is typically the vesting period. SFAS No. 123R also requires that cash flows resulting from tax benefits realized from stock option exercises or stock vesting events in excess of tax benefits recognized from stock-based compensation expenses be classified as cash flows from financing activities instead of cash flows from operating activities for awards subject to SFAS No. 123R.
Prior to October 1, 2006, the Company accounted for employee stock-based compensation using the intrinsic value method of Accounting Principles Board (APB) Opinion No. 25, "Accounting for Stock Issued to Employees," and related interpretations. Under the intrinsic value method, no compensation expense was reflected in netthe statement of income for stock options granted to employees, as all stock
options had an exercise price equal to the fair value of the underlying common stock on the date of grant.
Under the prospective transition method, the Company continues to account for options granted prior to October 1, 2006 under the provisions of APB Opinion No. 25. Since all stock options had an exercise price equal to the fair value of the underlying common stock on the date of grant, no compensation expense will be recognized for options granted prior to October 1, 2006 unless modifications are made to those options. Prior to the adoption of SFAS 123R, the fair value of stock options used to disclose pro forma net income and earnings per share disclosures was the estimated
value using the minimum value method as allowed for non-public companies. The adoption of SFAS 123R did not have a cumulative effect on the Company's results of operations, financial position, or cash flows.
The fair value of the Company's stock option awards is estimated on the date of grant using the Black-Scholes option-pricing model. The expected term of awards granted represents the period of time the awards are expected to be outstanding. As the Company's common stock is not publicly-traded, expected volatility is based on a historical volatility, for a period consistent with the expected option term, of publicly-traded peer companies. The risk-free interest rate is based on the yield curve of a zero-coupon U.S. Treasury bond with a maturity equal to the expected term of the option on the grant date. The Company uses historical data as a basis to estimate forfeitures.
The fair value of options granted during the three and six months ended DecemberMarch 31, 20062007 was determined using the following weighted average assumptions:
| | Three Months Ended March 31, 2007 | Six Months Ended March 31, 2007 | |||
|---|---|---|---|---|---|
| Dividend yield | — | — | |||
| Expected volatility | 25 | % | 25 | % | |
| Risk-free interest rate | 4.60 | % | 4.58 | % | |
| Term (in years) | 7 | 7 |
As a result of the adoption of SFAS 123(R), the Company's net income for the quarterthree and six months ended DecemberMarch 31, 20062007 was $0.1$0.2 million and $0.3 million, respectively, lower than under the Company's previous accounting method, as a result of recognizing as expense the fair value of stock options.
Stock option activity for the three and six months ended DecemberMarch 31, 20062007 was as follows:
| | Shares of stock under options | Weighted average exercise price | Weighted average remaining contractual term | Aggregate intrinsic value | |||||||
|---|---|---|---|---|---|---|---|---|---|---|---|
| | | | (In years) | (In thousands) | |||||||
| Outstanding at September 30, 2006 | 4,464,320 | $ | 16.85 | 3.31 | $ | 75,213 | |||||
| Options granted | 232,510 | 28.40 | 7.00 | 6,603 | |||||||
| Options forfeited or expired | 1,733 | 27.68 | 6.75 | 48 | |||||||
| Options exercised | 23,700 | 21.90 | 4.79 | 519 | |||||||
| Outstanding at December 31, 2006 | 4,671,397 | 17.39 | 3.24 | 81,249 | |||||||
| Vested and expected to vest in the future as of December 31, 2006 | 4,666,750 | $ | 17.38 | 3.24 | $ | 81,117 | |||||
| | Shares of stock under options | Weighted average exercise price | Aggregate intrinsic value | ||||||
|---|---|---|---|---|---|---|---|---|---|
| | | | (in thousands) | ||||||
| Outstanding at September 30, 2006 | 8,928,640 | $ | 8.42 | $ | 75,213 | ||||
| Options granted | 548,620 | 14.13 | 7,755 | ||||||
| Options forfeited or expired | 24,466 | 13.62 | 333 | ||||||
| Options exercised | 383,182 | 7.60 | 2,912 | ||||||
| Outstanding at March 31, 2007 | 9,069,612 | 8.79 | $ | 79,723 | |||||
| Vested and expected to vest in the future as of March 31, 2007 | 9,059,060 | $ | 8.78 | $ | 79,568 | ||||
The weighted average grant-date fair value of stock options granted during the threesix months ended DecemberMarch 31, 20062007 was $10.96.$5.53.
9. Earnings Per Share
Basic earnings per share, or EPS, excludes dilution and is computed by dividing net income available to common stockholders by the weighted average number of common shares outstanding for the period. Diluted EPS is computed by dividing net income by the weighted average number of common shares outstanding and dilutive potential common shares for the period. The Company includes as potential common shares the weighted average dilutive effects of outstanding stock options using the treasury stock method.
The following table sets forth the number of weighted average shares used to compute basic and diluted EPS:
| | | Three Months Ended December 31, | | Three Months Ended | Six Months Ended | |||||||||||||||||
|---|---|---|---|---|---|---|---|---|---|---|---|---|---|---|---|---|---|---|---|---|---|---|
| | | 2005 | 2006 | | March 31, 2006 | March 31, 2007 | March, 2006 | March 31, 2007 | ||||||||||||||
| | | (in thousands, except per share data) | | (in thousands, except per share data) | ||||||||||||||||||
| Numerator for basic earnings per share: | Numerator for basic earnings per share: | Numerator for basic earnings per share: | ||||||||||||||||||||
| Net income | $ | 12,955 | $ | 25,520 | Net income | $ | 11,887 | $ | 21,198 | $ | 24,842 | $ | 46,718 | |||||||||
| Preferred stock dividends | (1,384 | ) | (29 | ) | Preferred stock dividends | 663 | 87 | 2,047 | 116 | |||||||||||||
| Net income available for common stockholders | $ | 11,571 | $ | 25,491 | Net income available for common stockholders | $ | 11,224 | $ | 21,111 | $ | 22,795 | $ | 46,602 | |||||||||
| Denominator for basic earnings per share: | Denominator for basic earnings per share: | Denominator for basic earnings per share: | ||||||||||||||||||||
| Weighted average shares | 26,644 | 28,800 | Weighted average shares | 53,676 | 56,331 | 53,482 | 56,965 | |||||||||||||||
| Numerator for diluted earnings per share: | ||||||||||||||||||||||
| Numberator for diluted earnings per share: | Numberator for diluted earnings per share: | |||||||||||||||||||||
| Net income | $ | 12,955 | $ | 25,520 | Net income | $ | 11,887 | $ | 21,198 | $ | 24,842 | $ | 46,718 | |||||||||
| Denominator for diluted earnings per share: | ||||||||||||||||||||||
| Denominator for basic earnings per share | Denominator for basic earnings per share | 53,676 | 56,331 | 53,482 | 56,965 | |||||||||||||||||
| Potential common shares: | Potential common shares: | |||||||||||||||||||||
| Denominator for basic earnings per share | 26,644 | 28,800 | Preferred stock, Class D | 3,701 | — | 6,331 | — | |||||||||||||||
| Potential common shares: | Preferred stock, Class F and G | 10,215 | 18,747 | 5,107 | 18,747 | |||||||||||||||||
| Preferred stock, Class D | 4,480 | — | Stock options | 2,150 | 2,462 | 2,176 | 2,348 | |||||||||||||||
| Preferred stock, Class F and G | — | 9,373 | Preferred stock, other | 369 | 395 | 390 | 391 | |||||||||||||||
| Stock options | 1,101 | 1,118 | Stock matches | 33 | 19 | 29 | 36 | |||||||||||||||
| Preferred stock, other | 206 | 193 | Stock units | 16 | 10 | 14 | 13 | |||||||||||||||
| Stock matches | 12 | 26 | Stock warrants | 146 | — | 236 | — | |||||||||||||||
| Stock units | 6 | 8 | ||||||||||||||||||||
| Stock warrants | 163 | — | ||||||||||||||||||||
| Denominator for diluted earnings per share | 32,612 | 39,518 | ||||||||||||||||||||
| Denominator for diluted earnings per share | Denominator for diluted earnings per share | 70,306 | 77,964 | 67,765 | 78,500 | |||||||||||||||||
| Earnings per share: | Earnings per share: | Earnings per share: | ||||||||||||||||||||
| Basic | $ | 0.43 | $ | 0.89 | Basic | $ | 0.21 | $ | 0.37 | $ | 0.43 | $ | 0.82 | |||||||||
| Diluted | $ | 0.40 | $ | 0.65 | Diluted | $ | 0.17 | $ | 0.27 | $ | 0.37 | $ | 0.60 | |||||||||
For the three and six months ended DecemberMarch 31, 20052006 and 2006,2007, no options were excluded from the calculation or were considered anti-dilutive.
10. Stock Plans
During the quarterssix months ended DecemberMarch 31, 2005 and 2006,2007, the Company's Global Stock Program, or GSP, sold to the Company 0.8 million and 0.71.6 million shares for $19.2$21.4 million and $20.8as compared to 1.7 million respectively.for $20.0 million during the six months ended March 31, 2006. During the quarterssix months ended DecemberMarch 31, 2005 and 2006,2007, the Company's Stock Purchase Plan, or SPP, sold to the Company 0.3 and 0.30.7 million shares for $8.1$10.0 million and $9.4as compared to 0.6 million respectively.shares for $8.3 million during the six months ended March 31, 2006. During the quarterssix months ended DecemberMarch 31, 2005 and 2006,2007, direct shareholders sold to the Company 0.5 million and 0.61.2 million shares for $13.8$16.1 million and $16.2as compared to 1.3 million respectively.shares for $17.6 million during the six months ended March 31, 2006.
11. Commitments and Contingencies
The Company is subject to certain claims and lawsuits typically filed against the engineering and consulting profession, alleging primarily professional errors or omissions. The Company carries professional liability insurance against such claims, subject to certain deductibles and policy limits. From time to time the Company establishes reserves for litigation that is considered a defendant in various lawsuits arising in the normal courseprobable of business.a loss. In the opinion of management, the ultimate resolution of these matters will not have a material adverse effect on the financial position of the Company.
TheAt March 31, 2007, the Company iswas contingently liable in the amount of approximately $44.6$47.9 million under standby letters of credit issued primarily in connection with general and professional liability insurance programs and for payment and performance guarantees relating to domestic and overseas contracts. In addition, in some instances the Company guarantees that a project, when complete, will achieve specified performance standards. If the project subsequently fails to meet guaranteed performance standards, the Company may either incur significant additional costs or be held responsible for the costs incurred by the client to achieve the required performance standards.
Under joint venture arrangements, if a partner is financially unable to complete its share of the contract, the other partner(s) will be required to complete those activities. The Company generally only enters into joint venture arrangements with partners who are reputable, financially sound and who carry appropriate levels of surety bonds for the project in order to adequately assure completion of their assignments. The Company is a partner in certain joint ventures where the joint venture has contracted with subconsultants for certain specialized professional services. The joint venture, or the Company to the extent that the joint venture partner(s) are unable to fulfill their responsibilities, is liable to the third-party customer for performance of the sub-consultant and would be liable to the sub-consultant if the third-party customer failed to make payments due the joint venture for sub-consultant services.
12. Litigation
The Company is subject to certain claims and lawsuits typically filed against the engineering and consulting profession, alleging primarily professional errors or omissions. The Company carries professional liability insurance against such claims, subject to certain deductibles and policy limits. From time to time the Company establishes reserves for litigation that is considered a probable of a loss.
13. Subsequent Event
AsThe Company's board of February 20, 2007, all ofdirectors approved a two-for-one stock split, effected as a 100-percent dividend on the Company's outstanding loans previously madecommon stock, effective May 4, 2007. All share and per share amounts presented have been adjusted accordingly, on a retroactive basis, to reflect this stock dividend.
On May 7, 2007, the Company filed Amendment No. 3 to its Registration Statement on Form S-1 for the initial public offering of its common stock. The amendment contained, among other things, financial information for the fiscal period ended March 31, 2007, information on the proposed offering, an indicative price range and the intended use of proceeds from the proposed initial public offering including repayment of certain directors and senior officers under its Senior Executive Equity Investment Plan, or SEEIP, were terminated and repaid.existing debt obligations described in this Quarterly Report.
Until , 2007, 25 days after the date of this prospectus, all dealers that buy, sell or trade shares of our common stock, whether or not participating in this offering, may be required to deliver a prospectus. This delivery requirement is in addition to the obligation of dealers to deliver a prospectus when acting as underwriters and with respect to their unsold allotments or subscriptions.
PART II
INFORMATION NOT REQUIRED IN THE PROSPECTUS
ITEM 13. OTHER EXPENSES OF ISSUANCE AND DISTRIBUTION.
The table below lists various expenses, other than underwriting discounts and commissions, we expect to incur in connection with the sale and distribution of the securities being registered hereby. All the expenses are estimates, except the Securities and Exchange Commission registration fee, the NASD filing fee and the NYSE listing fee.
| Type | Type | Amount | Type | Amount | ||||
|---|---|---|---|---|---|---|---|---|
| Securities and Exchange Commission Registration Fee | Securities and Exchange Commission Registration Fee | $ | 6,140 | Securities and Exchange Commission Registration Fee | $ | 24,819 | ||
| NASD Filing Fee | NASD Filing Fee | * | NASD Filing Fee | 75,500 | ||||
| NYSE Fee | NYSE Fee | * | NYSE Fee | 250,000 | ||||
| Legal fees and expenses | Legal fees and expenses | * | Legal fees and expenses | 750,000 | ||||
| Accounting fees and expenses | Accounting fees and expenses | * | Accounting fees and expenses | 400,000 | ||||
| Printing and engraving expenses | Printing and engraving expenses | * | Printing and engraving expenses | 250,000 | ||||
| Transfer agent and registrar fees | Transfer agent and registrar fees | * | Transfer agent and registrar fees | 135,000 | ||||
| Miscellaneous expenses | Miscellaneous expenses | * | Miscellaneous expenses | 5,000 | ||||
| Total | $ | * | Total | $ | 1,890,319 | |||
ITEM 14. INDEMNIFICATION OF DIRECTORS AND OFFICERS.
Section 102 of the Delaware General Corporation Law, or DGCL, as amended, allows a corporation to eliminate the personal liability of directors of a corporation to the corporation or its stockholders for monetary damages for breach of fiduciary duty as a director, except where the director breached the duty of loyalty, failed to act in good faith, engaged in intentional misconduct or knowingly violated a law, authorized the payment of a dividend or approved a stock repurchase in violation of Delaware corporate law or obtained an improper personal benefit.
Section 145 of the DGCL provides for the indemnification of officers, directors and other corporate agents in terms sufficiently broad to indemnify such persons under circumstances for liabilities (including reimbursement for expenses incurred) arising under the Securities Act. Our Restated Certificate of Incorporation and Restated Bylaws provide for indemnification of our officers, directors, employees and agents to the extent and under the circumstances permitted under the Delaware General Corporation Law.
The Underwriting Agreement (Exhibit 1.1) provides for indemnification by the underwriters of us, our directors and officers, and by us of the underwriters, for some liabilities arising under the Securities Act, and affords some rights of contributions with respect thereto.
ITEM 15. RECENT SALES OF UNREGISTERED SECURITIES.
Since January 1, 2003, we have issued the following securities that were not registered under the Securities Act:
II-1
shares of common stock for an average purchase price of $10.52 upon exercise of such options.
We issued the securities to identified in paragraphs (i)-(vii) above to our directors, officers, employees and consultants under written compensatory benefit plans in reliance upon Rule 701 under the Securities Act and/or Section 4(2) of the Securities Act as transactions by an issuer not involving any public offering. Other than option grants referenced in clause (ii), the transactions identified in paragraphs (i)-(vii) predominantly relate to employee share purchases pursuant to bi-weekly payroll deductions under our 401(k) plan, sales and non tax-qualified stock purchase plan deferrals in the United States and global stock plan purchases outside the United States. We issued the securities identified in paragraphs (viii)—(xvii) and (ix) above in reliance upon Regulation D of the Securities Act and/orAct. The securities in paragraph (xv) were issued in reliance on Section (3)(a)(10) under the Securities Act. We issued the other securities identified in paragraphs (x)-(xvi) above in reliance upon Section 4(2) of the Securities Act as transactions by an issuer not involving any public offering or Regulation S
II-2
promulgated under the Securities Act as sales
II-2
occurring outside of the United States. The consideration for the securities issued in paragraphs (xi)(x)-(xvii)(xvi) in connection with acquisitions were securities of the acquired company. The purchasers were provided financial and other information concerning the Company and were allowed the opportunity to ask questions and receive information from the Company prior to making their investment decisions. The sale of these securities were made without general solicitation or advertising. Based on the limited nature of the offering, the level of knowledge and relationships of the purchasers with the Company, the provision and access to information and restrictions on transfer, and (where applicable) the residence of the purchaser, the Company believes its offerings were exempt from registration under Regulation D, Section 4(2), Regulation S and/or Rule 701.
ITEM 16. EXHIBITS AND FINANCIAL STATEMENT SCHEDULES.
| Exhibit Numbers | Description | |
|---|---|---|
| Form of Underwriting Agreement | ||
3.1** | Restated Certificate of Incorporation | |
3.2** | Certificate of Designations for Class C Preferred Stock | |
3.3** | Certificate of Designations for Class E Preferred Stock | |
3.4** | Certificate of Designations for Class F Convertible Preferred Stock, Series 1 | |
3.5** | Certificate of Designations for Class G Convertible Preferred Stock, Series 1 | |
3.6*** | Restated Bylaws | |
4.1** | Form of Common Stock Certificate | |
4.2** | Investor Rights Agreement, dated as of February 9, 2006, among Registrant and the investors party thereto | |
4.3** | Joinder Agreement, dated as of February 9, 2006, between the Registrant and the investor party thereto | |
4.4** | Joinder Agreement, dated as of February 14, 2006, between the Registrant and the investor party thereto | |
4.5** | Amendment No. 1 to Investor Rights Agreement, dated as of February 14, 2006, among the Registrant and the investors party thereto | |
Opinion of Company Counsel | ||
10.1** | Amended and Restated Credit Agreement, dated as of September 22, 2006, among Registrant, the Subsidiary Borrowers, Union Bank of California, N.A., as Administrative Agent, a Letter of Credit Issuing Lender and the Swing Line Lender, Harris N.A., as a Letter of Credit Issuing Lender, Bank of Montreal acting under its trade name BMO Capital Markets, as Syndication Agent and other financial institutions that are parties thereto | |
10.2** | Term Credit Agreement dated as of September 22, 2006, among Maunsell HK Holdings, Ltd., Faber Maunsell Limited, W.E. Bassett & Partners Pty. Ltd., Maunsell Group Limited, and Maunsell Australia Pty Ltd., as the Borrowers, Union Bank of California, N.A., as the Administrative Agent, BMO Capital Markets, as Co-Lead Arrangers and Co-Book Managers, Bank of Montreal, acting under its trade name BMO Capital Markets, as the Syndication Agent and other financial institutions that are parties thereto | |
II-3
10.3** | Note Purchase Agreement dated as of June 9, 1998, among Registrant and the purchaser parties thereto for Senior Notes due 2008 | |
II-3
10.4** | Amendment to Note Purchase Agreement dated as of June 9, 1998 | |
10.5** | Private Shelf Agreement, dated December 30, 2004, among Registrant, Prudential Investment Management, Inc. and certain Prudential Affiliates | |
10.6** | Guarantee dated as of January 9, 2007 among Registrant, HSBC Bank USA National Association and the other bank parties thereto | |
10.7** | Office Lease, dated June 13, 2001, between Registrant and Shuwa Investments Corporation | |
10.8** | First Amendment to Office Lease, dated September 2001, between Registrant and Shuwa Investments Corporation | |
10.9** | Second Amendment to Office Lease, dated October 22, 2001, between Registrant and Shuwa Investments Corporation | |
10.10** | Non-Qualified Stock Purchase Plan, restated as of October 1, 2006 | |
10.11** | Amendment 2006-1, dated as of October 1, 2006, to Non-Qualified Stock Purchase Plan | |
10.12** | 1992 Supplemental Executive Retirement Plan, restated as of November 20, 1997 | |
10.13** | First Amendment, effective July 1, 1998, to the 1992 Supplemental Executive Retirement Plan | |
10.14** | Second Amendment to the 1992 Supplemental Executive Retirement Plan | |
10.15** | Third Amendment to the 1992 Supplemental Executive Retirement Plan | |
10.16** | 1996 Supplemental Executive Retirement Plan, restated as of November 20, 1997 | |
10.17** | First Amendment, effective July 1, 1998, to the 1996 Supplemental Executive Retirement Plan | |
10.18** | Second Amendment to the 1996 Supplemental Executive Retirement Plan | |
10.19** | Agreement of Lease dated as of March 17, 1999, between 650 Third Avenue LLC and Frederick R. Harris, Inc. | |
10.20** | 1998 Management Supplemental Executive Retirement Plan | |
10.21** | First Amendment, effective January 1, 2002, to the 1998 Management Supplemental Executive Retirement Plan | |
10.22** | Second Amendment to the 1998 Management Supplemental Executive Retirement Plan | |
10.23** | Third Amendment to the 1998 Management Supplemental Executive Retirement Plan | |
10.24** | 1996 Excess Benefit Plan | |
10.25** | First Amendment, effective July 1, 1998, to the 1996 Excess Benefit Plan | |
10.26** | Second Amendment to the 1996 Excess Benefit Plan | |
10.27** | Third Amendment to the 1996 Excess Benefit Plan | |
10.28** | 2005 ENSR Stock Purchase Plan | |
10.29** | 2005 UMA Group Ltd. Employee Stock Purchase Plan | |
II-4
10.30** | 2006 Stock Incentive Plan | |
10.31** | Cansult Maunsell Merger Investment Plan | |
II-4
10.32** | AECOM Equity Investment Plan | |
10.33** | Global Stock Investment Plan—United Kingdom | |
10.34** | Hong Kong Stock Investment Plan—Grandfathered Directors | |
10.35** | AECOM Retirement & Savings Plan | |
10.36** | Executive Employment Agreement between Registrant and James R. Royer | |
21.1** | Subsidiaries of AECOM | |
Consent of Gibson, Dunn & Crutcher, LLP (included as part of Exhibit 5.1) | ||
23.2+ | Consent of Independent | |
24.1 | Power of Attorney |
Insofar as indemnification for liabilities arising under the Securities Act of 1933 (the "Act") may be permitted to directors, officers and controlling persons of the registrant pursuant to the foregoing provisions, or otherwise, the registrant has been advised that in the opinion of the Commission such indemnification is against public policy as expressed in the Act and is, therefore, unenforceable. In the event that a claim for indemnification against such liabilities (other than the payment by the registrant of expenses incurred or paid by a director, officer or controlling person of the registrant in the successful defense of any action, suit or proceeding) is asserted by such director, officer or controlling person in connection with the securities being registered, the registrant will, unless in the opinion of its counsel the matter has been settled by controlling precedent, submit to a court of appropriate jurisdiction the question of whether such indemnification by it is against public policy as expressed in the Act and will be governed by the final adjudication of such issue.
The undersigned registrant hereby undertakes that:
II-5
Pursuant to the requirements of the Securities Act of 1933, the Registrant has duly caused this Registration Statement to be signed on its behalf by the undersigned, thereunto duly authorized, in the City of Los Angeles, California, on March 8,May 7, 2007.
| AECOM TECHNOLOGY CORPORATION | |||
By: | /s/ JOHN M. DIONISIO John M. Dionisio President and Chief Executive Officer | ||
KNOW ALL MEN BY THESE PRESENTS, that each person whose signature appears below constitutes and appoints Michael S. Burke, Eric Chen and David Y. Gan, and each of them, his or her true and lawful attorneys-in-fact and agents, each with full power of substitution and resubstitution, for him or her and in his or her name, place and stead, in any and all capacities, to sign any and all amendments, including post-effective amendments, to this Registration Statement, and any registration statement relating to the offering covered by this Registration Statement and filed pursuant to Rule 462(b) under the Securities Act of 1933, and to file the same, with exhibits thereto and other documents in connection therewith, with the Securities and Exchange Commission, granting unto said attorneys-in-fact and agents, and each of them, full power and authority to do and perform each and every act and thing requisite and necessary to be done, as fully to all intents and purposes as he or she might or could do in person, hereby ratifying and confirming all that each of said attorneys-in-fact and agents or their substitute or substitutes may lawfully so or cause to be done by virtue hereof.
Pursuant to the requirements of the Securities Act of 1933, the following persons have signed this Registration Statement in the capacities and on the date indicated.
| Signature | Title | Date | ||
|---|---|---|---|---|
| /s/ JOHN M. DIONISIO John M. Dionisio | Director, President and Chief Executive Officer (Principal Executive Officer) | |||
/s/ MICHAEL S. BURKE Michael S. Burke | Executive Vice President, Chief Corporate Officer and Chief Financial Officer (Principal Financial Officer) | |||
/s/ RONALD E. OSBORNE Ronald E. Osborne | Vice President, Corporate Controller (Principal Accounting Officer) | |||
Richard G. Newman | Director, Chairman | |||
* Francis S.Y. Bong | Director | May 7, 2007 | ||
* H. Frederick Christie | Director | May 7, 2007 | ||
* James H. Fordyce | Director | May 7, 2007 | ||
II-6
S. Malcolm Gillis | Director | |||
Linda Griego | Director | |||
Robert J. Lowe | Director | |||
William G. Ouchi | Director | |||
William P. Rutledge | Director | |||
Lee D. Stern | Director |
| *By: | /s/ ERIC CHEN Eric Chen Attorney-in-Fact |
II-7
| Exhibit Numbers | Description | |
|---|---|---|
| Form of Underwriting Agreement | ||
3.1** | Restated Certificate of Incorporation | |
3.2** | Certificate of Designations for Class C Preferred Stock | |
3.3** | Certificate of Designations for Class E Preferred Stock | |
3.4** | Certificate of Designations for Class F Convertible Preferred Stock, Series 1 | |
3.5** | Certificate of Designations for Class G Convertible Preferred Stock, Series 1 | |
3.6*** | Restated Bylaws | |
4.1** | Form of Common Stock Certificate | |
4.2** | Investor Rights Agreement, dated as of February 9, 2006, among Registrant and the investors party thereto | |
4.3** | Joinder Agreement, dated as of February 9, 2006, between the Registrant and the investor party thereto | |
4.4** | Joinder Agreement, dated as of February 14, 2006, between the Registrant and the investor party thereto | |
4.5** | Amendment No. 1 to Investor Rights Agreement, dated as of February 14, 2006, among the Registrant and the investors party thereto | |
Opinion of Company Counsel | ||
10.1** | Amended and Restated Credit Agreement, dated as of September 22, 2006, among Registrant, the Subsidiary Borrowers, Union Bank of California, N.A., as Administrative Agent, a Letter of Credit Issuing Lender and the Swing Line Lender, Harris N.A., as a Letter of Credit Issuing Lender, Bank of Montreal acting under its trade name BMO Capital Markets, as Syndication Agent and other financial institutions that are parties thereto | |
10.2** | Term Credit Agreement dated as of September 22, 2006, among Maunsell HK Holdings, Ltd., Faber Maunsell Limited, W.E. Bassett & Partners Pty. Ltd., Maunsell Group Limited, and Maunsell Australia Pty Ltd., as the Borrowers, Union Bank of California, N.A., as the Administrative Agent, BMO Capital Markets, as Co-Lead Arrangers and Co-Book Managers, Bank of Montreal, acting under its trade name BMO Capital Markets, as the Syndication Agent and other financial institutions that are parties thereto | |
10.3** | Note Purchase Agreement dated as of June 9, 1998, among Registrant and the purchaser parties thereto for Senior Notes due 2008 | |
10.4** | Amendment to Note Purchase Agreement dated as of June 9, 1998 | |
10.5** | Private Shelf Agreement, dated December 30, 2004, among Registrant, Prudential Investment Management, Inc. and certain Prudential Affiliates | |
10.6** | Guarantee dated as of January 9, 2007 among Registrant, HSBC Bank USA National Association and the other bank parties thereto | |
10.7** | Office Lease, dated June 13, 2001, between Registrant and Shuwa Investments Corporation | |
II-8
10.8** | First Amendment to Office Lease, dated September 2001, between Registrant and Shuwa Investments Corporation | |
10.9** | Second Amendment to Office Lease, dated October 22, 2001, between Registrant and Shuwa Investments Corporation | |
10.10** | Non-Qualified Stock Purchase Plan, restated as of October 1, 2006 | |
10.11** | Amendment 2006-1, dated as of October 1, 2006, to Non-Qualified Stock Purchase Plan | |
10.12** | 1992 Supplemental Executive Retirement Plan, restated as of November 20, 1997 | |
10.13** | First Amendment, effective July 1, 1998, to the 1992 Supplemental Executive Retirement Plan | |
10.14** | Second Amendment to the 1992 Supplemental Executive Retirement Plan | |
10.15** | Third Amendment to the 1992 Supplemental Executive Retirement Plan | |
10.16** | 1996 Supplemental Executive Retirement Plan, restated as of November 20, 1997 | |
10.17** | First Amendment, effective July 1, 1998, to the 1996 Supplemental Executive Retirement Plan | |
10.18** | Second Amendment to the 1996 Supplemental Executive Retirement Plan | |
10.19** | Agreement of Lease dated as of March 17, 1999, between 650 Third Avenue LLC and Frederick R. Harris, Inc. | |
10.20** | 1998 Management Supplemental Executive Retirement Plan | |
10.21** | First Amendment, effective January 1, 2002, to the 1998 Management Supplemental Executive Retirement Plan | |
10.22** | Second Amendment to the 1998 Management Supplemental Executive Retirement Plan | |
10.23** | Third Amendment to the 1998 Management Supplemental Executive Retirement Plan | |
10.24** | 1996 Excess Benefit Plan | |
10.25** | First Amendment, effective July 1, 1998, to the 1996 Excess Benefit Plan | |
10.26** | Second Amendment to the 1996 Excess Benefit Plan | |
10.27** | Third Amendment to the 1996 Excess Benefit Plan | |
10.28** | 2005 ENSR Stock Purchase Plan | |
10.29** | 2005 UMA Group Ltd. Employee Stock Purchase Plan | |
10.30** | 2006 Stock Incentive Plan | |
10.31** | Cansult Maunsell Merger Investment Plan | |
10.32** | AECOM Technology Corporation Equity Investment Plan | |
10.33** | Global Stock Investment Plan—United Kingdom | |
10.34** | Hong Kong Stock Investment Plan—Grandfathered Directors | |
10.35** | AECOM Technology Corporation Retirement & Savings Plan | |
10.36** | Executive Employment Agreement between Registrant and James R. Royer | |
II-9
21.1** | Subsidiaries of AECOM | |
Consent of Gibson, Dunn & Crutcher, LLP (included as part of Exhibit 5.1) | ||
23.2+ | Consent of Independent | |
24.1 | Power of Attorney |
II-10