S‑1
| 1389 | |||
(State or other jurisdiction of | (Primary Standard Industrial Classification Code Number) | (I.R.S. Employer Identification Number) | ||
Title of Each Class of Securities Common Stock, par value $0.001 per share This Investing in our common stock involves risks. You should consider the risks we have described in The date of this prospectus is , 2017. ” estimates. of proppant per well. Over 75% of our fleet has been delivered over the past complex hydraulic fracturing jobs, and is largely standardized across units to facilitate efficient maintenance and repair and reduce equipment downtime. strong relationships to keep our fleet fully utilized and selectively expand our platform in response to specific customer demand. Common stock offered by the selling shareholders Common stock outstanding prior to and after this offering Use of proceeds We will not receive any of the proceeds from the sale of shares of our common stock by the selling shareholders Dividend policy Risk factors ($ in thousands except shares and per share amounts) Statement of Operations Data: Revenue Costs and Expenses: Cost of services(1) General and administrative(2) Depreciation and amortization Impairment expense Loss on disposal of assets Total costs and expenses Operating Loss Other Income (Expense): Interest expense Gain on extinguishment of debt Other expense Total other expense Loss before income taxes Income tax benefit Net loss Per share information: Net loss per common share: Basic Diluted Weighted average common shares outstanding: Basic Diluted Balance Sheet Data as of: Cash and cash equivalents Property and equipment — net of accumulated depreciation Total assets Long-term debt — net of deferred loan costs Total shareholders' equity Cash Flow Statement Data: Net cash (used in) provided by operating activities Net cash used in investing activities Net cash used in financing activities Other Data: Adjusted EBITDA Adjusted EBITDA Margin Capital expenditures Net loss Interest expense Income tax benefit Depreciation and amortization EBITDA Impairment expense Loss on disposal of assets Gain on extinguishment of debt Stock-based compensation Other expense Adjusted EBITDA Revenue Adjusted EBITDA margin capacity constraints, market limitations, curtailment of production or interruption of the processing or transportation of oil and natural gas produced from the wells in these areas. In addition, the effect of fluctuations on supply and demand may become more pronounced within specific geographic oil and natural gas producing areas such as the Permian Basin, which may cause these conditions to occur with greater frequency or magnify the effects of these conditions. Due to the concentrated nature of our operations, we could experience any of the same conditions at the same time, resulting in a relatively greater impact on our revenue than they might have on other companies that have more geographically diverse operations. completing their wells using their own hydraulic fracturing equipment and personnel. sources in these areas. Our or our alternative may not be favorable to us. In particular, the terms of any debt financing may include covenants that significantly restrict our operations. Our inability to grow as planned may reduce our chances of maintaining and improving profitability. needs or to expand or pursue our business activities. For example, Facility and Other Financing Arrangements .” imposed for certain risks. In some instances, certain insurance could become unavailable or available only for reduced amounts of coverage. If we were to incur a significant liability for which we are not fully insured, it could have a material adverse effect on our business, results of operations and financial condition. In addition, we may not be able to secure additional insurance or bonding that might be required by new governmental regulations. This may cause us to restrict our operations, which might severely impact our financial position. Certain motor vehicle operators require registration with the Department of Transportation. This registration requires an acceptable operating record. The Department of Transportation periodically conducts compliance reviews and may revoke registration privileges based on certain safety performance criteria that could result in a suspension of operations. separately negotiated agreement are unclear at this time. Conservation measures, commercial development and technological advances could reduce demand for oil and natural gas and our services.688-0012
688‑0012registrant'sregistrant’s principal executive offices)688-0012
688‑0012Copies to:Ryan J. Maierson
Thomas G. Brandt
Latham & Watkins LLP
811 Main Street, Suite 3700
Houston, Texas 77002
(713) 546-5400Alan BeckDouglas E. McWilliamsVinson & Elkins L.L.P.1001 Fannin Street, Suite 2500Houston, Texas 77002(713) 758-2222546‑5400oxpost-effectivepost‑effective amendment filed pursuant to Rule 462(c) under the Securities Act, check the following box and list the Securities Act registration statement number of the earlier effective registration statement for the same offering. opost-effectivepost‑effective amendment filed pursuant to Rule 462(d) under the Securities Act, check the following box and list the Securities Act registration statement number of the earlier effective registration statement for the same offering. onon-acceleratednon‑accelerated filer, or a smaller reporting company.company or an emerging growth company . See the definitions of "large“large accelerated filer," "accelerated filer"” “accelerated filer,” “smaller reporting company” and "smaller reporting company"“emerging growth company” in Rule 12b-212b‑2 of the Exchange Act.Non-acceleratedNon‑accelerated filer ý
x
(Do not check if a
smaller reporting company)CALCULATION OF REGISTRATION FEE
to be Registered Proposed Maximum
Aggregate Offering
Price(1)(2) Amount of
Registration Fee Amount to be
Registered(1) Proposed Maximum
Offering Price per
Share(2)
Aggregate Common Stock, par value $0.001 per share Common Stock, par value $0.001 per share 17,355,045 $11.765 $204,182,104 $23,665 (1) (1) (1) $345,000,000 $39,985.50 (2) (1)Includes shares issuable upon exercise of the underwriters' option to purchase additional shares.(2)Estimated solely for the purpose of calculating the registration fee pursuant to Rule 457(o).isbecomes effective. This preliminary prospectus is not an offer to sell nor does it seek an offer to buy these securities in any jurisdiction where the offer or sale is not permitted.FEBRUARY 7,SEPTEMBER 8, 2017![]()

is our initial public offering. We are offeringprospectus covers the offer and sale of 17,355,045 shares of our common stock andby the selling shareholders are(which term as used in this prospectus includes pledgees, donees, transferees or other successors‑in‑interest). We will not receive any of the proceeds from the sale of the shares by the selling shares ofshareholders. stock. Prior to this offering, there has been no public market for our common stock. Itstock is currently estimated that the initial public offering price will be between $ and $ per share. We intend to apply to list our common stocklisted on the New York Stock Exchange, or NYSE, under the symbol "PUMP." “PUMP.” The last reported closing sales price of our common stock on September 7, 2017 was $11.76 per share. You are urged to obtain current market quotations for our common stock."emerging“emerging growth company"company” as that term is used in the Jumpstart Our Business Startups Act of 2012, or JOBS Act, and will beare subject to reduced public company reporting requirements."Risk Factors"“Risk Factors” beginning on page 15.8.Per ShareTotal Initial public offering price$ $ Underwriting discounts and commissions(1)$ $ Proceeds, before expenses, to ProPetro Holding Corp. $ $ Proceeds, before expenses, to the selling shareholders$ $ (1)Please read "Underwriting" for a description of all underwriting compensation payable in connection with this offering. The underwriters have the option to purchase up to an additional shares from us and the selling shareholders at the public offering price, less the underwriting discounts. Delivery of the shares of common stock is expected to be made on or about , 2017 through the book-entry facilities of The Depository Trust Company.Goldman, Sachs & Co.BarclaysCredit SuisseJ.P. MorganEvercore ISIRBC Capital MarketsSimmons & Company International Energy Specialists of Piper JaffrayRaymond JamesDeutsche Bank SecuritiesTudor, Pickering, Holt & Co.Johnson Rice & Company L.L.C.

Page SummaryThe OfferingSummary Historical Consolidated Financial DataRisk FactorsUse of ProceedsDividend PolicyDilutionSelected Historical Financial DataManagement's Discussion and Analysis of Financial Condition and Results of OperationsIndustry OverviewManagementExecutive CompensationPrincipal and Selling ShareholdersCertain Relationships and Related Party TransactionsDescription Of Capital StockShares Eligible For Future SaleMaterial U.S. Federal Income Tax Consequences to Non-U.S. HoldersUnderwritingLegal MattersWhere You Can Find Additional InformationForward-Looking StatementsGlossary of Oil and Natural Gas TermsIndex to Financial StatementsF-1underwritersselling shareholders have not, authorized any other person to provide you with information different from that contained in this prospectus and any free writing prospectus. If anyone provides you with different or inconsistent information, you should not rely on it. We are not, and the underwritersThe selling shareholders are not making an offer to sell these securities in any jurisdiction where an offer or sale is not permitted. The information in this prospectus is accurate only as of the date of this prospectus, regardless of the time of delivery of this prospectus or any sale of our common stock. Our business, financial condition, results of operations and prospects may have changed since that date.forward-lookingforward‑looking statements that are subject to a number of risks and uncertainties, many of which are beyond our control. Please read "Risk Factors"“Risk Factors” and "Forward-Looking“Forward‑Looking Statements."parties'parties’ trademarks, service marks, trade names or products in this prospectus is not intended to, and does not imply, a relationship with, or endorsement or sponsorship by us. Solely for convenience, the trademarks, service marks and trade names referred to in this prospectus may appear without the ®,TM orSM symbols, but such references are not intended to indicate, in any way, that we will not assert, to the fullest extent under applicable law, our rights or the right of the applicable licensor to these trademarks, service marks and trade names. Unless the context otherwise requires, the information in this prospectus (other than in the historical financial statements) assumes that the underwriters will not exercise their option to purchase additional shares.is based on a variety of sources, including independent publications, government publications, informationhas been obtained from customers, distributors, suppliers, trade and business organizations and publicly available information and publications as well as our good faith estimates, which have been derived from management's knowledge and experience in the industry in which we operate. The industry data sourced from Spears & Associates is from its publication titled "Hydraulic Fracturing Market 2005-2017," published in the fourth quarter of 2016. The industry data sourced from Rystad Energy is from its "UCube" as of November 2016. We believe that these third-party sources are reliable and that the third-party information included in this prospectus and in our estimates is accurate and complete.prospectus. Unless indicated otherwise, the information presented in this prospectus assumes an initial public offering price of $ per share (the midpoint of the price range on the cover page of this prospectus), that the underwriters do not exercise their option to purchase additional shares and the conversion of all of the outstanding shares of our Series A Convertible Preferred Stock, par value $0.001 per share ("Series A Preferred Shares"), into shares of common stock.documents incorporated by reference herein. You should read "Risk Factors"“Risk Factors” for more information about important risks that you should consider carefully before buying our common stock."ProPetro“ProPetro Holding Corp.," "the” “the Company," "our” “our company," "we," "our"” “we,” “our” and "us,"“us,” or like terms, refer to ProPetro Holding Corp. and its subsidiary. References to (i) "Energy“Energy Capital Partners"Partners” refer to Energy Capital Partners II, LP and its parallel and co-investmentco‑investment funds and related investment vehicles and (ii) the "selling shareholders"“selling shareholders” refer to Energy Capital Partners and the other selling shareholders that are offering shares of common stock as set forth in this offering and have granted the underwriters an option to purchase additional shares.section entitled “Selling Shareholders.” When we refer to the "utilization"“utilization” of our fleet, we are referring to the percentage of our fleet in use by our customers at the applicable time or for the applicable period of determination. We have provided definitions for some of the terms we use to describe our business and industry and other terms used in this prospectus in the "Glossary“Glossary of Oil and Natural Gas Terms"Terms” beginning on page A-1A‑1 of this prospectus.growth-oriented,growth‑oriented, Midland, Texas-basedTexas‑based oilfield services company providing hydraulic fracturing and other complementary services to leading upstream oil and gas companies engaged in the exploration and production, or E&P, of North American unconventional oil and natural gas resources. Our operations are primarily focused in the Permian Basin, where we have cultivated longstanding customer relationships with some of the region'sregion’s most active and well-capitalizedwell‑capitalized E&P companies, including Callon Petroleum, Diamondback Energy, Parsley Energy, Pioneer Natural Resources, Surge Energy and XTO Energy. For the year ended December 31, 2016, no single customer represented greater than 20% of our revenue.companies. The Permian Basin is widely regarded as the most prolific oil-producingoil‑producing area in the United States, and we believe we are currentlyone of the largest private providerproviders of hydraulic fracturing services in the region by hydraulic horsepower, or HHP, with an aggregate deployed capacity of 420,000555,000 HHP. Our fleet which consists of 10 hydraulic fracturing units, has been designed to handle the highest intensity, most complex hydraulic fracturing jobs, and has been 100% utilized since September 2016. We haveIn the quarter ended June 30, 2017, we purchased and put in service two additional hydraulic fracturing units, which areand took delivery and put into service a third unit following the end of quarter, bringing our fleet total to 13 deployed units. In addition, we have contracted to purchase three new hydraulic fracturing units scheduled for delivery and deployment to dedicated customers in Aprilthe second half of 2017, as well as other ancillary equipment such as engines and June 2017, respectively.spare parts. These units will provide us with an additional 90,000135,000 HHP, bringing our totalaggregate capacity to 510,000690,000 HHP. Additionally, we expect to use the proceeds from this offering to purchase two additional units that will be deployed in 2017 to meet specific customer requests, giving us an additional 90,000 HHP, or 600,000 HHP in the aggregate, once all units have been received.region'sregion’s increasingly high-intensityhigh‑intensity well completions, which are characterized by longer horizontal wellbores, more frac stages per lateral and increasing amountsthreefour years, and we have fully maintained our equipment throughout the recent industry downturn to ensure optimal performance and reliability. In contrast, we believe many of our competitors have deferred necessary maintenance capital spending throughout the downturn, which we believe positions us to respond more quickly and reliably to customer needs during the ongoing market recovery.customers'customers’ increasing service needs and spending levels.high-qualityhigh‑quality services that are tailored to our customers'customers’ needs and synchronized with their well development programs. This alignment assists our customers in optimizing the long-termlong‑term development of their unconventional resources. Over the past threefour years, we have leveraged our strong Permian Basin relationships to grow our installed HHP capacity by over 400%four times and organically build our Permian Basin cementing, coiled tubing and acidizing lines of business. Consistent with past performance, we believe our substantial market presence will continue to yield a variety of actionable growth opportunities allowing us to expand both our hydraulic fracturing and complementary services going forward. To this end, we intend to continue our past practice of opportunistically deploying new equipment on a long-term,long‑term, dedicated basis in response to specific customer demand. For the nine months ended September 30, 2016 and the year ended December 31, 2015, we generated net losses of approximately $(35.8) million and $(45.9) million, respectively, and Adjusted EBITDA of approximately $1.6 million and $60.1 million, respectively. Over these same periods, approximately 92.1% and 90.0% of our revenues, respectively, were generated from our pressure pumping segment, which includes our hydraulic fracturing, cementing and acidizing services. For the definition of Adjusted EBITDA and a reconciliation from its most directly comparable financial measure calculated and presented in accordance with generally accepted accounting principles ("GAAP"), please read "Selected Historical Consolidated Financial Data — Non-GAAP Financial Measures."Company'sCompany’s operations on hydraulic fracturing targeting the Permian Basin. As of September 30, 2016,August 1, 2017, we had grown our hydraulic fracturing business to a total of 1013 hydraulic fracturing units with an aggregate of 420,000555,000 HHP, of which 320,000455,000 HHP has been delivered since 2013. We have purchased twoFurther, three additional hydraulic fracturing units which are scheduled for delivery and deployment to dedicated customers in April and Junethe second half of 2017, respectively. These unitswhich will provide us with an additional 90,000 HHP, bringingincrease our total capacity to 510,000an aggregate of 690,000 HHP. Additionally, we expect to use the proceeds from this offering to purchase two additional units that will be deployed in 2017 to meet specific customer requests, giving us an additional 90,000 HHP, or 600,000 HHP in the aggregate, once all units have been received. Our fleet has been designed to handle the highest-intensity,highest‑intensity, mostcustomer'scustomer’s needs. Each unit in our fleet has a designated team of personnel, which allows us to provide responsive and customized services, such as project design, proppant procurement, real-timereal‑time data provision and post-completionpost‑completion analysis for each of our jobs. Many of our hydraulic fracturing units and associated personnel have continuously worked with the same customer for the past several years, promoting deep relationships and a high degree of coordination and visibility into future customer activity levels. Furthermore, in light of our substantial market position and historically high fleet utilization levels, we have established a variety of entrenched relationships with key equipment, sand and other downhole consumable suppliers. These strategic relationships provide us ready access to equipment, parts and materials on a timely and economic basis and allow our dedicated procurement logistics team to ensure consistently reliable operations. In addition to our hydraulic fracturing operations, we offer a range of ancillary services to our customers, including cementing, acidizing, coiled tubing, flowback services and surface air drilling. We believe these services are complementary and synergistic with our hydraulic fracturing operations and have, in large part, grown organically with our customers'customers’ demand for these services. ProPetro is strategically located and focused in the Permian Basin, one of the world's most attractive regions for oil field service operations as a result of its size, geology, and customer activity levels. The Permian Basin consists of mature, legacy, onshore oil and liquids-rich natural gas reservoirs that span approximately 86,000 square miles in West Texas and New Mexico and are characterized by multiple prospective geologic benches for horizontal development. Rystad Energy estimates that, as of November 2016, the Permian Basin contains approximately 58 billion barrels of oil, the largest recoverable crude oil resource base in the United States and the second largest in the world. As a result of its significant size, coupled with the presence of multiple prospective geologic benches and other favorable characteristics, the Permian Basin has become widely recognized as the most attractive and economic oil resource in North America. Since May 2016, Permian Basin rig counts have grown by more than 110% to 291 active rigs as of January 2017. This increase in Permian Basin rig activity has accounted for more than 50% of the total U.S. rig count growth over that time period, more than three times the combined number of rigs added in the Bakken and Eagle Ford shales. The Permian Basin is divided by the Central Basin Platform, creating the Midland and Delaware sub-basins, which have each contributed to the overall growth in the Permian Basin. The Midland Basin is the more delineated and mature resource-play of the Permian Basin's sub-basins and is the current focus of our operations. Operational improvements in the basin have driven heightened oil production in recent years as a result of increasing levels of pad drilling, downspacing, and capital efficiency. Initially delineated with thousands of vertical wells, today its resource potential is further enhanced through horizontal drilling and completion efficiencies. Rystad Energy estimates the Midland Basin's recoverable oil resource to be over 27 billion barrels, second in the United States only to the geographically adjacent Delaware Basin. Accounting for more than 50% of the Permian Basin's growth in rig activity since May 2016, the Delaware Basin has become a premier, complementary resource base to the Midland Basin. Rystad Energy estimates the recoverable crude oil resource in the Delaware Basin to be slightly greater than the Midland Basin, at approximately 28 billion barrels. E&P operators have actively delineated acreage in the Delaware Basin, having successfully targeted nine distinct zones with horizontal penetration. As the less-developed of the two primary Permian Basin sub-basins, theDelaware Basin represents a high-growth opportunity for E&P companies, many of whom have entered the basin through large-scale acquisitions. As activity levels increase in the Delaware Basin, we have begun to expand our presence in the region in tandem with increasing activity levels and demand pull from our core customer base. The Permian Basin's compelling economics for E&P companies, especially in a low commodity price environment, has resulted in a significant increase in acquisition activity across the basin. Since 2016 the Permian Basin leads all other North American basins in acquisition activity, with more than 30 transactions of $100 million or greater and an aggregate transaction volume totaling more than $30 billion. Our customers have accounted for a significant portion of this acquisition activity by both size and volume and are actively scaling their capital budgets to develop their expanding resource bases. In addition to increased drilling activity levels in the Permian Basin, an ongoing shift to larger and more complex well completions has significantly increased per-well demand for the hydraulic fracturing and other completion services we offer. According to Spears & Associates, key drivers of this increasing service intensity include:•Longer horizontal wellbore laterals. Average Permian Basin lateral lengths are expected to grow from an average of 5,000 feet in 2013 to an estimated average of 9,000 feet anticipated in 2017. Management estimates that leading-edge Permian Basin lateral lengths are currently approaching 12,500 feet;•More frac stages per lateral. Frac stages per well are expected to increase from 15 stages per well completed in 2013 to approximately 42 stages per well completed in 2017; and•Increasing amounts of proppant per well. Permian Basin sand use is expected to grow from an average of 1,100 pounds per foot of proppant per well in 2015 to approximately 1,800 pounds per foot of proppant per well anticipated in 2017. Rising producer activity levels, increasing basin service intensity and continued drilling and completion efficiencies have combined to drive the 100% utilization of our fleet and build a sizable backlog of addressable demand for our services. We have seen our competitors defer necessary maintenance spending and cannibalize idle equipment for spare parts. This has resulted in tightening hydraulic fracturing supply and demand fundamentals and is likely to drive continued pricing improvement for our hydraulic fracturing services. Moreover, we believe the other complementary services that we provide are well-positioned to similarly benefit from a continued industry recovery.high-qualityhigh‑quality services that are tailored to our customers'customers’ needs and synchronized with their well development programs. This alignment assists our customers in optimizing the long-termlong‑term development of their unconventional resources. We believe that the following competitive strengths differentiate us from our peers and uniquely position us to achieve our primary business objective.•private hydraulic fracturing providerproviders by HHP in the Permian Basin, which is the most prolific oil producing area in the United States. Our longstanding customer relationships and substantial Permian Basin market presence uniquely position us to continue growing in tandem with the basin'sbasin’s ongoing development. The Permian Basin is a mature, liquids-richliquids‑rich basin with well-knownwell‑known geology and a large, exploitable resource base that delivers attractive E&P producer economics at or below current commodity prices. Rystad Energy estimatesthat, as of November 2016, the Permian Basin contains approximately 58 billion barrels of oil, the largest recoverable crude oil resource base in the United States and the second largest in the world. As a result of its significant size, coupled with the presence of multiple prospective geologic benches and other favorable characteristics, the Permian Basin has become widely recognized as the mostThe recent recovery of oil prices to the low $50 per barrel range has driven a considerable increase in Permian drilling and completion activity and associated demand for our services. Today, the Permian Basin is the most active onshore basin in North America, with over 291 active rigs, and accounts for approximately 51% of all oil-directed rigs in the United States. Current Permian production levels exceed the combined output of both the Bakken and Eagle Ford shale formations, and, given the Permian Basin's superior breakeven economics, which are estimated by Rystad Energy to be as low as $32 per barrel, we expect robust activity levels in the basin for the foreseeable future.
Our operational focus has historically been in the Permian Basin'sBasin’s Midland sub-basinsub‑basin in support of our customers'customers’ core operations. More recently, however, many of our customers (including Callon Petroleum, Diamondback Energy, Parsley Energy, RSP Permian and XTO Energy) have made sizeable acquisitions in the Delaware Basin. We anticipate that many of these customers will request our services in the Delaware Basin to help develop their acreage, and we believe that we are uniquely positioned to capture a large addressable growth opportunity as the basin develops. For the foreseeable future, we expect both the Midland Basin and the Delaware Basin to continue to command a disproportionate share of future North American E&P spending.•in Januaryat the beginning of August 2017. As the horizontal rig count has grown, well completion intensity levels have also increased as a result of longer wellbore lateral lengths, more fracturing stages per foot of lateral and increasing amounts of proppant per stage. Furthermore, the ongoing improvement in drilling and completion efficiencies, driven by innovations such as multi-wellmulti‑well pads and zipper fracs, have further increased the demand for HHP. Taken together, these demand drivers have helped contribute to the full utilization of our fleet and leave us well positioned to capture future organic growth opportunities and enhanced pricing for the services we offer.•high-quality,high‑quality, Permian Basin-focusedBasin‑focused customers.Our deep local roots, operational expertise and commitment to safe and reliable service have allowed us to cultivate longstanding customer relationships with the most active and well-capitalizedwell‑capitalized Permian Basin operators. Our diverse customer base is comprised of market leaders such as Callon Petroleum, Diamondback Energy, Parsley Energy, Pioneer Natural Resources, Surge Energy and XTO Energy, with no single customer representing more than 20% of our revenue for the year ended December 31, 2016. Many of our current customers have worked with us since our inception and have integrated our fleet scheduling with their well development programs. This high degree of operational alignment and their continued support have allowed us to maintain relatively high utilization rates over time. As our customers increase activity levels, we expect to continue to leverage these•well-maintainedwell‑maintained equipment.We have a large, homogenous fleet of modern equipment that is configured to handle the Permian Basin'sBasin’s most complex, highest-intensity,highest‑intensity, hydraulic fracturing jobs. We believe that our fleet design is a key competitive advantage compared to many of our competitors who have fracturing units that are not optimized for Permian Basin conditions. Our fleet is largely standardized across units to facilitate efficient maintenance and repair, reducing equipment downtime and improving labor efficiency. Importantly, we have fully maintained our fleet throughout the recent industry downturn to ensure optimal performance and reliability. In contrast, we believe many of our competitors have deferred necessary maintenance capital spending and cannibalized essential equipment for spare parts during the same period. Furthermore, our entrenched relationships with a variety of key suppliers and vendors provide us with the reliable access to the equipment necessary to support our continued organic growth strategy.•cross-cyclecross‑cycle financial performance.Over the past several years, we have maintained relatively high cross-cyclecross‑cycle fleet utilization rates. Since September 2016, our fleet has been 100% utilized, and for each of the years ended December 31, 2015 and 2016 and the quarter ended June 30, 2017, we operated in excess of 65% utilization. Our consistent track record of steady organic growth, coupled with our ability to immediately deploy new HHP on a dedicated and fully utilized basis, has resulted in revenue growth across industry cycles. We believe that we will be able to grow faster thancustomer-focusedcustomer‑focused approach should result in enhanced financial performance going forward.•theour company with a portion of our original investment capital. We believe their track record of successfully building premier oilfield service companies in the Permian Basin, as well as their deep roots and relationships throughout the West Texas community, provide a meaningful competitive advantage for our business. In addition, our management team has assembled a loyal group of highly-motivatedhighly‑motivated and talented divisional managers and field personnel, and we have had virtually no manager-levelmanager‑level turnover in our core service divisions over the past three years. We employ a balanced decision-makingdecision‑making structure that empowers managerial and field personnel to work directly with customers to develop solutions while leveraging senior management'smanagement’s oversight. This collaborative approach fosters strong customer links at all levels of the organization and effectively institutionalizes customer relationships beyond the executive suite. We promote a "Safety First"“Safety First” culture, which has led to a Total Recordable Incident Rate, or TRIR, well below industry averages. For example, for the year ended December 31, 2016, we had a TRIR of 0.9, compared to a peer average of 2.5 for the year ended December 31, 2014.•Basin-focusedBasin‑focused hydraulic fracturing business, as we believe the Permian Basin hydraulic fracturing market offers supportive long-termlong‑term growth fundamentals. These fundamentals are characterized by increased demand for our HHP, driven by increasing drilling activity and well completion intensity levels, along with underinvestment by our competitors in their equipment. In response to the current commodity price environment, a number of our customers have publicly announced their intention to increase 2017 capital budgets in the Permian Basin in excess of 50% over 2016 levels. We are currently operating at 100% utilization, and several of our customers have requested additional HHP capacity from us. As our customers continue to develop their assets in the Midland Basin and Delaware Basin, we believe we are strategically positioned to deploy additional hydraulic fracturing equipment in support of their ongoing needs. We have purchased twoFurther, three additional hydraulic fracturing units which are scheduled for delivery and deployment to dedicated customers in April and June 2017, respectively.the second half of 2017. These units will provide us with an additional 90,000135,000 HHP, bringing our total capacity to 510,000690,000 HHP. Additionally, we expect to use the proceeds from this offering to purchase two additional units that will be deployed in 2017 to meet specific customer requests, giving us an additional 90,000 HHP, or 600,000 HHP in the aggregate, once all units have been received.•(as(with approximately 90% of our fleet currently operating on such a schedule, as compared to 2014, when the majority of our services were provided during daylight hours) should result in greater revenue opportunity and enhanced margins as fixed costs are spread over a broader revenue base. We believe that any incremental future fleet additions will benefit from these trends and associated economies of scale.•Cross-sellCross‑sell our complementary services.In addition to our hydraulic fracturing services, we offer a broad range of complementary services in support of our customers'customers’ development activities, including cementing, acidizing, coiled tubing, flowback services and surface air drilling. These complementary services create operational efficiencies for our customers, and allow us to capture a greater percentagecross-sellingcross‑selling and growing our complementary service offerings.•long-term,long‑term, dedicated basis in response to inbound customer requests. We will also selectively evaluate potential strategic acquisitions that increase our scale and capabilities or diversify our operations. At the closing of this offering, we will have no outstanding debt and expect to have a net cash position and $ million of available liquidity, in the form of cash on hand and undrawn borrowing capacity under our $ million revolving credit facility, to support our growth ambitions. Our principal shareholder is Energy Capital Partners. Energy Capital Partners, together with its affiliate funds and related persons, is a private equity firm with over $13.5 billion in capital commitments that is focused on investing in North America's energy infrastructure. Energy Capital Partners has significant energy and financial expertise, including investments in the power generation, midstream oil and gas, energy services and environmental infrastructure sectors. Upon completion of this offering, Energy Capital Partners will beneficially own approximately % of our common stock (or approximately % if the underwriters' option to purchase additional shares of common stock is exercised in full). We are also a party to certain other agreements with Energy Capital Partners and certain of its affiliates. For a description of these agreements, please read "Certain Relationships and Related Party Transactions.""Risk Factors"“Risk Factors” beginning on page 158 and the other information in this prospectus for an explanation of these risks before investing in our common stock.688-0012. Following the closing of this offering, our688‑0012. Our website will beis located athttp://www. .com.www.propetroservices.com. We expect to make our periodic reports and other information filed with or furnished to the Securities and Exchange Commission, or the SEC, available, free of charge, through our website, as soon as reasonably practicable after those reports and other information are electronically filed with or furnished to the SEC. Information on our website or any other website is not incorporated by reference into this prospectus and does not constitute a part of this prospectus.$1.0$1.07 billion in revenue during our last fiscal year, we qualify as an "emerging“emerging growth company"company” as defined in the Jumpstart Our Business Startups Act of 2012, or the JOBS Act. As an emerging growth company, we may, for up to five years, take advantage of specified exemptions from reporting and other regulatory requirements that are otherwise applicable generally to public companies. These exemptions include:•Management'sManagement’s Discussion and Analysis of Financial Condition and Results of Operations in this prospectus;•••auditor'sauditor’s report in which the auditor would be required to provide additional information about the audit and the financial statements of the issuer; and•thisthe consummation of our initial public offering (“IPO”), (ii) the last day of the fiscal year in which we have more than $1.0$1.07 billion in annual revenue, (iii) the date on which we issue more than $1.0 billion of non-convertiblenon‑convertible debt over a three-year three‑year"large“large accelerated filer,"” as defined in Rule 12b-212b‑2 promulgated under the Securities Exchange Act of 1934, as amended, or the Exchange Act.will electhave elected to opt out of the exemption that allows emerging growth companies to extend the transition period for complying with new or revised financial accounting standards (this election is irrevocable). Accordingly, the information that we provide you may be different than what you may receive from other public companies in which you hold equity interests. IssuerProPetro Holding Corp.Common stock offered by us shares.17,355,045 shares. shares.83,039,854 shares. shares (including shares of common stock issued upon the automatic conversion of our Series A Preferred Shares at the consummation of this offering).Option to purchase additional sharesWe and the selling shareholders have granted the underwriters a 30-day option to purchase up to an aggregate of additional shares of our common stock.Shares held by our selling shareholders after this offering shares (or shares, if the underwriters exercise in full their option to purchase additional shares).We expect to receive approximately $ million of net proceeds from this offering, based upon the assumed initial public offering price of $ per share (the midpoint of the price range set forth on the cover page of this prospectus), after deducting underwriting discounts and estimated offering expenses payable by us.We intend to use the net proceeds from this offering as follows: • approximately $ million will be used to repay borrowings outstanding under our term loan; • approximately $ million will be used to fund the purchase of additional hydraulic fracturing units; and • approximately $ million will be retained for general corporate purposes, including to fund growth capital expenditures. Please read "Use of Proceeds."in this offering, including pursuant to any exercise by the underwriters of their option to purchase additional shares of our common stock from the selling shareholders.Dividend policy We do not anticipate paying any cash dividends on our common stock. In addition, we expect our new revolving credit facility will place certain restrictions on our ability to pay cash dividends. Please read "Dividend“Dividend Policy."” Directed share program At our request, the underwriters have reserved up to % of theTrading symbolOur common stock being offered by this prospectus for sale, at the initial public offering price, to our directors, executive officers, employees and business associates. The sales will be made by the underwriters through a directed share program. We do not know if these persons will choose to purchase all or any portion of these reserved shares, but any purchases they do make will reduce the number of shares available to the general public. Please read "Underwriting — Directed Share Program."Listing and trading symbolWe intend to apply to list our common stockis listed on the NYSE under the symbol "PUMP."Risk factors You should carefully read and consider the information set forth under the heading "Risk Factors"“Risk Factors” and all other information set forth in this prospectus before deciding to invest in our common stock.SUMMARY HISTORICAL CONSOLIDATED FINANCIAL DATA The following table presents summary historical consolidated financial data of ProPetro Holding Corp. as of the dates and for the periods indicated. The summary historical consolidated financial data as of and for the year ended December 31, 2015 are derived from the audited financial statements appearing elsewhere in this prospectus. The summary historical consolidated interim financial data as of September 30, 2016 and 2015, and for the nine months ended September 30, 2016 and 2015, are derived from the unaudited condensed consolidated interim financial statements appearing elsewhere in this prospectus. The unaudited interim condensed consolidated financial statements have been prepared on the same basis as our audited financial statements and, in our opinion, include all adjustments, consisting of normal recurring adjustments, that are considered necessary for a fair presentation of the financial position, results of operations and cash flows for such periods. Historical results are not necessarily indicative of future results. We conduct our business through seven operating segments: hydraulic fracturing, cementing, acidizing, coil tubing, flowback, surface drilling and Permian drilling. For reporting purposes, the hydraulic fracturing, cementing and acidizing operating segments are aggregated into our one reportable segment: pressure pumping. The summary historical consolidated data presented below should be read in conjunction with "Risk Factors," "Management's Discussion and Analysis of Financial Condition and Results of Operations" and our consolidated financial statements and the related notes and other financial data included elsewhere in this prospectus. For the Nine For the Year Months Ended Ended September 30, December 31, 2016 2015 2015 $ 272,999 $ 437,752 $ 569,618 255,362 369,411 483,338 17,197 20,248 27,370 32,669 37,636 50,134 — 36,609 36,609 12,859 15,093 21,268 $ 318,087 $ 478,997 $ 618,719 $ (45,088 ) $ (41,245 ) $ (49,101 ) (15,942 ) (16,458 ) (21,641 ) 6,975 — — (419 ) (643 ) (499 ) (9,386 ) (17,101 ) (22,140 ) (54,474 ) (58,346 ) (71,241 ) (18,644 ) (20,763 ) (25,388 ) $ (35,830 ) $ (37,583 ) $ (45,853 ) $ (1.22 ) $ (1.56 ) $ (1.90 ) $ (1.22 ) $ (1.56 ) $ (1.90 ) 29,328,475 24,132,871 24,132,871 29,328,475 24,132,871 24,132,871
$ 5,288 $ $ 34,310 267,239 291,838 384,264 446,454 188,439 236,876 75,297 69,571
$ (5,652 ) $ 64,690 $ 81,231 (18,156 ) (56,911 ) (62,776 ) (5,215 ) (35,789 ) (15,216 )
$ 1,570 $ 49,022 $ 60,149 0.6 % 11.2 % 10.6 % $ 21,894 $ 62,168 $ 71,677 (1)Exclusive of depreciation and amortization.(2)Inclusive of stock-based compensation.Non-GAAP Financial MeasuresEBITDA, Adjusted EBITDA and Adjusted EBITDA margin We view Adjusted EBITDA and Adjusted EBITDA margin as important indicators of performance. We define EBITDA as our net income, before (i) interest expense, (ii) income taxes and (iii) depreciation and amortization. We define Adjusted EBITDA as EBITDA, plus (i) loss on disposal of assets, (ii) gain on extinguishment of debt, (iii) stock based compensation, and (iv) other unusual or non-recurring charges, such as costs related to our initial public offering. Adjusted EBITDA margin reflects our Adjusted EBITDA as a percentage of our revenues. EBITDA, Adjusted EBITDA and Adjusted EBITDA margin are supplemental measures utilized by our management and other users of our financial statements such as investors, commercial banks, research analysts and others, to assess our financial performance because it allows us to compare our operating performance on a consistent basis across periods by removing the effects of our capital structure (such as varying levels of interest expense), asset base (such as depreciation and amortization) and items outside the control of our management team (such as income tax rates). EBITDA, Adjusted EBITDA and Adjusted EBITDA margin have limitations as analytical tools and should not be considered as an alternative to net income, operating income, cash flow from operating activities or any other measure of financial performance presented in accordance with GAAP. We believe that our presentation of EBITDA, Adjusted EBITDA and Adjusted EBITDA margin will provide useful information to investors in assessing our financial condition and results of operations. Net income is the GAAP measure most directly comparable to EBITDA, Adjusted EBITDA and Adjusted EBITDA margin. EBITDA, Adjusted EBITDA and Adjusted EBITDA margin should not be considered alternatives to net income presented in accordance with GAAP. Because EBITDA, Adjusted EBITDA and Adjusted EBITDA margin may be defined differently by other companies in our industry, our definition of EBITDA, Adjusted EBITDA and Adjusted EBITDA margin may not be comparable to similarly titled measures of other companies, thereby diminishing its utility. The following table presents a reconciliation of net loss to EBITDA, Adjusted EBITDA and Adjusted EBITDA margin for each of the periods indicated.Reconciliation of net loss to Adjusted EBITDA For the Nine For the Year Months ended Ended September 30, December 31, 2016 2015 2015 $ (35,830 ) $ (37,583 ) $ (45,853 ) 15,942 16,458 21,641 (18,644 ) (20,763 ) (25,388 ) 32,669 37,636 50,134 $ (5,863 ) $ (4,252 ) $ 534 — 36,609 36,609 12,859 15,093 21,268 (6,975 ) — — 1,130 929 1,239 419 643 499 $ 1,570 $ 49,022 $ 60,149 272,999 437,752 569,618 0.6 % 11.2 % 10.6 % customers'customers’ spending and associated drilling and completion activities, which had an adverse effect on our revenue. If prices were to decline, similar declines in our customers'customers’ spending would have an adverse effect on our revenue. In addition, a worsening of these conditions may result in a material adverse impact on certain of our customers'customers’ liquidity and financial position resulting in further spending reductions, delays in the collection of amounts owing to us and similar impacts.customers'customers’ willingness to explore, develop and produce oil and natural gas, and therefore, influence prices for our services, including:••••••••••••••••••••••••••short-termshort‑term basis, we are exposed to the risks of a rapid reduction in market prices and utilization and resulting volatility in our revenues.ninesix months ended SeptemberJune 30, 2017 and the year ended December 31, 2016, approximately 97% of our revenues were attributable to our operations in the Permian Basin. As a result of this concentration, we may be disproportionately exposed to the impact of regional supply and demand factors, delays or interruptions of production from wells in the Permian Basin caused by significant governmental regulation, processing or transportationre-marketre‑market or otherwise use the production could have a material adverse effect on our business, results of operations and financial condition. The decline and volatility in oil and natural gas prices over the last two years has negatively impacted the financial condition of our customers and further declines, sustained lower prices, or continued volatility could impact their ability to meet their financial obligations to us.competitors'competitors’ greater resources could allow those competitors to compete more effectively than we can. For instance, our larger competitors may offer services at below-marketbelow‑market prices or bundle ancillary services at no additional cost our customers. We compete with large national and multi-nationalmulti‑national companies that have longer operating histories, greater financial, technical and other resources and greater name recognition than we do. Several of our competitors provide a broader array of services and have a stronger presence in more geographic markets. In addition, we compete with several smaller companies capable of competing effectively on a regional or local basis.in-housein‑house fracturing capabilities by our customers could decrease the demand for our services and have a material adverse impact on our business.provider'sprovider’s reputation for safety and quality. We cannot assure that we will be able to maintain our competitive position.third-partythird‑party suppliers, and we may be vulnerable to delayed deliveries and future price increases.customers'customers’ ability to obtain water may have an adverse effect on our financial condition, results of operations and cash flows.customers'customers’ inability to obtain water from local sources or to effectively utilize flowback water could have an adverse effect on our financial condition, results of operations and cash flows."key person"“key person” life insurance policies on any of our employees. As a result, we are not insured against any losses resulting from the death of our key employees.well-establishedwell‑established competitors. A significant increase in the wages paid by competing employers could result in a reduction of our skilled labor force, increases in the wage rates that we must pay, or both. If either of these events were to occur, our capacity and profitability could be diminished and our growth potential could be impaired.$72$46 million for the year ended December 31, 2015.2016. We have historically financed capital expenditures primarily with funding from cash generated by operations, equipment and vendor financing and borrowings under our credit facilities. Following the completion of this offering,our IPO, we intend to finance our capital expenditures primarily with cash on hand, cash flow from operations and borrowings under our new revolving credit facility. We may be unable to generate sufficient cash from operations and other capital resources to maintain planned or future levels of capital expenditures which, among other things, may prevent us from acquiring new equipment or properly maintaining our existing equipment. Further, any disruptions or continuing volatility in the global financial markets may lead to an increase in interest rates or a contraction in credit availability impacting our ability to finance our operations. This could put us at a competitive disadvantage or interfere with our growth plans. Further, our actual capital expenditures for 2017 or future years could exceed our capital expenditure budget. In the event our capital expenditure requirements at any time are greater than the amount we have available, we could be required to seek additional sources of capital, which may include debt financing, joint venture partnerships, sales of assets, offerings of debt or equity securities or other means. We may not be able to obtain any such alternative source of capital. We may be required to curtail or eliminate contemplated activities. If we can obtain alternative sources of capital, the terms of such••••••new revolving credit facility (as defined herein) and any future financing agreements may limit our ability to finance future operations or capital needs or capitalize on potential acquisitions and other business opportunities. We expect to enter into a new revolving credit agreement concurrently with the closing of this offering. new revolving credit facility and any future financing agreements could restrict our ability to finance future operations or capitalwe expect that our new revolving credit facility will restrictrestricts or limitlimits our ability to:••••••conducted at the closing of this offering;currently conducted; and• new revolving credit facility may containcontains certain other operating and financial covenants. Our ability to comply with the covenants and restrictions contained in the new revolving credit facility may be affected by events beyond our control, including prevailing economic, financial and industry conditions. If market or other economic conditions deteriorate, our ability to comply with these covenants may be impaired. If we violate any of the restrictions, covenants, ratios or tests in our new revolving credit facility, a significant portion of our indebtednesslenders'lenders’ commitment to make further loans to us may terminate. We might not have, or be able to obtain, sufficient funds to make these accelerated payments. Any subsequent replacement of our new revolving credit facility or any new indebtedness could have similar or greater restrictions. Please read "Management's“Management’s Discussion and Analysis of Financial Condition and Results of Operations — Liquidity and Capital Resources — Credit Facilities — Our Revolving Credit Facility."clean-upclean‑up responsibilities, regulatory investigations and penalties or other damage resulting in curtailment or suspension of our operations. The cost of managing such risks may be significant. The frequency and severity of such incidents will affect operating costs, insurability and relationships with customers, employees and regulators. In particular, our customers may elect not to purchase our services if they view our environmental or safety record as unacceptable, which could cause us to lose customers and substantial revenues.sub-limitssub‑limits have beenclean-upclean‑up costs stemming from a sudden and accidental pollution event. However, we may not have coverage if we are unaware of the pollution event and unable to report the "occurrence"“occurrence” to our insurance company within the time frame required under our insurance policy. In addition, these policies do not provide coverage for all liabilities, and the insurance coverage may not be adequate to cover claims that may arise, or we may not be able to maintain adequate insurance at rates we consider reasonable. A loss not fully covered by insurance could have a material adverse effect on our financial position, results of operations and cash flows.anti-terroristanti‑terrorist efforts and other armed conflicts involving the United States could adversely affect the U.S. and global economies and could prevent us from meeting financial and other obligations. We could experience loss of business, delays or defaults in payments from payors or disruptions of fuel supplies and markets if pipelines, production facilities, processing plants, refineries or transportation facilities are direct targets or indirect casualties of an act of terror or war. Such activities could reduce the overall demand for oil and natural gas, which, in turn, could also reduce the demand for our services. Terrorist activities and the threat of potential terrorist activities and any resulting economic downturn could adversely affect our results of operations, impair our ability to raise capital or otherwise adversely impact our ability to realize certain business strategies.earth'searth’s atmosphere and other climatic changes. Based on these findings, the EPA has adopted and implemented, and continues to adopt and implement, regulations thatgreenhouse gases ("GHGs")GHGs under existing provisions of the Clean Air Act ("CAA"(“CAA”). The EPA also requires the annual reporting of GHG emissions from certain large sources of GHG emissions in the United States, including certain oil and gas production facilities. The EPA has also taken steps to limit methane emissions from oil and gas production facilities. In addition, the U.S. Congress has from time to time considered adopting legislation to reduce emissions of GHGs and almost one-halfone‑half of the states have already taken legal measures to reduce emissions of GHGs primarily through the planned development of GHG emission inventories and/or regional GHG cap and trade programs. And in December 2015, the United States joined the international community at the 21st Conference of the Parties of the United Nations Framework Convention on Climate Change in Paris, France. The resulting Paris Agreement calls for the parties to undertake "ambitious efforts"“ambitious efforts” to limit the average global temperature, and to conserve and enhance sinks and reservoirs of greenhouse gases. The Paris Agreement entered into force in November 2016. On June 1, 2017, President Trump announced that the United States planned to withdraw from the Paris Agreement and to seek negotiations either to reenter the Paris Agreement on different terms or establish a new framework agreement. The Paris Agreement provides for a four‑year exit process beginning when it took effect in November 2016, which would resulting in an effective exit date of November 2020. The United States’ adherence to the exit process is uncertain and/or the terms on which the United States is one of over 70 nations that has ratifiedmay reenter the Paris Agreement or otherwise indicated that it intends to comply with the agreement. Restrictions on emissions of GHGs that may be imposed could adversely affect the oil and natural gas industry byreducing demand for hydrocarbons and by making it more expensive to develop and produce hydrocarbons, either of which could have a material adverse effect on future demand for our services."underground injection"“underground injection” and require federal permitting and regulatory control of hydraulic fracturing, as well as legislative proposals to require disclosure of the chemical constituents of the fluids used in the fracturing process, have been proposed in recent sessions of Congress. Several states and local jurisdictions in which we or our customers operate also have adopted or are considering adopting regulations that could restrict or prohibit hydraulic fracturing in certain circumstances, impose more stringent operating standards and/or require the disclosure of the composition of hydraulic fracturing fluids."water cycle"“water cycle” activities associated with hydraulic fracturing may impact drinking water resources under certain circumstances such as water withdrawals for fracturing in times or areas of low water availability, surface spills during the management of fracturing fluids, chemicals or produced water, injection of fracturing fluids into wells with inadequate mechanical integrity, injection of fracturing fluids directly into groundwater resources, discharge of inadequately treated fracturing wastewater to surface waters, and disposal or storage of fracturing wastewater in unlined pits. The results of these studies could lead federal and state governments and agencies to develop and implement additional regulations.
indirectly with us and will not have any duty to refrain from engaging, directly or indirectly, in the same or similar business activities or lines of business as us, including those business activities or lines of business deemed to be competing with us, or doing business with any of our clients, customers or vendors. In particular, subject to the limitations of applicable law, our certificate of incorporation, among other things: Our certificate of incorporation and bylaws, as well as Delaware law, contain provisions that could discourage acquisition bids or merger proposals, which may adversely affect the market price of our common stock. We do not intend to pay dividends on our common stock, and outstanding. We cannot predict the size of future issuances of our common stock or securities convertible into common stock or the effect, if any, that future issuances and sales of shares of our common stock will have on the market price of our common stock. Sales of substantial amounts of our common stock (including shares issued in connection with an acquisition), or the perception that such sales could occur, may adversely affect prevailing market prices of our common stock. A significant reduction by Energy Capital Partners of its ownership interests in us could adversely affect us. Our ability to use our net operating loss carryforwards may be limited. shareholders of the shares of common stock covered by this prospectus will be determined by prevailing market prices at the time of sale, by private transactions negotiated by the selling shareholders or as otherwise described in the section entitled “Plan of Distribution.” Cash and cash equivalents(1) Long-term debt: Revolving credit facility(2) Term loan(3) Equipment financing Total long-term debt Shareholders' equity: Common stock ($0.001 par value; 200,000,000 shares authorized, 36,551,716 issued and outstanding, actual historical; and shares authorized, shares issued and outstanding, as adjusted) Additional paid-in capital Accumulated deficit Total shareholders' equity Total Capitalization Existing shareholders(1) New investors in this offering Total Statement of Operations Data: Revenue Pressure pumping All other Costs and Expenses: Cost of services(1) General and administrative(2) Depreciation and amortization Impairment expense Loss on disposal of assets Total costs and expenses Operating Loss Other Income (Expense): Interest expense Gain on extinguishment of debt Other expense Total other expense Loss before income taxes Income tax benefit Net loss Per share information: Net loss per common share: Basic Diluted Weighted average common shares outstanding: Basic Diluted Balance Sheet Data as of: Cash and cash equivalents Property and equipment — net of accumulated depreciation Total assets Long-term debt — net of deferred loan costs Total shareholders' equity Cash Flow Statement Data: Net cash (used in) provided by operating activities Net cash used in investing activities Net cash used in financing activities Other Data: Adjusted EBITDA(3) Adjusted EBITDA margin(3) Capital expenditures In addition to our core 61.0% and (in thousands except industry data) Revenue Cost of services(1) General and administrative expense(2) Depreciation and amortization Impairment expense Loss on disposal of assets Interest expense Gain on extinguishment of debt Other expense Income tax benefit Net loss Adjusted EBITDA(3) Adjusted EBITDA margin(3) Pressure pumping segment results of operations: Service revenue Costs of services Adjusted EBITDA Adjusted EBITDA margin(3)(7) Baker Hughes Domestic Average Rig Count — Onshore(4) Average oil price (per barrel)(5) Average natural gas price (per thousand cubic feet)(6) attributable to a decline in demand and pricing for these ancillary services. The overall decrease in revenues was year ended December 31, 2016 as compared to the year ended December 31, 2015. Goodwill impairment expense was $1.2 million for the year ended December 31, 2016, as compared to no goodwill impairment expense for the year ended December 31, 2015. The impairment expense in 2016 was attributable to the write‑down of goodwill related to our surface drilling reporting unit. Gain on Working Capital Current Assets: Cash and cash equivalents Accounts receivable — net of allowance for doubtful accounts Inventories Prepaid expenses Other current assets Total current assets Current liabilities: Accounts payable Accrued liabilities Current portion of long-term debt Accrued interest payable Total current liabilities Working capital (deficit) Net cash provided by (used in) operating activities Net cash used in investing activities Net cash used in financing activities Net decrease in cash and equivalents the six months ended June 30, 2016. borrowing base, otherwise it is 0.375%. 2017. 2015. Contractual Obligations Term Loan(1)(5) Existing revolving credit facility(2) Equipment financing(3) Operating leases(4) Total contractual obligations corresponding decrease in ” Critical Accounting Policies and Estimates 2017 and the year ended December 31, 2016, respectively. Vehicles Equipment Buildings and improvements and cash flows related to the assets subject to review. The significant assumption in our cash No events or changes in circumstances occurred that would indicate a potential impairment of property and equipment during the six months ended June 30, 2017 or 2016. We recorded an impairment loss of $6.3 million during the fourth quarter of 2016 related to our Permian drilling asset group, as our cash flow forecasts were negatively impacted with the idling of these rigs during the fourth quarter. The fair value estimate also declined as observable market inputs, such as recent auction sales also decreased. We are a For the Data.” Further, three additional hydraulic fracturing units Competitive Strengths positioned to capture future organic growth opportunities and enhanced pricing for the services we offer. highly‑motivated and talented divisional managers and field personnel, and we have had virtually no small oilfield service companies, including the largest integrated oilfield services companies. Our major competitors for hydraulic fracturing services, which make up the majority of revenues, include C&J Energy Services, Halliburton, adverse effect on us. See Remediation of Hazardous Substances. The Comprehensive Environmental Response, Compensation and Liability Act and countermeasure plan requirements require appropriate containment berms and similar structures to help prevent the contamination of regulated waters. asserted regulatory authority over certain aspects of the process. For example, in May 2014, the EPA issued an Advanced Notice of Proposed Rulemaking seeking comment on the development of regulations under the Toxic Substances Control Act to require companies to disclose information regarding the chemicals used in hydraulic fracturing. Beginning in August 2012, the EPA issued a series of rules under the CAA that establish new emission control requirements for certain oil and natural gas production and natural gas processing operations and associated equipment. And in March 2015, the Bureau of Land Management finalized a rule governing hydraulic fracturing on federal lands, implementation of which has been stayed pending the resolution of legal challenges. Further, legislation to amend the Safe Drinking Water Act to repeal the exemption for hydraulic fracturing (except when diesel fuels are used) from the definition of Dale Redman David Sledge Jeffrey Smith Mark Howell Schuyler E. Coppedge Stephen Herman Matthew H. Himler Peter Jurisprudence from South Texas College of Law and a B.A. from the University of Texas. We believe that Mr. Howell’s experience with corporate and securities law and the oil and gas industry makes him well suited to serve as General Counsel and Corporate Secretary. sectors. Matthew H. Himler board of directors since March 2017 and was appointed to the board in connection with our IPO. Mr. Moore served as Chairman of the Board of Cameron International Corporation from 2011 until it was acquired in April 2016. Mr. Moore worked at Cameron International Corporation from 1999 until 2014, serving as Chief Executive Officer from 2008 to 2015 and as President from 2008 to 2014. Prior to that, he held various management positions at Baker Hughes Incorporated, where he was employed for 23 years. Mr. Moore currently serves on the board of directors of Occidental Petroleum Corporation, Rowan Companies plc and KBR Inc. Mr. Moore also previously served on the board of directors of the American Petroleum Institute, the National Ocean Industries Association, and the Petroleum Equipment Suppliers Association. Mr. Moore received a B.B.A. from the University of Houston and is a graduate of the Advanced Management Program at Harvard Business School. Mr. Moore was selected to serve as a director on the board due to his wealth of experience in the oilfield service sector, including service as a director and executive officer to public corporations in the sector. Related Party Transactions ‑ Stockholders Agreement.” Our financial expert” under applicable SEC rules. Dale Redman Chief Executive Officer Jeffrey Smith Chief Financial Officer David Sledge Chief Operating Officer closed prior to the end of 2016, as well as the fact that no bonuses were paid with respect to fiscal year 2015. Additionally, in connection with our IPO, Mr. Sledge cashlessly exercised a portion of the vested portion of his 2013 option, resulting in his receipt of 81,106 shares of our common stock. to acceleration upon a change of control of the Company if the participant remains employed by the Company, but a change of control does not include Gross‑Ups Outstanding Equity Awards at Fiscal Year‑End Dale Redman Jeffrey Smith David Sledge Spencer D. Armour, III Spencer D. Armour, III Total Additionally, in connection with our IPO, Mr. Armour cashlessly exercised a portion of the vested portion of his 2013 option, resulting in his receipt of 81,106 shares of our common stock. and therefore a change of control, for the purposes of the stock options, did not occur in connection with our IPO and will not occur in connection with this offering. In connection with 2013 Stock Option Plan Further, the sum of the grant date fair value of is $400,000. of dividend record dates during the period between the date an award is granted and the date such award vests, is exercised, is distributed or expires, as determined by the plan administrator. Dividend equivalents may not be paid on awards granted under the Plan unless and until such awards have vested. measured either in absolute terms or as compared to any incremental increase or decrease or as compared to results of a peer group or to market performance indicators or indices. administrator may, in its discretion, accept cash or check, shares of our common stock that meet specified conditions, a incremental increase or decrease or as compared to results of a peer group or to market performance indicators or indices. MANAGEMENT respective directors, officers or 5% or more stockholders, as the case may be. The amounts and percentage of shares of common stock beneficially owned are reported on the basis of regulations of the SEC governing the determination of beneficial ownership of securities. Under the rules of the SEC, a person is deemed to be a Name of Beneficial Energy Capital Partners(3) Regiment Capital Special Situations Fund III, LP Directors/Executive Officers Dale Redman(4) David Sledge(4) Jeffrey Smith(4) Spencer D. Armour, III(4) Schuyler E. Coppedge Stephen Herman Matthew H. Himler Peter Labbat All Directors and Executive Officers as a group ( persons)(4) Other Selling Shareholders The following description of the American Stock Transfer & Trust Company, LLC. partnerships holding our common stock and partners in such partnerships should consult their tax advisors regarding the U.S. federal income tax consequences to them. ” If dividends paid to a gain. throughout the shorter of the as defined in the Code), annually report certain information about such accounts, and withhold 30% on certain payments to 1‑800‑SEC‑0330. implied by such Frac stage. A specified portion of the section of the wellbore that is being stimulated through hydraulic fracturing techniques. The average number of frac stages per horizontal well has increased dramatically as hydraulic fracturing has become standard industry practice and as the lateral lengths of horizontal wells has increased. Stimulation. A treatment performed to restore or enhance the productivity of a well. Stimulation treatments fall into two main groups, hydraulic fracturing treatments and matrix treatments. Fracturing treatments are performed above the fracture pressure of the reservoir formation and create a highly conductive flow path between the reservoir and the wellbore. Matrix treatments are performed below the reservoir fracture pressure and generally are designed to restore the natural permeability of the reservoir following damage to the Condensed Consolidated Statements of Cash Flows for the audits. ASSETS CURRENT ASSETS: Cash and cash equivalents Accounts receivable — net of allowance for doubtful accounts of $845,681 Inventories Prepaid expenses Other current assets Total current assets PROPERTY AND EQUIPMENT — Net of accumulated depreciation OTHER NONCURRENT ASSETS: Goodwill Intangible assets — net of amortization Deferred revenue rebate — net of amortization Other noncurrent assets Total other noncurrent assets TOTAL ASSETS LIABILITIES AND SHAREHOLDERS' EQUITY CURRENT LIABILITIES: Accounts payable Accrued liabilities Current portion of long-term debt Accrued interest payable Total current liabilities DEFERRED INCOME TAXES LONG-TERM DEBT — Net of deferred loan costs OTHER LONG-TERM LIABILITIES Total liabilities COMMITMENTS AND CONTINGENCIES (Note 17) SHAREHOLDERS' EQUITY: Common stock, $0.001 par value — 200,000,000 shares authorized and 24,132,871 shares issued Additional paid-in capital Accumulated deficit Total shareholders' equity TOTAL LIABILITIES AND SHAREHOLDERS' EQUITY REVENUE — Total service revenue COSTS AND EXPENSES: Cost of services (exclusive of depreciation and amortization) General and administrative (inclusive of stock-based compensation) Depreciation and amortization Impairment expense Loss on disposal of assets Total costs and expenses OPERATING LOSS OTHER EXPENSE: Interest expense Other expense Total other expense LOSS BEFORE INCOME TAXES INCOME TAX BENEFIT NET LOSS NET LOSS PER COMMON SHARE: Basic Diluted WEIGHTED AVERAGE COMMON SHARES OUTSTANDING: Basic Diluted BALANCE — January 1, 2015 Stock-based compensation cost Net loss BALANCE — December 31, 2015 OTES TO CASH FLOWS FROM OPERATING ACTIVITIES: Net loss Adjustments to reconcile net loss to net cash provided by operating activities: Depreciation and amortization Impairment expense Deferred income tax benefit Amortization of deferred revenue rebate Amortization of deferred debt issuance costs Stock-based compensation Loss on disposal of assets Loss on interest rate swap Changes in operating assets and liabilities: Accounts receivable Other current assets Inventories Prepaid expenses Accounts payable Accrued liabilities Accrued interest Net cash provided by operating activities CASH FLOWS FROM INVESTING ACTIVITIES: Capital expenditures Proceeds from sale of assets Net cash used in investing activities CASH FLOWS FROM FINANCING ACTIVITIES: Proceeds from borrowings Repayments of borrowings Proceeds from insurance financing Repayments of insurance financing Net cash used in financing activities NET INCREASE IN CASH AND CASH EQUIVALENTS CASH AND CASH EQUIVALENTS — Beginning of year CASH AND CASH EQUIVALENTS — End of year C TATEMENTS AS OF AND FOR THE accompanying consolidated financial statements. estimates of fair value of intensity of pressure pumping activity which has resulted in a shorter useful life and faster replacement of certain components of the pressure pumping equipment. Vehicles Equipment Leasehold improvements The impairment recorded in 2016 was $6.3 million for property and equipment relating to the Permian drilling asset group. recorded at their fair values as of the acquisition date. Based on our goodwill impairment CONSOLIDATED FINANCIAL STATEMENTS AS OF AND FOR THE On July 22, 2015, the FASB issued ASU No. In February 2016, the FASB issued ASU No. Supplemental cash flows disclosures Interest paid Income taxes paid Supplemental disclosure of non-cash investing activities Capital expenditures included in accounts payable Level 2 — Valuations based on one or more quoted prices in markets that are not active or for which all significant inputs are observable, either directly or indirectly. respectively. 2015: Property and equipment, net The Company generally applies fair value techniques to our reporting units on a nonrecurring basis associated with valuing potential impairment loss related to goodwill. The Company’s estimate of the reporting unit fair value was based on a combination of income and market approaches, level 1 and 3, respectively in the fair value hierarchy. The income approach involves the use of a discounted cash flow method, with the cash flow projections discounted at an appropriate discount rate. The market approach involves the use of comparable public companies market multiples in estimating the fair value. Significant assumptions include projected revenue growth, capital expenditures, utilization, gross margins, discount rates, and terminal growth Internally developed software Less accumulated amortization Intangible assets — net 2016 2017 2018 2019 Total Equipment and vehicles Leasehold improvements Subtotal Less accumulated depreciation Property and equipment — net values. 6.25% Term loan Revolving credit facility Equipment refinancing Total debt Less deferred loan costs, net of amortization Subtotal Less current portion of long-term debt Total long-term debt, net of deferred loan costs In 2015 given the 2016 2017 2018 2019 Total Accrued insurance Accrued payroll and related expenses Accrued vacation Other Total allocate resources. Year ended December 31, 2015 Service revenue Asset Impairment Adjusted EBITDA Depreciation and amortization Capital expenditures Total assets Year ended December 31, 2015 Net loss Depreciation and amortization Interest expense Loss on disposal of assets Impairment expense Stock-based compensation Other expense Income tax benefit Adjusted EBITDA (see total above) CONSOLIDATED FINANCIAL STATEMENTS AS OF AND FOR THE OTES TO CONSOLIDATED FINANCIAL STATEMENTS AS OF AND FOR THE YEARS ENDED D. Numerator (both basic and diluted) Net loss attributed to common stockholders Denominator Denominator for basic earnings (loss) per share Denominator for diluted earnings (loss) per share Basic loss per common share Diluted loss per common share CONSOLIDATED FINANCIAL STATEMENTS AS OF AND FOR THE the Company recognized $1.2 million in compensation expense related to these stock options. Expected volatility Expected dividends Expected term (in years) Risk free rate Expected volatility Expected dividends Expected term (in years) Risk free rate CONSOLIDATED FINANCIAL STATEMENTS AS OF AND FOR THE Outstanding at January 1, 2015 Granted Exercised Expired Forfeited Outstanding at December 31, 2015 Federal: Current Deferred State: Current Deferred Total benefit Tax at federal statutory rate State taxes, net of federal benefit Permanent differences Other Total provision Deferred Income Tax Assets Accrued liabilities Allowance for doubtful accounts Goodwill and other intangible assets Stock-based compensation Net operating losses Other Noncurrent deferred tax assets Total deferred tax assets Valuation allowance Total deferred tax assets — net Deferred Income Tax Liabilities Property and equipment Prepaid expenses Other Noncurrent deferred tax liabilities Net deferred tax liability 2016 2017 2018 2019 2020 Total ASSETS CURRENT ASSETS: Cash and cash equivalents Accounts receivable — net of allowance for doubtful accounts of $506,916 and $845,681, respectively Inventories Prepaid expenses Other current assets Total current assets PROPERTY AND EQUIPMENT — Net of accumulated depreciation OTHER NONCURRENT ASSETS: Goodwill Intangible assets — net of amortization Deferred revenue rebate — net of amortization Other noncurrent assets Total other noncurrent assets TOTAL ASSETS LIABILITIES AND SHAREHOLDERS' EQUITY CURRENT LIABILITIES: Accounts payable Accrued liabilities Current portion of long-term debt Accrued interest payable Total current liabilities DEFERRED INCOME TAXES LONG-TERM DEBT — Net of deferred loan costs OTHER LONG-TERM LIABILITIES Total liabilities COMMITMENTS AND CONTINGENCIES (Note 16) SHAREHOLDERS' EQUITY: Common stock, $0.001 par value — 200,000,000 shares authorized and 36,551,716 and 24,132,871 shares issued and outstanding at 2016 and 2015 Additional paid-in capital Accumulated deficit Total shareholders' equity TOTAL LIABILITIES AND SHAREHOLDERS' EQUITY REVENUE — Total service revenue COSTS AND EXPENSES: Cost of services (exclusive of depreciation and amortization) General and administrative (inclusive of stock-based compensation) Depreciation and amortization Impairment expense Loss on disposal of assets Total costs and expenses OPERATING LOSS OTHER INCOME (EXPENSE): Interest expense Gain on extinguishment of debt Other expense Total other expense LOSS BEFORE INCOME TAXES INCOME TAX BENEFIT NET LOSS NET LOSS PER COMMON SHARE: Basic Diluted WEIGHTED AVERAGE COMMON SHARES OUTSTANDING: Basic Diluted BALANCE — January 1, 2015 Stock-based compensation cost Net loss BALANCE — September 30, 2015 BALANCE — January 1, 2016 Stock-based compensation cost Additional equity capitalization Net loss BALANCE — September 30, 2016 CASH FLOWS FROM OPERATING ACTIVITIES: Net loss Adjustments to reconcile net loss to net cash (used) provided by operating activities: Depreciation and amortization Gain on extinguishment of debt Impairment expense Deferred income tax benefit Amortization of deferred revenue rebate Amortization of deferred debt issuance costs Stock-based compensation Loss on disposal of assets (Gain) loss on interest rate swap Changes in operating assets and liabilities: Accounts receivable Other current assets Inventories Prepaid expenses Accounts payable Accrued liabilities Accrued interest Net cash (used in) provided by operating activities CASH FLOWS FROM INVESTING ACTIVITIES: Capital expenditures Proceeds from sale of assets Net cash used in investing activities CASH FLOWS FROM FINANCING ACTIVITIES: Proceeds from borrowings Repayments of borrowings Proceeds from insurance financing Extinguishment of debt Payment of debt extinguishment costs Payment of debt issuance costs Proceeds from additional equity capitalization Net cash used in financing activities NET DECREASE IN CASH AND CASH EQUIVALENTS CASH AND CASH EQUIVALENTS — Beginning of period CASH AND CASH EQUIVALENTS — End of period Supplemental cash flows disclosures: Interest paid Income taxes paid Supplemental disclosure of non-cash investing activities: Capital expenditures included in accounts payable 2016: None 2015: Property and equipment, net Internally developed software Less accumulated amortization Intangible assets — net Year 2016 2017 2018 2019 Total Equipment and vehicles Leasehold improvements Subtotal Less accumulated depreciation Property and equipment — net 6.25% Term loan Revolving credit facility Equipment refinancing Total debt Less deferred loan costs, net of amortization Subtotal Less current portion of long-term debt Total long-term debt, net of deferred loan costs 2016 2017 2018 2019 Total Accrued property taxes Accrued insurance Accrued payroll and related expenses Accrued vacation Other Total Nine months ended September 30, 2016 Service revenue Gain on extinguishment of debt Adjusted EBITDA Depreciation and amortization Capital expenditures Nine months ended September 30, 2015 Service revenue Impairment Expense Adjusted EBITDA Depreciation and amortization Capital expenditures Nine months ended September 30, 2016 Net loss Interest expense Income tax benefit Depreciation and amortization Loss on disposal of assets Gain on extinguishment of debt Stock-based compensation Other expense Adjusted EBITDA (see total above) Nine months ended September 30, 2015 Net loss Interest expense Income tax expense Depreciation and amortization Impairment expense Loss on disposal of assets Stock-based compensation Other expense Adjusted EBITDA (see total above) Numerator (both basic and diluted) Net loss attributed to common stockholders Denominator Denominator for basic earnings (loss) per share Denominator for diluted earnings (loss) per share Basic loss per common share Diluted loss per common share Stock options Non-vested restricted stock Outstanding at January 1, 2015 Granted Exercised Forfeited Expired Outstanding at December 31, 2015 Exercisable at December 31, 2015 Outstanding at January 1, 2016 Granted Exercised Forfeited Expired Outstanding at September 30, 2016 Exercisable at September 30, 2016 party. $192,000, respectively. 2016 2017 2018 2019 2020 Total SEC registration fee FINRA filing fee listing fee Printing and engraving expenses Fees and expenses of legal counsel Accounting fees and expenses Transfer agent and registrar fees Miscellaneous Total corporation. Our certificate of incorporation behalf of our officers and directors against expense, liability or loss asserted incurred by them in their capacities as officers and directors. ‑ 231,019 such date of first use. This Offering and Ownership of Our Common Stockshareholder(s)shareholders and their affiliates will limit your ability to influence corporate matters. Upon completion of this offering (assuming no exercise of the underwriters' option to purchase additional shares), will ownowns approximately %41.6% of our outstanding common stock. Consequently, Energy Capital Partners will continue to havehas significant influence over all matters that require approval by our shareholders, including the election of directors and approval of significant corporate transactions. This concentration of ownership will limit your ability to influence corporate matters, and as a result, actions may be taken that you may not view as beneficial. Moreover, this concentration of stock ownership may also adversely affect the trading price of our common stock to the extent investors perceive a disadvantage in owning stock of a company with a controllingsignificant shareholder.long-livedlong‑lived and capital intensive energy assets within a host of energy related industries. Energy Capital Partners and its affiliated funds currently have investments in companies that operate in the energy infrastructure and oilfield services industries. As a result, Energy Capital Partners and its affiliates'affiliates’ and affiliated funds'funds’ current and future portfolio companies which it controls may now, or in the future, directly or indirectly, compete with us for investment or business opportunities.•non-employeenon‑employee directors to conduct business that competes with us and to make investments in any kind of property in which we may make investments; and•non-employeenon‑employee directors becomes aware of a potential business opportunity, transaction or other matter, they will have no duty to communicate or offer that opportunity to us.The requirements of being a public company, including compliance with the reporting requirements of the Exchange Act and the requirements of the Sarbanes-Oxley Act and the NYSE, may strain our resources, increase our costs and distract management, and we may be unable to comply with these requirements in a timely or cost-effective manner. As a public company, we will need to comply with new laws, regulations and requirements, certain corporate governance provisions of the Sarbanes-Oxley Act of 2002, related regulations of the SEC and the requirements of the NYSE, with which we are not required to comply as a private company. Complying with these statutes, regulations and requirements will occupy a significant amount of time of our board of directors and management and will significantly increase our costs and expenses. We will need to:•institute a more comprehensive compliance function;•comply with rules promulgated by the NYSE;•continue to prepare and distribute periodic public reports in compliance with our obligations under the federal securities laws;•establish new internal policies, such as those relating to insider trading; and•involve and retain to a greater degree outside counsel and accountants in the above activities. In addition, we expect that being a public company subject to these rules and regulations may make it more difficult and more expensive for us to obtain director and officer liability insurance and we may be required to accept reduced policy limits and coverage or incur substantially higher costs to obtain the same or similar coverage. As a result, it may be more difficult for us to attract and retain qualified individuals to serve on our board of directors or as executive officers. We are currently evaluating these rules, and we cannot predict or estimate the amount of additional costs we may incur or the timing of such costs. We will be required to comply with certain provisions of Section 404 of the Sarbanes-Oxley Act as early as our fiscal year ending December 31, 2018. Section 404 requires that we document and test our internal control over financial reporting and issue management's assessment of our internal control over financial reporting. This section also requires that our independent registered public accounting firm opine on those internal controls upon becoming a large accelerated filer, as defined in the SEC rules, or otherwise ceasing to qualify as an emerging growth company under the JOBS Act. We are evaluating our existing controls against the standards adopted by the Committee of Sponsoring Organizations of the Treadway Commission. During the course of our ongoing evaluation and integration of the internal control over financial reporting, we may identify areas requiring improvement, and we may have to design enhanced processes and controls to address issues identified through this review. For example, we anticipate the need to hire additional administrative and accounting personnel to conduct our financial reporting. We cannot be certain at this time that we will be able to successfully complete the procedures, certification and attestation requirements of Section 404 or that we or our independent registered public accounting firm will not identify material weaknesses in our internal control over financial reporting. If we fail to comply with the requirements of Section 404 or if we or our independent registered public accounting firm identify and report such material weaknesses, the accuracy and timeliness of the filing of our annual and quarterly reports may be materially adversely affected and could cause investors to lose confidence in our reported financial information, which could have a negative effect on the stock price of our common stock. In addition, a material weakness in the effectiveness of our internal control over financial reporting could result in an increased chance of fraud and the loss of customers, reduce our ability to obtain financing and require additional expenditures to comply with these requirements, each of which could have a material adverse effect on our business, results of operations and financial condition.There is no existing market for our common stock, and a trading market that will provide you with adequate liquidity may not develop. The price of our common stock may fluctuate significantly, and you could lose all or part of your investment. Prior to this offering, there has been no public market for our common stock. After this offering, there will be only publicly traded shares of common stock held by our public common shareholders ( shares of common stock if the underwriters exercise in full their option to purchase additional shares of common stock). Energy Capital Partners will own shares of common stock, representing an aggregate % of outstanding shares of our common stock (or shares of common stock, representing an aggregate % of outstanding shares of our common stock, if the underwriters exercise in full their option to purchase additional shares of common stock). We do not know the extent to which investor interest will lead to the development of an active trading market or how liquid that market might become. If an active trading market does not develop, you may have difficulty reselling any of our common stock at or above the initial public offering price. Additionally, the lack of liquidity may result in wide bid-ask spreads, contribute to significant fluctuations in the market price of the common stock and limit the number of investors who are able to buy the common stock. The initial public offering price for the common stock offered hereby will be determined by negotiations between us and the representatives of the underwriters and may not be indicative of the market price of the common stock that will prevail in the trading market. Consequently, you may not be able to sell shares of our common stock at prices equal to or greater than the price paid by you in this offering. The following is a non-exhaustive list of factors that could affect our stock price:•our operating and financial performance;•quarterly variations in the rate of growth of our financial indicators, such as net income per share, net income and revenues;•the public reaction to our press releases, our other public announcements and our filings with the SEC;•strategic actions by our competitors;•our failure to meet revenue or earnings estimates by research analysts or other investors;•changes in revenue or earnings estimates, or changes in recommendations or withdrawal of research coverage, by equity research analysts;•speculation in the press or investment community;•the failure of research analysts to cover our common stock;•sales of our common stock by us, the selling shareholders or other shareholders, or the perception that such sales may occur;•changes in accounting principles, policies, guidance, interpretations or standards;•additions or departures of key management personnel;•actions by our shareholders;•general market conditions, including fluctuations in commodity prices;•domestic and international economic, legal and regulatory factors unrelated to our performance; and•the realization of any risks described under this "Risk Factors" section. The stock markets in general have experienced extreme volatility that has often been unrelated to the operating performance of particular companies. These broad market fluctuations may adversely affect the trading price of our common stock. Securities class action litigation has often been instituted against companies following periods of volatility in the overall market and in the market price of a company's securities. Such litigation, if instituted against us, could result in substantial costs, divert our management's attention and resources and harm our business, operating results and financial condition.If securities or industry analysts do not publish research reports or publish unfavorable research about our business, the price and trading volume of our common stock could decline. The trading market for our common stock will depend in part on the research reports that securities or industry analysts publish about us or our business. We do not currently have and may never obtain research coverage by securities and industry analysts. If no securities or industry analysts commence coverage of us the trading price for our common stock and other securities would be negatively affected. In the event we obtain securities or industry analyst coverage, if oneor more of the analysts who covers us downgrades our securities, the price of our securities would likely decline. If one or more of these analysts ceases to cover us or fails to publish regular reports on us, interest in the purchase of our securities could decrease, which could cause the price of our common stock and other securities and their trading volume to decline. We intend to redomicile as a corporation under Delaware General Corporation Law and file a new certificate of incorporation. will authorizeauthorizes our board of directors to issue preferred stock, in addition to the Series A Preferred Shares, without shareholder approval. If our board of directors elects to issue preferred stock, it could be more difficult for a third party to acquire us. In addition, some provisions of our certificate of incorporation and bylaws could make it more difficult for a third party to acquire control of us, even if the change of control would be beneficial to our shareholders, including:•••••Investors in this offering will experience immediate and substantial dilution of $ per share. Based on an assumed initial public offering price of $ per share (the midpoint of the price range set forth on the cover of this prospectus), purchasers of our common stock in this offering will experience an immediate and substantial dilution of $ per share in the net tangible book value per share of common stock from the initial public offering price, and our historical and pro forma net tangible book deficit as of , 2016 would be $ per share. Please see "Dilution."We have broad discretion in the use of the net proceeds from this offering and may not use them effectively. Our management will have broad discretion in the application of the net proceeds from this offering and could spend the proceeds in ways that do not improve our results of operations or enhance the value of our common stock. We intend to use the net proceeds for general corporate purposes. However, our use of these proceeds may differ substantially from our current plans. The failure by our management to apply these funds effectively could result in financial losses that could have a material adverse effect on our business and cause the price of our common stock to decline. Pending their use, we may invest the net proceeds from this offering in a manner that does not produce income or that loses value.we expect that our debt agreements will place certain restrictions on our ability to do so. Consequently, your only opportunity to achieve a return on your investment is if the price of our common stock appreciates.we expect that our new revolving credit facility will placeplaces certain restrictions on our ability to pay cash dividends. Consequently, unless we revise our dividend policy, your only opportunity to achieve a return on your investment in us will be if you sell your common stock at a price greater than you paid for it. There is no guarantee that the price of our common stock that will prevail in the market will ever exceed the price that you pay in this offering.After the completionAs of this offering, we will have outstandingSeptember 7, 2017 there were 83,039,854 shares of common stock including shares of common stock issued upon the automatic conversion of the Series A Preferred Shares upon the consummation of this offering. Following the completion of this offering, assuming no exercise of the underwriters' option to purchase additional shares, Energy Capital Partners will own shares of our common stock, or approximately % of our total outstanding shares, all of which are restricted from immediate resale under the federal securities laws and are subject to the lock-up agreements with the underwriters described in "Underwriting," but may be sold into the market in the future. Please see "Shares Eligible for Future Sale." In connection with this offering, we intend to file a registration statement with the SEC on Form S-8 providing for the registration of shares of our common stock issued or reserved for issuance under our equity incentive plan. Subject to the satisfaction of vesting conditions, the expiration of lock-up agreements and the requirements of Rule 144, shares registered under the registration statement on Form S-8 will be available for resale immediately in the public market without restriction.The underwriters of this offering may waive or release parties to the lock-up agreements entered into in connection with this offering, which could adversely affect the price of our common stock. Prior to this offering, we, all of our directors and executive officers and holders of substantially all of our common stock will enter into lock-up agreements with respect to their common stock, pursuant to which they are subject to certain resale restrictions for a period of days following the effectiveness date of the registration statement of which this prospectus forms a part. Goldman, Sachs & Co. and Barclays Capital Inc. may, at any time and without notice, release all or any portion of the common stock subject to the foregoing lock-up agreements. If the restrictions under the lock-up agreements are waived, then common stock will be available for sale into the public markets, which could cause the market price of our common stock to decline and impair our ability to raise capital.Partners'Partners’ substantial ownership interest in us provides them with an economic incentive to assist us to be successful. Upon the expiration or earlier waiver of the lock-up restrictions on transfers or sales of our securities following the completion of this offering,However, Energy Capital Partners will not be subject to any obligation to maintain its ownership interest in us and may elect at any time thereafter to sell all or a substantial portion of or otherwise reduce its ownership interest in us. If Energy Capital Partners sells all or a substantial portion of its ownership interest in us, it may have less incentive to assist in our success and its affiliate(s) that are expected to serve as members of our board of directors may resign. Such actions could adversely affect our ability to successfully implement our business strategies which could adversely affect our cash flows or results of operations."emerging“emerging growth company"company” and we cannot be certain if the reduced disclosure requirements applicable to emerging growth companies will make our common stock less attractive to investors."emerging“emerging growth company,"” as defined in the JOBS Act, and we intend to take advantage of certain exemptions from various reporting requirements that are applicable to other public companies, including, but not limited to, not being required to comply with the auditor attestation requirements of Section 404 of the Sarbanes-OxleySarbanes‑Oxley Act, reduced disclosure obligations regarding executive compensation in our periodic reports and proxy statements, and exemptions from the requirements of holding a nonbinding advisory vote on executive compensation and shareholder approval of any golden parachute payments not previously approved. We intend to take advantage of these reporting exemptions until we are no longer an emerging growth company. We cannot predict if investors will find our common stock less attractive because we will rely on these exemptions. If some investors find our common stock less attractive as a result,because we rely on these exemptions, there may be a less active trading market for our common stock and our stock price may be more volatile.$1.0$1.07 billion of revenues in a fiscal year, have more than $700 million in market value of our common stock held by non-affiliatesnon‑affiliates as of any June 30 or issue more than $1.0 billion of non-convertiblenon‑convertible debt over a rolling three-yearthree‑year period.will beare subject to the same new or revised accounting standards as other public companies that are not emerging growth companies.Since we are a "controlled company" for purposes of NYSE corporate governance requirements, our shareholders will not have, and may never have, the protections that these corporate governance requirements are intended to provide. Since we are a "controlled company" for purposes of NYSE corporate governance requirements, we are not required to comply with the provisions requiring that a majority of our directors be independent, the compensation of our executives be determined by independentdirectors or nominees for election to our board of directors be selected by independent directors. If we choose to take advantage of any or all of these exemptions, our shareholders may not have the protections that these rules are intended to provide.September 30,December 31, 2016, we had approximately $149.1$175.6 million of U.S. federal and state net operating loss carryforwards ("NOLs"(“NOLs”). Our NOLs begin to expire in 2024. Utilization of these NOLs depends on many factors, including our future income, which cannot be assured. In addition, Section 382 of the Internal Revenue Code of("(“Section 382"382”), generally imposes an annual limitation on the amount of taxable income that may be offset by NOLs when a corporation has undergone an "ownership change"“ownership change” (as determined under Section 382). Generally, a change of more than 50% in the ownership of a corporation'scorporation’s stock, by value, over a three-yearthree‑year period constitutes an ownership change for U.S. federal income tax purposes. Any unused annual limitation may, subject to certain limitations, be carried over to later years. We have previously experienced an ownership change, and anticipate we will have an ownership change as a result of this offering, which would resultresulted in an annual limitation under Section 382 determined by multiplying the value of our stock at the time of the ownership change by the applicable long-term tax-exemptlong‑term tax‑exempt rate as defined in Section 382, increased under certain circumstances as a result of recognizing built-inbuilt‑in gains in our assets existing at the time of the ownership change. The limitations arising from our prior ownership change or from any ownership change arising as a result of this offering may prevent utilization of our NOLs prior to their expiration. Future ownership changes or regulatory changes could further limit our ability to utilize our NOLs. To the extent we are not able to offset our future income with our NOLs, this could adversely affect our operating results and cash flows if we attain profitability.will designatedesignates the Court of Chancery of the State of Delaware as the sole and exclusive forum for certain types of actions and proceedings that may be initiated by our shareholders, which could limit our shareholders'shareholders’ ability to obtain a favorable judicial forum for disputes with us or our directors, officers, employees or agents.will provideprovides that, unless we consent in writing to the selection of an alternative forum, the Court of Chancery of the State of Delaware will, to the fullest extent permitted by applicable law, be the sole and exclusive forum for (i) any derivative action or proceeding brought on our behalf, (ii) any action asserting a claim of breach of a fiduciary duty owed by any of our directors, officers, employees or agents to us or our shareholders, (iii) any action asserting a claim arising pursuant to any provision of the Delaware General Corporation Law (the "DGCL"“DGCL”), our certificate of incorporation or our bylaws, or (iv) any action asserting a claim against us that is governed by the internal affairs doctrine, in each such case subject to such Court of Chancery having personal jurisdiction over the indispensable parties named as defendants therein. Any person or entity purchasing or otherwise acquiring any interest in shares of our capital stock will be deemed to have notice of, and consented to, the provisions of our certificate of incorporation described in the preceding sentence. This choice of forum provision may limit a shareholder'sshareholder’s ability to bring a claim in a judicial forum that it finds favorable for disputes with us or our directors, officers, employees or agents, which may discourage such lawsuits against us and such persons. Alternatively, if a court were to find these provisions of our certificate of incorporation inapplicable to, or unenforceable in respect of, one or more of the specified types of actions or proceedings, we may incur additional costs associated with resolving such matters in other jurisdictions, which could adversely affect our business, financial condition or results of operations. Our net proceeds from the sale of shares of common stock in this offering are estimated to be $ million, after deducting underwriting discounts and commissions and estimated offering expenses. We intend to use the net proceeds from this offering as follows: (i) approximately $ million will be used to repay borrowings outstanding under our term loan, (ii) approximately $ million will be used to fund the purchase of additional hydraulic fracturing units; and (iii) approximately $ million will be retained for general corporate purposes.shareholders. We will pay all expenses relatedshareholders pursuant to this prospectus. In addition, we have agreed to pay certain expenses of the selling shareholders in connection with the sale of common stock from time to time. Please read “Selling Shareholders.”other than underwriting discounts and commissions related to the shares soldprice by the selling shareholders.illustratessets forth for the periods indicated, the reported high and low bid quotations per share for our anticipated use of the net proceeds from this offering:Sources of FundsUse of Funds(In millions) Net proceeds from this offering$Repayment of outstanding borrowings under our term loan$Purchase of additional hydraulic fracturing unitsGeneral corporate purposes Total sources of funds$Total uses of funds$ Price Per Share
of Common Stock High Low 2017 Third quarter (through September 7, 2017) 14.29 11.07 N/A Second quarter 14.70 11.93 N/A First quarter 14.50 12.47 N/A January 31,September 7, 2017, we had $71.8 millionthere were 83,039,854 shares of common stock outstanding, borrowings under our term loan.held of record by 22 holders. The term loan matures on September 30, 2019 and requires quarterly principal and interest payments. Our term loan bears interest at a ratenumber of LIBOR plus 6.25% and is subject to a 1% floor. The outstanding borrowings under our term loan were incurred primarily to fund a portionrecord holders of our 2015 and 2016 capital expenditures. In connection with the completion of this offering, we expect to repay our term loan in full and terminate our term loan. A $1.00 increasecommon stock does not include DTC participants or decrease in the assumed initial public offering price of $ per share would cause the net proceeds from this offering, after deducting the underwriting discounts and commissions and estimated offering expenses, received by us to increase or decrease, respectively, by approximately $ million, assuming the number ofbeneficial owners holding shares offered by us, as set forth on the cover page of this prospectus, remains the same. If the proceeds increase due to a higher initial public offering price or due to the issuance of additional shares, we would use the additional net proceeds to fund growth capital expenditures or for general corporate purposes. If the proceeds decrease due to a lower initial public offering price or a decrease in the number of shares issued, then we would first reduce by a corresponding amount the net proceeds directed to general corporate purposes and, if necessary, the purchase of additional hydraulic fracturing units and then, if necessary, the net proceeds directed to repay outstanding borrowings under our term loan.then-existingthen‑existing conditions, including our results of operations, financial condition, capital requirements, investment opportunities, statutory restrictions on our ability to pay dividends and other factors our board of directors may deem relevant. In addition, we expect that our revolving credit facility will placeplaces restrictions on our ability to pay cash dividends. The following table sets forth our cash and cash equivalents and capitalization as of September 30, 2016:•on a historical basis; and•on an as adjusted basis to reflect this offering and the application of the net proceeds from this offering as described under "Use of Proceeds." This table is derived from, should be read together with and is qualified in its entirety by reference to the historical consolidated financial statements and the accompanying notes and the unaudited pro forma condensed consolidated financial statements and the accompanying notes included elsewhere in this prospectus. You should also read this table in conjunction with "Management's Discussion and Analysis of Financial Condition and Results of Operations." As of September 30,
2016 Historical As Adjusted (in thousands, except
per share) $ 5,288 $ $ 38,500 $ 149,500 20,573 $ 208,573 $
37 264,852 (189,592 ) $ 75,297 $ 283,870 (1)As of January 31, 2017, we had a total of $9.2 million in cash and cash equivalents on hand.(2)As of January 31, 2017, we had no borrowings outstanding under our revolving credit facility and $1,500,000 of letters of credit issued under our credit agreement.(3)As of January 31, 2017, we had $71,750,000 outstanding under our term loan. Our term loan carries a LIBOR plus 6.25% interest rate, subject to a 1% floor. The term loan matures on September 30, 2019. Purchasers of our common stock in this offering will experience immediate and substantial dilution in the net tangible book value (tangible assets less total liabilities) per share of our common stock for accounting purposes. Our net tangible book value as of September 30, 2016 was approximately $ million, or $ per share. Pro forma net tangible book value per share is determined by dividing our net tangible book value, or total tangible assets less total liabilities, by our shares of common stock that will be outstanding immediately prior to the closing of this offering. Assuming an initial public offering price of $ per share (which is the midpoint of the price range set forth on the cover page of this prospectus), after giving effect to (i) the sale of the shares in this offering and (ii) the conversion of the Series A Preferred Shares into shares of common stock upon the consummation of this offering, and further assuming the receipt of the estimated net proceeds (after deducting estimated underwriting discounts and commissions and estimated offering expenses payable by us), our adjusted pro forma net tangible book value as of , 2016 would have been approximately $ million, or $ per share. This represents an immediate increase in the net tangible book value of $ per share to our existing shareholders and an immediate dilution to new investors purchasing shares in this offering of $ per share, resulting from the difference between the offering price and the pro forma as adjusted net tangible book value after this offering. The following table illustrates the per share dilution to new investors purchasing shares in this offering: Assumed initial public offering price per share$ Pro forma net tangible book value per share as of , 2016 (after giving effect to the conversion of the Series A Preferred Shares into common stock)$ Increase per share attributable to new investors in this offeringAs adjusted pro forma net tangible book value per share (after giving effect to this offering)Dilution in pro forma net tangible book value per share to new investors in this offering$ A $1.00 increase (decrease) in the assumed initial public offering price of $ per share, which is the midpoint of the price range set forth on the cover page of this prospectus, would increase (decrease) our as adjusted pro forma net tangible book value per share after the offering by $ and increase (decrease) the dilution to new investors in this offering by $ per share, assuming the number of shares offered by us and the selling shareholders, as set forth on the cover page of this prospectus, remains the same, after deducting the estimated underwriting discounts and commissions and estimated offering expenses payable by us. The following table summarizes, on an adjusted pro forma basis as of , 2016, the total number of shares of common stock owned by existing shareholders and to be owned by new investors at $ per share, which is the midpoint of the price range set forth on the cover page of this prospectus, and the total consideration paid and the average price per share paid by our existing shareholders and to be paid by new investors in this offering at $ , the midpoint of the price range set forth on the cover page of this prospectus, calculated before deduction of estimated underwriting discounts and commissions. Shares Acquired Total
Consideration Average Price Per Number Percent Amount Percent Share % $ % $ 100 % $ 100 % $ (1)Includes shares issuable upon the conversion of our Series A Preferred Shares in connection with this offering.periodsyears indicated. The selected historical financial data as of and for the yearyears ended December 31, 2016 and 2015 are derived from the audited consolidated financial statements appearing elsewhere in this prospectus. The selected historical interim financial data as of SeptemberJune 30, 20162017 and for the ninesix months ended SeptemberJune 30, 20162017 and 20152016, are derived from the unaudited interim condensed consolidated financial statements appearing elsewhere in this prospectus. The unaudited interim condensed consolidated financial statements have been prepared on the same basis as our audited financial statements and, in the Company's opinion, include all adjustments, consisting of normal recurring adjustments, which are considered necessary for a fair presentation of the financial position, results of operations and cash flows for such periods. Historical results are not necessarily indicative of future results."Risk“Risk Factors," "Management's” “Management’s Discussion and Analysis of Financial Condition and Results of Operations"Operations” and our consolidated financial statements and the related notes and other financial data included elsewhere in this prospectus.Table For the Six Months Ended June 30, For the Year Ended December 31, (In thousands, except for per share data and percentages) 2017 2016 2016 2015 Statement of Operations Data: $ 385,423 $ 156,095 $ 436,920 $ 569,618 Pressure pumping 367,431 141,712 409,014 510,198 All other 17,992 14,383 27,906 59,420 Costs and Expenses: 326,342 145,139 404,140 483,338 27,776 11,340 26,613 27,370 Depreciation and amortization 23,857 21,879 43,542 50,134 Property and equipment impairment expense — — 6,305 36,609 Goodwill impairment expense — — 1,177 — Loss on disposal of assets 20,229 6,936 22,529 21,268 Total costs and expenses $ 398,204 $ 185,294 $ 504,306 $ 618,719 $ (12,781 ) $ (29,199 ) $ (67,386 ) $ (49,101 ) Other Income (Expense): Interest expense (5,825 ) (11,392 ) (20,387 ) (21,641 ) Gain on extinguishment of debt — 6,975 6,975 — Other expense (602 ) (312 ) (321 ) (499 ) Total other expense (6,427 ) (4,729 ) (13,733 ) (22,140 ) Loss before income taxes (19,208 ) (33,928 ) (81,119 ) (71,241 ) Income tax benefit (expense) (223 ) 11,697 27,972 25,388 Net loss $ (19,431 ) $ (22,231 ) $ (53,147 ) $ (45,853 ) Per Share Information Net loss per common share: Basic $ (0.28 ) $ (0.60 ) $ (1.19 ) $ (1.31 ) Diluted $ (0.28 ) $ (0.60 ) $ (1.19 ) $ (1.31 ) Weighted average common shares outstanding: Basic 69,593 37,244 44,787 34,993 Diluted 69,593 37,244 44,787 34,993 Balance Sheet Data as of: Cash and cash equivalents $ 25,108 $ 133,596 $ 34,310 Property and equipment — net of accumulated depreciation $ 360,308 $ 263,862 $ 291,838 Total assets $ 561,916 $ 541,422 $ 446,454 Long-term debt — net of deferred loan costs $ 10,210 $ 159,407 $ 236,876 Total shareholders’ equity $ 379,697 $ 221,009 $ 69,571 Cash Flow Statement Data: Net cash (used in) provided by operating activities $ (463 ) $ 2,063 $ 10,658 $ 81,231 Net cash used in investing activities $ (111,401 ) $ (15,051 ) $ (41,688 ) $ (62,776 ) Net cash provided by (used in) financing activities $ 3,376 $ (1,140 ) $ 130,315 $ (15,216 ) Other Data: $ 46,884 $ 235 $ 7,816 $ 60,149 12.16 % 0.15 % 1.80 % 10.60 % Capital expenditures $ 143,811 $ 10,052 $ 46,008 $ 71,677 (1) Exclusive of depreciation and amortization. (2) (3) We view Adjusted EBITDA and Adjusted EBITDA margin as important indicators of performance. We define EBITDA as our net income, before (i) interest expense, (ii) income taxes and (iii) depreciation and amortization. We define Adjusted EBITDA as EBITDA, plus (i) loss on disposal of assets, (ii) gain on extinguishment of debt, (iii) stock based Contents For the Nine For the Year Months Ended Ended September 30, December 31, 2016 2015 2015 $ 272,999 $ 437,752 $ 569,618 251,410 388,054 510,198 21,589 49,698 59,420 255,362 369,411 483,338 17,197 20,248 27,370 32,669 37,636 50,134 — 36,609 36,609 12,859 15,093 21,268 $ 318,087 $ 478,997 $ 618,719 $ (45,088 ) $ (41,245 ) $ (49,101 ) (15,942 ) (16,458 ) (21,641 ) 6,975 — — (419 ) (643 ) (499 ) (9,386 ) (17,101 ) (22,140 ) (54,474 ) (58,346 ) (71,241 ) (18,644 ) (20,763 ) (25,388 ) $ (35,830 ) $ (37,583 ) $ (45,853 ) $ (1.22 ) $ (1.56 ) $ (1.90 ) $ (1.22 ) $ (1.56 ) $ (1.90 ) 29,328,475 24,132,871 24,132,871 29,328,475 24,132,871 24,132,871
$ 5,288 $ 34,310 267,239 291,838 384,264 446,454 188,439 236,876 75,297 69,571
$ (5,652 ) $ 64,690 $ 81,231 (18,156 ) (56,911 ) (62,776 ) (5,215 ) (35,789 ) (15,216 )
$ 1,570 $ 49,022 $ 60,149 0.6 % 11.2 % 10.6 % 21,894 62,168 71,677 (1)Exclusive of depreciation and amortization.(2)Inclusive of stock-based compensation.(3)For definitions of the non-GAAP financial measures ofEBITDA, Adjusted EBITDA and Adjusted EBITDA margin are supplemental measures utilized by our management and reconciliationother users of our financial statements such as investors, commercial banks, research analysts and others, to assess our financial performance because it allows us to compare our operating performance on a consistent basis across periods by removing the effects of our capital structure (such as varying levels of interest expense), asset base (such as depreciation and amortization) and items outside the control of our management team (such as income tax rates). EBITDA, Adjusted EBITDA and Adjusted EBITDA margin have limitations as analytical tools and should not be considered as an alternative to net income, operating income, cash flow from operating activities or any other measure of financial performance presented in accordance with GAAP.financial measures calculatedto EBITDA, Adjusted EBITDA and Adjusted EBITDA margin. EBITDA, Adjusted EBITDA and Adjusted EBITDA margin should not be considered alternatives to net income presented in accordance with GAAP, please read "Summary Historical Financial Data — Non-GAAP Financial Measures."GAAP. Because EBITDA, Adjusted EBITDA and Adjusted EBITDA margin may be defined differently by other companies in our industry, our definition of EBITDA, Adjusted EBITDA and Adjusted EBITDA margin may not be comparable to similarly titled measures of other companies, thereby diminishing its utility. The following table presents a reconciliation of net loss to EBITDA, Adjusted EBITDA and Adjusted EBITDA margin for each of the years indicated. For the Six Months Ended June 30, For the Year Ended December 31, ($ in thousands, except percentages) 2017 2016 2016 2015 Net loss $ (19,431 ) $ (22,231 ) $ (53,147 ) $ (45,853 ) Interest expense 5,825 11,392 20,387 21,641 Income tax (benefit) expense 223 (11,697 ) (27,972 ) (25,388 ) Depreciation and amortization 23,857 21,879 43,542 50,134 EBITDA $ 10,474 $ (657 ) $ (17,190 ) $ 534 Property and equipment impairment expense — — 6,305 36,609 Goodwill impairment expense — — 1,177 — Loss on disposal of assets 20,229 6,936 22,529 21,268 Gain on extinguishment of debt — (6,975 ) (6,975 ) — Stock-based compensation 7,978 619 1,649 1,239 Other expense 602 312 321 499 572 — — — Deferred IPO bonus expense 7,029 — — — Adjusted EBITDA $ 46,884 $ 235 $ 7,816 $ 60,149 Revenue $ 385,423 $ 156,095 $ 436,920 $ 569,618 Adjusted EBITDA margin 12.16 % 0.15 % 1.80 % 10.60 % (1) Other general and administrative expense relates to legal settlement expense. MANAGEMENT'S
FINANCIAL CONDITION AND RESULTS OF OPERATIONSforward-lookingforward‑looking statements that involve risks and uncertainties. You should read the "Risk Factors"“Risk Factors” section of this prospectus for a discussion of important factors that could cause actual results to differ materially from the results described in or implied by the forward-lookingforward‑looking statements contained in the following discussion and analysis."Management's“Management’s Discussion and Analysis of Financial Condition and Results of Operations"Operations” to "ProPetro“ProPetro Holding Corp.," "the” “the Company," "we," "our," "us"” “we,” “our,” “us” or like terms refer to ProPetro Holding Corp. and its subsidiary.growth-oriented,growth‑oriented, Midland, Texas-basedTexas‑based oilfield services company providing hydraulic fracturing and other complementary services to leading upstream oil and gas companies engaged in the exploration and production, or E&P, of North American unconventional oil and natural gas resources. Our operations are primarily focused in the Permian Basin, where we have cultivated longstanding customer relationships with some of the region'sregion’s most active and well-capitalizedwell‑capitalized E&P companies, including Callon Petroleum, Diamondback Energy, Parsley Energy, Pioneer Natural Resources, Surge Energy and XTO Energy. For the year ended December 31, 2016, no single customer represented greater than 20% of our revenue.companies. The Permian Basin is widely regarded as the most prolific oil-producingoil‑producing area in the United States, and we believe we are currently one of the largest private providerproviders of hydraulic fracturing services in the region by hydraulic horsepower, or HHP, with an aggregate deployed capacity of 420,000555,000 HHP. Our fleet which consists of 10 hydraulic fracturing units, has been designed to handle the highest intensity, most complex hydraulic fracturing jobs, and has been 100% utilized since September 2016. We haveIn the quarter ended June 30, 2017, we purchased and put in service two additional hydraulic fracturing units, which areand took delivery and put into service a third unit following the end of quarter, bringing our fleet total to 13 deployed units. In addition, we have contracted to purchase three new hydraulic fracturing units scheduled for delivery and deployment to dedicated customers in Aprilthe second half of 2017, as well as other ancillary equipment such as engines and June 2017, respectively.spare parts. These units will provide us with an additional 90,000135,000 HHP, bringing our totalaggregate capacity to 510,000690,000 HHP. Additionally, we expect to use the proceeds from this offering to purchase two additional units that will be deployed in 2017 to meet specific customer requests, giving us an additional 90,000 HHP, or 600,000 HHP in the aggregate, once all units have been received.region'sregion’s increasingly high-intensityhigh‑intensity well completions, which are characterized by longer horizontal wellbores, more frac stages per lateral and increasing amounts of proppant per well. Over 75% of our fleet has been delivered over the past threefour years, and we have fully maintained our equipment throughout the recent industry downturn to ensure optimal performance and reliability. In contrast, we believe manyAdditionally, all of the hydraulic horsepower delivered over the last four years has been sourced from a single manufacturer, leading to a homogeneous fleet with streamlined maintenance programs and training for our competitors have deferred necessary maintenance capital spending throughout the downturn, which we believe uniquely positions us to respond more quickly to customer needs during the ongoing market recovery.personnel.hydraulic fracturingpressure pumping segment operations, we also offer a suite of complementary well completion and production services, including coiled tubing, flowback services and surface air drilling. We believe these complementary services create operational efficiencies for our customers and allow us to capture a greater portion of their capital spending across the lifecycle of an unconventionala well. WeAdditionally, we believe that these complementary services should benefit from a continued industry recovery and that we are well positioned to continue expanding these offerings in response to our customers increasing service needs and spending levels.Overall Trends and Outlook The oil and gas industry has traditionally been volatile and is influenced by a combination of long-term, short-term and cyclical trends, including domestic and international supply and demand for oil and gas, current and expected future prices for oil and gas and the perceived stability and sustainability of those prices, and capital investments of E&P companies toward their development and production of oil and gas reserves. The oil and gas industry is also impacted by general domestic and international economic conditions, political instability in oil producing countries, government regulations (both in the United States and internationally), levels of consumer demand, adverse weather conditions, and other factors that are beyond our control. Declines and sustained weakness in crude oil prices began in the fourth quarter of 2014 and continued into February 2016, when the closing crude oil prices reached a low of $26.19 per barrel. This decline in oil prices caused our customers to reduce drilling and completion activity and curtail spending. These declines adversely affected the demand for our equipment and services and negatively impacted the prices we were able to charge our customers. Over the same period, the low crude oil price environment caused a steep reduction in our customers' drilling, completion and other production activities and their spending on our equipment and services. However, the recent recovery of crude oil prices to the low $50 per barrel range as of December 2016 has driven a considerable increase in drilling and completion activity, and associated demand for our services. The Permian Basin, our primary area of operation, is leading the recovery with the number of active drilling rigs increasing 110% from a low of 137 rigs in the basin as of May 2016 to 291 rigs in the basin as of January 2017, according to Baker Hughes. In addition to increased activity levels in the Permian Basin, several evolving industry trends, including increasingly longer horizontal wellbore laterals, a greater number of frac stages per lateral and increasing amounts of proppant employed per well, have significantly increased demand for our hydraulic fracturing and other completion services. As the Permian Basin shifts further towards more intensive horizontal drilling, operators and service providers are expected to continue to place significant focus on drilling and completion efficiencies, such as multi-well pads and zipper fracs. Multi-well pads allow for the drilling of multiple wellbores from a single topside location, reducing average drilling time. Similarly, zipper fracking allows for the alternating completion of hydraulic fracturing stages in adjacent wells, increasing the number of stages that can be performed in a given time period. These advancements have resulted in a reduction in the number of days typically required to drill and complete a well and, as a result, increased the total number of wells that can be drilled per rig, which, in turn, drives incremental demand for hydraulic fracturing services. Rising producer activity levels, increasing basin service intensity and continued drilling and completion efficiencies have combined to drive the 100% utilization of our fleet and build a sizable backlog of addressable demand for our services. We have seen our competitors defer necessary maintenance capital spending, cannibalize existing units for spare parts and idle HHP. This has resulted in tightening hydraulic fracturing supply and demand fundamentals and is likely to drive pricing improvement for our hydraulic fracturing services. Moreover, we believe the other complementary services that we provide are well-positioned to similarly benefit from a continued industry recovery. Our competitors include many large and small oilfield services companies, including C&J Energy Services, Halliburton, Patterson-UTI Energy Inc., RPC, Inc., Schlumberger, Superior Energy Services and a number of private companies. Competitive factors impacting sales of our services are price, reputation and technical expertise, service and equipment quality, and health and safety standards. Although we believe our customers consider all of these factors, we believe price is a key factor in E&P companies' criteria in choosing a service provider. While we seek to price our services competitively, we believe many of our customers elect to work with us based on our deep local roots, operational expertise, equipment's ability to handle the most complex Permian Basin well completions, and commitment to safety and reliability. Our substantial market presence in the Permian Basin positions us well to capitalize on increasing drilling and completion activity in the region. Historically, our operational focus has been in the Permian Basin's Midland sub-basin, where our customers have primarily operated. More recently however, with increasing levels of Delaware Basin activity, we have begun to expand our Delaware Basin presence in response to increasing levels of demand pull from our customers. Given our entrenched relationships with a variety of Delaware Basin operators, we believe that we are uniquely positioned to capture large addressable growth opportunity as the basin develops. For the foreseeable future, we expect the Permian Basin's Midland and Delaware sub-basins to continue to command a disproportionate share of future North American E&P spending.customers'customers’ needs. We generally do not have long-termlong‑term written contractual arrangements with our customers other than standard master service agreements, which include general contractual terms between our customers and us. We charge our customers on a per-jobper‑job basis, in which we set pricing terms after receiving full specifications for the requested job, including the lateral length of the customer'scustomer’s wellbore, the number of frac stages per well, the amount of proppant to be employed and other parameters of the job.58.7%58.6%58.9% of total costs of service for the nine monthsyears ended September 30,December 31, 2016 and 2015, respectively.25.0%24.4% and 24.4%24.3% of total costs of service for the nine monthsyears ended September 30,December 31, 2016 and 2015, respectively.16.3%14.5% and 17.0%16.9% of total costs of service for the nine monthsyears ended September 30,December 31, 2016 and 2015, respectively.lossloss/(gain) on disposal of assets, (ii) gain onnon-recurring charges,non‑recurring expenses, such as costs related to our initial public offering. Adjusted EBITDA margin reflects our Adjusted EBITDA as a percentage of our revenues.Non-GAAPNon‑GAAP Financial Measuresnon-GAAPnon‑GAAP financial measures will provide useful information to investors in assessing our financial condition and results of operations. Net income is the GAAP measure most directly comparable to Adjusted EBITDA. Our non-GAAPnon‑GAAP financial measures should not be considered as alternatives to the most directly comparable GAAP financial measure. Each of these non-GAAPnon‑GAAP financial measures has important limitations as analytical tools because they exclude some but not all items that affect the most directly comparable GAAP financial measures. You should not consider Adjusted EBITDA or Adjusted EBITDA margin in isolation or as a substitute for an analysis of our results as reported under GAAP. Because Adjusted EBITDA and Adjusted EBITDA margin may be defined differently by other companies in our industry, our definitions of these non-GAAPnon‑GAAP financial measures may not be comparable to similarly titled measures of other companies, thereby diminishing their utility. Please read "Summary — Summary“Selected Historical Consolidated Financial Data — Non-GAAP Financial Measures."Data” for definition of EBITDA, Adjusted EBITDA and Adjusted EBITDA margin.service lineoperating segment in our results of operations. We expect revenues and costs of services related to our Permian drilling operating segment to comprise a lower percentage of total revenues and total costs of service in future results of operations when compared to historic results due to our increased focus on pressure pumping and other complementary service offerings. We idled all seven of our Permian vertical drilling rigs throughout the first nine months of 2016. As a result, Permian Basin drilling comprised only $9.9 million of revenue (or 3.6%2.3% of revenues) duringfor the nine monthsyear ended September 30,December 31, 2016, as compared to $32.3$35.7 million (or 7.4%6.3% of revenues) infor the nine monthsyear ended September 30,December 31, 2015. Likewise cost of services related to Permian drilling was $8.3$8.5 million (3.2%(2.1% of all costs of services) for the nine monthsyear ended September 30,December 31, 2016 as compared to $26.7$30.8 million (or 7.2%6.4% of cost of service) for the nine monthsyear ended September 30,December 31, 2015. We anticipate the financial significance of this service line relative to the financial results from pressure pumping and other service offerings to continue to decline. We will incur additional operating expenses as a publicly traded corporation. We expect to incur approximately $ million annually in additional operating expenses as a publicly traded corporation that we have not previously incurred, including costs associated with compliance under the Exchange Act, annual and quarterly reports to common shareholders, registrar and transfer agent fees, audit fees, incremental director and officer liability insurance costs and director and officer compensation. We additionally expect to incur $ million in non-recurring costs related to our transition to a publicly traded corporation. These incremental expenses exclude the costs of this offering, as well as the costs associated with the initial implementation of our Sarbanes-Oxley Section 404 internal control reviews and testing.Table We expect revenues and costs of ContentsNine Months Ended September 30, 2016 Compared To Nine Months Ended September 30, 2015 Nine Months Ended
September 30, 2016 2015 $ 272,999 $ 437,752 255,362 369,411 17,197 20,248 32,669 37,636 — 36,609 12,859 15,093 15,942 16,458 6,975 — 419 643 18,644 20,763 $ (35,830 ) $ (37,583 ) $ 1,570 $ 49,022 0.6 % 11.2 % $ 251,410 $ 388,054 $ 235,587 $ 327,339 $ 6,500 $ 49,291 2.6 % 12.7 % 465 1,021 $ 41.34 $ 50.94 $ 2.34 $ 2.80 (1)Exclusive of depreciation and amortization.(2)Inclusive of stock-based compensation.(3)For definitions of the non-GAAP financial measures of Adjusted EBITDA and Adjusted EBITDA margin and reconciliation of Adjusted EBITDA and Adjusted EBITDA marginservices related to our most directly comparablePermian drilling operating segment to comprise a lower percentage of total revenues and total costs of service in future results of operations when compared to historic results due to our increased focus on pressure pumping and other complementary service offerings. We anticipate the financial measures calculated in accordance with GAAP, please read "Summary — Summary Historical Financial Data — Non-GAAP Financial Measures."(4)Average onshore U.S. rig count published by Baker Hughes(5)Average nine-month West TX Intermediate Spot Price published by EIA(6)Average nine month Henry Hub Natural Gas Spot Price published by EIA(7)non-GAAPfollowing table sets forth selected operating data for the periods indicated. Six Months Ended June 30, Year Ended December 31, (in thousands, except percentages) 2017 2016 2016 2015 Revenue $ 385,423 $ 156,095 $ 436,920 $ 569,618 326,342 145,139 404,140 483,338 27,776 11,340 26,613 27,370 Depreciation and amortization 23,857 21,879 43,542 50,134 Property and equipment impairment expense — — 6,305 36,609 Goodwill impairment expense — — 1,177 — Loss on disposal of assets 20,229 6,936 22,529 21,268 Interest expense 5,825 11,392 20,387 21,641 Gain on extinguishment of debt — (6,975 ) (6,975 ) — Other expense 602 312 321 499 Income tax expense/(benefit) 223 (11,697 ) (27,972 ) (25,388 ) Net loss $ (19,431 ) $ (22,231 ) $ (53,147 ) $ (45,853 ) $ 46,884 $ 235 $ 7,816 $ 60,149 12.16 % 0.15 % 1.80 % 10.60 % Pressure pumping segment results of operations: Revenue $ 367,431 $ 141,712 $ 409,014 $ 510,198 Cost of services $ 312,647 $ 132,122 $ 379,815 $ 432,372 Adjusted EBITDA $ 48,283 $ 3,549 $ 15,655 $ 62,540 13.14 % 2.50 % 3.80 % 12.30 % (1) Exclusive of depreciation and amortization. (2) Inclusive of stock‑based compensation. (3) For definitions of the non‑GAAP financial measures of Adjusted EBITDA and Adjusted EBITDA margin and reconciliation of Adjusted EBITDA and Adjusted EBITDA margin to our most directly comparable financial measures calculated in accordance with GAAP, please read “Selected Historical Financial Data”. (4) The non‑GAAP financial measure of Adjusted EBITDA margin for the pressure pumping segment is calculated by taking Adjusted EBITDA for the pressure pumping segment as a percentage of our revenues for the pressure pumping segment. is calculated by takingresulted from greater pricing power as demand for our services increased, without a corresponding increase in costs, which resulted in significantly higher realized Adjusted EBITDA margins during the six months ended June 30, 2017.pressure pumping segmentsix months ended June 30, 2017, as compared to $11.3 million for the six months ended June 30, 2016. The increase was primarily attributable to marginal increases in legal and professional fees, insurance expense, payroll and travel, and non-recurring expenses— an IPO bonus of $7.0 million to key employees, along with $6.8 million of accelerated stock compensation in connection with the IPO and non-recurring stock compensation for restricted stock units. General and administrative expenses, excluding non-recurring expenses, as a percentage of ourtotal revenues decreased to 3.6% for the pressure pumping segment.six months ended June 30, 2017, as compared to 7.3% for the six months ended June 30, 2016, and the decrease is as a result of the higher revenue in the six months ended June 30, 2017.37.6%23.3%, or $164.8$132.7 million, to $273.0$436.9 million for the nine monthsyear ended September 30,December 31, 2016 from $437.8as compared to $569.6 million for the nine monthsyear ended September 30, 2015. The pressure pumping business segment revenues decreased 35.2%, or $136.7 million, for the nine months ended September 30, 2016 compared to the nine months ended September 30,December 31, 2015. The decrease was primarily attributable to a reduction in customer activity, anda decline in pricing for our pressure pumpingfrac services as a result of an over‑supply of HHP in our areas of operations, and the idling of our seven Permian drilling rigs. Our pressure pumping segment revenues decreased 19.8%, or $101.2 million, for the year ended December 31, 2016 as compared to the year ended December 31, 2015. Revenues other than pressure pumping decreased 56.6%53.0%, or $28.1$31.5 million, for the nine months ended September 30,year December 31, 2016 as compared to the nine monthsyear ended September 30,December 31, 2015. The decrease was primarilya result ofattributable to a competitive market environment caused by the declinedecrease in U.S. onshore drilling and completion activity due to depressedas a result of decreased oil and natural gas commodity prices. Average oil and natural gas prices have decreased 18.7%11.0% and 16.5%3.8%, respectively, from the nine monthsyear ended September 30,December 31, 2015 as compared to the comparative period inyear ended December 31, 2016. The Baker Hughes U.S. onshore rig count also decreased 54.5% when comparing48.3% during the same periods.Servicesservices decreased 30.9%16.4%, or $114.0$79.2 million, to $255.4$404.1 million for the nine monthsyear ended September 30,December 31, 2016 from $369.4$483.3 million foras compared to the nine monthsyear ended September 30,December 31, 2015. Cost of services in our pressure pumping business segment decreased $91.8$52.6 million for the nine monthsyear ended September 30,December 31, 2016 as compared to the nine monthsyear ended September 30,December 31, 2015. The decreases were primarily dueattributable to lower activity levels, coupled with reduced personnel headcount. As a percentage of pressure pumping segment revenues, pressure pumping cost of services increased to 93.7%92.9% for the nine monthsyear ended September 30,December 31, 2016 as compared to 84.4%84.7% for the nine monthsyear ended September 30,December 31, 2015. The increase in cost of services as a percentage of sales for the pressure pumping segment resulted from lower revenue generating activity levels without a corresponding reduction in costs as well as depressed pricing for our services.services, which resulted in significantly lower realized EBITDA margins.15.1%2.8%, or $3.0$0.8 million, to $17.2$26.6 million for the nine monthsyear ended September 30,December 31, 2016 from $20.2as compared to $27.4 million for the nine monthsyear ended September 30,December 31, 2015. The decrease was primarily attributable to a $2.3$2.2 million reduction in insurance expense due to a reduction in personnel headcount and a $0.7$1.0 million reduction in property taxes.taxes, partially offset by an increase in bonus expense of $2.5 million as compared to 2015. General and administrative expenses as a percentage of total revenues were 6.3%was 6.1% for the nine monthsyear ended September 30,December 31, 2016 as compared to 4.6%4.8% for the comparative periodyear ended September 30,December 31, 2015. This increase was due partially to pricing pressures in a competitive operating environment, as well as our decision to maintain equipment and retain key personnel during times of lower equipment utilization levels.13.2%13.1%, or $5.0$6.6 million, to $32.7$43.5 million for the nine monthsyear ended September 30,December 31, 2016 from $37.6as compared to $50.1 million for the nine monthsyear ended September 30,December 31, 2015. The declinedecrease was primarily a result ofattributable to a decrease in average depreciable assets partially offset by approximately $21.9$46.0 million in capital expenditures during the nine monthsyear ended September 30,December 31, 2016. We calculate depreciation of property and equipment using the straight-linestraight‑line method.ImpairmentProperty and equipment impairment expense was $36.6 million for the nine monthsyear ended September 30,December 31, 2015, whereas noas compared to $6.3 million for the year ended December 31, 2016. The non‑cash impairment expense was reported during the nine months ended September 30, 2016. The non-cash impairment expensein 2015 was associated with our Permian drilling rigs and acidizing assets and was recognized as a result of depressed commodity prices and a negative future near-termnear‑term outlook for these3.1%5.8%, or $0.6$1.3 million, to $15.9$20.4 million for the nine monthsyear ended September 30,December 31, 2016 from $16.5as compared to $21.6 million for the nine monthsyear ended September 30,December 31, 2015. The declinedecrease in interest expense was primarily attributable to a reduction in our average debt balance during the 2016 period.2016. Loss on Disposal of Assets. Loss on the disposal of assets decreased 14.8%, or $2.2 million, to $12.9 million for the nine months ended September 30, 2016 from $15.1 million for the nine months ended September 30, 2015. The decrease resulted from a reduction in the replacement of components of our pressure pumping equipment as a result of reduced activity levels.RepurchaseExtinguishment of Debt. Gain on repurchaseextinguishment of debt was $7.0 million, net of cost, for the nine monthsyear ended September 30,December 31, 2016, as compared to no debt repurchaseextinguishment gain or loss for the nine monthsyear ended September 30,December 31, 2015. In June 2016, we conducted an auction process with our lenders to repurchase $37.5 million of our term loan at a 20% discount to par value.Expenses.Expense. Other expensesexpense decreased to $0.4$0.3 million for the nine monthsyear ended September 30,December 31, 2016 from $0.6as compared to $0.5 million for the nine monthsyear ended September 30,December 31, 2015. The decrease was primarily dueattributable to an unrealized gain resulting from the change in the fair value of our interest rate swap liability at September 30,December 31, 2016 compared to 2015, coupled with apartially offset by restructuring expenses related to the first amendment to our existing credit agreement incurred in 2016 and the reduction of other income in miscellaneous expenses.2016 as compared to 2015.decreaseincrease of $2.1$2.6 million in income tax benefit for the nine monthsyear ended September 30,December 31, 2016 as compared to the nine monthsyear ended September 30,December 31, 2015 is primarily attributable to a result ofhigher loss before income taxes, partially offset by the release of a $1.9 million valuation allowance of $0.9 million recorded in 2015 related to state and federal taxes.the year. As of September 30, 2016, our cash and cash equivalents were $5.3 million, and as of December 31, 2015, were $34.3 million. We expect that As of December 31, 2016, our primary sourcescash and cash equivalents were $133.6 million, and as of December 31, 2015, were $34.3 million.and capital resources after the consummation of this offering will beis currently provided by (i) existing cash balances, (ii) operating cash flows generated by operating activities and (iii) borrowings under our newrevolving credit facility. As of June 30, 2017, our revolving credit facility which we intend to enter into in connection with this offering. We expect that ourwas undrawn. Our primary uses of capitalcash will be to continue to fund our operations, support organic growth opportunities and satisfy future debt payments. Giving effectpayments, if incurred.this offering, we believe that our operating cash flow will be sufficient to fund our operations for at leastrepay a portion of the next twelve months. However, we expect that additional capital expenditures will be required to conduct our future operations and grow our business. As of January 31, 2017, we had $38.5 million of borrowing capacity availableindebtedness outstanding under our revolving credit facility. In connection withfacility and term loan, (ii) to acquire new hydraulic fracturing units totaling 90,000 additional HHP and (iii) for general corporate purposes.closingnet proceeds to repay outstandingthis offering,additional hydraulic fracturing units and for general corporate purposes. Following our IPO, we intend to terminateexpect that our existingprimary sources of liquidity and capital resources going forward will be cash flows generated by operating activities and borrowings under our revolving credit facility and enter into a new revolving credit facility. After giving effect to this offering, we expect to have $ million available under our new revolving credit facility.otherfuture obligations.SeptemberJune 30, 20162017 compared to December 31, 2016 and compared to December 31, 2015.June 30, December 31, September 30
2016 December 31
2015 2017 2016 2015 $ 5,288 $ 34,310 $ 25,108 $ 133,596 $ 34,310 87,036 90,291 147,820 115,179 90,291 6,993 8,572 4,819 4,713 8,572 1,643 4,488 6,933 4,609 4,488 1,514 804 3,689 6,683 804 $ 102,474 $ 138,465 $ 188,369 $ 264,780 $ 138,465 88,334 87,365 $ 155,956 $ 129,093 $ 87,365 4,769 7,052 8,335 13,620 7,052 16,757 16,295 Current portion of long‑term debt 6,337 16,920 16,295 78 77 — 108 77 109,938 110,789 $ 170,628 $ 159,741 $ 110,789 $ (7,464 ) $ 27,676 Working capital $ 17,741 $ 105,039 $ 27,676 working deficit totaled $7.5 million at September 30, 2016 and our working capital totaled $17.7 million, $105.0 million and $27.7 million at June 30, 2017, December 31, 2015. 2016 and December 31, 2015, respectively.$35.2$87.3 million decrease in working capital from December 31, 2016 to June 30, 2017 is primarily attributable to our use of cash for repayment of debt of $163.1 million, capital expenditures of $112.6 million, and other expenditures, partially offset by the receipt of $170.1 million (net of IPO underwriting discounts, commissions and other offering expenses) from the proceeds of our IPO.decreasesthe receipt of $163.0 million (net of $7.5 million transaction costs) from the private placement issuance of Series A Preferred Shares. As of December 31, 2016, $25 million of the proceeds from the private placement were used to pay a portion of the outstanding indebtedness under our revolving credit facility. The increase in our equipment utilization resultingcash due to the proceeds from the private placement was partially offset by a decrease in cash provided by operations as a result of depressed revenues and margins during this period, and a decrease in our cash flows.2016. These factors contributed to a $29$99.3 million reductionnet increase in cash and cash equivalents.$5.3$25.1 million, $133.6 million and $34.3 million at SeptemberJune 30, 2017, December 31, 2016 and December 31, 2015, respectively.the historicalour cash flowsflow for the nine months ended September 30, 2016 and 2015 (in thousands): Nine months ended
September 30, 2016 2015 $ (5,652 ) $ 64,690 $ (18,156 ) $ (56,911 ) $ (5,215 ) $ (35,789 ) $ (29,023 ) $ (28,010 ) Six Months Ended June 30, Year Ended December 31, ($ in thousands) 2017 2016 2016 2015 Net cash (used in) provided by operating activities $ (463 ) $ 2,063 $ 10,658 $ 81,231 Net cash (used in) provided by investing activities $ (111,401 ) $ (15,051 ) $ (41,688 ) $ (62,776 ) Net cash (used in) provided by financing activities $ 3,376 $ (1,140 ) $ 130,315 $ (15,216 ) $5.7$0.5 million for the ninesix months ended SeptemberJune 30, 2016 and2017, compared to net cash provided by operating activities was $64.7of $2.1 million for the ninesix months ended SeptemberJune 30, 2016. The net decrease of $2.5 million was primarily due to increased working capital needs resulting from higher and expanding activity levels.isdecreased from a $38.3 million cash inflow in 2015 to a $19.8 million cash inflow in 2016 due to adecreasean increase in accounts receivable attributable to lowerhigher business activity levels in the fourth quarter of 2016 as compared to 2015, partially offset by an increase in accounts payable attributable to the timing of payments of our accounts payable.2016 asinvesting activities increased to $111.4 million for the six months ended June 30, 2017, from $15.1 million during the six months ended June 30, 2016. The increase was primarily attributable to the new additional hydraulic fracturing units and other ancillary equipment purchased during the period, and a slight increase in maintenance capital expenditures, during the six months ended June 30, 2017, compared to 2015.Investing Activities$18.2$41.7 million and $56.9$62.8 million for the nine monthsyears ended September 30,December 31, 2016 and 2015, respectively. The decrease was primarily due to the addition of one hydraulic fracturing unit in January 2015 and a decline in capital expenditures in response to lower activity levels. Alllevels in 2016. Approximately 97.8% of our capital expenditures during the 2016 period is related to maintenance of equipment.$5.2 million and $35.8$1.1 million for the ninesix months ended SeptemberJune 30, 2016. The net increase in cash provided was primarily due to the receipt of $185.5 million of IPO proceeds, partially offset by payment of IPO costs of $15.1 million and $163.1 million in repayment of borrowings, during the six months ended June 30, 2017, compared to net cash used of $38.1 million for repayment of borrowings, offset by the equity capitalization proceeds of $40.0 million during the six months ended June 30, 2016.2015, respectively.net cash used in financing activities was $15.2 million for the year ended December 31, 2015. The decreasechange was primarily due to a $40.4$210.4 million increase in equity capitalization, $40.4 million common equity and a $19.5$170.0 million decrease in net borrowings during 2015preferred equity, partially offset by a $28.2 million increase in net repayments of borrowings, $7.5 million of transaction costs occurred related to the private placement and $30.0 million extinguishment of debt during the 2016 period.2016. In 2015, we entered into a new equipment financing arrangement relating to three hydraulic fracturing units, where we extended the amortization period from 13 to 36 months and reduced the amount of required monthly installment payments.September 30, 2013, we and our wholly owned subsidiary, ProPetro Services, Inc. (the "Borrower"),March 22, 2017, the Company entered into a credit agreement with Deutsche Bank AG New York Branch (as administrative agent) and the lenders party thereto, which we refer to as our "existing credit agreement". Our existing credit agreement provides for a term loan facility in a principal amount of $220.0 million, which we refer to as our term loan, and a revolving credit facility inwith a principal amount of commitments of $40.0 million. We refer to this$150 million borrowing capacity (the “revolving credit facility”). Borrowings under the revolving credit facility accrue interest based on a three‑tier pricing grid tied to availability, and our term loan collectively as "our existing credit facility". Our existingwe may elect for loans to be based on either LIBOR or base rate, plus the applicable margin, which ranges from 1.75% to 2.25% for LIBOR loans and 0.75% to 1.25% for base rate loans, with no LIBOR floor. Borrowings under the revolving credit facility is guaranteed by us (and, in the future, certain domestic subsidiaries of the Borrower would be required to become guarantors). Our existing credit facility isare secured by a first priority lien on, and security interest in substantially all assets of the Company. The revolving credit facility has a tenor of 5 years and equity interests held by the Borrower and the guarantors,a borrowing base of 85% of eligible accounts receivables less customary reserves. Under this facility we are required to comply, subject to certain exceptions and excluded assets. The interest rate on our existing credit facility is LIBOR plus 6.25%, subject (solelymateriality qualifiers, with respectcertain customary affirmative and negative covenants, including, but not limited to, the term loan) to a 1% LIBOR floor. Our existing revolving credit facility matures on September 30, 2018, and the term loan matures on September 30, 2019. On June 8, 2016, we and the Borrower entered into an amendment and waivercovenants pertaining to our existing credit agreement as a result of our failure to deliver certain annual and quarterly financial statements (and other related financial information) and comply with the specified leverage ratio financial covenant for the test period ending March 31, 2016. As a condition precedent to the effectiveness of the amendment our sponsor and majority shareholder, Energy Capital Partners, together with certain minority shareholders, contributed $40.4 million of additional equity into us, $10.4 million of which was reserved for working capital purposes and fees and up to $30.0 million of which was utilized to repurchase outstanding debt under our term loan. The amendment also provides that there shall be no leverage ratio financial covenant test until the test period ending June 30, 2017, at which time we will be subject to a total leverage financial covenant not exceeding 5.50:1.00, decreasing to 5.00:1.00 for the test period ending December 31, 2017, with further decreases to 4.50:1.00, 4.00:1.00, and 3.50:1.00 for the test periods ending June 30, 2018, December 31, 2018, and June 30, 2019, respectively. The amendment contains various covenants that restrict, among other things and subject to certain exceptions, our ability as well as the ability of the Borrower and certain of its present and future subsidiaries to incur certain liens, incurlien, indebtedness, changechanges in the nature of itsour business, undertake mergers and other fundamental changes, disposedisposal of certain assets, make investments and restricted payments, amendments to our organizational documents or accounting policies, earlymaking prepayments of subordinatedcertain debt, entry into dividend or lien blockers, certaindividends, transactions with affiliates, and our ability to carry out certain other activities. In addition, from the effective date of the amendment through and including June 29, 2017, certain baskets that would otherwise be available to us and the Borrower will not be available. Failure to comply with these covenants and restrictions could result in an event of default under our existing credit facility. In such an event, we could not request borrowings under the revolving facility, and all amounts outstanding under our existing credit facility, together with accrued interest, could then be declared immediately due and payable. As of September 30, 2016, we and the Borrower were in compliance with all covenants and restrictions in our existing credit facility. As of September 30, 2016, we had an outstanding principal balance of $38.5 million and $149.5 million under our revolving credit facility and term loan, respectively. On January 13, 2017, we usedincludes a portionSpringing Fixed Charge Coverage Ratio (“FCCR”) of 1.0x when excess availability is less than the greater of (i) 10% of the net proceedslesser of our recent private placement to repaythe facility size and the borrowing base (as set forth in full all outstanding borrowings under ourthe revolving credit facility) and (ii) $12 million. The revolving credit facility and approximately $75 million under our term loan. In addition, we entered into an amendment to our existing credit agreement pursuant to whichhas a commitment fee of 0.25% if the Borrowerutilization is no longer required to make scheduled amortization payments of principal for the remaindergreater than 50% of the term of the existing credit facility. As of January 31, 2017, we had no borrowings outstanding under our revolving credit facility, and we had $71.8 million outstanding under our term loan. In connection with the closing of this offering, we intend to terminate our existing credit facility and enter into a new revolving credit facility.36-month36‑month equipment financing arrangement for three hydraulic fracturing units, and received proceeds of $25.0 million. A portion of the proceeds were used to pay off manufacturer notes, and the remainder was used for additional liquidity.SeptemberJune 30, 20162017, we purchased certain light vehicles under this financing arrangement in the outstanding balance was $20.6amount of $0.2 million.SeptemberJune 30, 2016.2015 and $ million in 2016. We currently expect our capital expenditures to increase in 2017 as we deploy new hydraulic fracturing units and continue to capitalize equipment maintenance costs.this period.the year ended December 31, 2016.20152016 (in thousands). Total Less than 1 year 1 - 3 years 3 - 5 years More than 5 years $ 243,101 $ 24,857 $ 47,321 $ 170,923 $ — 38,500 — — 38,500 — 29,888 7,773 22,115 — — 3,149 768 897 710 774 $ 314,638 $ 33,398 $ 70,333 $ 210,133 $ 774 (1)Includes estimated interest cost at an interest rate of 6.25% plus the Eurodollar floor rate of 1%, per the terms of our term loan. As the Eurodollar Rate is floating and cannot be determined with accuracy for future periods, the floor rate of 1% was utilized to calculate anticipated future interest payments.(2)Exclusive of future commitment fees, amortization of deferred financing costs, interest expense or other fees on our revolving credit facility because obligations thereunder are floating rate instruments and we cannot determine with accuracy of the timing of future loan advances, repayments or future interest rates to be charged.(3)Equipment refinancing includes estimated interests costs of $5.4 million.(4)Operating leases include agreements for various office locations.(5)On June 8, 2016, $37.5 million of the term loan debt was repurchased by us from certain lenders. Total Less than
1 year 1 - 3 years 3 - 5 years More than
5 years$ 173,267 $ 21,340 $ 151,927 $ — $ — Revolving Credit Facility 13,500 — 13,500 — — 22,115 7,773 14,342 — — 2,382 471 793 688 430 Total contractual obligations $ 211,264 $ 29,584 $ 180,562 $ 688 $ 430 (1) Includes estimated interest cost at an interest rate of 6.25% plus rate with a 1% floor, per the terms of our Term Loan. As the Eurodollar Rate is floating and cannot be determined with accuracy for future periods, the floor rate of 1% was utilized to calculate anticipated future interest payments. (2) Equipment refinancing includes estimated interests costs of $2.9 million. (3) Operating leases include agreements for various office locations. long-termlong‑term debt due to fluctuations in applicable market interest rates. Going forward our market risk exposure generally will be limited to those risks that arise in the normal course of business, as we do not engage in speculative, non-operatingnon‑operating transactions, nor do we utilize financial instruments or derivative instruments for trading purposes.aremay be subject to interest rate risk on our variable rate debt and use an interest rate swap to manage the cash flow impacts of the floating rate obligations associated withunder our existing term loan and credit facility. The Company also has fixed rate debt, but does not currently utilize derivative instruments to manage the economic effect of changes in interest rates on our fixed rate debt. Our policies do not permit speculative trading activities, and the swap was not designated as a hedging instrument. The impact of a 1% increase in interest rates on our outstanding debt as of SeptemberJune 30, 20162017 and 20152016 would have resulted in an increase in interest expense andpre-taxpre‑tax income of approximately $1.7$0.1 million and $2.0$1 million, for the ninesix months ended SeptemberJune 30, 2017 and 2016, and 2015, respectively. not currently required to comply with the SEC's rules implementing Section 404 of the Sarbanes Oxley Act of 2002, and are therefore not required to make a formal assessment of the effectiveness of our internal control over financial reporting for that purpose. Upon becoming a public company, we will be required to comply with the SEC'sSEC’s rules implementing Section 302 of the Sarbanes-OxleySarbanes‑Oxley Act of 2002, which will requirerequires our management to certify financial and other information in our quarterly and annual reports and provide an annual management report on the effectiveness of our internal control over financial reporting. We will not be required to make our first assessment of our internal control over financial reporting until the year of our second annual report required to be filed with the SEC. To comply with the requirements of being a public company, we may need to implement additional financial and management controls, reporting systems and procedures and hire additional accounting, finance and legal staff. Further, our"emerging“emerging growth company"company” pursuant to the provisions of the JOBS Act. Please read "Summary“Summary — Our Emerging Growth Company Status."FASBFinancial Accounting Standards Board (“FASB”) issued Accounting Standards Update (ASU) No. 2014-09,2014‑09, Revenue from Contracts with Customers (Topic 606). ASU No. 2014-092014‑09 requires entities to recognize revenue to depict transfer of promised goods or services to customers in an amount that reflects the consideration to which the entity expects to be entitled in exchange for those goods or services. ASU No. 2014-092014‑09 requires entities to disclose both qualitative and quantitative information that enables users of interim condensedthe consolidated financial statements to understand the nature, amount, timing, and uncertainty of revenue and cash flows arising from contracts with customers, including disclosure of significant judgments affecting the recognition of revenue. ASU No. 2014-09 will be2014‑09 was originally effective for annual periods beginning after December 15, 2016, using either the retrospective or cumulative effect transition method. On August 12, 2015, the FASB issued ASU No. 2015-14,2015‑14, which defers the effective date of the revenue standard, ASU No. 2014-09,2014‑09, by one year for all entities and permits early adoption on a limited basis. We are currently evaluatingPer our preliminary evaluation, we believe that the adoption of this guidance will not materially affect our revenue recognition. However, we will continue to evaluate and quantify the effect of the adoption of this guidance on the interim condensedour consolidated financial statements.August 2014, the FASB issued ASU No. 2014-15,Disclosure of Uncertainties about an Entity's Ability to Continue as a Going Concern. Currently, there is no guidance in effect under accounting principles generally accepted in the United States of America regarding management's responsibility to assess whether there is substantial doubt about an entity's ability to continue as a going concern. Under ASU No. 2014-15, we will be required to assess its ability to continue as a going concern each interim and annual reporting period and provide certain disclosures if there is substantial doubt about its ability to continue as a going concern, including management's plan to alleviate the substantial doubt. ASU No. 2014-15 is effective for annual periods ending afterDecember 15, 2016, and interim periods thereafter with early adoption permitted. We are currently assessing the effect of the adoption of ASU No. 2014-15 on its future interim condensed consolidated financial statements and related disclosures. In AprilJuly 2015, the FASB issued ASU No. 2015-03,2015‑11, Interest — Imputation of Interest (Subtopic 835-30), which requires that deferred loan costs be classified in the balance sheet as a reduction of the respective term debt. The standard is effective for annual periods beginning after December 15, 2015. We adopted this guidance in 2015. The adoption of this guidance did not have a material impact on the consolidated financial statements. Deferred loan costs have been classified as a direct reduction from the long-term debt in the balance sheet at September 30, 2016 and December 31, 2015. On July 22, 2015, the FASB issued ASU No. 2015-11,Simplifying the Measurement of Inventory,which requires entities to measure most inventory "at“at the lower of cost and net realizable value,"” thereby simplifying the current guidance under which an entity must measure inventory at the lower of cost or market. ASU No. 2015-112015‑11 does not apply to inventories that are measured by using either the last-in, first-outlast‑in, first‑out method or the retail inventory method. The amendments in ASU No. 2015-112015‑11 are effective for fiscal years beginning after December 15, 2016. We are currently evaluating the effect of the adoption of this guidance on the interim condensed consolidated financial statements. In November 2015, FASB issuedThe ASU No. 2015-17,Income Taxes —Balance Sheet Classification of Deferred Taxes (Subtopic 740), which requires that deferred tax liabilities and assets be classified as noncurrent in the balance sheet. The current requirement that deferred tax liabilities and assets of a tax-paying component of an entity be offset and presented as a single amount is not affected by the amendments in this update. ASU No. 2015-17 isbecame effective for annual periods beginning after December 15, 2016, with early adoption permitted. We have elected early adoptionus in 20152017 and have applied this guidance prospectively. Thethe adoption of this guidance did not have a material impact on the interim condensedmaterially affect our consolidated financial statements.2016-02,2016‑02, Leases, a new standard on accounting for leases. The ASU introduces a lessee model that brings most leases on the balance sheet. The new standard also aligns many of the underlying principles of the new lessor model with those in the current accounting guidance as well as the FASB'sFASB’s new revenue recognition standard. However, the ASU eliminates the use of bright-linebright‑line tests in determining lease classification as required in the current guidance. The ASU also requires additional qualitative disclosures along with specific quantitative disclosures to better enable users of financial statements to assess the amount, timing, and uncertainty of cash flows arising from leases. The pronouncementnew standard is effective for annual reporting periods beginning after December 15, 2018, including interim periods within that reporting period, using a modified retrospective approach. Early adoption is permitted. We have not completed an evaluation of the impact the pronouncement will have on our interim condensed consolidated financial statements and related disclosures."emerging“emerging growth company"company” pursuant to the provisions of the JOBS Act, enacted on April 5, 2012. Section 102 of the JOBS Act provides that an "emerging“emerging growth company"company” can take advantage of the extended transition period provided in Section 7(a)(2)(B) of the Securities Act for complying with new or revised accounting standards. However, we are choosing to "opt out"“opt‑out” of such extended transition period, and as a result, we will comply with new or revised accounting standards on the relevant dates on which adoption of such standards is required for non-emergingnon‑emerging growth companies. Our election to "opt-out"“opt‑out” of the extended transition period is irrevocable.$12.9$20.2 million and $15.1$6.9 million for the ninesix months ended SeptemberJune 30, 2017 and 2016,straight-linestraight‑line method over estimated useful lives. The estimated useful lives and salvage values of property and equipment is subject to key assumptions such as maintenance, utilization and job variation. Unanticipated future changes in these assumptions could negatively or positively impact our net income. A 10% change in the useful lives of our property and equipment would have resulted in a $3.2$2.4 million and $4.3 million impact on net income inloss during the ninesix months ended SeptemberJune 30, 2016.straight-linestraight‑line method over the following estimated useful lives:1 - 51-5 years2 - 201-20 years5 - 205-20 years(FASB) Accounting Standards Codification (ASC) 360 regarding Accounting for the Impairment or Disposal of Long-LivedLong‑Lived Assets, we review our long-livedthe long‑lived assets to be held and used whenever events or circumstances indicate that the carrying value of those assets may not be recoverable. An impairment loss is indicated if the sum of the expected future undiscounted cash flows attributable to the assets is less than the carrying amount of such assets. In this circumstance, we recognize an impairment loss for the amount by which the carrying amount of the asset exceeds the fair value of the asset. Our cash flows forecasts require us to make certain judgements regarding long-termlong‑term forecasts of future revenue and costsflowsflow forecasts is our future growth expectations. The significant assumption is uncertain in that it is driven by future demand for our services and utilization which could be impacted by crude oil market prices, future market conditions and technological advancements. We recorded an impairment loss of $36.6 million during the fiscal year 2015 related to our permian drilling and acidizing asset groups. Our cash flows forecasts were based on estimated future utilization rate averaging 38% and 68% for our permian drilling and acidizing assets, respectively, and in general, assumed future crude oil price of $40 per barrel in 2016, $50 per barrel in 2017 and gradually increasing to approximately $70 per barrel in the future years. Our fair value estimates for certain long-livedlong‑lived assets require us to use significant other observable inputs among others including significant assumptions related to replacement costmarket approach based on actual recent auction sales or selling prices of comparable equipment. The estimates of fair value are also subject to significant variability, are sensitive to changes in market conditions, and are reasonably likely to change in the future. as we anticipate, and if our equipment remains idle or under-utilized,under‑utilized, the estimated fair value of such equipment may decline, which could result in additional impairment charges. Though the impacts of variations in any of these factors can have compounding or off-settingoff‑setting impacts, a 10% decline in the estimated fair value of our permianPermian drilling assets at December 31, 2016 would result in additional impairment of approximately $1.5$0.9 million, as of September 30, 2016. Aand a 10% decline in the estimated future cash flows for our other asset groups would not indicate an impairment. most recently performed our annual goodwill impairment test in accordance with ASC 350 on December 31, 2015,2016, at which time, we determined that the fair value of our hydraulic fracturing reporting unit was substantially in excess of its carrying value and the fair value of our surface drilling reporting unit was in excess ofless than its carrying value, by approximately 10%.resulting in the impairment of the entire $1.2 million of our surface drilling goodwill. The hydraulic fracturing and surface drilling operating segments are the only two segments which have goodwill. The quantitative impairment test we perform for goodwill utilizes certain assumptions, including forecasted revenue and cost assumptions. If the crude oil market declines and remains at low levels for a sustained period of time, we could record an impairment of the carrying value of our goodwill in the future. If crude oil prices decline further or remain at low levels, to the extent appropriate we expect to perform our goodwill impairment assessment on a more frequent basis to determine whether an impairment is required. Our discounted cash flow analysis for each reporting unit includes significant assumptions regarding discount rates, revenue growth rates, expected profitability margin, forecasted capital expenditures, the timing of an anticipated market recovery, and the timing of expected cash flow. As such, these analyses incorporate inherent uncertainties that are difficult to predict in volatile economic environments and could result in impairment charges in future periods if actual results materially differ from the estimated assumptions utilized in our forecast.interim condensed consolidated financial statements. Under this method, deferred tax assets and liabilities are determined on the basis of differences between theinterim condensed consolidated financial statements and tax bases of assets and liabilities using enacted tax rates in effect for the year in which the differences are expected to reverse. The effect of a change in tax rates on deferred tax assets and liabilities is recognized in income in the period that includes the enactment date.needvaluation allowance of $5.8 million for valuation allowances,the six months ended June 30, 2017, we have considered and made judgementsjudgments and estimates regarding estimated future taxable income. These estimates and judgementsjudgments include some degree of uncertainty and changes in these estimates and assumptions could require us to adjust the valuation allowances for our deferred tax assets and the ultimate realization of tax assets depends on the generation of sufficient taxable income.judgementjudgment in the use of assumptions and estimates. Additionally, we forecasts certain tax elements, such as future taxable income, as well as evaluate the feasibility of implementing tax planning strategies. Given the inherent uncertainty involved with the use of such variables, there can be significant variation between anticipated and actual results. Unforeseen events may significantly impact these variables, and changes to these variables could have a material impact on our income tax accounts. The final determination of our income tax liabilities involves the interpretation of local tax laws and related authorities in each jurisdiction. Changes in the operating environments, including changes in tax law, could impact the determination of our income tax liabilities for a tax year.Unless otherwise indicated, the information set forth under "Industry Overview," including all statistical data and related forecasts, is derived from Spears & Associates' "Hydraulic Fracturing Market 2005-2017" published in the fourth quarter 2016, and Rystad Energy's "UCube" as of November 2016. We believe that the third-party sources are reliable and that the third-party information included in this prospectus or in our estimates is accurate and complete. While we are not aware of any misstatements regarding the hydraulic fracturing industry data presented herein, estimates involve risks and uncertainties and are subject to change based on various factors, including those discussed under the heading "Risk Factors." Over the past decade, the innovative application of horizontal drilling and hydraulic fracturing has fundamentally changed the U.S. onshore oil and gas industry by enabling the extraction of hydrocarbons from tight rock formations, commonly referred to as shales, or unconventional resources. These technological advancements, discussed in detail below, have enabled E&P operators to economically extract these unconventional resources, repositioning the United States as a globally competitive oil and gas producer with resources expected to last generations. According to the EIA, U.S. unconventional oil production grew from 380,000 barrels per day in 2007 to almost 4.9 million barrels per day in 2015, representing 52% of total U.S. crude oil production in 2015. Furthermore, unconventional shale resources are expected to remain a substantial component of U.S. oil and gas production growth for the foreseeable future. The EIA projects that U.S. production of unconventional oil will increase by 45% from 2015 to 2040, representing a 1.5% annual growth rate over the next 25 years. This growth trajectory is supported by the vast resource potential of U.S. shale basins. According to industry consultant, Rystad Energy, there are over 430 billion barrels of technically recoverable oil and gas equivalent in U.S. shales, or more than 50 times the total amount of oil and gas produced in the United States in 2015. We believe the Permian Basin, our primary area of operation, will be a key driver of U.S. tight oil production due to its extensive drilling inventory and relatively attractive breakeven economics.Crude Oil Annual Production GrowthGlobal Crude Oil Proved Reserves Growth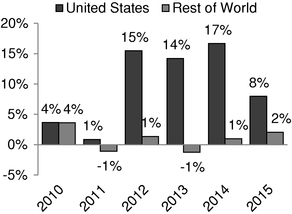
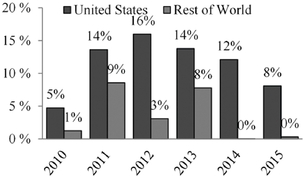
Source: Rystad Energy UCube, November 2016Source: EIA, January 2017Horizontal Drilling Overview Horizontal drilling is used to provide greater access to hydrocarbon reserves by exposing the well to more of the trapped producing formation. Horizontal wells have become the default method for E&P operators to most economically extract unconventional resources. According to Baker Hughes, as of January 27, 2017, horizontal rigs accounted for approximately 81% of all rigs drilling in the United States, up from 25% at year-end 2007. The figure below illustrates this shift over time.Horizontal Rigs as a Percentage of Total U.S. Rig Count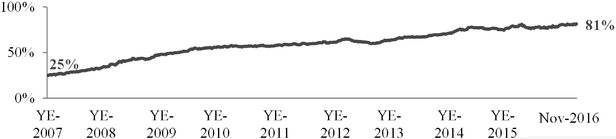
Source: Baker Hughes Rig Data, January 27, 2017Hydraulic Fracturing Overview Hydraulic fracturing involves pumping fluid down a well casing or tubing under high pressure to cause the underground formation to crack or fracture, allowing hydrocarbons to flow more freely. A propping agent, or proppant, is suspended in the fracturing fluid and holds open the fractures created in this process. Proppants generally consist of raw sand, resin-coated sand or ceramic particles and other engineered proprietary materials. To perform fracturing jobs, service providers use hydraulic horsepower and equipment mounted on mobile units, referred to as "frac fleets", to pump fluids, sand and other consumables downhole with high amounts of hydraulic horsepower ("HHP") to complete numerous frac stages in a single well, thereby increasing the flow of hydrocarbons. Among oilfield service subsectors, recent developments in drilling and completion techniques have had a disproportionately positive impact on demand for hydraulic fracturing and other well completion services. Spears & Associates estimates that the global market for hydraulic fracturing grew at a 10% compound annual growth rate from 2005 to 2015, faster than any other oilfield service segment. Spears & Associates estimates the total size of this market to be $25 billion in revenue in 2015, as shown below.Historical Worldwide Revenues for Selected Oilfield Service Segments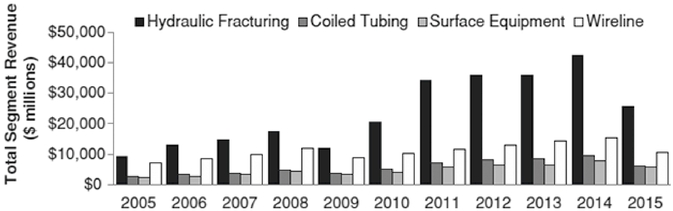
Source: Spears & Associates, December 2016Recent Trends in North American Hydraulic Fracturing Market In response to the increased demand for hydraulic fracturing services, between 2010 and 2015, over 12 million HHP entered the North American hydraulic fracturing market, resulting in anestimated 22 million HHP operating in North America (United States and Canada) at year-end 2015, according to Spears & Associates. As drilling and completion activity declined during the most recent oil and gas downturn, working North America, HHP also declined leading to an oversupply of HHP and a decline in HHP fleet utilization. In response to an oversupplied hydraulic fracturing market, many hydraulic fracturing service companies deferred necessary maintenance capital spending and idled HHP. As a result, Spears & Associates estimates that North American HHP will fall to approximately 20 million by year-end 2016, down over 10% from peak 2015 operating HHP. Since the closing price of crude oil reached a low of $26.19 in February 2016, demand for HHP has improved significantly, with oil and gas producers adding 250 oil-directed rigs in the United States since the lowest point during this time period. Further, North American shale E&P operators' 2017 capital budgets are higher than 2016 levels due to the more supportive commodity price environment. We anticipate industry-wide utilization of hydraulic fracturing horsepower to continue to increase resulting in a convergence of equipment supply and demand. Spears & Associates forecasts that Permian Basin hydraulic fracturing revenue will increase to $7 billion by 2019, representing a 70% increase over 2015 revenue and a 14% annual growth rate during the same time period.Permian Basin Hydraulic Fracturing Revenue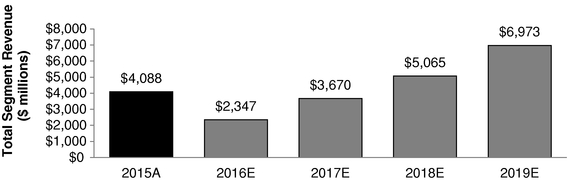
Source: Spears & Associates, December 2016Permian Basin The Permian Basin stretches across more than 86,000 square miles in West Texas and Southeast New Mexico and is comprised of three primary sub-areas: the Midland Basin, the Central Basin Platform and the Delaware Basin. These areas are characterized by high oil and liquids-rich natural gas content, extensive production histories, long-lived reserves, multiple producing horizons and historically high drilling success rates.Major Sub-Basins of the Permian Basin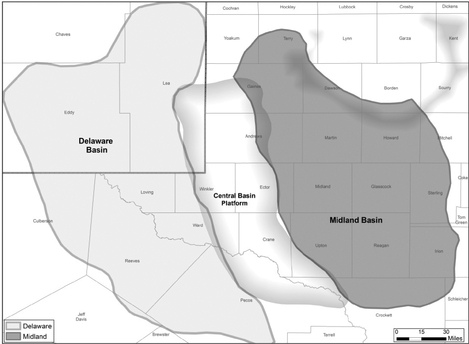
With the advent of hydraulic fracturing and horizontal drilling, the Permian Basin has experienced a renaissance over the past five years, and is today the largest crude oil resource in the United States, and the second largest in the world, according to Rystad Energy. The Permian Basin currently produces two million barrels of crude oil per day, which represents more than 22% of U.S. crude oil production, and exceeds the combined oil output of the Bakken and Eagle Ford, according to the EIA.Largest Crude Oil Field in the United StatesPermian Oil Production Continues to Increase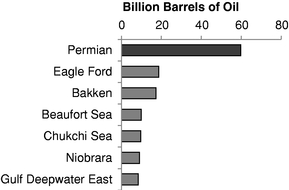
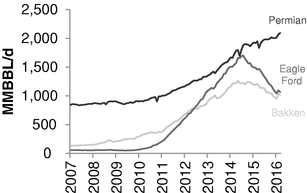
Source: Rystad Energy UCube, November 2016Source: EIA, January 27, 2017 The Permian Basin's extensive proved oil reserve base, and ability to increase production through commodity price cycles is largely due to its unique, multi-zone geology, commonly referenced to as stacked pay zones. Unlike other oil-producing basins, like the Eagle Ford and Bakken, Permian E&P operators are able to extract hydrocarbons from a single topside location from multiple stacked pay zones. This unique stacked geology lends itself to increased efficiencies and well productivity, driving costs considerably lower than other U.S. shale plays on a per barrel basis. Rystad Energy estimates Permian Basin breakeven costs to be as low $32 per barrel.Permian Basin Producing Zones Benchmarking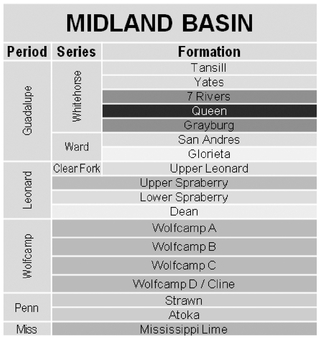
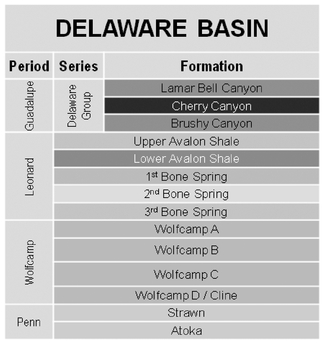
The Permian Basin's extensive drilling inventory and relatively attractive breakeven economics have resulted in an acceleration of E&P activity relative to other U.S. basins. Since rig counts bottomed in May 2016, the Permian Basin rig count has increased by 154 rigs, from 137 in May 2016 to 291 in January 2017, which represents approximately 50% of the total U.S. rig count increase over the same period. Today, the Permian Basin is the most active onshore North American basin, with over 291 drilling rigs operating as of January 2017, representing approximately 51% of all oil-directed rigs in the United States, according to Baker Hughes.Increase in Rig Count Since May 2016Total Rig Count by Basin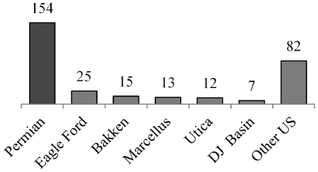
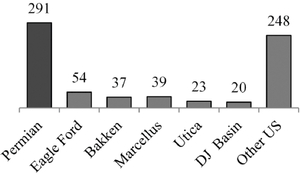
Source: Baker Hughes Rig Data, January 27, 2017Source: Baker Hughes Rig Data, January 27, 2017 Increased drilling and completion activity in the Permian Basin has been further supported by an active Permian M&A and capital markets environment. In contrast to other U.S. shale plays, through the most recent commodity price cycle Permian Basin-focused operators were able to raise significant amounts of equity and debt capital to fund their drilling programs and bolster their acreage positions through M&A. In 2016 alone, publicly traded Permian pure-play operators were able to raise over $12.0 billion of common equity, in contrast to Bakken and Eagle Ford operators who only raised approximately $2.8 billion and $1.9 billion, respectively. Further, many E&P operators who did not have a presence in the Permian entered the basin through acquisitions. Weanticipate that the influx of capital into the basin will result in increased drilling and completion spending.Permian E&P Operators Announced 2016-2017 Capital Spending Increase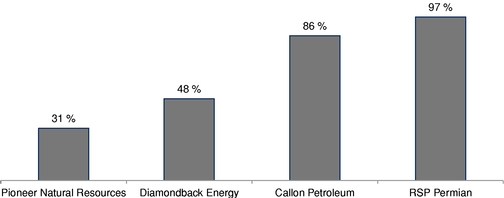
Midland Basin The Midland basin is the more delineated and mature resource-play of the Permian Basin's sub-basins. Investors look to the Midland Basin for near-term oil volume growth given its advanced stages of pad drilling, downspacing, and capital efficiency. Initially derisked with thousands of vertical wells, today its resource potential is further enhanced through horizontal drilling and drilling and completion efficiencies. Rystad Energy estimates the Midland Basin's recoverable oil resource to be over 27 billion barrels, which is greater than the entire Eagle Ford shale play's crude oil reserves, and is second only to the Midland Basin adjacent Delaware Basin. Our leading position in the Midland Basin positions us well to capitalize on increasing drilling and completion activity.Midland Basin Percentage of Horizontal RigsMidland Basin Rig Count Since May 2016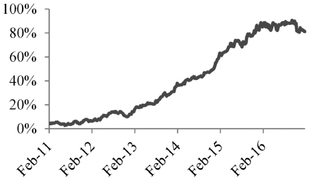
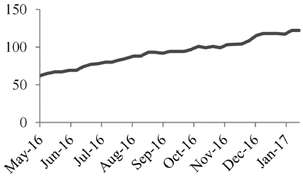
Source: Baker Hughes Rig Data, January 27, 2017Source: Baker Hughes Rig Data, January 27, 2017Delaware Basin Accounting for over 50% of the Permian Basin's growth in rig-activity since May 2016, the Delaware Basin has become a premier, complementary resource base to the Midland Basin. Rystad Energy estimates the recoverable crude oil resource in the Delaware Basin to be slightly greater than the Midland Basin, at approximately 28 billion barrels. As the less-developed of the two primary Permian Basin sub-basins, the Delaware Basin represents a high-growth opportunity for Midland-based service providers. As activity levels increase in the Delaware Basin we have begunto expand our presence in the Delaware Basin due to considerable demand pull from both existing and new customers.Delaware Basin Percentage of Horizontal RigsDelaware Basin Rig Count Since May 2016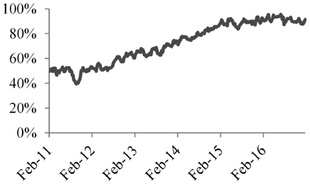
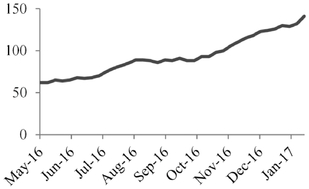
Source: Baker Hughes Rig Data, January 27, 2017Source: Baker Hughes Rig Data, January 27, 2017Industry Trends Impacting Hydraulic Fracturing Services A number of recent industry developments are positively impacting demand for hydraulic fracturing and related oilfield services. These developments include:•overall increase in drilling activity in the Permian Basin;•dramatic shift to horizontal drilling as a percentage of total drilling activity;•increasingly longer horizontal wellbore laterals;•greater number of frac stages per well;•increasing amounts of proppant employed per well; and•enhanced drilling and completion efficiencies. These developments, which are being driven by E&P operators to increase drilling and completion efficiencies, enhance well performance and decrease breakeven costs, are described in greater detail below.Increase in Permian Basin Drilling Activity Since rig counts reached their lowest point in May 2016, the Permian Basin rig count has increased by 154 rigs, from 137 in May 2016 to 291 in January 2017, which represents approximately 50% of the total U.S. rig count increase over the same period.Total Permian Basin Rig Count Since May 2016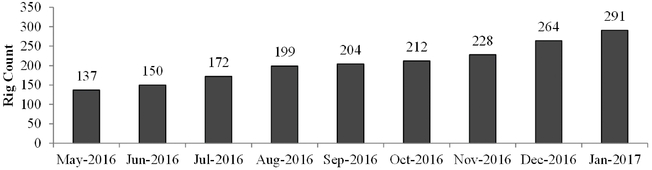
Source: Baker Hughes Rig Data, January 27, 2017Horizontal Drilling Activity Much of the growth in rig activity in the Permian Basin is the result of increasing horizontal drilling activity. Horizontal drilling has become the default method for E&P operators to most economically extract unconventional resources from the basin. According to Baker Hughes, as of January 27, 2017, horizontal rigs accounted for approximately 81% of all rigs drilling in the United States, up from 58% as of December 31, 2011. This growth has been especially pronounced in the Permian Basin, where horizontal rigs account for approximately 84% of current Permian Basin rig activity compared to just 22% in December 2011.Horizontal Rigs as a Percentage of Total Rig Count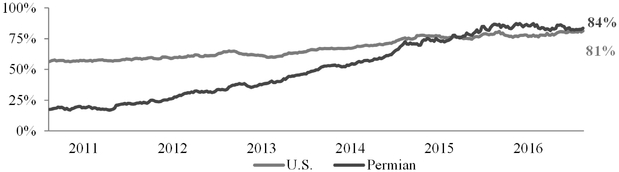
Source: Baker Hughes Rig Data, January 27, 2017Horizontal Lateral Length and Frac Stages per Well As the Permian Basin has shifted towards horizontal drilling, E&P operators and service providers are expected to continue to focus on advancing horizontal drilling efficiencies. Operators are expected to continue to increase horizontal wellbore lateral lengths and increase the number of frac stages per well by minimizing the spacing between stages along laterals. Longer horizontal laterals provide producers with a greater length of productive wellbore, and Spears & Associates estimates that lateral lengths will increase from an average of 5,000 feet in 2013 to an estimated average of 9,000 feet expected in 2017. Furthermore, we estimate that current leading-edge laterals in the Permian Basin can be as long as 12,500 feet. The combination of longer laterals and increased frac stages per well is resulting in increased demand for HHP. The graphs below illustraterecent and expected increases in horizontal lateral lengths and frac stages per well within the Permian Basin.Estimated Average Lateral Length in thePermian BasinEstimated Average Fracture Stages per Well in the Permian Basin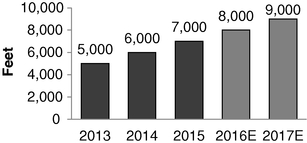
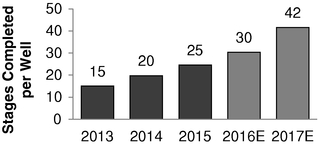
Source: Spears & Associates, December 2016Source: Spears & Associates, December 2016Total Frac Stages Performed in the Permian Basin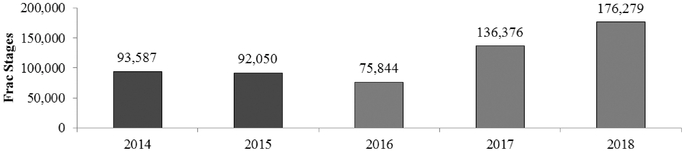
Source: Spears & Associates, December 2016Greater Volume of Proppant per Well The purpose of fluids and proppant in well completion is to induce and sustain reservoir rock fractures, thereby facilitating the flow of hydrocarbons from the reservoir into the well. Over time, oilfield service providers have been able to increase the volume of proppant used per lateral foot, thereby increasing the effectiveness of fractures. In order to pump larger amounts of these consumables, oilfield service providers require greater horsepower per fracturing stage, which results in increased demand for hydraulic fracturing equipment that is capable of performing the more complex and intense fracturing jobs. As shown below, Spears & Associates expects the amount of proppant pumped per foot of lateral length in the Permian Basin to rise over each of the next four years, growing at an annualized rate of approximately 20% from 2015 to 2018.Proppant per Lateral Foot in the Permian Basin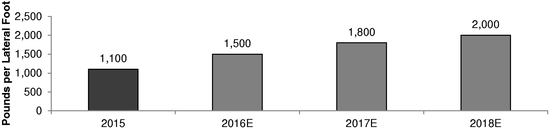
Source: Spears & Associates, November 2016Drilling and Completion Efficiencies In addition to the shift to horizontal drilling and increasing service intensity, drilling and completion efficiencies, such as multi-well pads and zipper fracs, are also driving increased hydraulic fracturing demand. Multi-well pads allow for the drilling of multiple wellbores from a single topside location, reducing average drilling time. Similarly, zipper fracking allows for the simultaneous completion of hydraulic fracturing stages in adjacent wells, increasing the number of stages that can be performed in a given time period. These advancements have resulted in a reduction in the number of days typically required to drill and complete a well, and as a result, increased the total number of wells that can be drilled per rig, which drives incremental demand for hydraulic fracturing services.Supply and Demand Dynamics in the Hydraulic Fracturing Services Market The increase in demand for hydraulic horsepower coupled with anticipated competitor equipment attrition is expected to drive more favorable hydraulic fracturing supply and demand dynamics. As the market for fracturing services tightens, we believe this may lead to a general increase in pricing. With demand for our services in excess of current capacity and the ability of our fleet to handle the most complex, highest intensity hydraulic fracturing jobs, we are optimally positioned to benefit from increasing pricing trends.Overviewgrowth-oriented,growth‑oriented, Midland, Texas-basedTexas‑based oilfield services company providing hydraulic fracturing and other complementary services to leading upstream oil and gas companies engaged in the exploration and production, or E&P, of North American unconventional oil and natural gas resources. Our operations are primarily focused in the Permian Basin, where we have cultivated longstanding customer relationships with some of the region'sregion’s most active and well-capitalizedwell‑capitalized E&P companies, including Callon Petroleum, Diamondback Energy, Parsley Energy, Pioneer Natural Resources, Surge Energy and XTO Energy. For the year ended December 31, 2016, no single customer represented greater than 20% of our revenue.companies. The Permian Basin is widely regarded as the most prolific oil-producingoil‑producing area in the United States, and we believe we are currentlyone of the largest private providerproviders of hydraulic fracturing services in the region by hydraulic horsepower, or HHP, with an aggregate deployed capacity of 420,000555,000 HHP. Our fleet which consists of 10 hydraulic fracturing units, has been designed to handle the highest intensity, most complex hydraulic fracturing jobs, and has been 100% utilized since September 2016. We haveIn the quarter ended June 30, 2017, we purchased and put in service two additional hydraulic fracturing units, which areand took delivery and put into service a third unit following the end of quarter, bringing our fleet total to 13 deployed units. In addition, we have contracted to purchase three new hydraulic fracturing units scheduled for delivery and deployment to dedicated customers in Aprilthe second half of 2017, as well as other ancillary equipment such as engines and June 2017, respectively.spare parts. These units will provide us with an additional 90,000135,000 HHP, bringing our totalaggregate capacity to 510,000690,000 HHP. Additionally, we expect to use the proceeds from this offering to purchase two additional units that will be deployed in 2017 to meet specific customer requests, giving us an additional 90,000 HHP, or 600,000 HHP in the aggregate, once all units have been received.region'sregion’s increasingly high-intensityhigh‑intensity well completions, which are characterized by longer horizontal wellbores, more frac stages per lateral and increasing amounts of proppant per well. Over 75% of our fleet has been delivered over the past threefour years, and we have fully maintained our equipment throughout the recent industry downturn to ensure optimal performance and reliability. In contrast, we believe many of our competitors have deferred necessary maintenance capital spending throughout the downturn, which we believe uniquely positions us to respond more quickly and reliably to customer needs during the ongoing market recovery.customerscustomers’ increasing service needs and spending levels.customer.customers. We achieve this objective by providing reliable, high-qualityhigh‑quality services that are tailored to our customers'customers’ needs and synchronized with their well development programs. This alignment assists our customers in optimizing the long-termlong‑term development of their unconventional resources. Over the past threefour years, we have leveraged our strong Permian Basin relationships to grow our installed HHP capacity by over 400%four times and organically build our Permian Basin cementing, coiled tubing and acidizing lines of business. Consistent with past performance, we believe our substantial market presence will continue to yield a variety of actionable growth opportunities allowing us to expand both our hydraulic fracturing and complementary services going forward. To this end, we intend to continue our past practice of opportunistically deploying new equipment on a long-term,long‑term, dedicated basis in response to specific customer demand.nine months ended September 30, 2016 and the yearyears ended December 31, 2016 and 2015, we generated net losses of approximately $(35.8)$(53.1) million and $(45.9) million, respectively, and Adjusted EBITDA of approximately $1.6$7.8 million and $60.1 million, respectively. Over these same periods,years, approximately 92.1%94% and 90.0%90% of our revenues, respectively, were generated from our pressure pumping segment, which includes our hydraulic fracturing, cementing and acidizing services. For the definition of Adjusted EBITDA and a reconciliation from its most directly comparable financial measure calculated and presented in accordance with generally accepted accounting principles ("GAAP"),GAAP, please read "Selected“Selected Historical Consolidated Financial Data — Non-GAAP Financial Measures."Private Placement of Convertible Preferred Stock Effective as of December 27, 2016,completed a private placement of 11,724,134issued and sold 13,250,000 shares of Series A Preferred Sharescommon stock, and certain selling shareholders sold 11,750,000 shares of common stock, at a price to certain "accredited investors" (as defined in Regulation D promulgated under the Securities Actpublic of 1933, as amended, or the Securities Act).$14.00 per share. We received netcash proceeds of approximately $163$170.1 million from this transaction, net of underwriting discounts and commissions and offering expenses, which we used the net proceeds (i) to repay $71.8 million in full all outstanding borrowings under our revolving credit facility and approximately $75 millionaccrued interest under our term loan, (ii) to acquire newfor the purchase of additional hydraulic fracturing units totaling 90,000 additional HHPfleets and ancillary equipment, and (iii) retained the balance for general corporate purposes. Upon consummationthis offering,common stock of the Series A Preferred Shares will automatically convert intoCompany received 1.45 shares of ourcommon stock for every one share of previous common stock. Effective December 27,in connection with2015 consolidated financial statements have been updated to reflect the closingeffect of the private placement of Series A Preferred Shares, we entered into a registration rights agreement with the purchasers of the Series A Preferred Shares under which we agreed to grant such purchasers certain registration rights with respect to the common stock into which the Series A Preferred Shares will convert. Please see "Shares Eligible for Future Sales — Preferred Shareholder Registration Rights Agreement."Reverse Stock Splitsplit. On December 22, 2016, we effected a 170.4667-for-1 reverse split of our common stock (the "reverse stock split"). All share-related and per-share information in the registration statement of which this prospectus constitutes a part has been adjusted to give effect to the reverse stock split from the beginning of the earliest periods presented.multi-stagemulti‑stage fracturing of horizontal oil-producingoil‑producing wells in unconventional geological formations. As of September 30, 2016,August 1, 2017, we had grown our hydraulic fracturing business to a total of 1013 hydraulic fracturing units with an aggregate of 420,000555,000 HHP, of which 320,000455,000 HHP has been delivered since 2013. We have purchased two which are scheduled for delivery and deployment to dedicated customers in April and Junethe second half of 2017, respectively. These unitswhich will provide us with an additional 90,000 HHP, bringingincrease our total capacity to 510,000an aggregate of 690,000 HHP. Additionally, we expect to use the proceeds from this offering to purchase two additional units that will be deployed in 2017 to meet specific customer requests, giving us an additional 90,000 HHP, or 600,000 HHP in the aggregate, once all units have been received."break,"“break,” or loosen viscosity, and be forced out of the formation by its pressure, leaving the proppants suspended in the fractures created, thereby increasing the mobility of the hydrocarbons. As a result of the fracturing process, production rates are usually enhanced substantially, thus increasing the rate of return of hydrocarbons for the operator."fleet"“fleet” and the personnel assigned to each unit as a "crew."“crew.” Our hydraulic fracturing units consist primarily of a high pressure hydraulic pump, a diesel engine, a transmission and various hoses, valves, tanks and other supporting equipment that are typically mounted to a flat-bedflat‑bed trailer.customer'scustomer’s needs. Each unit in our fleet has a designated team of personnel, which allows us to provide responsive and customized services, such as project design, proppant and other consumables procurement, real-timereal‑time data provision and post-completionpost‑completion analysis for each of our jobs. Many of our hydraulic fracturing units and associated personnel have continuously worked with the same customer for the past several years promoting deep relationships and a high degree of coordination and visibility into future customer activity levels. Furthermore, in light of our substantial market presence and historically high fleet utilization levels, we have established a variety of entrenched1314 cementing units, with seveneight units operating in the Permian Basin and six units operating in the Uinta-PiceanceUinta‑Piceance Basin. We believe that our cementing segment provides an organic growth opportunity for us to expand our service offerings within our existing customer base.
AcidizingAcidizingtruck-mountedtruck‑mounted reel for onshore applications. Due to its small diameter, coiled tubing can be inserted into existing production tubing and used to perform a variety of services to enhance the flow of oil or natural gas.down-hole down‑holetools and (v) enhance access to remote fields due to the smaller size and mobility.November 2016,June 30, 2017, we had one 2"2”, one 23/8"” and one 11/1V4"” coiled tubing unit, all of which were operating in the Permian Basin. We believe these units are well suited for the performance requirements of the unconventional resource markets we serve. The average age of these units is less than four years old.well-testingwell‑testing spreads. We provide flowback services in the Permian Basin and mid-continentmid‑continent markets.Uinta-PiceanceUinta‑Piceance Basin, which is capable of offering cost-effective, pre-setcost‑effective, pre‑set surface air drilling services to target depths of approximately 4,000 feet in areas of fragile geology. Air drilling is a technique in which oil, natural gas, or geothermal wells are drilled by creating a pressure within the well that is lower than the reservoir pressure, which results in increased rates of penetration, reduced formation damage and reduced drilling costs. This division is uniquely suited to the fragile geology of the Uinta-PiceanceUinta‑Piceance Basin and is highly complementary to our cementing offering.high-qualityhigh‑quality services that are tailored to our customers'customers’ needs and synchronized with their well development programs. This alignment assists our customers in optimizing the long-termlong‑term development of their unconventional resources. We believe that the following competitive strengths differentiate us from our peers and uniquely position us to achieve our primary business objective.•private hydraulic fracturing providerproviders by HHP in the Permian Basin, which is the most prolific oil producing area in the United States, by HHP.States. Our longstanding customer relationships and substantial Permian Basin market presence uniquely position us to continue growing in tandem with the basin'sbasin’s ongoing development. The PermianPenman Basin is a mature, liquids-richliquids‑rich basin with well-knownwell‑known geology and a large, exploitable resource base that delivers attractive E&P producer economics at or below current commodity prices. Rystad Energy estimates that, asAs a result of November 2016, the Permian Basin contains approximately 58 billion barrels of oil, the largest recoverable crude oil resource base in the United States and the second largest in the world. The massive extent of the Permian Basinits significant size, coupled with the presence of multiple prospective geologic benches renderand other favorable characteristics, the Permian Basin has become widely recognized as the most attractive and economic oil resource in North America.The recent recovery of oil prices to the low $50 per barrel range has driven a considerable increase in Permian drilling and completion activity and associated demand for our services. Today, the Permian Basin is the most active onshore basin in North America, with over 291 active rigs, and accounts for approximately 51% of all oil-directed rigs in the United States. Current Permian production levels exceed the combined output of both the Bakken and Eagle Ford shale formations, and, given the Permian Basin's superior breakeven economics, which are estimated by Rystad Energy to be as low as $32 per barrel, we expect robust activity levels in the basin for the foreseeable future.Basin'sBasin’s Midland sub-basin, wheresub‑basin in support of our customers have historically operated.customers’ core operations. More recently, however, many of our customers (including Callon Petroleum, Diamondback Energy, Parsley Energy, RSP Permian and XTO Energy) have made sizeable acquisitions in the Delaware Basin. We anticipate that many of these customers will request our services in the Delaware Basin to help develop their acreage, and we believe that we are uniquely positioned to capture a large addressable growth opportunity as the basin develops. For the foreseeable future, we expect both the Midland Basin and the Delaware Basin to continue to command a disproportionate share of future North American E&P spending.•levels.levels. The combination of an expanding Permian Basin horizontal rig count and more complex well completions has a compounding effect on HHP demand growth. Horizontal drilling has become the default method for E&P operators to most economically extract unconventional resources, and the number of horizontal rigs has increased from 22% of the total Permian Basin rig count in December 2011 to over 80% of the Permian Basin rig count in January 2017. As the horizontal rig count has grown, well completion intensity levels have also increased as a result of longer wellbore lateral lengths, more fracturing stages per foot of lateral and increasing amounts of proppant per stage. Furthermore, the ongoing improvement in drilling and completion efficiencies, driven by innovations such as multi-wellmulti‑well pads and zipper fracs, have further increased the demand for HHP. Taken together, these demand drivers have helped contribute to the full utilization of our fleet and leave us well•high-quality,high‑quality, Permian Basin-focusedBasin‑focused customers. Our deep local roots, operational expertise and commitment to safe and reliable service have allowed us to cultivate longstanding customer relationships with the most active and well-capitalized Permianwell‑capitalized Penman Basin operators. Our diverse customer base is comprised of market leaders such as Callon Petroleum, Diamondback Energy, Parsley Energy, Pioneer Naturalrates.rates over time. As our customers increase activity levels, we expect to continue to leverage these strong relationships to keep our fleet fully utilized and selectively expand our platform in response to specific customer demand.• well-maintained equipment., well‑maintained equipment We have a large, homogenous fleet of modernmodem equipment that is configured to handle the Permian Basin'sBasin’s most complex, highest-intensity,highest‑intensity, hydraulic fracturing jobs. We believe that our fleet design is a key competitive advantage compared to many of our competitors who have fracturing units that are not optimized for Permian Basin conditions. Our fleet is largely standardized across units to facilitate efficient maintenance and repair, reducing equipment downtime and improving labor efficiency. Importantly, we have fully maintained our fleet throughout the recent industry downturn to ensure optimal performance and reliability. In contrast, we believe many of our competitors have deferred necessary maintenance capital spending and cannibalized essential equipment for spare parts during the same period. Furthermore, our entrenched relationships with a variety of key suppliers and vendors provide us with the reliable access to the equipment necessary to support our continued organic growth strategy.•cross-cyclecross‑cycle financial performance. Over the past several years, we have maintained relatively high cross-cyclecross‑cycle fleet utilization rates. Since September 2016, our fleet has been 100% utilized, and for each of the years ended December 31, 2015 and 2016 and the quarter ended June 30, 2017, we operated in excess of 65% utilization. Our consistent track record of steady organic growth, coupled with our ability to immediately deploy new HHP on a dedicated and fully utilized basis, has resulted in revenue growth across industry cycles. We believe that we will be able to grow faster than our competitors while preserving attractive EBITDA margins as a result of our differentiated service offerings and a robust backlog of demand for our services. Furthermore, we believe that our philosophy of maintaining modest financial leverage and a healthy balance sheet has left us more conservatively capitalized than our peers. Several of our customers have recently requested additional HHP capacity from us, and we expect that improving market fundamentals, our superior execution and our customer-focusedcustomer‑focused approach should result in enhanced financial performance going forward.•theour company with a portion of our original investment capital. We believe their track record of successfully building premier oilfield service companies in the Permian Basin, as well as their deep roots and relationships throughout the West Texas community, provide a meaningful competitive advantage for our business. In addition, our management team has assembled a loyal group of highly-manager-levelmanager‑level turnover in our core service divisions over the past three years. We employ a balanced decision-makingdecision‑making structure that empowers managerial and field personnel to work directly with customers to develop solutions while leveraging senior management'smanagement’s oversight. This collaborative approach fosters strong customer links at all levels of the organization and effectively institutionalizes customer relationships beyond the executive suite. We promote a "Safety First"“Safety First” culture, which has led to a Total Recordable Incident Rate, or TRIR, well below industry averages. For example, for the year ended December 31, 2016, we had a TRIR of 0.9, compared to a peer average of 2.5 for the year ended December 31, 2014.•Basin-focusedBasin‑focused hydraulic fracturing business, as we believe the Permian Basin hydraulic fracturing market offers supportive long-termlong‑term growth fundamentals. These fundamentals are characterized by increased demand for our HHP, driven by increasing drilling activity and well completion intensity levels, along with underinvestment by our competitors in their equipment. In response to the current commodity price environment, a number of our customers have publicly announced their intention to increase 2017 capital budgets in the Permian Basin in excess of 50% over 2016 levels. We are currently operating at 100% utilization, and several of our customers have requested additional HHP capacity from us. As our customers continue to develop their assets in the Midland Basin and Delaware Basin, we believe we are strategically positioned to deploy additional hydraulic fracturing equipment in support of their ongoing needs. We have purchased twoFurther, three additional hydraulic fracturing units which are scheduled for delivery and deployment to dedicated customers in April and June 2017, respectively.the second half of 2017. These units will provide us with an additional 90,000135,000 HHP, bringing our total capacity to 510,000690,000 HHP. Additionally, we expect to use the proceeds from this offering to purchase two additional units that will be deployed in 2017 to meet specific customer requests, giving us an additional 90,000 HHP, or 600,000 HHP in the aggregate, once all units have been received.•(as opposed(with approximately 90% of our fleet currently operating on such a schedule, as compared to 2014, when the majority of our work wasservices were provided during daylight hour operations)hours) should result in greater revenue opportunity and enhanced margins as fixed costs are spread over a broader revenue base. We believe that any incremental future fleet additions will benefit from these trends and associated economies of scale.•Cross-sellCross‑sell our complementary services. In addition to our hydraulic fracturing services, we offer a broad range of complementary services in support of our customers'customers’ development activities, including cementing, acidizing, coiled tubing, flowback services and surface air drilling. These complementary services create operational efficiencies for our customers, and allow us to capture a greater percentage of their capital spending across the lifecycle of an unconventional well. We believe that, as our customers increase spending levels, we are well positioned to continue cross-sellingcross‑selling and growing our complementary service offerings.Table of Contents•long-term,long‑term, dedicated basis in response to inbound customer requests. We will also selectively evaluate potential strategic acquisitions that increase our scale and capabilities or diversify our operations. At the closing of this offering, we will have no outstanding debt and expect to have a net cash position and $ million of available liquidity, in the form of cash on hand and undrawn borrowing capacity under our $ million revolving credit facility, to support our growth ambitions.61%58% and 53% of our revenue, for the nine months ended September 30, 2016 and the yearyears ended December 31, 2016 and 2015,America'sAmerica’s energy infrastructure. Energy Capital Partners has significant energy and financial expertise to complement its investment in us, including investments in power generation, midstream oil and gas, oilfield services, environmental infrastructure and energy services sectors.companies'companies’ criteria in choosing a service provider. While we seek to price our services competitively, we believe many of our customers elect to work with us based on our deep local roots, operational expertise, equipment'sequipment’s ability to handle the most complex Permian Basin well completions, and commitment to safety and reliability.Patterson-UTIPatterson‑UTI Energy Inc., RPC, Inc., Schlumberger, Superior Energy Services and a number of locally oriented businesses.customers'customers’ annual capital expenditure budgets, the holidays and inclement winter weather during which we may experience declines in our operating results.workers'workers’ compensation and other forms of insurance, and could have other material adverse effects on our financial condition and results of operations.workers'workers’ compensation, business auto, commercial property, umbrella liability, in certain instances, excess liability, and directors and officers insurance policies providing coverages of risks and amounts that we believe to be customary in our industry. Further, we have pollution legal liability coverage for our business entities, which would cover, among other things, third party liability and costs of clean-upclean‑up relating to environmental contamination on our premises while our equipment are in transit and while on our customers'customers’ job site. With respect to our hydraulic fracturing operations, coverage would be available under our pollution legal liability policy for any surface or subsurface environmental clean-upclean‑up and liability to third parties arising from any surface or subsurface contamination. We also have certain specific coverages for some of our businesses, including for our hydraulic fracturing services."Risk Factors"“Risk Factors” for a description of certain risks associated with our insurance policies.non-compliance.non‑compliance. These laws and regulations may, for example, restrict the types, quantities and concentrations of various substances that can be released into the environment, limit or prohibit construction or drilling activities on certain lands lying within wilderness, wetlands, ecologically or seismically sensitive areas and other protected areas, or require action to prevent or remediate pollution from current or former operations. Moreover, it is not uncommon for neighboring landowners and other third parties to file claims for personal injury and property damage allegedly caused by the release of hazardous substances, hydrocarbons or other waste products into the environment. Changes in environmental, health and safety laws and regulations occur frequently, and any changes that result in more stringent and costly requirements could materially adversely affect our operations and financial position. We have not experienced any material adverse effect from compliance with these requirements. This trend, however, may not continue in the future.customers'customers’ operations are subject to similar laws and regulations. Any material adverse effect of these laws and regulations on our customers operations and financial position may also have an indirect material adverse effect on our operations and financial position.("RCRA"(“RCRA”) and comparable state laws and regulations, which affect our activities by imposing requirements regarding the generation, transportation, treatment, storage, disposal and cleanup of hazardous and non-hazardousnon‑hazardous wastes. With federal approval, the individual states administer some or all of the"solid wastes"“solid wastes” that are subject to the less stringent requirements of non-hazardousnon‑hazardous waste provisions.non-hazardousnon‑hazardous wastes or recategorize some non-hazardousnon‑hazardous wastes as hazardous for future regulation. Indeed, legislation has been proposed from time to time in Congress to recategorize certain oil and natural gas exploration, development and production wastes as hazardous wastes. Several environmental organizations have also petitioned the EPA to modify existing regulations to recategorize certain oil and natural gas exploration, development and production wastes as hazardous. Any such changes in these laws and regulations could have a material adverse effect on our capital expenditures and operating expenses. Although we do not believe the current costs of managing our wastes, as presently classified, to be significant, any legislative or regulatory reclassification of oil and natural gas exploration and production wastes could increase our costs to manage and dispose of such wastes.("CERCLA"(“CERCLA” or "Superfund"“Superfund”) and analogous state laws generally impose liability without regard to fault or legality of the original conduct, on classes of persons who are considered to be responsible for the release of a hazardous substance into the environment. These persons include the current owner or operator of a contaminated facility, a former owner or operator of the facility at the time of contamination and those persons that disposed or arranged for the disposal of the hazardous substance at the facility. Liability for the costs of removing or remediating previously disposed wastes or contamination, damages to natural resources, the costs of conducting certain health studies, amongst other things, is strict and joint and several. In addition, it is not uncommon for neighboring landowners and other third parties to file claims for personal injury and property damage allegedly caused by the hazardous substances released into the environment. In the course of our operations, we use materials that, if released, would be subject to CERCLA and comparable state laws. Therefore, governmental agencies or third parties may seek to hold us responsible under CERCLA and comparable state statutes for all or part of the costs to clean up sites at which such hazardous substances have been released.site'ssite’s soil and groundwater is contaminated with chromium and hexavalent chromium as a result of historic site operations unaffiliated with the Company and unassociated with the Company'sCompany’s operations. Toxic tort claims also have been asserted as a result of this groundwater contamination against various unaffiliated parties. In 2013, in order to reduce the Company'sCompany’s risk of incurring any future liabilities in connection with this site, the Company negotiated and obtained a bona fide prospective purchaser ("BFPP"(“BFPP”) letter from EPA Region 6 in connection with a reorganization of the facility site ownership and lease. The BFPP letter generally acknowledges and provides that the Company is unaffiliated with any potentially responsible parties or known contamination that is the subject of the Superfund action, the Company agrees to comply with any future land use restrictions that may be imposed in connection with a site remedy (none have been imposed to date), and the Company agrees to cooperate with and provide access and assistance to EPA Region 6 in connection with the remediation. In exchange for these undertakings, the Company will not be subject to any CERCLA action by the EPA. In addition, the Company separately obtained a 10-year10‑year environmental pollution legal liability insurance policy, effective March 4, 2013, with an aggregate limit of $20 million to insure against potential third-partythird‑party claims and any known or unknown pre-existingpre‑existing conditions at the site, including Superfund or toxic tort liabilities. Both prior to and since obtaining the BFPP letter and the insurance policy, no claims have been made or threatened against the Company or any of its affiliated persons or entities with regard to this Superfund site or any related liabilities, and the Company has not incurred any significant expenses in connection with this matter.("NORM"(“NORM”) associated with oil and gas deposits and, accordingly may result in the generation of wastes and other materials containing NORM. NORM exhibiting levels of naturally occurring radiation in excess("CAA"(“CAA”) and comparable state laws and regulations, regulate emissions of various air pollutants through the issuance of permits and the imposition of other emissions control requirements. The EPA has developed, and continues to develop, stringent regulations governing emissions of air pollutants from specified sources. New facilities may be required to obtain permits before work can begin, and existing facilities may be required to obtain additional permits and incur capital costs in order to remain in compliance. These and other laws and regulations may increase the costs of compliance for some facilities where we operate. Obtaining or renewing permits also has the potential to delay the development of oil and natural gas projects.greenhouse gases ("GHG")GHGs present an endangerment to public health and the environment because such gases contribute to warming of the earth'searth’s atmosphere and other climatic changes. Based on these findings, the EPA has adopted and implemented, and continues to adopt and implement, regulations that restrict emissions of GHGs under existing provisions of the CAA. The EPA also requires the annual reporting of GHG emissions from certain large sources of GHG emissions in the United States, including certain oil and gas production facilities. The U.S. Congress has from time to time considered adopting legislation to reduce emissions of GHGs and almost one-halfone‑half of the states have already taken legal measures to reduce emissions of GHGs primarily through the planned development of GHG emission inventories and/or regional GHG cap and trade programs. And in December 2015, the United States joined the international community at the 21st Conference of the Parties of the United Nations Framework Convention on Climate Change in Paris, France. The resulting Paris Agreement calls for the parties to undertake "ambitious efforts"“ambitious efforts” to limit the average global temperature, and to conserve and enhance sinks and reservoirs of greenhouse gases. The Paris Agreement entered into force in November 2016. On June 1, 2017, President Trump announced that the United States planned to withdraw from the Paris Agreement and to seek negotiations either to reenter the Paris Agreement on different terms or establish a new framework agreement. The Paris Agreement provides for a four‑year exit process beginning when it took effect in November 2016, which would result in an effective exit date of November 2020. The United States’ adherence to the exit process is uncertain and/or the terms on which the United States is one of over 70 nations that has ratifiedmay reenter the Paris Agreement or otherwise indicated that it intends to comply with the agreement. Restrictions on emissions of GHGs that may be imposed could adversely affect the oil and natural gas industry by reducing demand for hydrocarbons and by making it more expensive to develop and produce hydrocarbons, either of which could have a material adverse effect on future demand for our services.separately negotiated agreement are unclear at this time.("ESA"(“ESA”) and analogous state laws may impact exploration, development and production activities in areas where we operate. The ESA provides broad protection for species of fish, wildlife and plants that are listed as threatened or endangered. Similar protections are offered to migratory birds under the Migratory Bird Treaty Act and various state analogs. The U.S. Fish and Wildlife Service may identify previously unidentified endangered or threatened species or may designate critical habitat and suitable habitat areas that it believes are necessary for survival of a threatened or endangered species, which could cause us or our customers to incur additional costs or become subject to operating restrictions or operating bans in the affected areas."underground injection"“underground injection” and require federal permitting and regulatory control of hydraulic fracturing, as well as legislative proposals to require disclosure of the chemical constituents of the fluids used in the fracturing process, have been proposed in recent sessions of Congress. Several states and local jurisdictions in which we or our customers operate also have adopted or are considering adopting regulations that could restrict or prohibit hydraulic fracturing in certain circumstances, impose more stringent operating standards and/or require the disclosure of the composition of hydraulic fracturing fluids."water cycle"“water cycle” activities associated with hydraulic fracturing may impact drinking water resources under certain circumstances such as water withdrawals for fracturing in times or areas of low water availability, surface spills during the management of fracturing fluids, chemicals or produced water, injection of fracturing fluids into wells with inadequate mechanical integrity, injection of fracturing fluids directly into groundwater resources, discharge of inadequately treated fracturing wastewater to surface waters, and disposal or storage of fracturing wastewater in unlined pits. The results of these studies could lead federal and state governments and agencies to develop and implement additional regulations.("OSHA"(“OSHA”) and comparable state statutes regulate the protection of the health and safety of workers. In addition, the OSHA hazard communication standard requires that information be maintained about hazardous materials used or produced in operations and that this information be provided to employees, state and local government authorities and the public.SeptemberJune 30, 2016,2017, we employed 596842 people. None of our employees are represented by labor unions or subject to collective bargaining agreements.December 15, 2016. Age Position with ProPetro Holding Corp. 56 Chief Executive Officer and Director 60 Chief Operating Officer 5758 Chief Financial Officer 38 General Counsel and Corporate Secretary Ian Denholm 29 Chief Accounting Officer Spencer D. Armour, III 63 62Chairman of the Board of Directors Steven Beal 58 Director 43 Director 73 Director 3031 Director L. Labbat 52 51Director Alan E. Douglas 58 Director Christopher Leininger 48 Director Jack B. Moore 63 Director co-founderco‑founder of ProPetro and has been Chief Executive Officer since 2008, and he has been a Directormember of our board of directors since 2005. Mr. Redman has over 32 years of executive and entrepreneurial experience in the energy services industry. He was a co-founderco‑founder and Chief Executive Officer of Downhole Injection Systems, LLC, which was sold in 2004. Prior to that, Mr. Redman was President and CEO of Reef Chemical Company from 1993 to 1998. Mr. Redman received a B.B.A. in Finance from Texas Tech University. We believe that Mr. Redman'sRedman’s industry experience and deep knowledge of our business and our customers makes him well suited to serve as Chief Executive Officer and director.—‑ Drilling for Basic Energy Services from 2007 to 2009. Mr. Sledge was President and Chief Operating Officer of Sledge Drilling Corp., which was sold to Basic Energy Services in 2007. Mr. Sledge received a B.B.A. in Management from Baylor University. We believe Mr. Sledge'sSledge’s experience in the oilfield services business, combined with his executive management experience, makes him well suited to serve as our Chief Operating Officer.co-founderco‑founder of ProPetro and has been our Chief Financial Officer since 2005. Mr. Smith has over 33 years of accounting and financial experience. Prior to joining the Company, Mr. Smith served asSmith'sSmith’s extensive experience in accounting and finance, and history in the energy services industry, makes him well suited to serve as our Chief Financial Officer.
Mark HowellTableContentsa directorchairman of ProPetroour board of directors since February 2013. Mr. Armour has over 30 years of executive and entrepreneurial experience in the energy services industry. Mr. Armour currently serves as President of PT Petroleum LLC in Midland, Texas. He was the Vice President of Corporate Development for Basic Energy Services, Inc. from 2007 to 2008, which acquired Sledge Drilling Corp., a company Mr. Armour co-foundedco‑founded and served as Chief Executive Officer for from 2005 to 2006. From 1998 through 2005, he served as Executive Vice President of Patterson-UTIPatterson‑UTI Energy, Inc., which acquired Lone Star Mud, Inc., a company Mr. Armour founded and served as President for from 1986 to 1997. He also served on the Patterson —‑ UTI Board of Directors from 1999 through 2001. Mr. Armour received a B.S. in Economics from the University of Houston in 1977 and was appointed to the University of Houston System Board of Regents in 2011 by former Texas Governor, Rick Perry. We believe that Mr. Armour'sArmour’s extensive experience in the energy services industry and his deep knowledge of the industry dynamics within the Permian Basin make him well suited to serve as a director.directormember of ProPetroour board of directors since March 2013. Mr. Coppedge is a Partner at Energy Capital Partners where he has worked since 2005. Mr. Coppedge has over 20 years of experience in energy industry finance and investment activities, with a particular emphasis on oil field services, midstream oil and gas and renewable power generation. Prior to joining Energy Capital in 2005, Mr. Coppedge spent over six years at JP Morgan. In addition to ProPetro, Mr. Coppedge currently serves on the boards of STEAG-SCRCIG Logistics, STEAG‑SCR Tech, Terra-Gen,Terra‑Gen, LLC and USD Partners LP and as an observer to NCSG Crane & Heavy Haul Corporation. Mr. Coppedge also served on the board of FirstLight Power Enterprises, Inc. Mr. Coppedge received a B.A. in history from Middlebury College and an M.B.A. in finance from the Wharton School at the University of Pennsylvania. Mr. Coppedge was selected to serve as a Directordirector on the board due to his affiliation with Energy Capital Partners and his extensive experience inacross the finance industry and his history in the energy services industry.directormember of ProPetroour board of directors since March 2013. Mr. Herman has served as a Managing Director at Energy Capital Partners since 2005. Mr. Herman has over 43 years of energy industry experience, with a particular emphasis on renewable and fossil generation and environmental and oil field services. Prior to joining Energy Capital Partners in 2005, Mr. Herman was Senior Energy Counsel for Goldman Sachs. Mr. Herman was also the Senior Vice President and General Counsel of PG&E National Energy Group and its predecessor, U.S. Generating Company. Mr. Herman was also previously a Partner at Latham & Watkins LLP and Kirkland & Ellis.Ellis LLP. Mr. Herman currently serves on the boards of ADA Carbon Solutions LLC, STEAG-SCRSTEAG‑SCR Tech, EnergySolutions, Inc. and Granite Holdings, Inc. (the parent company of Wheelabrator Technologies, Inc.). Mr. Herman has also served on the boards of FirstLight Resources Inc., NextLight Renewable Power, LLC, PLH Group, Inc., Power Holdings of Illinois, LLC and Ice Energy, Inc. Mr. Herman received a B.S. in Economics from the Wharton School of Finance and Commerce at the University of Pennsylvania and an LL.B. from the University of Virginia Law School. Mr. Herman was selected to serve as a director on the board due to his affiliation with Energy Capital Partners, his extensive experience in the law and finance, and his history in the energy industry.directormember of ProPetroour board of directors since October 2016 and was appointed to the board in connection with his affiliation with Energy Capital Partners. Mr. Himler has served asis a Vice President at Energy Capital Partners, where he has worked since 2012. Mr. Himler has over 7seven years of experience in energy industry investment and finance activities. In addition to ProPetro, Mr. Himler serves on the board of NESCO Holdings LP and is an observer to NCSG Crane and Heavy Haul Corporation. Prior to joining Energy Capital Partners in 2012, Mr. Himler was an analyst at Lazard FrèresFreres & Co. Mr. Himler received a B.A. in Economics and Political Science from Amherst College. Mr. Himler was selected to serve as a director on the board due to his affiliation with Energy Capital Partners and his experience in investment activities within the oilfield and energy services sectors.L. Labbat L. Labbat has served as a directormember of ProPetroour board of directors since March 2013 and was appointed to the board in connection with his affiliation with Energy Capital Partners. Mr. Labbat has served as a Partner of Energy Capital Partners since 2006. Mr. Labbat has over 27 years of financial and investment experience and specializes in the energy and power sectors. Prior to joining Energy Capital Partners in 2006, Mr. Labbat was a Managing Director at Goldman, Sachs & Co.&Co. He currently serves on the boards of ADA Carbon Solutions, LLC, Chieftain Sand and Proppant, LLC, Next Wave Energy Partners, LP, Sendero Midstream Partners, LP and Summit Midstream Partners,StatusControlled Company Because Energy Capital Partners will beneficially own a majoritymember of our outstanding common stock following the completion of this offering, we expect to be a controlled company under NYSE corporate governance standards. A controlled company need not comply with the applicable corporate governance rules that require its board of directors to have a majority of independent directors and independent compensation and nominating and governance committees. Notwithstanding our status as a controlled company, we will remain subject to the applicable corporate governance standard that requires us to have an audit committee composed entirely of independent directors. As a result, we must have at least one independent director on our audit committee by the date our common stock is listed on the NYSE, a majority of independent directors on our audit committee within 90 days of the listing date and all independent directors on our audit committee within one year of the listing date. If at any time we cease to be a controlled company, we will take all action necessary to comply with NYSE listing rules, including appointing a majority of independent directors to our board of directors since March 2017 and ensuring we havewas appointed to the board in connection with our IPO. Mr. Douglas is a compensation committeeshareholder of Johnson, Miller & Co. where he has worked for 25 years. Mr. Douglas is a Certified Public Accountant with over 37 years of experience in accounting and audit activities. Prior to joining Johnson, Miller & Co., Mr. Douglas was a nominating and corporate governance committee composed entirely of independent directors, subjectCertified Public Accountant at KPMG for twelve years. Mr. Douglas received a B.B.A. in accounting from Texas Tech University. Mr. Douglas was selected to a permitted "phase-in" period. We will cease to qualifyserve as a controlled company oncedirector on the board due to his extensive experience with accounting and auditing activities.ceaseswhere he has worked since 2006. Mr. Leininger has over 17 years of experience in legal and finance activities in the energy industry. Mr. Leininger currently serves on the boards of Wheelabrator Technologies, Inc., NESCO Holdings, LP, EnergySolutions, Inc. and PLH Group, Inc. Prior to controljoining Energy Capital Partners, Mr. Leininger was an associate at Latham & Watkins LLP for 7 years. Mr. Leininger received a majorityB.A. in History and Political Science from the University of San Diego and a J.D. from the University of Virginia School of Law. Mr. Leininger was selected to serve as a director on the board due to his affiliation with Energy Capital Partners and his experience in financing, acquisition and development transactions.voting stock. Upon completion of this offering, ourwill consistconsists of ten directors, five of whom will satisfy the independence requirements of the Exchange Actwhich were designated by Energy Capital Partners. See “Certain Relationships and NYSE listing standards.certificate of incorporation providesbylaws provide that the terms of office of the directors are one year from the time of their election until the next annual meeting of shareholders or until their successors are duly elected and qualified.generally be not less than nor more than , andsubject to the exact numberprovisions of directors willthe stockholders agreement, be fixed from time to time exclusively by the board of directors pursuant to a resolution adopted by a majority of the whole board. In addition, our certificate of incorporation and our bylaws provide that, in general, vacancies on the board may be filled by a majority of directors in office, although less than a quorum.will establishhas established an audit committee in connection with this offering whose functions include the following:•accountant'saccountant’s qualifications and independence and our accounting and financial reporting processes of and the audits of our financial statements;••non-auditnon‑audit services to be performed by the independent accountants;•will beare set forth in the audit committee charter. Upon completion of this offering, ourOur audit committee will consistis comprised of directors who satisfy the independence requirements of the Exchange ActSteven Beal, Alan E. Douglas and NYSE listing standards,Jack B. Moore, each of whom will qualify as an audit committee financial expert as defined under these rulesis independent and listing standards, and of whom will satisfysatisfies the financial literacy standards for audit committee members under the Exchange Act and NYSE listing standards. Within one year after completionEach of the offering, we expect that our auditSteven Beal and Jack B. Moore qualifies as an “audit committee will be composed of three members that will satisfy the independence requirements of the Exchange Act and listing standards. Because we are considered to be controlled by Energy Capital Partners under NYSE rules, we are eligible for exemptions from provisions of these rules requiringmajority of independent directors, nominating and corporate governance and compensation committees composed entirely of independent directors and written charters addressing specified matters. We may elect to take advantage of these exemptions. In the event that we cease to be a controlled company within the meaning of these rules, we will be required to comply with these provisions after the specified transition periods. Although we will be eligible for an exemption from thestanding compensation committee requirements under NYSE rules, we intend to establish a compensation committee composed of at least independent directors in connection with this offering.Compensation Committee Our compensation committee will be comprised of .Spencer D. Armour, III, Jack B. Moore and Alan E. Douglas. This committee will establishestablishes salaries, incentives and other forms of compensation for officers and directors. The compensation committee will also administeradministers our long-termlong‑term incentive plan.will beis comprised of .Schuyler E. Coppedge, Alan E. Douglas and Jack B. Moore, of whom Messrs. Moore and Douglas satisfy the independence requirements of the Exchange Act and NYSE listing standards. The nominating and corporate governance committee is responsible for making recommendations to the board of directors regarding candidates for directorships and the size and composition of the board. In addition, the nominating and corporate governance committee is responsible for overseeing our corporate governance guidelines and reporting and making recommendations to the board concerning corporate governance matters. will provide that the board of directors is responsible for reviewing the process for assessing the major risks facing us and the options for their mitigation. This responsibility will beis largely satisfied by our audit committee, which is responsible for reviewing and discussing with management and our independent registered public accounting firm our major risk exposures and the policies management has implemented to monitor such exposures, including our financial risk exposures and risk management policies."2016“2016 Summary Compensation Table"Table” below. In 2016, our "named“named executive officers"officers” and their positions were as follows:•••forward-lookingforward‑looking statements that are based on our current plans, considerations, expectations and determinations regarding future compensation programs. Actual compensation programs that we adopt following the completion of this offering may differ materially from the currently planned programs summarized in this discussion. Year Salary
($) Bonus
($) Option awards
($) All Other
Compensation
($)(2) Total 2016 250,000 750,000 885,478 (1) 10,800 1,896,278 2015 250,000 — — 10,800 260,800 2016 250,000 500,000 549,028 (1) 10,800 1,309,828 2015 250,000 — — 10,800 260,800 2016 250,000 500,000 407,869 (1) 10,800 1,168,669 2015 250,000 — — 10,800 260,800 (1)All option awards granted to any named executive officer have been valued based on the fair value of the option awards at the grant dates computed in accordance with FASB ASC 718, and do not represent amounts realized by the named executive officers. We provide information regarding the assumptions used to calculate the value of all option awards granted in 2016 in Note 14 to our audited consolidated financial statements included elsewhere in this prospectus.(2)This column shows the amounts that Messrs. Redman, Smith and Sledge each received in 2015 and 2016 pursuant to our Vehicle Allowance Program.Name and Principal Position Year Salary
($) Bonus
($) Option awards
($)
Compensation
($)(2) Total ($) Dale Redman 2016 250,000 750,000 10,800 1,896,278 Chief Executive Officer 2015 250,000 — — 10,800 260,800 Jeffrey Smith 2016 250,000 500,000 10,800 1,309,828 Chief Financial Officer 2015 250,000 — — 10,800 260,800 David Sledge 2016 250,000 500,000 10,800 1,168,669 Chief Operating Officer 2015 250,000 — — 10,800 260,800 (1) All option awards granted to any named executive officer have been valued based on the fair value of the option awards at the grant dates computed in accordance with FASB ASC 718, and do not represent amounts realized by the named executive officers. We provide information regarding the assumptions used to calculate the value of all option awards granted in 2016 in Note 14 to our audited consolidated financial statements included elsewhere in this prospectus. (2) This column shows the amounts that Messrs. Redman, Smith and Sledge each received in 2015 and 2016 pursuant to our Vehicle Allowance Program. executive'sexecutive’s skill set, experience, role and responsibilities. Each named executive officer'sofficer’s initial base salary was provided in his employment agreement. There were no changes in the base salaries of any of the named executive officers in 2016.482,657699,852 shares of our common stock to each of our named executive officers. Each such stock option has a $5.73$3.96 per share exercise price. Such stock options are scheduled to vest in equal annual installments over four years from the date of the grant. The vesting of the stock options is subject to acceleration upon a change of control of the Company if the participant remains employed by the Company. A change of control does not include an initial public offering, and therefore a change of control did not occur in connection with our IPO and will not occur in connection with this offering.256,783372,335 restricted stock units on September 30, 2013 pursuant to a stand-alonestand‑alone restricted stock unit agreement, which restricted stock units are not subject to the 2013 Stock Option Plan or any equity plan. Each restricted stock unit represents the right to receive one share of common stock of the Company. Pursuant to their original terms, the restricted stock units would only be settled upon a change of control of the Company, whether or not Mr. Redman is an employee, consultant or director on such date. As defined in the agreement, a change of control does not include an initial public offering, and therefore a change of control did not occur in connection with our IPO and will not occur in connection with this offering. In connection with this offering,our IPO, we intend to terminateterminated and will liquidate, in accordance with Section 409A of the Code, (i) Mr. Redman'sRedman’s restricted stock units and (ii) stock options granted to various employees other than the named executive officers on December 1, 2013 (but not the stock options granted to our named executive officers in June 2013 as described above). Subject to approval by our board of directors, we will provide Mr. Redman with the 256,783372,335 shares of our common stock subject to his restricted stock units on the first anniversary of thisour initial public offering. Additionally, we will pay each employee who received an option on December 1, 2013, in exchange for his or her terminated stock option, a cash amount equal to (a) the excess, if any, of the (a)(1) initial public offeringIPO price per share of our common stock, or $14.00, over (2) $5.73$3.96 (the per share exercise price of such option) multiplied by (b) the number of shares of common stock subject to such option, with 50% of such payment payable on the first anniversary of this offeringour IPO and the remaining 50% of such payment payable on the second anniversary of this offering,our IPO, subject to such employee'semployee’s continued employment with us through each applicable payment date. Any such employee whose employment is terminated by us without cause (as determined by our board of directors) prior to the second anniversary of this offeringour IPO will remain entitled to his or her option cancellation payments on the applicable anniversaries.Partners'Partners’ equity contribution to the Company on June 8, 2016. The options were also granted to reward the named executive officers'officers’ past contributions to the companyCompany and expected future contributions. This 2016 grant included options to purchase 345,890501,540 shares of our common stock granted to Mr. Redman, options to purchase 214,463310,971 shares of our common stock granted to Mr. Smith and options to purchase 159,324231,019 shares of our common stock granted to Mr. Sledge. All of these 2016 options have a $3.26$2.25 per share exercise price. Such stock options are scheduled to vest in five equal semi-annualsemi‑annual installments starting on December 31, 2016. The vesting of the stock options is subjecta publican offering and so, for purposes of the stock options, did not occur in connection with our IPO and will not occur in connection with this offering. In connection with this offering,our IPO, however, we intend to fully accelerateaccelerated the vesting of the unvested portion of Messrs. Redman, Smith and Sledge'sSledge’s 2016 options. Prior to effective date of this offering, we intend to adopt a 2017 Incentive Award Plan in order to facilitate the grant of cash and equity incentives to directors, employees (including our named executive officers) and consultants of ourlong-termlong‑term success. We expect that the 2017 Incentive Award Plan will be effective on the date on which it is adopted by our board of directors, subject to approval of such plan by our current shareholders. For additional information about the 2017 Incentive Award Plan, please see the section titled "Equity“Equity Incentive Plans"Plans” below.Name Number of
Stock OptionsDale Redman 119,988 Jeffrey Smith 119,988 David Sledge 119,988 full-timefull‑time employees, but currently do not participate in the 401(k) plan. The Internal Revenue Code, or the Code, allows eligible employees to defer a portion of their compensation, within prescribed limits, on a pre-taxpre‑tax basis through contributions to the 401(k) plan. Currently, we match contributions made by participants in the 401(k) plan up to a specified percentage of the employee contributions and we may make certain discretionary profit sharing contributions. Both the matching contributions and the profit sharing contributions vest in equal installments over five years of service, with full vesting on retirement, death or disability. We believe that offering a vehicle for tax-deferredtax‑deferred retirement savings though our 401(k) plan, and making matching contributions and profit sharing contributions that vest over time, add to the overall desirability of our executive compensation package and further incentivize our employees in accordance with our compensation policies. We do not maintain any defined benefit pension plans or deferred compensation plans.Plans.Plans. All of our full-timefull‑time employees, including our named executive officers, are eligible to participate in our health and welfare plans, including:•••short-termlong-termlong‑term disability insurance; and•Program.Program. In addition, our named executive officers each participate in a vehicle allowance program.Gross-Upsgross-upgross‑up payments to cover our named executive officers'officers’ personal income taxes that may pertain to any of the compensation or perquisites paid or provided by our company.two-yeartwo‑year term and automatically renew for successive one-yearone‑year terms unless either party gives notice of non-extensionnon‑extension to the other no later than 90 days prior to the expiration of the then-applicablethen‑applicable term.executive'sexecutive’s annual base salary, based upon individual and Company annual performance targets established by the Board in its sole discretion. The employment agreements also provided for the executives'executives’ initial stock option grants. "Cause"executive'sexecutive’s willful failure to substantially perform his duties, (ii) the executive'sexecutive’s willful failure to carry out, or comply with, in any material respect any lawful directive of the Board,our board of directors, (iii) the executive'sexecutive’s commission at any time of any act or omission that results in, or may reasonably be expected to result in, a conviction, a plea of no contest, plea of nolo contendere or imposition of unadjudicated probation for any felony or crime involving moral turpitude; (iv) the executive'sexecutive’s unlawful use (including being under the influence) or possession of illegal drugs on the Company'sCompany’s premises or while performing the executive'sexecutive’s duties and responsibilities; (v) the executive'sexecutive’s commission at any time of any act of fraud, embezzlement, misappropriation, misconduct, conversion of assets of the Company or breach of fiduciary duty against the Company or (vi) the executive'sexecutive’s material breach of the employment agreement or any other agreement with the Company, subject to certain procedural requirements. "Good Reason"executive'sexecutive’s authority, duties or responsibilities, (ii) a material diminution in base compensation or (iii) any other action or inaction that constitutes a material breach of the employment agreement by the Company, in each case subject to certain procedural requirements.Year-End Option Awards Stock Awards Number of
Securities
Underlying
Unexercised
Options (#)
Exercisable Number of
Securities
Underlying
Unexercised
Options (#)
Unexercisable Option
Exercise
Price ($) Option
Expiration
Date Number of
Shares or
Units of Stock
That Have Not
Vested (#) Market Value
of Shares or
Units of Stock
That Have Not
Vested ($)(4) 361,993 (1) 120,664 5.73 6/14/2023 — — — — — — 256,783 (3) 3,723,354 69,178 (2) 276,712 3.26 7/19/2026 — — 361,993 (1) 120,664 5.73 6/14/2023 — — 42,893 (2) 171,570 3.26 7/19/2026 — — 361,993 (1) 120,664 5.73 6/14/2023 — — 31,865 (2) 127,459 3.26 7/19/2026 — — (1)On June 14, 2013, Messrs. Redman, Smith and Sledge were each granted 482,657 options to purchase our common stock that vest in equal annual installments on June 14, 2014, June 14, 2015, June 14, 2016 and June 14, 2017.(2)On July 19, 2016, Mr. Redman was granted 345,890 options to purchase our common stock, Mr. Smith was granted 214,463 options to purchase our common stock, and Mr. Sledge was granted 159,324 options to purchase our common stock. These grants are currently scheduled to vest in equal installments on December 31, 2016, June 30, 2017, December 31, 2017, June 30, 2018, and December 30, 2018. However, as described under "Narrative to Summary Compensation Table—Equity Compensation," we intend to fully accelerate the vesting of the unvested portion of these grants in connection with this offering.(3)On September 30, 2013, Mr. Redman was granted 256,783 restricted stock units that were originally intended to be settled only upon a change of control of the Company. However, as described under "Narrative to Summary Compensation Table—Equity Compensation," in connection with this offering, we intend to terminate and liquidate Mr. Redman's restricted stock units and provide Mr. Redman with the underlying shares on the first anniversary of this offering.(4)The amount reported above under the heading "Market Value of Shares or Units of Stock That Have Not Vested" reflects the fair market value of shares of our common stock as of December 31, 2016. Option Awards Stock Awards Name Number of
Securities
Underlying
Unexercised
Options
Exercisable Number of
Securities
Underlying
Unexercised
Options
Unexercisable Option
Exercise
Price ($) Option
Expiration
Date Number of
Shares or
Units of Stock
That Have Not
Vested
of Shares or
Units of Stock
That Have Not
Vested ($)(4)Dale Redman 174,963 $ 3.96 6/14/2023 — — — — — — 3,723,354 401,232 $ 2.25 7/19/2026 — — Jeffrey Smith 174,963 $ 3.96 6/14/2023 — — 248,777 $ 2.25 7/19/2026 — — David Sledge 174,963 $ 3.96 6/14/2023 — — 184,815 $ 2.25 7/19/2026 — — (1) On June 14, 2013, Messrs. Redman, Smith and Sledge were each granted 699,852 options to purchase our common stock that vest in equal annual installments on June 14, 2014, June 14, 2015, June 14, 2016 and June 14, 2017. (2) On July 19, 2016, Mr. Redman was granted 501,540 options to purchase our common stock, Mr. Smith was granted 310,971 options to purchase our common stock, and Mr. Sledge was granted 231,019 options to purchase our common stock. These grants are currently scheduled to vest in equal installments on December 31, 2016, June 30, 2017, December 31, 2017, June 30, 2018, and December 30, 2018. However, as described under “Narrative to Summary Compensation Table—Equity Compensation,” we fully accelerated the vesting of the unvested portion of these grants in connection with our IPO. (3) On September 30, 2013, Mr. Redman was granted 372,335 restricted stock units that were originally intended to be settled only upon a change of control of the Company. However, as described under “Narrative to Summary Compensation Table—Equity Compensation,” in connection with our initial public offering, we terminated Mr. Redman’s restricted stock units and will provide Mr. Redman with the underlying shares on the first anniversary of our IPO. (4) The amount reported above under the heading “Market Value of Shares or Units of Stock That Have Not Vested” reflects the fair market value of shares of our common stock as of December 31, 2016. Fees Earned
or Paid in
Cash ($) Option
Awards
($)(1) Total ($) 220,000 407,869 (2) 627,869 (1)All option awards granted to our non-employee director have been valued based on the fair value of the option awards at the grant dates computed in accordance with FASB ASC 718, and do not represent amounts realized by the non-employee director. We provide information regarding the assumptions used to calculate the value of all option awards granted in 2016 in Note 14 to our audited consolidated financial statements included elsewhere in this prospectus.(2)On July 19, 2016, Mr. Armour was granted 159,324 options to purchase our common stock. This grant was originally scheduled to vest in equal installments onDecember 31, 2016, June 30, 2017, December 31, 2017, June 30, 2018, and December 30, 2018. These options have a $3.26 exercise price. However, we intend to fully accelerate the vesting of the unvested portion of this grant in connection with this offering. The table below shows the aggregate numbers of option awards (exercisable and unexercisable) held as of December 31, 2016 by Mr. Armour. Mr. Armour did not hold any stock awards as of such date and no other directors held any equity awards as of such date.Name Grant Date Number of
Securities
Underlying
Options (#) Number of
Securities
Underlying
Unexercised
Options (#)
Exercisable Number of
Securities
Underlying
Unexercised
Options (#)
Unexercisable Fees Earned
or Paid in
Cash ($)
Awards
($)(1) Total ($) 6/14/2013 482,657 361,993 120,664 220,000 627,869 7/19/2016 159,324 31,865 127,459 641,981 393,858 248,123 (1) All option awards granted to our non‑employee director have been valued based on the fair value of the option awards at the grant dates computed in accordance with FASB ASC 718, and do not represent amounts realized by the non‑employee director. We provide information regarding the assumptions used to calculate the value of all option awards granted in 2016 in Note 14 to our audited consolidated financial statements included elsewhere in this prospectus. (2) On July 19, 2016, Mr. Armour was granted 231,019 options to purchase our common stock. This grant was originally scheduled to vest in equal installments on December 31, 2016, June 30, 2017, December 31, 2017, June 30, 2018, and December 30, 2018. These options have a $2.25 exercise price. However, we fully accelerated the vesting of the unvested portion of this grant in connection with our IPO. The table below shows the aggregate numbers of option awards (exercisable and unexercisable) held as of December 31, 2016 by Mr. Armour. Mr. Armour did not hold any stock awards as of such date and no other directors held any equity awards as of such date. Name Grant Date Number of
Securities
Underlying
Options Number of
Securities
Underlying
Unexercised
Options
Exercisable Number of
Securities
Underlying
Unexercised
Options
UnexercisableSpencer D. Armour, III 6/14/2013 699,852 524,889 174,963 7/19/2016 231,019 46,204 184,815 Total 930,871 571,093 359,778 Armour'sArmour’s bonus was discretionary and determined by our board of directors. In determining bonus amounts, our board of directors considered our performance during the fiscal year, including the private placement round that was closed prior to the end of 2016, as well as the fact that no bonuses were paid with respect to fiscal year 2015. Considering both his director fees and his 2016 bonus, Mr. Armour earned a total of $220,000 for his services as a non-employeenon‑employee director for the Company.482,657699,852 shares of our common stock to Mr. Armour in his role as a director of the Company. These 2013 options have a $5.73$3.96 per share exercise price. Such stock options are scheduled to vest in equal annual installments over four years from the date of the grant. The vesting of the stock options is subject to acceleration upon a change of control of the Company if Mr. Armour remains in the service of the Company. A change of control does not include a publican offering, and therefore a change of control did not occur in connection with our IPO and will not occur in connection with this offering.Armour'sArmour’s equity ownership from being diluted as a result of Energy Capital Partners'Partners’ equity contribution to the Company on June 8, 2016. Pursuant to this 2016 grant, Mr. Armour received options to purchase 159,324231,019 shares of our common stock. These 2016 options have a $3.26$2.25 per share exercise price. Pursuant to their original terms, such stock options were scheduled to vest in equal five equal semi-annualsemi‑annual installments starting on December 31, 2016. The vesting of the stock options was subject to acceleration upon a change of control of the Company if Mr. Armour remained in the service of the Company. A change of control does not include a publican offering,thisour initial public offering, however, we intend to fully accelerateaccelerated the vesting of the unvested portion of Mr. Armour'sArmour’s 2016 options.On and afterAs of the closing of this offeringour IPO and following the effectiveness of the 2017 Incentive Award Plan (as described below), no further grants will be made under the 2013 Stock Option Plan. Prior to the effective date of this offering,intend to adoptadopted the 2017 Incentive Award Plan, or the Plan, subject to approval by our current shareholders, under which we may grant cash and equity incentive awards to eligible employees, consultants and directors in order to attract, motivate and retain the talent for which we compete. The material terms of the Plan as it is currently contemplated, are summarized below. Our board of directors is still in the process of developing, approving and implementing the Plan and, accordingly, this summary is subject to change.will beare eligible to receive awards under the Plan. The Plan will beis administered by our Boardboard of directors with respect to awards to non-employeenon‑employee directors and by our compensation committee with respect to other participants, each of which may delegate its duties and responsibilities to committees of our directors and/or officers (referred to collectively as the plan administrator below), subject to certain limitations that may be imposed under Section 162(m) of the Code, Section 16 of the Exchange Act and/or stock exchange rules, as applicable. The plan administrator will havehas the authority to make all determinations and interpretations under, prescribe all forms for use with, and adopt rules for the administration of, the Plan, subject to its express terms and conditions. The plan administrator will also setsets the terms and conditions of all awards under the Plan, including any vesting and vesting acceleration conditions.will beare available for issuance under awards granted pursuant to the Plan, which shares may be authorized but unissued shares, or shares purchased in the open market. If an award under the Plan is forfeited, expires, is converted to shares of another entity in connection with a spin-offspin‑off or other similar event or is settled for cash, any shares subject to such award may, to the extent of such forfeiture, expiration, conversion or cash settlement, be used again for newwill beis 725,000 and the maximum amount that may be paid under a cash award pursuant to the Plan to any one participant during any calendar year period will be ;is $5,000,000; provided that these limitations will not apply until Section 162(m) applies to certain awards under the Plan (as described below).equity-basedequity‑based awards and the amount of any cash compensation granted to a non-employeenon‑employee director during any calendar year will be $ .will provideprovides for the grant of stock options, including incentive stock options, or ISOs, and nonqualified stock options, or NSOs, stock appreciation rights, or SARS, restricted stock, restricted stock units, or RSUs, other stock or cash based awards and dividend equivalents. No determination has been made as to the types or amounts of awards that will be granted to specific individuals pursuant to the Plan. Certain awards under the Plan may constitute or provide for a deferral of compensation, subject to Section 409A of the Code, which may impose additional requirements on the terms and conditions of such awards. All awards under the Plan will be set forth in award agreements, which will detail all terms and conditions of the awards, including any applicable vesting and payment terms and post-terminationpost‑termination exercise limitations. Awards other than cash awards generally will be settled in shares of our common stock, but the plan administrator may provide for cash settlement of any award. A brief description of each award type follows.•••••"qualified performance-based“qualified performance‑based compensation,"” or QPBC, within the meaning of Section 162(m) of the Code, in which case (unless the award is a stock option or SAR) the applicable performance criteria will be selected from the list below in accordance with the requirements of Section 162(m) of the Code."covered employees"“covered employees” (which, for emerging growth companies and smaller reporting companies, consists of the Chief Executive Officer and the next two most highly compensated employees, and for all other public companies, includes the Chief Executive Officer and the next three most highly compensated employees other than the Chief Financial Officer), but excludes from the calculation of amounts subject to this limitation any amounts that constitute QPBC. Under current tax law, we do not expect Section 162(m) of the Code to apply to certain awards under the Plan until the earliest to occur of (1) our annual shareholders'shareholders’ meeting at which members of our Board are to be elected in 2021; (2) a material modification of the Plan; (3) an exhaustion of the share supply under the Plan; or (4) the expiration of the Plan. However, QPBC performance criteria may be used with respect to awards that are not intended to constitute QPBC. In addition, the Company may issue awards that are not intended to constitute QPBC even if such awards might be non-deductiblenon‑deductible as a result of Section 162(m) of the Code.pre-established,pre‑established, objective performance goals set by our compensation committee and linked to shareholder-approvedshareholder‑approved performance criteria. For purposes of the Plan, one or more of the following performance criteria will be used in setting performance goals applicable to QPBC, and may be used in setting performance goals applicable to other awards: (i) adjusted net earnings or losses (either before or after one or more of the following: (A) interest, (B) taxes, (C) depreciation, (D) amortization and (E) non-cash equity-basednon‑cash equity‑based compensation expense); (ii) gross or net sales or revenue or sales or revenue growth; (iii) net income (either before or after taxes); (iv) adjusted net income; (v) operating earnings or profit (either before or after taxes); (vi) cash flow (including, but not limited to, operating cash flow and free cash flow); (vii) return on assets; (viii) return on capital (or invested capital) and cost of capital; (ix) return on shareholders'shareholders’ equity; (x) total shareholder return; (xi) return on sales; (xii) gross or net profit or operating margin; (xiii) costs, reductions in costs and cost control measures; (xiv) expenses; (xv) working capital; (xvi) earnings or loss per share; (xvii) adjusted earnings or loss per share; (xviii) price per share or dividends per share (or appreciation in and/or maintenance of such price or dividends); (xix) regulatory achievements or compliance (including, without limitation, regulatory body approval for commercialization of a product); (xx) implementation or completion of critical projects; (xxi) market share; (xxii) economic value; (xxiii) productivity; (xxiv) operating efficiency; (xxv) economic value-added;value‑added; (xxvi) cash flow return on capital; (xxvii) return on net assets; (xxviii) funds from operations; (xxix) funds available for distributions; (xxx) market penetration and geographic business expansion; (xxxi) customer satisfaction/growth; (xxxii) recruitment and retention of personnel; (xxxiii) human resources management; (xxxiv) supervision of litigation and other legal matters; (xxxv) strategic partnerships and transactions; (xxxvi) financial ratios (including those measuring liquidity, activity, profitability or leverage); (xxxvii) financing and other capital raising transactions; (xxxviii) year-endyear‑end cash; (xxxix) acquisition activity and marketing initiatives; and (xl) safety metrics, any of which may benon-operatingnon‑operating items; (v) items related to acquisitions; (vi) items attributable to the business operations of any entity acquired by the Company during the Performance Period; (vii) items related to the sale or disposition of a business or segment of a business; (viii) items related to discontinued operations that do not qualify as a segment of a business under Applicable Accounting Standards; (ix) items attributable to any stock dividend, stock split, combination or exchange of stock occurring during the Performance Period; (x) any other items of significant income or expense which are determined to be appropriate adjustments; (xi) items relating to unusual or infrequent corporate transactions, events or developments, (xii) items related to amortization of acquired intangible assets; (xiii) items that are outside the scope of the Company'sCompany’s core, on-goingon‑going business activities; (xiv) items related to acquired in-processin‑process research and development; (xv) items relating to changes in tax laws; (xvi) items relating to major licensing or partnership arrangements; (xvii) items relating to asset impairment charges; (xviii) items relating to gains or losses for litigation, arbitration and contractual settlements; (xix) items attributable to expenses incurred in connection with a reduction in force or early retirement initiative; (xx) items relating to foreign exchange or currency transactions and/or fluctuations; or (xxi) items relating to any other unusual or nonrecurring events or changes in Applicable Law, Applicable Accounting Standards or business conditions. For all Awards intended to qualify as Performance-BasedPerformance‑Based Compensation, such determinations shall be made within the time prescribed by, and otherwise in compliance with, Section 162(m) of the Code.non-reciprocalnon‑reciprocal transactions with our shareholders known as "equity“equity restructurings,"” the plan administrator will make equitable adjustments to the Plan and outstanding awards. In the event of a change in control of our company (as defined in the Plan), to the extent that the surviving entity declines to continue, convert, assume or replace outstanding awards, all such awards will become fully vested and exercisable in connection with the transaction. Upon or in anticipation of a change of control, the plan administrator may cause any outstanding awards to terminate at a specified time in the future and give the participant the right to exercise such awards during a period of time determined by the plan administrator in its sole discretion. Individual award agreements may provide for additional accelerated vesting and payment provisions. Claw-Back, Claw‑Back Provisions, Transferability, and Participant Payments. The plan administrator may modify award terms, establish subplans and/or adjust other terms and conditions of awards, subject to the share limits described above, in order to facilitate grants of awards subject to the laws and/or stock exchange rules of countries outside of the United States. All awards will be subject to the provisions of any claw-backclaw‑back policy implemented by our company to the extent set forth in such claw-backclaw‑back policy and/or in the applicable award agreement. With limited exceptions for estate planning, domestic relations orders, certain beneficiary designations and the laws of descent and distribution, awards under the Plan are generally non-transferablenon‑transferable prior to vesting, and are exercisable only by the participant. With regard to tax withholding, exercise price and purchase price obligations arising in connection with awards under the Plan, the plan"market“market sell order"order” or such other consideration as it deems suitable."reprices"“reprices” any stock option or SAR, or cancels any stock option or SAR in exchange for cash or another award when the option or SAR price per share exceeds the fair market value of the underlying shares. No award may be granted pursuant to the Plan after the tenth anniversary of the date on which our Board adopts the Plan. Executive Bonus Plan. We intend to adoptwill beis designed to provide an incentive for superior work and to motivate covered key executives toward even greater achievement and business results, to tie their goals and interests to those of us and our shareholders and to enable us to attract and retain highly qualified executives. The principal anticipated features of the Executive Bonus Plan are summarized below.will beare eligible to receive bonus payments with respect to a specified period (for example, our fiscal year). Bonuses will generally be payable under the Executive Bonus Plan upon the attainment of pre-establishedpre‑established performance goals. Notwithstanding the foregoing, we may pay bonuses (including, without limitation, discretionary bonuses) to participants under the Executive Bonus Plan based upon such other terms and conditions as the compensation committee may in its discretion determine.non-cash equity-basednon‑cash equity‑based compensation expense); (ii) gross or net sales or revenue or sales or revenue growth; (iii) net income (either before or after taxes); (iv) adjusted net income; (v) operating earnings or profit (either before or after taxes); (vi) cash flow (including, but not limited to, operating cash flow and free cash flow); (vii) return on assets; (viii) return on capital (or invested capital) and cost of capital; (ix) return on shareholders'shareholders’ equity; (x) total shareholder return; (xi) return on sales; (xii) gross or net profit or operating margin; (xiii) costs, reductions in costs and cost control measures; (xiv) expenses; (xv) working capital; (xvi) earnings or loss per share; (xvii) adjusted earnings or loss per share; (xviii) price per share or dividends per share (or appreciation in and/or maintenance of such price or dividends); (xix) regulatory achievements or compliance (including, without limitation, regulatory body approval for commercialization of a product); (xx) implementation or completion of critical projects; (xxi) market share; (xxii) economic value; (xxiii) productivity; (xxiv) operating efficiency; (xxv) economic value-added;value‑added; (xxvi) cash flow return on capital; (xxvii) return on net assets; (xxviii) funds from operations; (xxix) funds available for distributions; (xxx) market penetration and geographic business expansion; (xxxi) customer satisfaction/growth; (xxxii) recruitment and retention of personnel; (xxxiii) human resources management; (xxxiv) supervision of litigation and other legal matters; (xxxv) strategic partnerships and transactions; (xxxvi) financial ratios (including those measuring liquidity, activity, profitability or leverage); (xxxvii) financing and other capital raising transactions; (xxxviii) year-endyear‑end cash; (xxxix) acquisition activity and marketing initiatives; and (xl) safety metrics, any of which may be measured either in absolute terms or as compared to anynon-operatingnon‑operating items; (v) items related to acquisitions; (vi) items attributable to the business operations of any entity acquired by the Company during the Performance Period; (vii) items related to the sale or disposition of a business or segment of a business; (viii) items related to discontinued operations that do not qualify as a segment of a business under Applicable Accounting Standards; (ix) items attributable to any stock dividend, stock split, combination or exchange of stock occurring during the Performance Period; (x) any other items of significant income or expense which are determined to be appropriate adjustments; (xi) items relating to unusual or infrequent corporate transactions, events or developments, (xii) items related to amortization of acquired intangible assets; (xiii) items that are outside the scope of the Company'sCompany’s core, on-goingon‑going business activities; (xiv) items related to acquired in-processin‑process research and development; (xv) items relating to changes in tax laws; (xvi) items relating to major licensing or partnership arrangements; (xvii) items relating to asset impairment charges; (xviii) items relating to gains or losses for litigation, arbitration and contractual settlements; (xix) items attributable to expenses incurred in connection with a reduction in force or early retirement initiative; (xx) items relating toPerformance-BasedPerformance‑Based Compensation, such determinations shall be made within the time prescribed by, and otherwise in compliance with, Section 162(m) of the Code.will beis administered by the compensation committee. The compensation committee will select the participants in the Executive Bonus Plan and any performance goals to be utilized with respect to the participants, establish the bonus formulas for each participant'sparticipant’s annual bonus, and certify whether any applicable performance goals have been met with respect to a given performance period. The Executive Bonus Plan provides that we may amend or terminate the Executive Bonus Plan at any time in our sole discretion. Any amendments to the Executive Bonus Plan will require shareholder approval only to the extent required by applicable law, rule or regulation. The Executive Bonus Plan will expire on the earlier of:••Boardboard of directors are elected during 2021.PRINCIPALSELLING SHAREHOLDERSupon the consummationas of this offering, will beSeptember 7, 2017, was owned by:••directors;••group; and•selling shareholders. The underwriters have an option to purchase a maximum of additional shares."beneficial owner"“beneficial owner” of a security if that person has or shares "voting“voting power,"” which includes the power to vote or to direct the voting of such security, or "investment“investment power,"” which includes the power to dispose of or to direct the disposition of such security. In computing the number of shares beneficially owned by a person and the percentage ownership of that person, common stock subject to options or warrants held by that person that are currently exercisable or exercisable within 60 days of the date of this prospectus, if any, are deemed outstanding, but are not deemed outstanding for computing the percentage ownership of any other person. Except as indicated by footnote, the persons named in the table below have sole voting and investment power with respect to all shares of common stock shown as beneficially owned by them, subject to community property laws where applicable. Shares Beneficially Owned 5% Stockholders Number Percentage 34,527,928 41.6 % 5,811,097 7.0 % 4,179,201 5.0 % 910,575 1.1 % 27,214 * 74,113 * 7,558 * 22,558 * — — — — — — — — 7,558 * — — 7,558 * 1,057,134 1.3 % * Less than 1%. (1) Unless otherwise indicated, the address for each beneficial owners in this table is c/o ProPetro Holding Corp., 1706 S. Midkiff, Bldg. B, Midland, Texas 79701. (2) Includes (i) 517,092 shares held by Energy Capital Partners II, LP (“ECPII”), (ii) 16,843,582 shares held by Energy Capital Partners II‑A, LP (“ECP II‑A”), (iii) 3,526,945 shares held by Energy Capital Partners II‑B, LP (“ECP II‑B”), (iv) 6,195,410 shares held by Energy Capital Partners II‑C (Direct IP), LP (“ECP II‑C”), (v) 4,151,258 shares held by Energy Capital Partners II‑D, LP (“ECP II‑D”), and (vi) 3,293,641 shares held by Energy Capital Partners II (Midland Co‑Invest), LP (“ECP Co‑Invest”). Each of ECP II, ECP II‑A, ECP II‑B, ECP II‑C and ECP II‑D is managed by its general partner, Energy Capital Partners GP II, LP. Energy Capital Partners GP II, LP is managed by its general partner, Energy Capital Partners II, LLC (“Energy Capital Partners”). As a result, each of Energy Capital Partners GP II, LP and Energy Capital Partners may be deemed to share beneficial ownership of the shares held by ECP II, ECP II‑A, ECP II‑B, ECP II‑C and ECP II‑D. ECP Co‑Invest is managed by its general partner, Energy Capital Partners GP II Co‑Investment (Midland), LLC, which is managed by its sole member, Energy Capital Partners. Douglas W. Kimmelman, Peter Labbat, Thomas K. Lane, Tyler Reeder and Andrew D. Singer are the managing members of, and Rahman D’Argenio is a partner of, Energy Capital Partners and share the power to direct the voting and disposition of the shares beneficially owned by Energy Capital Partners. Each such individual disclaims beneficial ownership of such shares. The address for Energy Capital Partners and each of the other persons and entities in this footnote is 51 John F. Kennedy Parkway, Suite 200, Short Hills, New Jersey 07078. (3) The investment advisor of Double Black Diamond Offshore Ltd. is Carlson Capital, L.P., and the general partner of Carlson Capital, L.P. is Asgard Investment Corp. II. The sole stockholder of Asgard Investment Corp. II. is Asgard Investment Corp., and Clint D. Carlson is its controlling person. The business address of each person and entity named in this footnote 3 is 2100 McKinney Ave, Suite 1800, Dallas, TX 75201. (4) Adage Capital Partners, GP, LLC (“ACPGP”), serves as the general partner of Adage Capital Partners, LP, a Delaware limited partnership (the “Fund”) and as such has discretion over the portfolio of securities beneficially owned by the Fund. Adage Capital Advisors, LLC, a Delaware limited liability company (“ACA”), is managing member of ACPGP and directs ACPGP’s operations. Robert Atchinson and Phillip Gross are the managing members of ACPGP and ACA and general partners of the Fund. Robert Atchinson and Phillip Gross disclaim beneficial ownership of the reported securities except to the extent of their pecuniary interest therein. (5) Includes, for each executive officer, director and director nominee, shares of common stock that are issuable pursuant to options that are currently exercisable or exercisable within 60 days. Contents The following table does not include anyup to an aggregate of 17,355,045 shares of common stock that directors, director nomineesmay be offered and executive officerssold from time to time by the selling shareholders identified below under this prospectus, subject to any appropriate adjustment as a result of any subdivision, split, combination or other reclassification of our common stock.Selling Shareholder Shares Beneficially Owned Prior to this Offering Number of Shares Offered Hereby Shares Beneficially Owned After this Offering (1) Percentage of Class Beneficially Owned Before Offering After Offering (1) 4,179,201 2,999,999 1,179,202 5.0 % 1.4 % 1,499,998 1,499,998 — 1.8 % — 5,811,097 4,999,998 811,099 7.0 % * 1,281,817 1,199,999 81,818 1.5 % * 1,068,182 1,000,000 68,182 1.3 % * 799,999 799,999 — 1.0 % — 100,001 100,001 — * — 949,999 949,999 — 1.1 % — 949,999 949,999 — 1.1 % — 340,286 140,286 — * — 2,499,998 2,499,998 — 3.0 % — Dale Redman 612,774 167,870 444,904 1.1 % * Jeffrey Smith 74,113 46,899 27,214 * * Total 19,967,464 17,355,045 2,612,419 24 % 3.1 % * Less than 1%. (1) Represents the amounts of shares that will be held by the selling shareholder after completion of this offering based on the assumptions that: (a) all shares registered for sale by the registration statement of which this prospectus is a part will be sold by or on behalf of the selling shareholder; and (b) no other shares of our common stock will be acquired prior to completion of this offering by the selling shareholder. The selling shareholders may sell all, some or none of the shares offered pursuant to this prospectus and may sell other shares of our common stock that they may own pursuant to another registration statement under the Securities Act or sell some or all of their shares pursuant to an exemption from the registration requirements of the Securities Act of 1933, as amended (the “Securities Act”), including under Rule 144 promulgated thereunder or any successor rule. To our knowledge, there are currently no agreements, arrangements or understandings with respect to the sale of any of the shares that may be held by the selling shareholders after completion of this offering or otherwise. (2) Adage Capital Partners, GP, LLC (“ACPGP”), serves as the general partner of Adage Capital Partners, LP, a Delaware limited partnership (the “Fund”) and as such has discretion over the portfolio of securities beneficially owned by the Fund. Adage Capital Advisors, LLC, a Delaware limited liability company (“ACA”), is managing member of ACPGP and directs ACPGP’s operations. Robert Atchinson and Phillip Gross are the managing members of ACPGP and ACA and general partners of the Fund. Robert Atchinson and Phillip Gross disclaim beneficial ownership of the reported securities except to the extent of their pecuniary interest therein. (3) Arosa Capital Management Opportunistic GP II LLC is the general partner of Arosa Opportunistic Fund LP and Arosa Capital Management LP is its investment manager. The members of Arosa Capital Management Opportunistic GP II LLC and the limited partners of Arosa Capital Management LP are Till Bechtolsheimer and Abraham Joseph. The business address of each person and entity named in this footnote is 120 West 45th St. Suite 3700, NY, NY 10036. (4) The investment advisor of Double Black Diamond Offshore Ltd. is Carlson Capital, L.P., and the general partner of Carlson Capital, L.P. is Asgard Investment Corp. II. The sole stockholder of Asgard Investment Corp. II. is Asgard Investment Corp., and Clint D. Carlson is its controlling person. The business address of each person and entity named in this footnote 5 is 2100 McKinney Ave, Suite 1800, Dallas, TX 75201. (5) Encompass Capital Advisors LLC (“Encompass Capital Advisors”), as the investment adviser for Encompass Capital Master Fund L.P., may be deemed to beneficially own the shares of our common stock held by Encompass Capital Master Fund L.P. purchase in this offering throughalso be deemed to beneficially own the directed share program described under "Underwriting." Number of
Shares
of Common
Stock
Offered if the
Underwriters'
Option to Number of
Shares
of Common
Stock
Offered if the
Underwriters'
Option to
Purchase Shares Beneficially
Owned After this
Offering(1) (Assuming
No Exercise of the
Underwriters'
Option to Purchase Additional Shares) Shares Beneficially
Owned After this
Offering(1) (Assuming
the Underwriters'
Option to Purchase Additional Shares is Exercised
in Full)
Owner(2) Shares Beneficially Owned
Before this Offering Purchase
Additional Shares Additional Shares
is Exercised Number Percentage is not Exercised in Full Number Percentage Number Percentage % % % % %
1,079,083 2.9 % % % 521,317 1.4 % % % 762,056 2.1 % % % 521,317 1.4 % % % % % % % % % % % % % % %
2,883,773
7.4
%
%
% *Less than 1%.(1)Share count gives effecteach disclaim beneficial ownership of such shares of common stock except to the conversionextent of the Series A Preferred Share into common sharestheir respective economic interests in connection with this offering.(2)Unless otherwise indicated, the address for each beneficial owners in this table is c/o ProPetro Holding Corp.Encompass Capital Master Fund L.P., 1706 S. Midkiff, Bldg. B, Midland, Texas 79701.if any.(6) Encompass Capital Advisors LLC (“Encompass Capital Advisors”), as the investment adviser for Encompass Capital E&P Master Fund L.P., may be deemed to beneficially own the shares of our common stock held by Encompass Capital E&P Master Fund L.P. Todd Kantor, as the managing member of Encompass Capital Advisors, may also be deemed to beneficially own the shares of our common stock held by Encompass Capital E&P Master Fund L.P. Encompass Capital Advisors and Mr. Kantor each disclaim beneficial ownership of such shares of common stock except to the extent of their respective economic interests in Encompass Capital E&P Master Fund L.P., if any. (7) The beneficial owner of the shares held by Hartree Partners, LP is Hartree Partners GP, LLC. The holders of partnership interests in Hartree Partners GP, LLC are Stephen M. Semlitz, Stephen M. Hendel, Jonathan Guy Merison, and Opps Energy Trading Holding, L.P. The business address of Hartree Partners, LP is 1185 Avenue of the Americas, 9th Fl., New York, NY 10036. (8) John and Maurine Cox Foundation is managed by its Agents, Adam Rubinson and Matthew McMahan, appointed by the Trustee, James Kelly Cox. (9) JM Cox Resources, LP is managed by its General Partner, JM Cox Resources Genpar, LLC. JM Cox Resources Genpar, LLC elected the following persons to serve as Officers and to serve pursuant to the agreement: President: James Kelly Cox; Vice President: Anita Shipman Cox; Vice President: Adam Rubinson; Vice President: Matthew McMahan. (10) JM Cox Legacy, LP is managed by its General Partner, JM Cox Legacy Management, LLC. JM Cox Legacy Management, LLC elected the following persons to serve as Officers and to serve pursuant to the agreement: President: James Kelly Cox; Vice President: Anita Shipman Cox; Vice President: Adam Rubinson; Vice President: Matthew McMahan. (11) JPMorgan Chase & Co. controls J.P. Morgan Securities LLC. J.P. Morgan Securities LLC is a wholly owned subsidiary of JPMorgan Chase & Co., which, in its capacity as parent holding company, disclaims beneficial ownership of these shares. J.P. Morgan Securities LLC is controlled as set forth below: (3)Includes (i) 499,174 shares held by Energy Capital Partners II, LP ("ECP II"), (ii) 16,259,932 shares held by Energy Capital Partners II-A, LP ("II-A"), (iii) 3,404,733 shares held by Energy Capital Partners II-B, LP ("II-B"), (iv) 5,980,733 shares held by Energy Capital Partners II-C (Direct IP), LP ("II-C"), (v) 4,007,413 shares held by Energy Capital Partners II-D, LP ("II-D"), and (vi) 3,179,512 shares held by Energy Capital Partners II (Midland Co-Invest), LP ("ECP Co-Invest"). ECP II, II-A, II-B, II-CEric J. Stein, Erin Elizabeth Hill, Jason Edwin Sippel, Matthew Cherwin, Patrick C. Kirby, Robert C. Holmes and II-DChristopher L. Harvey is managed by its general partner, Energy Capital Partners GP II, LP. Energy Capital Partners GP II, LP is managed by its general partner, Energy Capital Partners II,a Manager of J.P. Morgan Securities LLC, ("Energy Capital Partners"). As a result, each of Energy Capital Partners GP II, LPDelaware limited liability company, and Energy Capital Partnersas such may be deemed to sharehave voting and dispositive power over the shares held by J.P. Morgan Securities LLC. Each of Eric J. Stein, Erin Elizabeth Hill, Jason Edwin Sippel, Matthew Cherwin, Patrick C. Kirby, Robert C. Holmes and Christopher L. Harvey disclaims beneficial ownership of the shares.(12) Moore Capital Management, LP, the investment manager of MMF Moore ET Investments, LP, has voting and investment control of the shares held by MMF Moore ET Investments, LP. Louis Moore Bacon is the controlling stockholder of the general partner of Moore Capital Management, LP and may be deemed to be the beneficial owner of the shares of ProPetro Holding Corp.’s common stock held by MMF Moore ET Investments, LP. heldor interests in the shares on any stock exchange, market or trading facility on which the shares are traded or in private transactions. The selling shareholders may sell their shares of common stock from time to time at the prevailing market price or in privately negotiated transactions. We will not receive any of the proceeds from the sale of shares of common stock pursuant to this prospectus.ECP II, ECP II-A, ECP II-B, ECP II-D. ECP Co-Investa broker‑dealer as principal and resale by the broker‑dealer for its account;manageda part is declared effective by its general partner, Energy Capital Partners GP II Co-Investment (Midland), LLC,the SEC;is managedrequire the delivery to such broker‑dealer or other financial institution of shares offered by its sole member, Energy Capital Partners. Douglas W. Kimmelman, Peter Labbat, Thomas K. Lane, Tyler Reederthis prospectus, which shares such broker‑dealer or other financial institution may resell pursuant to this prospectus (as supplemented or amended to reflect such transaction). The selling shareholders and Andrew D. Singer areany underwriters, dealers or agents participating in a distribution of the managing membersshares may be deemed to be underwriters within the meaning of the Securities Act, and any profit on the sale of the shares by the selling shareholders and any commissions received by broker‑dealers may be deemed to be underwriting commissions under the Securities Act.powerselling shareholders against certain liabilities related to direct the votingsale of the common stock, including certain liabilities arising under the Securities Act. Underbeneficially ownedof common stock offered in this prospectus by Energy Capital Partners. Each managing member disclaims beneficial ownershipthe selling shareholders. The anti‑manipulation rules under the Exchange Act may apply to sales of shares in the market and to the activities of the selling shareholders and its affiliates. Furthermore, Regulation M may restrict the ability of any person engaged in the distribution of the shares to engage in market‑making activities for the particular securities being distributed for a period of up to five business days before the distribution. The restrictions may affect the marketability of the shares and the ability of any person or entity to engage in market‑making activities for the shares.shares. The addresssecurities may not be sold unless they have been registered or qualified for sale or an exemption from registration or qualification requirements is available and is complied with.eachother existing shareholders, we agreed to use our commercially reasonable efforts to keep the registration statement of which this prospectus constitutes a part continuously effective under the other persons and entities in this footnote is 51 John F. Kennedy Parkway, Suite 200, Short Hills, New Jersey 07078.(4)Includes, for each executive officer and director, sharesSecurities Act until the earlier of common stock that are issuable pursuant to options that are currently exercisable or exercisable within 60 days, including pursuant to options for which(a) the vesting is expected to accelerate in full in connection with this offering.CERTAIN RELATIONSHIPS AND RELATED PARTY TRANSACTIONSProcedures for Review, Approval and Ratification of Related Person Transactions Our board of directors will adopt a code of business conduct and ethics in connection with the completion of this offering that will provide that the board of directors or its authorized committee will review on at least a quarterly basis all transactions with related persons that are required to be disclosed under SEC rules and,date when appropriate, initially authorize or ratify all such transactions. In connection with this offering, we will establish an audit committee consisting solely of independent directors whose functions will be set forth in the audit committee charter. We anticipate that one of the audit committee's functions will be to review and approve all relationships and transactions in which we and our directors, director nominees and executive officers and their immediate family members, as well as holders of more than 5% of any class of our voting securities and their immediate family members, have a direct or indirect material interest. We anticipate that such policy will be a written policy included as part the audit committee charter that will be implemented by the audit committee and in the Code of Business Conduct and Ethics that our board of directors will adopt prior to the completion of this offering. The code of business conduct and ethics will provide that, in determining whether or not to recommend the initial approval or ratification of a transaction with a related person, the board of directors or its authorized committee should consider all of the relevant factsshares covered by such registration statement have been sold and circumstances available, including (if applicable) but not limited to: (i) whether(b) the date on when there is an appropriate business justification for the transaction; (ii) the benefits that accrue to us as a result of the transaction; (iii) the terms available to unrelated third parties entering into similar transactions; (iv) the impact of the transaction on a director's independence (in the event the related person is a director, an immediate family member of a director or an entity in which a director or an immediate family member of a director is a partner, shareholder, member or executive officer); (v) the availability of other sources for comparable services; (vi) whether it is a single transaction or a series of ongoing, related transactions; and (vii) whether entering into the transaction would be consistent with the code of business conduct and ethics. The code of business conduct and ethics described above will be adopted in connection with the completion of this offering and, therefore, the transactions described below were not reviewed underare no shares covered by such policy.Registration Rights Agreements We have entered into a registration rights agreement with certain shareholders, including the selling shareholders. Pursuant tostatement outstanding.agreement,agreements for the benefit of the seller shareholders that are former holders of Series A Preferred Stock, we are requiredagreed to cause a shelfuse our commercially reasonable efforts to keep the registration statement to be filed as soon as permittedof which this prospectus constitutes a part continuously effective under the Securities Act until the earlier of (a) the date when all of the shares covered by such registration statement have been sold, (b) the applicable securities laws. Also pursuant todate on when there are no shares covered by such registration statement outstanding, and (c) the registration rights agreement, certain shareholders have the right to demand we undertake an underwritten offering of such shareholders' shares of our common stock at any time after the firstfifth anniversary of the consummation of this offering, in addition to certain "piggyback" rights when we undertake an underwritten offering of shares of our common stock. We have also entered into a registration rights agreement with the holders of our Series A Preferred Shares. Please read "Shares Eligible for Future Sale."Shareholders' Agreement We have entered into a shareholders' agreement with certain of our shareholders pursuant to which certain shareholders are entitled to nominate directors to our board of directors, in addition to other transfer restrictions and pre-emptive rights with respect to our shares. This shareholders' agreement will terminate upon the consummation of this offering. In connection with the consummation of this offering, we expect our existing shareholders to enter into a new shareholders' agreement.Indemnification Agreements Our bylaws will provide that we will indemnify our directors and officers to the fullest extent permitted by law. In addition, we intend to enter into separate indemnification agreements with our directors and certain officers. Each indemnification agreement will provide, among other things, for indemnification to the fullest extent permitted by law and our bylaws against any and all expenses, judgments, fines, penalties and amounts paid in settlement of any claim. The indemnification agreements will provide for the advancement or payment of all expenses to the indemnitee and for the reimbursement to us if it is found that such indemnitee is not entitled to such indemnification under applicable law and our bylaws.Payments to Executive Officers For the year ended 2015 and the nine months ended September 30, 2016, we paid Dale Redman, our Chief Executive Officer, $164,000 and $119,879, respectively, for reimbursement of costs incurred through use of his aircraft. We rent certain flowback equipment from PD Properties, an entity jointly owned by Dale Redman. For the year ended 2015 and the nine months ended September 30, 2016, we paid $192,000 and $144,000, respectively. We lease our corporate headquarters from South Midkiff Partners LLC, a entity owned jointly by Dale Redman, David Sledge, Spencer D. Armour, III and Jeff Smith pursuant to a five-year lease agreement with a five-year extension option requiring a base rent of $72,000 per year. In addition, we lease five properties adjacent to our corporate office from South Midkiff Partners LLC with annual base rents of $30,000, $30,000, $90,000, $90,000, and $180,000.currently organized as a TexasDelaware corporation. In connection with the completion of this offering, we intend to change the jurisdiction of our incorporation to the State of Delaware.anticipated certificationcertificate of incorporation and bylaws of ProPetro Holding Corp. does not purport to be complete and is qualified in its entirety by reference to the provisions of applicable law and to our anticipated certificate of incorporation, bylaws and bylaws,stockholders agreement, which are filed as exhibits to the registration statement of which this prospectus is a part. will have the exclusive right to vote for the election of directors and do not have cumulative voting rights. Except as otherwise required by law, holders of common stock, are not entitled to vote on any amendment to the certificate of incorporation (including any certificate of designations relating to any series of preferred stock) that relates solely to the terms of any outstanding series of preferred stock if the holders of such affected series are entitled, either separately or together with the holders of one or more other such series, to vote thereon pursuant to the certificate of incorporation (including any certificate of designations relating to any series of preferred stock) or pursuant to the DGCL. Subject to prior rights and preferences that may be applicable to any outstanding shares or series of preferred stock, holders of common stock are entitled to receive ratably in proportion to the shares of common stock held by them such dividends (payable in cash, stock or otherwise), if any, as may be declared from time to time by our board of directors out of funds legally available for dividend payments. All outstanding shares of common stock are fully paid and non-assessable.non‑assessable. The holders of common stock have no preferences or rights of conversion, exchange, pre-emptionpre‑emption or other subscription rights. There are no redemption or sinking fund provisions applicable to the common stock. In the event of any voluntary or involuntary liquidation, dissolution or winding-upwinding‑up of our affairs, holders of common stock will be entitled to share ratably in our assets in proportion to the shares of common stock held by them that are remaining after payment or provision for payment of all of our debts and obligations and after distribution in full of preferential amounts to be distributed to holders of outstanding shares of preferred stock, if any.Series A Preferred Stock In connection with the consummation of this offering, all 11,724,134 shares of outstanding Series A Preferred Stock will be automatically converted into shares of common stock at the applicable conversion price described in "Recent Events — Convertible Preferred Private Placement."Anti-TakeoverAnti‑Takeover Effects of Provisions of Our Amended and Restated Certificate of Incorporation, our Amended and Restated Bylaws and Delaware Law will contain provisions that could make the following transactions more difficult: acquisitions of us by means of a tender offer, a proxy contest or otherwise or removal of our directors. These provisions may also have the effect of preventing changes in our management. It is possible that these provisions could make it more difficult to accomplish or could deter transactions that stockholders may otherwise consider to be in their best interest or in our best interests, including transactions that might result in a premium over the market price for our shares.,the NYSE, from engaging in any business combination (as defined in Section 203) with any interested stockholder (as defined in Section 203) for a period of three years following the date that the stockholder became an interested stockholder, unless:•••two-thirdstwo‑thirds of the outstanding voting stock that is not owned by the interested shareholder..intend to apply to list of our common stock on the NYSE under the symbol "PUMP."“PUMP.”SHARES ELIGIBLE FOR FUTURE SALE Prior to this offering, there has been no public market for our common stock. Future sales of our common stock in the public market, or the availability of such shares for sale in the public market, could adversely affect the market price of our common stock prevailing from time to time. As described below, only a limited number of shares will be available for sale shortly after this offering due to contractual and legal restrictions on resale. Nevertheless, sales of a substantial number of shares of our common stock in the public market after such restrictions lapse, or the perception that those sales may occur, could adversely affect the prevailing market price of our common stock at such time and our ability to raise equity-related capital at a time and price we deem appropriate.Sales of Restricted Shares Upon completion of this offering, we will have outstanding an aggregate of shares of common stock, including shares of common stock issued upon the automatic conversion of the Series A Preferred Shares upon the consummation of this offering. Of these shares, all of the shares of common stock to be sold in this offering (or shares assuming the underwriters exercise the option to purchase additional shares in full) will be freely tradable without restriction or further registration under the Securities Act, unless the shares are held by any of our "affiliates" as such term is defined in Rule 144 under the Securities Act. All remaining shares of common stock will be deemed "restricted securities" as such term is defined under Rule 144. The restricted securities were, or will be, issued and sold by us in private transactions and are eligible for public sale only if registered under the Securities Act or if they qualify for an exemption from registration under Rule 144 or Rule 701 under the Securities Act, which rules are summarized below. As a result of the lock-up agreements described below and the provisions of Rule 144 and Rule 701 under the Securities Act, all of the shares of our common stock (excluding the shares to be sold in this offering) will be available for sale in the public market upon the expiration of the lock-up agreements, beginning 180 days after the date of this prospectus (subject to extension) and when permitted under Rule 144 or Rule 701.Lock-up Agreements We, all of our directors and executive officers and holders of substantially all of our outstanding common stock will agree not to sell any common stock or securities convertible into or exchangeable for shares of common stock for a period of days from the date of this prospectus, subject to certain exceptions. For a description of these lock-up provisions, please see the section entitled "Underwriting."Rule 144 In general, under Rule 144 under the Securities Act as currently in effect, a person (or persons whose shares are aggregated) who is not deemed to have been an affiliate of ours at any time during the three months preceding a sale, and who has beneficially owned restricted securities within the meaning of Rule 144 for a least six months (including any period of consecutive ownership of preceding non-affiliated holders) would be entitled to sell those shares, subject only to the availability of current public information about us. A non-affiliated person who has beneficially owned restricted securities within the meaning of Rule 144 for at least one year would be entitled to sell those shares without regard to the provisions of Rule 144. A person (or persons whose shares are aggregated) who is deemed to be an affiliate of ours and who has beneficially owned restricted securities within the meaning of Rule 144 for at least sixmonths would be entitled to sell within any three-month period a number of shares that does not exceed the greater of one percent of the then outstanding shares of our common stock or the average weekly trading volume of our common stock reported through NYSE during the four calendar weeks preceding the filing of notice of the sale. Such sales are also subject to certain manner of sale provisions, notice requirements and the availability of current public information about us.Rule 701 In general, under Rule 701 under the Securities Act, any of our employees, directors, officers, consultants or advisors who purchases shares from us in connection with a compensatory stock or option plan or other written agreement before the effective date of this offering is entitled to sell such shares 90 days after the effective date of this offering in reliance on Rule 144, without having to comply with the holding period requirement of Rule 144 and, in the case of non-affiliates, without having to comply with the public information, volume limitation or notice filing provisions of Rule 144. The SEC has indicated that Rule 701 will apply to typical stock options granted by an issuer before it becomes subject to the reporting requirements of the Exchange Act, along with the shares acquired upon exercise of such options, including exercises after the date of this prospectus.Stock Issued Under Employee Plans We intend to file a registration statement on Form S-8 under the Securities Act to register stock issuable under our 2013 Stock Option Plan and our 2017 Incentive Award Plan. This registration statement on Form S-8 is expected to be filed following the effective date of the registration statement of which this prospectus is a part and will be effective upon filing. Accordingly, shares registered under such registration statement will be available for sale in the open market following the effective date, unless such shares are subject to vesting restrictions with us, Rule 144 restrictions applicable to our affiliates or the lock-up restrictions described above.Registration Rights Agreement We have entered into a registration rights agreement with certain shareholders, including the selling shareholders. Pursuant to the registration rights agreement, we are required to cause a shelf registration statement to be filed as soon as permitted by the applicable securities laws. Also pursuant to the registration rights agreement, certain shareholders have the right to demand we undertake an underwritten offering of such shareholders' shares of our common stock at any time after the first anniversary of the consummation of this offering, in addition to certain "piggyback" rights when we undertake an underwritten offering of shares of our common stock.Preferred Shareholder Registration Rights Agreement In connection with the recent sale of Series A Preferred Stock, we have entered into a registration rights agreement with the holders of Series A Preferred Stock. The Series A Preferred Stock will automatically convert in common stock upon the consummation of this offering. Pursuant to this registration rights agreement, we are required to use commercially reasonable efforts to cause a shelf registration statement for the converted common stock to become effective no later than 180 days following the consummation of this offering. Also pursuant to this registration rights agreement, each holder of converted Series A Preferred Stock has the right to demand we undertake an underwritten offering of such shareholders' shares of our common stock at any time after the six-month anniversary of the consummation of this offering, in addition to certain "piggyback" rights when we undertake an underwritten offering of shares of our common stock.Shareholders' Agreement We have entered into a shareholders' agreement with certain of our shareholders pursuant to which certain shareholders are entitled to nominate directors to our board of directors, in addition to other transfer restrictions and pre-emptive rights with respect to our shares. This shareholders' agreement will terminate upon the consummation of this offering. In connection with the consummation of this offering, we expect our existing shareholders to enter into a new shareholders' agreement.Indemnification Agreements Our amended and restated bylaws will provide that we will indemnify our directors and officers to the fullest extent permitted by law. In addition, we intend to enter into separate indemnification agreements with our directors and certain officers. Each indemnification agreement will provide, among other things, for indemnification to the fullest extent permitted by law and our amended and restated bylaws against any and all expenses, judgments, fines, penalties and amounts paid in settlement of any claim. The indemnification agreements will provide for the advancement or payment of all expenses to the indemnitee and for the reimbursement to us if it is found that such indemnitee is not entitled to such indemnification under applicable law and our amended and restated bylaws.
MATERIAL U.S. FEDERAL INCOME TAX CONSEQUENCES TO NON-U.S.NON‑U.S. HOLDERSNon-U.S.Non‑U.S. Holders (as defined below) of the purchase, ownership and disposition of our common stock issued pursuant to this offering, but does not purport to be a complete analysis of all potential tax effects. The effects of other U.S. federal tax laws, such as estate and gift tax laws, and any applicable state, local or non-U.S.non‑U.S. tax laws are not discussed. This discussion is based on the U.S. Internal Revenue Code of 1986, as amended (the "Code"“Code”), Treasury regulations promulgated thereunder ("(“Treasury Regulations"Regulations”), judicial decisions, and published rulings and administrative pronouncements of the U.S. Internal Revenue Service (the "IRS"“IRS”), in each case as in effect as of the date hereof. These authorities may change or be subject to differing interpretations. Any such change or differing interpretation may be applied retroactively in a manner that could adversely affect a Non-U.S.Non‑U.S. Holder of our common stock. We have not sought and will not seek any rulings from the IRS regarding the matters discussed below. There can be no assurance the IRS or a court will not take a contrary position to those discussed below regarding the tax consequences of the purchase, ownership and disposition of our common stock.Non-U.S.Non‑U.S. Holders that hold our common stock as a "capital asset"“capital asset” within the meaning of Section 1221 of the Code (generally, property held for investment). This discussion does not address all U.S. federal income tax consequences relevant to a Non-U.S. Holder'sNon‑U.S. Holder’s particular circumstances, including the impact of the Medicare contribution tax on net investment income. In addition, it does not address consequences relevant to Non-U.S.Non‑U.S. Holders subject to special rules, including, without limitation:•long-termlong‑term residents of the United States;••••••"" "passive” “passive foreign investment companies,"” and corporations that accumulate earnings to avoid U.S. federal income tax;••tax-exempt•••"funds"funds” (within the meaning of Section 897(1)(2) of the Code and entities, all of the interests of which are held by qualified foreign pension funds); and•tax-qualifiedNON-U.S.NON‑U.S. TAXING JURISDICTION OR UNDER ANY APPLICABLE INCOME TAX TREATY.Non-U.S.Non‑U.S. Holder"Non-U.S. Holder"“Non‑U.S. Holder” is any beneficial owner of our common stock that is neither a "U.S. person"“U.S. person” nor an entity treated as a partnership for U.S. federal income tax purposes. A U.S. person is any person that, for U.S. federal income tax purposes, is or is treated as any of the following:••••"United“United States persons"persons” (within the meaning of Section 7701(a)(30) of the Code), or (2) has a valid election in effect to be treated as a United States person for U.S. federal income tax purposes."Dividend Policy"“Dividend Policy” we do not anticipate declaring or paying dividends to holders of our common stock in the foreseeable future. However, if we do make distributions of cash or property on our common stock, such distributions will constitute dividends for U.S. federal income tax purposes to the extent paid from our current or accumulated earnings and profits, as determined under U.S. federal income tax principles. Amounts not treated as dividends for U.S. federal income tax purposes will constitute a return of capital and first be applied against and reduce a Non-U.S. Holder'sNon‑U.S. Holder’s adjusted tax basis in its common stock, but not below zero. Any excess will be treated as capital gain and will be treated as described below under "—“—Sale or Other Taxable Disposition."Non-U.S.Non‑U.S. Holder of our common stock will be subject to U.S. federal withholding tax at a rate of 30% of the gross amount of the dividends (or such lower rate specified by an applicable income tax treaty, provided the Non-U.S.Non‑U.S. Holder furnishes to us or our paying agent prior to the payment of dividends a valid IRS Form W-8BENW‑8BEN or W-8BEN-EW‑8BEN‑E (or other applicable documentation) certifying qualification for the lower treaty rate). A Non-U.S.Non‑U.S. Holder that does not timely furnish the required documentation, but that qualifies for a reduced treaty rate, may obtain a refund of any excess amounts withheld by timely filing an appropriate claim for refund with the IRS. Non-U.S.Non‑U.S. Holders should consult their tax advisors regarding their entitlement to benefits under any applicable income tax treaty.Non-U.S.Non‑U.S. Holder are effectively connected with the Non-U.S. Holder'sNon‑U.S. Holder’s conduct of a trade or business within the United States (and, if required by an applicable income tax treaty, the Non-U.S.Non‑U.S. Holder maintains a permanent establishment in the United States to which such dividends are attributable), the Non-U.S.Non‑U.S. Holder will be exempt from the U.S. federal withholding tax described above. To claim the exemption, the Non-U.S.Non‑U.S. Holder must furnish to the applicable withholding agent a valid IRS Form W-8ECI,W‑8ECI, certifying that the dividends are effectively connected with the Non-U.S. Holder'sNon‑U.S. Holder’s conduct of a trade or business within the United States.Non-U.S.Non‑U.S. Holder that is a corporation also may be subject to a branch profits tax atdividends. Non-U.S. Holders should consult their tax advisors regarding any applicable tax treaties that may provide for different rules.Sale or Other Taxable DispositionNon-U.S. Holder will not be subject to Non‑U.S. federal income tax on any gain realized upon the sale or other taxable disposition of our common stock unless:•the gain is effectively connected with the Non-U.S. Holder's conduct of a trade or business within the United States (and, if required by an applicable income tax treaty, the Non-U.S. Holder maintains a permanent establishment in the United States to which such gain is attributable);•the Non-U.S. Holder is a nonresident alien individual present in the United States for 183 days or more during the taxable year of the disposition and certain other requirements are met; or•our common stock constitutes a United States real property interest ("USRPI") by reason of our status as a United States real property holding corporation ("USRPHC") for U.S. federal income tax purposes. Gain described in the first bullet point above generally will be subject to U.S. federal income tax on a net income basis at the regular graduated rates. A Non-U.S. Holder that is a corporation also may be subject to a branch profits tax at a rate of 30% (or such lower rate specified by an applicable income tax treaty) on its effectively connected earnings and profits (as adjusted for certain items), which will include such effectively connected gain. A Non-U.S. Holder described in the second bullet point above will be subject to U.S. federal income tax at a rate of 30% (or such lower rate specified by an applicable income tax treaty) on any gain derived from the disposition, which may generally be offset by U.S. source capital losses of the Non-U.S.Non‑U.S. Holder (even though the individual is not considered a resident of the United States), provided the Non-U.S.Non‑U.S. Holder has timely filed U.S. federal income tax returns with respect to such losses.non-U.S.non‑U.S. real property interests and our other business assets, there can be no assurance we currently are not a USRPHC or will not become one in the future. Even if we are or were to become a USRPHC, gain arising from the sale or other taxable disposition by a Non-U.S.Non‑U.S. Holder of our common stock will not be subject to U.S. federal income tax if our common stock is "regularly“regularly traded,"” as defined by applicable Treasury Regulations, on an established securities market, and such Non-U.S.Non‑U.S. Holder owned, actually and constructively, 5% or less of our common stockfive-yearfive‑year period ending on the date of the sale or other taxable disposition or the Non-U.S. Holder'sNon‑U.S. Holder’s holding period. If we were to become a USRPHC and our common stock were not considered to be "regularly traded"“regularly traded” on an established securities market during the calendar year in which the relevant disposition by a Non-U.S.Non‑U.S. holder occurs, such Non-U.S.Non‑U.S. holder (regardless of the percentage of stock owned) would be subject to U.S. federal income tax on a sale or other taxable disposition of our common stock and a 15% withholding tax would apply to the gross proceeds from such disposition. Non-U.S.Non-U.S.Non‑U.S. Holder is a United States person and the Non-U.S.Non‑U.S. Holder either certifies its non-U.S.non‑U.S. status, such as by furnishing a valid IRS Form W-8BEN, W-8BEN-EW‑8BEN, W‑8BEN‑E or W-8ECI,W‑8ECI, or otherwise establishes an exemption. However, information returns areNon-U.S.Non‑U.S. Holder, regardless of whether any tax was actually withheld. In addition, proceeds of the sale or other taxable disposition of our common stock within the United States or conducted through certain U.S.-relatedU.S.‑related brokers generally will not be subject to backup withholding or information reporting if the applicable withholding agent receives the certification described above and does not have actual knowledge or reason to know that such Non-U.S.Non‑U.S. Holder is a United States person, or the Non-U.S.Non‑U.S. Holder otherwise establishes an exemption. Proceeds of a disposition of our common stock conducted through a non-U.S.non‑U.S. office of a non-U.S.non‑U.S. broker generally will not be subject to backup withholding or information reporting.Non-U.S.Non‑U.S. Holder resides or is established.Non-U.S. Holder'sNon‑U.S. Holder’s U.S. federal income tax liability, provided the required information is timely furnished to the IRS."FATCA"“FATCA”) on certain types of payments made to non-U.S.non‑U.S. financial institutions and certain other non-U.S.non‑U.S. entities. Specifically, a 30% withholding tax may be imposed on dividends on, or gross proceeds from the sale or other disposition of, our common stock paid to a "foreign“foreign financial institution"institution” or a "non-financial“non‑financial foreign entity"entity” (each as defined in the Code) (including, in some cases, when such foreign financial institution or non-financialnon‑financial foreign entity is acting as an intermediary), unless (1) the foreign financial institution undertakes certain diligence and reporting obligations, (2) the non-financialnon‑financial foreign entity either certifies it does not have any "substantial“substantial United States owners"owners” (as defined in the Code) or furnishes identifying information regarding each direct and indirect substantial United States owner, or (3) the foreign financial institution or non-financialnon‑financial foreign entity otherwise qualifies for an exemption from these rules. If the payee is a foreign financial institution and is subject to the diligence and reporting requirements in (1) above, it must enter into an agreement with the U.S. Department of the Treasury requiring, among other things, that it undertake to identify accounts held by certain "specified“specified United States persons"persons” or "United States-owned“United States‑owned foreign entities"entities” (eachnon-compliantnon‑compliant foreign financial institutions and certain other account holders. Foreign financial institutions located in jurisdictions that have an intergovernmental agreement with the United States governing FATCA may be subject to different rules. The company, the selling stockholders and the underwriters named below have entered into an underwriting agreement with respect to the shares being offered. Subject to certain conditions, each underwriter has severally agreed to purchase the number of shares indicated in the following table. Goldman, Sachs & Co. and Barclays Capital Inc. are the representatives of the underwriters.UnderwritersNumber ofShares Goldman, Sachs & Co.Barclays Capital Inc. Credit Suisse Securities (USA) LLCJ.P. Morgan Securities LLC Evercore Group L.L.C.Piper Jaffray & Co. RBC Capital Markets, LLCRaymond James & Associates, Inc. Tudor, Pickering, Holt & Co. Securities, Inc.Deutsche Bank Securities Inc. Johnson Rice & Company L.L.C.Total The underwriters are committed to take and pay for all of the shares being offered, if any are taken, other than the shares covered by the option described below unless and until this option is exercised. The underwriters have an option to buy up to an additional shares from the company and the selling stockholders to cover sales by the underwriters of a greater number of shares than the total number set forth in the table above. They may exercise that option for 30 days. If any shares are purchased pursuant to this option, the underwriters will severally purchase shares in approximately the same proportion as set forth in the table above. The following table shows the per share and total underwriting discounts and commissions to be paid to the underwriters by the company and the selling stockholders. Such amounts are shown assuming both no exercise and full exercise of the underwriters' option to purchase additional shares.Per ShareTotal WithoutOptionExercise WithOptionExercise WithoutOptionExercise WithOptionExercise Underwriting Discounts and Commissions paid by us$$$$Underwriting Discounts and Commissions paid by the selling stockholders$$$$ The expenses of this offering that have been paid or are payable by us are estimated to be approximately $1.8 million (excluding underwriting discounts and commissions). We have agreed to pay expenses incurred by the selling stockholders in connection with this offering, other than the underwriting discounts and commissions. We have also agreed to reimburse the underwriters for certain of their expenses in an amount up to $ . Shares sold by the underwriters to the public will initially be offered at the initial public offering price set forth on the cover of this prospectus. Any shares sold by the underwriters to securitiesdealers may be sold at a discount of up to $ per share from the initial public offering price. After the initial offering of the shares, the representatives may change the offering price and the other selling terms. The offering of the shares by the underwriters is subject to receipt and acceptance and subject to the underwriters' right to reject any order in whole or in part. The company and its officers, directors, and holders of substantially all of the company's common stock have agreed with the underwriters, subject to certain exceptions, not to dispose of or hedge any of their common stock or securities convertible into or exchangeable for shares of common stock, and the Company has agreed not to file a registration statement in respect of any common stock or securities convertible or exchangeable into common stock, during the period from the date of this prospectus continuing through the date 180 days after the date of this prospectus, except with the prior written consent of Goldman, Sachs & Co. and Barclays Capital Inc. This agreement does not apply to any existing employee benefit plans or to the registration of the sale of shares issuable upon conversion of our Series A Preferred Stock, as required by the registration rights agreement with the holders of Series A Preferred Stock. See "Shares Available for Future Sale" for a discussion of certain transfer restrictions. Prior to the offering, there has been no public market for the shares. The initial public offering price has been negotiated among the company and the representatives. Among the factors to be considered in determining the initial public offering price of the shares, in addition to prevailing market conditions, will be the company's historical performance, estimates of the business potential and earnings prospects of the company, an assessment of the company's management and the consideration of the above factors in relation to market valuation of companies in related businesses. An application has been made to list our common stock on under the symbol "PUMP." In order to meet one of the requirements for listing the common stock on , the underwriters have undertaken to sell lots of 100 or more shares to a minimum of 400 beneficial holders. In connection with the offering, the underwriters may purchase and sell shares of common stock in the open market. These transactions may include short sales, stabilizing transactions and purchases to cover positions created by short sales. Short sales involve the sale by the underwriters of a greater number of shares than they are required to purchase in the offering, and a short position represents the amount of such sales that have not been covered by subsequent purchases. A "covered short position" is a short position that is not greater than the amount of additional shares for which the underwriters' option described above may be exercised. The underwriters may cover any covered short position by either exercising their option to purchase additional shares or purchasing shares in the open market. In determining the source of shares to cover the covered short position, the underwriters will consider, among other things, the price of shares available for purchase in the open market as compared to the price at which they may purchase additional shares pursuant to the option described above. "Naked" short sales are any short sales that create a short position greater than the amount of additional shares for which the option described above may be exercised. The underwriters must cover any such naked short position by purchasing shares in the open market. A naked short position is more likely to be created if the underwriters are concerned that there may be downward pressure on the price of the common stock in the open market after pricing that could adversely affect investors who purchase in the offering. Stabilizing transactions consist of various bids for or purchases of common stock made by the underwriters in the open market prior to the completion of the offering. The underwriters may also impose a penalty bid. This occurs when a particular underwriter repays to the underwriters a portion of the underwriting discount received by it because therepresentatives have repurchased shares sold by or for the account of such underwriter in stabilizing or short covering transactions. Purchases to cover a short position and stabilizing transactions, as well as other purchases by the underwriters for their own accounts, may have the effect of preventing or retarding a decline in the market price of the company's stock, and together with the imposition of the penalty bid, may stabilize, maintain or otherwise affect the market price of the common stock. As a result, the price of the common stock may be higher than the price that otherwise might exist in the open market. The underwriters are not required to engage in these activities and may end any of these activities at any time. These transactions may be effected on , in the over-the-counter market or otherwise.European Economic Area In relation to each Member State of the European Economic Area which has implemented the Prospectus Directive (each, a "Relative Member State") an offer to the public of our common shares may not be made in that Relevant Member State, except that an offer to the public in that Relevant Member State of our common shares may be made at any time under the following exemptions under the Prospectus Directive:•To any legal entity which is a qualified investor as defined in the Prospectus Directive;•To fewer than 150 natural or legal persons (other than qualified investors as defined in the Prospectus Directive), subject to obtaining the prior consent of the representatives for any such offer; or•In any other circumstances falling within Article 3(2) of the Prospectus Directive;provided that no such offer or shares of our common stock shall result in a requirement for the publication by us or any Brazilian placement agent of a prospectus pursuant to Article 3 of the Prospectus Directive. For the purposes of this provision, the expression an "offer to public" in relation to our common shares in any Relevant Member State means the communication in any form and by any means of sufficient information on the terms of the offer and our common shares to be offered so as to enable an investor to decide to purchase our common shares, as the same may be varied in that Member State by any measure implementing the Prospectus Directive in that Member State, the expression "Prospectus Directive" means Directive 2003/71/EC (as amended), including by Directive 2010/73/EU and includes any relevant implementing measure in the Relevant Member State. This European Economic Area selling restriction is in addition to any other selling restrictions set out below.United Kingdom In the United Kingdom, this prospectus is only addressed to and directed as qualified investors who are (i) investment professionals falling within Article 19(5) of the Financial Services and Markets Act 2000 (Financial Promotion) Order 2005 (the Order); or (ii) high net worth entities and other persons to whom it may lawfully be communicated, falling within Article 49(2)(a) to (d) of the Order (all such persons together being referred to as "relevant persons"). Any investment or investment activity to which this prospectus relates is available only to relevant persons and will only be engaged with relevant persons. Any person who is not a relevant person should not act or relay on this prospectus or any of its contents.Canada The securities may be sold in Canada only to purchasers purchasing, or deemed to be purchasing, as principal that are accredited investors, as defined in National Instrument 45-106 Prospectus Exemptions or subsection 73.3(1) of the Securities Act (Ontario), and are permitted clients, as defined in National Instrument 31-103 Registration Requirements, Exemptions, and Ongoing Registrant Obligations. Any resale of the securities must be made in accordance with an exemption form, or in a transaction not subject to, the prospectus requirements of applicable securities laws. Securities legislation in certain provinces or territories of Canada may provide a purchaser with remedies for rescission or damages if this offering memorandum (including any amendment thereto) contains a misrepresentation, provided that the remedies for rescission or damages are exercised by the purchaser within the time limit prescribed by the securities legislation of the purchaser's province or territory. The purchaser should refer to any applicable provisions of the securities legislation of the purchaser's province or territory of these rights or consult with a legal advisor. Pursuant to section 3A.3 of National Instrument 33-105 Underwriting Conflicts (NI 33-105), the underwriters are not required to comply with the disclosure requirements of NI 33-105 regarding underwriter conflicts of interest in connection with this offering.Hong Kong The shares may not be offered or sold in Hong Kong by means of any document other than (i) in circumstances which do not constitute an offer to the public within the meaning of the Companies (Winding Up and Miscellaneous Provisions) Ordinance (Cap. 32 of the Laws of Hong Kong) ("Companies (Winding Up and Miscellaneous Provisions) Ordinance") or which do not constitute an invitation to the public within the meaning of the Securities and Futures Ordinance (Cap. 571 of the Laws of Hong Kong) ("Securities and Futures Ordinance"), or (ii) to "professional investors" as defined in the Securities and Futures Ordinance and any rules made thereunder, or (iii) in other circumstances which do not result in the document being a "prospectus" as defined in the Companies (Winding Up and Miscellaneous Provisions) Ordinance, and no advertisement, invitation or document relating to the shares may be issued or may be in the possession of any person for the purpose of issue (in each case whether in Hong Kong or elsewhere), which is directed at, or the contents of which are likely to be accessed or read by, the public in Hong Kong (except if permitted to do so under the securities laws of Hong Kong) other than with respect to shares which are or are intended to be disposed of only to persons outside Hong Kong or only to "professional investors" in Hong Kong as defined in the Securities and Futures Ordinance and any rules made thereunder.Singapore This prospectus has not been registered as a prospectus with the Monetary Authority of Singapore. Accordingly, this prospectus and any other document or material in connection with the offer or sale, or invitation for subscription or purchase, of the shares may not be circulated or distributed, nor may the shares be offered or sold, or be made the subject of an invitation for subscription or purchase, whether directly or indirectly, to persons in Singapore other than (i) to an institutional investor (as defined under Section 4A of the Securities and Futures Act, Chapter 289 of Singapore (the "SFA")) under Section 274 of the SFA, (ii) to a relevant person (as defined in Section 275(2) of the SFA) pursuant to Section 275(1) of the SFA, or any person pursuant to Section 275(1A) of the SFA, and in accordance with the conditions specified in Section 275 of theSFA or (iii) otherwise pursuant to, and in accordance with the conditions of, any other applicable provision of the SFA, in each case subject to conditions set forth in the SFA. Where the shares are subscribed or purchased under Section 275 of the SFA by a relevant person which is a corporation (which is not an accredited investor (as defined in Section 4A of the SFA)) the sole business of which is to hold investments and the entire share capital of which is owned by one or more individuals, each of whom is an accredited investor, the securities (as defined in Section 239(1) of the SFA) of that corporation shall not be transferable for 6 months after that corporation has acquired the shares under Section 275 of the SFA except: (1) to an institutional investor under Section 274 of the SFA or to a relevant person (as defined in Section 275(2) of the SFA), (2) where such transfer arises from an offer in that corporation's securities pursuant to Section 275(1A) of the SFA, (3) where no consideration is or will be given for the transfer, (4) where the transfer is by operation of law, (5) as specified in Section 276(7) of the SFA, or (6) as specified in Regulation 32 of the Securities and Futures (Offers of Investments) (Shares and Debentures) Regulations 2005 of Singapore ("Regulation 32") Where the shares are subscribed or purchased under Section 275 of the SFA by a relevant person which is a trust (where the trustee is not an accredited investor (as defined in Section 4A of the SFA)) whose sole purpose is to hold investments and each beneficiary of the trust is an accredited investor, the beneficiaries' rights and interest (howsoever described) in that trust shall not be transferable for 6 months after that trust has acquired the shares under Section 275 of the SFA except: (1) to an institutional investor under Section 274 of the SFA or to a relevant person (as defined in Section 275(2) of the SFA), (2) where such transfer arises from an offer that is made on terms that such rights or interest are acquired at a consideration of not less than S$200,000 (or its equivalent in a foreign currency) for each transaction (whether such amount is to be paid for in cash or by exchange of securities or other assets), (3) where no consideration is or will be given for the transfer, (4) where the transfer is by operation of law, (5) as specified in Section 276(7) of the SFA, or (6) as specified in Regulation 32.Japan The securities have not been and will not be registered under the Financial Instruments and Exchange Act of Japan (Act No. 25 of 1948, as amended), or the FIEA. The securities may not be offered or sold, directly or indirectly, in Japan or to or for the benefit of any resident of Japan (including any person resident in Japan or any corporation or other entity organized under the laws of Japan) or to others for reoffering or resale, directly or indirectly, in Japan or to or for the benefit of any resident of Japan, except pursuant to an exemption from the registration requirements of the FIEA and otherwise in compliance with any relevant laws and regulations of Japan.Directed Share Program At our request, the underwriters have reserved for sale at the initial public offering price up to of the shares offered hereby (approximately %) for officers, directors, employees and certain other persons associated with us. The number of shares available for sale to the general public will be reduced to the extent such persons purchase such reserved shares. Any reserved shares not so purchased will be offered by the underwriters to the general public on the same basis as the other shares offered hereby. Any participants in this program shall be prohibited from selling, pledging or assigning any shares sold to them pursuant to this program for a period of days after the date of this prospectus. The company and the selling shareholders have agreed to indemnify the several underwriters against certain liabilities, including liabilities under the Securities Act of 1933. The underwriters and their respective affiliates are full service financial institutions engaged in various activities, which may include sales and trading, commercial and investment banking, advisory, investment management, investment research, principal investment, hedging, market making, brokerage and other financial and non-financial activities and services. Certain of the underwriters and their respective affiliates have provided, and may in the future provide, a variety of these services to the issuer and to persons and entities with relationships with the issuer, for which they received or will receive customary fees and expenses. In the ordinary course of their various business activities, the underwriters and their respective affiliates, officers, directors and employees may purchase, sell or hold a broad array of investments and actively trade securities, derivatives, loans, commodities, currencies, credit default swaps and other financial instruments for their own account and for the accounts of their customers, and such investment and trading activities may involve or relate to assets, securities and/or instruments of the issuer (directly, as collateral securing other obligations or otherwise) and/or persons and entities with relationships with the issuer. The underwriters and their respective affiliates may also communicate independent investment recommendations, market color or trading ideas and/or publish or express independent research views in respect of such assets, securities or instruments and may at any time hold, or recommend to clients that they should acquire, long and/or short positions in such assets, securities and instruments. Certain legal matters in connection with this offering will be passed upon for the underwriters by Vinson & Elkins L.L.P., Houston, Texas.Prospectusprospectus have been audited by Deloitte & Touche LLP, an independent registered public accounting firm, as stated in their report appearing herein. Such consolidated financial statements have been so included in reliance upon the report of such firm given upon their authority as experts in accounting and auditing.S-1S‑1 relating to the shares of common stock offered by this prospectus. This prospectus, which constitutes a part of the registration statement, does not contain all of the information set forth in the registration statement. For further information regarding us and the shares of common stock offered by this prospectus, we refer you to the full registration statement, including its exhibits and schedules, filed under the Securities Act. The registration statement, of which this prospectus constitutes a part, including its exhibits and schedules, may be inspected and copied at the SEC'sSEC’s Public Reference Room at 100 F Street, N.E., Washington, D.C. 20549. Copies of the materials may also be obtained from the SEC at prescribed rates by writing to the Public Reference Room. You may obtain information on the operation of the Public Reference Room by calling the SEC at 1-800-SEC-0330.SEC'sSEC’s website. After the completion of this offering, we will file with or furnish to the SEC periodic reports and other information. These reports and other information may be inspected and copied at the Public Reference Room maintained by the SEC or obtained from the SEC'sSEC’s website as provided above. Following the completion of this offering, ourOur website will beis located atwww. .comhttp://www.propetroservices.com.. We intend to make our periodic reports and other information filed with or furnished to the SEC available, free of charge, through our website, as soon as reasonably practicable after those reports and other information are electronically filed with or furnished to the SEC. Information on our website or any other website is not incorporated by reference into this prospectus and does not constitute a part of this prospectus.10-Q,10‑Q, for the first three fiscal quarters of each fiscal year.FORWARD-LOOKINGforward-lookingforward‑looking statements. Statements that are predictive in nature, that depend upon or refer to future events or conditions or that include the words "may," "could," "plan," "project," "budget," "predict," "pursue," "target," "seek," "objective," "believe," "expect," "anticipate," "intend," "estimate,"“may,” “could,” “plan,” “project,” “budget,” “predict,” “pursue,” “target,” “seek,” “objective,” “believe,” “expect,” “anticipate,” “intend,” “estimate,” and other expressions that are predictions of or indicate future events and trends and that do not relate to historical matters identify forward-lookingforward‑looking statements. Our forward-lookingforward‑looking statements include statements about our business strategy, our industry, our future profitability, our expected capital expenditures and the impact of such expenditures on our performance the costs of being a publicly traded corporation and our capital programs.forward-lookingforward‑looking statement may include a statement of the assumptions or bases underlying the forward-lookingforward‑looking statement. We believe that we have chosen these assumptions or bases in good faith and that they are reasonable. You are cautioned not to place undue reliance on any forward-lookingforward‑looking statements. You should also understand that it is not possible to predict or identify all such factors and should not consider the following list to be a complete statement of all potential risks and uncertainties. Factors that could cause our actual results to differ materially from the results contemplated by such forward-lookingforward‑looking statements include:••••long-termlong‑term supply of and demand for oil and natural gas;•third-partythird‑party operators;••••••••weather-relatedweather‑related delays, casualty losses and other matters beyond our control;•••forward-lookingforward‑looking statements. Although forward-lookingforward‑looking statements reflect our good faith beliefs at the time they are made, forward-lookingforward‑looking statements involve known and unknown risks, uncertainties and other factors, including the factors described under "Risk“Risk Factors,"” which may cause our actual results, performance or achievements to differ materially from anticipated future results, performance or achievements expressed orforward-lookingforward‑looking statements. We undertake no obligation to publicly update or revise any forward-lookingforward‑looking statement, whether as a result of new information, future events, changed circumstances or otherwise, unless required by law. These cautionary statements qualify all forward-lookingforward‑looking statements attributable to us or persons acting on our behalf.near-wellnear‑well formation damage and other damaging substances. This procedure commonly enhances production by increasing the effective well radius. When performed at pressures above the pressure required to fracture the formation, the procedure is often referred to as acid fracturing.liquidsliquids.open-holeopen‑hole intervals, it is possible that the well will bridge over (or seal itself with rock fragments from collapsing formations) down-holedown‑hole and intervention efforts will be averted.down-holedown‑hole tubulars and equipment required to enable safe and efficient production from an oil or gas well. The point at which the completion process begins may depend on the type and design of the well.Down-holeDown‑hole motors are used to increase the speed and efficiency of the drill bit or can be used to steer the bit in directional drilling operations. Drilling motors have become very popular because of horizontal and directional drilling applications and the increase of day rates for drilling rigs.re-completionre‑completion of unconventional oil and natural gas wells to stimulate and maintain oil and natural gas production through the process of hydraulic fracturing."directional“directional drilling,"” used where the departure of the wellbore from vertical exceeds about 80 degrees. Note that some horizontal wells are designed such that after reaching true 90-degree90‑degree horizontal, the wellbore may actually start drilling upward. In such cases, the angle past 90 degrees is continued, as in 95 degrees, rather than reporting it as deviation from vertical, which would then be 85 degrees. Because a horizontal well typically penetrates a greater length of the reservoir, it can offer significant production improvement over a vertical well.high-conductivityhigh‑conductivity communication with a large area of formation and bypasses any damage that may exist in the near-wellborenear‑wellbore area.gas-processinggas‑processing plants. Natural gas liquids can be classified according to their vapor pressures as low (condensate), intermediate (natural gasoline) and high (liquefied petroleum gas) vapor pressure.Earth'sEarth’s surface will initially be under pressure, often related to the hydrostatic column of ground waters above the reservoir. To produce, rocks must also have permeability, or the capacity to permit fluids to flow through them.man-mademan‑made or specially engineered proppants, such as resin-coatedresin‑coated sand or high-strengthhigh‑strength ceramic materials like sintered bauxite, may also be used. Proppant materials are carefully sorted for size and sphericity to provide an efficient conduit for production of fluid from the reservoir to the wellbore.fine-grained,fine‑grained, fissile, sedimentary rock formed by consolidation of clay-clay‑ and silt-sizedsilt‑sized particles into thin, relatively impermeable layers.near-wellborenear‑wellbore area. Stimulation in shale gas reservoirs typically takes the form of hydraulic fracturing treatments."unconventional"“unconventional” at any particular time is a complex function of resource characteristics, the available exploration and production technologies, the economic environment, and the scale, frequency and duration of production from the resource. Perceptions of these factorsThrough-tubingThrough‑tubing workover operations, using coiled tubing, snubbing or slickline equipment, are routinely conducted to complete treatments or well service activities that avoid a full workover where the tubing is removed. This operation saves considerable time and expense. Zipper frac.Zipperfrac. A hydraulic fracturing process where hydraulic fracturing operations are carried out concurrently at two or more parallel horizontal wellbores. In this process, one well holds frac pressure, while the adjacent well is stimulated through hydraulic fracturing. Hydraulic fracturing is alternated between each well, so the fracturing stages are placed opposite each other, resembling the teeth of a zipper.Audited Consolidated Financial Statements (Unaudited) F-3Consolidated StatementStatements of Operations for the yearthree and six months ended December 31, 2015F-6Notes to Consolidated Financial StatementsF-7Interim Condensed Consolidated Financial Statements (unaudited)Condensed Consolidated Balance Sheet as of September 30, 2016F-27Condensed Consolidated Statements of Operations for the nine months ended September 30, 2016 and 2015F-28Condensed Consolidated Statements of Changes in Shareholders' Equity for the nine months ended September 30, 2016 and 2015F-29ninesix months ended SeptemberJune 30, 2017 and 2016Audited Consolidated Financial Statements for the Years Ended December 31, 2016 and 2015F-302015: June 30, 2017 December 31, 2016 ASSETS Current Assets Cash and cash equivalents $ 25,108 $ 133,596 Accounts receivable - net of allowance for doubtful accounts of $512 and $552, respectively 147,820 115,179 Inventories 4,819 4,713 Prepaid expenses 6,933 4,608 Other current assets 3,689 6,684 Total current assets 188,369 264,780 PROPERTY AND EQUIPMENT - Net of accumulated depreciation 360,308 263,862 OTHER NONCURRENT ASSETS: Goodwill 9,425 9,425 Intangible assets - net of amortization 445 589 Deferred revenue rebate - net of amortization 1,539 2,462 Other noncurrent assets 1,830 304 Total other noncurrent assets 13,239 12,780 TOTAL ASSETS $ 561,916 $ 541,422 LIABILITIES AND SHAREHOLDERS’ EQUITY CURRENT LIABILITIES: Accounts payable $ 155,956 $ 129,093 Accrued liabilities 8,335 13,619 Current portion of long-term debt 6,337 16,920 Accrued interest payable — 109 Total current liabilities 170,628 159,741 DEFERRED INCOME TAXES 1,259 1,148 LONG-TERM DEBT 10,210 159,407 OTHER LONG-TERM LIABILITIES 122 117 Total liabilities 182,219 320,413 COMMITMENTS AND CONTINGENCIES (Note 9) SHAREHOLDERS’ EQUITY: — 17 Preferred stock, additional paid-in capital — 162,494 83 53 Additional paid-in capital 605,955 265,355 Accumulated deficit (226,341 ) (206,910 ) Total shareholders’ equity 379,697 221,009 TOTAL LIABILITIES AND SHAREHOLDERS’ EQUITY $ 561,916 $ 541,422 Three Months Ended June 30, Six Months Ended June 30, 2017 2016 2017 2016 REVENUE - Service revenue $ 213,492 $ 68,165 $ 385,423 $ 156,095 COSTS AND EXPENSES Cost of services (exclusive of depreciation and amortization) 176,777 64,849 326,342 145,139 General and administrative (inclusive of stock-based compensation) 7,916 5,536 27,776 11,340 Depreciation and amortization 12,706 10,794 23,857 21,879 Loss on disposal of assets 9,787 2,169 20,229 6,936 Total costs and expenses 207,186 83,348 398,204 185,294 OPERATING INCOME (LOSS) 6,306 (15,183 ) (12,781 ) (29,199 ) OTHER INCOME (EXPENSE): Interest expense (650 ) (5,977 ) (5,825 ) (11,392 ) Gain on extinguishment of debt — 6,975 — 6,975 Other expense (627 ) (14 ) (602 ) (312 ) Total other income (expense) (1,277 ) 984 (6,427 ) (4,729 ) INCOME (LOSS) BEFORE INCOME TAXES 5,029 (14,199 ) (19,208 ) (33,928 ) INCOME TAX (EXPENSE)/BENEFIT (108 ) 4,905 (223 ) 11,697 NET INCOME (LOSS) $ 4,921 $ (9,294 ) $ (19,431 ) $ (22,231 ) NET INCOME (LOSS) PER COMMON SHARE: Basic $ 0.06 $ (0.24 ) $ (0.28 ) $ (0.60 ) Diluted $ 0.06 $ (0.24 ) $ (0.28 ) $ (0.60 ) WEIGHTED AVERAGE COMMON SHARES OUTSTANDING: Basic 83,040 39,496 69,593 37,244 Diluted 86,279 39,496 69,593 37,244 Preferred Stock Common Stock Shares Amount Preferred Additional Paid-In Capital Shares Amount Additional Paid-In Capital Accumulated Deficit Total BALANCE - January 1, 2017 17,000 $ 17 $ 162,494 52,628 $ 53 $ 265,355 $ (206,910 ) $ 221,009 Stock-based compensation cost — — — — — 7,978 — 7,978 Initial Public Offering, net of costs — — — 13,250 13 170,128 — 170,141 Conversion of preferred stock to common at Initial Public Offering (17,000 ) (17 ) (162,494 ) 17,000 17 162,494 — — Exercise of stock options—net — — — 162 — — — — Net loss — — — — — — (19,431 ) (19,431 ) BALANCE - June 30, 2017 — $ — $ — 83,040 $ 83 $ 605,955 $ (226,341 ) $ 379,697 Six Months Ended June 30, 2017 2016 CASH FLOWS FROM OPERATING ACTIVITIES: Net loss $ (19,431 ) $ (22,231 ) Adjustments to reconcile net loss to net cash (used in) provided by
operating activities: Depreciation and amortization 23,857 21,879 Gain on extinguishment — (6,975 ) Deferred income tax expense (benefit) 111 (11,700 ) Amortization of deferred revenue rebate 923 923 Amortization of deferred debt issuance costs 3,240 1,468 Stock-based compensation 7,978 619 Loss on disposal of assets 20,229 6,936 (Gain) loss on interest rate swap (199 ) 96 Changes in operating assets and liabilities: Accounts receivable (32,641 ) 43,961 Other current assets 3,423 (445 ) Inventories (107 ) 3,421 Prepaid expenses (2,321 ) 2,360 Accounts payable (2,812 ) (39,247 ) Accrued liabilities (2,605 ) 988 Accrued interest (108 ) 10 Net cash (used in) provided by operating activities (463 ) 2,063 CASH FLOWS FROM INVESTING ACTIVITIES: Capital expenditures (112,630 ) (15,461 ) Proceeds from sale of assets 1,229 410 Net cash used in investing activities (111,401 ) (15,051 ) CASH FLOWS FROM FINANCING ACTIVITIES: Proceeds from borrowings 232 — Repayments of borrowings (163,128 ) (38,074 ) Repayments of insurance financing (2,476 ) (2,426 ) Debt extinguishment cost — (525 ) Payment of debt issuance costs (1,653 ) (115 ) Equity capitalization — 40,000 Proceeds from IPO 185,500 — Payment of IPO costs (15,099 ) — Net cash provided by (used in) financing activities 3,376 (1,140 ) NET DECREASE IN CASH AND CASH EQUIVALENTS (108,488 ) (14,128 ) CASH AND CASH EQUIVALENTS - Beginning of period 133,596 34,310 CASH AND CASH EQUIVALENTS - End of period $ 25,108 $ 20,182 TableAccordingly, any information related to, or dependent upon, the share or option counts in our comparative 2016 condensed consolidated financial statements (Unaudited) and Note 6, Net Income (Loss) per Share, Note 7, Stock‑BasedCompensation, and Note 10, Equity Capitalization, have been updated to reflect the effect of Contentsthe stock split. Estimated fair value measurements Balance ($ in thousands) June 30, 2017: Property and equipment, net $ — $ — $ — $ — $ — Goodwill $ — $ — $ — $ — $ — December 31, 2016: Property and equipment, net $ 8,700 $ — $ 8,700 $ — $ (6,305 ) Goodwill $ 9,425 $ — $ — $ 9,425 $ (1,177 ) ($ in thousands) 2017 2016 ABL Credit Facility $ — $ — 6.25% "Term loan" due September 2019 — 146,750 Revolving Credit Facility — 13,500 Equipment financing 16,547 19,193 Total debt 16,547 179,443 Less deferred loan costs, net of amortization — 3,116 Subtotal 16,547 176,327 Less current portion of long-term debt 6,337 16,920 Total long-term debt, net of deferred loan costs $ 10,210 $ 159,407 ($ in thousands) 2017 $ 3,081 2018 13,350 2019 77 2020 39 Total $ 16,547 Three months ended June 30, 2017 Six months ended June 30, 2017 ($ in thousands) Pressure Pumping All Other Total Pressure Pumping All Other Total Service revenue $ 203,591 $ 9,901 $ 213,492 $ 367,431 $ 17,992 $ 385,423 Adjusted EBITDA $ 31,362 $ (706 ) $ 30,656 $ 48,283 $ (1,399 ) $ 46,884 Depreciation and amortization $ 11,596 $ 1,110 $ 12,706 $ 21,591 $ 2,266 $ 23,857 Goodwill $ 9,425 $ — $ 9,425 $ 9,425 $ — $ 9,425 Capital expenditures $ 86,302 $ 1,047 $ 87,349 $ 141,345 $ 2,466 $ 143,811 Total assets $ 527,648 $ 34,268 $ 561,916 $ 527,648 $ 34,268 $ 561,916 Three months ended June 30, 2016 Six months ended June 30, 2016 Pressure Pumping All Other Total Pressure Pumping All Other Total Service revenue $ 62,167 $ 5,998 $ 68,165 $ 141,712 $ 14,383 $ 156,095 Adjusted EBITDA $ 529 $ (2,336 ) $ (1,807 ) $ 3,549 $ (3,314 ) $ 235 Depreciation and amortization $ 9,222 $ 1,572 $ 10,794 $ 18,631 $ 3,248 $ 21,879 Goodwill $ 9,425 $ 1,177 $ 10,602 $ 9,425 $ 1,177 $ 10,602 Capital expenditures $ 3,452 $ 105 $ 3,557 $ 9,942 $ 110 $ 10,052 Total assets at December 31, 2016 $ 501,906 $ 39,516 $ 541,422 $ 501,906 $ 39,516 $ 541,422 Three months ended June 30, 2017 Six months ended June 30, 2017 ($ in thousands) Pressure Pumping All Other Total Pressure Pumping All Other Total Net income (loss) $ 9,633 $ (4,712 ) $ 4,921 $ 1,715 $ (21,146 ) $ (19,431 ) Depreciation and amortization 11,596 1,110 12,706 21,591 2,266 23,857 Interest expense — 650 650 — 5,825 5,825 Income tax expense — 108 108 — 223 223 Loss/(gain) on disposal of assets 9,681 106 9,787 20,391 (162 ) 20,229 Stock-based compensation — 609 609 — 7,978 7,978 Other expense — 627 627 — 602 602 — 572 572 — 572 572 Deferred IPO bonus expense 452 224 676 4,586 2,443 7,029 Adjusted EBITDA $ 31,362 $ (706 ) $ 30,656 $ 48,283 $ (1,399 ) $ 46,884 Three months ended June 30, 2016 Six months ended June 30, 2016 ($ in thousands) Pressure Pumping All Other Total Pressure Pumping All Other Total Net income (loss) $ (11,390 ) $ 2,096 $ (9,294 ) $ (22,550 ) $ 319 $ (22,231 ) Depreciation and amortization 9,222 1,572 10,794 18,631 3,248 21,879 Interest expense — 5,977 5,977 — 11,392 11,392 Income tax benefit — (4,905 ) (4,905 ) — (11,697 ) (11,697 ) Loss/(gain) on disposal of assets 2,697 (528 ) 2,169 7,468 (532 ) 6,936 Stock-based compensation — 413 413 — 619 619 Gain on extinguishment of debt — (6,975 ) (6,975 ) — (6,975 ) (6,975 ) Other expense — 14 14 — 312 312 Adjusted EBITDA $ 529 $ (2,336 ) $ (1,807 ) $ 3,549 $ (3,314 ) $ 235 Three Months Ended June 30, Six Months Ended June 30, (In thousands, except for per share data) 2017 2016 2017 2016 Numerator (both basic and diluted) Net income (loss) relevant to common stockholders $ 4,921 $ (9,294 ) $ (19,431 ) $ (22,231 ) Denominator Denominator for basic income (loss) per share 83,040 39,496 69,593 37,244 Dilutive effect of stock options 2,867 — — — Dilutive effect of performance stock units — — — — Dilutive effect of non-vested restricted stock 372 — — — Denominator for diluted income (loss) per share 86,279 39,496 69,593 37,244 Basic income (loss) per common share $ 0.06 $ (0.24 ) $ (0.28 ) $ (0.60 ) Diluted income (loss) per common share $ 0.06 $ (0.24 ) $ (0.28 ) $ (0.60 ) Three Months Ended June 30, Six Months Ended June 30, (In thousands) 2017 2016 2017 2016 Stock options 793 3,371 4,640 3,371 Performance stock units 170 — 170 — Non-vested restricted stock 319 372 692 372 1,282 3,743 5,502 3,743 Expected volatility 45 % Expected dividends $ — Expected term (in years) 6.25 Risk free rate 1.35 % Expected volatility 45 % Expected dividends $ — Expected term (in years) 6.25 Risk free rate 1.83 % Expected volatility 55 % Expected dividends $ — Expected term (in years) 5.8 Risk free rate 1.22 % Expected volatility 18 % Expected dividends $ — Expected term (in years) 6.25 Risk free rate 2.23 % Number
of Shares Weighted
Average
Exercise
Price Weighted
Average
Grant‑Date
Fair ValueOutstanding at January 1, 2016 3,485,791 $ 3.96 $ 1.77 Granted 1,274,549 $ 2.25 $ 1.77 Exercised — $ — $ — Forfeited (114,456 ) $ 3.96 $ 1.77 Expired — $ — $ — Outstanding at December 31, 2016 4,645,884 $ 3.49 $ 1.77 Exercisable at December 31, 2016 2,354,466 $ 3.77 $ 1.77 Outstanding at January 1, 2017 4,645,884 $ 3.49 $ 1.77 Granted 793,738 $ 14.00 $ 3.35 Exercised (226,194 ) $ 3.96 $ 1.77 Forfeited (1,088 ) $ 14.00 $ 3.35 Expired — $ — $ — Canceled (571,927 ) $ 3.96 $ 1.77 Outstanding at June 30, 2017 4,640,413 $ 5.20 $ 2.04 Exercisable at June 30, 2017 3,847,763 $ 3.39 $ 1.77 Number of
Shares Weighted
Average
Grant Date
Fair ValueOutstanding at January 1, 2017 372,335 $ 3.89 Granted 691,585 $ 13.65 Vested — $ — Exercised — $ — Forfeited — $ — Canceled (372,335 ) $ 3.89 Outstanding at June 30, 2017 691,585 $ 13.65 Period
Granted Target Shares
Outstanding at
Beginning
of Period Target
Shares
Granted Target Shares Vested Target
Shares
Forfeited Target Shares
Outstanding
at End
of Period Weighted
Average
Grant Date
Fair Value per
Share2017 — 169,635 — — 169,635 $10.73 Total — 169,635 — — 169,635 ($ in thousands) 2017 $ 232 2018 426 2019 366 2020 344 2021 and thereafter 774 Total $ 2,142
and Shareholders ofsheetsheets of ProPetro Holding Corp. and Subsidiary (the "Company"“Company”), as of December 31, 2016 and 2015, and the related consolidated statements of operations, shareholders'changes in shareholders’ equity, and cash flows for each of the year then ended.two years in the period ended December 31, 2016. These consolidated financial statements are the responsibility of the Company'sCompany’s management. Our responsibility is to express an opinion on these consolidated financial statements based on our audit.auditaudits in accordance with the standards of the Public Company Accounting Oversight Board (United States) and in accordance with auditing standards generally accepted in the United States of America.. Those standards require that we plan and perform the audit to obtain reasonable assurance about whether the consolidated financial statements are free of material misstatement. The Company is not required to have, nor were we engaged to perform, an audit of its internal control over financial reporting. Our auditaudits included consideration of internal control over financial reporting as a basis for designing audit procedures that are appropriate in the circumstances, but not for the purpose of expressing an opinion on the effectiveness of the Company'sCompany’s internal control over financial reporting. Accordingly, we express no such opinion.opinion. An audit also includes examining, on a test basis, evidence supporting the amounts and disclosures in the consolidated financial statements, assessing the accounting principles used and significant estimates made by management, as well as evaluating the overall financial statement presentation. We believe that our auditaudits provide a reasonable basis for our opinion.year thentwo years in the period ended December 31, 2016, in conformity with accounting principles generally accepted in the United States of America./s/ DELOITTE & TOUCHE LLPHouston, TexasDecember 15, 2016 (January 20,Houston, Texas reverse stock split as described in Note 1)Table of Contents
PROPETRO HOLDING CORP. AND SUBSIDIARY
CONSOLIDATED BALANCE SHEETSHEETS
AS OF DECEMBER 31, 2016 AND 2015 2015
$ 34,310,323 90,290,905 8,572,015 4,488,180 803,828 138,465,251 291,838,498 10,602,147 877,027 4,307,921 363,490 16,150,585 $ 446,454,334
$ 87,365,143 7,051,915 16,295,302 76,794 110,789,154
29,120,052
236,875,829
98,068 376,883,103
24,133 223,309,211 (153,762,113 ) 69,571,231 $ 446,454,334 2016 2015 ASSETS CURRENT ASSETS: Cash and cash equivalents $ 133,595,602 $ 34,310,323 Accounts receivable — net of allowance for doubtful accounts of $551,909 and $845,681, respectively 115,178,992 90,290,905 Inventories 4,712,850 8,572,015 Prepaid expenses 4,608,862 4,488,180 Other current assets 6,683,739 803,828 Total current assets 264,780,045 138,465,251 PROPERTY AND EQUIPMENT — Net of accumulated depreciation 263,861,645 291,838,498 OTHER NONCURRENT ASSETS: Goodwill 9,424,999 10,602,147 Intangible assets — net of amortization 589,039 877,027 Deferred revenue rebate — net of amortization 2,461,669 4,307,921 Other noncurrent assets 304,901 363,490 Total other noncurrent assets 12,780,608 16,150,585 TOTAL ASSETS $ 541,422,298 $ 446,454,334 LIABILITIES AND SHAREHOLDERS’ EQUITY CURRENT LIABILITIES: Accounts payable $ 129,092,821 $ 87,365,143 Accrued liabilities 13,619,471 7,051,915 Current portion of long‑term debt 16,920,074 16,295,302 Accrued interest payable 108,337 76,794 Total current liabilities 159,740,703 110,789,154 DEFERRED INCOME TAXES 1,148,470 29,120,052 LONG‑TERM DEBT — Net of deferred loan costs 159,407,085 236,875,829 OTHER LONG‑TERM LIABILITIES 116,553 98,068 Total liabilities 320,412,811 376,883,103 COMMITMENTS AND CONTINGENCIES (Note 17) SHAREHOLDERS’ EQUITY: Preferred stock, $0.001 par value — 30,000,000 shares authorized and 16,999,990 and 0 shares issued and outstanding at 2016 and 2015, respectively 17,000 — Preferred stock, additional paid‑in capital 162,494,174 — Common stock, $0.001 par value — 200,000,000 shares authorized and 52,627,652 and 34,992,662 shares issued and outstanding at 2016 and 2015, respectively 52,628 34,993 Common stock, additional paid‑in capital 265,355,194 223,298,351 Accumulated deficit (206,909,509) (153,762,113) Total shareholders’ equity 221,009,487 69,571,231 TOTAL LIABILITIES AND SHAREHOLDERS’ EQUITY $ 541,422,298 $ 446,454,334
CONSOLIDATED STATEMENTS OF OPERATIONS
FOR THE YEARS ENDED DECEMBER 31, 2016 AND 2015 2016 2015 REVENUE — Total service revenue $ 436,920,270 $ 569,617,758 COSTS AND EXPENSES: Cost of services (exclusive of depreciation and amortization) 404,140,241 483,337,584 General and administrative (inclusive of stock‑based compensation) 26,613,123 27,369,740 Depreciation and amortization 43,541,679 50,133,993 Property and equipment impairment expense 6,305,426 36,609,332 Goodwill impairment expense 1,177,148 — Loss on disposal of assets 22,528,670 21,267,985 Total costs and expenses 504,306,287 618,718,634 OPERATING LOSS (67,386,017) (49,100,876) OTHER INCOME (EXPENSE): Interest expense (20,386,695) (21,641,454) Gain on extinguishment of debt 6,974,805 — Other expense (321,071) (497,924) Total other expense (13,732,961) (22,139,378) LOSS BEFORE INCOME TAXES (81,118,978) (71,240,254) INCOME TAX BENEFIT (27,971,582) (25,387,570) NET LOSS $ (53,147,396 ) $ (45,852,684 ) NET LOSS PER COMMON SHARE: Basic $ (1.19 ) $ (1.31 ) Diluted $ (1.19 ) $ (1.31 ) WEIGHTED AVERAGE COMMON SHARES OUTSTANDING: Basic 44,786,687 34,992,662 Diluted 44,786,687 34,992,662
CONSOLIDATED STATEMENTS OF CHANGES IN SHAREHOLDERS’ EQUITY
FOR THE YEARS ENDED DECEMBER 31, 2016 AND 2015 Preferred
Stock Preferred
Additional
Paid‑In
Capital Common
Stock Common
Additional
Paid‑In
Capital Accumulated
Deficit Total BALANCE — January 1, 2015 $ — $ — $ 34,993 $ 222,059,527 $ (107,909,429 ) $ 114,185,091 Stock‑based compensation cost — — — 1,238,824 — 1,238,824 Net loss — — — — (45,852,684) (45,852,684) BALANCE — December 31, 2015 $ — $ — $ 34,993 $ 223,298,351 $ (153,762,113 ) $ 69,571,231 BALANCE — January 1, 2016 $ — $ — $ 34,993 $ 223,298,351 $ (153,762,113 ) $ 69,571,231 Stock‑based compensation cost — — — 1,649,282 — 1,649,282 Additional common equity capitalization — — 17,635 40,407,561 — 40,425,196 Preferred equity capitalization, net of costs 17,000 162,494,174 — — — 162,511,174 Net loss — — — — (53,147,396) (53,147,396) BALANCE — December 31, 2016 $ 17,000 $ 162,494,174 $ 52,628 $ 265,355,194 $ (206,909,509 ) $ 221,009,487
CONSOLIDATED STATEMENTS OF CASH FLOWS
FOR THE YEARS ENDED DECEMBER 31, 2016 AND 2015 2016 2015 CASH FLOWS FROM OPERATING ACTIVITIES: Net loss $ (53,147,396 ) $ (45,852,684 ) Adjustments to reconcile net loss to net cash provided by operating activities: Depreciation and amortization 43,541,679 50,133,993 Gain on extinguishment of debt (6,974,805) — Property and equipment impairment expense 6,305,426 36,609,332 Goodwill impairment expense 1,177,148 — Deferred income tax benefit (27,971,582) (23,944,640) Amortization of deferred revenue rebate 1,846,251 1,846,251 Amortization of deferred debt issuance costs 2,090,874 1,351,202 Stock‑based compensation 1,649,282 1,238,824 Loss on disposal of assets 22,528,670 21,267,985 (Gain) loss on interest rate swap (205,422) 260,168 Changes in operating assets and liabilities: Accounts receivable (24,888,087) 67,348,446 Other current assets (562,897) 8,666 Inventories 3,859,165 (622,494) Prepaid expenses (62,093) 2,081,537 Accounts payable 37,047,563 (23,889,408) Accrued liabilities 4,392,287 (6,294,956) Accrued interest 31,544 (311,500) Net cash provided by operating activities 10,657,607 81,230,722 CASH FLOWS FROM INVESTING ACTIVITIES: Capital expenditures (42,831,884) (62,855,418) Proceeds from sale of assets 1,144,200 79,045 Net cash used in investing activities (41,687,684) (62,776,373) CASH FLOWS FROM FINANCING ACTIVITIES: Proceeds from borrowings — 60,718,300 Repayments of borrowings (41,295,302) (73,781,755) Proceeds from insurance financing 4,126,462 4,105,133 Repayments of insurance financing (4,527,287) (6,257,342) Extinguishment of debt (30,000,000) — Payment of debt extinguishment costs (525,196) — Payment of debt issuance costs (139,543) — Proceeds from additional common equity capitalization 40,425,196 — Proceeds from preferred equity capitalization 169,999,943 — Payment of preferred equity capitalization costs (7,488,768) — Payment of deferred IPO costs (260,149) — Net cash provided by (used in) financing activities 130,315,356 (15,215,664) NET INCREASE IN CASH AND CASH EQUIVALENTS 99,285,279 3,238,685 CASH AND CASH EQUIVALENTS — Beginning of year 34,310,323 31,071,638 CASH AND CASH EQUIVALENTS — End of year $ 133,595,602 $ 34,310,323 CONSOLIDATED STATEMENT OF OPERATIONSFOR THE YEAR ENDED DECEMBER 31, 2015 2015 $ 569,617,758 483,337,584 27,369,740 50,133,993 36,609,332 21,267,985 618,718,634 (49,100,876 ) (21,641,454 ) (497,924 ) (22,139,378 ) (71,240,254 ) (25,387,570 ) $ (45,852,684 ) $ (1.90 ) $ (1.90 ) 24,132,871 24,132,871 See notes to consolidated financial statements.PROPETRO HOLDING CORP. AND SUBSIDIARYCONSOLIDATED STATEMENT OF CHANGES IN SHAREHOLDERS' EQUITYFOR THE YEAR ENDED DECEMBER 31, 2015 Common
Stock Additional
Paid-In
Capital Accumulated
Deficit Total $ 24,133 $ 222,070,387 $ (107,909,429 ) $ 114,185,091 — 1,238,824 — 1,238,824 — — (45,852,684 ) (45,852,684 ) $ 24,133 $ 223,309,211 $ (153,762,113 ) $ 69,571,231 See notes to consolidated financial statements.Table of ContentsPROPETRO HOLDING CORP. AND SUBSIDIARYCONSOLIDATED STATEMENT OF CASH FLOWSFOR THE YEAR ENDED DECEMBER 31, 2015 2015 $ (45,852,684 ) 50,133,993 36,609,332 (23,944,640 ) 1,846,251 1,351,202 1,238,824 21,267,985 260,168 67,348,446 8,666 (622,494 ) 2,081,537 (23,889,408 ) (6,294,956 ) (311,500 ) 81,230,722 (62,855,418 ) 79,045 (62,776,373 ) 60,718,300 (73,781,755 ) 4,105,133 (6,257,342 ) (15,215,664 ) 3,238,685
31,071,638 $ 34,310,323 See notes to consolidated financial statements.Table of ContentsONSOLIDATED PROPETRO HOLDING CORP. AND SUBSIDIARYINANCIAL NOTES TO CONSOLIDATED FINANCIAL STATEMENTSSYEAR ENDED DECEMBERYEARS ENDED("Holding"(“Holding”), a Texas corporation was formed on April 14, 2007, to serve as a holding company for its wholly owned subsidiary ProPetro Services, Inc. ("Services"(“Services”), a Texas corporation. Services providesprovide hydraulic fracturing, cementing, acidizing, coil tubing, permianPermian drilling, surface drilling and flowback services to oil and gas producers, located primarily in Texas, Oklahoma, New Mexico, Utah, Colorado, and Wyoming.("ECP"(“ECP”), an energy-focusedenergy‑focused private equity firm (see Note 18). Holding and Services are collectively referred to as the "Company" in the accompanying consolidated financial statements. restated its certificate of formation in the state of Texas, approving a reverse stock split, such that each holder of common stock of the Company shall receive one share of common stock for every 170.4667 shares of previous common stock held. In conjunction, the Company amended the amount of authorized shares to 230,000,000, of which 200,000,000 are common and 30,000,000 are preferred.Stock-BasedStock‑Based Compensation, and Note 18Equity Capitalization have been updated to reflect the effect of the reverse stock split. Onsplit in December 27, 2016 and the Company completed a private placement offering of $170 million, issuing 11,724,134 shares of Series A convertible preferred stock. Costs associated withstock split in March 2017.offering were approximately $7 million, resulting“Company” in net proceeds to the Company of $163 million.("(“U.S. GAAP"GAAP”).PROPETRO HOLDING CORP. AND SUBSIDIARYNOTES TO CONSOLIDATED FINANCIAL STATEMENTS (Continued)AS OF AND FOR THE YEAR ENDED DECEMBER 31, 20152. SIGNIFICANT ACCOUNTING POLICIES (Continued)stock-basedstock‑based compensation. Actual results could differ from those estimates.Company'sCompany’s services are sold based upon contracts or other agreements with the customer that include fixed or determinable prices and do not include other post-deliverypost‑delivery obligations. Revenue for services is recognized as the services are rendered and when collectability is reasonably assured. Rates for services are typically determined per the contract or agreement with customers.permianPermian drilling, whereby we drill a well for a customer to a certain depth using a drilling rig and related equipment. The Company recognizes revenues either on a "turnkey"“turnkey” contract basis, in which a fixed and set price for the job is determinable, on a "daywork"“daywork” contract basis, in which a stated rate per day is fixed and determinable, or on a "footage"“footage” contract basis, in which a rate per feet drilled is fixed and determinable.Company'sCompany’s allowance for doubtful accounts is based on management'smanagement’s evaluations of the collectability of each accounts receivable based on the customer'scustomer’s payment history and general economic conditions. At December 31, 2016 and 2015, the allowance for doubtful accounts was $0.6 million and $0.8 million.million, respectively.Company'sCompany’s property and equipment are recorded at cost, less accumulated depreciation.yearyears ended December 31, 2015.2016 and 2015, respectively. The recorded loss on disposal is primarily attributed to the increased servicePROPETRO HOLDING CORP. AND SUBSIDIARYNOTES TO CONSOLIDATED FINANCIAL STATEMENTS (Continued)AS OF AND FOR THE YEAR ENDED DECEMBER 31, 20152. SIGNIFICANT ACCOUNTING POLICIES (Continued) Depreciation NOTES TO CONSOLIDATED FINANCIAL STATEMENTS AS OF AND FOR THE YEARS ENDEDstraight-linestraight‑line method over the following estimated useful lives:1 -‑ 5 years2 -‑ 20 years5 -‑ 20 yearsLong-LivedLong‑Lived Assets— In accordance with Financial Accounting Standards Board (FASB) Accounting Standards Codification (ASC) 360,Accounting for the Impairment or Disposal of Long-LivedLong‑Lived Assets, the Company reviews its long-livedlong‑lived assets to be held and used whenever events or circumstances indicate that the carrying value of those assets may not be recoverable.permianPermian drilling and acidizing asset groups.long-livedlong‑lived assets to be disposed of at the lower of their carrying amount or fair value, less cost to sell once management has committed to a plan to dispose of the assets.concluded that there was no impairmentthen compares the carrying value of goodwill to its implied fair value. In estimating the implied fair value of goodwill at the reporting unit, the Company assigns the fair value of the reporting unit to all of the assets and liabilities associated with the reporting unit as if the reporting unit had been acquired in 2015.a business combination. The excess of the fair value of the reporting unit over the amount assigned to the assets and liabilities of the reporting unit is the implied fair value of goodwill. If the carrying amount of goodwill exceeds the implied fair value of goodwill, an impairment loss is recognized for that difference.("Blackrock"(“Blackrock”) for $1.8 million. The assets acquired from Blackrock were recorded as $0.6 million of equipment with the excess of the purchase price over the fair value of the assets recorded as goodwill of $1.2 million. The acquisition complemented our existing drilling operations. The transaction has been accounted for using the acquisition method of accounting and, accordingly, assets and liabilities assumed were recorded at their fair values as of the acquisition date. TheBased on our goodwill impairment test as of December 31, 2016, the Company concluded that there was an impairment of goodwill of $1.2 million related to the Blackrock acquisition. No impairment was recorded during the year ended December 31, 2015. Prior to the impairment write‑down in the current year, the goodwill related to the Blackrock acquisition of $1.2 million iswas recorded in the all other reportable segment.("TSS"(“TSS”) for $24.4 million. The assets acquired from TSS were recorded as $15 million of equipment with the excess of the purchase price over fair value of the assets recorded as goodwill of $9.4 million. The acquisition complemented our existing pressure pumping business. The transaction has been accounted for using the acquisition method of accounting and, accordingly, assets and liabilities assumed werePROPETRO HOLDING CORP. AND SUBSIDIARYNOTES TO CONSOLIDATED FINANCIAL STATEMENTS (Continued)AS OF AND FOR THE YEAR ENDED DECEMBER 31, 20152. SIGNIFICANT ACCOUNTING POLICIES (Continued)straight-linestraight‑line basis over the asset'sasset’s estimated useful life.yearyears ended December 31, 2016 and 2015, advertising expense was $0.4 million and $0.9 million.million, respectively.straight-linestraight‑line method (which approximates the interest method). Deferred loan costs amortization is included in interest expense. Unamortized deferred loan costs associated with loans paid off or refinanced with different lenders are charged off in the period in which such an event occurs. Deferred loan costs are classified as a reduction of long-termlong‑term debt in the consolidated balance sheet. Amortization of deferred loan costs is recorded as interest expense in the statement of operations, and at December 31, 2016 and 2015, the amount of expense recorded was $2.1 million and $1.4 million.million, respectively.stock-basedstock‑based awards on a straight-linestraight‑line basis over the requisite service period of the award, which is usually the vesting period under the fair value method. Total compensation cost is measured on the grant date using fair value estimates.NOTESOTES TO CONSOLIDATED FINANCIAL STATEMENTS (Continued)YEAR ENDED DECEMBERYEARS ENDED2014-09,2014‑09, Revenue from Contracts with Customers (Topic 606). ASU No. 2014-092014‑09 requires entities to recognize revenue to depict transfer of promised goods or services to customers in an amount that reflects the consideration to which the entity expects to be entitled in exchange for those goods or services. ASU No. 2014-092014‑09 requires entities to disclose both qualitative and quantitative information that enables users of consolidated financial statements to understand the nature, amount, timing, and uncertainty of revenue and cash flows arising from contracts with customers, including disclosure of significant judgments affecting the recognition of revenue. ASU No. 2014-09 will be2014‑09 was originally effective for annual periods beginning after December 15, 2016, using either the retrospective or cumulative effect transition method. On August 12, 2015, the FASB issued ASU No. 2015-14,2015‑14, which defers the effective date of the revenue standard, ASU No. 2014-09,2014‑09, by one year for all entities and permits early adoption on a limited basis. The Company is currently evaluatingbelieves that the adoption of this guidance will not materially affect the Company’s revenue recognition. However, the Company will continue to evaluate and quantify the effect of the adoption of this guidance on theits consolidated financial statements. In August 2014, the FASB issued ASU No. 2014-15,Disclosure of Uncertainties about an Entity's Ability to Continue as a Going Concern. Currently, there is no guidance in effect under accounting principles generally accepted in the United States of America regarding management's responsibility to assess whether there is substantial doubt about an entity's ability to continue as a going concern. Under ASU No. 2014-15, the Company will be required to assess its ability to continue as a going concern each interim and annual reporting period and provide certain disclosures if there is substantial doubt about its ability to continue as a going concern, including management's plan to alleviate the substantial doubt. ASU No. 2014-15 is effective for annual periods ending after December 15, 2016, and interim periods thereafter with early adoption permitted. The Company is currently assessing the effect of the adoption of ASU No. 2014-15 on its future consolidated financial statements and related disclosures. In April 2015, the FASB issued ASU No. 2015-03,Interest — Imputation of Interest (Subtopic 835-30), which requires that deferred loan costs be classified in the balance sheet as a reduction of the respective term debt. The standard is effective for annual periods beginning after December 15, 2015. The Company has adopted this guidance in 2015. Deferred loan costs are classified as a direct reduction from the long-term debt in the balance sheet as of December 31, 2015.2015-11,2015‑11, Simplifying the Measurement of Inventory, which requires entities to measure most inventory "at“at the lower of cost and net realizable value,"” thereby simplifying the current guidance under which an entity must measure inventory at the lower of cost or market. ASU No. 2015-112015‑11 does not apply to inventories that are measured by using either the last-in, first-outlast‑in, first‑out method or the retail inventory method. The amendments in ASU No. 2015-112015‑11 are effective for fiscal years beginning after December 15, 2016. The Company is currently evaluating the effect of the adoption of this guidance on the consolidated financial statements. In November 2015, FASB issued ASU No. 2015-17,Income Taxes ���Balance Sheet Classification of Deferred Taxes (Subtopic 740), which requires that deferred tax liabilities and assets be classified as noncurrent in the balance sheet. The current requirement that deferred tax liabilities and assets of a tax-paying component of an entity be offset and presented as a single amount is not affected by the amendments in this update. ASU No. 2015-17 is effective for annual periodsPROPETRO HOLDING CORP. AND SUBSIDIARYNOTES TO CONSOLIDATED FINANCIAL STATEMENTS (Continued)AS OF AND FOR THE YEAR ENDED DECEMBER 31, 20152. SIGNIFICANT ACCOUNTING POLICIES (Continued)beginning after December 15, 2016, with early adoption permitted. The Company has elected early adoption in 2015 and has applied this guidance prospectively. The adoption of this guidance did not have a material impact on the consolidated financial statements.2016-02,2016‑02, Leases, a new standard on accounting for leases. The ASU introduces a lessee model that brings most leases on the balance sheet. The new standard also aligns many of the underlying principles of the new lessor model with those in the current accounting guidance as well as the FASB'sFASB’s new revenue recognition standard. However, the ASU eliminates the use of bright-linebright‑line tests in determining lease classification as required in the current guidance. The ASU also requires additional qualitative disclosures along with specific quantitative disclosures to better enable users of financial statements to assess the amount, timing, and uncertainty of cash flows arising from leases. The pronouncement is effective for annual reporting periods beginning after December 15, 2018, including interim periods within that reporting period, using a modified retrospective approach. Early adoption is permitted. We haveThe Company has not completed an evaluation of the impact the pronouncement will have on our consolidated financial statements and related disclosures.FLOWFLOWS INFORMATION December 31,
2015 December 31,
2016 December 31,
2015 $ 20,531,410 $ 18,248,687 $ 20,531,410 $ 1,295,173 $ 2,897 $ 1,295,173 Supplemental disclosure of non‑cash activities $ 8,821,227 $ 3,176,356 $ 8,821,227 "exit price"“exit price”) in an orderly transaction between market participants at the measurement date.Company'sCompany’s assumptions about the assumptions other market participants would use in pricing the asset or liability developed based on the best information available in the circumstances. The hierarchy is broken down into three levels based on the observability of inputs as follows:PROPETRO HOLDING CORP. AND SUBSIDIARYNOTES TO CONSOLIDATED FINANCIAL STATEMENTS (Continued)AS OF AND FOR THE YEAR ENDED DECEMBER 31, 20154. FAIR VALUE MEASUREMENTS (Continued)instrument'sinstrument’s categorization within the valuation hierarchy is based upon the lowest level of input that is significant to the fair value measurement. The Company'sCompany’s assessment of the significance of a particular input to the fair value measurement in its entirety requires judgment and considers factors specific to the asset or liability.short-termshort‑term nature. We use a derivative financial instrument, an interest rate swap, to manage interest rate risk. Our policies do not permit the use of derivative financial instruments for speculative purposes. We did not designate the interest rate swap as a hedge for accounting purposes. We record all derivatives as of the end of our reporting period in our consolidated balance sheet at fair value, which is based on quoted market prices, which represents a level 1 in the fair value measurement hierarchy. We may be exposed to credit losses in the event of nonperformance by counterparties to the interest rate swap. The counterparty of the interest rate swap is a lender under itsour term loan and a credible, large institution, and the Company does not believe there is significant or material credit risk upon settling the contract. The fair value of the interest rate swap liability at December 31, 2016 and 2015 was $0.3 million and $0.5 million.million, respectively. Based on quoted market prices as of December 31, 2016 and 2015, for contracts with similar terms and maturity date, as provided by the counterparty, we recorded a gain of $0.2 million and a loss of $0.3 million, in the year. Estimated fair value measurements Quoted prices in Signifcant other Signifcant other Carrying active market observable inputs unobservable Total gains Value (Level 1) (Level 2) inputs (Level 3) (losses) $ 291,838,498 — $ 291,838,498 — $ (36,609,332 ) Estimated fair value measurements 2016: Property and equipment, net $ 8,700,000 $ — $ 8,700,000 $ — $ (6,305,426 ) Goodwill $ 9,424,999 $ — $ — $ 9,424,999 $ (1,177,148 ) 2015: Property and equipment, net $ 291,838,498 $ — $ 291,838,498 $ — $ (36,609,332 ) 2015,2016, the non-cashdepressed cash flows and continued decline in utilization of our Permian drilling assets were indicative of potential impairment, resulting in the Company comparing the carrying value of the Permian drilling assets with its estimated fair value. We determined that the carrying value of the Permian drilling assets was greater than its estimated fair value and as such an impairment expense was recorded. In 2016, the non‑cash asset impairment charges for permianPermian drilling was $6.3 million, which had a net carrying value of $15.0 million prior to the impairment write‑down. In 2015, the non‑cash asset impairment charges for Permian drilling and acidizing was $28.6 million and $8 million, respectively, aggregating to a total of $36.6 million. The permianIn 2015, the Permian drilling and acidizing assets groups had a net carrying value of $48.1 million and $15.6 million prior to the impairment write-down.write‑down. See Note 7, "Impairment“Impairment of Long-livedLong‑lived Assets."”PROPETRO HOLDING CORP. AND SUBSIDIARYNOTES TO CONSOLIDATED FINANCIAL STATEMENTS (Continued)AS OF AND FOR THE YEAR ENDED DECEMBER 31, 20154. FAIR VALUE MEASUREMENTS (Continued)rates. There were no additions or disposal to goodwill in 2015. Based on our goodwill impairment analysis, eachrates, and weight allocation between income and market approaches. If the reporting unit'sunit’s carrying amount exceeds its fair value, was in excesswe consider goodwill impaired and perform a second step to measure the amount of the impairment loss. We estimated the fair value as of December 31, 2016 of the surface drilling reporting unit to be $3.8 million and its carrying value in 2015,was $4.2 million. As a result of the potential impairment with the carrying value exceeding the estimated fair value, we then further determined the implied fair value of the $1.2 million goodwill for the surface drilling reporting unit to be $0. Accordingly, we recorded an impairment loss of $1.2 million. The impairment loss was attributable to the challenging oil and we concluded that theregas market and slow recovery of crude oil prices, all of which adversely impacted on our expected future cash flows for the surface drilling reporting unit. There was no impairment of goodwill recorded in 2015.straight-linestraight‑line basis with a useful life of five years. Amortization expense included in net loss for the yearyears ended December 31, 2016 and 2015 was $0.3 million. The Company'sCompany’s intangible assets subject to amortization are as follows: 2015 $ 1,439,941 562,914 $ 877,027 2016 2015 Internally developed software $ 1,439,941 $ 1,439,941 Less accumulated amortization 850,902 562,914 Intangible assets — net $ 589,039 $ 877,027 Estimated
Future
Amortization
Expense $ 287,988 287,988 287,988 13,063 $ 877,027 Year Estimated
Future
Amortization
Expense2017 $ 287,988 2018 287,988 2019 13,063 Total $ 589,039 3.12.1 years.PROPETRO HOLDING CORP. AND SUBSIDIARYNOTES TO CONSOLIDATED FINANCIAL STATEMENTS (Continued)AS OF AND FOR THE YEAR ENDED DECEMBER 31, 201531: 2015 $ 399,084,240 5,003,838 404,088,078 112,249,580 $ 291,838,498 2016 2015 Equipment and vehicles $ 402,640,458 $ 399,084,240 Leasehold improvements 4,500,406 5,003,838 Subtotal 407,140,864 404,088,078 Less accumulated depreciation 143,279,219 112,249,580 Property and equipment — net $ 263,861,645 $ 291,838,498 LONG-LIVEDLONG‑LIVED ASSETS Annually, or wheneverlong-livedlong‑lived assets may not be recoverable, the Company reviews the carrying value of long-livedlong‑lived assets, such as property and equipment and other assets to determine if they are recoverable. If any long-livedlong‑lived assets are determined to be unrecoverable, an impairment expense is recorded in the year.period. Asset recoverability is estimated using undiscounted future net cash flows at the lowest identifiable level, excluding interest expense and one-timeone‑time other income and expense adjustments. The Company determined the lowest level of identifiable cash flows to be at the asset group level, which consistconsists of hydraulic fracturing, cementing, acidizing, coil tubing, flowback, permianPermian drilling, and surface drilling.2015,2016, the Company determined thatgradual shift from vertical to horizontal drilling rigs in the current depressed commodity prices and negative future near-term outlookPermian Basin has led to athe deterioration in utilization of our Permian drilling rigs, and pricing, and expects current andwe expect undiscounted future cash flows to result in anbe lower than the carrying value of the Permian drilling assets. Given that the carrying value of the Permian drilling assets may not be recoverable, the Company estimated the fair value of the asset group and compared it to its carrying value. Potential impairment for certain asset groups. Ifexists if the estimated undiscounted future net cash flows for a given asset group is less than the carrying amount of the asset group, angroup. The impairment expense is determined by comparing the estimated fair value with the carrying value of the related asset.asset, and any excess amount by which the carrying value exceeds the fair value is recorded as an impairment expense in the period. The estimated fair value of the Permian drilling asset group of $8.7 million was determined using the costmarket approach, which represents a level 2 in the fair value measurement hierarchy. Our fair value estimates required us to use significant other observable inputs including assumptions related to replacement cost, among others. TheAn impairment expense of $6.3 million was recorded in 2016 as the carrying value of the Permian drilling asset group of $15.0 million was greater than its estimated fair value. All other assets groups were determined to be recoverable.are permianwere Permian drilling and acidizing, with estimated fair values of approximately $18.8 million and $6.3 million, respectively. The estimated fair value of the Permian drilling and acidizing asset groups was determined using the cost approach, which represents a level 2 in the fair value measurement hierarchy. During the year ended December 31, 2015, the impairment expense for permianPermian drilling and acidizing was $28.6 million and $8 million, respectively.customer's 78-monthcustomer’s 78‑month service period. In March 2013, the Company repaid the note payable to the customer. For the yearyears ended December 31, 2016 and 2015, the Company recorded $1.8 million of amortization as a reduction of revenue.PROPETRO HOLDING CORP. AND SUBSIDIARYNOTES TO CONSOLIDATED FINANCIAL STATEMENTS (Continued)AS OF AND FOR THE YEAR ENDED DECEMBER 31, 2015LONG-TERMLONG‑TERM DEBT new term loan in the amount of $220 million with a $40 million revolving credit line. The facility is secured by a first priority lien and security interest in all assets and equity of the Company. The senior secured credit facility carries a 6.25% interest rate, plus Eurodollar Rate with a 1% floor. The senior notes areterm loan is due September 30, 2019, and requirerequires quarterly principal and interest payments. The revolving credit facility matures on September 30, 2018. The loan proceeds were used to pay off 100% of prior debt outstanding, plus any accrued interest due through September 30, 2013. The excess cash proceeds from the term loan, plus the $40 million revolver, were used as needed to fund future growth and working capital needs.short-termshort‑term financing allowed the companyCompany to maintain maximum liquidity and make future monthly payments with the cash flow the fracturing equipment generated.a 36-month equipment36‑month financing arrangement for three hydraulic fracturing units, and received proceedsfleets in the amount of $25 million. Amillion, and a portion of the proceeds were used to pay off the manufacturer notes, andwith the remainder wasbeing used for additional liquidity.value on our balance sheet.value. The fair value of the revolver and the equipment financing approximates itstheir carrying value.31: 2015 $ 195,250,000 38,500,000 24,488,140 258,238,140 5,067,009 253,171,131 16,295,302 $ 236,875,829 2016 2015 6.25% Term loan due September 2019 $ 146,750,000 $ 195,250,000 Revolving credit facility 13,500,000 38,500,000 Equipment refinancing 19,192,838 24,488,140 Total debt 179,442,838 258,238,140 Less deferred loan costs, net of amortization 3,115,679 5,067,009 Subtotal 176,327,159 253,171,131 Less current portion of long‑term debt 16,920,074 16,295,302 Total long‑term debt, net of deferred loan costs $ 159,407,085 $ 236,875,829 as ofat December 31, 2015.PROPETRO HOLDING CORP. AND SUBSIDIARYNOTES TO CONSOLIDATED FINANCIAL STATEMENTS (Continued)AS OF AND FOR THE YEAR ENDED DECEMBER 31, 20159. LONG-TERM DEBT (Continued)near-termthen near‑term economic uncertainty and volatility of commodity prices, the Company and its equity sponsor, Energy Capital Partners, engaged the lenders in negotiation to amend the existing credit agreement and negative covenants whereby the leverage ratio covenant was expected to be out of compliance as of March 31, 2016 test date. The amendment and waiver agreement was executed on June 8, 2016. The amended credit agreement key terms included Energy Capital Partners infusing $40 million of additional equity into the Company, $10 million of which werewas reserved for normal working capital and up to $30 million available to repurchase debt (see Note 18). A minority shareholder also infused $0.425 million alongside Energy Capital Partners to prevent dilution. The amendment and waiver also stated that there shall be no leverage ratio test until June 30, 2017, and any required financial statements past-duepast‑due were provided within 30 days.long-termtotal debt are as follows at December 31, 2015:2016: $ 16,295,302 16,920,074 24,272,764 200,750,000 $ 258,238,140 2017 $ 16,920,074 2018 37,772,764 2019 124,750,000 Total $ 179,442,838 31: 2015 $ 2,778,368 1,256,269 1,174,787 1,842,491 $ 7,051,915 2016 2015 Accrued insurance $ 2,900,221 $ 2,778,368 Accrued payroll and related expenses 4,728,614 1,256,269 Other 5,990,636 3,017,278 Total $ 13,619,471 $ 7,051,915 yearyears ended December 31, 2016 and 2015.PROPETRO HOLDING CORP. AND SUBSIDIARYNOTES TO CONSOLIDATED FINANCIAL STATEMENTS (Continued)AS OF AND FOR THE YEAR ENDED DECEMBER 31, 2015segments:segments for which discreet financial information is readily available: hydraulic fracturing, cementing, acidizing, coil tubing, flowback, surface drilling, and permianPermian drilling. These segments represent how the chief operating decision maker (CODM) evaluates performance and allocates resources for which discreet financial information is readily available."all other" “all other”category in the table below. Inter-segmentInter‑segment revenues are not material and were not shown separately in the table below.Adjustedadjusted EBITDA (earnings before other income (expense), interest, taxes, depreciation & amortization, stockstock‑based compensation expense, impairment expense, loss on disposal of assets) and. A reconciliation from segment level financial information to the consolidated statement of operations is provided in the table below. Pressure
Pumping All Other Total $ 510,198,128 $ 59,419,630 $ 569,617,758 $ 7,979,906 $ 28,629,426 $ 36,609,332 $ 62,540,290 $ (2,391,032 ) $ 60,149,258 $ 38,368,650 $ 11,765,343 $ 50,133,993 $ 69,029,321 $ 2,647,324 $ 71,676,645 $ 398,449,448 $ 48,004,886 $ 446,454,334 Reconciliation of Adjusted EBITDA to net loss Total $ (45,852,684 ) 50,133,993 21,641,454 21,267,985 36,609,332 1,238,824 497,924 (25,387,570 ) $ 60,149,258 NOTESOTES TO CONSOLIDATED FINANCIAL STATEMENTS (Continued)YEAR ENDED DECEMBERYEARS ENDED Pressure
Pumping All Other Total Year ended December 31, 2016 Service revenue $ 409,014,337 $ 27,905,933 $ 436,920,270 Adjusted EBITDA $ 15,655,202 $ (7,839,014 ) $ 7,816,188 Depreciation and amortization $ 37,281,862 $ 6,259,817 $ 43,541,679 Property and equipment impairment expense $ — $ 6,305,426 $ 6,305,426 Goodwill impairment expense $ — $ 1,177,148 $ 1,177,148 Capital expenditures $ 45,472,835 $ 535,405 $ 46,008,240 Goodwill $ 9,424,999 $ — $ 9,424,999 Total assets $ 501,905,907 $ 39,516,391 $ 541,422,298 Year ended December 31, 2015 Service revenue $ 510,198,128 $ 59,419,630 $ 569,617,758 Adjusted EBITDA $ 62,540,290 $ (2,391,032 ) $ 60,149,258 Depreciation and amortization $ 38,368,650 $ 11,765,343 $ 50,133,993 Property and equipment impairment expense $ 7,979,906 $ 28,629,426 $ 36,609,332 Capital expenditures $ 69,029,321 $ 2,647,324 $ 71,676,645 Goodwill $ 9,424,999 $ 1,177,148 $ 10,602,147 Total assets $ 398,449,448 $ 48,004,886 $ 446,454,334 Total Year ended December 31, 2016 Net loss $ (53,147,396 ) Depreciation and amortization 43,541,679 Interest expense 20,386,695 Loss on disposal of assets 22,528,670 Property and equipment impairment expense 6,305,426 Goodwill impairment expense 1,177,148 Gain on extinguishment of debt (6,974,805) Stock‑based compensation 1,649,282 Other expense 321,071 Income tax benefit (27,971,582) Adjusted EBITDA (see total above) $ 7,816,188 Total Year ended December 31, 2015 Net loss $ (45,852,684 ) Depreciation and amortization 50,133,993 Interest expense 21,641,454 Loss on disposal of assets 21,267,985 Property and equipment impairment expense 36,609,332 Stock‑based compensation 1,238,824 Other expense 497,924 Income tax expense (25,387,570) Adjusted EBITDA (see total above) $ 60,149,258 The Company's assets that are potentially subject to concentrations of credit risk are cash and cash equivalents and trade accounts receivable. Cash balances are maintained in financial institutions, which at times exceed federally insured limits. The Company monitors the financial condition of the financial institutions in which accounts are maintained and has not experienced any losses in such accounts. The receivables of the Company are spread over a number of customers, a majority of which are operators and suppliers to the oil and natural gas industries. The Company performs ongoing credit evaluations as to the financial condition of its customers with respect to trade receivables.yearyears ended December 31, 2016 and 2015, the Company had revenue from threefour significant customers that accounted for the following percentages of the Company'sCompany’s total revenue:2015 Company A14.2%Company B12.5% Company C11.1% 2016 2015 Customer A 18.0 % 12.5 % Customer B 12.5 % 8.8 % Customer C 8.7 % 14.2 % Customer D 7.0 % 11.1 % A,C and 99% of Customer B, 99% of Customer C.Company'sCompany’s net loss per share is determined by dividing the net loss relevant to the common stock by the weighted average number of shares outstanding during the year. Diluted net loss per common share uses the same net loss divided by the number of shares that would be outstanding assuming dilutive options and stock are converted (conversion method). The table below shows the calculations for yearyears ended December 31. 2015 $ (45,852,684 ) 24,132,871 24,132,871 $ (1.90 ) $ (1.90 ) 2016 2015 Numerator (both basic and diluted) Net loss relevant to common stockholders $ (53,147,396 ) $ (45,852,684 ) Denominator Denominator for basic earnings (loss) per share 44,786,687 34,992,662 Denominator for diluted earnings (loss) per share 44,786,687 34,992,662 Basic loss per common share $ (1.19 ) $ (1.31 ) Diluted loss per common share $ (1.19 ) $ (1.31 ) NOTESOTES TO CONSOLIDATED FINANCIAL STATEMENTS (Continued)YEAR ENDED DECEMBERYEARS ENDEDnon-vestednon‑vested restricted stock and stock options as shown in the table below, but have not been included in the above calculation of diluted earnings (loss) per share as it would be non-dilutiveanti‑dilutive to the calculation above.2015 Stock options2,404,004Non-vested restricted stock256,783 2,660,787 2016 2015 Stock options 4,645,884 3,485,791 Preferred stock 16,999,990 — Non‑vested restricted stock 372,335 372,335 22,018,209 3,858,126 STOCK-BASEDSTOCK‑BASED COMPENSATION"Plan"“Plan”) pursuant to which the Company'sCompany’s Board of Directors may grant stock options or other stock-basedstock‑based awards to key employees, consultants, and directors. The Plan, as amended, is authorized to grant up to 2,413,2914,645,884 shares of common stock (equivalent to 10% of outstanding shares) to be issued upon exercise of the options. The shares subject to each award can be granted with an exercise price per share of no less than 100% of the fair value of the Company's stock at the date of grant. The Company'sCompany’s share price used to estimate the fair value of the option at the grant date was based on a combination of income and market approaches, which are highly complex and sensitive. The income approach involves the use of a discounted cash flow method, with the cash flow projections discounted at an appropriate discount rate. The market approach involves the use of comparable public companies market multiples in estimating the fair value of the Company'sCompany’s stock. The expected term used to calculate the fair value of all options considers the vesting date and the grant'sgrant’s expiration date. The expected volatility was estimated by considering comparable public companies, and the risk free rate is based on the U.SU.S. treasury yield curve as of the grant date. The dividend assumption is based on historical experience. The fair value and estimates will no longer be necessary if the Company goes public because it will rely on the market price to determine the market value of its common stock. Prior to 2015, the Company had granted a total of 2,413,2713,499,228 options with an exercise price of $5.73$3.96 per option, and all options expire 10 years from the date of grant.1,930,6282,799,408 stock option awards to certain key employees and directors that shall vest and become exercisable based upon the achievement of a service requirement. The options vest in 25% increments for each year of continuous service and an option becomes fully vested upon the optionee'soptionee’s completion of the fourth year of service. The contractual term for the options awarded is 10 years.PROPETRO HOLDING CORP. AND SUBSIDIARYNOTES TO CONSOLIDATED FINANCIAL STATEMENTS (Continued)AS OF AND FOR THE YEAR ENDED DECEMBER For the years ended December 31, 2016 and 2015,14. STOCK-BASED COMPENSATION (Continued)Black-Scholes option-pricingBlack‑Scholes option‑pricing model. The fair value of the options was estimated at the date of grant using the following assumptions:45 % $ — 6.25 1.35 %482,643699,820 stock option awards to certain key employees that shall vest and become exercisable based upon the achievement of both a service and a performance requirement. The options vest in 25% increments for each year of continuous service and an option becomes fully vested upon a change in control. As of December 31, 2015,2016, the performance requirement was not considered to be probable of achievement for any of the outstanding option awards.awards and 114,456 options were forfeited during the year ended For the year ended December 31, 2015, the Company recognized $1.2 million in compensation expense related to these stock options. The tax benefit related to the stock compensation expense for the year ended December 31, 2015 is $0.4 million. The total unrecognized compensation expense as of December 31, 2015 is $1.8 million, and is expected to be recognized over 1.5 years.Black-Scholes option-pricingBlack‑Scholes option‑pricing model. The fair value of the options was estimated at the date of grant using the following assumptions:45 % $ — 6.25 1.83 % Expected volatility 55 % Expected dividends $ — Expected term (in years) 5.8 Risk free rate 1.22 % NOTESOTES TO CONSOLIDATED FINANCIAL STATEMENTS (Continued)YEAR ENDED DECEMBERYEARS ENDEDSTOCK-BASEDSTOCK‑BASED COMPENSATION (Continued)2,404,0043,485,791 as 9,26713,437 options were forfeited in 2014. As of December 31, 2015,2016, none of the options are fully vested. A summary of the stock option activity for the year 2015 endingyears ended December 31, 2016 and 2015 is presented below. Number
of Shares Weighted
Average
Exercise
Price Weighted
Average
Grant-Date
Fair Value Number
of Shares Weighted
Average
Exercise
Price Weighted
Average
Grant‑Date
Fair Value 2,404,004 $ 5.73 $ 2.56 3,485,791 $ 3.96 $ 1.77 — — — — $ — $ — — — — — $ — $ — Forfeited — $ — $ — — — — — $ — $ — Outstanding at December 31, 2015 3,485,791 $ 3.96 $ 1.77 Exercisable at December 31, 2015 1,399,704 $ 3.96 $ 1.77 Outstanding at January 1, 2016 3,485,791 $ 3.96 $ 1.77 Granted 1,274,549 $ 2.25 $ 1.77 Exercised — $ — $ — — — — (114,456) $ 3.96 $ 1.77 2,404,004 $ 5.73 $ 2.56 Expired — $ — $ — Outstanding at December 31, 2016 4,645,884 $ 3.49 $ 1.77 Exercisable at December 31, 2016 2,354,466 $ 3.77 $ 1.77 Company'sCompany’s Board of Directors authorized and granted 256,783372,335 Restricted Stock Units (RSUs) to a key executive. Each RSU represents the right to receive one share of common stock of the Company at par value $0.001 per share. RSUs shall vest and theThe shares of common stock subject to the RSUs shall be paid to the grantee upon change in control, whether or not grantee is an employee, consultant, or director of the Company on such date. If the grantee ceases to be an employee, consultant, or director of the Company prior to the vestingsettlement date, he shall not forfeit any rights with respect to the unvested RSUs and shall be entitled to receive payment on the vestingsettlement date. The fair value of the RSUs is measured as the price of the Company'sCompany’s shares on the grant date, which was estimated to be $5.63.$3.89. The Company's share price was based on a combination of income and market approaches, which are highly complex and sensitive. The income approach involves the use of a discounted cash flow method, with the cash flow projections discounted at an appropriate discount rate. The market approach involves the use of comparable public companies market multiples in estimating the fair value of the Company's stock. As of December 31, 2015, the RSUs were not vested as the performance requirement was not considered to be probable of achievement. Accordingly, the Company has not recognized any compensation expense related to these RSUs. There have been no additional RSUs granted, vested or forfeited since September 30, 2013.PROPETRO HOLDING CORP. AND SUBSIDIARYNOTES TO CONSOLIDATED FINANCIAL STATEMENTS (Continued)AS OF AND FOR THE YEAR ENDED DECEMBER 31, 201515. INCOME TAXES The components of the (benefit) provision for income taxes are as follows: 2015 $ (1,092,437 ) (22,176,578 ) (23,269,015 ) (350,494 ) (1,768,061 ) (2,118,555 ) $ (25,387,570 ) Reconciliation between the amounts determined by applying the federal statutory rate of 35% to income tax benefit is as follows: 2015 $ (24,934,089 ) (885,226 ) 578,837 (147,092 ) $ (25,387,570 ) PROPETRO HOLDING CORP. AND SUBSIDIARYNOTES TO CONSOLIDATED FINANCIAL STATEMENTS (Continued)AS OF AND FOR THE YEAR ENDED DECEMBER 31, 201515. INCOME TAXES (Continued) Deferred tax assets and liabilities are recognized for estimated future tax effects of temporary differences between the tax basis of an asset or liability and its reported amount in the consolidated financial statements. The significant items giving rise to deferred tax assets (liabilities) as of December 31, 2015 are as follows: 2015 $ 471,223 300,640 13,021,523 1,119,355 29,067,458 388,813 $ 44,369,012 $ 44,369,012 — $ 44,369,012
$
(70,621,451
) (1,498,531 ) (1,369,082 ) $ (73,489,064 ) $ (29,120,052 ) At December 31, 2015, the Company had approximately $112.8 million in net operating losses carryforwards for federal and state income tax purposes, which begin to expire in 2024. Utilization of net operating loss carryforwards may be limited due to past or future ownership changes. For December 31, 2015, we recorded a net valuation allowance release of $1.9 million on the basis of management's reassessment of the amount of its deferred tax assets that are more likely than not to be realized. In June 2006, the FASB issued FASB Interpretation (FIN) No. 48,Accounting for Uncertainty in Income Taxes — an interpretation of FASB Statement No. 109 (subsequently codified as ASC 740-10, Income Taxes, Under FASB Statement No. 168, The FASBAccounting Standards Codification and the Hierarchy of Generally Accepted Accounting Principles — a replacement of FASB Statement No. 162). ASC 740-10 prescribes a comprehensive model for recognizing, measuring, presenting, and disclosing in the consolidated financial statements tax positions taken or expected to be taken on a tax return, including a decision to file or not to file in a particular jurisdiction. The Company evaluated all tax positions and determined that the aggregate exposure under ASC 740-10 did not have a material effect on the consolidated financial statements during the yearPROPETRO HOLDING CORP. AND SUBSIDIARYNOTES TO CONSOLIDATED FINANCIAL STATEMENTS (Continued)AS OF AND FOR THE YEAR ENDED DECEMBER 31, 201515. INCOME TAXES (Continued)ended December 31, 2015. Therefore, no adjustments have been made to the consolidated financial statements related to the implementation of ASC 740-10. The Company will continue to evaluate its tax positions in accordance with ASC 740-10 and will recognize any future effect as a charge to income in the applicable period. Currently, the tax filings for years 2011 to 2014 remain open for examination by taxing authorities. Income tax penalties and interest assessments recognized under ASC 740-10 are accrued as a tax expense in the period that the Company's taxes are in an uncertain tax position. Any accrued tax penalties or interest assessments will remain until the uncertain tax position is resolved with the taxing authorities or until the applicable statute of limitations has expired.16. RELATED-PARTY TRANSACTIONS The Company leases its corporate offices from a related party pursuant to a five-year lease agreement with a five-year extension option requiring a base rent of $72,000 per year. The Company also leases five properties adjacent to the corporate office from related parties with annual base rents of $30,000, $30,000, $90,000, $90,000, and $180,000. During 2015, the Company paid approximately $164,000 to related parties for transportation services. The use of transportation services from related party is at actual cost. The Company also rents equipment in Elk City, Oklahoma from a related party in which $192,000 was paid in 2015. At December 31, 2015, the Company did not have any payables to related parties for services provided. All agreements pertaining to realty property and equipment were entered into during periods where the Company had limited liquidity and related parties secured them on behalf of the Company. All related party transactions are immaterial and have not been separately shown on the face of the financial statements. For related party disclosure related to equity transactions with Energy Capital Partners, see Note 18.17. COMMITMENTS AND CONTINGENCIESOperating Lease — The Company has various operating leases for office space and certain property and equipment. For the year ended December 31, 2015, the Company recorded operatingPROPETRO HOLDING CORP. AND SUBSIDIARYNOTES TO CONSOLIDATED FINANCIAL STATEMENTS (Continued)AS OF AND FOR THE YEAR ENDED DECEMBER 31, 201517. COMMITMENTS AND CONTINGENCIES (Continued)lease expense of $1.4 million. Required annual lease payments for each of the years ending December 31, are as follows: $ 767,516 471,416 426,416 366,416 343,916 $ 2,375,680 Contingent Liabilities — The Company may be subject to various legal actions, claims, and liabilities arising in the ordinary course of business. In the opinion of management, the ultimate disposition of these matters will not have a materially adverse effect on the Company's financial position, results of operations, or liquidity.18. EQUITY CAPITALIZATION At December 31, 2015, Energy Capital Partners (ECP) and its related affiliates hold 20,992,383 of the 24,132,871 outstanding common shares of the Company. The remaining outstanding shares of the Company are held by management and two prior lenders to the Company. Per the amended credit agreement executed on June 8, 2016 (see Note 9), the majority shareholder, ECP and its related affiliates along with other shareholders infused $40.425 million of equity into the Company and the Company issued 12,418,847 additional shares of stock. As of September 30, 2016, the Company has 36,551,716 commons shares outstanding and ECP and its related affiliates currently hold 33,331,494, increasing ECP ownership interest to 91.2%. The remaining outstanding common shares of the Company are held by management and two prior lenders to the Company.19. SUBSEQUENT EVENTS The Company evaluated subsequent events through December 15, 2016, the date on which the December 31, 2015 consolidated financial statements were originally issued, and through January 20, 2017, the date on which the retrospectively revised December 31, 2015 consolidated financial statements were issued (as to the reverse stock split discussed in Note 1). In addition to the equity re-capitalization and debt restructuring in Note 9 and Note 18, and the reverse stock split and private placement discussed in Note 1, the Company has retained investment bankers with the intention of an initial public offering.******PROPETRO HOLDING CORP. AND SUBSIDIARYCONDENSED CONSOLIDATED BALANCE SHEETS (UNAUDITED) SEPTEMBER 30, DECEMBER 31, 2016 2015 $ 5,287,743 $ 34,310,323 87,036,240 90,290,905 6,993,074 8,572,015 1,642,749 4,488,180 1,514,497 803,828 102,474,303 138,465,251 267,239,342 291,838,498 10,602,147 10,602,147 661,036 877,027 2,923,231 4,307,921 363,489 363,490 14,549,903 16,150,585 $ 384,263,548 $ 446,454,334 $ 88,334,016 $ 87,365,143 4,769,003 7,051,915 16,757,289 16,295,302 78,050 76,794 109,938,358 110,789,154 10,476,377 29,120,052 188,439,450 236,875,829 112,527 98,068 308,966,712 376,883,103 36,552 24,133 264,852,172 223,309,211 (189,591,888 ) (153,762,113 ) 75,296,836 69,571,231 $ 384,263,548 $ 446,454,334 See notes to interim condensed consolidated financial statements.PROPETRO HOLDING CORP. AND SUBSIDIARYCONDENSED CONSOLIDATED STATEMENTS OF OPERATIONS (UNAUDITED)FOR THE NINE MONTHS ENDED SEPTEMBER 30, 2016 AND 2015 2016 2015 $ 272,999,217 $ 437,751,886 255,362,241 369,411,215
17,197,087
20,247,558 32,669,014 37,636,043 — 36,609,332 12,859,060 15,092,736 318,087,402 478,996,884 (45,088,185 ) (41,244,998 ) (15,942,131 ) (16,458,016 ) 6,974,805 — (417,940 ) (643,143 ) (9,385,266 ) (17,101,159 ) (54,473,451 ) (58,346,157 ) (18,643,676 ) (20,762,840 ) $ (35,829,775 ) $ (37,583,317 ) $ (1.22 ) $ (1.56 ) $ (1.22 ) $ (1.56 ) 29,328,975 24,132,871 29,328,975 24,132,871 See notes to interim condensed consolidated financial statements.PROPETRO HOLDING CORP. AND SUBSIDIARYCONDENSED CONSOLIDATED STATEMENTS OF CHANGES IN SHAREHOLDERS' EQUITY(UNAUDITED)FOR THE NINE MONTHS ENDED SEPTEMBER 30, 2016 AND 2015 Common
Stock Additional
Paid-In
Capital Accumulated
Deficit Total $ 24,133 $ 222,070,387 $ (107,909,429 ) $ 114,185,091 — 929,118 — 929,118 — — (37,583,317 ) (37,583,317 ) $ 24,133 $ 222,999,505 $ (145,492,746 ) $ 77,530,892 $ 24,133 $ 223,309,211 $ (153,762,113 ) $ 69,571,231 — 1,130,184 — 1,130,184 12,419 40,412,777 — 40,425,196 — — (35,829,775 ) (35,829,775 ) $ 36,552 $ 264,852,172 $ (189,591,888 ) $ 75,296,836 See notes to interim condensed consolidated financial statements.PROPETRO HOLDING CORP. AND SUBSIDIARYCONDENSED CONSOLIDATED STATEMENTS OF CASH FLOWS (UNAUDITED)FOR THE NINE MONTHS ENDED SEPTEMBER 30, 2016 and 2015 2016 2015 $ (35,829,775 ) $ (37,583,317 ) 32,669,014 37,636,043 (6,974,805 ) — — 36,609,332 (18,643,676 ) (19,319,910 ) 1,384,689 1,384,689 1,805,917 1,013,402 1,130,184 929,118 12,859,060 15,092,736 (53,784 ) 508,235 3,254,665 68,005,184 (3,991 ) (1,349,838 ) 1,578,941 1,801,903 2,845,431 5,225,010 (2,294,337 ) (40,886,894 ) 618,903 (4,254,296 ) 1,256 (121,147 ) (5,652,308 ) 64,690,250 (18,631,127 ) (56,985,806 ) 474,736 74,545 (18,156,391 ) (56,911,261 ) — 22,218,300 (12,165,606 ) (53,848,478 ) (2,833,573 ) (4,159,071 ) (30,000,000 ) — (525,196 ) — (114,702 ) — 40,425,196 — (5,213,881 ) (35,789,249 ) (29,022,580 ) (28,010,260 )
34,310,323
31,071,638 $ 5,287,743 $ 3,061,378 See notes to interim condensed consolidated financial statementsPROPETRO HOLDING CORP. AND SUBSIDIARYNOTES TO CONDENSED CONSOLIDATED FINANCIAL STATEMENTS (UNAUDITED)FOR THE NINE MONTHS ENDED SEPTEMBER 30, 2016 AND 20151. ORGANIZATION AND HISTORY ProPetro Holding Corp. ("Holding"), a Texas corporation was formed on April 14, 2007, to serve as a holding company for its wholly owned subsidiary ProPetro Services, Inc. ("Services"), a Texas corporation. Services provides hydraulic fracturing, cementing, acidizing, coil tubing, permian drilling, surface drilling and flowback services to oil and gas producers, located primarily in Texas, Oklahoma, New Mexico, Utah, Colorado, and Wyoming. On March 4, 2013, a majority interest in the Company was purchased by Energy Capital Partners ("ECP"), an energy-focused private equity firm (see Note 17). On December 22, 2016, the Company amended and restated its certificate of formation in the state of Texas, approving a reverse stock split, such that each holder of common stock of the Company shall receive one share of common stock for every 170.4667 shares of previous common stock held. In conjunction, the Company amended the amount of authorized shares to 230,000,000, of which 200,000,000 are common and 30,000,000 are preferred. Accordingly, any information related to or dependent upon the share or option amounts in the 2015 and 2016 condensed consolidated financial statements and Note 13,Net Loss per Share, Note 14Stock-Based Compensation, and Note 17,Equity Capitalization have been updated to reflect the effect of the reverse stock split. On December 27, 2016, the Company completed a private placement offering of $170 million, issuing 11,724,134 shares of Series A convertible preferred stock. Costs associated with the offering were approximately $7 million, resulting in net proceeds to the Company of $163 million. Holding and Services are collectively referred to as the "Company" in the accompanying interim condensed consolidated financial statements.2. SIGNIFICANT ACCOUNTING POLICIES A summary of the significant accounting policies consistently applied in the preparation of the accompanying interim condensed consolidated financial statements are as follows: Principles of Consolidation — The accompanying interim condensed consolidated financial statements include the accounts of Holding and its wholly owned subsidiary, Services. All intercompany accounts and transactions have been eliminated in consolidation. Basis of Presentation — The unaudited interim condensed consolidated financial information furnished herein reflects all adjustments (consisting of normal recurring accruals) which are, in the opinion of management, considered necessary for a fair presentation of the financial position and the results of operations and cash flows of the Company for the periods presented. These interim unaudited condensed consolidated financial statements of the Company have been prepared in accordance with U.S. generally accepted accounting principles ("GAAP") for interim financial information. Accordingly, they do not include all of the information and notes required by GAAP for complete financial statements. These interim condensed consolidated financial statements should be read in conjunction with the audited financial statements for the year ended December 31, 2015. The results of operations for the nine month periods ended September 30, 2016 and 2015 are not necessarily indicative of the results to be expected for the full year.PROPETRO HOLDING CORP. AND SUBSIDIARYNOTES TO CONDENSED CONSOLIDATED FINANCIAL STATEMENTS (UNAUDITED) (Continued)FOR THE NINE MONTHS ENDED SEPTEMBER 30, 2016 AND 20152. SIGNIFICANT ACCOUNTING POLICIES (Continued) Use of Estimates — Management is required to make estimates and assumptions that affect the reported amounts of assets and liabilities and the disclosure of contingent assets and liabilities at the date of the interim condensed consolidated financial statements and revenues and expenses during the reporting period. Such estimates include, but are not limited to, allowance for doubtful accounts, depreciation of property and equipment, estimates of fair value of property and equipment, estimates related to fair value of reporting units for purposes of assessing goodwill, estimates related to deferred tax assets and liabilities, including any related valuation allowances, and estimates of fair value of stock-based compensation. Actual results could differ from those estimates. Revenue Recognition — The Company's services are sold based upon contracts or other agreements with the customer that include fixed or determinable prices and do not include other post-delivery obligations. Revenue for services is recognized as the services are rendered and when collectability is reasonably assured. Rates for services are typically determined per the contract or agreement with customers. Pressure Pumping — Pressure pumping consists of downhole pumping services including hydraulic fracturing, acidizing and cementing. The Company recognizes revenues when services are performed, collection of the receivables is probable, and a price is fixed or determinable. The Company prices services for its pressure pumping by the job, project or day depending on the type of service performed and request from the customer. Drilling Services — Drilling services consists of surface air drilling and permian drilling, whereby we drill a well for a customer to a certain depth using drilling rig and related equipment. The Company recognizes revenues either on a "turnkey" contract basis, in which a fixed and set price for the job is determinable, on a "daywork" contract basis, in which a stated rate per day is fixed and determinable, or on a "footage" contract basis, in which a rate per feet drilled is fixed and determinable. Other Completion & Production Services — Other completion & production services consists of coil tubing and flowback services whereby the Company recognizes revenues when services are performed either on a per job or per day or hourly rate, collections of receivables are probable, and a price is fixed or determinable. Cash and Cash Equivalents — The Company considers highly liquid investments with initial maturities of three months or less to be cash equivalents. Accounts Receivable — Accounts receivables are stated at the amount billed and billable to customers. The Company's allowance for doubtful accounts is based on management's evaluations of the collectability of each accounts receivable based on the customer's payment history and general economic conditions. At September 30, 2016 and December 31, 2015, the allowance for doubtful accounts was $0.5 million and $0.8 million, respectively. Inventories — Inventories, which consists only of raw materials, are stated at lower of average cost or market.PROPETRO HOLDING CORP. AND SUBSIDIARYNOTES TO CONDENSED CONSOLIDATED FINANCIAL STATEMENTS (UNAUDITED) (Continued)FOR THE NINE MONTHS ENDED SEPTEMBER 30, 2016 AND 20152. SIGNIFICANT ACCOUNTING POLICIES (Continued) Property and Equipment — The Company's property and equipment are recorded at cost, less accumulated depreciation. Upon sale or retirement of property and equipment, the cost and related accumulated depreciation are removed from the balance sheet and the net amount, less proceeds from disposal, is recognized as a gain or loss in the statement of operations. The Company recorded a loss on disposal of assets of $12.9 million and $15.1 million for the periods ended 2016 and 2015, respectively. The recorded loss on disposal is primarily attributed to the increased service intensity of pressure pumping activity which has resulted in a shorter useful life and faster replacement of certain components of the pressure pumping equipment. Depreciation — Depreciation of property and equipment is provided on the straight-line method over the following estimated useful lives: Vehicles1 - 5 yearsEquipment2 - 20 years Leasehold improvements5 - 20 years Impairment of Long-Lived Assets — In accordance with Financial Accounting Standards Board (FASB) Accounting Standards Codification (ASC) 360,Accounting for the Impairment or Disposal of Long-Lived Assets, the Company reviews its long-lived assets to be held and used whenever events or circumstances indicate that the carrying value of those assets may not be recoverable. An impairment loss is indicated if the sum of the expected future undiscounted cash flows attributable to the asset group is less than the carrying amount of such asset group. In this circumstance, the Company recognizes an impairment loss for the amount by which the carrying amount of the asset group exceeds the fair value of the asset group. The impairment recorded in the period ended September 30, 2015 was $36.6 million for property and equipment relating to the permian drilling and acidizing asset groups. No additional impairment was recorded in the period ended September 30, 2016. The Company accounts for long-lived assets to be disposed of at the lower of their carrying amount or fair value, less cost to sell once management has committed to a plan to dispose of the assets. Goodwill — Goodwill is the excess of the consideration transferred over the fair value of the tangible and identifiable intangible assets and liabilities recognized. Goodwill is not amortized. We perform an annual impairment test of goodwill as of December 31, or more frequently if circumstances indicate that impairment may exist. The determination of impairment is made by comparing the carrying amount of a reporting unit with its fair value, which is generally calculated using a combination of market and income approaches. If the fair value of the reporting unit exceeds the carrying value, no further testing is performed. Intangible Assets — Intangible assets with finite useful lives are amortized on a basis that reflects the pattern in which the economic benefits of the intangible assets are realized, which is generally on a straight-line basis over the asset's estimated useful life.PROPETRO HOLDING CORP. AND SUBSIDIARYNOTES TO CONDENSED CONSOLIDATED FINANCIAL STATEMENTS (UNAUDITED) (Continued)FOR THE NINE MONTHS ENDED SEPTEMBER 30, 2016 AND 20152. SIGNIFICANT ACCOUNTING POLICIES (Continued) Income Taxes — Income taxes are accounted for under the asset and liability method, which requires the recognition of deferred tax assets and liabilities for the expected future tax consequences of events that have been included in the interim condensed consolidated financial statements. Under this method, deferred tax assets and liabilities are determined on the basis of differences between the interim condensed consolidated financial statements and tax bases of assets and liabilities using enacted tax rates in effect for the year in which the differences are expected to reverse. The effect of a change in tax rates on deferred tax assets and liabilities is recognized in income in the period that includes the enactment date. We recognize deferred tax assets to the extent that we believe these assets are more likely than not to be realized. In making such a determination, we consider all positive and negative evidence, including future reversals of existing taxable temporary differences, projected future taxable income, and the results of recent operations. If we determine that we would be able to realize our deferred tax assets in the future in excess of their net recorded amount, we would make an adjustment to the deferred tax asset valuation allowance, which would reduce the provision for income taxes. Advertising Expense — All advertising costs are expensed as incurred. For the periods ended September 30, 2016 and 2015, advertising expense was $0.4 million and $0.8 million, respectively. Deferred Loan Costs — The Company capitalized certain costs in connection with obtaining its borrowings, including lender, legal, and accounting fees. These costs are being amortized over the term of the related loan using the straight-line method (which approximates the interest method). Deferred loan costs amortization is included in interest expense. Unamortized deferred loan costs associated with loans paid off or refinanced with different lenders are charged off in the period in which such an event occurs. Deferred loan costs are now classified as a reduction of long-term debt in the interim condensed consolidated balance sheet. Amortization of deferred loan costs is recorded as interest expense in the statement of operations, and at September 30, 2016 and September 30, 2015, the amount of expense recorded was $1.8 million and $1 million, respectively. Stock Based Compensation — The Company recognizes the cost of stock-based awards on a straight-line basis over the requisite service period of the award, which is usually the vesting period under the fair value method. Total compensation cost is measured on the grant date using fair value estimates. Insurance Financing — The Company annually renews their commercial insurance policies and records a prepaid insurance asset and amortizes it monthly over the coverage period. The Company may choose to finance a portion of the premiums and will make repayments monthly over ten months in equal installments. Concentration of Credit Risk — The Company's assets that are potentially subject to concentrations of credit risk are cash and cash equivalents and trade accounts receivable. Cash balances are maintained in financial institutions, which at times exceed federally insured limits. The Company monitors the financial condition of the financial institutions in which accounts are maintained and has not experienced any losses in such accounts. The receivables of the Company are spread over a number of customers, a majority of which are operators and suppliers to the oilPROPETRO HOLDING CORP. AND SUBSIDIARYNOTES TO CONDENSED CONSOLIDATED FINANCIAL STATEMENTS (UNAUDITED) (Continued)FOR THE NINE MONTHS ENDED SEPTEMBER 30, 2016 AND 20152. SIGNIFICANT ACCOUNTING POLICIES (Continued)and natural gas industries. The Company performs ongoing credit evaluations as to the financial condition of its customers with respect to trade receivables. Recently Issued Accounting Standards — In May 2014, the FASB issued Accounting Standards Update (ASU) No. 2014-09,Revenue from Contracts with Customers (Topic 606). ASU No. 2014-09 requires entities to recognize revenue to depict transfer of promised goods or services to customers in an amount that reflects the consideration to which the entity expects to be entitled in exchange for those goods or services. ASU No. 2014-09 requires entities to disclose both qualitative and quantitative information that enables users of interim condensed consolidated financial statements to understand the nature, amount, timing, and uncertainty of revenue and cash flows arising from contracts with customers, including disclosure of significant judgments affecting the recognition of revenue. ASU No. 2014-09 will be effective for annual periods beginning after December 15, 2016, using either the retrospective or cumulative effect transition method. On August 12, 2015, the FASB issued ASU No. 2015-14, which defers the effective date of the revenue standard, ASU No. 2014-09, by one year for all entities and permits early adoption on a limited basis. The Company is currently evaluating the effect of the adoption of this guidance on the interim condensed consolidated financial statements. In August 2014, the FASB issued ASU No. 2014-15,Disclosure of Uncertainties about an Entity's Ability to Continue as a Going Concern. Currently, there is no guidance in effect under accounting principles generally accepted in the United States of America regarding management's responsibility to assess whether there is substantial doubt about an entity's ability to continue as a going concern. Under ASU No. 2014-15, the Company will be required to assess its ability to continue as a going concern each interim and annual reporting period and provide certain disclosures if there is substantial doubt about its ability to continue as a going concern, including management's plan to alleviate the substantial doubt. ASU No. 2014-15 is effective for annual periods ending after December 15, 2016, and interim periods thereafter with early adoption permitted. The Company is currently assessing the effect of the adoption of ASU No. 2014-15 on its future interim condensed consolidated financial statements and related disclosures. In April 2015, the FASB issued ASU No. 2015-03,Interest-Imputation of Interest (Subtopic 835-30), which requires that deferred loan costs be classified in the balance sheet as a reduction of the respective term debt. The standard is effective for annual periods beginning after December 15, 2015. The Company has adopted this guidance in 2015. The adoption of this guidance did not have a material impact on the interim condensed consolidated financial statements. Deferred loan costs are classified as a direct reduction from the long-term debt in the balance sheet at September 30, 2016 and December 31, 2015. On July 22, 2015, the FASB issued ASU No. 2015-11,Simplifying the Measurement of Inventory, which requires entities to measure most inventory "at the lower of cost and net realizable value," thereby simplifying the current guidance under which an entity must measure inventory at the lower of cost or market. ASU No. 2015-11 does not apply to inventories that are measured by using either the last-in, first-out method or the retail inventory method. The amendments in ASU No. 2015-11 are effective for fiscal years beginning after December 15, 2016. The Company isPROPETRO HOLDING CORP. AND SUBSIDIARYNOTES TO CONDENSED CONSOLIDATED FINANCIAL STATEMENTS (UNAUDITED) (Continued)FOR THE NINE MONTHS ENDED SEPTEMBER 30, 2016 AND 20152. SIGNIFICANT ACCOUNTING POLICIES (Continued)currently evaluating the effect of the adoption of this guidance on the interim condensed consolidated financial statements. In November 2015, FASB issued ASU No. 2015-17,Income Taxes —Balance Sheet Classification of Deferred Taxes (Subtopic 740), which requires that deferred tax liabilities and assets be classified as noncurrent in the balance sheet. The current requirement that deferred tax liabilities and assets of a tax-paying component of an entity be offset and presented as a single amount is not affected by the amendments in this update. ASU No. 2015-17 is effective for annual periods beginning after December 15, 2016, with early adoption permitted. The Company has elected early adoption in 2015 and has applied this guidance prospectively. The adoption of this guidance did not have a material impact on the interim condensed consolidated financial statements. In February 2016, the FASB issued ASU No. 2016-02,Leases, a new standard on accounting for leases. The ASU introduces a lessee model that brings most leases on the balance sheet. The new standard also aligns many of the underlying principles of the new lessor model with those in the current accounting guidance as well as the FASB's new revenue recognition standard. However, the ASU eliminates the use of bright-line tests in determining lease classification as required in the current guidance. The ASU also requires additional qualitative disclosures along with specific quantitative disclosures to better enable users of financial statements to assess the amount, timing, and uncertainty of cash flows arising from leases. The pronouncement is effective for annual reporting periods beginning after December 15, 2018, including interim periods within that reporting period, using a modified retrospective approach. Early adoption is permitted. The Company has not completed an evaluation of the impact the pronouncement will have on our interim condensed consolidated financial statements and related disclosures.3. SUPPLEMENTAL CASH FLOW INFORMATION September 30 2016 2015 $ 14,115,600 $ 15,565,761 $ 2,797 $ 3,369,154 $ 3,263,211 $ 5,182,691 4. FAIR VALUE MEASUREMENTS Fair value is defined as the price that would be received to sell an asset or paid to transfer a liability (i.e., the "exit price") in an orderly transaction between market participants at the measurement date. In determining fair value, the Company uses various valuation approaches and establishes a hierarchy for inputs used in measuring fair value that maximizes the use of relevant observable inputs and minimizes the use of unobservable inputs by requiring that the most observable inputs be used, when available. Observable inputs are inputs that market participants would use in pricingPROPETRO HOLDING CORP. AND SUBSIDIARYNOTES TO CONDENSED CONSOLIDATED FINANCIAL STATEMENTS (UNAUDITED) (Continued)FOR THE NINE MONTHS ENDED SEPTEMBER 30, 2016 AND 20154. FAIR VALUE MEASUREMENTS (Continued)the asset or liability developed based on market data obtained from sources independent of the Company. Unobservable inputs are inputs that reflect the Company's assumptions about the assumptions other market participants would use in pricing the asset or liability developed based on the best information available in the circumstances. The hierarchy is broken down into three levels based on the observability of inputs as follows: Level 1 — Valuations based on quoted prices in active markets for identical assets or liabilities that the Company has the ability to access. Valuation adjustments and block discounts are not applied to Level 1 instruments. Since valuations are based on quoted prices that are readily and regularly available in an active market, valuation of these instruments does not entail a significant degree of judgment. Level 2 — Valuations based on one or more quoted prices in markets that are not active or for which all significant inputs are observable, either directly or indirectly. Level 3 — Valuations based on inputs that are unobservable and significant to the overall fair value measurement. A financial instrument's categorization within the valuation hierarchy is based upon the lowest level of input that is significant to the fair value measurement. The Company's assessment of the significance of a particular input to the fair value measurement in its entirety requires judgment and considers factors specific to the asset or liability.Assets and Liabilities Measured at Fair Value on a Recurring Basis Our financial instruments include cash and cash equivalents, accounts receivables, accounts payable, and a derivative financial instrument. The estimated fair value of our financial instruments — cash and cash equivalent, accounts receivable and accounts payable at September 30, 2016 and December 31, 2015 approximates their carrying value as reflected in our interim condensed consolidated balance sheets because of their short-term nature. We use a derivative financial instrument, an interest rate swap, to manage interest rate risk. Our policies do not permit the use of derivative financial instruments for speculative purposes. We did not designate the interest rate swap as a hedge for accounting purposes. We record all derivatives as of the end of our reporting period in our interim condensed consolidated balance sheet at fair value, which is based on quoted market prices, which represents a level 1 in the fair value measurement hierarchy. We may be exposed to credit losses in the event of nonperformance by counterparties to the interest rate swap. The counterparty of the interest rate swap is a lender under its term loan and a credible, large institution, and the Company does not believe there is significant or material credit risk upon settling the contract. The fair value of the interest rate swap at September 30, 2016 and December 31, 2015 was $0.4 million and $0.5 million, respectively. Based on quoted market prices as of September 30, 2016 and 2015, for contracts with similar terms and maturity date, as provided by the counterparty, we recorded a gain of $0.05 million and a loss of $0.5 million, respectively.PROPETRO HOLDING CORP. AND SUBSIDIARYNOTES TO CONDENSED CONSOLIDATED FINANCIAL STATEMENTS (UNAUDITED) (Continued)FOR THE NINE MONTHS ENDED SEPTEMBER 30, 2016 AND 20154. FAIR VALUE MEASUREMENTS (Continued)Assets Measured at Fair Value on a Nonrecurring Basis Assets measured at fair value on a nonrecurring basis at September 30, 2016 and December 31, 2015, respectively, are set forth below: Estimated fair value measurements Carrying Value Quoted prices in
active market
(Level 1) Signifcant other
observable inputs
(Level 2) Signifcant other
unobservable inputs
(Level 3) Total gains
(losses)
$ 291,838,498 — $ 291,838,498 — $ (36,609,332 ) In 2015, the non-cash asset impairment charges for Permian drilling and acidizing was $28.6 million and $8 million, respectively, aggregating to a total of $36.6 million. In 2015, the Permian drilling and acidizing assets groups had a net carrying value of $48.1 million and $15.6 million prior to the impairment write-down. No impairment was recorded in 2016. See Note 7, "Impairment of Long-lived Assets." The Company generally applies fair value techniques on a nonrecurring basis associated with valuing potential impairment loss related to goodwill. Significant assumptions include projected revenue growth, capital expenditures, utilization, gross margins, discount rates, and terminal growth rates. There were no additions or disposals to goodwill in 2016 and 2015.5. INTANGIBLE ASSETS Intangible assets are composed of internally developed software at September 30, 2016 and December 31, 2015. Intangible assets are amortized on a straight-line basis with a useful life of five years. Amortization expense included in net loss for the periods ended September 30, 2016 and 2015 was $0.2 million. The Company's intangible assets subject to amortization are as follows: 2016 2015 $ 1,439,941 $ 1,439,941
778,905
562,914 $ 661,036 $ 877,027 PROPETRO HOLDING CORP. AND SUBSIDIARYNOTES TO CONDENSED CONSOLIDATED FINANCIAL STATEMENTS (UNAUDITED) (Continued)FOR THE NINE MONTHS ENDED SEPTEMBER 30, 2016 AND 20155. INTANGIBLE ASSETS (Continued) Estimated remaining amortization expense for each fiscal year is expected to be as follows: Estimated
Future Amortization
Expense $ 71,997 287,988 287,988 13,063 $ 661,036 The average amortization period remaining is approximately 2.3 years.6. PROPERTY AND EQUIPMENT Property and equipment consisted of the following at September 30, 2016 and December 31, 2015, respectively: 2016 2015 $ 399,808,411 $ 399,084,240 5,016,780 5,003,838 404,825,191 404,088,078
137,585,849
112,249,580 $ 267,239,342 $ 291,838,498 7. IMPAIRMENT OF LONG-LIVED ASSETS Annually, or whenever events or circumstances indicate that the carrying value of long-lived assets may not be recoverable, the Company reviews the carrying value of long-lived assets, such as property and equipment and other assets to determine if they are recoverable. If any long-lived assets are determined to be unrecoverable, an impairment expense is recorded in the period. Asset recoverability is estimated using undiscounted future net cash flows at the lowest identifiable level, excluding interest expense and one-time other income and expense adjustments. The Company determined the lowest level of identifiable cash flows to be at the asset group level, which consist of hydraulic fracturing, cementing, acidizing, coil tubing, flowback, permian drilling, and surface drilling. In 2015, the Company determined that the current depressed commodity prices and negative future near-term outlook had led to a deterioration in utilization and pricing, and expected current and future cash flows to result in an asset impairment for certain asset groups. If the estimated undiscounted future net cash flows for a given asset group is less than the carrying amount of the asset group, an impairment expense is determined by comparing the estimated fair value with thePROPETRO HOLDING CORP. AND SUBSIDIARYNOTES TO CONDENSED CONSOLIDATED FINANCIAL STATEMENTS (UNAUDITED) (Continued)FOR THE NINE MONTHS ENDED SEPTEMBER 30, 2016 AND 20157. IMPAIRMENT OF LONG-LIVED ASSETS (Continued)carrying value of the related asset. The estimated fair value was determined using the cost approach, which represents a level 2 in the fair value measurement hierarchy. Our fair value estimates required us to use significant other observable inputs including assumptions related to replacement cost, among others. In 2015, the asset groups identified to have impairment are Permian drilling and acidizing, with estimated fair values of approximately $18.8 million and $6.3 million, respectively. During the period ended September 30, 2015, the impairment expense for Permian drilling and acidizing was $28.6 million and $8 million, respectively. No impairment expense was recorded for the period ended September 30, 2016.8. DEFERRED REVENUE REBATE In November 2011, the Company acquired certain oilfield fracturing equipment from a customer and agreed to provide future fracturing services to the customer for a period of 78 months in exchange for a 12% $25 million note payable to the customer. The Company recorded the fracturing equipment at its estimated fair value of approximately $13 million and assigned the remaining value of approximately $12 million to a deferred revenue rebate account to be amortized over the customer's 78-month service period. In March 2013, the Company repaid the note payable to the customer. For the periods ended September 30, 2016 and 2015, the Company recorded $1.4 million of amortization as a reduction of revenue.9. LONG-TERM DEBT On September 30, 2013, the Company entered into a new term loan in the amount of $220 million with a $40 million revolving credit line. The facility is secured by a first priority lien and security interest in all assets and equity interests held by the Company. The senior secured credit facility carries a interest rate of 6.25% plus Eurodollar Rate, with a 1% floor. The term loan is due September 30, 2019, and requires quarterly principal and interest payments. The loan proceeds were used to pay off 100% of prior debt outstanding, plus any accrued interest due through September 30, 2013. The excess cash proceeds from the term loan, plus the $40 million revolver, were used as needed to fund future growth and working capital needs. During 2014, the Company additionally entered into certain term notes with the equipment manufacturer of certain fracturing equipment. The interest rate is 9.5% and requires monthly principal and interest payments in 13 installments. The short-term financing allowed the company to maintain liquidity and make future monthly payments with the cash flow the fracturing equipment generated. On November 24, 2015, we entered into a 36-month equipment financing arrangement for three hydraulic fracturing units, and received proceeds of $25.0 million. A portion of the proceeds were used to pay off manufacturer notes, and the remainder was used for additional liquidity. As of September 30, 2016 the outstanding balance was $20.6 million. The estimated fair value of the term loan at September 30, 2016 was approximately 82% of the carrying value, or $122.6 million, compared to $149.5 million carrying value. The estimated fair value of the term loan at December 31, 2015 was approximately 60% of the carrying value, orPROPETRO HOLDING CORP. AND SUBSIDIARYNOTES TO CONDENSED CONSOLIDATED FINANCIAL STATEMENTS (UNAUDITED) (Continued)FOR THE NINE MONTHS ENDED SEPTEMBER 30, 2016 AND 20159. LONG-TERM DEBT (Continued)$117.2 million, compared to $195.3 million carrying value. The fair value of the revolver and the equipment financing approximates its carrying value. Total debt consisted of the following notes at September 30, 2016 and December 31, 2015, respectively: 2016 2015 $ 149,500,000 $ 195,250,000 38,500,000 38,500,000 20,572,534 24,488,140 208,572,534 258,238,140
3,375,795
5,067,009 205,196,739 253,171,131
16,757,289
16,295,302 $ 188,439,450 $ 236,875,829 Covenants — The Company is required to meet certain affirmative and negative covenants that are considered normal and customary for arrangements of this type, with customary exceptions and materiality qualifiers, including, but not limited to, reporting requirements, insurance, maintenance of collateral, and limitations on additional indebtedness, change of control, transactions with affiliates, and distributions. The financial covenant applicable is a maximum leverage ratio of 3.5x EBITDA (earnings before interest, taxes, depreciation, and amortization) to total debt. Effective March 31, 2014, the Company was required to be in compliance with these financial covenants. The Company was in compliance with the financial covenant at September 30, 2015. In 2015, given the near-term economic uncertainty and volatility of commodity prices, the Company and its equity sponsor, Energy Capital Partners, engaged the lenders in negotiation to amend the existing credit agreement and negative covenants whereby the leverage ratio covenant was expected to be out of compliance as of March 31, 2016 test date. The amendment and waiver agreement was executed on June 8, 2016. The amended credit agreement key terms included Energy Capital Partners infusing $40 million of additional equity into the Company, $10 million of which were reserved for normal working capital and up to $30 million available to repurchase debt (see Note 17). A minority shareholder also infused $0.425 million alongside Energy Capital Partners to prevent dilution. The amendment and waiver also stated that there shall be no leverage ratio test until June 30, 2017, and any required financial statements past-due were provided within 30 days. Gain on Extinguishment of Debt — following the credit amendment on June 8, 2016, the Company initiated an auction process with the lenders to repurchase a portion of debt for a price of 80 cents, or a 20% discount to par value. The auction settled on June 16, 2016 as the Company repurchased a total amount of $37.5 million of debt for $30 million plus $0.525 million in debtPROPETRO HOLDING CORP. AND SUBSIDIARYNOTES TO CONDENSED CONSOLIDATED FINANCIAL STATEMENTS (UNAUDITED) (Continued)FOR THE NINE MONTHS ENDED SEPTEMBER 30, 2016 AND 20159. LONG-TERM DEBT (Continued)extinguishment auction costs, leading to a gain on extinguishment of debt of $6.975 million, which is recorded as other income in the statement of operations. Annual Maturities — Scheduled of remaining maturities of long-term debt for each fiscal year are as follows at September 30, 2016: $ 4,129,696 16,920,074 24,272,764 163,250,000 $ 208,572,534 10. ACCRUED LIABILITIES Accrued liabilities consisted of the following at September 30, 2016 and December 31, 2015, respectively: 2016 2015 2,739,857 — — 2,778,368 751,958 1,256,269 921,283 1,174,787 355,905 1,842,491 $ 4,769,003 $ 7,051,915 11. EMPLOYEE BENEFIT PLAN The Company has a 401(k) plan whereby all employees with six months of service may contribute up to $15,000 to the plan. The employees vest in the Company contributions to the 401(k) plan 25% per year with full vesting occurring after five years of service. The employees are fully vested in their contributions when made. The Company matches employee contributions 20 cents on the dollar up to 10% of gross salary. The Company has reported expense under the plan of $0.1 million for each of the periods ended September 30, 2016 and 2015.12. REPORTABLE SEGMENT INFORMATION The Company has seven operating segments: hydraulic fracturing, cementing, acidizing, coil tubing, flowback, surface drilling, and permian drilling. These segments represent how the chief operating decision maker (CODM) evaluates performance and allocates resources for which discreet financial information is readily available. In accordance with Accounting Standards Codification (ASC) 280 —Segment Reporting, the Company has one reportable segment (pressure pumping) comprised of the hydraulic fracturing,PROPETRO HOLDING CORP. AND SUBSIDIARYNOTES TO CONDENSED CONSOLIDATED FINANCIAL STATEMENTS (UNAUDITED) (Continued)FOR THE NINE MONTHS ENDED SEPTEMBER 30, 2016 AND 201512. REPORTABLE SEGMENT INFORMATION (Continued)cementing, and acidizing operating segments. All other operating segments and corporate administrative expenses are included in the "all other" category in the table below. Inter-segment revenues are not material and were not shown separately in the table below. The Company manages and assesses the performance of the reportable segment by its Adjusted EBITDA (earnings before other income (expense), interest, taxes, depreciation & amortization, stock-based compensation expense, impairment expense, loss on disposal of assets) and reconciliation from segment level financial information to the consolidated statement of operations is provided in the table below. Pressure Pumping All Other Total $ 251,409,838 $ 21,589,379 $ 272,999,217 — 6,974,805 6,974,805 $ 6,500,191 $ (4,930,118 ) $ 1,570,073 $ 27,905,073 $ 4,763,941 $ 32,669,014 $ 21,582,218 $ 312,120 $ 21,894,338 $ 388,053,564 $ 49,698,322 $ 437,751,886 7,979,906 28,629,426 36,609,332 $ 49,291,189 $ (268,958 ) $ 49,022,231 $ 28,681,919 $ 8,954,124 $ 37,636,043 $ 59,701,522 $ 2,466,975 $ 62,168,497 PROPETRO HOLDING CORP. AND SUBSIDIARYNOTES TO CONDENSED CONSOLIDATED FINANCIAL STATEMENTS (UNAUDITED) (Continued)FOR THE NINE MONTHS ENDED SEPTEMBER 30, 2016 AND 201512. REPORTABLE SEGMENT INFORMATION (Continued)Reconciliation of Adjusted EBITDA to net loss Total $ (35,829,775 )
15,942,131 (18,643,676 ) 32,669,014 12,859,060 (6,974,805 ) 1,130,184 417,940 $ 1,570,073 Reconciliation of Adjusted EBITDA to net loss Total $ (37,583,317 )
16,458,016 (20,762,840 ) 37,636,043 36,609,332 15,092,736 929,118 643,143 $ 49,022,231 13. NET LOSS PER SHARE The Company's net loss per share is determined by dividing the net loss relevant to the common stock by the weighted average number of shares outstanding during the year. Diluted net loss per common share uses the same net loss divided by the number of shares that would bePROPETRO HOLDING CORP. AND SUBSIDIARYNOTES TO CONDENSED CONSOLIDATED FINANCIAL STATEMENTS (UNAUDITED) (Continued)FOR THE NINE MONTHS ENDED SEPTEMBER 30, 2016 AND 201513. NET LOSS PER SHARE (Continued)outstanding assuming dilutive options and stock are converted (conversion method). The table below shows the calculations for periods ended September 30. 2016 2015 $ (35,829,775 ) $ (37,583,317 ) 29,328,475 24,132,871 29,328,475 24,132,871
$
(1.22
)
$
(1.56
) $ (1.22 ) $ (1.56 ) The Company also has non-vested restricted stock and stock options as shown in the table below, but have not been included in the above calculation of diluted earnings (loss) per share as it would be non-dilutive to the calculation above. 2016 2015 3,204,066 2,404,004 256,783 256,783 3,460,849 2,660,787 14. STOCK-BASED COMPENSATION Stock Options — Effective March 4, 2013, the Company adopted the Stock Option Plan of Holding (the "Plan") pursuant to which the Company's Board of Directors may grant stock options or other stock-based awards to key employees, consultants, and directors. The Plan, as amended, is authorized to grant up to 3,204,083 shares of common stock to be issued upon exercise of the options. The shares subject to each award can be granted with an exercise price per share of no less than 100% of the fair value of the Company's stock at the date of grant. The Company'sCompany’s share price used to estimate the fair value of the optionRSU at the grant date was based on a combination of income and market approaches, which are highly complex and sensitive. The income approach involves the use of a discounted cash flow method, with the cash flow projections discounted at an appropriate discount rate. The market approach involves the use of comparable public companies market multiples in estimating the fair value of the Company's stock. The expected term used to calculate the fair value of all options considers the vesting date and the grant's expiration date. The expected volatility was estimated by considering comparable public companies, and the risk free rate is based on the U.S treasury yield curve as of the grant date. The dividend assumption is based on historical experience. The fair value and estimates will no longer be necessary if the Company goes public because it will rely on the market price to determine the market value of its common stock. Prior to 2015, the Company had granted a total of 2,413,271 options with an exercise price of $5.73 per option, and all options expire 10 years from the date of grant.PROPETRO HOLDING CORP. AND SUBSIDIARYNOTES TO CONDENSED CONSOLIDATED FINANCIAL STATEMENTS (UNAUDITED) (Continued)FOR THE NINE MONTHS ENDED SEPTEMBER 30, 2016 AND 201514. STOCK-BASED COMPENSATION (Continued) On June 14, 2013, the Company granted 1,930,628 stock option awards to certain key employees and directors that shall vest and become exercisable based upon the achievement of a service requirement. The options vest in 25% increments for each year of continuous service and an option becomes fully vested upon the optionee's completion of the fourth year of service. The contractual term for the options awarded is 10 years. For the periods ended September 30, 2016 and 2015, the Company recognized $0.9 million in compensation expense related to these stock options. The fair value of each option award granted is estimated on the date of grant using the Black-Scholes option-pricing model. The fair value of the options was estimated at the date of grant using the following assumptions:Expected volatility45%Expected dividends$—Expected term (in years)6.25Risk free rate1.35% On December 1, 2013, the Company granted 482,643 stock option awards to certain key employees that shall vest and become exercisable based upon the achievement of both a service and a performance requirement. The options vest in 25% increments for each year of continuous service and an option becomes fully vested upon a change in control. As of September 30, 2015, the performance requirement was not considered to be probable of achievement for any of the outstanding option awards and 78,939 options were forfeited during the period ended September 30, 2016. Accordingly, the Company has not recognized any compensation expense related to these stock options. The contractual term for the options awarded is 10 years. The fair value of each option award granted is estimated on the date of grant using the Black-Scholes option-pricing model. The fair value of the options was estimated at the date of grant using the following assumptions:Expected volatility45%Expected dividends$—Expected term (in years)6.25Risk free rate1.83% On July 19, 2016, the Company's Board of Directors authorized and granted 879,001 stock option awards to certain key employees and directors that shall vest and become exercisable based upon the achievement of a service requirement. The options vest in 20% increments for each six months of continuous service with December 2016 being the first vesting period and an option becomes fully vested as of July 2019. The contractual term for the options awarded is 10 years. For the period ended September 30, 2016, the Company recognized $0.2 million in compensation expense related to these stock options. The total stock compensation expense for periods ended September 30, 2016 and 2015 for all stock options was $1.1 million and $0.9 million, respectively. The tax benefit related to the stockPROPETRO HOLDING CORP. AND SUBSIDIARYNOTES TO CONDENSED CONSOLIDATED FINANCIAL STATEMENTS (UNAUDITED) (Continued)FOR THE NINE MONTHS ENDED SEPTEMBER 30, 2016 AND 201514. STOCK-BASED COMPENSATION (Continued)compensation expense recorded for the periods ended September 30, 2016 and 2015 was $0.4 million and $0.3 million, respectively. The total unrecognized compensation expense as of September 30, 2016 is $2.9 million, and is expected to be recognized over a weighted-average period of approximately1.8 years. The fair value of each option award granted is estimated on the date of grant using the Black-Scholes option-pricing model. The fair value of the options was estimated at the date of grant using the following assumptions:Expected volatility55%Expected dividends$—Expected term (in years)5.80Risk free rate1.51% The outstanding options at January 1, 2015 were 2,404,004 as 9,267 options were forfeited in 2014. As of September 30, 2016, none of the options are fully vested. A summary of the stock option activity for the periods ended September 30, 2016 is presented below. Number
of Shares Weighted
Average
Exercise
Price Weighted
Average
Grant-Date
Fair Value 2,404,004 $ 5.73 $ 2.56 — — — — — — — — — — — — 2,404,004 5.73 2.56 965,314 5.73 2.56 2,404,004 5.73 2.56 879,001 3.26 2.56 — — — (78,939 ) 5.73 2.56 — — — 3,204,066 5.05 2.56 1,447,971 5.73 2.56 Restricted Stock Units — On September 30, 2013, the Company's Board of Directors authorized and granted 256,783 Restricted Stock Units (RSUs) to a key executive. Each RSU represents the right to receive one share of common stock of the Company at par value $0.001 per share. RSUs shall vest and the shares of common stock subject to the RSUs shall be paid to the grantee upon change in control, whether or not grantee is an employee, consultant, or director ofPROPETRO HOLDING CORP. AND SUBSIDIARYNOTES TO CONDENSED CONSOLIDATED FINANCIAL STATEMENTS (UNAUDITED) (Continued)FOR THE NINE MONTHS ENDED SEPTEMBER 30, 2016 AND 201514. STOCK-BASED COMPENSATION (Continued)the Company on such date. If the grantee ceases to be an employee, consultant, or director of the Company prior to the vesting date, he shall not forfeit any rights with respect to the unvested RSUs and shall be entitled to receive payment on the vesting date. The fair value of the RSUs is measured as the price of the Company's shares on the grant date, which was estimated to be $5.63. The Company's share price used to estimate the fair value of the option at the grant date was based on a combination of income and market approaches, which are highly complex and sensitive. The income approach involves the use of a discounted cash flow method, with the cash flow projections discounted at an appropriate discount rate. The market approach involves the use of comparable public companies market multiples in estimating the fair value of the Company'sCompany’s stock. As of September 30,December 31, 2016, and 2015, the RSUs were not vested as the performance requirement was not considered to be probable of achievement. Accordingly, the Company has not recognized any compensation expense related to these RSUs. There have been no additional RSUs granted, vested or forfeited since September 30, 2013.RELATED-PARTYINCOME TAXES 2016 2015 Federal: Current $ — $ (1,092,437 ) Deferred (29,082,057 ) (22,176,578 ) (29,082,057 ) (23,269,015 ) State: Current — (350,494 ) Deferred 1,110,475 (1,768,061 ) 1,110,475 (2,118,555 ) Total benefit $ (27,971,582 ) $ (25,387,570 ) 2016 2015 Tax at federal statutory rate $ (28,391,642 ) $ (24,934,089 ) State taxes, net of federal benefit (215,952) (885,226) Permanent differences 498,131 578,837 Valuation allowance 878,522 — Other (740,641) (147,092) Total provision $ (27,971,582 ) $ (25,387,570 ) 2016 2015 Deferred Income Tax Assets Accrued liabilities 334,072 471,223 Allowance for doubtful accounts 194,664 300,640 Goodwill and other intangible assets 10,953,458 13,021,523 Stock‑based compensation 1,692,288 1,119,355 Net operating losses 49,266,688 29,067,458 Other 388,813 388,813 Noncurrent deferred tax assets $ 62,829,983 $ 44,369,012 Total deferred tax assets $ 62,829,983 $ 44,369,012 Valuation allowance (878,522 ) — Total deferred tax assets — net $ 61,951,461 $ 44,369,012 Deferred Income Tax Liabilities Property and equipment $ (60,958,408 ) $ (70,621,451 ) Prepaid expenses (1,506,831 ) (1,498,531 ) Other (634,692 ) (1,369,082 ) Noncurrent deferred tax liabilities $ (63,099,931 ) $ (73,489,064 ) Net deferred tax liability $ (1,148,470 ) $ (29,120,052 ) five-yearfive‑year lease agreement with a five-yearfive‑year extension option requiring a base rent of $72,000 per year. The Company also leases five properties adjacent to the corporate office from related parties with annual base rents of $30,000, $30,000, $90,000, $90,000, and $180,000.periods ending September 30,years ended December 31, 2016 and 2015, the Company paid $119,879approximately $186,000 and $119,421$164,000, respectively, for the use of transportation services from a related party is at actual cost.In period ending September 30,For the years ended December 31, 2016 and 2015, the Company paid $144,000$192,000 and $144,000.September 30,December 31, 2016 and December 31, 2015, the Company had $6,724$0 and $0 in payables, respectively, and approximately $35,000 and $18,000 in receivables, respectively, for related parties for services provided.17.18.PROPETRO HOLDING CORP. AND SUBSIDIARYNOTES TO CONDENSED CONSOLIDATED FINANCIAL STATEMENTS (UNAUDITED) (Continued)FOR THE NINE MONTHS ENDED SEPTEMBER 30, 2016 AND 201516.periodsyears ended September 30,December 31, 2016 and 2015, the Company recorded operating lease expense of $1$1.4 million for each of the periods. Required remaining lease payments for each fiscal year are as follows: $ 343,379 471,416 $ 471,416 426,416 426,416 366,416 366,416 343,916 343,916 2021 and thereafter 773,812 $ 1,951,543 $ 2,381,976 Company'sCompany’s financial position, results of operations, or liquidity.17.Energy Capital Partners (ECP)ECP and its related affiliates hold 20,992,383held 30,438,955 of the 24,132,87134,992,662 outstanding common shares of the Company. The remaining outstanding shares of the Company are held by management and two prior lenders to the Company.ECPEnergy Capital Partners, and its related affiliates along with other shareholders infused $40.425 million of equity into the Company and the Company issued 12,418,84718,007,328 additional shares of stock. On June 8, 2016, 12,288,22417,817,925 shares of stock were issued followed by 130,622189,403 on July 13, 2016. As of September 30,December 31, 2016, the Company has 36,551,716 52,627,652currently hold 33,331,494,48,330,667, increasing ECP ownership interest to 91.2%91.8%. The remaining outstanding common shares of the Company are held by management and two prior lenders to the Company.18. SUBSEQUENT EVENTS The Company evaluated subsequent events through15,27, 2016, the date on whichCompany completed a private placement offering of $170 million, issuing 16,999,990 shares of Series A nonparticipating convertible preferred stock, par value $.001 per share. Costs associated with the September 30,offering were approximately $7 million, resulting in net proceeds to the Company of $163 million.interim condensed consolidated financial statements16,999,990 shares of Series A convertible preferred stock were originally issued and January 20, 2017,outstanding, convertible into common stock at the date on whichconversion price per the retrospectively revised September 30, 2016 interim condensed consolidated financial statements were issued (asprivate placement agreement. Upon a qualifying initial public offering, the Series A Preferred Shares will automatically convert into common stock at a conversion price equal to the reverse stock split discussed in Note 1). In addition tolesser of $10.00 per Series A Preferred Share or 90% of the reverse stock split and private placement discussed in Note 1,initial public offering price of the common stock. The Company has retained investment bankers with the intention of an initial public offering.ProPetro Holding Corp. SharesProspectus , 2017Goldman, Sachs & Co.BarclaysCredit SuisseJ.P. MorganEvercore ISIRBC Capital MarketsSimmons & Company InternationalEnergy Specialists of Piper JaffrayRaymond JamesTudor, Pickering, Holt & Co.Deutsche Bank SecuritiesJohnson Rice & Company L.L.C.Through and including , 2017 (the 25th day after the date of this prospectus), all dealers effecting transactions in these securities, whether or not participating in this offering, may be required to deliver a prospectus. This is in addition to a dealer's obligation to deliver a prospectus when acting as an underwriter and with respect to an unsold allotment or subscription.FINRA filing fee and listing fee, the amounts set forth below are estimates. $ 39,986 * * * * * * * $ * SEC registration fee $ _ Printing and engraving expenses * Fees and expenses of legal counsel * Accounting and consulting fees and expenses * Transfer agent and registrar fees * Total * To These fees are calculated based on the number of shares offered and sold and cannot be filed by amendment.currently organized as a Texas Corporation. In connection with the completion of this offering, we intend to change the jurisdiction of our incorporation to the State of Delaware and we will file a certificate of incorporation with the State of Delaware.will provideprovides that a director will not be liable to the corporation or its stockholders for monetary damages to the fullest extent permitted by the DGCL.Delaware General Corporation Law (the “DGCL”). In addition, if the DGCL is amended to authorize the further elimination or limitation of the liability of directors, then the liability of a director of the corporation, in addition to the limitation on personal liability provided for in our certificate of incorporation, will be limited to the fullest extent permitted by the amended DGCL. Our bylaws will provide that the corporation will indemnify, and advance expenses to, any officer or director to the fullest extent authorized by the DGCL.attorneys'attorneys’ fees, judgments, fines and amounts paid in settlement in connection with specified actions, suits and proceedings whether civil, criminal, administrative, or investigative, other than a derivative action by or in the right of the corporation, if they acted in good faith and in a manner they reasonably believed to be in or not opposed to the best interests of the corporation and, with respect to any criminal action or proceeding, had no reasonable cause to believe their conduct was unlawful. A similar standard is applicable in the case of derivative actions, except that indemnification extends only to expenses, including attorneys'attorneys’ fees, incurred in connection with the defense or settlement of such action and the statute requires court approval before there can be any indemnification where the person seeking indemnification has been found liable to the corporation. The statute provides that it is not exclusive of other indemnification that may be granted by a corporation'scorporation’s certificate of incorporation, bylaws, disinterested director vote, stockholder vote, agreement or otherwise.will also containcontains indemnification rights for our directors and our officers. Specifically, our certificate of incorporation will provideprovides that we shall indemnify our officers and directors to the fullest extent authorized by the DGCL. Further, we may maintain insurance onII-1directors'directors’ and officers'officers’ insurance to cover our directors, officers and some of our employees for certain liabilities.will enterhave entered into written indemnification agreements with our directors and executive officers. Under these proposed agreements, if an officer or director makes a claim of indemnification to us, either a majority of the independent directors or independent legal counsel selected by the independent directors must review the relevant facts and make a determination whether the officer or director has met the standards of conduct under Delaware law that would permit (under Delaware law) and require (under the indemnification agreement) us to indemnify the officer or director. The underwriting agreement provides for indemnification by the underwriters of us and our officers and directors, and by us of the underwriters, for certain liabilities arising under the Securities Act or otherwise in connection with this offering.4(2)4(a)(2) of the Securities Act, Regulation D or Regulation S promulgated thereunder or Rule 701 of the Securities Act.12,418,84718,007,328 additional shares (after giving effect to the December 22, 2016 reverse stock split and March 2017 stock split) of common stock to certain investment funds managed by Energy Capital Partners and a minority shareholder for $40.425 million. We used the proceeds from the private offering for working capital purposes and to repay indebtedness under our term loan.$3.26$2.25 per share exercise price. Such stock options are scheduled to vest in five equal semi-annualsemi‑annual installments starting on December 31, 2016. In connection with this offering,our IPO, we intend to fully accelerateaccelerated the vesting of the unvested portion of these stock options.- 345,890
‑ 501,540- 214,463
‑ 310,971- 159,324
‑ 231,019- 159,32411,724,13416,999,990 shares of our Series A Convertible Preferred stock, par value $0.001 (the "Series“Series A Preferred Shares"Shares”) to certain "accredited investors"“accredited investors” (as defined in Regulation D promulgated under the Securities Act of 1933, as amended). We believe that the private offering of Series A Preferred Shares was exempt from the registration requirements pursuant to Rule 506 under Regulation D. We received net proceeds of approximately $163 million.II-2 Description 1.1*Form of Underwriting Agreement (including form of Lock-up Agreement)3.1 3.1*Amended and Restated Certificate of Incorporation of ProPetro Holding Corp., as amended March 16, 2017 (incorporated by reference herein to Exhibit 3.1 to ProPetro Holding Corp.’s Quarterly Report on Form 10‑Q for the quarter ended March 31, 2017).3.2 3.2*Amended and Restated Bylaws of ProPetro Holding Corp. (incorporated by reference herein to Exhibit 3.3 to ProPetro Holding Corp.’s Registration Statement on Form S‑1, dated March 10, 2017 (Registration No. 333‑215940)).4.1 4.1*Specimen Stock Certificate (incorporated by reference herein to Exhibit 4.1 to ProPetro Holding Corp.’s Registration Statement on Form S‑1, dated February 23, 2017 (Registration No. 333‑215940). 4.2 4.2*Registration Rights Agreement, dated March 4, 2013, by and among ProPetro Holding Corp. and the parties thereto (incorporated by reference herein to Exhibit 4.2 to ProPetro Holding Corp.’s Registration Statement on Form S‑1, dated February 23, 2017 (Registration No. 333‑215940)). Description 4.3 *Registration Rights Agreement, dated December 27, 2016, by and among ProPetro Holding Corp. and the investors listed on Schedule A thereto (incorporated by reference herein to Exhibit 4.2 to ProPetro Holding Corp.’s Registration Statement on Form S‑1, dated February 23, 2017 (Registration No. 333‑215940)). 4.4 Stockholders Agreement, dated as of March 22, 2017, by and among ProPetro Holding Corp., Energy Capital Partners II, LP, Energy Capital Partners II‑A, LP, Energy Capital Partners II‑B, LP, Energy Capital Partners II‑C (Direct IP), LP, Energy Capital Partners II‑D, LP, Energy Capital Partners II (Midland CoInvest), LP (incorporated by reference herein to Exhibit 4.1 to ProPetro Holding Corp.’s Current Report on Form 8‑K, dated March 28, 2017). 4.4*Form of Shareholders Agreement5.1 5.1*Form of opinionOpinion of Latham & Watkins LLP as to the legality of the securities being registered10.1 10.1*Form of Indemnification Agreement (incorporated by reference to Exhibit 10.1 to ProPetro Holding Corp.’s Registration Statement on Form S‑1, dated February 7, 2017 (Registration No. 333‑215940)). 10.2 Credit Agreement, dated as of March 22, 2017 by and among ProPetro Holding Corp., ProPetro Services, Inc., Barclays Bank PLC, as the Agent, the Collateral Agent, a Letter of Credit Issuer and the Swingline Lender, and each of the Lenders from time to time party thereto (incorporated by reference herein to Exhibit 10.2 to ProPetro Holding Corp.’s Current Report on Form 8‑K, dated March 28, 2017). 10.2*Form of Credit Agreement10.310.3# Employment Agreement, dated April 17, 2013, by and between ProPetro Holding Corp. and Dale Redman (incorporated by reference herein to Exhibit 10.3 to ProPetro Holding Corp.’s Registration Statement on Form S‑1, dated February 7, 2017 (Registration No. 333‑215940)). 10.410.4# Employment Agreement, dated April 17, 2013, by and between ProPetro Holding Corp. and David Sledge (incorporated by reference herein to Exhibit 10.4 to ProPetro Holding Corp.’s Registration Statement on Form S‑1, dated February 7, 2017 (Registration No. 333‑215940)). 10.510.5# Employment Agreement, dated April 17, 2013, by and between ProPetro Holding Corp. and Jeffrey Smith (incorporated by reference herein to Exhibit 10.5 to ProPetro Holding Corp.’s Registration Statement on Form S‑1, dated February 7, 2017 (Registration No. 333‑215940)). 10.610.6# Stock Option Plan of ProPetro Holding Corp., dated March 4, 2013 (incorporated by reference herein to Exhibit 10.6 to ProPetro Holding Corp.’s Registration Statement on Form S‑1, dated February 7, 2017 (Registration No. 333‑215940)). 10.710.7# First Amendment to the Stock Option Plan of ProPetro Holding Corp., dated June 14, 2013 (incorporated by reference herein to Exhibit 10.7 to ProPetro Holding Corp.’s Registration Statement on Form S‑1, dated February 7, 2017 (Registration No. 333‑215940)). 10.810.8# Second Amendment to the Stock Option Plan of ProPetro Holding Corp., dated December 2, 2016 (incorporated by reference herein to Exhibit 10.8 to ProPetro Holding Corp.’s Registration Statement on Form S‑1, dated February 7, 2017 (Registration No. 333‑215940)). 10.9# 10.9Non-QualifiedNon‑Qualified Stock Option Agreement, dated June 14, 2013, by and between ProPetro Holding Corp. and Dale Redman (incorporated by reference herein to Exhibit 10.9 to ProPetro Holding Corp.’s Registration Statement on Form S‑1, dated February 7, 2017 (Registration No. 333‑215940)).10.10# 10.10Non-QualifiedNon‑Qualified Stock Option Agreement, dated June 14, 2013, by and between ProPetro Holding Corp. and David Sledge (incorporated by reference herein to Exhibit 10.10 to ProPetro Holding Corp.’s Registration Statement on Form S‑1, dated February 7, 2017 (Registration No. 333‑215940)).10.11# 10.11Non-QualifiedNon‑Qualified Stock Option Agreement, dated June 14, 2013, by and between ProPetro Holding Corp. and Jeffrey Smith (incorporated by reference herein to Exhibit 10.11 to ProPetro Holding Corp.’s Registration Statement on Form S‑1, dated February 7, 2017 (Registration No. 333‑215940)).10.12# 10.12Non-QualifiedNon‑Qualified Stock Option Agreement, dated June 14, 2013, by and between ProPetro Holding Corp. and Spencer D. Armour, III (incorporated by reference herein to Exhibit 10.12 to ProPetro Holding Corp.’s Registration Statement on Form S‑1, dated February 7, 2017 (Registration No. 333‑215940)).10.13# 10.13Non-QualifiedNon‑Qualified Stock Option Agreement, dated July 19, 2016, by and between ProPetro Holding Corp. and Dale Redman (incorporated by reference herein to Exhibit 10.13 to ProPetro Holding Corp.’s Registration Statement on Form S‑1, dated February 7, 2017 (Registration No. 333‑215940)).
10.14# II-3Exhibitnumber Description 10.14Non-QualifiedNon‑Qualified Stock Option Agreement, dated July 19, 2016, by and between ProPetro Holding Corp. and David Sledge (incorporated by reference herein to Exhibit 10.14 to ProPetro Holding Corp.’s Registration Statement on Form S‑1, dated February 7, 2017 (Registration No. 333‑215940)). Description 10.1510.15# Non-QualifiedNon‑Qualified Stock Option Agreement, dated July 19, 2016, by and between ProPetro Holding Corp. and Jeffrey Smith (incorporated by reference herein to Exhibit 10.15 to ProPetro Holding Corp.’s Registration Statement on Form S‑1, dated February 7, 2017 (Registration No. 333‑215940)).10.16# 10.16Non-QualifiedNon‑Qualified Stock Option Agreement, dated July 19, 2016, by and between ProPetro Holding Corp. and Spencer D. Armour, III (incorporated by reference herein to Exhibit 10.16 to ProPetro Holding Corp.’s Registration Statement on Form S‑1, dated February 7, 2017 (Registration No. 333‑215940)).10.17# Restricted Stock Unit Grant Notice and Restricted Stock Unit Agreement, dated September 30, 2013, by and between ProPetro Holding Corp. and Dale Redman (incorporated by reference herein to Exhibit 10.17 to ProPetro Holding Corp.’s Registration Statement on Form S‑1, dated February 23, 2017 (Registration No. 333‑215940)). 10.18# Form of ProPetro Holding Corp. 2017 Incentive Award Plan (incorporated by reference to Exhibit 10.18 to ProPetro Holding Corp.’s Registration Statement on Form S‑1, dated March 7, 2017 (Registration No. 333‑215940)). 10.19# Form of ProPetro Holding Corp. Senior Executive Incentive Bonus Plan (incorporated by reference to Exhibit 10.19 to ProPetro Holding Corp.’s Registration Statement on Form S‑1, dated February 23, 2017 (Registration No. 333‑215940)). 10.20# Form of ProPetro Holding Corp. Non‑Employee Director Compensation Policy (incorporated by reference to Exhibit 10.20 to ProPetro Holding Corp.’s Registration Statement on Form S‑1, dated February 23, 2017 (Registration No. 333‑215940)). 10.21# Form of ProPetro Holding Corp. Director Stock Ownership Policy (incorporated by reference to Exhibit 10.21 to ProPetro Holding Corp.’s Registration Statement on Form S‑1, dated February 23, 2017 (Registration No. 333‑215940)). 10.22# Form of ProPetro Holding Corp. 2017 Incentive Award Plan Stock Option Grant Notice and Stock Option Agreement (incorporated by reference to Exhibit 10.22 to ProPetro Holding Corp.’s Registration Statement on Form S‑1, dated February 23, 2017 (Registration No. 333‑215940)). 10.23# Form of ProPetro Holding Corp. Amendment to Non‑Qualified Stock Option Agreement (incorporated by reference to Exhibit 10.23 to ProPetro Holding Corp.’s Registration Statement on Form S‑1, dated February 23, 2017 (Registration No. 333‑215940)). 10.24# Amendment to Employment Agreement, by and between ProPetro Holding Corp. and Dale Redman (incorporated by reference herein to Exhibit 10.24 to ProPetro Holding Corp.’s Registration Statement on Form S‑1, dated February 23, 2017 (Registration No. 333‑215940) 10.25# Employment Agreement, dated February 17, 2017, by and between ProPetro Holding Corp. and Mark Howell (incorporated by reference herein to Exhibit 10.25 to ProPetro Holding Corp.’s Registration Statement on Form S‑1, dated February 23, 2017 (Registration No. 333‑215940) 10.26# Form of ProPetro Holding Corp. 2017 Incentive Award Plan Performance Restricted Stock Unit Award Grant Notice and Performance Stock Unit Award Agreement (incorporated by reference herein to Exhibit 10.1 to ProPetro Holding Corp.’s Quarterly Report on Form 10-Q for the period ended June 30, 2017). 10.27# Form of ProPetro Holding Corp. 2017 Incentive Award Plan Restricted Stock Unit Award Grant Notice and Restricted Stock Unit Award Agreement (incorporated by reference herein to Exhibit 10.2 to ProPetro Holding Corp.’s Quarterly Report on Form 10-Q for the period ended June 30, 2017). 10.28# Form of ProPetro Holding Corp. 2017 Incentive Award Plan Director Restricted Stock Unit Award Grant Notice and Director Restricted Stock Unit Award Agreement (incorporated by reference herein to Exhibit 10.3 to ProPetro Holding Corp.’s Quarterly Report on Form 10-Q for the period ended June 30, 2017). 21.1 List of Subsidiaries of ProPetro Holding Corp. (incorporated by reference herein to Exhibit 21.1 to ProPetro Holding Corp.’s Registration Statement on Form S‑1, dated February 7, 2017 (Registration No. 333‑215940)). 23.1 Consent of Deloitte & Touche LLP 23.2 23.2*Consent of Latham & Watkins LLP (contained in Exhibit 5.1) Description 24.1101.INS Powers of Attorney (contained on the signature page to this Registration Statement)XBRL Instance Document101.SCH XBRL Taxonomy Extension Schema Document 101.CAL XBRL Taxonomy Extension Calculation Linkbase Document 101.DEF XBRL Taxonomy Extension Definition Linkbase Document 101.LAB XBRL Taxonomy Extension Labels Linkbase Document 101.PRE XBRL Taxonomy Extension Presentation Linkbase Document
# Compensatory plan, contract or arrangement.*To be filed by amendment.providefile, during any period in which offers or sales are being made, a post‑effective amendment to this registration statement:underwritersplan of distribution not previously disclosed in the registration statement or any material change to such information in the registration statement;closing specifiedtermination of the offering; andunderwriting agreement certificatesregistration statement as of the date it is first used after effectiveness Provided, however, that no statement made in a registration statement or prospectus that is part of the registration statement or made in a document incorporated or deemed incorporated by reference into the registration statement or prospectus that is part of the registration statement will, as to a purchaser with a time of contract of sale prior todenominations and registeredfirst use, supersede or modify any statement that was made in the registration statement or prospectus that was part of the registration statement or made in any such names as required by the underwritersdocument immediately prior to permit prompt delivery to each purchaser.Securities and Exchange CommissionSEC such indemnification is against public policy as expressed in the Securities Act and is, therefore, unenforceable. In the event that a claim for indemnification against such liabilities (other than the payment by the registrant of expenses incurred or paid by a director, officer or controlling person of the registrant in the successful defense of any action, suit or proceeding) is asserted by such director, officer or controlling person in connection with the securities being registered, the registrant will, unless in the opinion of its counsel the matter has been settled by controlling precedent, submit to a court of appropriate jurisdiction the question whether such indemnification by it is against public policy as expressed in the Securities Act and will be governed by the final adjudication of such issue. The undersigned registrant hereby undertakes that, (1) For purposes of determining any liability under the Securities Act, the information omitted from the form of prospectus filed as part of this registration statement in reliance upon Rule 430A and contained in a form of prospectus filed by the registrant pursuant to Rule 424(b)(1) or (4) or 497(h) under the Securities Act shall be deemed to be part of this registration statement as of the time it was declared effective. (2) For the purpose of determining any liability under the Securities Act, each post-effective amendment that contains a form of prospectus shall be deemed to be a new registration statement relating to the securities offered therein, and the offering of such securities at that time shall be deemed to be the initial bona fide offering thereof. (3) That, for the purpose of determining liability under the Securities Act of 1933 to any purchaser, each prospectus filed pursuant to Rule 424(b) as part of a registration statement relating to an offering, other than registration statements relying on Rule 430B or other than prospectuses filed in reliance on Rule 430A, shall be deemed to be part of and included in theII-4registration statement as of the date it is first used after effectiveness. Provided, however, that no statement made in a registration statement or prospectus that is part of the registration statement or made in a document incorporated or deemed incorporated by reference into the registration statement or prospectus that is part of the registration statement will, as to a purchaser with a time of contract of sale prior to such first use, supersede or modify any statement that was made in the registration statement or prospectus that was part of the registration statement or made in any such document immediately prior to such date of first use. (4) That, for the purpose of determining liability of the registrant under the Securities Act of 1933 to any purchaser in the initial distribution of the securities, the undersigned registrant undertakes that in a primary offering of securities of the undersigned registrant pursuant to this registration statement, regardless of the underwriting method used to sell the securities to the purchaser, if the securities are offered or sold to such purchaser by means of any of the following communications, the undersigned registrant will be a seller to the purchaser and will be considered to offer or sell such securities to such purchaser: (a) Any preliminary prospectus or prospectus of the undersigned registrant relating to the offering required to be filed pursuant to Rule 424; (b) Any free writing prospectus relating to the offering prepared by or on behalf of the undersigned registrant or used or referred to by the undersigned registrant; (c) The portion of any other free writing prospectus relating to the offering containing material information about the undersigned registrant or its securities provided by or on behalf of the undersigned registrant; and (d) Any other communication that is an offer in the offering made by the undersigned registrant to the purchaser.II-5the City of Houston,Midland, Texas, on February 7,September 8, 2017.ProPetro Holding Corp. By:/s/ DALE REDMANBy: /s/ Dale Redman Name: Dale Redman Title: Chief Executive Officer and Jeffrey Smith, and each of them, any of whom maywith full power to act without the joinder of the other, as his true and lawful attorneys-in-factattorneys‑in‑fact and agents, with full power of substitution and re-substitution,resubstitution, for him or her and in his or her name, place and stead, in any and all capacities, to sign any and all amendments (including post-effectivepost‑effective amendments) to this Registration Statement and any Registration Statement (including any amendment thereto) for this offering that is to be effective upon filing pursuant to Rule 462(b) under the Securities Act of 1933, as amended,registration statement, and to file the same, with all exhibits thereto, and all other documents in connection therewith, with the Securities and Exchange Commission, granting unto each said attorneys-in-factattorney‑in‑fact and agents, and each of them,agent full power and authority to do and perform each and every act and thing requisite and necessary to be done in connection therewith, as fully to all intents and purposes as he might or could do in person, hereby ratifying and confirming all that said attorneys-in-factattorneys‑in‑fact and agents or anyeither of them or their or his substitute andor substitutes may lawfully do or cause to be done by virtue hereof.February 7,September 8, 2017.Signature Title Date /s/ DALE REDMAN
Dale Redman Chief Executive Officer and Director (Principal Executive Officer) February 7, 2017/s/ JEFFREY SMITHJeffrey SmithChief Financial Officer (Principal Financial Officer and Principal Accounting Officer)February 7, 2017/s/ SPENCER D. ARMOUR, IIISpencer D. Armour, IIIDirectorFebruary 7, 2017/s/ SCHUYLER E. COPPEDGESchuyler E. CoppedgeDirectorFebruary 7, 2017/s/ STEPHEN HERMANStephen HermanDirectorFebruary 7, 2017/s/ MATTHEW H. HIMLERMatthew H. HimlerDirectorFebruary 7, 2017/s/ PETER LABBATPeter LabbatDirectorFebruary 7, 2017II-6Exhibitnumber Description 1.1*Form of Underwriting Agreement (including form of Lock-up Agreement)Dale Redman /s/Jeff Smith Chief Financial Officer (Principal Financial Officer) Jeff Smith /s/Spencer D. Armour, III Director Spencer D. Armour, III /s/Steven Beal Director Steven Beal /s/Schuyler E. Coppedge Director Schuyler E. Coppedge /s/Alan E. Douglas Director Alan E. Douglas /s/Stephen Herman Director Stephen Herman /s/Matthew H. Himler Director Matthew H. Himler /s/Peter Labbat Director Peter Labbat /s/Chris Leininger Director Chris Leininger /s/Jack B. Moore Director Jack B. Moore Description 3.1 *Amended and Restated 3.2 3.2*Amended and Restated 4.1 4.1*4.2 4.2*4.3 4.3*4.4 4.4*Form of Shareholders Agreement5.1 5.1*Form of opinion10.1 10.1*10.2 10.2*Form of Credit Agreement10.3# 10.310.4# 10.410.5# 10.510.6# 10.610.7# 10.710.8# 10.810.9# 10.9Non-Qualified Description 10.1010.10# Non-Qualified10.11# 10.11Non-Qualified10.12# 10.12Non-Qualified10.13# 10.13Non-Qualified10.14# 10.14Non-Qualified10.15# 10.15Non-Qualified
10.16# Exhibitnumber Description 10.16Non-QualifiedNon‑Qualified Stock Option Agreement, dated July 19, 2016, by and between ProPetro Holding Corp. and Spencer D. Armour, III (incorporated by reference herein to Exhibit 10.16 to ProPetro Holding Corp.’s Registration Statement on Form S‑1, dated February 7, 2017 (Registration No. 333‑215940)).10.17# 10.18# 10.19# 10.20# 10.21# 10.22# 10.23# 10.24# 10.25# 10.26# Description 10.27# 10.28# 21.1 23.1 23.2 23.2*101.INS XBRL Instance Document 101.SCH XBRL Taxonomy Extension Schema Document 101.CAL XBRL Taxonomy Extension Calculation Linkbase Document 101.DEF XBRL Taxonomy Extension Definition Linkbase Document 101.LAB XBRL Taxonomy Extension Labels Linkbase Document 101.PRE XBRL Taxonomy Extension Presentation Linkbase Document # Compensatory plan, contract or arrangement. 
24.1 Powers of Attorney (contained on the signature page to this Registration Statement)*To be filed by amendment.