Common Stock

![[MISSING IMAGE: lg_samsara-4clr.jpg]](https://capedge.com/proxy/S-1A/0001104659-22-039859/lg_samsara-4clr.jpg)
14.
| | | | Per Share | | | Total | | ||||||||
| Initial public offering price | | | | $ | | | | | $ | | | ||||
Underwriting discounts and commissions(1) | | | | $ | | | | | $ | | | ||||
| Proceeds to us, before expenses | | | | $ | | | | | $ | | | | |||
2022.
|
|

|
|
March 30, 2022.
SECURITIES AND EXCHANGE COMMISSION
| | Delaware | ||||||
| (State or other jurisdiction of incorporation or organization) | | | 3841 (Primary Standard Industrial Classification Code Number) | | | 47-5178400 (I.R.S. Employer Identification Number) | |
| Oded Har-Even, Esq. Ron Ben-Bassat, Esq. Sullivan & Worcester LLP 1633 Broadway New York, NY 10019 (212) 660-3060 | | | Thomas Ruggia Chief Executive Officer Samsara Vision, Inc. 27 Route 202, Suites 8 & 9, PO Box 705 Far Hills, NJ 07931 (877) 997-4448 | | | Matthew W. Mamak, Esq. Alston & Bird LLP 90 Park Avenue New York, NY 10016 (212) 210-9470 | |
☐ ☐ ☐ ☐¨¨¨¨ Large accelerated filer ¨☐ Accelerated filer ¨☐ Non-accelerated filer x☒ Smaller reporting company x☒ Emerging Growth Company x☒
CALCULATION OF REGISTRATION FEE
| Title of Securities Being Registered | Proposed Maximum Aggregate Offering Price(1)(2) | Amount of Registration Fee | ||||||
| Common stock, par value $0.0001per share(3) | $ | 28,750,000 | $ | 2,665.13 | ||||
| Representative’s warrants to purchase shares of common stock(4) | ||||||||
| Common stock underlying issuable upon exercise of Representative’s warrants(5) | $ | 1,796,875 | $ | 166.57 | ||||
| Total Registration Fee | $ | 30,546,875 | $ | 2,831.70 | ||||
☐
Common Stock
14.
| | | | Per Share | | | Total | | ||||||||
| Initial public offering price | | | | $ | | | | | $ | | | ||||
Underwriting discounts and commissions(1) | | | | $ | | | | | $ | | | ||||
| Proceeds to us, before expenses | | | | $ | | | | | $ | | | | |||
2022.
|
|
|
|
![[MISSING IMAGE: tm2135607d13-ph_inno4clr.jpg]](https://capedge.com/proxy/S-1A/0001104659-22-039859/tm2135607d13-ph_inno4clr.jpg)
| | | | Page | | |||
| | | | | | | ||
| | | | | | | ||
| | | | | | | ||
| | | | | | | ||
| | | | | | | ||
| | | | | | | ||
| | | | | | | ||
| | | | | | | ||
| | | | | | | ||
| | | | | | | ||
| | | | | | | ||
| | | | | | | ||
| | | | | | | ||
| | | | | | | ||
| | | | | 96 | | ||
| | | | | | | ||
| | | | | | | ||
| | | | | | | ||
| | | | | | | ||
| | | | | | | ||
| | | | | | | ||
| | | | | | | ||
|
Our Strengths
| WA IMT has clinically proven results under commercial conditions as well as peer-reviewed published long-term data. Our WA IMT is the first implantable medical device approved by the FDA that works similarly to the telephoto lens of a camera, resulting in improvement in vision and quality of life in individuals with late-stage AMD. • Our product line improves freedom for those patients suffering from late-stage AMD. This disease is one of the largest causes of non-preventable blindness in the world. Late-stage AMD patients are in need of products to improve the quality of their lives. There are currently no effective therapeutics for dry AMD. • Our WA IMT and the implantation thereof are approved by the Centers for Medicare & Medicaid Services (“CMS”) for reimbursement in the United States. This coverage decision applies to both our WA IMT and the surgeon fee. Surgeon reimbursement for the surgery tends to be in the range of approximately $1,500 – $1,800. For the year 2021, the CMS-approved reimbursement amount for the currently approved non-injectable version of our product is approximately $20,800 for both hospitals and Ambulatory Surgery Centers. For 2022, CMS has approved a hospital outpatient reimbursement rate of $24,166.29 and an Ambulatory Surgical Center reimbursement rate of $22,857.10. • Our gross margins, while fluctuating and dependent on various components and supplier prices, volume of production, and model, have been reasonably stable in the 85% to 90% range for our WA IMT device based on U.S. average selling price (“ASP”). Our SING IMT, which is currently not approved in the United States, adds the injector as a component to the overall cost. While the final margins have not been set and volume production has not been started, we believe our margins for the SING IMT surgical system will be in this range based on current U.S. pricing. • Our SING IMT and TSert delivery system received a CE Mark in April 2020, and we are in process of establishing the U.S. regulatory pathway. 6 • Our manufacturing facility complies with Good Manufacturing Practices (“GMPs”) and the European Union Medical Device Directive (Council Directive 93/42/EEC) (“EU MDD”) and subsequent amendments. Our experienced workers and line productions can facilitate large scale production. • We remain focused on continuing to improve our products and advance our technologies. We maintain an active internal research and development team, which is responsible for clinical activities and regulatory affairs. • Our intellectual property portfolio consists of 97 active patents and patent applications. Of these 97, 14 are issued U.S. patents, with another two pending U.S. patent applications. The remainder of the portfolio includes issued patents and pending applications in China, Hong Kong, Japan, Europe (including various national state validations) and Canada. The patent estate is directed to the core IMT implant, SING IMT and the TSert delivery system. These patents and patent applications have claims directed to apparatuses, systems and methods for implantation of IMT devices. The issued patents first begin to expire in 2023, with the last of these patents, which broadly claims the components of the SING IMT system, expiring in 2038. • Our management team has more than 200 years of collective successful experience in the ophthalmology and medical device industry. Our research and development and manufacturing teams in Tel Aviv, Israel have extensive experience in the development and manufacturing of ophthalmology related devices and technologies. |
| ||
Our Strategy
our recurring losses from operations, which consisted of $9,209 and $6,161 for the fiscal years ended December 31, 2021 and 2020, respectively, could continue to raise substantial doubt regarding our ability to continue as a going concern. Our ability to continue as a going concern requires that we obtain sufficient funding to finance our operations;
6
The Offering
| ||
| ||
| ||
|
|
1,837,038
| ||
7
no exercise of representative’s warrants;
| Six Months Ended June 30, | Year Ended December 31, | |||||||||||||||
| U.S. dollars in thousands, except share and per share data | 2021 | 2020 | 2020 | 2019 | ||||||||||||
| Consolidated Statement of Operations Data: | ||||||||||||||||
| Revenues | $ | 31 | $ | - | $ | - | $ | 72 | ||||||||
| Cost of revenues | (5 | ) | - | - | (67 | ) | ||||||||||
| Gross profit | 26 | - | - | 5 | ||||||||||||
| Research and development expenses | 1,622 | 1,150 | 2,652 | 3,253 | ||||||||||||
| Sales and marketing expenses | 736 | 149 | 272 | 629 | ||||||||||||
| General and administrative expenses | 1,588 | 1,061 | 3,237 | 2,260 | ||||||||||||
| Total operating expenses | 3,946 | 2,360 | 6,161 | 6,142 | ||||||||||||
| Operating loss | 3,920 | 2,360 | 6,161 | 6,137 | ||||||||||||
| Finance (income) expenses | (1,448 | ) | 9 | 38 | 30 | |||||||||||
| Loss attributable to the Company's stockholders (1) | 2,472 | 2,369 | $ | 6,199 | $ | 6,167 | ||||||||||
| Basic and diluted loss per share attributable to the Company's stockholders | $ | (0.27 | ) | $ | (0.26 | ) | $ | (0.69 | ) | $ | (0.69 | ) | ||||
| Weighted average stock outstanding (1) | 9,003,000 | 9,003,000 | 9,003,000 | 9,002,329 | ||||||||||||
8
| | | | Year Ended December 31, | | ||||||||||||
| U.S. dollars in thousands, except share and per share data | | | 2021 | | | 2020 | | | ||||||||
| Consolidated Statement of Operations Data: | | | | | | | | | | | | | | | ||
| Revenues | | | | $ | 39 | | | | | $ | — | | | | ||
| Cost of revenues | | | | | (7) | | | | | | — | | | | ||
| Gross profit | | | | | 32 | | | | | | — | | | | ||
| Research and development expenses | | | | | 4,227 | | | | | | 2,652 | | | | ||
| Sales and marketing expenses | | | | | 2,098 | | | | | | 272 | | | | ||
| General and administrative expenses | | | | | 2,916 | | | | | | 3,237 | | | | ||
| Total operating expenses | | | | | 9,241 | | | | | | 6,161 | | | | ||
| Operating loss | | | | | 9,209 | | | | | | 6,161 | | | | ||
| Finance (income) expenses | | | | | (1,033) | | | | | | 38 | | | | ||
| U.S. dollars in thousands | As of June 30, 2021 | |||||||||||
| Actual | Pro forma (1) | Pro forma as Adjusted (2)(3) | ||||||||||
| Consolidated Balance Sheet Data: | ||||||||||||
| Cash and cash equivalents and restricted cash | $ | 8,218 | $ | |||||||||
| Working capital (deficit) (4) | (2,783 | ) | ||||||||||
| Total assets | 8,662 | |||||||||||
| Convertible Series A preferred stock | 3,216 | |||||||||||
| Additional paid-in capital | 131,705 | |||||||||||
| Accumulated deficit | (137,776 | ) | ||||||||||
| Total stockholders’ equity (deficit) | $ | (6,071 | ) | $ | ||||||||
|
|
| | | | Year Ended December 31, | | ||||||||||||
| U.S. dollars in thousands, except share and per share data | | | 2021 | | | 2020 | | | ||||||||
Loss attributable to the Company’s stockholders(1) | | | | $ | 8,176 | | | | | $ | 6,199 | | | | ||
| Basic and diluted loss per share attributable to the Company’s stockholders | | | | $ | (0.91) | | | | | $ | (0.69) | | | | ||
Weighted average stock outstanding(1) | | | | | 9,004,950 | | | | | | 9,004,950 | | | | ||
| | ||||||||||||||||
| U.S. dollars in thousands | | | As of December 31, 2021 | | |||||||||||||||
| | | | Actual | | | Pro forma(1) | | | Pro forma as Adjusted(2)(3) | | |||||||||
| Consolidated Balance Sheet Data: | | | | | | | | | | | | | | | | | | | |
| Cash and cash equivalents and restricted cash | | | | $ | 2,877 | | | | | $ | 2,877 | | | | | | 15,896 | | |
Working capital (deficit)(4) | | | | | 1,865 | | | | | | 1,865 | | | | | | 15,257 | | |
| Total assets | | | | | 3,665 | | | | | | 3,665 | | | | | | 16,311 | | |
| Convertible Series A preferred stock | | | | | 3,216 | | | | | | — | | | | | | — | | |
| Additional paid-in capital | | | | | 131,897 | | | | | | 145,612 | | | | | | 158,631 | | |
| Accumulated deficit | | | | | (143,480) | | | | | | (143,480) | | | | | | (143,480) | | |
| Total stockholders’ equity (deficit) | | | | $ | (11,583) | | | | | $ | 2,133 | | | | | $ | 15,152 | | |
respectively.
10
Our success will depend on our ability to enhance our current technology and services and develop or acquire new technologies to keep pace with technological developments and evolving industry standards,
strategy.
13
We may not be able to replace our current manufacturing capabilities in a timely manner.
14
If we are not able to attract and retain highly skilled managerial, scientific technical and marketing personnel, we may not be able to implement our business model successfully.
15
International expansion of our business exposes us to business, regulatory, political, operational, financial and economic risks associated with doing business outside of the United States or Israel.
It is possible that our global market potential could be reduced or eliminated if any of the competitors develop and commercialize products that are safer, more effective, have fewer or less severe side effects, are more convenient or are less expensive than any products that we may develop. Our competitors also may obtain FDA or other regulatory approval for their products and possibly also more rapidly than we may obtain approval for ours.
• | ||
We are also subject to numerous post-marketing regulatory requirements, which include labeling regulations and medical device reporting regulations, which may require us to report to different regulatory agencies if our device causes or contributes to a death or serious injury, or malfunctions in a way that would likely cause or contribute to a death or serious injury. In addition, these regulatory requirements may change in the future in a way that adversely affects us. If we fail to comply with present or future regulatory requirements that are applicable to us, we may be subject to enforcement action by regulatory agencies, which may include, among others, any of the following sanctions:
19
Product and services liability suits, whether or not meritorious, could be brought against us. These suits could result in expensive and time-consuming litigation, payment of substantial damages and an increase in our insurance rates.
Risks Related to Our Intellectual Property
Third-party claims of intellectual property infringement may prevent or delay our development and commercialization efforts.
We may be involved in lawsuits to protect or enforce our intellectual property, which could be expensive, time consuming, and unsuccessful.
Many companies have encountered significant problems in protecting and defending intellectual property rights in foreign jurisdictions. The legal systems of certain countries, particularly certain developing countries, do not favor the enforcement of patents, trade secrets, and other intellectual property protection, which could make it difficult for us to stop the marketing of competing products or services in violation of our proprietary rights generally. Proceedings to enforce our patent rights in foreign jurisdictions, whether or not successful, could result in substantial costs and divert our efforts and attention from other aspects of our business, could put our future patents at risk of being invalidated or interpreted narrowly, put the issuance of our patent applications at risk, and could provoke third parties to assert claims against us. We may not prevail in any lawsuits that we initiate, and any damages or other remedies that we may be awarded, may not be commercially meaningful. Accordingly, our efforts to monitor and enforce our intellectual property rights around the world may be inadequate to obtain a significant commercial advantage from the intellectual property that we develop or license.
Our employees and consultants in Israel, including members of our management, may be obligated to perform one month, and in some cases longer periods, of military reserve duty until they reach the age of 40 (or older, for citizens who hold certain positions in the Israeli armed forces reserves) and, in the event of a military conflict or emergency circumstances, may be called to immediate and unlimited active duty. In the event of severe unrest or other conflict, individuals could be required to serve in the military for extended periods of time. In response to increases in terrorist activity, there have been periods of significant call-ups of military reservists. It is possible that there will be similar large-scale military reserve duty call-ups in the future. Our operations could be disrupted by the absence of a significant number of our officers, directors, employees and consultants related to military service. Such disruption could materially adversely affect our business and operations. Additionally, the absence of a significant number of the employees of our Israeli suppliers and contractors related to military service or the absence for extended periods of one or more of their key employees for military service may disrupt their operations.
25
Sales of a significant number of shares of our common stock in the public markets or significant short sales of our common stock, or the perception that such sales could occur, could depress the market price of our common stock and impair our ability to raise capital.
27
Other General Risk Factors
|
30
31
| ||
| ||
| As of June 30, 2021 | ||||||||||||
| Unaudited | ||||||||||||
| U.S. dollars in thousands | Actual | Pro forma | Pro forma as adjusted (1) | |||||||||
| Cash and cash equivalents and restricted cash | $ | 8,218 | $ | 8,218 | ||||||||
| Convertible loan | 10,200 | - | ||||||||||
| Convertible preferred stock (Series A), par value $0.0001 per share; 9,000,000 shares authorized, 9,000,000 shares issued and outstanding, actual; no shares authorized, issued or outstanding, pro forma and pro forma as adjusted | 3,216 | - | ||||||||||
| Stockholders’ equity: | ||||||||||||
| Common stock, par value $0.0001 per share; 19,000,000 shares authorized, actual; 3,000 shares issued and outstanding, actual; 28,000,000 shares authorized, pro forma and pro forma as adjusted; 9,003,000 shares issued and outstanding, pro forma; shares issued and shares outstanding, pro forma as adjusted | (* | ) | ||||||||||
| Additional paid-in capital | 131,705 | |||||||||||
| Accumulated deficit | (137,776 | ) | ||||||||||
| Total stockholders’ equity (deficit) | (6,071 | ) | ||||||||||
| Total capitalization | $ | (2,855 | ) | $ | ||||||||
| | | | As of December 31, 2021 Unaudited | | |||||||||||||||
| U.S. dollars in thousands | | | Actual | | | Pro forma | | | Pro forma as adjusted(1) | | |||||||||
| Cash and cash equivalents and restricted cash | | | | $ | 2,877 | | | | | $ | 2,877 | | | | | $ | 15,896 | | |
| Convertible loan | | | | | 10,500 | | | | | | — | | | | | | — | | |
| Convertible preferred stock (Series A), par value $0.0001 per share; 9,000,000 shares authorized, 9,000,000 shares issued and outstanding, actual; no shares authorized, issued or outstanding, pro forma and pro forma as adjusted | | | | | 3,216 | | | | | | — | | | | | | — | | |
| Stockholders’ equity: | | | | | | | | | | | | | | | | | | | |
| Common stock, par value $0.0001 per share; 90,000,000 shares authorized, actual; 4,950 shares issued and outstanding, actual; 90,000,000 shares authorized, pro forma and pro forma as adjusted; 18,335,271 shares issued and outstanding, pro forma; 20,835,271 shares issued and shares outstanding, pro forma as adjusted | | | | | (*) | | | | | | 1 | | | | | | 1 | | |
| Additional paid-in capital | | | | | 131,897 | | | | | | 145,612 | | | | | | 158,631 | | |
| Accumulated deficit | | | | | (143,480) | | | | | | (143,480) | | | | | | (143,480) | | |
| Total stockholders’ equity (deficit) | | | | | (11,583) | | | | | | 2,133 | | | | | | 15,152 | | |
| Total capitalization | | | | $ | (8,367) | | | | | $ | 2,133 | | | | | $ | 15,152 | | |
1,110,777•
540,000
161,410
32
| Six Months Ended June 30, | Year Ended December 31, | |||||||||||||||
| U.S. dollars in thousands, except share and per share data | 2021 | 2020 | 2020 | 2019 | ||||||||||||
| (Unaudited) | (Unaudited) | |||||||||||||||
| Consolidated Statement of Operations Data: | ||||||||||||||||
| Revenues | $ | 31 | $ | - | $ | - | $ | 72 | ||||||||
| Cost of revenues | (5 | ) | - | - | (67 | ) | ||||||||||
| Gross profit | 26 | - | - | 5 | ||||||||||||
| Research and development expenses | 1,622 | 1,150 | 2,652 | 3,253 | ||||||||||||
| Sales and marketing | 736 | 149 | 272 | 629 | ||||||||||||
| General and administrative expenses | 1,588 | 1,061 | 3,237 | 2,260 | ||||||||||||
| Total operating expenses | 3,946 | 2,360 | 6,161 | 6,142 | ||||||||||||
| Operating loss | 3,920 | 2,360 | 6,161 | 6,137 | ||||||||||||
| Finance (income) expenses | (1,448 | ) | 9 | 38 | 30 | |||||||||||
| Loss attributable to the Company's stockholders (1) | $ | 2,472 | $ | 2,369 | $ | 6,199 | $ | 6,167 | ||||||||
| Basic and diluted loss per share attributable to the Company's stockholders | $ | (0.27 | ) | $ | (0.26 | ) | $ | (0.69 | ) | $ | (0.69 | ) | ||||
| Weighted average stock outstanding (1) | 9,003,000 | 9,003,000 | 9,003,000 | 9,002,329 | ||||||||||||
(1) | ||||||||||||||||||||||||||||||||||||||||||||||||||||||||||||||||||||||||||||||||||||||||||||||||||||||||||||||||||||||||||||||||||||||||||||||||||||||||||||||||||||||||||||||||||||||||||||||||||||||||||||||||||||||||||||||||||
| June 30, | December 31, | |||||||
| U.S. dollars in thousands | 2021 | 2020 | ||||||
| (Unaudited) | ||||||||
| Consolidated Statements of Financial Position Data: | ||||||||
| Cash and cash equivalents and restricted cash | $ | 8,218 | $ | 2,402 | ||||
| Total assets | 8,662 | 2,812 | ||||||
| Additional paid-in capital | 131,705 | 130,272 | ||||||
| Accumulated deficit | (137,776 | ) | (135,304 | ) | ||||
| Total stockholders’ equity (deficit) | $ | (6,071 | ) | $ | (5,032 | ) | ||
| U.S. dollars in thousands | | | December 31, 2021 | | | |||||
| | | | | | | | | | ||
| Consolidated Statements of Financial Position Data: | | | | | | | | | | |
| Cash and cash equivalents and restricted cash | | | | $ | 2,877 | | | | ||
| Total assets | | | | | 3,665 | | | | ||
| Additional paid-in capital | | | | | 131,897 | | | | ||
| Accumulated deficit | | | | | (143,480) | | | | ||
| Total stockholders’ equity (deficit) | | | | $ | (11,583) | | | | ||
| | Assumed public offering price per share, the midpoint of the estimated price range set forth on the cover page of this prospectus | | | | $ | 6.00 | | |
| | Historical adjusted net tangible book value per share as of December 31, 2021 | | | | $ | 0.12 | | |
| | Increase in net tangible book value per share attributable to new investors in this offering | | | | $ | 0.61 | | |
| | As adjusted net tangible book value per share after offering | | | | $ | 0.73 | | |
| | Dilution in tangible book value per share to new investors | | | | $ | 5.27 | | |
The following table summarizes, on an as adjusted basis as of June 30,December 31, 2021, the differences between the number of common stock acquired from us, the total amount paid and the average price per share of common stock paid by the existing holders of our common stock and by investors in this offering
| Shares | Total Consideration | Average Price Per Common | ||||||||||||||||||
| Number | Percent | Amount | Percent | Stock | ||||||||||||||||
| Existing stockholders | % | $ | % | $ | ||||||||||||||||
| New investors | % | $ | % | $ | ||||||||||||||||
| Total | 100.0 | % | $ | 100 | % | $ | ||||||||||||||
| | | | Shares | | | Total Consideration | | | Average Price Per Common Stock | | |||||||||||||||||||||
| | Number | | | Percent | | | Amount | | | Percent | | ||||||||||||||||||||
| Existing stockholders | | | | | 18,335,271 | | | | | | 88% | | | | | $ | 130,000 | | | | | | 89.7% | | | | | $ | 7.09 | | |
| New investors | | | | | 2,500,000 | | | | | | 12% | | | | | $ | 15,000 | | | | | | 10.3% | | | | | $ | 6.00 | | |
| Total | | | | | 20,835,271 | | | | | | 100.0% | | | | | $ | 145,000 | | | | | | 100.0% | | | | | $ | 6.96 | | |
1,838,912•
46,323
$7.09.
Components of Results of Operation (U.S. dollars in thousands)
| Six Months Ended June 30, | Year Ended December 31, | |||||||||||||||
| U.S. dollars in thousands, except share and per share data | 2021 | 2020 | 2020 | 2019 | ||||||||||||
| (Unaudited) | (Unaudited) | |||||||||||||||
| Revenues | $ | 31 | $ | - | $ | - | $ | 72 | ||||||||
| Cost of revenues | (5 | ) | - | - | (67 | ) | ||||||||||
| Gross profit | $ | 26 | $ | - | $ | - | $ | 5 | ||||||||
36
| | | | Year Ended December 31, | | |||||||||
| U.S. dollars in thousands, except share and per share data | | | 2021 | | | 2020 | | ||||||
| Revenues | | | | $ | 39 | | | | | $ | — | | |
| Cost of revenues | | | | | (7) | | | | | | — | | |
| Gross profit | | | | $ | 32 | | | | | $ | — | | |
| Six Months Ended June 30, | Year Ended December 31, | |||||||||||||||
| U.S. dollars in thousands | 2021 | 2020 | 2020 | 2019 | ||||||||||||
| (Unaudited) | (Unaudited) | |||||||||||||||
| Clinical trials | $ | 405 | $ | 195 | $ | 534 | $ | 439 | ||||||||
| Salaries and related expenses | 586 | 455 | 980 | 1,025 | ||||||||||||
| Materials | 61 | 38 | 81 | 317 | ||||||||||||
| Rent and maintenance | 216 | 192 | 344 | 315 | ||||||||||||
| Quality assurance expenses | 352 | 225 | 561 | 742 | ||||||||||||
| Outsource services and other | 2 | 45 | 152 | 415 | ||||||||||||
| Total | $ | 1,622 | $ | 1,150 | $ | 2,652 | $ | 3,253 | ||||||||
| | | | Year Ended December 31, | | |||||||||
| U.S. dollars in thousands | | | 2021 | | | 2020 | | ||||||
| Clinical trials | | | | $ | 1,141 | | | | | $ | 534 | | |
| Salaries and related expenses | | | | | 1,351 | | | | | | 980 | | |
| Materials | | | | | 409 | | | | | | 81 | | |
| Rent and maintenance | | | | | 325 | | | | | | 344 | | |
| Quality assurance expenses | | | | | 772 | | | | | | 561 | | |
| Outsource services and other | | | | | 229 | | | | | | 152 | | |
| Total | | | | $ | 4,227 | | | | | $ | 2,652 | | |
| Six Months Ended June 30, | Year Ended December 31, | |||||||||||||||
| U.S. dollars in thousands | 2021 | 2020 | 2020 | 2019 | ||||||||||||
| (Unaudited) | (Unaudited) | |||||||||||||||
| Salaries and related expenses | $ | 213 | $ | 77 | $ | 150 | $ | 185 | ||||||||
| Outside services expenses | 516 | 62 | 101 | 357 | ||||||||||||
| Travel expenses | 5 | 0 | - | 17 | ||||||||||||
| Rent and maintenance | 1 | 8 | 15 | 70 | ||||||||||||
| Other | 1 | 2 | 6 | - | ||||||||||||
| Total | $ | 736 | $ | 149 | $ | 272 | $ | 629 | ||||||||
| | | | Year Ended December 31, | | |||||||||
| U.S. dollars in thousands | | | 2021 | | | 2020 | | ||||||
| | | | | | | | | | | | | | |
| Salaries and related expenses | | | | $ | 487 | | | | | $ | 150 | | |
| Outside services expenses | | | | | 1,532 | | | | | | 101 | | |
| Travel expenses | | | | | — | | | | | | — | | |
| Rent and maintenance | | | | | 3 | | | | | | 15 | | |
| Other | | | | | 76 | | | | | | 6 | | |
| Total | | | | $ | 2,098 | | | | | $ | 272 | | |
| Six Months Ended June 30, | Year Ended December 31, | |||||||||||||||
| U.S. dollars in thousands | 2021 | 2020 | 2020 | 2019 | ||||||||||||
| (Unaudited) | (Unaudited) | |||||||||||||||
| Salaries and related expenses | $ | 1,015 | $ | 844 | $ | 1,731 | $ | 1,560 | ||||||||
| Office rental, maintenance and depreciation | 148 | 70 | 179 | 165 | ||||||||||||
| Professional services | 111 | 32 | 278 | 74 | ||||||||||||
| Patents | 58 | 48 | 88 | 162 | ||||||||||||
| Travel expenses | 6 | 31 | 34 | 222 | ||||||||||||
| Other | 250 | 36 | 927 | 77 | ||||||||||||
| Total | $ | 1,588 | $ | 1,061 | $ | 3,237 | $ | 2,260 | ||||||||
Results of Operations
The following table summarizes our results of operations for the six months ended June 30, 2021 and 2020, together with the changes in those items in dollars:
| Six Months Ended June 30, | ||||||||
| U.S. dollars in thousands | 2021 | 2020 | ||||||
| (Unaudited) | (Unaudited) | |||||||
| Revenues | $ | 31 | $ | - | ||||
| Cost of revenues | (5 | ) | - | |||||
| Gross profit | 26 | - | ||||||
| Operating expenses | 3,946 | 2,360 | ||||||
| Research and development expenses | 1,622 | 1,150 | ||||||
| Selling, general and administrative expenses | 2,324 | 1,210 | ||||||
| Operating loss | (3,920 | ) | (2,360 | ) | ||||
| Financial (income) expenses, net | (1,448 | ) | 9 | |||||
| Loss before taxes on income | (2,472 | ) | (2,369 | ) | ||||
| Income tax expense (benefit) | - | |||||||
| Total comprehensive loss | $ | (2,472 | ) | $ | (2,369 | ) | ||
Revenues and Cost of Revenues
Our total revenues for the six months ended June 30, 2021 amounted to $31, which consisted primarily of the sale of implantable ophthalmic devices. This represents an increase of $31, or 100%, when compared to total revenues of $0 for the six months ended June 30, 2020. The reason for the increase was primarily attributable to the sale of implantable ophthalmic devices.
Our cost of revenues for the six months ended June 30, 2021 amounted to $5. This represents an increase of $5, when compared to $0 for the six months ended June 30, 2020. The reason for the increase was primarily attributable to the increase in the sale of implantable ophthalmic devices.
Research and Development Expenses
Our research and development expenses for the six months ended June 30, 2021 amounted to $1,622, which represents an increase of $472 or 41%, when compared to $1,150 for the six months ended June 30, 2020. The increase was primarily attributable to an increase of $210 in clinical trials, $127 in quality assurance, $293 in materials and $131 in salaries expenses.
Selling, General and Administrative Expenses
Our selling, general and administrative expenses for the six months ended June 30, 2020 amounted to $2,324, which represents an increase of $1,114, or 92%, compared to $1,210 for the six months ended June 30, 2020. The increase was primarily attributable to an increase of $587 in sales and marketing expenses mainly due to salaries and outside services, combined with an increase of $527 in general and administrative expenses mainly due to salaries and professional services expenses.
Our selling expenses will likely increase as we scale up our efforts to sell our products and services in the future.
Operating loss
As a result of the foregoing, our operating loss for the six months ended June 30, 2021 amounted to $3,920, compared to an operating loss of $2,360 for the six months ended June 30, 2020, which represents an increase of $1,560 or 66%. The increase was mainly due to the restructuring of our operations by increasing headcount and outside services expenses.
Financial Expense and Income
Financial expense and income consist of interest, bank fees, exchange rate differences and convertible loan valuation.
| | | | Year Ended December 31, | | |||||||||
| U.S. dollars in thousands | | | 2021 | | | 2020 | | ||||||
| Salaries and related expenses | | | | $ | 1,845 | | | | | $ | 1,731 | | |
| Office rental, maintenance and depreciation | | | | | 276 | | | | | | 179 | | |
| Professional services | | | | | 301 | | | | | | 278 | | |
| Patents | | | | | 124 | | | | | | 88 | | |
| Travel expenses | | | | | 5 | | | | | | 34 | | |
| Other | | | | | 365 | | | | | | 927 | | |
| Total | | | | $ | 2,916 | | | | | $ | 3,237 | | |
Total Comprehensive Loss
As a result of the foregoing, our total comprehensive loss for the six months ended June 30, 2021 was $2,472, compared to $2,369 for the six months ended June 30, 2020, which represents an increase of $103, or 4%.
Comparison of the Year Ended December 31, 20202021 to the Year Ended December 31, 20192020
| Year Ended December 31, | ||||||||
| U.S. dollars in thousands | 2020 | 2019 | ||||||
| Revenues | $ | - | $ | 72 | ||||
| Cost of revenues | - | (67 | ) | |||||
| Gross profit | - | 5 | ||||||
| Operating expenses: | ||||||||
| Research and development expenses | 2,652 | 3,253 | ||||||
| Selling, general and administrative expenses | 3,509 | 2,889 | ||||||
| Operating loss | 6,161 | 6,167 | ||||||
| Financial expenses, net | 38 | 30 | ||||||
| Loss before taxes on income | 6,199 | 6,167 | ||||||
| Income tax expense (benefit) | - | - | ||||||
| Total comprehensive loss | $ | 6,199 | $ | 6,167 | ||||
| | | | Year Ended December 31, | | |||||||||
| U.S. dollars in thousands | | | 2021 | | | 2020 | | ||||||
| Revenues | | | | $ | 39 | | | | | $ | — | | |
| Cost of revenues | | | | | (7) | | | | | | — | | |
| Gross profit | | | | | 32 | | | | | | — | | |
| Operating expenses: | | | | | | | | | | | | | |
| Research and development expenses | | | | | 4,227 | | | | | | 2,652 | | |
| Selling, general and administrative expenses | | | | | 5,014 | | | | | | 3,509 | | |
| Operating loss | | | | | 9,209 | | | | | | 6,161 | | |
| Financial (income) expenses, net | | | | | (1,033) | | | | | | 38 | | |
| Loss before taxes on income | | | | | 8,176 | | | | | | 6,199 | | |
| Income tax expense (benefit) | | | | | — | | | | | | — | | |
| Total comprehensive loss | | | | $ | 8,176 | | | | | $ | 6,199 | | |
39
Research and Development Expenses
our existing convertible loans.
the revaluation of our existing convertible loans.
Stock-based Compensation
There are significant judgments and estimates inherent in the determination of the fair value of our common stock. These judgments and estimates are management’s best estimates and include assumptions regarding our future operating performance, the time to completing an initial public offering or other liquidity event, the related company valuations associated with such events and the determinations of the appropriate valuation methods. If we had made different assumptions, our stock-based compensation expense, net loss and net loss per common share could have been different.
Liquidity and Capital Resources
We have funded our operations from inception through June 30,
restricted cash.
| Six Months Ended June 30, | Year Ended December 31, | |||||||||||||||
| U.S. dollars in thousands | 2021 | 2020 | 2020 | 2019 | ||||||||||||
| (Unaudited) | (Unaudited) | |||||||||||||||
| Operating activities | $ | (4,184 | ) | $ | (2,716 | ) | $ | (5,749 | ) | $ | (5,804 | ) | ||||
| Investing activities | $ | - | $ | - | $ | - | $ | (8 | ) | |||||||
| Financing activities | $ | 10,000 | $ | 2,693 | $ | 7,625 | $ | 5,892 | ||||||||
| Net increase (decrease) in cash and cash equivalents | $ | 5,816 | $ | (23 | ) | $ | 1,876 | $ | 80 | |||||||
| | | | Year Ended December 31, | | |||||||||
| U.S. dollars in thousands | | | 2021 | | | 2020 | | ||||||
| Operating activities | | | | $ | (9,270) | | | | | $ | (5,749) | | |
| Investing activities | | | | $ | — | | | | | $ | — | | |
| Financing activities | | | | $ | 9,745 | | | | | $ | 7,625 | | |
| Net increase in cash and cash equivalents | | | | $ | 475 | | | | | $ | 1,876 | | |
$8,176.
2021 and 2020.
deferred offering costs.
mandatory conversion — on the date of a Qualified Financing (as defined in the Note Agreement), all outstanding Principal Amount and all accrued and unpaid Interest shall be automatically converted into the class of the Company’s capital stock that is sold by the Company in a Qualified Financing at a price equal to 65% of the lowest price paid per share by the investors in the Qualified Financing; (ii) sale of Company — in any sale of all or substantially all of the assets of the Company to an 53 unaffiliated third party, merger, consolidation or other transaction of the Company, the Company shall pay in preference an amount equal to 1.25 times the original Principal Amount. During March and June 2021, the Company entered into an amendment to the Note Agreement with the Company's controlling shareholder, VOT, pursuant to which the Company issued to VOT an additional convertible loan with an aggregate principal amount of $10,000 (the "2021 Principal Amount"), which shall be convertible into shares of the Company’s capital stock. The 2021 Principal Amount bears interest of 6% per annum (the "2021 Interest"). The Principal Amount and all accrued and unpaid 2021 Interest shall be due and payable by the Company on demand on or after January 1, 2022. On December 15, 2021, the Company and VOT entered into a second amendment to the Note Agreement, pursuant to which the Principal Amount and all accrued and unpaid Interest shall be due and payable by the Company on demand on or after January 1, 2023. The change in the convertible loan's fair value resulting from the change in terms under the second amendment noted above was accounted for as a capital contribution in the amount of $100. On February 25, 2022, we entered into a third amendment to the Note Agreement with VOT, pursuant to which we agreed to issue to VOT an additional convertible loan with an aggregate principal amount of up to $5,200 (the “2022 Principal Amount”), which shall be convertible into shares of the Company’s capital stock. On February 28, 2022, we issued VOT a promissory note with an aggregate principal amount of $2,566,000 pursuant to the third amendment to the Note Agreement. The 2022 Principal Amount will bear interest at a rate of 6% per annum. The 2022 Principal Amount and all accrued and unpaid Interest shall be due and payable by us on demand on or after January 1, 2023. |
Current Outlook
As of June 30,December 31, 2021, our cash and cash equivalents and restricted cash were $8,218.$2,877. We expect that our existing cash and cash equivalents will be sufficient to fund our current operations until March 31,June 30, 2022, without using the net proceeds from this offering. The Company has been funded by the controlling stockholder on a month-to-month basis without interruption since inception. We expect such funding to continue until the completion of this offering. In addition, our operating plans may change as a result of many factors that may currently be unknown to us, and we may need to seek additional funds sooner than planned. Our future capital requirements will depend on many factors, including:
| U.S. dollars in thousands | Total | Less than 1 year | 1-3 years | 3-5 years | More than 5 years | |||||||||||||||
| Annual lease payments (1) | $ | 368 | $ | 261 | $ | 107 | $ | - | $ | - | ||||||||||
| Severance pay (2) | $ | 380 | $ | - | $ | - | $ | - | $ | - | ||||||||||
| $ | 748 | $ | 261 | $ | 107 | $ | - | $ | - | |||||||||||
| U.S. dollars in thousands | | | Total | | | Less than 1 year | | | 1 – 3 years | | | 3 – 5 years | | | More than 5 years | | |||||||||||||||
Annual lease payments(1) | | | | $ | 538 | | | | | $ | 457 | | | | | $ | 81 | | | | | $ | — | | | | | $ | — | | |
Severance pay(2) | | | | $ | 119 | | | | | $ | — | | | | | $ | — | | | | | $ | — | | | | | $ | 119 | | |
| | | | | $ | 657 | | | | | $ | 457 | | | | | $ | 81 | | | | | $ | — | | | | | $ | 119 | | |
Impact of Inflation and Currency Fluctuations
46
47
Our Strengths
|
| ||
| ||
Industry Overview and Market Opportunity
The AMD Market Opportunity
![[MISSING IMAGE: tm2135607d3-ph_corne4clr.jpg]](https://capedge.com/proxy/S-1A/0001104659-22-039859/tm2135607d3-ph_corne4clr.jpg)

![[MISSING IMAGE: tm2135607d3-ph_normal4clr.jpg]](https://capedge.com/proxy/S-1A/0001104659-22-039859/tm2135607d3-ph_normal4clr.jpg)
 | |
 |
|
![[MISSING IMAGE: tm2135607d3-tbl_since4clr.jpg]](https://capedge.com/proxy/S-1A/0001104659-22-039859/tm2135607d3-tbl_since4clr.jpg)
![[MISSING IMAGE: tm2135607d3-tbl_since14clr.jpg]](https://capedge.com/proxy/S-1A/0001104659-22-039859/tm2135607d3-tbl_since14clr.jpg)
 |
|
 | 61 |
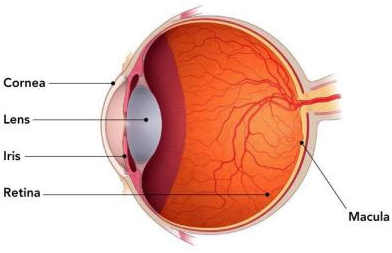
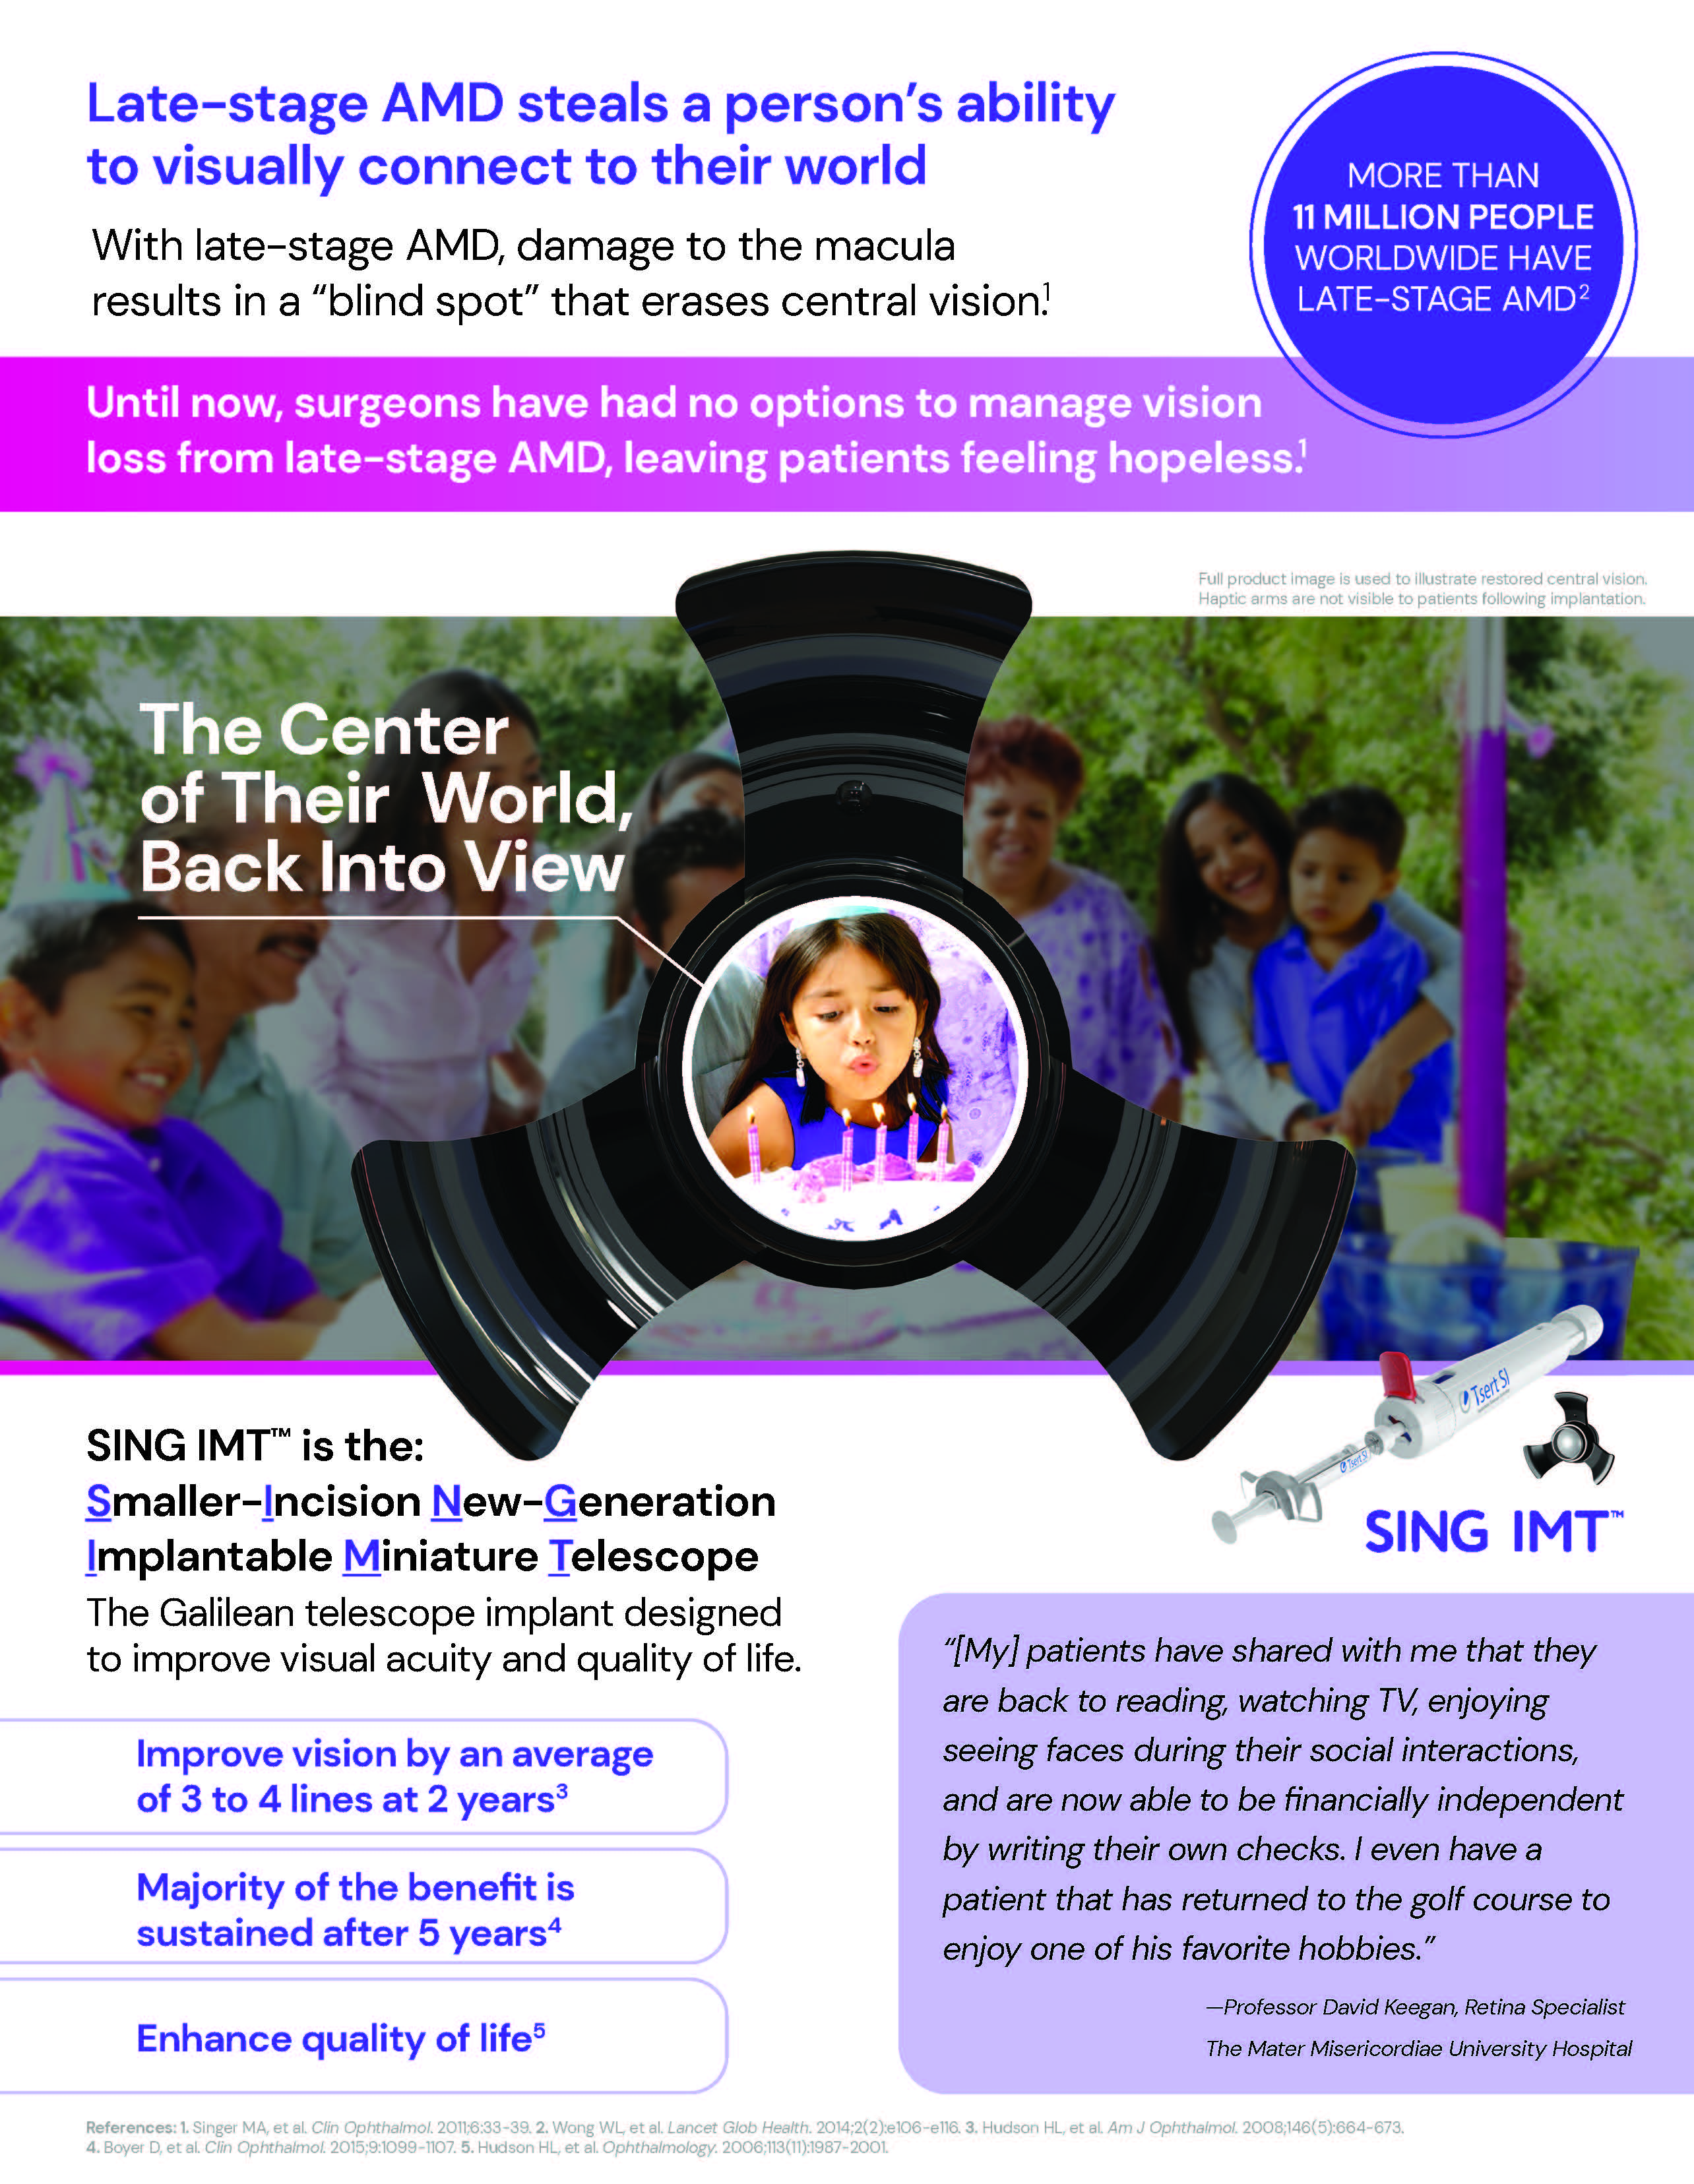
There are two main types of advanced, or late-stage AMD, which are commonly referred to as the “vision-threatening” stages of AMD: neovascular/exudative AMD, which is also known as wet AMD; and geographic atrophy, which is also known as the late-stages of dry AMD. Neovascular/exudative AMD is indicated by the development of choroidal neovascularization (“CNV”). CNV is the growth of new blood veins under the macula that could potentially leak. Dry AMD is the degeneration of the retinal pigment epithelium in the foveal center, causing scars in the foveal area and a loss of central vision. Various sources cite that the dry form of AMD comprises approximately 80% to 85% of the overall AMD market, while the wet form of the disease makes up about 15% to 20% of the overall AMD market. At this most advanced stage of the disease, the macula itself is generally beyond natural repair. It results in a loss of central vision, or blind spot(s). Depending on severity, the degeneration can make it difficult or impossible to perform everyday tasks. While there are treatments that slow down the progression of the disease (e.g., so-called Anti-VEGF injections for wet AMD), once the central loss of vision has occurred, it is uncorrectable and irreversible by glasses, drugs, or cataract surgery.
Products and Services
![[MISSING IMAGE: tm2135607d3-ph_implan4clr.jpg]](https://capedge.com/proxy/S-1A/0001104659-22-039859/tm2135607d3-ph_implan4clr.jpg)

|  |
|  |
![[MISSING IMAGE: tm2135607d3-ph_waimt4clr.jpg]](https://capedge.com/proxy/S-1A/0001104659-22-039859/tm2135607d3-ph_waimt4clr.jpg)
 |
 |
![[MISSING IMAGE: tm2135607d3-ph_sketca4clr.jpg]](https://capedge.com/proxy/S-1A/0001104659-22-039859/tm2135607d3-ph_sketca4clr.jpg)
![[MISSING IMAGE: tm2135607d3-ph_sketcb4clr.jpg]](https://capedge.com/proxy/S-1A/0001104659-22-039859/tm2135607d3-ph_sketcb4clr.jpg)
![[MISSING IMAGE: tm2135607d3-ph_sketcc4clr.jpg]](https://capedge.com/proxy/S-1A/0001104659-22-039859/tm2135607d3-ph_sketcc4clr.jpg)
![[MISSING IMAGE: tm2135607d3-ph_sketcd4clr.jpg]](https://capedge.com/proxy/S-1A/0001104659-22-039859/tm2135607d3-ph_sketcd4clr.jpg)
 |
 |
 |
![[MISSING IMAGE: tm2135607d3-ph_sketce4clr.jpg]](https://capedge.com/proxy/S-1A/0001104659-22-039859/tm2135607d3-ph_sketce4clr.jpg)
See “Risk Factors—Factors — Risks Related to Our Business” and “— Risks Related to Product Development and Regulatory Approval.”
3- & 4-line vision gain with 2.7X device
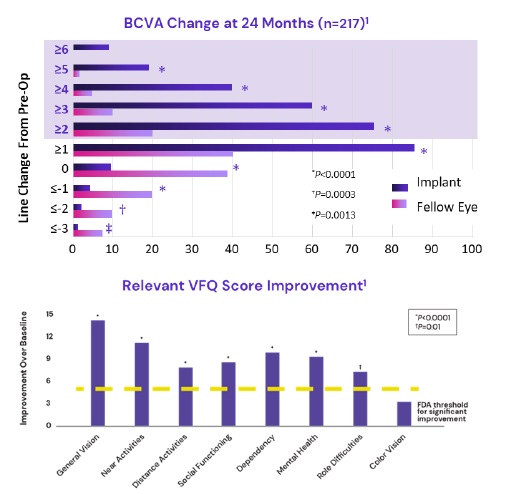
IMT-002 – 217
![[MISSING IMAGE: tm2135607d3-bc_bcva4clr.jpg]](https://capedge.com/proxy/S-1A/0001104659-22-039859/tm2135607d3-bc_bcva4clr.jpg)
A post-authorization safety study (“PASS”) is an interventional, prospective, multicenter, open label, single group assignment, safety study. The study objective is to assess the safety of the intraocular telescope as measured by the proportion of patients who within five years after implantation experience persistent vision-impairing corneal edema (corneal edema leading to a persistent loss of BCDVA > 2-lines from pre-surgery baseline level).
of $24,166.29 and an Ambulatory Surgical Center reimbursement rate of $22,857.10.
threefour persons as of June 30,December 31, 2021.$2.7$4.2 million and $3.3$2.7 million for research and development and related expenses during the year ended December 31, 20202021 and the year ended December 31, 2019,2020, respectively. During the six months ended June 30, 2021, we expended $1.6 million for research and development and related expenses.
Once received, the components are cleaned, inspected and assembled in our facility. The inspection of these parts and the assembly of our devices is performed inside the 200 square meter Class 7 of Clean Room. We have developed and built a unique production facility and technologies that support our line production, assembling and testing processes. Some of them were developed for capsulation of the telescope, using a laser welding technology, testing of welding, and leak test. All the implantable telescope assembly technology and its performances validation is performed in accordance with GMPs requirements.
Sales and Marketing
Patients suffering from end- stage and associated disabilities can today be assisted in several ways. Current approaches to help patients with late-stage AMD include:
• |
| | Product | | | ‘161 Patent | |
| NG Si IMT 3X
![[MISSING IMAGE: tm2135607d3-ph_ngimt4clr.jpg]](https://capedge.com/proxy/S-1A/0001104659-22-039859/tm2135607d3-ph_ngimt4clr.jpg) |  | | ![[MISSING IMAGE: tm2135607d3-ph_patent4clr.jpg]](https://capedge.com/proxy/S-1A/0001104659-22-039859/tm2135607d3-ph_patent4clr.jpg) | |
10,925,722Publication No: 20190328510Publication No. 2019032851010,925,722 (‘510 Publication)722 Patent) is titled “Apparatus for use in implanting intraocular lenses and method of preparing apparatus for use” and was filed on 2018-04-26. The claims of the ‘510 Publication‘722 Patent are directed to an apparatus systems and methods for implanting intraocular lenses. The ‘510 Publication has not yet issued but has been allowed by the United States Patent and Trademark Office USPTO. The expected expiration date of the ‘510 Publication‘722 Patent is no earlier than April 26,June 22, 2038. The disclosure of the ‘510 Publication‘722 Patent relates generally to the components of the SING IMT System. The current allowed claims of the ‘510 Publication relate to the SING IMT Injector tip (Tip Assembly, PN - RM00985-01)
| | Product | | | Disclosure of the ‘161 Patent | |
| SING IMT Injector tip (Tip Assembly,
![[MISSING IMAGE: tm2135607d3-ph_patentb4clr.jpg]](https://capedge.com/proxy/S-1A/0001104659-22-039859/tm2135607d3-ph_patentb4clr.jpg) |  | | ![[MISSING IMAGE: tm2135607d3-ph_patentc4clr.jpg]](https://capedge.com/proxy/S-1A/0001104659-22-039859/tm2135607d3-ph_patentc4clr.jpg) | |
| | Ss |  | | ![[MISSING IMAGE: tm2135607d3-ph_patentd4clr.jpg]](https://capedge.com/proxy/S-1A/0001104659-22-039859/tm2135607d3-ph_patentd4clr.jpg) | |
| Tsert Injector
|  | | ![[MISSING IMAGE: tm2135607d3-ph_patentf4clr.jpg]](https://capedge.com/proxy/S-1A/0001104659-22-039859/tm2135607d3-ph_patentf4clr.jpg) | |
’427‘427 patent expires on February 27, 2023. The ‘427 Patent has counterpart patents granted in the European Union and Canada.’273‘273 patent expires on August 30, 3037.2027. The ‘273 Patent has counterpart patents granted in the European Union, Japan and Canada.
Trademarks
Pre-market Approval Pathway
This procedure allows a manufacturer whose novel device is automatically classified into Class III to request a lesser classification of its medical device into Class I or Class II on the basis that the device presents low or moderate risk, rather than requiring the submission and approval of a PMA Application. Prior to the enactment of the Food and Drug Administration Safety and Innovation Act of 2012 (“FDASIA”), a medical device could only be eligible for de novo classification if the manufacturer first submitted a 510(k) premarket notification and received a determination from the FDA that the device was not substantially equivalent. FDASIA streamlined the de novo classification pathway by permitting manufacturers to request de novo classification directly without first submitting a 510(k) premarket notification to the FDA and receiving a not substantially equivalent determination. Under FDASIA, the FDA is required to classify the device within 120 days following receipt of the de novo application. If the manufacturer seeks reclassification into Class II, the manufacturer must include a draft proposal for special controls that are necessary to provide a reasonable assurance of the safety and effectiveness of the medical device. In addition, the FDA may reject the reclassification petition if it identifies a legally marketed predicate device that would be appropriate for a 510(k) or determines that the device is not low to moderate risk or that general controls would be inadequate to control the risks and special controls cannot be developed.
Newly discovered or developed safety or effectiveness data may require changes to a product’s labeling, including the addition of new warnings and contraindications, and may require the implementation of other risk management measures. Also, new government requirements, including those resulting from new legislation, may be established, or the FDA’s policies may change, which could delay or prevent regulatory clearance or approval of our products under development.
WA IMT products hold the following marketing approvals, as applicable:
| ||
| Name | | Age | ||||
| | | Position | | |||
| Thomas Ruggia | | | 44 | | | President and Chief Executive Officer and Director |
| | ||||||
| Joshua Fox | | | 51 | | | Chief Financial Officer |
| | ||||||
| Steve DeNelsky | | | 53 | | | Director |
| | ||||||
| David Schiff | | | 49 | | | Director |
| | ||||||
| Thierry Clidiere(2)(4) | | | 70 | | | Director |
| | ||||||
| Jonathan Talamo(1)(3) (4) | | | 60 | | | Director |
| | ||||||
| Tracy Valorie(1)(2) (3) (4) | | | 52 | | | Director |
| Judy Smythe(1)(2) (3) (4) | |||||
| | | Director | |
72
Steve DeNelsky, Director
Audit Committee
Compensation Committee
75
| Name and principal position | Salary ($) | Bonus ($) | Stock awards ($) | Option awards ($) | Non-equity incentive plan compensation ($) | Change in Pension Value and Nonqualified deferred compensation earnings ($) | All other compensation ($) | Total ($) | |||||||||||||||||||||||
Thomas Ruggia | $ | 175,909 | - | - | - | - | - | $ | 100,000 | $ | 275,909 | ||||||||||||||||||||
| President and Chief Executive Officer (1) | |||||||||||||||||||||||||||||||
| Richard Powers | $ | 216,000 | - | - | - | - | - | $ | 141,000 | $ | 357,000 | ||||||||||||||||||||
| Executive Vice President and Former Chief Executive Officer (2) | |||||||||||||||||||||||||||||||
| Joshua Fox | $ | - | - | - | - | - | - | - | $ | - | |||||||||||||||||||||
| Chief Financial Officer (3) | |||||||||||||||||||||||||||||||
| Name and principal position | | | Fiscal Year | | | Salary ($) | | | Bonus ($) | | | Stock awards ($) | | | Option awards ($) | | | Non-equity incentive plan compensation ($) | | | Change in Pension Value and Nonqualified deferred compensation earnings ($) | | | All other compensation ($) | | | Total ($) | | |||||||||||||||||||||||||||
| Thomas Ruggia | | | | | 2020 | | | | | $ | 175,909 | | | | | | — | | | | | | — | | | | | $ | 608,798 | | | | | | — | | | | | | — | | | | | $ | 100,000 | | | | | $ | 884,707 | | |
President and Chief Executive Officer(1) | | | | | 2021 | | | | | $ | 360,000 | | | | | $ | 75,000 | | | | | | — | | | | | | — | | | | | | — | | | | | | — | | | | | | — | | | | | $ | 435,000 | | |
| Richard Powers | | | | | 2020 | | | | | $ | 216,000 | | | | | | — | | | | | | — | | | | | | — | | | | | | — | | | | | | — | | | | | $ | 141,000 | | | | | $ | 357,000 | | |
Executive Vice President and Former Chief Financial Officer(2) | | | | | 2021 | | | | | $ | 54,000 | | | | | | — | | | | | | — | | | | | | — | | | | | | — | | | | | | — | | | | | $ | 47,743 | | | | | $ | 101,743 | | |
| Joshua Fox | | | | | 2020 | | | | | $ | — | | | | | | — | | | | | | — | | | | | | — | | | | | | — | | | | | | — | | | | | | — | | | | | $ | — | | |
| | | | | | | | | | | | |||||||||||||||||||||||||||||||||||||||||||||
Chief Financial Officer(3) | | | | | 2021 | | | | | $ | 300,000 | | | | | | — | | | | | $ | 299,150 | | | | | | — | | | | | | — | | | | | | — | | | | | | — | | | | | $ | 599,150 | | |
| Option Awards | Stock Awards | |||||||||||||||||||||||
| Name | Number of Securities Underlying Unexercised Options (Exercisable) | Number of Securities Underlying Unexercised Options (Unexercisable) | Option Exercise Price | Option Expiration Date | Equity Incentive Plan Awards: Number of Unearned Shares That Have Not Vested | Equity Incentive Plan Awards: Market or Payout Value of Unearned Shares That Have Not Vested | ||||||||||||||||||
| Thomas Ruggia | 534,412 | 0 | 1.79 | 07/30/2030 | 0 | |||||||||||||||||||
| President and Chief Executive Officer | ||||||||||||||||||||||||
| Richard Powers | 79,412 | 0 | 0.10 | 12/08/2025 | 0 | |||||||||||||||||||
| Executive Vice President and Former Chief Executive Officer | ||||||||||||||||||||||||
| Joshua Fox | 107,970 | 0 | 1.79 | 01/04/2031 | 0 | |||||||||||||||||||
| Chief Financial Officer | ||||||||||||||||||||||||
2021:
| | | | Option Awards | | | | | | | | | Stock Awards | | |||||||||||||||||||||
| Name | | | Number of Securities Underlying Unexercised Options (Exercisable) | | | Number of Securities Underlying Unexercised Options (Unexercisable) | | | Option Exercise Price | | | Option Expiration Date | | | Equity Incentive Plan Awards: Number of Unearned Shares That Have Not Vested | | | Equity Incentive Plan Awards: Market or Payout Value of Unearned Shares That Have Not Vested | | |||||||||||||||
| Thomas Ruggia | | | | | 438,715 | | | | | | 443,065 | | | | | | 1.08 | | | | | | 07/30/2030 | | | | | | 0 | | | | | |
| President and Chief Executive Officer | | | | | | | | | | | | | | | | | | | | | | | | | | | | | | | | | | |
| Richard Powers | | | | | 129,380 | | | | | | 0 | | | | | | 0.06 | | | | | | 12/08/2025 | | | | | | 0 | | | | | |
| Executive Vice President and Former Chief Financial Officer | | | | | | | | | | | | | | | | | | | | | | | | | | | | | | | | | | |
| Joshua Fox | | | | | 5,304 | | | | | | 306,452 | | | | | | 2.21 | | | | | | 01/04/2031 | | | | | | 0 | | | | | |
| Chief Financial Officer | | | | | | | | | | | | | | | | | | | | | | | | | | | | | | | | | | |
Employment Agreement with Thomas Ruggia, our President and Chief Executive Officer
| Name | Fees earned or paid in cash ($) | Stock awards ($) | Option awards ($) | Non-equity incentive plan compensation ($) | Nonqualified deferred compensation earnings ($) | All other compensation ($) | Total ($) | |||||||||||||||||||||
| Steve DeNelsky | - | - | - | - | - | - | - | |||||||||||||||||||||
| Thierry Clidiere | - | - | 35,259 | - | - | - | 32,259 | |||||||||||||||||||||
2021.
| Name | | | Fees earned or paid in cash ($) | | | Stock awards ($) | | | Option awards ($) | | | Non-equity incentive plan compensation ($) | | | Nonqualified deferred compensation earnings ($) | | | All other compensation ($) | | | Total ($) | | |||||||||||||||||||||
| Steve DeNelsky | | | | | — | | | | | | — | | | | | | — | | | | | | — | | | | | | — | | | | | | — | | | | | | — | | |
| Thierry Clidiere | | | | | — | | | | | | — | | | | | | — | | | | | | — | | | | | | — | | | | | | — | | | | | | — | | |
| David Schiff | | | | | — | | | | | | — | | | | | | — | | | | | | — | | | | | | — | | | | | | — | | | | | | — | | |
| Judy Smythe | | | | | — | | | | | | 60,177 | | | | | | — | | | | | | — | | | | | | — | | | | | | — | | | | | | 60,177 | | |
| Jonathan Talamo | | | | | — | | | | | | 28,829 | | | | | | — | | | | | | — | | | | | | — | | | | | | — | | | | | | 28,829 | | |
| Tracy Valorie | | | | | — | | | | | | 28,829 | | | | | | — | | | | | | — | | | | | | — | | | | | | — | | | | | | 28,829 | | |
Equity Incentive Plan
3,528,088.
79
Note Purchase Agreement with VOT Holdings LLC
On December 14, 2021, we entered into an amendment to the Note Agreement with VOT to extend the maturity date of our outstanding convertible notes to January 1, 2023. On February 25, 2022, we amended the Note Agreement with VOT to increase the Principal Amount by $5,200,000, of which $2,566,122 was received on February 28, 2022.
80
Security OwnershipCertain Beneficial Ownersa Qualified Financing (as defined in the Note Agreement), all outstanding Principal Amount and Managementall accrued and unpaid Interest shall be automatically converted into the class of the Company’s capital stock that is sold by the Company in a Qualified Financing at a price equal to 65% of the lowest price paid per share by the investors in the Qualified Financing;
| No. of Shares Beneficially Owned Prior to this Offering | Percentage Owned Before this Offering (1) | Percentage Owned After this Offering | ||||||||||
| Holders of more than 5% of our voting securities: | ||||||||||||
| VOT Holdings LLC (2) | 9,000,000 | 99.97 | % | % | ||||||||
| Directors and executive officers who are not 5% holders: | ||||||||||||
| Thomas Ruggia | 0 | 0 | % | |||||||||
| Joshua Fox | 0 | 0 | % | |||||||||
| Steve DeNelsky | 0 | 0 | % | |||||||||
| David Schiff | 0 | 0 | % | |||||||||
| Thierry Clidiere | 0 | 0 | % | |||||||||
| Jonathan Talamo | 0 | 0 | % | |||||||||
| Tracy Valorie | 0 | 0 | % | |||||||||
| All directors and executive officers as a group (8 persons) | 1,000 | 0.01 | % | % | ||||||||
* | |||||||||||||||||||||||||||||||||||||||||||||||||||||||||||||||||||||||||||||||||||||||||||||||||||||||||||||||||||||||||||||||||||||||||||||||||||||||||||||||||||||||||||||||||||||||||||||||||||||||||||||||||||||||||||||||||||||||||||||||||||||||||||||||||||||
82
Preferred Stock
In the recent year,
VStock Transfer LLC.
84
The holders of over 5% of our Common Stock have also signed lock up agreements pursuant to which, subject to certain exceptions, they agreed not to sell or otherwise dispose of their shares of common stock or any securities convertible into or exchangeable for common stock for a period of at least 180 days after the date of the pricing of our initial public offering without the prior written consent of the representative of the underwriters.
85
Rule 701
90
| Underwriters | | | of Shares | | |||
| ThinkEquity LLC | | | | | | ||
| | | | |||||
| | | | | ||||
| Total | | | | | | | |
$15.1 million.
91
The following table summarizes the public offering price, underwriting discounts and commissions, and proceeds to us before expenses, assuming both no exercise and full exercise by the underwriters of the over-allotment option.
| | | | | | | | | Total | | |||||
| | Per Share | | | Without Over- Allotment | | | With Over- Allotment | | ||||||
| Public offering price | | | | $ | | | | | | | | | ||
Underwriting discount ( %)(1) | | | | $ | | | | | | | | | ||
| Proceeds, before expenses, to us | | | | $ | | | | | | | | | ||
.
Discretionary Accounts
93
Offer Restrictions Outside of the United States
94
CONDENSED
AS OF JUNE 30, 2021
INDEX
- - - - - - - - - - - - - - - - - - -
SAMSARA VISION, INC.
CONDENSED CONSOLIDATED BALANCE SHEETS
U.S. dollars in thousands (except share and per share data)
June 30, 2021 | December 31, 2020 | |||||||
| (Unaudited) | ||||||||
| ASSETS | ||||||||
| CURRENT ASSETS: | ||||||||
| Cash and cash equivalents | $ | 8,055 | $ | 2,236 | ||||
| Restricted cash | 163 | 166 | ||||||
| Trade receivables | 16 | - | ||||||
| Other receivables and prepaid expenses | 98 | 77 | ||||||
| Inventory | 22 | 27 | ||||||
| Total current assets | 8,354 | 2,506 | ||||||
| LONG-TERM ASSETS: | ||||||||
| Property and equipment, net | 47 | 50 | ||||||
| Severance pay fund | 261 | 256 | ||||||
| Total long-term assets | 308 | 306 | ||||||
| Total assets | $ | 8,662 | $ | 2,812 | ||||
SAMSARA VISION, INC.
CONDENSED CONSOLIDATED BALANCE SHEETS
U.S. dollars in thousands (except share and per share data)
June 30, 2021 | December 31, 2020 | |||||||
| (Unaudited) | ||||||||
| LIABILITIES AND STOCKHOLDERS' EQUITY (DEFICIT) | ||||||||
| CURRENT LIABILITIES: | ||||||||
| Trade payables | $ | 170 | $ | 655 | ||||
| Other accounts payable and accrued expenses | 767 | 612 | ||||||
| Convertible loan | 10,200 | - | ||||||
| Total current liabilities | 11,137 | 1,267 | ||||||
| NON-CURRENT LIABILITIES: | ||||||||
| Convertible loan | - | 3,000 | ||||||
| Accrued severance pay | 380 | 361 | ||||||
| Total long-term liabilities | 380 | 3,361 | ||||||
| COMMITMENTS AND CONTINGENT LIABILITIES | ||||||||
| Convertible Preferred Stock, $0.0001 par value: | ||||||||
| Series A Preferred Stock 9,000,000 shares authorized at June 30, 2021 and December 31, 2020; 9,000,000 issued and outstanding shares at June 30, 2021 and December 31, 2020 | 3,216 | 3,216 | ||||||
| STOCKHOLDERS' EQUITY (DEFICIT): | ||||||||
| Common Stock of $0.0001 par value per share; 19,000,000 shares authorized at June 30, 2021 (unaudited) and December 31, 2020; 3,000 shares issued and outstanding at June 30, 2021 (unaudited) and December 31, 2020 | * | * | ||||||
| Additional paid-in capital | 131,705 | 130,272 | ||||||
| Accumulated deficit | (137,776 | ) | (135,304 | ) | ||||
| Total stockholders' Equity (Deficit) | (6,071 | ) | (5,032 | ) | ||||
| Total Liabilities, Convertible Preferred Stock, and Stockholders’ Equity (Deficit) | $ | 8,662 | $ | 2,812 | ||||
* Less than $1.
See accompanying notes to unaudited condensed consolidated financial statements.
SAMSARA VISION, INC.
CONDENSED CONSOLIDATED STATEMENTS OF OPERATIONS (UNAUDITED)
U.S. dollars in thousands (except share and per share data)
For the Six Months Ended June 30, | For the Three Months Ended June 30, | |||||||||||||||
| 2021 | 2020 | 2021 | 2020 | |||||||||||||
| Revenues | $ | 31 | $ | - | $ | 31 | $ | - | ||||||||
| Cost of revenues | (5 | ) | - | (5 | ) | - | ||||||||||
| Gross profit | 26 | - | 26 | - | ||||||||||||
| Operating expenses: | ||||||||||||||||
| Research and development | 1,622 | 1,150 | 819 | 548 | ||||||||||||
| Sales and marketing | 736 | 149 | 458 | 77 | ||||||||||||
| General and administrative | 1,588 | 1,061 | 775 | 520 | ||||||||||||
| Total operating expenses | 3,946 | 2,360 | 2,052 | 1,145 | ||||||||||||
| Operating loss | 3,920 | 2,360 | 2,026 | 1,145 | ||||||||||||
| Financial (income) expenses, net | (1,448 | ) | 9 | (1,142 | ) | 4 | ||||||||||
| Loss attributable to the Company's stockholders | $ | 2,472 | $ | 2,369 | $ | 884 | $ | 1,149 | ||||||||
| Basic and diluted loss per share attributable to the Company's stockholders | $ | (0.27 | ) | $ | (0.26 | ) | $ | (0.10 | ) | $ | (0.13 | ) | ||||
| Weighted average stock outstanding | 9,003,000 | 9,003,000 | 9,003,000 | 9,003,000 | ||||||||||||
See accompanying notes to unaudited condensed consolidated financial statements.
SAMSARA VISION, INC.
CONDENSED CONSOLIDATED STATEMENTS OF CHANGES IN STOCKHOLDERS' EQUITY (DEFICIT) (UNAUDITED)
U.S. dollars in thousands (except share and per share data)
| Series A Preferred Stock | Common Stock | |||||||||||||||||||||||||||
| Shares | Amount | Shares | Amount | Additional Paid-in Capital | Accumulated Deficit | Total Stockholders' Deficit | ||||||||||||||||||||||
| Balance as of January 1, 2020 | 9,000,000 | $ | 3,216 | 3,000 | $ | * | $ | 125,462 | $ | (129,105 | ) | $ | (3,643 | ) | ||||||||||||||
| Capital contribution from controlling shareholder | - | - | - | - | 2,693 | - | 2,693 | |||||||||||||||||||||
| Loss | - | - | - | - | - | (2,369 | ) | (2,369 | ) | |||||||||||||||||||
| Balance as of June 30, 2020 | 9,000,000 | $ | 3,216 | 3,000 | $ | * | $ | 128,155 | $ | (131,474 | ) | $ | (3,319 | ) | ||||||||||||||
| Balance as of January 1, 2021 | 9,000,000 | 3,216 | 3,000 | * | 130,272 | (135,304 | ) | (5,032 | ) | |||||||||||||||||||
| Capital contribution from controlling shareholder | - | - | - | - | 1,346 | - | 1,346 | |||||||||||||||||||||
| Stock-based compensation | - | - | - | - | 87 | - | 87 | |||||||||||||||||||||
| Loss | - | - | - | - | - | (2,472 | ) | (2,472 | ) | |||||||||||||||||||
| Balance as of June 30, 2021 | 9,000,000 | $ | 3,216 | 3,000 | $ | * | $ | 131,705 | $ | (137,776 | ) | $ | (6,071 | ) | ||||||||||||||
| Balance as of April 1, 2020 | 9,000,000 | 3,216 | 3,000 | * | 127,112 | (130,325 | ) | (3,213 | ) | |||||||||||||||||||
| Capital contribution from controlling shareholder | - | - | - | - | 1,043 | - | 1,043 | |||||||||||||||||||||
| Loss | - | - | - | - | - | (1,149 | ) | (1,149 | ) | |||||||||||||||||||
| Balance as of June 30, 2020 | 9,000,000 | $ | 3,216 | 3,000 | $ | * | $ | 128,155 | $ | (131,474 | ) | $ | (3,319 | ) | ||||||||||||||
| Balance as of April 1, 2021 | 9,000,000 | 3,216 | 3,000 | * | 130,315 | (136,892 | ) | (6,577 | ) | |||||||||||||||||||
| Capital contribution from controlling shareholder | - | - | - | - | 1,346 | - | 1,346 | |||||||||||||||||||||
| Stock-based compensation | - | - | - | - | 44 | - | 44 | |||||||||||||||||||||
| Loss | - | - | - | - | - | (884 | ) | (884 | ) | |||||||||||||||||||
| Balance as of June 30, 2021 | 9,000,000 | $ | 3,216 | 3,000 | $ | * | $ | 131,705 | $ | (137,776 | ) | $ | (6,071 | ) | ||||||||||||||
* Less than $1.
See accompanying notes to unaudited condensed consolidated financial statements.
SAMSARA VISION, INC.
CONDENSED CONSOLIDATED STATEMENTS OF CASH FLOWS (UNAUDITED)
U.S. dollars in thousands
| Six Months Ended June 30, | ||||||||
| 2021 | 2020 | |||||||
| Cash flows used in operating activities: | ||||||||
| Loss | $ | (2,472 | ) | $ | (2,369 | ) | ||
| Adjustments to reconcile net loss to net cash used in operating activities: | ||||||||
| Depreciation | 3 | 5 | ||||||
| Stock-based compensation | 87 | - | ||||||
| Decrease in fair value of convertible loan | (1,454 | ) | - | |||||
| Increase in accrued severance pay, net | 14 | 7 | ||||||
| Decrease (increase) in trade receivables | (16 | ) | 16 | |||||
| Increase in other receivables and prepaid expenses | (21 | ) | (107 | ) | ||||
| Decrease in inventory | 5 | - | ||||||
| Increase (decrease) in trade payables | (485 | ) | 20 | |||||
| Increase (decrease) in other accounts payable and accrued expenses | 155 | (288 | ) | |||||
| Net cash used in operating activities | (4,184 | ) | (2,716 | ) | ||||
| Cash flows used in investing activities: | ||||||||
| Net Cash provided by (used in) investing activities | - | - | ||||||
| Cash flows from financing activities: | ||||||||
| Capital contribution from controlling shareholder | - | 2,693 | ||||||
| Receipt of proceeds from convertible loan | 10,000 | - | ||||||
| Net cash provided by financing activities | 10,000 | 2,693 | ||||||
| Increase in cash and cash equivalents and restricted cash | 5,816 | (23 | ) | |||||
| Cash and cash equivalents and restricted cash at beginning of period | 2,402 | 526 | ||||||
| Cash and cash equivalents and restricted cash at end of period | $ | 8,218 | $ | 503 | ||||
See accompanying notes to unaudited condensed consolidated financial statements.
6
SAMSARA VISION, INC.
NOTES TO UNAUDITED CONSOLIDATED FINANCIAL STATEMENTS
U.S. dollars in thousands (except share and per share data)
General
Samsara Vision, Inc. ("Samsara Vision" or "Company") was incorporated on September 29, 2015, under the laws of the state of Delaware, United States, under the name “VisionCare, Inc.” On September 16, 2020, VisionCare, Inc changed its name from VisionCare, Inc. to Samsara Vision, Inc. The Company's controlling shareholder is VOT Holdings, LLC ("VOT"). The Company specializes in the field of medical device. The Company is engaged in research, development, manufacturing and marketing of proprietary implantable ophthalmic devices and technologies that are intended to significantly improve vision and quality of life for individuals with untreatable retinal disorders. The Company holds a wholly-owned subsidiary, VisionCare Ophthalmic Technologies Ltd., a company incorporated under the laws of Israel.
Liquidity
Since inception, the Company has incurred accumulated deficit of $137,776 and recurring operating losses and negative cash flows from operating activities. The Company has generated minimal product revenues and has financed its operations through capital contributions and convertible notes from its controlling shareholder. The Company’s ability to successfully carry out its business plan is primarily dependent upon its ability to (1) obtain sufficient additional capital, and (2) receive other sources of funding. There are no assurances, however, that the Company will be successful in obtaining an adequate level of financing needed for the long-term development and commercialization of its products. The failure of the Company to obtain sufficient funds when needed could have a material adverse effect on the Company’s business, results of operations, and financial condition.
These factors raise substantial doubt about the Company’s ability to continue as a going concern for a period of at least twelve months from the date of issuance of these interim consolidated financial statements. The accompanying interim consolidated financial statements have been prepared on a going concern basis, which contemplates the realization of assets and satisfaction of liabilities in the ordinary course of business. The interim consolidated financial statements do not include any adjustments relating to the recoverability and classification of recorded asset amounts or the amounts and classification of liabilities that might result from the outcome of this uncertainty.
Basis of Presentation
The accompanying unaudited condensed consolidated financial statements of the Company have been prepared in accordance with accounting principles generally accepted in the United States (“GAAP”) for interim financial information. Accordingly, they do not include all of the information and notes required by GAAP for annual financial statements. In the opinion of management, all adjustments (of a normal recurring nature) considered necessary for a fair statement of the results for the interim periods presented have been included. Operating results for the interim period are not necessarily indicative of the results that may be expected for the full year.
SAMSARA VISION, INC.
NOTES TO UNAUDITED CONSOLIDATED FINANCIAL STATEMENTS
U.S. dollars in thousands (except share and per share data)
Basis of Presentation (CONT.)
These unaudited condensed consolidated financial statements should be read in conjunction with the audited consolidated financial statements for the year ended December 31, 2020. The comparative balance sheet at December 31, 2020 has been derived from the audited consolidated financial statements at that date. The significant accounting policies applied in the annual financial statements of the Company as of December 31, 2020, are applied consistently in these interim consolidated financial statements.
Use of estimates
The preparation of the condensed interim consolidated financial statements in conformity with U.S. GAAP requires management to make estimates, judgments and assumptions. The Company's management believes that the estimates, judgments and assumptions used are reasonable based upon information available at the time they are made. These estimates, judgments and assumptions can affect the reported amounts of assets and liabilities and disclosure of contingent assets and liabilities at the dates of the consolidated financial statements, and the reported amounts of revenue and expenses during the reporting period. Actual results could differ from those estimates.
The novel coronavirus ("COVID-19") pandemic has created, and may continue to create significant uncertainty in macroeconomic conditions, and the extent of its impact on the Company's operational and financial performance will depend on certain developments, including the duration and spread of the outbreak and the impact on the Company's customers. The Company considered the impact of COVID-19 on the estimates and assumptions and determined that there were no material adverse impacts on the consolidated financial statements for the period ended June 30, 2021. As events continue to evolve and additional information becomes available, the Company's estimates and assumptions may change materially in future periods.
Accounting for stock-based compensation
The Company applies Accounting Standards Codification ("ASC") 718, Compensation - Stock Compensation, which requires companies to estimate the fair value of equity-based payment awards on the date of grant. The value of the award is recognized as an expense over the requisite service periods in the Company's consolidated statement of operations.
The Company estimated the fair value of stock-based awards using the Black-Scholes option pricing model.
The Company recognizes compensation expenses for the value of awards granted, based on the straight-line method for service-based awards. The Company accounts for forfeitures as they occur.
These assumptions and estimates were determined as follows:
Fair value of common stock - as the Company’s shares of common stock, $0.0001 par value per share (the “Common Stock”), are not publicly traded, the fair value was determined by management, with input from valuation reports prepared by third-party valuation specialists.
SAMSARA VISION, INC.
NOTES TO UNAUDITED CONSOLIDATED FINANCIAL STATEMENTS
U.S. dollars in thousands (except share and per share data)
Accounting for stock-based compensation (Cont.)
Risk-free interest rate - the risk-free rate for the expected term of the options is based on the yields of U.S. Treasury securities with maturities appropriate for the expected term of employee share option awards.
Expected term - the expected term of options granted is based on historical experience and represents the period of time that options granted are expected to be outstanding. The Company determines the expected term using the simplified method. The simplified method deems the term to be the average of the time-to-vesting and the contractual life of the options.
Expected volatility - since the Company has no trading history of its Common Stock, the expected volatility is derived from the average historical share volatilities of several unrelated public companies within the Company’s industry that the Company considers to be comparable to its own business over a period equivalent to the option’s expected term.
During the period ended June 30, 2021 the Company granted 188,130 options to employees and directors.
The Company estimated the fair value of share options granted during the period ended June 30, 2021 at the date of grant using the following assumptions:
| ||||
Fair value of financial instruments
The Company measures its financial instruments at fair value. Fair value is an exit price, representing the amount that would be received to sell an asset or paid to transfer a liability in an orderly transaction between market participants. As such, fair value is a market-based measurement that should be determined based on assumptions that market participants would use in pricing an asset or a liability.
The fair value hierarchy also requires an entity to maximize the use of observable inputs and minimize the use of unobservable inputs when measuring fair value. The Company categorized each of its fair value measurements in one of these three levels of hierarchy.
SAMSARA VISION, INC.
NOTES TO UNAUDITED CONSOLIDATED FINANCIAL STATEMENTS
U.S. dollars in thousands (except share and per share data)
Fair value of financial instruments (Cont.)
The carrying amounts of cash equivalents, short-term deposit, trade receivables, prepaid expenses, accounts payable, accrued expenses, deferred revenue and other current liabilities approximate fair value due to the short-term maturity of these instruments.
The fair value of the convertible loan is measured using unobservable inputs that require a high level of judgment to determine fair value, and thus are classified as Level 3 financial instruments. The Company estimates the fair value of the convertible loan using the Probability Weighted Expected Return Method.
Fair value estimates are made at a specific point in time, based on relevant market information and information about the financial instruments. These estimates are subjective in nature and involve uncertainties and matters of significant judgment and, therefore, cannot be determined with precision. Changes in assumptions could significantly affect these estimates.
The following table summarizes the Company’s liabilities measured at fair value as of June 30, 2021 and December 31, 2020, by level within the fair value hierarchy:
| Level 1 | Level 2 | Level 3 | ||||||||||
| June 30, 2021 | ||||||||||||
| Convertible loan | $ | - | $ | - | $ | 10,200 | ||||||
| December 31, 2020 | ||||||||||||
| Convertible loan | $ | - | $ | - | $ | 3,000 | ||||||
The key inputs used in the valuation of the convertible loan at the issuance date on March 16, 2021 and as of June 30, 2021 are probabilities for an initial public offering (“IPO”) event and liquidation event and value in each of the events, and expected time to IPO or liquidity event of 0.5 to 0.75 years. In order to estimate the IPO value, the Company used the discounted cash flows method assuming weighted average of cost of capital of 35%.
The following table presents the summary of the changes in the fair value of our Level 3 financial instruments:
SAMSARA VISION, INC.
NOTES TO UNAUDITED CONSOLIDATED FINANCIAL STATEMENTS
U.S. dollars in thousands (except share and per share data)
As an “emerging growth company,” the Jumpstart Our Business Startups Act (“JOBS Act”) allows the Company to delay adoption of new or revised accounting pronouncements applicable to public companies until such pronouncements are made applicable to private companies. The Company has elected to use this extended transition period under the JOBS Act. The adoption dates discussed below reflect this election.
Newly Issued Accounting Pronouncements
In February 2016, the Financial Accounting Standards Board (the "FASB") issued Accounting Standards Update ("ASU") 2016-02, Leases, requiring the recognition of lease assets and liabilities on the balance sheet. The standard: (a) clarifies the definition of a lease; (b) requires a dual approach to lease classification similar to current lease classifications; and (c) causes lessees to recognize leases on the balance sheet as a lease liability with a corresponding right-of-use asset for leases with a lease-term of more than 12 months. The standard is effective for public entities for fiscal years beginning after December 15, 2018 and for the Company for fiscal years beginning after December 15, 2021. The Company is currently evaluating the impact of adopting this new guidance on its financial statements.
In June 2016, the FASB issued ASU No. 2016-13 (Topic 326), Financial Instruments-Credit Losses: Measurement of Credit Losses on Financial Instruments, which replaces the existing incurred loss impairment model with an expected credit loss model and requires a financial asset measured at amortized cost to be presented at the net amount expected to be collected. The guidance will be effective for the Company for fiscal years beginning after December 15, 2022. Early adoption is permitted. The Company is currently evaluating the effect that ASU 2016-13 will have on its consolidated financial statements and related disclosures.
In August 2020, the FASB issued ASU No. 2020-06, Accounting for Convertible Instruments and Contracts in an Entity’s Own Equity (ASU 2020-06), which simplifies the accounting for certain financial instruments with characteristics of liabilities and equity, including convertible instruments and contracts in an entity’s own equity. Among other changes, ASU 2020-06 removes from GAAP the liability and equity separation model for convertible instruments with a cash conversion feature and a beneficial conversion feature, and as a result, after adoption, entities will no longer separately present in equity an embedded conversion feature for such debt. Similarly, the embedded conversion feature will no longer be amortized into income as interest expense over the life of the instrument. Instead, entities will account for a convertible debt instrument wholly as debt unless (1) a convertible instrument contains features that require bifurcation as a derivative under ASC Topic 815, Derivatives and Hedging, or (2) a convertible debt instrument was issued at a substantial premium. Additionally, ASU 2020-06 requires the application of the if-converted method to calculate the impact of convertible instruments on diluted earnings per share (EPS). ASU 2020-06 is effective for fiscal years beginning after December 15, 2021, with early adoption permitted for fiscal years beginning after December 15, 2020 and can be adopted on either a fully retrospective or modified retrospective basis. The Company elected to early adapt ASU 2020-06 effective January 1, 2021. The adoption of this standard did not result in a material impact to the Company’s financial statements.
SAMSARA VISION, INC.
NOTES TO UNAUDITED CONSOLIDATED FINANCIAL STATEMENTS
U.S. dollars in thousands (except share and per share data)
Net Loss per Share
Basic and diluted loss per share are computed by dividing net loss by the weighted average number of shares of the Company’s Common Stock outstanding for each period.
Basic and diluted net loss per share computation includes 9,000,000 issued and outstanding shares of Series A Preferred Stock for all periods presented given the Company's sole controlling shareholder.
The weighted-average number of shares related to outstanding options and convertible loan that were excluded from the calculation of diluted loss per share, since their effect was anti-dilutive, were 5,002,323 and 1,110,777 shares for the periods ended June 30, 2021, and 2020, respectively.
On December 16, 2020, the Company entered into a Note Purchase Agreement (the "Note Agreement") with the Company's controlling shareholder, VOT, pursuant to which the Company issued to VOT a convertible loan with an aggregate principal amount of $3,000 (the "Principal Amount"), which shall be convertible into shares of the Company’s capital stock. The Principal Amount bears interest of 6% per annum (the "Interest"). The Principal Amount and all accrued and unpaid Interest shall be due and payable by the Company on demand on or after January 1, 2022 (the "Maturity Date").
The Principal Amount shall convert into capital stock of the Company or repaid prior to maturity in the following scenarios:
During March and June, 2021, the Company entered into amendments to the Note Agreement with the Company's controlling shareholder, VOT, pursuant to which the Company issued to VOT an additional convertible loan with an aggregate principal amount of $10,000 (the "2021 Principal Amount"), which shall be convertible into shares of the Company’s capital stock. The 2021 Principal Amount bears interest of 6% per annum (the "2021 Interest"). The Principal Amount and all accrued and unpaid 2021 Interest shall be due and payable by the Company on demand on or after January 1, 2022.
SAMSARA VISION, INC.
NOTES TO UNAUDITED CONSOLIDATED FINANCIAL STATEMENTS
U.S. dollars in thousands (except share and per share data)
The Company elected to account for the convertible loan under the fair value option in accordance with ASC 825, Financial Instruments. Under the fair value option, changes in fair value are recorded in earnings. Since the loans were provided to the Company by a related party, the Company initially measured the fair value of the additional borrowings of the loan (see Note 1) in the amounts of $4,000 and $6,000, respectively, as a liability. The aggregate effect of the fair value adjustment for the loan amounted to $1,454 for the six-month period ended June 30, 2021 and was included as part of financial (income) expenses, net in the Company's unaudited condensed consolidated statements of operations.
The excess amount of proceeds received under the June loan was accounted for as a capital contribution in the amount of $1,346.
Equity transactions
For the three months ended June 30, 2021 and 2020, amounts of $0 and $1,043, respectively, were transferred to the Company as capital contribution by its controlling shareholder, VOT. For the six months ended June 30, 2021 and 2020, amounts of $0 and $2,693, respectively, were transferred to the Company as capital contribution by its controlling shareholder, VOT.
Stock option plan
On December 8, 2015, the Board of Directors of the Company adopted a stock option plan (the “2015 Plan”).
The Company initially reserved 1,888,235 shares of Common Stock for issuance to employees, consultants, officers or directors of the Company.
As of June 30, 2021, 46,323, options are available for future grants.
On January 4, 2021, the Board of Directors resolved to increase the number of shares of Common Stock available for issuance under the Company’s 2015 Plan by 200,000 shares from 1,688,235 shares to 1,888,235 shares. At that date, the Board of Directors and Shareholders approved the grant of 161,410 options to purchase Common Stock under the 2015 Plan, to certain employees and officers of the Company. Each option has an exercise price of $1.79 per share. The options vest over a period of 36 to 48 months and expire after 10 years from the grant date.
SAMSARA VISION, INC.
NOTES TO UNAUDITED CONSOLIDATED FINANCIAL STATEMENTS
U.S. dollars in thousands (except share and per share data)
Stock option plan (Cont.)
The following table presents the Company's stock option activity for employees, officers and directors under the 2015 Plan and related information:
| Period ended June 30, | Year ended December 31, | |||||||||||||||
| 2021 | 2020 | |||||||||||||||
| Amount of options | Weighted average exercise price | Amount of options | Weighted average exercise price | |||||||||||||
| Outstanding at the beginning of the period | 1,489,504 | $ | 0.71 | 947,827 | $ | 0.10 | ||||||||||
| Granted | 188,130 | $ | 1.79 | 541,677 | $ | 1.79 | ||||||||||
| Forfeited | 1,672 | $ | 1.79 | - | - | |||||||||||
| Outstanding at the end of the period | 1,675,962 | $ | 0.77 | 1,489,504 | $ | 0.71 | ||||||||||
| Number of options exercisable | 1,170,651 | $ | 0.37 | 1,110,587 | $ | 0.35 | ||||||||||
The following table sets forth the total share-based compensation expenses resulting from stock options granted to employees included in the Company's Statement of Operations:
| Period ended June 30, | ||||||||
| 2021 | 2020 | |||||||
| Research and development expenses | $ | 3 | $ | - | ||||
| Sales and marketing expenses | 1 | - | ||||||
| General and administrative expenses | 83 | - | ||||||
| $ | 87 | $ | - | |||||
Unamortized compensation expenses related to stock options granted to employees and directors to be recognized over a weighted average time of approximately 3.2 years are approximately $560.
The aggregate intrinsic value for each of the outstanding and exercisable stock options is approximately $1,602 as of June 30, 2021.
Stock options issued to non-employees:
The following table presents the Company's stock option activity for non-employees under the 2015 Plan and related information as of June 30, 2021:
Issuance date | Outstanding options | Exercise price | Exercisable options | Exercisable through | ||||||||||
| December 2015 | 162,950 | $ | 0.10 | 162,950 | December 2025 | |||||||||
SAMSARA VISION, INC.
NOTES TO UNAUDITED CONSOLIDATED FINANCIAL STATEMENTS
U.S. dollars in thousands (except share and per share data)
Stock option plan (Cont.)
In connection with research and development and other services provided to the Company by certain of its consultants, the Company issued stock options with exercise prices that are deemed to be equal to the fair market value of the stock at the date of grant. The options generally vest over 28-36 months and expire after 10 years from the grant date.
Total stock-based compensation expense resulting from stock options granted to non-employees in the consolidated statement of operations were $0 for each of the periods ended June 30, 2021 and 2020.
In September 2020, the Company entered into an operating lease agreement in Gladstone, NJ, starting in October 2020 and ending in October 2023.
In addition, the research and development facilities of the Israeli Subsidiary are leased under an operating lease agreement ending in December 2021.
Approximate future minimum annual lease payments under all non-cancelable operating leases as of June 30, 2021 are as follows:
| Period ending December 31, | |||||
| 2021 | $ | 220 | |||
| 2022 | 81 | ||||
| 2023 | 67 | ||||
| 368 | |||||
Total rent expenses for the three months ended June 30, 2021 and 2020, were $113 and $106, respectively. Total rent expenses for the six months ended June 30, 2021 and 2020, were $234 and $190, respectively.
The Company evaluated subsequent events and transactions that occurred after the balance sheet date up to November 3, 2021, the date that the financial statements were available to be issued.
- - - -
SAMSARA VISION, INC.
CONSOLIDATED FINANCIAL STATEMENTS
AS OF DECEMBER 31, 2020
2021
| | | | Page | |
| | | | ||
| | | | ||
| | | | ||
| | | | ||
| | | | ||
| | | |
- - - - - - - - - - - - - - - - - - -
 |
|
|
![[MISSING IMAGE: lh_eykostforer-4c.jpg]](https://capedge.com/proxy/S-1A/0001104659-22-039859/lh_eykostforer-4c.jpg)
| | Haifa, Israel March 10, 2022 | | | KOST FORER GABBAY & KASIERER | |
A Member of Ernst & Young Global |
| December 31, | ||||||||||||
| Note | 2020 | 2019 | ||||||||||
| ASSETS | ||||||||||||
| CURRENT ASSETS: | ||||||||||||
| Cash and cash equivalents | $ | 2,236 | $ | 372 | ||||||||
| Restricted cash | 166 | 154 | ||||||||||
| Trade receivables | - | 16 | ||||||||||
| Other receivables and prepaid expenses | 3 | 77 | 39 | |||||||||
| Inventory | 27 | 27 | ||||||||||
| Total current assets | 2,506 | 608 | ||||||||||
| LONG-TERM ASSETS: | ||||||||||||
| Property and equipment, net | 4 | 50 | 56 | |||||||||
| Severance pay fund | 256 | 226 | ||||||||||
| Total long-term assets | 306 | 282 | ||||||||||
| Total assets | $ | 2,812 | $ | 890 | ||||||||
| | | | | | | | | | December 31, | | |||||||||
| | | | Note | | | 2021 | | | 2020 | | |||||||||
| ASSETS | | | | | | | | | | | | | | | | | | | |
| CURRENT ASSETS: | | | | | | | | | | | | | | | | | | | |
| Cash and cash equivalents | | | | | | | | | | $ | 2,706 | | | | | $ | 2,236 | | |
| Restricted cash | | | | | | | | | | | 171 | | | | | | 166 | | |
| Other receivables and prepaid expenses | | | | | 3 | | | | | | 122 | | | | | | 77 | | |
| Inventories | | | | | | | | | | | 20 | | | | | | 27 | | |
| Total current assets | | | | | | | | | | | 3,019 | | | | | | 2,506 | | |
| LONG-TERM ASSETS: | | | | | | | | | | | | | | | | | | | |
| Deferred offering costs | | | | | | | | | | | 373 | | | | | | — | | |
| Property and equipment, net | | | | | 4 | | | | | | 14 | | | | | | 50 | | |
| Severance pay fund | | | | | | | | | | | 259 | | | | | | 256 | | |
| Total long-term assets | | | | | | | | | | | 646 | | | | | | 306 | | |
| Total assets | | | | | | | | | | $ | 3,665 | | | | | $ | 2,812 | | |
| LIABILITIES AND STOCKHOLDERS’ EQUITY (DEFICIT) CURRENT LIABILITIES: | | | | | | | | | | | | | | | | | | | |
| Trade payables | | | | | | | | | | $ | 483 | | | | | $ | 655 | | |
| Other accounts payable and accrued expenses | | | | | 5 | | | | | | 671 | | | | | | 612 | | |
| Total current liabilities | | | | | | | | | | | 1,154 | | | | | | 1,267 | | |
| NON-CURRENT LIABILITIES: | | | | | | | | | | | | | | | | | | | |
| Convertible loan | | | | | 6 | | | | | | 10,500 | | | | | | 3,000 | | |
| Accrued severance pay | | | | | | | | | | | 378 | | | | | | 361 | | |
| Total long-term liabilities | | | | | | | | | | | 10,878 | | | | | | 3,361 | | |
| COMMITMENTS AND CONTINGENT LIABILITIES | | | | | 7 | | | | | | | | | | | | | | |
CONVERTIBLE PREFERRED STOCK, $0.0001 par value: series A Preferred Stock 9,000,000 shares authorized at December 31, 2021 and 2020; 9,000,000 issued and outstanding shares at December 31, 2021 and 2020 | | | | | 8 | | | | | | 3,216 | | | | | | 3,216 | | |
| STOCKHOLDERS’ EQUITY (DEFICIT): | | | | | 9 | | | | | | | | | | | | | | |
| Common stock of $0.0001 par value per share – 90,000,000 (**) shares authorized at December 31, 2021 and 2020; 4,950 (**) shares issued and outstanding at December 31, 2021 and 2020 | | | | | | | | | | | (*) | | | | | | (*) | | |
| Additional paid-in capital | | | | | | | | | | | 131,897 | | | | | | 130,272 | | |
| Accumulated deficit | | | | | | | | | | | (143,480) | | | | | | (135,304) | | |
| Total stockholders’ equity (deficit) | | | | | | | | | | | (11,583) | | | | | | (5,032) | | |
| Total liabilities and stockholders’ equity (deficit) | | | | | | | | | | $ | 3,665 | | | | | $ | 2,812 | | |
SAMSARA VISION, INC.
CONSOLIDATED BALANCE SHEETS
U.S. dollars in thousands (except share and per share data)
| December 31, | ||||||||||||
| Note | 2020 | 2019 | ||||||||||
| LIABILITIES AND STOCKHOLDERS' EQUITY (DEFICIT) CURRENT LIABILITIES: | ||||||||||||
| Trade payables | $ | 655 | $ | 313 | ||||||||
| Other accounts payable and accrued expenses | 5 | 612 | 692 | |||||||||
| Total current liabilities | 1,267 | 1,005 | ||||||||||
| NON-CURRENT LIABILITIES: | ||||||||||||
| Convertible loan | 6 | 3,000 | - | |||||||||
| Accrued severance pay | 361 | 312 | ||||||||||
| Total long-term liabilities | 3,361 | 312 | ||||||||||
| COMMITMENTS AND CONTINGENT LIABILITIES | 7 | |||||||||||
| Convertible Preferred Stock, $0.0001 par value: | 8 | |||||||||||
| Series A Preferred Stock 9,000,000 shares authorized at December 31, 2020 and 2019; 9,000,000 issued and outstanding shares at December 31, 2020 and 2019 | 3,216 | 3,216 | ||||||||||
| STOCKHOLDERS' EQUITY (DEFICIT): | 9 | |||||||||||
| Common Stock of $0.0001 par value per share - 19,000,000 shares authorized at December 31, 2020 and 2019; 3,000 shares issued and outstanding at December 31, 2020 and 2019 | * | * | ||||||||||
| Additional paid-in capital | 130,272 | 125,462 | ||||||||||
| Accumulated deficit | (135,304 | ) | (129,105 | ) | ||||||||
| Total stockholders' deficiency | (5,032 | ) | (3,643 | ) | ||||||||
| Total liabilities and stockholders' equity | $ | 2,812 | $ | 890 | ||||||||
*
| Year ended December 31 | ||||||||
| 2020 | 2019 | |||||||
| Revenues | $ | - | $ | 72 | ||||
| Cost of revenues | - | (67 | ) | |||||
| Gross profit | - | 5 | ||||||
| Operating expenses: | ||||||||
| Research and development | 2,652 | 3,253 | ||||||
| Sales and marketing | 272 | 629 | ||||||
| General and administrative | 3,237 | 2,260 | ||||||
| Total operating expenses | 6,161 | 6,142 | ||||||
| Operating loss | 6,161 | 6,137 | ||||||
| Financial expenses, net | 38 | 30 | ||||||
| Loss attributable to the Company's stockholders | $ | 6,199 | $ | 6,167 | ||||
| Basic and diluted loss per share attributable to the Company's stockholders | $ | (0.69 | ) | $ | (0.69 | ) | ||
| Weighted average stock outstanding | 9,003,000 | 9,002,329 | ||||||
| | | | Year ended December 31 | | |||||||||
| | | | 2021 | | | 2020 | | ||||||
| Revenues | | | | $ | 39 | | | | | $ | — | | |
| Cost of revenues | | | | | (7) | | | | | | — | | |
| Gross profit | | | | | 32 | | | | | | — | | |
| Operating expenses: | | | | | | | | | | | | | |
| Research and development | | | | | 4,227 | | | | | | 2,652 | | |
| Sales and marketing | | | | | 2,098 | | | | | | 272 | | |
| General and administrative | | | | | 2,916 | | | | | | 3,237 | | |
| Total operating expenses | | | | | 9,241 | | | | | | 6,161 | | |
| Operating loss | | | | | 9,209 | | | | | | 6,161 | | |
| Financial (income) expenses, net | | | | | (1,033) | | | | | | 38 | | |
| Loss attributable to the Company’s stockholders | | | | $ | 8,176 | | | | | $ | 6,199 | | |
| Basic and diluted loss per share attributable to the Company’s stockholders (**) | | | | $ | (0.91) | | | | | $ | (0.69) | | |
| Weighted average stock outstanding (**) | | | | | 9,004,950 | | | | | | 9,004,950 | | |
| Series A Preferred Stock | Common Stock | |||||||||||||||||||||||||||
| Shares | Amount | Shares | Amount | Additional paid-in capital | Accumulated Deficit | Total Equity | ||||||||||||||||||||||
| Balance as of January 1, 2019 | 9,000,000 | $ | 3,216 | - | $ | - | $ | 119,568 | $ | (122,938 | ) | $ | (3,370 | ) | ||||||||||||||
| Capital contribution from controlling shareholder | - | - | - | - | 5,892 | - | 5,892 | |||||||||||||||||||||
| Exercise of stock options | - | - | 3,000 | $ | * | $ | * | - | $ | * | ||||||||||||||||||
| Stock-based compensation | - | - | - | - | 2 | - | 2 | |||||||||||||||||||||
| Loss | - | - | - | - | - | (6,167 | ) | (6,167 | ) | |||||||||||||||||||
| Balance as of December 31, 2019 | 9,000,000 | $ | 3,216 | 3,000 | $ | * | $ | 125,462 | $ | (129,105 | ) | $ | (3,643 | ) | ||||||||||||||
| Capital contribution from controlling shareholder | - | - | - | - | 4,625 | - | 4,625 | |||||||||||||||||||||
| Stock-based compensation | - | - | - | - | 185 | - | 185 | |||||||||||||||||||||
| Loss | - | - | - | - | - | (6,199 | ) | (6,199 | ) | |||||||||||||||||||
| Balance as of December 31, 2020 | 9,000,000 | $ | 3,216 | 3,000 | $ | * | $ | 130,272 | (135,304 | ) | $ | (5,032 | ) | |||||||||||||||
*
| | | | Series A Preferred stock | | | | Common stock | | | Additional paid-in capital | | | Accumulated deficit | | | Total stockholders’ equity (deficit) | | |||||||||||||||||||||||||||
| | | | Shares | | | Amount | | | | Shares** | | | Amount | | ||||||||||||||||||||||||||||||
| Balance as of January 1, 2020 | | | | | 9,000,000 | | | | | $ | 3,216 | | | | | | | 4,950 | | | | | $ | (*) | | | | | $ | 125,462 | | | | | $ | (129,105) | | | | | $ | (3,643) | | |
| Capital contribution from controlling shareholder | | | | | — | | | | | | — | | | | | | | — | | | | | | — | | | | | | 4,625 | | | | | | — | | | | | | 4,625 | | |
| Stock-based compensation | | | | | — | | | | | | — | | | | | | | — | | | | | | — | | | | | | 185 | | | | | | — | | | | | | 185 | | |
| Loss | | | | | — | | | | | | — | | | | | | | — | | | | | | — | | | | | | — | | | | | | (6,199) | | | | | | (6,199) | | |
| Balance as of December 31, 2020 | | | | | 9,000,000 | | | | | | 3,216 | | | | | | | 4,950 | | | | | | (*) | | | | | | 130,272 | | | | | | (135,304) | | | | | | (5,032) | | |
| Capital contribution from controlling shareholder | | | | | — | | | | | | — | | | | | | | — | | | | | | — | | | | | | 1,446 | | | | | | — | | | | | | 1,446 | | |
| Stock-based compensation | | | | | — | | | | | | — | | | | | | | — | | | | | | — | | | | | | 179 | | | | | | — | | | | | | 179 | | |
| Loss | | | | | — | | | | | | — | | | | | | | — | | | | | | — | | | | | | — | | | | | | (8,176) | | | | | | (8,176) | | |
| Balance as of December 31, 2021 | | | | | 9,000,000 | | | | | $ | 3,216 | | | | | | | 4,950 | | | | | $ | (*) | | | | | $ | 131,897 | | | | | $ | (143,480) | | | | | $ | (11,583) | | |
| Year ended December 31, | ||||||||
| 2020 | 2019 | |||||||
| Cash flows used in operating activities: | ||||||||
| Loss | $ | (6,199 | ) | $ | (6,167 | ) | ||
| Adjustments to reconcile net loss to net cash used in operating activities: | ||||||||
| Depreciation | 6 | 10 | ||||||
| Stock-based compensation | 185 | 2 | ||||||
| Increase in accrued severance pay, net | 19 | 6 | ||||||
| Decrease in trade receivables | 16 | 31 | ||||||
| Increase in other receivables and prepaid expenses | (38 | ) | (1 | ) | ||||
| Decrease in inventory | - | 29 | ||||||
| Increase in trade payables | 342 | 100 | ||||||
| Increase (decrease) in other accounts payable and accrued expenses | (80 | ) | 186 | |||||
| Net cash used in operating activities | (5,749 | ) | (5,804 | ) | ||||
| Cash flows used in investing activities: | ||||||||
| Purchase of property and equipment | - | (8 | ) | |||||
| Net cash used in investing activities | - | (8 | ) | |||||
| Cash flows from financing activities: | ||||||||
| Capital contribution from controlling shareholder | 4,625 | 5,892 | ||||||
| Receipt of proceeds from convertible loan | 3,000 | - | ||||||
| Exercise of stock options | - | * | ||||||
| Net cash provided by financing activities | 7,625 | 5,892 | ||||||
| Increase in cash and cash equivalents and restricted cash | 1,876 | 80 | ||||||
| Cash and cash equivalents and restricted cash at beginning of period | 526 | 446 | ||||||
| Cash and cash equivalents and restricted cash at end of period | $ | 2,402 | $ | 526 | ||||
| Supplemental disclosures of cash flow information: | ||||||||
| Cash paid during the year for income taxes | $ | 1 | $ | 1 | ||||
* Represents
| | | | Year ended December 31, | | |||||||||
| | | | 2021 | | | 2020 | | ||||||
| Cash flows used in operating activities: | | | | | | | | | | | | | |
| Loss | | | | $ | (8,176) | | | | | $ | (6,199) | | |
| Adjustments to reconcile loss to net cash used in operating activities: | | | | | | | | | | | | | |
| Depreciation | | | | | 36 | | | | | | 6 | | |
| Stock-based compensation | | | | | 179 | | | | | | 185 | | |
| Decrease in fair value of convertible loan | | | | | (1,054) | | | | | | — | | |
| Increase in accrued severance pay, net | | | | | 14 | | | | | | 19 | | |
| Decrease in trade receivables | | | | | — | | | | | | 16 | | |
| Increase in other receivables and prepaid expenses | | | | | (45) | | | | | | (38) | | |
| Decrease in inventory | | | | | 7 | | | | | | — | | |
| Increase (decrease) in trade payables | | | | | (255) | | | | | | 342 | | |
| Increase (decrease) in other accounts payable and accrued expenses | | | | | 24 | | | | | | (80) | | |
| Net cash used in operating activities | | | | | (9,270) | | | | | | (5,749) | | |
| Cash flows used in investing activities: | | | | | — | | | | | | — | | |
| Cash flows from financing activities: | | | | | | | | | | | | | |
| Payments of deferred offering costs | | | | | (255) | | | | | | — | | |
| Capital contribution from controlling shareholder | | | | | — | | | | | | 4,625 | | |
| Receipt of proceeds from convertible loan | | | | | 10,000 | | | | | | 3,000 | | |
| Net cash provided by financing activities | | | | | 9,745 | | | | | | 7,625 | | |
| Increase in cash and cash equivalents and restricted cash | | | | | 475 | | | | | | 1,876 | | |
| Cash and cash equivalents and restricted cash at beginning of year | | | | | 2,402 | | | | | | 526 | | |
| Cash and cash equivalents and restricted cash at end of year | | | | $ | 2,877 | | | | | $ | 2,402 | | |
| Supplemental disclosures of cash flow information: | | | | | | | | | | | | | |
| Cash paid during the year for income taxes | | | | | 1 | | | | | | 1 | | |
| Supplemental disclosures of noncash investing and financing activities: | | | | | | | | | | | | | |
| Deferred offering costs in accrued expenses | | | | $ | 118 | | | | | $ | — | | |
marketing of proprietary implantable ophthalmic devices and technologies that are intended to significantly improve vision and quality of life for individuals with untreatable retinal disorders.
SAMSARA VISION, INC.
NOTES TO CONSOLIDATED FINANCIAL STATEMENTS
U.S. dollars in thousands (except share and per share data)
SAMSARA VISION, INC.
NOTES TO CONSOLIDATED FINANCIAL STATEMENTS
U.S. dollars in thousands (except share and per share data)
Functional currency: (Cont.)
The Company has determined that the functional currency of its Israeli Subsidiary is the U.S. dollar. The foreign operation is considered a direct and integral part or extension of the Company’s operations. The day-to-day operations of the foreign subsidiary are dependent on the economic environment of the U.S. dollar.
SAMSARA VISION, INC.
NOTES TO CONSOLIDATED FINANCIAL STATEMENTS
U.S. dollars in thousands (except share and per share data)
Property and equipment:
| | | | % | | |||
| Computers and peripheral equipment | | | | 15 – 33 | | | |
| Office furniture and equipment | | | 7 | | |||
| Laboratory and manufacturing equipment | | | | 7 – 15 | | | |
Leasehold improvements | | | | 17 – 33 | | | |
*
SAMSARA VISION, INC.
NOTES TO CONSOLIDATED FINANCIAL STATEMENTS
U.S. dollars in thousands (except share and per share data)
Revenue recognition:
On January 1, 2018, the Company adopted Topic 606, Revenue from Contracts with Customers, using the modified retrospective method. Under the modified retrospective method, the Company recognized the cumulative effect of initially applying the new revenue standard as an adjustment to the opening balance of retained earnings. This adjustment did not have a material impact on the consolidated financial statements.
customer:
contract:
Revenue recognition: (Cont.)
3. Determine the transaction price
price:
SAMSARA VISION, INC.
NOTES TO CONSOLIDATED FINANCIAL STATEMENTS
U.S. dollars in thousands (except share and per share data)
Severance pay:
SAMSARA VISION, INC.
NOTES TO CONSOLIDATED FINANCIAL STATEMENTS
U.S. dollars in thousands (except share and per share data)
Income taxes:
SAMSARA VISION, INC.
NOTES TO CONSOLIDATED FINANCIAL STATEMENTS
U.S. dollars in thousands (except share and per share data)
Fair value of financial instruments (cont.):
The carrying amounts of cash equivalents, restricted cash, trade receivables, prepaid expenses, accounts payable, accrued expenses and other current liabilities approximate fair value due to the short-term maturity of these instruments.
| Level 1 | Level 2 | Level 3 | ||||||||||
| December 31, 2020 | ||||||||||||
| Convertible loan | $ | - | $ | - | $ | 3,000 | ||||||
| | | | Level 1 | | | Level 2 | | | Level 3 | | |||||||||
| December 31, 2020: | | | | | | | | | | | | | | | | | | | |
| Convertible loan | | | | $ | — | | | | | $ | — | | | | | $ | 10,500 | | |
| December 31, 2020: | | | | | | | | | | | | | | | | | | | |
| Convertible loan | | | | $ | — | | | | | $ | — | | | | | $ | 3,000 | | |
| | | | Convertible loan | | |||
| Balance as of December 31, 2019 | | | | | — | | |
| Issuance of convertible loan | | | | | 3,000 | | |
| Balance as of December 31, 2020 | | | | | 3,000 | | |
| Issuance of convertible loan | | | | | 8,654 | | |
| Capital contribution | | | | | (100) | | |
| Changes in fair value | | | | | (1,054) | | |
| Balance as of December 31, 2021 | | | | $ | 10,500 | | |
NOTES TO CONSOLIDATED FINANCIAL STATEMENTS
Concentrations of credit risks:
2020.
SAMSARA VISION, INC.
NOTES TO CONSOLIDATED FINANCIAL STATEMENTS
U.S. dollars in thousands (except share and per share data)
Accounting for stock-based compensation: (Cont.)
Risk-free interest rate - — the risk-free rate for the expected term of the options is based on the yields of U.S. Treasury securities with maturities appropriate for the expected term of employee share option awards.
For the years ended December 31, 2020 and 2019, the Company granted 541,677 and 0 stock options, to employees and directors, respectively.
| | | | Year ended December 31, 2021 | | | Year ended December 31, 2020 | | ||||||
| Dividend yield | | | 0% | | | 0% | | ||||||
| Expected volatility | | | 82.29% – 104.99% | | | 72.65% – 73.64% | | ||||||
| Risk-free interest | | | 0.5% – 1.34% | | | 0.32% | | ||||||
| Expected life (in years) | | | | | 6.02 – 6.08 | | | | | | 6 – 6.25 | | |
17
SAMSARA VISION, INC.
NOTES TO CONSOLIDATED FINANCIAL STATEMENTS
U.S. dollars in thousands (except share and per share data)
Recently Issued Accounting Pronouncements Not Yet Adopted:
As an “emerging growth company,” the Jumpstart Our Business Startups Act (“JOBS Act”) allows the Company to delay adoption of new or revisedadopted accounting pronouncements applicable to public companies until such pronouncements are made applicable to private companies. The Company has elected to use this extended transition period under the JOBS Act. The adoption dates discussed below reflect this election.
Accounting Standards Update ("ASU") 2016-02 - Leases (Topic 842):
In February 2016, the Financial Accounting Standards Board (the "FASB") issued ASU 2016-02, Leases, requiring the recognition of lease assets and liabilities on the balance sheet. The standard: (a) clarifies the definition of a lease; (b) requires a dual approach to lease classification similar to current lease classifications; and (c) causes lessees to recognize leases on the balance sheet as a lease liability with a corresponding right-of-use asset for leases with a lease-term of more than 12 months. The standard is effective for public entities for fiscal years beginning after December 15, 2018 and for the Company for fiscal years beginning after December 15, 2021. The Company is currently evaluating the impact of adopting this new guidance on its financial statements.
ASU No. 2016-13 (Topic 326):standards: In June 2016, the FASB issued ASU No. 2016-13 (Topic 326), Financial Instruments—Credit Losses: Measurement of Credit Losses on Financial Instruments, which replaces the existing incurred loss impairment model with an expected credit loss model and requires a financial asset measured at amortized cost to be presented at the net amount expected to be collected. The guidance will be effective for the Company for fiscal years beginning after December 15, 2022. Early adoption is permitted. The Company is currently evaluating the impact that ASU 2016-13 will have on its consolidated financial statements and related disclosures.
Among other changes, ASU 2020-06 removes from U.S. GAAP the liability and equity separation model for convertible instruments with a cash conversion feature and a beneficial conversion feature, and as a result, after adoption, entities will no longer separately present in equity an embedded conversion feature for such debt. Similarly, the embedded conversion feature will no longer be amortized into income as interest expense over the life of the instrument. Instead, entities will account for a convertible debt instrument wholly as debt unless (1) a convertible instrument contains features that require bifurcation as a derivative under ASC Topic 815, Derivatives and Hedging,, or (2) a convertible debt instrument was issued at a substantial premium. Additionally, ASU 2020-06 requires the application of the if-converted method to calculate the impact of convertible instruments on diluted earnings per share (EPS). ASU 2020-06 is effective for fiscal years beginning after December 15, 2021, with early adoption permitted for fiscal years beginning after December 15, 2020 and can be adopted on either a fully retrospective or modified retrospective basis. The Company elected to early adapt ASU 2020-06 effective January 1, 2021. The adoption of this standard did not result in a material impact to the Company’s financial statements.
18
U.S. dollars in thousands(except shareLeases, requiring the recognition of lease assets and per share data)
| December 31, | ||||||||
| 2020 | 2019 | |||||||
| Other accounts receivable | $ | 26 | $ | 13 | ||||
| Prepaid expenses | 51 | 26 | ||||||
| $ | 77 | $ | 39 | |||||
| December 31, | ||||||||
| 2020 | 2019 | |||||||
| Cost: | ||||||||
| Computers and peripheral equipment | $ | 311 | $ | 324 | ||||
| Office furniture and equipment | 253 | 279 | ||||||
| Laboratory and manufacturing equipment | 1,260 | 1,260 | ||||||
| Leasehold improvements | 668 | 717 | ||||||
| 2,492 | 2,580 | |||||||
| Less - accumulated depreciation | (2,442 | ) | (2,524 | ) | ||||
| Property and equipment, net | $ | 50 | $ | 56 | ||||
Depreciation expensesliabilities on the balance sheet. The standard: (a) clarifies the definition of a lease; (b) requires a dual approach to lease classification similar to current lease classifications; and (c) causes lessees to recognize leases on the balance sheet as a lease liability with a
| December 31, | ||||||||
| 2020 | 2019 | |||||||
| Payroll and related expenses | $ | 409 | $ | 575 | ||||
| Accrued expenses | 203 | 117 | ||||||
| $ | 612 | $ | 692 | |||||
requires a financial asset measured at amortized cost to be presented at the net amount expected to be collected. The guidance will be effective for the Company for fiscal years beginning after December 15, 2022. Early adoption is permitted. The Company is currently evaluating the impact that ASU 2016-13 will have on its consolidated financial statements and related disclosures.
| | | | December 31, | | |||||||||
| | ��� | | 2021 | | | 2020 | | ||||||
| Other accounts receivable | | | | $ | 23 | | | | | $ | 26 | | |
| Prepaid expenses | | | | | 99 | | | | | | 51 | | |
| | | | | $ | 122 | | | | | $ | 77 | | |
| | | | December 31, | | |||||||||
| | | | 2021 | | | 2020 | | ||||||
| Cost: | | | | | | | | | | | | | |
| Computers and peripheral equipment | | | | $ | 311 | | | | | $ | 311 | | |
| Office furniture and equipment | | | | | 253 | | | | | | 253 | | |
| Laboratory and manufacturing equipment | | | | | 1,260 | | | | | | 1,260 | | |
| Leasehold improvements | | | | | 668 | | | | | | 668 | | |
| | | | | | 2,492 | | | | | | 2,492 | | |
| Less – accumulated depreciation | | | | | (2,478) | | | | | | (2,442) | | |
| Property and equipment, net | | | | $ | 14 | | | | | $ | 50 | | |
| | | | December 31, | | |||||||||
| | | | 2021 | | | 2020 | | ||||||
| Payroll and related expenses | | | | $ | 496 | | | | | $ | 409 | | |
| Accrued expenses | | | | | 175 | | | | | | 203 | | |
| | | | | $ | 671 | | | | | $ | 612 | | |
19
SAMSARA VISION, INC.
NOTES TO CONSOLIDATED FINANCIAL STATEMENTS
U.S. dollars in thousands (except share and per share data)
The Principal Amount shall convert into capital stock of the Company or repaid prior to maturity in the following scenarios:
$100.
2022.
| Year ending December 31, | ||||
| 2021 | $ | 445 | ||
| 2022 | 81 | |||
| 2023 | 67 | |||
| 593 | ||||
20
| Year ending December 31, | | | | | | | |
| 2022 | | | | $ | 457 | | |
| 2023 | | | | | 81 | | |
| | | | | $ | 538 | | |
NOTES TO CONSOLIDATED FINANCIAL STATEMENTS
U.S. dollars in thousands(except share and per share data)
deposits up to NIS 505 thousand (approximately $162) in respect of the Israeli Subsidiary’s liabilities to its banks and other creditors.
$0.0001 each, which will automatically be converted into 14,850,000 shares of common stock immediately prior to the initial offering.
Stock.
21
SAMSARA VISION, INC.
NOTES TO CONSOLIDATED FINANCIAL STATEMENTS
U.S. dollars in thousands (except share and per share data)
Liquidation Right
22
NOTES TO CONSOLIDATED FINANCIAL STATEMENTS
U.S. dollars in thousands (except share and per share data)
Common Stock:
As of December 31, 2020, 32,781, options are available for future grants.
are available for future grants.
| Year ended December 31, | ||||||||||||||||
| 2020 | 2019 | |||||||||||||||
| Amount of options | Weighted average exercise price | Amount of options | Weighted average exercise price | |||||||||||||
| Outstanding at the beginning of the year | 947,827 | $ | 0.10 | 950,827 | $ | 0.10 | ||||||||||
| Granted | 541,677 | $ | 1.79 | - | - | |||||||||||
| Forfeited | - | - | - | - | ||||||||||||
| Exercised | - | - | (3,000 | ) | $ | 0.10 | ||||||||||
| Outstanding at the end of the year | 1,489,504 | $ | 0.71 | 947,827 | $ | 0.10 | ||||||||||
| Number of options exercisable | 1,110,587 | $ | 0.35 | 947,692 | $ | 0.10 | ||||||||||
| | | | Year ended December 31, | | |||||||||||||||||||||
| | | | 2021 | | | 2020 | | ||||||||||||||||||
| | | | Number of options | | | Weighted average exercise price | | | Number of options | | | Weighted average exercise price | | ||||||||||||
| Outstanding at the beginning of the year | | | | | 576,284 | | | | | $ | 0.43 | | | | | | 1,563,915 | | | | | $ | 0.06 | | |
| Granted | | | | | 576,284 | | | | | $ | 1.26 | | | | | | 893,767 | | | | | $ | 1.08 | | |
| Forfeited | | | | | 94,027 | | | | | $ | 1.65 | | | | | | — | | | | | | — | | |
| Outstanding at the end of the year | | | | | 2,939,939 | | | | | $ | 0.66 | | | | | | 2,457,682 | | | | | $ | 0.43 | | |
| Number of options exercisable | | | | | 2,035,691 | | | | | $ | 0.30 | | | | | | 1,832,469 | | | | | $ | 0.21 | | |
23
SAMSARA VISION, INC.
NOTES TO CONSOLIDATED FINANCIAL STATEMENTS
U.S. dollars in thousands (except share and per share data)
The following table sets forth the total share-based compensation expenses resulting from stock options granted to employees and non-employees included in the Company's StatementCompany’s statement of Operations:
| Year ended December 31, | ||||||||
| 2020 | 2019 | |||||||
| Research and development expenses | $ | 4 | $ | * | ||||
| Sales and marketing expenses | - | 1 | ||||||
| General and administrative expenses | 181 | * | ||||||
| $ | 185 | $ | 1 | |||||
operations:
| | | | Year ended December 31, | | |||||||||
| | | | 2021 | | | 2020 | | ||||||
| Research and development expenses | | | | $ | 1 | | | | | $ | 4 | | |
| Sales and marketing expenses | | | | $ | 8 | | | | | | — | | |
| General and administrative expenses | | | | | 170 | | | | | | 181 | | |
| | | | | $ | 179 | | | | | $ | 185 | | |
$877.
2021.
| Issuance date | Outstanding options | Exercise price | Exercisable options | Exercisable through | ||||||||||
| December 2015 | 162,950 | $ | 0.10 | 162,950 | December 2025 | |||||||||
2021:
| Issuance date | | | Outstanding options | | | Weighted average Exercise price | | | Exercisable options | | | Exercisable through | | |||||||||
| December 2015 | | | | | 268,868 | | | | | $ | 0.06 | | | | | | 268,868 | | | | December 2025 | |
| November 2021 | | | | | 44,088 | | | | | $ | 1.68 | | | | | | - | | | | October 2025 | |
| | | | | | 312,956 | | | | | $ | 0.29 | | | | | | 268,868 | | | | | |
24
SAMSARA VISION, INC.
NOTES TO CONSOLIDATED FINANCIAL STATEMENTS
U.S. dollars in thousands (except share and per share data)
On December 22, 2017, the United States enacted the Tax Cuts and Jobs Act (the “U.S. Tax Reform” or the "TCJA”“TCJA”), a comprehensive tax legislation that includes significant changes to the taxation of business entities. These changes, most of which are effective for tax years beginning after December 31, 2017, include several key tax provisions that might impact the Company, among others: (i) a reduction of the statutory federal corporate income tax rate from 35% (top rate) to 21% (flat rate) effective for tax years beginning after December 31, 2017 (ii) a new tax deduction in the amount of 37.5% of “foreign derived intangible income” that effectively reduces the federal corporate tax on certain qualified foreign derived sales/licenses/leases and service income in excess of a base amount to 13.125% (as compared to the regular corporate income tax rate of 21%); (iii) stricter limitation on the tax deductibility of business interest expense; (iv) a shift of the U.S. taxation of multinational corporations from a tax on worldwide income to a territorial system (along with certain rules designed to prevent erosion of the U.S. income tax base) (v) a one-time deemed repatriation tax on accumulated offshore earnings held in cash and illiquid assets, with the latter taxed at a lower rate and (vi) an expansion of the U.S. controlled foreign corporation (“CFC”) anti-tax deferral regime starting with the CFC’s first tax year beginning in 2018 intended to tax in the U.S. “global intangible low-taxed income” (“(“GILTI”).
25
SAMSARA VISION, INC.
NOTES TO CONSOLIDATED FINANCIAL STATEMENTS
U.S. dollars in thousands(except share and per share data)
2020.
| Year ended December 31, | ||||||||
| 2020 | 2019 | |||||||
| Deferred tax assets: | ||||||||
| Net operating loss carryforwards | $ | 12,680 | $ | 11,504 | ||||
| Depreciation | 1,698 | 1,997 | ||||||
| Allowances and reserves | 82 | 112 | ||||||
| Total deferred tax assets | 14,460 | 13,613 | ||||||
| Valuation allowance | (14,460 | ) | (13,613 | ) | ||||
| Net deferred tax assets | $ | - | $ | - | ||||
| | | | Year ended December 31, | | |||||||||
| | | | 2021 | | | 2020 | | ||||||
| Deferred tax assets: | | | | | | | | | | | | | |
| Net operating loss carryforwards | | | | $ | 16,408 | | | | | $ | 12,680 | | |
| Depreciation | | | | | 1,639 | | | | | | 1,698 | | |
| Allowances and reserves | | | | | 101 | | | | | | 82 | | |
| Total deferred tax assets | | | | | 18,148 | | | | | | 14,460 | | |
| Valuation allowance | | | | | (18,148) | | | | | | (14,460) | | |
| Net deferred tax assets | | | | $ | — | | | | | $ | — | | |
2016.
26
NOTES TO CONSOLIDATED FINANCIAL STATEMENTS
U.S. dollars in thousands (except share and per share data)
ASC 280, Segment Reporting, establishes standards for reporting information about operating segments. Operating segments are defined as components of an enterprise about which separate financial information is available that is evaluated regularly by the chief operating decision maker in deciding how to allocate resources and in assessing performance. The Company manages its business on the basis of one reportable segment and derives revenues from selling ophthalmic devices (see Note 1 for a brief description of the Company’s business). The following is a summary of revenues within geographic areas:
| Year ended December 31, | ||||||||
| 2020 | 2019 | |||||||
| Revenues based on customer’s location: | ||||||||
| United States | $ | - | $ | 65 | ||||
| Other | - | 7 | ||||||
| Total revenues | $ | - | $ | 72 | ||||
| | | | Year ended December 31, | | |||||||||
| | | | 2021 | | | 2020 | | ||||||
| Revenues based on customer’s location: | | | | | | | | | | | | | |
| United States | | | | $ | 31 | | | | | $ | — | | |
| Other | | | | | 8 | | | | | | — | | |
| Total revenues | | | | $ | 39 | | | | | $ | — | | |
| Year ended December 31, | ||||||||
| 2020 | 2019 | |||||||
| Israel | $ | 50 | $ | 56 | ||||
region:
| | | | Year ended December 31, | | |||||||||
| | | | 2021 | | | 2020 | | ||||||
| Israel | | | | $ | 14 | | | | | $ | 50 | | |
| Year ended December 31, | ||||||||
| 2020 | 2019 | |||||||
| Customer A | - | 22 | % | |||||
| Customer B | - | 22 | % | |||||
| Customer C | - | 22 | % | |||||
| Customer D | - | 22 | % | |||||
| | | | Year ended December 31, | | |||||||||
| | | | 2021 | | | 2020 | | ||||||
| Customer A | | | | | 39.90% | | | | | | — | | |
| Customer B | | | | | 39.90% | | | | | | — | | |
| Customer C | | | | | 20.20% | | | | | | — | | |
| Customer D | | | | | 100.00 | | | | | | | | |
- - - -
28
PRELIMINARY PROSPECTUS |
ThinkEquity
2022
97
| Amount | ||||
| Securities and Exchange Commission registration fee | $ | 2,832 | ||
| FINRA filing fee | 5,090 | |||
| Initial listing fee | 50,000 | |||
| Accountants’ fees and expenses | 60,000 | |||
| Legal fees and expenses | 495,000 | |||
| Transfer Agent’s fees and expenses | 5,000 | |||
| Printing and engraving expenses | 15,000 | |||
| Miscellaneous | 7,078 | |||
| Total expenses | $ | 650,000 | ||
| | | | Amounts USD | | |||
| Securities and Exchange Commission registration fee | | | | $ | 2,832 | | |
| FINRA filing fee | | | | | 5,090 | | |
| Initial listing fee | | | | | 50,000 | | |
| Accountants’ fees and expenses | | | | | 80,000 | | |
| Convertible note valuations | | | | | 71,000 | | |
| Legal fees and expenses | | | | | 495,000 | | |
| Transfer Agent’s fees and expenses | | | | | 5,000 | | |
| Printing and engraving expenses | | | | | 60,000 | | |
| Miscellaneous | | | | | 12,078 | | |
| Total expenses | | | | $ | 781,000 | | |
Our certificate of incorporation provide that we must indemnify our directors and officers to the fullest extent permitted by the DGCL and must also pay expenses incurred in defending any such proceeding in
3,252,895.
Exhibit No. | | | Description of Exhibit | | |
| 1.1** | | | | ||
| | 3.1** | ||||
| | |||||
| | |||||
| | 3.4** | ||||
| | |||||
| Amended and Restated Bylaws of Samsara Vision, Inc. | | ||||
| | 4.1** | ||||
| | | ||||
| | 4.2** | ||||
| | | ||||
| | |||||
| 5.1** | | | | ||
| | 10.1** | ||||
| | | ||||
| | 10.2** | ||||
| | | ||||
| | |||||
| 10.3** | | | | ||
| | 10.4** | ||||
| | |
Exhibit No. | | | Description of Exhibit | | |
| | 10.5** | | | | |
| | 10.6** | ||||
| | | ||||
| | |||||
| 10.7** | | ||||
| | |||||
| | |||||
| | 10.8** | ||||
| | | ||||
| | 10.9** | ||||
| | | ||||
| | |||||
| | | | |||
| | 10.11** | | | | |
| 10.12** | | | | ||
| | 10.13** | | | | |
| | 10.14** | | | Third Amendment to 2020 Note Purchase Agreement, dated February 25, 2022, by and between Samsara Vision, Inc. and VOT Holdings LLC | |
| | 21.1** | | | | |
| | 23.1** | ||||
| | | ||||
| | |||||
| 23.2** | | | | ||
| | 24.1** | ||||
| | | ||||
| | 107** | | | |
(ii) Any free writing prospectus relating to the offering prepared by or on behalf of the undersigned registrant or used or referred to by the undersigned registrant;
| | | | | SAMSARA VISION, INC. | | |||
| | | |||||||
| | By: | | | /s/ Thomas Ruggia | ||||
Thomas Ruggia | ||||||||
Chief Executive Officer | | |||||||
We, the undersigned officers and directors of Samsara Vision, Inc., hereby severally constitute and appoint Thomas Ruggia and Joshua Fox, and each of them singly (with full power to each of them to act alone), our true and lawful attorneys-in-fact and agents, with full power of substitution and resubstitution in each of them for him and in his name, place and stead, and in any and all capacities, to sign any and all amendments (including post-effective amendments) to this registration statement (or any other registration statement for the same offering that is to be effective upon filing pursuant to Rule 462(b) under the Securities Act of 1933), and to file the same, with all exhibits thereto and other documents in connection therewith, with the Securities and Exchange Commission, granting unto said attorneys-in-fact and agents, and each of them, full power and authority to do and perform each and every act and thing requisite or necessary to be done in and about the premises, as full to all intents and purposes as he might or could do in person, hereby ratifying and confirming all that said attorneys-in-fact and agents or any of them, or their or his substitute or substitutes, may lawfully do or cause to be done by virtue hereof.
| Signature | | Title | | | Date | | ||
| | ||||||||
/s/ Thomas Ruggia Thomas Ruggia | | | Chairman of the Board of Directors, President and Chief Executive Officer | | March 30, 2022 | | ||
/s/ Joshua Fox Joshua Fox | | | Chief Financial Officer | | March 30, 2022 | | ||
* Steve DeNelsky | | | Director | | March 30, 2022 | | ||
* Thierry Clidiere | | | Director | | March 30, 2022 | | ||
* David Schiff | | | Director | | March 30, 2022 | | ||
* Jonathan Talamo | | | Director | | March 30, 2022 | | ||
* Tracy Valorie | | | Director | | March 30, 2022 | | ||
* Judy Smythe | | | Director | | | March 30, 2022 | |
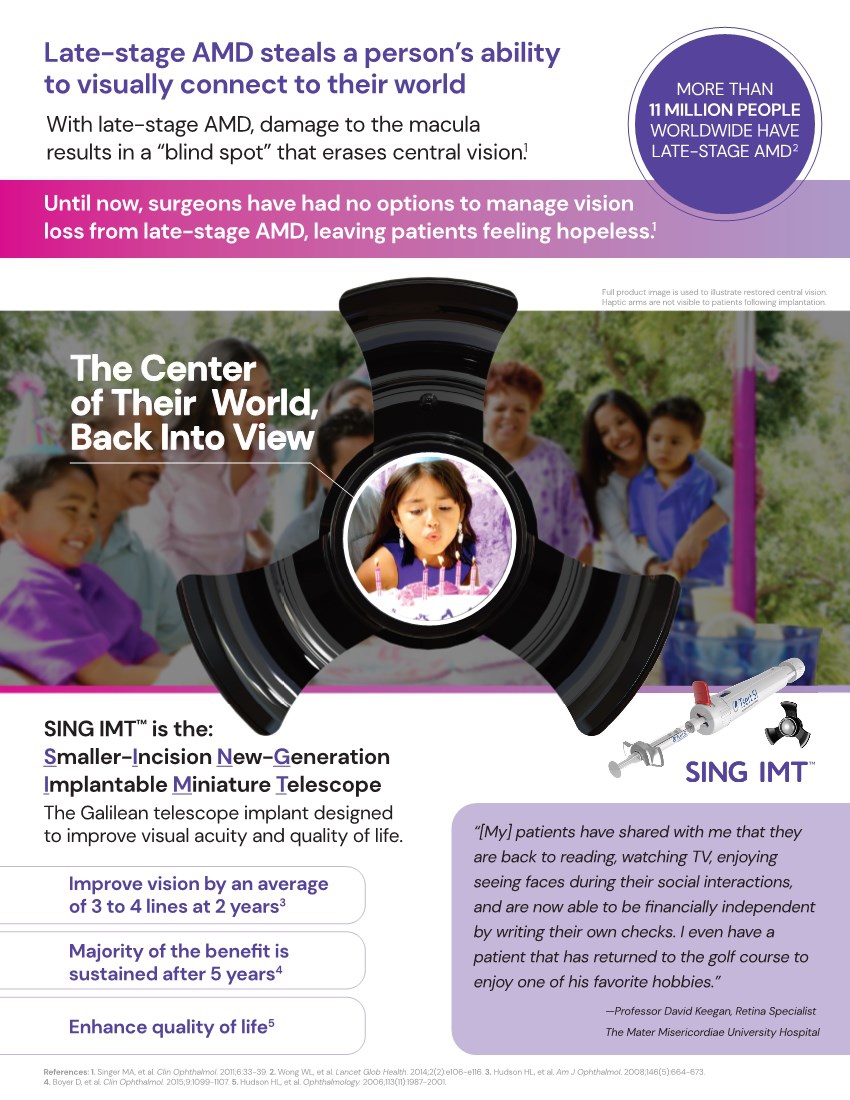
![[MISSING IMAGE: tm2135607d13-ph_late4clr.jpg]](https://capedge.com/proxy/S-1A/0001104659-22-039859/tm2135607d13-ph_late4clr.jpg)