Li Jun, our director, is an officer and controlling stockholder of United Best, our foreign advisor. See section entitled “Certain Relationships and Related Transactions” beginning on p 71.page 80.
We have no plans that provide for the payment of retirement benefits, or benefits that will be paid primarily following retirement, including, but not limited to, tax qualified defined benefit plans, supplemental executive retirement plans, tax qualified defined contribution plans and non-qualified defined contribution plans.
There are no contracts agreements, plans or arrangements, whether written or oral, that provide for payment to a named executive officer at, following, or in connection with the resignation, retirement or other termination of a named executive officer or a change in control or the company or a change in the executive officers responsibilities following a change in control, with respect to each named executive officer.
Except as set forth below, since October 1, 2007, the Company was not a party to any transaction (where the amount involved exceeded the lesser of $120,000 or 1% of the average of our assets for the last two fiscal years) in which an director, executive officer, holder of more than five percent of our common stock, or any member of the immediate family of any such person have or will have a direct or indirect material interest and no such transactions are currently proposed.
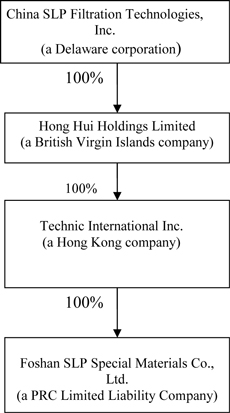
On February 12, 2010, we entered into a share exchange agreement with the owners of all of the outstanding shares of Hong Hui. Under the terms of the share exchange agreement we issued and delivered to the Hong Hui stockholders a total of 14,510,204 shares of our common stock in exchange for all of the outstanding shares of Hong Hui. As shareholders of Hong Hui, (i) Bestyield Group, a company controlled by Mr. Li, our chief executive officer, received 4,353,061 shares, (ii) Proudlead, a company controlled by Mr. Law, our president of sales and a director, received 4,353,061 shares and (iii) Newise Holdings, a company controlled by Mr. Li Jun one of our directors received 2,321,633 shares.
Under a limited recourse guaranty agreement dated as of February 12, 2010, Bestyield Group and Proudlead agreed to guaranty the company’s obligations under the notes issued in the February 2010 private placement. That guaranty is secured by a pledge of the 8,706,122 shares of common stock received by them in the reverse merger
In each of June 2007 and in February 2008 and May 2008, Joseph Nemelka, a former officer and director, advanced funds to the company in the total aggregate amount of $15,000. The advances were due on demand and bearsbore interest at 8% per annum. This indebtedness was forgiven in February 2010 prior to the reverse merger. In addition, Mr. Nemelka purchased a convertible promissory note in the aggregate principal amount of $100,000 in the February private placement.
Our board of directors is charged with reviewing and approving all potential related party transactions. All such related party transactions must then be reported under applicable SEC rules. We have not adopted other procedures for review, or standards for approval, of such transactions, but instead review them on a case-by-case basis.
The following is a summary description of our capital stock and certain provisions of our certificate of incorporation and by-laws, copies of which have been filed as exhibits to this prospectus. The following discussion is qualified in its entirety by reference to such exhibits.
We are authorized to issue 200,000,000 shares of common stock, par value $.001 per share, and 10,000,000 shares of blank-check preferred stock, par value $.001 per share.
Each share of our common stock has one vote on all matters including election of directors, without provision for cumulative voting. The common stock is not redeemable and has no conversion or preemptive rights. In the event we are liquidated, the holders of common stock will share equally in any balance of our assets available for distribution to them after satisfaction of creditors and preferred shareholders. The holders of our common stock are entitled to equal dividends and distributions per share with respect to the common stock when, as, and if declared by the board of directors from funds legally available.
In addition to the 200,000,000 shares of common stock, we are authorized to issue 10,000,000 shares of preferred stock. Shares of our preferred stock may be issued from time to time in one or more classes or series, each of which class or series shall have such distinctive designation or title as shall be fixed by the board of directors prior to the issuance of any shares thereof.
The issuance of shares of preferred stock, or the issuance of rights to purchase such shares, could be used to discourage an unsolicited acquisition proposal. For instance, the issuance of a series of preferred stock might impede a business combination by including class voting rights that would enable the holder to block such a transaction, or facilitate a business combination by including voting rights that would provide a required percentage vote of the stockholders. In addition, under certain circumstances, the issuance of preferred stock could adversely affect the voting power of the holders of the common stock. Although the board of directors is required to make any determination to issue such stock based on its judgment as to the best interests of our stockholders, the board of directors could act in a manner that would discourage an acquisition attempt or other transaction that some, or a majority, of the stockholders might believe to be in their best interests or in which stockholders might receive a premium for their stock over the then market price of such stock. The board of directors does not at present intend to seek stockholder approval prior to any issuance of currently authorized preferred stock, unless otherwise required by law.
On February 12, 2010, immediately following the closing of the share exchange agreement, we entered into a note purchase agreement with certain accredited investors for the sale of convertible notes, in the aggregate principal amount of $4,140,000, and warrants (which are exercisable only in certain events). The closing of the sale of the notes and warrants occurred on February 12, 2010. The terms of the notes and warrants is set forth below. The note purchase agreement contains representations, warranties and covenants which are customary for transactions of this nature.
We have also agreed to issue to Brean Murray, Carret & Co., LLC, and/or its designees, a warrant to purchase a number of shares of common stock equal to an aggregate of 5% of the shares of common stock sold in the offering, excluding over-allotments, if any. The warrant will have an exercise price equal to 125% of the offering price of the shares of common stock sold in this offering and be exercisable for four years commencing one year after the effective date of the registration statement. Pursuant to the rules of the Financial Industry Regulatory, Inc., or FINRA (formerly the NASD), and in particular Rule 5110, the warrant (and underlying shares) issued to Brean Murray, Carret & Co., LLC, may not be sold, transferred, assigned, pledged, or hypothecated, or be the subject of any hedging, short sale, derivative, put or call transaction that would result in the effective disposition of the securities by any person for a period of 180 days immediately following the date of delivery and payment for the shares offered; provided, however, that the warrant (and underlying shares) may be transferred to officers or partners of the representatives and members of the underwriting syndicate and their officers or partners as long as the warrant (and underlying shares) remain subject to the lockup.
For a description of the warrants issued to the financials advisors in connection with the private placement, and the reverse merger, see the section above entitled “Financial Services Agreements“Certain Relationships and Related Warrants”Transactions,” beginning on page 60.80.
On February 12, 2010, immediately prior to the closing of the share exchange agreement, shareholders holding 2,528,000 of the 2,600,000 shares of our then outstanding common stock agreed to surrender their shares for cancellation in payment by Joe Nemelka of an aggregate amount of $40,000, pursuant to stock purchase agreements entered into between Joe Nemelka and each such holder. Under the share exchange agreement we issued an aggregate of 14,510,204 shares of common stock to the stockholders of Hong Hui. In addition, immediately following the closing of the share exchange agreement we issued 362,755 and 290,755 shares of our common stock to United Best and Primary Capital, respectively, as a transaction fee in connection with the closing of the reverse merger and private financing. In addition there are 72,000 shares held by 210 round lot shareholders. Accordingly, as of February 12, 2010 following the closing of all of these transactions there were 15,235,714 shares of common stock issued and outstanding.
As more fully described in an Information Statement on Schedule 14C (which was mailed to our stockholders on March 3, 2010) on February 12, 2010 the board of directors and the holders of majority of our outstanding shares entitled to vote thereon approved the change the name of the Company to China Filtration Technology, Inc. and 1-for-5 reverse stock split of our shares of common stock.
These corporate actions became effective on the filing with the Secretary of State of Delaware of a certificate of amendment to our certificate of incorporation which was filed on March 24, 2010.
On June 1, 2010 the corporate name was changed to China SLP Filtration Technology, Inc.
The following is a general summary of certain material U.S. federal income tax consequences to an investor of the acquisition, ownership and disposition of our common stock purchased by an investor pursuant to this offering. As used in this discussion, “we”, “our” and “us” refers to China SLP Filtration Technology, Inc. This discussion applies only to investors that will hold each share of our common stock issued and purchased pursuant to this offering as a “capital asset” (generally, property held for investment) within the meaning of Section 1221 of the Internal Revenue Code of 1986, as amended (the “Code”). This discussion does not address all aspects of U.S. federal income taxation that may be relevant to an investor in light of that investor’s particular circumstances. In addition, this discussion does not address (a) U.S. federal non-income tax laws, such as estate or gift tax laws, (b) state, local or non-U.S. tax consequences, or (c) the special tax rules that may apply to certain investors, including, without limitation, banks, insurance companies, financial institutions, broker-dealers, taxpayers that have elected mark-to-market accounting, taxpayers subject to the alternative minimum tax provisions of the Code, tax-exempt entities, governments or agencies or instrumentalities thereof, regulated investment companies, real estate investment trusts, U.S. persons whose functional currency is not the U.S. dollar, certain former U.S. citizens or long-term residents of the United States, or investors that acquire, hold, or dispose of our common stock as part of a straddle, hedge, wash sale, constructive sale or conversion transaction or other integrated transaction. Additionally, this discussion does not consider the tax treatment of entities treated as partnerships or other pass-through entities for U.S. federal income tax purposes or of persons who hold our common stock through such entities. The tax treatment of a partnership and each partner thereof will generally depend upon the status and activities of the partnership and such partner. Thus, partnerships, other pass-through entities (and partners in such partnerships or owners of such other pass-through entities) should consult their own tax advisors.
This discussion is based on current provisions of the Code, its legislative history, U.S. Treasury regulations promulgated under the Code, judicial opinions, and published rulings and procedures of the U.S. Internal Revenue Service (“IRS”), all as in effect on the date of this prospectus. These authorities are subject to differing interpretations or to change, possibly with retroactive effect. We have not sought, and will not seek, any ruling from the IRS or any opinion of counsel with respect to the tax consequences discussed below, and there can be no assurance that the IRS will not take a position contrary to the tax consequences discussed below or that any position taken by the IRS would not be sustained.
As used in this discussion, the term “U.S. person” means a person that is, for U.S. federal income tax purposes, (i) an individual citizen or resident of the United States, (ii) a corporation (or other entity treated as a corporation for U.S. federal income tax purposes) created or organized (or treated as created or organized) in or under the laws of the United States or of any state thereof or the District of Columbia, (iii) an estate the income of which is subject to U.S. federal income taxation regardless of its source, or (iv) a trust if (A) a court within the United States is able to exercise primary supervision over the administration of the trust and one or more U.S. persons have the authority to control all substantial decisions of the trust, or (B) it has in effect a valid election to be treated as a U.S. person under applicable U.S. Treasury regulations. As used in this discussion, the term “U.S. holder” means a beneficial owner of our common stock that is a U.S. person, and the term “non-U.S. holder” means a beneficial owner of our common stock (other than an entity that is treated as a partnership or other pass-through entity for U.S. federal income tax purposes) that is not a U.S. person.
THIS DISCUSSION IS ONLY A SUMMARY OF CERTAIN MATERIAL U.S. FEDERAL INCOME TAX CONSEQUENCES OF THE ACQUISITION, OWNERSHIP AND DISPOSITION OF OUR COMMON STOCK. IT IS NOT TAX ADVICE. EACH PROSPECTIVE INVESTOR IN OUR COMMON STOCK SHOULD CONSULT ITS OWN TAX ADVISOR WITH RESPECT TO THE PARTICULAR TAX CONSEQUENCES TO SUCH INVESTOR OF THE ACQUISITION, OWNERSHIP AND DISPOSITION OF OUR COMMON STOCK, INCLUDING THE APPLICABILITY AND EFFECT OF ANY STATE, LOCAL, AND NON-U.S. TAX LAWS, AS WELL AS U.S. FEDERAL TAX LAWS, AND ANY APPLICABLE TAX TREATY.
U.S. Holders
A U.S. holder will be required to include in gross income as ordinary income the amount of any dividend paid on the shares of our common stock. A distribution on such shares will be treated as a dividend for U.S. federal income tax purposes to the extent paid from our current or accumulated earnings and profits, as determined under U.S. federal income tax principles. Distributions in excess of current and accumulated earnings and profits will constitute a return of capital that will be applied against and reduce (but not below zero) the U.S. holder’s adjusted tax basis in our common stock. Any remaining excess will be treated as gain from the sale or other taxable disposition of the common stock and will be treated as described under “Gain or Loss on Sale, Taxable Exchange or Other Taxable Disposition of Common Stock” below.
Any dividends we pay to a U.S. holder that is treated as a taxable corporation for U.S. federal income tax purposes generally will qualify for the dividends-received deduction if the applicable holding period and other requirements are satisfied. With certain exceptions, if the applicable holding period and other requirements are satisfied, dividends we pay to a non-corporate U.S. holder will constitute “qualified dividends” that will be subject to tax at the maximum tax rate accorded to long-term capital gains for tax years beginning on or before December 31, 2010, after which the tax rate applicable to dividends is scheduled to return to the tax rate applicable to ordinary income.
If PRC taxes apply to any dividends paid to a U.S. holder on our common stock, such taxes may be treated as foreign taxes eligible for credit against such holder’s U.S. federal income tax liability (subject to certain limitations), and such U.S. holder may be entitled to certain benefits under the income tax treaty between the United States and the PRC. U.S. holders should consult their own tax advisors regarding the creditability of any such PRC tax and their eligibility for the benefits of the income tax treaty between the United States and the PRC.
Gain or Loss on Sale, Taxable Exchange or Other Taxable Disposition of Common Stock
In general, a U.S. holder must treat any gain or loss recognized upon a sale, taxable exchange, or other taxable disposition of our common stock as capital gain or loss. Any such capital gain or loss will be long-term capital gain or loss if the U.S. holder’s holding period for the common stock so disposed of exceeds one year, and otherwise as short-term capital gain or loss. In general, a U.S. holder will recognize gain or loss in an amount equal to the difference between (i) the sum of the amount of cash and the fair market value of any property received in such disposition and (ii) the U.S. holder’s adjusted tax basis in the common stock so disposed of. Long-term capital gain recognized by a non-corporate U.S. holder will generally be subject to a maximum tax rate of 15 percent for tax years beginning on or before December 31, 2010, after which the maximum long-term capital gains tax rate is scheduled to increase to 20 percent. The deduction of capital losses is subject to various limitations.
If PRC taxes apply to any gain from the disposition of our common stock by a U.S. holder, such taxes may be treated as foreign taxes eligible for credit against such holder’s U.S. federal income tax liability (subject to certain limitations), and such U.S. holder may be entitled to certain benefits under the income tax treaty between the United States and the PRC. U.S. holders should consult their own tax advisors regarding the creditability of any such PRC tax and their eligibility for the benefits of the income tax treaty between the United States and the PRC.
For taxable years beginning after December 31, 2012, certain U.S. holders that are individuals, estates or trusts will be subject to a 3.8% tax on all or a portion of their "net investment income," which may include all or a portion of their dividends and net gains from the sale or other disposition of our common stock. If you are a U.S. holder that is an individual, estate or trust, you should consult your tax advisor regarding the applicability of the Medicare tax to your income and gains in respect of your investment in our common stock.
Non-U.S. Holders
In general, any distribution we make to a non-U.S. holder, to the extent paid out of our current or accumulated earnings and profits (as determined under U.S. federal income tax principles), will constitute a dividend for U.S. federal income tax purposes. Unless we are treated as an “80/20 company” for U.S. federal income tax purposes, as described below, any dividend paid to a non-U.S. holder with respect to shares of our common stock that is not effectively connected with the non-U.S. holder’s conduct of a trade or business within the United States, as described below, generally will be subject to U.S. federal withholding tax at a rate of 30 percent of the gross amount of the dividend, unless such non-U.S. holder is eligible for a reduced rate of withholding tax under an applicable income tax treaty and provides proper certification of its eligibility for such reduced rate (usually on an IRS Form W-8BEN). Any distribution not constituting a dividend will be treated first as reducing the non-U.S. holder’s adjusted tax basis in its shares of our common stock (but not below zero) and, to the extent such distribution exceeds the non-U.S. holder’s adjusted tax basis, as gain from the sale or other taxable disposition of the common stock, which will be treated as described under “Gain on Sale, Taxable Exchange or Other Taxable Disposition of Common Stock” below.
There is a possibility that we may qualify as an “80/20 company” for U.S. federal income tax purposes. In general, a U.S. corporation is an 80/20 company if at least 80 percent of its gross income earned directly or from subsidiaries during an applicable testing period is “active foreign business income.” The 80 percent test is applied on a periodic basis. If we qualify as an 80/20 company, a percentage of any dividend paid by us generally will not be subject to U.S. federal withholding tax. You should consult with your own tax advisors regarding the amount of any such dividend subject to withholding tax in this circumstance. It should also be noted that there are currently legislative proposals to amend the rules pertaining to 80/20 companies.
Dividends we pay to a non-U.S. holder that are effectively connected with such non-U.S. holder’s conduct of a trade or business within the United States (and, if certain income tax treaties apply, are attributable to a U.S. permanent establishment or fixed base maintained by the non-U.S. holder) generally will not be subject to U.S. withholding tax, provided such non-U.S. holder complies with certain certification and disclosure requirements (usually by providing an IRS Form W-8ECI). Instead, such dividends generally will be subject to U.S. federal income tax, net of certain deductions, at the same graduated individual or corporate tax rates applicable to U.S. persons. If the non-U.S. holder is a corporation, dividends that are effectively connected income may also be subject to a “branch profits tax” at a rate of 30 percent (or such lower rate as may be specified by an applicable income tax treaty).
A non-U.S. holder generally will not be subject to U.S. federal income tax in respect of gain recognized on a sale, exchange or other disposition of common stock, unless:
There can be no assurance that our common stock will be treated as regularly traded on an established securities market for this purpose.
Unless an applicable tax treaty provides otherwise, gain described in the first and third bullet points above generally will be subject to U.S. federal income tax, net of certain deductions, at the same graduated tax rates applicable to U.S. persons. Any gains described in the first bullet point above of a non-U.S. holder that is a foreign corporation may also be subject to an additional “branch profits tax” at a 30 percent rate (or a lower applicable tax treaty rate). Any U.S. source capital gain of a non-U.S. holder described in the second bullet point above (which may be offset by U.S. source capital losses during the taxable year of the disposition) generally will be subject to a flat 30 percent U.S. federal income tax (or a lower applicable tax treaty rate).
In connection with the third bullet point above, we generally will be classified as a USRPHC if the fair market value of our “United States real property interests” equals or exceeds 50 percent of the sum of the fair market value of our worldwide real property interests plus our other assets used or held for use in a trade or business, as determined for U.S. federal income tax purposes. We believe that we currently are not a USRPHC, and we do not anticipate becoming a USRPHC (although no assurance can be given that we will not become a USRPHC in the future).
Other than with respect to U.S. holders who are “exempt recipients,” we generally must report annually to the IRS and to each holder the amount of dividends and certain other distributions we pay to such holder on our common stock and the amount of tax, if any, withheld with respect to those distributions. In the case of a non-U.S. holder, copies of the information returns reporting those distributions and withholding may also be made available to the tax authorities in the country in which the non-U.S. holder is a resident under the provisions of an applicable income tax treaty or agreement. Information reporting is also generally required with respect to proceeds from the sales and other dispositions of our common stock to or through the U.S. office (and in certain cases, the foreign office) of a broker.
In addition, backup withholding of U.S. federal income tax, currently at a rate of 28 percent, generally will apply to distributions made on our common stock to, and the proceeds from sales and other dispositions of our common stock by, a non-corporate U.S. holder who:
A non-U.S. holder generally may eliminate the requirement for information reporting (other than with respect to distributions, as described above) and backup withholding by providing certification of its foreign status, under penalties of perjury, on a duly executed applicable IRS Form W-8 or by otherwise establishing an exemption.
Backup withholding is not an additional tax. Rather, the amount of any backup withholding will be allowed as a credit against a U.S. holder’s or a non-U.S. holder’s U.S. federal income tax liability and may entitle such holder to a refund, provided that certain required information is timely furnished to the IRS. Holders are urged to consult their own tax advisors regarding the application of backup withholding and the availability of and procedure for obtaining an exemption from backup withholding in their particular circumstances.
On March 18, 2010, the President signed the Hiring Incentives to Restore Employment Act into law. Effective for payments made after December 31, 2012, this law imposes a 30% U.S. federal withholding tax on distributions and the gross proceeds of sale in respect of our shares of common stock to a foreign financial institution or non-financial foreign entity, unless (i) in the case of a foreign financial institution, such institution enters into an agreement with the U.S. government to withhold on certain payments and to collect and provide to the U.S. tax authorities substantial information regarding U.S. account holders of such institution (which includes certain equity and debt holders of such institution, as well as certain account holders that are foreign entities with U.S. owners) and to withhold on certain payments and (ii) in the case of a non-financial foreign entity, such entity provides the withholding agent with a certification identifying the direct and indirect U.S. owners of the entity. Under certain circumstances, a non-U.S. shareholder might be eligible for refunds or credits of such taxes. Prospective investors should consult with their own tax advisor regarding the possible implications of this recently enacted legislation on the ownership and disposition of our common stock.
The following discussion summarizes the material PRC income tax considerations relating to the ownership of our common stock following the consummation of this offering.
Under Enterprise Income Tax Law of the PRC (“EIT Law”) that became effective on January 1, 2008, enterprises are classified as “resident enterprises” and “non-resident enterprises.” Pursuant to the EIT Law and its implementing rules, enterprisesEnterprises established outside of China whose “de facto management bodies” are located in China are considered “residentPRC “tax resident enterprises” and will generally be subject to the uniform 25% PRC enterprise income tax rate on their global income. AccordingIn addition, a tax circular issued by the State Administration of Taxation on April 22, 2009 regarding the standards used to classify certain Chinese-invested enterprises established outside of China as “resident enterprises” clarified that dividends and other income paid by such “resident enterprises” will be considered to be PRC source income, subject to PRC withholding tax, currently at a rate of 10%, when recognized by non-PRC enterprise shareholders. This recent circular also subjects such “resident enterprises” to various reporting requirements with the PRC tax authorities. Under the implementation rules to the implementing rules of the EITEnterprise Income Tax Law, a “de facto management body” refers tois defined as a managing body that in practice exerciseshas material and overall management and control over the productionmanufacturing and business operations, personnel accounting and human resources, finances and other assets of an enterprise. In addition, the tax circular mentioned above details that certain Chinese-invested enterprises will be classified as “resident enterprises” if the following are located or resident in China: senior management personnel and departments that are responsible for daily production, operation and management; financial and personnel decision making bodies; key properties, accounting books, company seal, and minutes of board meetings and shareholders’ meetings; and half or more of the senior management or directors having voting rights.
Given the short history of the EIT Law and lack of applicable legal precedent, it remains unclear how the PRC tax authorities will determine the PRC tax resident treatment of a non-PRC company such as us. Our management is substantially based in the PRC and expected to be based in the PRC in the future, although two of our executive officers and one of our directors are not PRC nationals. If the PRC tax authorities determine that we are a “resident enterprise” for PRC enterprise income tax purposes, a number of unfavorable tax consequences could follow. First, we could be subject to the enterprise income tax at a rate of 25% on our global taxable income.income, as well as PRC enterprise tax reporting obligations. Second, although under the New EIT Law providesand its implementing rules dividends paid to us from our PRC subsidiary would qualify as “tax-exempted income”, we cannot assure you that dividend income between “qualifiedsuch dividends will not be subject to a 10% withholding tax, as the PRC foreign exchange control authorities, which enforce the withholding tax, have not yet issued guidance with respect to the processing of outbound remittances to entities that are treated as resident enterprises”enterprises for PRC EIT purposes. Finally, it is exempt from income tax. Itpossible that future guidance issued with respect to the new “resident enterprise” classification could result in a situation in which a withholding tax of 10% for our non-PRC enterprise shareholders or a potential withholding tax of 20% for non-PRC individual shareholders is unclear whether theimposed on dividends we receive would constitute dividend income between “qualified resident enterprises”pay to them and would therefore qualify for tax exemption.with respect to gains derived by our non-PRC shareholders from transferring our shares. In addition to the uncertainty in how the new “resident enterprise” classification could apply, it is also possible that the rules may change in the future, possibly with retroactive effect. We are actively monitoring the “resident enterprise” classification rules and are evaluating appropriate organization changes to avoid this treatment, to the extent possible.
As of the date of this prospectus, there has not been a definitive determination as to the “resident enterprise” or “non-resident enterprise” status of us. However, since it is not anticipated that we would receive dividends or generate other income in the near future, we are not expected to have any income that would be subject to the 25% enterprise income tax on global income in the near future. We will consult with the PRC tax authorities and make any necessary tax payment if we (based on future clarifying guidance issued by the PRC), or the PRC tax authorities, determine that we are a resident enterprise under the EIT Law, and if we were to have income in the future.
If we are not treated as resident enterprises under the EIT Law, then dividends that we receive may be subject to PRC withholding tax. The EIT Law and the implementing rules of the EIT Law provide that (A) an income tax rate of 25% will normally be applicable to investors that are “non-resident enterprises,” or non-resident investors, which (i) have establishments or premises of business inside the PRC, and (ii) the income in connection with their establishment or premises of business is sourced from the PRC or the income is earned outside the PRC but has actual connection with their establishments or places of business inside the PRC, and (B) an income tax rate of 10% will normally be applicable to dividends payable to investors that are “non-resident enterprises,” or non-resident investors, which (i) do not have an establishment or place of business in the PRC or (ii) have an establishment or place of business in the PRC, but the relevant income is not effectively connected with the establishment or place of business, to the extent such dividends are derived from sources within the PRC.
As described above, the PRC tax authorities may determine the resident enterprise status of entities organized under the laws of foreign jurisdictions, on a case-by-case basis. We are a holding company and substantially all of our income may be derived from dividends. Thus, if we are considered as a “non-resident enterprise” under the EIT Law and the dividends paid to us are considered income sourced within the PRC, such dividends received may be subject to the income tax described in the foregoing paragraph.
As of the date of this prospectus, there has not been a definitive determination as to the “resident enterprise” or “non-resident enterprise” status of us. As indicated above, however, we are not expected to be paid any dividends in the near future. We will consult with the PRC tax authorities and make any necessary tax withholding if, in the future, we were to be paid any dividends and we (based on future clarifying guidance issued by the PRC), or the PRC tax authorities, determine that we are a non-resident enterprise under the EIT Law.
Dividends that Non-PRC Resident Investors Receive From Us; Gain on the Sale or Transfer of Our Common Stock
If dividends payable to (or gains recognized by) our non-resident investors are treated as income derived from sources within the PRC, then the dividends that non-resident investors receive from us and any such gain on the sale or transfer of our common stock, may be subject to taxes under PRC tax laws.
Under the EIT Law and the implementing rules of the EIT Law, PRC income tax at the rate of 10% is applicable to dividends payable to investors that are “non-resident enterprises,” or non-resident investors, which (i) do not have an establishment or place of business in the PRC or (ii) have an establishment or place of business in the PRC but the relevant income is not effectively connected with the establishment or place of business, to the extent that such dividends have their sources within the PRC. Similarly, any gain realized on the transfer of common stock by such investors is also subject to 10% PRC income tax if such gain is regarded as income derived from sources within the PRC.
The dividends paid by us to non-resident investors with respect to our common stock, or gain non-resident investors may realize from sale or the transfer of our common stock, may be treated as PRC-sourced income and, as a result, may be subject to PRC tax at a rate of 10%. In such event, we also may be required to withhold a 10% PRC tax on any dividends paid to non-resident investors. In addition, non-resident investors in our common stock may be responsible for paying PRC tax at a rate of 10% on any gain realized from the sale or transfer of our common stock after the consummation of the offering if such non-resident investors and the gain satisfy the requirements under the EIT Law and its implementing rules. However, under the EIT Law and its implementing rules, we would not have an obligation to withhold income tax in respect of the gains that non-resident investors (including U.S. investors) may realize from the sale or transfer of our common stock from and after the consummation of this offering.
If we were to pay any dividends in the future, we would again consult with the PRC tax authorities and if we (based on future clarifying guidance issued by the PRC), or the PRC tax authorities, determine that we must withhold PRC tax on any dividends payable by us under the EIT Law, we will make any necessary tax withholding on dividends payable to our non-resident investors. If non-resident investors as described under the EIT Law (including U.S. investors) realized any gain from the sale or transfer of our common stock and if such gain were considered as PRC-sourced income, such non-resident investors would be responsible for paying 10% PRC income tax on the gain from the sale or transfer of our common stock. As indicated above, under the EIT Law and its implementing rules, we would not have an obligation to withhold PRC income tax in respect of the gains that non-resident investors (including U.S. investors) may realize from the sale or transfer of our common stock from and after the consummation of this offering.
UNDERWRITING
| · | 1% of the total number of securities of the same class then outstanding, which will equal approximately 214,038 shares immediately after this offering; or |
| · | the average weekly trading volume of such securities during the four calendar weeks preceding the filing of a notice on Form 144 with respect to such sale. |
Subjectprovided, in each case, that we are subject to the termsExchange Act periodic reporting requirements for at least three months before the sale.
Sales by affiliates must also comply with the manner of sale, current public information and conditionsnotice provisions of Rule 144. The selling stockholders will not be governed by the foregoing restrictions when selling their shares pursuant to the resale prospectus.
As we are a former “shell” company, persons who wish to sell our securities have also to satisfy the additional requirements of Rule 144(i) which provides that those securities may be sold, subject to the other requirements of Rule 144, after one year has elapsed from the date that the issuer filed "Form 10 information" with the Commission (in our case February 12, 2011) provided that we have filed all reports and other materials required to be filed by section 13 of the Exchange Act during the preceding 12 months.
Registration Rights
Other than the registration rights set forth in (i) the registration rights agreement entered into on February 12, 2010 with the investors in the underwritingprivate placement under which we are obligated to register for resale all of shares issued on conversion of the notes, and (ii) the registration rights side agreement dated entered into on February 12, 2010 with the selling stockholders who had acquired their shares prior to the reverse merger, under which we are obligated to register for resale 52,001 shares, (iii) the agreements entered into with Primary Capital and United Best, under which we are obligated to register for resale the 653,510 shares received by Primary Capital and United Best under such agreements, (iv) oral agreements entered into with Li Jun and Ming Liu, we have no other obligation to register under the Securities Act any of our shares of common stock.
SECURITY OWNERSHIP OF CERTAIN BENEFICIAL OWNERS AND MANAGEMENT
The following table sets forth, as of the close of business on October 7, 2010, certain information with respect to the beneficial ownership of our common stock, by (i) each stockholder whom we know to own beneficially more than 5% of our common stock, (ii) each director, (iii) our chief executive officer and each other executive officer whose cash compensation for the most recent fiscal year exceeded $100,000 and (iv) all executive officers and directors as a group. The table reflects the ownership of our equity securities by the foregoing parties after the 1-for-5 reverse stock split which occurred on March 24, 2010.
Beneficial ownership is determined in accordance with the rules of the Securities and Exchange Commission, as consisting of sole or shared voting power (including the power to vote or direct the vote) and/or sole or shared investment power (including the power to dispose of or direct the disposition of) with respect to the security through any contract, arrangement, understanding, relationship or otherwise, subject to community property laws where applicable. Except as indicated below, and subject to applicable community property laws, the persons named in the table below have sole voting and investment power with respect to our common stock shown as beneficially owned by them. A shareholder is also deemed to be, as of any date, the beneficial owner of all securities that such shareholder has the right to acquire within 60 days after that date through (1) the exercise of any option, warrant or right, (2) the conversion of a security, (3) the power to revoke a trust, discretionary account or similar arrangement, or (4) the automatic termination of a trust, discretionary account or similar arrangement.
Unless otherwise indicated, the address for each listed stockholder is: c/o China SLP Filtration Technology, Inc., Shishan Industrial Park, Nanhai District, Foshan City, Guangdong Province PRC.
Name and Address of Shareholder | | Amount and Nature of Beneficial Ownership | | | Percent of Class (1) (2) | | | Amount and Nature of Beneficial Ownership | | | Percent of Class (1) (2)(3) | |
| | | | | | | | | | | | | |
| | | Before Offering | | | Before Offering | | | Post Offering | | | Post Offering | |
| Owners of More Than 5% Of Class | | | | | | | | | | | | |
| Bestyield Group Limited (4) | | | 4,353,061 | | | | 28.6 | % | | | 4,353,061 | | | | 19.91 | % |
| Proudlead Limited (5) | | | 4,353,061 | | | | 28.6 | % | | | 4,353,061 | | | | 19.91 | % |
| Li Jun (6) | | | 2,202,268 | | | | 14.33 | % | | | 2,202,268 | | | | 10.02 | % |
| Newise Holdings (6) | | | 1,547,756 | | | | 10.2 | % | | | 1,547,756 | | | | 7.08 | % |
| Pilot Link International Limited (7) | | | 1,668,673 | | | | 11 | % | | | 1,668,673 | | | | 7.63 | % |
| High Swift Limited (8) | | | 1,088,265 | | | | 7.1 | % | | | 1,088,265 | | | | 4.98 | % |
| Primary Capital, LLC (9) | | | 1,328,389 | | | | 8.6 | % | | | 1,328,389 | | | | 8.6 | % |
| | | | | | | | | | | | | | | | | |
| Directors and Executive Officers | | | | | | | | | | | | | | | | |
| Li Jie (Chief Executive Officer and a Director) (4) | | | 4,353,061 | | | | 28.6 | % | | | 4,353,061 | | | | 19.91 | % |
| Law Wawai (President of Sales and a Director) (5) | | | 4,353,061 | | | | 28.6 | % | | | 4,353,061 | | | | 19.91 | % |
| Zeng Shijun (Chief Technology Officer) | | | - | | | | - | % | | | - | | | | - | % |
| Eric Gan (Chief Financial Officer) (12) | | | - | | | | - | % | | | - | | | | - | % |
| Li Jun (Director) (6) | | | 2,202,268 | | | | 14.33 | % | | | 2,202,268 | | | | 14.33 | % |
| Richard M. Cohen (Director) (11) | | | 10,000 | | | | * | | | | 10,000 | | | | * | % |
| Chris Bickel (Director) (10) | | | - | | | | - | | | | - | | | | - | % |
| Su Lie (Director) | | | - | | | | - | | | | - | | | | - | % |
| | | | | | | | | | | | | | | | | |
| Directors and executive officers as a group (8 persons) | | | 10,918,390 | | | | 71.52 | % | | | 10,918,390 | | | | 71.52 | % |
* Less than 1%.
(1) As of the close of business on October 7, 2010, by and between us, Brean Murray, Carret & Co., LLC, who is acting asthere were 15,265,714 shares of our common stock outstanding. Following the book-running management and representative of underwritersclosing of this offering each underwriter has agreed to purchase from usthere will be 21,862,182 shares of common stock issued and we have severally agreed to sell,outstanding.
(2) In determining beneficial ownership of the common stock, the number of shares shown includes shares which the beneficial owner may acquire within 60 days of October 7, 2010 upon exercise of convertible securities, warrants or options. In accordance with Rule 13d-3 in determining the percentage of common stock owned by a person on a firm commitment basis,October 7, 2010 (a) the numerator is the number of shares of the class beneficially owned by such person, including shares which the beneficial owner may acquire within 60 days upon conversion or exercise of the warrants and other convertible securities, and (b) the denominator is the sum of (i) the total shares of that class outstanding on October 7, 2010, and (ii) the total number of shares that the beneficial owner may acquire upon conversion or exercise of other securities. Unless otherwise stated, each beneficial owner has sole power to vote and dispose of the shares.
(3) Following completion of the offering there will a total of 21,862,182 shares of common stock set forth below,outstanding, including (i) 15,265,714 shares of common stock currently outstanding, (ii) 1,971,429 shares issuable on conversion of the notes, (iii) 4,166,667 shares to be issued in the offering, and (iv) and 193,186 shares to be issued to United Best and 265,186 shares to be issued to Primary Capital on closing of the offering.
(4) Bestyield Group is a BVI company controlled by Mr. Li Jie, our chief executive officer. Its address is PO Box 957 Offshore Incorporations Center, Road Town, Tortola, British Virgin Islands. Mr. Li has sole voting power with respect to the shares. Bestyield has guaranteed our obligations to the investors under our outstanding convertible notes issued in February 2010. All of these shares have been pledged to secure the performance of that guaranty.
(5) Proudlead is a BVI company controlled by Law Wawai, president of sales and a director. Its address is PO Box 957 Offshore Incorporations Center, Road Town, Tortola, British Virgin Islands. Mr. Law has sole voting power with respect to the shares. Proudlead has guaranteed our obligations to the investors under our outstanding convertible notes issued in February 2010. All of these shares have been pledged to secure the performance of that guaranty.
(6) Represents 1,547,756 shares held by Newise Holdings, a BVI company controlled by Li Jun, one of our directors. Its address is PO Box 957 Offshore Incorporations Center, Road Town, Tortola, British Virgin Islands. Mr. Li has sole voting and dispositive power with respect to the shares held by Newise Holdings. In addition, under the terms of an agreement between Foshan and United Best, a company controlled by Mr. Li, United Best received, as a transaction fee following the closing of the financing 362,755 shares of our common stock. On closing of this offering United Best is also entitled to receive an additional 193,186 shares of common stock and a warrant to purchase 98,571 shares at an exercise price of $2.10 per share (based on an assumed public offering price of $6.00). Mr. Li has sole voting and dispositive power with respect to the shares held by United Best. Newise and United Best are named as selling stockholders in a resale prospectus dated the date hereof.
(7) Pilot Link International is a BVI company controlled by Li Shiyi and Wei Yang, PRC residents. Its address is PO Box 957 Offshore Incorporations Center, Road Town, Tortola, British Virgin Islands. Li Shiyi and Wei Yang have shared voting and dispositive power with respect to the shares.
(8) High Swift Limited is a BVI company controlled by Han Hung Yuk, a PRC resident. Its address is PO Box 957 Offshore Incorporations Center, Road Town, Tortola, British Virgin Islands. Mr. Han has sole voting power and dispositive with respect to the shares.
(9) Primary Capital is the beneficial owner of 964,632 shares. Primary Capital received, at the closing of the share exchange agreement, 290,755 shares of common stock and on April 20, 2010 Primary Capital purchased 673,877 shares from Newise Holdings. John Leo has sole voting and dispositive power with respect to the shares held by Primary Capital. Primary Capital’s address is 80 Wall Street, 5th Floor, New York, New York 10005. On closing of this offering Primary Capital is also entitled to receive an additional 265,186 shares of common stock and a warrant to purchase 98,571 shares at an exercise price of $2.10 per share (based on an assumed public offering price of $6.00). John Leo has sole voting and dispositive power with respect to the shares held by Primary Capital. Primary Capital’s address is 80 Wall Street, 5th Floor, New York, New York 10005. Primary Capital is named as a selling shareholder in a resale prospectus dated the date hereof.
(10) Chris Bickel is President of Primary Capital. Mr. Bickel does not have voting or dispositive power over the shares held by Primary Capital. Mr. Bickel’s business address is 80 Wall Street, 5th Floor, New York, New York 10005.
(11) Richard M. Cohen is a director of the Company, and his business address is 3 Park Avenue, 16th Floor, New York, New York 10016. In June 2010, we entered into a director’s agreement with Richard M. Cohen, which agreement was effective with his election to the Board. Under the terms of that agreement Mr. Cohen on September 3, 2010 was granted 30,000 shares of restricted two-thirds of which are subject to restrictions on transfer and are subject to forfeiture, with the restrictions lapsing as to one-third of the shares on the first anniversary of the date of grant, and as to one-third on the second anniversary of the date of grant, in the event Mr. Cohen continues to be a director on those dates. This table includes the 10,000 shares which are not currently subject to forfeiture.
(12) Under his employment agreement dated August 11, 2010, Mr. Gan is to be granted an option to purchase 400,000 shares of common stock at an exercise price equal to the public offering price, lessprice. The option vests and is exercisable as follows; 160,000 shares will vest and become exercisable on July 31, 2011; 120,000 shares will vest and become exercisable on July 31, 2012; 120,000 shares will vest and become exercisable on July 31, 2013. In the underwriting discountevent that the employment is terminated within 12 months from the employment agreement date by the Company without cause, 160,000 shares shall be vested immediately on the termination date. As the option is not currently exercisable none of the shares underlying the option are included in the table.
MANAGEMENT
Executive Officers and Directors
The following table sets forth information concerning our current directors and executive officers:
Directors and Executive Officers | | Position/Title | | Age | |
| | | | | |
| Li Jie | | Chief Executive Officer and a Director | | 55 | |
| | | | | |
| Law Wawai | | President of Sales and a Director | | 45 | |
| | | | | |
| Eric Gan | | Chief Financial Officer | | 48 | |
| | | | | |
| Zeng Shijun | | Chief Technology Officer | | 48 | |
| | | | | |
| Chris Bickel | | Director | | 47 | |
| | | | | |
| Li Jun | | Director | | 47 | |
| | | | | |
| Richard M. Cohen | | Director | | 59 | |
| | | | | |
| Su Lei | | Director | | 46 | |
Except for Messrs. Chris Bickel, Richard M. Cohen and Eric Gan, all of our officers and directors are residents of the PRC. In addition, substantially all of our assets are located in the PRC. As a result, it may be difficult or impossible for you to effect service of process within the United States on our company or any of them or to enforce court judgments obtained against them in the United States courts. We have been advised by our PRC counsel that there is uncertainty as to whether the courts of the PRC would (1) recognize or enforce judgments of U.S. courts obtained against our officers or directors or the experts named in this prospectus based on the civil liability provisions of the securities laws of the U.S. or any state in the U.S., or (2) entertain original actions brought in the PRC against our officers or directors or the experts named in this prospectus based on the securities laws of the U.S. or any state in the U.S.
The following is a summary of the biographical information of our directors and officers:
Li Jie was elected director and appointed as our Chief Executive Officer on February 12, 2010. Mr. Li has served as Chief Executive Officer and Managing Director of Foshan SLP Special Materials Co., Ltd. since its inception in 2000. He also serves as Director General of the China Industrial Textile Committee. From 1980 to 2000, he served as R&D director of Dalian Synthetic Fiber Research Institute. From 2000 to 2003, he also studied for an MBA at Southwest International University. We believe that Mr. Li’s knowledge of all aspects of our business and his in-depth understanding of our operations, combined with his years of experience in the nonwovens industry, position him well to serve as our Chairman and Chief Executive Officer. Mr. Li received a bachelor’s degree in Engineering for Chemical Fiber Technique at Dalian Light Industrial School. He received a Masters degree from Chinese Academy of Social Sciences where he studied economic management. Also he studied for an MBA at Southwest International University. Mr. Li is not, and has not been within the last five years, a director of any other publicly traded company.
Law Wawai was elected as a director and appointed as President of Sales on February 12, 2010. From 1997 to February 2010, Mr. Law served as director and general manager of Nanhai Wanzhi Trading Co. From 1987 to 1997, he was sales manger Nanhai Polyester Factor. We believe that Mr. Wawai’s knowledge of all aspects of the nonwovens business and his in-depth understanding of its operations position him well to serve as a director. Mr. Law received his bachelors degree in business management from Nanhai Television University. Mr. Law is not, and has not been within the last five years, a director of any other publicly traded company.
Eric Gan was appointed as our Chief Financial Officer in August 2010. From July 1999 to August 2010 Mr. Gan was a Senior Financial Consultant at The Goetzman Group, a company which provides staffing solutions in all areas of finance and accounting. His assignments while at The Goetzman Group included (i) acting as interim chief financial officer for Rino International Inc. Inc from January 2007 to September 2007; (ii) acting as interim general accounting manager for Physicals Formula from March 2008 to September 2008; and (iii) overseeing the Sarbanes- Oxley compliance project for Smart & Final from January 2005 to May 2005. Mr. Gan received his Master of Arts from Fudan University, Shanghai in June 1989 and received his Masters in Accounting from the University of Southern California in December 1995.
Zeng Shijun was appointed as our Chief Technology Officer on February 12, 2010. He has worked as deputy general manager for Dalian Hua Yang Engineer Co., Ltd. since 1992. He worked as project manager for Dalian Synthetic Fiber Research Institute from 1984 to 1991. He received his bachelor’s degree from Dalian University of Technology in 1984. He received a postgraduate degree in economy management from the China Social Scientific University in 1998.
Chris Bickel was elected as a director on February 12, 2010. Since October 2009, Mr. Bickel has served as President of Primary Capital and is responsible for business development in China. Primary Capital acted as placement agent for the Company’s February 2010 private placement. From 2005 to October 2009, Mr. Bickel was an investment banker at Rosewood Capital Group, LLC (previously an affiliate of Primary Capital and now a branch office ) during which time his investment banking team provided a full range of investment banking, due diligence and business advisory services to private China based companies interested in accessing the U.S. capital markets and being listed in the U.S., as well as advisory services to US based investment banking firms interested in identifying investment banking clients in China. Mr. Bickel was instrumental in originating and financing of a number of PRC companies that are listed on the NASDAQ or whose shares are quoted on the OTCBB. From 2001 through 2004, Mr. Bickel served as Chairman and CEO of Sino UJE Ltd., a Hong Kong based company which is a distributor of medical and industrial instrumentation and technology products. Mr. Bickel was also employed by Spectris Inc. from 1983 to 1996. As an employee of Spectris, Mr. Bickel was involved with and managed the nonwoven sector of its business. Spectris was engaged in providing engineered products for use in nonwovens production. We believe that Mr. Bickel’s extensive past experience in providing business advisory services to private China based companies interested in accessing the U.S. capital markets, including Rino International Corp. and Sino Gas International Holdings, Inc., and helping those companies become successfully listed as well as his over ten years’ experience in the nonwoven market and knowledge with manufacturing practice and the overall market make him a suitable candidate to serve on our board of directors.
Li Jun was elected as a director in February 2010. Mr. Li is the owner and manager of Shanghai Primary Capital Management Co., Ltd., a business advisory firm incorporated in Shanghai China, which he started in 2010. (Shanghai Primary Capital Management Co., Ltd. is not affiliated with Primary Capital.) He provides advisory services to China business owners seeking capital and advisory services related to listing their company on United States stock exchanges. He has over twenty years of experience working in China in various fields and in various capacities. Mr. Li founded Shanghai Rosewood Investment Consulting Co., Ltd in 2005 and participated in four listing and financing transactions in which China based companies received funding from U.S. based investors and listed on in the U.S. From 2001 through 2008, Mr. Li has been the Managing Director of SINO UJE, Ltd., a Hong Kong based company which is a distributor of medical and industrial instrumentation and technology products throughout Asia. From 1994 through 2000, Mr. Li was employed by Nanchang Minerals Machinery Imp and Exp Co., Ltd initially as a salesman, followed by promotions to department director and vice president. From 1987 through 1994, Mr. Li served as an instructor at the University of Military Science and Technology and he retired as a Major from the Chinese People’s Liberation Army. Although he has not been previously engaged in the nonwovens business, we believe that Mr. Li’s business acumen and his extensive past experience in providing business advisory services to private China based companies interested in accessing the U.S. capital markets and helping those companies become successfully listed make him an eminently suitable candidate to serve on our board of directors. Mr. Li received his Bachelor’s and his Master’s degree of Science from Shanghai Jiaotong University. Mr. Li is not, and has not been within the last five years, a director of any other publicly traded company.
Richard M. Cohen was elected as a director in June, 2010. Since 1996, Mr. Cohen has been the President of Richard M. Cohen Consultants, a financial services consulting company that accepts engagements from public and private companies to assist with their corporate governance and corporate finance needs. From 1984 through 1992, Mr. Cohen was an investment banker at both Henry Ansbacher and Furman Selz, where he specialized in mergers & acquisitions, public equity offerings, and restructurings. From 1980 through 1983, Mr. Cohen was a Vice President of corporate development at Macmillan, Inc. Mr. Cohen is a Certified Public Accountant (New York State) and began his career at Arthur Andersen. He received a B.S. from The University of Pennsylvania (Wharton) in 1973 and an M.B.A. from Stanford University in 1975. Although he has not been previously engaged in the nonwovens business we believe that Mr. Cohen’s business acumen and his experience in providing business advisory services to private companies to assist with their corporate governance and corporate finance needs coupled with his experience serving as a director of a number of publicly traded companies make him an eminently suitable candidate to serve on our board of directors. Mr. Cohen currently serves as a director of Helix BioMedix (OTCBB:HXBM), Rodman and Renshaw (NASDQ:RODM), CorMedix (OTCBB:CRMD), Dune Energy, Inc. (AMEX: DNE), for which he served as Chief Financial Officer from November 2003 to April 2005.
Su Lei was elected as a director in August 2010. Mr. Su currently serves as the Associate Director of Information of the State Environmental Protection Agency in China, a position he has held since 2001. Mr. Su has successively acted as Principal Staff Member, Associated Director and Director of China Environmental Protection Industrial Association since September 2001. He also currently serves as the Director of the Working Committee of China Green Star, a position he has held since 2002. China Green Star is a non-profit organization under China's Environmental Protection Association which focuses on promoting the interests of the environmental protection industry. We believe that Mr. Su’s position and experience with the State Environmental Protection Agency and his understanding of public policy matters make him well suited to serve on our board of directors. Mr. Su received a bachelor’s degree in the Electronic Engineering from China Air Force Missile Institute, and he is now a senior engineer in Environment Management.
All of our directors serve on the board until our next annual meeting of the stockholders, and until their successors have been elected and qualified or until their earlier resignation or removal.
Our executive officers serve at the discretion of the board of directors, subject to the terms of any employment agreement they have with the Company. Mr. Bickel is serving on the Board as a designee of Primary Capital. Under the terms of its financial services agreement with the company Primary Capital is entitled to designate one board member and one observer until February 11, 2012.
Family Relationships
There are no family relationships among our directors and executive officers, except the Eric Gan, our chief financial officer, is the brother in law of Li Jun, one of our directors. There is no arrangement or understanding between or among our executive officers and directors pursuant to which any director or officer was or is to be selected as a director or officer, and there is no arrangement, plan or understanding as to whether non-management shareholders will exercise their voting rights to continue to elect the current board of directors.
Involvement in Certain Legal Proceedings
None of our directors or executive officers has, during the past ten years:
| · | been convicted in a criminal proceeding or been subject to a pending criminal proceeding (excluding traffic violations and other minor offences); |
| · | had any bankruptcy petition filed by or against the business or property of the person, or of any partnership, corporation or business association of which he was a general partner or executive officer, either at the time of the bankruptcy filing or within two years prior to that time; |
| · | been subject to any order, judgment, or decree, not subsequently reversed, suspended or vacated, of any court of competent jurisdiction or federal or state authority, permanently or temporarily enjoining, barring, suspending or otherwise limiting, his involvement in any type of business, securities, futures, commodities, investment, banking, savings and loan, or insurance activities, or to be associated with persons engaged in any such activity; |
| · | been found by a court of competent jurisdiction in a civil action or by the Securities and Exchange Commission or the Commodity Futures Trading Commission to have violated a federal or state securities or commodities law, and the judgment has not been reversed, suspended, or vacated; |
| · | been the subject of, or a party to, any federal or state judicial or administrative order, judgment, decree, or finding, not subsequently reversed, suspended or vacated (not including any settlement of a civil proceeding among private litigants), relating to an alleged violation of any federal or state securities or commodities law or regulation, any law or regulation respecting financial institutions or insurance companies including, but not limited to, a temporary or permanent injunction, order of disgorgement or restitution, civil money penalty or temporary or permanent cease-and-desist order, or removal or prohibition order, or any law or regulation prohibiting mail or wire fraud or fraud in connection with any business entity; or |
| · | been the subject of, or a party to, any sanction or order, not subsequently reversed, suspended or vacated, of any self-regulatory organization (as defined in Section 3(a)(26) of the Exchange Act (15 U.S.C. 78c(a)(26))), any registered entity (as defined in Section 1(a)(29) of the Commodity Exchange Act (7 U.S.C. 1(a)(29))), or any equivalent exchange, association, entity or organization that has disciplinary authority over its members or persons associated with a member. |
Board Independence
In order to be listed on NASDAQ, a company is required to meet certain corporate governance requirements, including, with certain exceptions, the requirement to have a board of directors the majority of whose members are “independent” within the meaning of NASDAQ rules.
As a “controlled company” we are exempt from the requirements of the NASDAQ Marketplace Rules (i) to have a majority of independent board members; (ii) for independent director oversight of executive officer compensation and (iii) for independent director oversight of director nomination. As a controlled company, we remain subject to the NASDAQ audit committee requirements and the requirement that independent directors regularly meet in executive session.
Under NASDAQ Marketplace Rules a company is considered a "controlled company" if greater than 50% of its voting power is held by an individual, a group or another company. In order for a group to exist for purposes of this rule, the stockholders forming the group are required to publicly file a notice that they are acting as a group (e.g., Schedule 13D). Bestyield Group Limited, Proudlead Limited, Pilot Link International Limited, High Swift Limited, China Investment Management Inc. and Li Jun intend to file a Schedule 13D disclosing the existence of a group with respect to their holdings in the Company.
The Company intends to disclose its status as a “controlled company” in its proxy statement for its next annual meeting or in its next annual report on Form 10-K and the basis for determining that it is a controlled company.
The Board has determined that three of its six current members, namely Messrs. Chris Bickel, Su Lie and Richard M. Cohen, are “independent” within the meaning of NASDAQ listing standards.
Director Contracts
In June 2010, we entered into a director’s agreement with Richard M. Cohen, which agreement was effective with his election to the Board. Under the terms of that agreement, effective on closing of the offering, Mr. Cohen will be paid an annual retainer of $24,000 for serving as a director (with $2,000 payable at the beginning of each month). In addition, pursuant to the Company’s equity incentive plan, Mr. Cohen was awarded 30,000 shares of restricted two thirds of which are subject to restrictions on transfer and are subject to forfeiture with the restrictions lapsing as to one-third of the shares on the first anniversary of the date of grant and as to one- third on the second anniversary of the date of grant in the event Mr. Cohen continues to be a director on those dates. In addition, the Company will reimburse the director for pre-approved reasonable business-related expenses incurred in good faith in the performance of the director’s duties for the Company.
Committees
The Board currently has three standing committees: Audit Committee, Compensation Committee and Nominating Committee. Each member of these committees is “independent” as defined by NASDAQ and SEC rules and each of these committees has a written charter approved by the Board. Committee members are appointed by the Board based on the recommendation of the Nominating Committee, except that members of the Nominating Committee are appointed by the independent members of the Board. The current members of the committees are as follows:
| Director | | Audit | | Compensation | | Nominating |
| Jie Li | | | | | | |
| Law Wawai | | | | | | |
| Li Jun | | | | | | |
| Chris Bickel | | ü | | ü | | ü |
| Richard M. Cohen | | ü | | ü | | ü |
| Su Lei | | ü | | | | |
Audit Committee; Audit Committee Financial Expert
The Audit Committee, established in September 2010, currently consists of three members, Su Lei, Chris Bickel, Richard M. Cohen, its Chairman. The Board has determined that each of them is independent within the meaning of the NASDAQ listing standards and applicable SEC regulations, and that each member has the financial literacy required by the NASDAQ listing standards.
The Board also has determined that Mr. Cohen is qualified as an "audit committee financial expert" within the meaning of applicable SEC regulations and has the accounting and related financial sophistication required by NASDAQ listing standards.
The function of the Audit Committee, as more fully set forth in its charter, is to (i) oversee our financial statements, our financial reporting process and our system of internal control over financial reporting; (ii) recommend the selection of our registered public accounting firm; (iii) review the extent of non-audit services to be performed by the auditors; and (iv) review the disclosures made in our periodic financial reports.
Compensation Committee
The Compensation Committee, established in September 2010, consists of two members Chris Bickel and Richard M. Cohen. The Board has determined that each of them is independent within the meaning of the NASDAQ listing standards. The functions of the Compensation Committee, as more fully set forth in its charter, are to oversee our compensation policies generally, evaluate senior executive performance, oversee and determine compensation for senior executives and review and recommend to the Board actions regarding director compensation.
Nominating Committee
The Nominating Committee, established in September 2010, currently consists of two members, Chris Bickel and Richard M. Cohen. The Board has determined that each of Messrs. Bickel and Cohen is independent within the meaning of the NASDAQ listing standards.
As more fully set forth in its charter, the primary responsibilities of the Nominating Committee are to: (i) develop and recommend to the Board criteria for selecting qualified director candidates; (ii) identify, review and evaluate individuals qualified to become Board members; (iii) consider committee member qualifications, appointment and removal; and (iv) assist the Board in its annual reviews of the performance of the Board, each committee and management. The Committee has the exclusive authority to make recommendations to the Board for approval for the election of new members to the Board.
To fulfill its responsibilities and duties the Nominating Committee is required to, among other things (i) evaluate the current composition of the Board of Directors and its committees, and determine future requirements for director candidates; (ii) determine the Board’s criteria for selecting new directors, including desired board skills and attributes, and actively seek prospective individuals qualified to become board members; (iii) adopt and maintain a policy concerning the director nomination process; (iv) adopt a policy concerning the consideration of director candidates recommended by stockholders and consider stockholder nominees for election to the Board; (v) evaluate and propose nominations for election to the Board; and (vi) review and make recommendations to the Board concerning membership of Board committees.
The Committee does not assign specific weights to particular criteria. Rather, the Nominating Committee believes that the backgrounds and qualifications of the directors, considered as a group, should provide a significant composite mix of experience, knowledge and abilities that will allow the Board to fulfill its responsibilities.
The Nominating Committee will consider director nominees recommended for consideration by the stockholders. To have a person considered by the Nominating Committee for recommendation to the Board as a director nominee a stockholder should write to the Corporate Secretary, specifying the nominee's name and qualifications for Board membership and providing confirmation of the nominee's consent to serve as a director. Following verification that the person submitting the recommendation is a stockholder of the Company, all properly submitted recommendations will be brought to the attention of the Nominating Committee at a regularly scheduled Committee meeting.
If a stockholder properly recommends a director nominee, the Nominating Committee will give due consideration to that nominee and will use the same criteria used for evaluating other director nominees, in addition to considering the information relating to the director nominee provided by the stockholder.
Stockholders also may nominate directors for election at our annual meeting of stockholders by following the provisions set forth in our bylaws. The deadline for stockholder nominations is set forth in our by laws. Stockholders and other parties interested in communicating directly with the Board of Directors may do so by writing to: China SLP Filtration Technology, Inc., Attention: Board of Directors, Shishan Industrial Park, Nanhai District, Foshan City, Guangdong Province PRC. Pursuant to a process approved by the Board, the Corporate Secretary reviews all correspondence received by us and addressed to members of the Board and regularly forwards to the Board a summary of such correspondence and copies of all correspondence that, in the opinion of the Corporate Secretary, deals with the functions of the Board or Board committees or otherwise requires the Board's attention. Directors may at any time review a log of all correspondence received by us that is addressed to members of the Board and request copies of any such correspondence.
Concerns relating to accounting, internal controls or auditing matters are immediately brought to the attention of our internal audit department and handled in accordance with procedures established by the Audit Committee to address such matters.
Compensation Committee Interlocks and Insider Participation
All current members of the Compensation Committee are independent directors. None of the past or present members of our Compensation Committee are present or past employees or officers of ours or any of our subsidiaries. No member of the Compensation Committee has had any relationship with us requiring disclosure under Item 404 of Regulation S-K under the Securities Exchange Act of 1934, as amended. None of our executive officers serves on the cover pageboard of this prospectus.directors or compensation committee of a company that has an executive officer that serves on our Board or Compensation Committee.
Code of Ethics
We strive to foster a culture of honesty, integrity and accountability.
We have a code of ethics applicable to all employees, including all officers, and including our independent directors, who are not employees of the company, with regard to their company -related activities. The code incorporates our guidelines designed to deter wrongdoing and to promote honest and ethical conduct and compliance with applicable laws and regulations. The code also incorporates our expectations of our employees that enable us to provide accurate and timely disclosure in our filings with the SEC and other public communications. In addition, the code incorporates guidelines pertaining to topics such as complying with applicable laws, rules, and regulations; reporting code violations; and maintaining accountability for adherence to the code.
Waivers of the Code for executive officers and directors may be granted only by the Board. Amendments to the Code must be approved by the Board. We intend to provide disclosure of any such amendments or waivers on our website (www.silepu.com) within four business days of any such amendment or waiver.
EXECUTIVE COMPENSATION
The following is a summary of the compensation we paid to our former chief executive officers, for the last two fiscal years ended September 30, 2010 and 2009. No executive officer received compensation in excess of $100,000 for any of those two years.
Name and Principal Position | | Fiscal Year | | Salary ($) | | Bonus ($) | | Stock Awards ($) | | Option Awards ($) | | Non-equity Incentive Plan Compensation ($) | | Nonqualified Deferred Compensation Earnings ($) | | All Other Compensation ($) | | Total ($) | |
| Li Jie | | | 2010 | | 44,117 | | | -0- | | -0- | | | -0- | | -0- | | | -0- | | -0- | | | 44,117 | |
| (CEO(1) | | | 2009 | | -0- | | | -0- | | -0- | | | -0- | | -0- | | | -0- | | -0- | | | -0- | |
| | | | | | | | | | | | | | | | | | | | | | | | | |
| Seth Winterton | | | 2010 | | -0- | | | -0- | | -0- | | | -0- | | -0- | | | -0- | | -0- | | | -0- | |
| (former CEO)(2) | | | 2009 | | -0- | | | -0- | | -0- | | | -0- | | -0- | | | -0- | | -0- | | | -0- | |
| (1) | Jie Li was appointed Chief Executive Officer in February 2010. |
| (2) | Seth Winterton served as Chief Executive Officer of Perpetual Technologies from December 29, 2008 until February 12, 2010. |
The following is a summary of the compensation paid by our operating subsidiary Foshan to Li Jie, its President and Chief Executive Officer, for the last two fiscal years ended September 30, 2010 and 2009, respectively. No executive officer of Foshan received compensation in excess of $100,000 for any of these two years.
Underwriter | | Number of
Common Stock
| |
Brean Murray, Carret & Co., LLC | | | |
| | | |
| | | |
Total | | | |
Name and Principal Position | | Fiscal Year | | Salary ($)(1) | | | Bonus ($) | | | Stock Awards ($) | | | Option Awards ($) | | | Non-equity Incentive Plan Compensation ($) | | | Nonqualified Deferred Compensation Earnings ($) | | | All Other Compensation ($) | | | Total ($) | |
| Li Jie | | | | | | | | | | | | | | | | | | | | | | | | | | |
| (President and Chief | | 2010 | | | 44,117 | | | | -0- | | | | -0- | | | | -0- | | | | -0- | | | | -0- | | | | -0- | | | | 44,117 | |
| Executive Officer ) | | 2009 | | | 44,117 | | | | -0- | | | | -0- | | | | -0- | | | | -0- | | | | -0- | | | | -0- | | | | 44,117 | |
(1) The underwriters haverelevant exchange rates for fiscal years ended September 2010 and 2009 are $1 to RMB 6.8 and RMB 6.8, respectively.
Employment Agreement
On November 20, 2008, Mr. Li entered into an employment agreement with Foshan to serve as our President and Chief Executive Officer. Under the agreement, Mr. Li is to be paid a salary of $15,000 per month beginning on the closing date of the public offering. The agreement can be terminated by either party by giving 30 days notice.
On November 20, 2008, Mr. Zeng entered into an employment agreement with Foshan to serve as our Chief Technology Officer. Under the agreement, Mr. Zeng is to be paid a salary of $5,000 per month beginning on the closing date of the public offering. The agreement can be terminated by either party by giving 30 day notice.
On January 1, 2010, Mr. Law entered into an employment agreement with Foshan to serve as our President of Sales. Under the agreement, Mr. Law is to be paid a salary of $5,000 per month beginning on the closing date of the public offering. The agreement can be terminated by either party by giving 30 day notice.
Effective August 5, 2010, Mr. Gan entered into an employment agreement with the Company to serve as Chief Financial Officer. The term is for three years unless sooner terminated as provided in the agreement. Under the agreement Mr. Gan has agreed to perform such duties as shall be consistent with the position of Chief Financial Officer subject to the supervision and direction of the Board. Under the agreement Mr. Gan will receive an annual salary of $120,000 payable in 12 equal payment payable on the 15th day of each month beginning on August 15, 2010). However, prior to the completion of the offering contemplated by this prospectus, Mr. Gan will receive a salary of $6,000 per month (receiving $10,000 for the month during which the Company completes its initial public offering and thereafter). In addition to his annual salary, Mr. Gan will be reimbursed for all reasonable expenses including travel expense between United States and China and will be provided with housing expense during the term of his employment. Mr. Gan will also receive, subject to the approval of the Board of Directors, an option to purchase allup to 400,000 shares of the company’s common stock at an exercise price equal to the initial public offering price. The option shall vest and be exercisable as follows; 160,000 shares will vest and become exercisable on July 31, 2011; 120,000 shares will vest and become exercisable on July 31, 2012; 120,000 shares will vest and become exercisable on July 31, 2013. In the event that the employment is terminated within 12 months from the employment agreement date by the Company without cause, 160,000 shares shall be vested immediately on the termination date.
2010 Stock Incentive Plan
On September 3, 2010, we adopted the 2010 Plan. All officers and key employees, directors of, and consultants to the Company and its subsidiaries and affiliates, who are responsible for or contribute to the management, growth and/or profitability of the business of the Company and/or its subsidiaries and affiliates are eligible for participation in the 2010 Plan. Two Million One Hundred Eighty Six Thousand Two Hundred Eighteen (2,186,218) (or such number as shall be equal to 10% of the outstanding shares on a fully diluted basis after the offering and the conversion of the notes) shares of common stock offeredhave been authorized and reserved for the 2010 Plan and any shares that may become available for issuance under awards under the 2010 Plan as a result of expiration or forfeiture. Under the 2010 Plan, the company may issue stock options, stock appreciation rights, restricted stock awards, restricted stock units, performance awards and other stock-based awards. The 2010 Plan is administered by our Compensation Committee.
The purpose of the 2010 Plan is to enhance the profitability and value of the Company for the benefit of its stockholders by enabling the Company to offer eligible participants stock-based incentives in the Company to attract, retain and reward such individuals and strengthen the mutuality of interests between such individuals and the Company’s stockholders.
The Compensation Committee does not currently have a set formula for determining who will receive awards and what the amounts of the awards will be and when such awards will be made. The Compensation Committee can make an award in its discretion at any time as consistent with the terms of the 2010 Plan. Long-term equity incentives are intended to reward and will be awarded to eligible participants who help achieve our overall corporate goals and meet their individual employee objectives.
Outstanding Equity Awards
On September 3, 2010, as required by the terms of his agreement with the Company entered into in June 2010, the Board awarded Richard Cohen 30,000 shares of restricted two-thirds of which are subject to restrictions on transfer and are subject to forfeiture, with the restrictions lapsing as to one-third of the shares on the first anniversary of the date of grant, and as to one-third on the second anniversary of the date of grant in the event Mr. Cohen continues to be a director on those dates.
On September 3, 2010, under the 2010 Plan and in connection with his appointment as Chief Financial Officer, the Board granted Eric Gan an option to purchase 400,000 shares at an exercise price equal to the public offering price of this offering. The option shall vest and be exercisable as follows; 160,000 shares will vest and become exercisable on July 31, 2011; 120,000 shares will vest and become exercisable on July 31, 2012; 120,000 shares will vest and become exercisable on July 31, 2013. In the event that the employment is terminated within 12 months from the employment agreement date by the Company without cause, 160,000 shares shall be vested immediately on the termination date.
Except for the foregoing there are no option exercises, options outstanding or restricted stock grants as of the date of this prospectus.
Compensation of Directors
During the fiscal year ended September 30, 2010, we did not pay any compensation to any of our current directors for services rendered in their capacity as directors of the company.
In June 2010, we entered into a director’s agreement with Richard M. Cohen, which agreement was effective with his election to the Board. Under the terms of that agreement Mr. Cohen commencing on the closing of the offering will be paid an annual retainer of $24,000 for serving as a director (with $2,000 payable at the beginning of each month). In addition, pursuant to the 2010 Plan Mr. Cohen was granted 30,000 shares of restricted two-thirds of which are subject to restrictions on transfer and to forfeiture, with the restrictions lapsing as to one-third of the shares, on the first anniversary of the date of grant, and as to one-third, on the second anniversary of the date of grant in the event Mr. Cohen continues to be a director on those dates. In addition, the Company will reimburse the director for pre-approved reasonable business-related expenses incurred in good faith in the performance of the director’s duties for the Company.
Except as set forth above as of the date of this prospectus, (other than those covered by the over-allotment option described below), if anywe have no formal or informal arrangements or agreements to compensate our directors for services they provide as directors. We plan to implement a compensation program for our independent directors, as and when they are purchased.appointed, which we anticipate will include such elements as an annual retainer, meeting attendance fees and stock options. The underwriting agreement providesdetails of that the obligationscompensation program will be negotiated with each independent director.
None of the underwritersdirectors of Foshan, our PRC-based operating company, are presently being compensated for their service as directors.
Li Jun, our director, is an officer and controlling stockholder of United Best, our foreign advisor. See section entitled “Certain Relationships and Related Transactions” beginning on page 80.
Additional Narrative Disclosure
We have no plans that provide for the payment of retirement benefits, or benefits that will be paid primarily following retirement, including, but not limited to, paytax qualified defined benefit plans, supplemental executive retirement plans, tax qualified defined contribution plans and non-qualified defined contribution plans.
There are no contracts agreements, plans or arrangements, whether written or oral, that provide for payment to a named executive officer at, following, or in connection with the resignation, retirement or other termination of a named executive officer or a change in control or the company or a change in the executive officers responsibilities following a change in control, with respect to each named executive officer.
CERTAIN RELATIONSHIPS AND RELATED TRANSACTIONS
Except as set forth below, since October 1, 2007, the Company was not a party to any transaction (where the amount involved exceeded the lesser of $120,000 or 1% of the average of our assets for the last two fiscal years) in which an director, executive officer, holder of more than five percent of our common stock, or any member of the immediate family of any such person have or will have a direct or indirect material interest and accept deliveryno such transactions are currently proposed.
Primary Capital is a beneficial owner of more than 5% of our common stock. Mr. Bickel is also the President of Primary Capital. Chris Bickel is a director of our company serving as a designee of Primary Capital.
Primary Capital provided financial services in connection with the private placement and reverse merger which closed on February 12, 2010. The services provided and to be provided by Primary Capital include the following:
| · | assisting the Company in preparing a detailed business plan, financial model and power point presentation; |
| · | negotiating and structuring the reverse merger; |
| · | acting as placement agent for the February 12, 2010 note financing; |
| · | recommending to the Company a qualified auditor, securities attorney and investor relations firm, and assisting the Company with negotiating the terms of their respective engagements; |
| · | advising the Company on strategies to increase shareholder value; |
| · | assisting the Company and its investor relations firm in organizing, and participating with the Company in, investor road shows and investor conference calls; |
| · | recommending investor conferences in the US and Europe to be attended by the Company and a representative of Primary Capital; |
| · | identifying strategic relationships and joint venture partners; |
| · | identifying and recommending persons to serve on the Company’s Board of Directors; |
| · | identifying and rendering advice regarding potential acquisitions, including the valuation of the acquisition and financing for the acquisition; |
| · | assisting the Company in connection with its listing on a U.S. stock exchange; |
| · | reviewing and commenting on the Company’s SEC filings associated with the Company’s transactions; and |
| · | advising Company regarding its obligations as a U.S. public company. |
United Best assisted the Company with negotiations with service contractors and assisted the Company with on-going communications and coordinating the relationships with service contractors during the listing process.
Under the terms of a financial services agreement between Primary Capital and the company, Primary Capital was paid a commission of $202,000 at the closing of the February 2010 private financing. Primary Capital is also owed an additional $75,000 for services rendered in connection with the private placement. Primary Capital is also entitled to receive $15,000 on completion of the offering and $15,000 for the next succeeding seven calendar quarters for an aggregate amount of $120,000.
At the closing of the private financing, Primary Capital received 290,755 shares of our common stock which shares are being registered in the resale prospectus. Primary is also entitled to receive 265,186 shares of common stock on the closing of this offering.
In addition, for providing these financial services Primary Capital is entitled to receive, on conversion of the notes issued to the investors in the February 2010 private placement (which occurs upon consummation of this offering), a five-year warrant to purchase 98,571 shares of common stock (which number is equal to 5% of the 1,971,429 number of shares of common stock issued to the noteholders on conversion), exercisable at $2.10 (which equals the price at which the notes converted and assumes an initial public offering price of $6.00 per share). Unlike the investor warrants, these warrants will not terminate but instead become exercisable upon conversion of the notes and consummation of this offering. The shares underlying these warrants are being registered in the resale prospectus. If the note conversion does not occur, Primary Capital will receive a five-year warrant to purchase that number of shares of common stock equal to 5% of the common stock are subjectunderlying the warrants issued to the passing upon certain legal matters by counsel and certain conditions such as confirmation ofinvestors in the accuracy of representations and warranties by us about our financial condition and operations and other matters.
Commissions and Discounts
The following table showsprivate financing exercisable at the underwriting fees to be paid to the underwriters in connection with this offering. These amountssame price at which those investor warrants are shown assuming both no exercise and full exercise of the over-allotment option.
| | No
Exercise
| | | Full
Exercise
| |
Per share | | $ | | | | $ | | |
Total | | $ | | | | $ | | |
exercisable.
Li Jun is a director and is a beneficial owner of more than 5% of our common stock. Mr. Li is an officer and controlling stockholder of United Best, our foreign advisor, provided financial services in connection with the private financing. United Best is listed as a selling stockholder in the resale prospectus. Newise Holdings, a company also controlled by Li Jun, is also listed as a selling stockholder in the resale prospectus.
Under the terms of a consulting agreement between United Best and the company, United Best was paid a commission of $202,000 at the closing of the financing. United Best is also owed an additional $75,000 for services rendered in connection with the financing. Additionally, under the consulting agreement, as amended, United Best is entitled to be paid fee on completion of this offering a success of $750,000 (which represents 3% of the $25,000,000 in gross proceeds received by us in connection with the underwritten offering, assuming an initial public offering price of $6.00 per share).
At the closing of the private financing, United Best received 362,755 shares of our common stock for their services. United Best is also entitled to receive an additional 193,186 shares on closing of this offering. 32,857of these particular shares held by United Best are being registered in the resale prospectus.
In addition, as partial consideration for providing these financial services, United Best is entitled to receive, on conversion of the notes issued to the investors in the February 2010 private placement (which occurs upon consummation of this offering), a five-year warrant to purchase 98,571 shares of common stock (which represents 5% of the number of common stock issued to the note holders on conversion), exercisable at the price of $2.10 per share (i.e. the price at which the notes converted based on the assumed initial public offering price of $6.00 per share). Unlike the investor warrants, these warrants will not terminate but instead become exercisable on conversion of the notes and consummation of this offering. The shares underlying these warrants are being registered in the resale prospectus. If the note conversion does not occur, United Best will receive a feefive-year warrant to purchase that number of $ ($ ifshares of common stock equal to 5% of the over-allotment option is exercised in full), which is in additioncommon stock underlying the warrants issued to the underwriting discounts and commissionsinvestors in the above table. We estimate that the total fees and expenses payable by us, excluding underwriting discounts and commissions, and the fee payable to United Best will be approximately million.
Pricing of Securities
The underwriters have advised us that they propose to offer the shares to the public at $ per share. The underwriters propose to offer the shares to certain dealersprivate financing exercisable at the same price less a concessionat which those investor warrants are exercisable.
For additional information about the nature of not more than $ per share. The underwriters may allow,the services provided to the company by each of Primary Capital and the dealers may reallow, a concessionUnited Best under their respective agreements, reference is make to “Additional Disclosure Regarding Conversion of not more than $ per shareNotes and Exercise of Warrants - Financial Services Agreements and Related Warrants” beginning on sales to certain other brokers and dealers. After this offering, these figures may be changed by the underwriters.page 65.
Over-allotment OptionOn February 12, 2010, we entered into a share exchange agreement with the owners of all of the outstanding shares of Hong Hui. Under the terms of the share exchange agreement we issued and delivered to the Hong Hui stockholders a total of 14,510,204 shares of our common stock in exchange for all of the outstanding shares of Hong Hui. As shareholders of Hong Hui, (i) Bestyield Group, a company controlled by Mr. Li, our chief executive officer, received 4,353,061 shares, (ii) Proudlead, a company controlled by Mr. Law, our president of sales and a director, received 4,353,061 shares and (iii) Newise Holdings, a company controlled by Mr. Li Jun one of our directors received 2,321,633 shares.
Under a limited recourse guaranty agreement dated as of February 12, 2010, Bestyield Group and Proudlead agreed to guaranty the underwriters an over-allotment option. This option, whichcompany’s obligations under the notes issued in the February 2010 private placement. That guaranty is exercisable for up to 45 days aftersecured by a pledge of the date of this prospectus, permits the underwriters to purchase a maximum of additional8,706,122 shares of common stock from usreceived by them in the reverse merger
In each of June 2007 and in February 2008 and May 2008, Joseph Nemelka, a former officer and director, advanced funds to cover over-allotments. If the underwriters exercisecompany in the total aggregate amount of $15,000. The advances were due on demand and bore interest at 8% per annum. This indebtedness was forgiven in February 2010 prior to the reverse merger. In addition, Mr. Nemelka purchased a convertible promissory note in the aggregate principal amount of $100,000 in the February private placement.
Our board of directors is charged with reviewing and approving all potential related party transactions. All such related party transactions must then be reported under applicable SEC rules. We have not adopted other procedures for review, or partstandards for approval, of such transactions, but instead review them on a case-by-case basis.
Except for the foregoing, no executive officer, director or any member of these individuals’ immediate families, any corporation or organization with whom any of these individuals is an affiliate or any trust or estate in which any of these individuals serve as a trustee or in a similar capacity or has a substantial beneficial interest in is or has been indebted to the Company at any time since the beginning of the Company’s last fiscal year.
DESCRIPTION OF SECURITIES
The following is a summary description of our capital stock and certain provisions of our certificate of incorporation and by-laws, copies of which have been filed as exhibits to this option, they will purchaseprospectus. The following discussion is qualified in its entirety by reference to such exhibits.
General
We are authorized to issue 200,000,000 shares of common stock, covered bypar value $.001 per share, and 10,000,000 shares of blank-check preferred stock, par value $.001 per share.
Immediately following the option at the public offering price that appears on the cover pageclosing of this prospectus, less the same underwriting discount as set forth above. The underwriters have severally agreed that to the extent the over-allotment option is exercised they will each purchase a number of additionaloffering, 21,862,183 shares of common stock proportionatewill be issued and outstanding (excluding shares issuable upon exercise of the over-allotment option). In addition, 197,142 shares may be purchased upon the exercise of placement agent warrants, 208,333 shares may be purchased upon the exercise of underwriter’s warrants and 400,000 shares are issuable on exercise of outstanding options.
Common Stock
Each share of our common stock has one vote on all matters including election of directors, without provision for cumulative voting. The common stock is not redeemable and has no conversion or preemptive rights. In the event we are liquidated, the holders of common stock will share equally in any balance of our assets available for distribution to them after satisfaction of creditors and preferred shareholders. The holders of our common stock are entitled to equal dividends and distributions per share with respect to the underwriter's initial amount reflectedcommon stock when, as, and if declared by the board of directors from funds legally available.
Preferred Stock
In addition to the 200,000,000 shares of common stock, we are authorized to issue 10,000,000 shares of preferred stock. Shares of our preferred stock may be issued from time to time in one or more classes or series, each of which class or series shall have such distinctive designation or title as shall be fixed by the table above.board of directors prior to the issuance of any shares thereof.
The issuance of shares of preferred stock, or the issuance of rights to purchase such shares, could be used to discourage an unsolicited acquisition proposal. For instance, the issuance of a series of preferred stock might impede a business combination by including class voting rights that would enable the holder to block such a transaction, or facilitate a business combination by including voting rights that would provide a required percentage vote of the stockholders. In addition, under certain circumstances, the issuance of preferred stock could adversely affect the voting power of the holders of the common stock. Although the board of directors is required to make any determination to issue such stock based on its judgment as to the best interests of our stockholders, the board of directors could act in a manner that would discourage an acquisition attempt or other transaction that some, or a majority, of the stockholders might believe to be in their best interests or in which stockholders might receive a premium for their stock over the then market price of such stock. The board of directors does not at present intend to seek stockholder approval prior to any issuance of currently authorized preferred stock, unless otherwise required by law.
Notes and Warrants
On February 12, 2010, immediately following the closing of the share exchange agreement, we entered into a note purchase agreement with certain accredited investors for the sale of convertible notes, in the aggregate principal amount of $4,140,000, and warrants (which are exercisable only in certain events). The closing of the sale of the notes and warrants occurred on February 12, 2010. The terms of the notes and warrants is set forth below. The note purchase agreement contains representations, warranties and covenants which are customary for transactions of this nature.
The notes have the following material terms:
Maturity: The notes mature after one year. If principal is not paid on maturity then 150% of the principal amount shall be payable.
Interest: 10% per annum payable quarterly increasing to 15% if there is a default. $204,464 out of the closing proceeds is being held in escrow to cover most of the first six months interest.
Conversion: In the event of the closing of this offering, $4,140,000 aggregate principal amount of the notes outstanding converts automatically into 1,971,429 shares of common stock at a conversion price of $2.10 per share (which represents a 65% discount to the assumed offering price of $6.00 per share).
The warrants have the following material terms:
Exercisable: The warrants will become void if the notes automatically convert into common stock (which will be the case if the offering contemplated by this prospectus closes). The warrants are exercisable at any time during a five-year period commencing on the closing of a “financing,” which means the first sale (or series of related sales) by us of stock (or debt or equity securities convertible into stock), in a capital raising transaction, occurring after the maturity date (or the date the notes become due pursuant to a default, if earlier) with aggregate gross proceeds of at least $2,000,000. The warrants cannot be exercised if no financing is consummated within a five-year period after the issue date.
Number of Shares: The warrants represent the right to purchase 8% of the total number of shares of common stock outstanding (on a fully-diluted basis) immediately after the closing of the “financing.”
Exercise Price: The warrants are exercisable at the price for which the shares of common stock (or common stock equivalent if derivative securities are sold) are sold in the financing. If the financing includes more than one type of security, the exercise price shall equal the lowest price per share of common stock or common stock equivalent included in the financing.
Underwriter’s Warrants
We have also agreed to issue to Brean Murray, Carret & Co., LLC, and/or its designees, as a warrant to purchase a number of shares of common stock equal to an aggregate of 5% of the shares of common stock sold in the offering, excluding over-allotments, if any. The warrant will have an exercise price equal to 125% of the offering price of the shares of common stock sold in this offering and be exercisable for four years commencing one year after the effective date of the registration statement. Pursuant to the rules of the Financial Industry Regulatory, Authority, Inc., or FINRA (formerly the NASD), and in particular Rule 5110, the warrant (and underlying shares) issued to Brean Murray, Carret & Co., LLC, may not be sold, transferred, assigned, pledged, or hypothecated, or be the subject of any hedging, short sale, derivative, put or call transaction that would result in the effective disposition of the securities by any person for a period of 180 days immediately following the date of delivery and payment for the shares offered; provided, however, that the warrant (and underlying shares) may be transferred to officers or partners of the representatives and members of the underwriting syndicate and their officers or partners as long as the warrant (and underlying shares) remain subject to the lockup.
Financials Advisor Warrants
For a description of the warrants issued to the financials advisors in connection with the private placement, see the section above entitled “Certain Relationships and Related Transactions,” beginning on page 80.
Exchange Listing
We have applied for listing of our common stock on the NASDAQ Capital Market under the symbol “SLPC.”
Recent Stockholder Actions
On February 12, 2010, immediately prior to the closing of the share exchange agreement, shareholders holding 2,528,000 of the 2,600,000 shares of our then outstanding common stock agreed to surrender their shares for cancellation in payment by Joe Nemelka of an aggregate amount of $40,000, pursuant to stock purchase agreements entered into between Joe Nemelka and each such holder. Under the share exchange agreement we issued an aggregate of 14,510,204 shares of common stock to the stockholders of Hong Hui. In addition, immediately following the closing of the share exchange agreement we issued 362,755 and 290,755 shares of our common stock to United Best and Primary Capital, respectively, as a transaction fee in connection with the closing of the private financing. In addition there are 72,000 shares held by 210 round lot shareholders. Accordingly, as of February 12, 2010 following the closing of all of these transactions there were 15,235,714 shares of common stock issued and outstanding.
As more fully described in an Information Statement on Schedule 14C (which was mailed to our stockholders on March 3, 2010) on February 12, 2010 the board of directors and the holders of majority of our outstanding shares entitled to vote thereon approved the change the name of the Company to China Filtration Technology, Inc. and 1-for-5 reverse stock split of our shares of common stock.
These corporate actions became effective on the filing with the Secretary of State of Delaware of a certificate of amendment to our certificate of incorporation which was filed on March 24, 2010.
On June 1, 2010 the corporate name was changed to China SLP Filtration Technology, Inc.
MATERIAL UNITED STATES FEDERAL INCOME TAX CONSIDERATIONS
General
The following is a general summary of certain material U.S. federal income tax consequences to an investor of the acquisition, ownership and disposition of our common stock purchased by an investor pursuant to this offering. As used in this discussion, “we”, “our” and “us” refers to China SLP Filtration Technology, Inc. This discussion applies only to investors that will hold each share of our common stock issued and purchased pursuant to this offering as a “capital asset” (generally, property held for investment) within the meaning of Section 1221 of the Internal Revenue Code of 1986, as amended (the “Code”). This discussion does not address all aspects of U.S. federal income taxation that may be relevant to an investor in light of that investor’s particular circumstances. In addition, this discussion does not address (a) U.S. federal non-income tax laws, such as estate or gift tax laws, (b) state, local or non-U.S. tax consequences, or (c) the special tax rules that may apply to certain investors, including, without limitation, banks, insurance companies, financial institutions, broker-dealers, taxpayers that have elected mark-to-market accounting, taxpayers subject to the alternative minimum tax provisions of the Code, tax-exempt entities, governments or agencies or instrumentalities thereof, regulated investment companies, real estate investment trusts, U.S. persons whose functional currency is not the U.S. dollar, certain former U.S. citizens or long-term residents of the United States, or investors that acquire, hold, or dispose of our common stock as part of a straddle, hedge, wash sale, constructive sale or conversion transaction or other integrated transaction. Additionally, this discussion does not consider the tax treatment of entities treated as partnerships or other pass-through entities for U.S. federal income tax purposes or of persons who hold our common stock through such entities. The tax treatment of a partnership and each partner thereof will generally depend upon the status and activities of the partnership and such partner. Thus, partnerships, other pass-through entities (and partners in such partnerships or owners of such other pass-through entities) should consult their own tax advisors.
This discussion is based on current provisions of the Code, its legislative history, U.S. Treasury regulations promulgated under the Code, judicial opinions, and published rulings and procedures of the U.S. Internal Revenue Service (“IRS”), all as in effect on the date of this prospectus. These authorities are subject to differing interpretations or to change, possibly with retroactive effect. We have not sought, and will not seek, any ruling from the IRS or any opinion of counsel with respect to the tax consequences discussed below, and there can be no assurance that the IRS will not take a position contrary to the tax consequences discussed below or that any position taken by the IRS would not be sustained.
As used in this discussion, the term “U.S. person” means a person that is, for U.S. federal income tax purposes, (i) an individual citizen or resident of the United States, (ii) a corporation (or other entity treated as a corporation for U.S. federal income tax purposes) created or organized (or treated as created or organized) in or under the laws of the United States or of any state thereof or the District of Columbia, (iii) an estate the income of which is subject to U.S. federal income taxation regardless of its source, or (iv) a trust if (A) a court within the United States is able to exercise primary supervision over the administration of the trust and one or more U.S. persons have the authority to control all substantial decisions of the trust, or (B) it has in effect a valid election to be treated as a U.S. person under applicable U.S. Treasury regulations. As used in this discussion, the term “U.S. holder” means a beneficial owner of our common stock that is a U.S. person, and the term “non-U.S. holder” means a beneficial owner of our common stock (other than an entity that is treated as a partnership or other pass-through entity for U.S. federal income tax purposes) that is not a U.S. person.
THIS DISCUSSION IS ONLY A SUMMARY OF CERTAIN MATERIAL U.S. FEDERAL INCOME TAX CONSEQUENCES OF THE ACQUISITION, OWNERSHIP AND DISPOSITION OF OUR COMMON STOCK. IT IS NOT TAX ADVICE. EACH PROSPECTIVE INVESTOR IN OUR COMMON STOCK SHOULD CONSULT ITS OWN TAX ADVISOR WITH RESPECT TO THE PARTICULAR TAX CONSEQUENCES TO SUCH INVESTOR OF THE ACQUISITION, OWNERSHIP AND DISPOSITION OF OUR COMMON STOCK, INCLUDING THE APPLICABILITY AND EFFECT OF ANY STATE, LOCAL, AND NON-U.S. TAX LAWS, AS WELL AS U.S. FEDERAL TAX LAWS, AND ANY APPLICABLE TAX TREATY.
U.S. Holders
Taxation of Distributions
A U.S. holder will be required to include in gross income as ordinary income the amount of any dividend paid on the shares of our common stock. A distribution on such shares will be treated as a dividend for U.S. federal income tax purposes to the extent paid from our current or accumulated earnings and profits, as determined under U.S. federal income tax principles. Distributions in excess of current and accumulated earnings and profits will constitute a return of capital that will be applied against and reduce (but not below zero) the U.S. holder’s adjusted tax basis in our common stock. Any remaining excess will be treated as gain from the sale or other taxable disposition of the common stock and will be treated as described under “Gain or Loss on Sale, Taxable Exchange or Other Taxable Disposition of Common Stock” below.
Any dividends we pay to a U.S. holder that is treated as a taxable corporation for U.S. federal income tax purposes generally will qualify for the dividends-received deduction if the applicable holding period and other requirements are satisfied. With certain exceptions, if the applicable holding period and other requirements are satisfied, dividends we pay to a non-corporate U.S. holder will constitute “qualified dividends” that will be subject to tax at the maximum tax rate accorded to long-term capital gains for tax years beginning on or before December 31, 2010, after which the tax rate applicable to dividends is scheduled to return to the tax rate applicable to ordinary income.
If PRC taxes apply to any dividends paid to a U.S. holder on our common stock, such taxes may be treated as foreign taxes eligible for credit against such holder’s U.S. federal income tax liability (subject to certain limitations), and such U.S. holder may be entitled to certain benefits under the income tax treaty between the United States and the PRC. U.S. holders should consult their own tax advisors regarding the creditability of any such PRC tax and their eligibility for the benefits of the income tax treaty between the United States and the PRC.
Gain or Loss on Sale, Taxable Exchange or Other Taxable Disposition of Common Stock
In general, a U.S. holder must treat any gain or loss recognized upon a sale, taxable exchange, or other taxable disposition of our common stock as capital gain or loss. Any such capital gain or loss will be long-term capital gain or loss if the U.S. holder’s holding period for the common stock so disposed of exceeds one year, and otherwise as short-term capital gain or loss. In general, a U.S. holder will recognize gain or loss in an amount equal to the difference between (i) the sum of the amount of cash and the fair market value of any property received in such disposition and (ii) the U.S. holder’s adjusted tax basis in the common stock so disposed of. Long-term capital gain recognized by a non-corporate U.S. holder will generally be subject to a maximum tax rate of 15 percent for tax years beginning on or before December 31, 2010, after which the maximum long-term capital gains tax rate is scheduled to increase to 20 percent. The deduction of capital losses is subject to various limitations.
If PRC taxes apply to any gain from the disposition of our common stock by a U.S. holder, such taxes may be treated as foreign taxes eligible for credit against such holder’s U.S. federal income tax liability (subject to certain limitations), and such U.S. holder may be entitled to certain benefits under the income tax treaty between the United States and the PRC. U.S. holders should consult their own tax advisors regarding the creditability of any such PRC tax and their eligibility for the benefits of the income tax treaty between the United States and the PRC.
New Legislation Regarding Medicare Tax
For taxable years beginning after December 31, 2012, certain U.S. holders that are individuals, estates or trusts will be subject to a 3.8% tax on all or a portion of their "net investment income," which may include all or a portion of their dividends and net gains from the sale or other disposition of our common stock. If you are a U.S. holder that is an individual, estate or trust, you should consult your tax advisor regarding the applicability of the Medicare tax to your income and gains in respect of your investment in our common stock.
Non-U.S. Holders
Taxation of Distributions
In general, any distribution we make to a non-U.S. holder, to the extent paid out of our current or accumulated earnings and profits (as determined under U.S. federal income tax principles), will constitute a dividend for U.S. federal income tax purposes. Unless we are treated as an “80/20 company” for U.S. federal income tax purposes, as described below, any dividend paid to a non-U.S. holder with respect to shares of our common stock that is not effectively connected with the non-U.S. holder’s conduct of a trade or business within the United States, as described below, generally will be subject to U.S. federal withholding tax at a rate of 30 percent of the gross amount of the dividend, unless such non-U.S. holder is eligible for a reduced rate of withholding tax under an applicable income tax treaty and provides proper certification of its eligibility for such reduced rate (usually on an IRS Form W-8BEN). Any distribution not constituting a dividend will be treated first as reducing the non-U.S. holder’s adjusted tax basis in its shares of our common stock (but not below zero) and, to the extent such distribution exceeds the non-U.S. holder’s adjusted tax basis, as gain from the sale or other taxable disposition of the common stock, which will be treated as described under “Gain on Sale, Taxable Exchange or Other Taxable Disposition of Common Stock” below.
There is a possibility that we may qualify as an “80/20 company” for U.S. federal income tax purposes. In general, a U.S. corporation is an 80/20 company if at least 80 percent of its gross income earned directly or from subsidiaries during an applicable testing period is “active foreign business income.” The 80 percent test is applied on a periodic basis. If we qualify as an 80/20 company, a percentage of any dividend paid by us generally will not be subject to U.S. federal withholding tax. You should consult with your own tax advisors regarding the amount of any such dividend subject to withholding tax in this circumstance. It should also be noted that there are currently legislative proposals to amend the rules pertaining to 80/20 companies.
Dividends we pay to a non-U.S. holder that are effectively connected with such non-U.S. holder’s conduct of a trade or business within the United States (and, if certain income tax treaties apply, are attributable to a U.S. permanent establishment or fixed base maintained by the non-U.S. holder) generally will not be subject to U.S. withholding tax, provided such non-U.S. holder complies with certain certification and disclosure requirements (usually by providing an IRS Form W-8ECI). Instead, such dividends generally will be subject to U.S. federal income tax, net of certain deductions, at the same graduated individual or corporate tax rates applicable to U.S. persons. If the non-U.S. holder is a corporation, dividends that are effectively connected income may also be subject to a “branch profits tax” at a rate of 30 percent (or such lower rate as may be specified by an applicable income tax treaty).
Gain on Sale, Taxable Exchange or Other Taxable Disposition of Common Stock
A non-U.S. holder generally will not be subject to U.S. federal income tax in respect of gain recognized on a sale, exchange or other disposition of common stock, unless:
| · | the gain is effectively connected with the conduct of a trade or business by the non-U.S. holder within the United States (and, under certain income tax treaties, is attributable to a U.S. permanent establishment or fixed base maintained by the non-U.S. holder); |
| · | the non-U.S. holder is an individual who is present in the United States for 183 days or more in the taxable year of disposition and certain other conditions are met, and is not eligible for relief under an applicable income tax treaty; or |
| · | we are or have been a “United States real property holding corporation” (“USRPHC”) for U.S. federal income tax purposes at any time during the shorter of the five year period ending on the date of disposition or the non-U.S. holder’s holding period for the common stock disposed of, and, generally, in the case where our common stock is regularly traded on an established securities market, the non-U.S. holder has owned, directly or indirectly, more than 5 percent of the common stock disposed of, at any time during the shorter of the five year period ending on the date of disposition or the non-U.S. holder’s holding period for the common stock disposed of. |
There can be no assurance that our common stock will be treated as regularly traded on an established securities market for this purpose.
Unless an applicable tax treaty provides otherwise, gain described in the first and third bullet points above generally will be subject to U.S. federal income tax, net of certain deductions, at the same graduated tax rates applicable to U.S. persons. Any gains described in the first bullet point above of a non-U.S. holder that is a foreign corporation may also be subject to an additional “branch profits tax” at a 30 percent rate (or a lower applicable tax treaty rate). Any U.S. source capital gain of a non-U.S. holder described in the second bullet point above (which may be offset by U.S. source capital losses during the taxable year of the disposition) generally will be subject to a flat 30 percent U.S. federal income tax (or a lower applicable tax treaty rate).
In connection with the third bullet point above, we generally will be classified as a USRPHC if the fair market value of our “United States real property interests” equals or exceeds 50 percent of the sum of the fair market value of our worldwide real property interests plus our other assets used or held for use in a trade or business, as determined for U.S. federal income tax purposes. We believe that we currently are not a USRPHC, and we do not anticipate becoming a USRPHC (although no assurance can be given that we will not become a USRPHC in the future).
Information Reporting and Backup Withholding
Other than with respect to U.S. holders who are “exempt recipients,” we generally must report annually to the IRS and to each holder the amount of dividends and certain other distributions we pay to such holder on our common stock and the amount of tax, if any, withheld with respect to those distributions. In the case of a non-U.S. holder, copies of the information returns reporting those distributions and withholding may also be made available to the tax authorities in the country in which the non-U.S. holder is a resident under the provisions of an applicable income tax treaty or agreement. Information reporting is also generally required with respect to proceeds from the sales and other dispositions of our common stock to or through the U.S. office (and in certain cases, the foreign office) of a broker.
In addition, backup withholding of U.S. federal income tax, currently at a rate of 28 percent, generally will apply to distributions made on our common stock to, and the proceeds from sales and other dispositions of our common stock by, a non-corporate U.S. holder who:
| · | fails to provide an accurate taxpayer identification number; |
| · | is notified by the IRS that backup withholding is required; or |
| · | in certain circumstances, fails to comply with applicable certification requirements. |
A non-U.S. holder generally may eliminate the requirement for information reporting (other than with respect to distributions, as described above) and backup withholding by providing certification of its foreign status, under penalties of perjury, on a duly executed applicable IRS Form W-8 or by otherwise establishing an exemption.
Backup withholding is not an additional tax. Rather, the amount of any backup withholding will be allowed as a credit against a U.S. holder’s or a non-U.S. holder’s U.S. federal income tax liability and may entitle such holder to a refund, provided that certain required information is timely furnished to the IRS. Holders are urged to consult their own tax advisors regarding the application of backup withholding and the availability of and procedure for obtaining an exemption from backup withholding in their particular circumstances.
Recently Enacted Legislation Relating to Foreign Accounts
On March 18, 2010, the President signed the Hiring Incentives to Restore Employment Act into law. Effective for payments made after December 31, 2012, this law imposes a 30% U.S. federal withholding tax on distributions and the gross proceeds of sale in respect of our shares of common stock to a foreign financial institution or non-financial foreign entity, unless (i) in the case of a foreign financial institution, such institution enters into an agreement with the U.S. government to withhold on certain payments and to collect and provide to the U.S. tax authorities substantial information regarding U.S. account holders of such institution (which includes certain equity and debt holders of such institution, as well as certain account holders that are foreign entities with U.S. owners) and to withhold on certain payments and (ii) in the case of a non-financial foreign entity, such entity provides the withholding agent with a certification identifying the direct and indirect U.S. owners of the entity. Under certain circumstances, a non-U.S. shareholder might be eligible for refunds or credits of such taxes. Prospective investors should consult with their own tax advisor regarding the possible implications of this recently enacted legislation on the ownership and disposition of our common stock.
MATERIAL PRC INCOME TAX CONSIDERATIONS
The following discussion summarizes the material PRC income tax considerations relating to the ownership of our common stock following the consummation of this offering.
Resident Enterprise Treatment
Under Enterprise Income Tax Law of the PRC (“EIT Law”) that became effective on January 1, 2008, enterprises are classified as “resident enterprises” and “non-resident enterprises.” Enterprises established outside of China whose “de facto management bodies” are located in China are considered PRC “tax resident enterprises” and will generally be subject to the uniform 25% PRC enterprise income tax rate on their global income. In addition, a tax circular issued by the State Administration of Taxation on April 22, 2009 regarding the standards used to classify certain Chinese-invested enterprises established outside of China as “resident enterprises” clarified that dividends and other income paid by such “resident enterprises” will be considered to be PRC source income, subject to PRC withholding tax, currently at a rate of 10%, when recognized by non-PRC enterprise shareholders. This recent circular also subjects such “resident enterprises” to various reporting requirements with the PRC tax authorities. Under the implementation rules to the Enterprise Income Tax Law, a “de facto management body” is defined as a body that has material and overall management and control over the manufacturing and business operations, personnel and human resources, finances and other assets of an enterprise. In addition, the tax circular mentioned above details that certain Chinese-invested enterprises will be classified as “resident enterprises” if the following are located or resident in China: senior management personnel and departments that are responsible for daily production, operation and management; financial and personnel decision making bodies; key properties, accounting books, company seal, and minutes of board meetings and shareholders’ meetings; and half or more of the senior management or directors having voting rights.
Given the short history of the EIT Law and lack of applicable legal precedent, it remains unclear how the PRC tax authorities will determine the PRC tax resident treatment of a non-PRC company such as us. Our management is substantially based in the PRC and expected to be based in the PRC in the future, although two of our executive officers and one of our directors are not PRC nationals. If the PRC tax authorities determine that we are a “resident enterprise” for PRC enterprise income tax purposes, a number of unfavorable tax consequences could follow. First, we could be subject to the enterprise income tax at a rate of 25% on our global taxable income, as well as PRC enterprise tax reporting obligations. Second, although under the New EIT Law and its implementing rules dividends paid to us from our PRC subsidiary would qualify as “tax-exempted income”, we cannot assure you that such dividends will not be subject to a 10% withholding tax, as the PRC foreign exchange control authorities, which enforce the withholding tax, have not yet issued guidance with respect to the processing of outbound remittances to entities that are treated as resident enterprises for PRC EIT purposes. Finally, it is possible that future guidance issued with respect to the new “resident enterprise” classification could result in a situation in which a withholding tax of 10% for our non-PRC enterprise shareholders or a potential withholding tax of 20% for non-PRC individual shareholders is imposed on dividends we pay to them and with respect to gains derived by our non-PRC shareholders from transferring our shares. In addition to the uncertainty in how the new “resident enterprise” classification could apply, it is also possible that the rules may change in the future, possibly with retroactive effect. We are actively monitoring the “resident enterprise” classification rules and are evaluating appropriate organization changes to avoid this treatment, to the extent possible.
As of the date of this prospectus, there has not been a definitive determination as to the “resident enterprise” or “non-resident enterprise” status of us. However, since it is not anticipated that we would receive dividends or generate other income in the near future, we are not expected to have any income that would be subject to the 25% enterprise income tax on global income in the near future. We will consult with the PRC tax authorities and make any necessary tax payment if we (based on future clarifying guidance issued by the PRC), or the PRC tax authorities, determine that we are a resident enterprise under the EIT Law, and if we were to have income in the future.
Dividends From PRC Operating Companies
If we are not treated as resident enterprises under the EIT Law, then dividends that we receive may be subject to PRC withholding tax. The EIT Law and the implementing rules of the EIT Law provide that (A) an income tax rate of 25% will normally be applicable to investors that are “non-resident enterprises,” or non-resident investors, which (i) have establishments or premises of business inside the PRC, and (ii) the income in connection with their establishment or premises of business is sourced from the PRC or the income is earned outside the PRC but has actual connection with their establishments or places of business inside the PRC, and (B) an income tax rate of 10% will normally be applicable to dividends payable to investors that are “non-resident enterprises,” or non-resident investors, which (i) do not have an establishment or place of business in the PRC or (ii) have an establishment or place of business in the PRC, but the relevant income is not effectively connected with the establishment or place of business, to the extent such dividends are derived from sources within the PRC.
As described above, the PRC tax authorities may determine the resident enterprise status of entities organized under the laws of foreign jurisdictions, on a case-by-case basis. We are a holding company and substantially all of our income may be derived from dividends. Thus, if we are considered as a “non-resident enterprise” under the EIT Law and the dividends paid to us are considered income sourced within the PRC, such dividends received may be subject to the income tax described in the foregoing paragraph.
As of the date of this prospectus, there has not been a definitive determination as to the “resident enterprise” or “non-resident enterprise” status of us. As indicated above, however, we are not expected to be paid any dividends in the near future. We will consult with the PRC tax authorities and make any necessary tax withholding if, in the future, we were to be paid any dividends and we (based on future clarifying guidance issued by the PRC), or the PRC tax authorities, determine that we are a non-resident enterprise under the EIT Law.
Dividends that Non-PRC Resident Investors Receive From Us; Gain on the Sale or Transfer of Our Common Stock
If dividends payable to (or gains recognized by) our non-resident investors are treated as income derived from sources within the PRC, then the dividends that non-resident investors receive from us and any such gain on the sale or transfer of our common stock, may be subject to taxes under PRC tax laws.
Under the EIT Law and the implementing rules of the EIT Law, PRC income tax at the rate of 10% is applicable to dividends payable to investors that are “non-resident enterprises,” or non-resident investors, which (i) do not have an establishment or place of business in the PRC or (ii) have an establishment or place of business in the PRC but the relevant income is not effectively connected with the establishment or place of business, to the extent that such dividends have their sources within the PRC. Similarly, any gain realized on the transfer of common stock by such investors is also subject to 10% PRC income tax if such gain is regarded as income derived from sources within the PRC.
The dividends paid by us to non-resident investors with respect to our common stock, or gain non-resident investors may realize from sale or the transfer of our common stock, may be treated as PRC-sourced income and, as a result, may be subject to PRC tax at a rate of 10%. In such event, we also may be required to withhold a 10% PRC tax on any dividends paid to non-resident investors. In addition, non-resident investors in our common stock may be responsible for paying PRC tax at a rate of 10% on any gain realized from the sale or transfer of our common stock after the consummation of the offering if such non-resident investors and the gain satisfy the requirements under the EIT Law and its implementing rules. However, under the EIT Law and its implementing rules, we would not have an obligation to withhold income tax in respect of the gains that non-resident investors (including U.S. investors) may realize from the sale or transfer of our common stock from and after the consummation of this offering.
If we were to pay any dividends in the future, we would again consult with the PRC tax authorities and if we (based on future clarifying guidance issued by the PRC), or the PRC tax authorities, determine that we must withhold PRC tax on any dividends payable by us under the EIT Law, we will make any necessary tax withholding on dividends payable to our non-resident investors. If non-resident investors as described under the EIT Law (including U.S. investors) realized any gain from the sale or transfer of our common stock and if such gain were considered as PRC-sourced income, such non-resident investors would be responsible for paying 10% PRC income tax on the gain from the sale or transfer of our common stock. As indicated above, under the EIT Law and its implementing rules, we would not have an obligation to withhold PRC income tax in respect of the gains that non-resident investors (including U.S. investors) may realize from the sale or transfer of our common stock from and after the consummation of this offering.
Lock-Up Agreements
In June 2010, we entered into lock-up agreements with officers and directors and beneficial owners of more than 5% of our common stock. See “Underwriting – Lock-up Agreements.”
In addition, in June 2010, we entered into lock-up agreements with the selling stockholders listed in the resale prospectus dated as of the date hereof pursuant to which the selling stockholders have agreed not to sell any of the shares of common stock for a period of 90 days following the date of the public offering.
Rule 144
Under Rule 144, a person who has beneficially owned restricted shares of our common stock or warrants for at least six months is entitled to sell his, her or its securities provided that (1) such person is not deemed to have been one of our affiliates at the time of, or at any time during the three months preceding, a sale, (2) we are subject to the Exchange Act reporting requirements for at least 90 days before the sale and (3) if the sale occurs prior to satisfaction of a one-year holding period, we provide current information at the time of sale.
Persons who have beneficially owned restricted shares of our common stock or warrants for at least six months but who are our affiliates at the time of, or at any time during the three months preceding, a sale, would be subject to additional restrictions, by which such person would be entitled to sell within any three-month period only a number of securities that does not exceed the greater of:
| · | 1% of the total number of securities of the same class then outstanding, which will equal approximately 214,038 shares immediately after this offering; or |
| · | the average weekly trading volume of such securities during the four calendar weeks preceding the filing of a notice on Form 144 with respect to such sale. |
provided, in each case, that we are subject to the Exchange Act periodic reporting requirements for at least three months before the sale.
Sales by affiliates must also comply with the manner of sale, current public information and notice provisions of Rule 144. The selling stockholders will not be governed by the foregoing restrictions when selling their shares pursuant to the resale prospectus.
As we are a former “shell” company, persons who wish to sell our securities have also to satisfy the additional requirements of Rule 144(i) which provides that those securities may be sold, subject to the other requirements of Rule 144, after one year has elapsed from the date that the issuer filed "Form 10 information" with the Commission (in our case February 12, 2011) provided that we have filed all reports and other materials required to be filed by section 13 of the Exchange Act during the preceding 12 months.
Registration Rights
Other than the registration rights set forth in (i) the registration rights agreement entered into on February 12, 2010 with the investors in the private placement under which we are obligated to register for resale all of shares issued on conversion of the notes, and (ii) the registration rights side agreement entered into on February 12, 2010 with the selling stockholders who had acquired their shares prior to the reverse merger, under which we are obligated to register for resale 52,001 shares, (iii) the agreements entered into with Primary Capital and United Best, under which we are obligated to register for resale the 653,510 shares received by Primary Capital and United Best under such agreements, (iv) oral agreements entered into with Li Jun and Ming Liu, we have no other obligation to register under the Securities Act any of our shares of common stock.
SECURITY OWNERSHIP OF CERTAIN BENEFICIAL OWNERS AND MANAGEMENT
The following table sets forth, as of the close of business on October 7, 2010, certain information with respect to the beneficial ownership of our common stock, by (i) each stockholder whom we know to own beneficially more than 5% of our common stock, (ii) each director, (iii) our chief executive officer and each other executive officer whose cash compensation for the most recent fiscal year exceeded $100,000 and (iv) all executive officers and directors as a group. The table reflects the ownership of our equity securities by the foregoing parties after the 1-for-5 reverse stock split which occurred on March 24, 2010.
Beneficial ownership is determined in accordance with the rules of the Securities and Exchange Commission, as consisting of sole or shared voting power (including the power to vote or direct the vote) and/or sole or shared investment power (including the power to dispose of or direct the disposition of) with respect to the security through any contract, arrangement, understanding, relationship or otherwise, subject to community property laws where applicable. Except as indicated below, and subject to applicable community property laws, the persons named in the table below have sole voting and investment power with respect to our common stock shown as beneficially owned by them. A shareholder is also deemed to be, as of any date, the beneficial owner of all securities that such shareholder has the right to acquire within 60 days after that date through (1) the exercise of any option, warrant or right, (2) the conversion of a security, (3) the power to revoke a trust, discretionary account or similar arrangement, or (4) the automatic termination of a trust, discretionary account or similar arrangement.
Unless otherwise indicated, the address for each listed stockholder is: c/o China SLP Filtration Technology, Inc., Shishan Industrial Park, Nanhai District, Foshan City, Guangdong Province PRC.
Name and Address of Shareholder | | Amount and Nature of Beneficial Ownership | | | Percent of Class (1) (2) | | | Amount and Nature of Beneficial Ownership | | | Percent of Class (1) (2)(3) | |
| | | | | | | | | | | | | |
| | | Before Offering | | | Before Offering | | | Post Offering | | | Post Offering | |
| Owners of More Than 5% Of Class | | | | | | | | | | | | |
| Bestyield Group Limited (4) | | | 4,353,061 | | | | 28.6 | % | | | 4,353,061 | | | | 19.91 | % |
| Proudlead Limited (5) | | | 4,353,061 | | | | 28.6 | % | | | 4,353,061 | | | | 19.91 | % |
| Li Jun (6) | | | 2,202,268 | | | | 14.33 | % | | | 2,202,268 | | | | 10.02 | % |
| Newise Holdings (6) | | | 1,547,756 | | | | 10.2 | % | | | 1,547,756 | | | | 7.08 | % |
| Pilot Link International Limited (7) | | | 1,668,673 | | | | 11 | % | | | 1,668,673 | | | | 7.63 | % |
| High Swift Limited (8) | | | 1,088,265 | | | | 7.1 | % | | | 1,088,265 | | | | 4.98 | % |
| Primary Capital, LLC (9) | | | 1,328,389 | | | | 8.6 | % | | | 1,328,389 | | | | 8.6 | % |
| | | | | | | | | | | | | | | | | |
| Directors and Executive Officers | | | | | | | | | | | | | | | | |
| Li Jie (Chief Executive Officer and a Director) (4) | | | 4,353,061 | | | | 28.6 | % | | | 4,353,061 | | | | 19.91 | % |
| Law Wawai (President of Sales and a Director) (5) | | | 4,353,061 | | | | 28.6 | % | | | 4,353,061 | | | | 19.91 | % |
| Zeng Shijun (Chief Technology Officer) | | | - | | | | - | % | | | - | | | | - | % |
| Eric Gan (Chief Financial Officer) (12) | | | - | | | | - | % | | | - | | | | - | % |
| Li Jun (Director) (6) | | | 2,202,268 | | | | 14.33 | % | | | 2,202,268 | | | | 14.33 | % |
| Richard M. Cohen (Director) (11) | | | 10,000 | | | | * | | | | 10,000 | | | | * | % |
| Chris Bickel (Director) (10) | | | - | | | | - | | | | - | | | | - | % |
| Su Lie (Director) | | | - | | | | - | | | | - | | | | - | % |
| | | | | | | | | | | | | | | | | |
| Directors and executive officers as a group (8 persons) | | | 10,918,390 | | | | 71.52 | % | | | 10,918,390 | | | | 71.52 | % |
* Less than 1%.
(1) As of the close of business on October 7, 2010, there were 15,265,714 shares of our common stock outstanding. Following the closing of this offering there will be 21,862,182 shares of common stock issued and outstanding.
(2) In determining beneficial ownership of the common stock, the number of shares shown includes shares which the beneficial owner may acquire within 60 days of October 7, 2010 upon exercise of convertible securities, warrants or options. In accordance with Rule 13d-3 in determining the percentage of common stock owned by a person on October 7, 2010 (a) the numerator is the number of shares of the class beneficially owned by such person, including shares which the beneficial owner may acquire within 60 days upon conversion or exercise of the warrants and other convertible securities, and (b) the denominator is the sum of (i) the total shares of that class outstanding on October 7, 2010, and (ii) the total number of shares that the beneficial owner may acquire upon conversion or exercise of other securities. Unless otherwise stated, each beneficial owner has sole power to vote and dispose of the shares.
(3) Following completion of the offering there will a total of 21,862,182 shares of common stock outstanding, including (i) 15,265,714 shares of common stock currently outstanding, (ii) 1,971,429 shares issuable on conversion of the notes, (iii) 4,166,667 shares to be issued in the offering, and (iv) and 193,186 shares to be issued to United Best and 265,186 shares to be issued to Primary Capital on closing of the offering.
(4) Bestyield Group is a BVI company controlled by Mr. Li Jie, our chief executive officer. Its address is PO Box 957 Offshore Incorporations Center, Road Town, Tortola, British Virgin Islands. Mr. Li has sole voting power with respect to the shares. Bestyield has guaranteed our obligations to the investors under our outstanding convertible notes issued in February 2010. All of these shares have been pledged to secure the performance of that guaranty.
(5) Proudlead is a BVI company controlled by Law Wawai, president of sales and a director. Its address is PO Box 957 Offshore Incorporations Center, Road Town, Tortola, British Virgin Islands. Mr. Law has sole voting power with respect to the shares. Proudlead has guaranteed our obligations to the investors under our outstanding convertible notes issued in February 2010. All of these shares have been pledged to secure the performance of that guaranty.
(6) Represents 1,547,756 shares held by Newise Holdings, a BVI company controlled by Li Jun, one of our directors. Its address is PO Box 957 Offshore Incorporations Center, Road Town, Tortola, British Virgin Islands. Mr. Li has sole voting and dispositive power with respect to the shares held by Newise Holdings. In addition, under the terms of an agreement between Foshan and United Best, a company controlled by Mr. Li, United Best received, as a transaction fee following the closing of the financing 362,755 shares of our common stock. On closing of this offering United Best is also entitled to receive an additional 193,186 shares of common stock and a warrant to purchase 98,571 shares at an exercise price of $2.10 per share (based on an assumed public offering price of $6.00). Mr. Li has sole voting and dispositive power with respect to the shares held by United Best. Newise and United Best are named as selling stockholders in a resale prospectus dated the date hereof.
(7) Pilot Link International is a BVI company controlled by Li Shiyi and Wei Yang, PRC residents. Its address is PO Box 957 Offshore Incorporations Center, Road Town, Tortola, British Virgin Islands. Li Shiyi and Wei Yang have shared voting and dispositive power with respect to the shares.
(8) High Swift Limited is a BVI company controlled by Han Hung Yuk, a PRC resident. Its address is PO Box 957 Offshore Incorporations Center, Road Town, Tortola, British Virgin Islands. Mr. Han has sole voting power and dispositive with respect to the shares.
(9) Primary Capital is the beneficial owner of 964,632 shares. Primary Capital received, at the closing of the share exchange agreement, 290,755 shares of common stock and on April 20, 2010 Primary Capital purchased 673,877 shares from Newise Holdings. John Leo has sole voting and dispositive power with respect to the shares held by Primary Capital. Primary Capital’s address is 80 Wall Street, 5th Floor, New York, New York 10005. On closing of this offering Primary Capital is also entitled to receive an additional 265,186 shares of common stock and a warrant to purchase 98,571 shares at an exercise price of $2.10 per share (based on an assumed public offering price of $6.00). John Leo has sole voting and dispositive power with respect to the shares held by Primary Capital. Primary Capital’s address is 80 Wall Street, 5th Floor, New York, New York 10005. Primary Capital is named as a selling shareholder in a resale prospectus dated the date hereof.
(10) Chris Bickel is President of Primary Capital. Mr. Bickel does not have voting or dispositive power over the shares held by Primary Capital. Mr. Bickel’s business address is 80 Wall Street, 5th Floor, New York, New York 10005.
(11) Richard M. Cohen is a director of the Company, and his business address is 3 Park Avenue, 16th Floor, New York, New York 10016. In June 2010, we entered into a director’s agreement with Richard M. Cohen, which agreement was effective with his election to the Board. Under the terms of that agreement Mr. Cohen on September 3, 2010 was granted 30,000 shares of restricted two-thirds of which are subject to restrictions on transfer and are subject to forfeiture, with the restrictions lapsing as to one-third of the shares on the first anniversary of the date of grant, and as to one-third on the second anniversary of the date of grant, in the event Mr. Cohen continues to be a director on those dates. This table includes the 10,000 shares which are not currently subject to forfeiture.
(12) Under his employment agreement dated August 11, 2010, Mr. Gan is to be granted an option to purchase 400,000 shares of common stock at an exercise price equal to the public offering price. The option vests and is exercisable as follows; 160,000 shares will vest and become exercisable on July 31, 2011; 120,000 shares will vest and become exercisable on July 31, 2012; 120,000 shares will vest and become exercisable on July 31, 2013. In the event that the employment is terminated within 12 months from the employment agreement date by the Company without cause, 160,000 shares shall be vested immediately on the termination date. As the option is not currently exercisable none of the shares underlying the option are included in the table.
MANAGEMENT
Executive Officers and Directors
The following table sets forth information concerning our current directors and executive officers:
Directors and Executive Officers | | Position/Title | | Age | |
| | | | | |
| Li Jie | | Chief Executive Officer and a Director | | 55 | |
| | | | | |
| Law Wawai | | President of Sales and a Director | | 45 | |
| | | | | |
| Eric Gan | | Chief Financial Officer | | 48 | |
| | | | | |
| Zeng Shijun | | Chief Technology Officer | | 48 | |
| | | | | |
| Chris Bickel | | Director | | 47 | |
| | | | | |
| Li Jun | | Director | | 47 | |
| | | | | |
| Richard M. Cohen | | Director | | 59 | |
| | | | | |
| Su Lei | | Director | | 46 | |
Except for Messrs. Chris Bickel, Richard M. Cohen and Eric Gan, all of our officers and directors are residents of the PRC. In addition, substantially all of our assets are located in the PRC. As a result, it may be difficult or impossible for you to effect service of process within the United States on our company or any of them or to enforce court judgments obtained against them in the United States courts. We have been advised by our PRC counsel that there is uncertainty as to whether the courts of the PRC would (1) recognize or enforce judgments of U.S. courts obtained against our officers or directors or the experts named in this prospectus based on the civil liability provisions of the securities laws of the U.S. or any state in the U.S., or (2) entertain original actions brought in the PRC against our officers or directors or the experts named in this prospectus based on the securities laws of the U.S. or any state in the U.S.
The following is a summary of the biographical information of our directors and officers:
Li Jie was elected director and appointed as our Chief Executive Officer on February 12, 2010. Mr. Li has served as Chief Executive Officer and Managing Director of Foshan SLP Special Materials Co., Ltd. since its inception in 2000. He also serves as Director General of the China Industrial Textile Committee. From 1980 to 2000, he served as R&D director of Dalian Synthetic Fiber Research Institute. From 2000 to 2003, he also studied for an MBA at Southwest International University. We believe that Mr. Li’s knowledge of all aspects of our business and his in-depth understanding of our operations, combined with his years of experience in the nonwovens industry, position him well to serve as our Chairman and Chief Executive Officer. Mr. Li received a bachelor’s degree in Engineering for Chemical Fiber Technique at Dalian Light Industrial School. He received a Masters degree from Chinese Academy of Social Sciences where he studied economic management. Also he studied for an MBA at Southwest International University. Mr. Li is not, and has not been within the last five years, a director of any other publicly traded company.
Law Wawai was elected as a director and appointed as President of Sales on February 12, 2010. From 1997 to February 2010, Mr. Law served as director and general manager of Nanhai Wanzhi Trading Co. From 1987 to 1997, he was sales manger Nanhai Polyester Factor. We believe that Mr. Wawai’s knowledge of all aspects of the nonwovens business and his in-depth understanding of its operations position him well to serve as a director. Mr. Law received his bachelors degree in business management from Nanhai Television University. Mr. Law is not, and has not been within the last five years, a director of any other publicly traded company.
Eric Gan was appointed as our Chief Financial Officer in August 2010. From July 1999 to August 2010 Mr. Gan was a Senior Financial Consultant at The Goetzman Group, a company which provides staffing solutions in all areas of finance and accounting. His assignments while at The Goetzman Group included (i) acting as interim chief financial officer for Rino International Inc. Inc from January 2007 to September 2007; (ii) acting as interim general accounting manager for Physicals Formula from March 2008 to September 2008; and (iii) overseeing the Sarbanes- Oxley compliance project for Smart & Final from January 2005 to May 2005. Mr. Gan received his Master of Arts from Fudan University, Shanghai in June 1989 and received his Masters in Accounting from the University of Southern California in December 1995.
Zeng Shijun was appointed as our Chief Technology Officer on February 12, 2010. He has worked as deputy general manager for Dalian Hua Yang Engineer Co., Ltd. since 1992. He worked as project manager for Dalian Synthetic Fiber Research Institute from 1984 to 1991. He received his bachelor’s degree from Dalian University of Technology in 1984. He received a postgraduate degree in economy management from the China Social Scientific University in 1998.
Chris Bickel was elected as a director on February 12, 2010. Since October 2009, Mr. Bickel has served as President of Primary Capital and is responsible for business development in China. Primary Capital acted as placement agent for the Company’s February 2010 private placement. From 2005 to October 2009, Mr. Bickel was an investment banker at Rosewood Capital Group, LLC (previously an affiliate of Primary Capital and now a branch office ) during which time his investment banking team provided a full range of investment banking, due diligence and business advisory services to private China based companies interested in accessing the U.S. capital markets and being listed in the U.S., as well as advisory services to US based investment banking firms interested in identifying investment banking clients in China. Mr. Bickel was instrumental in originating and financing of a number of PRC companies that are listed on the NASDAQ or whose shares are quoted on the OTCBB. From 2001 through 2004, Mr. Bickel served as Chairman and CEO of Sino UJE Ltd., a Hong Kong based company which is a distributor of medical and industrial instrumentation and technology products. Mr. Bickel was also employed by Spectris Inc. from 1983 to 1996. As an employee of Spectris, Mr. Bickel was involved with and managed the nonwoven sector of its business. Spectris was engaged in providing engineered products for use in nonwovens production. We believe that Mr. Bickel’s extensive past experience in providing business advisory services to private China based companies interested in accessing the U.S. capital markets, including Rino International Corp. and Sino Gas International Holdings, Inc., and helping those companies become successfully listed as well as his over ten years’ experience in the nonwoven market and knowledge with manufacturing practice and the overall market make him a suitable candidate to serve on our board of directors.
Li Jun was elected as a director in February 2010. Mr. Li is the owner and manager of Shanghai Primary Capital Management Co., Ltd., a business advisory firm incorporated in Shanghai China, which he started in 2010. (Shanghai Primary Capital Management Co., Ltd. is not affiliated with Primary Capital.) He provides advisory services to China business owners seeking capital and advisory services related to listing their company on United States stock exchanges. He has over twenty years of experience working in China in various fields and in various capacities. Mr. Li founded Shanghai Rosewood Investment Consulting Co., Ltd in 2005 and participated in four listing and financing transactions in which China based companies received funding from U.S. based investors and listed on in the U.S. From 2001 through 2008, Mr. Li has been the Managing Director of SINO UJE, Ltd., a Hong Kong based company which is a distributor of medical and industrial instrumentation and technology products throughout Asia. From 1994 through 2000, Mr. Li was employed by Nanchang Minerals Machinery Imp and Exp Co., Ltd initially as a salesman, followed by promotions to department director and vice president. From 1987 through 1994, Mr. Li served as an instructor at the University of Military Science and Technology and he retired as a Major from the Chinese People’s Liberation Army. Although he has not been previously engaged in the nonwovens business, we believe that Mr. Li’s business acumen and his extensive past experience in providing business advisory services to private China based companies interested in accessing the U.S. capital markets and helping those companies become successfully listed make him an eminently suitable candidate to serve on our board of directors. Mr. Li received his Bachelor’s and his Master’s degree of Science from Shanghai Jiaotong University. Mr. Li is not, and has not been within the last five years, a director of any other publicly traded company.
Richard M. Cohen was elected as a director in June, 2010. Since 1996, Mr. Cohen has been the President of Richard M. Cohen Consultants, a financial services consulting company that accepts engagements from public and private companies to assist with their corporate governance and corporate finance needs. From 1984 through 1992, Mr. Cohen was an investment banker at both Henry Ansbacher and Furman Selz, where he specialized in mergers & acquisitions, public equity offerings, and restructurings. From 1980 through 1983, Mr. Cohen was a Vice President of corporate development at Macmillan, Inc. Mr. Cohen is a Certified Public Accountant (New York State) and began his career at Arthur Andersen. He received a B.S. from The University of Pennsylvania (Wharton) in 1973 and an M.B.A. from Stanford University in 1975. Although he has not been previously engaged in the nonwovens business we believe that Mr. Cohen’s business acumen and his experience in providing business advisory services to private companies to assist with their corporate governance and corporate finance needs coupled with his experience serving as a director of a number of publicly traded companies make him an eminently suitable candidate to serve on our board of directors. Mr. Cohen currently serves as a director of Helix BioMedix (OTCBB:HXBM), Rodman and Renshaw (NASDQ:RODM), CorMedix (OTCBB:CRMD), Dune Energy, Inc. (AMEX: DNE), for which he served as Chief Financial Officer from November 2003 to April 2005.
Su Lei was elected as a director in August 2010. Mr. Su currently serves as the Associate Director of Information of the State Environmental Protection Agency in China, a position he has held since 2001. Mr. Su has successively acted as Principal Staff Member, Associated Director and Director of China Environmental Protection Industrial Association since September 2001. He also currently serves as the Director of the Working Committee of China Green Star, a position he has held since 2002. China Green Star is a non-profit organization under China's Environmental Protection Association which focuses on promoting the interests of the environmental protection industry. We believe that Mr. Su’s position and experience with the State Environmental Protection Agency and his understanding of public policy matters make him well suited to serve on our board of directors. Mr. Su received a bachelor’s degree in the Electronic Engineering from China Air Force Missile Institute, and he is now a senior engineer in Environment Management.
All of our directors serve on the board until our next annual meeting of the stockholders, and until their successors have been elected and qualified or until their earlier resignation or removal.
Our executive officers serve at the discretion of the board of directors, subject to the terms of any employment agreement they have with the Company. Mr. Bickel is serving on the Board as a designee of Primary Capital. Under the terms of its financial services agreement with the company Primary Capital is entitled to designate one board member and one observer until February 11, 2012.
Family Relationships
There are no family relationships among our directors and executive officers, except the Eric Gan, our chief financial officer, is the brother in law of Li Jun, one of our directors. There is no arrangement or understanding between or among our executive officers and directors pursuant to which any director or officer was or is to be selected as a director or officer, and there is no arrangement, plan or understanding as to whether non-management shareholders will exercise their voting rights to continue to elect the current board of directors.
Involvement in Certain Legal Proceedings
None of our directors or executive officers has, during the past ten years:
| · | been convicted in a criminal proceeding or been subject to a pending criminal proceeding (excluding traffic violations and other minor offences); |
| · | had any bankruptcy petition filed by or against the business or property of the person, or of any partnership, corporation or business association of which he was a general partner or executive officer, either at the time of the bankruptcy filing or within two years prior to that time; |
| · | been subject to any order, judgment, or decree, not subsequently reversed, suspended or vacated, of any court of competent jurisdiction or federal or state authority, permanently or temporarily enjoining, barring, suspending or otherwise limiting, his involvement in any type of business, securities, futures, commodities, investment, banking, savings and loan, or insurance activities, or to be associated with persons engaged in any such activity; |
| · | been found by a court of competent jurisdiction in a civil action or by the Securities and Exchange Commission or the Commodity Futures Trading Commission to have violated a federal or state securities or commodities law, and the judgment has not been reversed, suspended, or vacated; |
| · | been the subject of, or a party to, any federal or state judicial or administrative order, judgment, decree, or finding, not subsequently reversed, suspended or vacated (not including any settlement of a civil proceeding among private litigants), relating to an alleged violation of any federal or state securities or commodities law or regulation, any law or regulation respecting financial institutions or insurance companies including, but not limited to, a temporary or permanent injunction, order of disgorgement or restitution, civil money penalty or temporary or permanent cease-and-desist order, or removal or prohibition order, or any law or regulation prohibiting mail or wire fraud or fraud in connection with any business entity; or |
| · | been the subject of, or a party to, any sanction or order, not subsequently reversed, suspended or vacated, of any self-regulatory organization (as defined in Section 3(a)(26) of the Exchange Act (15 U.S.C. 78c(a)(26))), any registered entity (as defined in Section 1(a)(29) of the Commodity Exchange Act (7 U.S.C. 1(a)(29))), or any equivalent exchange, association, entity or organization that has disciplinary authority over its members or persons associated with a member. |
Board Independence
In order to be listed on NASDAQ, a company is required to meet certain corporate governance requirements, including, with certain exceptions, the requirement to have a board of directors the majority of whose members are “independent” within the meaning of NASDAQ rules.
As a “controlled company” we are exempt from the requirements of the NASDAQ Marketplace Rules (i) to have a majority of independent board members; (ii) for independent director oversight of executive officer compensation and (iii) for independent director oversight of director nomination. As a controlled company, we remain subject to the NASDAQ audit committee requirements and the requirement that independent directors regularly meet in executive session.
Under NASDAQ Marketplace Rules a company is considered a "controlled company" if greater than 50% of its voting power is held by an individual, a group or another company. In order for a group to exist for purposes of this rule, the stockholders forming the group are required to publicly file a notice that they are acting as a group (e.g., Schedule 13D). Bestyield Group Limited, Proudlead Limited, Pilot Link International Limited, High Swift Limited, China Investment Management Inc. and Li Jun intend to file a Schedule 13D disclosing the existence of a group with respect to their holdings in the Company.
The Company intends to disclose its status as a “controlled company” in its proxy statement for its next annual meeting or in its next annual report on Form 10-K and the basis for determining that it is a controlled company.
The Board has determined that three of its six current members, namely Messrs. Chris Bickel, Su Lie and Richard M. Cohen, are “independent” within the meaning of NASDAQ listing standards.
Director Contracts
In June 2010, we entered into a director’s agreement with Richard M. Cohen, which agreement was effective with his election to the Board. Under the terms of that agreement, effective on closing of the offering, Mr. Cohen will be paid an annual retainer of $24,000 for serving as a director (with $2,000 payable at the beginning of each month). In addition, pursuant to the Company’s equity incentive plan, Mr. Cohen was awarded 30,000 shares of restricted two thirds of which are subject to restrictions on transfer and are subject to forfeiture with the restrictions lapsing as to one-third of the shares on the first anniversary of the date of grant and as to one- third on the second anniversary of the date of grant in the event Mr. Cohen continues to be a director on those dates. In addition, the Company will reimburse the director for pre-approved reasonable business-related expenses incurred in good faith in the performance of the director’s duties for the Company.
Committees
The Board currently has three standing committees: Audit Committee, Compensation Committee and Nominating Committee. Each member of these committees is “independent” as defined by NASDAQ and SEC rules and each of these committees has a written charter approved by the Board. Committee members are appointed by the Board based on the recommendation of the Nominating Committee, except that members of the Nominating Committee are appointed by the independent members of the Board. The current members of the committees are as follows:
| Director | | Audit | | Compensation | | Nominating |
| Jie Li | | | | | | |
| Law Wawai | | | | | | |
| Li Jun | | | | | | |
| Chris Bickel | | ü | | ü | | ü |
| Richard M. Cohen | | ü | | ü | | ü |
| Su Lei | | ü | | | | |
Audit Committee; Audit Committee Financial Expert
The Audit Committee, established in September 2010, currently consists of three members, Su Lei, Chris Bickel, Richard M. Cohen, its Chairman. The Board has determined that each of them is independent within the meaning of the NASDAQ listing standards and applicable SEC regulations, and that each member has the financial literacy required by the NASDAQ listing standards.
The Board also has determined that Mr. Cohen is qualified as an "audit committee financial expert" within the meaning of applicable SEC regulations and has the accounting and related financial sophistication required by NASDAQ listing standards.
The function of the Audit Committee, as more fully set forth in its charter, is to (i) oversee our financial statements, our financial reporting process and our system of internal control over financial reporting; (ii) recommend the selection of our registered public accounting firm; (iii) review the extent of non-audit services to be performed by the auditors; and (iv) review the disclosures made in our periodic financial reports.
Compensation Committee
The Compensation Committee, established in September 2010, consists of two members Chris Bickel and Richard M. Cohen. The Board has determined that each of them is independent within the meaning of the NASDAQ listing standards. The functions of the Compensation Committee, as more fully set forth in its charter, are to oversee our compensation policies generally, evaluate senior executive performance, oversee and determine compensation for senior executives and review and recommend to the Board actions regarding director compensation.
Nominating Committee
The Nominating Committee, established in September 2010, currently consists of two members, Chris Bickel and Richard M. Cohen. The Board has determined that each of Messrs. Bickel and Cohen is independent within the meaning of the NASDAQ listing standards.
As more fully set forth in its charter, the primary responsibilities of the Nominating Committee are to: (i) develop and recommend to the Board criteria for selecting qualified director candidates; (ii) identify, review and evaluate individuals qualified to become Board members; (iii) consider committee member qualifications, appointment and removal; and (iv) assist the Board in its annual reviews of the performance of the Board, each committee and management. The Committee has the exclusive authority to make recommendations to the Board for approval for the election of new members to the Board.
To fulfill its responsibilities and duties the Nominating Committee is required to, among other things (i) evaluate the current composition of the Board of Directors and its committees, and determine future requirements for director candidates; (ii) determine the Board’s criteria for selecting new directors, including desired board skills and attributes, and actively seek prospective individuals qualified to become board members; (iii) adopt and maintain a policy concerning the director nomination process; (iv) adopt a policy concerning the consideration of director candidates recommended by stockholders and consider stockholder nominees for election to the Board; (v) evaluate and propose nominations for election to the Board; and (vi) review and make recommendations to the Board concerning membership of Board committees.
The Committee does not assign specific weights to particular criteria. Rather, the Nominating Committee believes that the backgrounds and qualifications of the directors, considered as a group, should provide a significant composite mix of experience, knowledge and abilities that will allow the Board to fulfill its responsibilities.
The Nominating Committee will consider director nominees recommended for consideration by the stockholders. To have a person considered by the Nominating Committee for recommendation to the Board as a director nominee a stockholder should write to the Corporate Secretary, specifying the nominee's name and qualifications for Board membership and providing confirmation of the nominee's consent to serve as a director. Following verification that the person submitting the recommendation is a stockholder of the Company, all properly submitted recommendations will be brought to the attention of the Nominating Committee at a regularly scheduled Committee meeting.
If a stockholder properly recommends a director nominee, the Nominating Committee will give due consideration to that nominee and will use the same criteria used for evaluating other director nominees, in addition to considering the information relating to the director nominee provided by the stockholder.
Stockholders also may nominate directors for election at our annual meeting of stockholders by following the provisions set forth in our bylaws. The deadline for stockholder nominations is set forth in our by laws. Stockholders and other parties interested in communicating directly with the Board of Directors may do so by writing to: China SLP Filtration Technology, Inc., Attention: Board of Directors, Shishan Industrial Park, Nanhai District, Foshan City, Guangdong Province PRC. Pursuant to a process approved by the Board, the Corporate Secretary reviews all correspondence received by us and addressed to members of the Board and regularly forwards to the Board a summary of such correspondence and copies of all correspondence that, in the opinion of the Corporate Secretary, deals with the functions of the Board or Board committees or otherwise requires the Board's attention. Directors may at any time review a log of all correspondence received by us that is addressed to members of the Board and request copies of any such correspondence.
Concerns relating to accounting, internal controls or auditing matters are immediately brought to the attention of our internal audit department and handled in accordance with procedures established by the Audit Committee to address such matters.
Compensation Committee Interlocks and Insider Participation
All current members of the Compensation Committee are independent directors. None of the past or present members of our Compensation Committee are present or past employees or officers of ours or any of our subsidiaries. No member of the Compensation Committee has had any relationship with us requiring disclosure under Item 404 of Regulation S-K under the Securities Exchange Act of 1934, as amended. None of our executive officers serves on the board of directors or compensation committee of a company that has an executive officer that serves on our Board or Compensation Committee.
Code of Ethics
We strive to foster a culture of honesty, integrity and accountability.
We have a code of ethics applicable to all employees, including all officers, and including our independent directors, who are not employees of the company, with regard to their company -related activities. The code incorporates our guidelines designed to deter wrongdoing and to promote honest and ethical conduct and compliance with applicable laws and regulations. The code also incorporates our expectations of our employees that enable us to provide accurate and timely disclosure in our filings with the SEC and other public communications. In addition, the code incorporates guidelines pertaining to topics such as complying with applicable laws, rules, and regulations; reporting code violations; and maintaining accountability for adherence to the code.
Waivers of the Code for executive officers and directors may be granted only by the Board. Amendments to the Code must be approved by the Board. We intend to provide disclosure of any such amendments or waivers on our website (www.silepu.com) within four business days of any such amendment or waiver.
EXECUTIVE COMPENSATION
The following is a summary of the compensation we paid to our former chief executive officers, for the last two fiscal years ended September 30, 2010 and 2009. No executive officer received compensation in excess of $100,000 for any of those two years.
Name and Principal Position | | Fiscal Year | | Salary ($) | | Bonus ($) | | Stock Awards ($) | | Option Awards ($) | | Non-equity Incentive Plan Compensation ($) | | Nonqualified Deferred Compensation Earnings ($) | | All Other Compensation ($) | | Total ($) | |
| Li Jie | | | 2010 | | 44,117 | | | -0- | | -0- | | | -0- | | -0- | | | -0- | | -0- | | | 44,117 | |
| (CEO(1) | | | 2009 | | -0- | | | -0- | | -0- | | | -0- | | -0- | | | -0- | | -0- | | | -0- | |
| | | | | | | | | | | | | | | | | | | | | | | | | |
| Seth Winterton | | | 2010 | | -0- | | | -0- | | -0- | | | -0- | | -0- | | | -0- | | -0- | | | -0- | |
| (former CEO)(2) | | | 2009 | | -0- | | | -0- | | -0- | | | -0- | | -0- | | | -0- | | -0- | | | -0- | |
| (1) | Jie Li was appointed Chief Executive Officer in February 2010. |
| (2) | Seth Winterton served as Chief Executive Officer of Perpetual Technologies from December 29, 2008 until February 12, 2010. |
The following is a summary of the compensation paid by our operating subsidiary Foshan to Li Jie, its President and Chief Executive Officer, for the last two fiscal years ended September 30, 2010 and 2009, respectively. No executive officer of Foshan received compensation in excess of $100,000 for any of these two years.
Name and Principal Position | | Fiscal Year | | Salary ($)(1) | | | Bonus ($) | | | Stock Awards ($) | | | Option Awards ($) | | | Non-equity Incentive Plan Compensation ($) | | | Nonqualified Deferred Compensation Earnings ($) | | | All Other Compensation ($) | | | Total ($) | |
| Li Jie | | | | | | | | | | | | | | | | | | | | | | | | | | |
| (President and Chief | | 2010 | | | 44,117 | | | | -0- | | | | -0- | | | | -0- | | | | -0- | | | | -0- | | | | -0- | | | | 44,117 | |
| Executive Officer ) | | 2009 | | | 44,117 | | | | -0- | | | | -0- | | | | -0- | | | | -0- | | | | -0- | | | | -0- | | | | 44,117 | |
(1) The relevant exchange rates for fiscal years ended September 2010 and 2009 are $1 to RMB 6.8 and RMB 6.8, respectively.
Employment Agreement
On November 20, 2008, Mr. Li entered into an employment agreement with Foshan to serve as our President and Chief Executive Officer. Under the agreement, Mr. Li is to be paid a salary of $15,000 per month beginning on the closing date of the public offering. The agreement can be terminated by either party by giving 30 days notice.
On November 20, 2008, Mr. Zeng entered into an employment agreement with Foshan to serve as our Chief Technology Officer. Under the agreement, Mr. Zeng is to be paid a salary of $5,000 per month beginning on the closing date of the public offering. The agreement can be terminated by either party by giving 30 day notice.
On January 1, 2010, Mr. Law entered into an employment agreement with Foshan to serve as our President of Sales. Under the agreement, Mr. Law is to be paid a salary of $5,000 per month beginning on the closing date of the public offering. The agreement can be terminated by either party by giving 30 day notice.
Effective August 5, 2010, Mr. Gan entered into an employment agreement with the Company to serve as Chief Financial Officer. The term is for three years unless sooner terminated as provided in the agreement. Under the agreement Mr. Gan has agreed to perform such duties as shall be consistent with the position of Chief Financial Officer subject to the supervision and direction of the Board. Under the agreement Mr. Gan will receive an annual salary of $120,000 payable in 12 equal payment payable on the 15th day of each month beginning on August 15, 2010). However, prior to the completion of the offering contemplated by this prospectus, Mr. Gan will receive a salary of $6,000 per month (receiving $10,000 for the month during which the Company completes its initial public offering and thereafter). In addition to his annual salary, Mr. Gan will be reimbursed for all reasonable expenses including travel expense between United States and China and will be provided with housing expense during the term of his employment. Mr. Gan will also receive, subject to the approval of the Board of Directors, an option to purchase up to 400,000 shares of the company’s common stock at an exercise price equal to the initial public offering price. The option shall vest and be exercisable as follows; 160,000 shares will vest and become exercisable on July 31, 2011; 120,000 shares will vest and become exercisable on July 31, 2012; 120,000 shares will vest and become exercisable on July 31, 2013. In the event that the employment is terminated within 12 months from the employment agreement date by the Company without cause, 160,000 shares shall be vested immediately on the termination date.
2010 Stock Incentive Plan
On September 3, 2010, we adopted the 2010 Plan. All officers and key employees, directors of, and consultants to the Company and its subsidiaries and affiliates, who are responsible for or contribute to the management, growth and/or profitability of the business of the Company and/or its subsidiaries and affiliates are eligible for participation in the 2010 Plan. Two Million One Hundred Eighty Six Thousand Two Hundred Eighteen (2,186,218) (or such number as shall be equal to 10% of the outstanding shares on a fully diluted basis after the offering and the conversion of the notes) shares of common stock have been authorized and reserved for the 2010 Plan and any shares that may become available for issuance under awards under the 2010 Plan as a result of expiration or forfeiture. Under the 2010 Plan, the company may issue stock options, stock appreciation rights, restricted stock awards, restricted stock units, performance awards and other stock-based awards. The 2010 Plan is administered by our Compensation Committee.
The purpose of the 2010 Plan is to enhance the profitability and value of the Company for the benefit of its stockholders by enabling the Company to offer eligible participants stock-based incentives in the Company to attract, retain and reward such individuals and strengthen the mutuality of interests between such individuals and the Company’s stockholders.
The Compensation Committee does not currently have a set formula for determining who will receive awards and what the amounts of the awards will be and when such awards will be made. The Compensation Committee can make an award in its discretion at any time as consistent with the terms of the 2010 Plan. Long-term equity incentives are intended to reward and will be awarded to eligible participants who help achieve our overall corporate goals and meet their individual employee objectives.
Outstanding Equity Awards
On September 3, 2010, as required by the terms of his agreement with the Company entered into in June 2010, the Board awarded Richard Cohen 30,000 shares of restricted two-thirds of which are subject to restrictions on transfer and are subject to forfeiture, with the restrictions lapsing as to one-third of the shares on the first anniversary of the date of grant, and as to one-third on the second anniversary of the date of grant in the event Mr. Cohen continues to be a director on those dates.
On September 3, 2010, under the 2010 Plan and in connection with his appointment as Chief Financial Officer, the Board granted Eric Gan an option to purchase 400,000 shares at an exercise price equal to the public offering price of this offering. The option shall vest and be exercisable as follows; 160,000 shares will vest and become exercisable on July 31, 2011; 120,000 shares will vest and become exercisable on July 31, 2012; 120,000 shares will vest and become exercisable on July 31, 2013. In the event that the employment is terminated within 12 months from the employment agreement date by the Company without cause, 160,000 shares shall be vested immediately on the termination date.
Except for the foregoing there are no option exercises, options outstanding or restricted stock grants as of the date of this prospectus.
Compensation of Directors
During the fiscal year ended September 30, 2010, we did not pay any compensation to any of our current directors for services rendered in their capacity as directors of the company.
In June 2010, we entered into a director’s agreement with Richard M. Cohen, which agreement was effective with his election to the Board. Under the terms of that agreement Mr. Cohen commencing on the closing of the offering will be paid an annual retainer of $24,000 for serving as a director (with $2,000 payable at the beginning of each month). In addition, pursuant to the 2010 Plan Mr. Cohen was granted 30,000 shares of restricted two-thirds of which are subject to restrictions on transfer and to forfeiture, with the restrictions lapsing as to one-third of the shares, on the first anniversary of the date of grant, and as to one-third, on the second anniversary of the date of grant in the event Mr. Cohen continues to be a director on those dates. In addition, the Company will reimburse the director for pre-approved reasonable business-related expenses incurred in good faith in the performance of the director’s duties for the Company.
Except as set forth above as of the date of this prospectus, we have no formal or informal arrangements or agreements to compensate our directors for services they provide as directors. We plan to implement a compensation program for our independent directors, as and when they are appointed, which we anticipate will include such elements as an annual retainer, meeting attendance fees and stock options. The details of that compensation program will be negotiated with each independent director.
None of the directors of Foshan, our PRC-based operating company, are presently being compensated for their service as directors.
Li Jun, our director, is an officer and controlling stockholder of United Best, our foreign advisor. See section entitled “Certain Relationships and Related Transactions” beginning on page 80.
Additional Narrative Disclosure
We have no plans that provide for the payment of retirement benefits, or benefits that will be paid primarily following retirement, including, but not limited to, tax qualified defined benefit plans, supplemental executive retirement plans, tax qualified defined contribution plans and non-qualified defined contribution plans.
There are no contracts agreements, plans or arrangements, whether written or oral, that provide for payment to a named executive officer at, following, or in connection with the resignation, retirement or other termination of a named executive officer or a change in control or the company or a change in the executive officers responsibilities following a change in control, with respect to each named executive officer.
CERTAIN RELATIONSHIPS AND RELATED TRANSACTIONS
Except as set forth below, since October 1, 2007, the Company was not a party to any transaction (where the amount involved exceeded the lesser of $120,000 or 1% of the average of our assets for the last two fiscal years) in which an director, executive officer, holder of more than five percent of our common stock, or any member of the immediate family of any such person have or will have a direct or indirect material interest and no such transactions are currently proposed.
Primary Capital is a beneficial owner of more than 5% of our common stock. Mr. Bickel is also the President of Primary Capital. Chris Bickel is a director of our company serving as a designee of Primary Capital.
Primary Capital provided financial services in connection with the private placement and reverse merger which closed on February 12, 2010. The services provided and to be provided by Primary Capital include the following:
| · | assisting the Company in preparing a detailed business plan, financial model and power point presentation; |
| · | negotiating and structuring the reverse merger; |
| · | acting as placement agent for the February 12, 2010 note financing; |
| · | recommending to the Company a qualified auditor, securities attorney and investor relations firm, and assisting the Company with negotiating the terms of their respective engagements; |
| · | advising the Company on strategies to increase shareholder value; |
| · | assisting the Company and its investor relations firm in organizing, and participating with the Company in, investor road shows and investor conference calls; |
| · | recommending investor conferences in the US and Europe to be attended by the Company and a representative of Primary Capital; |
| · | identifying strategic relationships and joint venture partners; |
| · | identifying and recommending persons to serve on the Company’s Board of Directors; |
| · | identifying and rendering advice regarding potential acquisitions, including the valuation of the acquisition and financing for the acquisition; |
| · | assisting the Company in connection with its listing on a U.S. stock exchange; |
| · | reviewing and commenting on the Company’s SEC filings associated with the Company’s transactions; and |
| · | advising Company regarding its obligations as a U.S. public company. |
United Best assisted the Company with negotiations with service contractors and assisted the Company with on-going communications and coordinating the relationships with service contractors during the listing process.
Under the terms of a financial services agreement between Primary Capital and the company, Primary Capital was paid a commission of $202,000 at the closing of the February 2010 private financing. Primary Capital is also owed an additional $75,000 for services rendered in connection with the private placement. Primary Capital is also entitled to receive $15,000 on completion of the offering and $15,000 for the next succeeding seven calendar quarters for an aggregate amount of $120,000.
At the closing of the private financing, Primary Capital received 290,755 shares of our common stock which shares are being registered in the resale prospectus. Primary is also entitled to receive 265,186 shares of common stock on the closing of this offering.
In addition, for providing these financial services Primary Capital is entitled to receive, on conversion of the notes issued to the investors in the February 2010 private placement (which occurs upon consummation of this offering), a five-year warrant to purchase 98,571 shares of common stock (which number is equal to 5% of the 1,971,429 number of shares of common stock issued to the noteholders on conversion), exercisable at $2.10 (which equals the price at which the notes converted and assumes an initial public offering price of $6.00 per share). Unlike the investor warrants, these warrants will not terminate but instead become exercisable upon conversion of the notes and consummation of this offering. The shares underlying these warrants are being registered in the resale prospectus. If the note conversion does not occur, Primary Capital will receive a five-year warrant to purchase that number of shares of common stock equal to 5% of the common stock underlying the warrants issued to the investors in the private financing exercisable at the same price at which those investor warrants are exercisable.
Li Jun is a director and is a beneficial owner of more than 5% of our common stock. Mr. Li is an officer and controlling stockholder of United Best, our foreign advisor, provided financial services in connection with the private financing. United Best is listed as a selling stockholder in the resale prospectus. Newise Holdings, a company also controlled by Li Jun, is also listed as a selling stockholder in the resale prospectus.
Under the terms of a consulting agreement between United Best and the company, United Best was paid a commission of $202,000 at the closing of the financing. United Best is also owed an additional $75,000 for services rendered in connection with the financing. Additionally, under the consulting agreement, as amended, United Best is entitled to be paid fee on completion of this offering a success of $750,000 (which represents 3% of the $25,000,000 in gross proceeds received by us in connection with the underwritten offering, assuming an initial public offering price of $6.00 per share).
At the closing of the private financing, United Best received 362,755 shares of our common stock for their services. United Best is also entitled to receive an additional 193,186 shares on closing of this offering. 32,857of these particular shares held by United Best are being registered in the resale prospectus.
In addition, as partial consideration for providing these financial services, United Best is entitled to receive, on conversion of the notes issued to the investors in the February 2010 private placement (which occurs upon consummation of this offering), a five-year warrant to purchase 98,571 shares of common stock (which represents 5% of the number of common stock issued to the note holders on conversion), exercisable at the price of $2.10 per share (i.e. the price at which the notes converted based on the assumed initial public offering price of $6.00 per share). Unlike the investor warrants, these warrants will not terminate but instead become exercisable on conversion of the notes and consummation of this offering. The shares underlying these warrants are being registered in the resale prospectus. If the note conversion does not occur, United Best will receive a five-year warrant to purchase that number of shares of common stock equal to 5% of the common stock underlying the warrants issued to the investors in the private financing exercisable at the same price at which those investor warrants are exercisable.
For additional information about the nature of the services provided to the company by each of Primary Capital and United Best under their respective agreements, reference is make to “Additional Disclosure Regarding Conversion of Notes and Exercise of Warrants - Financial Services Agreements and Related Warrants” beginning on page 65.
On February 12, 2010, we entered into a share exchange agreement with the owners of all of the outstanding shares of Hong Hui. Under the terms of the share exchange agreement we issued and delivered to the Hong Hui stockholders a total of 14,510,204 shares of our common stock in exchange for all of the outstanding shares of Hong Hui. As shareholders of Hong Hui, (i) Bestyield Group, a company controlled by Mr. Li, our chief executive officer, received 4,353,061 shares, (ii) Proudlead, a company controlled by Mr. Law, our president of sales and a director, received 4,353,061 shares and (iii) Newise Holdings, a company controlled by Mr. Li Jun one of our directors received 2,321,633 shares.
Under a limited recourse guaranty agreement dated as of February 12, 2010, Bestyield Group and Proudlead agreed to guaranty the company’s obligations under the notes issued in the February 2010 private placement. That guaranty is secured by a pledge of the 8,706,122 shares of common stock received by them in the reverse merger
In each of June 2007 and in February 2008 and May 2008, Joseph Nemelka, a former officer and director, advanced funds to the company in the total aggregate amount of $15,000. The advances were due on demand and bore interest at 8% per annum. This indebtedness was forgiven in February 2010 prior to the reverse merger. In addition, Mr. Nemelka purchased a convertible promissory note in the aggregate principal amount of $100,000 in the February private placement.
Our board of directors is charged with reviewing and approving all potential related party transactions. All such related party transactions must then be reported under applicable SEC rules. We have not adopted other procedures for review, or standards for approval, of such transactions, but instead review them on a case-by-case basis.
Except for the foregoing, no executive officer, director or any member of these individuals’ immediate families, any corporation or organization with whom any of these individuals is an affiliate or any trust or estate in which any of these individuals serve as a trustee or in a similar capacity or has a substantial beneficial interest in is or has been indebted to the Company at any time since the beginning of the Company’s last fiscal year.
DESCRIPTION OF SECURITIES
The following is a summary description of our capital stock and certain provisions of our certificate of incorporation and by-laws, copies of which have been filed as exhibits to this prospectus. The following discussion is qualified in its entirety by reference to such exhibits.
General
We are authorized to issue 200,000,000 shares of common stock, par value $.001 per share, and 10,000,000 shares of blank-check preferred stock, par value $.001 per share.
Immediately following the closing of this offering, 21,862,183 shares of common stock will be issued and outstanding (excluding shares issuable upon exercise of the over-allotment option). In addition, 197,142 shares may be purchased upon the exercise of placement agent warrants, 208,333 shares may be purchased upon the exercise of underwriter’s warrants and 400,000 shares are issuable on exercise of outstanding options.
Common Stock
Each share of our common stock has one vote on all matters including election of directors, without provision for cumulative voting. The common stock is not redeemable and has no conversion or preemptive rights. In the event we are liquidated, the holders of common stock will share equally in any balance of our assets available for distribution to them after satisfaction of creditors and preferred shareholders. The holders of our common stock are entitled to equal dividends and distributions per share with respect to the common stock when, as, and if declared by the board of directors from funds legally available.
Preferred Stock
In addition to the 200,000,000 shares of common stock, we are authorized to issue 10,000,000 shares of preferred stock. Shares of our preferred stock may be issued from time to time in one or more classes or series, each of which class or series shall have such distinctive designation or title as shall be fixed by the board of directors prior to the issuance of any shares thereof.
The issuance of shares of preferred stock, or the issuance of rights to purchase such shares, could be used to discourage an unsolicited acquisition proposal. For instance, the issuance of a series of preferred stock might impede a business combination by including class voting rights that would enable the holder to block such a transaction, or facilitate a business combination by including voting rights that would provide a required percentage vote of the stockholders. In addition, under certain circumstances, the issuance of preferred stock could adversely affect the voting power of the holders of the common stock. Although the board of directors is required to make any determination to issue such stock based on its judgment as to the best interests of our stockholders, the board of directors could act in a manner that would discourage an acquisition attempt or other transaction that some, or a majority, of the stockholders might believe to be in their best interests or in which stockholders might receive a premium for their stock over the then market price of such stock. The board of directors does not at present intend to seek stockholder approval prior to any issuance of currently authorized preferred stock, unless otherwise required by law.
Notes and Warrants
On February 12, 2010, immediately following the closing of the share exchange agreement, we entered into a note purchase agreement with certain accredited investors for the sale of convertible notes, in the aggregate principal amount of $4,140,000, and warrants (which are exercisable only in certain events). The closing of the sale of the notes and warrants occurred on February 12, 2010. The terms of the notes and warrants is set forth below. The note purchase agreement contains representations, warranties and covenants which are customary for transactions of this nature.
The notes have the following material terms:
Maturity: The notes mature after one year. If principal is not paid on maturity then 150% of the principal amount shall be payable.
Interest: 10% per annum payable quarterly increasing to 15% if there is a default. $204,464 out of the closing proceeds is being held in escrow to cover most of the first six months interest.
Conversion: In the event of the closing of this offering, $4,140,000 aggregate principal amount of the notes outstanding converts automatically into 1,971,429 shares of common stock at a conversion price of $2.10 per share (which represents a 65% discount to the assumed offering price of $6.00 per share).
The warrants have the following material terms:
Exercisable: The warrants will become void if the notes automatically convert into common stock (which will be the case if the offering contemplated by this prospectus closes). The warrants are exercisable at any time during a five-year period commencing on the closing of a “financing,” which means the first sale (or series of related sales) by us of stock (or debt or equity securities convertible into stock), in a capital raising transaction, occurring after the maturity date (or the date the notes become due pursuant to a default, if earlier) with aggregate gross proceeds of at least $2,000,000. The warrants cannot be exercised if no financing is consummated within a five-year period after the issue date.
Number of Shares: The warrants represent the right to purchase 8% of the total number of shares of common stock outstanding (on a fully-diluted basis) immediately after the closing of the “financing.”
Exercise Price: The warrants are exercisable at the price for which the shares of common stock (or common stock equivalent if derivative securities are sold) are sold in the financing. If the financing includes more than one type of security, the exercise price shall equal the lowest price per share of common stock or common stock equivalent included in the financing.
Underwriter’s Warrants
We have also agreed to issue to Brean Murray, Carret & Co., LLC, and/or its designees, a warrant to purchase a number of shares of common stock equal to an aggregate of 5% of the shares of common stock sold in the offering, excluding over-allotments, if any. The warrant will have an exercise price equal to 125% of the offering price of the shares of common stock sold in this offering and be exercisable for four years commencing one year after the effective date of the registration statement. Pursuant to the rules of the Financial Industry Regulatory, Inc., or FINRA (formerly the NASD), and in particular Rule 5110, the warrant (and underlying shares) issued to Brean Murray, Carret & Co., LLC, may not be sold, transferred, assigned, pledged, or hypothecated, or be the subject of any hedging, short sale, derivative, put or call transaction that would result in the effective disposition of the securities by any person for a period of 180 days immediately following the date of delivery and payment for the shares offered; provided, however, that the warrant (and underlying shares) may be transferred to officers or partners of the representatives and members of the underwriting syndicate and their officers or partners as long as the warrant (and underlying shares) remain subject to the lockup.
Financials Advisor Warrants
For a description of the warrants issued to the financials advisors in connection with the private placement, see the section above entitled “Certain Relationships and Related Transactions,” beginning on page 80.
Exchange Listing
We have applied for listing of our common stock on the NASDAQ Capital Market under the symbol “SLPC.”
Recent Stockholder Actions
On February 12, 2010, immediately prior to the closing of the share exchange agreement, shareholders holding 2,528,000 of the 2,600,000 shares of our then outstanding common stock agreed to surrender their shares for cancellation in payment by Joe Nemelka of an aggregate amount of $40,000, pursuant to stock purchase agreements entered into between Joe Nemelka and each such holder. Under the share exchange agreement we issued an aggregate of 14,510,204 shares of common stock to the stockholders of Hong Hui. In addition, immediately following the closing of the share exchange agreement we issued 362,755 and 290,755 shares of our common stock to United Best and Primary Capital, respectively, as a transaction fee in connection with the closing of the private financing. In addition there are 72,000 shares held by 210 round lot shareholders. Accordingly, as of February 12, 2010 following the closing of all of these transactions there were 15,235,714 shares of common stock issued and outstanding.
As more fully described in an Information Statement on Schedule 14C (which was mailed to our stockholders on March 3, 2010) on February 12, 2010 the board of directors and the holders of majority of our outstanding shares entitled to vote thereon approved the change the name of the Company to China Filtration Technology, Inc. and 1-for-5 reverse stock split of our shares of common stock.
These corporate actions became effective on the filing with the Secretary of State of Delaware of a certificate of amendment to our certificate of incorporation which was filed on March 24, 2010.
On June 1, 2010 the corporate name was changed to China SLP Filtration Technology, Inc.
MATERIAL UNITED STATES FEDERAL INCOME TAX CONSIDERATIONS
General
The following is a general summary of certain material U.S. federal income tax consequences to an investor of the acquisition, ownership and disposition of our common stock purchased by an investor pursuant to this offering. As used in this discussion, “we”, “our” and “us” refers to China SLP Filtration Technology, Inc. This discussion applies only to investors that will hold each share of our common stock issued and purchased pursuant to this offering as a “capital asset” (generally, property held for investment) within the meaning of Section 1221 of the Internal Revenue Code of 1986, as amended (the “Code”). This discussion does not address all aspects of U.S. federal income taxation that may be relevant to an investor in light of that investor’s particular circumstances. In addition, this discussion does not address (a) U.S. federal non-income tax laws, such as estate or gift tax laws, (b) state, local or non-U.S. tax consequences, or (c) the special tax rules that may apply to certain investors, including, without limitation, banks, insurance companies, financial institutions, broker-dealers, taxpayers that have elected mark-to-market accounting, taxpayers subject to the alternative minimum tax provisions of the Code, tax-exempt entities, governments or agencies or instrumentalities thereof, regulated investment companies, real estate investment trusts, U.S. persons whose functional currency is not the U.S. dollar, certain former U.S. citizens or long-term residents of the United States, or investors that acquire, hold, or dispose of our common stock as part of a straddle, hedge, wash sale, constructive sale or conversion transaction or other integrated transaction. Additionally, this discussion does not consider the tax treatment of entities treated as partnerships or other pass-through entities for U.S. federal income tax purposes or of persons who hold our common stock through such entities. The tax treatment of a partnership and each partner thereof will generally depend upon the status and activities of the partnership and such partner. Thus, partnerships, other pass-through entities (and partners in such partnerships or owners of such other pass-through entities) should consult their own tax advisors.
This discussion is based on current provisions of the Code, its legislative history, U.S. Treasury regulations promulgated under the Code, judicial opinions, and published rulings and procedures of the U.S. Internal Revenue Service (“IRS”), all as in effect on the date of this prospectus. These authorities are subject to differing interpretations or to change, possibly with retroactive effect. We have not sought, and will not seek, any ruling from the IRS or any opinion of counsel with respect to the tax consequences discussed below, and there can be no assurance that the IRS will not take a position contrary to the tax consequences discussed below or that any position taken by the IRS would not be sustained.
As used in this discussion, the term “U.S. person” means a person that is, for U.S. federal income tax purposes, (i) an individual citizen or resident of the United States, (ii) a corporation (or other entity treated as a corporation for U.S. federal income tax purposes) created or organized (or treated as created or organized) in or under the laws of the United States or of any state thereof or the District of Columbia, (iii) an estate the income of which is subject to U.S. federal income taxation regardless of its source, or (iv) a trust if (A) a court within the United States is able to exercise primary supervision over the administration of the trust and one or more U.S. persons have the authority to control all substantial decisions of the trust, or (B) it has in effect a valid election to be treated as a U.S. person under applicable U.S. Treasury regulations. As used in this discussion, the term “U.S. holder” means a beneficial owner of our common stock that is a U.S. person, and the term “non-U.S. holder” means a beneficial owner of our common stock (other than an entity that is treated as a partnership or other pass-through entity for U.S. federal income tax purposes) that is not a U.S. person.
THIS DISCUSSION IS ONLY A SUMMARY OF CERTAIN MATERIAL U.S. FEDERAL INCOME TAX CONSEQUENCES OF THE ACQUISITION, OWNERSHIP AND DISPOSITION OF OUR COMMON STOCK. IT IS NOT TAX ADVICE. EACH PROSPECTIVE INVESTOR IN OUR COMMON STOCK SHOULD CONSULT ITS OWN TAX ADVISOR WITH RESPECT TO THE PARTICULAR TAX CONSEQUENCES TO SUCH INVESTOR OF THE ACQUISITION, OWNERSHIP AND DISPOSITION OF OUR COMMON STOCK, INCLUDING THE APPLICABILITY AND EFFECT OF ANY STATE, LOCAL, AND NON-U.S. TAX LAWS, AS WELL AS U.S. FEDERAL TAX LAWS, AND ANY APPLICABLE TAX TREATY.
U.S. Holders
Taxation of Distributions
A U.S. holder will be required to include in gross income as ordinary income the amount of any dividend paid on the shares of our common stock. A distribution on such shares will be treated as a dividend for U.S. federal income tax purposes to the extent paid from our current or accumulated earnings and profits, as determined under U.S. federal income tax principles. Distributions in excess of current and accumulated earnings and profits will constitute a return of capital that will be applied against and reduce (but not below zero) the U.S. holder’s adjusted tax basis in our common stock. Any remaining excess will be treated as gain from the sale or other taxable disposition of the common stock and will be treated as described under “Gain or Loss on Sale, Taxable Exchange or Other Taxable Disposition of Common Stock” below.
Any dividends we pay to a U.S. holder that is treated as a taxable corporation for U.S. federal income tax purposes generally will qualify for the dividends-received deduction if the applicable holding period and other requirements are satisfied. With certain exceptions, if the applicable holding period and other requirements are satisfied, dividends we pay to a non-corporate U.S. holder will constitute “qualified dividends” that will be subject to tax at the maximum tax rate accorded to long-term capital gains for tax years beginning on or before December 31, 2010, after which the tax rate applicable to dividends is scheduled to return to the tax rate applicable to ordinary income.
If PRC taxes apply to any dividends paid to a U.S. holder on our common stock, such taxes may be treated as foreign taxes eligible for credit against such holder’s U.S. federal income tax liability (subject to certain limitations), and such U.S. holder may be entitled to certain benefits under the income tax treaty between the United States and the PRC. U.S. holders should consult their own tax advisors regarding the creditability of any such PRC tax and their eligibility for the benefits of the income tax treaty between the United States and the PRC.
Gain or Loss on Sale, Taxable Exchange or Other Taxable Disposition of Common Stock
In general, a U.S. holder must treat any gain or loss recognized upon a sale, taxable exchange, or other taxable disposition of our common stock as capital gain or loss. Any such capital gain or loss will be long-term capital gain or loss if the U.S. holder’s holding period for the common stock so disposed of exceeds one year, and otherwise as short-term capital gain or loss. In general, a U.S. holder will recognize gain or loss in an amount equal to the difference between (i) the sum of the amount of cash and the fair market value of any property received in such disposition and (ii) the U.S. holder’s adjusted tax basis in the common stock so disposed of. Long-term capital gain recognized by a non-corporate U.S. holder will generally be subject to a maximum tax rate of 15 percent for tax years beginning on or before December 31, 2010, after which the maximum long-term capital gains tax rate is scheduled to increase to 20 percent. The deduction of capital losses is subject to various limitations.
If PRC taxes apply to any gain from the disposition of our common stock by a U.S. holder, such taxes may be treated as foreign taxes eligible for credit against such holder’s U.S. federal income tax liability (subject to certain limitations), and such U.S. holder may be entitled to certain benefits under the income tax treaty between the United States and the PRC. U.S. holders should consult their own tax advisors regarding the creditability of any such PRC tax and their eligibility for the benefits of the income tax treaty between the United States and the PRC.
New Legislation Regarding Medicare Tax
For taxable years beginning after December 31, 2012, certain U.S. holders that are individuals, estates or trusts will be subject to a 3.8% tax on all or a portion of their "net investment income," which may include all or a portion of their dividends and net gains from the sale or other disposition of our common stock. If you are a U.S. holder that is an individual, estate or trust, you should consult your tax advisor regarding the applicability of the Medicare tax to your income and gains in respect of your investment in our common stock.
Non-U.S. Holders
Taxation of Distributions
In general, any distribution we make to a non-U.S. holder, to the extent paid out of our current or accumulated earnings and profits (as determined under U.S. federal income tax principles), will constitute a dividend for U.S. federal income tax purposes. Unless we are treated as an “80/20 company” for U.S. federal income tax purposes, as described below, any dividend paid to a non-U.S. holder with respect to shares of our common stock that is not effectively connected with the non-U.S. holder’s conduct of a trade or business within the United States, as described below, generally will be subject to U.S. federal withholding tax at a rate of 30 percent of the gross amount of the dividend, unless such non-U.S. holder is eligible for a reduced rate of withholding tax under an applicable income tax treaty and provides proper certification of its eligibility for such reduced rate (usually on an IRS Form W-8BEN). Any distribution not constituting a dividend will be treated first as reducing the non-U.S. holder’s adjusted tax basis in its shares of our common stock (but not below zero) and, to the extent such distribution exceeds the non-U.S. holder’s adjusted tax basis, as gain from the sale or other taxable disposition of the common stock, which will be treated as described under “Gain on Sale, Taxable Exchange or Other Taxable Disposition of Common Stock” below.
There is a possibility that we may qualify as an “80/20 company” for U.S. federal income tax purposes. In general, a U.S. corporation is an 80/20 company if at least 80 percent of its gross income earned directly or from subsidiaries during an applicable testing period is “active foreign business income.” The 80 percent test is applied on a periodic basis. If we qualify as an 80/20 company, a percentage of any dividend paid by us generally will not be subject to U.S. federal withholding tax. You should consult with your own tax advisors regarding the amount of any such dividend subject to withholding tax in this circumstance. It should also be noted that there are currently legislative proposals to amend the rules pertaining to 80/20 companies.
Dividends we pay to a non-U.S. holder that are effectively connected with such non-U.S. holder’s conduct of a trade or business within the United States (and, if certain income tax treaties apply, are attributable to a U.S. permanent establishment or fixed base maintained by the non-U.S. holder) generally will not be subject to U.S. withholding tax, provided such non-U.S. holder complies with certain certification and disclosure requirements (usually by providing an IRS Form W-8ECI). Instead, such dividends generally will be subject to U.S. federal income tax, net of certain deductions, at the same graduated individual or corporate tax rates applicable to U.S. persons. If the non-U.S. holder is a corporation, dividends that are effectively connected income may also be subject to a “branch profits tax” at a rate of 30 percent (or such lower rate as may be specified by an applicable income tax treaty).
Gain on Sale, Taxable Exchange or Other Taxable Disposition of Common Stock
A non-U.S. holder generally will not be subject to U.S. federal income tax in respect of gain recognized on a sale, exchange or other disposition of common stock, unless:
| · | the gain is effectively connected with the conduct of a trade or business by the non-U.S. holder within the United States (and, under certain income tax treaties, is attributable to a U.S. permanent establishment or fixed base maintained by the non-U.S. holder); |
| · | the non-U.S. holder is an individual who is present in the United States for 183 days or more in the taxable year of disposition and certain other conditions are met, and is not eligible for relief under an applicable income tax treaty; or |
| · | we are or have been a “United States real property holding corporation” (“USRPHC”) for U.S. federal income tax purposes at any time during the shorter of the five year period ending on the date of disposition or the non-U.S. holder’s holding period for the common stock disposed of, and, generally, in the case where our common stock is regularly traded on an established securities market, the non-U.S. holder has owned, directly or indirectly, more than 5 percent of the common stock disposed of, at any time during the shorter of the five year period ending on the date of disposition or the non-U.S. holder’s holding period for the common stock disposed of. |
There can be no assurance that our common stock will be treated as regularly traded on an established securities market for this purpose.
Unless an applicable tax treaty provides otherwise, gain described in the first and third bullet points above generally will be subject to U.S. federal income tax, net of certain deductions, at the same graduated tax rates applicable to U.S. persons. Any gains described in the first bullet point above of a non-U.S. holder that is a foreign corporation may also be subject to an additional “branch profits tax” at a 30 percent rate (or a lower applicable tax treaty rate). Any U.S. source capital gain of a non-U.S. holder described in the second bullet point above (which may be offset by U.S. source capital losses during the taxable year of the disposition) generally will be subject to a flat 30 percent U.S. federal income tax (or a lower applicable tax treaty rate).
In connection with the third bullet point above, we generally will be classified as a USRPHC if the fair market value of our “United States real property interests” equals or exceeds 50 percent of the sum of the fair market value of our worldwide real property interests plus our other assets used or held for use in a trade or business, as determined for U.S. federal income tax purposes. We believe that we currently are not a USRPHC, and we do not anticipate becoming a USRPHC (although no assurance can be given that we will not become a USRPHC in the future).
Information Reporting and Backup Withholding
Other than with respect to U.S. holders who are “exempt recipients,” we generally must report annually to the IRS and to each holder the amount of dividends and certain other distributions we pay to such holder on our common stock and the amount of tax, if any, withheld with respect to those distributions. In the case of a non-U.S. holder, copies of the information returns reporting those distributions and withholding may also be made available to the tax authorities in the country in which the non-U.S. holder is a resident under the provisions of an applicable income tax treaty or agreement. Information reporting is also generally required with respect to proceeds from the sales and other dispositions of our common stock to or through the U.S. office (and in certain cases, the foreign office) of a broker.
In addition, backup withholding of U.S. federal income tax, currently at a rate of 28 percent, generally will apply to distributions made on our common stock to, and the proceeds from sales and other dispositions of our common stock by, a non-corporate U.S. holder who:
| · | fails to provide an accurate taxpayer identification number; |
| · | is notified by the IRS that backup withholding is required; or |
| · | in certain circumstances, fails to comply with applicable certification requirements. |
A non-U.S. holder generally may eliminate the requirement for information reporting (other than with respect to distributions, as described above) and backup withholding by providing certification of its foreign status, under penalties of perjury, on a duly executed applicable IRS Form W-8 or by otherwise establishing an exemption.
Backup withholding is not an additional tax. Rather, the amount of any backup withholding will be allowed as a credit against a U.S. holder’s or a non-U.S. holder’s U.S. federal income tax liability and may entitle such holder to a refund, provided that certain required information is timely furnished to the IRS. Holders are urged to consult their own tax advisors regarding the application of backup withholding and the availability of and procedure for obtaining an exemption from backup withholding in their particular circumstances.
Recently Enacted Legislation Relating to Foreign Accounts
On March 18, 2010, the President signed the Hiring Incentives to Restore Employment Act into law. Effective for payments made after December 31, 2012, this law imposes a 30% U.S. federal withholding tax on distributions and the gross proceeds of sale in respect of our shares of common stock to a foreign financial institution or non-financial foreign entity, unless (i) in the case of a foreign financial institution, such institution enters into an agreement with the U.S. government to withhold on certain payments and to collect and provide to the U.S. tax authorities substantial information regarding U.S. account holders of such institution (which includes certain equity and debt holders of such institution, as well as certain account holders that are foreign entities with U.S. owners) and to withhold on certain payments and (ii) in the case of a non-financial foreign entity, such entity provides the withholding agent with a certification identifying the direct and indirect U.S. owners of the entity. Under certain circumstances, a non-U.S. shareholder might be eligible for refunds or credits of such taxes. Prospective investors should consult with their own tax advisor regarding the possible implications of this recently enacted legislation on the ownership and disposition of our common stock.
MATERIAL PRC INCOME TAX CONSIDERATIONS
The following discussion summarizes the material PRC income tax considerations relating to the ownership of our common stock following the consummation of this offering.
Resident Enterprise Treatment
Under Enterprise Income Tax Law of the PRC (“EIT Law”) that became effective on January 1, 2008, enterprises are classified as “resident enterprises” and “non-resident enterprises.” Enterprises established outside of China whose “de facto management bodies” are located in China are considered PRC “tax resident enterprises” and will generally be subject to the uniform 25% PRC enterprise income tax rate on their global income. In addition, a tax circular issued by the State Administration of Taxation on April 22, 2009 regarding the standards used to classify certain Chinese-invested enterprises established outside of China as “resident enterprises” clarified that dividends and other income paid by such “resident enterprises” will be considered to be PRC source income, subject to PRC withholding tax, currently at a rate of 10%, when recognized by non-PRC enterprise shareholders. This recent circular also subjects such “resident enterprises” to various reporting requirements with the PRC tax authorities. Under the implementation rules to the Enterprise Income Tax Law, a “de facto management body” is defined as a body that has material and overall management and control over the manufacturing and business operations, personnel and human resources, finances and other assets of an enterprise. In addition, the tax circular mentioned above details that certain Chinese-invested enterprises will be classified as “resident enterprises” if the following are located or resident in China: senior management personnel and departments that are responsible for daily production, operation and management; financial and personnel decision making bodies; key properties, accounting books, company seal, and minutes of board meetings and shareholders’ meetings; and half or more of the senior management or directors having voting rights.
Given the short history of the EIT Law and lack of applicable legal precedent, it remains unclear how the PRC tax authorities will determine the PRC tax resident treatment of a non-PRC company such as us. Our management is substantially based in the PRC and expected to be based in the PRC in the future, although two of our executive officers and one of our directors are not PRC nationals. If the PRC tax authorities determine that we are a “resident enterprise” for PRC enterprise income tax purposes, a number of unfavorable tax consequences could follow. First, we could be subject to the enterprise income tax at a rate of 25% on our global taxable income, as well as PRC enterprise tax reporting obligations. Second, although under the New EIT Law and its implementing rules dividends paid to us from our PRC subsidiary would qualify as “tax-exempted income”, we cannot assure you that such dividends will not be subject to a 10% withholding tax, as the PRC foreign exchange control authorities, which enforce the withholding tax, have not yet issued guidance with respect to the processing of outbound remittances to entities that are treated as resident enterprises for PRC EIT purposes. Finally, it is possible that future guidance issued with respect to the new “resident enterprise” classification could result in a situation in which a withholding tax of 10% for our non-PRC enterprise shareholders or a potential withholding tax of 20% for non-PRC individual shareholders is imposed on dividends we pay to them and with respect to gains derived by our non-PRC shareholders from transferring our shares. In addition to the uncertainty in how the new “resident enterprise” classification could apply, it is also possible that the rules may change in the future, possibly with retroactive effect. We are actively monitoring the “resident enterprise” classification rules and are evaluating appropriate organization changes to avoid this treatment, to the extent possible.
As of the date of this prospectus, there has not been a definitive determination as to the “resident enterprise” or “non-resident enterprise” status of us. However, since it is not anticipated that we would receive dividends or generate other income in the near future, we are not expected to have any income that would be subject to the 25% enterprise income tax on global income in the near future. We will consult with the PRC tax authorities and make any necessary tax payment if we (based on future clarifying guidance issued by the PRC), or the PRC tax authorities, determine that we are a resident enterprise under the EIT Law, and if we were to have income in the future.
Dividends From PRC Operating Companies
If we are not treated as resident enterprises under the EIT Law, then dividends that we receive may be subject to PRC withholding tax. The EIT Law and the implementing rules of the EIT Law provide that (A) an income tax rate of 25% will normally be applicable to investors that are “non-resident enterprises,” or non-resident investors, which (i) have establishments or premises of business inside the PRC, and (ii) the income in connection with their establishment or premises of business is sourced from the PRC or the income is earned outside the PRC but has actual connection with their establishments or places of business inside the PRC, and (B) an income tax rate of 10% will normally be applicable to dividends payable to investors that are “non-resident enterprises,” or non-resident investors, which (i) do not have an establishment or place of business in the PRC or (ii) have an establishment or place of business in the PRC, but the relevant income is not effectively connected with the establishment or place of business, to the extent such dividends are derived from sources within the PRC.
As described above, the PRC tax authorities may determine the resident enterprise status of entities organized under the laws of foreign jurisdictions, on a case-by-case basis. We are a holding company and substantially all of our income may be derived from dividends. Thus, if we are considered as a “non-resident enterprise” under the EIT Law and the dividends paid to us are considered income sourced within the PRC, such dividends received may be subject to the income tax described in the foregoing paragraph.
As of the date of this prospectus, there has not been a definitive determination as to the “resident enterprise” or “non-resident enterprise” status of us. As indicated above, however, we are not expected to be paid any dividends in the near future. We will consult with the PRC tax authorities and make any necessary tax withholding if, in the future, we were to be paid any dividends and we (based on future clarifying guidance issued by the PRC), or the PRC tax authorities, determine that we are a non-resident enterprise under the EIT Law.
Dividends that Non-PRC Resident Investors Receive From Us; Gain on the Sale or Transfer of Our Common Stock
If dividends payable to (or gains recognized by) our non-resident investors are treated as income derived from sources within the PRC, then the dividends that non-resident investors receive from us and any such gain on the sale or transfer of our common stock, may be subject to taxes under PRC tax laws.
Under the EIT Law and the implementing rules of the EIT Law, PRC income tax at the rate of 10% is applicable to dividends payable to investors that are “non-resident enterprises,” or non-resident investors, which (i) do not have an establishment or place of business in the PRC or (ii) have an establishment or place of business in the PRC but the relevant income is not effectively connected with the establishment or place of business, to the extent that such dividends have their sources within the PRC. Similarly, any gain realized on the transfer of common stock by such investors is also subject to 10% PRC income tax if such gain is regarded as income derived from sources within the PRC.
The dividends paid by us to non-resident investors with respect to our common stock, or gain non-resident investors may realize from sale or the transfer of our common stock, may be treated as PRC-sourced income and, as a result, may be subject to PRC tax at a rate of 10%. In such event, we also may be required to withhold a 10% PRC tax on any dividends paid to non-resident investors. In addition, non-resident investors in our common stock may be responsible for paying PRC tax at a rate of 10% on any gain realized from the sale or transfer of our common stock after the consummation of the offering if such non-resident investors and the gain satisfy the requirements under the EIT Law and its implementing rules. However, under the EIT Law and its implementing rules, we would not have an obligation to withhold income tax in respect of the gains that non-resident investors (including U.S. investors) may realize from the sale or transfer of our common stock from and after the consummation of this offering.
If we were to pay any dividends in the future, we would again consult with the PRC tax authorities and if we (based on future clarifying guidance issued by the PRC), or the PRC tax authorities, determine that we must withhold PRC tax on any dividends payable by us under the EIT Law, we will make any necessary tax withholding on dividends payable to our non-resident investors. If non-resident investors as described under the EIT Law (including U.S. investors) realized any gain from the sale or transfer of our common stock and if such gain were considered as PRC-sourced income, such non-resident investors would be responsible for paying 10% PRC income tax on the gain from the sale or transfer of our common stock. As indicated above, under the EIT Law and its implementing rules, we would not have an obligation to withhold PRC income tax in respect of the gains that non-resident investors (including U.S. investors) may realize from the sale or transfer of our common stock from and after the consummation of this offering.
Penalties for Failure to Pay Applicable PRC Income Tax
Non-resident investors in us may be responsible for paying PRC tax at a rate of 10% on any gain realized from the sale or transfer of our common stock after the consummation of this offering if such non-resident investors and the gain satisfy the requirements under the EIT Law and its implementing rules, as described above.
According to the EIT Law and its implementing rules, the PRC Tax Administration Law (the “Tax Administration Law”) and its implementing rules, the Provisional Measures for the Administration of Withholding of Enterprise Income Tax for Non-resident Enterprises (the “Administration Measures”) and other applicable PRC laws or regulations (collectively the “Tax Related Laws”), where any gain derived by non-resident investors from the sale or transfer of our common stock is subject to any income tax in the PRC, and such non-resident investors fail to file any tax return or pay tax in this regard pursuant to the Tax Related Laws, they may be subject to certain fines, penalties or punishments, including without limitation: (1) if a non-resident investor fails to file a tax return and present the relevant information in connection with tax payments, the competent tax authorities shall order it to do so within the prescribed time limit and may impose a fine up to RMB 2,000, and in egregious cases, may impose a fine ranging from RMB 2,000 to RMB 10,000; (2) if a non-resident investor fails to file a tax return or fails to pay all or part of the amount of tax payable, the non-resident investor shall be required to pay the unpaid tax amount payable, a surcharge on overdue tax payments (the daily surcharge is 0.05% of the overdue amount, beginning from the day the deferral begins), and a fine ranging from 50% to 500% of the unpaid amount of the tax payable; (3) if a non-resident investor fails to file a tax return or pay the tax within the prescribed time limit according to the order by the PRC tax authorities, the PRC tax authorities may collect and check information about the income items of the non-resident investor in the PRC and other payers (the “Other Payers”) who will pay amounts to such non-resident investor, and send a “Notice of Tax Issues” to the Other Payers to collect and recover the tax payable and impose overdue fines on such non-resident investor from the amounts otherwise payable to such non-resident investor by the Other Payers; (4) if a non-resident investor fails to pay the tax payable within the prescribed time limit as ordered by the PRC tax authorities, a fine may be imposed on the non-resident investor ranging from 50% to 500% of the unpaid tax payable; and the PRC tax authorities may, upon approval by the director of the tax bureau (or sub-bureau) of, or higher than, the county level, take the following compulsory measures: (i) notify in writing the non-resident investor’s bank or other financial institution to withhold from the account thereof for payment of the amount of tax payable, and (ii) detain, seal off, or sell by auction or on the market the non-resident investor’s commodities, goods or other property in a value equivalent to the amount of tax payable; or (5) if the non-resident investor fails to pay all or part of the amount of tax payable or surcharge for overdue tax payment, and can not provide a guarantee to the tax authorities, the tax authorities may notify the frontier authorities to prevent the non-resident investor or their legal representative from leaving the PRC.
UNDERWRITING
Subject to the terms and conditions in the underwriting agreement, dated , 2010, by and between us, Brean Murray, Carret & Co., LLC, who is acting as the book-running management and representative of underwriters of this offering, each underwriter has agreed to purchase from us and we have severally agreed to sell, on a firm commitment basis, the number of shares of common stock set forth below, at the public offering price, less the underwriting discount set forth on the cover page of this prospectus.
| Underwriter | | Number of Common Stock | |
| Brean Murray, Carret & Co., LLC | | | | |
| | | | |
| Total | | | | |
The underwriters have agreed to purchase all shares of common stock offered by this prospectus (other than those covered by the over-allotment option described below), if any are purchased. The underwriting agreement provides that the obligations of the underwriters to pay for and accept delivery of the common stock are subject to the passing upon certain legal matters by counsel and certain conditions such as confirmation of the accuracy of representations and warranties by us about our financial condition and operations and other matters.
Commissions and Discounts
The following table shows the underwriting fees to be paid to the underwriters in connection with this offering. These amounts are shown assuming both no exercise and full exercise of the over-allotment option.
| | No Exercise | | | Full Exercise | |
| Per share | | $ | | | | $ | | |
| Total | | $ | | | | $ | | |
We have also agreed to advance $50,000 to Brean Murray, Carret & Co., LLC against reasonable and customary out-of-pocket expenses, and to reimburse Brean Murray, Carret & Co., LLC up to $70,000 for legal expenses provided by outside counsel and up to $60,000 for other reasonable and customary out-of-pocket expenses incurred by Brean Murray, Carret & Co., LLC.
United Best, our foreign advisor, will receive a fee of $ ($ if the over-allotment option is exercised in full), which is in addition to the underwriting discounts and commissions in the above table. We estimate that the total fees and expenses payable by us, excluding underwriting discounts and commissions, and the fee payable to United Best will be approximately million.
Pricing of Securities
The underwriters have advised us that they propose to offer the shares to the public at $ per share. The underwriters propose to offer the shares to certain dealers at the same price less a concession of not more than $ per share. The underwriters may allow, and the dealers may reallow, a concession of not more than $ per share on sales to certain other brokers and dealers. After this offering, these figures may be changed by the underwriters.
The initial public offering price for shares of our common stock offered by this prospectus was negotiated by us and the underwriters. The factors considered in determining the initial public offering price include the history of and the prospects for the industry in which we compete, our past and present operations, our historical results of operations, our prospectus for future earnings, the recent market prices of securities of generally comparable companies and the general condition of the securities markets at the time of this offering and other relevant factors. There can be no assurance that the initial public offering price of shares of our common stock will correspond to the price at which our shares will trade in the public market subsequent to this offering or that an active public market for our common stock will develop and continue after this offering.
Over-allotment Option
We have granted the underwriters an over-allotment option. This option, which is exercisable for up to 45 days after the date of this prospectus, permits the underwriters to purchase a maximum of additional shares of common stock from us to cover over-allotments. If the underwriters exercise all or part of this option, they will purchase shares of common stock covered by the option at the public offering price that appears on the cover page of this prospectus, less the same underwriting discount as set forth above. The underwriters have severally agreed that to the extent the over-allotment option is exercised they will each purchase a number of additional shares of common stock proportionate to the underwriter's initial amount reflected in the table above.
Underwriter’s Warrants
We have also agreed to issue to Brean Murray, Carret & Co., LLC, and/or its designees as a warrant to purchase a number of shares of common stock equal to an aggregate of 5% of the shares of common stock sold in the offering, excluding over-allotments, if any. The warrant will have an exercise price equal to 125% of the offering price of the shares of common stock sold in this offering. The warrant will be exercisable for four years commencing one year after the effective date of the registration statement, and will therefore cease to be exercisable five years after the effective date of the registration statement. Pursuant to the rules of the Financial Industry Regulatory Authority, Inc., or FINRA (formerly the NASD), and in particular Rule 5110, the warrant (and underlying shares) issued to Brean Murray, Carret & Co., LLC, may not be sold, transferred, assigned, pledged, or hypothecated, or be the subject of any hedging, short sale, derivative, put or call transaction that would result in the effective disposition of the securities by any person for a period of 180 days immediately following the date of delivery and payment for the shares offered; provided, however, that the warrant (and underlying shares) may be transferred to officers or partners of the representatives and members of the underwriting syndicate and their officers or partners as long as the warrant (and underlying shares) remain subject to the lockup.
Lock-Up Agreements
We and each of our directors, executive officers, 5% shareholders and other existing stockholders are subject to lock-up agreements that, subject to certain exceptions, prohibit us and them from, (1) offering, pledging, announcing the intention to sell, selling, contracting to sell, selling any option or contract to purchase, purchasing any option or contract to sell, granting any option, right or warrant to purchase, making any short sale or otherwise transferring or disposing of, directly or indirectly, any shares of our common stock or any securities convertible into, exercisable or exchangeable for or that represent the right to receive our shares of common stock, whether now owned or hereafter acquired, or (2) entering into any swap or other agreement that transfers, in whole or in part, any of the economic consequences of ownership of our shares of common stock, whether any such transaction described in clause (1) or (2) foregoing is to be settled by delivery of shares of common stock or such other securities, in cash or otherwise, for a period of at least 90 days following the effective date of the registration statement without the prior written consent of the underwriters' representative.
The lock-up period in all of the lock-up agreements is subject to extension if (1) during the last 17 days of the lock-up period, we release earnings results or material news or a material event relating to us occurs, or (2) prior to the expiration of the lock-up period, we announce that we will release earnings results during the 16-day period beginning on the last day of the lock-up period, in which cases the restrictions imposed in these lock-up agreements shall continue to apply until the expiration of the 18-day period beginning on the issuance of the earnings release or the occurrence of the material news or material event.event, unless the underwriters’ representative waives the extension in writing.
The underwriters' represetative may agree at its discretion and at any time or from time to time, without notice, to release all or any portion of the shares subject to the lock-up agreements described above.
Other Terms
The underwriting agreement provides for indemnification by and among us andWe have agreed to indemnify the underwriters against specifiedcertain liabilities, including civil liabilities under the Securities Act, and for contribution by us and the underwritersor to contribute to payments that the underwriters may be required to be made withmake in respect toof those liabilities.
We have been advisedagreed that, upon successful completion of this offering, for a period of twelve (12) months from the closing of this offering, we will grant Brean Murray, Carret & Co., LLC the right of participation to act as, in our discretion, lead underwriter or minimally as a co-manager with at least 50.0% of the economics, or, in the opinioncase of a three-underwriter or -placement agent transaction, 33.0% of the Securitieseconomics, for each and Exchange Commission, indemnificationevery future public and private equity and public debt offering of liabilities under the Securities Act is against public policy as expressed inCompany (or any successor to or subsidiary of the Securities Act, and is therefore, unenforceable.Company) during such twelve (12) month period.
Price Stabilization, Short Positions, Passive Market-Making
In connection with this offering, the underwriters may engage in activities that stabilize, maintain, or otherwise affect the price of our shares of common stock, including:
| | · | stabilizing transactions; |
| | · | purchases to cover positions created by short sales; |
| | · | imposition of penalty bids; |
| | · | covering transactions; and |
Stabilizing transactions consist of bids or purchases made for the purpose of preventing or retarding a decline in the market price of our shares of common stock while this offering is in progress. These transactions may also include making short sales of our shares of common stock, which involve the sale by the underwriters of a greater number of shares of common stock than they are required to purchase in this offering. Short sales may be “covered short sales,” which are short positions in an amount not greater than the underwriters’ over-allotment option referred to above, or may be “naked short sales,” which are short positions in excess of that amount. The effect of these transactions may be to stabilize or maintain the market price of our securities at a level above that which might otherwise prevail in the open market.
The underwriters may close out any covered short position either by exercising their over-allotment option, in whole or in part, or by purchasing shares in the open market. In making this determination, the underwriters will consider, among other things, the price of shares available for purchase in the open market compared to the price at which they may purchase shares through the over-allotment option. The underwriters must close out any naked short position by purchasing shares in the open market. A naked short position is more likely to be created if the underwriters are concerned that there may be downward pressure on the price of the common stock in the open market that could adversely affect investors who purchased in this offering.
The underwriters also may impose a penalty bid, which occurs when a particular underwriter repays to the underwriters’ represetativerepresentative a portion of the underwriting discount received by it because the underwriter’s has repurchased shares sold by or for the account of that underwriter in stabilizing or short-covering transactions.
As a result of these activities, the price of our common stock may be higher than the price that otherwise might exist in the open market. If these activities are commenced, they may be discontinued by the underwriters at any time. The underwriters may carry out these transactions on NASDAQ Global Market or the NASDAQ Capital Market, in the over-the-counter market, or otherwise.
In addition, in connection with this offering, certain of the underwriters (and selling group members) may engage in passive market-making transactions in our common stock on NASDAQ Global Market or the NASDAQ Capital Market or in the over-the-counter market prior to the pricing and completion of this offering. Passive market-making consists of displaying bids on NASDAQ Global Market or the NASDAQ Capital Market or in the over-the-counter market no higher than the bid prices of independent market makers and making purchases at prices no higher than these independent bids and effected in response to order flow. Net purchases by a passive market maker on each day are generally limited to a specified percentage of the passive market maker’s average daily trading volume in the common stock during a specified period and must be discontinued when such limit is reached. Passive market-making may cause the price of our common stock to be higher than the price that otherwise would exist in the open market in the absence of these transactions. If passive market-making is commenced, it may be discontinued at any time. Neither we nor the underwriters make any representation or prediction as to the effect that the transactions described above may have on the prices of our securities.
Other Matters
A prospectus in electronic format may be made available on a website maintained by the representative of the underwriters and may also be made available on a website maintained by other underwriters. The underwriters may agree to allocate a number of shares for sale to its online brokerage account holders. Internet distributions will be allocated by the representative of the underwriters to underwriters that may make Internet distributions on the same basis as other allocations. In connection with the offering, the underwriters or syndicate members may distribute prospectuses electronically. No forms of electronic prospectus other than prospectuses that are printable as Adobe® PDF will be used in connection with this offering.
The underwriters have informed us that they do not expect to confirm sales of common stock offered by this prospectus to accounts over which they exercise discretionary authority.
Selling Restrictions
General
No action has been or will be taken by us or by any underwriter in any jurisdiction except in the United States that would permit a public offering of our common stock, or the possession, circulation or distribution of this prospectus or any other material relating to us and our common stock in any country or jurisdiction where action for that purpose is required. Accordingly, our common stock may not be offered or sold, directly or indirectly, and neither this prospectus nor any other material or advertisements in connection with this offering may be distributed or published, in or from any country or jurisdiction except in compliance with any applicable rules and regulations of any such country or jurisdiction. The foregoing restrictions do not apply to stabilization transactions.
United Kingdom
In the United Kingdom, the common stock offered by this prospectus are directed to and will only be available for purchase to a person who is an exempt person as referred to at paragraph (c) below and who warrants, represents and agrees that: (a) it has not offered or sold, will not offer or sell, any common stock offered by this prospectus to any person in the United Kingdom except in circumstances which do not constitute an offer to the public in the United Kingdom for the purposes of the section 85 of the Financial Services and Markets Act 2000 (as amended) (“FSMA”); and (b) it has complied and will comply with all applicable provisions of FSMA and the regulations made thereunder in respect of anything done by it in relation to the common stock offered by this prospectus in, from or otherwise involving the United Kingdom; and (c) it is a person who falls within the exemptions to Section 21 of the FSMA as set out in The Financial Services and Markets Act 2000 (Financial Promotion) Order 2005 (“the Order”), being either an investment professional as described under Article 19 or any body corporate (which itself has or a group undertaking has a called up share capital or net assets of not less than £500,000 (if more than 20 members) or otherwise £5 million) or an unincorporated association or partnership (with net assets of not less than £5 million) or is a trustee of a high value trust or any person acting in the capacity of director, officer or employee of such entities as defined under Article 49(2)(a) to (d) of the Order, or a person to whom the invitation or inducement may otherwise lawfully be communicated or cause to be communicated. The investment activity to which this document relates will only be available to and engaged in only with exempt persons referred to above. Persons who are not investment professionals and do not have professional experience in matters relating to investments or are not an exempt person as described above, should not review nor rely or act upon this document and should return this document immediately. It should be noted that this document is not a prospectus in the United Kingdom as defined in the Prospectus Regulations 2005 and has not been approved by the Financial Services Authority or any competent authority in the United Kingdom.
European Economic Area
In relation to each member state of the European Economic Area which has implemented the Prospectus Directive (each, a “Relevant Member State”), with effect from and including the date on which the Prospectus Directive is implemented in that Relevant Member State, no offer of our common stock has been made or will be made to the public in that Relevant Member State, except that, with effect from and including such date, an offer of our common stock may be made to the public in the Relevant Member State at any time:
| | · | to legal entities which are authorized or regulated to operate in the financial markets or, if not so authorized or regulated, whose corporate purpose is solely to invest in securities; |
| | · | to any legal entity which has two or more of (1) an average of at least 250 employees during the last financial year; (2) a total balance sheet of more than €43,000,000 and (3) an annual net turnover of more than €50,000,000, as shown in its last annual or consolidated accounts; |
| | · | to fewer than 100 natural or legal persons (other than qualified investors as defined in the Prospectus Directive); or |
| | · | in any other circumstances which do not require the publication by us of a prospectus pursuant to Article 3 of the Prospectus Directive. |
For the purposes of this provision, the expression an “offer of our common stock to the public” in relation to any common stock in any Relevant Member State means the communication in any form and by any means of sufficient information on the terms of the offer and any common stock to be offered so as to enable an investor to decide to purchase any common stock, as the same may be varied in that Relevant Member State by any measure implementing the Prospectus Directive in that Relevant Member State and the expression “Prospectus Directive” means Directive 2003/71/EC and includes any relevant implementing measure in each Relevant Member State.
Switzerland
This document does not constitute a prospectus within the meaning of Art. 652a of the Swiss Code of Obligations. Our common stock may not be sold directly or indirectly in or into Switzerland except in a manner which will not result in a public offering within the meaning of the Swiss Code of Obligations. Neither this document nor any other offering materials relating to our common stock may be distributed, published or otherwise made available in Switzerland except in a manner which will not constitute a public offer of our common stock in Switzerland.
Hong Kong
Our common stock may not be offered or sold by means of any document other than: (i) in circumstances which do not constitute an offer to the public within the meaning of the Companies Ordinance (Cap. 32, Laws of Hong Kong), (ii) to “professional investors” as defined in the Securities and Futures Ordinance (Cap. 571, Laws of Hong Kong) and any rules thereunder, or (iii) in other circumstances which do not result in the document being a “prospectus” within the meaning of the Companies Ordinance. No advertisement, invitation or other document relating our common stock may be issued, whether in Hong Kong or elsewhere, where such document is directed at, or the contents are likely to be accessed or read by, the public of Hong Kong (except if permitted to do so under the laws of Hong Kong), other than with respect to such common stock that are intended to be disposed of only to persons outside of Hong Kong or only to “professional investors” as defined in the Securities and Futures Ordinance and any rules thereunder.
People’s Republic of China
This prospectus may not be circulated or distributed in the PRC and the shares may not be offered or sold, and will not offer or sell to any person for re-offering or resale directly or indirectly to any resident of the PRC except pursuant to applicable laws and regulations of the PRC. For the purpose of this paragraph, PRC does not include Taiwan and the special administrative regions of Hong Kong and Macau.
Singapore
This prospectus has not been registered as a prospectus with the Monetary Authority of Singapore. Accordingly, this prospectus and any other document or material in connection with the offer or sale, or invitation for subscription or purchase, of our common stock may not be circulated or distributed, nor may our common stock be offered or sold, or be made the subject of an invitation for subscription or purchase, whether directly or indirectly, to persons in Singapore other than (i) to an institutional investor under Section 274 of the Securities and Futures Act, Chapter 289 of Singapore (the “SFA”), (ii) to a relevant person, or any person pursuant to Section 275(1A), and in accordance with the conditions, specified in Section 275 of the SFA or (iii) otherwise pursuant to, and in accordance with the conditions of, any other applicable provision of the SFA.
Where the shares of common stock are subscribed or purchased under Section 275 by a relevant person which is:
| · | a corporation (which is not an accredited investor) the sole business of which is to hold investments and the entire share capital of which is owned by one or more individuals, each of whom is an accredited investor; or |
| · | a trust (where the trustee is not an accredited investor) whose sole purpose is to hold investments and each beneficiary is an accredited investor, shares, debentures and units of shares and debentures of that corporation or the beneficiaries’ rights and interest in that trust shall not be transferable for six months after that corporation or that trust has acquired the common stock under Section 275 except: (i) to an institutional investor or to a relevant person, or to any person pursuant to an offer that is made on terms that such rights or interest are acquired at a consideration of not less than $200,000 (or its equivalent in a foreign currency) for each transaction, whether such amount is to be paid for in cash or by exchange of securities or other assets; (ii)where no consideration is given for the transfer; or (iii) by operation of law. |
Israel
The common stock offered by this prospectus have not been approved or disapproved by the Israeli Securities Authority (ISA). The common stock may not be offered or sold, directly or indirectly, to the public in Israel. The ISA has not issued permits, approvals or licenses in connection with the offering of the common stock or publishing the prospectus; nor has it authenticated the details included herein, confirmed their reliability or completeness, or rendered an opinion as to the quality of the securities being offered. Any resale, directly or indirectly, to the public of the common stock offered by this prospectus is subject to restrictions on transferability and must be effected only in compliance with the Israeli securities laws and regulations.
LEGAL MATTERS
The validity of the shares sold by us under this prospectus will be passed upon by Guzov Ofsink, LLC, New York, New York. Pillsbury Winthrop Shaw Pittman, LLP, Washington, D.C. and Global Law Office, China, will pass upon certain legal matters for the underwriters. Legal matters as to PRC law will be passed upon for us by Han Kun Law Firm. Pillsbury Winthrop Shaw Pittman LLP may rely upon Global Law Office with respect to matters governed by PRC law.
With respect to certain matters involving the enforcement of foreign judgments in the PRC and the bringing of original actions in the PRC predicated solely on the federal securities laws of the United States, Han Kun Law Firm, has given us certain advice.
SERVICE OF PROCESS AND ENFORCEMENT OF JUDGMENTS
We are a company incorporated under the laws of the State of Delaware in the United States. However, all of our business, assets and operations are located in China. In addition, a substantial majority of our directors and officers reside outside of the United States. As a result, it may be difficult for United States investors to effect service of process within the United States upon us or such persons or to enforce against us or them, judgments obtained in United States courts, including judgments predicated upon the civil liability provisions of the securities laws of the United States or any State thereof.
Han Kun Law Offices, our counsel as to Chinese law, has advised us that there is uncertainty as to whether the courts of China would (1) recognize or enforce judgments of United States courts obtained against us or such persons predicated upon the civil liability provisions of the securities laws of the United States or any State thereof, or (2) be competent to hear original actions brought in each respective jurisdiction, against us or such persons predicated upon the securities laws of the United States or any State thereof.
Han Kun Law Offices has advised us that the recognition and enforcement of foreign judgments are provided for under the Chinese Civil Procedure Law. Chinese courts may recognize and enforce foreign judgments in accordance with the requirements of the Chinese Civil Procedure Law based either on treaties between China and the country where the judgment is made or in reciprocity between jurisdictions. China does not have any treaties or other agreements with the United States that provide for the reciprocal recognition and enforcement of foreign judgments. As a result, it is uncertain whether a Chinese court would enforce a judgment rendered by a court in the United States.
We have appointed Vcorp Services, LLC as our agent to receive service of process with respect to any action brought against us in a court in the United States.
EXPERTS
Child Van Wagoner & Bradshaw, PLLC, independent registered public accountants, located in Utah, have audited our financial statements included in this registration statement to the extent and for the periods set forth in their report. We have relied on such reports given upon the authority of such firm as experts in accounting and auditing.
WHERE YOU CAN FIND MORE INFORMATION
We file annual, quarterly and other reports, proxy statements and other information with the SEC under the Securities Exchange Act of 1934. You may read and copy any materials we file with the SEC at the SEC’s public reference room at 100 F Street, N.E., Washington, D.C. 20549. Please call the SEC at 1-800-SEC-0330 for further information on the public reference room. Our SEC filings are also available to the public through the SEC’s website at http://www.sec.gov.
INDEX TO FINANCIAL STATEMENTS
1. Unaudited Condensed Consolidated Financial Statements of China SLP Filtration Technology, Inc. as of March 31,June 30, 2010 and March 31,June 30, 2009 and for the three month and sixnine month periods ended March 31,June 30, 2010 and 2009. | | |
| | | | |
| i. | Unaudited Condensed Consolidated Balance Sheets as of March 31,June 30, 2010 and March 31,June 30, 2009 | | F-2 |
| | | |
ii. | Unaudited Condensed Consolidated Statements of Operations and Comprehensive Loss for the three and six months ended March 31, 2010 and March 31, 2009 | | F-3 |
| | | | |
| iii. | Unaudited Condensed Consolidated Statements of Operations and Comprehensive Income for the three and nine months ended June 30, 2010 and June 30, 2009 | | F-3 |
| | | |
| iv. | Unaudited Condensed Consolidated Statements of Cash Flows for the three and sixnine months ended March 31,June 30, 2010 and March 31,June 30, 2009 | | F-4 |
| | | | |
iv.v. | Unaudited Condensed Consolidated Statement of Changes in Stockholders’ Equity | | F-5 |
| | | | |
vvi. | Notes to Unaudited Consolidated Financial Statements | | F-6 |
| | | | |
| 2. Unaudited Pro Forma Consolidated Financial Statements of China SLP Filtration Technology, Inc. as of June 30, 2010 | | F-17 |
| | | |
| i. | Notes to Unaudited Pro Forma Consolidated Financial Statements | | F-21 |
| | | |
3. Audited Consolidated Financial Statements of Technic International LtdChina SLP Filtration Technology, Inc. as of September 30, 2009 and 2008 and for the years ended September 30, 2009 and 2008 | | |
| | | | |
| i. | Report of Independent Registered Public Accounting Firm | | F-14F-23 |
| | | | |
| ii. | Consolidated Balance Sheets as of September 30, 2009 and 2008 | | F-15F-24 |
| | | | |
iv.iii. | Consolidated Statements of Operations and Comprehensive Income (Loss) for the years ended September 30, 2009 and 2008 | | F-16F-25 |
| | | | |
| iv. | Consolidated Statements of Cash Flows for the years ended September 30, 2009 and 2008 | | F-17F-26 |
| | | | |
vi.v. | Consolidated StatementStatements of Stockholders' Equity for the years ended September 30, 2009 and 2008 | | F-18F-27 |
| | | | |
vii.vi. | Notes to Consolidated Financial Statements | | F-19F-28 |
| | | |
| 4. Unaudited Condensed Financial Statements of Perpetual Technologies, Inc. as of September 30, 2009 and 2008 and for the years ended September 30, 2009 and 2008 | | |
| | | |
| i. | Unaudited Condensed Balance Sheets as of September 30, 2009 and 2008 | | F-39 |
| | | |
| ii. | Unaudited Condensed Statements of Operations for the years ended September 30, 2009 and 2008 | | F-40 |
| | | |
| iii. | Unaudited Statements of Cash Flows for the years ended September 30, 2009 and 2008 | | F-41 |
| | | |
| iv. | Notes to Consolidated Financial Statements | | F-42 |
CHINA SLP FILTRATION TECHNOLOGY, INC.
CONSOLIDATED BALANCE SHEETS
| | | March 31, | | | September 30, | | | June 30, | | September 30, | |
| | | 2010 | | | 2009 | | | 2010 | | 2009 | |
| | | (Unaudited) | | | (audited) | | | (Unaudited) | | | |
| ASSETS | | | | | | | |
| | | | | | | | | | | | |
| Current Assets | | | | | | | | | | | |
| Cash and cash equivalents | | $ | 6,092,334 | | | $ | 3,297,648 | | | $ | 6,333,417 | | $ | 3,297,648 | |
| Accounts receivable – Net | | | 1,914,786 | | | | 1,424,835 | | | | 2,258,662 | | | | 1,424,835 | |
| Advance to suppliers | | | 1,341,121 | | | | 685,551 | | | | 453,174 | | | | 685,551 | |
| Inventory | | | 1,022,404 | | | | 1,197,289 | | | | 1,490,078 | | | | 1,197,289 | |
| Prepaid expenses and other current assets | | | 189,535 | | | | 45,656 | | | | 279,595 | | | | 45,656 | |
| Total Current Assets | | | 10,560,180 | | | | 6,650,979 | | | | 10,814,926 | | | | 6,650,979 | |
| | | | | | | | | | | | | | |
| Deposits | | | 1,946,280 | | | | - | | | | 2,193,202 | | - | |
| Property and equipment – Net | | | 10,130,508 | | | | 10,711,865 | | | | 11,032,609 | | | | 10,711,865 | |
| Receivable from related party | | | 213,035 | | | | 773,672 | | | 1,111 | | | | 773,672 | |
| Land use rights – Net | | | 530,364 | | | | 537,350 | | | | 531,506 | | | | 537,350 | |
| Total Assets | | $ | 23,380,367 | | | $ | 18,673,866 | | | $ | 24,573,354 | | $ | 18,673,866 | |
| | | | | | | | | | | | | | |
| LIABILITIES AND STOCKHOLDERS' EQUITY | | | | | | | | | | | | | |
| Current Liabilities | | | | | | | | | | | | | |
| Short term loan | | $ | 3,803,327 | | | $ | 4,578,409 | | | $ | 3,833,994 | | | $ | 4,578,409 | |
| Accounts payable and accrued liabilities | | | 371,247 | | | | 410,114 | | | | 696,703 | | | | 410,114 | |
| Client's deposits | | | - | | | | 75,176 | | | - | | 75,176 | |
| Taxes payable | | | 17,154 | | | | 726 | | | 9,378 | | 726 | |
| Warrants liabilities | | | 1,052,000 | | | | - | | | 690,000 | | - | |
| Convertible notes payable $4,140,000, net of discount $2,134,793 | | | 2,005,207 | | | | - | | |
| Convertible notes payable $4,140,000, net of discount | | | | 2,615,107 | | | - | |
| | | | | | | | | | | | | | |
| Total Current Liabilities | | | 7,248,935 | | | | 5,064,425 | | | | 7,845,182 | | | | 5,064,425 | |
| | | | | | | | | | | | | | | | |
| Total Liabilities | | | 7,248,935 | | | | 5,064,425 | | | | 7,845,182 | | | | 5,064,425 | |
| | | | | | | |
| Stockholder's Equity | | | | | | | | | | | | | |
| | | | | | | | | | |
| Common stock, $0.001 par value, 40,000,000 shares authorized, 15,235,714 and 14,510,214 shares issued and outstanding at March 31, 2010 and September 30, 2009 | | | 15,236 | | | | 14,510 | | |
| Additional paid-in Capital | | | 8,205,582 | | | | 7,548,752 | | |
| Preferred stock, $0.001 par value, 10,000,000 shares authorized, o shares issued and outstanding | | | - | | - | |
| Common stock, $0.001 par value, 40,000,000 shares authorized, 15,235,714 and 14,510,204 shares issued and outstanding at June 30, 2010 and September 30, 2009 | | | 15,236 | | 14,510 | |
| Additional paid-in capital | | | | 8,205,582 | | 7,548,752 | |
| Retained earnings | | | 6,390,212 | | | | 4,500,532 | | | | 6,824,980 | | | | 4,500,532 | |
| Accumulated other comprehensive income | | | 1,520,402 | | | | 1,545,647 | | | | 1,682,374 | | | | 1,545,647 | |
| Total Stockholder's Equity | | | 16,131,432 | | | | 13,609,441 | | |
| Total Stockholders' Equity | | | | 16,728,172 | | | | 13,609,441 | |
| | | | | | | | | | | | | | | | |
| Total Liabilities and Stockholder's Equity | | $ | 23,380,367 | | | $ | 18,673,866 | | | $ | 24,573,354 | | $ | 18,673,866 | |
See accompanying notes to financial statements
CHINA SLP FILTRATION TECHNOLOGY, INC.
CONSOLIDATED STATEMENTS OF OPERATIONS AND COMPREHENSIVE INCOME
(Unaudited)
| | | Three Months Ended | | Six Months Ended | | | Three Months Ended | | Nine Months Ended | |
| | | March 31 | | March 31 | | | June 30 | | June 30 | |
| | | 2010 | | 2009 | | 2010 | | 2009 | | | 2010 | | 2009 | | 2010 | | 2009 | |
| Net Sales | | $ | 4,628,671 | | $ | 2,214,940 | | $ | 9,847,025 | | $ | 4,540,833 | | | $ | 5,072,791 | | | $ | 2,482,212 | | | $ | 14,919,816 | | | $ | 7,023,045 | |
| Cost of Sales | | | 3,237,311 | | | 1,373,921 | | | 6,843,833 | | | 2,906,402 | | | | 3,537,571 | | | | 1,779,328 | | | | 10,381,404 | | | | 4,685,730 | |
| Gross Profit | | 1,391,360 | | 841,019 | | 3,003,192 | | 1,634,431 | | | | 1,535,220 | | | | 702,884 | | | | 4,538,412 | | | | 2,337,315 | |
| Selling, General and Administration expenses | | | 407,461 | | | 275,526 | | | 662,138 | | | 758,442 | | |
| | | | | | | | | | | |
| Selling, General and Administrative Expenses | | | | 701,436 | | | | 266,101 | | | | 1,363,574 | | | | 1,024,543 | |
| Income from Operations | | 983,899 | | 565,493 | | 2,341,054 | | 875,989 | | | | 833,784 | | | | 436,783 | | | | 3,174,838 | | | | 1,312,772 | |
| | | | | | | | | | | | | | | | | | | |
| Other income (expense) | | | | | | | | | | |
| Other Income (expense) | | | | | | | | | | |
| Interest Income | | 292 | | - | | 517 | | - | | | | 10,106 | | | | 2,104 | | | | 10,623 | | | | 2,104 | |
| Interest Expense | | (390,355 | ) | | (76,286 | ) | | (452,387 | ) | | (160,506 | ) | | | (764,794 | ) | | | (65,162 | ) | | | (1,216,685 | ) | | | (225,668 | ) |
| Gain on disposal of fixed assets | | | 496 | | | - | | | 496 | | | 16,263 | | |
| Total other income (expenses) | | | (389,567 | ) | | | (76,286 | ) | | | (451,374 | ) | | | (144,243 | ) | |
| Loss on disposal of fixed assets | | | | - | | | | (16,263 | ) | | | - | | | | - | |
| Changes in Fair Value of Warrants | | | | 362,000 | | | | - | | | | 362,000 | | | | - | |
| Total Other Income (expenses) | | | | (392,688 | ) | | | (79,321 | ) | | | (844,062 | ) | | | (223,564 | ) |
| Income before IncomeTaxes | | 594,332 | | 489,207 | | 1,889,680 | | 731,746 | | | | 441,096 | | | | 357,462 | | | | 2,330,776 | | | | 1,089,208 | |
| Income tax provision | | | - | | | - | | | - | | | - | | |
| Income Tax Provision | | | | 6,328 | | | | - | | | | 6,328 | | | | - | |
| Net Income | | $ | 594,332 | | $ | 489,207 | | $ | 1,889,680 | | $ | 731,746 | | | $ | 434,768 | | | $ | 357,462 | | | $ | 2,324,448 | | | $ | 1,089,208 | |
| | | | | | | | | | | | | | | | | | | |
| Other Comprehensive Income | | | | | | | | | | | | | | | | | | |
| Foreign Currency Translation Adjustments | | | (23,939 | ) | | | 14,446 | | | (25,245 | ) | | | (90,836 | ) | | | 161,972 | | | | 24,560 | | | | 136,727 | | | | (66,276 | ) |
| Total Comphrensive Income | | $ | 570,393 | | $ | 503,653 | | $ | 1,864,435 | | $ | 640,910 | | |
| Total Comprehensive Income | | | $ | 596,740 | | | $ | 382,022 | | | $ | 2,461,175 | | | $ | 1,022,932 | |
| | | | | | | | | | | | | | | | | | | |
| Net Income Per Common Share of Common Stock: | | | | | | | | | | |
| Basic and diluted | | $ | 0.04 | | $ | 0.03 | | $ | 0.13 | | $ | 0.05 | | |
| Weighted-Average Shares of Common Stock Outstanding: | | | | | | | | | | |
| Net Income Per Common Shares: | | | | | | | | | | |
| Basic and Diluted | | | $ | 0.03 | | | $ | 0.02 | | | $ | 0.16 | | | $ | 0.08 | |
| Weighted-Average Common Shares Outstanding: | | | | | | | | | | |
| Basic | | 14,897,143 | | 14,510,204 | | 14,701,547 | | 14,510,204 | | | | 15,235,714 | | | | 14,510,204 | | | | 14,879,603 | | | | 14,510,204 | |
| Diluted | | 15,798,367 | | 14,510,204 | | 15,147,208 | | 14,510,204 | | | | 16,925,510 | | | | 14,510,204 | | | | 15,739,975 | | | | 14,510,204 | |
CHINA SLP FILTRATION TECHNOLOGY, INC.