
As filed with the Securities and Exchange Commission on June 9, 2011May 31, 2013
Registration No. 333- 333-174801
UNITED STATES
SECURITIES AND EXCHANGE COMMISSION
Washington, D.C. 20549
Amendment No. 5
to
Form S-1
REGISTRATION STATEMENT
UNDER
THE SECURITIES ACT OF 1933
AVAYA HOLDINGS CORP.
(Exact name of registrant as specified in its charter)
| Delaware | 3661 | 26-1119726 | ||
(State or other jurisdiction of incorporation or organization) | (Primary Standard Industrial Classification Code Number) | (I.R.S. Employer Identification No.) |
211 Mount Airy Road4655 Great America Parkway
Basking Ridge, New Jersey 07920Santa Clara, California 95054
(908) 953-6000
(Address, including zip code, and telephone number, including area code, of registrant’s principal executive offices)
Pamela F. Craven, Esq.
Chief Administrative Officer
Avaya Holdings Corp.
211 Mount Airy Road
Basking Ridge, New Jersey 07920
(908) 953-6000
(Name, address, including zip code, and telephone number, including area code, of agent for service)
With copies to:
Julie H. Jones, Esq.
| Daniel J. Zubkoff, Esq. Douglas S. Horowitz, Esq. Cahill Gordon & ReindelLLP 80 Pine Street New York, NY 10005 Telephone (212) 701-3000 Fax (212) 269-5420 |
Approximate date of commencement of proposed sale to public: As soon as practicable after this Registration Statement becomes effective.
If any of the securities being registered on this Form are to be offered on a delayed or continuous basis pursuant to Rule 415 under the Securities Act of 1933 check the following box. ¨
If this Form is filed to register additional securities for an offering pursuant to Rule 462(b) under the Securities Act, please check the following box and list the Securities Act registration statement number of the earlier effective registration statement for the same offering. ¨
If this Form is a post-effective amendment filed pursuant to Rule 462(c) under the Securities Act, check the following box and list the Securities Act registration statement number of the earlier effective registration statement for the same offering. ¨
If this Form is a post-effective amendment filed pursuant to Rule 462(d) under the Securities Act, check the following box and list the Securities Act registration statement number of the earlier effective registration statement for the same offering. ¨
Indicate by check mark whether the registrant is a large accelerated filer, an accelerated filer, a non-accelerated filer, or a smaller reporting company. See the definitions of “large accelerated filer,” “accelerated filer” and “smaller reporting company” in Rule 12b-2 of the Exchange Act. (Check one):
| Large accelerated filer | ¨ | Accelerated filer | ¨ | |||||||
| Non-accelerated filer | x | (Do not check if a smaller reporting company) | Smaller reporting company | ¨ | ||||||
CALCULATION OF REGISTRATION FEE
Title of Each Class of Securities to be Registered | Proposed Maximum Aggregate Offering | Amount of Registration Fee | ||
Common Stock, $0.001 par value per share | $1,000,000,000 | $116,100 | ||
The Registrant hereby amends this Registration Statement on such date or dates as may be necessary to delay its effective date until the Registrant shall file a further amendment which specifically states that this Registration Statement shall thereafter become effective in accordance with Section 8(a) of the Securities Act of 1933, as amended, or until the Registration Statement shall become effective on such date as the Securities and Exchange Commission, acting pursuant to said Section 8(a), may determine.
The information in this preliminary prospectus is not complete and may be changed. These securities may not be sold until the registration statement filed with the Securities and Exchange Commission is effective. This preliminary prospectus is not an offer to sell these securities and it is not soliciting an offer to buy these securities in any jurisdiction where the offer or sale is not permitted.
PROSPECTUS (Subject to Completion)
Issued June 9, 2011May 31, 2013
Shares
COMMON STOCK
Avaya Holdings Corp. is offering shares of its common stock. This is the initial public offering of shares of our common stock and no public market currently exists for our shares. We expect the initial public offering price of our common stock to be between $ and $ per share.
After the completion of this offering, funds affiliated with our Sponsors (as defined herein) will continue to own a majority of the voting power of our outstanding common stock. As a result, we expect to be a “controlled company” within the meaning of the corporate governance standards of .the New York Stock Exchange. See “Principal Stockholders.”
We have applied to list our common stock on the New York Stock Exchange under the symbol “ .”“AVYA.”
Investing in our common stock involves a high degree of risk. See “Risk Factors”“Risk Factors” beginning on page 17.18.
PRICE $ A SHARE
| Public Offering Price | Underwriting | Proceeds to Avaya | ||||
Per Share | $ | $ | $ | |||
Total | $ | $ | $ |
We have granted the underwriters the right to purchase up to an additional shares of common stock for a period of 30 days.
Neither the Securities and Exchange Commission nor any other regulatory body has approved or disapproved of these securities or passed upon the accuracy or adequacy of this prospectus. Any representation to the contrary is a criminal offense.
The underwriters expect to deliver the shares to purchasers on , 2011.2013.
| MORGAN STANLEY | GOLDMAN, SACHS & CO. | J.P. MORGAN |
| CITI | DEUTSCHE BANK SECURITIES | |
BofA MERRILL LYNCH | BARCLAYS | CREDIT SUISSE | ||
, 20112013
The information in this preliminary prospectus is not complete and may be changed. These securities may not be sold until the registration statement filed with the Securities and Exchange Commission is effective. This preliminary prospectus is not an offer to sell these securities and it is not soliciting an offer to buy these securities in any jurisdiction where the offer or sale is not permitted.


| Page | ||||
| 1 | ||||
| 31 | ||||
| 33 | ||||
| 34 | ||||
| 35 | ||||
| 37 | ||||
| 39 | ||||
Management’s Discussion and Analysis of Financial Condition and Results of Operations | ||||
| 134 | ||||
| 135 | ||||
| 145 | ||||
| Page | ||||
| ||||
| F-1 | ||||
We have not authorized anyone to provide any information or to make any representations other than those contained in this prospectus or in any free writing prospectuses we file with the Securities and Exchange Commission, or the SEC. We take no responsibility for, and can provide no assurance as to the reliability of, any other information that others may give you. This prospectus is an offer to sell only the shares offered hereby, but only under circumstances and in jurisdictions where it is lawful to do so. The information contained in this prospectus is current only as of its date.
Until , 20112013 (25 days after the commencement of this offering), all dealers that buy, sell or trade shares of our common stock, whether or not participating in this offering, may be required to deliver a prospectus. This delivery requirement is in addition to the obligation of dealers to deliver a prospectus when acting as underwriters and with respect to their unsold allotments or subscriptions.
For investors outside the United States: we have not and the underwriters have not done anything that would permit this offering or possession or distribution of this prospectus in any jurisdiction where action for that purpose is required, other than in the United States. Persons outside the United States who come into possession of this prospectus must inform themselves about, and observe any restrictions relating to, the offering of the shares of common stock and the distribution of this prospectus outside the United States.
When we use the terms “we,” “us,” “our,” “Avaya” or the “Company,” we mean Avaya Holdings Corp., a Delaware corporation, and its consolidated subsidiaries, including Avaya Inc., our principal U.S. operating subsidiary, taken as a whole, unless the context otherwise indicates.
Avaya Aura®, Avaya Flare® and Avaya web.alive, AvayaLive™®, Radvision Scopia® and other trademarks or service marks of Avaya are the property of Avaya Holdings Corp. and/or its affiliates. This prospectus also contains additional tradenames, trademarks or service marks belonging to us and to other companies. We do not intend our use or display of other parties’ trademarks, tradenames or service marks to imply, and such use or display should not be construed to imply, a relationship with, or endorsement or sponsorship of us by, these other parties.
i
This summary highlights information contained elsewhere in this prospectus. This summary does not contain all of the information you should consider before investing in our common stock. You should read this entire prospectus carefully, especially the “Risk Factors” section of this prospectus and our consolidated financial statementsConsolidated Financial Statements and related notes appearing at the end of this prospectus, before making an investment decision. This summary contains forward-looking statements that involve risks and uncertainties. Our actual results may differ significantly from the results discussed in the forward-looking statements as a result of certain factors, including those set forth in “Risk Factors” and “Special Note Regarding Forward-Looking Statements.”
Our Company
We are a leading global provider of next-generationreal-time business collaboration and communications solutions that bring people together with the right information at the right time in the right context, enabling business usersbusinesses to improve their efficiency and quickly solve critical business challenges. Our solutions are designed to enable business users to work together more effectively as a team internally orand with their customers and suppliers, increasing innovation, improving productivity and acceleratingto accelerate decision-making and achieve business outcomes. We have a long track record of innovation and our customers historically have relied on us to deliver mission critical communications solutions. The markets for areas associated with our business collaboration and communicationsThese industry leading solutions are expectedalso designed to representbe flexible, reliable and secure, enabling simplified management and cost reduction while providing a $77 billion market in 2011 in the aggregate.platform for next-generation collaboration from Avaya.
We are highly focused on and structured to serveserving our core business collaboration and communications markets with open and unifying, fit-for-purpose products, targeted sales coveragesolutions and distributed software services and support models. We targetshape our portfolio to meet the demands of customers today and in the future.
Our solutions and services are aimed at large enterprises, small- and medium-sizedmid-sized businesses and government organizationsorganizations. We offer solutions in fivethree key business collaboration and communications product categories:
Real-Time Collaboration, Video and Unified Communications Software, Infrastructure and Endpoints for an increasingly mobile workforce
Real Time Video CollaborationCustomer Experience Management, including Contact Center applications
Contact Center
Data Communications
Applications, including their IntegrationNetworking for data center, campus, branch, and Enablementwireless access to complement our business collaboration, unified communications and contact center portfolios
Our next-generationThese three categories are supported by Avaya’s portfolio of services including product support, integration, and professional and managed services. These services enable customers to optimize and manage their communications networks worldwide and achieve enhanced business collaborationresults.
Our solutions are architecteddesigned to be highly scalable, reliable, secure, flexible and easy to manage,manage. They can be deployed in numerous ways including on a customer’s own premise, in the cloud and supportin a varietyvirtualized environment. We believe that delivering solutions in a cloud environment, either private or public, will be the deployment mode of deployment models, including on-premise, public and private cloud, virtualized and mobile delivery. Ourchoice for many customers in the near future. Further, our research and development investments are focused on software atsolutions across the user experience and business application layers, and software and hardware at the infrastructure layer, and endpoints. In addition, we are investing in software for monitoring, troubleshooting and managing distributed communications architectures that we believe will reduce the total cost of ownership and improve end-to-end serviceability of our solutions versus our competitors.
WeSignificant industry trends, such as the Bring Your Own Device (BYOD) and the blurring of consumer and enterprise, called the “Consumerization of IT,” are executingdriving the overall move toward enterprise mobility. Enterprises seek 24x7 device and location agnostic collaboration and communications solutions to increase employee effectiveness, reduce costs and gain competitive advantages in the marketplace. In addition, we believe
many businesses today have grown through acquisition or lack central controls on two critical strategic initiatives relatedinfrastructure and are left with inefficient, disparate communications infrastructure that may benefit financially from consolidation. As a result of these trends, we believe that enterprises require a holistic, flexible business solution that is designed to facilitate collaboration, and incorporates enterprise-class stability, scalability and security. Additionally, we believe that the transition ofmarket will evolve to require secure collaboration between enterprises including video, desktop sharing, presence and directory updates.
Through our innovative collaboration and communications solutions, we are reshaping our product portfolio to address these trends and the enhancement of our sales coverage model in order to continue to grow our business. Our product portfolio has been reshaped to drive revenue growthThe foundation for our ongoing innovation is our Avaya Aura platform, our Session Initiation Protocol (SIP) standards-based software suite that brings together voice, video and business model cash cycle time. In addition, ourdata into a single, integrated communications and collaboration platform.
Our portfolio of business collaboration and communications solutions is designed to deliver ana simple and intuitive and personalized user experience, seamlessly integrating various modes of communications and collaboration, including real-time voice, video, instant messaging, presence, and conferencing, and non real-timenon-real-time email, voicemail and social networking. In addition, we have decoupled solutions from the user’s location and allowed consolidation of infrastructure in the data center. Our solutions take the critical step of replacing voice-centric call control used by traditional Voice over Internet Protocol (VoIP) solutions with standards-based SIP session management. This allows communications applications to operate freely from the underlying infrastructure and supports both multiple media (voice, video, text) and modes (call, conference, instant messaging/chat, and email) of communication over the same session. Our Avaya Aura Contact Center also leverages our session management architecture and applies these collaboration principles to customer interactions.
These solutions target high growth market segments and we believe expand our addressable markets and accelerate our sales cycle as customers more frequently upgradeaugment their solutions to take advantage of our ongoing product innovation and to deploy our user experience across an array of endpoints, including our own and those of other vendors. Detailed information on the trends impacting our industry can be found in the next section, Our Industry.
We have further enhanced our business through acquisitions that have amplified our innovation and growth strategy. A key example of this is Radvision Ltd., which we acquired in June 2012 and which enhances Avaya’s position with industry leading video collaboration and communications solutions.
With our product portfolio poised for the future, we are now seeking toWe leverage our sales and distribution channels to speed new solutions to market and accelerate customer adoption and generate an increasing percentage ofadoption. We have strategic initiatives in place to grow our revenue from these new high value software solutions and user experience-centric applications. We are expanding our sales coverage model, including both partners and direct sales,partner community while supporting our customers’ channel preference. In December 2009, we acquiredpartners’ profitability and success. We also fully leverage the enterprise solutions businessdiversity of Nortel Networks Corporation, or NES, which expanded our customer base, broadenedthe partner community for the Avaya portfolio, engaging with value added resellers, systems integrators, service providers, and strengthened our indirect sales channel, enhanced our technology portfolio, established our leading presence in data communicationsapplication developers. Please see the section titled, Customers; Sales, Partners and enhanced our ability to compete globally.
Over the past several years, we have invested significantly in research and development, introducing more than 60 new product offerings to the market since the beginning of fiscal year 2010. For example, we recently released our Avaya Flare Experience, a real-time, enterprise video communications and collaboration solution helping to break down the barriers commonly seen in today’s communications and collaboration tools with a distinctive user interface for quick, easy access to voice and video, social media, presence, instant messaging, audio/video/web conferencing, a consolidated view of multiple directories and context history. In addition, we have further enhanced our business through acquisitions and by restructuring or divesting businesses that dilute our focus from our principal markets.
Our market leadership in next-generation business collaboration is due in part to our long-standing heritage of delivering mission critical unified communications, contact center and voice communications solutions. As a market leader in enterprise voice telephony and messagingDistribution for more than 10 years and in unified communications for the past four years, we believe that our Voice over Internet Protocol, or VoIP, solutions have enabled customers to centralize communications applications and hardware to serve geographically dispersed users, significantly reducing management cost, complexity, and annual spend to telecommunication service providers. Leveraging this experience, we have now developed innovative, next-generation unified communications and contact center solutions that focus on business collaboration, and, unlike earlier solutions, are designed from the ground up to support multiple media and modes of communication, reducing cost and complexity while improving collaboration effectiveness. At the core of our next-generation collaboration solutions is Avaya Aura, our Session Initiation Protocol, or SIP, based architecture, which enables multiple people, media and resources to be brought together into an integrated communications session with the ability to access the communication context across different media and modes. The Avaya Aura architecture makes software applications easier to develop, deploy and manage than traditional Computer Telephone Integration, or CTI, based unified communications and contact center applications. Since our SIP-based architecture requires much less specialized communications programming skill than traditional solutions, we expect it to attract a broader community of developers and accelerate innovation and application development.details.
Our solutions address the needs of a diverse range of customers, including large multinational enterprises, small-small and medium-sized businesses and government organizations. As of March 31, 2011,September 30, 2012, we had over 400,000300,000 customers, including more than 85%95% of the Fortune 500 companies, andwith installations in over one million customer locations worldwide. Our customers operate in a broad range of industries, including financial services, manufacturing, retail, transportation, energy, media and communications, health care,healthcare, education and government, and include, among others, Morgan Stanley & Co. LLC, Progressive Casualty Insurance Company, Whirlpool Corporation, The Hewlett-Packard Company, or HP, Home Depot, Inc., United Air Lines, Inc., Marriott International, Inc., the Blue Cross and Blue Shield Association, Australia National University and the Federal Deposit Insurance Corporation, or the FDIC. We employ a flexible go-to-market strategy with direct and indirect presence in over 100170 countries. As of March 31, 2011,2013, we had approximately 9,90010,800 channel partners and for the six months ended March 31, 2011,fiscal 2012, our product revenue from indirect sales represented approximately 77%75% of our total product revenue.
For the twelve months ended September 30, 2010fiscal 2012 and the six months ended March 31, 2011, we generated revenue of $5,060$5,171 million and $2,756$5,547 million, respectively. For the twelve months ended September 30, 2010,fiscal 2012, product revenue represented 51%52% of our total revenue and services revenue represented 49%48%. For the six months
ended March 31,fiscal 2011, product revenue represented 54% of our total revenue and services revenue represented 46%. For the twelve months ended September 30, 2010, approximately 55% of our revenue wasRevenue generated in the United States.States for fiscal 2012 and 2011 represented 54% of our total revenue. For the twelve months ended September 30, 2010fiscal 2012 we had operating income of $115 million as opposed to an operating loss of $94 million in fiscal 2011. For fiscal 2012 and the six months ended March 31, 2011, we had a net losslosses of $871$354 million and $612$863 million, respectively,respectively. For each of fiscal 2012 and 2011, we had Adjusted EBITDA of $795 million and $442 million, respectively.$971 million. See “Management’s Discussion and Analysis of Financial Condition and Results of Operations—Non-GAAP Financial Measures and Supplemental Disclosure—Operations: EBITDA and Adjusted EBITDA” for a definition and explanation of Adjusted EBITDA and a reconciliation of net loss to Adjusted EBITDA.
Our Industry
Trends Driving Business Collaboration Spending
Enterprises are increasingly focused on deploying collaboration solutions in order to increase productivity, reduce costs and complexity and gain competitive advantages. The requirements of enterprises have evolved over the past few years in response to the following trends:
Increasingly Mobile and Always-ConnectedConnected Workforce Needs Anytime/Anywhere Collaboration Tools.As enterprises move toward a more geographically dispersed, 24x7 connected workforce, they need tools to quickly solve business challenges while improving their efficiency. To do this, enterprises need collaboration technology that can bring people together with the right information at the right time in the right context to make critical business decisions, enabling business users to improve their efficiency and quickly solve critical business challenges.decisions.
Proliferation of Devices and ApplicationsExpanding the Number of Points of Integration.The number and types of endpoints are growing rapidly. Whereas in the past, business users communicated primarily via desk-phones, today they continue to use desk-based devices, but also various mobile devices such as laptops, smartphones and tablets. In order to communicate seamlessly and securely across these devices, applications and applications, collaboration solutionsendpoints must integrate thembe integrated into the communications infrastructure and allowprovide a way for IT professionals to manage themhave a consolidated view of these devices and applications so that the environment can be managed effectively and reliably.
Consumerization of the Enterprise has Changed Expectations of Business Users and Put More Pressure on IT Departments.BusinessWith the proliferation of consumer devices such as the Apple iPhone and Apple iPad, Google Android smartphones and tablets and business and social networking applications, business users are increasingly using consumer-focused products and applications for business tasks, particularly in the areas of collaboration and communication. This has put a significant strain onBusiness users expect their enterprise IT departmentssolutions to support and secure these devices and mimic these applications within the enterprise.and expect enterprise vendors to design their products so that they are easier to use.
Customer Expectations of Contact Centers and Customer Service Areare Changing. Customer expectationsinteractions are changing as interactions with contact centers evolveevolving from voice-centric, point-in-time, contact center transactions to multimediapersistent customer conversations over multiple interactions and multi-modal communications.across multiple media and modes of communication. Customers increasingly expect enterprises to know about the history of the interaction regardlesstheir interactions, even when they occur across a mix of the method of communication.self-service and agent assisted communications methods including voice, video, email and chat.
Business Leaders are Increasingly Challenged to Deliver New Business Capabilities to Support Growth While Facing Tight IT Budgets. Business leaders continue to manage their overall spending closely dueDue to continued macro-economic uncertainty. Atuncertainty, businesses are closely managing overall spending while at the same time business leaders are focused onmaking strategic IT investments to gain competitive advantageadvantage. As a result, they are seeking solutions that cost-effectively scale with their businesses. Increasingly, to help manage costs and improve productivity, while expecting acceptable levels of return on their investment.efficiencies businesses are exploring a shift to operating expense models, where they pay a fee for business collaboration and communications services but the underlying solutions, infrastructure and headcount are owned and managed by the vendor, as opposed to capital expenditure models that require them to invest in and own the solutions, infrastructure and headcount.
Competitors’ Solutions are Inadequate
Together these trends add to the complexityThe Benefits of enabling business collaboration, and drive business leaders to seek a more simple, holistic solution that is easy-to-use, scalable and cost-effective. We believe that competitors’ solutions fall short of delivering a seamless real-time collaboration experience due to the following limitations:
Most Collaboration Solutions Today are One-size-fits-all and Often Cannot Accommodate Customers’ Specific Needs.Competitors’ collaboration solutions are not designed for the demands of unified communications. Many collaboration vendors see the demand for unified communications as an opportunity to sell more of their core products by bundling their products with other communication systems and loosely tying the systems together with a single user interface. The resulting solutions are poorly architected, difficult to deploy and manage and do not deliver a seamless, real-time business collaboration experience.
Competitors’ Solutions Were Built from an Email or Data Networking Focus, Not for Real-time Collaboration. Many traditional collaboration tools simply aggregate different modes of communication around their core competency (email or data) with a single interface without integrating the underlying architectures. As a result, users have a disjointed experience and do not realize the many benefits of next-generation business collaboration solutions such as simultaneous conversations across different media or the ability to access the context of their conversations across various modes and media.
Traditional Solutions are Closed and Proprietary, Forcing Customers to Use a Single Vendor and Abandon Existing IT Investments.Many of our competitors’ collaboration solutions use proprietary, closed architectures, which do not integrate well with those of other vendors. This forces customers to choose a platform that does not offer all of the desired features and functionality and makes it difficult to integrate third party applications to address broader enterprise requirements. As a result, customers either have to abandon their existing infrastructure investments or accept additional complexity and costs in order to deploy new infrastructure equipment or applications.
Limited Consumer Device Support.We believe that because of their proprietary nature, competitors’ solutions do not easily lend themselves to enabling the integration of new consumer devices with seamless, real-time collaborations applications. These solutions lack the infrastructure to reliably integrate, support and secure these consumer devices and therefore inhibit the potential benefits these devices can bring to the enterprise.
Most Collaboration Solutions Vendors Lack an In-house Global Services Organization to Support Customers and Partners Through Implementation and Maintenance. Most collaboration vendors lack a full scale in-house services organization to help customers and partners deploy business collaboration solutions or the integration expertise to help customers migrate from their current communications environment. As a result, customers are forced to contract with third-party service providers, which adds to the overall cost and complexity of deployment.
High Total Cost of Ownership. Traditional solutions require a significant investment in new infrastructure and customized integration. In addition, they are difficult to deploy and manage and require significant professional services support upfront and ongoing IT costs to manage and maintain.
Addressable Market for Business Collaboration Solutions is Large and Growing
We believe that the trend toward a more mobile workforce and the proliferation of devices and applications creates a significant market opportunity for business collaboration. In addition, we believe that the limitations of traditional collaboration solutions present an opportunity for differentiated vendors to gain market share. We believe that the business collaboration market includes spending on unified communications, contact center applications and data networking equipment, as well as spending on support and maintenance services to support these tools. Industry analysts project that in 2011, these markets will grow to $77 billion in aggregate.
Our Solutions
We are a leader in the business collaboration market and have created next-generation solutions that offer an innovative approach, delivering our customers fit-for-purpose, open solutions that we believe enable them to experience enhanced levels of productivity at a lower total cost of ownership than our competitors. The key benefits of our solutions include:
Innovative Real-Time, Multimedia, Multi-Platform Collaboration Tools that Unleash the Power of Teamwork.Promote Business Collaboration.We help Our next-generation business collaboration and communications solutions are designed to provide our customers unleash the power of collaboration by providing them with the software and infrastructure needed to bring together the right people together with the right information at the right time in the right context regardless of the communications technology, devices or location.
Fit-for-Purpose Solutions that Offer Anan Enhanced User Experience, Productivity Benefits and Lower Total Cost of Ownership.OurWe deliver comprehensive, fit-for-purpose solutions that are designed for the needs of today’s distributed, collaborative workforce, while addressing what we believe are the three key performance challenges for an enterprise-class communications environment: resiliency, efficiency and scalability. We believe our solutions are specifically designed to address thethese needs, of today’s unified communications environment. As a result, we believe our solutions require less hardware and perform better than our competitors.
Open Standards-Based Architecture that Enables Flexible and Extensible Collaboration.Our next-generationopen standards-based solutions, are based on an open SIP architecture, accommodatingincluding our Avaya Aura platform, accommodate customers with multi-vendor environments seeking to leverage their existing investments and supplement their existing solutionswhat they have with the specific collaboration products thatand/or services they need, as well asand rapidly create and deploy applications. Providing enterprises with strong integration capabilities gives them the flexibility to take advantage of new collaboration and contact center tools and devices as they are introduced, rather than being confined to a single vendor and having to compromise on functionality.
Enterprise-Class Solutions that are Scalable, Secure, Reliable and Reliable.Backed by Our Award-Winning Services.Enterprises and governments across the world depend on us for their collaboration needs, knowing that we can deliver mission critical dependability. Our product portfolio has been designed to be highly reliable, secure and scalable, and is backed by anour award-winning global services. Avaya Global Services, or AGS, is a leading provider of support services organization withrelating to business collaboration and communications solutions, offering services support tools to help our customers monitor, troubleshoot and manage their infrastructure. In addition, AGS delivers managed and professional services, providing the integration expertise necessary to help customers migrate from their current communications environment to next-generation business collaboration and communications environments.
Centralized Application Integration and Management that Makes it Easier to Integrate, Deploy and Manage. Our solutions provide enterprises with the ability to perform integration and management tasks as part of a central service rather than from individual platforms, reducing the amount of time required to perform integration activities and to support and manage unified communications services.
Our Competitive Strengths
In addition to the strengths of our solutions, we believe the following competitive strengths position us well to capitalize on the opportunities presentedcreated by the market trends impactingaffecting our industry.
Leading Position Across Our Key End Markets.We are a leader in business collaboration and communications, with leading market share in worldwide unified communications, contact center infrastructure, voice maintenancesupport services and enterprise messaging.
Large, Diverse and Global Customer Installed Base.Our solutions address the needs of a diverse range of customers from large multinational enterprises to small- and medium-sized businesses in a number ofvarious industries. We believe our large and diverse customer base provides us with recurring revenue and a continuing growththe opportunity to further expand within our customer base.
History of Innovation with Large Pipeline of New Products and UniqueDifferentiated Approach to Commercialization.We continue to innovate rapidly. As of March 31, 2011,September 30, 2012, we had over 5,700approximately 5,900 patents and pending patent applications, including foreign counterparts.counterparts that cover a wide range of products and services. Since the beginning of fiscal year 2010, we have introduced more than 60130 new offerings across our portfolio.portfolio, the largest product pipeline in our history. These new offerings include our Avaya Aura platform, Avaya Aura Contact Center, Avaya Flare Experience and Avaya Virtual Enterprise Network Architecture. We have a uniquebelieve that our approach to commercialization approach which we believe results in new products with broad appeal and accelerates the timeline for development and adoption.
Acquisitions Have Further Amplified Our Innovation and Growth Strategy. Key examples of this include Radvision Ltd., acquired in June 2012, and Sipera Systems, Inc., acquired in October 2011. Radvision enhances Avaya’s position with industry leading video collaboration and communications solutions. The Sipera portfolio brings best-in-class Session Border Controller (SBC) security and management solutions.
Flexible Go-to-Market Strategy Expands Reach of Our Products and Services.We sell our solutions both directly and through an indirect sales channel, enabling ustailoring our go-to-market strategy to reach customers across industries and globally.our target market. With the acquisition of the enterprise solutions business of Nortel Networks Corporation, or NES, we significantly expanded our channel coverage and deepened our vertical expertise.
Global End-to-End Services OrganizationCapability Provides Large Recurring Revenue Stream. We maintain an award-winning, global, in-house services organization that provides us withAvaya Global Services is uniquely positioned to deploy, support and manage Avaya solutions as a key advantage over manyresult of joint planning between R&D and service planning in advance of new products being released. Avaya Global Services has direct access to our competitors who lack such an organization. Our services contracts tendresearch and development teams necessary to be multi-year arrangements, have high renewal rates and have provided us with a large recurring revenue base and significant visibility into our customers’ future collaboration needs.quickly resolve customer issues. This allows Avaya to provide quality service for Avaya products.
Experienced Management Team with Track Record of Execution. We have an experienced team of senior executives that has demonstrated an ability to identify critical trends in the technology and communications sectors and develop a comprehensive strategic vision to enable businesses to capitalize on those trends.
Our Growth Strategy
We intendbelieve we are well-positioned worldwide and have a multi-faceted strategy that builds upon our brand, strong client relationships and ability to continue to be on the cutting edge of innovation. Our vision is to be the preeminent provider of business collaboration and communications solutions with a commitment to open standards and innovative products, services and solutions. Key elements of our strategy include:
Leverage our Leading Market Positions to Drive the Adoption of our Next-Generation Collaboration Solutions.We believe that our market leadership, global scale and extensive customer interaction and credibility with customers and prospects creates a strong platform from which to drive and shape the evolution of enterprise communications toward greater business collaboration.
Capture Additional Market Share Across our Portfolio of Products and Services. MostWhile we have leading market presence in the majority of the markets we serve, most of our markets still have numerous competitors of varying size, whosize. Changes in business communications needs will find it challengingchallenge many of these competitors to keep paceinnovate and allow us to gain share with our broader portfolio of products and services. We also believe that scale and service capability become increasingly important as the changing business collaboration needs. Ourcomplexity and importance of communications grows within the enterprise. As potential customers look to migrate to our solutions, our open architecture integratescan integrate with competitor systems and providesprovide a path for gradual transition while still achieving cost savings and improved functionality. In addition, weWe also believe there is significant opportunity to further monetize the NES installed base by increasing the services attach rate forsell support contracts to customers acquired in the NES acquisition.
Grow Avaya Managed Services. With Communications Outsourcing Solutions, Avaya provides custom managed services for multi-vendor applications and infrastructure. Avaya offers end-to-end management for any stage of the network lifecycle to help extend the potential of aging communications environments and enable customers to adopt new technology easily. Avaya takes a vendor-agnostic approach to managing communications and day-to-day operations. We help design, implement, and manage technology upgrades, working in existing environments and offering flexible financial models to meet budget and business needs.
Expand Margins and Profitability. Drive profitable growth worldwide andWe have multiple initiatives to further increase our profit margins worldwide, including increasingexpanding gross profits and reducing operating expenses. From fiscal 2007 to fiscal 2012 we increased our focus on higher-margin software revenue, optimizinggross margin, excluding the amortization of technology intangible assets and the impact of purchase accounting adjustments, from 47% to 54% and we are pursuing the following initiatives to further expand our gross profits:
Driving lower material cost through our increased scale as a result of the NES acquisition, improved supplier mix and increased component commonality.
Greater use of low cost regions for supplier sourcing, contract manufacturing and provisioning of some support services.
Optimizing design of products and services productivity to drive efficiencies, executing on certain cost-savingsmaterial and supply chain efficiencies.
Increasing the percentage of our revenue represented by higher-margin software.
Generating service productivity improvements through methodology and diagnostic tools as well as promoting greater web-based self-service tools.
We also have the following initiatives to reduce operating expenses as a percentage of revenues:
Cost savings initiatives associated with the integration of NES and achieving greater economies of scale.other acquisitions.
Other restructuring activities including exiting facilities and reducing the workforce or relocating positions to lower cost geographies.
Sales productivity improvements and distribution channel optimization.
Continue to Develop Innovative Products and Services Around Our Next Generation Business Collaboration Solutions.Solutions to Drive Revenue and Shorten Sales Cycles. ExtendWe intend to extend our industry-leading position through continued focus on product innovation and substantial investment in research and development for new products and services in high growth areas.services. Evidence of this focus is our 130 new product offerings since the beginning of fiscal 2010. We believe our abilityalso plan to develop innovative solutions is advancedcontinue to embrace the opportunity presented by feedback gathered from our extensive customer relationshipscloud computing and our customer focus, which allow usseek new ways to better meet our customers’ needs and anticipate market demand.leverage the Virtual Desktop Integration (VDI) trend to securely deliver business collaboration to users.
Continue to Invest in and Expand our Sales and Distribution Capabilities to Attack New Markets and Better Penetrate Existing Markets. Continue to investOur continued investment in our channel partners and sales force is designed to help optimize their market focus, improve segmentation, enter new geographies and provide our channel partners with compelling business incentives and discounts, along with training, marketing programs and technical support through our Avaya Connect, our business partner program. We also plan to leverage our sales and distribution channels to accelerate customer adoption and generate an increasing percentage of our revenue from our new high value software solutions and user experience-centric applications.
Pursue Strategic Relationships, Alliances and Acquisitions. ContinueWe plan to continue to establish relationships and alliances and selectively acquire capability-enhancing businesses as key elements in our strategy going forward. We believe we have one of the largest communications-focused developer and technology partner ecosystems. This is evidenced by the Avaya DevConnect program, which promotes the development, compliance-testing and co-marketing of innovative third-party products that are compatible with Avaya’s standards-based solutions and has more than 20,000 registered companies as of September 30, 2012. We also maintain key relationships with large technology vendors such as International Business Machines Corporation (IBM), HP, and Oracle. Additionally, we will continue to continue our global growth.make acquisitions when we find opportunities with compelling strategic and financial rationales.
Retain, Recruit and Develop Talent Globally.Globally Develop. We are focused on developing a workforce that has both exceptional technical capabilities and the leadership skills that are required to support our technological and geographical growth. Building and nurturing a committed, diverse and engaged workforce with the highest levels of ethics and integrity is at the heart of our strategy. We have dramatically reshaped our workforce throughout our entire organization and have an executive team with significant experience in operating leading technology companies. Our transformation to being the leader in business collaboration and communications will be fueled by developing new workforce capabilities and building upon our talented team in place today.
Risks Associated with Our Company
Our business is subject to a number of risks of which you should be aware before making an investment decision. These risks are discussed more fully in the “Risk Factors” section of this prospectus immediately following this prospectus summary. These risks include, but are not limited to, the following:
Our revenues are dependent on general economic conditions and the willingness of enterprises to make capital investments;
| • | Our revenues are dependent on general economic conditions and the willingness of enterprises to make capital investments. The impact of economic conditions on the willingness of enterprises to make capital investments, particularly in business collaboration technology and related services can significantly affect our operating results and we believe that enterprises continue to be cautious about sustained economic growth. |
The market opportunity for advanced communications products and services, including our next-generation business collaboration solutions may not develop in the ways that we anticipate;
| • | The market opportunity for advanced communications products and services, including our next-generation business collaboration solutions may not develop in the ways that we anticipate. The demand for our offerings can change quickly and in ways that we may not anticipate because the market in which we operate is characterized by rapid, and sometimes disruptive, technological developments, evolving industry standards, frequent new product introductions and enhancements, changes in customer requirements and a limited ability to accurately forecast future customer demand. |
We depend on third-party providers to manufacture, warehouse and distribute our products;
| • | We are dependent on our intellectual property. As a leader in technology and innovation in business collaboration and communications, we are dependent on the maintenance of our current intellectual property rights and the establishment of new intellectual property rights. If we are not able to protect our intellectual property rights or if those rights are invalidated or circumvented, our business may be adversely affected. |
If we are not able to protect our intellectual property rights or if those rights are invalidated or circumvented, our business may be adversely affected;
| • | Our degree of leverage could adversely affect our ability to raise additional capital to fund our operations and limit our ability to react to changes in the economy or our industry. Our degree of leverage could have important consequences, including making it more difficult for us to make payments on our indebtedness and increasing our vulnerability to general economic and industry conditions. |
Our degree of leverage could adversely affect our ability to raise additional capital to fund our operations and limit our ability to react to changes in the economy or our industry;
| • | We face formidable competition from providers of unified communications, contact center and networking solutions and related services; as these markets evolve, we expect competition to intensify. In addition to the competition we face from traditional enterprise voice communications |
We face formidable competition from numerous established firms that provide both traditional enterprise voice communications solutions as well as providers of technology related to business collaboration and contact center solutions; as these markets evolve, we expect competition to intensify and expand to include companies that do not currently compete directly against us;
solutions and providers of technology related to business collaboration and contact center solutions, we expect competition to intensify and expand to include companies that do not currently compete directly against us. |
Following the completion of this offering, funds affiliated with TPG Capital, or TPG, and Silver Lake, which are collectively referred to as our Sponsors, will have the ability to control the outcome of matters submitted for stockholder approval and may have interests that differ from those of our other stockholders; and
| • | The Sponsors have significant influence over corporate transactions. Following the completion of this offering, funds affiliated with TPG Global LLC, or, together with its affiliates, TPG, and Silver Lake Partners, or Silver Lake, which are collectively referred to as our Sponsors, will have the ability to control the outcome of matters submitted for stockholder approval and may have interests that differ from those of our other stockholders. |
We expect to be a “controlled company” within the meaning of the rules of the and, as a result, will qualify for, and intend to rely on, exemptions from certain corporate governance requirements.
| • | We expect to be a “controlled company” within the meaning of the rules of the New York Stock Exchange. After completion of this offering, the Sponsors will continue to control a majority of the voting power of our outstanding common stock. As a result, we will qualify for, and intend to rely on, exemptions from certain corporate governance requirements. |
Company Information and Corporate Structure
Our principal executive offices are located at 211 Mt. Airy Road, Basking Ridge, NJ 07920.4655 Great America Parkway, Santa Clara, CA 95054. Our telephone number is (908) 953-6000. Our website address is www.avaya.com. Information contained in, and that can be accessed through, our website is not incorporated into and does not form a part of this prospectus.
Avaya Holdings Corp., formerly known as Sierra Holdings Corp., was incorporated under the laws of the State of Delaware on June 1, 2007 by affiliates of the Sponsors. The Sponsors, through a subsidiary holding company, acquired Avaya Inc., our principal U.S. operating subsidiary, and each of its subsidiaries in a merger transaction that was completed on October 26, 2007, which we refer to in this prospectus as the Merger. SinceDespite the fact that Avaya Inc.’s obligation to file periodic and current reports with the SEC ended on October 1, 2010, it has voluntarily filedfiles such reports with the SEC to comply with the terms of the indenturesindenture governing its senior secured and unsecured notes. Avaya Holdings Corp. is a holding company with no stand-alone operations and has no material assets other than its ownership interest in Avaya Inc. and its subsidiaries. All of Avaya Holdings Corp.’s operations are conducted through its various subsidiaries, which are organized and operated according to the laws of their jurisdiction of incorporation, and consolidated by Avaya Holdings Corp.
As of March 31, 2013, our total outstanding indebtedness was $6,103 million (excluding capital lease obligations and $18 million of debt discount due upon settlement of our indebtedness), of which $5,094 million was attributable to financing associated with the Merger and $1,009 million was attributable to financing associated with the acquisition of NES. For a complete discussion of our financing see Note 7, “Financing Arrangements,” to our unaudited Consolidated Financial Statements included elsewhere in this prospectus.
The following chart shows our organizational structure immediately following the consummation of this offering:
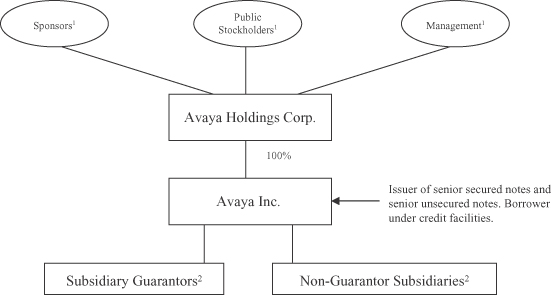
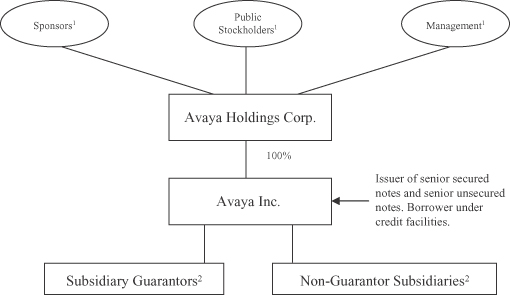
| (1) | Represents %, % and % of the total voting power in our company, respectively. |
| (2) | Substantially all of our domestic 100% owned subsidiaries as of |
THE OFFERING
Common stock we are offering | Shares | |
Common stock to be outstanding after this offering | Shares | |
Option to purchase additional shares offered to underwriters | Shares | |
Use of proceeds | We intend to use the net proceeds received by us in connection with this offering for the following purposes: | |
• to repay a portion of our long-term indebtedness; | ||
• to redeem all of our outstanding Series A Preferred Stock; and | ||
• to pay certain amounts in connection with the termination of our management services agreement with affiliates of our Sponsors pursuant to its terms. | ||
See “Use of Proceeds.” | ||
Risk factors | You should carefully read the “Risk Factors” section of this prospectus beginning on page 17 for a discussion of factors to consider carefully before deciding whether to purchase shares of our common stock. | |
Proposed NYSE symbol | “ | |
As of March 31, 2011,2013, we had 487,389,017488,662,389 shares of common stock outstanding. This excludes the following numbers of shares of our common stock issuable in connection with the exercise of warrants outstanding as of March 31, 20112013, the conversion of our Series B Convertible Preferred Stock and equity awards under our Amended and Restated 2007 Equity Incentive Plan, or the 2007 Plan:
100,000,000 shares of common stock issuable upon the exercise of warrants held by affiliates of our Sponsors, which warrants are subject to the lock-up agreements described under “Underwriters” and exercisable at any time prior to December 18, 2019 at an exercise price of $3.25 per share see(see “Description of Capital Stock—Warrants”);
24,500,000 shares of common stock issuable upon the exercise of warrants held by affiliates of our Sponsors, which warrants are subject to the lock-up agreements described under “Underwriters” and “Principal Stockholders”exercisable at any time prior to May 29, 2022 at an exercise price of $4.00 per share (see “Description of Capital Stock—Warrants”);
429,761 shares of common stock issuable on the exercise of optionsContinuation Options that were awarded by the Company to executive officers prior to the Merger andthat were permitted to be rolled over into equity awards issued by us upon consummation of the Merger, or Continuation Options, each with an exercise price of $1.25 per share;
972,341 shares of common stock issuable onupon conversion of the distributionSeries B Convertible Preferred Stock held by affiliates of units that were awarded to executive officers priorour Sponsors, and convertible at any time as such Series B Convertible Preferred Stock is outstanding at a conversion price equal to the Merger and were permittedlesser of (1) $4.00 per share (subject to be rolled over into equity awards issued by us upon consummationcertain anti-dilution provisions) or (2) the offering price per share in this offering, which such shares if converted are subject to the lock-up agreements described under “Underwriters” (see “Description of the Merger, or Continuation Units;Capital Stock—Preferred Stock—Series B Convertible Preferred Stock”);
44,072,95636,262,394 shares of common stock issuable upon the exercise of options with exercise prices ranging from $3.00 to $5.00 per share and a weighted average exercise price of $3.03$3.28 per share;
1,370,0001,719,808 shares of common stock issuable on the vesting and distribution of restricted stock units, or RSUs; and
4,405,2019,748,283 additional shares of common stock as of March 31, 20112013 reserved for future grants under the 2007 Plan.
This also excludes additional shares of common stock reserved for future equity incentive plans to be effective upon the occurrencecompletion of this offering.
Unless otherwise indicated, all information in this prospectus:
assumes the adoption of our amended and restated certificate of incorporation and our amended and restated bylaws to be effective upon the closing of this offering;
assumes no exercise by the underwriters of their option to purchase up to additional shares of our common stock in this offering; and
reflects, for all prior periods, a for of our common stock to be effected prior to the consummation of this offering.
SUMMARY HISTORICAL FINANCIAL DATA
The following table sets forth our summary historical consolidated financial data at the dates and for the periods indicated. Avaya Holdings Corp. was incorporated on June 1, 2007 by affiliates of the Sponsors. Avaya Holdings Corp., through a subsidiary holding company, entered into a merger agreement with Avaya Inc., or the Predecessor, pursuant to which the holding company merged with and into Avaya Inc., with Avaya Inc. continuing as the surviving entity and a wholly owned subsidiary of Avaya Holdings Corp., in a transaction that was completed on October 26, 2007. Avaya Holdings Corp. is a holding company and has no material assets or stand-alone operations other than its ownership in Avaya Inc. and its subsidiaries. The summary historical consolidated financial data set forth below are those of Avaya Holdings Corp. and its consolidated subsidiaries, or the Successor, from its inception on June 1, 2007 through March 31, 20112013 and those of its predecessor, Avaya Inc., for all prior periodsthe period October 1, 2007 through October 26, 2007, the closing date of the Merger.
The Predecessor summary historical consolidated financial data set forth below as of and for the years ended September 30, 2006 and September 30, 2007 have been derived from our Predecessor’s audited consolidated financial statements and related notes, which are not included in this prospectus. The Predecessor summary historical consolidated financial data set forth below for the period October 1, 2007 through October 26, 2007 hashave been derived from our Predecessor’s audited Consolidated Financial Statements and related notes, which are not included in this prospectus. The Successor summary historical consolidated financial statementsdata set forth below as of September 30, 2011 and 2012 and for the years ended September 30,2010, 2011 and 2012 have been derived from our audited Consolidated Financial Statements and related notes included elsewhere in this prospectus. The Successor summary historical consolidated financial data set forth below as of and for the yearsyear ended September 30, 2008 and 2009 and 2010 havehas been derived from our audited consolidated financial statementsConsolidated Financial Statements and related notes, which are not included elsewhere in this prospectus. The Successor summary historical consolidated financial data set forth below as of and for the period June 1, 2007 through September 30, 2007 has been derived from our unaudited consolidated financial statements,Consolidated Financial Statements, which are not included in this prospectus. The Successor had no operations prior to the Merger. The Successor summary historical consolidated financial data set forth below as of and for the six months ended March 31, 2011 and 2010 have been derived from our unaudited consolidated financial statements included elsewhere in this prospectus. Our unaudited consolidated financial statements for the six months ended March 31, 2011 and 2010 have been prepared on the same basis as the annual consolidated financial statements and, in the opinion of our management, include all adjustments, which include only normal recurring adjustments, necessary for a fair statement of this data. As part of the Merger on October 26, 2007, we entered into various financing arrangements and, as a result, had a different capital structure following the Merger. Accordingly, the results of operations for periods subsequent to the Merger will not necessarily be comparable to the prior period.
The data for the six months ended March 31, 2013 and 2012 has been derived from unaudited financial statements also appearing herein and which, in the opinion of management, include all adjustments consisting only of normal recurring adjustments, necessary for a fair statement of the financial condition, results of operations and cash flows for the unaudited interim periods.
The following summary should be read together with our consolidated financial statementsConsolidated Financial Statements and the related notes appearing elsewhere in this prospectus and the “Management’s Discussion and Analysis of Financial Condition and Results of Operations” section of this prospectus.
| Predecessor | Successor | Predecessor | Successor | |||||||||||||||||||||||||||||||||||||||||||||||||||||||||||||||||||||||||||
| Fiscal year ended September 30, | Period from October 1, 2007 through October 26, 2007 | Period from June 1, 2007 through September 30, 2007(1) | Fiscal year ended September 30, | For the Six Months Ended March 31, | Period from October 1, 2007 through October 26, 2007 | Period from June 1, 2007 through September 30, 2007 | Fiscal year ended September 30, | Six months ended March 31, | ||||||||||||||||||||||||||||||||||||||||||||||||||||||||||||||||||||||
| 2006 | 2007 | 2008(2) | 2009 | 2010 | 2010 | 2011 | 2008(1) | 2009 | 2010 | 2011 | 2012 | 2012 | 2013 | |||||||||||||||||||||||||||||||||||||||||||||||||||||||||||||||||
| (in millions, except per share amounts) | (in millions, except per share amounts) | |||||||||||||||||||||||||||||||||||||||||||||||||||||||||||||||||||||||||||||
STATEMENT OF OPERATIONS DATA: | ||||||||||||||||||||||||||||||||||||||||||||||||||||||||||||||||||||||||||||||
REVENUE | ||||||||||||||||||||||||||||||||||||||||||||||||||||||||||||||||||||||||||||||
Products | $ | 2,790 | $ | 2,875 | $ | 96 | $ | — | $ | 2,595 | $ | 1,923 | $ | 2,602 | $ | 1,193 | $ | 1,479 | $ | 96 | $ | — | $ | 2,595 | $ | 1,923 | $ | 2,602 | $ | 2,976 | $ | 2,672 | $ | 1,386 | $ | 1,160 | ||||||||||||||||||||||||||||||||||||||||||
Services | 2,358 | 2,403 | 150 | — | 2,328 | 2,227 | 2,458 | 1,187 | 1,277 | 150 | — | 2,328 | 2,227 | 2,458 | 2,571 | 2,499 | 1,258 | 1,198 | ||||||||||||||||||||||||||||||||||||||||||||||||||||||||||||
|
|
|
|
|
|
|
|
| ||||||||||||||||||||||||||||||||||||||||||||||||||||||||||||||||||||||
| 246 | — | 4,923 | 4,150 | 5,060 | 5,547 | 5,171 | 2,644 | 2,358 | ||||||||||||||||||||||||||||||||||||||||||||||||||||||||||||||||||||||
|
|
|
|
|
|
|
|
| ||||||||||||||||||||||||||||||||||||||||||||||||||||||||||||||||||||||
| 5,148 | 5,278 | 246 | — | 4,923 | 4,150 | 5,060 | 2,380 | 2,756 | ||||||||||||||||||||||||||||||||||||||||||||||||||||||||||||||||||||||
COSTS | ||||||||||||||||||||||||||||||||||||||||||||||||||||||||||||||||||||||||||||||
Products: | ||||||||||||||||||||||||||||||||||||||||||||||||||||||||||||||||||||||||||||||
Costs (exclusive of amortization of intangible assets) | 1,224 | 1,295 | 56 | — | 1,256 | 872 | 1,243 | 548 | 675 | 56 | — | 1,256 | 872 | 1,243 | 1,314 | 1,145 | 591 | 497 | ||||||||||||||||||||||||||||||||||||||||||||||||||||||||||||
Amortization of technology intangible assets | 15 | 20 | 1 | — | 231 | 248 | 291 | 142 | 133 | 1 | — | 231 | 248 | 291 | 257 | 192 | 99 | 36 | ||||||||||||||||||||||||||||||||||||||||||||||||||||||||||||
Services | 1,534 | 1,512 | 100 | — | 1,403 | 1,164 | 1,354 | 644 | 687 | 100 | — | 1,403 | 1,164 | 1,354 | 1,344 | 1,248 | 637 | 573 | ||||||||||||||||||||||||||||||||||||||||||||||||||||||||||||
|
|
|
|
|
|
|
|
| ||||||||||||||||||||||||||||||||||||||||||||||||||||||||||||||||||||||
| 2,773 | 2,827 | 157 | — | 2,890 | 2,284 | 2,888 | 1,334 | 1,495 | 157 | — | 2,890 | 2,284 | 2,888 | 2,915 | 2,585 | 1,327 | 1,106 | |||||||||||||||||||||||||||||||||||||||||||||||||||||||||||||
|
|
|
|
|
|
|
|
| ||||||||||||||||||||||||||||||||||||||||||||||||||||||||||||||||||||||
GROSS MARGIN | 2,375 | 2,451 | 89 | — | 2,033 | 1,866 | 2,172 | 1,046 | 1,261 | 89 | — | 2,033 | 1,866 | 2,172 | 2,632 | 2,586 | 1,317 | 1,252 | ||||||||||||||||||||||||||||||||||||||||||||||||||||||||||||
|
|
|
|
|
|
|
|
| ||||||||||||||||||||||||||||||||||||||||||||||||||||||||||||||||||||||
OPERATING EXPENSES | ||||||||||||||||||||||||||||||||||||||||||||||||||||||||||||||||||||||||||||||
Selling, general and administrative | 1,532 | 1,552 | 111 | — | 1,456 | 1,272 | 1,721 | 833 | 931 | 111 | — | 1,456 | 1,272 | 1,721 | 1,845 | 1,630 | 847 | 765 | ||||||||||||||||||||||||||||||||||||||||||||||||||||||||||||
Research and development | 428 | 444 | 29 | — | 376 | 309 | 407 | 197 | 236 | 29 | — | 376 | 309 | 407 | 461 | 464 | 228 | 231 | ||||||||||||||||||||||||||||||||||||||||||||||||||||||||||||
Amortization of intangible assets | 48 | 48 | 4 | — | 187 | 207 | 218 | 107 | 112 | 4 | — | �� | 187 | 207 | 218 | 226 | 226 | 112 | 114 | |||||||||||||||||||||||||||||||||||||||||||||||||||||||||||
Impairment of long-lived assets | — | — | — | — | 10 | 2 | 16 | 16 | — | — | — | 10 | 2 | 16 | — | — | — | — | ||||||||||||||||||||||||||||||||||||||||||||||||||||||||||||
Impairment of indefinite-lived intangible assets | — | — | — | — | 130 | 60 | — | — | — | — | — | 130 | 60 | — | — | — | — | — | ||||||||||||||||||||||||||||||||||||||||||||||||||||||||||||
Goodwill impairment | — | — | — | — | 899 | 235 | — | — | — | — | — | 899 | 235 | — | — | — | — | 89 | ||||||||||||||||||||||||||||||||||||||||||||||||||||||||||||
Restructuring charges, net | 104 | 36 | 1 | — | — | 160 | 171 | 83 | 64 | 1 | — | — | 160 | 171 | 189 | 147 | 111 | 102 | ||||||||||||||||||||||||||||||||||||||||||||||||||||||||||||
In-process research and development charge | — | — | — | — | 112 | 12 | — | — | — | — | — | 112 | 12 | — | — | — | — | — | ||||||||||||||||||||||||||||||||||||||||||||||||||||||||||||
Acquisition-related costs | — | — | — | — | — | 29 | 20 | 19 | 4 | — | — | — | 29 | 20 | 5 | 4 | 3 | — | ||||||||||||||||||||||||||||||||||||||||||||||||||||||||||||
Merger-related costs | — | 105 | 57 | — | 1 | — | — | — | — | 57 | — | 1 | — | — | — | — | — | — | ||||||||||||||||||||||||||||||||||||||||||||||||||||||||||||
|
|
|
|
|
|
|
|
| ||||||||||||||||||||||||||||||||||||||||||||||||||||||||||||||||||||||
| 2,112 | 2,185 | 202 | — | 3,171 | 2,286 | 2,553 | 1,255 | 1,347 | 202 | — | 3,171 | 2,286 | 2,553 | 2,726 | 2,471 | 1,301 | 1,301 | |||||||||||||||||||||||||||||||||||||||||||||||||||||||||||||
|
|
|
|
|
|
|
|
| ||||||||||||||||||||||||||||||||||||||||||||||||||||||||||||||||||||||
OPERATING INCOME (LOSS) | 263 | 266 | (113 | ) | — | (1,138 | ) | (420 | ) | (381 | ) | (209 | ) | (86 | ) | |||||||||||||||||||||||||||||||||||||||||||||||||||||||||||||||
OPERATING (LOSS) INCOME | (113 | ) | — | (1,138 | ) | (420 | ) | (381 | ) | (94 | ) | 115 | 16 | (49 | ) | |||||||||||||||||||||||||||||||||||||||||||||||||||||||||||||||
Interest expense | (3 | ) | (1 | ) | — | — | (377 | ) | (409 | ) | (487 | ) | (229 | ) | (240 | ) | — | — | (377 | ) | (409 | ) | (487 | ) | (460 | ) | (432 | ) | (217 | ) | (224 | ) | ||||||||||||||||||||||||||||||||||||||||||||||
Loss on extinguishment of debt | — | — | — | — | — | — | — | — | (246 | ) | — | — | — | — | — | (246 | ) | — | — | (6 | ) | |||||||||||||||||||||||||||||||||||||||||||||||||||||||||
Other income, net | 24 | 43 | 1 | — | 27 | 14 | 15 | 5 | 1 | |||||||||||||||||||||||||||||||||||||||||||||||||||||||||||||||||||||
Other income (expense), net | 1 | — | 27 | 14 | 15 | 5 | (29 | ) | (16 | ) | 4 | |||||||||||||||||||||||||||||||||||||||||||||||||||||||||||||||||||
|
|
|
|
|
|
|
|
| ||||||||||||||||||||||||||||||||||||||||||||||||||||||||||||||||||||||
INCOME (LOSS) BEFORE INCOME TAXES | 284 | 308 | (112 | ) | — | (1,488 | ) | (815 | ) | (853 | ) | (433 | ) | (571 | ) | |||||||||||||||||||||||||||||||||||||||||||||||||||||||||||||||
Provision for (benefit from) income taxes | 83 | 93 | (24 | ) | — | (183 | ) | 30 | 18 | (16 | ) | 41 | ||||||||||||||||||||||||||||||||||||||||||||||||||||||||||||||||||
LOSS BEFORE INCOME TAXES | (112 | ) | — | (1,488 | ) | (815 | ) | (853 | ) | (795 | ) | (346 | ) | (217 | ) | (275 | ) | |||||||||||||||||||||||||||||||||||||||||||||||||||||||||||||
NET INCOME (LOSS) | 201 | 215 | (88 | ) | — | (1,305 | ) | (845 | ) | (871 | ) | (417 | ) | (612 | ) | |||||||||||||||||||||||||||||||||||||||||||||||||||||||||||||||
Benefit from (provision for) income taxes | 24 | — | 183 | (30 | ) | (18 | ) | (68 | ) | (8 | ) | 26 | 6 | |||||||||||||||||||||||||||||||||||||||||||||||||||||||||||||||||
|
|
|
|
|
|
|
|
| ||||||||||||||||||||||||||||||||||||||||||||||||||||||||||||||||||||||
NET LOSS | (88 | ) | — | (1,305 | ) | (845 | ) | (871 | ) | (863 | ) | (354 | ) | (191 | ) | (269 | ) | |||||||||||||||||||||||||||||||||||||||||||||||||||||||||||||
Less net income attributable to noncontrolling interests | — | 3 | — | — | 2 | 2 | 3 | 2 | — | — | — | 2 | 2 | 3 | — | — | — | — | ||||||||||||||||||||||||||||||||||||||||||||||||||||||||||||
|
|
|
|
|
|
|
|
| ||||||||||||||||||||||||||||||||||||||||||||||||||||||||||||||||||||||
NET INCOME (LOSS) ATTRIBUTABLE TO AVAYA HOLDINGS CORP. | 201 | 212 | (88 | ) | — | (1,307 | ) | (847 | ) | (874 | ) | (419 | ) | (612 | ) | |||||||||||||||||||||||||||||||||||||||||||||||||||||||||||||||
Less: Accretion and accrued dividends on Series A preferred stock | — | — | — | — | — | — | (62 | ) | (2 | ) | (3 | ) | ||||||||||||||||||||||||||||||||||||||||||||||||||||||||||||||||||
NET LOSS ATTRIBUTABLE TO AVAYA HOLDINGS CORP. | (88 | ) | — | (1,307 | ) | (847 | ) | (874 | ) | (863 | ) | (354 | ) | (191 | ) | (269 | ) | |||||||||||||||||||||||||||||||||||||||||||||||||||||||||||||
NET INCOME (LOSS) ATTRIBUTABLE TO AVAYA HOLDINGS CORP. COMMON STOCKHOLDERS | $ | 201 | $ | 212 | $ | (88 | ) | $ | — | $ | (1,307 | ) | $ | (847 | ) | $ | (936 | ) | $ | (421 | ) | $ | (615 | ) | ||||||||||||||||||||||||||||||||||||||||||||||||||||||
Less: Accretion and accrued dividends on Series A and Series B preferred stock | — | — | — | — | (62 | ) | (7 | ) | (71 | ) | (3 | ) | (21 | ) | ||||||||||||||||||||||||||||||||||||||||||||||||||||||||||||||||
|
|
|
|
|
|
|
|
| ||||||||||||||||||||||||||||||||||||||||||||||||||||||||||||||||||||||
NET LOSS ATTRIBUTABLE TO AVAYA HOLDINGS CORP. COMMON STOCKHOLDERS | $ | (88 | ) | $ | — | $ | (1,307 | ) | $ | (847 | ) | $ | (936 | ) | $ | (870 | ) | $ | (425 | ) | $ | (194 | ) | $ | (290 | ) | ||||||||||||||||||||||||||||||||||||||||||||||||||||
|
|
|
|
|
|
|
|
| ||||||||||||||||||||||||||||||||||||||||||||||||||||||||||||||||||||||
SHARE DATA: | ||||||||||||||||||||||||||||||||||||||||||||||||||||||||||||||||||||||||||||||
Net income (loss) per share attributable to common stockholders—basic | $ | 0.43 | $ | 0.47 | $ | (0.19 | ) | $ | — | $ | (2.87 | ) | $ | (1.74 | ) | $ | (1.92 | ) | $ | (0.86 | ) | $ | (1.26 | ) | ||||||||||||||||||||||||||||||||||||||||||||||||||||||
Net loss per share attributable to common stockholders—basic | $ | (0.19 | ) | $ | — | $ | (2.87 | ) | $ | (1.74 | ) | $ | (1.92 | ) | $ | (1.78 | ) | $ | (0.87 | ) | $ | (0.40 | ) | $ | (0.59 | ) | ||||||||||||||||||||||||||||||||||||||||||||||||||||
Weighted average shares outstanding—basic | 462.6 | 454.2 | 462.9 | — | 455.9 | 488.1 | 488.6 | 488.5 | 488.9 | 462.9 | — | 455.9 | 488.1 | 488.6 | 489.0 | 489.6 | 489.3 | 489.3 | ||||||||||||||||||||||||||||||||||||||||||||||||||||||||||||
Net income (loss) per share attributable to common stockholders—diluted | $ | 0.43 | $ | 0.46 | $ | (0.19 | ) | $ | — | $ | (2.87 | ) | $ | (1.74 | ) | $ | (1.92 | ) | $ | (0.86 | ) | $ | (1.26 | ) | ||||||||||||||||||||||||||||||||||||||||||||||||||||||
Net loss per share attributable to common stockholders—diluted | $ | (0.19 | ) | $ | — | $ | (2.87 | ) | $ | (1.74 | ) | $ | (1.92 | ) | $ | (1.78 | ) | $ | (0.87 | ) | $ | (0.40 | ) | $ | (0.59 | ) | ||||||||||||||||||||||||||||||||||||||||||||||||||||
Weighted average shares outstanding—diluted | 468.6 | 461.3 | 462.9 | — | 455.9 | 488.1 | 488.6 | 488.5 | 488.9 | 462.9 | — | 455.9 | 488.1 | 488.6 | 489.0 | 489.6 | 489.3 | 489.3 | ||||||||||||||||||||||||||||||||||||||||||||||||||||||||||||
| Predecessor | Successor | Predecessor | Successor | |||||||||||||||||||||||||||||||||||||||||||||||||||||||||||||||||||||||||||
| Fiscal year ended September 30, | Period from October 1, 2007 through October 26, 2007 | Period from June 1, 2007 through September 30, 2007(1) | Fiscal year ended September 30, | Six months ended March 31, | Period from October 1, 2007 through October 26, 2007 | Period from June 1, 2007 through September 30, 2007 | Fiscal year ended September 30, | Six months ended March 31, | ||||||||||||||||||||||||||||||||||||||||||||||||||||||||||||||||||||||
| 2006 | 2007 | 2008(2) | 2009 | 2010 | 2010 | 2011 | 2008(1) | 2009 | 2010 | 2011 | 2012 | 2012 | 2013 | |||||||||||||||||||||||||||||||||||||||||||||||||||||||||||||||||
| (in millions) | (in millions) | |||||||||||||||||||||||||||||||||||||||||||||||||||||||||||||||||||||||||||||
BALANCE SHEET DATA (at end of period): | ||||||||||||||||||||||||||||||||||||||||||||||||||||||||||||||||||||||||||||||
Cash and cash equivalents | $ | 899 | $ | 1,270 | $ | — | $ | 594 | $ | 582 | $ | 594 | $ | 591 | $ | 468 | $ | — | $ | 594 | $ | 582 | $ | 594 | $ | 415 | $ | 338 | $ | 356 | $ | 303 | ||||||||||||||||||||||||||||||||||||||||||||||
Intangible assets, net | 263 | 248 | — | 3,154 | 2,636 | 2,603 | 2,878 | 2,367 | — | 3,154 | 2,636 | 2,603 | 2,129 | 1,775 | 1,939 | 1,625 | ||||||||||||||||||||||||||||||||||||||||||||||||||||||||||||||
Goodwill | 941 | 1,157 | — | 3,956 | 3,695 | 4,075 | 4,113 | 4,080 | — | 3,956 | 3,695 | 4,075 | 4,079 | 4,188 | 4,093 | 4,093 | ||||||||||||||||||||||||||||||||||||||||||||||||||||||||||||||
Total assets | 5,200 | 5,933 | — | 10,010 | 8,665 | 9,276 | 9,691 | 8,920 | — | 10,010 | 8,665 | 9,276 | 8,561 | 8,184 | 8,321 | 7,830 | ||||||||||||||||||||||||||||||||||||||||||||||||||||||||||||||
Total debt (excluding capital lease obligations) | — | — | — | 5,222 | 5,150 | 5,928 | 5,887 | 6,176 | — | 5,222 | 5,150 | 5,928 | 6,157 | 6,121 | 6,139 | 6,103 | ||||||||||||||||||||||||||||||||||||||||||||||||||||||||||||||
Preferred stock, Series B | — | — | — | — | — | 227 | — | 245 | ||||||||||||||||||||||||||||||||||||||||||||||||||||||||||||||||||||||
Preferred stock, Series A | — | — | — | — | — | 130 | 127 | 133 | — | — | — | 130 | 137 | 144 | 140 | 147 | ||||||||||||||||||||||||||||||||||||||||||||||||||||||||||||||
Total Avaya Holdings Corp. stockholders’ equity (deficiency) | 2,086 | 2,586 | — | 1,063 | (682 | ) | (1,543 | ) | (907 | ) | (2,136 | ) | — | 1,063 | (682 | ) | (1,543 | ) | (2,500 | ) | (2,843 | ) | (2,637 | ) | (3,133 | ) | ||||||||||||||||||||||||||||||||||||||||||||||||||||
STATEMENT OF CASH FLOWS DATA: | ||||||||||||||||||||||||||||||||||||||||||||||||||||||||||||||||||||||||||||||
Net cash provided by (used in) | ||||||||||||||||||||||||||||||||||||||||||||||||||||||||||||||||||||||||||||||
Operating activities | $ | 647 | $ | 637 | $ | 133 | $ | — | $ | 304 | $ | 242 | $ | 42 | $ | (2 | ) | $ | (349 | ) | $ | 133 | $ | — | $ | 304 | $ | 242 | $ | 42 | $ | (300 | ) | $ | 44 | $ | 31 | $ | 88 | |||||||||||||||||||||||||||||||||||||||
Investing activities | (189 | ) | (360 | ) | (16 | ) | — | (7,205 | ) | (155 | ) | (864 | ) | (850 | ) | (30 | ) | (16 | ) | — | (7,205 | ) | (155 | ) | (864 | ) | (101 | ) | (283 | ) | (75 | ) | (59 | ) | ||||||||||||||||||||||||||||||||||||||||||||
Financing activities | (315 | ) | 54 | 11 | — | 7,512 | (101 | ) | 853 | 878 | 248 | 11 | — | 7,512 | (101 | ) | 853 | 228 | 155 | (22 | ) | (59 | ) | |||||||||||||||||||||||||||||||||||||||||||||||||||||||
OTHER FINANCIAL DATA: | ||||||||||||||||||||||||||||||||||||||||||||||||||||||||||||||||||||||||||||||
EBITDA | $ | 520 | $ | 557 | $ | (94 | ) | $ | — | $ | (515 | ) | $ | 240 | $ | 320 | $ | 135 | $ | 2 | $ | (94 | ) | $ | — | $ | (515 | ) | $ | 240 | $ | 320 | $ | 313 | $ | 647 | $ | 284 | $ | 169 | ||||||||||||||||||||||||||||||||||||||
Adjusted EBITDA(3) | 654 | 832 | (27 | ) | — | 859 | 753 | 795 | 367 | 442 | ||||||||||||||||||||||||||||||||||||||||||||||||||||||||||||||||||||
Adjusted EBITDA(2) | (27 | ) | — | 859 | 753 | 795 | 971 | 971 | 479 | 423 | ||||||||||||||||||||||||||||||||||||||||||||||||||||||||||||||||||||
Capital expenditures, net | 117 | 120 | 8 | — | 120 | 76 | 79 | 30 | 35 | 8 | — | 120 | 76 | 79 | 83 | 92 | 38 | 47 | ||||||||||||||||||||||||||||||||||||||||||||||||||||||||||||
Capitalized software development costs | 71 | 93 | 7 | — | 74 | 43 | 43 | 23 | 14 | 7 | — | 74 | 43 | 43 | 42 | 35 | 19 | 10 | ||||||||||||||||||||||||||||||||||||||||||||||||||||||||||||
| (1) |
| The summary historical consolidated financial data above as of and for the year ended September 30, 2008 reflect the results of Avaya Holdings Corp. for the entire fiscal year and includes the results of Avaya Inc. and its consolidated subsidiaries subsequent to October |
| Adjusted EBITDA is calculated in accordance with |
EBITDA is defined as net income (loss) before income taxes, interest and depreciation and amortization. EBITDA provides us with a measure of operating performance that excludes items that are outside the control of management, which can differ significantly from company to company depending on capital structure, the tax jurisdictions in which companies operate and capital investments. Under Avaya Inc.’s debt agreements, its ability to draw on its revolving credit facilities or engage in activities such as incurring additional indebtedness, making investments and paying dividends is tied in part to ratios based on Adjusted EBITDA. EBITDA and Adjusted EBITDA are non-GAAP measures. GAAP is a reference to generally accepted accounting principles in the United States of America. As defined in ourAvaya Inc.’s debt agreements, Adjusted EBITDA is a measure of EBITDA further adjusted to exclude certain charges and other adjustments permitted in calculating covenant compliance under ourAvaya Inc.’s debt agreements. We believe that including
supplementary information concerning Adjusted EBITDA is appropriate to provide additional information to investors to demonstrate compliance with ourAvaya Inc.’s debt agreements and because it serves as a basis for determining management compensation. In addition, we believe Adjusted EBITDA provides more comparability between our historical results and results that reflect purchase accounting and our new capital structure following the Merger. Accordingly, Adjusted EBITDA measures our financial performance based on operational factors that management can impact in the short-term, namely the Company’s pricing strategies, volume, costs and expenses of the organization.
EBITDA and Adjusted EBITDA have limitations as analytical tools. Adjusted EBITDA does not represent net income (loss) or cash flow from operations as those terms are defined by GAAP and does not necessarily indicate whether cash flows will be sufficient to fund cash needs. While Adjusted EBITDA and similar measures are frequently used as measures of operations and the ability to meet debt service requirements, these terms are not necessarily comparable to other similarly titled captions of other companies due to the potential inconsistencies in the method of calculation. Adjusted EBITDA does not reflect the impact of earnings or charges resulting from matters that we consider not to be indicative of our ongoing operations. In particular, the definition of Adjusted EBITDA in Avaya Inc.’s debt agreements allows us to add back certain non-cash charges that are deducted in calculating net income (loss). Avaya Inc.’s debt agreements also allowallows us to add back restructuring charges, Sponsor monitoring fees and other specific cash costs and expenses as defined in the agreements and that portion of our pension costs, other post-employment benefit costs, and non-retirement post-employment benefit costs representing the amortization of prior service costs and net actuarial gains/losses associated with these employment benefits. However, these are expenses that may recur, may vary and are difficult to predict. Further, Avaya Inc.’s debt agreements require that Adjusted EBITDA be calculated for the most recent four fiscal quarters. As a result, the measure can be disproportionately affected by a particularly strong or weak quarter. Further, it may not be comparable to the measure for any subsequent four-quarter period or any complete fiscal year.
The unaudited reconciliation of net (loss) income, (loss), which is a GAAP measure, to EBITDA and Adjusted EBITDA is presented below:
| Predecessor | Successor | Predecessor | Successor | |||||||||||||||||||||||||||||||||||||||||||||||||||||||||||||||||||||||
| Fiscal year ended September 30, 2007 | October 1, 2007 through October 26, 2007 | June 1, 2007 through September 30, 2007 | Fiscal year ended September 30, | Six months ended March 31, | Period from October 1, 2007 through October 26, 2007 | Period from June 1, 2007 through September 30, 2007 | Fiscal year ended September 30, | Six months ended March 31, | ||||||||||||||||||||||||||||||||||||||||||||||||||||||||||||||||||
| 2008 | 2009 | 2010 | 2010 | 2011 | 2008(1) | 2009 | 2010 | 2011 | 2012 | 2012 | 2013 | |||||||||||||||||||||||||||||||||||||||||||||||||||||||||||||||
| (in millions) | (in millions) | |||||||||||||||||||||||||||||||||||||||||||||||||||||||||||||||||||||||||
Net income (loss) | $ | 215 | $ | (88 | ) | $ | — | $ | (1,305 | ) | $ | (845 | ) | $ | (871 | ) | $ | (417 | ) | $ | (612 | ) | ||||||||||||||||||||||||||||||||||||||||||||||||||||
Net loss | $ | (88 | ) | $ | — | $ | (1,305 | ) | $ | (845 | ) | $ | (871 | ) | $ | (863 | ) | $ | (354 | ) | $ | (191 | ) | $ | (269 | ) | ||||||||||||||||||||||||||||||||||||||||||||||||
Interest expense | 1 | — | — | 377 | 409 | 487 | 229 | 240 | — | — | 377 | 409 | 487 | 460 | 432 | 217 | 224 | |||||||||||||||||||||||||||||||||||||||||||||||||||||||||
Interest income | (49 | ) | (5 | ) | — | (20 | ) | (6 | ) | (5 | ) | (3 | ) | (2 | ) | (5 | ) | — | (20 | ) | (6 | ) | (5 | ) | (5 | ) | (3 | ) | (2 | ) | (1 | ) | ||||||||||||||||||||||||||||||||||||||||||
Income tax (benefit) expense | 93 | (24 | ) | — | (183 | ) | 30 | 18 | (16 | ) | 41 | |||||||||||||||||||||||||||||||||||||||||||||||||||||||||||||||
(Benefit from) provision for income taxes | (24 | ) | — | (183 | ) | 30 | 18 | 68 | 8 | (26 | ) | (6 | ) | |||||||||||||||||||||||||||||||||||||||||||||||||||||||||||||
Depreciation and amortization | 297 | 23 | — | 616 | 652 | 691 | 342 | 335 | 23 | — | 616 | 652 | 691 | 653 | 564 | 286 | 221 | |||||||||||||||||||||||||||||||||||||||||||||||||||||||||
|
|
|
|
|
|
|
|
|
| |||||||||||||||||||||||||||||||||||||||||||||||||||||||||||||||||
EBITDA | 557 | (94 | ) | — | (515 | ) | 240 | 320 | 135 | 2 | (94 | ) | — | (515 | ) | 240 | 320 | 313 | 647 | 284 | 169 | |||||||||||||||||||||||||||||||||||||||||||||||||||||
Impact of purchase accounting adjustments | — | — | — | 230 | (1 | ) | 5 | 2 | (2 | ) | — | — | 230 | (1 | ) | 5 | — | 3 | 1 | — | ||||||||||||||||||||||||||||||||||||||||||||||||||||||
Restructuring charges, net | 36 | 1 | — | — | 160 | 171 | 83 | 64 | 1 | — | — | 160 | 171 | 189 | 142 | 111 | 102 | |||||||||||||||||||||||||||||||||||||||||||||||||||||||||
Sponsors’ fees | — | — | — | 6 | 7 | 7 | 4 | 4 | — | — | 6 | 7 | 7 | 7 | 7 | 4 | 4 | |||||||||||||||||||||||||||||||||||||||||||||||||||||||||
Merger-related costs | 105 | 57 | — | 1 | — | — | — | — | 57 | — | 1 | — | — | — | — | — | — | |||||||||||||||||||||||||||||||||||||||||||||||||||||||||
Acquisition-related costs | — | — | — | — | 29 | 20 | 19 | 4 | — | — | — | 29 | 20 | 5 | 4 | 3 | — | |||||||||||||||||||||||||||||||||||||||||||||||||||||||||
Integration-related costs | — | — | — | — | 5 | 208 | 83 | 87 | — | — | — | 5 | 208 | 132 | 19 | 8 | 9 | |||||||||||||||||||||||||||||||||||||||||||||||||||||||||
Strategic initiative costs(f) | — | — | — | 27 | 21 | 6 | 4 | — | ||||||||||||||||||||||||||||||||||||||||||||||||||||||||||||||||||
Debt registration fees | — | — | — | — | — | 1 | 1 | — | — | — | — | — | 1 | — | — | — | — | |||||||||||||||||||||||||||||||||||||||||||||||||||||||||
Loss on extinguishment of debt(g) | — | — | — | — | — | — | — | 246 | ||||||||||||||||||||||||||||||||||||||||||||||||||||||||||||||||||
Third-party fees expensed in connection with debt modification(h) | — | — | — | — | — | — | — | 9 | ||||||||||||||||||||||||||||||||||||||||||||||||||||||||||||||||||
Loss on extinguishment of debt(7) | — | — | — | — | — | 246 | — | — | 6 | |||||||||||||||||||||||||||||||||||||||||||||||||||||||||||||||||
Third-party fees expensed in connection with debt modification(8) | — | — | — | — | — | 9 | — | — | 18 | |||||||||||||||||||||||||||||||||||||||||||||||||||||||||||||||||
Strategic initiative costs(9) | — | — | 27 | 21 | 6 | — | — | — | — | |||||||||||||||||||||||||||||||||||||||||||||||||||||||||||||||||
Non-cash share-based compensation | 39 | — | — | 21 | 10 | 19 | 11 | 6 | — | — | 21 | 10 | 19 | 12 | 8 | 5 | 3 | |||||||||||||||||||||||||||||||||||||||||||||||||||||||||
Write-down of held for sale assets to net realizable value | — | — | — | — | — | — | — | 1 | — | — | — | — | — | 1 | 5 | — | — | |||||||||||||||||||||||||||||||||||||||||||||||||||||||||
(Gain) loss on sale of long-lived assets | (8 | ) | — | — | 1 | 1 | (4 | ) | — | (1 | ) | |||||||||||||||||||||||||||||||||||||||||||||||||||||||||||||||
Loss (gain) on investments and sale of long-lived assets | — | — | 1 | 1 | (4 | ) | 1 | 3 | 3 | — | ||||||||||||||||||||||||||||||||||||||||||||||||||||||||||||||||
Impairment of long-lived assets | 8 | — | — | 140 | 62 | 16 | 16 | — | — | — | 140 | 62 | 16 | — | 6 | — | — | |||||||||||||||||||||||||||||||||||||||||||||||||||||||||
Goodwill impairment | — | — | — | 899 | 235 | — | — | — | — | — | 899 | 235 | — | — | — | — | 89 | |||||||||||||||||||||||||||||||||||||||||||||||||||||||||
Bank fees | 7 | — | — | — | — | — | — | — | ||||||||||||||||||||||||||||||||||||||||||||||||||||||||||||||||||
Reversal of contingent liability related to acquisition | — | — | — | — | — | — | (1 | ) | — | — | ||||||||||||||||||||||||||||||||||||||||||||||||||||||||||||||||
Change in fair value of Preferred Series B embedded derivative(10) | — | — | — | — | — | — | 6 | — | (8 | ) | ||||||||||||||||||||||||||||||||||||||||||||||||||||||||||||||||
Venezuela hyperinflationary and devaluation charges | — | — | — | — | — | — | — | — | 1 | |||||||||||||||||||||||||||||||||||||||||||||||||||||||||||||||||
Securities registration fees(11) | — | — | — | — | — | — | 3 | 3 | — | |||||||||||||||||||||||||||||||||||||||||||||||||||||||||||||||||
Net loss (income) of unrestricted subsidiaries, net of dividends received | 2 | — | (5 | ) | (4 | ) | (6 | ) | — | — | — | — | ||||||||||||||||||||||||||||||||||||||||||||||||||||||||||||||
Loss (gain) on foreign currency transactions | — | 1 | — | (15 | ) | (8 | ) | 1 | (2 | ) | (9 | ) | 1 | — | (15 | ) | (8 | ) | 1 | (12 | ) | 21 | 12 | (15 | ) | |||||||||||||||||||||||||||||||||||||||||||||||||
Net (income) loss of unrestricted subsidiaries, net of dividends received | (6 | ) | 2 | — | (5 | ) | (4 | ) | (6 | ) | (4 | ) | — | |||||||||||||||||||||||||||||||||||||||||||||||||||||||||||||
Pension/OPEB/nonretirement postemployment benefits and long-term disability costs(i) | 94 | 6 | — | 69 | (4 | ) | 31 | 15 | 31 | |||||||||||||||||||||||||||||||||||||||||||||||||||||||||||||||||
Pension/OPEB/nonretirement postemployment benefits and long-term disability costs(12) | 6 | — | 69 | (4 | ) | 31 | 68 | 98 | 45 | 45 | ||||||||||||||||||||||||||||||||||||||||||||||||||||||||||||||||
|
|
|
|
|
|
|
|
|
| �� | ||||||||||||||||||||||||||||||||||||||||||||||||||||||||||||||||
Adjusted EBITDA | $ | 832 | $ | (27 | ) | $ | — | $ | 859 | $ | 753 | $ | 795 | $ | 367 | $ | 442 | $ | (27 | ) | $ | — | $ | 859 | $ | 753 | $ | 795 | $ | 971 | $ | 971 | $ | 479 | $ | 423 | ||||||||||||||||||||||||||||||||||||||
|
|
|
|
|
|
|
|
| ||||||||||||||||||||||||||||||||||||||||||||||||||||||||||||||||||
| The summary historical consolidated financial data above as of and for the year ended September 30, 2008 reflect the results of Avaya Holdings Corp. for the entire fiscal year and includes the results of Avaya Inc. and its consolidated subsidiaries subsequent to October 26, 2007, the date of the Merger. |
| (2) | For fiscal |
| adjustments for certain assets and liabilities, such as inventory. For fiscal |
| Sponsors’ fees represent monitoring fees payable to affiliates of the Sponsors pursuant to a management services agreement entered into at the time of the Merger. See “Certain Relationships and Related Party Transactions.” |
| Merger-related costs are costs directly attributable to the Merger and include investment banking, legal and other third-party costs. |
| Acquisition-related costs include legal and other costs related to the acquisition of NES, Radvision and other acquisitions. |
| Integration-related costs primarily represent third-party consulting fees and other administrative costs associated with consolidating and coordinating the operations of Avaya and |
| In fiscal 2013, loss on extinguishment of debt represents the loss recognized in connection with the repayment of $284 million of term B-5 loans and $584 million of term B-1 loans and was measured as the difference between the reacquisition price and the carrying value (including unamortized debt costs) of the debt as discussed in Note 7, “Financing Arrangements,” to our unaudited Consolidated Financial Statements located elsewhere in this prospectus. In fiscal 2012 the loss on extinguishment of debt represents the loss recognized in connection with the payment in full of the senior secured incremental term B-2 loans and was measured as the difference between the reacquisition price and the carrying value of the senior secured incremental term B-2 loans as discussed in Note 9, “Financing Arrangements,” to our audited Consolidated Financial Statements located elsewhere in this prospectus. |
| (8) | In fiscal 2013, the third-party fees expensed in connection with debt modification represents fees paid to third-parties in connection with the modification of the senior secured credit facility and the exchange of $1,384 million of senior unsecured notes for senior secured notes as discussed in Note 7, “Financing Arrangements,” to our unaudited Consolidated Financial Statements located elsewhere in this prospectus. In fiscal 2011, includes fees paid to third parties in connection with the modification of the senior secured credit facility as discussed in Note 9, “Financing Arrangements,” to our audited Consolidated Financial Statements located elsewhere in this prospectus. |
| (9) | Strategic initiative costs represent consulting fees in connection with management’s cost-savings actions, which commenced subsequent to the Merger. |
| Represents that portion of our pension costs, other post-employment benefit costs, non-retirement post-employment benefit costs representing the amortization of prior service costs and net actuarial gains/losses associated with these employment benefits. For the fiscal year ended September 30, 2011, the amount includes a curtailment charge of $7 million associated with workforce reductions in Germany. |
Investing in our common stock involves a high degree of risk. You should carefully consider the following risk factors, as well as the other information in this prospectus, before deciding to invest in our common stock. The occurrence of any of the following risks could harm our business, financial condition, results of operations or prospects. In that case, the trading price of our common stock could decline, and you may lose all or part of your investment.
Risks Associated with Our Company
A key component of our strategy isOur solutions may fail to leverage our leading market positions to drive the adoption of our next-generation business collaboration solutions,keep pace with rapidly changing technology and this strategy may not be successful.evolving industry standards.
Business collaboration technology continues to evolve. BothThe market in which we operate is characterized by rapid, and sometimes disruptive, technological developments, evolving industry standards, frequent new product introductions and enhancements and changes in customer requirements. In addition, both traditional and new competitors are investing heavily in this market and competing for customers.
In order to execute our strategy successfully, we must:
retain and expand our presence with existing customers by continuing to innovate around As next-generation business collaboration solutions and continuingtechnology continues to grow our contact center and voice communications solutions;
capture additional market share across our portfolio of products and services;
continueevolve, we must keep pace in order to expand gross margins and reduce operating expense through current and future initiatives;
continue to invest in research and development, including in new software and platform development;
continue to invest in and expand our sales and distribution capabilities to attack new markets and better penetrate existing markets;
train our sales staff and distribution partners to sell new products and services including, but not limited to, the recently launched Avaya Flare Experience and our new video products;
acquire new technologies through licensing, development contracts, alliances and acquisitions;
train our services employees and channel partners to service new or enhanced products and applications and take other measures to ensure we can deliver consistent levels of service globally;
enhance our services organization’s ability to service complex, multi-vendor networks;
retain, recruit and develop qualified personnel globally, particularly in research and development, services and sales;
develop relationships with new types of channel partners who are capable of both selling advanced products and extending our reach into new and existing markets; and
establishmaintain or expand our presence in key geographic markets.
market leading position. We recently introduced a significant number of new product offerings and are increasingly focused on new, high value software solutions, as a revenue driver. If we doare not able to successfully executedevelop and bring these new solutions to market in a timely manner, achieve market acceptance of our strategy,solutions or identify new market opportunities for our operatingsolutions, our business and results of operations may be materially and adversely affected.
The market opportunity for business collaboration unified communications solutions and other products and services may not develop in the ways that we anticipate.
The demand for our offerings can change quickly and in ways that we may not anticipate because the market in which we operate is characterized by rapid, and sometimes disruptive, technological developments, evolving industry standards, frequent new product introductions and enhancements, changes in customer requirements and a limited ability to accurately forecast future customer orders. Our operating results may be adversely affected if the market opportunity for our products and services does not develop in the ways that we anticipate.
We cannot predict whether:
our solutions will attract and retain customers and channel partners or that we can execute our sales strategy successfully;
the demand for our products and services, including Avaya Aura and the Avaya Flare Experience, will grow as quickly as we anticipate or current or future competitors or new technologies will cause the market to evolve in a manner different than we expect;
if other technologies will become more accepted or standard in our industry or will disrupt our SIP-based technology platform; orplatforms.
we will be able to maintain a leadership or profitable position as this opportunity develops.
We face formidable competition from numerous established firms that provide both traditional enterprise voice communications solutions as well as providers of technology related to business collaboration andunified communications, contact center solutions;and networking solutions and related services; as these markets evolve, we expect competition to intensify and expand to include companies that do not currently compete directly against us.
We compete against providers of both traditional enterprise voiceOur unified communications solutions as well as providers of technology related to business collaboration and contact center solutions. For example, we compete with Alcatel-Lucent (including Genesys), Aspect Software, Inc., or Aspect, Brocade Communications Systems, Inc., or Brocade, Cisco Systems, Inc., or Cisco, Juniper Networks, Inc., or Juniper, Microsoft Corporation, or Microsoft, NEC Corporation, or NEC, and Siemens Enterprise Communications Group, or SEN.SEN, Alcatel-Lucent and Huawei Technologies Co., Ltd, or Huawei, in the enterprise segment; with ShoreTel, Inc., or ShoreTel, and Mitel Networks Corp., or Mitel, in the small and medium enterprise segment; and with Cisco, Broadsoft Inc., or Broadsoft, Microsoft, 8x8, Inc., or 8x8, and ShoreTel in cloud solutions. Our video conferencing solutions both partner and compete with solutions offered byCisco, Polycom Inc., TANDBERG (now Cisco) and LifeSize (now a division of Logitech International S.A.). We also face competition
Our contact center solutions compete with Genesys Telecommunications Laboratories, Inc., or Genesys, Cisco and Huawei in the enterprise segment and with Cisco and Interactive Intelligence, Inc., or Interactive Intelligence, in the small and medium enterprise market from many competitors, includingsegment and cloud solutions.
Our networking solutions compete with Cisco, Alcatel-Lucent, NEC, Matsushita Electric Corporation of America, MitelHewlett-Packard Company, or HP, Huawei and Juniper Networks, Corp., or Mitel, and ShoreTel Inc., or ShoreTel, although the market for these products is more fragmented. Juniper, primarily with respect to L2/L3 ethernet switching.
We face competition in certain geographies with companies that have a particular strength and focus in these regions, such as Huawei Technologies Co., Ltd. in China, and Intelbras S.A., or Intelbras, in Latin America. OurAmerica and Matsushita Electric Corporation of America, or Panasonic, in Asia.
While we believe our global, in-house end-to-end services business competesorganization provides us with a competitive advantage, it faces competition from companies like those above in offering services, either directly or indirectly through their channel partners, with respect to their own product offerings, as well as with many value-added resellers, consulting and systems integration firms and network service providers.
In addition, because the business collaboration market continues to evolve and technology continues to develop rapidly, we may face competition in the future from companies that do not currently compete against us, but whose current business activities may bring them into competition with us in the future. In particular, this may be the case as business, information technology and communications applications deployed on converged networks become more integrated to support business collaboration. We may face increased competition from current leaders in information technology infrastructure, information technology, consumer products, companies, personal and business applications and the software that connects the network infrastructure to those applications. With respect to services, we may also face competition from companies that seek to sell remotely hosted services or software as a service directly to the end customer. Competition from these potential market entrants may take many forms, including offering products and applications similar to those we offer as part of another offering. In addition, these technologies continue to move from a proprietary environment to an open standards-based environment.
Several of our existing competitors have, and many of our future competitors may have, greater financial, personnel, technical, research and development and other resources, more well-established brands or reputations and broader customer bases than we do and, as a result, these competitors may be in a stronger position to respond quickly to potential acquisitions and other market opportunities, new or emerging technologies and changes in customer requirements. Some of these competitors may have customer bases that are more geographically balanced than ours and, therefore, may be less affected by an economic downturn in a particular region. Other competitors may have deeper expertise in a particular stand-alone technology that develops more quickly than we anticipate. Competitors with greater resources also may be able to offer lower prices, additional
products or services or other incentives that we cannot match or do not offer. Industry consolidations may also create competitors with broader and more geographic coverage and the ability to reach enterprises through communications service providers. Existing customers of data networking companies that compete against us may be inclined to purchase enterprise communications solutions from their current data networking or software vendors rather than from us. Also, as communications and data networks converge, we may face competition from systems integrators that traditionally have been focused on data network integration.
We cannot predict which competitors may enter our markets in the future, what form such competition may take or whether we will be able to respond effectively to the entry of new competitors into competition with us or the rapid evolution in technology and product development that has characterized our businesses. In addition, in order to effectively compete with any new market entrant, we may need to make additional investments in our business, use more capital resources than our business currently requires or reduce prices, any of which may materially and adversely affect our profitability.
Our revenues are dependent on general economic conditions and the willingness of enterprises to make capital investments.
One factor that significantly affects our operating results is the impact of economic conditions on the willingness of enterprises to make capital investments, particularly in business collaboration technology and related services. Given the current state of the economy, we believe that enterprises continue to be cautious about sustained economic growth and have tried to maintain or improve profitability through cost control and constrained capital spending which places additional pressure on IT departments to demonstrate acceptable return on investment and may cause them to delay or reject capital projects, including implementing our solutions. Because it is not certain whether enterprises will increase spending on business collaboration technology significantlysolutions resulting in the near term, we could experience continued pressure on our ability to increase our revenue. Our ability to grow revenue also may be affected by other factors, such as well as creating competitive pricing pressures and price erosion and our ability to effectively and consistently price new and existing offers in the marketplace.erosion. If these or other conditions limit our ability to grow revenue or cause our revenue to decline and we cannot reduce costs on a timely basis or at all, our operating results may be materially and adversely affected.
Our strategy depends in part on our ability to rely on our indirect sales channel.
We continue to take steps to sell our products and services into new and expanded geographic markets and to a broader customer base. An important element of our go-to-market strategy therefore, involves our indirectto expand sales channel, which includescoverage and increase market absorption of new products is our global network of alliance partners, distributors, dealers, value-added resellers,
telecommunications service providers and system integrators. For example, although we expanded our indirect channel network and gained relationships with new channel partners through our acquisition of NES, in order to be successful we must further monetize the NES installed base by increasing the services attach rate for the Nortel customers we acquired. Our relationships with channel partners are important elementsCertain of our marketingcontractual agreements with our largest distributors and sales efforts.resellers generally permit termination of the relationship by either party for convenience upon prior notice of 30 to 180 days. See “Our Business-Avaya Connect” for more information on our global business partner program and the standard terms of our program agreements. Our financial results could be adversely affected if our contracts with channel partners were terminated, if our relationships with channel partners were to deteriorate, if our maintenancesupport pricing or other services strategies conflict with those of our channel partners, if any of our competitors were to enter into strategic relationships with or acquire a significant channel partner, if channel partners do not become enabled to sell new products or if the financial condition of our channel partners were to weaken. In addition, we may expend time, money and other resources on developing and maintaining channel relationships that are ultimately unsuccessful. There can be no assurance that we will be successful in maintaining, expanding or developing relationships with channel partners, including those obtained as a result of the acquisition of NES.partners. If we are not successful, we may lose sales opportunities, customers andor market share.
We are dependent on our intellectual property. If we are not able to protect our proprietary rights or if those rights are invalidated or circumvented, our business may be adversely affected.
We believe that developing new products and technology is critical to our success. As a leader in technology and innovation in business collaboration we are dependent on the maintenance of our current intellectual property rights and the establishment of new intellectual property rights. Wecommunications, we generally protect our intellectual property through patents, trademarks, trade secrets, copyrights, confidentiality and nondisclosure agreements and other measures. There can be no assurance that patents will be issued from pending applications that we have filed or that our patents will be sufficient to protect our key technology. Although we have been granted and have acquired many patents, have obtained other intellectual property rights and continue to file new patent applications and seek additional proprietary rights, theretechnology from misappropriation or falling into the public domain, nor can assurances be no assurances made that any of our patents, patent applications or our other intellectual property or proprietary rights will not be challenged, invalidated or circumvented. In addition,For example, our business is global and the level of protection of our proprietary technology will vary by country, particularly in countries that do not have well developed judicial systems or laws that adequately protect intellectual property rights. Any actions taken in these countries may have results that are different than if such actions were taken under the laws of the U.S. Patent litigation and other challenges to our patents and other proprietary rights are costly and unpredictable and may prevent us from marketing and selling a product in a particular geographic area. Patent filings by third parties, whether made before or after the date of our filings, could render our intellectual property less valuable. Competitors and others may also misappropriate our intellectual property, disputes as to ownership of intellectual property may arise and our intellectual property may otherwise fall into the public domain. If we are unable to protect our proprietary rights, we may be at a disadvantage to others who did not incur the substantial time and expense we incurred to create our products. In addition, our efforts to enforce or protect our proprietary rights may be ineffective, could result in substantial costs and diversion of resources and could substantially harm operating results.
If we fail to retain or attract key employees, our business may be harmed.
The success of our business depends on the skill, experience and dedication of our employee base. If we are unable to retain and recruit sufficiently experienced and capable personnel, especially in the key areas of product development, sales, services and management, our business and financial results may suffer. Experienced and capable personnel in the technology industry remain in high demand, and there is continual competition for their talents among our competitors.talents. When talented employees leave, we may have difficulty replacing them and our business may suffer. While we strive to maintain our competitiveness in the marketplace, there can be no assurance that we will be able to successfully retain and attract the personnel that we need to achieve our business objectives.
We rely on third-party providers for the manufacture,manufacturers and component suppliers, as well as warehousing and distribution logistics associated with our products.providers.
We have outsourced substantially all of our manufacturing operations to several electronic manufacturing services, or EMS, providers. Our EMS providers produce the vast majority of products in facilities located in southern China, with other products producedmanufactured in facilities located in Poland, Israel, Mexico, Malaysia, Taiwan, Ireland, Germany, Indonesia, the United Kingdom and the U.S. All manufacturing of our products is performed in accordance with detailed specifications and product designs furnished or approved by us and is subject to rigorous quality control standards. We periodically review our product manufacturing operations and consider changes we believe may be necessary or appropriate. Although we closely manage the transition process when manufacturing changes are required, we could experience disruption to our operations during any such transition. Any such disruption could negatively affect our reputation and our results of operations. We also purchase certain hardware components and license certain software components and resell them separately or as part of our products under the Avaya brand. In some cases, certain components are available only from a single source
or from a limited source of suppliers. Delays or shortages associated with these components could cause significant disruption to our operations.
We have also outsourced substantially all of our warehousing and distribution logistics operations to several providers of such services on a global basis, and any delays or material changes in such services could cause significant disruption to our operations.As our business and operations related relationships have expanded globally in the last few years, certain operational and logistical challenges as well as changes in economic or political conditions as well asand natural disasters, in a specific country or region, could negatively affect our revenue, costs, expenses and financial condition or those of our channel partners and distributors.
We conduct significant sales and customer support operations and increasing amounts of our research and development activities in countries outside of the U.S. and also depend on non-U.S. operations of our contract manufacturers and our distributionchannel partners. For each of the fiscal years ended September 30, 2010 and 2009,2012 we derived 45%46% of our revenue from sales outside the U.S. The vast majority of our contract manufacturing also takes place outside the U.S., primarily in southern China. OurThe transition of even a portion of our operations or functions to a foreign country involves a number of logistical and technical challenges, including:
challenges in effectively managing operations in jurisdictions with lower cost structures as a result of several factors, including time zone differences and regulatory, legal, employment, cultural and logistical issues;
the potential negative impact on our existing employees as a result of the relocation of workforce resources;
an inability to predict the extent of government support;
the availability of qualified workers and the level of competition in offshore markets for qualified personal, including skilled design and technical personnel, as companies expand their operations offshore; and
future monetary and economic conditions in any specific offshore location
If we are unable to effectively manage our offshore operations, we may be unable to produce the expected cost savings from any shifts of operations to offshore jurisdictions and our business and results of operations could be adversely affected.
In addition, our future operating results, including our ability to import our products from, export our products to, or sell our products in, various countries, could be adversely affected by a variety of uncontrollable and changing factors. These factors includesuch as political conditions, economic conditions, legal and regulatory constraints, protectionist legislation, difficulty in enforcing intellectual property rights such as against counterfeiting of our products, relationships with employees and works councils, unfavorable tax and currency regulations, health or similar issues, natural disasters and other matters in any of the countries or regions in which we and our contract manufacturers and business partners currently operate or intend to operate in the future. Additional risks inherent in our global operations generally include, among other things, the costs and difficulties of managing international operations, adverse tax consequences, including imposition of withholding or other taxes on payments by subsidiaries, and greater difficulty in enforcing intellectual property rights (including the increased risk of counterfeiting of our products). Our prospective effective tax rate could be adversely affected by, among others, an unfavorable geographical distribution of our earnings and losses, by changes in the valuation of our deferred tax assets or liabilities or by changes in tax laws, regulations, accounting principles, or interpretations thereof. The various risks inherent in doing business in the U.S. generally also exist when doing business outside of the U.S., and may be exaggerated by the difficulty of doing business in numerous sovereign jurisdictions due to differences in culture, laws and regulations.
If we perform more of our operations outside the U.S., we may be exposed to increased operational and logistical risks associated with foreign operations, many of which are beyond our control and could affect our ability to operate successfully.
In order to enhance the cost-effectiveness of our operations, increasingly we have been shifting portions of certain of our operations to jurisdictions with lower cost structures than those available in certain of the countries in which we traditionally operate. This includes certain research and development, customer support and corporate infrastructure activities. We may encounter complications associated with the set-up, migration and operation of business systems and equipment in expanded or new facilities. The transition of even a portion of our research and development or customer support operations to a foreign country involves a number of logistical and technical challenges that could result in delays and other disruptions to our operations. If such delays or disruptions occur, they could damage our reputation and otherwise adversely affect our business and results of operations. To the extent that we shift any operations or functions outside of the U.S. to jurisdictions with lower cost structures, we may experience challenges in effectively managing those operations as a result of several factors, including time zone differences and regulatory, legal, employment, cultural and logistical issues. Additionally, the relocation of workforce resources may have a negative impact on our existing employees, which could negatively impact our operations. If we are unable to effectively manage our offshore operations, our business and results of operations could be adversely affected. We cannot be certain that any shifts in our operations to offshore jurisdictions will ultimately produce the expected cost savings. We cannot predict the extent of government support, availability of qualified workers, future labor rates or monetary and economic conditions in any offshore locations where we may operate. Although some of these factors may influence our decision to establish or increase our offshore operations, there are other inherent risks beyond our control, including issues such as political uncertainties and currency regulations as discussed above under “—As our business and operations related relationships have expanded globally in the last few years, changes in economic or political conditions, as well as natural disasters, in a specific country or region could negatively affect our revenue, costs, expenses and financial condition or those of our channel partners and distributors.” We are faced with competition in these offshore markets for qualified personnel, including skilled design and technical personnel, and we expect this competition to increase as companies expand their operations offshore, which
could increase our costs and employee turnover rates. One or more of these factors or other factors relating to foreign operations could result in increased operating expenses and make it more difficult for us to manage our costs and operations, which could cause our operating results to decline and result in reduced revenues.
Fluctuations in foreign currency exchange rates could negatively impact our operating results.
Foreign currency exchange rates and fluctuations may have an impact on our revenue, costs or cash flows from our international operations, which could adversely affect our financial performance. Our primary currency exposures are to the euro, British pound, Indian rupee, Canadian dollar and Canadian dollar.Brazilian real. These exposures may change over time as business practices evolve and as the geographic mix of our business changes. From time to
time we enter into foreign exchange forward contracts to reduce the short-term impact of foreign currency fluctuations. However, any attempts to hedge against foreign currency fluctuation risks may be unsuccessful and result in an adverse impact to our operating results.
If we are unable to integrate acquired businesses into ours effectively, our operating results may be adversely affected.
From time to time, we seek to expand our business through acquisitions. For example, during fiscal 2012 we completed three acquisitions including the acquisition of Radvision Ltd. We may not be able to successfully integrate acquired businesses and, where desired, their product portfolios, into ours, and therefore we may not be able to realize the intended benefits from an acquisition. If we fail to successfully integrate acquisitions, or product portfolios, or if they fail to perform as we anticipate, our existing businesses and our revenue and operating results could be adversely affected. If the due diligence of the operations of these acquired businesses performed by us and by third parties on our behalf is inadequate or flawed, or if we later discover unforeseen financial or business liabilities, acquired businesses and their assets may not perform as expected. Additionally, acquisitions could result in difficulties assimilating acquired operations and, where deemed desirable, transitioning overlapping products to be a single product line and the diversion of capital and management’s attention away from other business issues and opportunities. We may fail to retain employees acquired through acquisitions, which may negatively impact the integration efforts.
For all the reasons set forth above, the failure to integrate acquired businesses effectively may adversely impact Avaya’s business, results of operations or financial condition.
We may be subject to litigation and infringement claims, which could cause us to incur significant expenses or prevent us from selling our products or services.
From time to time, we receive notices and claims from third parties asserting that our proprietary or licensed products, systems and software infringe their intellectual property rights. ThereThe number of such claims has increased recently and there can be no assurance that the number of these notices and claims will not increase in the future and that others will not claim that our proprietary or licensed products, systems and software are infringing their intellectual property rights or that we do not in fact infringe those intellectual property rights. We may be unaware of intellectual property rights of others that may cover some of our technology. Irrespective of the merits of these claims, if a third party claimed that our proprietary or licensed systems and software infringed their intellectual property rights, any resulting litigation could be costly and time consuming and could divert the attention of management and key personnel from other business issues. The complexity of the technology involved and the uncertainty of intellectual property litigation increase these risks. These matters may result in any number of outcomes for us, including entering into licensing agreements, redesigning our products to avoid infringement, being enjoined from selling products that are found to infringe, paying damages if products are found to infringe and indemnifying customers from infringement claims as part of our contractual obligations. Royalty or license agreements may be very costly and we may be unable to obtain royalty or license agreements on terms acceptable to us or at all. Such agreements may cause operating margins to decline. We also may be subject to significant damages or an injunction against us or our use of our proprietary or licensed systems or products. In addition, some of our employees previously have been employed at other companies that provide integrated communications solutions. We may be subject to claims that these employees or we have inadvertently or otherwise used or disclosed trade secrets or other proprietary information of their former employers. These claims and other successful claims of patent or other intellectual property
infringement against us could materially adversely affect our operating results. We have made and will likely continue to make investments to license and/or acquire the use of third-party intellectual property rights and technology as part of our strategy to manage this risk, but there can be no assurance that we will be successful or that any costs relating to such activity will not be material. We may also be subject to additional notice, attribution and other compliance requirements to the extent we incorporate open source software into our applications. In addition, third parties have claimed, and may in the future claim, that a customer’s use of our products, systems or software infringes the third party’s intellectual property rights. Under certain circumstances, we may be required to indemnify our customers for some of the costs and damages related to such an infringement claim. Any indemnification requirement could have a material adverse effect on our business and our operating results. ForSee Note 15, “Commitments and Contingencies,” to our unaudited Consolidated Financial Statements for the six months ended March 31, 2013 and Note 19, “Commitments and Contingencies,” to our audited Consolidated Financial Statements for the fiscal year ended September 30, 2012 for a description of certain legal proceedings regarding intellectual property, please see Note 19, “Commitments and Contingencies,” to our unaudited consolidated financial statements for the period ended March 31, 2011.property.
A breach of the security of our information systems or those of our third party providers could adversely affect our operating results.
We rely on the security of our information systems among other things,and, in certain circumstances, those of our third party providers, such as vendors, consultants and contract manufacturers, to protect our proprietary information and information of our customers. In addition, the growth of BYOD programs has heightened the need for enhanced security measures. Information technology system failures, including a breach of our or our third party providers’ data security, could disrupt our ability to function in the normal course of business by potentially causing, among other things, delays in the fulfillment or cancellation of customer orders, disruptions in the manufacture or shipment of products or, delivery of services or an unintentional disclosure of customer, employee or our information. Additionally, despite our security procedures weor those of our third party providers, information systems may be vulnerable to threats such as computer hacking, cyber-terrorism or other unauthorized attempts by third parties to access, modify or delete our or our customers’ proprietary information. Any such breach could have a material adverse effect on our operating results and our reputation as a provider of mission critical business collaboration and communications solutions. Such consequences could be exacerbated if we or our third party providers are unable to adequately recover critical systems following a systems failure.
We may be adversely affected by environmental, health and safety, laws, regulations, costs and other liabilities.
We are subject to a wide range of governmental requirements relating to employee safety, and health and to environmental protection. If we violate or fail to comply with these requirements, we could be fined or otherwise sanctioned by regulators.regulators, lose customers and damage our reputation, which could have an adverse effect on our business. We are subject to certain provisions of environmental laws governing the cleanup of soil and groundwater contamination that may impose joint and several liability for the costs of investigating and remediating releases of regulated materials at currently or formerly owned or operated sites and at third-party waste disposal sites. In certain circumstances, this liability may also include the cost of cleaning up historical contamination, whether or not caused by us. We are currently involved in several remediations at currently or formerly owned or leased sites. We are also subject to various state,local, federal and international laws and regulations relating toregarding the presencematerial content and electrical design of certain substances in our products and making producers of certain electrical productsthat require us to be financially responsible for the collection, treatment, recycling and disposal of those products. For example, the European Union or the EU,(EU) has adopted the Restriction on Hazardous Substances or RoHS,(RoHS) and Waste Electrical and Electronic Equipment or WEEE, directives. Similar(WEEE Directive) with similar laws and regulations have been or may bebeing enacted in other regions. Effective in May 2014, the United States requires companies to begin publicly disclosing their use of conflict minerals that originated in the Democratic Republic of the Congo (DRC) or an adjoining country. Additionally, new requirements addressing the operating characteristics of our products are emerging, such as the EU Energy Using Product (EuP Directive) are being imposed to address the operating characteristics of our products. Our failure or EuP, directive, which may necessitate reengineeringthe undetected failure of some products.
Environmental laws are complex, change frequently and have tendedour supply chain to become more stringent over time. It is often difficult to estimate the future impact of environmental matters, including potential liabilities. There can be no assurance that our costs of complyingcomply with current andexisting or future environmental, and health and safety laws, including existing, pending and future environmental laws addressing climate change, and ourrequirements could subject us to liabilities arising from past or future releases of, or exposure to, regulated materials will not exceed any amounts reflected inexceeding our reserves or adversely affect our business, results of operations or financial condition.
In addition, a number of climate change regulations and initiatives are either in force or pending at the local, federal and international levels. Our operations and our supply chain could face increased climate change-related regulations, modifications to transportation to meet lower emission requirements and changes to types of materials used for products and packaging to reduce emissions, increased utility costs to address cleaner energy technologies, increased costs related to severe weather events, and emissions reductions associated with operations, business travel or products. These yet-to-be defined costs and changes to operations could have a financial impact on our business.
Business collaboration solutions are complex, and design defects, errors, failures or “bugs” may be difficult to detect and correct.
Business collaboration solutions are complex, integrating hardware, software and many elements of a customers’customer’s existing network and communications infrastructure. Despite pre-shipment testing conducted prior to the release of products to the market and quality assurance programs, hardware may malfunction and software may contain “bugs” that are difficult to detect and fix. Any such issues could interfere with the expected operation of a solution, which might negatively impact customer satisfaction, reduce sales opportunities or affect gross margins.
Depending upon the size and scope of any such issue, remediation may have a material impact on our business. Our inability to cure an application or product defect, should one occur, could result in the failure of an application or product line, the temporary or permanent withdrawal from an application, product or market, damage to our reputation, inventory costs, an increase in warranty claims, lawsuits by customers or customers’ or channel partners’ end users, or application or product reengineering expenses. Our insurance may not cover or may be insufficient to cover claims that are successfully asserted against us.
Integral aspects of our operations may be subject to climate change risks.
We recognize that climate change is an issue of global concern. In addition, a number of climate change regulations and initiatives are either in force or pending at the state, regional, Federal and international levels that focus on reducing greenhouse gas emissions. Integral aspects of our operations that may be subject to climate change risks include, but are not limited to, the following: increased regulations that have either been promulgated or may be promulgated in the future in jurisdictions in which we operate; the procurement and transport of raw materials and components used by our manufacturers and the use of those raw materials and components in the manufacturing process; manufacturing emissions; packaging and transport of finished goods; emissions and waste generated by our business operations; emissions associated with business travel (air, vehicular, fleet services); and emissions associated with business activities and emissions generated by our products. We continue to monitor those risks and will develop policies and processes designed to mitigate those risks where possible. We cannot assure you that our efforts to mitigate climate change risks will be successful or that risks associated with climate change will not have a negative impact on our business, results of operations or financial condition.
Pension and postretirement healthcare and life insurance liabilities could impair our liquidity or financial condition.
We sponsor non-contributory defined benefit pension plans covering a portion of our U.S. employees and retirees, and postretirement benefit plans for U.S. retirees that include healthcare benefits and life insurance coverage. We froze benefit accruals and additional participation in our plans for our U.S. management employees effective December 31, 2003. Certain of our non-U.S. operations also have various retirement benefit programs covering substantially all of their employees. Some of these programs are considered to be defined benefit pension plans for accounting purposes. If one or more of our U.S. pension plans were to be terminated without being fully funded on a termination basis, the Pension Benefit Guaranty Corporation, or PBGC, could obtain a lien on our assets for the amount of our liability, which would result in an event of default under each of our credit facilities. As a result, any such liens would have a material adverse effect on the Company, including our liquidity and financing arrangements. The measurement of our obligations, costs and liabilities associated with benefits pursuant to our pension and postretirement benefit plans requires that we estimate the present value of projected future payments to all participants, including assumptions related to discount rates, investment returns on designated plan assets, health care cost trends, and demographic experience. If future economic or demographic trends and results are different from our assumptions, then our obligations could be higher than we currently estimate. If our cash flows and capital resources are insufficient to meet required minimal funding of our U.S. defined benefit plans or to fund our other pension or postretirement healthcare and life insurance obligations, or if we are required or elect to fund any material portion of the liabilitythese obligations now or in the future, we could be forced to reduce or delay investments and capital expenditures, seek additional capital, or restructure or refinance our indebtedness. In addition, if our operating results and available cash are insufficient to meet our pension or postretirement healthcare and life insurance obligations, we could face
substantial liquidity problems and may be required to dispose of material assets or operations in order to meet our pension or postretirement healthcare and life insurance obligations. We may not be able to consummate those dispositions or to obtain any proceeds on terms acceptable to us or at all, and any such proceeds may not be adequate to meet any pension or postretirement healthcare and life insurancesuch obligations then due. In addition, our U.S. defined benefit pension plans are subject to the provisions of the Employee Retirement Income Security Act of 1974, as amended, or ERISA. ERISA, along with certain provisions of the Internal Revenue Code of 1986, or the Code, requires minimum funding contributions and theThe PBGC has the authority under certain circumstances to petition a court to terminate an underfunded pension plan. One of those circumstances isplan upon the occurrence of an event with respect to which the PBGC determines that the possible long-term loss of the PBGC with respect to the plan may reasonably be expected to increase unreasonably if the plan is not terminated. If our U.S. defined benefit pension plans were to be terminated, we would incur a liability to the plans or the PBGC equal to the amount by which the liabilities of the plans, calculated on a termination basis, exceed the assets of the plans, which amount would likely exceed the amount that we have estimated to be the underfunded amount as of March 31, 2011.September 30, 2012.
Please seeSee Note 15, “Commitments and Contingencies,” to our unaudited Consolidated Financial Statements for the six months ended March 31, 2013 and Note 13, “Benefit Obligations,” to our unaudited consolidated financial statementsaudited Consolidated Financial Statements for the periodyear ended March 31, 2011September 30, 2012 for further details on our pension and postretirement benefit plans, including funding status.
We may incur liabilities as a result of our obligation to indemnify, and to share certain liabilities with, Lucent Technologies Inc., or Lucent, in connection with Avaya Inc.’sour spin-off from Lucent in September 2000.
Pursuant to the Contribution and Distribution Agreement between Avaya Inc. and Lucent, a predecessor to Alcatel-Lucent, Lucent contributed to Avaya Inc. substantially all of the assets, liabilities and operations associated with its enterprise networking businesses and distributed all of the outstanding shares of Avaya Inc.’s common stock to its stockholders. The Contribution and Distribution Agreement, among other things, provides that, in general, Avaya Inc. will indemnify Lucent for all liabilities including certain pre-distribution tax
obligations of Lucent relating to our businesses and all contingent liabilities accruing pre-distribution primarily relating to Avaya Inc.’s businesses or otherwise assigned to Avaya Inc. In addition, the Contribution and Distribution Agreement provides that certain contingent liabilities not directly identifiable with one of the parties accruing pre-distribution will be shared in the proportion of 90% by Lucent and 10% by Avaya Inc. The Contribution and Distribution Agreement also provides that contingent liabilities accruing pre-distribution in excess of $50 million that are primarily related to Lucent’s businesses shall be borne 90% by Lucent and 10% by Avaya Inc. and contingent liabilities accruing pre-distribution in excess of $50 million that are primarily related to Avaya Inc.’s businesses shall be borne equally by the parties. Please seeSee Note 19, “Commitments and Contingencies,” to our unaudited consolidated financial statementsaudited Consolidated Financial Statements for the periodfiscal year ended September 30, 2012 and Note 15, “Commitments and Contingencies,” to our unaudited Consolidated Financial Statements for the six months ended March 31, 20112013 for a description of certain matters involving Lucent for which Avaya Inc. has assumed responsibility under the Contribution and Distribution Agreement. We cannot assure you that Lucent will not submit a claim for indemnification or cost sharing to us in connection with any future matter. In addition, our ability to assess the impact of matters for which Avaya Inc. may have to indemnify or share the cost with Lucent is made more difficult by the fact that we do not control the defense of these matters.
In addition, in connection with the distribution, weAvaya Inc. and Lucent entered into a Tax Sharing Agreement that governs the parties’ respective rights, responsibilities and obligations after the distribution with respect to taxes for the periods ending on or before the distribution. Generally, pre-distribution taxes that are clearly attributable to the business of one party will be borne solely by that party, and other pre-distribution taxes will be shared by the parties based on a formula set forth in the Tax Sharing Agreement. In addition,Costs borne by Avaya under the Tax Sharing Agreement addresses the allocationcould have an adverse impact on our business, results of liability for taxes that are incurred as a result of restructuring activities undertaken to implement the distribution. If the distribution fails to qualify as a tax-free distribution under Section 355 of the Code because of an acquisition of Avaya Inc.’s stockoperations or assets, or some other actions of Avaya Inc., then Avaya Inc. will be solely liable for any resulting corporate taxes.
Risks Related to Our Debt
Our degree of leverage could adversely affect our ability to raise additional capital to fund our operations, limit our ability to react to changes in the economy or our industry, expose us to interest rate risk to the extent of our variable rate debt and prevent us from meeting obligations on our indebtedness.
A summary of the materialThe significant terms of our financing agreements can be found in Note 9, “Financing Arrangements,” and Note 22, “Subsequent Events,” in each case to the audited Consolidated Financial Statements for the fiscal year ended September 30, 2012 and Note 7, “Financing Arrangements,” to the unaudited consolidated financial statements as ofConsolidated Financial Statements for the six months ended March 31, 2011.2013. As of March 31, 2011,2013, our total indebtedness was $6,176$6,103 million (excluding capital lease obligations).
The Avaya Inc. senior secured multi-currency asset-based revolving credit facility allows for senior secured borrowings of up to $335 million and the right to request up to $100 million of additional commitments. As of March 31, 2013, there were no borrowings and $76 million of undrawn letters of credit outstanding under this facility. In addition, the senior secured multi-currency revolver available under the Avaya Inc. senior secured credit facility allows for senior secured borrowings of up to $200 million, and as of March 31, 2013, there were no borrowings under the senior secured multi-currency revolver. Our degree of leverage could have important consequences, including:
making it more difficult for us to make payments on our indebtedness;
increasing our vulnerability to general economic and industry conditions;
requiring a substantial portion of cash flow from operations to be dedicated to the payment of principal and interest on our indebtedness, thereby reducing our ability to use our cash flow to fund our operations, capital expenditures and future business opportunities;
exposing us to the risk of increased interest rates as borrowings under the senior secured multi-currency asset-based revolving credit facility and the senior secured credit facility are at variable rates of interest;
limiting our ability to make strategic acquisitions;
limiting our ability to obtain additional financing for working capital, capital expenditures, debt service requirements, acquisitions and general corporate or other purposes; and
limiting our ability to adjust to changing market conditions and placing us at a competitive disadvantage compared to our competitors who are less highly leveraged.
Our debt agreements contain restrictions that limit in certain respects our flexibility in operating our business.
Avaya Inc.’s credit facilities, the indenture governing its senior unsecured cash-pay notes (the “cash pay notes”) and its senior unsecured payment-in-kind, or PIK, toggle notes (the “PIK toggle notes,” and together with the cash pay notes, the “senior unsecured notes”), each due November 1, 2015, the indentures governing its senior secured notes due April 1, 2019 (the “2019 senior secured notes”) and the indenture governing its 7.00% senior secured notes due 2021 (the “2021 senior secured notes” and, together with the 2019 senior secured notes, the “senior secured notes,” and together with the senior unsecured notes, the “notes”) contain various covenants that limit our ability to engage in specific types of transactions. These covenants limit ourAvaya Inc.’s and ourits restricted subsidiaries’ ability to:
incur or guarantee additional debt and issue or sell certain preferred stock;
pay dividends on, redeem or repurchase our capital stock;
make certain acquisitions or investments;
incur or assume certain liens;
enter into transactions with affiliates; and
sell assets to, or merge or consolidate with, another company.
A breach of any of these covenants could result in a default under one or both of ourthe credit facilities and/or the indentures governing the notes. In the event of any default under either of the credit facilities, the applicable lenders could elect to terminate borrowing commitments and declare all borrowings and loans outstanding, together with accrued and unpaid interest and any fees and other obligations, to be due and payable, which would be an event of default under the indentures governing the notes.
If we were unable to repay or otherwise refinance these borrowings and loans when due, the applicable secured lenders could proceed against the collateral granted to them to secure that indebtedness, which could force us into bankruptcy or liquidation. In the event our lenders accelerate the repayment of our borrowings, we and our subsidiaries may not have sufficient assets to repay that indebtedness.
We may not be able to generate sufficient cash to service all of our indebtedness and our other ongoing liquidity needs, and we may be forced to take other actions to satisfy our obligations under our indebtedness, which may not be successful.
Our ability to make scheduled payments on or to refinance our debt obligations and to fund our planned capital expenditures, acquisitions and other ongoing liquidity needs depends on our financial condition and operating performance, which is subject to prevailing economic and competitive conditions and to certain financial, business and other factors beyond our control. There can be no assurance that we will maintain a level of cash flow from operating activities or that future borrowings will be available to us under either of our credit facilities or otherwise in an amount sufficient to permit us to pay the principal, premium, if any, and interest on our indebtedness. If our cash flow and capital resources are insufficient to fund our debt service obligations, we may be forced to reduce or delay investments and capital expenditures, or to seek additional capital or restructure or refinance our indebtedness. These alternative measures may not be successful and may not permit us to meet our scheduled debt service obligations. In the absence of such operating results and resources, we could face substantial liquidity problems and might be required to dispose of material assets or operations to meet our debt service and other obligations. Our credit facilities and the indentures governing the notes restrict ourthe ability of Avaya Inc. and its restricted subsidiaries to dispose of assets and use the proceeds from the disposition.
Accordingly, we may not be able to consummate those dispositions or to obtain any proceeds on terms acceptable to us or at all, and any such proceeds may not be adequate to meet any debt service obligations then due.
Despite our level of indebtedness, we and our subsidiaries may be able to incur additional indebtedness, whichindebtedness. This could further exacerbate the risks associated with our degree of leverage.
We and our subsidiaries may be able to incur additional indebtedness in the future. Although the credit facilities and the indentures governing the notes contain restrictions on the incurrence of additional indebtedness, these restrictions are subject to a number of significant qualifications and exceptions, and any indebtedness incurred in compliance with these restrictions could be substantial. To the extent new debt is added to our and our subsidiaries’ currently anticipated debt levels, the related risks that we and our subsidiaries face could intensify.
A ratings downgrade of Avaya Inc. or other negative action by a ratings organization could adversely affect the trading price of the shares of our common stock.
Credit rating agencies continually revise their ratings for companies they follow. The condition of the financial and credit markets and prevailing interest rates have fluctuated in the past and are likely to fluctuate in the future. In addition, developments in our business and operations could lead to a ratings downgrade for Avaya Inc. Any such fluctuation in the rating of Avaya Inc. may impact Avaya Inc.’s ability to access debt markets in the future or increase its cost of future debt which could have a material adverse effect on the operations and financial condition of Avaya Inc., which in return may adversely affect the trading price of shares of our common stock.
Risks Related to this Offering and Ownership of Our Common Stock
An active trading market for our common stock may not develop.
Prior to this offering, there has been no public market for our common stock. Although we have applied to list our common stock has been approved for listing on the ,New York Stock Exchange, an active trading market for our shares may never develop or be sustained following this offering. If the market does not develop or is not sustained, it may be difficult for you to sell your shares of common stock at a price that is attractive to you or at all. In addition, an inactive market may impair our ability to raise capital by selling shares and may impair our ability to acquire other companies by using our shares as consideration, which, in turn, could materially adversely affect our business.
The price of our common stock may be volatile and fluctuate substantially, which could result in substantial losses for investors purchasing shares in this offering.
The initial public offering price for the shares of our common stock sold in this offering will be determined by negotiation between the representatives of the underwriters and us. This price may not reflect the market price of our common stock following this offering. In addition, the market price of our common stock is likely to be highly volatile and may fluctuate substantially due to the following factors (in addition to the other risk factors described in this section):
actual or anticipated fluctuations in our results of operations;
variance in our financial performance from the expectations of equity research analysts;
conditions and trends in the markets we serve;
announcements of significant new services or products by us or our competitors;
additions or changes to key personnel;
changes in market valuation or earnings of our competitors;
the trading volume of our common stock;
future sale of our equity securities;
changes in the estimation of the future size and growth rate of our markets;
legislation or regulatory policies, practices or actions; and
general economic conditions.
In addition, the stock markets in general have experienced extreme price and volume fluctuations that have often been unrelated or disproportionate to the operating performance of the particular companies affected. These broad market and industry factors may materially harm the market price of our common stock irrespective of our operating performance. As a result of these factors, you might be unable to resell your shares at or above the initial public offering price after this offering.
The Sponsors will have the ability to control the outcome of matters submitted for stockholder approval and may have interests that differ from those of our other stockholders.
After the completion of this offering, the Sponsors will own approximately % of our common stock, or % on a fully diluted basis. The Sponsors have significant influence over corporate transactions. So long as investment funds associated with or designated by the Sponsors continue to own a significant amount of the outstanding shares of our common stock, even if such amount is less than 50%, the Sponsors will continue to be able to strongly influence or effectively control our decisions, regardless of whether or not other stockholders believe that the transaction is in their own best interests. Such concentration of voting power could also have the effect of delaying, deterring or preventing a change of control or other business combination that might otherwise be beneficial to our stockholders.
In addition, the Sponsors and their affiliates are in the business of making investments in companies and may, from time to time in the future, acquire interests in businesses that directly or indirectly compete with certain portions of our business. To the extent the Sponsors invest in such other businesses, the Sponsors may have differing interests than our other stockholders. The Sponsors may also pursue acquisition opportunities that may be complementary to our business and, as a result, those acquisition opportunities may not be available to us. Also, as of March 31, 2011, the Sponsors hold approximately $198 million of Avaya Inc.’s senior secured term B-1 loans, approximately $124 million of Avaya Inc.’s senior secured term B-3 loans and 77,728.25 shares of our Series A Preferred Stock, although we intend to redeem all of the outstanding Series A Preferred Stock with the proceeds of this offering. As a result, their continued interests as creditors may conflict with the interests of our common stock holders.
We are a “controlled company” within the meaning of the rules of the New York Stock Exchange and, as a result, will qualify for, and intend to rely on, exemptions from certain corporate governance requirements.
After completion of this offering, the Sponsors will continue to control a majority of the voting power of our outstanding common stock. As a result, we are a “controlled company” within the meaning of the corporate governance rules of the .New York Stock Exchange. Under these rules, a company of which more than 50% of the voting power is held by an individual, group or another company is a “controlled company” and may elect not to comply with certain corporate governance requirements, including:
the requirement that a majority of the board of directors consist of independent directors;
the requirement that we have a nominating/corporate governance committee that is composed entirely of independent directors;
the requirement that we have a compensation committee that is composed entirely of independent directors; and
the requirement for an annual performance evaluation of the nominating/corporate governance and compensation committees.
Following this offering, we intend to utilize some or all of those exemptions. As a result, we willmay not have a majority of independent directors, our nominating and corporate governance committee and compensation committee willmay not consist entirely of independent directors and, while we may choose to do so, such committees will not be required to conduct annual performance evaluations.
Accordingly, you will not be similarly situated to stockholders of companies that are subject to all of the corporate governance requirements of the .New York Stock Exchange.
New investors in our common stock will experience immediate and substantial book value dilution after this offering.
The initial public offering price of our common stock will be substantially higher than the pro forma net tangible book value, or deficit, per share of the outstanding shares immediately after the offering. Based on an assumed initial public offering price of $ per share, the midpoint of the price range set forth on the cover of this prospectus, and our net tangible book value as of ,as-adjusted deficit at September 30, 2012, if you purchase our shares in this offering, you will suffer immediate dilution in net tangible book value per share of approximately $ per share. See “Dilution” included elsewhere in this prospectus.
Upon expiration of lock-up arrangements between the underwriters and our officers, directors and certain holders of our common stock, a substantial number of shares of our common stock could be sold into the public market shortly after this offering, which could depress our stock price.
Our officers, directors and certain holders of our common stock, options and warrants, holding substantially all of our outstanding shares of common stock prior to completion of this offering, have entered into lock-up agreements with our underwriters which prohibit, subject to certain limited exceptions, the disposal or pledge of, or the hedging against, any of their common stock or securities convertible into or exchangeable for shares of common stock for a period through the date 180 days after the date of this prospectus, subject to extension in certain circumstances. Our management stockholders’ agreement also restricts the parties thereto from transferring their shares of common stock or any securities convertible into or exchangeable or exercisable for shares of common stock (other than shares acquired in the public market subsequent to this offering and other than certain transfers to their affiliates) until 180 days after the effective date of the registration statement. The market price of our common stock could decline as a result of sales by our existing stockholders in the market after this offering and after the expiration of these lock-up periods, or the perception that these sales could occur. If a trading market develops for our common stock, and after these lock-up periods expire, many of our stockholders will have an opportunity to sell their stock for the first time. These factors could also make it difficult for us to raise additional capital by selling stock. Please see the section titled “Shares Eligible for Future
Sale” for additional information regarding these factors. In addition, in the future, we may issue securities to raise additional capital or to acquire interests in other companies or technologies. As a result, your interest in our company may be further diluted and the market price of our common stock could decline.
We are a holding company and rely on dividends, distributions and other payments, advances and transfers of funds from our subsidiaries to meet our obligations.
We have no direct operations and derive all of our cash flow from our subsidiaries. Because we conduct our operations through our subsidiaries, we depend on those entities for dividends and other payments or distributions to meet our obligations. The deterioration of the earnings from, or other available assets of, our subsidiaries for any reason could limit or impair their ability to pay dividends or other distributions to us.
We currently do not intend to pay dividends on our common stock and, consequently, your only opportunity to achieve a return on your investment is if the price of our common stock appreciates.
Following the completion of this offering, we do not anticipate that we will pay any cash dividends on shares of our common stock for the foreseeable future. Any determination to pay dividends in the future will be at the discretion of our board of directors and will depend on results of operations, financial condition, contractual restrictions, restrictions imposed by applicable law and other factors our board of directors deems relevant. Accordingly, if you purchase shares in this offering, realization of a gain on your investment will depend on the appreciation of the price of our common stock, which may never occur. Investors seeking cash dividends in the foreseeable future should not purchase our common stock. Please see the section titled “Dividend Policy” for additional information.
Anti-takeover provisions in our certificate of incorporation and bylaws could prevent or delay a change in control of our company.
Upon completion of this offering, ourOur certificate of incorporation and our bylaws will contain certain provisions that may discourage, delay or prevent a change in our management or control over us that stockholders may consider favorable. favorable, including the following, some of which may only become effective when the Sponsors collectively beneficially own less than 40% of our outstanding shares of common stock:
the division of our board of directors into three classes and the election of each class for three-year terms;
the sole ability of the board of directors to fill a vacancy created by the expansion of the board of directors;
advance notice requirements for stockholder proposals and director nominations;
limitations on the ability of stockholders to call special meetings and to take action by written consent;
the approval of holders of at least two-thirds of the shares entitled to vote generally on the making, alteration, amendment or repeal of our certificate of incorporation or bylaws, will be required to adopt, amend or repeal our bylaws, or amend or repeal certain provisions of our certificate of incorporation;
the required approval of holders of at least two-thirds of the shares entitled to vote at an election of the directors to remove directors and, following the classification of the board of directors, removal only for cause; and
the ability of our board of directors to designate the terms of and issue new series of preferred stock, without stockholder approval, which could be used to institute a rights plan, or a poison pill, that would work to dilute the stock ownership or a potential hostile acquirer, likely preventing acquisitions that have not been approved by our board of directors.
The existence of suchthe foregoing provisions and other anti-takeover measures could limit the price that investors might be willing to pay in the future for shares of our common stock. They could also deter potential acquirers of our company, thereby reducing the likelihood that you could receive a premium for your common stock in any suchan acquisition. For more information, please see the section titled “Description of Capital Stock.”
If securities or industry analysts do not publish research or reports or publish unfavorable research or reports about our business, our stock price and trading volume could decline.
The trading market for our common stock will depend in part on the research and reports that securities or industry analysts publish about us, our business, our market or our competitors. We may not obtain research coverage by securities and industry analysts. If no securities or industry analysts commence coverage of our company, the trading price for our stock could be negatively impacted. In the event we obtain securities or industry analyst coverage, if one or more of the analysts who covers us publishes unfavorable research or reports or downgrades our stock, our stock price would likely decline. If one or more of these analysts ceases to cover us or fails to regularly publish reports on us, interest in our stock could decrease, which could cause our stock price or trading volume to decline.
SPECIAL NOTE REGARDING FORWARD-LOOKING STATEMENTS
This prospectus contains “forward-looking statements.” In some cases, these statements may be identified by the use of forward-looking terminology such as “anticipate,” “believe,” “continue,” “could,” “estimate,” “expect,” “intend,” “may,” “might,” “our vision,” “plan,” “potential,” “predict,” “should,” “will” or “would” or other similar words. These statements discuss future expectations, contain projections of results of operations or of financial condition, or state trends and known uncertainties or other forward-looking information. You are cautioned that forward-looking statements are inherently uncertain. Each forward-looking statement contained in this prospectus is subject to risks and uncertainties that could cause actual results to differ materially from those expressed or implied by such statement. We refer you to the section entitled “Risk Factors” in this prospectus for identification of important factors with respect to these risks and uncertainties. We caution readers not to place considerable reliance on such statements. Our business is subject to substantial risks and uncertainties, including those identified in this prospectus. The information contained in this prospectus is provided by us as of the date of this prospectus, and we do not undertake any obligation to update any forward-looking statements contained in this document as a result of new information, future events or otherwise. Forward-looking statements include, without limitation, statements regarding:
our expectations regarding our revenue, cost of revenue, selling, general and administrative expenses, research and development expenses, amortization of intangible assets and interest expense;
our expectations regarding the demand for our next-generation business collaboration solutions and the market trends contributing to such demand;
our strategy for worldwide growth, including our ability to develop and sell advancedbusiness collaboration and communications products and services, including unified communications, data networking solutions and contact center solutions;
the strength of our current intellectual property portfolio and our intention to obtain patents and other intellectual property rights used in connection with our business;
our anticipated competition as the business collaboration market evolves;
the product sales to be generated by our backlog;
our future cash requirements, including our primary cash requirements for the period April 1, 20112013 through September 30, 2011;2013;
our intention to use the net proceeds of the initial public offering to repay certain of our existing indebtedness and to redeem our Series A Preferred Stock;
our future sources of liquidity, including any future refinancing of our existing debt or issuance of additional securities;
the uncertainties regarding our liquidity, including our ability to generate revenue, reduce costs, make future acquisitions and defend against litigation;
the impact of new accounting pronouncements; and
our expectations regarding the impact of legal proceedings, including antitrust, intellectual property or employment litigation.
Many factors could cause our actual results, performance or achievements to differ materially from any future results, performance or achievements expressed or implied by these forward-looking statements. Some of the key factors that could cause actual results to differ from our expectations include:
the ability of our abilitysolutions to developkeep pace with rapidly changing technology and sell advanced communications products and services, including unified communications, data networking solutions and contact center solutions;
our reliance on our indirect sales channel;
economic conditions and the willingness of enterprises to make capital investments;
the market for our products and services, including unified communications solutions;evolving industry standards;
our ability to remain competitive in the markets we serve;
the market for our business collaboration and communications solutions;
economic conditions and the willingness of enterprises to make capital investments;
our reliance on our indirect sales channel;
our ability to protect our intellectual property and avoid claims of infringement;
our ability to retain and attract key employees;
our degreereliance on third-party manufacturers and component suppliers, as well as warehousing and distribution logistics providers;
risks relating to the transaction of leverage and its effect on our ability to raise additional capital and to react to changesbusiness internationally, including fluctuations in the economy or our industry;foreign currency exchange rates;
our ability to manage our supply chain and logistics functions;integrate acquired businesses;
liquidity and our access to capital markets;
the ability to protect ouran adverse result in any significant litigation, including antitrust, intellectual property and avoid claims of infringement;or employment litigation;
our ability to maintain adequate security over our information systems;
environmental, health and safety laws, regulations, costs and other liabilities;
climate change risks;
an adverse result in any significant litigation, including antitrust, intellectual property or employment litigation;
risks relating to the transactioncomplexity of business internationally; andcollaboration solutions, which may make it difficult for us to detect errors, failures or “bugs”;
pension and post-retirement healthcare and life insurance liabilities.liabilities;
our degree of leverage and its effect on our ability to raise additional capital and to react to changes in the economy or our industry; and
liquidity and our access to capital markets.
We estimate that the net proceeds of the sale of the common stock that we are offering will be approximately $ million after deducting estimated underwriting discounts and commissions and estimated offering expenses payable by us. This assumes an initial public offering price of $ per share, which is the midpoint of the range listed on the cover page of this prospectus.
We currently expect to use the net proceeds to us from this offering for the following purposes and in the following amounts:
approximately $ million will be used to repay a portion of our long-term indebtedness;
approximately $ million will be used to redeem all of our outstanding Series A Preferred Stock.Stock of which $ million and $ million will be used to redeem the Series A Preferred Stock held by Silver Lake and TPG, respectively. See “Certain Relationships and Related Party Transactions.” For more information on our Series A Preferred Stock, including the terms of redemption, see “Description of Capital Stock—Preferred Stock—Series A Preferred Stock”; and
approximately $ million will be used to pay certain amounts in connection with the termination of our management services agreement with affiliates of our Sponsors as described under “Certain Relationships and Related Party Transactions”, of which $ million and $ million will be paid to Silver Lake and TPG, respectively, pursuant to its terms.the terms of the agreement.
While we currently anticipate that we will use the net proceeds of this offering as described above, we may reallocate the net proceeds from time to time depending upon market and other conditions in effect at the time. To the extent the net proceeds of this offering are greater or less than the estimated amount, because either the offering does not price at the midpoint of the estimated price range or the size of the offering changes, the difference will increase or decrease the amount of net proceeds available for the purposes set forth above. Pending their application, we intend to invest the net proceeds in short-term, interest-bearing, investment-grade securities.
Our payment of dividends on our common stock in the future will be determined by our board of directors in its sole discretion and will depend on business conditions, our financial condition, earnings, liquidity and capital requirements, the covenants in agreements governing our indebtedness and other factors. We have no current plans to pay dividends on our common stock.
As disclosed above under “Use of Proceeds,” we intend to use a portion of the net proceeds from this offering to redeem all of our outstanding Series A Preferred Stock. TheSubject to the rights of holders of our Series B Convertible Preferred Stock as described below, the certificate of designations for the Series A Preferred Stock grants holders of our Series A Preferred Stock the right to receive, as, when and if declared by our board of directors and in preference to the holders of any and all other series or classes of capital stock, payable either in cash or, at our option, by issuance of additional shares of Series A Preferred Stock, cumulative annual dividends at a rate of 5% per annum on $1,000 per share (which value is to be proportionately adjusted to reflect any stock dividend, stock split, combination of shares, reclassification, reorganization, recapitalization or other similar event affecting the Series A Preferred Stock), compounded quarterly from and after the date of issuance of such shares of Series A Preferred Stock. As of March 31, 2013, the carrying value of our Series A Preferred Stock was $147 million which includes $22 million of accumulated and unpaid dividends as well as $57 million of discount accretion. The $57 million of discount accretion was recorded to the carrying amount of the Series A Preferred Stock at the date of issuance so that the carrying amount was equal to the redemption amount at that date of $125 million.
The certificate of designations for the Series B Convertible Preferred Stock grants holders of our Series B Convertible Preferred Stock the right to receive, as, when and if declared by our board of directors and in preference to the holders of any and all other series or classes of capital stock, payable either in cash or, at our option, by issuance of additional shares of Series B Convertible Preferred Stock, cumulative annual dividends at a rate of 8% per annum on $4,000 per share (which value is to be proportionately adjusted to reflect any stock dividend, stock split, combination of shares, reclassification, reorganization, recapitalization or other similar event affecting the Series B Convertible Preferred Stock), compounded annually from and after the date of issuance of such shares of Series B Convertible Preferred Stock. Additionally, holders of Series B Convertible Preferred Stock participate in any dividends payable on shares of the Company’s common stock on an as converted basis. As of March 31, 2013, the carrying value of our Series B Convertible Preferred Stock was $245 million which includes $13 million of accumulated and unpaid dividends, $36 million of accretion to the redemption price, as well as $33 million of discount accretion at the date of issuance.
So long as any share of our Series A Preferred Stock remainsand Series B Convertible Preferred Stock remain outstanding, no dividend or distribution may be declared or paid on our common stock unless all accrued and unpaid dividends have been paid on our Series A Preferred Stock and Series B Convertible Preferred Stock and dividends paid on our common stock may not be paid at a rate greater than the rate paid on Series A Preferred Stock. As of March 31, 2011, there were accrued unpaid dividends totaling $8 million on ourStock or Series AB Convertible Preferred Stock in addition to its redemption value of $125 million. Stock.
In addition, because Avaya Holdings Corp. is a holding company, its ability to pay cash dividends on its common stock may be limited by restrictions on its ability to obtain sufficient funds through dividends from subsidiaries, including restrictions under the terms of the agreements governing Avaya Inc.’s indebtedness. Refer to the section of this prospectus entitled “Description of Certain Outstanding Indebtedness” for a more detailed discussion of the agreements governing our indebtedness and the section of this prospectus entitled “Description of Capital Stock” for a more detailed description of the terms of our Series A Preferred Stock and our Series B Convertible Preferred Stock.
The following table sets forth our capitalization as of March 31, 2011:2013:
on an actual basis; and
on a pro forma basis after giving effect to (i) the sale by us of shares of common stock at an assumed initial public offering price of $ per share and after deducting estimated underwriting discounts and commissions and estimated offering expenses payable by us and (ii) the application of such net proceeds as described under “Use of Proceeds.” For purpose of this table, the assumed initial public offering price is $ per share, which is the midpoint of the range listed on the cover page of this prospectus.
You should read the following table in conjunction with our consolidated financial statementsConsolidated Financial Statements and related notes, “Selected Historical Consolidated Financial Data” and “Management’s Discussion and Analysis of Financial Condition and Results of Operations,” all included elsewhere in this prospectus.
| As of March 31, 2011 | As of March 31, 2013 | |||||||||||||
| Actual | Pro Forma(1) | Actual | Pro Forma(1) | |||||||||||
| (in millions, except share amounts) | (in millions, except share amounts) | |||||||||||||
Cash and cash equivalents | $ | 468 | $ | 303 | ||||||||||
|
| |||||||||||||
Debt:(2) | ||||||||||||||
Senior secured term B-1 loans | $ | 1,457 | ||||||||||||
Senior secured term B-3 loans | 2,176 | $ | 2,139 | |||||||||||
Senior secured notes | 1,009 | |||||||||||||
Senior unsecured cash-pay notes | 700 | |||||||||||||
Senior unsecured PIK toggle notes | 834 | |||||||||||||
Senior secured term B-4 loans | 1 | |||||||||||||
Senior secured term B-5 loans | 1,148 | |||||||||||||
7% senior secured notes | 1,009 | |||||||||||||
9% senior secured notes | 290 | |||||||||||||
10.50% senior secured notes | 1,384 | |||||||||||||
9.75% senior unsecured cash-pay notes due 2015 | 58 | |||||||||||||
10.125%/10.875% senior unsecured PIK toggle notes due 2015 | 92 | |||||||||||||
Unaccreted discount | (18 | ) | ||||||||||||
|
| |||||||||||||
Total debt | 6,176 | 6,103 | ||||||||||||
|
| |||||||||||||
Preferred stock, par value $.001 per share; authorized 250,000 shares, Series A, 125,000 and nil shares outstanding on an actual and pro forma basis, respectively | 133 | |||||||||||||
Preferred stock, par value $.001 per share; authorized 250,000 shares | ||||||||||||||
Series B, 48,921 and 48,921 shares issued and outstanding on an actual and pro forma basis, respectively(3) | 245 | |||||||||||||
Series A, 125,000 and nil shares issued and outstanding on an actual and pro forma basis, respectively | 147 | |||||||||||||
Deficiency: | ||||||||||||||
Common stock, par value $.001 per share; authorized 750 million shares, outstanding 487,389,017 and shares on an actual and pro forma basis, respectively | — | |||||||||||||
Common stock, par value $.001 per share; authorized 750 million shares, outstanding 488,662,389 and shares on an actual and pro forma basis, respectively | — | |||||||||||||
Additional paid-in capital | 2,569 | 2,510 | ||||||||||||
Accumulated deficit | (3,640 | ) | (4,514 | ) | ||||||||||
Accumulated other comprehensive loss | (1,065 | ) | (1,129 | ) | ||||||||||
|
| |||||||||||||
Total deficiency | (2,136 | ) | (3,133 | ) | ||||||||||
|
| |||||||||||||
Total capitalization | $ | 4,173 | $ | 3,362 | ||||||||||
|
| |||||||||||||
| (1) | Assumes the net proceeds from this offering, together with cash on hand, are used on the closing date to redeem all outstanding shares of our Series A Preferred Stock for |
| issuance of $57 million; to repay $ million of long-term indebtedness; and to make a payment to affiliates of our Sponsors in connection with the termination of the management services agreement as described under “Certain Relationships and Related Party Transactions” and to pay certain fees and expenses relating to this offering. The pro forma amounts do not give effect to any accounting charges that may be recorded as a result of such payment. A $1.00 increase (decrease) in the assumed initial public offering price of $ per share, the mid-point of the estimated price range set forth on the cover page of this prospectus and the application of the net proceeds therefrom, would (i) increase (decrease) the net proceeds to us by $ million, assuming the number of shares offered by us, as set forth on the cover page of this prospectus, |
remains the same and after deducting underwriting discounts and commissions and estimated offering expenses payable by us, and (ii) would increase (decrease) our total long-term debt reduction by $ million and decrease (increase) our stockholders’ deficiency by $ million. |
| (2) | For additional information regarding our outstanding indebtedness, please refer to “Management’s Discussion and Analysis of Financial Condition and Results of Operations—Liquidity and Capital Resources—Financing Activities,” “Description of Certain Outstanding Indebtedness” and Note |
| (3) | Includes accumulated and unpaid dividends of $13 million, $36 million of accretion to the redemption price, as well as the discount accretion recorded at the date of issuance of $33 million. Please refer to Note 15, “Capital Stock,” to our audited Consolidated Financial Statements included elsewhere in this prospectus. |
If you invest in shares of our common stock in this offering, your interest will be diluted to the extent of the difference between the public offering price per share of our common stock and the as-adjusted net tangible book value, or deficit, per share of our common stock after this offering. The deficit is calculated as the liabilities in excess of our net tangible book value. The deficit per share is determined by dividing the numerator of total liabilities plus the book value of our Series A Preferred Stock less total tangible assets (total assets less intangible assets) by the denominator of the number of outstanding shares of common stock. Our deficit value at March 31, 20112013 was $8,583$8,606 million or $17.61 per share of common stock.
Our as-adjusted deficit at March 31, 2011,2013, after giving effect to the sale by us of shares of common stock at an assumed initial public offering price of $ per share, which is the midpoint of the range listed on the cover of this prospectus, and after deducting estimated underwriting discounts and commissions and estimated offering expenses payable by us, would have been approximately $ million, or $ per share. This represents an immediate increase in as-adjusted deficit of $ per share to existing stockholders and an immediate dilution of $ per share to new investors, or approximately % of the assumed initial public offering price of $ per share. The following table illustrates this per share dilution:
Assumed initial public offering price per share | $ | $ | ||||||||||||||
Deficit per share as of March 31, 2011, before giving effect to this offering | $ | (8,583 | ) | |||||||||||||
Deficit per share as of March 31, 2013, before giving effect to this offering | $ | (8,606 | ) | |||||||||||||
Decrease in deficit per share attributable to investors purchasing shares in this offering | ||||||||||||||||
As adjusted deficit per share, after giving effect to this offering | ||||||||||||||||
A $1.00 increase (decrease) in the assumed initial public offering price of $ per share would decrease (increase) our as-adjusted deficit by $ million, the as-adjusted deficit per share after this offering by $ per share and the dilution in as-adjusted deficit per share to investors in this offering by $ per share, assuming that the number of shares offered by us, as set forth on the cover page of this prospectus, remains the same and after deducting the estimated underwriting discount and estimated offering expenses payable by us.
The following table summarizes, as of March 31, 2011,2013, the number of shares of common stock purchased from us since inception, the total consideration paid to us and the average price per share paid by existing shareholders and by new investors purchasing shares of common stock in this offering at an assumed initial public offering price of $ per share, before deducting underwriting discount and estimated offering expenses payable by us.
| Shares Purchased | Total Consideration | Average Price Per Share | |||||||||||||||||||||||
| Number | Percent | Amount | Percent | ||||||||||||||||||||||
Existing shareholders | $ | $ | |||||||||||||||||||||||
New investors | |||||||||||||||||||||||||
Total | |||||||||||||||||||||||||
A $1.00 increase (decrease) in the assumed initial public offering price of $ per share would increase (decrease) total consideration paid by new investors, total consideration paid by all stockholders and the average price per share paid by all stockholders by $ million, $ million and $ per share, assuming the number of shares offered by us, as set forth on the cover page of this prospectus, remains the same and before deducting underwriting discounts and commissions and estimated offering expenses payable by us.
The above discussion and table are based on 487,389,017488,662,389 shares of common stock outstanding as of March 31, 2011.2013. This excludes the following numbers of shares of our common stock issuable in connection with the exercise of warrants outstanding as of March 31, 20112013, the conversion of our Series B Convertible Preferred Stock and equity awards under our Amended and Restated 2007 Equity Incentive Plan:
100,000,000 shares of common stock issuable upon the exercise of warrants held by affiliates of our Sponsors, which warrants are subject to the lock-up agreements described under “Underwriters” and exercisable at any time prior to December 18, 2019 at an exercise price of $3.25 per share (see “Description of Capital Stock—Warrants”);
24,500,000 shares of common stock issuable upon the exercise of warrants held by affiliates of our Sponsors, which warrants are subject to the lock-up agreements described under “Underwriters” and exercisable at any time prior to May 29, 2022 at an exercise price of $4.00 per share (see “Description of Capital Stock—Warrants”);
429,761 Continuation Options that were awarded by the Company to executive officers prior to the Merger that were permitted to be rolled over into equity awards issued by us upon consummation of the Merger, each with an exercise price of $1.25 per share;
972,341 Continuation Units that were awarded shares of common stock issuable upon conversion of the Series B Convertible Preferred shares held by the Company to executive officers prioraffiliates of our Sponsors, and convertible at any time as such Series B Convertible Preferred Stock is outstanding at a conversion price equal to the Merger that were permittedlesser of (1) $4.00 per share (subject to be rolled over into equity awards issued by us upon consummationcertain anti-dilution provisions) and (2) the offering price per share in this offering, which such shares if converted are subject to the lock-up agreements described under “Underwriters” (see “Description of the Merger;Capital Stock—Preferred Stock—Series B Convertible Preferred Stock”);
44,072,95636,262,394 shares of common stock issuable upon the exercise of options with exercise prices ranging from $3.00 to $5.00 per share and a weighted average exercise price of $3.03$3.28 per share;
1,370,0001,719,808 shares of common stock issuable on the vesting and distribution of RSUs; and
4,405,2019,748,283 additional shares of common stock as of March 31, 20112013 reserved for future grants under the 2007 Plan.
This also excludes additional shares of common stock reserved for future equity incentive plans to be effective upon the completion of this offering.
To the extent the options or warrants are exercised and awards are granted under these plans, there may be further economic dilution to our stockholders.
SELECTED HISTORICAL CONSOLIDATED FINANCIAL DATA
The following table sets forth our selected historical consolidated financial data at the dates and for the periods indicated. Avaya Holdings Corp. was incorporated on June 1, 2007 by affiliates of the Sponsors. Avaya Holdings Corp., through a subsidiary holding company, entered into a Merger Agreement with Avaya Inc., or the Predecessor, pursuant to which the holding company merged with and into Avaya Inc., with Avaya Inc. continuing as the surviving entity and a wholly owned subsidiary of Avaya Holdings Corp., in a transaction that was completed on October 26, 2007. Avaya Holdings Corp. is a holding company and has no material assets or stand-alone operations other than its ownership in Avaya Inc. and its subsidiaries. The selected historical consolidated financial data set forth below are those of Avaya Holdings Corp. and its consolidated subsidiaries, or the Successor, from its inception on June 1, 2007 through March 31, 20112013 and those of its Predecessor, Avaya Inc., for all prior periods through the closing date of the Merger.
The Predecessor selected historical consolidated financial data set forth below as of and for the years ended September 30, 2006 and September 30,period October 1, 2007 through October 26, 2007 have been derived from our Predecessor’s audited consolidated financial statementsConsolidated Financial Statements and related notes which are not included in this prospectus. The PredecessorSuccessor selected historical consolidated financial data set forth below as of and for the period October 1, 2007 through October 26, 2007 hassix months ended March 31, 2012 and 2013 have been derived from our Predecessor’s audited consolidated financial statementsunaudited Consolidated Financial Statements and related notes included elsewhere in this prospectus. The Successor selected historical consolidated financial data set forth below as of and for the fiscal years ended September 30, 2008, 200930,2010, 2011, and 20102012 have been derived from our audited consolidated financial statementsConsolidated Financial Statements and related notes included elsewhere in this prospectus. The Successor selected historical consolidated financial data set forth below for the fiscal years ended September 30, 2008 and 2009 have been derived from our audited Consolidated Financial Statements and related notes, which are not included in this prospectus. The Successor selected historical consolidated financial data set forth below as of and for the period June 1, 2007 through September 30, 2007 has been derived from our unaudited consolidated financial statements,Consolidated Financial Statements, which are not included in this prospectus. The Successor had no operations prior to the Merger. The Successor selected historical consolidated financial data set forth below as of and for the six months ended March 31, 2011 and 2010 have been derived from our unaudited consolidated financial statements included elsewhere in this prospectus. Our unaudited consolidated financial statements for the six months ended March 31, 2011 and March 31, 2010 have been prepared on the same basis as the annual consolidated financial statements and, in the opinion of our management, include all adjustments, which include only normal recurring adjustments, necessary for a fair statement of this data. As part of the Merger on October 26, 2007, we entered into various financing arrangements and, as a result, had a different capital structure following the Merger. Accordingly, the results of operations for periods subsequent to the Merger will not necessarily be comparable to prior periods.
The following selected historical consolidated financial data should be read together with our consolidated financial statementsConsolidated Financial Statements and the related notes appearing elsewhere in this prospectus and the “Management’s Discussion and Analysis of Financial Condition and Results of Operations” section of this prospectus.
| Predecessor | Successor | |||||||||||||||||||||||||||||||||||||||||||||||||||||||||||||||||||||||||||||
| Fiscal year ended September 30, | Period from October 1, 2007 through October 26, 2007 | Period from June 1, 2007 through September 30, 2007(1) | Fiscal year ended September 30, | For the Six Months Ended March 31, | Predecessor | Successor | ||||||||||||||||||||||||||||||||||||||||||||||||||||||||||||||||||||||||
| Period from October 1, 2007 through October 26, 2007 | Period from June 1, 2007 through September 30, 2007 | Fiscal year ended September 30, | Six months ended March 31, | |||||||||||||||||||||||||||||||||||||||||||||||||||||||||||||||||||||||||||
| 2006 | 2007 | 2008(2) | 2009 | 2010 | 2010 | 2011 | 2008(1) | 2009 | 2010 | 2011 | 2012 | 2012 | 2013 | |||||||||||||||||||||||||||||||||||||||||||||||||||||||||||||||||
| (in millions, except per share amounts) | (in millions, except per share amounts) | |||||||||||||||||||||||||||||||||||||||||||||||||||||||||||||||||||||||||||||
STATEMENT OF OPERATIONS DATA: | ||||||||||||||||||||||||||||||||||||||||||||||||||||||||||||||||||||||||||||||
REVENUE | ||||||||||||||||||||||||||||||||||||||||||||||||||||||||||||||||||||||||||||||
Products | $ | 2,790 | $ | 2,875 | $ | 96 | $ | — | $ | 2,595 | $ | 1,923 | $ | 2,602 | $ | 1,193 | $ | 1,479 | $ | 96 | $ | — | $ | 2,595 | $ | 1,923 | $ | 2,602 | $ | 2,976 | $ | 2,672 | $ | 1,386 | $ | 1,160 | ||||||||||||||||||||||||||||||||||||||||||
Services | 2,358 | 2,403 | 150 | — | 2,328 | 2,227 | 2,458 | 1,187 | 1,277 | 150 | — | 2,328 | 2,227 | 2,458 | 2,571 | 2,499 | 1,258 | 1,198 | ||||||||||||||||||||||||||||||||||||||||||||||||||||||||||||
|
|
|
|
|
|
|
|
| ||||||||||||||||||||||||||||||||||||||||||||||||||||||||||||||||||||||
| 5,148 | 5,278 | 246 | — | 4,923 | 4,150 | 5,060 | 2,380 | 2,756 | 246 | — | 4,923 | 4,150 | 5,060 | 5,547 | 5,171 | 2,644 | 2,358 | |||||||||||||||||||||||||||||||||||||||||||||||||||||||||||||
|
|
|
|
|
|
|
|
| ||||||||||||||||||||||||||||||||||||||||||||||||||||||||||||||||||||||
COSTS | ||||||||||||||||||||||||||||||||||||||||||||||||||||||||||||||||||||||||||||||
Products: | ||||||||||||||||||||||||||||||||||||||||||||||||||||||||||||||||||||||||||||||
Costs (exclusive of amortization of intangible assets) | 1,224 | 1,295 | 56 | — | 1,256 | 872 | 1,243 | 548 | 675 | 56 | — | 1,256 | 872 | 1,243 | 1,314 | 1,145 | 591 | 497 | ||||||||||||||||||||||||||||||||||||||||||||||||||||||||||||
Amortization of technology intangible assets | 15 | 20 | 1 | — | 231 | 248 | 291 | 142 | 133 | 1 | — | 231 | 248 | 291 | 257 | 192 | 99 | 36 | ||||||||||||||||||||||||||||||||||||||||||||||||||||||||||||
Services | 1,534 | 1,512 | 100 | — | 1,403 | 1,164 | 1,354 | 644 | 687 | 100 | — | 1,403 | 1,164 | 1,354 | 1,344 | 1,248 | 637 | 573 | ||||||||||||||||||||||||||||||||||||||||||||||||||||||||||||
|
|
|
|
|
|
|
|
| ||||||||||||||||||||||||||||||||||||||||||||||||||||||||||||||||||||||
| 2,773 | 2,827 | 157 | — | 2,890 | 2,284 | 2,888 | 1,334 | 1,495 | 157 | — | 2,890 | 2,284 | 2,888 | 2,915 | 2,585 | 1,327 | 1,106 | |||||||||||||||||||||||||||||||||||||||||||||||||||||||||||||
|
|
|
|
|
|
|
|
| ||||||||||||||||||||||||||||||||||||||||||||||||||||||||||||||||||||||
GROSS MARGIN | 2,375 | 2,451 | 89 | — | 2,033 | 1,866 | 2,172 | 1,046 | 1,261 | 89 | — | 2,033 | 1,866 | 2,172 | 2,632 | 2,586 | 1,317 | 1,252 | ||||||||||||||||||||||||||||||||||||||||||||||||||||||||||||
|
|
|
|
|
|
|
|
| ||||||||||||||||||||||||||||||||||||||||||||||||||||||||||||||||||||||
OPERATING EXPENSES | ||||||||||||||||||||||||||||||||||||||||||||||||||||||||||||||||||||||||||||||
Selling, general and administrative | 1,532 | 1,552 | 111 | — | 1,456 | 1,272 | 1,721 | 833 | 931 | 111 | — | 1,456 | 1,272 | 1,721 | 1,845 | 1,630 | 847 | 765 | ||||||||||||||||||||||||||||||||||||||||||||||||||||||||||||
Research and development | 428 | 444 | 29 | — | 376 | 309 | 407 | 197 | 236 | 29 | — | 376 | 309 | 407 | 461 | 464 | 228 | 231 | ||||||||||||||||||||||||||||||||||||||||||||||||||||||||||||
Amortization of intangible assets | 48 | 48 | 4 | — | 187 | 207 | 218 | 107 | 112 | 4 | — | 187 | 207 | 218 | 226 | 226 | 112 | 114 | ||||||||||||||||||||||||||||||||||||||||||||||||||||||||||||
Impairment of long-lived assets | — | — | — | — | 10 | 2 | 16 | 16 | — | |||||||||||||||||||||||||||||||||||||||||||||||||||||||||||||||||||||
Impairment of indefinite-lived intangible assets | — | — | — | — | 130 | 60 | — | — | — | — | — | 130 | 60 | — | — | — | — | — | ||||||||||||||||||||||||||||||||||||||||||||||||||||||||||||
Goodwill impairment | — | — | — | — | 899 | 235 | — | — | — | — | — | 899 | 235 | — | — | — | — | 89 | ||||||||||||||||||||||||||||||||||||||||||||||||||||||||||||
Restructuring charges, net | 104 | 36 | 1 | — | — | 160 | 171 | 83 | 64 | |||||||||||||||||||||||||||||||||||||||||||||||||||||||||||||||||||||
Restructuring and impairment charges, net | 1 | — | 10 | 162 | 187 | 189 | 147 | 111 | 102 | |||||||||||||||||||||||||||||||||||||||||||||||||||||||||||||||||||||
In-process research and development charge | — | — | — | — | 112 | 12 | — | — | — | — | — | 112 | 12 | — | — | — | — | — | ||||||||||||||||||||||||||||||||||||||||||||||||||||||||||||
Acquisition-related costs | — | — | — | — | — | 29 | 20 | 19 | 4 | — | — | — | 29 | 20 | 5 | 4 | 3 | — | ||||||||||||||||||||||||||||||||||||||||||||||||||||||||||||
Merger-related costs | — | 105 | 57 | — | 1 | — | — | — | — | 57 | — | 1 | — | — | — | — | — | — | ||||||||||||||||||||||||||||||||||||||||||||||||||||||||||||
|
|
|
|
|
|
|
|
| ||||||||||||||||||||||||||||||||||||||||||||||||||||||||||||||||||||||
| 2,112 | 2,185 | 202 | — | 3,171 | 2,286 | 2,553 | 1,255 | 1,347 | 202 | — | 3,171 | 2,286 | 2,553 | 2,726 | 2,471 | 1,301 | 1,301 | |||||||||||||||||||||||||||||||||||||||||||||||||||||||||||||
|
|
|
|
|
|
|
|
| ||||||||||||||||||||||||||||||||||||||||||||||||||||||||||||||||||||||
OPERATING INCOME (LOSS) | 263 | 266 | (113 | ) | — | (1,138 | ) | (420 | ) | (381 | ) | (209 | ) | (86 | ) | (113 | ) | — | (1,138 | ) | (420 | ) | (381 | ) | (94 | ) | 115 | 16 | (49 | ) | ||||||||||||||||||||||||||||||||||||||||||||||||
Interest expense | (3 | ) | (1 | ) | — | — | (377 | ) | (409 | ) | (487 | ) | (229 | ) | (240 | ) | — | — | (377 | ) | (409 | ) | (487 | ) | (460 | ) | (432 | ) | (217 | ) | (224 | ) | ||||||||||||||||||||||||||||||||||||||||||||||
Loss on extinguishment of debt | — | — | — | — | — | — | — | — | (246 | ) | — | — | — | — | — | (246 | ) | — | — | (6 | ) | |||||||||||||||||||||||||||||||||||||||||||||||||||||||||
Other income, net | 24 | 43 | 1 | — | 27 | 14 | 15 | 5 | 1 | |||||||||||||||||||||||||||||||||||||||||||||||||||||||||||||||||||||
Other income (expense), net | 1 | — | 27 | 14 | 15 | 5 | (29 | ) | (16 | ) | 4 | |||||||||||||||||||||||||||||||||||||||||||||||||||||||||||||||||||
|
|
|
|
|
|
|
|
| ||||||||||||||||||||||||||||||||||||||||||||||||||||||||||||||||||||||
INCOME (LOSS) BEFORE INCOME TAXES | 284 | 308 | (112 | ) | — | (1,488 | ) | (815 | ) | (853 | ) | (433 | ) | (571 | ) | |||||||||||||||||||||||||||||||||||||||||||||||||||||||||||||||
Provision for (benefit from) income taxes | 83 | 93 | (24 | ) | — | (183 | ) | 30 | 18 | (16 | ) | 41 | ||||||||||||||||||||||||||||||||||||||||||||||||||||||||||||||||||
LOSS BEFORE INCOME TAXES | (112 | ) | — | (1,488 | ) | (815 | ) | (853 | ) | (795 | ) | (346 | ) | (217 | ) | (275 | ) | |||||||||||||||||||||||||||||||||||||||||||||||||||||||||||||
Benefit from (provision for) income taxes | 24 | — | 183 | (30 | ) | (18 | ) | (68 | ) | (8 | ) | 26 | 6 | |||||||||||||||||||||||||||||||||||||||||||||||||||||||||||||||||
|
|
|
|
|
|
|
|
| ||||||||||||||||||||||||||||||||||||||||||||||||||||||||||||||||||||||
NET INCOME (LOSS) | 201 | 215 | (88 | ) | — | (1,305 | ) | (845 | ) | (871 | ) | (417 | ) | (612 | ) | |||||||||||||||||||||||||||||||||||||||||||||||||||||||||||||||
NET LOSS | (88 | ) | — | (1,305 | ) | (845 | ) | (871 | ) | (863 | ) | (354 | ) | (191 | ) | (269 | ) | |||||||||||||||||||||||||||||||||||||||||||||||||||||||||||||
Less net income attributable to noncontrolling interests | — | 3 | — | — | 2 | 2 | 3 | 2 | — | |||||||||||||||||||||||||||||||||||||||||||||||||||||||||||||||||||||
Less: net income attributable to noncontrolling interests | — | — | 2 | 2 | 3 | — | — | — | — | |||||||||||||||||||||||||||||||||||||||||||||||||||||||||||||||||||||
|
|
|
|
|
|
|
|
| ||||||||||||||||||||||||||||||||||||||||||||||||||||||||||||||||||||||
NET INCOME (LOSS) ATTRIBUTABLE TO AVAYA HOLDINGS CORP. | 201 | 212 | (88 | ) | — | (1,307 | ) | (847 | ) | (874 | ) | (419 | ) | (612 | ) | |||||||||||||||||||||||||||||||||||||||||||||||||||||||||||||||
NET LOSS ATTRIBUTABLE TO AVAYA HOLDINGS CORP. | (88 | ) | — | (1,307 | ) | (847 | ) | (874 | ) | (863 | ) | (354 | ) | (191 | ) | (269 | ) | |||||||||||||||||||||||||||||||||||||||||||||||||||||||||||||
Less: Accretion and accrued dividends on Series A preferred stock | — | — | — | — | — | — | (62 | ) | (2 | ) | (3 | ) | ||||||||||||||||||||||||||||||||||||||||||||||||||||||||||||||||||
Less: Accretion and accrued dividends on Series A and Series B preferred stock | — | — | — | — | (62 | ) | (7 | ) | (71 | ) | (3 | ) | (21 | ) | ||||||||||||||||||||||||||||||||||||||||||||||||||||||||||||||||
|
|
|
|
|
|
|
|
| ||||||||||||||||||||||||||||||||||||||||||||||||||||||||||||||||||||||
NET INCOME (LOSS) ATTRIBUTABLE TO AVAYA HOLDINGS CORP. COMMON STOCKHOLDERS | $ | 201 | $ | 212 | $ | (88 | ) | $ | — | $ | (1,307 | ) | $ | (847 | ) | $ | (936 | ) | $ | (421 | ) | $ | (615 | ) | ||||||||||||||||||||||||||||||||||||||||||||||||||||||
NET LOSS ATTRIBUTABLE TO AVAYA HOLDINGS CORP. COMMON STOCKHOLDERS | $ | (88 | ) | $ | — | $ | (1,307 | ) | $ | (847 | ) | $ | (936 | ) | $ | (870 | ) | $ | (425 | ) | $ | (194 | ) | $ | (290 | ) | ||||||||||||||||||||||||||||||||||||||||||||||||||||
|
|
|
|
|
|
|
|
| ||||||||||||||||||||||||||||||||||||||||||||||||||||||||||||||||||||||
SHARE DATA: | ||||||||||||||||||||||||||||||||||||||||||||||||||||||||||||||||||||||||||||||
Net income (loss) per share attributable to common stockholders—basic | $ | 0.43 | $ | 0.47 | $ | (0.19 | ) | $ | — | $ | (2.87 | ) | $ | (1.74 | ) | $ | (1.92 | ) | $ | (0.86 | ) | $ | (1.26 | ) | ||||||||||||||||||||||||||||||||||||||||||||||||||||||
Net loss per share attributable to common stockholders—basic | $ | (0.19 | ) | $ | — | $ | (2.87 | ) | $ | (1.74 | ) | $ | (1.92 | ) | $ | (1.78 | ) | $ | (0.87 | ) | $ | (0.40 | ) | $ | (0.59 | ) | ||||||||||||||||||||||||||||||||||||||||||||||||||||
Weighted average shares outstanding—basic | 462.6 | 454.2 | 462.9 | — | 455.9 | 488.1 | 488.6 | 488.5 | 488.9 | 462.9 | — | 455.9 | 488.1 | 488.6 | 489.0 | 489.6 | 489.3 | 489.3 | ||||||||||||||||||||||||||||||||||||||||||||||||||||||||||||
Net income (loss) per share attributable to common stockholders—diluted | $ | 0.43 | $ | 0.46 | $ | (0.19 | ) | $ | — | $ | (2.87 | ) | $ | (1.74 | ) | $ | (1.92 | ) | $ | (0.86 | ) | $ | (1.26 | ) | ||||||||||||||||||||||||||||||||||||||||||||||||||||||
Net loss per share attributable to common stockholders—diluted | (0.19 | ) | — | (2.87 | ) | (1.74 | ) | (1.92 | ) | (1.78 | ) | (0.87 | ) | (0.40 | ) | (0.59 | ) | |||||||||||||||||||||||||||||||||||||||||||||||||||||||||||||
Weighted average shares outstanding—diluted | 468.6 | 461.3 | 462.9 | — | 455.9 | 488.1 | 488.6 | 488.5 | 488.9 | 462.9 | — | 455.9 | 488.1 | 488.6 | 489.0 | 489.6 | 489.3 | 489.3 | ||||||||||||||||||||||||||||||||||||||||||||||||||||||||||||
| Predecessor | Successor | Predecessor |
| Successor | ||||||||||||||||||||||||||||||||||||||||||||||||||||||||||||||||||||||||||
| Fiscal year ended September 30, | Period from October 1, 2007 through October 26, 2007 | Period from June 1, 2007 through September 30, 2007(1) | Fiscal year ended September 30, | Six months ended March 31, | Period from October 1, 2007 through October 26, 2007 | Period from June 1, 2007 through September 30, 2007 | Fiscal year ended September 30, | Six months ended March 31, | ||||||||||||||||||||||||||||||||||||||||||||||||||||||||||||||||||||||
| 2006 | 2007 | 2008(2) | 2009 | 2010 | 2010 | 2011 | 2008(1) | 2009 | 2010 | 2011 | 2012 | 2012 | 2013 | |||||||||||||||||||||||||||||||||||||||||||||||||||||||||||||||||
| (in millions) | (in millions) | |||||||||||||||||||||||||||||||||||||||||||||||||||||||||||||||||||||||||||||
BALANCE SHEET DATA (at end of period): | ||||||||||||||||||||||||||||||||||||||||||||||||||||||||||||||||||||||||||||||
Cash and cash equivalents | $ | 899 | $ | 1,270 | $ | — | $ | 594 | $ | 582 | $ | 594 | $ | 591 | $ | 468 | $ | — | $ | 594 | $ | 582 | $ | 594 | $ | 415 | $ | 338 | $ | 356 | $ | 303 | ||||||||||||||||||||||||||||||||||||||||||||||
Intangible assets, net | 263 | 248 | — | 3,154 | 2,636 | 2,603 | 2,878 | 2,367 | — | 3,154 | 2,636 | 2,603 | 2,129 | 1,775 | 1,939 | 1,625 | ||||||||||||||||||||||||||||||||||||||||||||||||||||||||||||||
Goodwill | 941 | 1,157 | — | 3,956 | 3,695 | 4,075 | 4,113 | 4,080 | — | 3,956 | 3,695 | 4,075 | 4,079 | 4,188 | 4,093 | 4,093 | ||||||||||||||||||||||||||||||||||||||||||||||||||||||||||||||
Total assets | 5,200 | 5,933 | — | 10,010 | 8,665 | 9,276 | 9,691 | 8,920 | — | 10,010 | 8,665 | 9,276 | 8,561 | 8,184 | 8,321 | 7,830 | ||||||||||||||||||||||||||||||||||||||||||||||||||||||||||||||
Total debt (excluding capital lease obligations) | — | — | — | 5,222 | 5,150 | 5,928 | 5,887 | 6,176 | — | 5,222 | 5,150 | 5,928 | 6,157 | 6,121 | 6,139 | 6,103 | ||||||||||||||||||||||||||||||||||||||||||||||||||||||||||||||
Preferred stock, Series B | — | — | — | — | — | 227 | — | 245 | ||||||||||||||||||||||||||||||||||||||||||||||||||||||||||||||||||||||
Preferred stock, Series A | — | — | — | — | — | 130 | 127 | 133 | — | — | — | 130 | 137 | 144 | 140 | 147 | ||||||||||||||||||||||||||||||||||||||||||||||||||||||||||||||
Total Avaya Holdings Corp. stockholders’ equity (deficiency) | 2,086 | 2,586 | — | 1,063 | (682 | ) | (1,543 | ) | (907 | ) | (2,136 | ) | — | 1,063 | (682 | ) | (1,543 | ) | (2,500 | ) | (2,843 | ) | (2,637 | ) | (3,133 | ) | ||||||||||||||||||||||||||||||||||||||||||||||||||||
STATEMENT OF CASH FLOWS DATA: | ||||||||||||||||||||||||||||||||||||||||||||||||||||||||||||||||||||||||||||||
Net cash provided by (used in): | ||||||||||||||||||||||||||||||||||||||||||||||||||||||||||||||||||||||||||||||
Net cash provided by (used in) | ||||||||||||||||||||||||||||||||||||||||||||||||||||||||||||||||||||||||||||||
Operating activities | $ | 647 | $ | 637 | $ | 133 | $ | — | $ | 304 | $ | 242 | $ | 42 | $ | (2 | ) | $ | (349 | ) | $ | 133 | $ | — | $ | 304 | $ | 242 | $ | 42 | $ | (300 | ) | $ | 44 | $ | 31 | $ | 88 | |||||||||||||||||||||||||||||||||||||||
Investing activities | (189 | ) | (360 | ) | (16 | ) | — | (7,205 | ) | (155 | ) | (864 | ) | (850 | ) | (30 | ) | (16 | ) | — | (7,205 | ) | (155 | ) | (864 | ) | (101 | ) | (283 | ) | (75 | ) | (59 | ) | ||||||||||||||||||||||||||||||||||||||||||||
Financing activities | (315 | ) | 54 | 11 | — | 7,512 | (101 | ) | 853 | 878 | 248 | 11 | — | 7,512 | (101 | ) | 853 | 228 | 155 | (22 | ) | (59 | ) | |||||||||||||||||||||||||||||||||||||||||||||||||||||||
OTHER FINANCIAL DATA: | ||||||||||||||||||||||||||||||||||||||||||||||||||||||||||||||||||||||||||||||
EBITDA | $ | 520 | $ | 557 | $ | (94 | ) | $ | — | $ | (515 | ) | $ | 240 | $ | 320 | $ | 135 | $ | 2 | $ | (94 | ) | $ | — | $ | (515 | ) | $ | 240 | $ | 320 | $ | 313 | $ | 647 | $ | 284 | $ | 169 | ||||||||||||||||||||||||||||||||||||||
Adjusted EBITDA(3) | 654 | 832 | (27 | ) | — | 859 | 753 | 795 | 367 | 442 | (27 | ) | — | 859 | 753 | 795 | 971 | 971 | 479 | 423 | ||||||||||||||||||||||||||||||||||||||||||||||||||||||||||
Capital expenditures, net | 117 | 120 | 8 | — | 120 | 76 | 79 | 30 | 35 | 8 | — | 120 | 76 | 79 | 83 | 92 | 38 | 47 | ||||||||||||||||||||||||||||||||||||||||||||||||||||||||||||
Capitalized software development costs | 71 | 93 | 7 | — | 74 | 43 | 43 | 23 | 14 | 7 | — | 74 | 43 | 43 | 42 | 35 | 19 | 10 | ||||||||||||||||||||||||||||||||||||||||||||||||||||||||||||
| (1) | The selected historical consolidated financial data above as of and for the year ended September 30, 2008 reflect the results of Avaya Holdings Corp. for the entire fiscal year and includes the results of Avaya Inc. and its consolidated subsidiaries subsequent to October 26, 2007, the date of the Merger. |
| (2) | Avaya Holdings Corp. is a holding company formed on June 1, 2007 by affiliates of the Sponsors for the purpose of consummating the Merger. Avaya Holdings Corp. has no material assets or stand-alone operations other than its ownership in Avaya Inc. and its subsidiaries. The selected historical consolidated financial data above as of September 30, 2007 and for the period from June 1, 2007 through September 30, 2007 reflects the results of Avaya Holdings Corp. |
| (3) | Adjusted EBITDA is calculated in accordance with, |
The following are some of the items affecting the comparability of the selected historical consolidated financial data for the periods presented:
The Company remains focused on its efforts to streamline operations, generate cost savings and eliminate overlapping processes and expenses. Restructuring charges for the six months ended March 31, 2013 were $102 million and include employee separation costs and lease obligations. In December 2012, the Company approved a plan that provides for the elimination of 234 positions in Europe, the Middle East and Africa, or EMEA, and resulted in a charge of $47 million, including $34 million associated with the elimination of positions in Germany. The separation charges include, but are not limited to, social pension fund payments and health care and unemployment insurance costs to be paid to or on behalf of the affected employees. In addition, a voluntary program offered to certain management employees in the U.S. resulted in the elimination of 195 positions and a charge of $9 million.
During the three months ended March 31, 2013, the Company recorded an impairment to goodwill associated with its IT professional services, or ITPS, reporting unit of $89 million. The ITPS reporting unit provides specialized information technology services exclusively to U.S. government customers and has experienced a decline in revenues as compared to previous periods and a reduction in its forecasts for the remainder of fiscal 2013. The reporting unit was impacted by reduced government spending in anticipation of sequestration and general budget cuts. See discussion in Note 4, “Goodwill and Intangible Assets,” to our unaudited Consolidated Financial Statements included elsewhere in this prospectus.
On August 8, 2011, Avaya Inc. amended the terms of the multi-currency revolvers available under its senior secured credit facility and its senior secured multi-currency asset-based revolving credit facility to extend the final maturity of each from October 26, 2013 to October 26, 2016. All other terms and conditions of the senior secured credit facility and the senior secured multi-currency asset-based revolving credit facility remain unchanged.
During the three months ended December 31, 2012, Avaya Inc. completed three transactions to refinance $848 million of term loans under the senior secured credit facility. On October 29, 2012 Avaya Inc. completed an amendment and restatement of the senior secured credit facility and senior secured multi-currency asset-based revolving credit facility along with the extension of the maturity date of $135 million aggregate principal amount of term B-1 loans from October 26, 2014 to October 26, 2017 by converting such loans into a new tranche of senior secured term B-4 loans (“term B-4 loans”). On December 21, 2012 Avaya Inc. completed an amendment and restatement of the senior secured credit facility along with the extension of the maturity date of $713 million aggregate principal amount of term B-1 loans from October 26, 2014 to October 26, 2017 and $134 million aggregate principal amount of term B-4 loans from October 26, 2017 to March 31, 2018 in each case by converting such loans into a new tranche of senior secured term B-5 loans (“term B-5 loans”). On December 21, 2012 Avaya Inc. issued $290 million of 9% senior secured notes due April 2019 (the “9% Senior Secured Notes”), the proceeds of which were used to repay $284 million principal amount of term B-5 loans and to pay related fees and expenses. See Note 7, “Financing Arrangements” to our unaudited Consolidated Financial Statements included elsewhere in this prospectus for further details.
During the three months ended March 31, 2013, the Company refinanced the $584 million of term B-1 loans outstanding under its senior secured credit facility and refinanced $1,384 million of senior unsecured notes. On March 7, 2013, Avaya Inc. completed an exchange offer in which $642 million of its 9.75% senior unsecured cash-pay notes due 2015 and $742 million of 10.125%/10.875% senior unsecured paid-in-kind (“PIK”) toggle notes due November 1, 2015 were exchanged for $1,384 million of 10.50% senior secured notes due March 1, 2021. In addition, on March 12, 2013, Avaya Inc. refinanced the remaining term B-1 loans due October 26, 2014, with the cash proceeds from the issuance of $589 million aggregate principal amount of term B-5 loans due October 26, 2017 under its senior secured credit facility. See Note 7, “Financing Arrangements” to our unaudited Consolidated Financial Statements included elsewhere in this prospectus for further details.
The Company recognized a loss on extinguishment of debt for the six months ended March 31, 2013 of $6 million in connection with (1) the issuance of Avaya Inc.’s 9% Senior Secured Notes and the payment of $284 million of term B-5 loans and (2) the refinancing of $584 million of outstanding term B-1 loans. The loss represents the difference between the reacquisition price and the carrying value (including unamortized discount and debt issue costs) of the debt. See Note 7, “Financing Arrangements” to our unaudited Consolidated Financial Statements included elsewhere in this prospectus for further details.
On February 11, 2011, Avaya Inc. completed a private placement of $1,009 million of senior secured notes. The senior secured notes were issued at par, bear interest at a rate of 7% per annum and mature on April 1, 2019. The proceeds from the notes were used to repay in full the senior secured incremental term B-2 loans outstanding under Avaya Inc.’sthe senior secured credit facility (representing $988 million in aggregate principal amount and $12 million in accrued and unpaid interest) and to pay related fees and expenses. The issuance of the senior secured notes and repayment of the senior secured incremental term B-2 loans was accounted for as an extinguishment of the senior secured incremental term B-2 loans and issuance of new debt. Accordingly, the Company recognized a loss on
expenses. The issuance of the senior secured notes and repayment of the senior secured incremental term B-2 loans was accounted for as an extinguishment of the senior secured incremental term B-2 loans and issuance of new debt. Accordingly, the Company recognized a loss on extinguishment of debt of $246 million based on the difference between the reacquisition price and the carrying value of the incremental term B-2 loans (including unamortized debt discount and debt issue costs) during |
As a result of the acquisitionacquisitions of NES and Radvision, our operating results include the operations of the NES business and Radvision as of December 19, 2009.2009 and June 5, 2012.
For the six months ended March 31, 2013 and fiscal 2012, we recognized a gain (loss) on the changes in the fair value of the Series B Convertible Preferred Stock (“preferred series B”) embedded derivative included in other income (expense) of $8 million and $(6) million, respectively. In order to partially fund the acquisition of Radvision, on May 29, 2012 the Company issued 48,921 shares of preferred series B which contain an embedded derivative that under GAAP must be recognized as a liability at fair value at each balance sheet date with the changes in the fair value recognized in operations. See Note 15 “Capital Stock” to our audited Consolidated Financial Statements included elsewhere in this prospectus for further discussion.
In connection with the acquisition of NES, we have incurred acquisition-related costs during fiscal years 2009 and 2010 of $29 million and $20 million, respectively.
We incurred integration costs with respect to the NES acquisition of $208 million, $87$132 million and $83$208 million, for fiscal year 2010 and the six months ended March 31, 2011 and fiscal 2010, respectively. Integration-relatedIntegration costs primarily represent third-party consulting fees and other administrative costs associated with consolidating and coordinating the operations of Avaya and NES. These costs were incurred in connection with, among other things, the on-boarding of NES personnel, developing compatible IT systems and internal processes and developing and implementing a strategic operating plan to help enable a smooth transition with minimal disruption to NES customers. Such costs also include fees paid to certain Nortel-controlled entitiesNortel for logistics and other support functions being performed on a temporary basis according to a transition services agreement. In fiscal 2012 we incurred $19 million of integration costs which were primarily associated with consolidating and coordinating the operations of Avaya and Radvision and costs associated with NES, primarily related to developing compatible IT systems and internal processes.
During fiscal 2012 and 2011, we continued to identify opportunities to streamline operations and generate cost savings, which include exiting facilities and reducing headcount. Restructuring charges for fiscal 2012 and 2011 were $142 million and $189 million, respectively. In fiscal 2012 and 2011 the Company entered into agreements with the works council representing employees of certain of the Company’s German subsidiaries for the elimination of 327 and 210 positions, respectively. The charges associated with these agreements were $70 million and $56 million respectively and consisted of severance and employment benefit payments, including, but not limited to, social pension fund payments and healthcare and unemployment insurance costs to be paid to or on behalf of the affected employees. In addition, the Company incurred employee separation costs of $53 million and $97 million for fiscal 2012 and 2011, respectively, primarily related to the U.S. and EMEA, excluding Germany. The Company also recorded charges associated with partially or totally vacated facilities of $19 million and $36 million for fiscal 2012 and 2011, respectively.
On August 31, 2010, we sold our 59.13% ownership in AGC Networks Ltd., or AGC, (formerly Avaya GlobalConnect Ltd.), our reseller in India, and recognized a $7 million gain on the sale. AGC remains a key channel partner of Avaya serving customers in the India market one of the fastest growing enterprise communications markets in the world, and in Australia.
Impairment charges of $16 million were incurred in fiscal year 2010 associated with certain technologies with overlapping functionality to technologies acquired with NES.
Amortization of intangible assets was $418 million, $483 million, $509 million and $455 million for the years ended September 30, 2012, 2011, 2010 and 2009, respectively. The increase of $54 million is attributable to amortization associated with intangible assets recorded in connection with our acquisition of NES. In acquisition accounting, we recorded technologies, customer relationships and other intangibles of NES with an estimated fair value of $476 million. These assetsfluctuations are amortized over their estimated economic lives ranging from less than one year to thirteen years.
attributable to amortization associated with intangible assets recorded in connection with our acquisition of NES partially offset by any impairment and fully amortized intangibles. In acquisition accounting, we recorded technologies, customer relationships and other intangibles of NES with an estimated fair value of $476 million. These assets are amortized over their estimated economic lives ranging from less than one year to thirteen years. |
In connection with the financing of the acquisition of NES, we received cash proceeds of $783 million were received in exchange for senior secured incremental term B-2 loans with a face value of $1,000 million and the issuance of detachable warrants to purchase 61.5 million shares of common stock.
In connection with the financing of the acquisition of NES, we issued 125,000 shares of Series A Preferred Stock with detachable warrants to purchase 38.5 million shares of common stock for cash proceeds of $125 million.
During the period from December 19, 2009 through September 30, 2010, we incurred incremental interest expense from the financing associated with the acquisition of NES of $117 million, which includes non-cash interest expense of $33$34 million.
During the year ended September 30, 2010, we continued our focus on controlling costs. In response to the global economic climate and, in connection with the acquisition of NES, we began implementing additional initiatives designed to streamline our operations, generate cost savings and eliminate overlapping processes and expenses associated with the NES business. These initiatives include exiting facilities and reducing the workforce or relocating positions to lower cost geographies. Restructuring charges associated with these initiatives were $151 million for employee separation costs primarily associated with involuntary employee severance actions in Europe, the Middle East and Africa, or the EMEA and the U.S. and an additional $24 million in future net lease payments associated with the closing and consolidating of facilities.
The provision for income taxes for fiscal years 2009was $8 million, $68 million, $18 million and 2010 was $30 million for the years ended September 30, 2012, 2011, 2010 and $18 million, respectively. The provision is2009, respectively, and was substantially different from income taxes determined at the U.S. federalFederal statutory rate. InFor fiscal year 2009, we were in a three-year cumulative U.S. book tax loss position and had determined that it is more likely than not that our U.S. net deferred tax assets would not be realized. Accordingly, we had provided a valuation allowance against our U.S. net deferred tax assets. As a result, we recorded a tax provision associated with earnings in certain profitable non-U.S. tax jurisdictions for the period offset by a minimal tax benefit relating to our U.S. pre-tax losses in fiscal year 2009. In fiscal year 2010, 2011 and 2012, we provided additional allowances associated with the U.S. valuation allowance and our income tax provision relatedprimarily relates to earnings of certain profitable non-U.S. tax jurisdictions. As of September 30, 2012, the Company changed its indefinite reinvestment of undistributed foreign earnings assertion with respect to its non-U.S. subsidiaries. As a result the Company recorded fiscal 2012 income tax expense of $17 million relating to non-U.S. taxes.
During the six months ended March 31, 2013, the Company recognized $17 million of income tax benefit related to the elimination of the tax effect of certain interest rate swaps in other comprehensive income and a tax charge of $16 million to other comprehensive income primarily relating to pension benefits. During the six months ended March 31, 2012, the Company recorded a tax charge of $6 million to other comprehensive income primarily relating to pension benefits.
During fiscal year 2009, we recorded impairments to goodwill and trademark and trade name indefinite-lived intangible assets of $235 million and $60 million, respectively. The impairments are primarily attributable to lower expected future discounted cash flows as a result of the continued weakness in the global economy and changes in discount rates.
During fiscal year 2009, as a response to the global economic downturn, we began implementing certain initiatives designed to further streamline our operations and generate cost savings. Restructuring charges associated with these initiatives were $160 million and include employee separation costs primarily related to workforce actions in the EMEA and U.S. regions.
In connection with the Merger, we entered into financing arrangements on October 26, 2007 providing for $5,250 million in financing.
As a result of the Merger, all of the assets and liabilities of the Predecessor company were recorded at estimated fair values by the Successor company at October 27, 2007. The purchase price allocation resulted in significant changes to our balance sheet accounts including inventory, deferred income tax assets and liabilities, property, plant and equipment, intangible assets, goodwill, employee benefit obligations, deferred revenue and other assets, liabilities and stockholders’ equity accounts. These adjustments included increases to goodwill of $3,698 million and trademark and trade name indefinite-lived intangible assets of $545 million.
Amortization of intangible assets for fiscal year 2008 was $418 million. The increase over fiscal year 2007 is attributable to the amortization expense associated with significant intangible asset values recorded in connection with the Merger. In purchase accounting, we recorded technologies, patents, licenses, customer relationships and other intangibles with an estimated fair value of $3,157 million. These assets are amortized over their estimated economic lives ranging from five to ten years.
During fiscal year 2008 we expensed IPRD of $112 million which represented certain technologies that, at the time of the Merger, were in the initial development stages and did not meet the technological feasibility standard necessary for capitalization at the time. Accordingly, these amounts were expensed at the date of the acquisition.Merger.
As a result of the Merger, we increased the inventory of the Predecessor by $182 million to reflect its estimated fair value less costs to sell. This adjustment in value was fully expensed as cost of goods sold during fiscal year 2008 as the inventory was sold.
During fiscal year 2008, we recorded impairments as part of our annual impairment tests to goodwill and trademark and trade name indefinite-lived intangible assets of $899 million and $130 million, respectively. The impairments are primarily the result of lower expected future cash flows as a result of the weakness in the global economy.
The benefit from income taxes for fiscal year 2008 was $183 million and reflects an effective benefit rate of 12.3%. The difference between our effective benefit rate and the U.S. federal statutory rate of 35% is primarily attributable to the non-deductible portions of the impairment of goodwill and the IPRD charge. The unrecognized tax benefits associated with the non-deductible portions of these charges is $334 million or 22% of pre-tax loss for fiscal year 2008.
During fiscal year 2007 and the period October 1, 2007 through October 26, 2007 the Predecessor incurred approximately $105 million and $57 million respectively, of Merger-related costs. These costs included investment banking, legal and other third-party costs, as well as $96 million of non-cash stock compensation expense resulting from the accelerated vesting of stock options and RSUs in connection with the Merger.
During fiscal years 2006 and 2007 and the period October 1, 2007 through October 26, 2007, respectively, the Predecessor recorded $104 million, $36 million and $1 million of restructuring charges related to employee separation and lease termination costs in EMEA and the U.S. Restructuring actions taken during the period October 27, 2007 through September 30, 2008 were charged against the $330 million liability established in purchase accounting for employee separation costs and lease obligations, rather than impacting the Consolidated Statement of Operations.
UNAUDITED PRO FORMA COMBINED FINANCIAL STATEMENTS
The following presents the unaudited pro forma combined balance sheet as of March 31, 2011,2013, and the unaudited pro forma combined statement of operations for the year ended September 30, 20102012 and the six months ended March 31, 2011.2013.
The following unaudited pro forma combined financial statements have been developed by applying pro forma adjustments to the historical consolidated statementsConsolidated Balance Sheets and Statements of financial position and operationsOperations of Avaya Holdings Corp. appearing elsewhere in this prospectus. The unaudited pro forma combined balance sheet as of March 31, 20112013 gives effect to the sale of the common stock as contemplated in this offering and the use of the proceeds thereof as if they had occurred on March 31, 2011.2013. The unaudited pro forma combined statement of operations for the fiscal year ended September 30, 20102012 gives effect to the acquisition of NES and its related financing, the refinancing of certain Company debt that took place on February 11, 2011,during the six months ended March 31, 2013 and the sale of the common stock as contemplated in this offering and the use of the proceeds thereof as if they had occurred on October 1, 2009.2011. The unaudited pro forma combined statement of operations for the six months ended March 31, 20112013 gives effect to the refinancing of certain Company debt that took place on February 11, 2011,during the six months ended March 31, 2013 and the sale of the common stock as contemplated in this offering and the use of the proceeds thereof as if they had occurred on October 1, 2009. All2011.All pro forma adjustments and underlying assumptions are described more fully in the notes to the unaudited pro forma combined financial statements.
The pro forma information presented is for illustrative purposes only and is not necessarily indicative of the financial position or results of operations that would have been realized if the acquisition of NES and its related financing, the refinancing of certain Company debt that took place on February 11, 2011, and the sale of the common stock as contemplated in this offering and the use of the proceeds thereof were completed on the dates indicated, nor is it indicative of future operating results. The pro forma adjustments are based upon available information and certain assumptions that management believes to be reasonable.
The unaudited pro forma combined statementsstatement of operations dodoes not include the effects of:
forecasted operating efficienciescompensation expense relative to the market-based “multiple-of-money” options or cost savings;
forecasted savings as a resultcash awards under the Long-Term Incentive Cash Bonus Plan granted by the Company and recognized upon the completion of planned restructuring actions;
any forecasted gross margin improvement due to scale and leveraging of our and NES’s supply chains;this offering; or
accounting charges that may be recorded as a result of the termination of the management services agreement with affiliates of the Sponsors pursuant to the terms of the agreement.
You should read this information in conjunction with the:
accompanying notes to the unaudited pro forma combined financial statements; and audited historical consolidated financial statementsConsolidated Financial Statements of Avaya Holdings Corp. as of and for the year ended September 30, 2010,2012, included elsewhere in this prospectus; and
unaudited historical consolidated financial statementsConsolidated Financial Statements of Avaya Holdings Corp. as of and for the six months ended March 31, 2011,2013, included elsewhere in this prospectus.
The unaudited pro forma combined statement of operations for the fiscal year ended September 30, 2010 is presented as if the acquisition of NES and its related financing, the refinancing of certain Company debt that took place on February 11, 2011, and the sale of the common stock as contemplated in this offering and the use of the proceeds thereof had taken place on October 1, 2009. Due to the timing of the acquisition of NES, the unaudited pro forma combined statement of operations for the fiscal year ended September 30, 2010 includes the historical audited results of Avaya Holdings Corp. for the fiscal year ended September 30, 2010 and the historical unaudited results of NES for the period October 1, 2009 through December 18, 2009. There were no material transactions between Avaya Holdings Corp. and NES that require elimination during the period October 1, 2009 through December 18, 2009.
Avaya Holdings Corp.
Unaudited Pro Forma Combined Balance Sheet
March 31, 20112013
| Historical Avaya Holdings. Corp | IPO Pro Forma Adjustment (Note 4) | Pro Forma Combined | Historical | IPO Pro Forma Adjustments (Note 2) | Pro Forma | |||||||||||||||||||||||
| (in millions) | (in millions, except per share amounts) | |||||||||||||||||||||||||||
ASSETS | ||||||||||||||||||||||||||||
Current assets: | ||||||||||||||||||||||||||||
Cash and cash equivalents | $ | 468 | $ | — | (e), (f), (g), (h) | $ | $ | 303 | $ | — | (a), (b), (c), (d) | $ | ||||||||||||||||
Accounts receivable, net | 734 | — | 681 | — | ||||||||||||||||||||||||
Inventory | 311 | — | 255 | — | ||||||||||||||||||||||||
Deferred income taxes, net | 4 | — | 21 | — | ||||||||||||||||||||||||
Other current assets | 307 | — | (g) | 277 | — | (c) | ||||||||||||||||||||||
|
|
| ||||||||||||||||||||||||||
TOTAL CURRENT ASSETS | 1,824 | — | 1,537 | — | ||||||||||||||||||||||||
|
|
| ||||||||||||||||||||||||||
Property, plant and equipment, net | 423 | — | 353 | — | ||||||||||||||||||||||||
Deferred income taxes, net | 20 | — | 44 | — | ||||||||||||||||||||||||
Intangible assets, net | 2,367 | — | 1,625 | — | ||||||||||||||||||||||||
Goodwill | 4,080 | — | 4,093 | — | ||||||||||||||||||||||||
Other assets | 206 | — | (g) | 178 | — | (c) | ||||||||||||||||||||||
|
|
| ||||||||||||||||||||||||||
TOTAL ASSETS | $ | 8,920 | $ | — | $ | $ | 7,830 | $ | — | $ | ||||||||||||||||||
|
|
| ||||||||||||||||||||||||||
LIABILITIES | ||||||||||||||||||||||||||||
Current liabilities: | ||||||||||||||||||||||||||||
Debt maturing within one year | $ | 37 | $ | — | $ | $ | 35 | $ | — | $ | ||||||||||||||||||
Accounts payable | 519 | — | 409 | — | ||||||||||||||||||||||||
Payroll and benefit obligations | 313 | — | 247 | — | ||||||||||||||||||||||||
Deferred revenue | 653 | — | 689 | — | ||||||||||||||||||||||||
Business restructuring reserves, current portion | 91 | — | 103 | — | ||||||||||||||||||||||||
Other current liabilities | 390 | — | 261 | — | ||||||||||||||||||||||||
|
|
| ||||||||||||||||||||||||||
TOTAL CURRENT LIABILITIES | 2,003 | — | 1,744 | — | ||||||||||||||||||||||||
|
|
| ||||||||||||||||||||||||||
Long-term debt | 6,139 | — | (g) | 6,068 | — | (c) | ||||||||||||||||||||||
Pension obligations | 1,542 | — | 1,708 | — | ||||||||||||||||||||||||
Other postretirement obligations | 459 | 343 | ||||||||||||||||||||||||||
Deferred income taxes, net | 163 | — | 209 | — | ||||||||||||||||||||||||
Business restructuring reserves, non-current portion | 49 | — | 56 | — | ||||||||||||||||||||||||
Other liabilities | 568 | — | 443 | — | (e) | |||||||||||||||||||||||
|
|
| ||||||||||||||||||||||||||
TOTAL NON-CURRENT LIABILITIES | 8,920 | — | 8,827 | — | ||||||||||||||||||||||||
|
|
| ||||||||||||||||||||||||||
Preferred stock, Series B | 245 | — | ||||||||||||||||||||||||||
Preferred stock, Series A | 133 | — | (f) | 147 | — | (b) | ||||||||||||||||||||||
TOTAL DEFICIENCY | (2,136 | ) | — | (e), (g), (h) | ||||||||||||||||||||||||
TOTAL STOCKHOLDERS’ DEFICIENCY | (3,133 | ) | — | (a), (c), (d), (e) | ||||||||||||||||||||||||
|
|
| ||||||||||||||||||||||||||
TOTAL LIABILITIES AND DEFICIENCY | $ | 8,920 | $ | — | $ | |||||||||||||||||||||||
TOTAL LIABILITIES AND STOCKHOLDERS’ DEFICIENCY | $ | 7,830 | $ | — | $ | |||||||||||||||||||||||
|
|
| ||||||||||||||||||||||||||
See accompanying notes to unaudited pro forma combined financial statements.
Avaya Holdings Corp.
Unaudited Pro Forma Combined Statement of Operations
YearSix Months Ended September 30, 2010March 31, 2013
| Historical | Acquisition Pro Forma Adjustments (Note 2) | Debt Refinancing Pro Forma Adjustments (Note 3) | IPO Pro Forma Adjustments (Note 4) | Pro Forma Combined | ||||||||||||||||||||||||||||||||||||||||||
| Avaya Holdings Corp. Year Ended September 30, 2010 | NES Period from October 1, 2009 through December 18, 2009 | Historical | Debt Refinancing Pro Forma Adjustments (Note 3) | IPO Pro Forma Adjustments (Note 2) | Pro Forma | |||||||||||||||||||||||||||||||||||||||||
| (in millions, except per share amounts) | (in millions, except per share amounts) | |||||||||||||||||||||||||||||||||||||||||||||
REVENUE | ||||||||||||||||||||||||||||||||||||||||||||||
Products | $ | 2,602 | $ | 294 | $ | — | $ | — | $ | — | $ | $ | 1,160 | $ | — | $ | — | $ | ||||||||||||||||||||||||||||
Services | 2,458 | 122 | — | — | — | 1,198 | — | — | ||||||||||||||||||||||||||||||||||||||
|
|
|
| |||||||||||||||||||||||||||||||||||||||||||
| 5,060 | 416 | — | — | — | 2,358 | — | — | |||||||||||||||||||||||||||||||||||||||
|
|
|
| |||||||||||||||||||||||||||||||||||||||||||
COSTS | ||||||||||||||||||||||||||||||||||||||||||||||
Products: | ||||||||||||||||||||||||||||||||||||||||||||||
Costs (exclusive of amortization of intangibles) | 1,243 | 179 | (4 | ) | (b) | — | — | 497 | — | — | ||||||||||||||||||||||||||||||||||||
Amortization of technology intangible assets | 291 | 2 | 9 | (a) | — | — | 36 | — | — | |||||||||||||||||||||||||||||||||||||
Services | 1,354 | 96 | — | — | — | 573 | — | — | ||||||||||||||||||||||||||||||||||||||
|
|
|
| |||||||||||||||||||||||||||||||||||||||||||
| 2,888 | 277 | 5 | — | — | 1,106 | — | — | |||||||||||||||||||||||||||||||||||||||
|
|
|
| |||||||||||||||||||||||||||||||||||||||||||
GROSS MARGIN | 2,172 | 139 | (5 | ) | — | — | 1,252 | — | — | |||||||||||||||||||||||||||||||||||||
|
|
|
| |||||||||||||||||||||||||||||||||||||||||||
OPERATING EXPENSES | ||||||||||||||||||||||||||||||||||||||||||||||
Selling, general and administrative | 1,721 | 156 | (3 | ) | (b) | — | — | (j) | 765 | — | — | (g),(i) | ||||||||||||||||||||||||||||||||||
Research and development | 407 | 64 | (1 | ) | (b) | — | — | 231 | — | — | ||||||||||||||||||||||||||||||||||||
Amortization of intangible assets | 218 | 4 | 1 | (a) | — | — | 114 | — | — | |||||||||||||||||||||||||||||||||||||
Impairment of long-lived assets | 16 | — | — | — | — | |||||||||||||||||||||||||||||||||||||||||
Restructuring charges, net | 171 | — | — | — | — | |||||||||||||||||||||||||||||||||||||||||
Acquisition-related costs | 20 | — | (20 | ) | (c) | — | — | |||||||||||||||||||||||||||||||||||||||
Other operating expense, net | — | 3 | — | — | — | |||||||||||||||||||||||||||||||||||||||||
Goodwill impairment | 89 | — | — | |||||||||||||||||||||||||||||||||||||||||||
Restructuring and impairment charges, net | 102 | — | — | |||||||||||||||||||||||||||||||||||||||||||
|
|
|
| |||||||||||||||||||||||||||||||||||||||||||
TOTAL OPERATING EXPENSES | 2,553 | 227 | (23 | ) | — | — | 1,301 | — | — | |||||||||||||||||||||||||||||||||||||
|
|
|
| |||||||||||||||||||||||||||||||||||||||||||
OPERATING LOSS | (381 | ) | (88 | ) | 18 | — | — | (49 | ) | — | — | |||||||||||||||||||||||||||||||||||
Interest expense | (487 | ) | — | (32 | ) | (d) | 43 | — | (i) | (224 | ) | — | — | (f) | ||||||||||||||||||||||||||||||||
Loss on extinguishment of debt | (6 | ) | — | — | ||||||||||||||||||||||||||||||||||||||||||
Other income, net | 15 | — | — | — | — | 4 | — | — | ||||||||||||||||||||||||||||||||||||||
|
|
|
| |||||||||||||||||||||||||||||||||||||||||||
LOSS BEFORE REORGANIZATION ITEMS AND INCOME TAXES | (853 | ) | (88 | ) | (14 | ) | 43 | — | ||||||||||||||||||||||||||||||||||||||
Reorganization items | — | 9 | — | — | — | |||||||||||||||||||||||||||||||||||||||||
LOSS BEFORE INCOME TAXES | (853 | ) | (79 | ) | (14 | ) | 43 | — | (275 | ) | — | — | ||||||||||||||||||||||||||||||||||
Provision for income taxes | 18 | — | — | — | — | |||||||||||||||||||||||||||||||||||||||||
Benefit from income taxes | 6 | — | — | |||||||||||||||||||||||||||||||||||||||||||
|
|
|
| |||||||||||||||||||||||||||||||||||||||||||
NET LOSS | (871 | ) | (79 | ) | (14 | ) | 43 | — | (269 | ) | — | — | ||||||||||||||||||||||||||||||||||
Less net income attributable to non-controlling interests | 3 | — | — | — | — | |||||||||||||||||||||||||||||||||||||||||
NET LOSS ATTRIBUTABLE TO AVAYA HOLDINGS CORP. | (874 | ) | (79 | ) | (14 | ) | 43 | — | ||||||||||||||||||||||||||||||||||||||
Less: Accretion and accrued dividends on Series A preferred stock | (62 | ) | — | — | (k) | |||||||||||||||||||||||||||||||||||||||||
Less: Accretion and accrued dividends on Series A and Series B preferred stock | (21 | ) | — | — | (h) | |||||||||||||||||||||||||||||||||||||||||
|
|
|
| |||||||||||||||||||||||||||||||||||||||||||
NET LOSS ATTRIBUTABLE TO AVAYA HOLDINGS CORP. COMMON STOCKHOLDERS | $ | (936 | ) | $ | (79 | ) | $ | (14 | ) | $ | 43 | $ | — | $ | $ | (290 | ) | $ | — | $ | — | $ | ||||||||||||||||||||||||
|
|
|
| |||||||||||||||||||||||||||||||||||||||||||
SHARE DATA: | ||||||||||||||||||||||||||||||||||||||||||||||
Net loss per share attributable to common stockholders | $ | (1.92 | ) | $ | $ | (0.59 | ) | $ | ||||||||||||||||||||||||||||||||||||||
|
| |||||||||||||||||||||||||||||||||||||||||||||
Weighted average basic and diluted shares outstanding | 488.6 | 489.3 | ||||||||||||||||||||||||||||||||||||||||||||
|
| |||||||||||||||||||||||||||||||||||||||||||||
See accompanying notes to unaudited pro forma combined financial statements.
Avaya Holdings Corp.
Unaudited Pro Forma Combined Statement of Operations
Six MonthsYear Ended March 31, 2011September 30, 2012
| Historical Avaya Holdings Corp. | Debt Refinancing Pro Forma Adjustments (Note 3) | IPO Pro Forma Adjustments (Note 4) | Pro Forma Combined | |||||||||||||||||
| (in millions, except per share amounts) | ||||||||||||||||||||
REVENUE | ||||||||||||||||||||
Products | $ | 1,479 | $ | — | $ | — | $ | |||||||||||||
Services | 1,277 | — | — | |||||||||||||||||
| 2,756 | — | — | ||||||||||||||||||
COSTS | ||||||||||||||||||||
Products: | ||||||||||||||||||||
Costs (exclusive of amortization of intangibles) | 675 | — | — | |||||||||||||||||
Amortization of technology intangible assets | 133 | — | — | |||||||||||||||||
Services | 687 | — | — | |||||||||||||||||
| 1,495 | — | — | ||||||||||||||||||
GROSS MARGIN | 1,261 | — | — | |||||||||||||||||
OPERATING EXPENSES | ||||||||||||||||||||
Selling, general and administrative | 931 | — | — | (m | ) | |||||||||||||||
Research and development | 236 | — | — | |||||||||||||||||
Amortization of intangible assets | 112 | — | — | |||||||||||||||||
Restructuring charges, net | 64 | — | — | |||||||||||||||||
Acquisition-related costs | 4 | — | — | |||||||||||||||||
TOTAL OPERATING EXPENSES | 1,347 | — | — | |||||||||||||||||
OPERATING LOSS | (86 | ) | — | — | ||||||||||||||||
Interest expense | (240 | ) | 17 | — | (l) | |||||||||||||||
Loss on extinguishment of debt | (246 | ) | ||||||||||||||||||
Other income, net | 1 | — | — | |||||||||||||||||
LOSS BEFORE INCOME TAXES | (571 | ) | 17 | — | ||||||||||||||||
Provision for income taxes | 41 | — | — | |||||||||||||||||
NET LOSS | (612 | ) | 17 | — | ||||||||||||||||
Less: Accrued dividends on Series A preferred stock | (3 | ) | — | — | (n) | |||||||||||||||
NET LOSS ATTRIBUTABLE TO AVAYA HOLDINGS CORP. COMMON STOCKHOLDERS | $ | (615 | ) | $ | 17 | $ | — | $ | ||||||||||||
SHARE DATA: | ||||||||||||||||||||
Net loss per share attributable to common stockholders | $ | (1.26 | ) | $ | ||||||||||||||||
Weighted average basic and diluted shares outstanding | 488.9 | |||||||||||||||||||
| Historical | Debt Refinancing Pro Forma Adjustments (Note 3) | IPO Pro Forma Adjustments (Note 2) | Pro Forma | |||||||||||||||
| (in millions, except per share amounts) | ||||||||||||||||||
REVENUE | ||||||||||||||||||
Products | $ | 2,672 | $ | — | $ | — | $ | |||||||||||
Services | 2,499 | — | — | |||||||||||||||
| 5,171 | — | — | ||||||||||||||||
COSTS | ||||||||||||||||||
Products: | ||||||||||||||||||
Costs (exclusive of amortization of intangibles) | 1,145 | — | — | |||||||||||||||
Amortization of technology intangible assets | 192 | — | — | |||||||||||||||
Services | 1,248 | — | — | |||||||||||||||
| 2,585 | — | — | ||||||||||||||||
GROSS MARGIN | 2,586 | — | — | |||||||||||||||
OPERATING EXPENSES | ||||||||||||||||||
Selling, general and administrative | 1,630 | — | — | (k),(m) | ||||||||||||||
Research and development | 464 | — | — | |||||||||||||||
Amortization of intangible assets | 226 | — | — | |||||||||||||||
Restructuring and impairment charges, net | 147 | — | — | |||||||||||||||
Acquisition-related costs | 4 | — | — | |||||||||||||||
TOTAL OPERATING EXPENSES | 2,471 | — | — | |||||||||||||||
OPERATING INCOME | 115 | — | — | |||||||||||||||
Interest expense | (432 | ) | — | — | (j) | |||||||||||||
Loss on extinguishment of debt | — | — | — | |||||||||||||||
Other expense, net | (29 | ) | — | — | ||||||||||||||
LOSS BEFORE INCOME TAXES | (346 | ) | — | — | ||||||||||||||
Provision for income taxes | (8 | ) | — | — | ||||||||||||||
NET LOSS | (354 | ) | — | — | ||||||||||||||
Less: Accretion and accrued dividends on Series A and Series B preferred stock | (71 | ) | — | — | (l) | |||||||||||||
NET LOSS ATTRIBUTABLE TO AVAYA HOLDINGS CORP. COMMON STOCKHOLDERS | $ | (425 | ) | $ | — | $ | — | $ | ||||||||||
SHARE DATA: | ||||||||||||||||||
Net loss per share attributable to common stockholders | $ | (0.87 | ) | $ | ||||||||||||||
Weighted average basic and diluted shares outstanding | 489.6 | |||||||||||||||||
See accompanying notes to unaudited pro forma combined financial statements.
NOTES TO UNAUDITED PRO FORMA COMBINED FINANCIAL STATEMENTS
NOTE 1: BASIS OF PRESENTATION
The unaudited pro forma combined financial statements include the following for all applicable periods:
The historical consolidated financial statementsConsolidated Financial Statements of Avaya Holdings Corp.
The historical consolidated financial statements of NES which was acquired on December 18, 2009 and therefore not included in the consolidated operating results of Avaya during the period October 1, 2009 through December 18, 2009. On January 4, 2009, Nortel initiated creditor protection proceedings under the respective restructuring regimes of Canada, the U.S. and the United Kingdom. The historical consolidated statement of operations of NES for the period from October 1, 2009 through December 18, 2009 includes $9 million of reorganization items. Reorganization items represent the direct and incremental costs incurred during the period related to the creditor protection proceedings such as revenues, expenses such as professional fees directly related to the process of reorganizing the debtors, realized gains and losses and provisions for losses resulting from the reorganization and restructuring of the business.
Acquisition pro forma adjustments which give effect to an increase in certain expenses that occurred as a direct result of the acquisition of NES and have not been included in the historical consolidated financial statements of Avaya Holdings Corp. or NES such as amortization expense associated with the stepped-up value of intangible assets and additional interest expense associated with financing of the acquisition of NES for the periods October 1, 2009 through December 18, 2009. The acquisition pro forma adjustments also give effect to the elimination of certain non-recurring charges which occurred as a direct result of the acquisition of NES such as acquisition-related costs.
Debt refinancing pro forma adjustments related to interest expense which give effect to the refinancing of certain Company debt that took place on February 11, 2011during the six months ended March 31, 2013 as if itthey had occurred on October 1, 2009.2011.
Initial public offering pro forma adjustments which give effect to the sale of the number of shares set forth on the cover of this prospectus at an assumed initial public offering price of $ , which is the midpoint of the range listed on the cover of this prospectus and the use of the proceeds as set forth under “Use of Proceeds” as if the initial public offering had occurred on October 1, 2009 for purposes of the unaudited pro forma combined statements of operations and on March 31, 2011 for purposes of the unaudited pro forma combined balance sheet.
As more fully discussed in the notes to Avaya Holdings Corp.’s consolidated financial statements appearing elsewhere in this prospectus,statement of operations and on December 18, 2009 Avaya Inc. acquired NES for $933 million in cash consideration. In connection with this transaction, Avaya Inc. acquired certain assets and assumed certain liabilities associated with NES, including all of the shares of Nortel Government Solutions Incorporated. The acquisition of NES was accounted for in accordance with Financial Accounting Standards Board, or FASB, Accounting Standards Codification, or ASC, Topic 805 “Business Combinations,” or ASC 805, which requires an allocation of the purchase price of the acquired entity to the assets acquired and liabilities assumed based on their estimated fair values at the date of acquisition.
As more fully discussed in the notes to Avaya Holdings Corp.’s consolidated financial statements appearing elsewhere in this prospectus, on February 11, 2011 the Company amended and restated its senior secured credit facility to reflect modifications to certain provisions thereof and repaid $988 million par value of senior secured incremental term B-2 loans with the proceeds from a private placement of $1,009 million of senior secured notes.
The most significant modifications to the senior secured credit facility include an amendment that permitted Avaya Inc. to effect a refinancing (see below) in which the maturity of a portion of the senior secured term B-1 loans, or term B-1 loans, representing outstanding par value of $2.2 billion was extended from October 26, 2014 to October 26, 2017 by converting such loans into a new tranche of senior secured B-3 loans, or term B-3 loans,
and changing the applicable interest rate for the new tranche of term B-3 loans. The term B-1 loans, as well as the new tranche of term B-3 loans bear interest at a rate per annum equal to either a base rate or a LIBOR rate, in each case plus an applicable margin. However, the applicable margin for borrowings of term B-3 loans is 3.50% per annum with respect to base rate borrowings and 4.50% per annum with respect to LIBOR borrowings as compared to the applicable margin for borrowings of term B-1 loans, which is 1.75% per annum with respect to base rate borrowings and 2.75% per annum with respect to LIBOR borrowings. The amendment and restatement of the senior secured credit facility represents a debt modification for accounting purposes. As a result of the amendment and restatement of the senior secured credit facility, the Company incurred third-party expenses of $9 million, which were expensed as incurred and included in other income, net for the six months ended March 31, 2011. Although2013 for purposes of the unaudited pro forma combined statement of operations for the six months ended March 31, 2011 reflects the amendment and restatement as if it had occurred on October 1, 2009, such third-party expenses have not been eliminated and are included in the unaudited pro forma combined statement of operations.balance sheet.
On February 11, 2011, we completed a private placement of $1,009 million of senior secured notes, which bear interest at a rate of 7% per annum and mature on April 1, 2019. The proceeds of the private placement were used to repay in full the senior secured incremental term B-2 loans outstanding under Avaya Inc.’s senior secured credit facility (representing $988 million par value and $12 million in accrued and unpaid interest through February 11, 2011), which was incurred to effect the acquisition of NES and to pay related fees and expenses. The issuance of the senior secured notes and repayment of the incremental term B-2 loans was accounted for as an extinguishment of the incremental term B-2 loans and issuance of new debt. Accordingly, the Company recognized a loss on extinguishment of debt of $246 million based on the difference between the reacquisition price and the carrying value of the incremental term B-2 loans (including unamortized debt discount and debt issue costs) for the six months ended March 31, 2011. Although the unaudited pro forma combined statement of operations for the six months ended March 31, 2011 reflects the issuance of the $1,009 million of senior secured notes and the repayment of the incremental term B-2 loans as if they had occurred on October 1, 2009, the loss on extinguishment of debt has not been eliminated and is included in the unaudited pro forma combined statement of operations.
As more fully discussed under “Use of Proceeds,” the Company estimates that it will receive net proceeds of approximately $ million from the sale of the number of shares set forth on the cover of this prospectus at an assumed initial public offering price of $ , which is the midpoint of the range listed on the cover of this prospectus, after deducting the underwriting discounts and commissions and estimated offering expenses payable by the Company. The Company intends to use the net proceeds received in connection with this offering to redeem all outstanding shares of Series A Preferred Stock for $ million, including accretion and accrued unpaid dividends of $ million, repay $ million of our long-term indebtedness, and to pay $ million in connection with the termination of the management services agreement with affiliates of our Sponsors. Under the terms of the Management Services Agreement, the agreement will terminate upon an initial public offering, and, upon such termination the one-time success fee referenced in the preceding sentence is due.
NOTE 2: ACQUISITION PRO FORMA ADJUSTMENTS
The unaudited pro forma combined financial statements reflect the pro forma adjustments of the acquisition of NES and the related financing. The tax effects of these pro forma adjustments are not material to the unaudited pro forma combined financial statements as a result of the valuation allowance established against the Company’s U.S. deferred tax assets.
The pro forma adjustments included in the unaudited pro forma combined financial statements related to the acquisition of NES and associated financing for the year ended September 30, 2010 are as follows:
(a)Amortization of intangible assets—The pro forma adjustment of $10 million has been provided to amortize the intangible assets acquired for the period of October 1, 2009 through December 18, 2009 not included in the historical consolidated financial statements of Avaya Holdings Corp. The pro forma adjustment to
amortization reflects the additional expense associated with the stepped-up value of these assets and the stated useful lives of the assets as of October 1, 2009, offset by the historical amortization expense recorded by NES.
| Amortization of Assets Acquired | Less Nortel Historical Amortization | Pro Forma Amortization Adjustment | ||||||||||
(in millions) | ||||||||||||
Cost: Products—Amortization of technology intangible assets | $ | 11 | $ | 2 | $ | 9 | ||||||
Operating Expenses: Amortization of intangible assets | 5 | 4 | 1 | |||||||||
Pro forma amortization | $ | 16 | $ | 6 | $ | 10 | ||||||
(b)Depreciation of property, plant and equipment—The pro forma adjustment of $(8) million has been recorded to remove the historical depreciation recorded by NES and reflect the depreciation expense resulting from acquisition accounting as if it were recorded as of October 1, 2009.
| Depreciation of Assets Acquired | Less Nortel Historical Depreciation | Pro Forma Depreciation Adjustment | ||||||||||
(in millions) | ||||||||||||
Costs: Products | $ | 2 | $ | 6 | $ | (4 | ) | |||||
Selling, general and administrative | 2 | 5 | (3 | ) | ||||||||
Research and development | — | 1 | (1 | ) | ||||||||
Pro forma depreciation | $ | 4 | $ | 12 | $ | (8 | ) | |||||
(c) Acquisition-related costs—Certain costs and expenses reflected in Avaya Holdings Corp.’s historical consolidated financial statements for the year ended September 30, 2010 of $20 million are directly related to the acquisition of NES and are non-recurring in nature. Therefore, they have been eliminated from the unaudited pro forma combined statement of operations. These costs include legal and other third-party costs incurred in connection with the acquisition of NES.
(d)Interest expense—The $32 million pro forma adjustment to interest expense for the year ended September 30, 2010 reflects pro forma interest expense assuming the issuance of the incremental term B-2 loans under Avaya Inc.’s senior secured credit facility on October 1, 2009. The pro forma interest expense adjustment is as follows:
| Interest Expense | ||||
| (in millions) | ||||
Additional cash interest(1) | $ | 23 | ||
Accretion of debt discount(2) | 9 | |||
Amortization of debt issuance costs(3) | — | |||
Pro forma interest expense | $ | 32 | ||
|
|
NOTE 3: DEBT REFINANCING PRO FORMA ADJUSTMENTS
The unaudited pro forma combined financial statements reflect the pro forma adjustments of the refinancing of certain Company debt that took place on February 11, 2011, as fully discussed in the notes to Avaya Holding Corp.’s consolidated financial statements included elsewhere in this prospectus. The tax effects of these pro forma adjustments are not material to the unaudited pro forma combined statement of operations as a result of the valuation allowance established against the Company’s U.S. deferred tax assets.
The pro forma adjustment included in the unaudited pro forma combined statement of operations for the year ended September 30, 2010 related to the refinancing of certain Company debt eliminates interest expense recognized on the incremental term B-2 loans and the portion of the term B-1 loans that were converted into a new tranche of term B-3 loans and increases interest expense for interest associated with the new tranche of term B-3 loans and the $1,009 million of senior secured notes as if the refinancing had occurred on October 1, 2009. The debt refinancing pro forma adjustment was determined as follows:
| Historical Avaya Holdings. Corp | Acquisition Pro Forma Adjustments | Pro Forma Interest Expense | Debt Refinancing Pro Forma Adjustments | |||||||||||||
(in millions) | ||||||||||||||||
Interest expense on term B-1 loans(1) | $ | 78 | $ | — | $ | — | $ | (78 | ) | |||||||
Cash interest expense on term B-3 loans(2) | — | — | 105 | 105 | ||||||||||||
Amortization of debt issuance costs on term B-3 loans(3) | — | — | 4 | 4 | ||||||||||||
Accretion of debt discount on term B-3 loans(4) | — | — | 1 | 1 | ||||||||||||
Interest expense on incremental term B-2 loans(5) | 117 | 32 | — | (149 | ) | |||||||||||
Cash interest expense on $1,009 senior secured notes(6) | — | — | 71 | 71 | ||||||||||||
Amortization of debt issuance costs on $1,009 senior secured notes(7) | — | — | 3 | 3 | ||||||||||||
Total pro forma interest expense adjustment | $ | 195 | $ | 32 | $ | 184 | $ | (43 | ) | |||||||
The pro forma adjustment included in the unaudited pro forma combined statement of operations for the six months ended March 31, 2011 related to the refinancing of certain Company debt eliminates interest expense recognized on the incremental term B-2 loans and the portion of the term B-1 loans that were converted into a new tranche of term B-3 loans and increases interest expense for interest associated with the new tranche of term B-3 loans and the $1,009 million of senior secured notes as if the refinancing had occurred on October 1, 2009. The debt refinancing pro forma adjustment was determined as follows:
| Historical Avaya Holdings. Corp | Pro Forma Interest Expense | Debt Refinancing Pro Forma Adjustments | ||||||||||
| (in millions) | ||||||||||||
Interest expense on term B-1 loans(8) | $ | 28 | $ | — | $ | (28 | ) | |||||
Cash interest expense on term B-3 loans(9) | 14 | 52 | 38 | |||||||||
Amortization of debt issuance costs on term B-3 loans(10) | 1 | 2 | 1 | |||||||||
Accretion of debt discount on term B-3 loans(11) | — | 1 | 1 | |||||||||
Interest expense on incremental term B-2 loans(12) | 55 | — | (55 | ) | ||||||||
Cash interest expense on $1,009 senior secured notes(13) | 10 | 35 | 25 | |||||||||
Amortization of debt issuance costs on $1,009 senior secured notes(14) | — | 1 | 1 | |||||||||
Total pro forma interest expense adjustment | $ | 108 | $ | 91 | $ | (17 | ) | |||||
NOTE 4: INITIAL PUBLIC OFFERING PRO FORMA ADJUSTMENTS
The unaudited pro forma combined financial statements reflect the pro forma adjustments of the sale of the number of shares set forth on the cover of this prospectus at an assumed initial public offering price of $ , which is the midpoint of the range listed on the cover of this prospectus and the use of the proceeds as set forth under “Use of Proceeds.” The tax effects of these pro forma adjustments are not material to the unaudited pro forma combined statement of operations as a result of the valuation allowance established against the Company’s U.S. deferred tax assets.
ADJUSTMENTS TO UNAUDITED PRO FORMA COMBINED BALANCE SHEET
The pro forma adjustments included in the unaudited pro forma combined balance sheet as of March 31, 20112013 related to the sale of the number of shares set forth on the cover of this prospectus at an assumed initial public offering price of $ , which is the midpoint of the range listed on the cover of this prospectus and the use of the proceeds as set forth under “Use of Proceeds” are as follows:
| Pro Forma Adjustments | ||||||||||||||||||||
| Sale of Shares | Redemption of Series A Preferred Stock (b) | Repayment of debt (c) | Payment of Monitoring Fee (d) | Net Adjustments | ||||||||||||||||
Increases / (Decreases) in | (in millions) | |||||||||||||||||||
Cash and cash equivalents | ||||||||||||||||||||
Other current assets | ||||||||||||||||||||
Other assets | ||||||||||||||||||||
Debt maturing within one year | ||||||||||||||||||||
Long-term debt | ||||||||||||||||||||
Preferred Stock: Series A | ||||||||||||||||||||
Stockholders’ deficiency | ||||||||||||||||||||
| ||||||||||||||||||||
(e)(a)Sale of Shares—As more fully discussed under “Use of Proceeds,” the Company estimates that it will receive net proceeds of approximately $ million from the sale of the common stock offered in this offering, after deducting the underwriting discounts and commissions and estimated offering expenses payable by the Company. These proceeds assume that the underwriters do not exercise their option to purchase additional shares.
(f)(b)Redemption of Series A Preferred Stock—The Company intends to use the net proceeds received in connection with this offering in part to redeem all outstanding shares of Series A Preferred Stock for $ million, including accrued unpaid dividends of $ million.
(g)(c)Repayment of debt—debt—The Company intends to use the net proceeds received in connection with this offering in part to repay $ million of Avaya Inc.’s long-term indebtedness.
(h)(d)Payment of Monitoring Fee—The Company intends to use the net proceeds received in connection with this offering in part to pay $ million in connection with the termination of the management services agreement with affiliates of our Sponsors pursuant to its terms.
(e)Compensation expense—The pro forma adjustment of $ million has been provided to give effect to $ million of stock-based compensation expense associated with market-based “multiple-of-money” options granted by the Company and $ million of compensation expense relative to cash awards granted by the Company under the Long-Term Incentive Cash Bonus Plan, which will be recognized upon completion of this offering.
ADJUSTMENTS TO UNAUDITED PRO FORMA COMBINED STATEMENTS OF OPERATIONS
The pro forma adjustments included in the unaudited pro forma combined statement of operations for the yearsix months ended September 30, 2010March 31, 2013 related to the sale of the common stock offered in this offering and the use of the proceeds thereof are as follows:
(i)(f)Interest expense—expense—The pro forma adjustment of $ million has been provided to eliminate a portion of the interest expense associated with certain long-term indebtedness reflected in the historical consolidated financial statementsConsolidated Financial Statements of Avaya Holdings Corp. for the yearsix months ended September 30, 2010.March 31, 2013. The Company intends to use the net proceeds received in connection with this offering in part to repay $ million of Avaya Inc.’s long-term indebtedness.
(j)(g)Selling, general and administrative expense—The pro forma adjustment of $ million has been provided to eliminate the annual monitoring fee payable under the management services agreement with affiliates of our Sponsors reflected in the historical consolidated financial statementsConsolidated Financial Statements of Avaya Holdings Corp. for the year
six months ended September 30, 2010.March 31, 2013. Under the terms of the management services agreement, the agreement will terminate upon consummation of this offering and the Company is required to pay a success fee of $ to affiliates of our Sponsors.
(k)(h)Accretion and dividendsDividends on Series A Preferred Stock—Stock—The pro forma adjustment of $ has been provided to eliminate accretion and accrued dividends on the Company’s Series A Preferred Stock for the yearsix months ended September 30, 2010.March 31, 2013. The Company intends to use the net proceeds received in connection with this offering in part to redeem all outstanding shares of its Series A Preferred Stock for $ million, including accrued unpaid dividends of $ million.
(i)Compensation expense—The pro forma adjustment of $ million reflects $ million of stock-based compensation expense associated with market-based “multiple-of-money” options granted by the Company and $ million of compensation expense relative to cash awards granted by the Company under the Long-Term Incentive Cash Bonus Plan for the six months ended March 31, 2013 as if the sale of the common stock as contemplated in this offering had occurred on October 1, 2011.
The pro forma adjustments included in the unaudited pro forma combined statement of operations for the six monthsyear ended March 31, 2011September 30, 2012 related to the sale of the common stock offered in this offering and the use of the proceeds thereof are as follows:
(l)(j)Interest expense—expense—The pro forma adjustment of $ million has been provided to eliminate a portion of the interest expense associated with certain long-term indebtedness reflected in the historical consolidated financial statementsConsolidated Financial Statements of Avaya Holdings Corp. for the six monthsyear ended MarchSeptember 31, 2011.2012. The Company intends to use the net proceeds received in connection with this offering in part to repay $ million of Avaya Inc.’s long-term indebtedness.
(m)(k)Selling, general and administrative expense—expense—The pro forma adjustment of $ million has been provided to eliminate the annual monitoring fee payable under the management services agreement with affiliates of our Sponsors reflected in the historical consolidated financial statementsConsolidated Financial Statements of Avaya Holdings Corp. for the six monthsyear ended MarchSeptember 31, 2011.2012. Under the terms of the management services agreement, the agreement will terminate upon consummation of this offering and the Company is required to pay a success fee of $ to affiliates of our Sponsors.
(n)(l)Dividends on Series A Preferred Stock—Stock—The pro forma adjustment of $ has been provided to eliminate accrued dividends that were accrued on the Company’s Series A Preferred Stock for the six monthsyear ended MarchSeptember 31, 2011.2012. The Company intends to use the net proceeds received in connection with this offering in part to redeem all outstanding shares of its Series A Preferred Stock for $ million, including accrued unpaid dividends of $ million.
(m)Compensation expense—The pro forma adjustment of $ million reflects $ million of stock-based compensation expense associated with market-based “multiple-of-money” options granted by the Company and $ million of compensation expense relative to cash awards granted by the Company under the Long-Term Incentive Cash Bonus Plan for the year ended September 31, 2012 as if the sale of the common stock as contemplated in this offering had occurred on October 1, 2011.
NOTE 3: DEBT REFINANCING PRO FORMA ADJUSTMENTS
Debt refinancing pro forma adjustments related to interest expense for the six months ended March 31, 2013 and fiscal 2012 give effect to the refinancing of certain debt that took place during the six months ended March 31, 2013 as if the financing had occurred on October 1, 2011. Such pro forma adjustments include:
the elimination of interest expense recognized on the senior secured term B-1 loans outstanding under the senior secured credit facility, and the portion of the senior unsecured cash-pay notes and senior unsecured paid-in-kind toggle notes that were refinanced, and
an increase in interest expense associated with the new senior secured term B-4 loans, senior secured term B-5 loans, 9% Senior Secured Notes and 10.50% Senior Secured Notes.
MANAGEMENT’S DISCUSSION AND ANALYSIS OF
FINANCIAL CONDITION AND RESULTS OF OPERATIONS
The following is a discussion and analysis of our financial condition and results of operations for each of the six months ended March 31, 2011 and 2010 and each of the three fiscal years ended September 30, 2012, 2011 and 2010 2009, and 2008.the six month periods ended March 31, 2013 and 2012. You should read this discussion and analysis together with our consolidated financial statementsConsolidated Financial Statements and related notes and the other financial information included elsewhere in this prospectus. This discussion contains forward-looking statements that involve significant risks and uncertainties. As a result of many factors, such as those set forth under “Risk Factors” and elsewhere in this prospectus, our actual results may differ materially from those anticipated in these forward-looking statements.
When we use the terms “we,” “us,” “our,” “Avaya” or the “Company,” we mean Avaya Holdings Corp., a Delaware corporation, and its consolidated subsidiaries, including Avaya Inc., our principal U.S. operating subsidiary, taken as a whole, unless the context otherwise indicates.
Overview
We are a leading global provider of next-generationreal-time business collaboration and communications solutions that bring people together with the right information at the right time in the right context, enabling business usersbusinesses to improve their efficiency and quickly solve critical business challenges more quickly.challenges. Our highly intuitive and personalized user experience enablessolutions are designed to enable business users to collaborate seamlessly across various modes of communication, including real-time voice, video, instant messagingwork together more effectively internally and conferencing,with their customers and non real-time email, voicemailsuppliers, to accelerate decision-making and social networking. Our open SIP-based collaboration platform isachieve business outcomes. These industry leading solutions are also designed to facilitate the developmentbe flexible, reliable and rollout ofsecure, enabling simplified management and cost reduction while providing a platform for next-generation business collaboration tools within our customers’ existing IT infrastructure, reducing the cost of implementing our solution. We have established ourselves as a leader in the business collaboration market in part due to our long-standing heritage of delivering mission critical unified communications, contact center and voice communications solutions.from Avaya.
Our solutions address the needs of a diverse range of customers, including large multinational enterprises, small- and medium-sized businesses and government organizations. As of March 31, 2011,September 30, 2012, we had over 400,000300,000 customers, including more than 85%95% of the Fortune 500 companies and installations in over one million customer locations worldwide. Our customers operate in a broad range of industries, including financial services, manufacturing, retail, transportation, energy, media and communications, health care, education and government.
We sell solutions directlyemploy a flexible go-to-market strategy with direct and through our channel partners.indirect presence in over 170 countries. As of March 31, 2011,2013, we had approximately 9,90010,800 channel partners worldwide, including system integrators, service providers, value-added resellers and business partners that providefor fiscal 2012, our productrevenue from indirect sales and service support.
For the twelve months ended September 30, 2010 and the six months ended March 31, 2011, we had total revenue of $5,060 million and $2,756 million, respectively. For the twelve months ended September 30, 2010, product revenue represented 51%approximately 75% of our total revenue and services revenue represented 49%. product revenue.
For the six months ended March 31, 2013 and for fiscal 2012 and 2011, we generated revenue of $2,358 million, $5,171 million, and $5,547 million, respectively. For the six months ended March 31, 2013 and for fiscal 2012 and 2011, product revenue represented 49%, 52%, and 54% of our total revenue and services revenue represented 51%, 48%, and 46%., respectively. For the twelve months ended September 30, 2010, approximately 55% of our revenue was generated in the United States. For the twelve months ended September 30, 2010 and the six months ended March 31, 2013 and for fiscal 2012 and 2011, revenue generated in the United States was 54%. For the six months ended March 31, 2013 and for fiscal 2012 and 2011 we had a net loss of $871$269 million, $354 million, and $612$863 million, respectively, and Adjusted EBITDA of $795$423 million, $971 million and $442$971 million, respectively. See “Non-GAAP Financial Measures and Supplemental Disclosure—EBITDA and Adjusted EBITDA” for a definition and explanation of Adjusted EBITDA and a reconciliation of net loss to Adjusted EBITDA.
History
We have a long history of innovation dating back to our research and development roots in Bell Laboratories when we were a part of AT&T. Avaya was formerly the Business Communications business unit of Lucent, a 1996 spin-off from AT&T. Since our own spin-off from Lucent in 2000, we have been a leading provider of unified communications, contact center solutions and more recently business collaboration solutions to our customers. Avaya Inc., our wholly owned subsidiary, operated as a public company with common stock traded on the New York Stock Exchange from October 1, 2000 until acquired by affiliates of our Sponsors on October 26, 2007. On
Business Trends
There are a number of trends and uncertainties affecting our business. For example, the effect that general economic conditions have on our customers’ willingness to spend on information technology, and particularly enterprise communications technology, impacts the demand for our products and, as a result, our revenue. The global economic downturn during 2008 through 2010 as well as the recent economic uncertainties associated with Europe negatively affected most of the markets we serve. However, despite the negative effect of these uncertainties during this period we maintained our focus on profitability levels and investing in our future results. We implemented various initiatives designed to streamline our operations, generate cost savings, and eliminate overlapping processes and expenses associated with the NES business. We invested significantly in research and development. Since the beginning of fiscal 2010 we have introduced more than 130 new offerings across our portfolio, the largest product pipeline in our history. In December 18, 2009, we acquired NES which extended our market leadership positions, enhancedin order to further expand our technology portfolio, expandedenhance our customer base, broadened and strengthenedbroaden our indirect sales channel and provide us greater ability to compete globally. In June 2012, we acquired Radvision, a global provider of videoconferencing and telepresence technologies over IP and wireless networks. The integrated Avaya and Radvision portfolios will extend intra-company business to business and business to consumer video communications, and also support internal BYOD initiatives. We believe the investments in NES, Radvision, and other acquisitions, as well as our ongoing investments in research and development are helping us to capitalize on the increasing focus of enterprises on deploying collaboration solutions in order to increase productivity, reduce costs and complexity and gain competitive advantage, which is being further accelerated by a trend toward a more mobile workforce and the associated proliferation of devices. In addition, we believe that the limitations of traditional collaboration solutions present an opportunity for differentiated vendors to gain market share.
We have also successfully expanded our indirect channel. Since fiscal 2009 and the acquisition of NES, our indirect channel has grown from 53% to 75% of our product revenues. We believe this expansion of our indirect channel favorably impacts our financial results by reducing selling expenses and allowing us to reach more end users and grow our business, although sales through the indirect channel generally generate lower profits than direct sales due to higher discounts. In furtherance of our effort to maintain an effective business partner program, we continue to refine and expand our global coverage. For example, in August 2010 we sold our 59.13% ownership interest in AGC, a publicly traded reseller of our products and services in India, which allowed us to pursue additional channel partners in India while continuing to sell through AGC.
Certain trends and uncertainties also impact our global services organization, which provides us a large recurring revenue stream. Due to advances in technology, our customers continue to expect to pay less for traditional services. In addition, despite the benefits of a robust indirect channel, our channel partners have direct contact with our customers that may foster independent relationships between them and bolstereda loss of certain services agreements for us. We have been able to offset these impacts by focusing on other types of services not traditionally provided by our competitive position.channel partners, such as professional and support or managed services.
We expect our gross profit and gross margin to continue to improve in the foreseeable future as we implement various initiatives such as increasing our focus on sales of higher margin software, securing more favorable pricing with our contract manufacturers and lower transportation costs, optimizing design of products and services productivity to drive efficiencies, executing on certain cost savings initiatives and achieving greater economies of scale. We have also redesigned the Avaya support website and are transitioning our customers from an agent-based support model to a self-service/web-based support model. These improvements have allowed us to reduce the workforce and relocate positions to lower-cost geographies and improve our services gross margins. Historically, lower profits experienced by the acquired NES business and competitor and customer pricing pressures have been challenges to improving the gross margins of our business. However, we continue to apply our business model discipline to the acquired NES business to accomplish our gross margin initiatives.
For fiscal 2012, 2011 and 2010, revenue outside of the U.S. represented 46%, 46% and 45% of total revenue, respectively. Foreign currency exchange rates and fluctuations have had an impact on our revenue, costs and cash flows from our international operations. Our primary currency exposures are to the euro, British pound,
Indian rupee, Japanese yen, Canadian dollar and Brazilian real. These exposures may change over time as business practices evolve and as the geographic mix of our business changes and we are not able to predict the impact that foreign currency fluctuations will have on future periods.
Continued Focus on Cost Structure
In connection with the Merger in fiscal 2008, Avaya’s management and board of directors developed and began implementing various plans and initiatives designed to streamline the operations of the Company and generate cost savings. Additionally, in response to the global economic downturn and in connection with its acquisitions of NES and Radvision, the Company identified and initiated cost savings programs. These cost savings programs include: (1) reducing headcount, (2) relocating certain job functions to lower cost geographies, including service delivery, customer care, research and development, human resources and finance, (3) eliminating real estate costs associated with unused or under-utilized facilities and (4) implementing gross margin improvement and other cost reduction initiatives.
Reductions in headcount included the elimination of redundancies by re-defining and consolidating job functions, reductions in management and in back-office headcount of our sales organization, reduced headcount in our services business, the use of remote monitoring of customer systems, which made our services segment more efficient, and a shift in the mix of the Company’s distribution channels toward the indirect channel which reduced our personnel needs. We were also able to attain additional salary savings as the Company placed greater emphasis on shifting job functions to its shared service centers in India and Argentina, as well as the automation of customer service.
Reductions in real estate costs were achieved by: (1) eliminating redundant facilities, particularly research and development facilities, in similar geographic areas as part of transitioning and integrating the operations of NES, (2) reductions in headcount, which decreased our real estate needs, and (3) reducing operating costs through more efficient facilities management. These initiatives enabled us to vacate and consolidate facilities without affecting the quality or distribution of our products and services, and reduce our real estate costs.
During fiscal 2011 and 2012, we were able to execute on several gross margin improvements and other cost reduction initiatives. These initiatives included obtaining better pricing from our contract manufacturers and transportation vendors. The success of these initiatives along with the reduction in headcount and real estate costs discussed above have been successful in improving our gross margin and operating margin.
In connection with the Merger, the Company rolled out initiatives to eliminate approximately 2,800 employee positions, of which 2,200 were located in the U.S. and 600 were located outside the U.S., predominantly in EMEA. In addition, the Company took action to vacate facilities in the U.S., Germany, United Kingdom and the Netherlands. The costs associated with these actions were $330 million and were recorded as a liability in purchase accounting. The liability included $251 million of costs associated with the terminated employees and $79 million of lease termination obligations, net of expected future sub-lease income, for the vacated facilities. We began realizing the costs saving benefits associated with these initiatives during the period October 27, 2007 through September 30, 2008.The headcount reductions associated with this program were completed in fiscal 2010. The cash payments associated with the headcount reductions are expected to be completed in fiscal 2018 and the cash payments associated with the lease obligations are expected to continue through fiscal 2021.
As described above, the Company initiated additional cost saving programs, which resulted in a reduction of headcount in fiscal 2009 and 2010. As a result of these actions, the Company recognized $160 million in fiscal 2009 and $171 million in fiscal 2010 of restructuring charges, net of adjustments to previous periods, which were primarily associated with involuntary employee separation actions in EMEA and the U.S. These charges included initiatives the Company implementedinthe first quarter of fiscal 2010 to eliminate overlapping process and expenses associated with the acquisition of NES and included costs associated with the closing and consolidating
utilized and under-utilized facilities primarily located in the U.S. and Germany, eliminating redundant facilities in similar geographic areas as part of transitioning and integrating the operations of NES and accounting for reductions in headcount. As part of the acquisition of NES, the Company acquired a workforce of approximately 5,900 and assumed leases in the U.S. that were redundant to existing Avaya facilities, thereby creating excess real estate capacity. The Company’s workforce at September 2008, 2009, and 2010 was approximately 17,500, 15,500 and 18,900, respectively, excluding AGC, which we sold in August 2010. In addition, the Company successfully relocated approximately 750 employee positions in fiscal 2009 and 70 employee positions in fiscal 2010 to its shared service centers in India and Argentina.
In fiscal 2011 and 2012 the Company continued to streamline operations, generate cost savings and eliminate overlapping processes and expenses. Restructuring charges, net of adjustments to previous periods, in fiscal 2011 and 2012 were $189 million and $142 million, respectively. In fiscal 2011 and 2012 the Company entered into agreements with the works council representing employees of certain of the Company’s German subsidiaries for the elimination of 210 and 327 positions, respectively. The charges associated with these agreements were $56 million and $70 million respectively and consisted of severance and employment benefit payments, including, but not limited to, social pension fund payments and healthcare and unemployment insurance costs to be paid to or on behalf of the affected employees. In addition, the Company had restructuring charges of $97 million and $53 million of other employee separation costs for fiscal 2011 and 2012, respectively, primarily related to the U.S. and EMEA exclusive of Germany. The Company also recorded charges associated with partially or totally vacated facilities of $36 million and $19 million for fiscal 2011 and 2012, respectively.
In fiscal 2013, the Company remains focused on its efforts to streamline operations, generate cost savings and eliminate overlapping processes and expenses. Restructuring charges, net of adjustments to previous periods, for the six months ended March 31, 2013 were $102 million. The Company approved a plan that provides for the elimination of 234 positions in EMEA that resulted in a charge of $47 million, of which $34 million was for the elimination of positions in Germany. The separation charges include, but are not limited to, social pension fund payments and health care and unemployment insurance costs to be paid to or on behalf of the affected employees. In addition, a voluntary program offered to certain management employees in the U.S. resulted in the elimination of 195 positions and a charge of $9 million. In April 2013, the Company initiated a voluntary severance program in the U.S. and will recognize the expense associated with this program during the quarter ending June 30, 2013. The Company is also evaluating the potential for additional employee severance actions to reduce headcount globally and could initiate these actions during the quarter ending June 30, 2013.
The Company continues to evaluate opportunities to streamline its operations and identify cost savings globally. Although a specific plan does not exist at this time, the Company may take additional restructuring actions in the future and the costs of those actions could be material. All costs associated with such actions would be recognized in accordance with authoritative accounting guidance and the Company’s accounting policies as outlined in Note 2, “Summary of Significant Accounting Policies – Restructuring Programs” to our audited Consolidated Financial Statements included elsewhere in this prospectus. See Note 8, “Business Restructuring Reserves and Programs” to our audited Consolidated Financial Statements included elsewhere in this prospectus for further details on our restructuring programs.
Refinancing of Debt Refinancing
On February 11, 2011, our wholly owned subsidiary, Avaya Inc., successfully completed a debt refinancing that deferred the maturity of $3.18$3.2 billion of senior secured loans. As part of the transaction, $2.2 billion outstanding parface value of Avaya Inc.’sthe senior secured term B-1 loans (“term B-1 loans”) was converted into a new tranche of senior secured term B-3 loans, extending the maturity of that indebtedness from October 26, 2014 to October 25, 2017, and $988 million parface value of senior secured incremental term B-2 loans was repaid with the proceeds from a private placement by Avaya Inc. of $1,009 million of senior secured notes, extending the maturity of that indebtedness from October 26, 2014 to April 1, 2019.
Key Performance Indicators
On August 8, 2011, Avaya Inc. amended the terms of the multi-currency revolvers available under its senior secured credit facility and its senior secured multi-currency asset-based revolving credit facility to extend the final maturity of each from October 26, 2013 to October 26, 2016.
Key performance indicators that we useSee Note 9, “Financing Arrangements” to manage our business and evaluate our financial results and operating performance include: Revenue, Gross Margin, Gross Margin Percentage, Adjusted EBITDA and Cash Balance. We evaluate revenue performance against the overall economic environment, the underlying growthaudited Consolidated Financial Statements included elsewhere in our core markets, changes in our competitive environment, the impact of new product launches and applications and our customers’ willingness to spend on information technology. Gross margin is primarily affected by our ability to manage costs, including obtaining volume discount pricing from our suppliers and personnel costs. Adjusted EBITDA provides us with a measure of our financial performance based on operational factors that management can impact in the short-term, namely our pricing strategies, volume, costs and expenses of the organization. Cash balance is used as an indicator of the Company’s ability to generate cash flows from operations and to evaluate management’s ability to control its accounts receivable, inventory and accounts payable balances.this prospectus for further details.
These key performance indicators as of and for the fiscal years ended September 30, 2009 and 2010 and as of and forDuring the six months ended March 31, 2011 were as follows:2013, Avaya Inc. completed a series of transactions which allowed Avaya Inc. to refinance (1) its term B-1 loans outstanding under its senior secured credit facility originally due October 26, 2014, and (2) $642 million of its 9.75% senior unsecured cash-pay notes and $742 million of its senior unsecured paid-in-kind (“PIK”) toggle notes each originally due November 1, 2015 (collectively, the “Old Notes”).
| September 30, | March 31, 2011(2) | |||||||||||
| 2009 | 2010(2) | |||||||||||
| (dollars in millions) | ||||||||||||
Revenue | $ | 4,150 | $ | 5,060 | $ | 2,756 | ||||||
Gross Margin | 1,866 | 2,172 | 1,261 | |||||||||
Gross Margin Percentage | 45 | % | 43 | % | 46 | % | ||||||
Adjusted EBITDA(1) | 753 | 795 | 442 | |||||||||
Cash Balance | 582 | 594 | 468 | |||||||||
On October 29, 2012 Avaya Inc. completed an amendment and restatement of the senior secured credit facility and senior secured multi-currency asset-based revolving credit facility along with the extension of the maturity date of $135 million aggregate principal amount of term B-1 loans from October 26, 2014 to October 26, 2017 by converting such loans into a new tranche of senior secured term B-4 loans (“term B-4 loans”). On December 21, 2012 Avaya Inc. completed an amendment and restatement of the senior secured credit facility along with the extension of the maturity date of $713 million aggregate principal amount of term B-1 loans from October 26, 2014 to October 26, 2017 and $134 million aggregate principal amount of term B-4 loans from October 26, 2017 to March 31, 2018 in each case by converting such loans into a new tranche of senior secured term B-5 loans (“term B-5 loans”). On December 21, 2012 Avaya Inc. issued $290 million of 9% senior secured notes due April 2019 (the “9% Senior Secured Notes”), the proceeds of which were used to repay $284 million principal amount of term B-5 loans and to pay related fees and expenses.
On March 7, 2013, Avaya Inc. completed an exchange offer in which $1,384 million of Old Notes were exchanged for $1,384 million of 10.50% senior secured notes due March 1, 2021. In addition, on March 12, 2013, Avaya Inc. refinanced the remaining term B-1 loans due October 26, 2014, with the cash proceeds from the issuance of $589 million aggregate principal amount of term B-5 loans due October 26, 2017 under its senior secured credit facility.
In connection with the amendments and restatements of the senior secured credit facility necessary to effectuate the transactions described above, the applicable interest rate for the portion of the term B-1 loans that were converted into term B-4 loans and term B-5 loans was also changed.
Both the 9% Senior Secured Notes and the 10.50% Senior Secured Notes have not been, and will not be, registered under the Securities Act or applicable state securities laws and may not be offered or sold absent registration under the Securities Act or applicable state securities laws or applicable exemptions from registration requirements.
See Note 7, “Financing Arrangements and Other Transactions” to our unaudited Consolidated Financial Statements included elsewhere in this prospectus for further details.
Acquisition of RADVISION Ltd.
On June 5, 2012, Avaya acquired Radvision for $230 million in cash. Radvision is a global provider of videoconferencing and telepresence technologies over internet protocol (“IP”) and wireless networks. Through this acquisition, Avaya will expand its technology portfolio and provide customers a highly integrated and interoperable suite of cost-effective, easy to use, high-definition video collaboration products, with the ability to interoperate with multiple mobile devices including Apple iPad and Google Android. See discussion in Note 4, “Business Combinations,” to our audited Consolidated Financial Statements included elsewhere in this prospectus for further details.
Financial Operations Overview
The following describes certain components of our statement of operations and considerations impacting those results.
Revenue. We derive our revenue primarily from the sale and service of business collaboration and communications systems and applications. Our product revenue includes the sale of unified communications, contact center, small and medium enterprise communications, video and data networking solutions. Product revenue accounted for 46%49%, 51%52%, 54% and 54%51% of our total revenue for fiscal years 2009 and 2010 and the six month periodmonths ended March 31, 2013, fiscal 2012, 2011 and 2010, respectively. Our services revenue includes product maintenance and support, professional services, including design and integration, and operations, or managed services.
We expect thatemploy a flexible go-to-market strategy with direct and indirect presence in over 170 countries and as of March 31, 2013, we continue to introduce new product offeringshad approximately 10,800 channel partners. For fiscal 2012, 2011 and enterprises increase their spending, we will generate more revenue from our installed base and2010 our product revenue will become a larger partfrom indirect sales represented approximately 75%, 76%, and 71% of our total revenue.
Our distribution network includes approximately 9,900 channel partners, including a global network of alliance partners, distributors, dealers, value-added resellers, telecommunications service providers and system integrators. Our indirect sales channel represented 71% of our product revenues for fiscal year 2010 and 77% of our product revenues for the six months ended March 31, 2011.revenue, respectively. Our revenue outside the United States represented 45%46%, 45%46% and 46%45% of our total revenue in fiscal years 20092012, 2011 and 2010, and the six month period ended March 31, 2011, respectively.
Because we sell our products to end-users in a wide range of industries and geographies, demand for our products is generally driven more by the level of general economic activity than by conditions in one particular industry or geographic region.
Cost of Revenue. Cost of product revenue consists primarily of hardware costs, royalties and license fees for third-party software included in our systems, personnel and related overhead costs of operation including but not limited to current engineering, freight, warranty costs, amortization of technology intangible assets and provisions for excess inventory. We outsource substantially all of our manufacturing operations to several EMS providers. Our EMS providers produce the vast majority of our products in facilities located in southern China, with other products produced in facilities located in Poland, Israel, Mexico, Malaysia, Taiwan, Ireland, Germany, Indonesia, the United Kingdom and the U.S. The majority of these costs vary with the unit volumes of product sold. We expect over time to increase the software content of our products, decrease our product costs and improve product gross margins.profits. Cost of services revenue consists of salarysalaries and related overhead costs of personnel engaged in support and services. As we continue to realize the benefit of cost saving initiatives, which include the benefit of productivity improvements from automation of customer service, reducing the workforce and relocating positions to lower cost geographies, we expect our cost of services revenue will decrease.decrease as a percentage of services revenue.
Selling, General and Administrative ExpensesExpenses.. Selling, general and administrative expenses consist primarily of costs relating to our sales and marketing activities and administrative, legal, finance functions and related overhead and other corporate expenses.
Sales and marketing expenses primarily include personnel costs, sales commissions, travel, marketing promotional and lead generation programs, trade shows, professional services fees and related overhead expenses. We plan to continue to invest in development of our distribution channels by increasing the size of our field sales force and continue to develop the capabilities of our channel partners to enable us to expand into new geographies and further increase our sales to small and medium enterprises across the world.
AdministrativeGeneral and administrative expenses consist primarily of salary and benefit costs for executive and administrative staff, the use and maintenance of administrative offices, including depreciation expense, logistics, information systems and legal, financial, human resources, and accounting services.other corporate functions. Administrative expenses generally do not increase or decrease directly with changes in sales volume.
Research and Development ExpensesExpenses.. Research and development expenses primarily include personnel costs, outside engineering costs, professional services, prototype costs, test equipment, software usage fees and related overhead expenses. Research and development expenses are recognized when incurred. The level of research and development expense is related to the number of products in development, the stage of development process, the complexity of the underlying technology, the potential scale of the product upon successful commercialization and the level of our exploratory research. We conduct such activities in areas we believe will accelerate our longer term net revenue growth.
We are devoting substantial resources to the development of additional functionality for existing products and the development of new products and related software applications. We intend to continue to make significant investments in our research and development efforts because we believe they are essential to maintaining and improving our competitive position. Accordingly, we expect research and development expenses to continue to increase.
Amortization of Intangible AssetsAssets.. As a result of the Merger, and acquisitionthe acquisitions of NES and Radvision, and other acquisitions, significant amounts were recognized in purchase accounting for the estimated fair values of customer relationships associated with the businesses acquired. The fair value of these intangible assets was estimated by independent valuations at the time of acquisition and is amortized into our operating expenses over their estimated useful lives.
Goodwill Impairment.The Company tests goodwill for impairment at the reporting unit level annually each September 30th and more frequently if events occur or circumstances change that indicate that the fair value of a reporting unit may be below its carrying value. If the fair value of a reporting unit is below its carrying value, the implied fair value of the reporting unit is compared to the carrying value of that goodwill and a loss is recognized to the extent the carrying amount of the reporting unit’s goodwill exceeds the implied fair value of the goodwill.
Restructuring Charges.and Impairment Charges, net.In response to the global economic climate, the acquisition of NES and the Company’s commitment to control costs, the Company implemented initiatives designed to streamline the operations of the Company and generate cost savings. The Company exited and consolidated facilities and terminated or relocated certain employees.job functions. The expenses associated with these actions are reflected in our operating results. As the Company continues to evaluate and identify additional operational synergies, additional cost saving opportunities may be identified and future restructuring charges may be incurred.
Interest Expense. Interest expense consists primarily of interest on indebtedness under ourAvaya Inc.’s credit facilities and on our unsecuredits notes. Interest expense also includes the amortization of deferred financing costs, the amortization of debt discount (including amortization of debt discount associated with ourAvaya Inc.’s incremental B-2 term loans that wewere refinanced in February 2011,2011), and the expense associated with interest rate derivative instruments we use to minimize our exposure to variable rate interest payments associated with ourAvaya Inc.’s debt. We regularly evaluate market conditions, our liquidity profile, and various financing alternatives for opportunities to enhance our capital structure. If market conditions are favorable, we may refinance existing debt or issue additional debt securities. Further, we intend to use a portion of the net proceeds of this offering to repay certain of our existing indebtedness and redeem our Series A Preferred Stock, which would improve our leverage ratio and our interest expense in the future should decrease.
Loss on Extinguishment of Debt.In connection with the issuance of Avaya Inc.’s senior secured notes and the payment in full of the incremental term B-2 loans, we recognized a loss on extinguishment of debt forDuring the six months ended March 31, 2013 and during fiscal 2011, the Company completed a series of $246 million. Thetransactions to extend the maturity dates of certain debt. Under GAAP, the Company was required to account for certain of these transactions as an extinguishment of debt. A loss representsrepresenting the difference between the reacquisition price of the senior secured incremental term B-2 loansoriginal debt (including consent fees paid by Avaya to the holders of the senior secured incremental term B-2 loansoriginal debt that consented to the amendment and restatement of the senior secured credit facility of $1 million)transaction) and the carrying value of the incremental term B-2 loansold debt (including unamortized debt discount and debt issue costs). was recognized. See Note 9, “Financing Arrangements,”Arrangements” to our consolidated financial statementsaudited Consolidated Financial Statements and Note 7, “Financing Arrangements” to our unaudited Consolidated Financial Statements included elsewhere in this prospectus for further details.details on such transactions.
Other (Expense) Income, net.Other (expense) income, net consists primarily of gains and losses on foreign currency transactions and forward contracts, changes in the fair value of certain features included in the Company’s Series B Convertible Preferred Stock (“preferred series B”) which are considered an embedded derivative, third party fees incurred in connection with certain debt modifications and the Company’s registration statement, interest income, and other gains and losses that are not considered part of the Company’s ongoing major or central operations.
Income Taxes.Income taxes are accounted for under the asset and liability method. Under this method, deferred tax assets and liabilities are recognized for the estimated future tax consequences attributable to differences between the financial statement carrying amounts of existing assets and liabilities and their respective tax bases, and operating loss and tax credit carryforwards. Deferred tax assets and liabilities are measured using enacted tax rates in effect for the year in which those temporary differences are expected to be recovered or settled. Our effective income tax rate differs from the U.S. Federal tax rate primarily due to (1) the effect of taxable income in certain non-U.S. jurisdictions, (2) changes in the valuation allowance established against the Company’s deferred tax assets, (3) changes to the valuation allowance associated with tax expense on net gains/losses in other comprehensive income, particularly as it relates to post-employment benefits and interest rate swaps, and (4) changes in estimates of uncertain tax positions. As of September 30, 2012, the Company changed its indefinite reinvestment of undistributed foreign earnings assertion with respect to its non-U.S. subsidiaries. As a result the Company recorded fiscal 2012 income tax expense of $17 million relating to non-U.S. income taxes. The Company continues to evaluate whether or not to indefinitely reinvest future undistributed foreign earnings.
Selected Segment Information
We conduct ourThe Company conducts its business operations in three segments. Two of those segments, Global Communications Solutions or GCS,(“GCS”) and DataAvaya Networking or Data,(“Networking”), make up Avaya’s Enterprise Collaboration Solutions (“ECS”) product portfolio. The third segment contains the Company’s services portfolio and is called Avaya Global Services or AGS, contains Avaya’s services portfolio.
In GCS, we deliver business collaboration and communications solutions primarily for IT infrastructure, unified communications, and contact center solutionssolutions. Our infrastructure and small and medium enterprise communications. Our unified communicationsUC application solutions are designed to promote collaboration, innovation, productivity and real-time decision-making by providing business users a highly intuitive and personalized user experience that enables them to collaborate seamlessly across various modes of communication, including voice, video, email, instant messaging, text messaging, web conferencing, voicemail and social networking. Our contact center application solutions are highly reliable, scalable communications-centric applications suites designed to optimize customer service. SME communications solutions are focused on enterprises with up to 250 employees and include telephony, messaging, networking, conferencing and customer management products that are designed for the requirements of SMEs and help our customers increase the productivity of their employees, deliver superior customer service and reduce costs.
Our DataNetworking segment provides a broad range of internet protocol networking infrastructure products including ethernet switches, routers and Virtual Private Network appliances, wireless networking routers, access control solutions, unified management solutions and end-to-end virtualization strategies and architectures.
Through our AGS segment we help our customers evaluate, plan, design, implement, support, manage and optimize their enterprise communications networks to help them achieve enhanced business results. Our award-winning AGS service portfolio includes product support, integration and professional and operations, or managed services that enable customers to optimize and manage their converged communications networks worldwide.
The following tabletables presents revenue and gross profit by segment for the yearsperiods indicated:
| Fiscal Year Ended September 30, 2009 | Fiscal Year Ended September 30, 2010 | Six months ended March 31, 2013 | Six months ended March 31, 2012 | |||||||||||||||||||||||||||||||||||||||||||||||||||||||||||||
| Revenues | Gross Margin | Revenues | Gross Margin | Revenues | Gross Profit | Revenues | Gross Profit | |||||||||||||||||||||||||||||||||||||||||||||||||||||||||
| Dollar Amount | Percent of Total Revenue | Dollar Amount | Percent of Revenue | Dollar Amount | Percent of Total Revenue | Dollar Amount | Percent of Revenue | Dollar Amount | Percent of Total Revenue | Dollar Amount | Percent of Revenue | Dollar Amount | Percent of Total Revenue | Dollar Amount | Percent of Revenue | |||||||||||||||||||||||||||||||||||||||||||||||||
| (dollars in millions) | (dollars in millions) | |||||||||||||||||||||||||||||||||||||||||||||||||||||||||||||||
Global Communications Solutions | $ | 1,939 | 46 | % | $ | 1,066 | 55 | % | $ | 2,327 | 46 | % | $ | 1,249 | 54 | % | $ | 1,046 | 44 | % | $ | 619 | 59 | % | $ | 1,241 | 47 | % | $ | 718 | 58 | % | ||||||||||||||||||||||||||||||||
Data Networking | — | 0 | % | — | 0 | % | 282 | 5 | % | 117 | 41 | % | ||||||||||||||||||||||||||||||||||||||||||||||||||||
Avaya Networking | 114 | 5 | % | 45 | 39 | % | 146 | 5 | % | 64 | 44 | % | ||||||||||||||||||||||||||||||||||||||||||||||||||||
Enterprise Collaboration Solutions | 1,160 | 49 | % | 664 | 57 | % | 1,387 | 52 | % | 782 | 56 | % | ||||||||||||||||||||||||||||||||||||||||||||||||||||
Avaya Global Services | 2,227 | 54 | % | 1,065 | 48 | % | 2,463 | 49 | % | 1,119 | 45 | % | 1,198 | 51 | % | 626 | 52 | % | 1,258 | 48 | % | 609 | 48 | % | ||||||||||||||||||||||||||||||||||||||||
Unallocated Amounts(1) | (16 | ) | 0 | % | (265 | ) | (2) | (12 | ) | 0 | % | (313 | ) | (2) | — | — | % | (38 | ) | (2) | (1 | ) | — | % | (74 | ) | (2) | |||||||||||||||||||||||||||||||||||||
|
|
|
|
|
|
|
| |||||||||||||||||||||||||||||||||||||||||||||||||||||||||
| $ | 4,150 | 100 | % | $ | 1,866 | 45 | % | $ | 5,060 | 100 | % | $ | 2,172 | 43 | % | $ | 2,358 | 100 | % | $ | 1,252 | 53 | % | $ | 2,644 | 100 | % | $ | 1,317 | 50 | % | |||||||||||||||||||||||||||||||||
|
|
|
|
|
|
|
| |||||||||||||||||||||||||||||||||||||||||||||||||||||||||
Global Communications Solutions Avaya Networking Enterprise Collaboration Solutions Avaya Global Services Unallocated Amounts(1) Fiscal year ended September 30, 2012 Fiscal year ended September 30, 2011 Revenues Gross Profit Revenues Gross Profit Dollar
Amount Percent of
Total
Revenue Dollar
Amount Percent
of
Revenue Dollar
Amount Percent of
Total
Revenue Dollar
Amount Percent
of
Revenue (dollars in millions) $ 2,390 46 % $ 1,387 58 % $ 2,675 49 % $ 1,532 57 % 284 6 % 115 40 % 304 5 % 131 43 % 2,674 52 % 1,502 56 % 2,979 54 % 1,663 56 % 2,499 48 % 1,224 49 % 2,573 46 % 1,222 47 % (2 ) — % (140 ) (2) (5 ) — % (253 ) (2) $ 5,171 100 % $ 2,586 50 % $ 5,547 100 % $ 2,632 47 %
Financial Results Summary
Avaya Holdings Corp. was incorporated on June 1, 2007 by affiliatesThe following table sets forth for the six month periods ended March 31, 2013 and 2012 and for the years ended September 30, 2012, 2011, and 2010, our results of the Sponsors. Avaya Holdings Corp., through a subsidiary holding company, entered into a merger agreementoperations, and have been prepared in accordance with Avaya Inc., or the Predecessor, pursuant to which the holding company merged with and into Avaya Inc., with Avaya Inc. continuing as the surviving entity and a wholly owned subsidiary of Avaya Holdings Corp., in a transaction that was completed on October 26, 2007. Avaya Holdings Corp. is a holding company and has no material assets or standalone operations other than its ownership in Avaya Inc. and its subsidiaries.GAAP. The selected historical consolidated financial results asdata set forth below are thoseas of Avaya Holdings Corp. and its consolidated subsidiaries, orfor the Successor, from October 1, 2007 throughsix months ended March 31, 20112013 and those of its Predecessor, Avaya Inc., for the period October 1, 2007 through October 26, 2007. Prior to October 26, 2007, Avaya Inc. operated as a public company with common stock traded on the New York Stock Exchange.
The Predecessor operating results set forth below for the period October 1, 2007 through October 26, 20072012 have been derived from our Predecessor’s audited consolidated financial statementsunaudited Consolidated Financial Statements and related notes included elsewhere in this prospectus. The Successor operating resultsselected historical consolidated financial data set forth below as of and for the fiscal years ended September 30, 2008, 20092012, 2011, and 2010 have been derived from our audited consolidated financial statementsConsolidated Financial Statements and related notes included elsewhere in this prospectus. The Successor operating results set forth below as of and for the six months ended March 31, 2011 and 2010 have been derived from our unaudited consolidated financial statements included elsewhere in this prospectus, have been prepared on the same basis as the annual consolidated financial statements and, in the opinion of our management, include all adjustments, which include only normal recurring adjustments, necessary for a fair statement of this data. Although GAAP requires that we report the results of Avaya Inc. for the periods October 1, 2007 through October 26, 2007 and the results of Avaya Holdings Corp. for the full fiscal year 2008 separately, management reviews the Company’s operating results for fiscal year 2008 by combining the results of the Predecessor with the results of Avaya Holdings Corp. for fiscal year 2008. Because Avaya Holdings Corp. has no material assets or standalone operations other than its ownership in Avaya Inc. and its subsidiaries, management believes such presentation provides the most meaningful comparison of our results for fiscal year 2008.
The Company cannot adequately benchmark the operating results of the 26-day period ended October 26, 2007 against any of the previous periods reported in its consolidated financial statements and we do not believe that reviewing the results of this period in isolation would be useful in identifying any trends in or reaching any conclusions regarding the Company’s overall operating performance. Further, because there were no structural changes to Avaya Inc. as a result of the Merger, management believes that the key performance indicators such as revenues and gross margin for this period when combined with the Successor period provide meaningful comparisons to other periods and are useful in identifying current business trends. Accordingly, in addition to presenting our results of operations as reported in our consolidated financial statements in accordance with GAAP, the table below presents the combined results for the fiscal year ended September 30, 2008 as management reviews these results. The combined results for the fiscal year ended September 30, 2008 represent the sum of the reported amounts for Avaya Inc. for the period October 1, 2007 through October 26, 2007 and for Avaya Holdings Corp. for the fiscal year ended September 30, 2008. These combined results do not comply with GAAP and have not been prepared as pro forma results under applicable regulations, but are presented because we believe they provide the most meaningful comparison of our results. The combined operating results may not reflect the actual results we would have achieved absent the Merger and may not be predictive of future results of operations.
| Six months ended March 31, | Fiscal years ended September 30, | |||||||||||||||||||
In millions | 2013 | 2012 | 2012 | 2011 | 2010 | |||||||||||||||
STATEMENT OF OPERATIONS DATA: | ||||||||||||||||||||
REVENUE | ||||||||||||||||||||
Products | $ | 1,160 | $ | 1,386 | $ | 2,672 | $ | 2,976 | $ | 2,602 | ||||||||||
Services | 1,198 | 1,258 | 2,499 | 2,571 | 2,458 | |||||||||||||||
|
|
|
|
|
|
|
|
|
| |||||||||||
| 2,358 | 2,644 | 5,171 | 5,547 | 5,060 | ||||||||||||||||
|
|
|
|
|
|
|
|
|
| |||||||||||
COSTS | ||||||||||||||||||||
Products: | ||||||||||||||||||||
Costs (exclusive of amortization of intangibles) | 497 | 591 | 1,145 | 1,314 | 1,243 | |||||||||||||||
Amortization of technology intangible assets | 36 | 99 | 192 | 257 | 291 | |||||||||||||||
Services | 573 | 637 | 1,248 | 1,344 | 1,354 | |||||||||||||||
|
|
|
|
|
|
|
|
|
| |||||||||||
| 1,106 | 1,327 | 2,585 | 2,915 | 2,888 | ||||||||||||||||
|
|
|
|
|
|
|
|
|
| |||||||||||
GROSS PROFIT | 1,252 | 1,317 | 2,586 | 2,632 | 2,172 | |||||||||||||||
|
|
|
|
|
|
|
|
|
| |||||||||||
OPERATING EXPENSES | ||||||||||||||||||||
Selling, general and administrative | 765 | 847 | 1,630 | 1,845 | 1,721 | |||||||||||||||
Research and development | 231 | 228 | 464 | 461 | 407 | |||||||||||||||
Amortization of intangible assets | 114 | 112 | 226 | 226 | 218 | |||||||||||||||
Goodwill impairment | 89 | — | — | — | — | |||||||||||||||
Restructuring and impairment charges, net | 102 | 111 | 147 | 189 | 187 | |||||||||||||||
Acquisition-related costs | — | 3 | 4 | 5 | 20 | |||||||||||||||
|
|
|
|
|
|
|
|
|
| |||||||||||
| 1,301 | 1,301 | 2,471 | 2,726 | 2,553 | ||||||||||||||||
|
|
|
|
|
|
|
|
|
| |||||||||||
OPERATING (LOSS) INCOME | (49 | ) | 16 | 115 | (94 | ) | (381 | ) | ||||||||||||
Interest expense | (224 | ) | (217 | ) | (432 | ) | (460 | ) | (487 | ) | ||||||||||
Loss on extinguishment of debt | (6 | ) | — | — | (246 | ) | — | |||||||||||||
Other income (expense), net | 4 | (16 | ) | (29 | ) | 5 | 15 | |||||||||||||
|
|
|
|
|
|
|
|
|
| |||||||||||
REVENUE Products Services COSTS Products: Costs (exclusive of amortization of intangibles) Amortization of technology intangible assets Services GROSS MARGIN OPERATING EXPENSES Selling, general and administrative Research and development Amortization of intangible assets Impairment of long-lived assets Impairment of indefinite-lived intangible assets Goodwill impairment Restructuring charges, net In-process research and development charge Acquisition-related costs Merger-related costs OPERATING LOSS Interest expense Loss on early extinguishment of debt Other income, net LOSS BEFORE INCOME TAXES (Benefit from) provision for income taxes NET LOSS Less net income attributable to non controlling interests NET LOSS ATTRIBUTABLE TO AVAYA HOLDINGS CORP. Less accretion and accrued dividends on Series A Preferred stock NET LOSS ATTRIBUTABLE TO AVAYA HOLDINGS CORP. COMMON STOCKHOLDERS Net loss per share attributable to common stockholders Weighted average basic and diluted shares outstanding Predecessor Successor Combined Successor Period from
October 1,
2007
through
October 26,
2007 Fiscal Year
Ended
September 30,
2008 Fiscal Year
Ended
September 30,
2008 Fiscal Years
Ended
September 30, Six Months
Ended March
31, 2009 2010 2010 2011 (in millions, except per share amounts) $ 96 $ 2,595 $ 2,691 $ 1,923 $ 2,602 $ 1,193 $ 1,479 150 2,328 2,478 2,227 2,458 1,187 1,277 246 4,923 5,169 4,150 5,060 2,380 2,756 56 1,256 1,312 872 1,243 548 675 1 231 232 248 291 142 133 100 1,403 1,503 1,164 1,354 644 687 157 2,890 3,047 2,284 2,888 1,334 1,495 89 2,033 2,122 1,866 2,172 1,046 1,261 111 1,456 1,567 1,272 1,721 833 931 29 376 405 309 407 197 236 4 187 191 207 218 107 112 — 10 10 2 16 16 — — 130 130 60 — — — — 899 899 235 — — — 1 — 1 160 171 83 64 — 112 112 12 — — — — — — 29 20 19 4 57 1 58 — — — — 202 3,171 3,373 2,286 2,553 1,255 1,347 (113 ) (1,138 ) (1,251 ) (420 ) (381 ) (209 ) (86 ) — (377 ) (377 ) (409 ) (487 ) (229 ) (240 ) — — — — — — (246 ) 1 27 28 14 15 5 1 (112 ) (1,488 ) (1,600 ) (815 ) (853 ) (433 ) (571 ) (24 ) (183 ) (207 ) 30 18 (16 ) 41 (88 ) (1,305 ) (1,393 ) (845 ) (871 ) (417 ) (612 ) — 2 2 2 3 2 — (88 ) (1,307 ) (1,395 ) (847 ) (874 ) (419 ) (612 ) — — — — (62 ) (2 ) (3 ) $ (88 ) $ (1,307 ) $ (1,395 ) $ (847 ) $ (936 ) $ (421 ) $ (615 ) $ (0.19 ) $ (2.87 ) $ (3.06 ) $ (1.74 ) $ (1.92 ) $ (0.86 ) $ (1.26 ) 462.9 455.9 456.5 488.1 488.6 488.5 488.9
Results of Operations
| Six months ended March 31, | Fiscal years ended September 30, | |||||||||||||||||||
In millions | 2013 | 2012 | 2012 | 2011 | 2010 | |||||||||||||||
LOSS BEFORE INCOME TAXES | $ | (275 | ) | $ | (217 | ) | $ | (346 | ) | $ | (795 | ) | $ | (853 | ) | |||||
Benefit from (provision for) income taxes | 6 | 26 | (8 | ) | (68 | ) | (18 | ) | ||||||||||||
|
|
|
|
|
|
|
|
|
| |||||||||||
NET LOSS | (269 | ) | (191 | ) | (354 | ) | (863 | ) | (871 | ) | ||||||||||
Less net income attributable to noncontrolling interests | — | — | — | — | 3 | |||||||||||||||
|
|
|
|
|
|
|
|
|
| |||||||||||
NET LOSS ATTRIBUTABLE TO AVAYA HOLDINGS CORP. | (269 | ) | (191 | ) | (354 | ) | (863 | ) | (874 | ) | ||||||||||
Less: Accretion and accrued dividends on Series A and Series B preferred stock | (21 | ) | (3 | ) | (71 | ) | (7 | ) | (62 | ) | ||||||||||
|
|
|
|
|
|
|
|
|
| |||||||||||
NET LOSS ATTRIBUTABLE TO AVAYA HOLDINGS CORP. COMMON STOCKHOLDERS | $ | (290 | ) | $ | (194 | ) | $ | (425 | ) | $ | (870 | ) | $ | (936 | ) | |||||
|
|
|
|
|
|
|
|
|
| |||||||||||
Net loss per share attributable to common stockholders | $ | (0.59 | ) | $ | (0.40 | ) | $ | (0.87 | ) | $ | (1.78 | ) | $ | (1.92 | ) | |||||
|
|
|
|
|
|
|
|
|
| |||||||||||
Weighted average basic and diluted shares outstanding | 489.3 | 489.3 | 489.6 | 489.0 | 488.6 | |||||||||||||||
|
|
|
|
|
|
|
|
|
| |||||||||||
Summary of the Six Months Ended March 31, 20112013 Compared with Six Months Ended March 31, 20102012
Revenue
Our revenue for the six months ended March 31, 20112013 and 20102012 was $2,756$2,358 million and $2,380$2,644 million, respectively, an increasea decrease of $376$286 million or 16%11%. Incremental revenue from the Radvision business for the six months ended March 31, 2013 was $44 million. The decrease is primarily the result of lower customer spend on unified communications, contact center, and network products in a cautious spending environment. During the six months ended March 31, 2013, these factors impacting our revenues across most of our product solutions also contributed to lower support and professional services revenues. Further, the reduction in spending by government customers in the U.S. in anticipation of sequestration and budget cuts has also negatively impacted our product and services revenues.
During the six months ended March 31, 2013, we experienced lower sales of our unified communications products, particularly gateways and legacy NES phones and platforms. We believe these declines are primarily attributable to customers delaying systems upgrades in a cautious spending environment. The decline in gateway sales may be in part impacted by better utilization of SIP technology, which enables our customers to do more with less hardware. We believe the decrease in our contact center product revenues is in part due to pricing pressures of the increasing competition in the marketplace as well as a growing market trend around Cloud consumption preferences with more customers exploring operating expense models for procuring services. The following table sets forth a comparison of revenue by portfolio:
| Six months ended March 31, | Six months ended March 31, | |||||||||||||||||||||||||||||||||||||||||||||||
| 2010 | 2011 | Mix | Yr. to Yr. Percent Change | Yr. to Yr. Percent Change, net of Foreign Currency Impact | Percentage of Total Revenue | Yr. to Yr. Percentage Change | Yr. to Yr. Percentage Change, net of Foreign Currency Impact | |||||||||||||||||||||||||||||||||||||||||
| 2010 | 2011 | |||||||||||||||||||||||||||||||||||||||||||||||
| (dollars in millions) | ||||||||||||||||||||||||||||||||||||||||||||||||
Dollars in millions | 2013 | 2012 | 2013 | 2012 | Yr. to Yr. Percentage Change | Yr. to Yr. Percentage Change, net of Foreign Currency Impact | ||||||||||||||||||||||||||||||||||||||||||
GCS | $ | 1,089 | $ | 1,325 | 46 | % | 48 | % | 22 | % | 22 | % | $ | 1,046 | $ | 1,241 | 44 | % | 47 | % | ||||||||||||||||||||||||||||
Purchase accounting adjustments | (3 | ) | (1 | ) | 0 | % | 0 | % | (1) | (1) | — | (1 | ) | 0 | % | 0 | % | (1) | (1) | |||||||||||||||||||||||||||||
Data | 107 | 155 | 4 | % | 6 | % | 45 | % | 44 | % | ||||||||||||||||||||||||||||||||||||||
Networking | 114 | 146 | 5 | % | 5 | % | -22 | % | -22 | % | ||||||||||||||||||||||||||||||||||||||
|
|
|
|
|
| |||||||||||||||||||||||||||||||||||||||||||
Total product revenue | 1,193 | 1,479 | 50 | % | 54 | % | 24 | % | 24 | % | ||||||||||||||||||||||||||||||||||||||
Total ECS product revenue | 1,160 | 1,386 | 49 | % | 52 | % | -16 | % | -16 | % | ||||||||||||||||||||||||||||||||||||||
AGS | 1,190 | 1,279 | 50 | % | 46 | % | 7 | % | 8 | % | 1,198 | 1,258 | 51 | % | 48 | % | -5 | % | -4 | % | ||||||||||||||||||||||||||||
Purchase accounting adjustments | (3 | ) | (2 | ) | 0 | % | 0 | % | (1) | (1) | ||||||||||||||||||||||||||||||||||||||
Total service revenue | 1,187 | 1,277 | 50 | % | 46 | % | 8 | % | 8 | % | ||||||||||||||||||||||||||||||||||||||
|
|
|
|
|
| |||||||||||||||||||||||||||||||||||||||||||
Total revenue | $ | 2,380 | $ | 2,756 | 100 | % | 100 | % | 16 | % | 16 | % | $ | 2,358 | $ | 2,644 | 100 | % | 100 | % | -11 | % | -10 | % | ||||||||||||||||||||||||
|
|
|
|
|
| |||||||||||||||||||||||||||||||||||||||||||
GCS revenue for the six months ended March 31, 2013 and 2012 was $1,046 million and $1,241 million, respectively, a decrease of $195 million or 16%. The decrease in GCS revenue was primarily the result of lower customer spend on unified communications and contact center products in a cautious spending environment as discussed above. These decreases were partially offset by the incremental revenue from the Radvision business for the current period.
Networking revenue for the six months ended March 31, 2013 and 2012 was $114 million and $146 million, respectively, a decrease of $32 million or 22%. The decrease in Networking revenue is primarily a result of lower demand.
AGS revenue for the six months ended March 31, 2013 and 2012 was $1,198 million and $1,258 million, respectively, a decrease of $60 million or 5%. The decrease in AGS revenue was primarily due to lower support and professional services revenues as a result of lower product sales particularly in the U.S. and lower IT professional services, or ITPS, revenues associated with our U.S. government customers. These decreases were partially offset by an increase in revenues from operational services performed under service level agreements entered into in prior periods.
The following table sets forth a comparison of revenue by location:
| Six months ended March 31, | ||||||||||||||||||||||||
| Percentage of Total Revenue | Yr. to Yr. Percentage Change | Yr. to Yr. Percentage Change, net of Foreign Currency Impact | ||||||||||||||||||||||
Dollars in millions | 2013 | 2012 | 2013 | 2012 | ||||||||||||||||||||
U.S. | $ | 1,262 | $ | 1,426 | 54 | % | 54 | % | (12 | )% | (12 | )% | ||||||||||||
International: | ||||||||||||||||||||||||
EMEA | 629 | 692 | 27 | % | 26 | % | (9 | )% | (8 | )% | ||||||||||||||
APAC—Asia Pacific | 239 | 243 | 10 | % | 9 | % | (2 | )% | (1 | )% | ||||||||||||||
Americas International—Canada and Latin America | 228 | 283 | 9 | % | 11 | % | (19 | )% | (18 | )% | ||||||||||||||
|
|
|
|
|
|
|
|
|
|
|
| |||||||||||||
Total International | 1,096 | 1,218 | 46 | % | 46 | % | (10 | )% | (9 | )% | ||||||||||||||
|
|
|
|
|
|
|
|
|
|
|
| |||||||||||||
Total revenue | $ | 2,358 | $ | 2,644 | 100 | % | 100 | % | (11 | )% | (10 | )% | ||||||||||||
|
|
|
|
|
|
|
|
|
|
|
| |||||||||||||
Revenue in the U.S. for the six months ended March 31, 2013 and 2012 was $1,262 million and $1,426 million, respectively, a decrease of $164 million or 12%. The decrease in U.S. revenue was primarily attributable to lower sales associated with our unified communications and contact center products, which contributed to lower revenues from support and professional services, particularly with our U.S. Government customers. The decrease is also attributable to lower sales associated with our contact center and networking products and was partially offset by the incremental revenues from the Radvision business. Revenue in EMEA for the six months ended March 31, 2013 and 2012 was $629 million and $692 million, respectively, a decrease of $63 million or 9%. The decrease in EMEA revenue was primarily attributable to lower sales associated with our unified communications and contact center products and to a lesser extent an unfavorable impact of foreign currency and was partially offset by the incremental revenues from the Radvision business. Revenue in APAC for the six months ended March 31, 2013 and 2012 was $239 million and $243 million, respectively, a decrease of $4 million or 2%. The decrease in APAC revenue is primarily attributable to lower revenues associated with our unified communications products and professional services, and an unfavorable impact of foreign currency, partially offset by higher support services. Revenue in Americas International was $228 million and $283 million for the six months ended March 31, 2013 and 2012, respectively, a decrease of $55 million or 19%. The decrease in Americas International revenue was particularly attributable to Canada and Brazil and was associated primarily with our unified communications and contact center products, as well as an unfavorable impact of foreign currency.
We sell our solutions directly to end users and through an indirect sales channel. The following table sets forth a comparison of revenue from sales of products by channel:
| Six months ended March 31, | ||||||||||||||||||||||||
| Percentage of Total ECS Product Revenue | Yr. to Yr. Percentage Change | Yr. to Yr. Percentage Change, net of Foreign Currency Impact | ||||||||||||||||||||||
Dollars in millions | 2013 | 2012 | 2013 | 2012 | ||||||||||||||||||||
Direct | $ | 266 | $ | 333 | 23 | % | 24 | % | (20 | )% | (20 | )% | ||||||||||||
Indirect | 894 | 1,053 | 77 | % | 76 | % | (15 | )% | (15 | )% | ||||||||||||||
|
|
|
|
|
|
|
|
|
|
|
| |||||||||||||
Total ECS product revenue | $ | 1,160 | $ | 1,386 | 100 | % | 100 | % | (16 | )% | (16 | )% | ||||||||||||
|
|
|
|
|
|
|
|
|
|
|
| |||||||||||||
Gross Profit
The following table sets forth a comparison of gross profit by segment:
| Six months ended March 31, | ||||||||||||||||||||||||
| Gross Profit | Gross Margin | Change | ||||||||||||||||||||||
Dollars in millions | 2013 | 2012 | 2013 | 2012 | Amount | Pct. | ||||||||||||||||||
GCS | $ | 619 | $ | 718 | 59.2 | % | 57.9 | % | (99 | ) | (14 | )% | ||||||||||||
Networking | 45 | 64 | 39.5 | % | 43.8 | % | (19 | ) | (30 | )% | ||||||||||||||
|
|
|
|
|
|
|
|
|
|
|
| |||||||||||||
ECS | 664 | 782 | 57.2 | % | 56.4 | % | (118 | ) | (15 | )% | ||||||||||||||
AGS | 626 | 609 | 52.3 | % | 48.4 | % | 17 | 3 | % | |||||||||||||||
Unallocated amounts | (38 | ) | (74 | ) | (1) | (1) | 36 | (1) | ||||||||||||||||
|
|
|
|
|
|
|
|
|
|
|
| |||||||||||||
Total | $ | 1,252 | $ | 1,317 | 53.1 | % | 49.8 | % | (65 | ) | (5 | )% | ||||||||||||
|
|
|
|
|
|
|
|
|
|
|
| |||||||||||||
| (1) | Not meaningful |
Gross profit for the six months ended March 31, 2013 and 2012 was $1,252 million and $1,317 million, respectively, a decrease of $65 million or 5%. The decrease is primarily attributable to a decrease in sales volume and lower pricing partially offset by the success of our gross margin improvement initiatives, the impact of lower amortization of technology intangible assets, and a $5 million benefit associated with the release of a contingent liability related to a labor matter in EMEA that we released as a result of a favorable court ruling. Our gross margin improvement initiatives include exiting facilities, reducing the workforce, relocating positions to lower-cost geographies, productivity improvements, and obtaining better pricing from our contract manufacturers and transportation vendors. As a result of the above factors, gross margin increased to 53.1% for the six months ended March 31, 2013 from 49.8% for the six months ended March 31, 2012.
GCS gross profit for the six months ended March 31, 2013 and 2012 was $619 million and $718 million, respectively, a decrease of $99 million or 14%. The decrease in GCS gross profit is primarily due to the decrease in sales volume and lower pricing partially offset by the success of our gross margin improvement initiatives discussed above. As a result of the above factors, GCS gross margin increased to 59.2% for the six months ended March 31, 2013 compared to 57.9% for the six months ended March 31, 2012.
Networking gross profit for the six months ended March 31, 2013 and 2012 was $45 million and $64 million, respectively, a decrease of $19 million or 30%. Networking gross margin decreased to 39.5% for the six months ended March 31, 2013 from 43.8% for the six months ended March 31, 2012. The decreases in Networking gross profit and margin were due to lower revenues which did not allow us to leverage our fixed costs.
AGS gross profit for the six months ended March 31, 2013 and 2012 was $626 million and $609 million, respectively, an increase of $17 million or 3%. The increase in AGS gross profit is primarily due to the continued benefit from our gross margin improvement initiatives discussed above, and a $5 million benefit associated with
the release of a contingent liability related to a labor matter in EMEA that we released as a result of a favorable court ruling. We have redesigned the Avaya support website and continue to transition our customers from an agent-based support model to a self-service/web-based support model. These improvements have allowed us to reduce the workforce and relocate positions to lower-cost geographies. These increases in AGS gross profit were partially offset by a decrease in services revenue. As a result of the above factors, AGS gross margin increased to 52.3% for the six months ended March 31, 2013 compared to 48.4% for the six months ended March 31, 2012.
Unallocated amounts for the six months ended March 31, 2013 and 2012 include the effect of the amortization of acquired technology intangibles related to the acquisition of NES and the Merger, costs that are not core to the measurement of segment management’s performance, but rather are controlled at the corporate level, and certain purchase accounting adjustments in connection with the Merger. Unallocated costs for six months ended March 31, 2013 also included the effect of the amortization of acquired technology intangible assets related to the acquisition of Radvision in June 2012. The decrease in unallocated costs is primarily due to the impact of lower amortization associated with technology intangible assets acquired prior to fiscal 2012.
Operating expenses
| Six months ended March 31, | ||||||||||||||||||||||||
| Percentage of Revenue | Change | |||||||||||||||||||||||
Dollars in millions | 2013 | 2012 | 2013 | 2012 | Amount | Pct. | ||||||||||||||||||
Selling, general and administrative | $ | 765 | $ | 847 | 32.4 | % | 32.0 | % | $ | (82 | ) | (10 | )% | |||||||||||
Research and development | 231 | 228 | 9.8 | % | 8.6 | % | 3 | 1 | % | |||||||||||||||
Amortization of intangible assets | 114 | 112 | 4.8 | % | 4.2 | % | 2 | 2 | % | |||||||||||||||
Goodwill impairment | 89 | — | 3.8 | % | — | % | 89 | — | % | |||||||||||||||
Restructuring and impairment charges, net | 102 | 111 | 4.3 | % | 4.2 | % | (9 | ) | (8 | )% | ||||||||||||||
Acquisition-related costs | — | 3 | — | % | 0.1 | % | (3 | ) | (100 | )% | ||||||||||||||
|
|
|
|
|
|
|
|
|
|
|
| |||||||||||||
Total operating expenses | $ | 1,301 | $ | 1,301 | 55.1 | % | 49.1 | % | $ | — | — | % | ||||||||||||
|
|
|
|
|
|
|
|
|
|
|
| |||||||||||||
SG&A expenses for the six months ended March 31, 2013 and 2012 were $765 million and $847 million, respectively, a decrease of $82 million. The decrease was primarily due to lower expenses as a result of our cost savings initiatives, lower selling expenses, and a $3 million benefit associated with the release of a contingent liability related to a labor matter in EMEA that we released as a result of a favorable court ruling. Our cost savings initiatives include exiting facilities, reducing the workforce and relocating positions to lower-cost geographies. These decreases were partially offset by the incremental expenses associated with the Radvision business.
R&D expenses for the six months ended March 31, 2013 and 2012 were $231 million and $228 million, respectively, an increase of $3 million. The increase was primarily due to the incremental expenses associated with the Radvision business and a lower portion of product development costs that were capitalized in the current period. These increases were partially offset by lower expenses associated with our cost savings initiatives discussed above. Capitalized software development costs for the six months ended March 31, 2013 and 2012 were $10 million and $19 million, respectively, a decrease of $9 million. Because the projects in our product development portfolio for the six months ended March 31, 2012 were generally further along in the development cycle than those for the six months ended March 31, 2013, we capitalized a lower portion of our current period R&D spend.
Amortization of intangible assets was $114 million and $112 million for the six months ended March 31, 2013 and 2012, respectively.
Goodwill impairment associated with our ITPS reporting unit for the six months ended March 31, 2013 was $89 million. The ITPS reporting unit provides specialized information technology services exclusively to U.S. government customers and has experienced a decline in revenues as compared to previous periods and a reduction in its forecasts for the remainder of fiscal 2013. The reporting unit was impacted by reduced
government spending in anticipation of sequestration and general budget cuts. Additionally, there is much uncertainty regarding how sequestration cuts will be implemented and the impact they will have on contractors supporting the government. As a result of these events, the Company determined that an interim impairment test of the reporting unit’s goodwill should be performed.
Based on our performance of step one of the goodwill impairment test, we determined that the estimated fair value of the ITPS reporting unit was less than the carrying value of its net assets (including goodwill). Based on the second step of the goodwill impairment test, we determined that the book value of the reporting unit’s goodwill exceeded its implied fair value. Accordingly, we wrote down the goodwill balance by $89 million. The impairment was primarily the result of budgetary constraints, sequestration and uncertainty regarding spending on the part of the U.S. government. The reduced valuation of the reporting unit reflects additional market risks and lower sales forecasts for the reporting unit, which is consistent with economic trends at that time.
During the three months ended March 31, 2012, the Company tested goodwill for impairment and determined that no impairment existed. During the three months ended March 31, 2012, the Company experienced a decline in revenue as compared to the same period of the prior year and sequential quarters. This revenue decline impacted the Company’s forecasts for the remainder of fiscal 2012. As a result of these events, the Company determined that an interim impairment test of goodwill should be performed. Using the revised forecasts as of March 31, 2012, we performed step one of the impairment test of goodwill. Although the revised forecasts provided for lower cash flows, the respective book value of each reporting unit did not exceed their estimated fair values and therefore no impairment existed.
Restructuring and impairment charges, net, for the six months ended March 31, 2013 and 2012 were $102 million and $111 million, respectively, a decrease of $9 million. The Company continued to identify opportunities to streamline its operations and generate cost savings which included consolidating and exiting facilities and eliminating employee positions. Restructuring charges recorded during the six months ended March 31, 2013 include employee separation costs of $79 million and lease obligations of $23 million. The employee separation costs are primarily associated with employee severance actions in EMEA and the U.S. The EMEA approved plan provides for the elimination of 234 positions and resulted in a charge of $47 million. The separation charges include, but are not limited to, social pension fund payments and health care and unemployment insurance costs to be paid to or on behalf of the affected employees. A voluntary program offered to certain management employees in the U.S. resulted in the elimination of 195 positions and resulted in a charge of $9 million. Restructuring charges for the six months ended March 31, 2013 includes lease obligations primarily related to the Company’s Maidenhead, United Kingdom, Guilford, United Kingdom, and Highlands Ranch, Colorado facilities. Restructuring charges recorded during the six months ended March 31, 2012 include employee separation costs of $107 million and lease obligations of $4 million. Employee separation charges for this period are primarily associated with employee severance actions in the EMEA, U.S., and Canada. In April 2013, the Company initiated a voluntary employee severance program in the U.S. and will recognize the expense associated with this program during the quarter ending June 30, 2013. The Company is also evaluating the potential for additional employee severance actions to reduce headcount globally and could initiate these actions during the quarter ending June 30, 2013. The Company continues to evaluate opportunities to streamline its operations and identify cost savings globally and may take additional restructuring actions in the future and the costs of those actions could be material.
Acquisition-related costs for the six months ended March 31, 2012 was $3 million and include third-party legal and other costs related to business acquisitions in fiscal 2012. There were no acquisition-related costs for the six months ended March 31, 2013.
Operating (Loss) Income
For the six months ended March 31, 2013, operating loss was $49 million compared to operating income of $16 million for the six months ended March 31, 2012.
Operating (loss) income for the six months ended March 31, 2013 and 2012 includes non-cash expenses for depreciation and amortization of $221 million and $286 million, goodwill impairment of $89 million and $0, and share-based compensation of $3 million and $5 million for each of the periods, respectively.
Interest Expense
Interest expense for the six months ended March 31, 2013 and 2012 was $224 million and $217 million, respectively, which includes non-cash interest expense of $12 million in each period. Non-cash interest expense for each period includes amortization of debt issuance costs and accretion of debt discount. Cash interest expense for the six months ended March 31, 2013 compared to the six months ended March 31, 2012 increased as a result of certain debt refinancing transactions partially offset by a decrease in interest expense as a result of the expiration of certain unfavorable interest rate swap contracts.
During the six months ended March 31, 2013, Avaya Inc. completed a series of transactions which allowed Avaya Inc. to refinance term loans under its senior secured credit facilities that originally matured October 26, 2014 and senior unsecured notes that originally matured on November 1, 2015. As a result of these debt refinancing transactions, the interest rate associated with the portion of the debt that was refinanced increased. See Note 7, “Financing Arrangements” to our unaudited Consolidated Financial Statements included elsewhere in this prospectus for further details.
Loss on Extinguishment of Debt
In connection with (1) the issuance the 9% Senior Secured Notes and the payment of $284 million of our term B-5 loans and (2) the refinancing of $584 million of outstanding term B-1 loans, the Company recognized a loss on extinguishment of debt for the six months ended March 31, 2013 of $6 million. The loss represents the difference between the reacquisition price and the carrying value (including unamortized discount and debt issue costs) of the debt. See Note 7, “Financing Arrangements” to our unaudited Consolidated Financial Statements included elsewhere in this prospectus for further details.
Other Income (Expense), Net
Other income, net for the six months ended March 31, 2013 was $4 million as compared to other expense, net of $16 million for the six months ended March 31, 2012. Other income, net, for the current period includes net foreign currency transaction gains of $15 million and changes in the fair value of preferred series B embedded derivative of $8 million, partially offset by third party fees incurred in connection with debt modifications of $18 million. Also included in other income, net for the six months ended March 31, 2013 is a $1 million translation loss recognized in connection with the devaluation of the bolivar by the Venezuela government in February 2013. Other expense, net for the six months ended March 31, 2012 includes net foreign currency transaction losses of $12 million and third party fees incurred in connection with the preparation of the Company’s registration statement of $3 million.
Benefit from Income Taxes
The benefit from income taxes for the six months ended March 31, 2013 was $6 million, as compared to a benefit from income taxes of $26 million for the six months ended March 31, 2012.
The effective rate for the six months ended March 31, 2013 differs from the statutory U.S. Federal income tax rate primarily due to (1) the effect of tax rate differentials on foreign income/loss, (2) changes in the valuation allowance established against the Company’s deferred tax assets, (3) $17 million of income tax benefit recognized upon the expiration of certain interest rate swaps and (4) $16 million release of valuation allowance associated with tax expense on net gains in other comprehensive income.
During the six months ended March 31, 2013, the Company recognized $17 million of income tax benefit related to the elimination of the tax effect of certain interest rate swaps in other comprehensive income. The tax effect of such interest rate swaps was recognized in other comprehensive income prior to the establishment of a valuation allowance against the Company’s U.S. net deferred tax assets and was eliminated following the expiration of the final interest rate swap upon which the tax effect was established.
During the six months ended March 31, 2013, the Company recorded a tax charge of $16 million to other comprehensive income primarily relating to pension benefits. The charge to other comprehensive income and decrease in related deferred tax assets resulted in the recording of an income tax benefit in continuing operations related to the release of the corresponding valuation allowance.
The effective rate for the six months ended March 31, 2012 differs from the statutory U.S. Federal income tax rate primarily due to (1) the effect of tax rate differentials on foreign income/loss, (2) changes in the valuation allowance established against the Company’s deferred tax assets and (3) $6 million release of valuation allowance associated with tax expense on net gains in other comprehensive income.
During the six months ended March 31, 2012, the Company recorded a tax charge of $6 million to other comprehensive income primarily relating to pension benefits. The charge to other comprehensive income and decrease in related deferred tax assets resulted in the recording of an income tax benefit in continuing operations related to the release of the corresponding valuation allowance.
Summary of the Fiscal Year Ended September 30, 2012 Compared with Fiscal Year Ended September 30, 2011
Revenue
Our revenue for fiscal 2012 and 2011 was $5,171 million and $5,547 million, respectively, a decrease of $376 million or 7%. Incremental revenue from the Radvision business for the period June 5, 2012 through September 30, 2012 was $31 million. The following table sets forth a comparison of revenue by portfolio:
| Fiscal years ended September 30, | ||||||||||||||||||||||||
| Percentage of Total Revenue | Yr. to Yr. Percent Change | Yr. to Yr. Percent Change, net of Foreign Currency Impact | ||||||||||||||||||||||
In millions | 2012 | 2011 | 2012 | 2011 | ||||||||||||||||||||
GCS | $ | 2,390 | $ | 2,675 | 46 | % | 49 | % | (11 | )% | (10 | )% | ||||||||||||
Purchase accounting adjustments | (2 | ) | (3 | ) | — | % | — | % | (1) | (1) | ||||||||||||||
Networking | 284 | 304 | 6 | % | 5 | % | (7 | )% | (6 | )% | ||||||||||||||
|
|
|
|
|
|
|
|
|
|
|
| |||||||||||||
Total ECS product revenue | 2,672 | 2,976 | 52 | % | 54 | % | (10 | )% | (9 | )% | ||||||||||||||
|
|
|
|
|
|
|
|
|
|
|
| |||||||||||||
AGS | 2,499 | 2,573 | 48 | % | 46 | % | (3 | )% | (1 | )% | ||||||||||||||
Purchase accounting adjustments | — | (2 | ) | — | % | — | % | (1) | (1) | |||||||||||||||
|
|
|
|
|
|
|
|
|
|
|
| |||||||||||||
Total service revenue | 2,499 | 2,571 | 48 | % | 46 | % | (3 | )% | (1 | )% | ||||||||||||||
|
|
|
|
|
|
|
|
|
|
|
| |||||||||||||
Total revenue | $ | 5,171 | $ | 5,547 | 100 | % | 100 | % | (7 | )% | (6 | )% | ||||||||||||
|
|
|
|
|
|
|
|
|
|
|
| |||||||||||||
| (1) | Not meaningful |
GCS revenue for fiscal 2012 and 2011 was $2,390 million and $2,675 million, respectively, a decrease of $285 million or 11%. The decrease in GCS revenue was driven by lower IT infrastructure spend by our end customers, limited quality issues on product/solution integration transitions, pricing pressures and an unfavorable impact of foreign currency, particularly in EMEA. The Company continues to make progress addressing the limited quality issues in its infrastructure solutions product portfolio through patches issued to end-users and applied to inventories held by our contract manufacturers.
Networking revenue for fiscal 2012 and 2011 was $284 million and $304 million, respectively, a decrease of $20 million or 7%. The decrease in Networking revenue is primarily a result of higher demand in fiscal 2011 due to our new product offerings, primarily in the U.S.
AGS revenue for fiscal 2012 and 2011 was $2,499 million and $2,573 million, respectively, a decrease of $74 million or 3%. The decrease in AGS revenue was primarily due to an unfavorable impact of foreign currency, particularly in EMEA, as well as customers reducing their spending on support contracts. These decreases in support contracts revenue were partially offset by an increase in professional services.
The following table sets forth a comparison of revenue by location:
| Fiscal years ended September 30, | ||||||||||||||||||||||||
| Percentage of Total Revenue | Yr. to Yr. Percentage Change | Yr. to Yr. Percentage Change, net of Foreign Currency Impact | ||||||||||||||||||||||
Dollars in millions | 2012 | 2011 | 2012 | 2011 | ||||||||||||||||||||
U.S. | $ | 2,786 | $ | 2,998 | 54 | % | 54 | % | (7 | )% | (7 | )% | ||||||||||||
International: | ||||||||||||||||||||||||
EMEA | 1,349 | 1,488 | 26 | % | 27 | % | (9 | )% | (6 | )% | ||||||||||||||
APAC—Asia Pacific | 497 | 515 | 10 | % | 9 | % | (3 | )% | (3 | )% | ||||||||||||||
Americas International—Canada and Latin America | 539 | 546 | 10 | % | 10 | % | (1 | )% | 2 | % | ||||||||||||||
|
|
|
|
|
|
|
|
|
|
|
| |||||||||||||
Total International | 2,385 | 2,549 | 46 | % | 46 | % | (6 | )% | (4 | )% | ||||||||||||||
|
|
|
|
|
|
|
|
|
|
|
| |||||||||||||
Total revenue | $ | 5,171 | $ | 5,547 | 100 | % | 100 | % | (7 | )% | (6 | )% | ||||||||||||
|
|
|
|
|
|
|
|
|
|
|
| |||||||||||||
Revenue in the U.S. for fiscal 2012 and 2011 was $2,786 million and $2,998 million, respectively, a decrease of $212 million million or 7%. The decrease in U.S. revenue was primarily due to lower revenues associated with our infrastructure solutions portfolio, support services particularly in the government sector, and networking products, partially offset by higher sales associated with contact center applications and professional services. Revenue in EMEA for fiscal 2012 and 2011 was $1,349 million and $1,488 million, respectively, a decrease of $139 million or 9%. The decrease in EMEA revenues was primarily due to lower revenues associated with our infrastructure solutions portfolio, German rental base and support services associated with our infrastructure solutions portfolio, as well as an unfavorable impact of foreign currency, partially offset by an increase in sales of our new networking product offerings. Within EMEA, revenue in Germany decreased due to a decline in our rental base as lease renewals are typically at lower rates, which is expected to continue into fiscal 2013. Revenue in APAC for fiscal 2012 and 2011 was $497 million and $515 million, respectively, a decrease of $18 million. The decrease in APAC revenue is primarily attributable to lower revenues associated with our infrastructure solutions portfolio, partially offset by higher support services and professional services. Revenue in Americas International was $539 million and $546 million for fiscal 2012 and 2011, respectively, a decrease of $7 million or 1%. The decrease in Americas International revenue was primarily due to lower revenues associated with our infrastructure solutions and contact center portfolios and an unfavorable impact of foreign currency, partially offset by an increase in Networking revenues.
We sell our solutions both directly and through an indirect sales channel. The following table sets forth a comparison of revenue from sales of products by channel:
| Fiscal years ended September 30, | ||||||||||||||||||||||||
| Percentage of ECS Product Revenue | Yr. to Yr. Percentage Change | Yr. to Yr. Percentage Change, net of Foreign Currency Impact | ||||||||||||||||||||||
Dollars in millions | 2012 | 2011 | 2012 | 2011 | ||||||||||||||||||||
Direct | $ | 662 | $ | 700 | 25 | % | 24 | % | (5 | )% | (3 | )% | ||||||||||||
Indirect | 2,010 | 2,276 | 75 | % | 76 | % | (12 | )% | (11 | )% | ||||||||||||||
|
|
|
|
|
|
|
|
|
|
|
| |||||||||||||
Total ECS product revenue | $ | 2,672 | $ | 2,976 | 100 | % | 100 | % | (10 | )% | (9 | )% | ||||||||||||
|
|
|
|
|
|
|
|
|
|
|
| |||||||||||||
The percentage of product sales through the indirect channel decreased by 1 percentage point to 75% in fiscal 2012 as compared to 76% in fiscal 2011. The decrease in sales volume in the indirect channel was a result of the revenue declines and factors causing those declines discussed above and due to inventory working capital management by distributors. The percentage of total revenue derived from indirect channels decreased relative to the percentage derived from direct sales due to the continuing transition from legacy NES products to the newer Avaya platforms. Sales from the NES business, prior to its acquisition by Avaya, were substantially generated through the indirect channel.
Gross Profit
The following table sets forth a comparison of gross profit by segment:
| Fiscal years ended September 30, | ||||||||||||||||||||||||
| Gross Profit | Gross Margin | |||||||||||||||||||||||
Dollars in millions | 2012 | 2011 | 2012 | 2011 | Change | |||||||||||||||||||
GCS | $ | 1,387 | $ | 1,532 | 58.0 | % | 57.3 | % | $ | (145 | ) | (9 | )% | |||||||||||
Networking | 115 | 131 | 40.5 | % | 43.1 | % | (16 | ) | (12 | )% | ||||||||||||||
|
|
|
|
|
|
|
|
|
|
|
| |||||||||||||
ECS | 1,502 | 1,663 | 56.2 | % | 55.9 | % | (161 | ) | (10 | )% | ||||||||||||||
AGS | 1,224 | 1,222 | 49.0 | % | 47.5 | % | 2 | — | % | |||||||||||||||
Unallocated amounts | (140 | ) | (253 | ) | (1) | (1) | 113 | (1) | ||||||||||||||||
|
|
|
|
|
|
|
|
|
|
|
| |||||||||||||
Total | $ | 2,586 | $ | 2,632 | 50.0 | % | 47.4 | % | $ | (46 | ) | (2 | )% | |||||||||||
|
|
|
|
|
|
|
|
|
|
|
| |||||||||||||
| (1) | Not meaningful |
Gross profit for fiscal 2012 and 2011 was $2,586 million and $2,632 million, respectively. Gross profit decreased by $46 million or 2% and includes incremental gross profit from the Radvision business for the period June 5, 2012 through September 30, 2012 of $22 million. The decrease is attributable to decreased sales volumes, pricing pressures and an unfavorable impact of foreign currency. These decreases were partially offset by the success of our gross margin improvement initiatives, the impact of lower amortization of technology intangible assets, reductions in integration-related costs related to the acquisition of the NES business, a favorable change in our product mix as we had lower sales of lower margin products and lower costs associated with our employee incentive plans, which are driven by our actual financial results relative to established targets. Our gross margin improvement initiatives include exiting facilities, reducing the workforce, relocating positions to lower-cost geographies, productivity improvements, and obtaining better pricing from our contract manufacturers and transportation vendors. Gross margin increased to 50.0% for fiscal 2012 from 47.4% for fiscal 2011. The increase in gross margin is primarily due to the success of our gross margin improvement initiatives as discussed above, the impact of lower amortization of technology intangible assets, reductions in integration-related costs related to the acquisition of the NES business and lower costs associated with our employee incentive plans.
GCS gross profit for fiscal 2012 and 2011 was $1,387 million and $1,532 million, respectively. GCS gross profit decreased $145 million or 9%. The decrease in GCS gross profit is primarily due to the decrease in sales volume, pricing pressures and the unfavorable impact of foreign currency. These decreases were partially offset by the success of our gross margin improvement initiatives discussed above. The decreases were also offset by the reductions in integration-related costs related to the acquisition of the NES business and a favorable change in our product mix as we had lower sales of lower margin products. GCS gross margin increased to 58.0% for fiscal 2012 compared to 57.3% for fiscal 2011. The increase is primarily due to the positive effect of our gross margin improvement initiatives described above and a favorable change in our product mix as we had lower sales of lower margin products partially offset by lower sales volume, which reduced the leverage on our fixed costs.
Networking gross profit for fiscal 2012 and 2011 was $115 million and $131 million, respectively. Networking gross margin decreased to 40.5% for fiscal 2012 from 43.1% for fiscal 2011. The decreases in Networking gross profit and margin were due to lower revenues which did not allow us to leverage our fixed costs.
AGS gross profit for fiscal 2012 and 2011 was $1,224 million and $1,222 million and gross margin was 49.0% and 47.5%, respectively. The increases in AGS gross profit and gross margin are primarily due to the continued benefit from cost savings initiatives discussed above, as well as lower costs associated with our employee incentive plans. We have redesigned the Avaya support website and are transitioning our customers from an agent-based support model to a self-service/web-based support model. These improvements have allowed us to reduce the workforce and relocate positions to lower-cost geographies. These increases in AGS gross profit were partially offset by a decrease in services revenue.
Unallocated amounts for fiscal 2012 and 2011 include the effect of the amortization of acquired technology intangibles related to the acquisition of NES and the Merger, costs that are not core to the measurement of segment management’s performance, but rather are controlled at the corporate level, and certain purchase accounting adjustments in connection with the Merger. Unallocated costs for fiscal 2012 also included the effect of the amortization of acquired technology intangible assets related to the acquisition of Radvision in June 2012. The decrease in unallocated costs is primarily due to the impact of lower amortization associated with technology intangible assets acquired prior to fiscal 2012.
Operating Expenses
| Fiscal years ended September 30, | ||||||||||||||||||||||||
Percentage of Revenue | ||||||||||||||||||||||||
Dollars in millions | 2012 | 2011 | 2012 | 2011 | Change | |||||||||||||||||||
Selling, general and administrative | $ | 1,630 | $ | 1,845 | 31.5 | % | 33.3 | % | $ | (215 | ) | (12 | )% | |||||||||||
Research and development | 464 | 461 | 9.0 | % | 8.3 | % | 3 | 1 | % | |||||||||||||||
Amortization of intangible assets | 226 | 226 | 4.4 | % | 4.1 | % | — | — | % | |||||||||||||||
Restructuring and impairment charges, net | 147 | 189 | 2.8 | % | 3.4 | % | (42 | ) | (22 | )% | ||||||||||||||
Acquisition-related costs | 4 | 5 | 0.1 | % | 0.1 | % | (1 | ) | (20 | )% | ||||||||||||||
|
|
|
|
|
|
|
|
|
|
|
| |||||||||||||
Total operating expenses | $ | 2,471 | $ | 2,726 | 47.8 | % | 49.2 | % | $ | (255 | ) | (9 | )% | |||||||||||
|
|
|
|
|
|
|
|
|
|
|
| |||||||||||||
SG&A expenses for fiscal 2012 and 2011 were $1,630 million and $1,845 million, respectively, a decrease of $215 million. The decrease was primarily due to reductions in integration-related costs related to the acquisition of the NES business, a favorable impact of foreign currency, the continued benefit associated with our cost savings initiatives, and lower expenses associated with our employee incentive plans, which are driven by our actual financial results relative to established targets. Integration-related costs included in SG&A were $19 million and $103 million for fiscal 2012 and 2011, respectively. In fiscal 2011, integration-related costs primarily represent third-party consulting fees and other administrative costs associated with consolidating and coordinating the operations of Avaya and NES. These costs were incurred in connection with, among other things, the on-boarding of NES personnel, developing compatible IT systems and internal processes, and developing and implementing a strategic operating plan to enable a smooth transition with minimal disruption to NES customers. Such costs include fees paid to certain Nortel-controlled entities for logistic and other support functions being performed on a temporary basis pursuant to a transition services agreement which expired in June 2011. For fiscal 2012, integration-related costs are primarily associated with the continued development of compatible IT systems.
R&D expenses for fiscal 2012 and 2011 were $464 million and $461 million, respectively, an increase of $3 million. The increase was primarily due to an increase in costs of new product development, as well as the incremental expenses associated with the acquisition of Radvision. The increase in these costs was partially offset by lower expenses associated with our employee incentive plans, which are driven by our actual financial results relative to established targets, and a favorable impact of foreign currency. Capitalized software development costs for fiscal 2012 and 2011 were $35 million and $42 million, respectively, a decrease of $7 million. Because the
projects in our product development portfolio for fiscal 2011 were generally further along in the development cycle than those for fiscal 2012, we capitalized a lower portion of our current period R&D spend.
Amortization of intangible assets was $226 million for fiscal 2012 and 2011.
Restructuring and impairment charges, net, for fiscal 2012 and 2011 were $147 million and $189 million, respectively, a decrease of $42 million. The Company continues to focus on controlling costs and, as a result, implemented additional initiatives designed to streamline its operations and generate cost savings. These initiatives include exiting facilities and reducing the workforce or relocating positions to lower cost geographies. Restructuring charges recorded during fiscal 2012 include employee separation costs of $123 million and lease obligations of $19 million. Employee separation costs for fiscal 2012 include $70 million associated with a plan presented to the works council on February 13, 2012 representing employees of certain of the Company’s German subsidiaries to eliminate 327 positions. The costs consist of severance and employment benefits payments and include, but are not limited to, social pension fund payments and health care and unemployment insurance costs to be paid to or on behalf of the affected employees. In addition to the restructuring charges related to Germany, the company had employee separation costs in the US, Canada and EMEA, excluding Germany. Costs related to lease obligations include facilities partially or totally vacated during the period primarily located in the United Kingdom and the U.S. Restructuring charges recorded during fiscal 2011 include employee separation costs of $153 million and lease obligations of $36 million. Employee separation charges for this period include $56 million associated with an agreement reached with the Germany works council representing employees of certain of Avaya’s German subsidiaries for the elimination of 210 employee positions. For fiscal 2011, lease obligations included in restructuring charges represent the remaining lease obligations associated with facilities partially or totally vacated during the period primarily in Ireland and the U.S. The Company continues to evaluate opportunities to streamline its operations and identify cost savings globally and may take additional restructuring actions in the future and the costs of those actions could be material.
The Company initiated a plan to dispose of a Company owned facility in Munich, Germany and relocate to a new facility. Accordingly, the Company wrote the value of this asset down to its net realizable value of $3 million and reclassified this asset as held for sale. Included in restructuring and impairment charges, net in the Statement of Operations is an impairment charge of $5 million for fiscal 2012.
Acquisition-related costs for fiscal 2012 and 2011 were $4 million and $5 million, and include third-party legal and other costs related to the acquisition of Radvision and other business acquisitions in fiscal 2012 and 2011.
Operating Income (Loss)
Fiscal 2012 operating income was $115 million compared to an operating loss of $94 million for fiscal 2011.
Results for fiscal 2012 include the impact of integration-related costs (included in SG&A and elsewhere) of $19 million and acquisition-related costs of $4 million. In addition, in fiscal 2012, the Company incurred impairment charges of $5 million related to the write-down of the Munich, Germany facility. For fiscal 2011, we incurred integration-related costs (included in SG&A and elsewhere) of $132 million and acquisition-related costs of $5 million.
Operating income (loss) for fiscal 2012 and 2011 includes non-cash expenses for depreciation and amortization of $564 million and $653 million and share-based compensation of $8 million and $12 million, respectively.
Interest Expense
Interest expense for fiscal 2012 and 2011 was $432 million and $460 million, respectively, which includes non-cash interest expense of $22 million and $41 million, respectively. Non-cash interest expense for fiscal 2012 includes (1) amortization of debt issuance costs and (2) accretion of debt discount attributable to our senior secured term B-3 loans which were issued on February 11, 2011 as a result of the modification to certain
provisions of the senior secured credit facility. Non-cash interest expense for fiscal 2011 includes: (1) amortization of debt issuance costs and (2) accretion of debt discount attributable to our senior secured incremental term B-2 loans through February 11, 2011 the date on which the loans were repaid in full, and (3) accretion of debt discount attributable to our senior secured term B-3 loans which were issued on February 11, 2011 as a result of the modification to certain provisions of the senior secured credit facility.
Cash interest expense for fiscal 2012 decreased $10 million. The decrease was a result of the expiration of certain unfavorable interest rate swap contracts combined with the impact of the issuance of the senior secured notes and the related repayment of the senior secured incremental B-2 loans. The senior secured notes bear interest at a lower rate per annum than the previously outstanding senior secured incremental term B-2 loans. This decrease was partially offset by an increase in interest expense due to the impact of the amendment and restatement of the senior secured credit facility. The amendment and restatement of the senior secured credit facility resulted in the creation of a new tranche of senior secured term B-3 loans which bear interest at a higher rate per annum than the senior secured term B-1 loans that they replaced. See Note 9, “Financing Arrangements” to our audited Consolidated Financial Statements located elsewhere in this prospectus for further details on the amendment and extension of the senior secured credit facility and the issuance of the senior secured notes.
Loss on Extinguishment of Debt
In connection with the issuance of Avaya Inc.’s senior secured notes and the payment in full of the senior secured incremental term B-2 loans, we recognized a loss on extinguishment of debt for fiscal 2011 of $246 million. The loss represents the difference between the reacquisition price of the incremental term B-2 loans (including consent fees paid by Avaya to the holders of the incremental term B-2 loans that consented to the amendment and restatement of the senior secured credit facility of $1 million) and the carrying value of the incremental term B-2 loans (including unamortized debt discount and debt issue costs). See Note 9, “Financing Arrangements” to our audited Consolidated Financial Statements located elsewhere in this prospectus for further details on the issuance of the senior secured notes and repayment of the senior secured incremental term B-2 loans.
Other (Expense) Income, Net
Other expense, net, for fiscal 2012 was $29 million as compared to other income, net of $5 million for fiscal 2011. During fiscal 2012, other expense, net primarily related to net foreign currency transaction losses of $21 million, changes in the fair value of the preferred series B embedded derivative of $6 million and third party fees incurred in connection with the preparation of the Company’s registration statement of $3 million. During fiscal 2011, net foreign currency transaction gains and interest income were partially offset by fees paid to third parties in connection with the modification of the senior secured term B-1 loan of $9 million.
Provision for Income Taxes
For fiscal 2012 and 2011 the provision for income taxes was $8 million and $68 million and the effective income tax rate was 2% and 9%, respectively.
The effective income tax rate for fiscal 2012 differs from the U.S. Federal tax rate primarily due to (1) the effect of taxable income in certain non-U.S. jurisdictions, (2) the valuation allowance established against the Company’s deferred tax assets, (3) $62 million release of valuation allowance associated with tax expense on net gains in other comprehensive income, (4) $17 million of income tax expense related to undistributed foreign earnings, and (5) $9 million of income tax benefit related to the correction of prior year deferred tax assets and liabilities for certain non-U.S. legal entities.
In fiscal 2012, the Company recorded a tax charge of $62 million to other comprehensive income and a decrease in deferred tax assets primarily relating to post-employment benefits. The charge to other comprehensive income and decrease in deferred tax assets resulted in the recording of a $56 million federal and a
$6 million state income tax benefit in continuing operations related to the release of the corresponding valuation allowance. In fiscal 2011, the Company recorded a tax benefit to other comprehensive income. Therefore, there was no adjustment to the income tax provision in continuing operations.
As of September 30, 2012, the Company changed its indefinite reinvestment of undistributed foreign earnings assertion with respect to its non-U.S. subsidiaries. As a result the Company recorded fiscal 2012 income tax expense of $17 million relating to non-U.S. taxes. In the future, the Company will continue to evaluate whether or not to indefinitely reinvest future undistributed foreign earnings.
During the fourth quarter of fiscal 2012, the Company recorded a correction to prior year deferred tax assets and liabilities for certain non-U.S. legal entities. This adjustment decreased the provision for income taxes by $9 million. Without this adjustment the Company’s provision for income taxes and effective income tax rate would have been $17 million and (5%), respectively for fiscal 2012. The Company evaluated the correction in relation to the current quarter and fiscal 2012, as well as the periods in which the adjustment originated, and concluded that the adjustment is not material to the current year and any prior quarter or year.
The effective income tax rate for fiscal 2011 differs from the U.S. Federal tax rate primarily due to the effect of taxable income in certain non-U.S. jurisdictions and due to the valuation allowance established against the Company’s U.S. deferred tax assets.
See Note 12, “Income Taxes” to our audited Consolidated Financial Statements for further details and a reconciliation of the Company’s loss before income taxes at the U.S. Federal statutory rate to the provision for income taxes.
Summary of the Fiscal Year Ended September 30, 2011 Compared with Fiscal Year Ended September 30, 2010
Revenue
Our revenue for fiscal 2011 and 2010 was $1,325$5,547 million and $1,089$5,060 million, respectively, an increase of $487 million or 10%. The following table sets forth a comparison of revenue by segment:
| Fiscal years ended September 30, | ||||||||||||||||||||||||
| Percentage of Total Revenue | Yr. to Yr. Percent Change | Yr. to Yr. Percent Change, net of Foreign Currency Impact | ||||||||||||||||||||||
In millions | 2011 | 2010 | 2011 | 2010 | ||||||||||||||||||||
GCS | $ | 2,675 | $ | 2,329 | 49 | % | 46 | % | 15 | % | 14 | % | ||||||||||||
Purchase accounting adjustments | (3 | ) | (7 | ) | — | % | — | % | (1) | (1) | ||||||||||||||
Networking | 304 | 280 | 5 | % | 5 | % | 9 | % | 8 | % | ||||||||||||||
|
|
|
|
|
|
|
|
|
|
|
| |||||||||||||
Total ECS product revenue | 2,976 | 2,602 | 54 | % | 51 | % | 14 | % | 13 | % | ||||||||||||||
|
|
|
|
|
|
|
|
|
|
|
| |||||||||||||
AGS | 2,573 | 2,463 | 46 | % | 49 | % | 4 | % | 3 | % | ||||||||||||||
Purchase accounting adjustments | (2 | ) | (5 | ) | — | % | — | % | (1) | (1) | ||||||||||||||
|
|
|
|
|
|
|
|
|
|
|
| |||||||||||||
Total service revenue | 2,571 | 2,458 | 46 | % | 49 | % | 5 | % | 3 | % | ||||||||||||||
|
|
|
|
|
|
|
|
|
|
|
| |||||||||||||
Total revenue | $ | 5,547 | $ | 5,060 | 100 | % | 100 | % | 10 | % | 8 | % | ||||||||||||
|
|
|
|
|
|
|
|
|
|
|
| |||||||||||||
| (1) | Not meaningful |
GCS revenue for fiscal 2011 and 2010 was $2,675 million and $2,329 million, respectively. GCS revenue increased $236$346 million or 22%15% primarily due to incremental revenue from the NES business and increased sales volume. The NES business is included in our results for the entire six months ended March 31,full fiscal 2011 as compared to results for the six months ended March 31,fiscal 2010, which included the results of the NES business for only the period of December 19, 2009 through March 31,
September 30, 2010. The increase inIn 2011, GCS revenue also included an increase in unified communications revenues, which was predominantly the result ofbenefited from the introduction of new product offerings induring the fourth quartersecond half of fiscal 2010 and throughout fiscal 2011 and an increase in new Avaya Aura licenses sold. TheWe believe the additional functionality created by our Avaya Aura technology has also resulted in increased demand for mostacross many of our unified communications product lines.infrastructure solutions. The increase in contact center application solutions revenues was driven by new product offerings. These increases were partially offset by the impact of our divestiture of our 59.13% ownership ofinterest in AGC in August 2010. Until August 31, 2010 which is discussedAGC was our majority-owned subsidiary and its sales to end users were included in Note 4, “Business Combinations and Other Transactions,”our revenues. Our divestiture of AGC allowed us to our consolidated financial statements included elsewherepursue additional channel partners in this prospectus.India while continuing to sell through AGC.
DataNetworking revenue for the six months ended March 31,fiscal 2011 and 2010 was $155$304 million and $107$280 million, respectively. DataNetworking revenue increased $48$24 million or 45%9% primarily due to incremental revenue from the NES business for the entire six months ended March 31,fiscal 2011 as compared to results for the six months ended March 31,fiscal 2010, which included the results of the NES business for only the period of December 19, 2009 through March 31,September 30, 2010. Our datanetworking business was acquired as part of the acquisition of NES on December 18, 2009. The addition of the NES businesses has given Avayaus a position within the global data networking industry, one in which Avaya waswe did not recently participating.participate immediately prior to the acquisition.
AGS revenue for the six months ended March 31,fiscal 2011 and 2010 was $1,279$2,573 million and $1,190$2,463 million, respectively. AGS revenues increased $89$110 million or 7%4% primarily due to incremental revenue from the NES business for the entire six months ended March 31,fiscal 2011 as compared to results for the six months ended March 31, 2010, which included the results of the NES business for only the period of December 19, 2009
through March 31, 2010. The increase in AGS revenue was partially offset by lower revenues due to customers reducing their spending on maintenance contracts in response to economic conditions and the impact of our divestiture of AGC.
The following table sets forth a comparison of revenue by location:
| Six months ended March 31, | ||||||||||||||||||||||||
| 2010 | 2011 | Mix | Yr. to Yr. Percent Change | Yr. to Yr. Percent Change, net of Foreign Currency Impact | ||||||||||||||||||||
| 2010 | 2011 | |||||||||||||||||||||||
| (dollars in millions) | ||||||||||||||||||||||||
U.S. | $ | 1,289 | $ | 1,494 | 54 | % | 54 | % | 16 | % | 16 | % | ||||||||||||
International: | ||||||||||||||||||||||||
Germany | 285 | 251 | 12 | % | 9 | % | -12 | % | -6 | % | ||||||||||||||
EMEA (excluding Germany) | 383 | 491 | 16 | % | 18 | % | 28 | % | 28 | % | ||||||||||||||
Total EMEA | 668 | 742 | 28 | % | 27 | % | 11 | % | 14 | % | ||||||||||||||
APAC—Asia Pacific | 217 | 254 | 9 | % | 9 | % | 17 | % | 14 | % | ||||||||||||||
Americas International—Canada and Central and Latin America | 206 | 266 | 9 | % | 10 | % | 29 | % | 26 | % | ||||||||||||||
Total International | 1,091 | 1,262 | 46 | % | 46 | % | 16 | % | 16 | % | ||||||||||||||
Total revenue | $ | 2,380 | $ | 2,756 | 100 | % | 100 | % | 16 | % | 16 | % | ||||||||||||
Revenue in the U.S. for the six months ended March 31, 2011 and 2010 was $1,494 million and $1,289 million, respectively. Revenue in the U.S. increased $205 million or 16% primarily due to incremental revenue from the NES business for the entire six months ended March 31, 2011 as compared to results for the six months ended March 31,fiscal 2010, which included the results of the NES business for only the period of December 19, 2009 through March 31,September 30, 2010. This increase also included an increase in sales volume
The following table sets forth a comparison of unified communications products, partially offsetrevenue by decreases resulting from lower sales associated with customers reducing spending on maintenance contracts. location:
| Fiscal years ended September 30, | ||||||||||||||||||||||||
| Percentage of Total Revenue | Yr. to Yr. Percentage Change | Yr. to Yr. Percentage Change, net of Foreign Currency Impact | ||||||||||||||||||||||
Dollars in millions | 2011 | 2010 | 2011 | 2010 | ||||||||||||||||||||
U.S. | $ | 2,998 | $ | 2,764 | 54 | % | 55 | % | 8 | % | 8 | % | ||||||||||||
International: | ||||||||||||||||||||||||
EMEA | 1,488 | 1,383 | 27 | % | 27 | % | 8 | % | 6 | % | ||||||||||||||
APAC—Asia Pacific | 515 | 464 | 9 | % | 9 | % | 11 | % | 8 | % | ||||||||||||||
Americas International—Canada and Latin America | 546 | 449 | 10 | % | 9 | % | 22 | % | 18 | % | ||||||||||||||
|
|
|
|
|
|
|
|
|
|
|
| |||||||||||||
Total International | 2,549 | 2,296 | 46 | % | 45 | % | 11 | % | 9 | % | ||||||||||||||
|
|
|
|
|
|
|
|
|
|
|
| |||||||||||||
Total revenue | $ | 5,547 | $ | 5,060 | 100 | % | 100 | % | 10 | % | 8 | % | ||||||||||||
|
|
|
|
|
|
|
|
|
|
|
| |||||||||||||
Revenue in EMEAthe U.S. for the six months ended March 31,fiscal 2011 and 2010 was $742$2,998 million and $668$2,764 million, respectively. Revenue in EMEAthe U.S. increased $74$234 million or 11%8% primarily due to incremental revenue from the NES business for the entire six months ended March 31,fiscal 2011 as compared to results for the six months ended March 31,fiscal 2010, which included the results of the NES business for only the period of December 19, 2009 through March 31,September 30, 2010. This increase also included an increase in sales volume driven by new product offerings. Revenue in EMEA for fiscal 2011 and 2010 was $1,488 million and $1,383 million, respectively. Revenue in EMEA increased $105 million or 8% primarily due to incremental revenue from the NES business for fiscal 2011 as compared to results for fiscal 2010, which included the results of the NES business for only the period of December 19, 2009 through September 30, 2010 and an increase in sales volume of unified communications products. The increase of revenue in EMEA was partially offset by a decrease of revenue in Germany attributable to decreases resulting from customers reducing spending on maintenancesupport contracts and the decline in our rental base.base as lease renewals are typically at lower rates, which is expected to continue in fiscal 2012. Revenue in Asia Pacific, or APAC and Canada and Central and Latin America, or Americas International also increased $37$51 million and $60$97 million, respectively, primarilyrespectively. The increases were due to incremental revenue from the NES business for the entire six months ended March 31,fiscal 2011 as compared to results for the six months ended March 31,fiscal 2010, which included the results of the NES business for only the period of December 19, 2009 through March 31, 2010. The increase in revenue in APACSeptember 30, 2010, increased sales volume driven by new product offerings and Americas International included an increase in sales volume for our unified communications products,professional services, as well as the
favorable impact of foreign currency. The increase in revenue in APAC was partially offset by the impact of our divestiture of AGC in August 2010. Although we continue to market to end users in the APAC region through the indirect channel using AGC as a business partner, sales through our indirect channel generally generate lower top line revenue due to volume discounts.
We continue to expand our market coverage by investing more in the indirect channel through our partners worldwide, including system integrators, service providers, value-added resellers and business partners that provide sales and service support. The following table sets forth a comparison of revenue from sales of products by channel:
| Six months ended March 31, | Fiscal years ended September 30, | |||||||||||||||||||||||||||||||||||||||||||||||
| 2010 | 2011 | Mix | Yr. to Yr. Percent Change | Yr. to Yr. Percent Change, net of Foreign Currency Impact | Percentage of ECS Product Revenue | Yr. to Yr. Percentage Change | Yr. to Yr. Percentage Change, net of Foreign Currency Impact | |||||||||||||||||||||||||||||||||||||||||
| 2010 | 2011 | |||||||||||||||||||||||||||||||||||||||||||||||
| (dollars in millions) | ||||||||||||||||||||||||||||||||||||||||||||||||
Dollars in millions | 2011 | 2010 | 2011 | 2010 | ||||||||||||||||||||||||||||||||||||||||||||
Direct | $ | 395 | $ | 339 | 33 | % | 23 | % | -14 | % | -13 | % | $ | 700 | $ | 763 | 24 | % | 29 | % | (8 | )% | (10 | )% | ||||||||||||||||||||||||
Indirect | 798 | 1,140 | 67 | % | 77 | % | 43 | % | 42 | % | 2,276 | 1,839 | 76 | % | 71 | % | 24 | % | 23 | % | ||||||||||||||||||||||||||||
|
|
|
|
|
| |||||||||||||||||||||||||||||||||||||||||||
Total sales of products | $ | 1,193 | $ | 1,479 | 100 | % | 100 | % | 24 | % | 24 | % | ||||||||||||||||||||||||||||||||||||
Total ECS product revenue | $ | 2,976 | $ | 2,602 | 100 | % | 100 | % | 14 | % | 13 | % | ||||||||||||||||||||||||||||||||||||
|
|
|
|
|
| |||||||||||||||||||||||||||||||||||||||||||
The percentage of product sales through the indirect channel increased by 105 percentage points to 77%76% in the first six months of fiscal year 2011 as compared to 67%71% in the corresponding period in fiscal year 2010. The increase was predominantlyprimarily attributable to the incremental product sales from the NES business which, prior to the acquisition of NES, was substantially generated through the indirect channel and the impact of the sale of AGC in August 2010. As a result of our divestiture of AGC, we continue to market to end users through AGC and those sales in fiscal year 2011 are included in our indirect revenues. During most of fiscal yearUntil August 31, 2010 AGC was our majority-owned subsidiary and its sales to end users were included in our direct revenues. In addition, the increase is also attributable to the incremental product sales from the NES business, which, prior to the acquisition of NES, were substantially generated through the indirect channel. Due to higher volume discounts, sales through the indirect channel generally generate lower margins than direct sales. However, our use of the indirect channel lowers selling expenses and allows us to reach more end users.
Gross MarginProfit
The following table sets forth a comparison of gross marginprofit by segment:
| Six months ended March 31, | ||||||||||||||||||||||||
| Percent of Revenue | ||||||||||||||||||||||||
| 2010 | 2011 | 2010 | 2011 | Change | ||||||||||||||||||||
| (dollars in millions) | ||||||||||||||||||||||||
GCS margin | $ | 604 | $ | 736 | 55.5 | % | 55.5 | % | $ | 132 | 22 | % | ||||||||||||
Data margin | 45 | 67 | 42.1 | % | 43.2 | % | 22 | 49 | % | |||||||||||||||
AGS margin | 553 | 599 | 46.5 | % | 46.8 | % | 46 | 8 | % | |||||||||||||||
Amortization of technology intangible assets and the impact of purchase accounting adjustments | (156 | ) | (141 | ) | (1) | (1) | 15 | (1) | ||||||||||||||||
Total gross margin | $ | 1,046 | $ | 1,261 | 43.9 | % | 45.8 | % | $ | 215 | 21 | % | ||||||||||||
| Fiscal years ended September 30, | ||||||||||||||||||||||||
| Gross Profit | Gross Margin | |||||||||||||||||||||||
Dollars in millions | 2011 | 2010 | 2011 | 2010 | Change | |||||||||||||||||||
GCS | $ | 1,532 | $ | 1,249 | 57.3 | % | 53.6 | % | $ | 283 | 23 | % | ||||||||||||
Networking | 131 | 117 | 43.1 | % | 41.8 | % | 14 | 12 | % | |||||||||||||||
|
|
|
|
|
|
|
|
|
|
|
| |||||||||||||
ECS | 1,663 | 1,366 | 55.9 | % | 52.5 | % | 297 | 22 | % | |||||||||||||||
AGS | 1,222 | 1,119 | 47.5 | % | 45.4 | % | 103 | 9 | % | |||||||||||||||
Unallocated amounts | (253 | ) | (313 | ) | (1) | (1) | 60 | (1) | ||||||||||||||||
|
|
|
|
|
|
|
|
|
|
|
| |||||||||||||
Total | $ | 2,632 | $ | 2,172 | 47.4 | % | 42.9 | % | $ | 460 | 21 | % | ||||||||||||
|
|
|
|
|
|
|
|
|
|
|
| |||||||||||||
| (1) | Not |
Gross marginprofit for the six months ended March 31,fiscal 2011 and 2010 was $1,261$2,632 million and $1,046$2,172 million, respectively. Gross marginprofit increased by $215$460 million or 21% primarily due to the incremental margin from the NES business for the entire six months ended March 31,fiscal 2011 as compared to results for the six months ended March 31,fiscal 2010, which included the results of the NES business for only the period of December 19, 2009 through March 31, 2010. The grossSeptember 30, 2010 and an increase in sales volume. Gross margin percentage increased to 45.8%47.4% for fiscal 2011 from 42.9% for the six months ended March 31, 2011 from 43.9% for the six months ended March 31,fiscal 2010. The increase in gross marginprofit and gross margin percentage is primarily due to higher sales volume which leveraged our fixed costs, prior period cost saving initiatives including exiting facilities and reducing the impact ofworkforce and relocating positions to lower-cost geographies and lower amortization of technology intangible assets, on higher sales volume, partially offset by higher costs associated with our employee incentive programs.programs, which are driven by our actual financial results relative to established targets.
GCS gross marginprofit for the six months ended March 31,fiscal 2011 and 2010 was $736$1,532 million and $604$1,249 million, respectively. GCS gross marginprofit increased $132$283 million or 22%23% primarily due to the incremental margin provided by
the NES business for the entire six months ended March 31,fiscal 2011 as compared to results for the six months ended March 31,fiscal 2010, which included the results of the NES business for only the period of December 19, 2009 through March 31, 2010. The increase in GCS gross margin also includedSeptember 30, 2010 and an increase in sales volume of unified communications products. Thedriven by new product offerings. GCS gross margin was 55.5%increased to 57.3% for the six months ended March 31,fiscal 2011 andfrom 53.6% for fiscal 2010. The increase in gross margin percentage remained flatis primarily due to the increase in sales volume which leveraged our fixed costs offset byand prior period cost saving initiatives including exiting facilities and reducing the impact of the acquisition of the NES business, which historically experienced lower margin percentages.workforce and relocating positions to lower-cost geographies.
DataNetworking gross marginprofit for the six months ended March 31,fiscal 2011 and 2010 was $67$131 million and $45$117 million, respectively. Our datanetworking business was acquired as part of the acquisition of NES on December 18, 2009. Results for the six months ended March 31,fiscal 2011 includeincludes the impact of the NES business for the entire six monthsyear as compared to results for the six months ended March 31,fiscal 2010, which included the results of the NES business for only the period of December 19, 2009 through March 31,September 30, 2010. Gross margin increased to 43.1% for fiscal 2011 from 41.8% in fiscal 2010. The increase in gross margin is primarily due to a reduction in costs of our networking products, partially offset by pricing pressures impacting revenues.
AGS gross marginprofit for the six months ended March 31,fiscal 2011 and 2010 was $599$1,222 million and $553$1,119 million, respectively. AGS gross marginprofit increased $46$103 million or 8%9% primarily due to an increase in revenues from professional services. The increase in AGS gross margin also included the incremental margin provided by the NES business for the entire six months ended March 31,fiscal 2011 as compared to results for the six months ended March 31,fiscal 2010, which included the results of the NES business for only the period of December 19, 2009 through March 31,September 30, 2010. The increase in AGS gross margin was partially offset by lower revenues due to customers reducing their spending on maintenance contracts in response to economic conditions. The AGS gross margin percentage increased to 46.8%47.5% for the six months ended March 31,fiscal 2011 from 46.5%45.4% for the six months ended March 31,fiscal 2010. The change in gross margin percentage is primarily attributable to the continued benefit from cost saving initiatives, which include the benefit of productivity improvements from reducing the workforce and relocating positions to lower cost geographies partially offset by the effects of the acquired NES business for the period December 19, 2009 through March 31,September 30, 2010. The acquired NES business historically experienced lower services margins prior to the acquisition. Accordingly, the acquisition of NES negatively impacts the gross margin percentage of AGS for the period presented.
Total gross marginprofit for the six months ended March 31,fiscal 2011 and 2010 included the effect of certain acquisition adjustments including the amortization of acquired technology intangibles and the amortization of the inventory step-up related to the acquisition of NES and the Merger.
Operating expenses
The following table sets forth a comparison of operating expenses:
| Six months ended March 31, | ||||||||||||||||||||||||
| Percent of Revenue | ||||||||||||||||||||||||
| 2010 | 2011 | 2010 | 2011 | Change | ||||||||||||||||||||
| (dollars in millions) | ||||||||||||||||||||||||
Selling, general and administrative | $ | 833 | $ | 931 | 35.0 | % | 33.8 | % | $ | 98 | 12 | % | ||||||||||||
Research and development | 197 | 236 | 8.3 | % | 8.6 | % | 39 | 20 | % | |||||||||||||||
Amortization of intangible assets | 107 | 112 | 4.5 | % | 4.1 | % | 5 | 5 | % | |||||||||||||||
Impairment of long-lived assets | 16 | — | 0.7 | % | 0.0 | % | (16 | ) | (1) | |||||||||||||||
Restructuring charges, net | 83 | 64 | 3.5 | % | 2.3 | % | (19 | ) | -23 | % | ||||||||||||||
Acquisition-related costs | 19 | 4 | 0.8 | % | 0.1 | % | (15 | ) | (1) | |||||||||||||||
Total operating expenses | $ | 1,255 | $ | 1,347 | 52.8 | % | 48.9 | % | $ | 92 | 7 | % | ||||||||||||
| Fiscal years ended September 30, | ||||||||||||||||||||||||
| Percentage of Revenue | ||||||||||||||||||||||||
Dollars in millions | 2011 | 2010 | 2011 | 2010 | Change | |||||||||||||||||||
Selling, general and administrative | $ | 1,845 | $ | 1,721 | 33.3 | % | 34.0 | % | $ | 124 | 7 | % | ||||||||||||
Research and development | 461 | 407 | 8.3 | % | 8.0 | % | 54 | 13 | % | |||||||||||||||
Amortization of intangible assets | 226 | 218 | 4.1 | % | 4.3 | % | 8 | 4 | % | |||||||||||||||
Restructuring and impairment charges, net | 189 | 187 | 3.4 | % | 3.7 | % | 2 | 1 | % | |||||||||||||||
Acquisition-related costs | 5 | 20 | 0.1 | % | 0.4 | % | (15 | ) | (75 | )% | ||||||||||||||
|
|
|
|
|
|
|
|
|
|
|
| |||||||||||||
Total operating expenses | $ | 2,726 | $ | 2,553 | 49.2 | % | 50.4 | % | $ | 173 | 7 | % | ||||||||||||
|
|
|
|
|
|
|
|
|
|
|
| |||||||||||||
Selling, general and administrative, or SG&A expenses for the six months ended March 31,fiscal 2011 and 2010 were $931$1,845 million and $833$1,721 million, respectively, an increase of $98$124 million. The increase in expenses was due
to incremental SG&A expenses incurred by the NES business for the entire six months ended March 31,fiscal 2011 as compared to results for the six months ended March 31,fiscal 2010, which included the results of the NES business for only the period of December 19, 2009 through March 31, 2010,September 30, 2010. In addition, the increases included unfavorable impacts of foreign currency, as well as higher costs associated withunder our employee incentive programs.plans, which are driven by actual results versus established targets. These increases were partially offset by decreases in integration-related costs. Integration-related costs included in SG&A were $87$102 million and $83$154 million for the six months ended March 31,fiscal 2011 and 2010,
respectively. Integration-related costs primarily represent third-party consulting fees and other administrative costs associated with consolidating and coordinating the operations of Avaya and NES. These costs were incurred in connection with, among other things, the on-boarding of NES personnel, developing compatible IT systems and internal processes, and developing and implementing a strategic operating plan to help enable a smooth transition with minimal disruption to NES customers. Such costs also include fees paid to certain Nortel-controlled entities for logisticlogistics and other support functions being performed on a temporary basis pursuant to a transition services agreement. These costs were partially offset bySG&A also decreased as a result of the continued benefit from cost savings initiatives implemented in prior periods, which included exiting facilities and reducing the workforce and relocating positions to lower-cost geographies.geographies and the impact of our divestiture of AGC in August 2010. Until August 31, 2010 AGC was our majority-owned subsidiary and its SG&A expenses were included in our SG&A expenses.
R&D expenses for the six months ended March 31,fiscal 2011 and 2010 were $236$461 million and $197$407 million, respectively, an increase of $39$54 million. The increase in R&D expenses was due to incremental R&D expenses from the acquired NES business for the entire six months ended March 31,fiscal 2011 as compared to results for the six months ended March 31,fiscal 2010, which included the results of the NES business for only the period of December 19, 2009 through March 31,September 30, 2010, as well as higher costs associated withunder our employee incentive programs. This increase was partially offset by reductions resulting from continued focus on cost saving initiatives and the re-prioritization of projects.
Amortization of intangible assets for the six months ended March 31,fiscal 2011 and 2010 was $112$226 million and $107$218 million, respectively, an increase of $5$8 million. The increase was due to amortization related to intangible assets acquired in connection with the acquisition of NES for the entire six months ended March 31, 2011 as compared to results for the six months ended March 31, 2010, which included the results of the NES business for only the period of December 19, 2009 through March 31, 2010.
Our acquisition of NES provided us with access to several proprietary technologies that previously were not available to Avaya. Some of these technologies, based on their functionality, overlapped with our pre-existing technologies. In order to realize synergies and reduce our expenditures on research and development and marketing, the number of technologies Avaya supported was reduced. As a result, we identified certain technologies associated with our GCS products segment that were redundant to others that Avaya no longer aggressively develops and markets. The Company recorded an impairment charge of $16 million in the six months ended March 31, 2010 associated with these technologies. The Company determined that no events or circumstances changed during the six months ended March 31, 2011 that would indicate that other technologies are impaired.
Restructuring and impairment charges, net, for the six months ended March 31,fiscal 2011 and 2010 were $64$189 million and $83$187 million, respectively, a decreasean increase of $19$2 million. During fiscal year2011 and 2010, we continued our focus on controlling costs. In response to the global economic climate and in anticipation of the acquisition of NES, we began implementing additional initiatives designed to streamline our operations, generate cost savings, and eliminate overlapping processes and expenses associated with the NES business. These initiatives include exiting facilities and reducing the workforce or relocating positions to lower cost geographies. Restructuring charges recorded during fiscal 2011 include employee separation costs of $153 million and lease obligations of $36 million. Employee separation charges for this period include $56 million associated with an agreement reached with the six months ended March 31,works council representing employees of certain of the Company’s German subsidiaries for the elimination of 210 employee positions. Severance and employment benefits payments associated with this action are expected to be paid through fiscal 2014, and include, but are not limited to, social pension fund payments and health care and unemployment insurance costs to be paid to or on behalf of the affected employees. For fiscal 2011, lease obligations included in restructuring charges represent the remaining lease obligations associated with facilities vacated during the period primarily in Ireland and the U.S. Restructuring charges recorded during fiscal 2010 include employee separation costs of $147 million and lease obligations of $24 million and primarily include costs associated with involuntary employee severance actions in EMEA and the U.S. and facilities vacated during the period primarily in the U.S. and United Kingdom.
In addition, during fiscal 2010, we recorded an impairment charge of $16 million associated with certain technologies in the NES acquisition. Our acquisition of NES provided us with access to several proprietary technologies that previously were not available to Avaya. Some of these technologies, based on their functionality, overlapped with our pre-existing technologies. In order to realize synergies and reduce our expenditures on research and development and marketing, the number of technologies Avaya supports is being reduced. As thea result, we identified certain technologies associated with our GCS products segment that are redundant to others that Avaya no longer aggressively develops and markets. The Company continues to evaluate its cost structure, additional restructuring opportunities may be identified.determined that no events or circumstances changed during fiscal 2011 that would indicate that any technologies were impaired.
Acquisition-related costs for the six months ended March 31,fiscal 2011 and 2010 were $4$5 million and $19$20 million, respectively, a decrease of $15 million, and include third-party legal and other costs related to business acquisitions in fiscal year 2011 and the acquisition of NES in fiscal year 2010.
Operating Loss
Operating loss for the six months ended March 31,fiscal 2011 was $86$94 million compared to $209$381 million for the six months ended March 31,fiscal 2010.
Results for the six months ended March 31,fiscal 2011 include the impact of the operating results associated with the NES business, which includes the effect of certain acquisition adjustments and the amortization of acquired technology and customer intangibles, for the entire six months ended March 31,fiscal 2011 as compared to results for the six months ended March 31,fiscal 2010, which included the results of the NES business for only the period of December 19, 2009 through March 31,September 30, 2010. In addition, for the six months ended March 31,fiscal 2011, we incurred integrationintegration-related costs (included in SG&A)&A and elsewhere) of $47$132 million and acquisition-related costs of $4$5 million, as described above. For the six months ended March 31,fiscal 2010, we incurred integrationintegration-related costs (included in SG&A and elsewhere) of $47$208 million, acquisition-related costs of $19$20 million and an impairment of $16 million to our long-lived assets.
Our operating loss for the six months ended March 31,fiscal 2011 and 2010 includes non-cash expenses for depreciation and amortization of $335$653 million and $342 million$691 and share-based compensation of $6$12 million and $11$19 million, respectively.
Interest Expense
Interest expense for the six months ended March 31,fiscal 2011 and 2010 was $240$460 million and $229$487 million, which includes non-cash interest expense of $28$41 million and $64$105 million, respectively. Non-cash interest expense for the six months ended March 31,fiscal 2011 includes (1) amortization of debt issuance costs, (2) accretion of debt discount attributable to Avaya Inc.’sthe senior secured incremental term B-2 loans, which were issued in connection with the acquisition of NES, through February 11, 2011, the date on which thethose loans were repaid in full, and (3) accretion of debt discount attributable to Avaya Inc.’sthe senior secured term B-3 loans, which were issued on February 11, 2011 as a result of the modification to certain provisions of the senior secured credit facility. Non-cash interest expense for the six months ended March 31,fiscal 2010 includes:includes (1) amortization of debt issuance costs, (2) accretion of debt discount attributable to Avaya Inc.’sthe senior secured incremental term B-2 loans issued in connection with the acquisition of NES and (3) PIK interest, which weAvaya Inc. elected to finance through Avaya Inc.’sthe senior unsecured PIK toggle notes for the period of May 1, 20102009 through October 31, 20102009 and November 1, 20102009 through April 30, 2010.
Cash interest expense for the six months ended March 31,fiscal 2011 increased as a result of (1) the Company’sour election to pay cash interest on Avaya Inc.’sour senior unsecured PIK toggle notes for the periodperiods of May 1, 2010 through October 31, 2010, and November 1, 2010 through April 30, 2011, (2) cash interest expense attributable to the financing associated with the acquisition of NES, and (3)May 1, 2011 through October 31, 2011, and (2) the amendment and restatement of the senior secured credit facility. The senior secured incremental term B-2 loans were issued on December 18, 2009 in connection with the acquisition of NES and repaid in full on February 11, 2011 with the proceeds from the issuance of the senior secured notes. As a result, financing associated with the acquisition of NES was outstanding for a longer period during the six months ended March 31, 2011 as compared to the six months ended March 31, 2010. The amendment and restatement of the senior secured credit facility resulted in anpermitted the extension of the maturity of a portion of the senior secured term B-1 loans representing outstanding principal amounts of $2.2 billion from October 26, 2014 to October 26, 2017 by converting such loans into a new tranche of senior secured B-3 loans that bear interest at a higher rate per annum than the senior secured term B-1 loans that they replaced. This increase was partially offset by decreased cash interest expense as a result of the expiration of certain interest rate swap contracts associated with Avaya Inc.’sour senior secured credit facility. See Note 9, “Financing Arrangements,”Arrangements” to our consolidated financial statementsaudited Consolidated Financial Statements for further details on the amendment and extension of the senior secured credit facility and the issuance of the senior secured notes.facility.
Loss on Extinguishment of Debt
In connection with the issuance of Avaya Inc.’sthe senior secured notes and the payment in full of the senior secured incremental term B-2 loans, we recognized a loss on extinguishment of debt for the six months ended March 31,fiscal 2011 of $246 million. The loss represents the difference between the reacquisition price of the senior
secured incremental term B-2 loans (including $1 million of consent fees paid by Avaya Inc. to the holders of the senior secured incremental term B-2 loans that consented to the amendment and restatement of the senior secured credit facility of $1 million)facility) and the carrying value of the senior secured incremental term B-2 loans (including unamortized debt discount and debt issue costs). See Note 9, “Financing Arrangements,”Arrangements” to our consolidated financial statementsaudited Consolidated Financial Statements for further details on the issuance of Avaya Inc.’sthe senior secured notes and repayment of the senior secured incremental term B-2 loans.
Other Income, Net
Other income, net for the six months ended March 31,fiscal 2011 and 2010 was $1 million as compared to $5 million for the six months ended March 31, 2010. This difference primarily representsand $15 million, respectively, a decrease of $10 million. For fiscal 2011 other income, net includes fees paid to third parties in connection with the modification of the senior secured term B-1 loan of $9 million offset by interest income and net foreign currency transaction gains of $9 million during the six months ended March 31, 2011 and $2 million of net foreign currency transaction gains for the six months ended March 31, 2010.
Provision for (Benefit from) Income Taxes
The provision for income taxes for the six months ended March 31, 2011 was $41 million, as compared to the benefit from income taxes for the six months ended March 31, 2010 of $16 million. The effective tax rate for the six months ended March 31, 2011 was 7.2% and the benefit rate for the six months ended March 31, 2010 was 3.7%, and differs from the U.S. federal tax rate primarily due to the effect of taxable income in non-U.S. jurisdictions and due to the valuation allowance established against the Company’s U.S. deferred tax assets. The tax benefit for the six months ended March 31, 2010 includes a $10 million reduction in the Company’s unrecognized tax benefits due to the settlement of a global tax issue plus the reversal of interest in the amount of $5 million.
Fiscal Year Ended September 30, 2010 Compared with Fiscal Year Ended September 30, 2009
Revenue
Our revenue for fiscal year 2010 and 2009 was $5,060 million and $4,150 million, respectively, an increase of $910 million or 22%. The following table sets forth a comparison of revenue by segment:
| Fiscal year ended September 30, | ||||||||||||||||||||||||
| Percent of Total Revenue | Yr. to Yr. Percent Change | Yr. to Yr. Percent Change, net of Foreign Currency Impact | ||||||||||||||||||||||
| 2009 | 2010 | 2009 | 2010 | |||||||||||||||||||||
| (dollars in millions) | ||||||||||||||||||||||||
GCS | $ | 1,939 | $ | 2,327 | 46 | % | 46 | % | 20 | % | 19 | % | ||||||||||||
Purchase accounting adjustments | (16 | ) | (7 | ) | 0 | % | 0 | % | (1) | (1) | ||||||||||||||
Data | — | 282 | 0 | % | 5 | % | (1) | (1) | ||||||||||||||||
Total product revenue | 1,923 | 2,602 | 46 | % | 51 | % | 35 | % | 34 | % | ||||||||||||||
AGS | 2,227 | 2,463 | 54 | % | 49 | % | 11 | % | 10 | % | ||||||||||||||
Purchase accounting adjustments | — | (5 | ) | 0 | % | 0 | % | (1) | (1) | |||||||||||||||
Total service revenue | 2,227 | 2,458 | 54 | % | 49 | % | 10 | % | 10 | % | ||||||||||||||
Total revenue | $ | 4,150 | $ | 5,060 | 100 | % | 100 | % | 22 | % | 21 | % | ||||||||||||
GCS revenue for fiscal year 2010 and 2009 was $2,327 million and $1,939 million, respectively. GCS revenue increased $388 million or 20% primarily due to incremental revenue from the NES business and the favorable impact of foreign currency. The increase in GCS revenues was partially offset by lower sales volume of communications infrastructure partially attributable to global economic conditions and cautious spending by
Avaya’s established customer base as Avaya’s product line was in transition during the first half of fiscal year 2010. The acquisition of NES in fiscal year 2010 resulted in an increase in the number of products under development and presented challenges in sales force and partner training and product positioning. We believe this resulted in lower comparable revenues during the first half of fiscal year 2010 as many customers curtailed purchases and upgrades until we completed the integration of the Avaya and NES product portfolios. During the second half of fiscal year 2010, we completed the integration of the Avaya and NES product lines as we continued to execute our new product roadmap and launched a series of new products, including our new video portfolio.
Data revenue for fiscal year 2010 was $282 million. Our data business was acquired as part of the acquisition of NES on December 18, 2009. The addition of the NES businesses has given Avaya a position within the global data networking industry, one in which Avaya was not recently participating.
AGS revenue for fiscal year 2010 and 2009 was $2,463 million and $2,227 million, respectively. AGS revenue increased $236 million or 11% primarily due to incremental revenue from the NES business and the favorable impact of foreign currency. The increase in AGS revenues was partially offset by lower revenues due to customers reducing their spending by cancelling or reducing maintenance contract services, which we believe was in response to economic conditions. As we implemented the strategic decision to broaden our market coverage through the indirect channel, we incurred a loss of certain service agreements to channel partners. In addition, due to the decline in comparable product revenues, associated revenues for certain product support, implementation and professional services also declined.
The following table sets forth a comparison of revenue by location:
| Fiscal Year ended September 30, | ||||||||||||||||||||||||
| Mix | Yr. to Yr. Percent Change | Yr. to Yr. Percent Change, net of Foreign Currency Impact | ||||||||||||||||||||||
| 2009 | 2010 | 2009 | 2010 | |||||||||||||||||||||
| (dollars in millions) | ||||||||||||||||||||||||
U.S. | $ | 2,276 | $ | 2,764 | 55 | % | 55 | % | 21 | % | 21 | % | ||||||||||||
International: | ||||||||||||||||||||||||
Germany | 579 | 537 | 14 | % | 10 | % | -7 | % | -8 | % | ||||||||||||||
EMEA (excluding Germany) | 613 | 846 | 15 | % | 17 | % | 38 | % | 38 | % | ||||||||||||||
Total EMEA | 1,192 | 1,383 | 29 | % | 27 | % | 16 | % | 16 | % | ||||||||||||||
APAC—Asia Pacific | 350 | 464 | 8 | % | 9 | % | 33 | % | 29 | % | ||||||||||||||
Americas International—Canada and Central and Latin America | 332 | 449 | 8 | % | 9 | % | 35 | % | 29 | % | ||||||||||||||
Total International | 1,874 | 2,296 | 45 | % | 45 | % | 23 | % | 20 | % | ||||||||||||||
Total revenue | $ | 4,150 | $ | 5,060 | 100 | % | 100 | % | 22 | % | 21 | % | ||||||||||||
Revenue in the U.S. for fiscal year 2010 and 2009 was $2,764 million and $2,276 million, respectively. Revenue in the U.S. increased $488 million or 21% primarily due to incremental revenue from the NES business partially offset by a decline in services revenue due to customers cancelling or renegotiating maintenance contracts, a decrease in demand as a result of the global economy and cautious spending by our customers, as well as the curtailment of purchases and upgrades by many customers while the Company completed its consolidation of the NES and Avaya product lines. Revenue in EMEA for fiscal year 2010 and 2009 was $1,383 million and $1,192 million, respectively. Revenue in EMEA increased $191 million or 16% primarily as a result of incremental revenue from the NES business and the impact of foreign currency. The increase was partially offset by decreases attributable to the exiting of lower-margin product and service offerings and weakness in the European economy. Excluding the impacts of the incremental revenue from the NES business and foreign currency, revenues in APAC increased slightly, while revenues in Central and Latin America, or CALA, decreased slightly.
We continue to expand our market coverage by investing more in the indirect channel through our partners worldwide, including system integrators, service providers, value-added resellers and business partners that provide sales and service support. The following table sets forth a comparison of revenue from sales of products by channel:
| Year ended September 30, | ||||||||||||||||||||||||
| Percent of Total Revenue | Yr. to Yr. Percent Change | Yr. to Yr. Percent Change, net of Foreign Currency Impact | ||||||||||||||||||||||
| 2009 | 2010 | 2009 | 2010 | |||||||||||||||||||||
| (dollars in millions) | ||||||||||||||||||||||||
Direct | $ | 905 | $ | 765 | 47 | % | 29 | % | -15 | % | -17 | % | ||||||||||||
Indirect | 1,023 | 1,841 | 53 | % | 71 | % | 80 | % | 80 | % | ||||||||||||||
Total sales of products | $ | 1,928 | $ | 2,606 | 100 | % | 100 | % | 35 | % | 34 | % | ||||||||||||
The percentage of product sales through the indirect channel increased by 18 percentage points to 71% in fiscal year 2010 as compared to 53% in fiscal year 2009. The increase was predominantly attributable to the incremental product sales from the NES business, which, prior to the acquisition of NES, were substantially generated through the indirect channel. Excluding the impact of NES, the percentage of product sales through the indirect channel also increased for fiscal year 2010 as compared to fiscal year 2009. As a result of higher volume discounts, sales through the indirect channel generally generate lower margins than direct sales. Avaya’s use of the indirect channel lowers selling expenses and allows us to reach more end users.
Gross Margin
The following table sets forth a comparison of gross margin by segment:
| Fiscal year ended September 30, | ||||||||||||||||||||||||
| Percent of Revenue | ||||||||||||||||||||||||
| 2009 | 2010 | 2009 | 2010 | Change | ||||||||||||||||||||
| (dollars in millions) | ||||||||||||||||||||||||
GCS margin | $ | 1,066 | $ | 1,249 | 55.0 | % | 53.7 | % | $ | 183 | 17 | % | ||||||||||||
Data margin | — | 117 | (1) | 41.5 | % | 117 | (1) | |||||||||||||||||
AGS margin | 1,065 | 1,119 | 47.8 | % | 45.4 | % | 54 | 5 | % | |||||||||||||||
Amortization of technology intangible assets and the impact of purchase accounting adjustments | (265 | ) | (313 | ) | (1) | (1) | (48 | ) | (1) | |||||||||||||||
Total gross margin | $ | 1,866 | $ | 2,172 | 45.0 | % | 42.9 | % | $ | 306 | 16 | % | ||||||||||||
Gross margin for fiscal year 2010 and 2009 was $2,172 million and $1,866 million, respectively. Gross margin increased by $306 million or 16% primarily due to the incremental margin from the NES business and the favorable impact of foreign currency.
GCS gross margin for fiscal year 2010 and 2009 was $1,249 million and $1,066 million, respectively. GCS gross margin increased $183 million or 17% primarily due to incremental margin provided by the NES business and the favorable impact of foreign currency. The increase in gross margin was partially offset by the decline in sales volume and pricing in the U.S. and EMEA. The GCS gross margin percentage decreased to 53.7% for fiscal year 2010 from 55.0% for fiscal year 2009. The decrease in gross margin percentage is primarily due to the lower gross margin percentage of the NES business.
Data gross margin for fiscal year 2010 was $117 million with a gross margin percentage of 41.5%. We acquired our data business as part of the acquisition of NES on December 18, 2009.
AGS gross margin for fiscal year 2010 and 2009 was $1,119 million and $1,065 million, respectively. AGS gross margin increased $54 million or 5% primarily due to incremental margin provided by the NES business and the favorable impact of foreign currency. The AGS gross margin percentage decreased to 45.4% for fiscal year 2010 from 47.8% for fiscal year 2009. The decrease in gross margin percentage is primarily due to the lower gross margin percentage of the NES business.
Total gross margin for fiscal year 2010 and 2009 included the effect of certain acquisition adjustments including the amortization of acquired technology intangibles and the amortization of the inventory step-up related to the acquisition of NES and the Merger.
Operating expenses
The following table sets forth a comparison of operating expenses:
| Fiscal year ended September 30, | ||||||||||||||||||||||||
| Percent of Revenue | ||||||||||||||||||||||||
| 2009 | 2010 | 2009 | 2010 | Change | ||||||||||||||||||||
| (dollars in millions) | ||||||||||||||||||||||||
Selling, general and administrative | $ | 1,272 | $ | 1,721 | 30.7 | % | 34.0 | % | $ | 449 | 35 | % | ||||||||||||
Research and development | 309 | 407 | 7.4 | % | 8.0 | % | 98 | 32 | % | |||||||||||||||
Amortization of intangible assets | 207 | 218 | 5.0 | % | 4.3 | % | 11 | 5 | % | |||||||||||||||
Impairment of long-lived assets | 2 | 16 | 0.0 | % | 0.3 | % | 14 | 700 | % | |||||||||||||||
Impairment of indefinite-lived intangible assets | 60 | — | 1.4 | % | 0.0 | % | (60 | ) | -100 | % | ||||||||||||||
Goodwill impairment | 235 | — | 5.7 | % | 0.0 | % | (235 | ) | -100 | % | ||||||||||||||
Restructuring charges, net | 160 | 171 | 3.9 | % | 3.4 | % | 11 | 7 | % | |||||||||||||||
In-process research and development charge | 12 | — | 0.3 | % | 0.0 | % | (12 | ) | -100 | % | ||||||||||||||
Acquisition-related costs | 29 | 20 | 0.7 | % | 0.4 | % | (9 | ) | -31 | % | ||||||||||||||
Total operating expenses | $ | 2,286 | $ | 2,553 | 55.1 | % | 50.4 | % | $ | 267 | 12 | % | ||||||||||||
SG&A expenses for fiscal year 2010 and 2009 were $1,721 million and $1,272 million, respectively, an increase of $449 million. The increase was due to incremental SG&A expenses arising as a result of operating the acquired NES business, as well as integration-related costs of $208 million for fiscal year 2010 and an unfavorable foreign currency impact. Integration-related costs primarily represent third-party consulting fees and other administrative costs associated with consolidating and coordinating the operations of Avaya and NES. These costs were incurred in connection with, among other things, the on-boarding of NES personnel, developing compatible IT systems and internal processes and developing and implementing a strategic operating plan to help enable a smooth transition with minimal disruption to NES customers. Such costs also include fees paid to certain Nortel-controlled entities for logistics and other support functions being performed on a temporary basis pursuant to a transition services agreement. These costs were partially offset by the continued benefit from cost savings initiatives.
R&D expenses for fiscal year 2010 and 2009 were $407 million and $309 million, respectively, an increase of $98 million. The increase was due to incremental R&D expenses incurred by the NES business and an unfavorable foreign currency impact. The increase was partially offset by reductions resulting from continued focus on cost saving initiatives and the re-prioritization of projects.
Amortization of intangible assets for fiscal year 2010 and 2009 was $218 million and $207 million, respectively. The increase was due to amortization related to intangible assets acquired in connection with the acquisition of NES.
Our acquisition of NES provided us with access to several proprietary technologies that previously were not available to Avaya. Some of these technologies, based on their functionality, overlapped with our pre-existing
technologies. In order to realize synergies and reduce our expenditures on research and development and marketing, the number of technologies Avaya supported was reduced. As a result, we identified certain technologies associated with our products segment that were redundant to others which Avaya no longer aggressively developed and marketed. The Company recorded an impairment charge of $16 million in the three months ended December 31, 2009 associated with these technologies. During fiscal year 2009, we also recognized an impairment loss of $2 million relating to capitalized software. Based on our analysis, we determined that this asset had no future use to the Company.
During the second quarter of fiscal year 2009, we recognized impairment losses associated with our indefinite-lived intangible assets of $60 million and goodwill of $235 million. During the three months ended March 31, 2009, the global economic downturn experienced during 2008 continued and negatively affected most of our markets beyond the Company’s expectations utilized in its annual testing of goodwill at September 30, 2008. Several of the Company’s customers and competitors had reduced their financial outlooks or disclosed that they were experiencing very challenging market conditions with little visibility of a rebound. As a result we had seen indications that enterprises were not willing to spend on enterprise communications technology, and the rate of revenue growth we experienced in previous years was not expected to resume in the near term. Our product revenues for the six months ended March 31, 2009 were down 25% when compared to the same period of the prior year. Cutbacks in spending, access to credit, employment variability, corporate profit growth, interest rates, energy prices, and other factors in specific markets were expected to further impact corporate willingness to spend on communications technology in the near term. In March 2009, in response to these adverse business indicators and the rapidly declining revenue trends experienced during the second quarter of our 2009 fiscal year, we reduced our near-term and long-term revenue projections. As a result of the deteriorating business climate during the second quarter of fiscal year 2009, we determined that our long-lived assets and goodwill should be tested for potential impairment.
We performed step one of the impairment test of long-lived assets included in our reporting units and determined that the net book values of each of our reporting units were recoverable. We also tested our indefinite-lived intangible assets for impairment and determined that, as a result of the lower revenue projections and higher discount rates, the carrying values of our tradenames and trademarks exceeded their estimated fair values. Accordingly, we recorded an impairment charge of $60 million to reflect such intangible assets at their estimated fair values.
We also performed an analysis of goodwill for impairment. Based on our performance of step one of the goodwill impairment test, we determined that the net book value of two of our GCS reporting units exceeded their estimated fair values. Based on the second step of the goodwill impairment test, we determined that the book value of goodwill of one of the two reporting units exceeded its implied fair value. Accordingly, we wrote down the goodwill balance by $235 million as of March 31, 2009 in order to state the goodwill balance of that reporting unit at its implied fair value. The reduced valuation of the affected reporting unit reflects the additional market risks, higher discount rates and the lower sales forecasts for the Company’s GCS product lines consistent with economic trends at that time.
Upon classification of the AGC business, which represents a portion of certain GCS and AGS reporting units, as held for sale, the Company tested the goodwill remaining in the portion of the reporting units to be retained for impairment in accordance with the authoritative guidance. Based on this goodwill impairment test, the Company determined that the respective book values for these reporting units did not exceed their estimated fair values and that it was not necessary to record impairment charges. Excluding the AGC transaction, which requires that goodwill be tested for impairment, the Company determined that no events occurred or circumstances changed during fiscal year 2010 that would indicate that the fair value of a reporting unit may be below its carrying amount.
At September 30, 2010 and 2009, the Company performed its annual test of recoverability of indefinite-lived intangible assets and its annual goodwill impairment test. The Company determined that the respective
book values of the Company’s reporting units did not exceed their estimated fair values and therefore no impairment existed. However, if market conditions continue to deteriorate, or if we are unable to execute on our cost reduction efforts and other strategies, it may be necessary to record additional impairment charges in the future. See Note 5, “Goodwill,” and Note 6, “Intangible Assets,” to our consolidated financial statements included elsewhere in this prospectus.
Restructuring charges, net for fiscal year 2010 and 2009 were $171 million and $160 million, respectively, an increase of $11 million. During fiscal year 2010, we continued our focus on controlling costs. In response to the global economic climate and in anticipation of the acquisition of NES, we began implementing additional initiatives designed to streamline our operations, generate cost savings and eliminate overlapping processes and expenses associated with the NES business. These initiatives include exiting facilities and reducing the workforce or relocating positions to lower cost geographies. Restructuring charges recorded during fiscal year 2010 include employee separation costs primarily associated with involuntary employee severance actions in EMEA and the U.S. As the Company continues to evaluate its cost structure, additional restructuring opportunities may be identified.
As fully discussed in Note 4, “Business Combinations and Other Transactions,” to our consolidated financial statements, as a result of our acquisition of Adomo, Inc., or Adomo, a developer of unified messaging solutions, the Company recognized IPRD charges in fiscal year 2009 of $12 million. IPRD represents certain technologies expected to enhance the Company’s products when completed in future years and were recorded in purchase accounting of the acquisition of Adomo at their estimated fair values. At the time of the acquisition of Adomo and the Merger, these technologies were in the initial development stages and did not meet the technological feasibility standard necessary for capitalization. Accordingly, these amounts were charged to the Consolidated Statement of Operations at the date of the acquisition of Adomo and completion of the Merger.
Acquisition-related costs for fiscal year 2010 and 2009 were $20 million and $29 million, and include legal and other costs related to the acquisition of NES.
Operating Loss
Our operating loss for fiscal year 2010 was $381 million compared to $420 million for fiscal year 2009, a decrease of $39 million.
For the period December 19, 2009 through September 30, 2010, results include the impact of the unfavorable operating results from the acquisition of NES, which includes the effect of certain acquisition adjustments and the amortization of acquired technology and customer intangibles. In addition, we incurred integration costs (included in SG&A) of $106 million, restructuring charges that were $11 million higher for fiscal year 2010 as compared to fiscal year 2009 and an impairment of $16 million to our long-lived assets, as described above.gains. For fiscal year 2009, results included the impact of the impairment of goodwill and indefinite-lived intangible assets of $235 million and $60 million, respectively,
Our operating loss for fiscal years 2010 and 2009 includes non-cash expenses for depreciation and amortization of $691 million and $652 million and share-based compensation of $19 million and $10 million, respectively.
Interest Expense
Interest expense for fiscal year 2010 and 2009 was $487 million and $409 million, which includes non-cash interest expense of $105 million and $57 million, respectively. Non-cash interest expense for fiscal year 2010 includes (1) amortization of debt issuance costs, (2) accretion of debt discount attributable to Avaya Inc.’s incremental term B-2 loans issued in connection with the acquisition of NES and (3) PIK interest for the period of October 1, 2009 through April 30, 2010 which we elected to finance through Avaya Inc.’s senior unsecured
PIK toggle notes. Non-cash interest expense for fiscal year 2009 represents (1) amortization of debt issuance costs and (2) PIK interest for the period of May 1, 2009 through September 30, 2009 which we elected to finance through Avaya Inc.’s senior unsecured PIK toggle notes.
Cash interest expense for fiscal year 2010 increased as a result of cash interest expense associated with Avaya Inc’s senior secured incremental term B-2 loans issued in connection with the acquisition of NES. This increase was partially offset by decreased cash interest expense as a result of lower interest rates combined with the expiration of certain interest rate swap contracts associated with Avaya Inc.’s term B-1 loans under the senior secured credit facility issued in connection with the Merger, combined with the fact that the Company elected to pay in kind interest on Avaya Inc.’s senior unsecured PIK toggles notes for a longer period during 2010.
Other Income, Net
Otherother income, net for fiscal year 2010 was $15 million as compared to $14 million for fiscal year 2009. Net foreign currency transaction losses were $1 million for fiscal year 2010 as compared to a net gain of $8 million for fiscal year 2009. Interest income was $5 million and $6 million for fiscal year 2010 and 2009, respectively. The decrease in net foreign currency transaction gains and losses is consistent with the weakening of the U.S. dollar during fiscal year 2010 and its negative impact on certain foreign currency hedges. The decrease inincludes interest income for fiscal year 2010 is due to a decrease in interest rates earned on cash balances compared to fiscal year 2009. Also included in fiscal year 2010 isand a $7 million gain on our divestiture of AGC.
Provision for Income Taxes
The provision for income taxes was $18$68 million and $30$18 million for fiscal year2011 and 2010, and 2009, respectively. The effective tax rate for fiscal year2011 and 2010 was 8.5% and 2009 was 2.1%, respectively, and 3.7%, respectively. The rates differdiffers from the U.S. Federal tax rate primarily due to the effect of taxable income in non-U.S. jurisdictions and due to the valuation allowance principally established against our U.S. deferred tax assets. Additionally, the tax provision for fiscal 2011 includes an $8 million benefit for the reversal of a valuation allowance related to NOLs, which are now expected to be utilized by a non-U.S. entity and a $5 million benefit for a reduction in unrecognized tax benefits due to reduction of uncertain tax positions plus the reversal of interest in the amount of $3 million. The tax benefit for fiscal 2010 includes a $10 million reduction in our unrecognized tax benefits due to the settlement of a tax issue plus the reversal of interest in the amount of $5 million.
See Note 12, “Income Taxes” to our audited Consolidated Financial Statements included elsewhere in this prospectus for further details and a reconciliation of the Company’s loss before income taxes at the U.S. Federal statutory rate to the provision for income taxes.
Fiscal Year Ended September 30, 2009 Compared with Fiscal Year Ended September 30, 2008 Combined Results
Revenue
Our revenue for fiscal year 2009 and 2008 was $4,150 million and $5,169 million, respectively, a decrease of $1,019 million or 20%. The following table sets forth a comparison of revenue by segment:
| Fiscal Year Ended September 30, | ||||||||||||||||||||||||
| Combined Results 2008 | 2009 | Percent of Total Revenue | Yr. to Yr. Percent Change | Yr. to Yr. Percent Change, net of Foreign Currency Impact | ||||||||||||||||||||
| Combined Results 2008 | 2009 | |||||||||||||||||||||||
| (dollars in millions) | ||||||||||||||||||||||||
GCS | $ | 2,734 | $ | 1,939 | 53 | % | 46 | % | -29 | % | -26 | % | ||||||||||||
Purchase accounting adjustments | (43 | ) | (16 | ) | -1 | % | 0 | % | (1) | (1) | ||||||||||||||
Total product revenue | 2,691 | 1,923 | 52 | % | 46 | % | -29 | % | -25 | % | ||||||||||||||
AGS | 2,478 | 2,227 | 48 | % | 54 | % | -10 | % | -6 | % | ||||||||||||||
Total revenue | $ | 5,169 | $ | 4,150 | 100 | % | 100 | % | -20 | % | -16 | % | ||||||||||||
GCS revenue for fiscal year 2009 and 2008 was $1,939 million and $2,734 million, respectively, a decrease of $795 million or 29%. The decline was primarily due to decreases in product sales volume and pricing as a result of general weaknesses in the global economy, as well as an unfavorable foreign currency impact.
In response to the weakening global economy, many of our customers elected to defer or reduce their capital spending. Customer headcount reductions and postponed upgrades to communication systems led to lower demand for our products in fiscal year 2009 and had a negative impact on sales volume and our unit pricing. The implementation of the Company’s strategic decision to grow its sales of products through the indirect channel also negatively affected unit pricing as sales through this channel typically come at higher discounts. The effect of these factors was realized across all product lines, in particular unified communications infrastructure, which includes telephony products such as gateways and servers, IP and TDM sets and communication manager licenses, as well as product lines supporting the Company’s contact center solutions and integrated office communications units.
AGS revenue for fiscal year 2009 and 2008 was $2,227 million and $2,478 million, respectively, a decrease of $251 million or 10%. The decline was primarily due to an unfavorable foreign currency impact, the result of exiting low-margin contracts, as well as the effect of general weaknesses in the global economy reducing customer spending.
In the second half of fiscal year 2008, the Company began to implement its strategy to divest itself of its lower-margin service offerings and certain low-margin contracts, primarily located in EMEA. In 2008, the Company successfully negotiated the settlement of one large low-margin service contract and since that time has elected not to renew other such contracts as they expire. These strategic moves to exit the low-margin service business account for $72 million of the decrease in fiscal year 2009 revenues. Additional decreases in revenues were attributable to the weak global economy. In particular, decreases in product sales volumes led to lower implementation service revenues and customers looked for ways to cut maintenance costs through the termination or reduction of certain service contracts and by reducing their reliance on managed and professional services.
The following table sets forth a comparison of revenue by location:
| Fiscal Year ended September 30, | ||||||||||||||||||||||||
| Mix | ||||||||||||||||||||||||
| Combined Results 2008 | 2009 | Combined Results 2008 | 2009 | Yr. to Yr. Percent Change | Yr. to Yr. Percent Change, net of Foreign Currency Impact | |||||||||||||||||||
| (dollars in millions) | ||||||||||||||||||||||||
U.S. | $ | 2,655 | $ | 2,276 | 51 | % | 55 | % | -14 | % | -14 | % | ||||||||||||
International: | ||||||||||||||||||||||||
Germany | 757 | 579 | 15 | % | 14 | % | -24 | % | -15 | % | ||||||||||||||
EMEA (excluding Germany) | 886 | 613 | 17 | % | 15 | % | -31 | % | -22 | % | ||||||||||||||
Total EMEA | 1,643 | 1,192 | 32 | % | 29 | % | -27 | % | -19 | % | ||||||||||||||
APAC—Asia Pacific | 488 | 350 | 10 | % | 8 | % | -28 | % | -23 | % | ||||||||||||||
Americas International—Canada and Central and Latin America | 383 | 332 | 7 | % | 8 | % | -13 | % | -4 | % | ||||||||||||||
Total International | 2,514 | 1,874 | 49 | % | 45 | % | -25 | % | -17 | % | ||||||||||||||
Total revenue | $ | 5,169 | $ | 4,150 | 100 | % | 100 | % | -20 | % | -16 | % | ||||||||||||
Revenue in the U.S. for fiscal year 2009 and 2008 was $2,276 million and $2,655 million, respectively, a decrease of $379 million or 14%. The decline was primarily due to decreases in products sales volume and pricing as a result of general weaknesses in the global economy, as well as lower services revenues directly
relating to the decreases in product revenue volumes. Revenue in EMEA for fiscal year 2009 and 2008 was $1,192 million and $1,643 million, respectively, a decrease of $451 million or 27%. Excluding the impact of foreign currency, EMEA revenues declined 19% as a result of lower product sales due to the effects of the weakening economy on sales volumes and pricing pressures, as well as the termination of a large, low-margin contract and exiting from other lower-margin service offerings. The decreases in APAC and Americas International revenue were due primarily to product revenue decreases as a result of the slowdown in growth in both of those regions.
The following table sets forth a comparison of revenue from sales of products by channel:
| Fiscal Year ended September 30, | ||||||||||||||||||||||||
| Percent of Total Revenue | ||||||||||||||||||||||||
| Combined Results 2008 | 2009 | Combined Results 2008 | 2009 | Yr. to Yr. Percent Change | Yr. to Yr. Percent Change, net of Foreign Currency Impact | |||||||||||||||||||
| (dollars in millions) | ||||||||||||||||||||||||
Direct | $ | 1,315 | $ | 905 | 49 | % | 47 | % | -31 | % | -28 | % | ||||||||||||
Indirect | 1,384 | 1,023 | 51 | % | 53 | % | -26 | % | -23 | % | ||||||||||||||
Total sales of products | $ | 2,699 | $ | 1,928 | 100 | % | 100 | % | -29 | % | -25 | % | ||||||||||||
In fiscal year 2009, the Company began to implement its strategic decision to grow its sales of products through the indirect channel, and as a result product sales through the indirect channel increased by two percentage points. As a result of higher volume discounts, sales through the indirect channel generally generate lower margins than direct sales. Our use of the indirect channel lowers selling expense and allows us to reach more end users.
Gross Margin
The following table sets forth a comparison of gross margin by segment:
| Fiscal year ended September 30, | ||||||||||||||||||||||||
| Percent of Revenue | ||||||||||||||||||||||||
| Combined Results 2008 | 2009 | Combined Results 2008 | 2009 | Change | ||||||||||||||||||||
| (dollars in millions) | ||||||||||||||||||||||||
GCS margin | $ | 1,514 | $ | 1,066 | 55.4 | % | 55.0 | % | $ | (448 | ) | -30 | % | |||||||||||
AGS margin | 968 | 1,065 | 39.1 | % | 47.8 | % | 97 | 10 | % | |||||||||||||||
Amortization of technology intangible assets and the impact of purchase accounting adjustments | (360 | ) | (265 | ) | (1) | (1) | 95 | (1) | ||||||||||||||||
Total gross margin | $ | 2,122 | $ | 1,866 | 41.1 | % | 45.0 | % | $ | (256 | ) | -12 | % | |||||||||||
Fiscal year 2009 and 2008 gross margin was $1,866 million and $2,122 million, respectively, a decrease of $256 million or 12%.
GCS gross margin for fiscal year 2009 and 2008 was $1,066 million and $1,514 million, respectively, a decrease of $448 million or 30%. The decrease in gross margin was primarily due to the decline in sales volume and pricing in the U.S. and EMEA, as well as an unfavorable foreign currency impact. The gross margin rate was flat, as reductions in costs, including the impact of lower costs resulting from the reduced payout in connection with our annual incentive award program, were offset by decreases in sales volume which minimized the leverage of our fixed costs.
AGS gross margin for fiscal year 2009 and 2008 was $1,065 million and $968 million, respectively, an increase of $97 million or 10%. The increase in gross margin and gross margin rate was due to improved efficiencies and savings achieved as a result of cost savings initiatives including downsizing of the services work force and transitioning resources to low-cost geographies, partially offset by an unfavorable foreign currency impact. The gross margin rate was also affected by the termination of a lower-margin contract with a large customer, as well as exiting other lower-margin service offerings, as discussed earlier.
Total gross margin for fiscal year 2009 included $248 million of amortization of technology-related intangible assets, as well as the impact of other purchase accounting adjustments related to the Merger. Total gross margin for fiscal year 2008 included $232 million of amortization of technology-related intangible assets and the impact of $182 million related to fair value adjustments to inventory recorded in connection with the Merger, partially offset by the impact of other purchase accounting adjustments.
Operating expenses
The following table sets forth a comparison of operating expenses:
| Fiscal year ended September 30, | ||||||||||||||||||||||||
| Percent of Revenue | ||||||||||||||||||||||||
| Combined Results 2008 | 2009 | Combined Results 2008 | 2009 | Change | ||||||||||||||||||||
| (dollars in millions) | ||||||||||||||||||||||||
Selling, general and administrative | $ | 1,567 | $ | 1,272 | 30.3 | % | 30.7 | % | $ | (295 | ) | -19 | % | |||||||||||
Research and development | 405 | 309 | 7.8 | % | 7.4 | % | (96 | ) | -24 | % | ||||||||||||||
Amortization of intangible assets | 191 | 207 | 3.7 | % | 5.0 | % | 16 | 8 | % | |||||||||||||||
Impairment of long-lived assets | 10 | 2 | 0.2 | % | 0.0 | % | (8 | ) | -80 | % | ||||||||||||||
Impairment of indefinite-lived intangible assets | 130 | 60 | 2.5 | % | 1.4 | % | (70 | ) | -54 | % | ||||||||||||||
Goodwill impairment | 899 | 235 | 17.4 | % | 5.7 | % | (664 | ) | -74 | % | ||||||||||||||
Restructuring charges, net | 1 | 160 | 0.0 | % | 3.9 | % | 159 | 15900 | % | |||||||||||||||
In-process research and development charge | 112 | 12 | 2.2 | % | 0.3 | % | (100 | ) | -89 | % | ||||||||||||||
Acquisition-related costs | — | 29 | 0.0 | % | 0.7 | % | 29 | — | ||||||||||||||||
Merger-related costs | 58 | — | 1.1 | % | 0.0 | % | (58 | ) | -100 | % | ||||||||||||||
Total operating expenses | $ | 3,373 | $ | 2,286 | 65.2 | % | 55.1 | % | $ | (1,087 | ) | -32 | % | |||||||||||
In connection with the Merger, Avaya’s management and Board of Directors developed various plans and initiatives designed to streamline the operations of the Company and generate cost savings, which included exiting facilities and reducing the workforce or relocating positions to lower cost geographies. We partially realized the cost saving benefits of these initiatives during the period October 27, 2007 through September 30, 2008 and continued to realize the benefits in fiscal year 2009. As a result of the global economic downturn, we continued our focus on controlling costs. In December 2008, the Company announced that it would be initiating additional restructuring plans during fiscal year 2009. These plans included additional headcount reductions, shifting resources to low-cost geographies and the further consolidation of facilities. These plans also included reductions in management and in back-office headcount of our sales organization, reduced headcount in our services business, and consolidating certain other back-office functions and facilities. In addition, during fiscal year 2009, we reached agreements with the various Works Councils in Europe to reduce our EMEA workforce. We partially realized the benefits of these actions during fiscal year 2009.
SG&A expenses for fiscal year 2009 and 2008 were $1,272 million and $1,567 million, respectively, a decrease of $295 million. The decrease is primarily due to cost saving initiatives implemented in fiscal year 2008 that continued in fiscal year 2009, as described above, as well as lower costs resulting from the reduced payout in connection with our annual incentive award program and a favorable foreign currency impact.
R&D expenses for fiscal year 2009 and 2008 were $309 million and $405 million, respectively, a decrease of $96 million. The decrease is primarily due to cost saving initiatives implemented in fiscal year 2008 that continued in fiscal year 2009, as described above, as well as the re-prioritization of projects, the impact of lower costs resulting from the reduced payout in connection with our annual incentive award program and a favorable foreign currency impact. The restructuring plans described above provided for the net reduction of 260 R&D positions, primarily in high-cost geographies, and the consolidation of four research facilities located in the U.S. and EMEA.
Amortization of intangible assets for fiscal year 2009 and 2008 was $207 million and $191 million, respectively. The increase of $16 million is attributable to the amortization expense associated with significant intangible asset values recorded in connection with the Merger for the full twelve months ended September 30, 2009 as compared to the successor period of October 27, 2007 through September 30, 2008.
During fiscal year 2009, we recognized an impairment loss of $2 million relating to capitalized software. During fiscal year 2008, we recognized an impairment loss of $10 million relating to internal-use software. Based on our analysis, we determined that these assets had no future use to the Company.
During fiscal years 2009 and 2008, we recognized impairment losses associated with our indefinite-lived intangible assets of $60 million and $130 million, respectively, and goodwill impairment of $235 million and $899 million, respectively.
During the three months ended March 31, 2009, the global economic downturn experienced during 2008 continued and negatively affected most of our markets beyond the Company’s expectations utilized in its annual testing of goodwill at September 30, 2008. Several of the Company’s customers and competitors had reduced their financial outlooks or disclosed that they were experiencing very challenging market conditions with little visibility of a rebound. As a result we had seen indications that enterprises were not willing to spend on enterprise communications technology, and the rate of revenue growth we experienced in previous years was not expected to resume in the near term. Our product revenues for the six months ended March 31, 2009 were down 25% when compared to the same period of the prior year. Cutbacks in spending, access to credit, employment variability, corporate profit growth, interest rates, energy prices, and other factors in specific markets were expected to further impact corporate willingness to spend on communications technology in the near term. In March 2009, in response to these adverse business indicators and the rapidly declining revenue trends experienced during the second quarter of our 2009 fiscal year, the Company reduced its near-term and long-term revenue projections. As a result of the deteriorating business climate during the second quarter of fiscal year 2009, we determined that our long-lived assets and goodwill should be tested for potential impairment.
We performed step one of the impairment test of long-lived assets included in our reporting units and determined that the net book values of each of our reporting units were recoverable. We also tested our indefinite-lived intangible assets for impairment and determined that, as a result of the lower revenue projections and higher discount rates, the carrying values of our tradenames and trademarks exceeded their estimated fair values. Accordingly, we recorded an impairment charge of $60 million to reflect such intangible assets at their estimated fair values.
We also performed an analysis of goodwill for impairment. Based on our performance of step one of the goodwill impairment test, we determined that the net book value of two of our GCS reporting units exceeded their estimated fair values. Based on the second step of the goodwill impairment test, we determined that the book value of goodwill of one of the two reporting units exceeded its implied fair value. Accordingly, we wrote down the goodwill balance by $235 million as of March 31, 2009 in order to state the goodwill balance of the reporting unit at its implied fair value. The reduced valuation of the affected reporting unit reflects the additional market risks, higher discount rates and the lower sales forecasts for the Company’s GCS product lines consistent with economic trends at that time.
At September 30, 2008, the Company performed its annual test of recoverability of indefinite-lived intangible assets and recognized an impairment charge of $130 million. The Company also performed its annual goodwill impairment test and recorded an impairment charge of $899 million associated with the goodwill allocated to the GCS segment. These impairment charges are consistent with the decrease in product revenues in fiscal year 2008 compared to the prior year and the additional market risks and higher discount rates resulting from the economic downturns.
At September 30, 2009, the Company performed its annual test of recoverability of indefinite-lived intangible assets and its annual goodwill impairment test. The Company determined that the respective book values of the Company’s reporting units did not exceed their estimated fair values and therefore no impairment existed.
Restructuring charges, net for fiscal years 2009 and 2008 were $160 million and $1 million, respectively. As described above, the restructuring plan initiated in connection with the Merger was designed to streamline the operations of the Company and generate cost savings by exiting facilities, reducing the workforce or relocating positions to lower cost geographies. As a result of the Merger, a $330 million liability was established in purchase accounting for employee separation costs and lease obligations, which includes $67 million of future spending associated with the restructuring programs implemented in prior years. The restructuring actions taken during fiscal year 2008 were charged against this liability and did not impact the Consolidated Statement of Operations. In December 2008, the Company announced that it would be initiating additional restructuring plans during fiscal year 2009. These plans included additional headcount reductions, shifting resources to low-cost geographies and the further consolidation of facilities. As a result of the implementation of the fiscal year 2009 restructuring plan, we incurred $160 million of restructuring charges primarily related to the employee separation actions in Europe and the U.S.
As fully discussed in Note 4, “Business Combinations and Other Transactions,” to our consolidated financial statements, as a result of our acquisition of Adomo and the Merger, the Company recognized IPRD charges in fiscal years 2009 and 2008 of $12 million and $112 million, respectively. IPRD represents certain technologies expected to enhance the Company’s products when completed in future years and were recorded in purchase accounting in connection with the acquisition of Adomo and the Merger at their estimated fair values. At the time of the acquisition of Adomo and the Merger, these technologies were in the initial development stages and did not meet the technological feasibility standard necessary for capitalization. Accordingly, these amounts were charged to the Consolidated Statement of Operations at the date of acquisition and completion of the Merger.
Acquisition-related costs for fiscal year 2009 were $29 million. Acquisition-related costs include legal and other costs related to the acquisition of NES. No acquisition-related costs were incurred during fiscal year 2008.
Merger-related costs for fiscal year 2008 were $58 million. In addition to investment banking, legal, and other third-party costs, Merger-related costs also included $6 million of non-cash stock compensation resulting from the accelerated vesting of stock options and restricted stock units in connection with the Merger. No Merger-related costs were incurred during fiscal year 2009.
Operating Loss
Our operating loss for fiscal year 2009 was $420 million, compared to $1,251 million for fiscal year 2008, a decrease of $831 million.
The decrease in our operating loss reflects the decreases in costs and expenses in fiscal year 2009, particularly to SG&A and R&D expenses due to the benefits of our cost savings initiatives. These savings initiatives include reductions in discretionary spending, reductions in headcount, the transition of resources to low-cost geographies, the consolidation of facilities and the result of lower costs resulting from the reduced
payout in connection with our annual incentive award program. Our lower operating loss is also the result of lower impairment charges in fiscal year 2009 associated with indefinite-lived assets and goodwill. In fiscal year 2008, the charges were $734 million higher as the Company began to recognize the effect the deteriorating economy had on these assets. In addition, our results were affected by certain charges in fiscal year 2008 directly related to the Merger and purchase accounting which were not repeated in 2009. For fiscal year 2008, our operating loss included $58 million of Merger-related costs and the net $561 million impact arising as a result of the fair value adjustments recorded in purchase accounting in connection with the Merger, including the $112 million IPRD charge. These decreases in operating loss were partially offset by a decrease in product sales volume during fiscal year 2009 and restructuring charges related to our fiscal year 2009 restructuring plan of $160 million.
Our operating loss for fiscal years 2009 and 2008 includes non-cash expenses for depreciation and amortization of $652 million and $616 million and share-based compensation of $10 million and $21 million, respectively.
Interest Expense
Interest expense for fiscal years 2009 and 2008 was $409 million and $377 million, respectively. Interest expense for both periods primarily relates to interest associated with our debt issued in connection with the Merger, including amortization of debt issuance costs. The increase of $32 million is attributable to the debt incurred in connection with the Merger for the full twelve months ended September 30, 2009 as compared to the successor period of October 27, 2007 through September 30, 2008, and the amortization of deferred financing costs incurred in October 2008 associated with the exchange notes as discussed more fully in Note 9, “Financing Arrangements,” to our consolidated financial statements.
Other Income, Net
Other income, net for fiscal years 2009 and 2008 was $14 million and $27 million, respectively. This primarily represents interest income of $6 million and $24 million and net foreign currency transaction gains of $8 million and $14 million for fiscal years 2009 and 2008, respectively. The decrease in interest income for fiscal year 2009 is due to a decrease in interest rates earned on cash balances compared to fiscal year 2008. The increase in foreign currency gains is consistent with the improved strength in the U.S. dollar during fiscal year 2009, resulting in foreign currency transaction gains on unhedged U.S. denominated transactions entered into by certain of our non-U.S. subsidiaries.
Provision for (Benefit from) Income Taxes
The provision for income taxes for fiscal year 2009 was $30 million as compared to a benefit from income taxes of $207 million for fiscal year 2008.
The effective tax rate for fiscal year 2009 was 3.7% and differs from the U.S. federal tax rate primarily due to the valuation allowance established against the Company’s U.S. deferred tax assets and the non-deductible portion of impairment charges associated with goodwill.
Prior to fiscal year 2009, the Company’s U.S. deferred tax liabilities exceeded its deferred tax assets and therefore a valuation allowance against its U.S. deferred tax assets was unnecessary. In fiscal year 2009, due to the existence of cumulative book losses in the U.S. and future expected book losses, the Company concluded that a valuation allowance was necessary against its U.S. deferred tax assets to the extent they exceed the scheduled reversal of deferred tax liabilities as of September 30, 2009. During fiscal year 2009, the Company’s deferred tax assets exceeded the deferred tax liabilities and as a result, the Company only recognized a minimal tax benefit relating to its U.S. pre-tax losses for fiscal year 2009 offset by tax provisions associated with earnings in certain profitable non-U.S. tax jurisdictions for the period.
The effective benefit rate for fiscal year 2008 was 13% and differs from the U.S. federal statutory rate of 35% primarily due to the non-deductible portion of impairment charges associated with goodwill and non-deductibility of the $112 million IPRD charge.
Non-GAAP Financial Measures and Supplemental Disclosure
EBITDA and Adjusted EBITDA
EBITDA is defined as net income (loss) before income taxes, interest expense, interest income and depreciation and amortization. EBITDA provides us with a measure of operating performance that excludes items that are outside the control of management, which can differ significantly from company to company depending on capital structure, the tax jurisdictions in which companies operate and capital investments. Under Avaya Inc.’sthe Company’s debt agreements, itsthe ability to draw down on itsthe revolving credit facilities or engage in activities such as incurring additional indebtedness, making investments and paying dividends is tied in part to ratios based on Adjusted EBITDA. As defined in our debt agreements, Adjusted EBITDA is a non-GAAP measure of EBITDA further adjusted to exclude certain charges and other adjustments permitted in calculating covenant compliance under our debt agreements. We believe that including supplementary information concerning Adjusted EBITDA is appropriate to provide additional information to investors to demonstrate compliance with our debt agreements and because it serves as a basis for determining management compensation. In addition, we believe Adjusted EBITDA provides more comparability between our historical results and results that reflect purchase accounting and our new capital structure following the Merger. Accordingly, Adjusted EBITDA measures our financial performance based on operational factors that management can impact in the short-term, namely the Company’s pricing strategies, volume, costs and expenses of the organization.
EBITDA and Adjusted EBITDA have limitations as analytical tools. Adjusted EBITDA does not represent net income (loss) or cash flow from operations as those terms are defined by GAAP and does not necessarily indicate whether cash flows will be sufficient to fund cash needs. While Adjusted EBITDA and similar measures are frequently used as measures of operations and the ability to meet debt service requirements, these terms are not necessarily comparable to other similarly titled captions of other companies due to the potential inconsistencies in the method of calculation. Adjusted EBITDA does not reflect the impact of earnings or charges resulting from matters that we consider not to be indicative of our ongoing operations. In particular, based on our debt agreements the definition of Adjusted EBITDA in Avaya Inc.’s debt agreements allows us to add back certain non-cash charges that are deducted in calculating net income (loss). Avaya Inc.’sOur debt agreements also allow us to add back restructuring charges, Sponsor monitoring fees and other specific cash costs and expenses as defined in the agreements and that portion of our pension costs, other post-employment benefit costs, and non-retirement post-employment benefit costs
representing the amortization of priorpension service costs and net actuarial gains/lossesgain or loss associated with these employment benefits. However, these are expenses that may recur, may vary and are difficult to predict. Further, Avaya Inc.’sour debt agreements require that Adjusted EBITDA be calculated for the most recent four fiscal quarters. As a result, the measure can be disproportionately affected by a particularly strong or weak quarter. Further, it may not be comparable to the measure for any subsequent four-quarter period or any complete fiscal year.
The unaudited reconciliation of net loss, which is a GAAP measure, to EBITDA and Adjusted EBITDA is presented below:
| Six months ended March 31, | Fiscal years ended September 30, | |||||||||||||||||||
In millions | 2013 | 2012 | 2012 | 2011 | 2010 | |||||||||||||||
Net loss | $ | (269 | ) | $ | (191 | ) | $ | (354 | ) | $ | (863 | ) | $ | (871 | ) | |||||
Interest expense | 224 | 217 | 432 | 460 | 487 | |||||||||||||||
Interest income | (1 | ) | (2 | ) | (3 | ) | (5 | ) | (5 | ) | ||||||||||
Income tax expense | (6 | ) | (26 | ) | 8 | 68 | 18 | |||||||||||||
Depreciation and amortization | 221 | 286 | 564 | 653 | 691 | |||||||||||||||
|
|
|
|
|
|
|
|
|
| |||||||||||
EBITDA | 169 | 284 | 647 | 313 | 320 | |||||||||||||||
Impact of purchase accounting adjustments (a) | — | 1 | 3 | — | 5 | |||||||||||||||
Restructuring charges, net | 102 | 111 | 142 | 189 | 171 | |||||||||||||||
Sponsors’ fees (b) | 4 | 4 | 7 | 7 | 7 | |||||||||||||||
Acquisition-related costs (c) | — | 3 | 4 | 5 | 20 | |||||||||||||||
Integration-related costs (d) | 9 | 8 | 19 | 132 | 208 | |||||||||||||||
Debt registration fees | — | — | — | — | 1 | |||||||||||||||
Loss on extinguishment of debt (e) | 6 | — | — | 246 | — | |||||||||||||||
Third-party fees expensed in connection with the debt modification (f) | 18 | — | — | 9 | — | |||||||||||||||
Strategic initiative costs (g) | — | — | — | — | 6 | |||||||||||||||
Non-cash share-based compensation | 3 | 5 | 8 | 12 | 19 | |||||||||||||||
Write-down of assets held for sale to net realizable value | — | — | 5 | 1 | — | |||||||||||||||
Loss (gain) on investments and sale of long-lived assets, net | — | 3 | 3 | 1 | (4 | ) | ||||||||||||||
Impairment of long-lived assets | — | — | 6 | — | 16 | |||||||||||||||
Goodwill impairment | 89 | — | — | — | — | |||||||||||||||
Reversal of contingent liability related to acquisition | — | — | (1 | ) | — | — | ||||||||||||||
Change in fair value of Preferred Series B embedded derivative (h) | (8 | ) | — | 6 | — | — | ||||||||||||||
Venezuela hyperinflationary and devaluation charges | 1 | — | — | — | — | |||||||||||||||
Securities registration fees (i) | — | 3 | 3 | — | — | |||||||||||||||
Net income of unrestricted subsidiaries, net of dividends received | — | — | — | — | (6 | ) | ||||||||||||||
(Gain) loss on foreign currency transactions | (15 | ) | 12 | 21 | (12 | ) | 1 | |||||||||||||
Pension/OPEB/nonretirement postemployment benefits and long-term disability costs (j) | 45 | 45 | 98 | 68 | 31 | |||||||||||||||
|
|
|
|
|
|
|
|
|
| |||||||||||
Adjusted EBITDA | $ | 423 | $ | 479 | $ | 971 | $ | 971 | $ | 795 | ||||||||||
|
|
|
|
|
|
|
|
|
| |||||||||||
| Predecessor | Successor | |||||||||||||||||||||||||||
| October 1, 2007 through October 26, 2007 | Fiscal year ended September 30, | Six months ended March 31, | ||||||||||||||||||||||||||
| 2008 | 2009 | 2010 | 2010 | 2011 | ||||||||||||||||||||||||
| (in millions) | ||||||||||||||||||||||||||||
Net loss | $ | (88 | ) | $ | (1,305 | ) | $ | (845 | ) | $ | (871 | ) | $ | (417 | ) | $ | (612 | ) | ||||||||||
Interest expense | — | 377 | 409 | 487 | 229 | 240 | ||||||||||||||||||||||
Interest income | (5 | ) | (20 | ) | (6 | ) | (5 | ) | (3 | ) | (2 | ) | ||||||||||||||||
Income tax (benefit) expense | (24 | ) | (183 | ) | 30 | 18 | (16 | ) | 41 | |||||||||||||||||||
Depreciation and amortization | 23 | 616 | 652 | 691 | 342 | 335 | ||||||||||||||||||||||
EBITDA | (94 | ) | (515 | ) | 240 | 320 | 135 | 2 | ||||||||||||||||||||
Impact of purchase accounting adjustments(a) | — | 230 | (1 | ) | 5 | 2 | (2 | ) | ||||||||||||||||||||
Restructuring charges, net | 1 | — | 160 | 171 | 83 | 64 | ||||||||||||||||||||||
Sponsors’ fees(b) | — | 6 | 7 | 7 | 4 | 4 | ||||||||||||||||||||||
Merger-related costs(c) | 57 | 1 | — | — | — | — | ||||||||||||||||||||||
Acquisition-related costs(d) | — | — | 29 | 20 | 19 | 4 | ||||||||||||||||||||||
Integration-related costs(e) | — | — | 5 | 208 | 83 | 87 | ||||||||||||||||||||||
Loss on extinguishment of debt(f) | — | — | — | — | — | 246 | ||||||||||||||||||||||
Third-party fees expensed in connection with the debt modification(g) | — | — | — | — | — | 9 | ||||||||||||||||||||||
Strategic initiative costs(h) | — | 27 | 21 | 6 | 4 | — | ||||||||||||||||||||||
Debt registration fees | — | — | — | 1 | 1 | — | ||||||||||||||||||||||
Non-cash share-based compensation | — | 21 | 10 | 19 | 11 | 6 | ||||||||||||||||||||||
Loss (gain) on sale of long-lived assets | — | 1 | 1 | (4 | ) | — | (1 | ) | ||||||||||||||||||||
Impairment of long-lived assets | — | 140 | 62 | 16 | 16 | — | ||||||||||||||||||||||
Write-down of held for sale assets to net realizable value | — | — | — | — | — | 1 | ||||||||||||||||||||||
Goodwill impairment | — | 899 | 235 | — | — | — | ||||||||||||||||||||||
Gain on foreign currency transactions | 1 | (15 | ) | (8 | ) | 1 | (2 | ) | (9 | ) | ||||||||||||||||||
Net loss (income) of unrestricted subsidiaries, net of dividends received | 2 | (5 | ) | (4 | ) | (6 | ) | (4 | ) | — | ||||||||||||||||||
Pension/OPEB/nonretirement postemployment benefits and long-term disability costs(i) | 6 | 69 | (4 | ) | 31 | 15 | 31 | |||||||||||||||||||||
Adjusted EBITDA | $ | (27 | ) | $ | 859 | $ | 753 | $ | 795 | $ | 367 | $ | 442 | |||||||||||||||
| (a) | For fiscal |
| (b) | Sponsors’ fees represent monitoring fees payable to affiliates of the Sponsors pursuant to a management services agreement entered into at the time of the Merger. See |
| (c) |
| Acquisition-related costs include legal and other costs related to |
| Integration-related costs primarily represent third-party consulting fees and other administrative costs associated with consolidating and coordinating the operations of Avaya and |
| Strategic initiative costs represent consulting fees in connection with management’s cost-savings actions, which commenced subsequent to the Merger. |
| (h) | Represents the loss (gain) on changes in the fair value of certain embedded derivative features of the Company’s Series B preferred stock. Under GAAP, these embedded features must be recognized at fair value at each balance sheet date with the changes in the fair value recognized in operations. See Note 15, “Capital Stock,” to our audited Consolidated Financial Statements located elsewhere in this prospectus. |
| (i) | Represents third party fees incurred in connection with the Company’s registration statement. |
| (j) | Represents that portion of our pension costs, other post-employment benefit costs and non-retirement post-employment benefit costs representing the amortization of prior service costs and net actuarial gains/losses associated with these employment benefits. For fiscal 2012 and 2011, the amounts include a curtailment charge of $5 million associated with workforce reduction in Germany and the U.S. and $7 million associated with workforce reductions in Germany, respectively. |
Supplemental Quarterly Financial Information
Our quarterly revenues and other financial measures have varied in the past and can be expected to vary in the future due to numerous factors, including modest seasonality related to the structure of our incentive compensation plan, which has been based on annual targets rather than quarterly targets, and customer budget cycles generally resulting in higher revenue in the fourth fiscal quarter relative to other quarters. The following table sets forth our unaudited (a) revenue, (b) gross margin and (c) reconciliations of net loss to EBITDA and Adjusted EBITDA for each of the ten quarters in the period ended March 31, 2011. Operating2013.Operating results for these periods are not necessarily indicative of the operating results for a full year or of the results expected in future periods. You should read this data together with our consolidated financial statementsConsolidated Financial Statements and the related notes included elsewhere in this prospectus.
| Three Months Ended | ||||||||||||||||||||||||||||||||||||||||
| December 31, 2008 | March 31, 2009 | June 30, 2009 | September 30, 2009 | December 31, 2009 | March 31, 2010 | June 30, 2010 | September 30, 2010 | December 30, 2010 | March 31, 2011 | |||||||||||||||||||||||||||||||
Revenue | (in millions) | |||||||||||||||||||||||||||||||||||||||
Products | $ | 532 | $ | 452 | $ | 437 | $ | 502 | $ | 513 | $ | 680 | $ | 700 | $ | 709 | $ | 722 | $ | 757 | ||||||||||||||||||||
Services | 581 | 548 | 549 | 549 | 547 | 640 | 632 | 639 | 644 | 633 | ||||||||||||||||||||||||||||||
| 1,113 | 1,000 | 986 | 1,051 | 1,060 | 1,320 | 1,332 | 1,348 | 1,366 | 1,390 | |||||||||||||||||||||||||||||||
Costs | ||||||||||||||||||||||||||||||||||||||||
Products | ||||||||||||||||||||||||||||||||||||||||
Costs | 234 | 203 | 207 | 228 | 223 | 325 | 349 | 346 | 332 | 343 | ||||||||||||||||||||||||||||||
Amortization of technology intangible assets | 62 | 62 | 62 | 62 | 59 | 83 | 79 | 70 | 67 | 66 | ||||||||||||||||||||||||||||||
Services | 316 | 292 | 278 | 278 | 268 | 376 | 349 | 361 | 348 | 339 | ||||||||||||||||||||||||||||||
| 612 | 557 | 547 | 568 | 550 | 784 | 777 | 777 | 747 | 748 | |||||||||||||||||||||||||||||||
Gross Margin | $ | 501 | $ | 443 | $ | 439 | $ | 483 | $ | 510 | $ | 536 | $ | 555 | $ | 571 | $ | 619 | $ | 642 | ||||||||||||||||||||
Reconciliation of Net Loss to Adjusted EBITDA | ||||||||||||||||||||||||||||||||||||||||
Net loss | $ | (90 | ) | $ | (401 | ) | $ | (224 | ) | $ | (130 | ) | $ | (136 | ) | $ | (281 | ) | $ | (240 | ) | $ | (214 | ) | $ | (180 | ) | $ | (432 | ) | ||||||||||
Interest expense | 104 | 101 | 101 | 103 | 102 | 127 | 127 | 131 | 127 | 113 | ||||||||||||||||||||||||||||||
Interest income | (3 | ) | (2 | ) | — | (1 | ) | (2 | ) | (1 | ) | (1 | ) | (1 | ) | (1 | ) | (1 | ) | |||||||||||||||||||||
Income tax (benefit) expense | 1 | (17 | ) | 11 | 35 | 3 | (19 | ) | 9 | 25 | 22 | 19 | ||||||||||||||||||||||||||||
Depreciation and amortization | 161 | 160 | 162 | 169 | 157 | 185 | 176 | 173 | 168 | 167 | ||||||||||||||||||||||||||||||
EBITDA(a) | 173 | (159 | ) | 50 | 176 | 124 | 11 | 71 | 114 | 136 | (134 | ) | ||||||||||||||||||||||||||||
Impact of purchase accounting adjustments | (2 | ) | (3 | ) | (3 | ) | 7 | (1 | ) | 3 | 2 | 1 | (1 | ) | (1 | ) | ||||||||||||||||||||||||
Restructuring charges, net | 18 | 33 | 114 | (5 | ) | 15 | 68 | 51 | 37 | 22 | 42 | |||||||||||||||||||||||||||||
Sponsors’ fees | — | 3 | 2 | 2 | 2 | 2 | 2 | 1 | 2 | 2 | ||||||||||||||||||||||||||||||
Merger-related costs | — | — | — | — | — | — | — | — | — | — | ||||||||||||||||||||||||||||||
Acquisition-related costs | — | — | — | 29 | 17 | 2 | 1 | — | 4 | — | ||||||||||||||||||||||||||||||
Integration-related costs | — | — | — | 5 | 24 | 59 | 64 | 61 | 48 | 39 | ||||||||||||||||||||||||||||||
Strategic initiative costs | 5 | 2 | 10 | 4 | 3 | 1 | — | 2 | — | — | ||||||||||||||||||||||||||||||
Debt registration fees | — | — | — | — | — | 1 | — | — | — | — | ||||||||||||||||||||||||||||||
Non-cash share-based compensation | 4 | 1 | 1 | 4 | 7 | 4 | 4 | 4 | 3 | 3 | ||||||||||||||||||||||||||||||
Write-down of held for sale assets to net realizable value | — | — | — | — | — | — | — | — | 1 | — | ||||||||||||||||||||||||||||||
Loss (gain) on sale of long-lived assets | — | — | 2 | (1 | ) | (1 | ) | 1 | — | (4 | ) | — | (1 | ) | ||||||||||||||||||||||||||
Impairment of long-lived assets | 2 | 60 | — | — | 16 | — | — | — | — | — | ||||||||||||||||||||||||||||||
Goodwill impairment | — | 235 | — | — | — | — | — | — | — | |||||||||||||||||||||||||||||||
Loss (gain) on foreign currency transactions | (9 | ) | — | 4 | (3 | ) | (1 | ) | (1 | ) | — | 3 | (8 | ) | (1 | ) | ||||||||||||||||||||||||
Loss on extinguishment of debt | — | — | — | — | — | — | — | — | — | 246 | ||||||||||||||||||||||||||||||
Third-party fees expensed in connection with the debt modification | — | — | — | — | — | — | — | — | — | 9 | ||||||||||||||||||||||||||||||
Net loss (income) of unrestricted subsidiaries, net of dividends received | 0 | 0 | (2 | ) | (2 | ) | (2 | ) | (2 | ) | (1 | ) | (1 | ) | — | — | ||||||||||||||||||||||||
Pension/OPEB/nonretirement postemployment benefits and long-term disability costs | (1 | ) | (1 | ) | (1 | ) | (1 | ) | 7 | 8 | 8 | 8 | 15 | 16 | ||||||||||||||||||||||||||
Adjusted EBITDA(a) | $ | 190 | $ | 171 | $ | 177 | $ | 215 | $ | 210 | $ | 157 | $ | 202 | $ | 226 | $ | 222 | $ | 220 | ||||||||||||||||||||
| Three months ended | ||||||||||||||||||||||||||||||||||||||||
| March 31, 2013 | December 31, 2012 | September 30, 2012 | June 30, 2012 | March 31, 2012 | December 31, 2011 | September 30, 2011 | June 30, 2011 | March 31, 2011 | December 31, 2010 | |||||||||||||||||||||||||||||||
| (in millions) | ||||||||||||||||||||||||||||||||||||||||
REVENUE | ||||||||||||||||||||||||||||||||||||||||
Products | $ | 529 | $ | 631 | $ | 652 | $ | 634 | $ | 637 | $ | 749 | $ | 768 | $ | 729 | $ | 757 | $ | 722 | ||||||||||||||||||||
Services | 589 | 609 | 625 | 616 | 620 | 638 | 651 | 643 | 633 | 644 | ||||||||||||||||||||||||||||||
|
|
|
|
|
|
|
|
|
|
|
|
|
|
|
|
|
|
|
| |||||||||||||||||||||
| 1,118 | 1,240 | 1,277 | 1,250 | 1,257 | 1,387 | 1,419 | 1,372 | 1,390 | 1,366 | |||||||||||||||||||||||||||||||
|
|
|
|
|
|
|
|
|
|
|
|
|
|
|
|
|
|
|
| |||||||||||||||||||||
COSTS | ||||||||||||||||||||||||||||||||||||||||
Products: | ||||||||||||||||||||||||||||||||||||||||
Costs (exclusive of amortization of intangibles) | 236 | 261 | 283 | 271 | 280 | 311 | 320 | 319 | 343 | 332 | ||||||||||||||||||||||||||||||
Amortization of technology intangible assets | 14 | 22 | 46 | 47 | 49 | 50 | 59 | 65 | 66 | 67 | ||||||||||||||||||||||||||||||
Services | 282 | 291 | 302 | 309 | 315 | 322 | 322 | 335 | 339 | 348 | ||||||||||||||||||||||||||||||
|
|
|
|
|
|
|
|
|
|
|
|
|
|
|
|
|
|
|
| |||||||||||||||||||||
| 532 | 574 | 631 | 627 | 644 | 683 | 701 | 719 | 748 | 747 | |||||||||||||||||||||||||||||||
|
|
|
|
|
|
|
|
|
|
|
|
|
|
|
|
|
|
|
| |||||||||||||||||||||
GROSS PROFIT | $ | 586 | $ | 666 | $ | 646 | $ | 623 | $ | 613 | $ | 704 | $ | 718 | $ | 653 | $ | 642 | $ | 619 | ||||||||||||||||||||
|
|
|
|
|
|
|
|
|
|
|
|
|
|
|
|
|
|
|
| |||||||||||||||||||||
Reconciliation of Adjusted EBITDA | ||||||||||||||||||||||||||||||||||||||||
Net (loss) income | $ | (188 | ) | $ | (81 | ) | $ | 6 | $ | (169 | ) | $ | (165 | ) | $ | (26 | ) | $ | (99 | ) | $ | (152 | ) | $ | (432 | ) | $ | (180 | ) | |||||||||||
Interest expense | 116 | 108 | 108 | 107 | 108 | 109 | 109 | 111 | 113 | 127 | ||||||||||||||||||||||||||||||
Interest income | — | (1 | ) | — | (1 | ) | (1 | ) | (1 | ) | (2 | ) | (1 | ) | (1 | ) | (1 | ) | ||||||||||||||||||||||
Provision for (benefit from) income taxes | 3 | (9 | ) | (54 | ) | 88 | (24 | ) | (2 | ) | 79 | (52 | ) | 19 | 22 | |||||||||||||||||||||||||
Depreciation and amortization | 107 | 114 | 138 | 140 | 143 | 143 | 155 | 163 | 167 | 168 | ||||||||||||||||||||||||||||||
|
|
|
|
|
|
|
|
|
|
|
|
|
|
|
|
|
|
|
| |||||||||||||||||||||
EBITDA | 38 | 131 | 198 | 165 | 61 | 223 | 242 | 69 | (134 | ) | 136 | |||||||||||||||||||||||||||||
Impact of purchase accounting adjustments(a) | — | — | 1 | 1 | 1 | — | 2 | — | (1 | ) | (1 | ) | ||||||||||||||||||||||||||||
Restructuring charges, net | 18 | 84 | 14 | 17 | 90 | 21 | 23 | 102 | 42 | 22 | ||||||||||||||||||||||||||||||
Sponsors’ fees(b) | 2 | 2 | 2 | 1 | 2 | 2 | 2 | 1 | 2 | 2 | ||||||||||||||||||||||||||||||
Acquisition-related costs(c) | — | — | — | 1 | 2 | 1 | 1 | — | — | 4 | ||||||||||||||||||||||||||||||
Integration-related costs(d) | 5 | 4 | 5 | 6 | 3 | 5 | 10 | 35 | 39 | 48 | ||||||||||||||||||||||||||||||
Loss on extinguishment of debt(e) | 3 | 3 | — | — | — | — | — | — | 246 | — | ||||||||||||||||||||||||||||||
Third-party fees expensed in connection with the debt modification(f) | 14 | 4 | — | — | — | — | — | — | 9 | — | ||||||||||||||||||||||||||||||
Non-cash share-based compensation | 1 | 2 | 1 | 2 | 2 | 3 | 3 | 3 | 3 | 3 | ||||||||||||||||||||||||||||||
Write-down of assets held for sale to net realizable value | — | — | 1 | 4 | — | — | — | — | — | 1 | ||||||||||||||||||||||||||||||
Loss (gain) on investments and sale of long-lived assets, net | — | — | — | — | 2 | 1 | — | 2 | (1 | ) | — | |||||||||||||||||||||||||||||
Impairment of long-lived assets | — | — | 4 | 2 | — | — | — | — | — | — | ||||||||||||||||||||||||||||||
Goodwill impairment Reversal of contingent liability related to acquisition Change in fair value of Preferred Series B embedded derivative(h) Venezuela hyperinflationary and devaluation charges Securities registration fees(i) (Gain) loss on foreign currency transactions Pension/OPEB/nonretirement postemployment benefits and long-term disability costs(j) Adjusted EBITDA Three months ended March 31,
2013 December 31,
2012 September 30,
2012 June 30,
2012 March 31,
2012 December 31,
2011 September 30,
2011 June 30,
2011 March 31,
2011 December 31,
2010 (in millions) $ 89 $ — $ — $ — $ — $ — $ $ $ $ — — (1 ) — — — — — — — (4 ) (4 ) 3 3 — — — — — — 1 — — — — — — — — — — — — — 3 — — — — — (17 ) 2 14 (5 ) 11 1 (5 ) 2 (1 ) (8 ) 22 23 25 28 23 22 15 22 16 15 $172 $ 251 $ 267 $ 225 $ 200 $ 279 $ 293 $ 236 $ 220 $ 222
Liquidity and Capital Resources
Our existing cash balance, cash generated by operations and borrowings available under our credit facilities are our primary sources of short-term liquidity. Based on our current level of operations, we believe these sources will be adequate to meet our liquidity needs for at least the next several years.twelve months. Our ability to meet our cash requirements will depend on our ability to generate cash in the future, which is subject to general economic, financial, competitive, legislative, regulatory and other factors that are beyond our control. As part of our analysis, we have assessed the implications of the recent financial events on our current business and determined that these market conditions have not resulted in an inabilityaffected our ability to meet our obligations as they come due in the ordinary course of business and have not had a significant impact on our liquidity as of March 31, 2011.2013. However, we cannot assure you that our business will generate sufficient cash flowflows from operations or that future borrowings will be available to us under our credit facilities in an amount sufficient to enable us to repay our indebtedness or to fund our other liquidity needs. See “—Contractual Obligations and Sources of Liquidity—Credit Facilities.”
Sources and Uses of Cash
The following table provides the condensed statements of cash flows for the periods indicated:
| Fiscal Year ended September 30, | Six months ended March 31, | Six months ended March 31, | Fiscal years ended September 30, | |||||||||||||||||||||||||||||||||||||
| 2008(1) | 2009 | 2010 | 2010 | 2011 | 2013 | 2012 | 2012 | 2011 | 2010 | |||||||||||||||||||||||||||||||
| (in millions) | in millions | |||||||||||||||||||||||||||||||||||||||
Net cash provided by (used for): | ||||||||||||||||||||||||||||||||||||||||
Net cash (used for) provided by: | ||||||||||||||||||||||||||||||||||||||||
Net loss | $ | (1,305 | ) | $ | (845 | ) | $ | (871 | ) | $ | (417 | ) | $ | (612 | ) | $ | (269 | ) | $ | (191 | ) | $ | (354 | ) | $ | (863 | ) | $ | (871 | ) | ||||||||||
Adjustments to net loss for non-cash items | 1,667 | 978 | 860 | 462 | 313 | |||||||||||||||||||||||||||||||||||
Adjustments to reconcile net loss to net cash used for operating activities | 300 | 324 | 616 | 637 | 880 | |||||||||||||||||||||||||||||||||||
Changes in operating assets and liabilities | (58 | ) | 109 | 53 | (47 | ) | (50 | ) | 57 | (102 | ) | (218 | ) | (74 | ) | 33 | ||||||||||||||||||||||||
|
|
|
|
| ||||||||||||||||||||||||||||||||||||
Operating activities | 304 | 242 | 42 | (2 | ) | (349 | ) | 88 | 31 | 44 | (300 | ) | 42 | |||||||||||||||||||||||||||
Investing activities | (7,205 | ) | (155 | ) | (864 | ) | (850 | ) | (30 | ) | (59 | ) | (75 | ) | (283 | ) | (101 | ) | (864 | ) | ||||||||||||||||||||
Financing activities | 7,512 | (101 | ) | 853 | 878 | 248 | (59 | ) | (22 | ) | 155 | 228 | 853 | |||||||||||||||||||||||||||
Effect of exchange rate changes on cash and cash equivalents | (17 | ) | 2 | (19 | ) | (17 | ) | 5 | (5 | ) | 7 | 7 | (6 | ) | (19 | ) | ||||||||||||||||||||||||
|
|
|
|
| ||||||||||||||||||||||||||||||||||||
Net (decrease) increase in cash and cash equivalents | 594 | (12 | ) | 12 | 9 | (126 | ) | (35 | ) | (59 | ) | (77 | ) | (179 | ) | 12 | ||||||||||||||||||||||||
Cash and cash equivalents at beginning of period | — | 594 | 582 | 582 | 594 | |||||||||||||||||||||||||||||||||||
Cash and cash equivalents at beginning of year | 338 | 415 | 415 | 594 | 582 | |||||||||||||||||||||||||||||||||||
|
|
|
|
| ||||||||||||||||||||||||||||||||||||
Cash and cash equivalents at end of period | $ | 594 | $ | 582 | $ | 594 | $ | 591 | $ | 468 | ||||||||||||||||||||||||||||||
Cash and cash equivalents at end of year | $ | 303 | $ | 356 | $ | 338 | $ | 415 | $ | 594 | ||||||||||||||||||||||||||||||
|
|
|
|
| ||||||||||||||||||||||||||||||||||||
Operating Activities
Cash provided by operating activities(used for) operations was $44 million, ($300) million, and $42 million $242for fiscal 2012, 2011 and 2010, respectively. Cash provided by operations was $88 million and $304 million for the fiscal years ended September 30, 2010, 2009 and 2008, respectively. Cash used for operating activities was $349 million and $2$31 million for the six months ended March 31, 2013 and 2012, respectively.
Adjustments to reconcile net loss to net cash provided by (used for) operations for fiscal 2012, 2011 and 2010 were $616 million, $637 million, and $880 million, and consisted of depreciation and amortization of $564 million, $653 million, and $691 million, unrealized loss (gain) on foreign currency exchange of $29 million, ($38) million, and $41 million, non-cash interest expense of $22 million, $41 million and $105 million and share based compensation of $8 million, $12 million, and $19 million, respectively. CashIn addition to these adjustments, in fiscal 2011, cash used for operating activitiesoperations included $291 million in payments associated with the refinancing of the incremental term B-2 loans. In connection with this refinancing the Company recognized a $241 million cash loss on the extinguishment of debt (excluding $5 million of non-cash charges for debt issuance costs) and paid $50 million of amortized discount.
Adjustments to reconcile net loss to net cash provided by operations for the six months ended March 31, 2011 includes2013 and 2012 were $300 million and $324 million, respectively and primarily consisted of depreciation and amortization of $221 million and $286 million, respectively. Adjustments to reconcile net loss to net cash provided by operations during the repaymentsix months ended March 31, 2013 also included goodwill impairment of the discount upon redemption$89 million and third-party fees expensed in connection with our debt modifications of the term B-2 loans$18 million, which were partially offset by unrealized gains on foreign currency exchanges of $291$27 million.
TheCash provided by (used for) changes in operating assets and liabilities for fiscal 2012, 2011 and 2010 were ($218) million, ($74) million, and $33 million, respectively. Cash provided by (used for) changes in operating assets and liabilities for the six months ended March 31, 2013 and 2012, was $57 million and ($102) million, respectively.
In fiscal 2012 the decrease in net cash associated with the changes in ouroperating assets and liabilities was predominantly driven by payments associated with our business restructuring reserves established in prior years, reductions in the Company’s accounts payable and deferred revenue balances and payment of previously established employee payroll and benefit obligations, the most significant of which were payments under our pension and employee incentive plans. These decreases were partially offset by a decrease in inventory levels.
In fiscal 2011 the decrease in net cash associated with the changes in our operating assets and liabilities resulted in a net decrease in cash and cash equivalents of $50 million for the six months ended March 31, 2011. The net decrease was primarilypredominantly driven by the timing of the
payment of accrued interest, payments associated with our business restructuring reserves and a decrease in foreign exchange contracts resulting from thedue to settlement of foreign exchange contracts and changes in foreign currency exchange rates.rates associated with these contracts, an increase in inventory and a decrease in payroll and benefit obligations. These decreases in our cash balancesoperating assets and liabilities were partially offset by the increase in accrued interest as a result of the issuance of the senior secured notes and repayment of the senior secured incremental term B-2 loans, which resulted in a change in the timing of when our interest payments are due. The decreases in operating asset and liabilities were also partially offset by efforts to closely manage the timing of our payments to vendors, improvements in the collections of our accounts receivable combined with increases inand the effects of non-cash business restructuring reserves net of cash due to the timing of payment of accounts payable.payments against our reserves.
TheIn fiscal 2010 the increase in net cash associated with the changes in our operating assets and liabilities resulted in a net decrease in cash and cash equivalents of $47 million for the six months ended March 31, 2010 and were primarily due to increases in accounts receivable and deferred costs offset by the increase in accounts payable associated with the acquired NES business. The acquisition of NES included only a limited amount of working capital. Therefore, the increases in accounts receivable and accounts payable were expected as the acquired balances of these accounts were not sufficient to sustain the existing business needs at the date of the acquisition of NES. The increase in deferred costs is associated with certain projects of the Avaya Government Solutions business (formerly Nortel Government Solutions Incorporated) that began ramping up in January 2010.
The change in operating assets and liabilities of $53 million in fiscal year 2010 was predominantly due to increases in accounts payable and deferred revenues and payments made in connection with our restructuring activities partially offset by increases in accounts receivable and deferred costs. Payments related tocosts and payments made in connection with our restructuring charges were $39 million, net of restructuring charges related to the acquisition of NES.activities.
The changeIn the six months ended March 31, 2013, the increase in net cash associated with the changes in our operating assets and liabilities of $109 million in fiscal year 2009 was primarily due to continuedpredominantly driven by improvements in the collection of accounts receivablereceivables, increases in deferred revenues attributable to a significant number of annual prepaid support contracts closed in January 2013, and reductionthe effects of non-cash business restructuring reserves net of cash payments against our reserves. These increases in inventories whichcash and cash equivalents were partially offset by payment of accrued interest, payments associated with our employee incentive programs in the first quarter of 2009, the payments made in connection with our restructuring activities and a reduction in our accounts payable balance.
The change in operating assets and liabilities resulted in a net decrease in our cash and cash equivalents of $58 million in fiscal year 2008 and was primarily due to payments associated with our employee incentive programs in the first quarter of 2008 and the payments made in connection with our restructuring activities. These decreases were partially offset by the improvements in the collectionpay down of accounts receivable and reduction in inventories.payable.
Investing Activities
CashNet cash used for investing activities for fiscal 2012, 2011 and 2010 was $30$283 million, $101 million, and $850$864 million, and consisted primarily of cash used for the six months ended March 31, 2011acquisition of businesses of $234 million, $16 million and 2010,$805 million, capital expenditures of $92 million, $83 million and $79 million and payments to develop capitalized software of $35 million, $42 million and $43 million, respectively. Cash used for investing activitiesthe acquisition of businesses in the period ended March 31, 2011 included capital expenditures and capitalized software development costsfiscal 2012 includes $208 million of $35 million and $14 million, respectively. Further, during the first quarterpayments (net of fiscal year 2011, the Company and Nortel agreed on a final purchase pricecash acquired of $933 million$22 million) related to our acquisition of Radvision. Cash for the acquisition of NES and we received $6 million representing all remaining amounts due to Avaya from funds heldbusinesses in escrow. In addition, restricted cash of $24 million that formerly secured a standby letter of credit related to a facility lease in Germany is included in cash and cash equivalents, as the standby letter of credit is now secured by a letter of credit issued under Avaya Inc.’s senior secured multi-currency asset-based revolving credit facility. We also used $14 million for the acquisition of Konftel AB, a Swedish manufacturer of conference telephones and an innovator in audio collaboration technology, during the second quarter of fiscal year 2011 as discussed in Note 4, “Business Combinations and Other Transactions,” to our consolidated financial statements included elsewhere in this prospectus. The primary use of cash in the six months ended March 31, 2010 was related toincludes payments in connection with the acquisition of NES of $805$800 million (net of cash acquired of $38 million, and the application of the $100 million good-faith deposit made in fiscal year 2009)2009 and the return of funds held in escrow of $5 million). In addition, during that period we usedfiscal 2012 the cash for capital expenditures and capitalized software development costs of $30 million and $23 million, respectively.
Cash used for investing activities was $864partially offset by $74 million for fiscal year 2010. The primary use of cash in fiscal year 2010 wasproceeds from the sale of investments primarily related to paymentsmarketable securities acquired in connection with the acquisition of NES of $800 million (in AugustRadvision. In fiscal 2010,
the Company received $5 million from funds held in escrow as a partial working capital adjustment to the purchase price of NES). In addition, during fiscal year 2010 we used cash for capital expenditures and capitalized software development costs of $79 million and $43 million, respectively. Cash used for investing activities during fiscal year 2010 was partially offset by $18 million of proceeds from the liquidation of auction rate securities acquired in connection with the acquisition of NES and the $32 million ofin net proceeds received from the divestiture of our 59.13% ownership in AGC (net of cash sold of $13 million). and $18 million in proceeds from the liquidation of auction rate securities acquired in connection with the acquisition of NES.
Cash used for investing activities was $155$59 million and $75 million for fiscal 2009the six months ended March 31, 2013 and included2012, respectively. The primary use of cash used for investing activities for the six months ended March 31, 2013 was related to capital expenditures and capitalized software development costs of $76$47 million and $43$10 million, respectively and the $100 million good-faith deposit made in connection with the purchase of NES. These payments were partially offset by $98$9 million related to the liquidation of short-term securities.
Cash used for investing activities was $7,205 million for fiscal year 2008. The primary use of cash in fiscal year 2008 was related to cash payments in connection withproceeds from the Mergersales of $6,925 million (net of cash acquired of $1,405 million). In addition, during that period we used cash for capital expenditures and capitalized software development costs of $120 million and $74 million, respectively, and $98 million related to the reclassification of short-term securities.long-lived assets.
Financing Activities
Net cash provided by financing activities for fiscal 2012, 2011 and 2010 was $248$155 million, for the six months ended March 31, 2011, as compared to $878$228 million, for the six months ended March 31, 2010. Activity for the current periodand $853 million, respectively, and primarily included proceeds from our financing agreements (net of repayments), proceeds from the issuance of Avaya Inc.’spreferred stock and payments for debt issuance and modification costs.
In fiscal 2012 net cash provided by financing activities included $196 million of proceeds from the issuance of 48,921 shares of Series B Convertible Preferred Stock with detachable warrants to purchase 24.5 million shares of common stock and $60 million borrowed by the Company under its senior secured asset-based credit facility both of which were used to finance, in part, the acquisition of Radvision. Following the completion of the acquisition, all amounts borrowed under the senior secured asset-based credit facility were repaid in full.
In fiscal 2011 net cash provided by financing activities included proceeds of $967 million from the issuance of $1,009 million of senior secured notes net of $1,009$42 million whichof cash paid for debt issuance and debt modification costs. The proceeds from the issuance of the senior secured notes were used, to repay in full the senior secured incremental term B-2 loans includingwhich had a discounted carrying value of $696 million. In addition to the discounted carrying value of $696 million, for the repaymenttotal payment of principal, net$987 million included $241 million of unamortized loan discount includedrecognized as a cash out flowloss on extinguishment of debt (excluding $5 million of non-cash charges for financing activitiesdebt issuance costs) and $291$50 million for the repayment of debtamortized loan discount as discussed under “Operating Activities”inSources and Uses of Cash—Operating Activities above. Additionally, activitySee Note 9, “Financing Arrangements” to our audited Consolidated Financial Statements for further details on the current period included $42 million in associated debt issuance of the senior secured notes and modification costs and $22 million in scheduled debt payments. Netrepayment of the senior secured incremental term B-2 loans.
In fiscal 2010 net cash used forprovided by financing activities for the corresponding prior year period included net proceeds of $783 million from the issuance of senior secured incremental term B-2 loans with detachable warrants to purchase 61.5 million shares of the Company’s common stock and proceeds of $125 million from the issuance of 125,000 shares of Series A preferred stock with detachable warrants to purchase 38.5 million shares of common stock. This was partially offset by $24 millionstock which were used to finance, in debt payments and debt issuance costspart, the acquisition of $5 million.NES.
Net cash provided by financing activities for fiscal year 2010 was $853 million. Financing activities for fiscal year 2010 included net proceeds of $783 million from the issuance of incremental term B-2 loans with detachable warrants to purchase 61.5 million shares of the Company’s common stock and proceeds of $125 million from the issuance of 125,000 shares of Series A preferred stock with detachable warrants to purchase 38.5 million shares of common stock. This was partially offset by the scheduled repayments of our long-term debt of $37 million, $42 million and $48 million in debt paymentsfiscal 2012, 2011 and debt issuance costs of $5 million.2010, respectively.
Net cash used for financing activities for fiscal year 2009 was $101$59 million and included $72$22 million for debt payments, including a $34 million principal payment required by Avaya Inc.’s debt agreements as a result of generating excess cash flowsthe six months ended March 31, 2013 and 2012. Cash from operations, as defined in the debt agreements. In addition, $29 million of cash was used in fiscal year 2009 for costs incurred in connection with the conversion of the loans under the senior unsecured credit facility into the senior unsecured notes.
Net cash provided by financing activities for fiscal year 2008 was $7,512 million and includedthe six months ended March 31, 2013 includes proceeds of $5,250$589 million from the issuance of debt in connection with the Mergersenior secured term B-5 loans and $2,427proceeds of $290 million from the issuance of common stock, partially offset by $1319% Senior Secures Notes. The proceeds from the issuance of the senior secured term B-5 loans were used to repay $584 million principal amount of senior secured term B-1 loans and $31the proceeds from the issuance of the 9% Senior Secured Notes were used to repay $284 million principal amount of term B-5 loans. Cash used for financing activities for the six months ended March 31, 2013 also includes cash paid for debt issuance and modification costs of $49 million. Included in cash used for debt issuance costs andfinancing activities is $19 million in scheduled debt payments respectively.
Contractual Obligations and Sources of Liquidity
Contractual Obligations
The following table summarizes our contractual obligations as of September 30, 2010:2012:
| Payments due by period | Payments due by period | |||||||||||||||||||||||||||||||||||||||
| Total | Less than 1 year | 1-3 years | 3-5 years | More than 5 years | ||||||||||||||||||||||||||||||||||||
| (in millions) | ||||||||||||||||||||||||||||||||||||||||
In millions | Total | Less than 1 year | 1-3 years | 3-5 years | More than 5 years | |||||||||||||||||||||||||||||||||||
Capital lease obligations(1) | $ | 25 | $ | 2 | $ | 4 | $ | 6 | $ | 13 | $ | 24 | $ | 3 | $ | 8 | $ | 7 | $ | 6 | ||||||||||||||||||||
Operating lease obligations(2) | 498 | 116 | 146 | 91 | 145 | 499 | 101 | 153 | 108 | 137 | ||||||||||||||||||||||||||||||
Purchase obligations with contract manufacturers and suppliers(3) | 103 | 103 | — | — | — | 61 | 61 | — | — | — | ||||||||||||||||||||||||||||||
Other purchase obligations(4) | 113 | 65 | 40 | 8 | — | 114 | 40 | 66 | 8 | — | ||||||||||||||||||||||||||||||
Senior secured term B-1 loans(5) | 3,662 | 38 | 76 | 3,548 | — | 1,434 | 15 | 1,419 | — | — | ||||||||||||||||||||||||||||||
Senior secured incremental term B-2 loans(5) | 990 | 10 | 20 | 960 | — | |||||||||||||||||||||||||||||||||||
Senior secured term B-3 loans(5) | 2,152 | 23 | 46 | 46 | 2,037 | |||||||||||||||||||||||||||||||||||
Senior secured notes(6) | 1,009 | — | — | — | 1,009 | |||||||||||||||||||||||||||||||||||
9.75% senior unsecured notes due 2015 | 700 | — | — | — | 700 | 700 | — | — | 700 | — | ||||||||||||||||||||||||||||||
10.125%/10.875% senior PIK toggle unsecured notes due 2015 | 834 | — | — | 15 | 819 | 834 | — | 15 | 819 | — | ||||||||||||||||||||||||||||||
Interest payments due on long-term debt | 1,934 | 418 | 805 | 635 | 76 | 1,734 | 389 | 717 | 464 | 164 | ||||||||||||||||||||||||||||||
Pension benefit obligations | 150 | 150 | — | — | — | 178 | 178 | — | — | — | ||||||||||||||||||||||||||||||
|
|
|
|
| ||||||||||||||||||||||||||||||||||||
Total | $ | 9,009 | $ | 902 | $ | 1,091 | $ | 5,263 | $ | 1,753 | $ | 8,739 | $ | 810 | $ | 2,424 | $ | 2,152 | $ | 3,353 | ||||||||||||||||||||
|
|
|
|
| ||||||||||||||||||||||||||||||||||||
| (1) | The payments due for capital lease obligations do not include future payments for interest. |
| (2) | Contractual obligations for operating leases include |
| (3) | We purchase components from a variety of suppliers and use several contract manufacturers to provide manufacturing services for our products. During the normal course of business, in order to manage manufacturing lead times and to help assure adequate component supply, we enter into agreements with contract manufacturers and suppliers that allow them to produce and procure inventory based upon forecasted requirements provided by us. If we do not meet these specified purchase commitments, we could be required to purchase the inventory. See Note 19, “Commitments and |
| (4) | Other purchase obligations represent an estimate of contractual obligations in the ordinary course of business, other than commitments with contract manufacturers and suppliers, for which we have not received the goods or services as of September 30, |
| (5) | The contractual cash obligations for the senior secured credit facility represent the minimum principal payments owed per year. The contractual cash obligations do not reflect a potential springing of the term |
| B-3 loans to July 26, 2015 (as described in Note 9, “Financing Arrangements” to our audited Consolidated Financial Statements) or any contingent mandatory annual principal repayments that may be required to be made upon us achieving certain excess cash flow targets, as defined in |
| As discussed more fully below, subsequent to September 30, 2012 Avaya Inc. completed a series of transactions which allowed it to refinance its senior secured term B-1 loans originally due October 26, 2014. |
| (6) | The contract obligations for the senior secured notes, which mature on April 1, 2019, represent principal payments only. |
| (7) | The contractual cash obligations for the 9.75% senior unsecured cash pay notes due 2015 and 10.125%/10.875% senior paid-in-kind (“PIK”) toggle unsecured notes due 2015 (see Note 9, “Financing Arrangements,” to our |
| The contractual cash obligations for interest payments represent the related interest payments on long-term debt and the contractual obligations associated with the related interest rate swaps which hedge |
| The Company sponsors non-contributory defined pension |
AsAdditionally, as of September 30, 2010,2012, the Company had gross unrecognized tax benefits of $185$248 million. Also, included in non-current liabilities is $7$9 million relating to audits by state and local and foreign taxing authorities for the periods prior to the Company’s separation from Alcatel-LucentLucent Technologies Inc. (now Alcatel-Lucent) pursuant to the Company’s Tax Sharing Agreement with Lucent (predecessor to Alcatel-Lucent).between the Company and Lucent. Further, an additional $28$37 million for gross interest and penalties relating to these amounts had been classified as non-current liabilities. At this time, the Company is unable to make a reasonably reliable estimate of the timing of payments in connection with these tax liabilities; therefore, such amounts are not included in the above contractual obligation table.
On February 11, 2011,October 29, 2012 Avaya Inc. amendedcompleted an amendment and restated itsrestatement of the senior secured credit facility to reflect modifications to certain provisions thereof. The most significant modifications include an amendment that permitted Avaya Inc. to effect a refinancing (see below) in whichand senior secured multi-currency asset-based revolving credit facility along with the extension of the maturity date of a portion$135 million aggregate principal amount of the senior secured term B-1 loans representing outstanding principal amounts of $2.2 billion was extended from October 26, 2014 to October 26, 2017 by converting such loans into a new tranche of senior secured term B-3B-4 loans (potentially springing(“term B-4 loans”). On December 21, 2012 Avaya Inc. completed an amendment and restatement of the senior secured credit facility along with the extension of the maturity date of $713 million aggregate principal amount of term B-1 loans from October 26, 2014 to JulyOctober 26, 2015, under certain circumstances)2017 and increasing the applicable interest rate for the$134 million aggregate principal amount of term B-4 loans from October 26, 2017 to March 31, 2018 in each case by converting such loans into a new tranche of senior secured term B-3 loans.
The refinancing referenced above was accomplished through a private placement of $1,009B-5 loans (“term B-5 loans”). On December 21, 2012 Avaya Inc. issued $290 million of senior secured notes. The9% senior secured notes were issued at par, bear interest at a ratedue April 2019 (the “9% Senior Secured Notes”), the proceeds of 7% per annum and mature on April 1, 2019. The proceeds from the noteswhich were used to repay in full the senior secured incremental term B-2 loans outstanding under Avaya Inc.’s senior secured credit facility (representing $988$284 million in aggregate principal amount and $12 million in accrued and unpaid interest through February 11, 2011)of term B-5 loans and to pay related fees and expenses. The private placement effectively deferred $950
On March 7, 2013, Avaya Inc. completed an exchange offer in which $642 million of its 9.75% senior unsecured cash-pay notes due 2015 and $742 million of 10.125%/10.875% senior unsecured PIK toggle notes due November 1, 2015 were exchanged for $1,384 million of 10.50% senior secured notes due March 1, 2021. In addition, on March 12, 2013, Avaya Inc. refinanced the remaining term B-1 loans due October 26, 2014, with the cash proceeds from the issuance of $589 million aggregate principal payments originallyamount of term B-5 loans due in October 2014 to April 2019. Please refer to Note 9, “Financing Arrangements,” to26,
2017 under its senior secured credit facility. Annual maturities of debt, based on our consolidated financial statementsdebt profile as of March 31, 2013 and September 30, 2012, for further details.the next five years ending September 30th and thereafter consist of:
In millions | March 31, 2013 | September 30, 2012 | ||||||
2013 | $ | 19 | $ | 38 | ||||
2014 | 38 | 38 | ||||||
2015 | 53 | 1,442 | ||||||
2016 | 174 | 1,542 | ||||||
2017 | 38 | 23 | ||||||
2018 and thereafter | 5,799 | 3,046 | ||||||
|
|
|
| |||||
Total | $ | 6,121 | $ | 6,129 | ||||
|
|
|
| |||||
Our primary future cash requirements will be to fund working capital, debt service, capital expenditures, restructuring payments and benefit obligations. In addition, we may use cash in the future to make strategic acquisitions.
In addition to our working capital requirements, we expect our primary cash requirements for the period April 1, 20112013 through September 30, 20112013 to be as follows:
| • | Benefit obligations—We estimate we will make payments under our pension and postretirement obligations totaling $104 million during the remainder of fiscal 2013. These payments include: $67 million to satisfy the minimum statutory funding requirements of our U.S. qualified plans, $4 million of payments under our U.S. benefit plans which are not pre-funded, $8 million under our non-U.S. benefit plans which are predominately not pre-funded, $21 million under our U.S. retiree medical benefit plan which is not pre-funded and $4 million under the agreements for represented retirees to post-retirement health trusts. See discussion in Note 13, “Benefit Obligations” to our audited Consolidated Financial Statements for further details of our benefit obligations. |
| • | Debt service—As discussed above and in Note 7, “Financing Arrangements” to our unaudited Consolidated Financial Statements, Avaya Inc. entered into certain refinancing transactions during the six months ended March 31, 2013. We expect to make payments of |
| • | Capital |
| • | Restructuring payments—We expect to make payments of |
|
|
We and our subsidiaries, affiliates and significant shareholders may from time to time seek to retire or repurchasepurchase our outstanding debt (including publicly issued debt) and equity (including shares issued in this offering) through cash purchases and/or exchanges, in open market purchases, privately negotiated transactions, by tender offer or otherwise. Such repurchases or exchanges, if any, will depend on prevailing market conditions, liquidity requirements, contractual restrictions and other factors. The amounts involved may be material.
Future Sources of Liquidity
We expect our primary source ofexisting cash balance, cash generated by operations and borrowings available under our credit facilities to be positive net cash flows provided by operating activities.our primary sources of short-term liquidity. We expect that profitable revenues from higher margin products and services and continued focus on accounts receivable, inventory management and cost containment
will enable us to generate positive net cash from operating activities. Further, we continue to focus on cost reductions and have initiated restructuring plans during fiscal year 20112013 designed to reduce overhead and provide cash savings.
Avaya Inc. currently has two revolving credit facilities providing for borrowings of up to an aggregate of $535 million subject to certain contractual limitations. Avaya Inc.’s senior secured multi-currency asset-based revolving credit facility provides senior secured revolving financing of up to $335 million, subject to availability under a borrowing base which, at any time, equals the sum of 85% of eligible accounts receivable plus 85% of the net orderly liquidation value of eligible inventory, subject to certain reserves and other adjustments. In addition, although the senior secured multi-currency asset-based revolving credit facility does not require Avaya Inc. to comply with any financial ratio maintenance covenants, if Avaya Inc. has Excess Availability under the facility of less than $33.5 million at any time, it will not be permitted to borrow any additional amounts thereunder unless its pro forma Consolidated Fixed Charge Coverage Ratio (each such term as defined in the credit agreement governing the facility) is at least 1.0 to 1.0. At March 31, 2013 there were no borrowings under the facility, however there were letters of credit issued in the ordinary course of business which reduce the amount of borrowings available. Based on the borrowing base as calculated at March 31, 2013, the remaining availability under the facility was $218 million which is net of $76 million in issued letters of credit. Avaya Inc. also has a senior secured multi-currency revolver, which allows for borrowings of up to $200 million. At March 31, 2013, there were no amounts outstanding under the aggregate, each of which matures on October 26, 2013. Please refersenior secured multi-currency revolver and the $200 million was available in full. Both revolving credit facilities include other customary conditions that, if not complied with, could restrict Avaya Inc.’s availability to borrow. See Note 9,7, “Financing Arrangements,”Arrangements” to our consolidated financial statements for further details.unaudited Consolidated Financial Statements.
During the fourth quarter of fiscal 2012, the Company changed its indefinite reinvestment of undistributed foreign earnings assertion with respect to its non-U.S. subsidiaries. This change in assertion reflects the Company’s intention and ability to maintain flexibility with respect to sourcing of funds from non-U.S. locations.
The Company is planning to make an initial public offering of its common stock as contemplated in this prospectus. We intend to use the net proceeds of this offering to repay certain of our existing indebtedness and to redeem our Series A preferred stock. There is no way to predict whether or not we will be successful in completing this offering as contemplated.Preferred Stock.
If we do not generate sufficient cash from operations, face unanticipated cash needs such as the need to fund significant strategic acquisitions or do not otherwise have sufficient cash and cash equivalents, we may need to incur additional debt or issue additional equity. In order to meet our cash needs Avaya Inc.we may, from time to time, borrow under itsour credit facilities or issue long-term or short-term debt or equity, if the market and our credit facilities and the indentures governing our notes permit us to do so. Furthermore, if we acquire a business in the future that has existing debt, our debt service requirements may increase. We regularly evaluate market conditions, our liquidity profile, and various financing alternatives for opportunities to enhance our capital structure. If market conditions are favorable, we may refinance our existing debt or issue additional securities.
Based on past performance and current expectations, we believe that our existing cash and cash equivalents of $594$338 million and $468$303 million as of September 30, 20102012 and March 31, 2011,2013, respectively and future cash provided by operating activities will be sufficient to meet our future cash requirements described above.above for at least the next twelve months. Our ability to meet these requirements will depend on our ability to generate cash in the future, which is subject to general economic, financial, competitive, legislative, regulatory and other factors that are beyond our control.
Uncertainties Regarding Our Liquidity
We believe the following uncertainties exist regarding our liquidity:
| • | Revenues—Our ability to generate net cash from operating activities has been a primary source of our liquidity. If our revenues and |
and challenging market conditions, particularly in the U.S. |
activities in a sufficient amount to meet our cash needs could be adversely affected. Furthermore, our net cash provided by operating activities may be insufficient if we face unanticipated cash needs such as the funding of a future acquisition or other capital |
| • | Cost Saving Initiatives—Our ability to reduce costs through cost saving initiatives will have a direct effect on our cash flows and available cash balances, as certain restructuring charges are recorded in the current year but are paid in future periods. Further, although we may identify additional cost saving initiatives in the future, we may be unsuccessful in these actions or the amount required for severance payments may be so prohibitive as to preclude the implementation of such cost savings initiatives, which could negatively impact our future cash flows. |
| • | Debt Ratings—Our ability to obtain external financing and the related cost of |
| • | Future Acquisitions—We may from time to time in the future make acquisitions. Such acquisitions may require significant amounts of cash or may result in increased debt service requirements to the extent we assume or incur debt in connection with such |
| • | Litigation—In the ordinary course of business, the Company is involved in litigation, claims, government inquiries, investigations, charges and proceedings. See |
Debt Service Obligations
As a result of the Merger and the acquisition of NES, our level of indebtedness increased. As of March 31, 2011,2013, principal payments due under our indebtedness was $6,176were $6,121 million, excluding capital lease obligations of $24$23 million. Our interest expense for the period October 27, 2007 through September 30, 2008 and for fiscal years 2009 and 2010 was $377 million, $409 million and $487 million, and includes $17 million, $57 million and $105 million of non-cash interest expense, respectively. Our interest expense for the six months endedending March 31, 2010 and 20112013 was $229$224 million and $240includes $12 million of non-cash interest expense. Our interest expense for fiscal 2012, 2011, and 2010 was $432 million, $460 million and $487 million, respectively, and includes $64$22 million, $41 million and $28$105 million of non-cash interest expense, respectively.
Our leverage requires that a substantial portion of our cash flows from operations be dedicated to the payment of principal and interest on our indebtedness.
We continually monitor our exposure to the risk of increased interest rates as portions of our borrowings under our credit facilities are at variable rates of interest. We use interest rate swap agreements to manage the amount of our floating rate debt to the extent we deem appropriate. At September 30, 20102012 the outstanding notional amount of these swap agreements was $3.3$1.8 billion. Subsequent to September 30, 2010, we chose to let swap agreements with aggregated notional amounts of $1.3 billion expire pursuant to their terms. The remaining outstanding swap agreements with notional amounts aggregating $2.0 billion expire through August 2013.
For the periods May 1, 2009 through October 31, 2009 and November 1, 2009 through April 30, 2010, the Company elected to pay interest in kind on Avaya Inc.’s senior unsecured PIK toggle notes. As a result, payment in kind interest of $41 million and $43 million was added to the principal amount of the notes effective November 1, 2009 and May 1, 2010, respectively, and will be payable when the notes become due. For the interest periods of May 1, 2010 to October 31, 2010 and November 1, 2010 to April 30, 2011, the Company made such payments in cash interest. On April 29, the Company delivered notice to its creditors that, with respect to the interest period of May 1, 2011 to October 31, 2011, the Company will make such payments in cash interest. The Company has made all scheduled payments timely and is not in default under the senior secured credit facility, the indenture governing Avaya Inc.’s senior secured notes, the indenture governing Avaya Inc.’s senior unsecured notes or Avaya Inc.’s senior secured multi-currency asset-based revolving credit facility.
Strategic Uses of Cash and Cash Equivalents
Cash and cash equivalents decreased by $126 million to $468 million at March 31, 2011 from $594 million at September 30, 2010. Cash and cash equivalents at March 31, 2011 and September 30, 2010 do not include restricted cash of $2 million and $28 million, respectively. The restricted cash balance at September 30, 2010 related primarily to the securing of a standby letter of credit related to a facility lease in Germany, which was classified as other non-current assets, and is now secured by a letter of credit issued under Avaya Inc.’s senior secured multi-currency asset-based revolving credit facility as of March 31, 2011.
Our cash and cash equivalents balance at September 30, 2010 and 2009 was $594 million and $582 million, respectively, an increase of $12 million. Cash and cash equivalents at September 30, 2009 does not include $100 million that had been placed in an interest bearing escrow account as a good faith deposit in connection with the acquisition of NES and classified as other non-current assets. This deposit was included in the funds used for the acquisition of NES on December 18, 2009. In addition, at September 30, 2010 and 2009 there was restricted cash of $28 million and $32 million, respectively, primarily securing a standby letter of credit related to a facility lease in Germany which is classified as other non-current assets and is not included in the cash and cash equivalents balance.
Deferred Tax Assets
Our deferred tax assets are primarily a result of deductible temporary differences related to pension, tax credit carryforwards, net operating loss or NOL,(“NOL’s”) carryforwards, benefit obligations, tax credit carryforwards, and other accruals which are available to reduce taxable income in future periods. As of September 30, 2010,2012, the Company had tax-effected NOL carryforwards of $777$1,038 million, comprised of $523$543 million for U.S. federal,Federal, state and local taxes and $254$495 million for foreign taxes primarilyincluding $180 million, $255 million and $24 million, in Germany.Germany, Luxembourg and France, respectively. U.S. federalFederal and state NOL carryforwards expire through the year 2030,2031, with the majority expiring in excess of 10 years. The majority of foreign NOL carryforwards (after-tax) have no expiration. Additionally, the Company has various other tax credit carryforwards totaling $77$73 million. Of this total, $28$17 million expire within five years, $17$21 million expire between five and 15 years and $32$35 million expire in excess of 15 years.
The Internal Revenue Code contains certain provisions which may limit the use of U.S. Federal net operating losses and U.S. Federal tax credits upon a change in ownership (determined under very broad and complex direct and indirect ownership rules) in the Company within a three-year testing period. As a result of the Merger, a significant change in the ownership of the Company occurred which, pursuant to Section 382 of the U.S. Internal Revenue Code, will limitthat limits, on an annual basis, the Company’s ability to utilize its federal NOLs.U.S. Federal NOL’s and U.S. Federal tax credits. The Company’s NOLsNOL’s and tax credits will continue to be available to offset taxable income and tax liabilities (until such NOLsNOL’s and tax credits are either used or expire) subject to the Section 382 annual limitation. If the Section 382 annual limitation amount is not fully utilized in a particular tax year, then the unused portion from that particular tax year will be added to the Section 382 annual limitation in subsequent years. We do not believe that the share issuance as contemplated in this prospectus will itself, or when aggregated with other prior shareholder ownership changes during the applicable testing period, cause an ownership change that would further limit, on an annual basis, our ability to utilize our current U.S. Federal net operating losses and U.S. Federal tax credits.
In fiscal years 2008 and 2009, we recognized significant impairments of our intangible assets and goodwill which contributed to a significant book taxable loss in the U.S. We also incurred and expect to continue to incur significant interest expense related to our debt and amortization and depreciation expense associated with the step-up in basis of our assets in purchase accounting associated with the Merger and the acquisition of NES. As a result of continuing pre-tax losses incurred subsequent to the Merger, as of September 30, 2010,2012, excluding the U.S. deferred tax liabilities on indefinite-lived intangible assets, our deferred tax assets exceed our deferred tax liabilities in the U.S. Further, as of September 30, 2010,and we are in a three-year cumulative book taxable loss position in the U.S.
Further, as a result of operational losses and continued business restructuring accruals in Germany, Spain and France as well as intercompany interest expense in Luxembourg, the Company’s subsidiaries in Germany, Luxembourg, Spain and France are in a three year cumulative book taxable loss position.
In assessing the realization of U.S. deferred tax assets, the Company considers whether it is more likely than not that some portion or all of the deferred tax assets will not be realized. The Company considered the scheduled reversal of U.S. deferred tax assets and liabilities, projected future U.S. taxable income, and certain distinct tax planning strategies in making this assessment. Based on this assessment in fiscal year 20092010, 2011, and 2010,2012 the Company determined that it is more likely than not that the U.S., German, Luxembourg, Spanish and French deferred tax assets will not be realized to the extent they exceed the scheduled reversal of deferred tax liabilities. Accordingly, we have provided a valuation allowance against our U.S., German, Luxembourg, Spanish and French net deferred tax assets which has and will continue to adversely affect our effective income tax rate.
At September 30, 2010,2012, the valuation allowance of $1,094$1,527 million is comprised of $786$962 million relating to U.S. deferred tax assets and $308$565 million relating to foreign deferred tax assets for which $180$260 million, $255 million and $24 million relates to our German, operations.Luxembourg and French subsidiaries, respectively. In fiscal year 2010,2012, the Company recorded an increase of $356$117 million to its valuation allowance. The increase in the valuation allowance is comprised of a $330$60 million charge included in the provision for income taxes.taxes (which includes $135 million charge for federal and international income taxes, $56 million release of valuation allowance associated with federal tax expense on net gains in other comprehensive income and $19 million benefit for state income taxes) and a $57 million change to net deferred tax assets related to other changes in other comprehensive income.
Credit Facilities
In connection with the Merger on October 26, 2007, Avaya Inc. entered into borrowing arrangements with several financial institutions, certain of which arrangements were amended December 18, 2009 in connection with the acquisition of NES and amended on February 11, 2011 in connection with the refinancing.have since been amended. Long-term debt under Avaya Inc.’s borrowing arrangements includes a senior secured credit facility consisting of term loans and a revolving credit facility, senior unsecured notes, and a senior secured multi-currency asset based revolving credit facility, senior secured notes and senior unsecured notes. On August 8, 2011, Avaya Inc. amended the terms of the multi-currency
revolvers available under its senior secured credit facility and its senior secured multi-currency asset-based revolving credit facility to extend the final maturity of each from October 26, 2013 to October 26, 2016.
During the three months ended December 31, 2012, Avaya Inc. completed three transactions which allowed Avaya Inc. to refinance $848 million of term loans under its senior secured credit facilities that originally matured October 26, 2014. These transactions were (1) an amendment and restatement of the senior secured credit facility and the senior secured multi-currency asset-based revolving credit facility on October 29, 2012 along with the extension of the maturity date of $135 million aggregate principal amount of senior secured term B-1 loans (“term B-1 loans”), (2) an amendment and restatement of the senior secured credit facility on December 21, 2012 along with the extension of the maturity date of $713 million aggregate principal amount of term B-1 loans and $134 million aggregate principal amount of senior secured term B-4 loans, and (3) the issuance on December 21, 2012 of $290 million of 9% senior secured notes due April 2019.
During the three months ended March 31, 2013, Avaya Inc. refinanced the remaining $584 million of term B-1 loans outstanding under its senior secured credit facility with the cash proceeds of $589 million aggregate principal amount of term B-5 loans under the senior secured credit facility.
Additionally, during the three months ended March 31, 2013, Avaya Inc. refinanced $1,384 million of senior unsecured notes, through (1) amendments to the senior secured credit facility and the senior secured multi-currency asset-based revolving credit facility permitting the refinancing of the 9.75% senior unsecured notes due 2015 and 10.125%/10.875% senior unsecured PIK toggle notes due 2015 (collectively, the “Old Notes”) with indebtedness secured by a lien on certain collateral on a junior-priority basis and (2) the exchange of $1,384 million of Old Notes for $1,384 million of 10.50% senior secured notes due 2021.
As of March 31, 2013, term loans outstanding under the senior secured credit facility include term B-3 loans, term B-4 loans and term B-5 loans with remaining face values (after all principal payments through March 31, 2013) of $2,139 million, $1 million, and $1,148 million respectively. The Company regularly evaluates market conditions, its liquidity profile, and various financing alternatives for opportunities to enhance its capital structure. If opportunities are favorable, Avaya Inc. may refinance existing debt or issue additional debt securities.
In connection with the acquisition of Radvision, Avaya Inc. borrowed $60 million under its senior secured asset-based credit facility. Following the completion of the acquisition, all amounts borrowed were repaid in full.
We are not in default under the senior secured credit facility, the indentures governing Avaya Inc.’s‘s notes or Avaya Inc.’s senior secured multi-currency asset-based revolving credit facility. See Note 9, “Financing Arrangements,Arrangements” and Note 22, “Subsequent Events,” to our consolidated financial statementsaudited Consolidated Financial Statements and Note 7, “Financing Arrangements” to our unaudited Consolidated Financial Statements for further details.
Guarantees of Indebtedness and Other Off-Balance Sheet Arrangements
We are party to several types of agreements, including surety bonds, purchase commitments, product financing arrangements and performance guarantees, which are fully discussed in NoteNotes 15 and 19, “Commitments and Contingencies,” to our consolidated financial statements located elsewhere in this prospectus.unaudited and audited Consolidated Financial Statements, respectively.
Legal Proceedings and Environmental, Health and Safety Matters
We are subject to certain legal proceedings, and environmental, health and safety matters, which are fully discussed in NoteNotes 15 and 19, “Commitments and Contingencies—Legal Proceedings,”Contingencies” to our consolidated financial statements.unaudited and audited Consolidated Financial Statements, respectively.
Use of Estimates and Critical Accounting Policies and Estimates
Our consolidated financial statementsConsolidated Financial Statements are based on the selection and application of GAAP,accounting principles generally accepted in the United States of America, which require us to make estimates and assumptions about future events that affect the amounts reported in our financial statements and the accompanying notes. Future events and their effects cannot be determined with absolute certainty. Therefore, the determination of estimates requires the exercise of judgment. Actual results could differ from those estimates, and any such differences may be material to the financial statements. We believe that the following policies may involve a higher degree of judgment and complexity in their application and represent the critical accounting policies used in the preparation of our financial statements. If different assumptions or conditions were to prevail, the results could be materially different from our reported results.
Acquisition Accounting
The Company accounts for business combinations using the acquisition method, which requires an allocation of the purchase price of an acquired entity to the assets acquired and liabilities assumed based on their estimated fair values at the date of acquisition. Goodwill represents the excess of the purchase price over the net tangible and intangible assets acquired.
Revenue Recognition
The Company derives revenue primarily from the sale of products, software, and services for communications systems and applications. The Company’s products are sold directly through its worldwide sales force and indirectly through its global network of distributors, dealers, value-added resellers and systems integrators. Services includes (i) supplemental maintenancesupport service, including services provided under contracts to monitor and optimize customers’ communications network performance; (ii) professional services for implementation and integration of solutions for our customers;converged voice and data networks, network security and unified communications; and (iii) operations, or managed services. MaintenanceSupport contracts typically have terms that range from one to five years. Contracts for professional services typically have terms that range from twofour to foursix weeks for standard solutions and from six months to one year or more for customized solutions. Contracts for operationsmanaged services typically have terms that range from one to seven years.
In accordance with GAAP, revenue is recognized when persuasive evidence of an arrangement exists, delivery has occurred, the fee is fixed or determinable, and collectability is reasonably assured, contractual obligations have been satisfied and title and risk of loss have been transferred to the customer. In instances in which finalassured. For arrangements that require acceptance of the product, system, or solution isas specified by the customer, revenue is deferred until allthe acceptance criteria have been met.
The Company’s indirect sales to distributionchannel partners are generally recognized at the time of shipment if all contractual obligations have been satisfied. The Company accrues a provision for estimated sales returns and other allowances, and deferrals relating to inventory levels held by distributors,including promotional marketing programs etc.and other incentives as a reduction of revenue at time of revenue recognition pursuant to FASB ASC Topic 605, “Revenue Recognition,” or ASC 605.sale. When estimating returns, the Company considers customary inventory levels held by distributors.
Revenue Recognition—Fiscal years 2010Multiple deliverable arrangements beginning in fiscal 2011
In October 2009, the Financial Accounting Standards Board (“FASB”) amended the software revenue recognition guidance to remove from its scope tangible products containing software components and priornon-software components that function together to deliver the product’s essential functionality. The FASB also amended the guidance for multiple deliverable revenue arrangements to: (i) provide updated guidance on how the deliverables in an arrangement should be separated and how the consideration should be allocated; and (ii) change the term “fair value” to “selling price” and require an entity to allocate revenue using the estimated selling prices of the deliverables when a vendor does not have vendor-specific or third-party evidence of selling price. The Company adopted the new guidance on a prospective basis as of the beginning of fiscal 2011 for revenue arrangements entered into or materially modified on or after October 1, 2010.
The new guidance did not generally change the units of accounting for the Company’s revenue transactions as delivered and undelivered items generally qualified as separate units of accounting under the historical guidance. The new guidance affects the timing of revenue recognition for multiple deliverable arrangements that included delivered items and undelivered items for which the Company was unable to demonstrate fair value pursuant to the historical guidance. In such cases, the delivered items were combined with the undelivered items to form a single unit of accounting and revenue was recognized either on a straight-line basis over the services period or deferred until the earlier of when the fair value requirements were met or when the last item was delivered. In addition, the Company previously used the residual method to allocate the arrangement consideration in cases where fair value could only be determined for the undelivered items. Under the new guidance, the Company allocates the total arrangement consideration based upon the relative selling price of each deliverable and revenue is recognized as each item is delivered.
The Company enters into multiple deliverable arrangements, which may include any combinationvarious combinations of products, software and services. Most product and service deliverables qualify as separate units of accounting and can be sold on a standalone basis. A deliverable constitutes a separate unit of accounting when it has standalone value and, where return rights exist, delivery or performance of the undelivered items is considered probable and substantially within the Company’s control. When the Company sells products with implementation services, they are generally combined as one or more units of accounting, depending on the nature of the services and the customer’s acceptance requirements.
Most of the Company’s solutions have both software and non-software components that function together to deliver the products’ essential functionality. For these multiple deliverable arrangements, the Company allocates revenue to the deliverables based on their relative selling prices. To the extent that a deliverable is subject to specific guidance on whether and/or how to allocate the consideration in a multiple deliverable arrangement, that deliverable is accounted for in accordance with such specific guidance. The Company limits the amount of revenue recognition for delivered items to the amount that is not contingent on the future delivery of products or services or meeting other future performance obligations.
The Company allocates revenue based on a selling price hierarchy of vendor-specific objective evidence, third-party evidence, and then selling price. Vendor-specific objective evidence is based on the price charged when the deliverable is sold separately. Third-party evidence is based on largely interchangeable competitor products or services in standalone sales to similarly situated customers. As the Company is unable to reliably determine what competitors products’ selling prices are on a standalone basis, the Company is not typically able to determine third-party evidence. Estimated selling price is based on the Company’s best estimates of what the selling prices of deliverables would be if they were sold regularly on a standalone basis. Estimated selling price is established considering multiple factors including, but not limited to, pricing practices in different geographies and through different sales channels, major product and services groups, and customer classifications.
Once the Company allocates revenue to each deliverable, the Company recognizes revenue in accordance with its policies when all revenue recognition criteria are met. Products revenue is generally recognized upon delivery and support and managed services revenue is generally recognized ratably over the period during which the services are performed. However, revenue for professional services arrangements is generally recognized upon completion of performance and revenue for arrangements that require acceptance of the product, system, or solution, is recognized when the acceptance criteria have been met.
Standalone or subsequent sales of software or software-related items are recognized in accordance with the software revenue recognition guidance. For multiple deliverable arrangements that only include software items, the Company generally uses the residual method to allocate the arrangement consideration. Under the residual method, the amount of consideration allocated to the delivered items equals the total arrangement consideration, less the fair value of the undelivered items. Where vendor-specific objective evidence for the undelivered items cannot be determined, the Company defers revenue until all items are delivered and services have been performed, or until such evidence of fair value can be determined for the undelivered items.
Multiple deliverable arrangements in fiscal 2010 and prior
Prior to fiscal 2011, a multiple deliverable arrangement is separated into more than one unit of accounting if all of the following criteria are met: (i) the delivered item(s) has value to the customer on a standalone basis; (ii) there is objective and reliable evidence of the fair value of the undelivered item(s); and (iii) if the arrangement includes a general right of return relative to the delivered item(s) and, delivery or performance of the undelivered item(s) is considered probable and substantially inwithin the control of the Company. If these criteria are not met, the delivered productsitems are combined with the undelivered items to form a single unit of accounting and revenue for the delivered and undelivered items areis recognized on either a straight-line basis over the services period or deferred until the earlier of when such criteria are met or when the last undelivered item is delivered.
Most delivered and undelivered items qualify as separate units of accounting and can be sold standalone or in various combinations across the Company’s geographies or customer markets. The Company uses the residual method to allocate the arrangement consideration for multiple deliverable transactions wherearrangements for which objective and reliable evidence of fair value of the delivered items cannot be determined but can only be determined for the undelivered items. Under the residual method, the amount of consideration allocated to the delivered items equals the total arrangement consideration, less the fair value of the undelivered items. To the extent that a deliverable in a multiple deliverable arrangement is subject to specific guidance on whether and/or how to separate multiple deliverable arrangements into separate units of accounting, that deliverable is accounted for in accordance with such specific guidance.
The Company limits the amount of revenue recognition for delivered items to the amount that is not contingent on the future delivery of products or services, future performance obligations, or subject to customer-specific return or refund privileges. Once the Company allocates revenue to each deliverable, the Company recognizes revenue on each deliverable in accordance with its policies for product and service revenue recognition. Supplemental maintenance services and operations services revenues are deferred and recognized ratably over the period during which the services are to be performed. Professional services arrangements are generally recognized upon delivery or completion of performance. For services performed on a time and materials basis, revenue is recognized upon performance.
The Company uses objective and reliable evidence of fair value to separate an arrangementthe deliverables into more than one unit of accounting if the Company has evidenced vendor-specific objective evidence of fair value, or VSOE, or third-party evidence of fair value or TPE, for all of the deliverables. The accounting guidance does not permit the Company to use an item. VSOE is based on theestimated selling price chargedfor these arrangements when the deliverable is sold separately. TPEobjective and reliable evidence of fair value is established by evaluating largely interchangeable competitor products or services in standalone sales to similarly situated customers. As the Company is unable to reliably determine what competitors products’ selling prices are on a standalone basis, the Company is not typically able to determine TPE.available.
The Company recognizes revenue in accordance with the subtopic of Revenue Recognition under FASB ASC Topic 985, “Software,” or ASC 985,software revenue recognition guidance for arrangements that include software that is more than incidental to
the products or services as a whole. In multiple deliverable software arrangements, the Company generally uses the residual method to allocate the arrangement consideration. Under the residual method, the amountWhen vendor-specific objective evidence of consideration allocated to the delivered items equals the total arrangement consideration less the fair value of the undelivered items. Where VSOE ofcannot be determined for the undelivered items, cannot be determined, the Company defers revenue until all items are delivered and services have been performed,delivered or until VSOEsuch evidence can be determined for the undelivered items.
Revenue Recognition—Fiscal year 2011
In October 2009, the FASB amended the accounting standards for revenue recognition to remove tangible products containing software components and non-software components that function together to deliver the product’s essential functionality from the scope of industry specific software revenue recognition guidance. In October 2009, the FASB also amended the accounting standards for multiple deliverable revenue arrangements (formerly Emerging Issues Task Force No. 08-1) to: (i) provide updated guidance on whether multiple deliverables exist, how the deliverables in an arrangement should be separated, and how the consideration should be allocated; (ii) require an entity to allocate revenue in an arrangement using estimated selling prices, or ESP, of deliverables if a vendor does not have VSOE or TPE; and (iii) eliminate the use of the residual method and require an entity to allocate revenue using the relative selling price method. The Company adopted the new guidance on a prospective basis as of the beginning of fiscal 2011 for revenue arrangements entered into or materially modified on or after October 1, 2010.
The new guidance did not generally change the units of accounting for the Company’s revenue transactions as delivered and undelivered items in most transactions qualified as separate units of accounting under the historical guidance. The new guidance does affect the timing of revenue recognition for multiple deliverable arrangements that included delivered products and undelivered items for which the Company was unable to demonstrate fair value pursuant to the historical guidance. In such cases, under the historical guidance, the delivered products were combined with the undelivered items to form a single unit of accounting and revenue for the delivered and undelivered items was recognized on a straight-line basis or deferred until the earlier of when the fair value requirements were met or when the last item was delivered. In addition, under the historical guidance, the Company used the residual method to allocate arrangement consideration for multiple deliverable transactions where objective and reliable evidence of fair value of the delivered items could not be determined but could be determined for the undelivered items. Under the new guidance, the Company allocates the total arrangement consideration to each separable deliverable of an arrangement based upon the relative selling price of each deliverable and revenue is recognized upon delivery or completion of those units of accounting. As a result of adopting the new guidance, net revenues for the six months ended March 31, 2011 were not materially different from the net revenues that would have been recorded under the historical accounting guidance. The Company cannot reasonably estimate the effect of adopting the new guidance on future financial periods as the impact will vary depending on the nature and volume of new or materially modified multiple deliverable arrangements in any given period.
The Company enters into multiple deliverable arrangements, which may include any combination of products, software and services. Most product and service deliverables qualify as separate units of accounting and can be sold standalone or in various combinations across the Company’s geographies or customer markets. A deliverable constitutes a separate unit of accounting when it has standalone value and there are no customer-negotiated refunds or return rights for the delivered items. If the arrangement includes a customer-negotiated refund or return right relative to the delivered items, and the delivery and performance of the undelivered item is considered probable and substantially in the Company’s control, the delivered item constitutes a separate unit of accounting.
Most all of the Company’s solutions have both software and non-software components that function together to deliver the products’ essential functionality. For multiple deliverable arrangements that contain both software and non-software components that function together to deliver a product’s essential functionality, the Company allocates revenue to all deliverables based on their relative selling prices. In such circumstances, the
Company uses a hierarchy of VSOE, TPE and ESP to determine the selling price to be used for allocating revenue to the deliverables. To the extent that a deliverable in a multiple deliverable arrangement is subject to specific guidance on whether and/or how to separate multiple deliverable arrangements into separate units of accounting, that deliverable is accounted for in accordance with such specific guidance. In addition, the Company limits the amount of revenue recognition for delivered items to the amount that is not contingent on the future delivery of products or services, future performance obligations, or subject to customer-specific return or refund privileges.
VSOE is based on the price charged when the deliverable is sold separately. TPE of selling price is established by evaluating largely interchangeable competitor products or services in standalone sales to similarly situated customers. As the Company is unable to reliably determine what competitors products’ selling prices are on a standalone basis, the Company is not typically able to determine TPE. ESP is based on the Company’s best estimates of what the selling prices of deliverables would be if they were sold regularly on a standalone basis. The ESP is established considering multiple factors including, but not limited to pricing practices in different geographies, through different sales channels, major product and services groups, and customer classifications.
Once the Company allocates revenue to each deliverable, the Company recognizes revenue on each deliverable in accordance with its policies for product and service revenue recognition. Supplemental maintenance services and operations services revenues are deferred and recognized ratably over the period during which the services are to be performed. Professional services arrangements are generally recognized upon delivery or completion of performance. For services performed on a time and materials basis, revenue is recognized upon performance. Standalone or subsequent sales of software or software-related products are recognized in accordance with FASB ASC Topic 985, “Software.” In multiple deliverable arrangements that only include standalone software and software-related products, the Company uses the residual method to allocate arrangement consideration. Under the residual method, the amount of consideration allocated to the delivered items equals the total arrangement consideration less the fair value of the undelivered items. Where VSOE of the undelivered items cannot be determined, the Company defers revenue until all items are delivered and services have been performed, or until VSOE can be determined for the undelivered items.determined.
Income Taxes
Income taxes are accounted for under the asset and liability method. Under this method, deferred tax assets and liabilities are recognized for the estimated future tax consequences attributable to differences between the financial statement carrying amounts of existing assets and liabilities and their respective tax bases, and operating loss and tax credit carryforwards. Deferred tax assets and liabilities are measured using enacted tax rates in effect for the year in which those temporary differences are expected to be recovered or settled. The effect on deferred tax assets and liabilities of a change in tax rates is recognized in the Consolidated Statements of Operations in the period that includes the enactment date. A valuation allowance is recorded to reduce the carrying amounts of deferred tax assets if it is more likely than not that such assets will not be realized. Additionally, the accounting for income taxes requires the Company to evaluate and make an assertion as to whether undistributed foreign earnings will be indefinitely reinvested or repatriated. As discussed more fully in Note 12, “Income Taxes” to our audited Consolidated Financial Statements at September 30, 2012, the Company changed its indefinite reinvestment of undistributed foreign earnings assertion.
FASB ASCAccounting Standards Codification (“ASC”) subtopic 740-10, “Income Taxes—Overall,” or Overall” (“ASC 740-10,740-10”) prescribes a comprehensive model for the financial statement recognition, measurement, classification, and disclosure of uncertain tax positions. ASC 740-10 contains a two-step approach to recognizing and measuring uncertain tax positions. The first step is to evaluate the tax position for recognition by determining if the weight of available evidence indicates that it is more likely than not that the position will be sustained on audit, based on the technical merits of the position. The second step is to measure the tax benefit as the largest amount that is more than 50% likely of being realized upon settlement.
Significant judgment is required in evaluating our uncertain tax positionpositions and determining our provision for income taxes. Although we believe our reserves are reasonable, no assurance can be given that the final tax outcome of these matters will not be different from that which is reflected in our historical income tax provision and accruals. We adjust these reserves in light of changing facts and circumstances.
Acquisition Accounting
Effective October 1, 2009, the Company accounts for business combinations under the new authoritative guidance using the acquisition method, which requires an allocation of the purchase price of an acquired entity to the assets acquired and liabilities assumed based on their estimated fair values at the date of acquisition. Goodwill represents the excess of the purchase price over the net tangible and intangible assets acquired.
Intangible and Long-lived Assets
Intangible assets include technology, customer relationships, trademarks and trade namestrade-names and other intangibles. Intangible assets with finite lives are amortized using the straight-line method over the estimated economic lives of the assets, which range from two to fifteen years. Long-lived assets, including intangible assets with finite lives, are reviewed for impairment whenever events or changes in circumstances indicate that the carrying amount of such assets may not be recoverable in accordance with FASB ASC Topic 360-10-35, “Impairment or Disposal of Long-Lived Assets,” or 360, “Property, Plant, and Equipment” (“ASC 360-10-35.360”). Determination of recoverability is based on an estimate of undiscounted future cash flows resulting from the use of the asset and its eventual disposition. Measurement of an impairment loss for long-lived assets that management expects to hold and use is based on the estimated fair value of the asset. Long-lived assets to be disposed of are reported at the lower of carrying amount or estimated fair value less costs to sell. Intangible assets determined to have indefinite useful lives are not amortized but are tested for impairment annually each September 30th, and more frequently if events occur or circumstances change that indicate an asset may be impaired. The estimated useful life of intangible and long-lived assets are based on many factors including assumptions regarding the effects of obsolescence, demand, competition and other economic factors, expectations regarding the future use of the asset, and our historical experience with similar assets. The assumptions used to determine the estimated useful lives could change due to numerous factors including product demand, market conditions, technological developments, economic conditions and competition.
During the second quarter of fiscal 2013, the Company tested the intangible assets and other long-lived assets of its ITPS reporting unit for impairment. The ITPS reporting unit provides specialized information technology services exclusively to government customers in the U.S. During the three months ended March 31, 2013, ITPS experienced a decline in revenues as a result of reduced government spending in anticipation of sequestration and budget cuts. Additionally there is uncertainty regarding how the sequestration and budget cuts will be implemented and the impact they will have on contractors supporting the government. As a result of these events, the Company determined that an interim impairment test of the reporting unit’s intangible assets and other long-lived assets should be performed.
Using the revised forecasts, the Company tested the intangible assets and other long-lived assets of the ITPS reporting unit for impairment during the three months ended March 31, 2013 and no impairment was identified.
Goodwill
Goodwill is not amortized but is subject to periodic testing for impairment in accordance with FASB ASC Topic 350, “Intangibles—Goodwill“Intangibles-Goodwill and Other,” or Other” (“ASC 350,350”) at the reporting unit level which is one level below the Company’s operating segments. The assessment of goodwill impairment is conducted by estimating and comparing the fair value of the Company’s reporting units’ net assets, as defined in ASC 350, to their carrying value as of that date. The fair value is estimated using an income approach whereby the fair value of the asset is based on the future cash flows that each reporting unit’s assets can be expected to generate. Future cash flows are based on forward-looking information regarding market share and costs for each reporting unit and are discounted using an appropriate discount rate. Future discounted cash flows can be affected by changes in industry or market conditions or the rate and extent to which anticipated synergies or cost savings are realized with newly acquired entities. The test for impairment is conducted annually each September 30th, and more frequently if events occur or circumstances change that indicate that the fair value of a reporting unit may be below its carrying amount.
At September 30, 20102012 the Company performed its annual goodwill impairment test and determined that the respective book values of the Company’s reporting units did not exceed their estimated fair values and that it was not necessary to record impairment charges. In order to evaluate the sensitivity of the fair value calculations on the goodwill impairment test the Company applied a hypothetical 10% decrease to the fair value of each reporting unit. This hypothetical 10% decrease in the fair value of each reporting unit at September 30, 20102012
indicated that only one reporting unit, with goodwill of $133 million, would notfail step one of the goodwill impairment test. Based on our goodwill impairment assessment performed as of September 30, 2012, we determined that no other reporting unit was at risk for failing step one of the goodwill impairment test.
During the second quarter of fiscal 2013, as a result inof the events that occurred with respect to the ITPS reporting unit discussed above, the Company determined that an interim impairment test of the reporting unit’s goodwill should be performed.
The test of goodwill for anyimpairment began with preparing a valuation of the ITPS reporting unit utilizing our latest near-term and long-term cash flow forecasts. The valuation was prepared based on a discounted cash flow model, consistent with the methodology used as part of the annual goodwill impairment test. This valuation reflected additional market risks and lower sales forecasts for the reporting unit, which are consistent with the government events and economic trends at that time. Specifically, the discounted cash flow model used a discount rate of 13% and did not provide for long-term growth.
The results of step one of the goodwill impairment test indicated that the estimated fair value of the ITPS reporting unit was less than the carrying value of its net assets (including goodwill) and as such, the Company performed step two of the impairment test. The second step of the impairment test compares the implied fair value of the reporting unit’s goodwill with the carrying value of that goodwill. If the carrying amount of the reporting unit’s goodwill exceeds the implied fair value of the goodwill, an impairment loss is recognized in an amount equal to that excess. The implied fair value is determined in the same manner as the amount of goodwill recognized in a business combination. That is, the fair value of the reporting unit is allocated to all of the assets and liabilities of that unit as if the reporting unit had been acquired in a business combination and the fair value of the reporting unit was the purchase price paid to acquire the reporting unit. This allocation is performed only for purposes of assessing goodwill for impairment; accordingly Avaya did not adjust the net book value of the assets and liabilities on its Consolidated Balance Sheets other than goodwill as a result of this process.
As a result of the application of step two of the goodwill impairment test, the Company estimated the implied fair value of the goodwill to be $44 million as compared with a carrying value of $133 million and recorded an impairment to goodwill of $89 million. See Note 4, “Goodwill and Intangible Assets” to our unaudited Consolidated Financial Statements.
The financial forecast utilized for purposes of the impairment analysis is based on estimated future cash flows that a market participant would expect the reporting unit to generate in the future. While the Company believes the assumptions used in the impairment analysis are reasonable, changes in the projected cash flows, the discount rate, and short-term and long-term growth rates could produce significantly different results for the impairment analysis. Internal and external factors could result in changes in these assumptions which may result in future impairment tests and charges. The Company will continue to monitor any changes in circumstances for indicators of impairment.
The Company determined that no events occurred or circumstances changed during the six months ended March 31, 2013 that would more likely than not reduce the fair value of its other reporting units below their respective carrying amounts.
Restructuring Programs
The Company accounts for exit or disposal of activities in accordance with FASB ASC Topic 420, “Exit or Disposal Cost Obligations,” or Obligations” (“ASC 420.420”). In accordance with ASC 420, a business restructuring is defined as an
exit or disposal activity that includes but is not limited to a program that is planned and controlled by management and materially changes either the scope of a business or the manner in which that business is conducted. Business restructuring charges includeincludes (i) one-time termination benefits related to employee separations, (ii) contract termination costs and (iii) other costs associated with exit or disposal activities including, but not limited to, costs for consolidating or closing facilities and relocating employees.
A liability is recognized and measured at its fair value for one-time termination benefits once the plan of termination is communicated to affected employees and it meets all of the following criteria: (i) management commits to a plan of termination, (ii) the plan identifies the number of employees to be terminated and their job classifications or functions, locations and the expected completion date, (iii) the plan establishes the terms of the benefit arrangement and (iv) it is unlikely that significant changes to the plan will be made or the plan will be withdrawn. Contract termination costs include costs to terminate a contract or costs that will continue to be incurred under the contract without benefit to the Company. A liability is recognized and measured at its fair value when the Company either terminates the contract or ceases using the rights conveyed by the contract. A liability is recognized and measured at its fair value for other associated costs in the period in which the liability is incurred.
In connection with the Merger, the Company adopted a plan to exit certain activities of the newly acquired company. A liability was recognized as of the consummation date of the acquisition for the costs under the exit plan in accordance with the authoritative guidance at that time if these costs were not associated with or were not incurred to generate revenues of the combined entity after the consummation date and either (i) had no future economic benefit to the combined company, were incremental to other costs incurred by either the acquired company or the acquiring company in the conduct of activities prior to the consummation date, and were expected to be incurred as a direct result of the plan to exit an activity of the acquired company or (ii) the cost represented an amount to be incurred by the combined company under a contractual obligation of the acquired company that existed prior to the consummation date and will either continue after the plan is completed with no economic benefit to the combined company or be a penalty incurred by the combined company to cancel that contractual obligation.
Pension and Postretirement Benefit Obligations
The Company sponsors non-contributory defined benefit pension plans covering certaina portion of its U.S. employees and retirees, and postretirement benefit plans for certaincovering a portion of its U.S. retirees that include healthcare benefits and life insurance coverage. Certain non-U.S. operations have various retirement benefit programs covering substantially all of their employees. Some of these programs are considered to be defined benefit pension plans for accounting purposes.
The Company’s pension and postretirement benefit costs are developed from actuarial valuations. Inherent in these valuations are key assumptions, including the discount rate and expected long-term rate of return on plan assets. Material changes in pension and postretirement benefit costs may occur in the future due to changes in these assumptions, changes in the number of plan participants, changes in the level of benefits provided, changes in asset levels and changes in legislation.
The discount rate is subject to change each year, consistent with changes in rates of return on high-quality fixed-income investments currently available and expected to be available during the expected benefit payment period. TheAs of September 30, 2012, the Company selects the assumed discount rate for its U.S. pension and postretirement plans by applying the published rates of existingfrom the AonHewitt AA Only and AonHewitt AA Only Above Median yield curves such as the Citigroup Pension Discount Curve and the Citigroup Above Median Pension Discount Curve, to the expected benefit payment streams and develops a rate at which it is believed the benefit obligations could be effectively settled. Previously, the Company applied rates from the Citigroup Pension Discount Curve and the Citigroup Above Median Pension Discount Curve. The Company follows a similar process for its non-U.S. pension plans by applying the published iBoxx indices. Based on the published rates as of September 30, 2010,2012, the Company used a weighted average discount rate of 4.95%3.94% for the U.S. pension plans, 4.34%3.61% for the non-U.S. pension plans, and 4.85%3.81% for the postretirement plans. For the U.S. pension plans,
non-U.S. pension plans, and the postretirement plans, every one-percentage-point increase or decrease in the discount rate reduces or increases our benefit obligation by $362$449 million, $81$98 million, and $71$65 million, respectively.
The market-related value of the Company’s plan assets as of the measurement date is developed using a 5-year smoothing technique. First, a preliminary market-related value is calculated by adjusting the market-related value at the beginning of the year for payments to and from plan assets and the expected return on assets during the year.
The expected return on assets represents the expected long-term rate of return on plan assets adjusted up to plus or minus 2% based on the actual 10-year average rate of return on plan assets. A final market-related value is determined as the preliminary market-related value, plus 20% of the difference between the actual return and expected return for each of the past five years.
These pension and other postretirement benefits are accounted for in accordance with FASB ASC Topic 715, “Compensation—Retirement Benefits,” or Benefits” (“ASC 715.715”). ASC 715 requires that plan assets and obligations be measured as of the reporting date and the over-funded, under-funded or unfunded status of plans be recognized as of the reporting date as an asset or liability in the Consolidated Balance Sheets. In addition, ASC 715 requires costs and related obligations and assets arising from pensions and other postretirement benefit plans to be accounted for based on actuarially determinedactuarially-determined estimates.
The plans use different factors, including years of service, eligible compensation and age, to determine the benefit amount for eligible participants. The Company funds its U.S. pension plans in compliance with applicable laws. See Note 13, “Benefit Obligations,” to our consolidated financial statementsaudited Consolidated Financial Statements for a discussion of the Company’s pension and postretirement plans and the Company’s decision to freeze benefit accruals and additional participation in the plans for its U.S. management employees effective December 31, 2003.plans.
Commitments and Contingencies
In the ordinary course of business we are subject to legal proceedings related to environmental, product, employment, intellectual property, licensing and other matters. In addition, we are subject to indemnification and liability sharing claims by Lucent Technologies Inc. (now Alcatel-Lucent) under the terms of the Contribution and Distribution Agreement. In order to determine the amount of reserves required, we assess the likelihood of any adverse judgments or outcomes to these matters as well as potential ranges of probable losses. A determination of the amount of reserves required for these contingencies is made after analysis of each individual issue. The estimates of required reserves may change in the future due to new developments in each matter or changes in approach such as a change in settlement strategy. Assessing the adequacy of any reserve for matters for which we may have to indemnify Alcatel-Lucent is especially difficult, as we do not control the defense of those matters and have limited information. In addition, estimates are made for our repurchase obligations related to products sold to various distributors who obtain financing from certain third party lending institutions, as described in Note 19,15, “Commitments and Contingencies,” in the notesContingencies” to our consolidated financial statements located elsewhere in this prospectus.unaudited Consolidated Financial Statements.
Share-based Compensation
Expense Recognition
The Company measures and recognizes compensation expense for all share-based payment awards based on their estimated fair values at the date of grant. The 2007 Plan governs the issuance of equity awards, including RSUs and stock options, to eligible plan participants. Key employees, directors, and consultants of the Company may be eligible to receive awards under the 2007 Plan. As of March 31, 2011,2013, the Company had authorized the issuance of up to 49,848,157 shares of its stock under the 2007 Plan and there remained 4,405,2019,784,283 shares available for future grant.
Option Awards
During fiscal years 2008 and 2009, the Company granted time-based, performance-based “EBITDA,” and market-based “multiple-of-money” options to purchase stock. Options granted during the year ended September 30,fiscal 2008 have an exercise price of $5.00, and options granted during the year ended September 30,fiscal 2009 have an exercise price of $3.80, which was the fair value of the underlying shares at the time granted, in each case as determined by the board of directors at the date of grant.
In November 2009, our compensation committee approved a stock option exchange program through which individuals holding stock options having exercise prices of $5.00 and $3.80 per share could exchange them on a one-option-for-one-option basis, for replacement options with an exercise price of $3.00 per share, the fair value of the underlying shares at the time of exchange, and with new vesting terms. The replacement options issued to
participants in the exchange program include time-based and market-based multiple-of-money options. The time-based options vest ratably over four years following the date of exchange. The multiple-of-money options vest upon the achievement of defined returns on the Sponsors’ initial investment in the Company. The exchange offer was closed on November 16, 2009 and substantially all eligible options were tendered for exchange and have an effective exchange date of November 17, 2009. During fiscal 2010, 2011 and 2012 the Company also granted time-based and multiple-of-money options in the ordinary course of business. A complete discussion of the terms and conditions of the granted awards and the exchange offer is provided in Note 14,“Share-based Compensation,” to our consolidated financial statementsaudited Consolidated Financial Statements included elsewhere in this prospectus.
For the six months ended March 31, 2013 and 2012 and fiscal 2012, 2011 and 2010 and the fiscal years ended 2010, 2009 and 2008, the Company recognized share-based compensation associated with these options of $2 million, $3 million, $5 million, $10 million, and $16 million, $9 million and $21 million, respectively, which is included in costs and operating expenses.respectively. At March 31, 2011,September 30, 2012, there was $14$8 million of unrecognized share-based compensation that the Company expects to recognize as expense over the next three to four years associated with 2007 Plan options. The expected expense does not include any compensation associated with the multiple-of-money awards as vesting of the multiple-of-money awards is outside of the control of the Company and the award recipients. Vesting and resulting compensation expense relative toof the multiple-of-money awards will only be recognizedoccur upon achievement of defined returns of the occurrence of a triggering event.Sponsors’ initial investment in the Company. The public offering as contemplated by the Company, if successful, doesthis prospectus will not meet the definition of a triggering event as defined byvesting condition included in the awards.multiple-of-money awards because the Sponsors will not be selling shares in the offering. At September 30, 2010,2012, exercisable options and unvested time-based options that are expected to vest aggregate to 27,346,51524,605,846 and have a weighted average exercise price of $3.03,$3.27, a fair value at the date of grant of $54$48 million, an intrinsic value of $20 million, and no intrinsic value.a weighted average remaining contractual term of 8 years.
The following table summarizes option awards under the 2007 Plan:
Options | Time- based | EBITDA | Multiple-of - Money | Total | Weighted Average Exercise Price | Fair Value at Date of Grant | ||||||||||||||||||||||||||||||||||||||||||
| (options granted and fair value in thousands) | ||||||||||||||||||||||||||||||||||||||||||||||||
Granted | 25,471 | 6,857 | 6,857 | 39,185 | $ | 5.00 | $ | 89,342 | ||||||||||||||||||||||||||||||||||||||||
Forfeited | (5,570 | ) | (1,500 | ) | (1,500 | ) | (8,570 | ) | $ | 5.00 | (19,540 | ) | ||||||||||||||||||||||||||||||||||||
Outstanding—September 30, 2008 | 19,901 | 5,357 | 5,357 | 30,615 | $ | 5.00 | 69,802 | |||||||||||||||||||||||||||||||||||||||||
Granted | 8,161 | 2,197 | 2,197 | 12,555 | $ | 3.80 | 26,240 | |||||||||||||||||||||||||||||||||||||||||
Forfeited | (7,628 | ) | (2,123 | ) | (2,123 | ) | (11,874 | ) | $ | 4.94 | (26,953 | ) | ||||||||||||||||||||||||||||||||||||
Outstanding—September 30, 2009 | 20,434 | 5,431 | 5,431 | 31,296 | $ | 4.54 | 69,089 | |||||||||||||||||||||||||||||||||||||||||
Options (in 000s) | Time- based | EBITDA | Multiple-of- Money | Total | Weighted Average Exercise Price | Fair Value at Date of Grant (in 000s) | ||||||||||||||||||||||||||||||||||||||||||
Outstanding—October 1, 2009 | 20,434 | 5,431 | 5,431 | 31,296 | $ | 4.54 | $ | 69,089 | ||||||||||||||||||||||||||||||||||||||||
Tendered—November 2009 | (18,587 | ) | (5,004 | ) | (5,004 | ) | (28,595 | ) | $ | 4.53 | (63,064 | ) | (18,587 | ) | (5,004 | ) | (5,004 | ) | (28,595 | ) | $ | 4.53 | (63,064 | ) | ||||||||||||||||||||||||
Exchanged—November 2009 | 18,587 | — | 10,008 | 28,595 | $ | 3.00 | 52,173 | 18,587 | 10,008 | 28,595 | $ | 3.00 | 52,173 | |||||||||||||||||||||||||||||||||||
Granted | 12,584 | — | 5,341 | 17,925 | $ | 3.00 | 22,013 | 12,584 | 5,341 | 17,925 | $ | 3.00 | 22,013 | |||||||||||||||||||||||||||||||||||
Forfeited | (3,421 | ) | (273 | ) | (1,393 | ) | (5,087 | ) | $ | 3.52 | (9,411 | ) | (3,421 | ) | (273 | ) | (1,393 | ) | (5,087 | ) | $ | 3.52 | (9,411 | ) | ||||||||||||||||||||||||
|
|
|
|
|
| |||||||||||||||||||||||||||||||||||||||||||
Outstanding—September 30, 2010 | 29,597 | 154 | 14,383 | 44,134 | $ | 3.03 | $ | 70,800 | 29,597 | 154 | 14,383 | 44,134 | $ | 3.03 | 70,800 | |||||||||||||||||||||||||||||||||
Granted | 4,466 | — | 2,404 | 6,870 | $ | 3.58 | 8,705 | |||||||||||||||||||||||||||||||||||||||||
Exercised | (55 | ) | — | — | (55 | ) | $ | 3.00 | (105 | ) | ||||||||||||||||||||||||||||||||||||||
Forfeited | (4,905 | ) | (58 | ) | (2,390 | ) | (7,353 | ) | $ | 3.08 | (11,846 | ) | ||||||||||||||||||||||||||||||||||||
|
|
|
|
|
| |||||||||||||||||||||||||||||||||||||||||||
Outstanding—October 1, 2011 | 29,103 | 96 | 14,397 | 43,596 | $ | 3.11 | 67,554 | |||||||||||||||||||||||||||||||||||||||||
Granted | 3,745 | — | 2,017 | 5,762 | $ | 4.22 | 9,696 | |||||||||||||||||||||||||||||||||||||||||
Exercised | (1,094 | ) | — | — | (1,094 | ) | $ | 3.00 | (2,067 | ) | ||||||||||||||||||||||||||||||||||||||
Forfeited | (5,991 | ) | (14 | ) | (3,911 | ) | (9,916 | ) | $ | 3.14 | (14,064 | ) | ||||||||||||||||||||||||||||||||||||
|
|
|
|
|
| |||||||||||||||||||||||||||||||||||||||||||
Outstanding—September 30, 2012 | 25,763 | 82 | 12,503 | 38,348 | $ | 3.28 | $ | 61,119 | ||||||||||||||||||||||||||||||||||||||||
|
|
|
|
|
| |||||||||||||||||||||||||||||||||||||||||||
Restricted Stock Units
The Company has issued RSUs each of which represents the right to receive one share of the Company’s stock when fully vested.
Compensation expense relating to RSUs is based upon the fair market value of common stock underlying the grant, which was determined in accordance with the terms of the 2007 plan.Plan. For the year ended September 30, 2010 and 2009, the Company recognized compensation expense associated with RSUs of $3 million and $1 million, respectively. Compensation expense for the year ended September 30, 2008 associated with RSUs was not material. For each of the six month periodsmonths ended March 31, 2013 and 2012 and fiscal 2012, 2011 and 2010, the Company recognized compensation expense associated with RSUs of $1 million.million, $2 million, $3 million, $2 million and $3 million, respectively. As of March 31, 2011,
September 30, 2012, there was $4$6 million of unrecognized share based compensation associated with RSUs that the Company expects to recognize as expense through May 2013.September 2016. The following table summarizes the RSUs granted under the 2007 Plan:
Nonvested Shares | Shares | |||
| ||||
| ||||
Non-vested shares at | ||||
| ||||
| ||||
| 740,789 | |||
Granted | 495,000 | |||
Forfeited | (15,000 | ) | ||
Vested | (295,000 | ) | ||
Non-vested shares at September 30, 2010 | 925,789 | |||
Granted | 305,000 | |||
Forfeited | (65,789 | ) | ||
Vested | (432,500 | ) | ||
Non-vested shares at September 30, 2011 | 732,500 | |||
Granted | 1,956,115 | |||
Forfeited | (220,682 | ) | ||
Vested | (547,046 | ) | ||
Non-vested shares at September 30, 2012 | 1,920,887 | |||
Fair Value Measurement and Valuation Methodologies
Valuation of Common Stock.Since our common stock is not publicly traded, the terms of the 2007 Plan require that our board or a committee of the board, as plan administrator, determine the fair market value of a share of our common stock. The determination is based in part upon the recommendation of our CEO and an independent third-party appraisal that is obtained at least annually and is reassessed by the plan administrator at least semi-annually. The table below summarizes equity awards granted by the Company and the valuation of our common stock as determined by the plan administrator for fiscal years 2008 through 2011:2012:
| Option Grants | Option Grants | |||||||||||||||||||||||||||||||||||||||
Period | Fair Value of Common Stock | Number | Exercise Price | RSU Grants(2) | Fair Value at Date of Grant | Fair Value of Common Stock | Number | Exercise Price | RSU Grants(2) | Fair Value at Date of Grant | ||||||||||||||||||||||||||||||
| (units granted and fair value in thousands) | (units granted and fair value in thousands) | |||||||||||||||||||||||||||||||||||||||
Year ended September 30, 2008 | $ | 5.00 | 39,185 | $ | 5.00 | 110 | $ | 89,892 | $ | 5.00 | 39,185 | $ | 5.00 | 110 | $ | 89,892 | ||||||||||||||||||||||||
Year ended September 30, 2009 | $ | 3.80 | 12,555 | $ | 3.80 | 331 | $ | 27,498 | $ | 3.80 | 12,555 | $ | 3.80 | 331 | $ | 27,498 | ||||||||||||||||||||||||
2009 Stock option exchange—tendered(1) | (28,595 | ) | — | $ | (63,064 | ) | ||||||||||||||||||||||||||||||||||
2009 Stock option exchange—replacement | $ | 3.00 | 28,595 | $ | 3.00 | — | $ | 52,173 | ||||||||||||||||||||||||||||||||
2009 Stock option exchange-tendered(1) | (28,595 | ) | — | $ | (63,064 | ) | ||||||||||||||||||||||||||||||||||
2009 Stock option exchange-replacement | $ | 3.00 | 28,595 | $ | 3.00 | — | $ | 52,173 | ||||||||||||||||||||||||||||||||
Year ended September 30, 2010 | $ | 3.00 | 17,925 | $ | 3.00 | 345 | $ | 23,048 | $ | 3.00 | 17,925 | $ | 3.00 | 345 | $ | 23,048 | ||||||||||||||||||||||||
Three months ended December 31, 2010 | $ | 3.00 | 1,915 | $ | 3.00 | 50 | $ | 2,138 | ||||||||||||||||||||||||||||||||
Eight months ended May 31, 2011 | $ | 3.00 | 4,025 | $ | 3.00 | 215 | $ | 4,823 | ||||||||||||||||||||||||||||||||
Three months ended March 31, 2011 | $ | 3.00 | 2,110 | $ | 3.00 | 65 | $ | 2,386 | ||||||||||||||||||||||||||||||||
Four months ended September 30, 2011 | $ | 4.40 | 2,845 | $ | 4.40 | 90 | $ | 4,924 | ||||||||||||||||||||||||||||||||
Seven months ended April 30, 2012 | $ | 4.40 | 3,162 | $ | 4.40 | 1,559 | $ | 12,504 | ||||||||||||||||||||||||||||||||
Five months ended September 30, 2012 | $ | 4.00 | 2,600 | $ | 4.00 | 397 | $ | 5,641 | ||||||||||||||||||||||||||||||||
| (1) | Represents the original grant date fair value of stock options tendered for exchange under the stock option exchange program in November 2009. The replacement options issued included time-based and market-based multiple-of-money options. A complete discussion of the terms and conditions of the granted awards and the exchange offer is provided in Note 14, “Share-based Compensation,” to our |
| (2) | Excludes |
We considered numerous objective and subjective factors in valuing our common stock at each valuation date consistent with the guidance in the American Institute of Certified Public Accountants Practice Aid,Valuation of Privately-Held-Company Equity Securities Issued as Compensation, or the Practice Aid. These objective and subjective factors included, but were not limited to:
arm’s-lengtharm’s length sales of our common stock in privately negotiated transactions;
valuations of our common stock;
our stage of development and financial position; and
our future financial projections.
Consistent with these objective and subjective factors, the plan administrator obtained independent third-party valuations. Other factors that went into the determination of the fair value of our stock price included: (1) our then current and projected financial performance, including the consideration of the potential outcomes of such performance and their corresponding impact on our common stock valuation, (2) general economic conditions, (3) our peer group of companies and their performance and (4) the volatility in equity markets.
In October 2007, the board estimated the fair value of the Company’s common stock to be $5.00 per share. This is consistent with the net book value of each share immediately following the closing of the Merger. The Practice Aid indicates that a third-party transaction between a willing buyer and a willing seller is the best indication of fair value. As Avaya Holdings Corp. has no material assets or standalone operations other than its ownership in Avaya Inc., we believe Avaya Holdings Corp.’s net investment in Avaya Inc. immediately after the Merger to be the best estimate of the fair value of the Company and that the resulting net book value per share of common stock to be the best estimate of the fair value of our common stock at the time of the Merger. At each grant date subsequent to the Merger until a new valuation was performed in October 2008, the plan administrator considered the objective and subjective factors discussed above and determined that the $5.00 value was a reasonable estimation of fair value.value at each such grant date.
Subsequent to fiscal year 2008, to assist the plan administrator in its determination of the fair value of our common stock, independent third-party valuations of the Company’s common stockenterprise value were also performed as of October 15, 2008, September 30, 2009, and September 30, 2010.2010, May 31, 2011, October 31, 2011, April 30, 2012 and October 31, 2012. The valuations were prepared used a weighted-average value calculated underusing two different valuation approaches, the income approach and market approach, to determine the value of the Company’s common stock.
The Income Approach quantifies the future cash flows that management expects to achieve consistent with our annual business plan and forecasting process. These future cash flows are discounted to their net present values using a rate corresponding to an estimated weighted-average cost of capital. The discount rate reflects the risks inherent in the cash flows and the market rates of return available from alternative investments of similar type and quality as of the valuation date. Our weighted average cost of capital is calculated by weighting the required returns on interest-bearing debt and common equity capital in proportion to their estimated percentages in our capital structure as well as the capital structure of comparable publicly-traded companies. The weighted average cost of capital assumption utilized in the valuations of the Company ranged from 12%11% to 13%.
The Market Approach considers the fair value of an asset based on the price at which comparable assets have been purchased under similar circumstances. The market approach used relies on published transactions, based on a weighted average of multiples of actual and forecasted revenue and actual and forecasted EBITDA, which is consistent with the primary performance indicators underlying our annual business plan and forecasting process. The multiples were determined based on trading multiples of a peer group of companies that are periodically reviewed by management for consistency with our business strategy, the businesses and markets in
which we operate, and our competitive landscape.landscape or, the Stock Price Peer Group. For the valuations performed, the multiples of actual and forecasted revenue utilized ranged from 1.3 times to 1.92.0 times and actual and forecasted EBITDA utilized ranged from 6.2 times to 12.4 times. These multiples were then adjusted as appropriate for specific characteristics of the Company such as size, projected growth and EBITDA Percentageas a
percentage of revenue as it relates to our peer group.Stock Price Peer Group. Additionally, a 10% to 15% “equity control premium” was applied in order to estimate the value of equity on a marketable, controlling basis, as the peer groupStock Price Peer Group included only widely-held publicly traded companies and we are controlled by the Sponsors.
We believe both of these approaches provide reliable estimates of the Company’s operating value and have historically yielded consistent estimated operating values for our Company.value. Therefore we apply an equal weighting to each approach and have not applied a discounting factor for the lack of marketability of the common stock for being a private company.
The independent third-party valuations yielded an estimated Company value attributable to our common stock of $2.1 billion, $1.0 billion, and $1.3 billion and an implied per share value of $4.38, $1.96 and $2.71 at October 15, 2008, September 30, 2009 and September 30, 2010, respectively. In addition, the plan administrator considered input from management and the CEO as well as other factors when assessing fair value, including: (1) our then current and projected financial performance, and the consideration of the potential outcomes of such performance, (2) general economic conditions, (3) the performance of our peer companiesStock Price Peer Group and (4) volatility in the equity markets. The independent third-party valuations as of September 30, 2009 did not consider the results of NES, which was consummated in December 2009.2009 and the independent third-party valuations as of April 30, 2012 did not consider the results of Radvision, which was consummated in June 2012. However, management and the plan administrator did consider the likelihood of consummating the acquisition of NES and Radvision in valuing our common stock in October 2009.2009 and April 2012, respectively. Based on those considerations, the plan administrator valued our common stock at $3.80, $3.00, $3.00, $4.40, $4.40, $4.00 and $3.00 in November 2008, October 2009, and December 2010, May 2011, October 2011, April 2012, and October 2012, respectively.
For each grant date subsequent to the then most recent valuation, the plan administrator considered whether it was necessary to update the estimated fair value considering, among other factors, financial performance, changes in general economic conditions and recent business and industry developments. Based on a consideration of these factors, the plan administrator determined that the latest value was a reasonable estimate of fair value at each grant date.
During fiscal year 2008 and the first half of fiscal year 2009, the global economy experienced a downturn, which negatively affected most markets. Several of our customers and competitors reduced their financial outlooks or disclosed that they were experiencing very challenging market conditions with little visibility of a rebound. Indications were that enterprises were not willing to spend on enterprise communications technology, and the revenue growth experienced in previous years was not expected in the near term. As demonstrated by the Company’s results, the demand for products fell as revenues were down when compared to the same period of the prior year. Cutbacks in spending, access to credit, employment variability, corporate profit growth, interest rates, energy prices, and other factors in specific markets were expected to further impact customer willingness to spend on communications technology in the near term. As a result, the Company’s projected future cash flows indicated a loss in fair value and in September 2008 and March 2009, the Company recognized goodwill impairments of $899 million and $235 million, respectively. We believe that these factors support the decline in the fair value of our common stock from $5.00 to $3.80 and subsequently to $3.00 and that these declines arewere consistent with the trends in our business and the global economy.economy at that time.
Although the global economic downturn during 2008 and 2010 negatively affected most of the markets we serve, during this period we maintained our focus on profitability levels and investing in our future results. Additionally, market conditions improved globally during the period December 2010 through May 2011. Equity markets in general demonstrated growth and interest rates declined during this period. These trends had a significant effect on the value of our equity and accordingly the Board of Directors reassessed its valuation of the Company’s common stock in accordance with the provisions of the 2007 Plan and in May 2011 established its fair value at $4.40 per share. The increase in our valuation at this time was primarily driven by two factors: (1) the decrease in interest rates, which contributed to the decrease in the estimated weighted average cost of capital used to discount our estimated future cash flows under the income approach, and (2) the improvements in the equity markets during the period December 2010 through May 2011, which increased the multiples used under the market approach.
During the three months ended March 31, 2012 and continuing for the remainder of fiscal 2012 and into fiscal 2013, the Company experienced a decline in revenue. Constrained capital spending by several of our customers caused them to delay system upgrades. In addition GDP growth and unemployment remained at challenging levels especially in those theaters from which we derive our strongest concentrations of revenue such as the U.S. and EMEA. Also during the second half of fiscal 2012, the global economic recovery stalled with equity markets in general declining. We believe these factors support the decline in the fair value of our common stock from $4.40 to $4.00 and subsequently to $3.00. The decrease in our valuation during this time was primarily driven by (1) the decline in our revenue which also impacted the Company’s forecast, and (2) the declines in the equity markets during the period from April 2012 through October 2012, which decreased the multiples used under the market approach.
As more fully discussed in Note 14, “Share-based Compensation,” to our consolidated financial statementsaudited Consolidated Financial Statements included elsewhere in this prospectus, in November 2009, the plan administrator approved a stock option exchange program through which individuals holding stock options having exercise prices of $5.00 and $3.80 per share could exchange them on a one-option-for-one-option basis, for replacement options with an exercise price of $3.00 per share, the then fair market value as of the underlying shares. The exchange offer was closed on November 16, 2009 and 28,595,000 options were tendered for exchange.
As more fully discussed in Note 12, “Share-based Compensation,” to our unaudited Consolidated Financial Statements included elsewhere in this prospectus, in February 2013 Avaya’s Compensation Committee approved a result of the stock option exchange program substantially all outstandingthrough which individuals holding market-based “multiple-of-money” and performance-based “EBITDA” stock options as of March 31, 2011 have an exercise price of $3.00 per share, basedcould exchange them on the fair market value of the underlying shares at the time granted.
Valuation of Option Awards.The fair value of option awards is determined at the date of grant utilizing the Cox-Ross-Rubinstein binomial option pricing model which is affected by the fair value of the Company’s stock as well as a number of complex and subjective assumptions. Expected volatility is based primarily on a combination of the Company’s peer group’sStock Price Peer Group’s historical volatility and estimates of implied volatility of the Company’s peer group.Stock Price Peer Group. The risk-free interest rate assumption was derived from reference to the U.S. Treasury Spot rates for the expected term of the stock options. The dividend yield assumption is based on the Company’s current intent not to issue a dividend under its dividend policy. The expected holding period assumption was estimated based on the Company’s historical experience.
The assumptions used in calculating the fair value of stock-based awards represent our best estimates, but these estimates involve inherent uncertainties and the application of management’s judgment. Some of the critical assumptions used in estimating the grant date fair value are presented in the table below:
| Year Ended September 30, 2008 | Year Ended September 30, 2009 | Year Ended September 30, 2010 | Six Months Ended March 31, 2011 | |||||||||||||
Expected life (years) | 5 | 5 | 5 | 5 | ||||||||||||
Risk-free interest rate | 3.93 | % | 2.24 | % | 2.28 | % | 1.64 | % | ||||||||
Expected dividend yield | 0 | % | 0 | % | 0 | % | 0 | % | ||||||||
Expected volatility | 46.5 | % | 63.94 | % | 51.01 | % | 47.82 | % | ||||||||
| Five months ended September 30, 2012 | Seven months ended April 30, 2012 | Four months ended September 30, 2011 | Six months ended March 31, 2011 | Fiscal 2010 | Fiscal 2009 | Fiscal 2008 | ||||||||||||||||||||||
Exercise price | $ | 4.00 | $ | 4.40 | $ | 4.40 | $ | 3.00 | $ | 3.00 | $ | 3.80 | $ | 5.00 | ||||||||||||||
Stock price | $ | 4.00 | $ | 4.40 | $ | 4.40 | $ | 3.00 | $ | 3.00 | $ | 3.80 | $ | 5.00 | ||||||||||||||
Term | 5 years | 5 years | 5 years | 5 years | 5 years | 5 years | 5 years | |||||||||||||||||||||
Volatility | 52.22 | % | 55.91 | % | 48.55 | % | 47.82 | % | 51.01 | % | 63.94 | % | 46.50 | % | ||||||||||||||
Risk-free rate | 0.75 | % | 0.92 | % | 1.48 | % | 1.64 | % | 2.28 | % | 2.24 | % | 3.93 | % | ||||||||||||||
Dividend yield | 0.00 | % | 0.00 | % | 0.00 | % | 0.00 | % | 0.00 | % | 0.00 | % | 0.00 | % | ||||||||||||||
Under the 2007 Plan, the exercise price of stock options cannot be set at a price below the estimated fair market value of our common stock on the date of grant.
New Accounting Guidance Recently Adopted
Disclosure of Supplementary Pro Forma Information for Business Combinations and Noncontrolling Interests
In the first quarter of fiscal year 2010, the Company adopted new guidance under the acquisition method for business combinations. The more significant changes include: an expanded definition of a business and a business combination; recognition of acquisition-related expenses and restructuring costs separately from the business combination; recognition of assets acquired and liabilities assumed at their acquisition-date fair values with subsequent changes recognized in earnings; and capitalization of in-process research and development at fair value as an indefinite-lived intangible asset. The guidance also amends and clarifies the application issues on initial recognition and measurement, subsequent measurement and accounting, and disclosure of assets and liabilities arising from contingencies in a business combination. The impact of the revised accounting guidance on the Company’s results of operations and financial position will vary depending on each future specific business combination or asset purchase.
Effective the first quarter of fiscal year 2010, the Company adopted revised accounting guidance which requires noncontrolling interests (formerly minority interest) to be presented as a separate component within the equity section of the Consolidated Balance Sheets and separate presentation of net income attributable to noncontrolling interests on the Consolidated Statements of Operations. The relevant presentation and disclosures have been applied retrospectively for all periods presented. The adoption of this accounting guidance did not have a material impact on the Company’s consolidated financial statements.
Fair Value Measures
In September 2006, the FASB issued an accounting standard related to fair value measurements of financial and non-financial assets and liabilities. The provisions of the standard applicable to financial assets and liabilities were effective and adopted by the Company on October 1, 2008. In February 2008, the FASB delayed the effective date of the provisions of this standard as they pertain to fair value measurements and disclosures of non-financial assets and liabilities, except for those assets and liabilities that are recognized or disclosed at fair
value in the financial statements on a recurring basis (at least annually). On October 1, 2009 the provisions of this standard became effective for the Company’s non-financial assets and liabilities. The adoption of this accounting guidance did not have a material impact on the Company’s consolidated statement of operations.
In January 2010, the FASB issued revised guidance intended to improve disclosures related to fair value measurements. This guidance requires new disclosures and clarifies certain existing disclosure requirements. New disclosures under this guidance require separate information about significant transfers into and out of Level 1 and Level 2 and the reasons for such transfers, and also require purchases, sales, issuances, and settlements information for Level 3 measurements to be included in the rollforward of activity on a gross basis. The guidance also clarifies the requirement to determine the level of disaggregation for fair value measurement disclosures and the requirement to disclose valuation techniques and inputs used for both recurring and nonrecurring fair value measurements in either Level 2 or Level 3. This accounting guidance became effective for the Company beginning in the second quarter of fiscal year 2010, except for the rollforward of activity on a gross basis for Level 3 fair value measurements, which will be effective for the Company in the first quarter of fiscal year 2012. The adoption of this accounting guidance is reflected in Note 11, “Fair Value Measures,” and did not have a material impact on the Company’s financial statement disclosures.
In August 2009, the FASB issued guidance to clarify the fair value measurements and disclosures requirements related to the measurement of liabilities at fair value. The guidance provides clarification that in circumstances in which a quoted price in an active market for the identical liability is not available, a reporting entity is required to measure fair value using one or more of the following methods: 1) a valuation technique that uses a) the quoted market price of the identical liability when traded as an asset or b) quoted prices for similar liabilities or similar liabilities when traded as assets and/or 2) a valuation technique that is consistent with the principles of ASC 820, “Fair Value Measurements and Disclosures.” The accounting guidance became effective for the Company beginning in fiscal year 2010. The adoption of this accounting guidance did not have a material impact on the Company’s consolidated statement of operations.
Intangibles-Goodwill and Other
In April 2008, the FASB issued guidance on the determination of useful lives of intangible assets, which amends the factors that should be considered in developing renewal or extension assumptions used to determine the useful life of an intangible asset. This guidance applies prospectively to intangible assets that are acquired individually or with a group of other assets in business combinations or asset acquisitions. The guidance became effective for the Company beginning in fiscal year 2010. The adoption of this guidance did not have a material impact on the Company’s consolidated financial statements.
Compensation-Retirement Benefits
In December 2008, the FASB issued guidance related to employers’ disclosure about postretirement benefit plan assets. The guidance requires enhanced disclosures to provide users of financial statements with an understanding of (i) how investment allocation decisions are made, (ii) major categories of plan assets, (iii) how fair value of plan assets is measured, (iv) the effect of fair value measurements on changes in plan assets during a period and (v) significant concentrations of risk within plan assets. The accounting guidance became effective for the Company for the fiscal year ending on September 30, 2010. The adoption of this accounting guidance is reflected in Note 13, “Benefit Obligations,” and did not have a material impact on the Company’s financial statement disclosures.
Revenue Recognition
In April 2010, the FASB issued accounting guidance on the milestone method of revenue recognition. The guidance defines the term “milestone” and the prescribed criteria that should be met to apply the milestone method of revenue recognition for research or development transactions. The guidance requires that the milestone should meet all criteria to be considered substantive to recognize consideration that is contingent upon
the achievement of a milestone in its entirety as revenue in the period in which the milestone is achieved. This accounting guidance became effective for the Company beginning October 1, 2010. The adoption of this accounting guidance did not have an impact on the Company’s consolidated financial statements.
In October 2009, the FASB amended the accounting standards for revenue recognition to remove tangible products containing software components and non-software components that function together to deliver the product’s essential functionality from the scope of industry specific software revenue recognition guidance. In October 2009, the FASB also amended the accounting standards for multiple deliverable revenue arrangements (formerly Emerging Issues Task Force No. 08-1) to: (i) provide updated guidance on whether multiple deliverables exist, how the deliverables in an arrangement should be separated, and how the consideration should be allocated; (ii) require an entity to allocate revenue in an arrangement using ESP of deliverables if a vendor does not have VSOE or TPE; and (iii) eliminate the use of the residual method and require an entity to allocate revenue using the relative selling price method. The Company adopted the new guidance on a prospective basis as of the beginning of fiscal year 2011 for revenue arrangements entered into or materially modified after October 1, 2010.
The new guidance did not generally change the units of accounting for the Company’s revenue transactions as products and services qualified as separate units of accounting in most transactions under the historical guidance. The new guidance does affect the timing of revenue recognition for multiple deliverable arrangements that included delivered products and undelivered items for which the Company was unable to demonstrate fair value pursuant to the historical guidance. In such cases, under the historical guidance, the delivered products were combined with the undelivered items to form a single unit of accounting and revenue for the delivered and undelivered items was recognized on a straight-line basis or deferred until the earlier of when the fair value requirements were met or when the last item was delivered. In addition, under the historical guidance, the Company used the residual method to allocate arrangement consideration for multiple deliverable transactions where objective and reliable evidence of fair value of the delivered items could not be determined. Under the new guidance, the Company allocates the total arrangement consideration to each separable deliverable of an arrangement based upon the relative selling price of each deliverable and revenue is recognized upon delivery or completion of those units of accounting. As a result of adopting the new guidance, net revenues for the six months ended March 31, 2011 were not materially different than the net revenues that would have been recorded under the historical accounting guidance. The Company cannot reasonably estimate the effect of adopting the new guidance on future financial periods as the impact will vary depending on the nature and volume of new or materially modified multiple deliverable arrangements in any given period.
The Company derives revenue primarily from the sale of products, software, and services for communications systems and applications. The Company’s products are sold directly through its worldwide sales force and indirectly through its global network of distributors, dealers, value-added resellers and systems integrators. Services includes (i) supplemental maintenance service, including services provided under contracts to monitor and optimize customers’ communications network performance, and on a time-and-materials basis; (ii) professional services for implementation and integration of converged voice and data networks, network security and unified communications; and (iii) operations services. Maintenance contracts typically have terms that range from one to five years. Contracts for professional services typically have terms that range from two to four weeks for standard solutions and from six months to one year for customized solutions. Contracts for operations services typically have terms that range from one to seven years.
In accordance with GAAP, revenue is recognized when persuasive evidence of an arrangement exists, delivery has occurred, the fee is fixed or determinable, collectability is reasonably assured, contractual obligations have been satisfied and title and risk of loss have been transferred to the customer. In instances where final acceptance of the product, system or solution is specified by the customer, revenue is deferred until all acceptance criteria have been met.
The Company’s indirect sales to distribution partners are generally recognized at the time of shipment if all contractual obligations have been satisfied. The Company accrues a provision for estimated sales returns and
other allowances and deferrals relating to inventory levels held by distributors, promotional marketing programs, etc. as a reduction of revenue at time of revenue recognition as required by ASC 605.
The Company enters into multiple deliverable arrangements, which may include any combination of products, software and services. Most product and service deliverables qualify as separate units of accounting and can be sold standalone or in various combinations across the Company’s geographies or customer markets. A deliverable constitutes a separate unit of accounting when it has standalone value and there are no customer-negotiated refunds or return rights for the delivered items. If the arrangement includes a customer-negotiated refund or return right relative to the delivered items, and the delivery and performance of the undelivered item is considered probable and substantially in the Company’s control, the delivered item constitutes a separate unit of accounting.
Most all of the Company’s solutions have both software and non-software components that function together to deliver the products’ essential functionality. For multiple deliverable arrangements that contain both software and non-software components that function together to deliver a products’ essential functionality, the Company allocates revenue to all deliverables based on their relative selling prices. In such circumstances, the Company uses a hierarchy of VSOE, TPE and ESP to determine the selling price to be used for allocating revenue to the deliverables. The Company then recognizes revenue on each deliverable in accordance with its policies for product and service revenue recognition.
VSOE is based on the price charged when the deliverable is sold separately. TPE of selling price is established by evaluating largely interchangeable competitor products or services in standalone sales to similarly situated customers. As the Company is unable to reliably determine what competitors products’ selling prices are on a standalone basis, the Company is not typically able to determine TPE. ESP is based on the Company’s best estimates of what the selling prices of deliverables would be if they were sold regularly on a standalone basis. The ESP is established considering multiple factors including, but not limited to pricing practices in different geographies, through different sales channels, major product and services groups, and customer classifications. The Company limits the amount of revenue recognition for delivered items to the amount that is not contingent on the future delivery of products or services, future performance obligations, or subject to customer-specific return or refund privileges. Support services and operations services revenues are deferred and recognized ratably over the period during which the services are to be performed. Professional services arrangements are generally recognized upon delivery or completion of performance. For services performed on a time and materials basis, revenue is recognized upon performance.
Standalone or subsequent sales of software or software-related products are recognized in accordance with FASB ASC Topic 985, “Software.” In multiple deliverable arrangements that only include standalone software and software-related products, the Company uses the residual method to allocate arrangement consideration. Under the residual method, the amount of consideration allocated to the delivered items equals the total arrangement consideration less the fair value of the undelivered items. Where VSOE of the undelivered items cannot be determined, the Company defers revenue until all items are delivered and services have been performed, or until VSOE can be determined for the undelivered items.
Recent Accounting Guidance Not Yet Effective
In December 2010, the FASBFinancial Accounting Standards Board (“FASB”) issued revised guidance which requires that if a company presents pro forma comparative financial statements for business combinations, the company should disclose revenue and earnings of the combined entity as though the business combination(s) that occurred during the current year had occurred as of the beginning of the comparable prior annual reporting period only. This guidance also expands the supplemental pro forma disclosures to include a description of the nature and amount of material, nonrecurring pro forma adjustments directly attributable to the business combination included in the reported pro forma revenue and earnings. This accounting guidance isbecame effective for the Company for business combinations for which the acquisition date was on a prospective basis beginning in fiscal year 2012.or after October 1, 2011. The adoption of this guidance isdid not expected to have a material impact on the Company’s financial statement disclosures.
Goodwill Impairment Test
In December 2010, the FASB issued revised guidance on when a company should perform step two of the goodwill impairment test for reporting units with zero or negative carrying amounts. This guidance requires that for reporting units with zero or negative carrying amounts, a company is required to perform step two of the goodwill impairment test if it is more likely than not that a goodwill impairment exists. In determining whether it is more likely than not that a goodwill impairment exists, an entity should consider whether there are any adverse qualitative factors indicating that an impairment may exist. This accounting guidance became effective for the Company beginning October 1, 2011 and did not have a material impact on the Company’s Consolidated Financial Statements or financial statement disclosures.
Fair Value Measures
In May 2011, the FASB issued revised guidance which is intended to achieve common fair value measurement and disclosure guidance in GAAP and International Financial Reporting Standards. The majority of the changes represent a clarification to existing GAAP. Additionally, the revised guidance includes expanded disclosure requirements.
This accounting guidance became effective for the Company beginning in the second quarter of fiscal 2012 and did not have a material impact on the Company’s Consolidated Financial Statements or financial statement disclosures.
Multiemployer Pension Plan Disclosures
In September 2011, the FASB issued revised guidance which requires additional disclosure about an employer’s participation in a multiemployer pension plan. The accounting guidance became effective for the Company as of September 30, 2012 and is applied retrospectively for all prior periods presented. The adoption of this accounting guidance did not have a material impact on the Company’s financial statement disclosures.
Presentation of Comprehensive Income
In fiscal 2012, the Company adopted new guidance on the presentation of comprehensive income and its components in the financial statements. This guidance eliminated the option to report other comprehensive income and its components in the statement of changes in equity and instead requires presentation either in a single continuous statement or in two separate, but consecutive statements. The relevant presentation and disclosures have been applied retrospectively for all periods presented.
Goodwill Impairment Test
In September 2011, the Financial Accounting Standards Board (“FASB”) issued revised guidance intended to simplify how an entity tests goodwill for impairment. As a result of the guidance, an entity will be allowed to first assess qualitative factors to determine whether it is necessary to perform the two-step quantitative goodwill impairment test. An entity will not be required to calculate the fair value of a reporting unit unless the entity determines, based on a qualitative assessment, that it is more likely than not that its fair value is less than its carrying amount. The accounting guidance became effective for the Company beginning in fiscal year 2012.2013 and did not have an impact on the consolidated financial statements or financial statement disclosures.
Indefinite-lived Intangible Asset Impairment Test
In July 2012, the FASB issued revised guidance intended to simplify how an entity tests indefinite-lived intangible assets other than goodwill for impairment. As a result of the guidance, an entity will be allowed to first assess qualitative factors to determine whether it is necessary to perform the quantitative impairment test. An entity will not be required to perform the quantitative impairment test unless the entity determines, based on a qualitative assessment, that it is more likely than not that the indefinite-lived asset is impaired. The adoptionaccounting guidance became effective for the Company beginning in fiscal year 2013 and did not have an impact on the consolidated financial statements or financial statement disclosures.
Recent Accounting Guidance Not Yet Effective
On February 5, 2013, the FASB issued Accounting Standards Update No. 2013-02 “Reporting of thisAmounts Reclassified Out of Accumulated Other Comprehensive Income”. The standard requires that companies present, either in a single note or parenthetically on the face of the financial statements, the effect of significant amounts reclassified from each component of accumulated other comprehensive income based on its source and the income statement line items affected by the reclassification. Thisaccounting guidance is noteffective for the Company beginning in the first quarter of fiscal 2014 and is only expected to have a material impact onthe presentation of the Company’s consolidated financial statements.statements and related notes.
Quantitative and Qualitative DisclosureDisclosures About Market Risk
Foreign Currency Impact on Revenue
Our revenues outside of the U.S. were 45%, 45% and 49% of total revenue for the fiscal years ended September 30, 2010, 2009 and 2008, respectively, and were 46% for each of the six-month periods ended March 31, 2011 and March 31, 2010, respectively. Any strengthening of the U.S. dollar against other currencies, particularly the euro, will have a negative impact on our reported revenues and, to a lesser degree, on our profitability. Conversely, any weakening of the U.S. dollar will have a positive impact. Revenues for the fiscal year ended September 30, 2009 included an unfavorable foreign currency impact of 4% when compared to fiscal year ended September 30, 2008. Revenues for the fiscal year ended September 30, 2010 included a favorable foreign currency impact of 1% when compared to fiscal year ended September 30, 2009. Revenues for the six months ended March 31, 2011 were not impacted by changes in foreign currency rates when compared to the six months ended March 31, 2010.
Foreign Currency Transactions
Recorded Transactions—We utilize foreign currency forward contracts primarily to manage short-term exchange rate exposures on certain receivables, payables and loans residing on foreign subsidiaries’ books, which are denominated in currencies other than the subsidiary’s functional currency. For fiscal years 2010, 2009 and 2008, and the six-month periods ended March 31,2012, 2011, and 2010, the changes in the fair value of the foreign currency forward contracts were substantially offset by changes resulting from the revaluation of the hedged items.
The fair value of foreign currency forward contracts is sensitive to changes in currency exchange rates. A 10% upward shift in the value of the foreign currencies that we trade against from the prevailing market rates would have had a negative impact of $3$6 million, $9 million, and $23$3 million for fiscal years2012, 2011, and 2010, 2009 and 2008, respectively. A 10% downward shift in the value of the foreign currencies that we trade against from the prevailing market rates would have had a positive impact of $11 million and $9 million, and a negative impact of $28 million for fiscal year2012, 2011 and 2010, and a positive impact of $8 million and $22 million for fiscal years 2009 and 2008, respectively.
Forecasted Transactions—From time to time, we use foreign currency forward contracts to offset certain forecasted foreign currency transactions primarily related to the purchase or sale of product expected to occur during the ensuing twelve months. The change in the fair value of foreign currency forward contracts is recognized as other income or expense in the period in which the exchange rates change. For fiscal years2012, 2011, and 2010, 2009 and 2008, these gains and losses were not material to our results of operations.
Interest Rate Risk
The Company uses interest rate swaps to manage the amount of its floating rate debt in order to reduce its exposure to variable rate interest payments associated with the senior secured credit facility. In connection withAt September 30, 2012 the debt arrangements entered into upon closing of the Merger, the Company entered into five interest rate swap agreements in November 2007, or the 2007 swaps. These swaps had an aggregateoutstanding notional amount of $2,400 million. One of the 2007 swaps with a notional amount of $200 million matured on November 26, 2008 andthese swap agreements was $1.8 billion. Subsequent to September 30, 2012, we chose to let one
with a notional amount of $700 million matured on November 26, 2009. On March 5, 2008 the Company entered into two additional interest rate swaps, or the 2008 swaps, swap agreement with an aggregate notional amount of $800 million, one of which$0.3 billion expire pursuant to its terms. The remaining outstanding swap agreements with a notional amount of $550 million matured on November 27, 2009. Onamounts aggregating $1.5 billion expire in August 23, 2010 the Company entered into two additional interest rate swaps, or the 2010 swaps, with an aggregate notional amount of $1,500 million.2013. The Company pays the counterparty fixed interest payments for the term of the swap, and receives variable interest payments based on three-month LIBOR from the counterparties. The net receipt or payment from the interest rate swap agreements is included in interest expense and is paid on or about the 26th day of each February, May, August and November. As of September 30, 2010,2012, a 0.125% change in interest rates would result in a change in our annual interest expense of $1$2 million. Upon the expiration of twoone of our interest rate swap agreements in November 2010,2012, a 0.125% change in interest rates would resulthave resulted in a change in our annual interest expense of $2$3 million.
See Note 10, “Derivatives and Other Financial Instruments,” to our consolidated financial statements appearingaudited Consolidated Financial Statements included elsewhere in this prospectus for further details related to these interest rate swap agreements.
Our Company
We are a leading global provider of next-generationreal-time business collaboration and communications solutions that bring people together with the right information at the right time in the right context, enabling business usersbusinesses to improve their efficiency and quickly solve critical business challenges. Our solutions are designed to enable business users to work together more effectively as a team internally orand with their customers and suppliers, increasing innovation, improving productivity and acceleratingto accelerate decision-making and achieve business outcomes. We have a long track record of innovation and our customers historically have relied on us to deliver mission critical communications solutions. The markets for areas associated with our business collaboration and communications
These industry leading solutions are expectedalso designed to representbe flexible, reliable and secure, enabling simplified management and cost reduction while providing a $77 billion market in 2011 in the aggregate.platform for next-generation collaboration from Avaya.
We are highly focused on and structured to serveserving our core business collaboration and communications markets with open and unifying, fit-for-purpose products, targeted sales coverage,solutions and distributed software services and support models. We target three primary customer segments:shape our portfolio to meet the demands of customers today and in the future.
Our solutions and services are aimed at large enterprises, small- and medium-sizedmid-sized businesses and government organizations. We provideoffer solutions in fivethree key business collaboration and communications product categories:
Real-Time Collaboration, Video and Unified Communications Software, Infrastructure and Endpoints for an increasingly mobile workforce
Real Time Video CollaborationCustomer Experience Management, including Contact Center applications
Contact Center
Data Communications
Applications, including their IntegrationNetworking for data center, campus, branch, and Enablementwireless access to complement our business collaboration, unified communications and contact center portfolios
Our next-generationThese three categories are supported by Avaya’s portfolio of services including product support, integration, and professional and managed services. These services enable customers to optimize and manage their communications networks worldwide and achieve enhanced business collaborationresults.
Our solutions are architecteddesigned to be highly scalable, reliable, secure, flexible and easy to manage,manage. They can be deployed in numerous ways including on a customer’s own premise, in the cloud and supportin a varietyvirtualized environment. We believe that delivering solutions in a cloud environment, either private or public, will be the deployment mode of deployment models, including on-premise, public and private cloud, virtualized and mobile delivery. Ourchoice for many customers in the near future. Further, our research and development investments are focused on software atsolutions across the user experience and business application layers, and software and hardware at the infrastructure layer, and endpoints. In addition, we are investing in software for monitoring, troubleshooting and managing distributed communications architectures that we believe will reduce the total cost of ownership and improve end-to-end serviceability of our solutions versus our competitors.
WeSignificant industry trends, such as the Bring Your Own Device (BYOD) and the blurring of consumer and enterprise, called the “Consumerization of IT,” are executingdriving the overall move toward enterprise mobility. Enterprises seek 24x7 device and location agnostic collaboration and communications solutions to increase employee effectiveness, reduce costs and gain competitive advantages in the marketplace. In addition, we believe many businesses today have grown through acquisition or lack central controls on two critical strategic initiatives relatedinfrastructure and are left with inefficient, disparate communications infrastructure that may benefit financially from consolidation. As a result of these trends, we believe that enterprises require a holistic, flexible business solution that is designed to facilitate collaboration, and incorporates enterprise-class stability, scalability and security. Additionally, we believe that the transition ofmarket will evolve to require secure collaboration between enterprises including video, desktop sharing, presence and directory updates.
Through our innovative collaboration and communications solutions, we are reshaping our product portfolio to address these trends and the enhancement of our sales coverage model in order to continue to grow our business. Over the past several years, we have invested significantly in researchThe foundation for our ongoing innovation is our
Avaya Aura platform, our Session Initiation Protocol (SIP) standards-based software suite that brings together voice, video and development, introducing more than 60 new product offerings to the market since the beginning of fiscal year 2010. We have reshaped our product portfolio through this investmentdata into a single, integrated communications and innovation in order to drive revenue growth and business model cash cycle time. In addition, ourcollaboration platform. Our portfolio of business collaboration and communications solutions is designed to deliver ana simple and intuitive and personalized user experience, seamlessly integrating various modes of communications and collaboration, including real-time voice, video, instant messaging, presence, and conferencing, and non real-timenon-real-time email, voicemail and social networking. In addition, we have decoupled solutions from the user’s location and allowed consolidation of infrastructure in the data center. Our solutions take the critical step of replacing voice-centric call control used by traditional Voice over Internet Protocol (VoIP) solutions with standards-based SIP session management. This allows communications applications to operate freely from the underlying infrastructure and supports both multiple media (voice, video, text) and modes (call, conference, instant messaging/chat, and email) of communication over the same session. Our Avaya Aura Contact Center also leverages our session management architecture and applies these collaboration principles to customer interactions.
These solutions target high growth market segments and we believe expand our addressable markets and accelerate our sales cycle as customers more frequently upgradeaugment their solutions to take advantage of our ongoing product innovation and to deploy our user experience across an array of endpoints, including our own and those of other vendors. Detailed information on the trends impacting our industry can be found in the next section, Our Industry.
We have further enhanced our business through acquisitions that have amplified our innovation and growth strategy. In addition,A key example of this is Radvision Ltd., which we have restructured or divested businesses that dilute our focus from our principal markets.acquired in June 2012 and which enhances Avaya’s position with industry leading video collaboration and communications solutions.
With our product portfolio poised for the future, we are now seeking toWe leverage our sales and distribution channels to speed new solutions to market and accelerate customer adoption and generate an increasing percentage ofadoption. We have strategic initiatives in place to grow our revenue from these new high value software solutions and user experience-centric applications. We are expanding our sales coverage model, including both partners and direct sales,partner community while supporting our customers’ channel preference. In
December 2009, we acquired NES, which expanded our customer base, broadenedpartners’ profitability and strengthened our indirect sales channel, enhanced our technologysuccess. We also fully leverage the diversity of the partner community for the Avaya portfolio, established our leading presence in data communicationsengaging with value added resellers, systems integrators, service providers, and enhanced our ability to compete globally.
Our market leadership in next-generation business collaboration is due in part to our long-standing heritage of delivering mission critical unified communications, contact centerapplication developers. Please see the section titled, Customers; Sales, Partners and voice communications solutions. As a market leader in enterprise voice telephony and messagingDistribution for more than 10 years and in unified communications for the past four years, we believe that our VoIP solutions have enabled customers to centralize communications applications and hardware to serve geographically dispersed users, significantly reducing management cost, complexity and annual spend to telecommunication service providers. Leveraging this experience, we have now developed innovative, next-generation unified communications and contact center solutions that focus on business collaboration and, unlike earlier solutions, are designed from the ground up to support multiple media and modes of communication, reducing cost and complexity while improving collaboration effectiveness. The experience that we are delivering provides a rich environment in which users can find the right individuals and the right information by accessing the context of their communications sessions, including call history, conversation threads across email, voice and other media, related documents, directories and other relevant data.
Significant industry trends are driving enterprises to seek 24x7, device and location agnostic collaboration solutions to increase employee productivity, reduce costs and gain competitive advantages in the marketplace. In addition, businesses that have grown through acquisition or that lack central controls on infrastructure often are left with inefficient, disparate communications infrastructure needing consolidation. As a result of these trends, we believe that enterprises require a holistic, next-generation business collaboration solution that is designed from the ground up to facilitate collaboration, or fit-for-purpose, and incorporates enterprise-class stability, scalability and security. SIP provides a basis to address this need. SIP is a fundamental architectural building block of Avaya Aura, our next-generation, enterprise-class collaboration platform, because it shifts communications from voice-centric, dedicated media channels, as was the case in legacy communication environments, toward session-based environments, where multiple people, media and resources can be brought together into an integrated communications session. In addition to decoupling collaboration solutions from the user’s geographical location and allowing consolidation of infrastructure in the data center, our next-generation business collaboration solutions take the critical next step of replacing the voice-centric call control used by traditional VoIP and unified communications solutions with standards-based SIP session management. This decouples communications applications from the underlying infrastructure and supports both multiple media and modes of communication over the same session. Our Avaya Aura Session Manager architecture is designed to allow collaboration applications to be rapidly developed, tightly integrated, run anywhere in the network and be managed more easily than traditional unified communications solutions. Avaya Aura Contact Center solutions also leverage our session management architecture and apply these principles to customer interactions. We believe our Avaya Aura architecture embraces and attracts software application partners. In addition, our award-winning, global services-delivery infrastructure helps customers address their critical needs from initial planning and design, through implementation, monitoring and maintenance.
Enterprise IT infrastructure has historically included only devices developed specifically for enterprise customers and installed, owned and managed by enterprise IT departments. However, with business users bringing consumer-focused devices into the enterprise, sometimes owned and managed by the individual users themselves, there is an increasing need to have these devices reliably integrated, supported and secured by IT professionals. We believe that Avaya is at the forefront of this industry trend. For example, we recently released our Avaya Flare Experience, a real-time, enterprise video communications and collaboration solution, which offers an intuitive, easy-to-use experience. The Avaya Flare Experience is currently available on our own Desktop Video Device and is expected to be made available on consumer devices such as Apple iPad and Google Android tablets, Windows laptops and other consumer device classes and platforms. The Avaya Flare Experience is designed to help break down the barriers commonly seen in today’s communications and collaboration tools with a distinctive user interface for quick, device-agnostic, easy access to voice and video, social media, presence, instant messaging, audio/video/web conferencing and a consolidated view of multiple directories and
context history. The Avaya Flare Experience provides enterprise users with the sophisticated enterprise-class functions they need on the devices they prefer, while also providing enterprise IT departments with the control, compliance and reporting functions they require.details.
Our solutions address the needs of a diverse range of customers, including large multinational enterprises, small-small and medium-sized businesses and government organizations. As of March 31, 2011,September 30, 2012, we had over 400,000300,000 customers, including more than 85%95% of the Fortune 500 companies, andwith installations in over one million customer locations worldwide. Our customers operate in a broad range of industries, including financial services, manufacturing, retail, transportation, energy, media and communications, health care,healthcare, education and government, and include, among others, Morgan Stanley & Co. LLC, Progressive Casualty Insurance Company, Whirlpool Corporation, The Hewlett-Packard Company, or HP, Home Depot, Inc., United Air Lines, Inc., Marriott International, Inc., the Blue Cross and Blue Shield Association, Australia National University and the FDIC. We employ a flexible go-to-market strategy with direct and indirect presence in over 100170 countries. As of March 31, 2011,2013, we had approximately 9,90010,800 channel partners and for the six months ended March 31, 2011,fiscal 2012, our product revenue from indirect sales represented approximately 77%75% of our total product revenue.
For the twelve months ended September 30, 2010fiscal 2012 and the six months ended March 31, 2011, we generated revenue of $5,060$5,171 million and $2,756$5,547 million, respectively. For the twelve months ended September 30, 2010,fiscal 2012, product revenue represented 51%52% of our total revenue and services revenue represented 49%48%. For the six months ended March 31,fiscal 2011, product revenue represented 54% of our total revenue and services revenue represented 46%. For the twelve months ended September 30, 2010, approximately 55% of our revenue wasRevenue generated in the United States.States for fiscal 2012 and 2011 represented 54% of our total revenue. For the twelve months ended September 30, 2010fiscal 2012 we had operating income of $115 million as opposed to an operating loss of $94 million in fiscal 2011. For fiscal 2012 and the six months ended March 31, 2011, we had a net losslosses of $871$354 million and $612$863 million, respectively,respectively. For each of fiscal 2012 and 2011, we had Adjusted EBITDA of $795 million and $442 million, respectively.$971 million. See “Management’s Discussion and Analysis of Financial Condition and Results of Operations—Non-GAAP Financial Measures and Supplemental Disclosure—Operations: EBITDA and Adjusted EBITDA” for a definition and explanation of Adjusted EBITDA and a reconciliation of net loss to Adjusted EBITDA.
Our Industry
Trends Driving Business Collaboration Spending
Enterprises are increasingly focused on deploying collaboration solutions in order to increase productivity, reduce costs and complexity and gain competitive advantages. The requirements of enterprises have evolved over the past few years in response to the following trends:
Increasingly Mobile and Always-ConnectedConnected Workforce Needs Anytime/Anywhere Collaboration Tools.According to a 20092011 International Data Corporation or IDC,(IDC) report, the number of mobile workers worldwide has increased 25%is projected to increase 30% from 20071.0 billion in 2010 to 2010,1.3 billion in 2015, increasing the demand in today’s enterprise for both reliable wired and wireless access.access(1)1. As enterprises move toward a more geographically dispersed, 24x7 connected workforce, they need tools to quickly solve business challenges while improving their efficiency. To do this, enterprises need collaboration technology that can bring people together with the right information at the right time in the right context to make critical business decisions, enabling business users to improve their efficiency and quickly solve critical business challenges.decisions. These increasingly mobile workers need to be able to connect remotely to their business applications from wherever they are and demand the same experience and capabilities they have when at their office desk.
Proliferation of Devices and Applications Expanding the Number of Points of Integration.The number and types of endpoints are growing rapidly. Whereas in the past, business users communicated primarily via desk-phones, today they continue to use desk-based devices, but also various mobile devices likesuch as laptops, smartphones and tablets. IDC reports from April 2011 estimatedSeptember 2012 forecasted that there were 522214 million laptops shipped in 2012 will grow to 321 million in 20162, 700 million smartphones shipped in 2012 will grow to 1,258 million in 20163, and 117 million media tablets shipped in 2010, and forecasts that number2012 will grow to increase to 1,278261 million in 2014, growing at a compound annual growth rate, or CAGR, of 25%.2016(2)4. In order to communicate seamlessly and securely across these devices, and
applications collaboration solutionsand endpoints must integrate thembe integrated into the communications infrastructure and provide a way for IT professionals to have a consolidated view of these devices and applications so that the environment can be managed effectively and reliably.
Consumerization of the Enterprise has Changed Expectations of Business Users and Put More Pressure on IT Departments.With the proliferation of consumer devices such as the AppleiPhone and Apple iPad,, Google Android smartphones and tablets, and the RIM Blackberry, business applications available through online stores such as the Apple iTunes store and social networking applications such as Facebook and Twitter, business users are increasingly using consumer-focused products and applications for business tasks, particularly in the areas of collaboration and communication. This has put a significant strain on IT departments to support and secure these devices and applications within the enterprise. In addition, business users expect their enterprise IT solutions to mimic the intuitive experience they enjoy with their consumer devices and applications, forcing IT departments to seek solutions that can deliver this kind of experience and enterprise vendors to design their products so that they are easier to use.
Customer Expectations of Contact Centers and Customer Service Areare Changing.Customer interactions are evolving from voice-centric, point-in-time, contact center transactions to persistent customer conversations over multiple interactions and across multiple media and modes of communication. Customers expect enterprises to know about the history of their interactions, even when they occur across a mix of self-service and agent assisted communications methods including voice, video, email and chat. With the growth of social networking, customers are even beginning to expect that the most customer service focused companies will capture and react to their comments made through Twitter or Facebook postings.
| 1 | IDC Mobile Worker Population 2011-2015 Forecast, Document #232073, December 2011 |
| 2 | IDC Worldwide PC 2012-2016 Forecast Update, Doc. #236840, September, 2012. |
| 3 | IDC Worldwide Smartphone 2012-2016 Forecast Update, Doc. #236736, September, 2012 |
| 4 | IDC Worldwide and U.S. Media Tablet 2012-2016 Forecast Update, Doc. #237222, September, 2012. |
Business Leaders are Increasingly Challenged to Deliver New Business Capabilities to Support Growth While Facing Tight IT Budgets.Business leaders continue to manage overall spending closely due Due to continued macro-economic uncertainty. Atuncertainty, businesses are closely managing overall spending while at the same time business leaders are making strategic IT investments to gain competitive advantage. As IT departments become increasingly sophisticated and strategically important within the enterprise, business leaders are increasingly held accountable to demonstrate an acceptable level of return for their IT investments. According to a March 2011 Gartner survey, two of the top five challenges for CEOs today are attracting and retaining new customers and improving productivity.(1) To meet these challenges, enterprises are deploying collaboration solutions that allow them to leverage their existing IT investments while providing a flexible roadmap to gradually upgrade their systems. In addition, CIOs are seeking to rationalize their network infrastructure and computing hardware to simplify their IT environments and reduce expenses while also increasing the reliability and scalability of their business collaboration and communications environments to avoid lost productivity and revenue due to systems outages. Increasingly, to help manage costs and efficiencies, CIOs also are exploring a shift to operating expense models, where they pay a fee for business collaboration and communications services but the underlying solutions, infrastructure and headcount are owned and managed by the vendor, as opposed to capital expenditure models that require them to invest in and own the solutions, infrastructure and headcount.
Together these trends add to the complexity of enabling business collaboration, and drive business leaders to seek more simple,simpler, holistic solutions that are easy-to-use, scalable and cost-effective.
Business Collaboration Solutions of Our Competitors Do Not Adequately Address These Trends
Despite the aforementioned trends, we believe competitors’ solutions still fall short of delivering a seamless real-time collaboration experience. Historically, enterprises deployed separate, independent systems to satisfy their communication needs, deploying a different system for voice, email and video usually from different vendors. This siloed approach to communications presents challenges when trying to enable seamless, real-time collaboration. Earlier solutions attempted to aggregate these disparate systems under a common user interface, but failed to integrate them from the ground up on a common platform. As a result, in our view, these solutions suffer from the following limitations:
Most Collaboration Solutions Today are One-Size-Fits-All and Often Cannot Accommodate Customers’ Specific Needs.Competitors’ collaboration solutions are not designed for the demands of unified communications. Many collaboration vendors see demand for unified communications as an opportunity to sell more of their core products by bundling their products with other communication systems, and loosely tying the
systems together with a single interface. The resulting solutions are poorly architected, difficult to deploy and manage and do not deliver a seamless, real-time business collaboration experience. Also, because the solutions are not customized to customers’ specific needs, customers often have to integrate third-party technologies to address communication requirements that are not being met out of the box, adding to the overall complexity and cost of the solution.
Competitors’ Solutions were Builtbuilt from an Email or Data Networking Focus, Not for Real-Time Collaboration. As organizations become more decentralized and decisions are increasingly made by groups rather than individuals, business users need to be able to collaborate and communicate in real-time while being able to access the information that they need.information. Many traditional collaboration tools fall short of their promise to enable cross-enterprise cooperation, often simply aggregating different modes of communication around their core competency (email or data) with a single interface to integrate the underlying architectures. As a result, users have a disjointed experience, where the different modes of communication are independent and do not share a common context. For example, an ongoing conversation between people within an enterprise or between an enterprise and theirits customers that includes emails, phone calls, instant messages and social media occurs over independent and unrelated applications in most competitor environments. As a result, these interactions cannot be seamlessly integrated in real-time or intelligently routed along with the conversation history across various modes and media. The limitations of existing solutions force users to fall back on using the various modes of communication independently, resulting in inefficient interactions and delays in solving complex business problems needing input from multiple constituents.
Traditional Solutions are Closed and Proprietary, Forcing Customers to use a Single Vendor and Abandon Existing IT Investments.Many Some of our competitors’ collaboration solutions use proprietary, closed architectures, which do not integrate well with those of other vendors. This forces customers to choose a platform that does not offer all the desired features and functionality and makes it difficult to integrate third-party applications to address broader enterprise requirements. As a result, customers often either have to abandon their existing infrastructure investments or accept unnecessary levels of complexity and costs in order to deploy new infrastructure equipment and/or new applications. In addition, because these solutions employ proprietary architectures, it is more difficult for developers to create third-party applications that can support them, giving the customer less flexibility and choice with respect to new functionality that may be introduced.
Limited Consumer Device Support.We believe that because of their proprietary nature, some competitors’ solutions do not easily lend themselves to enabling new consumer devices with seamless, real-time collaboration applications. These solutions lack the infrastructure to reliably integrate, support and secure these consumer devices and therefore inhibit the potential benefits these devices can bring to the enterprise.
Most Collaboration Solutions Vendors Lack an In-House Global Services Organization to Support Customers and Partners Through Implementation, Maintenance and MaintenanceDay-to-Day Operations.. Given the complexity of deploying a collaboration solution, many customers require some level of assistance to migrate from their current communications environment and may also require help to integrate the new system with their existing infrastructure and business applications. However, most collaboration vendors lack a full scale in-house services organization that includes global managed services for multi-vendor collaboration applications and infrastructure or the integration expertise to help customers and partners manage this transition. As a result customers are forced to contract with third-party service providers, adding to the overall cost and complexity of deployment.
High Total Cost of Ownership.Because many traditional solutions employ proprietary architectures, they require a significant investment in new infrastructure and significant customized integration to address communication requirements not met out of the box. In addition, because many of these solutions were not fit-for-purpose, they have loosely integrated systems that are difficult to deploy and manage and often require significant professional services support upfront and ongoing IT costs to manage and maintain. Such traditional solutions require more complex system integration and achieve reliability through the over deployment of equipment rather than the optimization of product. The result is reliability at a higher cost that is more difficult to scale as business needs change.
Addressable Market for Business Collaboration Solutions is Large and Growing
We believe that the trend toward a more mobile workforce and the proliferation of devices and applications creates a significant market opportunity for business collaboration. In addition, we believe that the limitations of traditional collaboration solutions and capital-intensive buying models present an opportunity for differentiated vendors to gain market share.
We believe that the business collaboration market includes spending on unified communications, contact center applications and data networking infrastructure equipment as well as spending on supportprofessional, managed/cloud and maintenancesupport services to implement, maintain and supportmanage these tools. Industry analysts project that in 2011,2013, these markets will growhave grown to $77$104 billion of vendor spending in aggregate, with unified communications accounting for $14 billion, contact center accounting for $3$4 billion, data networking infrastructure accounting for $25$29 billion and maintenance, managedsupport, managed/cloud and professional services accounting for the remaining $35$57 billion. AllOf course, certain segments of thesethis market are growing faster than others. For example, in the unified communications segment, spending for applications is growing at a faster rate than for desk phones. However, markets are impacted positively by the need for enterprises to increase productivity and upgrade their unified communications strategy to a more integrated approach. In response to this need, industry analysts expect that from 20112013 through 20142016 aggregate spending on unified communications, contact center, data networking and maintenance,support, managed and professional services will grow at CAGRsannual growth rates of 6%,3% to 5%, 5%, 2%, 6% and 8%, respectively..
The Benefits of Our Solutions
We are a leader in the business collaboration marketand communications and are leveraging our market leadership to recognize and address the challenges impacting our industry and innovate around them.industry. We have created next-generation business collaboration and communications solutions that offer an innovative approach, delivering to our customers fit-for-purpose, open solutions that we believe enable them to experience enhanced levels of productivity at a lower total cost of ownership than our competitors. The key benefits of our solutions include:
Innovative Real-Time, Multimedia, Multi-Platform Collaboration Tools that Unleash the Power of Teamwork.Promote Business Collaboration.We help Our next-generation business collaboration and communications solutions are designed to provide our customers unleash the power of collaboration by providing them with the software and infrastructure needed to bring together the right people with the right information at the right time in the right context regardless of the communications technology, devices or
location. Our solutions can seamlessly integrate different media, enabling interactions with simultaneous video, voice, instant messaging and content, as well as more efficient and effective business collaboration for real-time decision-making.
Fit-For-Purpose Solutions that Offer an Enhanced User Experience, Productivity Benefits and Lower Total Cost of Ownership.We deliver comprehensive, fit-for-purpose solutions that are designed for the needs of today’s distributed, collaborative workforce, while addressing what we believe are the three key performance challenges for an enterprise-class communications environment: resiliency, efficiency and scalability. Most vendors try to address these demands by layering on more architectures and protocols. In the process, they sacrifice simplicity, flexibility and total cost of ownership. In contrast, our solutions are specifically designed to address these needs, and, as a result, we believe our solutions require less hardware and perform better than our nearest competitors. For example, as compared to our nearest competitors, we believe that our unified communications solutions require up to 80% less hardware, our data networking solutions are 40% more energy efficient and our contact center solutions deliver a 20% increase in agent productivity.
Open Standards-Based Architecture that Enables Flexible and Extensible Collaboration.Our next-generationopen standards-based solutions, are based on an open SIP architecture accommodatingincluding our Avaya Aura platform, accommodate customers with multi-vendor environments seeking to leverage their existing investments, and supplement what they have with the specific collaboration products and/or services they need as well asand rapidly create and deploy applications. Providing enterprises with strong integration capabilities gives them the flexibility to take advantage of new collaboration and contact center tools and devices as they are introduced, rather than being confined to a single vendor and having to compromise on functionality. We continue to invest in our developer ecosystem, Avaya DevConnect, which boasted over 15,00020,000 members as of March 31, 2011.September 30, 2012. This, together with our Agile Communication Environment or ACE,(ACE), toolkits, application programming interfaces or APIs,(APIs) and integration environments allow businesses to derive unique value from our architecture.
Enterprise-Class Solutions that are Scalable, Secure, Reliable and Reliable.Backed by Our Award-Winning Services.Enterprises and governments across the world depend on us for their collaboration needs, knowing that we can deliver mission critical dependability. Our
product portfolio has been designed to be highly reliable, secure and scalable and is backed by anour award-winning global services. AGS is a leading provider of support services organization withrelating to business collaboration and communications solutions, offering services support tools to help our customers monitor, troubleshoot and manage their infrastructure. In addition, we believe our data networking technology is seven times more resilient than that of our nearest competitor.AGS delivers managed and professional services, providing the integration expertise necessary to help customers migrate from their current communications environment to next-generation business collaboration and communications environments.
Centralized Application Integration and Management that Makes it Easier to Integrate, Deploy and Manage.Our solutions provide enterprises with the ability to perform integration and management tasks as part of a central service rather than from individual platforms, reducing the amount of time required to perform integration activities and to support and manage unified communications services. Enterprises also can make changes to unified communications services, which can be automatically populated and published throughout the environment, speeding up deployment of new services, infrastructure or unified communications applications.
By implementing our solutions, we believe customers benefit from:
improvedImproved productivity, efficiency and decision-making of business users;users.
anAn easy-to-use and flexible solution that enables seamless communication across multiple modes and devices in real-time;real-time.
enterprise-classEnterprise-class reliability, scalability and security backed by our award-winning global in-house services organization;organization.
lowerLower total cost of ownership; andownership.
closerCloser and more targeted communication with their customers.
Our Competitive Strengths
In addition to the strengths of our solutions, we believe the following competitive strengths position us well to capitalize on the opportunities created by the market trends affecting our industry.
Leading Position Acrossacross Our Key End Markets.We are a leader in business collaboration and communications, with leading market share(1) in worldwide unified communications5, contact centerinfrastructure6, voice maintenance services7 and enterprise messaging8, and a position in the Leader’s quadrant in each of Gartner’s Magic Quadrants for Corporate Telephony, Unified Communications and Unified Communications.Contact Center Infrastructure(2)9.
We believe that our market leadership and our incumbent position within our customer base will better enable us to cross-sell to existing customers and win new customers.
Large, Diverse and Global Customer Installed Base.Our solutions address the needs of a diverse range of customers from large multinational enterprises to small-small and medium-sized businesses in a number ofvarious industries, including financial services, manufacturing, retail, transportation, energy, media and communications, health care, education and government. As of March 31, 2011,September 30, 2012, we had over 400,000300,000 total customers, including more than 85%95% of the Fortune 500 companies and installations in over one million customer locations worldwide. We have thousands of direct customers and no end-user customers represented more than two percent of our revenue for the year ended September 30, 2010.fiscal 2012. In addition, many of our largest enterprise customers have been buying from us for over 10 years. We believe our large and diverse customer base provides us with recurring revenue and a continuing growththe opportunity to further expand within our customer base.
History of Innovation with Large Pipeline of New Products and UniqueDifferentiated Approach to Commercialization.We continue to innovate rapidly, expanding on our technical heritage from Bell Labs. As of March 31, 2011,September 30, 2012, we had over 5,700approximately 5,900 patents and pending patent applications, including foreign counterparts. Our patents and pending patent applications cover a wide range of products and services involving a variety of technologies, including, but not limited to, unified communications (including video, social media, telephony and messaging), contact centers, wireless communications and data networking. Since the beginning of fiscal year 2010, we have introduced more than 60130 new offerings across our portfolio, the largest product pipeline in our history. WeIn March 2009, we introduced the Avaya Aura in March 2009,platform, our SIP-based software suite that brings together voice, video and data into a multimedia, multi-session infrastructuresingle, integrated communications and collaboration platform that provides a simple means of connecting legacy, multi-vendor systems to new open standards SIP-based applications. In July 2010, we introduced Avaya Aura Contact Center, which forms the core of our SIP contact center
| 5 | Dell’Oro Group, Enterprise Telephony Report, 4Q12, February, 2013. |
| 6 | Gartner Inc. Market Share, Contact Center: Worldwide, 2012, Drew Kraus, March, 2013. Gartner ranks Avaya the leader in Contact Center Agent End-User Revenue by Manufacturer, Worldwide in 2012. |
| 7 | IntelliCom Analytics, Services Market Dashboard, Q4 2012 Global Lifecycle Services Market Workbook, April, 2013. |
| 8 | T3i Group, InfoTrack for Converged Applications, Messaging Systems Shipments, Revenue & Market Share Details, Full Year 2012, May 2013. |
| 9 | Gartner Magic Quadrants—Gartner Magic Quadrant for Corporate Telephony, Jay Lassman, et al, September, 2012. |
| - | Gartner Magic Quadrant for Unified Communications, Bern Elliot et al, August 2012. |
| - | Gartner Magic Quadrant for Contact Center Infrastructure, Worldwide, Drew Kraus, et al, June 2012. |
Gartner does not endorse any vendor, product or service depicted in our research publications, and does not advise technology users to select only those vendors with the highest ratings. Gartner research publications consist of the opinions of Gartner’s research organization and should not be construed as statements of fact. Gartner disclaims all warranties, expressed or implied, with respect to this research, including any warranties of merchantability or fitness for a particular purpose.
The Gartner Report(s) described herein, (the “Gartner Report(s)”) represent(s) data, research opinion or viewpoints published, as part of a syndicated subscription service, by Gartner, Inc. (“Gartner”), and are not representations of fact. Each Gartner Report speaks as of its original publication date (and not as of the date of this prospectus) and the opinions expressed in the Gartner Report(s) are subject to change without notice.subscription service, by Gartner, Inc. (“Gartner”), and are not representations of fact. Each Gartner Report speaks as of its original publication date (and not as of the date of this prospectus) and the opinions expressed in the Gartner Report(s) are subject to change without notice.
technology, enabling multi-channel integration of social media, email, instant messaging and video applications. We introduced the Avaya Flare Experience in September 2010, demonstrating how simple and elegant communications can be and in November 2010 we introduced Avaya Virtual Enterprise Network Architecture or Avaya VENA,(Avaya VENA) an end-to-end virtualization strategy and architecture that will help simplify data center and campus networking. In order to accelerate the commercialization of innovation, we have modeled our Emerging Products and Technology team after smaller, entrepreneurial start-ups, leveraging our Avaya Labs research team and innovating together with our customers, understanding their challenges and collaborating on their visions. We believe that this approach to commercialization results in new products with broad appeal and accelerates the timeline for development and adoption.
Acquisitions Have Further Amplified Our Innovation and Growth Strategy. Key examples of this include Radvision Ltd., acquired in June 2012, and Sipera Systems, Inc., acquired in October 2011. Radvision enhances Avaya’s position with industry leading video collaboration and communications solutions. The Sipera portfolio brings best-in-class Session Border Controller (SBC) security and management solutions.
Flexible Go-to-Market Strategy Expands Reach of Our Products and Services.We sell our solutions both directly and through an indirect sales channel, tailoring our go-to-market strategy to our target markets. Our indirect sales channel is comprised of an extensive network of alliance partners, distributors, dealers, value-added resellers, telecommunications service providers and system integrators that allows us to reach customers across industries and globally. We have an extensive set of vertical specific solutions ranging from industries such as Finance/Insurance, Healthcare/Hospitality, Manufacturingfinance/insurance, healthcare, hospitality, manufacturing and Retail.retail. As of March 31, 2011,2013, we had approximately 9,90010,800 channel partners worldwide. Our indirect sales channel represented approximately 71%75% and 76% of our product revenues for the fiscal year ended September 30, 20102012 and 77% of our product revenues for the six months ended March 31, 2011.2011, respectively. With the acquisition of NES,the enterprise solutions business of Nortel Networks Corporation (NES) we significantly expanded our channel coverage and deepened our vertical expertise.
Global End-to-End Services OrganizationCapability Provides Large Recurring Revenue Stream.We maintain an award-winning, global, in-house services organization that provides us withAvaya Global Services is uniquely positioned to deploy, support and manage Avaya solutions as a key advantage over manyresult of joint planning between R&D and service planning in advance of new products being released. Avaya Global Services has direct access to our competitors who lack such an organization. research and development teams necessary to quickly resolve customer issues. This allows Avaya to provide quality service for Avaya products.
Our worldwide services-delivery infrastructure and services toolscapabilities help customers address their critical business collaboration and communications needs from initial planning and design through implementation, monitoringmaintenance and ongoing maintenance.day-to-day operation of both cloud and on-premise solutions. Contracts for support services typically have terms that range from one to five years, and contracts for operationsmanaged services typically have terms that range from one to seven years. The U.S. accounted for approximately 65%66% of our support revenue, with contract renewal rates of more than 80%86%. We generated 49%48% of our revenues for the fiscal year ended September 30, 20102012 from services. As such, our services relationships have provided us with a large recurring revenue base and significant visibility into our customers’ future collaboration needs.
Experienced Management Team with Track Record of Execution. We have an experienced team of senior executives with diverse and complementary backgrounds that combine extensive knowledge of the communications industry. During their service at our company and past service at other leading enterprises, our management team has demonstrated an ability to identify critical trends in the technology and communications sectors and develop a comprehensive strategic vision to enable businesses to capitalize on those trends.
Our Growth Strategy
We believe we are well-positioned for growth worldwide and have a multi-faceted strategy that builds upon our brand, strong client relationships and ability to continue to be on the cutting edge of innovation. Our vision is to be the preeminent provider of business collaboration and communications solutions with a commitment to open standards and innovative products, services and solutions. Key elements of our strategy include:
Leverage our Leading Market Positions to Drive the Adoption of our Next-Generation Collaboration Solutions. We believe that our market leadership, global scale and extensive customer interaction creates a strong platform from which to drive and shape the evolution of enterprise communications toward greater business collaboration. Our track record with our customers gives us the credibility that we believe provides us with a competitive advantage in helping them cope with this evolution. Additionally, extensive interaction with our large, global and diversified customer base helps us gain greater insight into market needs, which we incorporated into the design of the Avaya Aura platform, the Avaya Flare Experience, Avaya ACE and our other new products. This insight will continue to help shape our product roadmap into the future.
Capture Additional Market Share Acrossacross our Portfolio of Products and Services. While we have leading market presence in the majority of the markets we serve, most of our markets still have numerous competitors of varying size. Changes in business communications needs will challenge many of these competitors to innovate and allow us to gain share with our broader portfolio of products and services. We also believe that scale and service capability become increasingly important as the complexity and importance of communications grows within the enterprise. As potential customers look to movemigrate to Avaya,our solutions, our open architecture can integrate with competitor systems and provide a path for gradual transition while still achieving cost savings and improved functionality. Additionally, based on industry analyst projections, we believe the market for data networking will be $25was $26 billion in 2011. 2012.
While we believe our data products are best-in-class, we still have a modest market presence in data and believe our new product offerings can solve important customer needs around efficiency and resiliency and offer a compelling value proposition to both our large installed base and new customers. Within our services business, weWe also believe there is significant opportunity to further monetize the NES installed base by increasing the services attach rate forsell support contracts to customers acquired in the NES acquisition. This services monetization startedeffort began in the third quarter of fiscal year 2010 and is expected to continuecontribute to be a driver of incremental growth.growth in the support coverage for our installed base as existing support contracts come up for renewal.
Grow Avaya Managed Services. With Communications Outsourcing Solutions, Avaya provides custom managed services for multi-vendor applications and infrastructure. Avaya offers end-to-end management for any stage of the network lifecycle to help extend the potential of aging communications environments and enable customers to adopt new technology easily. Avaya takes a vendor-agnostic approach to managing communications and day-to-day operations. We help design, implement, and manage technology upgrades, working in existing environments and offering flexible financial models to meet budget and business needs. As of March 31, 2013, Avaya has more than 2.9 million ports under contract for managed services globally, supported by more than 700 communications managed services experts and a next-generation management platform.
Expand Margins and Profitability. We are focused on driving profitable growth worldwide and have multiple initiatives to increase our profit margins worldwide, including expanding gross marginsprofits and reducing operating expenses. From fiscal 2007 to March 2011fiscal 2012 we increased our gross margins,margin, excluding the amortization of technology intangible assets and the impact of purchase accounting adjustments, from 47% to 51%54% and we are pursuing the following gross margin initiatives to further expand our gross margins:profits:
drivingDriving lower material cost through our increased scale as a result of the NES transaction,acquisition, improved supplier mix and increased component commonality;commonality.
greaterGreater use of low cost regions for supplier sourcing, contract manufacturing and provisioning of some support services;services.
optimizingOptimizing design of products to drive material and supply chain efficiencies;efficiencies.
increasingIncreasing the percentage of higher margin software revenue; andour revenue represented by higher-margin software.
generatingGenerating service productivity improvements through methodology and diagnostic tools as well as promoting greater web-based self-service tools.
We also have the following initiatives to reduce operating expenses as a percentage of revenues:
our transition services agreement with NES, which resulted in $120 million of operating expense per annum, will be concluding at the end of June 2011;
costCost savings initiatives associated with the integration of NES integration and other acquisitions.
Other restructuring activities including exiting facilities and reducing the workforce or relocating positions to lower cost geographies have generated significant cost savings and we expect further cost savings to be generated;
achieving greater economies of scale thus reducing general and administrative expense as a percentage of revenues; andgeographies.
salesSales productivity improvements and distribution channel optimization.
Taken as a whole, we expect to be able to achieve increased adjusted gross margins and reduced operating expenses as a percentage of revenues, thus driving increased profit margins.
CContinueontinue to Develop Innovative Products and Services Around our Next-Generation Business Collaboration Solutions.Solutions to Drive Revenue and Shorten Sales Cycle. We intend to extend our industry-leading position through continued focus on product innovation and substantial investment in research and development for new products and services. Evidence of this focus is our more than 60130 new product offerings since the beginning of fiscal year 2010. Examples include: the Avaya Flare Experience Avaya web.alive,for iPhone and Windows, AvayaLive Engage, Avaya Aura, 6.0, Avaya Aura Contact Center, Avaya Aura Conferencing, Avaya IP Office 7.0,8.1, Avaya Video Conferencing Solution, Avaya ACE, Avaya VENA and Avaya Partner-Enabled Managed Services.Communication Outsourcing Solutions. We believe our ability to innovate is advanced by feedback gathered from our extensive customer relationships and our customer focus. We have been recognized by third-party industry analysts for our customer service and support three years in a row. We believe this customer focus allows us to better meet our customers’ needs and anticipate market demand. In addition, we plan to continue to make investments across the portfolio to create enhancements and breakthroughs in a number of key areas. For example,areas, which we believe will expandencourage customers to upgrade their solutions more frequently to take advantage of our market leadingongoing product innovation and to deploy our user experience across an array of Avaya Flare Experience onto non-Avaya hardware platforms and operating systems such as the Apple iPad and Windows-based personal computers, or PCs.third-party endpoints. We willalso plan to continue to embrace the opportunity presented by cloud computing, endorsing a model that allows enterprises to benefit from deploying applications both on premise and in the cloud. We will seek new ways to leverage the Virtual Desktop Integration or VDI,(VDI) trend to find new ways to securely deliver business collaboration to users.
Continue to Invest in and Expand our Sales and Distribution Capabilities to Attack New Markets and Better Penetrate Existing Markets. Our flexible go-to-market strategy, which consists of both a direct sales force and approximately 9,90010,800 channel partners (as of March 31, 2011)2013), allows us to reach customers across industries and around the globe while allowing them to interact with Avaya in a way that fits their organization. We intend to continue investing in our channel partners and sales force to optimize their market focus, improve segmentation, enter new geographies and provide our channel partners with compelling business incentives and discounts, along with training, marketing programs, and technical support through our Avaya Connect program. We also plan to leverage our sales and distribution channels to accelerate customer adoption and generate an increasing percentage of our revenue from our new high-value software solutions, data networking, video collaboration, mid-market offers, and user experience-centric applications.
Pursue Strategic Relationships, Alliances and Acquisitions. ContinuingWe plan to continue to establish relationships and alliances and selectively acquiringacquire capability-enhancing businesses will play aas key roleelements in our growth strategy going forward. We believe we have one of the largest communications-focused developer and technology partner ecosystems. This is evidenced by the Avaya DevConnect program, which promotes the development, compliance-testing and co-marketing of innovative third-party products that are compatible with Avaya’s standards-based solutions and has more than 15,00020,000 registered companies as of March 31, 2011.September 30, 2012. We also
maintain key relationships with large technology vendors such as IBM,International Business Machines Corporation (IBM), HP, and Microsoft.Oracle. Additionally, we will continue to make acquisitions when we find opportunities with compelling strategic and financial rationales. Our acquisition and integration of NES is an example of our success with this strategy.
Retain, Recruit and Develop Talent Globally.Globally. We are focused on developing a workforce that has both exceptional technical capabilities and the leadership skills that are required to support our technological and geographical growth. Building and nurturing a committed, diverse and engaged workforce with the highest levels of ethics and integrity is at the heart of our strategy, as evidenced by our selection as one of the World’s Most Ethical Companies by the Ethisphere™ institute in 2011 for the fifth consecutive year. strategy.
We have dramatically reshaped our workforce throughout our entire organization and have an executive team with significant experience in operating leading technology companies. Our transformation to being the leader in business collaboration and communications will be fueled by developing new workforce capabilities and building upon our talented team in place today.
Our ProductsSolutions
We offer solutions in three key business collaboration and communications categories:
Real-Time Collaboration, Video and Unified Communications Software, Infrastructure and Endpoints for an increasingly mobile workforce
Customer Experience Management, including Contact Center applications
Networking
Our product portfolio spans a broad range of unified communications, collaboration, customer service, video and data productssolutions are designed to meet the diverse needs of small and mid-size businesses, as well as large enterprises.enterprises and government customers. The majority of our product portfolio comprisesis comprised of software products that reside on either a client or server. Client software resides on both our own and third-party devices, including desk phones, tablets, desktop PCs and mobile phones. Server-side software controls communication and collaboration for the enterprise, and delivers rich value-added applications such as messaging, telephony, voice, video and web conferencing, mobility and customer service. Hardware includes a broad range of desk phones, servers and gateways and LAN/WAN switching wireless access points and gateways. HighlightsA portion of ourthe portfolio include:has been subjected to rigorous interoperability and security testing and is approved for acquisition by the US Government. Avaya’s portfolio of services include product support, integration, and professional and managed services that enable customers to optimize and manage their communications networks worldwide and achieve enhanced business results.
Real-Time Collaboration, Video and Unified Communications
Enterprises of all sizes depend on Avaya Aurafor unified communications solutions and technology that help improve efficiency, collaboration and competitiveness. Our people-centric solutions integrate voice, video and data, enabling users to communicate and collaborate in real-time, in the mode best suited to each interaction. This eliminates inefficiencies in communications to help make organizations more productive and responsive.
Video and Conferencing
Avaya Aura ishelps enable faster, more effective collaboration inside the coreenterprise and externally with conferencing solutions for desktops, meeting rooms and mobile devices.
| • | Avaya Aura Conferencing gives users one-touch control over collaboration. With it they can drag and drop contacts to start a conference, without dialing, switch between IM, email, voice, and video in one window and in one application, scroll and click on contacts with the ability to send invitations that automatically contain conference information and links, share content and desktops with a click of the “collaborate” button, and see who is in the conference, who just arrived and who is presenting. |
| • | The Avaya Flare Experienceis an easy-to-use interface with one-click access to real-time, enterprise-wide audio, video, and web collaboration. The intuitive drag-and-drop experience integrates directories, contextual history, and more. During a conference, a user can manage everything with built-in controls, including the ability to click an icon to escalate from an audio call to point-to-point, or multi-party video, or start web collaboration, access contacts, enterprise directories, and preferences via the contact fan, share desktops, applications, or the whiteboard and take notes and minutes. The Avaya Flare Experience can be downloaded onto many consumer devices including Apple iPad, Apple iPhone and Windows-based PCs. |
| • | Radvision Scopia is a standards-based portfolio of hardware and software products that includes conference room systems, desktop and mobile video conferencing and infrastructure and management (see “—Platforms, Infrastructure and Phones below for more information). |
| Radvision Scopia High Definition (HD) video conferencing room systems incorporate state-of-the-art video technology with capabilities required to support today’s room system deployments. The Radvision Scopia XT5000 is ideal for large conference rooms, while the Radvision Scopia XT4200 is specifically designed for the needs of smaller and mid-sized conference rooms. We also offer desktop clients from the software Radvision Scopia Desktop to the Radvision Scopia XT Executive 240. These advanced HD personal video conferencing endpoints are cost effective for expanding the reach of the video deployment beyond the conference room. |
| Radvision Scopia Mobile extends the Radvision Scopia solution to the latest mobile devices providing applications for video conferencing, control and management via smartphones and tablets supporting Apple iOS and Google Android. Radvision Scopia solutions are used by institutions, enterprises and service providers to create high quality, easy-to-use voice, video, and data collaboration environments, regardless of the communication network—IP, SIP, 3G, 4G, H.323, ISDN or next generation IMS. |
Communication and Messaging
Avaya applications deliver advanced enterprise communication and messaging tools to end users on their device of choice. Among others, Avaya offers Avaya one-X Unified Communications clients, which deliver software-based user experiences for consistent, enterprise-wide mobility and collaboration. Users can work from anywhere, using virtually any device, including desktop and laptop computers, tablets and smartphones—helping enterprises lower expenses, increase productivity, enhance business continuity, and streamline customer support.
| • | Avaya one-X Communicator is ideal for users who communicate frequently, manage multiple calls, set up ad-hoc conferencing and need to be highly reachable. The solution provides users with access to unified communications capabilities including voice calling, audio conferencing, instant messaging and presence, corporate directories and communication logs. This software client can be deployed on desktop or laptop computers running either Microsoft Windows or Apple Mac operating systems, and is supported over Virtual Desktop Infrastructure (VDI) connections. |
| • | Avaya one-X Mobile enables users to access enterprise communications from a wide selection of mobile devices, including high-end smart phones and tablets. A choice of one-X Mobile clients is available for popular platforms including Apple iPhone, Google Android and RIM BlackBerry. Through integration with Avaya one-X Client Enablement Services, Avaya one-X Mobile users have access to a broad range of unified communications capabilities such as visual voicemail, corporate directory, aggregated presence, VIP lists and synchronized call logs and contacts. Avaya one-X Mobile gives users single number/single identity for both inbound and outbound calls, even when using personal devices. |
| • | Avaya Client Applicationsprovide access to Avaya voice and video services from business applications such as Microsoft Lync, Office Communications Server, Microsoft Outlook, Microsoft Office, IBM Sametime, and CRM applications such as Salesforce.com and Microsoft Dynamics. |
In addition to the above, Avaya’s standards-based, IP unified messaging portfolio provides features such as call answering, voice messaging, and speech capabilities, each supporting specific business and end user needs.
Platforms, Infrastructure and Phones
Avaya’s feature-rich applications have at their foundation platforms and infrastructure products designed to support and strengthen them. In addition, Avaya’s product portfolio includes phones and other endpoints that are designed to showcase the benefits those applications provide to their users.
| • | The Avaya Aura platform is at the core of many of our next-generation collaboration and communications solutions. Using this architecture, organizations can rapidly and cost-effectively deploy applications from a centralized data center to users on nearly any device or network. The Avaya Aura platform provides a simple means of connecting legacy, multi-vendor systems to new open standards SIP-based applications, helping enterprises to reduce costs and increase user productivity and choice simultaneously. We believe our Avaya Aura platform is one of the most reliable, secure and comprehensive offerings in the industry and that our commitment to open, standards-based solutions helps provide customers with the flexibility to be more efficient and successful. |
The Avaya Aura architecture simplifies complex communications networks and reduces infrastructure costs. It delivers a suite of collaboration applications, including voice, video, messaging, presence, web applications and more. Using this architecture, organizations are able to rapidly and cost-effectively deploy from a centralized data center to users regardless of the device they are using or the network to which they are connected. Avaya Aura provides a simple means of connecting legacy, multi-vendor systems to new open standards SIP-based applications, helping enterprises to reduce costs and increase user productivity and choice simultaneously. We believe Avaya Aura is one of the most reliable, secure and comprehensive offerings in the industry and that our commitment to open, standards-based solutions helps provide our customers with the flexibility to be more efficient and successful.
At the heart of Avaya Aura is Session Manager, which provides multimedia communications control and management. Multi-vendor voice, video and data communications can all be managed and controlled from one centralized platform. Avaya Auraplatform uses virtualization technology across all applications to reduce the physical number of servers relative to existing offerings, reducing total cost of ownership for medium sized and large enterprises alike.
The Avaya Aura supports devices, applicationsportfolio provides collaboration and collaboration tools acrosscommunication capabilities on a wide rangebroad variety of operating systems, vendor platforms,devices, desktop, laptop and tablet computers, smart phones, mobile devices and dedicated deskphones, allowing business users to work from any location using a variety of public and private networks. Highlights of the Avaya Aura portfolio include the following:deskphones.
Avaya Aura Messaging, which enables migration from traditional voice messaging systems to SIP based multimedia messaging with enterprise-class features, scalability and reliability.
Avaya Aura Presence Services, which provides contextual information and availability from across multiple devices and applications to users, delivering a richer collaboration experience. These capabilities are leveraged across the entire spectrum of communications applications, ranging from voice calls and instant messaging to customer services and business processes.
Avaya Aura Conferencing, which offers a rich set of scalable conferencing configurations and delivers audio conferencing, web conferencing, document-based collaboration and video-enabled web conferencing while letting users leverage familiar desktop applications and interfaces for increased conference control.
Avaya Aura Video Conferencing solutions, which comprise a wide suite of high-definition, low-bandwidth, SIP-based video endpoints to enable enterprises to deliver video throughout their organizations. Our video endpoints scale to serve individual desktop users and small workgroups as well as large conference rooms.
Avaya Aura communications and collaboration endpoints include telephones, speaker phones, personal video collaboration devices and client software designed to provide enterprise class communications and the Avaya Flare Experience on our own devices as well as laptops, smartphones and tablets.
| • |
Avaya IP Office is our award-winning, flagship solution for Small and Medium Enterprises, or SME, communications. Avaya IP Office |
| • | Avaya |
| • | Avaya Agile Communication Environment (ACE) offers a rich set of web application programming interfaces, or APIs, that enable developers to integrate communications into other business applications (such as CRM, ERP, BPM and social application frameworks) and business processes (such as dynamic team formation, business continuity planning and customer engagements). For more policy-based style customization on enterprise communications, the Avaya ACE Foundation Toolkit offers Java APIs to allow customers to build Java feature sets to influence the treatment of incoming and/or outbound communications leveraging the SIP architecture. These capabilities enable rapid development of custom applications, which helps reduce costs and increases flexibility for enterprises. Programmers with limited communications expertise can readily embed real-time communications in business applications and workflows, expanding both the ability and opportunity to use Avaya collaboration capabilities. Avaya ACE provides a versatile platform for the members of Avaya DevConnect, our developer ecosystem, to build applications. |
| • | Avaya SBC for Enterprise provides enhanced security for mobile collaboration allowing remote users to securely connect to the enterprise without the need of a VPN connection, and protects SIP trunks from multiple threats. |
| • | Radvision Video Conferencinginfrastructure includes Radvision Scopia Elite MCUs, which are reliable and highly scalable multi-party video conferencing platforms for enterprise and service provider environments. They offer advanced and easy-to-use multi-party infrastructure for video conferencing and are at the core of a high definition deployment. In addition, gateways for Microsoft Lync and SIP provide connectivity and interoperability with unified communications solutions to standards-based video conferencing systems and infrastructure. Radvision Scopia Gateways are ideal for connecting IP video networks with ISDN and PSTN networks providing connectivity to ISDN endpoints or telephones. |
| In addition to the above, Radvision Scopia Management provides a comprehensive management solution for voice and video collaboration, while Radvision Scopia ECS Gatekeeper is a high-performance, H.323 ECS (Enhanced Communication Server) Gatekeeper that provides intelligent, advanced backbone management for IP telephony and multimedia communication networks. Finally, Radvision’s eVident monitoring solution helps enable enterprises and service providers to ensure network readiness before and after voice and video applications are deployed. |
| • | Endpointsare sold in a range of models that suit employees at every level, including IP and digital deskphones, DECT handsets, wireless phones, conference phones and the Avaya Desktop Video Device (ADVD). |
Avaya Contact Center and Customer Experience Management
Avaya is a leader in the contact center market. The contact center portfolio provides a foundation for managing voice interactions that has been extended to include multiple channels supporting instant messaging, video, email and social media. Based on client engagements globally, we understand how to deliver world-class customer experience management to establish rich and informed relationships with customers. Our approach is based on two core principles:
| • |
|
| • | Persistent conversation,which connects all interactions with a |
Avaya believes there are five components to effective Customer Experience Management. Each component delivers value to an organization, and, when combined, they help improve customer acquisition, increase customer retention & growth, deliver high quality experiences and help enable efficient management. Avaya Contact Center solutions align along these five components:
| • | Interaction, which involves connecting an enterprise with its end customers over their preferred media and modes such as web, social, mobile, voice and video. This also includes the desktop element that provides relevant information to agents and knowledge workers and facilitates collaboration across all the resources involved in delivering the |
| • | Experienceincludes leveraging real-time awareness of customer needs, business policies and resource availability to determine the next best action and best resource to address the customer needs at the right time based on target customer experience the organization wants to deliver. It is also responsible for integrating inbound and outbound self service, agent selection and workflows with
|
| • | Performanceencompasses the collection, consolidation and analysis of data and information in order to |
| • | Designincludes open, standards-based tools for creating and managing applications and workflows that are |
| • | Managementmeans enabling centralized management and administration for all the
|
Avaya Networking
In support of our data communications strategy, our networking product portfolio is designed to address and compete on the basis of three key requirements: resiliency, efficiency and performance.
Our networking portfolio is complementary to our unified communications and contact center portfolios based on the Avaya Aura architecture. We believe that customers today benefit from end-to-end solution design, testing and support. Over time we expect customers to benefit from development work in integrated provisioning, system management, quality of experience and bandwidth utilization.
Our networking products focus on data center, campus, branch and wireless access networking, and we believe these products provide better support for real-time collaboration. Our data networking portfolio is complementary to our business collaboration, unified communications and contact center portfolio based on the Avaya Aura architecture. We believe that customers today benefit from end-to-end solution design, testing and support. Over time we expect customers to benefit from development work in integrated provisioning, system management, quality of experience and bandwidth utilization.
Our data networking portfolio includes:
| • | Ethernet |
| • | Unified |
| • | Wireless |
| • | Access |
| • | Unified |
Avaya leverages these hardware platforms to deliver a range of next-generation networking capabilities that are collectively offered under the Virtual Enterprise Network Architecture (VENA) banner. An end-to-end strategic framework, VENA helps simplify data center and campus networking and optimizes business applications and service deployments, while helping to reduce costs, improve time-to-service and enhance business agility.
Avaya VENA—an end-to-end virtualization strategy and architecture that helps simplify data center and campus networking and optimizes business applications and service deployments in and between data centers and campuses, while helping to reduce costs and improve time to service.
We sell our portfolio of data networking products globally into enterprises of all types, with particular strength in healthcare, education, hospitality, financial services and local and state government.
Avaya Services
Avaya Services consult, enable, support, manage, optimize and even outsource enterprise communications solutions (applications and networks) to help customers achieve enhanced business results both directly and
through partners. Avaya’s award-winning portfolio of services enables customers to mitigate risk, reduce total cost of ownership, and optimize communication solutions for performance worldwide. Avaya Services is supported by patented design and management tools and network operations and technical support centers around the world.
Avaya’s Services portfolio spans three types of services, Avaya Professional Services, Avaya Global Support Services, and Avaya Managed Services. Avaya Client Services is a business unit that encompasses both Avaya Global Support Services and Avaya Managed Services offers.
| • | Avaya Professional Services (APS)helps organizations leverage technologies effectively to meet their business objectives. Our
|
| • | Enablement Services, providing access to expertise and resources for defining and deploying Avaya solutions that maximize technology potential and help assure solutions work as designed. Avaya Professional Services strives to exceed customers’ expectations by providing the greatest possible benefit for their investment. |
| • | Optimization Services, to help drive increased value and greater business results from customers’ existing technology. Leveraging best practices, Avaya consultants and solution architects analyze a communications environment in the context of customer business priorities and strategies, helping develop a communications business case, expected results and technical considerations. |
| • | Innovation Services, to help an organization leverage communications to reach new levels of business potential and market competiveness. Focused on leading technology and advanced services delivery, we |
| • | Avaya Client Services (ACS)is a
The contracts for these services range from one to multiple-years, with three year terms being the most common. Custom or complex services contracts are typically five years in length. The portfolio of |
| • | Global Support |
| • | Avaya Managed Services, which provides IT Infrastructure Library (ITIL)-aligned, multivendor managed and outsourcing services for customers’ communications
|
Our Technology
We believe that technology enhances the way in which people collaborate. At Avaya, we work with customers, industry groups and technical bodies to foster innovation. Across our portfolio we leverage critical technology to our customers’ advantage. Avaya is a leading innovator in leveraging the use of SIP for business collaboration. This open-standard based protocol shifts communications from having to coordinate multiple, independent media and communications systems toward session management based environments, where multiple media and resources can flexibly be brought into a fully-integrated, session-based interaction. This fundamental difference supports more fluid, effective and persistent collaboration across multiple media and modes of communications.
Centralized SIP-Based Architecture
At the core of our architecture, SIP based Avaya Aura Session Manager centralizes communications control and application integration. Avaya Aura Session Manager orchestrates a wide array of communication and collaboration applications and systems by decoupling them from the network. Applications can be deployed to individual users based on their need, rather than by where they work or the capabilities of the system to which they are connected. Avaya Aura Session Manager reduces complexity and provides the foundation for broader unified communications and collaboration strategies.
Unique SIP-Based Experiences
The Avaya Flare Experience leverages the Avaya Aura technology and its session control and management, presence, unified communications features and services, application creation and enablement capabilities. Social network interfaces to services, such as Facebook, allow for integrated directories across platforms. Users can access Microsoft Exchange services, such as e-mail, contacts and calendar, directly from a user’s contact card and, via the Avaya Aura Presence Services, can exchange instant message and presence information with Microsoft Lync users (i.e., Microsoft Communicator clients). Point-to-point video calls do not require a separate video conferencing server, and multi-party conferencing is enabled by Avaya Aura Conferencing.
Flexible Deployment Options
While Avaya’s unified communication offerings, including its comprehensive video portfolio and Avaya’s contact center solutions, have traditionally been deployed on a customer’s premise, the underlying distributed architecture enables a broader range of deployment options. Supporting customers looking to shift all or a portion of their communication and collaboration investment from capital expense to operating expense, Avaya’s unified communications and contact center solutions can be deployed in public, private, hybrid and managed cloud models by small to large enterprises and by cloud service providers. Further, through comprehensive monitoring technologies, these solutions can also be deployed as managed services.
Additional Technologies
In addition to SIP, we use technologies including:
SIP/SIMPLE and XMPP: the Avaya Aura Presence Services collects, publishes, aggregates and federates rich presence and enables instant messaging using SIP/SIMPLE and XMPP standards, providing interoperability with systems from other vendors, including but not limited to Microsoft, IBM and Google;
Platform Services: Avaya’s products are designed for extensibility, allowing customers, systems integrators, and ISVs using industry standard protocols and interfaces to develop new applications and to seamlessly integrate with the underlying capabilities of the communication and collaboration infrastructure;
Operating System, or OS, Support: our software applications run on a broad range of operating systems including, but not limited to, Microsoft Windows, Apple MAC OS, Google Android and RIM Blackberry;
High Quality/Low Bandwidth Video: Avaya’s Video solutions are able to deliver high quality video while minimizing bandwidth consumption and responding to adverse network conditions through the use of dual 1080p/60fps video channels, H.264 High Profile for bandwidth efficiency and cascading media to optimize bandwidth between sites and H.264 Scalable Video Coding (SVC) technology to maintain quality video during times of intermittent network congestion;
Virtualization Technology is used in our core Avaya Aura portfolio to reduce the physical server footprint using hypervisor technology to run multiple applications concurrently on a single physical platform;
Resilient data networking: our data portfolio provides highly resilient IPv4 and IPv6 routing services, with redundant hardware components, forwarding and restart capabilities that minimize interruptions, including one of the industry’s few sub second failover capabilities; and
Avaya believes that as WebRTC (web based real-time communication) standards continue to mature, WebRTC will be a key component of both unified communications and contact center solutions enabling broader access and simpler deployment models. Avaya has dedicated resources developing extensions to existing products and exploring new uses of this emerging technology.
Alliances
We have formed alliances with companies where we can improve our offerings to customers through collaboration. Our alliances can take different forms, including those intended, among other things, to extend our market reach through the use of complementary technologies, to develop new products or enhance existing ones, and to exchange technology. Our go to market alliances enable us to support large multinational unified communications, contact center and networking customers on a global basis. We jointly package our products and services and integrate applications to execute our market penetration strategy. Each of the alliance partners has resources certified in the Avaya solutions portfolios extending our global sales, implementation and support capabilities. We currently have alliances with IBM, HP, AT&T, Verizon and British Telecom, among others.
Avaya DevConnect
The Avaya DevConnect program is designed to promote the development, compliance-testing and co-marketing of innovative third-party products that are compatible with Avaya’s standards-based solutions. Member organizations have expertise in a broad range of technologies, including IP telephony, contact center and unified communications applications.
As of April 1, 2013, more than 21,000 companies have registered with the program, including more than 400 companies operating as Technology Partners that are eligible to submit their products or services for
compatibility testing by the Avaya Solution Interoperability and Test Lab. Avaya Test Lab engineers work in concert with each submitting member company to develop comprehensive test plans for each application to validate the product integrations
Customers; Sales, Partners and Distribution
Customers
Our customer base is diverse, ranging in size from small businesses employing a few employees to large government agencies and multinational companies with over 100,000 employees. As of September 30, 2012, we had over 300,000 customers, including more than 95% of the Fortune 500 companies and installations in over one million customer locations worldwide. Our customers operate in a broad range of industries, including financial services, manufacturing, retail, transportation, energy, media and communications, health care, education and government, and include, among others, Morgan Stanley & Co. LLC, Progressive Casualty Insurance Company, Whirlpool Corporation, HP, Home Depot, Inc., United Air Lines, Inc., Marriott International, Inc., the Blue Cross and Blue Shield Association, Australia National University and the FDIC. We employ a flexible go-to-market strategy with direct and indirect presence in over 170 countries. As of March 31, 2013, we had approximately 10,800 channel partners and for fiscal 2012, our product revenue from indirect sales represented approximately 75% of our total product revenue.
No single customer represented more than 10% of our revenue for fiscal 2012, 2011 and 2010. See Note 15, “Reportable Segments,” to our audited Consolidated Financial Statements for customer geographic information.
Sales, Partners and Distribution
Our global go-to-market strategy is designed to focus and strengthen our reach and impact on large multinational enterprises, mid-market and more regional enterprises and small businesses. Our go-to-market strategy is to serve our customers the way they prefer to work with us, either directly with Avaya or through our indirect sales channel, which includes our global network of alliance partners, distributors, dealers, value-added resellers, telecommunications service providers and system integrators. Our sales organizations are equipped with a broad product and software portfolio, complemented with services offerings including product support, integration and professional and managed services.
The Avaya sales organization is globally deployed with direct and indirect (e.g., channel partner) presence in over 170 countries. We continue to focus on efficient deployment of Avaya sales resources, both directly and indirectly, for maximum market penetration and global growth. Our investment in our sales organization includes training curricula to support the evolution of our sales strategy toward a solutions-based sales process targeted at helping businesses reduce costs, lower risk and grow their revenues. The program includes sales process, skills and solutions curricula for all roles within our sales organization.
Avaya Connect
As of March 31, 2013, there were approximately 10,800 channel partners that serve our customers worldwide through Avaya Connect, our business partner program. Through the use of certifications, the program positions partners to sell, implement and maintain our communications systems, applications and services. Avaya Connect offers clearly defined partner categories with financial, technical, sales and marketing benefits that grow in parallel with levels of certification. We support partners in the program by providing a portfolio of industry-leading solutions in addition to sales, marketing and technical support. Although the terms of individual channel partner agreements may deviate from our standard program terms, our standard program agreements for resellers generally provide for a term of one year with automatic renewal for successive one year terms and may be terminated by either party for convenience upon 30 days’ prior notice and our standard program agreements for distributors may be terminated by either party for convenience upon 90 days’ prior notice. Our partner
agreements generally provide for responsibilities, conduct, order and delivery, pricing and payment, and include customary indemnification, warranty and other similar provisions. No single channel partner represents more than 10% of our revenue for fiscal 2012, 2011 and 2010.
Alliances
We have formed alliances with companies where we believe we can improve our offerings to customers through collaboration. Our alliances can take different forms, including those intended, among other things, to extend our market reach through the use of complementary technologies, to develop new products or enhance existing ones, and to exchange technology. Current major alliances include:
International Business Machines Corporation, or IBM—Avaya and IBM offer our enterprise customers a variety of unified communications and contact center solutions. Sales and delivery are being offered through IBM Global Services. Avaya applications are integrated and interoperable with many IBM technologies and we use IBM technology in our product portfolio.
The Hewlett-Packard Company, or HP—Avaya and HP are collaborating in the development, sales, marketing and delivery of converged communications solutions for enterprise customers. The solutions address customer needs in unified communications and contact center environments. Sales and delivery are being offered through HP sales and services. Avaya applications are interoperable with a variety of HP technologies.
Avaya DevConnect
The Avaya DevConnect program is designed to promote the development, compliance-testing and co-marketing of innovative third-party products that are compatible with Avaya’s standards-based solutions. Member organizations have expertise in a broad range of technologies, including IP telephony, contact center and unified communications applications.
As of March 31, 2011, more than 15,000 companies have registered with the program, including more than 400 companies operating at a higher level of program membership that are eligible to submit their products or services for compatibility testing by the Avaya Solution Interoperability and Test Lab.
Avaya Test Lab engineers work in concert with each submitting member company to develop comprehensive test plans for each application to validate the product integrations.
Customers; Sales, Partners and Distribution
Customers
Our customer base is diverse, ranging in size from small businesses employing a few employees to large government agencies and multinational companies with over 100,000 employees. As of March 31, 2011, we had over 400,000 customers, including more than 85% of the Fortune 500 companies and one million customer locations worldwide. Our customers operate in a broad range of industries, including financial services, manufacturing, retail, transportation, energy, media and communications, health care, education and government, and include, among others, Morgan Stanley & Co. LLC, Progressive Casualty Insurance Company, Whirlpool
Corporation, The Hewlett-Packard Company, Home Depot, Inc., United Air Lines, Inc., Marriott International, Inc., the Blue Cross and Blue Shield Association, Australia National University and the FDIC. We employ a flexible go-to-market strategy with direct and indirect presence in over 100 countries. As of March 31, 2011, we had approximately 9,900 channel partners and for the six months ended March 31, 2011, our product revenue from indirect sales represented approximately 77% of our total product revenue.
No single customer represented more than 10% of our revenue for the years ended September 30, 2010, 2009 and 2008. For customer geographic information, please see Note 17, “Reportable Segments,” to our consolidated financial statements located elsewhere in this prospectus.
Sales, Partners and Distribution
Our global go-to-market strategy is designed to focus and strengthen our reach and impact on large multinational enterprises, mid-market and more regional enterprises and small businesses. Our go-to-market strategy is to serve our customers the way they prefer to work with us, either directly with Avaya or through our indirect sales channel, which includes our global network of alliance partners, distributors, dealers, value-added resellers, telecommunications service providers and system integrators. Our sales organizations are equipped with a broad product and software portfolio, complemented with services offerings including product support, integration and professional and managed services.
The Avaya sales organization is globally deployed with direct and indirect (e.g., channel partner) presence in over 100 countries. We continue to focus on efficient deployment of Avaya sales resources, both directly and indirectly, for maximum market penetration and global growth. Our investment in our sales organization includes training curricula to support the evolution of our sales strategy toward a solutions-based sales process targeted at helping businesses reduce costs, lower risk and grow their revenues. The program includes sales process, skills and solutions curricula for all roles within our sales organization.
Avaya Connect
As of March 31, 2011, there were approximately 9,900 channel partners that serve our customers worldwide through Avaya Connect, our business partner program. Through the use of certifications, the program positions partners to sell, implement and maintain our communications systems, applications and services. Avaya Connect offers clearly defined partner categories with financial, technical, sales and marketing benefits that grow in parallel with levels of certification. We support partners in the program by providing a portfolio of industry-leading solutions in addition to sales, marketing and technical support.
Research and Development
We make substantial investments in research and development to develop new systems, services and software in support of business collaboration, including, but not limited to, converged communications systems, communications applications, multimedia contact center innovations, collaboration tools, messaging applications, video, speech enabled applications, business infrastructure and architectures, converged mobility systems, hosted offerings, web services, communications-enabled business processes and applications, data networks and services for our customers. In addition, in 2009 we created an Emerging Products and Technology team, which includes Avaya Labs research and as of September 30, 2012 has over 250230 people working in an entrepreneurial team focused on accelerating the commercialization of innovation.
We invested $464 million, $461 million and $407 million in fiscal 2012, 2011 and $309 million for the years ended September 30, 2010, and 2009, respectively, on research and development. Customer-sponsored research and development activities that we have conducted have not been material.
Manufacturing and Suppliers
We have outsourced substantially all of our manufacturing operations to several electronic manufacturing services or EMS providers. Our EMS providers produce the vast majority of our products in facilities located in southern China, with other products producedmanufactured in facilities located in Poland, Israel, Mexico, Malaysia, Taiwan, Ireland, Germany, Indonesia, the United Kingdom and the U.S. All manufacturing of our products is performed in accordance with detailed specifications and product designs furnished or approved by us and is subject to rigorous quality control standards. We periodically review our product manufacturing operations and consider changes we believe may be necessary or appropriate. We also purchase certain hardware components and license certain software components from third-party original equipment manufacturers or OEMs and resell them bothseparately or as part of our products under the Avaya brand and, in some cases, under the brand of the OEMs.brand.
In some cases, certain components are available only from a single source or from a limited source of suppliers. Delays or shortages associated with these components could cause significant disruption to our operations. We have also outsourced substantially all of our warehousing and distribution logistics operations to several providers of such services on a global basis. For more information on risks related to products, components and components,logistics, see “Risk Factors—Risks Related to Our Business—WeFactors-Risks Associated with our Company-We rely on third-party providers for the manufacture,manufacturers and component suppliers, as well as warehousing and distribution logistics associatedproviders” and “Risk Factors-Risks Associated with our products” and “Risk Factors—Risks Related to Our Business—AsCompany-As our business and operations related relationships have expanded globally in the last few years, certain operational and logistical challenges as well as changes in economic or political conditions as well asand natural disasters, in a specific country or region, could negatively affect our revenue, costs, expenses and financial condition.condition or those of our channel partners and distributors.”
Competition
We compete against providers of both traditional enterprise voiceOur unified communications solutions as well as providers of technology related to business collaboration and contact center solutions. For example, we compete with Alcatel-Lucent (including Genesys), Aspect, Brocade, Cisco, Juniper, Microsoft, NEC, SEN, Alcatel-Lucent and SEN. Our video conferencing solutions both partnerHuawei in the enterprise segment; with ShoreTel and compete with solutions offered by Polycom Inc., TANDBERG (now Cisco) and LifeSize (now a division of Logitech International S.A.). We also face competitionMitel in the small and medium enterprise market from many competitors, includingsegment; and with Cisco, Alcatel-Lucent, NEC, Matsushita Electric Corporation of America, MitelBroadsoft, Microsoft, 8x8, and ShoreTel althoughin cloud solutions. Our video solutions compete with Cisco, Polycom and LifeSize.
Our contact center solutions compete with Genesys, Cisco and Huawei in the market for these products is more fragmented. enterprise segment and with Cisco and Interactive Intelligence in the small and medium enterprise segment and cloud solutions.
Our data solutions compete with Cisco, HP, Huawei and Juniper primarily with respect to L2/L3 ethernet switching.
We face competition in certain geographies with companies that have a particular strength and focus in these regions, such as Huawei in China, and Intelbras in Latin America. America and Panasonic in Asia.
While we believe our global, in-house end-to-end services organization provides us with a competitive advantage, it faces competition from companies like those above offering services, either directly or indirectly through their channel partners, with respect to their own product offerings, as well as many value-added resellers, consulting and systems integration firms and network service providers.
In addition, because the business collaboration market continues to evolve and technology continues to develop rapidly, we may face competition in the future from companies that do not currently compete against us, but whose current business activities may bring them into competition with us in the future. In particular, this may be the case as business, information technology and communications applications deployed on converged networks become more integrated to support business collaboration. We may face increased competition from current leaders in information technology infrastructure, information technology, consumer products, companies, personal and business applications and the software that connects the network infrastructure to those applications. With respect to services, we may also face competition from companies that seek to sell remotely hosted services or software as a service directly to the end customer. Competition from these potential market entrants may take many forms, including offering products and applications similar to those we offer as part of another offering. In addition, these technologies continue to move from a proprietary environment to an open standards-based environment.
Technological developments and consolidation within the industry, as well as changes in the solutions that we offer, result in frequent changes to our group of competitors. The principal competitive factors applicable to our solutions include:
product features, performance and reliability;
customer service and technical support;
relationships with distributors, value-added resellers and systems integrators;
an installed base of similar or related products;
relationships with buyers and decision makers;
price;
the relative financial condition of competitors;
brand recognition;
the ability to integrate various products into a customer’s existing environment, including the ability of a provider’s products to interoperate with other providers’ business collaboration products;
the ability to offer hosted solutions; and
the ability to be among the first to introduce new products and services.
For more information on risks related to our competition, see “Risk Factors—Risks Related toFactors-Risks Associated with Our Business—WeCompany-We face formidable competition from numerous established firms in the enterpriseproviders of unified communications, business collaborationcontact center and information technology markets;networking solutions and related services; as these markets evolve, we expect competition to intensify and expand to include new companies that do not currently compete directly against us.”
Patents, Trademarks and Other Intellectual Property
We own a significant number of patents important to our business and we expect to continue to file new applications to protect our research and development investments in new products and services across all areas of the business. As of March 31, 2011,September 30, 2012, we had approximately 5,7005,900 patents and pending patent applications, including foreign counterpart patents and foreign applications. Our patents and pending patent applications cover a wide range of products and services involving a variety of technologies, including, but not limited to, unified communications (including video, social media, telephony and messaging), contact centers, wireless communications and networking. The duration of our patents is determined by the laws of the country of issuance and for U.S. patents may be 17 years from the date of issuance of the patent or 20 years from the date of its filing, depending upon when the patent application was filed. In addition, we hold numerous trademarks, both in the U.S. and in other countries.
Our intellectual property holdings include those assigned to us by Lucent Technologies (now Alcatel-Lucent) at Avaya’s inception, which included a number of patents, trademarks, copyrights, trade secrets and other intellectual property directly related to and important to our business. Lucent and its subsidiaries also granted certain rights and licenses to specified patents, trademarks, copyrights, trade secrets and other intellectual property needed for the manufacture, use and sale of our products. Rights to these patents were granted through a cross license entered into with Lucent. In addition, Lucent conveyed to Avaya numerous licenses and sublicensessub-licenses under patents of third parties.
We will obtain patents and other intellectual property rights used in connection with our business when practicable and appropriate. Historically, we have done so organically or through commercial relationships as well as in connection with acquisitions, including the acquisition of NES. For example, in the acquisition of NES, we acquired over 800 patents and patent applications and were licensed a significant number of patents, trademarks, copyrights, trade secrets and other intellectual property.
Our intellectual property policy is to protect our products, technology and processes by asserting our intellectual property rights where appropriate and prudent. From time to time, assertions of infringement of certain patents or other intellectual property rights of others have been made against us. In addition, certain
pending claims are in various stages of litigation. Based on industry practice, we believe that any licenses or other rights that might be necessary for us to continue with our current business could be obtained on commercially reasonable terms. However, we cannot assure you that any of those licenses or other rights will always be available on acceptable terms or that litigation will not occur. The failure to obtain necessary licenses or other rights, or litigation arising out of such claims, could adversely affect our business.
For more information concerning the risks related to patents, trademarks and other intellectual property, please see “Risk Factors—Risks Related to Our Business—Factors-Risks Associated with our Company-We are dependent on our intellectual property. If we are unablenot able to protect our proprietary rights or if those rights are invalidated or circumvented, our business and future prospects may be harmed”adversely affected.” and “Risk Factors—Risks Related to Our Business—WeFactors-Risks Associated with our Company-We may be subject to litigation and infringement claims, which could cause us to incur significant expenses or prevent us from selling our products or services.”
Backlog
Our backlog for product sales generated, which represents the aggregate of the sales price of orders received from customers, but not yet recognized as revenue, was $169$149 million on March 31,September 30, 2012 and 2011 and $185 million $141 million and $79 million on September 30, 2010, 2009 and 2008, respectively. However,2010. These orders are expected to be recognized as revenue within the next 90 days, however, all orders are subject to possible rescheduling by customers. Although we believe that the orders included in the backlog are firm, some orders may be cancelledcanceled by the customer without penalty, and we may elect to permit cancellation of orders without penalty where management believes it is in our best interests to do so. We do not believe that our backlog, as of any particular date, is necessarily indicative of actual net sales for any future period.
Employees
As of March 31, 2011,2013, we employed 18,92515,953 employees, of which 18,75015,824 were full-time employees (16,493(13,877 were management and non-represented employees and 2,2551,947 were unionized employees)represented employees covered by collective bargaining agreements) and 175129 were part-time employees (126(125 were management and non-represented employees and 49four were represented employees covered by collective bargaining agreements).
Of the 2,3041,951 full-time and part-time unionized employees as of March 31, 2011, 1,048 employees are covered by collective bargaining agreements as of March 31, 2013, 786 were in the U.S.United States and 1,165 were located internationally, in China, Brazil, Mexico, Argentina, Germany and Canada.
OurIn the U.S., our current three-year agreements with each of the Communications Workers of America and the International Brotherhood of Electrical Workers have recently been extended and will expire on June 9, 2012, and we expect to commence bargaining of new agreements in the spring of 2012.7, 2014.
Environmental, Health and Safety Matters
We are subject to a wide range of governmental requirements relating to employee safety, and health and environmental protection, including (a) certain provisions of environmental laws governing the cleanup of soil and groundwater contamination, (b) various state,local, federal and international laws and regulations governingregarding the design, disposalmaterial content and materials compositionelectrical design of our products including those restricting the presence of certain substances in electronic products and making producers of those productsthat require us to be financially responsible for the collection, treatment, recycling and disposal of certainthose products, and (c) various employee safety and health regulations that are imposed in various countries within which we operate. For example, we are currently involved in several remediations at currently or formerly owned or leased sites, which we do not believe will have a material impact on our business or results of operations. Please see “Risk Factors—Risks Associated with Our Business—Company—We may be adversely affected by environmental, health and safety, laws, regulations, costs and other liabilities” for a discussion of the potential impact such governmental requirements and climate change risks may have on our business.”
SustainabilityCorporate Responsibility at Avaya
We have developedAvaya’s Corporate Responsibility Program incorporates four key elements: Environment, Community, Marketplace and Workplace. For Environment, Avaya looks for means to leave the world at a sustainability program supported by an Environmental Steering Committee, whichminimum the same and hopefully better than we found it. Marketplace includes engaging in fair and ethical business dealings with our customers and our supply chain. Workplace means developing a desirable place to work for our employees across the globe. Community is Avaya working to positively impact society as a cross-functional team that overseeswhole and supporting the Avaya-wide sustainability work by providing supervision, direction, guidance, objectives and targets. We recognize that climate change is an issue of global concern. Integral aspects of our operations that may be subject to climate change risks include, butcommunities where we are not limited to, the following: increased regulations that have either been promulgated or may be promulgated in the future in jurisdictions in which we operate; the procurement and transport of raw materials and components used by our manufacturers and the use of those raw materials and components in the manufacturing process; manufacturing emissions; packaging and transport of finished goods; emissions and waste generated by our business operations; emissions associated with business travel (air, vehicular, fleet services); and emissions associated with business activities and emissions generated by our products. We continue to monitor those risks and will develop policies and processes designed to mitigate those risks where possible. In addition, to minimize the physical risk associated with climate change, we leverage our global Business Continuity Plan to mitigate business interruptions and to help ensure continued operations in the face of risks such as increased intensity and frequency of extreme weather events. Business Continuity Plans are tested throughout the year using various business disruption scenarios to help ensure our ability to respond to challenges, such as any significant events that may be tied to climate change.located. Please see “Risk Factors—Risks Associated with Our Business—Integral aspects of our businessCompany—We may be subject to climate change risks.adversely affected by environmental, health and safety, laws, regulations, costs and other liabilities.”
Properties
As of March 31, 2011,2013, we had 271223 leased facilities (which included 1814 storage locations containing between 7598 to 500400 square feet) and 94 owned facilities, located in 5559 countries. These included 1113 primary research and development facilities located in Canada, China, Germany, India, Ireland, Israel, Ireland, the United KingdomItaly and the U.S. Our real property portfolio consists of aggregate floor space of 8.15.4 million square feet, of which 5.84.6 million square feet is leased and 2.30.8 million square feet is owned. Of the 4.6 million square feet which is leased, 1.0 million related to property for which the future minimum lease payments have been accrued for in accordance with GAAP. Our lease terms range from monthly leases to 1613.5 years. We believe that all of our facilities and equipment are in good condition and are well maintained. Our facilities are used for current operations of all operating segments. For additional information regarding obligations under operating leases, see Note 19,15, “Commitments and Contingencies,” to our consolidated financial statements for the period ended March 31, 2011.unaudited Consolidated Financial Statements.
Legal Proceedings
In the ordinary course of business, the Company is involved in litigation, claims, government inquiries, investigations and proceedings, including, but not limited to, those identified below, relating to intellectual property, commercial, securities, employment, employee benefits, environmental and regulatory matters. Other than as described below, the Company believes there is no litigation pending or environmental and regulatory matters against the Company that could have, individually or in the aggregate, a material adverse effect on the Company’s financial position, results of operations or cash flows. Please see “Risk Factors—Risks Associated with Our Business—We may be subject to litigation and infringement claims, which could cause us to incur significant expenses or prevent us from selling products or services.”
Antitrust Litigation
In 2006, the Company instituted an action in the U.S. District Court, District of New Jersey, against defendants Telecom Labs, Inc., TeamTLI.com Corp. and Continuant Technologies, Inc. and subsequently amended its complaint to include certain individual officers of these companies as defendants. Defendants purportedly provide maintenance services to customers who have purchased or leased the Company’s communications equipment. The Company asserts in its amended complaint that, among other things, defendants, or each of them, have engaged in tortious conduct and/or violated federal intellectual property laws by improperly accessing and utilizing the Company’s proprietary software, including passwords, logins and
maintenance service permissions, to perform certain maintenance services on the Company’s customers’ equipment. Defendants have filed a counterclaimcounterclaims against the Company, alleging a number of tort claims and alleging that the Company has violated the Sherman Act’s prohibitions against anticompetitive conduct through the manner in which the Company sells its products and services. The Company filed a motionDefendants seek to dismissrecover the profits they claim they would have earned from maintaining Avaya’s products, and ask for injunctive relief prohibiting the conduct they claim is anticompetitive. Under the federal anticompetitive claims, whichantitrust laws, defendants could be entitled to three times the court granted in partamount of any actual damages awarded for lost profits plus attorney’s fees and denied in part. Defendants filed a motion to dismiss the Company’s claims to the extent they assert violations of the federal Digital Millennium Copyright Act. The court denied Defendants’ motion in its entirety. Defendants also filed a motion to amend their complaint, which was denied in part and affirmed in part.costs. The parties have engaged in extensive discovery and motion practice to, among other things, amend and dismiss pleadings and compel and oppose discovery requests. A trial date originally setIn January 2012, Avaya’s motions to dismiss defendants’ counterclaims were granted in part and denied in part. In February 2012, the parties filed motions for September 2011 has been adjournedreconsideration of certain aspects of the Court’s ruling and no new date has been set by the court. At this point in the proceeding,Avaya filed a motion for certification of an interlocutory appeal. The parties’ motions were denied on April 26, 2012. Expert discovery on the Company’s claims and the defendants’ surviving counterclaims continues.counter-claims is completed, and in July 2012 the parties filed motions to exclude the opinion testimony of certain of each others’ experts, which were denied without prejudice on August 28, 2012. On August 17, 2012, defendants filed motions for partial summary judgment, seeking to dismiss the Company’s claims for tortious interference with contractual relations and misappropriation of trade secrets, which were denied on October 26, 2012. The trial has been scheduled for September 9, 2013. Therefore, at this time an outcome cannot be predicted and, as a result, the Company cannot be assured that this case will not have a material adverse effect on the manner in which it does business, its financial position, results of operations, or cash flows.
Intellectual Property
In the ordinary course of business, the Company is involved in litigation alleging it has infringed upon third parties’ intellectual property rights, including patents. Some litigation may involve claims for infringement against customers by third parties relating to the use of Avaya’s products, as to which the Company may provide indemnifications of varying scope to certain customers. These matters are on-going and the outcomes are subject to inherent uncertainties. As a result, the Company cannot be assured that any such matter will not have a material adverse effect on its financial position, results of operations or cash flows. However, management does provide for estimated losses if and when it believes the facts and circumstances indicate that a loss is probable and the loss can be reasonably estimated. While it is not possible at this time to determine with certainty the ultimate outcome of these cases, the Company believes there are no such infringement matters that could have, individually or in aggregate, a material adverse effect on the Company’s financial position, results of operations or cash flows.
Other
In October 2009, a former supplier in France, Combel, made a claim for improper termination of the Company’s relationship under French law seeking damages of at least €10 million and a provisional (interim) indemnity by the Company of €5 million. The Company disputes that Combel is entitled to any such damages and that it has not improperly terminated the relationship. In December 2010, the court rejected all claims of Combel based on the allegedly improper termination of the commercial relationship and only a claim with respect to the buyback of inventory remains open. To assess the value of the remaining inventory, the court appointed an expert. Combel has filed an appeal against the Court decision. The next hearing is scheduled in September 2011. An outcome cannot be predicted and, as a result, the Company cannot be assured that this case will not have a material adverse effect on its financial position, results of operations or cash flows.
In October 2009, a group of former employees of Avaya’s former Shreveport, Louisiana manufacturing facility brought suit in Louisiana state court, naming as defendants Alcatel-Lucent USA, Inc., Lucent Technologies Services Company, Inc., and AT&T Technologies, Inc. The former employees allege hearing loss
due to hazardous noise exposure from the facility dating back over forty years, and stipulate that the total amount of each individual’s damages does not exceed fifty thousand dollars. In February 2010 plaintiffs amended their complaint and added Avaya Inc.to add the Company as a named defendant. There are 101 plaintiffs101plaintiffs in the case. This matter is inDefendants’ motion to dismiss plaintiffs’ complaint was denied on April 30, 2012. At this time an outcome cannot be predicted however, because the early phasesamounts of discovery. Thethe claims are not material, the Company cannot determine ifbelieves the outcome of this matter will have an effect on our business or, if it does, whether its outcome willnot have a material adverse effect on ourthe manner in which it does business, its financial position, results of operations, or cash flow.flows.
General
The Company records accruals for legal contingencies to the extent that it has concluded it is probable that a liability has been incurred and the amount of the loss can be reasonably estimated. No estimate of the possible loss or range of loss in excess of amounts accrued, if any, can be made at this time regarding the matters specifically described above because the inherently unpredictable nature of legal proceedings may be exacerbated by various factors, including: (i) the damages sought in the proceedings are unsubstantiated or indeterminate; (ii) discovery is not complete; (iii) the proceeding is in its early stages; (iv) the matters present legal uncertainties; (v) there are significant facts in dispute; (vi) there are a large number of parties (including where it is uncertain how liability, if any, will be shared among multiple defendants); or (vii) there is a wide range of potential outcomes.
MARKET, RANKING AND OTHER INDUSTRY DATA
This prospectus includes industry and trade association data, forecasts and information that we have prepared based, in part, upon data, forecasts and information obtained from independent trade associations, industry publications and surveys and other information available to us. Some data is also based on our good faith estimates, which are derived from management’s knowledge of the industry and independent sources. Industry publications and surveys and forecasts generally state that the information contained therein has been obtained from sources believed to be reliable. We have not independently verified any of the data from third-party sources nor have we ascertained the underlying economic assumptions relied upon therein. Statements as to our market position are based on market data currently available to us. Our estimates involve risks and uncertainties and are subject to change based on various factors, including those discussed under the heading “Risk Factors” in this prospectus.
The Magic Quadrants are copyrighted 2010 by Gartner, Inc. and are reused with permission. The Magic Quadrant is a graphical representation of a marketplace at and for a specific time period. It depicts Gartner’s analysis of how certain vendors measure against criteria for that marketplace, as defined by Gartner. Gartner does not endorse any vendor, product or service depicted in the Magic Quadrant, and does not advise technology users to select only those vendors placed in the “Leaders” quadrant. The Magic Quadrant is intended solely as a research tool, and is not meant to be a specific guide to action. Gartner disclaims all warranties, express or implied, with respect to this research, including any warranties of merchantability or fitness for a particular purpose.
The Gartner Reports described herein, or the “Gartner Reports,” represent data, research opinions or viewpoints published, as part of a syndicated subscription service, by Gartner, Inc., or Gartner, and are not representations of fact. Each Gartner Report speaks as of its original publication date (and not as of the date of this prospectus) and the opinions expressed in the Gartner Reports are subject to change without notice.
Executive Officers and Directors
The following table sets forth the name, age and position of each of our executive officers and directors as of JuneMay 1, 2011:2013:
Name | Age | Position | ||||
| Senior Vice President, Corporate Strategy and | |||||
|
| |||||
| Senior Vice President | |||||
James M. Chirico, Jr. | Executive Vice President, Business Operations | |||||
Pamela F. Craven | Senior Vice President and Chief Administrative Officer | |||||
|
| |||||
|
| |||||
| 52 | Senior Vice President and Chief Information Officer | ||||
Roger C. Gaston | 57 | Senior Vice President, Human Resources | ||||
Jaroslaw S. Glembocki | 56 | Senior Vice President, Quality Program Office | ||||
J. Joel Hackney, Jr. | Senior Vice President | |||||
Kevin J. Kennedy | Director, President and Chief Executive Officer | |||||
| Senior Vice President, | |||||
| 52 | Senior Vice President & General Manager, Avaya Networking | ||||
Michael M. Runda | 56 | Senior Vice President and President, | ||||
Brett A. Shockley | Senior Vice President | |||||
David Vellequette | 57 | Senior Vice President, Chief Financial Officer | ||||
Directors | ||||||
| Director | |||||
Charles H. Giancarlo | Chairman of the Board of Directors | |||||
John W. Marren | 50 | Director | ||||
Afshin Mohebbi | Director | |||||
Greg K. Mondre | Director | |||||
| Director | |||||
| ||||||
Mohamad S. Ali,Pierre-Paul Allard, Senior Vice President, Corporate Strategy and President, Avaya Global ServicesDevelopment
Mr. AliAllard has been our Senior Vice President, Corporate Strategy and President, Avaya Global Services,Development since April 2011. Prior to that time,May 7, 2012. Previously, he spent 19 years at Cisco Systems, Inc., a provider of communications and networking products and services. Most recently, from August 2003 until February 2012, he served as our Senior Vice President, Corporate DevelopmentSales and Strategy since December 2009 and, priorOperations, Global Enterprise at Cisco. Prior to that time and since July 15, 2009,joining Cisco, he was our Senior Vice President, Corporate Development. Previously, Mr. Ali spent 1312 years at International Business Machines Corporation, or IBM, a global provider of information technology products and services, most recently as Vice President, Business Developmentservices. Since September 2008, Mr. Allard has served on the board of directors of EXFO Inc., a provider of next-generation test and Strategyservice assurance solutions for IBM’s Information Management Division from 2005 until July 2009.wireless and wireline network operators and equipment manufacturers in the global telecommunications industry.
Steven J. Bandrowczak,Gary E. Barnett, Senior Vice President & General Manager, Collaboration
Mr. Barnett has been our Senior Vice President and General Manager, Data Solutions
Mr. Bandrowczak has been our Vice President and General Manager, Data SolutionsCollaboration since June 14, 2010. Previously,December 20, 2011. Prior to that time, from August 2011 until December 18, 2009 until June 14, 2010,2011, he served as our Vice President Sales and Marketing for the Avaya data business. From January 1, 2009 until December 18, 2009, Mr. Bandrowczak was the President, Enterprise Sales Americas for Nortel Networks Inc.GM of UC Applications, and from July 16, 2007April 2011 until January 1, 2009,August 2011, he served as Chief Information Officer for Nortel Networks Corporation and Nortel Networks Limited.our Vice President of CC Applications. Previously, from SeptemberOctober 2005 until July 2007, he served as Senior Vice President and Chief Information Officer for
Lenovo Group Ltd., a global producer of PC products and value-added professional services. Prior to that,April 2011, he served as Executive Vice President and Chief InformationTechnology Officer at DHL Worldwide, a global market leader in the international express and logistics industry.
Alan E. Baratz, Senior Vice President and President, Global Communications Solutions
Dr. Baratz has been our Senior Vice President and President, Global Communications Solutions since October 2, 2008. From June 1, 2007 to January 31, 2008, Dr. Baratz served as Senior Vice President of the NetworkAspect Software, and Systems Technology Group at Cisco Systems, Inc., a provider of unified communications and networking products. Previously, he served as Presidentcontact center software and Chief Executive Officer of NeoPath Networks, a provider of network file management solutions, from February 25, 2005 until it was acquired by Cisco on March 13, 2007. From August 11, 2003 to February 14, 2005, Dr. Baratz served as President and Chief Executive Officer of Versata, Inc., a software company serving the distributed enterprise applications market.services.
James M. Chirico, Jr., Executive Vice President, Business Operations
Mr. Chirico has been our Executive Vice President, Business Operations since June 14, 2010. Previously, from February 3, 2009 until June 14, 2010, he served as our Chief Restructure Officer and President, Operations. From January 2, 2008 until February 3, 2009, he served as our Senior Vice President and President, Operations. FromPrior to that time, from February 1998 to November 2007, Mr. Chirico held various senior management positions at Seagate Technology, a designer, manufacturer and marketer of hard disc drives, including Executive Vice President, Global Disc Storage Operations, from February 2006 until November 2007, and Senior Vice President and General Manager, Asia Operations, from September 2000 to February 2006.
Pamela F. Craven, Senior Vice President and Chief Administrative Officer
Mrs. Craven has been our Senior Vice President and Chief Administrative Officer since August 2006. In that role, she continues to serve as our General Counsel, which is a position she has held since September 2000. She also served as Corporate Secretary from September 2000 to January 2007. She was a Senior Vice President from August 2002 tountil August 2006.
Christopher M. Formant,Fariborz Ebrahimi, Senior Vice President and President, Avaya Government SolutionsChief Information Officer
Mr. FormantEbrahimi has been our Senior Vice President and President, Avaya Government SolutionsChief Information Officer since August 16, 2010.February 18, 2013. Previously, from February 25, 2008he was employed by Verizon Communications Inc., a leading provider of communications, information and entertainment products and services to consumers, businesses and governmental agencies. From January 2006 until August 16, 2010,December 2013 he served as our Senior Vice President and President, Avaya Global Services. Mr. Formant was previously Executive Vice PresidentCIO for Corporate Network and Executive Committee Member at Bearing-Point, Inc., a consulting firm, from February 2003 to January 2008.Technology which included Verizon’s Wireline network as well as Verizon Shared Services Operations (VSO) which included the finance operations, real estate and supply chain services supporting all Verizon companies.
Roger C. Gaston, Senior Vice President, Human Resources
Mr. Gaston has been our Senior Vice President, Human Resources since May 2006. From March 2001 to September 2005 he was Corporate Vice President, Human Resources at Storage Technology Corp., a technology storage solutions provider.In his role, Mr. Gaston is responsible for employee compensation and benefits, employee communications, workforce relations, organizational development and transformation, recruitment, talent management and labor relations.
Stephen J. Gold,Jaroslaw S. Glembocki, Senior Vice President, and Chief Information OfficerQuality Program Office
Mr. GoldGlembocki has beenserved as our Senior Vice President, and Chief Information OfficerQuality Program Office since May 24, 2010.November 7, 2011. Previously from July 2009 until May 2010, he served as Executive Vice President, Chief InformationOperating Officer and Corporate Chief Technology Officer at GSI Commerce, Inc.of Solexant Corp., a providerdeveloper of e-commerce and digital marketing solutions, and,third-generation ultrathin-film PV technology, from February 2005March 2011 until JulyOctober 2011. From June 2009 he served as Executive Vice President and Chief Information Officer.until March 2011, Mr. Glembocki was engaged in various consulting projects. Prior to that, from 2003 to 2005, he wasMr. Glembocki served as Senior Vice President of Recording Heads and Chief Information OfficerMedai Operations at Merck & Company, Inc.,Seagate Technology HDD Holdings, a pharmaceutical company.
J. Joel Hackney, Jr., Senior Vice President Global Sales and Marketing and President, Field Operations& General Manager, Avaya Cloud Solutions
Mr. Hackney Jr. has been our Senior Vice President and General Manager, Avaya Cloud Solutions since January 11, 2013. Prior to that and since June 14, 2010 he served as our Senior Vice President, Global Sales and Marketing and President, Field Operations since June 14, 2010.Operations. From December 19, 2009 until June 14, 2010 he was our Senior Vice President and President, Avaya Government and Data Solutions. Previously, he spent four years at Nortel Networks Corporation where, from September 2007 to December 2009, he served as President, Nortel Enterprise Solutions and, from December 2005 to September 2007, he served as Senior Vice President of Global Operations and Quality. Prior to that, he spent 14 years at General Electric, a diversified technology, media and financial services company most recently as Division General Manager, GE Consumer and Industrial.
Kevin J. Kennedy, Director, President and Chief Executive Officer
Mr. Kennedy has been our President and Chief Executive Officer and a member of our board of directors since December 22, 2008. Previously, from September 2003 tountil December 2008, he served as Chief Executive
Officer of JDS Uniphase Corporation, or JDSU, a provider of optical communications products, and from March 2004 until December 2008, he also served as President of JDSU. He joinedwas a member of JDSU’s board of directors infrom November 2001 until August 2012 and since December 2008, has served as Vice Chairman of their board of directors.directors from December 2008 until August 2012. Mr. Kennedy is also on the board of directors of KLA-Tencor Corporation, a supplier of process control and yield management solutions for the semiconductor industry. Mr. Kennedy served on the boards of directors of Rambus Inc., a developer of a high-speed chip-to-chip interface technology, from April 2003 until July 2008 Freescale Semiconducter, Inc., an embedded processing semiconductor and solutions company, from July 2004 until December 2006, and Polycom Inc., a provider of telepresence, voice and video conferencing solutions, from May 2008 until January 2009. Mr. Kennedy was selected to serve as a director in light of his role as Chief Executive Officer, the management perspective he brings to the board deliberations, his extensive management experience and his experience on multiple publicpubic company boards.
Anthony J. Massetti, Senior Vice President and Chief Financial Officer
Mr. Massetti has been our Senior Vice President and Chief Financial Officer since October 26, 2009. From January 2008 to October 2009, Mr. Massetti was Chief Financial Officer and Senior Vice President at NCR Corporation, a global provider of financial and retail self service solutions and services. From 2002 to 2008, he was with QLogic Corporation, a storage networking solutions company, most recently as Chief Financial Officer and Senior Vice President from 2004 to 2008.
Thomas G. Mitchell, Senior Vice President, and President, SME and Avaya Go to MarketGlobal Sales
Mr. Mitchell has been our Senior Vice President, Avaya Global Sales since January 11, 2013. Prior to that and since March 2011 he served as our Senior Vice President and President, SME and Avaya Go to Market, since March 2011. Prior to that time, heMarket. He served as our Senior Vice President, Channel TransformationIntegration since May 3, 2010. From 2005 tountil April 2010, Mr. Mitchell was a consultant specializing in developing and refining complex global go-to-market strategies in the IT marketplace.
Marc J. Randall, Senior Vice President & General Manager, Avaya Networking
Mr. Randall has been our Senior Vice President and GM, Avaya Networking since December 20, 2011. From January 31, 2011 until December 16, 2011, he served as Vice President and General Manager of Cisco Systems, Inc., a provider of communications and networking products and services. Previously, from 2008 to 2010, he served as Senior Vice President of Products and Offerings of Brocade, Inc., a provider of network solutions. Prior to that time, from 2003 until 2008, he served as President, CEO and a Director of Force10 Networks, a provider of data center networking.
Michael M. Runda, Senior Vice President and President, Avaya Client Services
Mr. Runda has been our Senior Vice President and President, Avaya Client Services since May 2012. From October 2011 until May 2012, he served as our Vice President, Global Support Services. Prior to that time, from 2010 until 2011, he served as Chief Executive Officer of KCS Academy, a subsidiary of the Consortium for Service Innovation. From 2006 until 2010, he served as the Vice President of Global Support for Inuit Corporation.
Brett A. Shockley, Senior Vice President Corporate Development and Strategy& Chief Technology Officer
Mr. Shockley has served as our Senior Vice President Corporate Development and StrategyChief Technology Officer since April 2011.8, 2013. Prior to that time fromand since December 2011, he served as our Senior Vice President & General Manager of Avaya Applications and Emerging Technologies. From April 2011 until December 2011, he served as our Senior Vice President of Strategy and Corporate Development. From July 2009 tountil April 2011, Mr. Shockley served as our Vice President of Emerging Products and Technology. FromPreviously, from January 2002 tountil October 2008, Mr. Shockleyhe was Chairman, Chief Executive Officer and President of Spanlink Communications, Inc., a provider of unified communications and contact center solutions. Mr. Shockley is on the board of directors of Wireless Ronin Technologies, Inc., a wireless communications development company focused on digital signage.
Eugene J. Frantz,David Vellequette, Senior Vice President, Chief Financial Officer
Mr. Vellequette has been our Senior Vice President, Chief Financial Officer since October 1, 2012. Previously, he served as Executive Vice President and Chief Financial Officer of JDS Uniphase Corporation, or JDSU, a provider of optical communications products a position he held from June 2005 until August 2012. He joined JDSU as Vice President and Operations Controller in July 2004.
John S. Chen, Director
Mr. FrantzJohn S. Chen has been a member of our boardBoard of directorsDirectors since October 26, 2007.December 14, 2012. Mr. Frantz joined TPG CapitalChen has been a Special Advisor of Silver Lake since 2012. He served as Chairman and Chief Executive Officer of Sybase, Inc., a computer software company, from July 2010 until he retired in 1999November 2012. Mr. Chen also served as Chairman, Chief Executive Officer, President, and is a Partner. Mr. Frantz sat on the board of directors of SMART Modular Technologies, Inc.,
a provider of memory products and liquid-crystal displays, from April 2004 until January 2010. Mr. Frantz’s experience in financial matters, service as a director of other companies, experience in working with companies controlledSybase from November 1998 until July 2010 when Sybase was acquired by private equity sponsors,SAP AG. Mr. Chen is also on the boards of Wells Fargo & Company, a financial services company, and The Walt Disney Company, a diversified worldwide entertainment company. Mr. Chen’s related industry experience, service as an executive officer and director of other companies, and affiliation with TPG,Silver Lake, which prior to the completion of this offering, has the right to select three of our directors, led to the conclusion that he should serve as a director of our Company.
Charles H. Giancarlo, Chairman of the Board of Directors
Mr. Giancarlo has been a member of our board of directors since June 30, 2008 and has been our Chairman of the board of directors since December 22, 2008. He served as our President and Chief Executive Officer from June 30, 2008 until December 22, 2008. Mr. Giancarlo has been a Managing Director of Silver Lake since 2007. Prior to joining Silver Lake in 2007, he was employed by Cisco Systems, Inc., a provider of communications and networking products and services, which he joined in 1994 and where he was Executive Vice President and Chief Development Officer from 2004 to 2007. Mr. Giancarlo is also on the boards of directors of Accenture Ltd.,plc, a management consulting business, and various private companies. He served on the board of directors of Netflix, Inc., an online movie rental subscription service, and various private companies.from April 2007 until May 2012. Mr. Giancarlo’s related industry experience, experience in financial matters, service as an executive officer and director of other companies, prior service as our Chief Executive Officer, experience in working with companies controlled by private equity sponsors, and affiliation with Silver Lake, which prior to the completion of this offering, has the right to select three of our directors, led to the conclusion that he should serve as a director our Company.
John W. Marren, Director
Mr. Marren has been a member of our board of directors since August 24, 2012. Mr. Marren previously served on our board of directors from October 26, 2007 until April 15, 2011. Mr. Marren joined TPG in 2000 as a Partner and leads TPG’s technology team. Mr. Marren previously served as Chairman of the Board of MEMC Electronic Materials, Inc., a provider in the semiconductor and solar industries, a position he held from November 2001 to December 2012. He also serves on the board of directors of various private companies. Mr. Marren’s related industry experience, experience in financial matters, service as a director of other companies, experience in working with companies controlled by private equity sponsors, and affiliation with TPG, which has the right to select three of our directors, led to the conclusion that he should serve as a director our Company.
Afshin Mohebbi, Director
Mr. Mohebbi has been a member of our board of directors since April 2011. Mr. Mohebbi ishas been a TPG Senior Advisor to TPG,since 2004, supporting the firm’s portfolio of private and public companies throughout the world. Previously, Mr. Mohebbi held various executive positions at Qwest Communications International Inc., or Qwest, British Telecom Plc., SBC Communications Inc. and Pacific Telesis Group. Most recently, he was president and chief operating officer of Qwest, Communications International Inc., a provider of broadband Internet-based data, voice and image communications, from April 2001 to December 2002.communications. Mr. Mohebbi served on the board of directors of Hanaro Telecom, a provider of long distance service and wholesale of IT-related products, from March 2005 until December 2007. Mr. Mohebbi’s related industry experience, service as an executive officer and director of other companies, experience in working with companies controlled by private equity sponsors, and affiliation with TPG, which prior to the completion of this offering, has the right to select three of our directors, led to the conclusion that he should serve as a director of our Company.
Greg K. Mondre, Director
Mr. Mondre has been a member of our board of directors since October 26, 2007. Mr. Mondre has been a Managing Partner of Silver Lake since 2012 and a Managing Director of Silver Lake since 2005. Prior to joining Silver Lake in 1999, he was a principal at TPG and an investment banker at Goldman, Sachs & Co., a global investment banking and securities firm. Mr. Mondre is also on the boards of directors of various private companies. Mr. Mondre’s experience in financial matters, service as a director of other companies, experience in working with companies controlled by private equity sponsors and affiliation with Silver Lake, which prior to the completion of this offering, has the right to select three of our directors, led to the conclusion that he should serve as a director of our Company.
KevinGary B. Rollins,Smith, Director
Mr. RollinsSmith has been a directorDirector of Avayathe Company since October 26, 2007.December 6, 2011. Mr. Rollins has been a senior advisor focusing on investment strategies in global technology at TPG since he joined in 2007. From April 1996 to January 2007, Mr. Rollins held various positions at Dell, Inc., or Dell, a technology solutions, services and support provider, includingSmith currently serves as President, and Chief Executive Officer from March 2004and Director of Ciena Corporation, or Ciena, a network infrastructure company. Mr. Smith began serving as Chief Executive Officer of Ciena in May 2001, in addition to January 2007,his existing responsibilities as president and President and Chief Operating Officer, from 2001 to March 2004.director, positions he has held since October 2000. Mr. Rollins servedSmith also serves on the board of directors of Sears Holdings Corporation,CommVault Systems, Inc., a large broadline retailer, from February 2008 untilprovider of data and information management software applications and related services, a position he has held since May 2010. On July 22, 2010, the SEC filed a civil injunctive action involving Dell, which included allegations against Dell and certain2004. Mr. Smith’s nearly 30 years of its senior officers, including Mr. Rollins, concerning the failure to provide adequate disclosure in its SEC
filings with respect to Dell’s commercial relationship with Intel Corp. Dell and the relevant officers, including Mr. Rollins, agreed, without admitting or denying the allegations, to settle the matter, and the U.S. District Court for the District of Columbia approved such settlement on October 13, 2010. Mr. Rollins’ settlement included a monetary penalty and a permanent injunction prohibiting violations of Sections 17(a)(2) & (3) of the Securities Act and violations, including aiding and abetting violations, of Section 13(a) of the Securities Exchange Act of 1934, or the Exchange Act. Mr. Rollins’ industry experience, service as an executive officer and director of other companies, experience in working with companies controlled by private equity sponsors,the global telecommunications industry, experience in financial matters and affiliation with TPG, which, prior toindependence from the completion of this offering, has the right to select three of our directors,Company, led to the conclusion that he should serve as a director of ourthe Company.
David J. Roux, Director
Mr. Roux has been a member of our board of directors since October 26, 2007 and served as Chairman of the board of directors from November 2, 2007 until December 22, 2008. Mr. Roux is Chairman of Silver Lake. Prior to co-founding Silver Lake in 1999, he served as Chairman and Chief Executive Officer of Liberate Technologies, a software company specializing in telecommunications technology, Executive Vice President at Oracle Corporation, a software and technology company, and Senior Vice President at Lotus Development Corporation, a software manufacturer that was acquired by IBM in 1995. Mr. Roux is also on the boards of directors of various private companies. Mr. Roux served on the boards of directors of Business Objects S.A., a provider of business intelligence software and services, from December 2003 until January 2006, Symantec Corporation, a personal computer security software company, from July 2005 until September 2007, and Thomson S.A., a consumer electronics company from September 2004 until October 2008. Mr. Roux’s experience in financial matters, service as an executive officer and director of other companies, experience in working with companies controlled by private equity sponsors, affiliation with Silver Lake, which, prior to the completion of this offering, has the right to select three directors, and related industry experience, led to the conclusion that he should serve as a director of our Company.
Board Composition and Director Independence
Our business and affairs are managed under the direction of the board of directors. Our board of directors is currently composed of seven directors: Mr. Kennedy, and three representatives from each of the Sponsors. Because of their relationships with our SponsorsSilver Lake, two representatives from TPG and us, none of our directors is “independent” under the rules of the or Rule 10A-3 under the Exchange Act.a non-affiliated director. We expect that, effective upon completion of this offering, our board of directors will appoint and to serve on our board of directors and that our board of directors will determine that each such director is an independent director under the applicable rules of the New York Stock Exchange and Rule 10A-3 under the Exchange Act. Currently Mr. Smith is our only non-affiliated director, and he has been determined by the Board to meet the independence rules of the New York Stock Exchange and Rule 10A-3 under the Exchange Act.
Under our certificate of incorporation that will be in effect upon the completion of this offering, until such time as the Sponsors collectively cease to beneficially own at least 40% or more of our outstanding common stock (such time referred to in this section as the “triggering event”), the number of directors shall be no fewer than three and no more than fifteen. At each annual meeting of stockholders, the directors will be elected to serve until the earlier of their death, resignation or removal, or until their successors have been elected and qualified. Vacancies and newly-created directorships on the board may be filled by the remaining directors, and until the triggering event, vacancies on the board may also be filled by holders of a majority of the outstanding shares of common stock.
Currently, each director is elected for a one-year term. Our certificate of incorporation that will become effective upon the closing of this offering provides that at the first annual meeting after the triggering event, the board shall be divided into three classes with staggered three-year terms.
Prior to the triggering event, directors may be removed with or without cause by holders of a majority of the outstanding shares of common stock. Following the triggering event, our directors may be removed only for cause by the affirmative vote of the holders of at least two-thirds of the voting power of our outstanding shares of capital stock entitled to vote generally in the election of directors, voting together as a single class.
A stockholders’ agreement between us and our current shareholders contains an agreement among the parties pursuant to which each of the Sponsors, in its sole discretion, designates three of the current directors. In
connection with the consummation of this offering, certain of the provisions in the stockholders’ agreement are likely to be amended or terminated. In addition, Mr. Kennedy’s employment agreement provides that, for so long as he is the Company’s Chief Executive Officer, our Sponsors shall ensure that their affiliates vote to elect him as a member of our board of directors.
Following the completion of this offering, we expect to be a “controlled company” under the rules of the New York Stock Exchange because more than 50% of our outstanding voting power will be held by the Sponsors. See “Principal Stockholders.” We intend to rely upon the “controlled company” exception relating to the board of directors and committee independence requirements under the rules of .the New York Stock Exchange. Pursuant to this exception, we will be exempt from the rules that would otherwise require that our board of directors consist of a majority of independent directors and that our compensation committee and nominating and governance committee be composed entirely of independent directors. The “controlled company” exception does not modify the independence requirements for the audit committee, and we intend to comply with the requirements of the
Exchange Act and the rules of the ,New York Stock Exchange, which require that our audit committee have at least one independent director upon consummation of this offering, consist of a majority of independent directors within 90 days following the effective date of the registration statement of which this prospectus forms a part and exclusively of independent directors within one year following the effective date of the registration statement of which this prospectus forms a part.
Board Committees
We currently have an audit committee, a compensation committee and a nominating and governance committee with the composition and responsibilities described below. The members of each committee are appointed by the board of directors and serve until their successor is elected and qualified, unless they are earlier removed or resign. In addition, from time to time, special committees may be established under the direction of the board of directors when necessary to address specific issues.
Audit Committee
Following the offering, the Audit Committee will be composed of Messrs. Frantz, Mondre, Mohebbi, Smith and . �� will serve as the Chairperson of the Audit Committee.
Mr. Smith is our only non-affiliated Director, and he has been determined by the Board to meet the independence rules of the New York Stock Exchange and Rule 10A-3 of the Exchange Act. We anticipate that, prior to the completion of this offering, our audit committeeBoard will determine that and meet the definition of “independent director” under theindependence rules of the and under Rule 10A-3 under the Exchange Act.as well. Within 90 days following the effective date of the registration statement of which this prospectus forms a part, we anticipate that the Audit Committee will consist of a majority of independent directors, and within one year following the effective date of the registration statement of which this prospectus forms a part, the Audit Committee will consist exclusively of independent directors. None of our Audit Committee members simultaneously serves on the audit committees of more than three public companies, including ours. The board of directors has affirmatively determined that Messrs. Frantz, Mondre, and qualify as audit committee financial experts under the applicable requirements of the rules and regulations of the SEC.
Our audit committeeAudit Committee is responsible for, among other things:
selecting the independent auditors;
pre-approving all audit engagement fees and terms, as well as audit and permitted non-audit services to be provided by the independent auditors;
at least annually, obtaining and reviewing a report of the independent auditors describing the audit firm’s internal quality-control procedures and any material issues raised by its most recent review of internal quality controls;
annually evaluating the qualifications, performance and independence of the independent auditors;
discussing the scope of the audit and any problems or difficulties;
reviewing and discussing the annual audited and quarterly unaudited financial statements and “Management’s Discussion and Analysis of Financial Conditions in Results of Operations” with management and the independent auditor;
discussing types of information to be disclosed in earnings press releases and provided to analysts and rating agencies;
discussing policies governing the process by which risk assessment and risk management are to be undertaken;
| • | reviewing and evaluating the adequacy of the Company’s ethics and compliance program, including our Code of Conduct,Operating with Integrity; |
reviewing disclosures made by the chief executive officer and chief financial officer regarding any significant deficiencies or material weaknesses in our internal control over financial reporting;
reviewing internal audit activities and qualifications of the internal audit function;
establishing procedures for receipt, retention and treatment of complaints received by us regarding accounting, auditing or internal controls and the submission of anonymous employee concerns regarding accounting and auditing;
discussing with our general counsel any material government investigations, litigation or legal matters that could reasonably be expected to have a material impact on business or financial statements;
approving all related party transactions;
reviewing and approving the Company’s decisions to enter into certain swaps and security-based swaps;
annually reviewing and reassessing the Audit Committee charter; and
preparing the report required by the SEC to be included in our annual report on Form 10-K or our proxy or information statement.
The Audit Committee has authority under its charter to obtain advice and assistance from outside legal counsel, accounting, or other outside advisors as deemed appropriate to perform its duties and responsibilities. A copy of the charter will be available on our website at www.avaya.com upon completion of this offering. Information contained in, and that can be accessed through, our website is not incorporated into and does not form a part of this prospectus.
Compensation Committee
AllThe Compensation Committee consists of our executive officers are employees of Avaya Inc. Prior to June 1, 2011, compensationMessrs. Giancarlo, Marren and related matters were reviewed and approved by the compensation committee of the board of directors of Avaya Inc. On and after June 1, 2011, all such matters are and will be reviewed and approved by the compensation committee of the board of directors of Avaya Holdings Corp. The compensation committees of Avaya Inc. and Avaya Holdings Corp., which we refer to in this prospectus collectively as the “Compensation Committee,” consist of the same members—Messrs. Rollins, Giancarlo, and Roux.Smith. Mr. RollinsMarren serves as Chairman of the Compensation Committee. During fiscal year 2010, the Compensation Committee held 6 meetings. We anticipate that, prior to the completion of this offering, the Compensation Committee, or a subcommittee, will be composed of “outside directors” as defined in Section 162(m) of the Code.
The Compensation Committee is responsible for:
reviewing and approving individual performance of each of the Company’s senior officers reporting directly to the CEO and setting their compensation based on that evaluation;
reviewing the individual goals and objectives of, and evaluating the performance of, the chief executive officer, and setting the chief executive officer’s compensation based on that evaluation;
making recommendations to the board of directors regarding the adoption of new incentive compensation and equity-based plans, and administering our existing incentive compensation and equity-based plans;
making recommendations to the board of directors regarding compensation of the board members and its committee members;
annually reviewing the Compensation Committee charter and recommending any proposed changes to the Board;
reviewing and discussing with management the compensation discussion and analysis to be included in our filings with the SEC and preparing an annual compensation committee report for inclusion in our annual report on Form 10-K or proxy statement; and
overseeing any other such matters as the board of directors shall deem appropriate from time to time.
The Compensation Committee has authority under its charter to access such internal and external resources, including retaining legal, financial, or other advisors, as the Compensation Committee deems necessary or appropriate to fulfill its responsibilities. A copy of the charter will be available on our website at www.avaya.com upon completion of this offering. Information contained in, and that can be accessed through, our website is not incorporated into and does not form a part of this prospectus.
Nominating and Governance Committee
The Nominating and Governance Committee of our board of directors consists initially of Messrs. Giancarlo,Chen, Kennedy and Mohebbi. Mr. Mohebbi and Kennedy. Mr. Giancarlo serves as Chairman of the Nominating and Governance Committee.
The Nominating and Governance Committee is responsible for and oversees:
evaluating the performance, size and composition of the full board of directors annually to determine the qualifications and areas of expertise needed to further enhance the composition of the board of directors and working with management in attracting candidates with those qualifications;
establishing criteria for the selection of new directors;
identifying individuals qualified to become directors and reviewing the qualifications of prospective nominees;
recommending the slate of nominees for inclusion in the Company’s proxy statement and presentation to the Company’s shareholders at each annual meeting, if any;
establishing a policy for considering shareholder nominees for election to our board of directors and reviewing any candidates for board membership nominated by shareholders;
recommending qualified individuals to serve as committee members on the various board committees and recommending to the full board of directors, as appropriate, changes in number, function or composition of committees;
reviewing the performance of any board member eligible to stand for re-election at our annual meeting, if any, as well as other criteria prescribed by Company policies;
establish criteria and processes for, and overseeing, the performance and self-evaluation process of our board of directors;
reviewing and assessing any director who retires, changes from the principal occupation or principal background association held when such director was originally invited to join the board of directors, joins any new board of directors of a public company or private company or joins a governmental commission, and in each case, determining whether it believes that such director’s change in circumstances represents a conflict of interest or otherwise inhibits such director’s ability to serve the best interest of the Company and its stockholders;
circumstances represents a conflict of interest or otherwise inhibits such director’s ability to serve the best interest of the Company and its stockholders; |
evaluating the need and, if necessary, create a plan for the orientation and continuing education of directors;
monitoring, with the assistance of our General Counsel, current developments in the regulation and practice of corporate governance; and
reviewing our corporate governance guidelines once adopted and providing recommendations to the board of directors regarding possible changes.
The Nominating and Governance Committee has sole authority under its charter to retain and terminate, at the Company’s expense, any search firm or advisor to be used to identify director candidates and has sole authority to approve the search firm’s or advisor’s fees and other retention terms. A copy of the charter will be available on our website at www.avaya.com upon completion of this offering.
Board Leadership Structure
Our board of directors understands that there is no single, generally accepted approach to providing board leadership and that given the dynamic and competitive environment in which we operate, the right board leadership structure may vary as circumstances warrant. To this end, our board of directors has no policy mandating the combination or separation of the roles of Chairman and Chief Executive Officer. We currently have a separate Chairman and Chief Executive Officer. This leadership structure has been determined to be appropriate for us at this time in light of our current relationship with our Sponsors, though our board of directors believes the matter should be discussed and considered from time to time as circumstances change.
Board Oversight of Risk Management
While the full board of directors has the ultimate oversight responsibility for the risk management process, its committees oversee risk in certain specified areas. In particular, our Compensation Committee is responsible for overseeing the management of risks relating to our executive compensation plans and arrangements and the incentives created by the compensation awards it administers. Our Audit Committee oversees management of enterprise risks as well as financial risks and effective upon the consummation of this offering will also be responsible for overseeing potential conflicts of interests. Pursuant to the board of directors’ instruction, management regularly reports on applicable risks to the relevant committee or the full board of directors, as appropriate, with additional review or reporting on risks conducted as needed or as requested by the board of directors and its committees.
Code of Ethics and Business Conduct
Our Code of Conduct,Operating with Integrity, is designed to help directors and employees worldwide to resolve ethical issues in an increasingly complex global business environment. The Code of Conduct applies to all directors and employees, including, without limitation, the Chief Executive Officer, the Chief Financial Officer, the Corporate Controller and any other employee with any responsibility for the preparation and filing of documents with the SEC. The Code of Conduct covers a variety of topics, including those required to be addressed by the SEC. Topics covered include, but are not limited to, conflicts of interest, confidentiality of information and compliance with applicable laws and regulations. Directors and employees of the Company receive periodic updates regarding policies governed by and changes to the Code of Conduct. The Code of Conduct is available at our Investor Relations website located at http://investors.avaya.com. We will post amendments to or waivers of the provisions of the Code of Conduct made with respect to any of our directors and executive officers on that website within four business days. The information contained on, or accessible through, our website is not part of this prospectus, and is therefore not incorporated by reference. During fiscal 2012, no amendments to or waivers of the provisions of the Code of Conduct were made with respect to any of our directors or executive officers.
Compensation Committee Interlocks and Insider Participation
Prior to June 1, 2011, all compensation and related matters were reviewed by the compensation committee of Avaya Inc. During fiscal year 2010,2012, the compensation committee of Avaya Inc.Compensation Committee was comprised of Messrs.Mr. Kevin Rollins (Chairman), RouxMr. Smith and Mr. Giancarlo. Mr. Rollins is affiliatedwas associated with TPG, and Messrs. Rouxhe ceased serving as a director on October 25, 2012. Mr. Marren became a member of the Compensation Committee in October 2012, and Giancarlo are affiliated with Silver Lake.he was appointed Chairman of the Compensation Committee in February 2013. For additional information regarding transactions between those entities and Avaya, please see “Certain Relationships and Related Party Transactions” below.
General
Compensation Philosophy and Objectives
Avaya’s general compensation philosophy is that total compensation should bebased on a driving principle, established by our CEO and Compensation Committee, to balance market competitiveness with affordability in the current business context. Compensation programs are designed to attract, motivate and retain executive officers and employees in such a way aswho are expected to create value formake the benefit of the Company and its owners. The Company believes that the main objective of its compensation program should be to create a competitive total compensation package thatgreatest impact on business results. Actual rewards employees for performance against stated goals and objectives. The Company believes that performance should be measured at both the corporate and the individual levels. Employees are rewarded for both their contributions to short-term and long-termdependent upon corporate performance and their demonstratedindividual contribution level. Leadership behaviors, cross-functional effectiveness and performance measured againstattainment of individual objectives.objectives are considered in determining individual contribution level.
Avaya competes with other companies in the market for talented employees. As a result, Avaya’s market-based pay platform, which defines market pay relative to specific and varying roles and responsibilities, emphasizes the commitment to provide employees with a pay opportunity that is externally competitive. The platform aims to provide Avaya with an increased ability to attract and retain top talent and make more informed pay decisions. The Company has not adopted any formal policies or guidelines for allocating compensation between short-term and long-term compensation, between cash and non-cash compensation, or among different forms of cash and non-cash compensation.
Compensation Committee
Pursuant to its charter, the compensation committee, which we refer to in this prospectus as the “Compensation Committee,” reviews and approves compensation and related matters. The Compensation Committee must consist of at least three members. A Compensation Committee member serves until his successor is elected and qualified. The Compensation Committee charter provides that the Compensation Committee acts on behalf of Avaya Holdings Corp. and Avaya Inc. All of our executive officers are employees of Avaya Inc. During fiscal 2012, the Compensation Committee held seven meetings.
Prior to December 2011, the members of the Compensation Committee were Mr. Kevin Rollins (Chairman), Mr. Giancarlo and Mr. David Roux. In December 2011, Mr. Smith was appointed to the Compensation Committee in place of Mr. Roux. In October 2012, Mr. Rollins resigned from the Board, and the Compensation Committee membership was further revised later in fiscal 2013. The members of the Compensation Committee now are Messrs. Giancarlo, Marren (Chairman) and Smith.
Compensation Consultant
For fiscal 2012, the Company retained an advisor on compensation matters, Pearl Meyer and Partners, LLC (“Pearl Meyer”), on a project by project basis.
In addition, pursuant to its charter, the Compensation Committee has sole authority to retain, at the Company’s expense, and terminate any compensation consultant to advise the Compensation Committee, and it has sole authority to approve that consultant’s fees and other retention terms. During fiscal 2012, the Compensation Committee did not retain any such consultant. However, from time to time the Compensation Committee received support from compensation advisors at each of Silver Lake and TPG, our Sponsors.
How Compensation Decisions are Made
Compensation Committee
All of ourMaterials and recommendations with respect to CEO and non-CEO executive officersofficer compensation are employees of Avaya Inc. Prior to June 1, 2011, compensation and related matters were reviewed and approveddeveloped by the Executive Compensation group within the Company, based in part on advice and market and peer group data from Pearl Meyer. With respect to non-CEO compensation, committee of the board of directors of Avaya Inc. Onmaterials and after June 1, 2011, all such mattersrecommendations are presented to the CEO for his review and will be reviewed and approved by the compensation committee of the board of directors of Avaya Holdings Corp.assessment. The compensation committees of Avaya Inc. and Avaya Holdings Corp., which we referCEO makes a recommendation to in this prospectus collectively as the “Compensation Committee,” consist of the same members—Messrs. Rollins (Chairman), Giancarlo, and Roux. During fiscal year 2010, the Compensation Committee, held six meetings.which includes the advice, market and peer group data from Pearl Meyer with respect to the base salary, short-term and long-term incentives, including equity awards and long-term cash awards, for each of the executive officers other than the CEO. With respect to CEO compensation, as described above, the
Compensation Committee reviews the materials and recommendations developed by the Executive Compensation group within the Company. Ultimately, the Compensation Committee determines all elements of CEO and non-CEO executive officer compensation. Generally, the Compensation Committee reviews its decisions with the Board of Directors to ensure alignment.
TheFrom time to time, management may recommend that the Compensation Committee establishesadjust executive officer compensation for various reasons, such as changes in executive officer responsibilities or based on information regarding competitive benchmarking of compensation practices. The CEO provides his perspective on each executive officer’s individual performance for the Company’s compensation philosophyyear as part of our annual performance review and strategy and discharges the board of directors’ responsibilities relating to the compensation of executive officers. succession planning process.
When making individual compensation decisions for each of the executives named in the Summary Compensation Table, who we refer to as the Named Executive Officers, the Compensation Committee takes many factors into account including the officer’s experience, responsibilities, management abilities, job performance and the Company’s performance as a whole and sets compensation based on that evaluation in conjunction with reviewinga review of market-based compensation elements. These factors are considered by the Compensation Committee in a subjective manner without any specific formula or weighting. Compensation Committee members serve until their successor is elected and qualified. Under its charter, the Compensation Committee must consist of at least three members.
Compensation Consultant
For fiscal year 2010, we retained an advisor on compensation matters, Aon Radford Consulting, on a project by project basis. In addition, from time to time the Compensation Committee received support from compensation advisors at each of Silver Lake and TPG.
Role of Management
From time to time, management may recommend that the Compensation Committee adjust executive officer compensation for various reasons, such as changes in executive officer responsibilities or based on information
regarding competitive benchmarking of compensation practices. The CEO provides his perspective on each executive officer’s individual performance for the year as part of our annual performance review and succession planning process.
Benchmarking and Competitive Analysis
For fiscal year 2010, we used benchmarking information to align the executive officers’ compensation with a competitive compensation structure, including national surveys that cover a broad group of companies in a variety of industries. Additionally, specific compensation detail was reviewed for benchmarking purposes regarding a number of companies, including the following, or the Peer Group:
|
|
|
Companies were selected to be in the Peer Group based upon factors including, but not limited to, industry (focusing on technology, software and services companies) and revenue. During fiscal year 2010, management and the Compensation Committee reviewed and agreed to modify the Peer Group for the purposes of maintaining a competitive position in the market and to ensure that the Peer Group included companies of similar size in terms of annual revenue and other financial measures as well as number of employees. As a result of the analysis and changes, the following companies were added to the Peer Group: Agilent Technologies, Inc., NetApp, Inc., Xerox Corporation, and the following companies were removed from the Peer Group: Tellabs Inc and JDS Uniphase Corporation.
With respect to each of the following, we strive to be near the median of compensation for executive officers of the Peer Group who hold positions similar to those of the Company’s executive officers:
base salaries;
total target cash compensation (consisting of base salaries plus annual cash bonuses); and
total direct compensation (consisting of total target cash compensation plus equity awards).
We also monitor compensation policies and practices of our competitors who, because of their revenues or other factors, do not meet the criteria to be included within the Peer Group, but with whom we compete in the market for talented employees.
Reviewing Compensation Decisions
Following the conclusion of each fiscal year, the Compensation Committee reviews the individual objectives and performance of the CEO and the Company’s executive officers, including the Named Executive Officers. The Compensation Committee then reviews each executive officer’s total compensation package, including, but not limited to, base salary, short-term incentive awards, long-term incentive awards, perquisites,
retirement and other benefits. Following the reviews of performance and compensation arrangements, the Compensation Committee sets the compensation for each of those individuals for the following fiscal year. The Compensation Committee generally reviews its decisions with the board of directors to ensure that there is alignment regarding the Compensation Committees’ evaluations and compensation actions, if any.
Fiscal Year 2010 Analysis
During fiscal year 2010, the Compensation Committee actively reviewed executive officer compensation and made adjustments based upon a number of different factors and for a variety of reasons, including with respect to hiring and retaining talent. For example, in October 2010, the Compensation Committee approved recognition awards and stock option retention awards for certain employees, including certain of the Named Executive Officers, following the execution by Avaya Inc. of agreements to acquire NES. In November 2009, the Compensation Committee approved changes to the compensation packages for certain of the Named Executive Officers following a competitive benchmarking exercise. Also in that month, the Compensation Committee approved a cash bonus program for certain employees, including certain of the Named Executive Officers, to retain those individuals following the acquisition of NES and to facilitate the successful integration of that business. In May 2010, the Compensation Committee approved compensation changes following a realignment of certain executive officer positions and accountabilities. Each of these actions is described in greater detail below and in the accompanying tables, including the Summary Compensation Table.
Elements of Executive Officer Compensation
We rely upon a mix of compensation elements, including salary, short-term and long-term incentives and other compensation vehicles. The Compensation Committee recognizes that decisions regarding any one element of compensation may impact how the Company relies upon or makes use of another element. As a result, the Compensation Committee does not review each element in isolation and instead reviews them in total when making compensation decisions, without any particular weighting. In addition, prior to this offering, wethe Compensation Committee considered the Company’s status as a privately-held entity when making compensation decisions.
Benchmarking and Competitive Analysis
For fiscal 2012, we evaluated each executive officer’s compensation, including the CEO, using market and Peer Group data provided by Pearl Meyer. The market data includes national surveys that cover a broad group of companies in a variety of industries. The Peer Group is selected based on factors including, but not limited to, industry, with specific focus on technology and software companies, and revenue. The Peer Group for fiscal 2012 was:
• Adobe Systems Incorporated • Broadcom Corporation • DST Systems, Inc. • Intuit Inc. • NetApp, Inc. • Qualcomm Incorporated | • Agilent Technologies, Inc. • CA, Inc. • EMC Corporation • Juniper Networks Inc. • NCR Corporation • Symantec Corporation | • Anixter International Inc. • Harris Corporation • Level 3 Communications, Inc. • Pitney Bowes Inc. • Unisys Corporation • Xerox Corporation |
We also monitor compensation policies and practices of our competitors who, because of their revenues or other factors, do not meet the criteria to be included within the Peer Group, but with whom we compete in the market for talented employees. These competitors include Brocade, Cisco, Dell, HP, IBM and Microsoft.
Generally, we benchmark our executive officers’ compensation against the market median for base salary, target bonus opportunity, annual long-term incentive value and total direct compensation (consisting of base salary, target bonus opportunity, long-term cash and equity awards).
Fiscal 2012 Analysis
During fiscal 2012, when making individual compensation decisions for each of the Named Executive Officers, the Compensation Committee made adjustments based upon a number of different factors. For example,
in December 2011, the Compensation Committee approved changes to the compensation packages for executive officers of the Company, including certain of the Named Executive Officers, following a competitive benchmarking exercise. Also in that month, the Compensation Committee approved the 2012 Sales Incentive Program for certain employees, including certain of the Named Executive Officers, designed to continue momentum in quarterly revenue growth in fiscal 2012. This program is described in more detail in the section titled “2012 Sales Incentive Program.” Each of these actions is described in greater detail below and in the accompanying tables, including, where applicable, the Summary Compensation Table.
Elements of Executive Officer Compensation
Generally, we rely upon a mix of compensation elements, including salary, short-term and long-term incentives. Because neither Avaya Holdings Corp. nor Avaya Inc. had equity that was publicly traded prior to this offering, at times we have utilized direct cash compensation to a greater extent than, or in lieu of, equity awards to attract and retain employees and to drive incentive-based outcomes. Following the completion of this offering, the Compensation Committee expects to assess the mix of cash compensation and equity awards given to our executive officers compared to external and Peer Group benchmark practices to determine if changes are advisable.
The following highlights the elements of the Company’s compensation program for executive officers, including the Named Executive Officers.
Base Salaries
Base salaries are designed to compensate individuals for their current contributions to the Company as reflected in their day-to-day performance. Base salaries are intended to be competitive relative to similar positions at companies of comparable size in our and similar industries. The Company structures base salaries to help attract, motivate and retain employees with a broad, proven track record of performance. Base salaries are reviewed annually by the Compensation Committee.Committee and are determined in part by the ongoing need to attract and retain executive talent. Consideration of salary adjustments, if any, generally is based on competitive market and peer group data collected regarding the Peer Group and individual performance of the executive officers in question.performance. During fiscal year 2010,2012, the base salaries for Messrs. Kennedy, Massetti, BaratzHackney, Mitchell and ManganelloFormant remained unchanged at $1,250,000, $550,000, $600,000$650,000, $500,000 and $350,000,$500,000, respectively. In consideration of individual performance leading up to and during fiscal year 2010,2012, the Compensation Committee adjusted the base salary for Mr. Chirico andMassetti from $563,750 to $585,000, effective on January 1, 2012. In August 2012, Mr. HackneyMassetti ceased serving as it believed those adjustments were warranted given their respective positions and increased responsibilities withinChief Financial Officer of the Company. Effective on July 1, 2010, Mr. Chirico received a base salary adjustment from $600,000 to $625,000 inCompany, though he remained on-roll following the end of the fiscal year. In connection with his being named Executive Vice President, Business Operations and Mr. Hackney received achange in roles, his base salary adjustment from $600,000was reduced effective September 21, 2012 to $650,000 in connection withan amount to cover only the cost of his being named Senior Vice President, Global Sales and Marketing and President, Field Operations.
Short-Term Incentives
Annual Non-Equity Incentive Plan Cash Bonus Program
The Avaya Inc. Short Term Incentive Plan, or STIP, is Avaya’s annual cash bonus program thatplan. The plan is designed to reward employees, including the Named Executive Officers, for their contributions to Avaya’s business results. Actual awards are directly determined by the achievement of objectives that are short-term in nature. The STIP provides anCompany’s performance against specific annual financial targets and further adjusted based on individual contribution level, Therefore, the opportunity for eligible employees to receive cash bonuses based on the combination of corporate performance and individual performance. The opportunity for a more significant awardawards increases when both the Company and the employee achieve higher levels of performance.
At the beginning of each fiscal year, the Compensation Committee establishes corporate financial objectivesthresholds that must be met before bonuses will be considered underto provide funding to the STIP.plan. The aggregate amount of cash available for awards under the STIP varies depending on how the Company performs against those financial objectives, as follows:
objectives. For each additional dollar achieved above a given threshold, a portion of that dollar is allocated, based upon an established formula, to increase the funding to the plan and, correspondingly, increase the aggregate amount of cash available for awards under the STIP. If corporate performance is less than the minimum thresholds established by the
Compensation Committee, then no STIP bonuses arefunding is available unless the Compensation Committee exercises its discretion to modify the thresholds or to allocate funds for employee awards. For example, the Compensation Committee may choose to exercise its discretion in the event that an unforeseen one-time item impacts financial performance during the fiscal year.
If corporate performance is above the minimum thresholds established by the Compensation Committee, then STIP bonuses may be paid to eligible employees at the end of that fiscal year. Starting with the minimum thresholds, the aggregate cash pool available to fund employee awards will increase based upon an established formula. There is no cap on the amounts that may be used to fund employee awards under the established formula.Corporate Performance Targets for Fiscal 2012
For fiscal year 2010,2012, the Compensation Committee determined that corporate performance would be measured based upon year-over-year growth of each of “Management EBITDA” and total revenue, with each having an equal weighting. “Management EBITDA” isagainst (i) Adjusted EBITDA ason a pre-STIP basis (i.e., before taking into account the payment of STIP), or Pre-STIP Adjusted EBITDA, and (ii) revenue targets, with (i) and (ii) each weighted 50% and 50%, respectively. Adjusted EBITDA is defined in “Management’s Discussion and Analysis of Financial Condition and Results of Operations,Operations.” of this prospectus,
The plan provided an eligible employee with certain adjustments. Unlikethe opportunity to receive a mid-year payout based on Pre-STIP Adjusted EBITDA to determine Management EBITDA, the Company does not adjust for prior service cost calculated under ASC 712, the Company does not deduct income from unrestricted subsidiaries, net of dividends received, the Company does not adjust for purchase accounting impacts related to the Mergerperformance for the recognitionfirst six months of deferredthe fiscal year, subject to a cap and individual contribution levels. The year-end payment opportunity for an eligible employee was measured based on both Pre-STIP Adjusted EBTIDA results and total revenue and reductionresults for deferred costs and business partner commissions written off in purchase accounting, the Company does deduct the full expense relatedfiscal year, subject to pension and other post-employment benefit obligations, the Company does deduct software development costs and net income attributable to non-controlling interests are excluded from the calculation.individual contribution levels. In addition, the Compensation Committee determined that the size of the cash pool available for STIP awards would beat the end of the fiscal year was subject to adjustment based uponon (i) customer satisfaction results as determined under a net promoter score (NPS) compiled with the help of a third party vendor. If customer satisfaction for fiscal year 2010 was less than 3.70 (as measured on a 5 point scale), thenvendor, in which event the cash pool was subjectcould have been increased or decreased by an amount not to a reductionexceed 5% and (ii) measurement of 10%. If customer satisfaction was equal to or greater than 3.70the quality of the Company’s products and less than or equal to 3.77, then no adjustment would be made toservices, based on an assessment by the cash pool. If customer satisfaction was greater than 3.77, thenCompensation Committee and the CEO, in which event the cash pool was subjectcould be decreased by an amount not to an increase of 10%exceed 5%.
At the beginning of the fiscal year, the Management EBITDA target was set at 17.7% year over year growth, or $139 million (calculated assuming 100% pay-out of STIP). The total revenue target was set at 2.0% year over year growth, or $82 million.Individual Contribution Level
In May 2010, the Compensation Committee, due toevent funding for the impactSTIP is attained in any fiscal year, then the size of the acquisition of NES on the original Plan targets, approved modified STIP targets based on financial performance in the second half of the year. The targeted STIP payout wasan individual employee’s award is determined based upon his or her contribution level relative to peers within the achievementCompany. Maximum and minimum ranges of new Management EBITDAawards are set based upon whether an employee is a low-, successful- or high-relative contributor. Leadership behaviors, cross-functional effectiveness and total revenue targetsattainment of $522 million (calculated assuming a STIP payout of 100% for the fiscal year) and $2,770 million, respectively, for the second half of fiscal year 2010 only. The Compensation Committee retained the customer satisfaction modifier concept that had been established at the beginning of the fiscal year.
The Company believes that the Management EBITDA and total revenue metrics best represented how it measured short-term performance during fiscal year 2010. In addition, the Company believes that the use of the customer satisfaction multiplier helpedindividual objectives are considered in determining individual contribution level relative to motivate employees to maintain and improve customer relationships while driving corporate performance.peers.
The extent to which the Company achieves its STIP targets is referred to as the “Avaya Performance Factor.” For fiscal year 2010, the Avaya Performance Factor was 2.74%. The Company failed to achieve the threshold level set for the Management EBITDA but did exceed its revenue threshold by $32 million. There was no adjustment to the cash pool available for awards based on customer satisfaction results for fiscal year 2010.Fiscal 2012 Results
The assessment of an executive officer’s individual performance includes consideration of that executive officer’s leadership qualities and achievement of stated objectives. Award targets for executive officers are set as a percentage of their base salaries and are based upon their respective roles and responsibilities and competitive market data. For fiscal year 2010, the annual target awards2012, actual financial results did not provide any funding for Messrs. Kennedy, Massettimid-year or year-end payouts, other than approximately $1,200,000 in payments to certain non-US employees and Manganello were unchanged at 100%, 85% and 50% of base salaries, respectively. During fiscal year 2010, the Compensation Committee adjusted the STIP target awards for each of Messrs. Chirico and Hackney from 75% to 85%U.S. represented employees in connection with their base salary increases as described above. These adjustments were made in recognition of their increased responsibilities within the Companycertain labor agreements. The first half Pre-STIP Adjusted EBITDA threshold was $522,000,000 and to align theiractual first half Pre-STIP Adjusted EBTIDA was $480,000,000. The annual target incentive awards with competitive benchmarks. Dr. BaratzPre-STIP Adjusted EBITDA threshold was not eligible to participate in the Company’s STIP bonus program (see “—Additional Cash Payments” below$1,156,000,000 and actual Pre-STIP Adjusted EBITDA for more information).
An individual employee’sfiscal 2012 was $973,000,000. The annual revenue threshold was $5,705,000,000 and actual STIP award is determined by multiplying the Avaya Performance Factor by the employee’s STIP target percentage (based on job level) and byfiscal 2012 revenue was $5,171,000,000. As a factor which is below, at or greater than 100% that reflects the employee’s individual performance. Adjustments may be made at the discretion of the employee’s supervisor, or in the case of the Named Executive Officers, at the discretion of the Compensation Committee. Factors influencing adjustment decisions include, but are not limited to, the size of the aggregate pool of funds available for STIP awards, individual employee performance, the desire to retain key employees and the portion of the year during which the employee was employed by the Company. For fiscal year 2010, as indicated in the Summary Compensation Tableresult, no executive officers received payments under the heading “Non-Equity Incentive Plan Compensation,” based on the Avaya Performance Factor, each of Messrs. Kennedy, Massetti, Hackney, Chirico and Manganello received $44,363, $12,635, $11,956, $14,546 and $5,275, respectively, under the STIP.STIP for fiscal 2012.
Additional Cash Payments
Cash awards are occasionally made to employees for a variety of reasons, including, but not limited to, immediate retention purposes, pursuant to offers of employment and in recognition of significant individual contributions for specific projects or performance during the fiscal year. The Compensation Committee or the board of directors must approve all cash awards made to each executive officer of the Company, including the Named Executive Officers.
During fiscal 2010, the Company adopted an employee cash bonus program in connection with the NES acquisition designed to help retain certain employees, including certain of the Named Executive Officers, during
the critical period required to integrate that business with the Company. Of the Named Executive Officers, Messrs. Massetti, Formant and Baratz received awards of $200,000, $200,000 and $150,000, respectively. Each of the three Named Executive Officers received the second of two equal installments under this program during fiscal 2012.
In January 2009 the Compensation Committee reduced severance benefits payable to certain executive officers upon an involuntary separation from the Company. ToCompany and, to compensate them for the change in benefits, certain executive officers received cash awards during the fiscal year. However, none of the Named Executive Officers was among those that received any of those payments. Also during fiscal year 2010, the Compensation Committee approved recognition awards for employees of the Company, including certain officers of the Company, in relation to the Company’s performance specific to the fourth quarter of fiscal year 2009. Of the Named Executive Officers, only Messrs. Chirico and Manganello received awards of $200,000 and $150,000, respectively, under this program.
During fiscal year 2009, the Compensation Committee approved twoa cash retention awards for Mr. Chirico in conjunction with his being named Chief Restructure Officer, the position he held before being named Executive Vice President, Business Operations. The firstaward. In this regard, a cash award which is for $2,700,000, is payable in 2
installments of $1,000,000 and $1,700,000, the first of which he received in fiscal year 2009 and the second of which he received in fiscal year 2011. The second award, which is for $900,000 was paid in equal installments during a three-fiscal-year period beginning in fiscal year 2009. During fiscal year 2010,made to Mr. Chirico received a total of $300,000 pursuant to the second award.
During fiscal year 2010, Dr. Baratz earned a bonus of $300,000 in lieu of his participation in the Company’s STIP program.
During fiscal year 2010, Avaya Inc. adopted an employee cash bonus program in connection with the NES acquisition designed to help retain certain employees, including the Named Executive Officers, during the critical period required to integrateFormant that business with the Company. Of the Named Executive Officers, Messrs. Massetti, Chirico, Baratz and Manganello received awards of $200,000, $200,000, $150,000 and $100,000, respectively. Each of these awards is scheduled to be paidwas payable in equal installments during fiscal years2009, fiscal 2011 and 2012 and is not included in the Summary Compensation Table below for payments in fiscal year 2010.
During fiscal year 2010, the Company approved a program to reduce the total carry-over vacation liability assumed in the NES acquisition by allowing former employees of Nortel to sell their carry-over vacation days at 50 cents per dollar of accrued vacation time, where legally permitted. Pursuant to this program, Mr. Hackney elected to receive a cash payment of $43,847, in return for his accrued carry-over vacation.
Finally, during fiscal year 2010, the Company allowed employees the option of choosing to monetize two unused vacation days in return for a payment equivalent to the value of those days in their base salary. Under this program, Dr. Baratz chose to participate receiving a payment of $4,616.2012.
For additional information regarding all of these awards, please see the Summary Compensation Table.
Long-Term Incentives
FollowingWe have adopted the consummation of the Merger, our shareholders approvedAmended and Restated 2007 Equity Incentive Plan, or the 2007 Plan, and ourthe Long-Term Incentive Cash Bonus Plan, or the Cash Plan. These plans are intended to advance the interests of the Company and its affiliates by providing for the grant to select individuals, including the Named Executive Officers, of long-term equity and cash incentive awards. These equity and cash awards are designed to help achieve long-term goals and objectives and, in the process, align management interests with those of shareholders.
As of September 30, 2010,March 31, 2013, 49,848,157 shares of our common stock were authorized for issuance in connection with awards granted pursuant to the 2007 Plan, in addition to 2,924,125 shares available for issuance in satisfaction of Continuation Options and Continuation Units, or together the Continuation Awards. The number of shares available for issuance as of September 30, 2010 includes 4,500,000 shares that were authorized for issuance under a November 2009 amendment to the 2007 Plan following the announcement of the NES acquisition. None of the Named Executive Officers holds any Continuation Awards. Also, as of September 30, 2010,March 31, 2013, we were authorized to issue up to $60,000,000 in aggregated awards under the Cash Plan. None of the Named Executive Officers holds any awards under the Cash Plan.
The sizes ofIn alignment with our overall compensation philosophy, equity awards are structureddetermined by balancing the interests of shareholders, in terms of the impact of dilution, with the need to align the interests of management with those of shareholders. An objective is to provide long-term incentive compensation that is competitive with that offered by peer companies. Individual grants of equity awards are based on various factors, including a review ofAvaya’s private equity ownership, Peer Group and other competitive market data, demonstrated sustainedindividual performance and each individual’s demonstrated abilitycontribution level. Avaya does not currently provide executive officers or employees with annual grants, such that equity awards for newly hired executive officers and employees are generally intended to contribute to the Company’s future success. The Company’s ability and desire to retain key talent is also considered.provide grant values that represent a longer-term investment. With the exception of considerations regarding dilution, similar factors are used when determining long-term cash incentive awards.
The majority of long-term incentive awards issued during fiscal year 2010 were issued to Avaya employees on November 17, 2009 pursuant to an offer by Avaya Holdings Corp. to its outstanding stock option holders to
exchange their existing stock options with an exercise price equal to or greater than $3.80 per share for new stock options with an exercise price of $3.00 per share in a one-for-one option exchange, as described in greater detail below under “Stock Option Awards—Fiscal year 2010 Awards.”
The stock option exchange was designed to provide an incentive for employees to continue to drive Company performance and to help retain those employees. Additional long-termLong-term incentive awards were made during fiscal year 20102012 in connection with new-hire employment offers, for purposes of promotion and retention of existing employees and in recognition of significant individual contributions for specific projects or performance during the fiscal year.
To the extent any of the Named Executive Officers received grants of long-term incentive awards during fiscal year 2010,2012, they are included in the “Grants of Plan-Based Awards” table below.
Since our common stock is not publicly traded, the terms of the 2007 Plan require that our board of directors or a committee of the board, as plan administrator, determine the fair market value of a share of our common stock. The determination is based in part upon the recommendation of our CEO and an independent third-party appraisal that is obtained at least annually and reassessed by the plan administrator at least semi-annually. For fiscal 2010,2012, the Compensation Committee obtained an independent valuation and considered that valuation as well as other factors when setting the exercise price of stock option awards granted throughout the year. See “Management’s Discussion and Analysis—Analysis-Use of Estimates and Critical Accounting Policies—Share-basedPolicies-Share-based Compensation.”
Section 162(m) disallows a tax deduction for any publicly held corporation for individual compensation exceeding $1 million in any taxable year for a company’s named executive officers, other than its chief financial officer, unless compensation is performance-based. As we are not currently publicly traded, our Compensation Committee has not previously taken the deductibility limit imposed by Section 162(m) into consideration in setting compensation. Following this offering, at such times as we are subject to the deduction limitations of Section 162(m), we expect that our Compensation Committee will seek to qualify the variable compensation paid to our Named Executive Officers for an exemption from the deductibility limits of Section 162(m). However, our Compensation Committee may, in its judgment, authorize compensation payments that do not comply with the exemptions in Section 162(m) when it believes that such payments are appropriate to attract and retain executive talent.
Our Compensation Committee regularly considers the accounting implications of significant compensation decisions, especially in connection with decisions that relate to our equity incentive award plans and programs. As accounting standards change, we may revise certain programs to appropriately align accounting expenses of our equity awards with our overall executive compensation philosophy and objectives.
Stock Option Awards
Key employees, directors, and consultants of the Company may be eligible to receive stock options under the 2007 Plan. Each stock option, when vested and exercised, entitles the holder to receive one share of our common stock, subject to certain restrictions on transfer and sale as provided for in the 2007 Plan and the related award agreements.
Fiscal year 2010 Awards
Stock Option Exchange Program
During fiscal year 2010, we extended an offer to all employees who held stock options with an exercise price equal to $3.80 or greater to exchange those stock options for new stock options. These “replacement” stock options were awarded on November 17, 2009 following the completion of the exchange offer, have an exercise price of $3.00 per share, which was the fair market value of a share of our common stock on the date of grant, and have new vesting provisions.
Each replacement stock option grant was issued in exchange for a grant that was comprised of time-based stock options, market-based multiple-of-money, or MoM, stock options and performance-based “EBITDA” stock options, weighted 65%, 17.5% and 17.5%, respectively, of the total number of shares subject to each award. The time-based stock options that were replaced generally vested 25% on the first anniversary of the date of grant, and in equal installments quarterly thereafter over the following three-year period for a total of a four-year vesting period. The MoM stock options that were replaced vested 50% upon the achievement of a multiple of 2.0 times, and 100% upon the achievement of a multiple of 3.0 times or greater. The MoM is based on a return on the initial amount invested in us by the Sponsors, as defined in the 2007 Plan. EBITDA stock options that were replaced vested in equal installments each year over a four-year period assuming annual Management EBITDA targets were met for fiscal years 2009, 2010, 2011 and 2012. In the event that the Company’s stock is traded on a national securities exchange following October 2011, the MoM stock options that were replaced vested 50% upon the achievement for a full quarter of both (i) a multiple of 1.0 times and (ii) the combination of the average trading price together with cash proceeds received prior to the determination equaled or exceeded a multiple of
2.0 times. The remaining 50% vested upon the achieved of both (i) a multiple of 1.5 times and (ii) the combination of the average trading price together with cash proceeds received prior to the determination equaled or exceeded a multiple of 3.0 times.
Each new replacement stock option grant is comprised of time-based stock options and market-based MoM stock options, weighted 65% and 35%, respectively, of the total number of shares subject to each award. The replacement time-based stock options vest in equal annual installments on the first, second, third and fourth anniversaries of the date of grant. The replacement MoM stock options vest 50% upon the achievement of a multiple of 1.6 times, and 100% upon the achievement of a multiple of 2.0 times or greater, of the initial amount invested in us by the Sponsors as defined in the 2007 Plan. Given the difficulty with forecasting performance several years into the future in the current economic environment, EBITDA stock options were not offered in replacement grants under the exchange program. In the event that the Company’s stock is traded on a national securities exchange following October 2011, the replacement MoM stock options vest 50% upon the achievement for a full quarter of both (i) a multiple of 0.8 times and (ii) the combination of the average trading price together with cash proceeds received prior to the determination equaled or exceeded a multiple of 1.6 times. The remaining 50% vested upon the achievement of both (i) a multiple of 1.0 times and (ii) the combination of the average trading price together with cash proceeds received prior to the determination equaling or exceeding a multiple of 2.0 times.
With the exception of Messrs. Massetti and Hackney, each of whom had no eligible options to exchange, all of the Named Executive Officers accepted the exchange offer with respect to all of their qualifying awards. As a result, Messrs. Kennedy, Chirico, Baratz and Manganello exchanged 5,000,000, 1,250,000, 1,100,000 and 300,000 stock options, respectively, for an equal number of replacement stock options having the new weighting of time-based and MoM stock options.
Any awards of stock options which were not tendered for exchange during the eligible exchange period remained unchanged in their terms and conditions. These awards continue to maintain their original exercise price, their original vesting terms, and their original 10-year term.
Acquisition Stock Option Awards
In November 2009, a special award of stock options was made to key employees, including the Named Executive Officers, for retention purposes following the NES acquisition. Generally, employees receiving an award of stock options under this one-time grant received stock options that are time-based in nature. However, awards of options under this retention program made to executive officers of the Company, including the Named Executive Officers, were 65% time-based and 35% MoM based. All time-based stock options granted under this program vested 20% on the date which Avaya closed the acquisition of NES, which was December 18, 2009; an additional 20% of the shares granted under each time-based award will vest annually thereafter on the anniversary of the NES acquisition date over the following four years. All time based awards granted in connection with this program will become fully vested on the fourth anniversary of the date the acquisition of NES was completed, or December 18, 2013.
Other Stock Option2012 Awards
During fiscal year 2010,2012, awards of time-based and market based multiple of money, or MoM, stock options were made to Company employees including theexecutive officers and Named Executive Officers. Each grant of stock options generally included both65% time-based and MoM-based, weighted as 65%vesting and 35%, respectively, of the total number of shares subject to each grant. MoM-based vesting awards. The time-based portions of the awardsstock options vest 25% on the first anniversary of the grant date and thereafter vest in equal installments annually over the following three-year period, becoming fully vested four years after the grant date. The MoM stock options will vest 50% upon the achievement of a multiple of 1.6 times, and 100% upon the achievement of a multiple of 2.0 times or greater, the initial amount invested in us by the Sponsors (defined in the award agreements to be $1.5 billion), as defined in the 2007 Plan.
During fiscal year 2010, each of Messrs. Massetti and Hackney received stock option awards in connection with their offers of employment having weightings and vesting periods as set forth in the immediately preceding paragraph. In addition, Mr. Hackney received a stock option award in connection with his appointment by the Company as Senior Vice President, Global Sales and Marketing and President, Field Operations. The details of those awards are set forth in the “Grants of Plan-Based Awards” table.
Except as otherwise noted, all of the stock option grants issued during fiscal year 2010, including those under the stock option exchange offer program, conform to the standard vesting provisions and were issued using the 65%-35% weightings of time-based and MoM-based awards, respectively. The Company believes that, for fiscal year 2010,2012, this mix provided the appropriate balance between awards certain to vest over time and awards that would vest based on corporate performance. However, the 2007 Plan does not restrict award grants to that formula.formula and the Company may grant awards with different vesting provisions in the future. All stock options awarded under the 2007 Plan expire ten years from the date of grant or upon cessation of employment, in which event there are limited exercise provisions allotted toassociated with vested stock options.
During fiscal 2012, Mr. Mitchell received a retention-based stock option award. The details of this award are set forth in the “Grants of Plan-Based Awards” table.
During fiscal 2013, the Company conducted a stock option exchange offer in which 2007 Plan participants, including the Named Executive Officers, could exchange performance based stock options, including MoM stock options, for restricted stock units. See “—Fiscal 2013 Actions and Changes to Compensation Approach” for more information.
Restricted Stock Unit Awards
Key employees, directors and consultants of the Company may be eligible to receive RSUs under the 2007 Plan. Each restricted stock unit, when vested, entitles the holder to receive one share of our common stock, subject to certain restrictions on their transfer and sale as provided for in the 2007 Plan and the related
award agreements. RSUs vest over time according to the provisions set forth in their individual award agreements. As reflected in the “Grants of Plan-Based Awards” table, during fiscal 2012, Messrs. Hackney, Mitchell and Formant received awards of 56,818, 45,455 and 45,455, respectively, under the 2012 Sales Incentive Program, which is described in more detail in the section titled “2012 Sales Incentive Program”.
2011-2013 Performance Recognition Plan
On December 22, 2010, the Compensation Committee approved a plan to provide cash incentives to certain executive officers, including its Named Executive Officers, to help promote the long-term value of the Company, referred to as the Avaya Inc. Executive Committee 2011-2013 Performance Recognition Plan, or the EC LTIP. The Compensation Committee currently serves as that plan’s administrator. On May 11, 2011, the Compensation Committee approved certain amendments to the plan as well as the final plan document and form of award agreement. The plan was subsequently amended on December 6, 2012. See “—Fiscal 2013 Actions and Changes to Compensation Approach” for more information.
Under the plan as in effect prior to December 6, 2012, each award under the EC LTIP consists of the grant to a plan participant of the conditional right to receive a dollar amount credited to an account for such participant based on the Company’s performance during fiscal years 2011, 2012 and 2013. The amount credited to a participant’s account for each of the respective fiscal years will be determined based on the Company’s actual Management EBITDA (as defined in the Company’s Annual Report on Form 10-K for the fiscal year 2010 Mr. Massetti receivedended September 30, 2010) excluding the impact of payments under the STIP, or Pre-STIP EBITDA, compared to performance thresholds and targets established by the plan administrator for the applicable fiscal year, subject to a multiplier for each threshold and target. The amount credited to a participant’s account for a fiscal year will equal his or her targeted award multiplied by the multiplier determined based on the Company’s actual performance. Attainment of Pre-STIP EBITDA between the threshold and target levels will result in a pro rata adjustment (based on straight line interpolation) to the applicable multipliers. For fiscal 2012, the threshold Pre-STIP EBITDA was established at $1,017 million and the target Pre-STIP EBITDA was established at $1,221 million. Achievement of corporate performance equal to the applicable threshold and target would result in multipliers of 75% and 100%, respectively, of the award amounts identified for each of the Named Executive Officers below.
If the Pre-STIP EBITDA attained for any fiscal year is less than the applicable threshold, then no amount will be credited to a participant’s account for that fiscal year under the terms of the plan. For any fiscal year where the actual Pre-STIP EBITDA equals or exceeds the target for such year, the plan administrator may, in its sole discretion, credit an additional amount to one or more participant’s accounts based on any factors it determines are appropriate, including, but not limited to, individual performance and contribution to the business results. In no event, however, will the amount credited to a participant’s account for any fiscal year exceed 160 percent of that participant’s targeted award.
If during the one-year period following a change of control transaction involving the Company, a participant in the plan is involuntarily terminated other than for “cause” or voluntarily terminates for “good reason” (as each such term is defined in the EC LTIP plan document), a pro rata portion of the targeted award for such fiscal year shall be credited to the participant’s account for that year.
In addition, a participant will (i) forfeit any or all rights with respect to the award or to amounts previously paid under an award and (ii) be required to pay back any such previously paid amounts, if the participant breaches any nondisclosure, non-competition, non-solicitation or other undertakings set forth in the award agreement.
The table below reflects the threshold and target award established for the Named Executive Officers for fiscal 2012. The earned amounts are included in the Summary Compensation Table below, under the heading “Non-Equity Incentive Plan Comp.”
Named Executive Officer | FY12 Opportunity @ Threshold | FY12 Opportunity @ Target | ||||||
Kevin J. Kennedy | $ | 937,500 | $ | 1,250,000 | ||||
Anthony J. Massetti | $ | 422,813 | $ | 563,750 | ||||
J. Joel Hackney, Jr. | $ | 487,500 | $ | 650,000 | ||||
Thomas G. Mitchell | $ | 375,000 | $ | 500,000 | ||||
Christopher M. Formant | $ | 375,000 | $ | 500,000 | ||||
Fiscal 2012 results for Pre-STIP EBITDA of $973 million did not meet the annual threshold under the EC LTIP established by the Compensation Committee and therefore, no amounts were awarded for fiscal 2012 to any of the Named Executive Officers.
Prior to December 6, 2012, the dollar amount of all awards that may be issued under the EC LTIP at target payout was $25 million and could not exceed $40 million in the aggregate for all participants.
2012 Sales Incentive Program
On December 5, 2011, the Compensation Committee approved a plan to provide incentives to certain executive officers of the Company, including Messrs. Hackney, Mitchell and Formant, to continue to grow revenue in fiscal 2012 (the “2012 Sales Incentive Program”). Under the terms of the 2012 Sales Incentive Program, each program participant was granted the conditional right to receive a number of restricted stock units, or RSUs, under the 2007 Plan upon the achievement of certain revenue objectives. RSUs to be awarded under the 2012 Sales Incentive Program would be based upon the fair market value of our common stock on December 6, 2011, the date of grant, which was $4.40 per share.
The number of RSUs that a participating employee in the 2012 Sales Incentive Program had the right to receive (subject to vesting requirements and the other terms and conditions of the applicable award agreement) was to be determined based upon achievement of both of the following: (i) revenue targets for specific sales territories/divisions/product houses (each, a “Performance Gateway”) and (ii) an overall revenue target for the Company. For each of Messrs. Hackney, Mitchell and Formant, achievement of three of five specified Performance Gateways would result in an award of 50% of his opportunity and achievement of all five specified Performance Gateways would result in an award of 100% of his opportunity. Achievement of targets under the 2012 Sales Incentive Program was measured twice in fiscal 2012, with a participating employee being able to earn half of his total opportunity based on results for the first half of fiscal 2012 and the second half of his total opportunity based on results for the second half of fiscal 2012. All RSU awards granted under the 2012 Sales Incentive Program would vest on December 6, 2013 for each program participant who achieved the performance objectives. Messrs. Hackney, Mitchell and Formant were awarded the opportunity to receive up to 56,818, 45,455 and 45,455 RSUs, in conjunction with his offer of employment (see “Employment, Change in Controlrespectively, under the 2012 Sales Incentive Program.
The applicable Performance Gateways and Separation Agreements—Mr. Massetti’s Employment Agreement” for additional information),revenue targets were not achieved, and Mr. Chirico and Mr. Hackney received a grant oftherefore, no RSUs in recognition of their performance results and increased responsibilities within the Company, as discussed above.vested.
Long-Term Cash Bonus Awards
Key employees directors, and consultants of the Company may be eligible to receive an award under ourthe Long-Term Incentive Cash Bonus Plan. Under this plan, each award will become payable upon the achievement of defined returns on the Sponsors’ initial investment in us. Initially, awards granted under this plan were payable in full upon the achievement of a multiple of 2.0 times or greater of the initial amount invested by the Sponsors as defined in the plan. Effective November 1, 2009, this plan was amended to modify the vesting provisions such that awards are payable in full upon the achievement of a multiple of 1.6 times or greater of the initial amount invested in us by the Sponsors as defined in the plan. The amendment decreased the target from a multipleNone of 2.0 times or greater of the initial amount invested in us by the Sponsors because the Company and the Compensation Committee concluded that the program lacked the intended retentive nature of awards granted in light of the changing economic climate. Executives of the Company at the level of Vice President or higher, including the Named Executive Officers generally do not receive awardshas received an award under this plan.
Long-Term Incentive Award Agreement Provisions
All long-term equity and cash incentive awards are subject to the terms and conditions of the award agreements and the plans under which they were issued. In addition to provisions regarding vesting, all awards made in fiscal year 2010,2012, including those made to the Named Executive Officers, contain provisions restricting award recipients from, among other things, disclosing proprietary Company information and, for a period of twelve months from the date of termination of employment, soliciting the Company’s customers or employees. A breach of any of the imposed restrictions will cause the underlying award to be cancelled in its entirety and any benefit already paid out prior to the Company’s notice to the award recipient of the violation shall, at the Company’s sole discretion, be required to be repaid to the Company.
In addition to the restrictions noted in the above paragraph, each long-term incentive award made to an employee at the Vice President level or above, including each of the Named Executive Officers, includes a
provision restricting the recipient from working directly or indirectly for, and from providing services in any capacity, to a material competitor of the Company for a period of twelve months following their termination of employment.
To the extent an individual acquires shares of our common stock upon exercise of a stock option or vesting of an RSU, those shares are subject to the restrictions on transfer and other provisions contained in a management stockholders’ agreement and, in the case of certain executive officers, including certain of the Named Executive Officers, a registration rights agreement. See “Certain Relationships and Related Party Transactions.”
2013 Equity Incentive Plan
Effective upon completion of this offering, our board of directors intends to adopt an incentive plan to be named the Avaya Holdings Corp. 2013 Equity Incentive Plan, or the 2013 Plan. The 2013 Plan will be in addition to the 2007 Plan. The following summary describes the material terms of the 2013 Plan but is not a complete description of all its terms. This summary is qualified in its entirety by reference to the 2013 Plan, which will be filed as an exhibit to the registration statement of which this prospectus is a part.
The 2013 Plan will be administered by the Compensation Committee, and participants will be selected from among the key employees, directors and consultants of, and advisors to, the Company or its affiliates, subject to certain limitations in the case of incentive stock options, or ISOs. The awards that can be granted under the 2013 Plan include stock options, restricted and unrestricted stock and stock units, performance awards, stock appreciation rights, other stock-based awards and cash awards. In the Compensation Committee’s discretion, an award may also provide for dividend equivalents, subject to applicable legal and tax requirements.
Subject to adjustment, the maximum number of shares of common stock that may be delivered in satisfaction of awards under the 2013 Plan will be shares. The number of shares that may be delivered under the 2013 Plan will not be reduced by shares of common stock withheld by the Company in payment of the exercise price of an award or in satisfaction of tax withholding obligations, or by shares of common stock underlying an award settled in cash or awards that expire or become unexercisable without having been exercised or are forfeited to or repurchased by the Company as a result of not having vested.
No more than shares of common stock may be issued pursuant to ISOs under the 2013 Plan. The maximum number of shares of common stock for which stock options may be granted and the maximum number of shares of common stock subject to stock appreciation rights that may be granted to any person in any calendar year will each be shares. In addition, the maximum number of shares subject to awards, other than stock options and stock appreciation rights, that may be granted to any person in any calendar year will be shares. The maximum amount payable to any person as cash awards under the 2013 Plan will be $ .
The Compensation Committee will have the authority to determine the vesting schedule applicable to each award, and to accelerate the vesting or exercisability of any award. The Compensation Committee will also determine the effect of termination of employment or service on an award.
The 2013 Plan will provide that grants of performance awards will be made subject to the achievement of “performance criteria” over a performance period, which may be one or more periods as established by the Compensation Committee. Performance criteria with respect to those awards that are intended to qualify as “performance-based compensation” for purposes of Section 162(m) of the Code will mean one or more objectively determinable measures of performance relating to any, or any combination, of the following (measured either absolutely or by reference to an index or indices or the performance of one or more companies and determined either on a consolidated basis or, as the context permits, on a divisional, subsidiary, line of business, project or geographical basis or in combinations thereof): net sales; system-wide sales; revenue; revenue growth or product or services revenue growth; operating income (before or after taxes); pre- or after-tax income or loss (before or after allocation of corporate overhead and bonus); earnings or loss per share; net income or loss (before or after taxes); adjusted operating income; adjusted net income; adjusted earnings per share; return on equity; total stockholder return; return on assets or net assets; appreciation in and/or maintenance of the price of the shares or any other publicly-traded securities of the Company; market share; gross profits; earnings or losses (including earnings or losses before taxes, before interest and taxes, or before interest, taxes, depreciation and/or amortization, and including with further adjustments as deemed appropriate by the administrator); economic value-added models or equivalent metrics; comparisons with various stock market indices; reductions in costs; cash flow or cash flow per share (before or after dividends); return on capital (including return on total capital or return on invested capital); cash flow return on investment; improvement in or attainment of expense levels or working capital levels, including cash, inventory and accounts receivable; operating margin; gross margin; gross margin percentage; adjusted gross margin, cash balance; cash margin; debt reduction; stockholders equity; operating efficiencies; customer satisfaction and/or loyalty; customer growth; employee engagement and/or satisfaction; supply chain achievements (including establishing relationships with manufacturers or suppliers of component materials and manufacturers of the Company’s products); points of distribution; co-development, co-marketing, profit sharing, joint venture or other similar arrangements; financial ratios, including those measuring liquidity, activity, profitability or leverage; cost of capital or assets under management; success in implementing financing and other capital raising transactions (including sales of the Company’s equity or debt securities; factoring transactions; sales or licenses of the Company’s assets, including its intellectual property, whether in a particular jurisdiction or territory or globally; or through partnering transactions); implementation, completion or attainment of measurable objectives with respect to research, development, manufacturing, commercialization, products or projects, production volume levels, acquisitions and divestitures; and recruiting and maintaining personnel. To the extent consistent with the requirements for satisfying the performance-based compensation exception under Section 162(m), the administrator may establish that, in the case of any award intended to qualify for such exception, one or more of the performance criteria applicable to such award will be adjusted in an objectively determinable manner to reflect events (for example, the impact of charges for restructurings, discontinued operations, mergers, acquisitions, extraordinary items, and other unusual or non-recurring items, and the cumulative effects of tax or accounting changes, each as defined by U.S. generally accepted accounting principles) occurring during the performance period that affect the applicable performance criterion or criteria.
We anticipate that, prior to the completion of the offering, the Compensation Committee, or a subcommittee, will be composed of “outside directors” as defined in Section 162(m) of the Code.
In the event of a consolidation, merger or similar transaction, a sale or transfer of all or substantially all of the Company’s assets or a dissolution or liquidation of the Company, the Compensation Committee may, among other things, provide for continuation or assumption of outstanding awards, for new grants in substitution of outstanding awards, or for the accelerated vesting or delivery of shares under awards, in each case on such terms and with such restrictions as it deems appropriate. Except as otherwise provided in an award agreement, awards not assumed will terminate upon the consummation of such corporate transaction.
In the event of certain corporate transactions that involve a change in the Company’s capital structure, the Compensation Committee will make appropriate adjustments to the maximum number of shares that may be delivered under the 2013 Plan and the individual limits included in the 2013 Plan, and will also make appropriate adjustments to the number and kind of shares of stock or securities subject to awards, the exercise prices of such awards or any other terms of awards affected by such change in the Company’s capital structure. The Compensation Committee will also make the types of adjustments described above to take into account events other than those listed above if it determines that such adjustments are appropriate to avoid distortion and preserve the value of awards.
The Compensation Committee will be able to amend the 2013 Plan or outstanding awards, or terminate the 2013 Plan as to future grants of awards, except that the Compensation Committee will not, without the participant’s consent, be able alter the terms of an award if it would affect materially and adversely a participant’s rights under the award.
Employee Stock Purchase Plan
Effective upon completion of this offering, our board of directors intends to adopt an employee stock purchase plan, or the ESPP. The purpose of the ESPP is to enable eligible employees of the Company and of certain of its subsidiaries to purchase shares of our common stock and thereby acquire an interest in the future of the Company. The ESPP will be administered by our board of directors or its delegate. The maximum aggregate number of shares of our common stock available for purchase under the ESPP will be .
Employees will be offered the option to purchase shares of our common stock during offering periods whose duration will be determined by the board. Unless the board provides otherwise, there generally will be two offering periods each year, one running for the first half of our fiscal year and the other running for the second half of our fiscal year, with the initial offering period expected to begin on . During each offering period, eligible employees will be given the option to purchase shares of our common stock at % of their fair market value on the date of exercise of the option, which will be the last day of the offering period. The board will determine procedures for eligible employees to elect to participate in the ESPP.
Participation in the ESPP will be limited to eligible employees of the Company and of those subsidiaries of the Company that our board may designate not including highly compensated employees subject to the disclosure requirements of Section 16(a) of the Exchange Act. Any employee who owns (or is deemed under statutory attribution rules to own) stock possessing 5% or more of the total combined voting power or value of all classes of stock of the Company or of any of our subsidiaries will not be permitted to participate in the ESPP. Also, any employee who is not employed by the Company or one of our subsidiaries at the start of an option period will not be permitted to participate in the ESPP for that offering period.
A participant in the ESPP will be permitted to designate an amount of up to 10% of the participant’s compensation (for these purposes, the participant’s base salary plus any sales commissions, paid by the Company to the participant during an offering period) to acquire shares of our common stock. In no event will a participant be granted an option under the ESPP that would permit the participant in any calendar year to purchase stock under the ESPP or any other employee stock purchase plan of the Company or any of our subsidiaries with a fair market value (determined as of the beginning of the relevant offering periods) of more than $25,000.
Participants may pay for the common stock purchased under the ESPP through authorization of payroll deductions, which will be accomplished by means of withholding at a whole percentage of a participant’s compensation. The board may, however, authorize other means of payment, such as a lump sum cash payment. An authorization of payroll deductions will remain in effect for subsequent offering periods unless a participant revokes or changes the authorization. A participant may cancel his or her election to participate, and may terminate any payroll deductions, at any time prior to the purchase of our common stock by written notice delivered to the Company. Upon cancellation, any amount contributed by a participant or withheld from a participant’s compensation will be returned to the participant.
A participant may not transfer any rights under the ESPP, and, upon death or termination of employment during an offering period, any right held by a participant to purchase shares of our common stock under the ESPP is deemed canceled.
In the event of a merger or similar transaction or change of control, the board will provide that any outstanding right to purchase shares of our common stock under the ESPP is assumed or substituted for, or is canceled with a return of any amounts contributed by or withheld from the compensation of a participant, or that the offering period ends before the date of the proposed sale or merger.
The board has discretion to amend the ESPP to any extent and in any manner it may deem advisable, provided that any amendment that would be treated as the adoption of a new plan for purposes of Section 423 of the Code will take effect only if approved by shareholders of the Company within twelve months before or after its adoption.
Other Compensation
In addition to base salaries, short-term incentives and long-term incentives, the Company provides its executive officers with certain other benefits to remain competitive in the market for a high-caliber management team.
Perquisites
Certain temporary relocation expenses are paid on behalf of executive officers, including the Named Executive Officers, in order to attract and retain critical talent. During fiscal year 2010,2012, tax gross up payments were made with respect to eligible temporary relocation expenses. For additional information regarding perquisites made available to the Named Executive Officers during fiscal year 2010,2012, please see the “All Other Compensation” column of the Summary Compensation Table and the corresponding footnotes.
Post-Employment Benefit Information
Pension Plans
Avaya maintains a non-contributory qualified pension plan, known as the Avaya Inc. Pension Plan for Salaried Employees, or APPSE, which covers U.S. salaried employees hired before January 1, 2004. Pension amounts based on the pension plan formula that exceed the applicable Code limitations with respect to qualified pension plans are paid to qualifying individuals under a non-contributory unfunded supplemental pension plan, called the Avaya Inc. Supplemental Pension Plan, or ASPP. Effective December 31, 2003, pension benefit accruals provided under the APPSE and accruals provided under the ASPP were frozen with respect to all employees. Additionally, no new employees hired after December 31, 2003, including all of the Named Executive Officers, are eligible to participate in the APPSE or the ASPP. Of the Named Executive Officers, only Mr. Manganello is a participant under both the APPSE and the ASPP; the other Named Executive Officers joined the Company after December 31, 2003. Please see “Pension Benefits” below for additional information.
Savings Plans
At the same time the changes were made to the APPSE and the ASPP described above, the Company enhanced the Avaya Inc. Savings Plan for Salaried Employees, or ASPSE, a qualified savings plan that covers U.S. salaried employees, and created the Avaya Inc. Savings Restoration Plan, or ASRP. The ASRP is an unfunded non-qualified deferred compensation plan designed to restore contribution opportunities lost under the ASPSE as a result of Internal Revenue Service, or IRS, Code limits. The ASRP provides that executives will be able to defer compensation and receive Company allocations (automatic company contributions and company matching contributions) that cannot be made or received under the ASPSE due to limitations imposed by the Code.
Prior to January
From March 1, 2009 through March 31, 2010, the ASPSE included an automatic 2% Company contribution and a match formula of 100% on the first 2% of eligible compensation contributed by a participant and 50% on the next 4% of eligible compensation contributed by a participant. Effective January 1, 2009, the ASPSE was revised to remove the
automatic 2% Company contribution and to change the matching formula to 100% of the first 4% of eligible compensation contributed by each participant. The entiresuspended Company matching portion for both plans was then suspended effective March 1, 2009.
contributions under the ASPSE. Effective April 1, 2010, the Company reinstated ASPSE matching contributions. The formula for matching contributions was 50% on the first 3% of eligible compensation contributed by a participant. Effective October 1, 2010, the Company matching allocation for the ASPSE was further enhanced to 100% on the first 2% of eligible compensation contributed by a participant and 50% on the next 1% of eligible compensation contributed by a participant. The
Effective January 1, 2013, the Company matching allocation forwill be made on a quarterly basis, once a Company performance threshold is met. The matching formula will change to 50% on the ASRP has not been restored since its suspensionfirst 5% of eligible compensation contributed by a participant on March 1, 2009.a pre-tax basis. The Company match will be capped at $3,000 annually, per participant.
For more information regarding each of these plans, please see “Pension Benefits” and “Nonqualified Defined Contribution and Other Deferred Compensation Plans” below.
Employment, Change in Control and Separation Arrangements
Mr. Kennedy’s Employment Agreement
Mr. Kennedy is party to an employment agreement with the Company under which he agrees to serve as the Company’s President and CEO. The agreement, which became effective December 22, 2008, has an initial three-year term that is automatically renewed for subsequent one-year periods unless notice of non-renewal is delivered by the Company. Under the agreement, Mr. Kennedy’s base salary is $1,250,000. It provides that his target cash award under the STIP is 100% of his base salary, with the maximum award payable to him under the STIP being subject to a cap of 200% of his base salary. Pursuant to the agreement, Mr. Kennedy received a guaranteed incentive award for fiscal year 2009 of $965,754 and a transition bonus of $850,000. The Compensation Committee approved a change to Mr. Kennedy’s target opportunity under the STIP, to 125% of his base salary, effective January 1, 2011.
Under the agreement, Mr. Kennedy received, effective as of the date his employment with the Company commenced, a grant of 5,000,000 stock options having an exercise price equal to the fair market value of a share of our common stock at the time of grant, which was $3.80. These awards were exchanged for replacement options with an exercise price of $3.00 per share, vesting ratably in four annual installments, under thea stock option exchange program discussed above. For additional information, please see the section above labeled “Elementsavailable to all holders of Executive Officer Compensation—Long Term Compensation—Stock Option Awards—Fiscal Year 2010 Awards—Stock Option Exchange Program.”stock options, conducted in fiscal 2010.
Effective December 22, 2008, Mr. Kennedy also received 400,000 RSUs, which vest equally on the first, second, third and fourth anniversary dates of the grant date. Currently, the RSUs are subject to certain puts and calls that expire on the initial public offering. Prior to anthe initial public offering, (i) if Mr. Kennedy’s employment is terminated other than for cause, (ii) if he voluntarily resigns for any reason or (iii) upon his death or disability, Mr. Kennedy has the right to require usthe Company to purchase from him any or all of the shares of common stock subject to his vested RSUs at fair market value, unless fair market value is less than $10 per share, in which case the purchase price shall be $10 per share, or the RSU Price. Further, in the event that certain “drag-along” or “tag-along” provisions under the management stockholders’ agreement are exercised and Mr. Kennedy sells shares of common stock underlying vested RSUs in certain transactions and receives less than $10 per share, then we are obligated to pay to Mr. Kennedy the difference between $10 per share and the amount realized by Mr. Kennedy in such transaction.
In addition, the agreement provides that, for so long as Mr. Kennedy is the Company’s CEO, the Sponsors shall ensure that their affiliates vote to elect him as a member of our board of directors.
Mr. Massetti’s Offer of Employment
Mr. Massetti became the Company’s Senior Vice President and Chief Financial Officer on October 26, 2009. Under the terms of his offer of employment, Mr. Massetti’s annual base salary iswas $550,000 and his annual target award under the Avaya STIP iswas 85% of his annual base salary. Pursuant to the terms of his offer, the amount of his fiscal year 2010 award under the STIP was prorated for his days of service during the fiscal year. In addition, heHe received a cash sign-on bonus payment of $375,000 in January 2010 and a cash sign-on bonus payment of $750,000 in March 2011. Each award requires repayment to the Company if Mr. Massetti terminates
his employment for any reason or if the Company terminates his employment for cause, in either case within 12 months following each payment. The repayment amount will be prorated based on the number of months employed in the 12 month period following payment. The Compensation Committee approved a change to Mr. Massetti’s base salary and target opportunity under the STIP to $585,000 and $526,500, respectively, effective in January 2011.
As part of the offer of employment, Mr. Massetti was awarded 1,000,000 stock options pursuant to the 2007 Plan. The grant was comprised of time-based stock options and MoM stock options, weighted 65% and 35% respectively, having an exercise price equal to the fair market value of a share of our common stock at the time of grant, which was $3.00. The vesting terms are similar to those granted to employees who participated in the stock option exchange program discussed under “—Elements of Executive Officer Compensation—Long Term Compensation—Stock Option Awards—Fiscal Year 2010 Awards—Stock Option Exchange Program.”during fiscal 2012.
Mr. Massetti also was granted 150,000 RSUs on November 19, 2009, which vestvested 50% on the first anniversary of the grant date and 25% on each of the second and third anniversaries of the grant date. Following Mr. Massetti’s termination of employment, we have the right to purchase from him shares issued on the vesting of these RSUs at a purchase price per share equal to the greater of the fair market value of a share of our common stock and $13. Further, (i) if Mr. Massetti’s employment is terminated other than for cause, (ii) if he voluntarily resigns for good reason or (iii) upon his death or disability, Mr. Massetti has the right to require us to purchase from him any or all of the shares of common stock subject to his vested RSUs at a purchase price per share equal to the greater of the fair market value of a share of our common stock and $13.$13 (the “Massetti Put”). If Mr. Massetti exercises this right, then we will have the right to defer the payment to a change in control event, as defined in the 2007 Plan.
Mr. Massetti’s Separation Agreement
Mr. Massetti ceased serving as Senior Vice President and Chief Financial Officer effective August 15, 2012. On May 20, 2013, the terms of his separation agreement were finalized. Under the terms of the agreement, Mr. Massetti will receive $171,250, less applicable tax withholdings, and up to $25,000 for reimbursement of legal and tax professional fees in connection with his separation of employment.
Consistent with the terms of the award agreement governing his grant of 150,000 RSUs as discussed above, upon his termination of employment the vesting and distribution of the underlying shares was accelerated. The Company remitted the taxes associated with that distribution directly to the tax authorities on behalf of Mr. Massetti, resulting in an additional $257,668 in income for Mr. Massetti in 2012.
In addition to the above, as indicated in the Summary Compensation Table, in fiscal 2011 Mr. Massetti earned $620,125 under the terms of the EC LTIP. In exchange for his forfeiting all rights under that plan, Mr. Massetti will receive a one-time cash payment equal to $620,125, less applicable tax withholdings.
Finally, consistent with the terms of his offer of employment, Mr. Massetti exercised the Massetti Put. In exchange for the 150,000 shares of our common stock subject to the Massetti Put, beginning May 15, 2013 and for seven quarters thereafter (i.e., July 1, 2013, October 1, 2013, etc. through and including the quarter beginning January 1, 2015), the Company or Avaya Inc. will issue payments within 30 days of May 15 and the first business day of each of the seven quarters thereafter, of $243,750, or $1,950,000 in the aggregate, less applicable tax withholdings.
Except as set forth above, all other terms of Mr. Massetti’s separation agreement and benefits he is to receive are consistent in all material respects with previously disclosed Company plans.
Mr. Hackney’s Offer of Employment
Mr. Hackney became an officer of the Company on December 19, 2009 following the acquisition by Avaya Inc. of the enterprise solutions business of NES and was appointedas the Senior Vice President and President of Avaya Government Solutions and Data Solutions. Under the terms of his offer of employment, Mr. Hackney’sHis initial annual base salary was $600,000 and his annual target award under the Avaya STIP was 75% of his annual base salary. The amount of his fiscal year 2010 award under the STIP was prorated for his days of service during the fiscal year. In addition, he is eligible to receivereceived a one-time cash bonus paymentaward in the amount of $600,000 which was payable onupon the earlier of (i) two years from the date ofon which he was first employment by Avaya Inc., (ii) the acquisitioncompletion of NES, (ii) the divestiture by Avaya of a particular business unit or (iii) Mr. Hackney’s termination ofif he was terminated by Avaya other than for Cause. The payment was conditioned upon his continued employment by the Company without cause. This payment is conditioned on his remaining employed by the Company through the date on which the payment iswas made, to him.which was December 2011.
As part of the offer of employment, Mr. Hackney was awarded 600,000 stock options pursuant to the 2007 Plan. The grant was comprised of time-based stock options and MoM stock options, weighted 65% and 35%, respectively, having an exercise price equal to the fair market value of a share of our common stock at the time of grant, which was $3.00. The vesting terms are similar to those granted to employees who participated in the stock option exchange program discussed under “Elements of Executive Officer Compensation—Long Term Compensation—Stock Option Awards—Fiscal Year 2010 Awards—Stock Option Exchange Program.”
In connection with his appointment as Senior Vice President, Global Sales and Marketing and President, Field Operations, Mr. Hackney’s annual base salary was adjusted from $600,000 to $650,000, effective January 2011. Mr. Hackney subsequently assumed the role of Senior Vice President and General Manager, Avaya Cloud Solutions effective as of January 11, 2013.
Mr. Mitchell’s Offer of Employment
Mr. Mitchell entered into an Executive Employment Agreement effective May 3, 2010 pursuant to which he became the Company’s Senior Vice President, Channel Integration. Mr. Mitchell’s employment agreement had an initial term that expired on November 3, 2011 and could be extended for a subsequent six month period pursuant to a mutual agreement of Mr. Mitchell and the Company. Under the employment agreement, Mr. Mitchell’s base salary was established at $450,000. In addition, Mr. Mitchell was eligible to receive a discretionary bonus of $550,000 based on achievement against established performance targets. Mr. Mitchell received a payment in December 2010 of $228,250 for results associated with the first half of his annual target and a second payment in April 2011 of $275,000 for results associated with the second half of his annual target.
On March 22, 2011, Mr. Mitchell accepted a revised offer of employment in connection with his appointment as Senior Vice President, SME and Avaya Go to Market, effective April 1, 2011. Under the terms of his revised offer letter, which superseded Mr. Mitchell’s existing Executive Employment Agreement, Mr. Mitchell’s annual base salary was increased from $450,000 to $500,000. In addition, effective April 1, 2011, in lieu of the discretionary cash bonus described above, Mr. Mitchell became eligible to participate in the Company’s STIP at 80% of his base salary, with Mr. Mitchell’s fiscal 2011 STIP to be prorated to reflect his actual STIP eligibility period (April 1, 2011 through September 30, 2011). Mr. Mitchell was also awarded 900,000 stock options pursuant to the 2007 Plan. The grant was comprised of time-based stock options and MoM stock options, weighted 65% and 35% respectively, having an exercise price equal to the fair market value of a share of our common stock at the time of grant, which was $3.00. The vesting terms are similar to those granted to employees during fiscal 2012. Finally, under the terms of Mr. Mitchell’s revised offer letter, he was awarded a grant of 50,000 RSUs on March 22, 2011, which vest equally on the first and second anniversaries of the grant date.
On February 16, 2012, the Compensation Committee approved a $250,000 Retention Bonus for Mr. Mitchell to be paid in two equal installments on December 31, 2012 and December 31, 2013.
Mr. Mitchell subsequently assumed the role of Senior Vice President, Global Sales effective as of January 11, 2013.
Mr. Formant’s Offer of Employment
Mr. Formant became an officer of the company on February 18, 2008, at which time he was appointed Senior Vice President and President, Avaya Global Services. Under the terms of his offer of employment, Mr. Formant’s initial annual base salary was $450,000 and his annual target award under the Avaya STIP was 75% of his annual base salary. The offer also provided a guarantee that his STIP award for each fiscal quarter through December 2009 would not be less than $25,000. In addition, he received a cash sign-on bonus payment of $300,000, payable in eight quarterly installments at the end of each fiscal quarter. The payments were made in March, June, September and December of 2008 and 2009. All payments were conditioned upon Mr. Formant’s continued employment through the date each payment was due.
As part of the offer of employment, Mr. Formant was awarded 900,000 stock options pursuant to the 2007 Plan, having an exercise price equal to the fair market value of our common stock at the time of grant, which was $5.00. These awards were exchanged for replacement options with an exercise price of $3.00 per share under a stock option exchange program conducted in fiscal 2010.
Effective March of 2009, the Compensation Committee approved a change to Mr. Formant’s base salary to $500,000 based on a review of his compensation as the SVP and President, Avaya Global Services. Effective August 2010, Mr. Formant was named Senior Vice President and President – Avaya Government Solutions.
Mr. Formant’s Separation Agreement
On April 12, 2013, the Company announced that Mr. Formant would cease holding the position of Senior Vice President and President, Avaya Government Solutions effective as of April 30, 2013. On May 24, 2013 the Company finalized the terms of his separation agreement. As indicated in the Summary Compensation Table, in fiscal 2011 Mr. Formant earned $500,000 under the terms of the EC LTIP. In exchange for his forfeiting all rights under that plan, Mr. Formant will receive a one-time cash payment equal to $500,000, less applicable tax withholdings. Except as set forth in the immediately preceding sentence, all other terms of Mr. Formant’s separation agreement and benefits he is to receive are consistent in all material respects with previously disclosed Company plans.
Mr. Vellequette’s Offer of Employment
Mr. Vellequette became the Company’s Senior Vice President and Chief Financial Officer on October 1, 2012. Under the terms of his offer of employment, Mr. Vellequette’s annual base salary is $575,000 and his annual target award under the STIP were adjusted asis 90% of his annual base salary. In addition, he received a cash sign-on bonus payment of $400,000, payable in two equal installments in April 2013 and February 2014. These payments are conditioned upon Mr. Vellequette’s continued employment through the date the payment is due. In addition, Mr. Vellequette’s target opportunity under the EC LTIP for fiscal 2013 is $575,000, with the actual award for fiscal 2013 being the greater of $400,000 and the actual award earned based on the achievement of the fiscal 2013 financial targets set forth under “—Elementsin the plan.
As part of Executive Officer Compensation.”the offer of employment, Mr. Vellequette was awarded 500,000 stock options pursuant to the 2007 Plan. The grant was comprised of 325,000 time-based stock options and 175,000 MoM stock options, having an exercise price equal to the fair market value of a share of our common stock at the time of grant, which was $4.00. The vesting terms are similar to those granted to employees during fiscal 2012.
Mr. Vellequette also was granted 150,000 RSUs which will vest 25% on each of the first, second, third and fourth anniversaries of the date of grant.
Dr. Baratz’s Separation Agreement
In connection with Dr. Baratz’s separation from the Company, he received a payment of one times base salary in the amount of $675,000, in accordance with the Avaya Inc. Involuntary Separation Plan for Senior Officers. He also received the final installment of a cash retention award in the amount of $75,000, in accordance with his amended employment agreement dated February 2011. Also, as part of Dr. Baratz’s separation agreement, he forfeited his right to participate in the EC LTIP and received a one-time payment of $675,000. Dr. Baratz stopped vesting in all stock options as of his separation from the Company which was effective May 5, 2012, and he was given an 18 month extended period in which to exercise his vested options.
Change in Control Agreements
Certain executive officers of the Company are parties to agreements providing for severance benefits in the event of the termination of their employment following a change in control of the Company. The agreements were entered into prior to the Merger and at a time when the Company was publicly traded to provide assurances that, in the event a change in control transaction was contemplated, these executive officers would negotiate and conduct the underlying transaction smoothly and efficiently, without concern that their positions and their financial livelihoods may be in jeopardy. None of the Named Executive Officers are partiesis a party to these agreements.
Involuntary Separation Plan
The Avaya Inc. Involuntary Separation Plan for Senior Officers, amended and restated as of February 1, 2009, is designed to provide a specific payment and certain benefit enhancements to eligible executive officers of the Company and its affiliated companies and subsidiaries, including with the exception of Mr. Manganello, the Named Executive Officers, in the event that their employment is involuntarily terminated under certain conditions. Eligible executive officers include the CEO and all executive officers elected by the Company’s board of directors at a level above Vice President who are designated “At Risk” under the Avaya Force Management Program Guidelines. The Avaya Inc. Involuntary Separation Plan for Vice Presidents, amended and restated as of April 1, 2009, provides benefits for employees at the level of Vice President, including Mr. Manganello, who are terminated under similar conditions. For a description of the potential amounts that could be received by each of the Named Executive Officers assuming an involuntary separation had occurred as of September 30, 2010,2012, please see the section below titled “Potential Payments on Occurrence of Change in Control and Other Events.”
Fiscal Year 20112013 Actions and Changes to Compensation Approach Post-Initial Public Offering
Following the conclusion of fiscal year 2010,2012, the Compensation Committee approved changes to certain executive officer compensation arrangements, including those for certain Named Executive Officers,Officers.
Short-Term Incentive Plan
Effective December 6, 2012, the Compensation Committee determined that, for fiscal 2013, corporate performance would be measured against Adjusted EBITDA on a pre-STIP basis (i.e., before taking into account the payment of STIP), or Pre-STIP Adjusted EBITDA. Adjusted EBITDA is defined in I“Management’s Discussion and Analysis of Financial Condition and Results of Operations”.
As adopted, an eligible employee participating in the STIP will have an opportunity for a mid-year and year-end payout on achievement by the Company of quarterly Pre-STIP Adjusted EBITDA targets for the first and second six-month periods of fiscal 2013, respectively, subject to individual performance criteria. If a quarterly target is not achieved, then no cash will be available to fund STIP for that quarter.
Salary Adjustment
On December 6, 2012, the Compensation Committee approved a change to Mr. Mitchell’s salary from $500,000 to $600,000 effective January 1, 2011.2013. The changes were based upon reviewsincrease was made in recognition of the performance of those executive officershis contribution during fiscal year 2010 as well as competitive market2012 and following a review of benchmark data. Mr. Kennedy’s target incentive opportunity under the STIP was increased to 125%. Mr. Massetti’s base salary and target incentive opportunity under the STIP were increased to $563,750 and 90%, respectively. Mr. Hackney’s target incentive opportunity under the STIP was increased to 90%. The Compensation
Executive Committee believes those adjustments were warranted given each officer’s relative compensation as compared to the compensation of executives holding similar roles at other companies.Long-term Incentive Plan Amendment
In addition, on February 17, 2011,On December 6, 2012, the Compensation Committee approved the following changes to Dr. Alan Baratz’s compensation:
Increase in annual base salary from $600,000 to $675,000, effective January 1, 2011;
Establishmentamendment and restatement of a target opportunity under the STIP equal to 90% of base salary. Previously, Dr. Baratz did not participate in the STIP. Under his prior arrangement with the Company, Dr. Baratz received a cash payment at the end of each fiscal year equal to $300,000. In connection with the changes approved by the Compensation Committee on February 17, 2011, Dr. Baratz has agreed to terminate that prior arrangement;
Cash retention award of $225,000 payable in three equal installments of $75,000 in each of February 2011, December 2011 and December 2012 provided that Dr. Baratz remains employed by the Company through the date of payment. If Dr. Baratz is terminated by the Company other than for cause, any unpaid amounts will become due and payable to him;
Grant of 100,000 RSUs under the 2007 Plan. The grant of RSUs had an effective date of April 1, 2011 and will vest 50% on each of the first and second anniversaries of that effective date;
Participation in the EC LTIP (discussed below).
Further, on December 22, 2010, the Compensation Committee approved a plan to provide cash incentives to certain executive officers, including its Named Executive Officers, to help promote the long-term value of the Company, referred to as the Avaya Inc. Executive Committee 2011-2013 Performance Recognition Plan or the EC LTIP. The Compensation Committee currently servesplan was revised to include additional executive officers as that plan’s administrator. On May 11,participants and to extend the term of the plan to cover fiscal years 2014 and fiscal 2015 in addition to the previously covered fiscal years of 2011 the Compensation Committee approved the final plan document and form of award agreement.through 2013. The plan was amended on that date as well.amendments did not modify any previously issued awards covering fiscal years 2011 through 2013.
EachWith respect to the extended period covered by the plan post-amendment, each award under the EC LTIP post-amendment consists of the grant to a plan participant of the conditional right to receive a dollar amount credited to an account for such participant based on the Company’s performance during fiscal
years 2011, 20122014 and 2013.2015. The amount credited to a participant’s account for each of the respective fiscal years will be determined based on the Company’s actual ManagementPre-STIP Adjusted EBITDA (asas defined above) excluding the impact of payments under the STIP, or Pre-STIP EBITDA,above compared to performance thresholds and targets established by the plan administrator for the applicable fiscal year, subject to a multiplier for each threshold and target. The amount credited to a participant’s account for a fiscal year will equal his or her targeted award multiplied by the multiplier determined based on the Company’s actual performance. Attainment of Pre-STIP Adjusted EBITDA between the threshold and target levels will result in a pro rata adjustment (based on straight line interpolation) to the applicable multipliers. For fiscal year 2011, achievement of corporate performance equal to the applicable threshold and target would result in multipliers of 75% and 100%, respectively, of the award amounts identified for each of the NEOs below. The Compensation Committee expects to establish thresholds and targets under the EC LTIP for fiscal years 20122014 and 20132015 during the first quarter of each respective year.
If the Pre-STIP Adjusted EBITDA attained for anyeither fiscal year is less than the applicable threshold, then no amount will be credited to a participant’s account for that fiscal year. For any fiscal year where the actual Pre-STIP Adjusted EBITDA equals or exceeds the target for such year, the plan administrator may, in its sole discretion, credit an additional amount to one or more participant’s accounts based on any factors it determines are appropriate, including, but not limited to, individual performance and contribution to the business. In no event, however, will the amount credited to a participant’s account for anyeither fiscal year exceed 160 percent of that participant’s targeted award.
The dollar amount of all awards that may be issued under the EC LTIP (including awards pre-amendment) at target payout is $25approximately $32 million and shall not exceed $40$50 million in the aggregate for all participants.
If duringUnless previously paid, each award will be automatically forfeited, and no payment will be made, upon termination of a participant’s employment with the one-year period following a change of control transaction involving us, a participant in the planCompany and its subsidiaries before it is involuntarily terminatedpaid for any reason, other than involuntary termination without cause, disability, death and, for “cause” or voluntarily terminates for “good reason” (as each such term is defined inawards covering the EC LTIP plan document), a pro rata portion of the targeted award for such fiscal year shall be credited to the participant’s account for that year.
2014 and fiscal 2015 periods, retirement. In addition, a participant will (i) forfeit any or all rights with respect to the award or to amounts previously paid under an award and (ii) be required to pay back any such previously paid amounts, if the participant breaches any nondisclosure, non-competition, non-solicitation or other undertakings set forth in the award agreement.
Awards for fiscal 2014 and 2015 for certain of the Named Executive Officers under the EC LTIPand Mr. Vellequette are set forth below for fiscal years 2011 through 2013:below.
Named Executive Officer | Annual Opportunity | |||
Kevin J. Kennedy, President and Chief Executive Officer | $ | 1,250,000 | ||
Anthony J. Massetti, Senior Vice President and Chief Financial Officer | $ | 563,750 | ||
J. Joel Hackney, Jr., Senior Vice President, Global Sales & Marketing & President, Field Operations | $ | 650,000 | ||
James M. Chirico, Jr., Executive Vice President, Business Operations | $ | 625,000 | ||
Alan E. Baratz, Senior Vice President and President, Global Communications Solutions | $ | 675,000 | ||
NEO | Annual Opportunity for Fiscal 2014-2015(1) | |||
Kevin J. Kennedy, President and Chief Executive Officer | $ | 1,250,000 | ||
David Vellequette, SVP and Chief Financial Officer | $ | 575,000 | ||
J. Joel Hackney, Jr., SVP & General Manager, Avaya Cloud Solutions | $ | 650,000 | ||
Thomas G. Mitchell, SVP, Global Sales | $ | 600,000 | ||
| (1) | All amounts are the same as their respective fiscal 2011-2013 annual award opportunities with the exception of (i) Mr. Mitchell, whose fiscal 2011-2013 annual award opportunity was $500,000 and |
| (ii) Mr. Vellequette, who became the Company’s SVP and Chief Financial Officer effective October 1, 2012 and previously was not a participant in the plan. With respect to Mr. Vellequette and as previously disclosed on a Form 8-K filed with the SEC on August 15, 2012, his offer of employment provides that the actual award for fiscal 2013 shall be the greater of $400,000 and the actual award earned based on the achievement by the Company of the fiscal 2013 financial target. |
We anticipateShort-Term Cash Awards
On December 6, 2012, the Compensation Committee approved a numbershort-term cash award program for senior officers, including the Named Executive Officers, as follows:
NEO | Award Amount | First Payment Dec. 2012 | Second Payment Mar. 2013 | Third Payment Dec. 2013 | ||||||||||||
Kevin J. Kennedy, President and Chief Executive Officer | $ | 2,813,000 | $ | 781,500 | $ | 781,500 | $ | 1,250,000 | ||||||||
J. Joel Hackney, Jr., SVP &General Manager, Avaya Cloud Solutions | $ | 645,000 | $ | 147,500 | $ | 147,500 | $ | 350,000 | ||||||||
Thomas G. Mitchell, SVP, Global Sales | $ | 800,000 | $ | 200,000 | $ | 200,000 | $ | 400,000 | ||||||||
Christopher M. Formant, Former SVP and President, Avaya Government Solutions | $ | 395,000 | $ | 107,500 | $ | 107,500 | $ | 180,000 | ||||||||
Each award will be paid in three installments, provided the executive officer is employed on the date of changespayment. In February 2013, the second payment date of March 2013 was changed to our compensation approach following this offering.May 2013. The awards were in recognition of performance during fiscal 2012 and represent an investment in senior officers the Company believes have high levels of impact on business results. Effective April 30, 2013, Mr. Formant ceased serving as Senior Vice President and President, Avaya Government Solutions and, under the terms of his separation agreement, he will not receive the third installment payment. See “Employment, Change in Control and Separation Agreements – Mr. Formant’s Separation Agreement.”
In addition, Mr. Kennedy was granted a cash award of approximately $600,000 payable at the end of December 2012 in recognition for his leadership during fiscal 2012.
Long-Term Cash Awards
On December 6, 2012, the Compensation Committee approved a long-term cash award program for senior officers, including the Named Executive Officers and Mr. Vellequette, as follows:
NEO | Cash Payment (First Installment) Jan. 1, 2013 | Cash Payment (Second Installment) Jan. 1, 2014(1) | Target Range for Cash Payment (Third Installment) Dec. 1, 2015(1, 2) | |||||||||
Kevin J. Kennedy, President and Chief Executive Officer | $ | 994,000 | $ | 1,656,000 | $ | 3,975,000 - $7,288,000 | ||||||
David Vellequette, SVP and Chief Financial Officer | $ | 173,000 | $ | 518,000 | $ | 1,035,000 - $1,898,000 | ||||||
J. Joel Hackney, Jr., SVP & General Manager, Avaya Cloud Solutions | $ | 443,000 | $ | 738,000 | $ | 1,770,000 - $3,245,000 | ||||||
Thomas G. Mitchell, SVP, Global Sales | $ | 342,000 | $ | 571,000 | $ | 1,370,000 - $2,512,000 | ||||||
Christopher M. Formant, Former SVP and President, Avaya Government Solutions | $ | 327,000 | — | — | ||||||||
| (1) | Actual payment dates for Mr. Vellequette will be January 1, 2015 for the second installment and November 1, 2017 for the third installment. Effective April 30, 2013, Mr. Formant ceased serving as Senior |
| Vice President and President, Avaya Government Solutions and, under the terms of his separation agreement, he will not receive the third installment payment. See “Employment, Change in Control and Separation Agreements – Mr. Formant’s Separation Agreement.” |
| (2) | Actual amounts to be awarded will depend on individual performance rating for the year in which the third installment payment is to be made. Effective April 30, 2013, Mr. Formant ceased serving as Senior Vice President and President, Avaya Government Solutions and, under the terms of his separation agreement, he will not receive the third installment payment. See “Employment, Change in Control and Separation Agreements – Mr. Formant’s Separation Agreement.” |
Notwithstanding the foregoing, the third installment payment for a senior officer will be adjusted downward (i) to reflect shares of our 2007 Plan, we intendcommon stock previously owned and sold by that senior officer and (ii) if our common stock is then publicly traded, to adopt an omnibus equity incentive planreflect the value of shares of our common stock that will permit the grantingsenior officer owns or could receive upon exercise of various types of awards to our key employees, directors, consultants and advisors. Types of awards that may be granted are: stock options or vested RSUs, in each case excluding shares relating to continuation stock appreciation rights, restricted stock, unrestricted stock, stock units,options, continuation restricted stock units and cash awards. It is our policy that stock options granted after the completion of this offering will have a per share exercise price that is not less than the fair market value of a share of our common stock on the date of grant.
Section 162(m) disallows a tax deduction for any publicly held corporation for individual compensation exceeding $1 million in any taxable year for a company’s named executive officers, other than its chief financial officer, unless compensation is performance-based. As we are not currently publicly traded, our Compensation Committee has not previously taken the deductibility limit imposed by Section 162(m) into consideration in setting compensation. Following this offering, at such times as we are subject to the deduction limitations of Section 162(m), we expect that our Compensation Committee will seek to qualify the variable compensation paid to our Named Executive Officers for an exemption from the deductibility limits of Section 162(m). However, our Compensation Committee may, in its judgment, authorize compensation payments that do not comply with the exemptions in Section 162(m) when it believes that such payments are appropriate to attract and retain executive talent.
Our Compensation Committee regularly considers the accounting implications of significant compensation decisions, especiallyinvested in connection with decisions that relate to our equity incentivethe going-private transaction of the Company.
Stock Option Exchange Offer
On February 25, 2013, the Compensation Committee approved a stock option exchange program through which individuals holding performance based stock options, including MoM stock options, could exchange them on a three-for-one basis for RSUs. The replacement RSUs will vest in full on December 16, 2013, and vesting will be accelerated in the event of a change in control (as defined in the award plansagreement), death, disability, involuntary termination without cause or upon termination of employment under certain voluntary programs. The stock option exchange program was closed on April 30, 2013 and programs. As accounting standards change, we may revise certain programs to appropriately align accounting expenses10,204,689 stock options were tendered for exchange. In connection with the exchange offer, 3,401,654 replacement RSUs were granted which have an effective grant date of our equity awards with our overall executive compensation philosophy and objectives.May 6, 2013. Below is information regarding participation in the stock option exchange program by the Named Executive Officers:
NEO | MoM Stock Options Exchanged | RSUs Granted | ||||||
Kevin J. Kennedy, President and Chief Executive Officer | 2,100,000 | 700,001 | ||||||
J. Joel Hackney, Jr., SVP &General Manager, Avaya Cloud Solutions | 490,000 | 163,334 | ||||||
Thomas G. Mitchell, SVP, Global Sales | 350,000 | 116,667 | ||||||
Christopher M. Formant, Former SVP and President, Avaya Government Solutions (1) | 525,000 | 175,000 | ||||||
| (1) | Mr. Formant ceased serving as Senior Vice President and President, Avaya Government Solutions, effective April 30, 2013. In connection with his separation from the Company, his RSUs received in the stock option exchange program will be fully vested and distributed. |
Conclusion
The Compensation Committee believes that the Company’s compensation program for executive officers supports the Company’s philosophy that compensation should be designed to attract, motivate and retain executive officers and employees in such a way as to create value for the benefit of the Company’s shareholders. The Company feels confident that the Company’s salary, short-term incentive, long-term incentive and other compensation programs help enable the Company to create a competitive total compensation package. In addition, the Company believes that this total compensation package helps reinforce the Company’s commitment to reward employees for performance against stated goals and objectives, both at the corporate and individual levels.
Summary Compensation Table
The following table sets forth the compensation earned by the Company’s Named Executive Officers for services rendered in all capacities to the Company and its subsidiaries for the fiscal years indicated. The Company’s Named Executive Officers for fiscal year 20102012 include our Chief Executive Officer, individuals serving asour former Chief Financial Officer, during the fiscal year and our three most highly compensated executive officers in fiscal year 20102012 (including our former SVP & President, Avaya Government Solutions) other than the Chief Executive Officer and Chief Financial Officer.Officer and the Company’s former SVP, Corporate Development & Strategy.
Name & Title: | Fiscal Year | Salary(6) | Bonus(7) | Stock Awards(8) | Option Awards(8) | Non Equity Incentive Plan Compensation(9) | Change In Pension Value(10) | All Other Compensation(11) | Total | |||||||||||||||||||||||||||
Kevin J. Kennedy | 2010 | $ | 1,153,846 | $ | — | $ | — | $ | 903,500 | $ | 44,363 | $ | — | $ | 507,637 | $ | 2,609,345 | |||||||||||||||||||
| President & Chief Executive Officer(1) | 2009 | 965,754 | 850,000 | 4,000,000 | 8,164,063 | 965,754 | — | 594,843 | 15,540,414 | |||||||||||||||||||||||||||
Anthony J. Massetti | 2010 | 489,198 | 375,000 | 1,950,000 | 1,129,375 | 12,635 | — | 67,858 | 4,024,066 | |||||||||||||||||||||||||||
| SVP and Chief Financial Officer(2) | ||||||||||||||||||||||||||||||||||||
J. Joel Hackney, Jr. | 2010 | 459,565 | — | 300,000 | 1,264,900 | 11,956 | — | 46,367 | 2,082,788 | |||||||||||||||||||||||||||
| SVP, Global Sales and Marketing & President, Field Operations(3) | ||||||||||||||||||||||||||||||||||||
James M. Chirico, Jr. | 2010 | 559,615 | 300,000 | 225,000 | 517,400 | 14,546 | — | 125,642 | 1,742,203 | |||||||||||||||||||||||||||
| EVP, Business Operations(4) | 2009 | 558,333 | 1,500,000 | — | 408,203 | — | — | 285,558 | 2,752,094 | |||||||||||||||||||||||||||
Alan E. Baratz | 2010 | 550,000 | 300,000 | — | 451,750 | — | — | 8,627 | 1,310,377 | |||||||||||||||||||||||||||
| SVP and President, Global Communications Solutions | ||||||||||||||||||||||||||||||||||||
J. David Manganello | 2010 | 327,115 | — | — | 182,325 | 5,275 | 942 | 3,877 | 519,534 | |||||||||||||||||||||||||||
| VP, Former Interim Chief Financial Officer(5) | ||||||||||||||||||||||||||||||||||||
Name | Year | Salary ($)(4) | Bonus ($)(5) | Stock Awards ($)(6) | Option Awards ($)(6) | Non-Equity Incent. Plan Comp ($)(7) | Change in Pension Value ($)(8) | All Other Comp. ($)(9) | Total ($) | |||||||||||||||||||||||||||
Kevin J. Kennedy | 2012 | $ | 1,250,000 | $ | — | $ | — | $ | — | $ | — | $ | — | $ | 78,648 | $ | 1,328,648 | |||||||||||||||||||
President and Chief Executive Officer | 2011 | $ | 1,250,000 | $ | — | $ | — | $ | — | $ | 2,584,227 | $ | — | $ | 25,112 | $ | 3,859,339 | |||||||||||||||||||
| 2010 | $ | 1,153,846 | $ | — | $ | — | $ | 903,500 | $ | 44,363 | $ | — | $ | 507,637 | $ | 2,609,345 | ||||||||||||||||||||
Anthony J. Massetti(1) | 2012 | $ | 621,673 | $ | 100,000 | $ | — | $ | — | $ | — | $ | — | $ | 49,590 | $ | 771,263 | |||||||||||||||||||
Former SVP and Chief Financial Officer | 2011 | $ | 560,313 | $ | 850,000 | $ | — | — | $ | 914,357 | $ | — | $ | 66,924 | $ | 2,391,593 | ||||||||||||||||||||
| 2010 | $ | 489,198 | $ | 375,000 | $ | 1,950,000 | $ | 1,129,375 | $ | 12,635 | $ | — | $ | 67,858 | $ | 4,024,066 | ||||||||||||||||||||
J. Joel Hackney, Jr.(2) | 2012 | $ | 650,000 | $ | 600,000 | $ | — | $ | — | $ | — | $ | — | $ | 15,756 | $ | 1,265,756 | |||||||||||||||||||
| SVP & General Manager, Avaya Cloud Solutions | 2011 | $ | 650,000 | $ | — | $ | — | $ | — | $ | 947,517 | $ | — | $ | 7,220 | $ | 1,604,737 | |||||||||||||||||||
| 2010 | $ | 459,565 | $ | 300,000 | $ | 1,264,900 | $ | 11,956 | $ | 46,367 | $ | 2,082,788 | ||||||||||||||||||||||||
Thomas G. Mitchell(3) | 2012 | $ | 500,000 | $ | — | $ | 440,000 | $ | 135,850 | $ | — | $ | — | $ | 3,340 | $ | 1,079,190 | |||||||||||||||||||
SVP, Global Sales | 2011 | $ | 475,000 | $ | 503,250 | $ | 150,000 | $ | 754,650 | $ | 298,533 | $ | — | $ | 2,960 | $ | 2,184,393 | |||||||||||||||||||
| 2010 | ||||||||||||||||||||||||||||||||||||
Christopher M. Formant | 2012 | $ | 500,000 | $ | 400,000 | $ | — | $ | — | $ | — | $ | — | $ | 22,958 | $ | 922,958 | |||||||||||||||||||
Former SVP & President, Avaya Government Solutions | ||||||||||||||||||||||||||||||||||||
Alan E. Baratz | 2012 | $ | 506,250 | $ | 225,000 | $ | — | $ | — | $ | — | $ | — | $ | 1,353,418 | $ | 2,084,668 | |||||||||||||||||||
Former SVP, Corporate | 2011 | $ | 647,308 | $ | 150,000 | $ | 300,000 | $ | — | $ | 722,461 | $ | — | $ | 4,283 | $ | 1,824,051 | |||||||||||||||||||
Development and Strategy | 2010 | $ | 550,000 | $ | 300,000 | $ | — | $ | 451,750 | $ | — | $ | — | $ | 8,627 | $ | 1,310,377 | |||||||||||||||||||
| (1) |
| Mr. Massetti was elected Senior Vice President and Chief Financial Officer effective October 26, 2009. His salary for fiscal year 2010 |
| Mr. Hackney joined the Company as Senior Vice President |
| (3) | Mr. Mitchell joined the Company as Senior Vice President, Channel Integration on May 3, 2010 and was subsequently named Senior Vice President, |
| position. Mr. |
| Reflects the impact of participation in the Company’s mandatory two-week furlough program for all employees (except to the extent prohibited by local law, in which case participation was voluntary) |
Name | Year | NES Acquisition Retention (A) | Payments Pursuant to Employment Offer (B) | Severance Buy Down Bonus (C) | Total Bonus | |||||||||||||||
Kevin J. Kennedy | 2012 | — | — | — | — | |||||||||||||||
| 2011 | — | — | — | — | ||||||||||||||||
| 2010 | — | — | — | — | ||||||||||||||||
Anthony J. Massetti | 2012 | $ | 100,000 | $ | — | — | $ | 100,000 | ||||||||||||
| 2011 | $ | 100,000 | $ | 750,000 | — | $ | 850,000 | |||||||||||||
| 2010 | — | $ | 375,000 | — | $ | 375,000 | ||||||||||||||
J. Joel Hackney, Jr. | 2012 | — | $ | 600,000 | — | $ | 600,000 | |||||||||||||
| 2011 | — | — | — | — | ||||||||||||||||
| 2010 | — | — | — | |||||||||||||||||
Thomas G. Mitchell | 2012 | — | — | — | — | |||||||||||||||
| 2011 | — | $ | 503,250 | — | $ | 503,250 | ||||||||||||||
Christopher M. Formant | 2012 | $ | 100,000 | — | $ | 300,000 | $ | 400,000 | ||||||||||||
Alan E. Baratz | 2012 | 75,000 | $ | 150,000 | — | $ | 225,000 | |||||||||||||
| 2011 | 75,000 | $ | 75,000 | — | $ | 150,000 | ||||||||||||||
| 2010 | — | $ | 300,000 | — | $ | 300,000 | ||||||||||||||
| (A) | Reflects installments received in connection with |
| (B) | Includes sign-on payments for certain senior officers pursuant to their Offers of Employment. See each “—Employment, Change in Control and Separation Agreements and Dr. Baratz’s amended terms of employment. |
| (C) | Represents the third installment of a cash award granted to Mr. |
| Amounts indicated for the “Stock Awards” and “Option Awards” columns represent the aggregate grant date fair value of the awards during the respective years as calculated in accordance with FASB ASC Topic 718, “Compensation-Stock Compensation,” or ASC 718, without regard to forfeiture assumption. For more information regarding the valuation of stock-based awards (including assumptions made in such valuation), refer to Note 14, “Share-based Compensation,” to our audited |
Not included in fiscal year 2010, 2011 or 2012 are any amounts attributable to MoM stock options as it is not possible to determine if the performance condition (e.g., sale or initial public offering of the Company) will be satisfied until such event actually occurs. For options granted to Mr. Mitchell in 2011 and 2012, assuming the highest level of achievement, the aggregate grant date fair value for fiscal 2011 and fiscal 2012 would have been $434,700 and $93,450 respectively.
Included in fiscal year 2010 for Messrs. Kennedy, Massetti and Hackney is the incremental fair value of the replacement options received under thea stock option exchange program as calculated in accordance with ASC 718. See Note 14, “Share-based Compensation,” to our Consolidated Financial Statements for the year ended September 30, 2012 included elsewhere in this prospectus. Not included in fiscal year 2010 are any amounts attributable to MoM stock options as it is not possible to determine if athe performance condition (e.g., satisfactionsale or initial public offering of MoM targets)the Company) will be satisfied until such event actually occurs. Assuming the highest level of achievement, the aggregate grant date fair value for such awards for
Messrs. Kennedy, Massetti Hackney, Chirico, Baratz and ManganelloHackney would be $3,549,000, $739,375, $828,100, $975,975, $946,400$3,240,720, $675,150 and $266,175,$758,168, respectively. For MoM stock option awards issued in the stock option exchange program, the highest level of achievement represents the new awards’ full fair value at the date of issuance as the old awards were not expected to vest under their vesting conditions at the date the stock option exchange offer was completed.
Not included in fiscal year 2009 are any amounts attributable to theThe MoM stock options as it is not possible to determine if a performance condition (e.g. satisfaction of MoM targets) will be satisfied until such event actually occurs. Includedreceived in the fiscal year 2009 amounts is the fair value at the date of grant of EBITDA options for which achievement of the annual or cumulative targets was considered probable and that date. Not included in fiscal year 2009 are any amounts for those EBITDA options as to which the achievement of the annual and cumulative targets was considered less than probable as of that date. Assuming the highest level of achievement, the aggregate grant date fair value for the MoM awards for Messrs. Kennedy and Chirico would be $1,828,750 and $91,438, respectively, and the aggregate grant date fair value for the EBITDA awards would be $1,828,750 and $91,438, respectively. Please see the tables named “Outstanding Equity Awards at Fiscal Year End” and “Grants of Plan-Based Awards” for further information.
Please note that the amounts shown for fiscal year 2009 differ from those amounts previously disclosed for fiscal year 20092010 stock option exchange program were tendered in the Company’s registration statement on Form S-4 (registration no.333-1639982013 stock option exchange program (see “Fiscal 2013 Actions and Changes to Compensation Approach – Stock Option Exchange Offer”). This is because SEC disclosure rules at that time required that we present stock award information based on the amount recognized during the fiscal year for financial statement reporting purposes in accordance with SFAS 123(R) (predecessor to ASC 718). However, recent changes in the SEC’s disclosure rules require that we now present the stock award amounts in this column using the grant date fair value. As a result, each Named Executive Officer’s total compensation amount for fiscal year 2009 also differs from amounts previously reported, if any.
| Represents annual |
The Named Executive Officers did not receive any preferential earnings on compensation deferred on a basis that is not tax-qualified. |
|
| During fiscal |
Amounts paid by the Company during fiscal year 20102012 in the “All Other Compensation” column are as follows:
Name | Year | Company Contributions to ASPSE | Company Contributions to ASRP | Insurance Premiums | Temporary Housing & Relocation Benefits(A) | Temporary Housing & Relocation Gross-Up(A) | Financial Counseling Services & Gross-Up(B) | Automobile Allowance(B) | Monetization of Vacation Days(C) | Total “All Other Compensation” | Year | Company Contributions to ASPSE | Company Contributions to ASRP | Insurance Premiums | Temp Housing & Relocation Benefits (A) | Temp Housing & Relocation Gross-Up (A) | All Other (B) | Total “All Other Compensation” | ||||||||||||||||||||||||||||||||||||||||||||||||||||||
Kevin J. Kennedy | 2012 | $ | 6,250 | — | $ | 8,369 | $ | 11,891 | — | $ | 52,138 | $ | 78,648 | |||||||||||||||||||||||||||||||||||||||||||||||||||||||||||
| 2011 | $ | 6,125 | — | $ | 7,979 | $ | 10,144 | $ | 864 | — | $ | 25,112 | ||||||||||||||||||||||||||||||||||||||||||||||||||||||||||||
Kevin J. Kennedy | 2010 | $ | — | $ | — | $ | 6,984 | $ | 498,267 | $ | 2,386 | $ | — | $ | — | $ | — | $ | 507,637 | |||||||||||||||||||||||||||||||||||||||||||||||||||||
| 2009 | 9,058 | — | 5,293 | 359,507 | 208,385 | — | 12,600 | — | 594,843 | 2010 | — | — | $ | 6,984 | $ | 498,267 | $ | 2,386 | — | $ | 507,637 | |||||||||||||||||||||||||||||||||||||||||||||||||||
Anthony J. Massetti | 2010 | 1,613 | — | 2,507 | 49,861 | 13,877 | — | — | — | 67,858 | 2012 | $ | 6,250 | — | $ | 2,396 | $ | 35,925 | $ | 4,834 | $ | 185 | $ | 49,590 | ||||||||||||||||||||||||||||||||||||||||||||||||
| 2011 | $ | 6,125 | — | $ | 2,294 | $ | 33,019 | $ | 25,486 | — | $ | 66,924 | ||||||||||||||||||||||||||||||||||||||||||||||||||||||||||||
| 2010 | $ | 1,613 | — | $ | 2,507 | $ | 49,861 | $ | 13,877 | — | $ | 67,858 | ||||||||||||||||||||||||||||||||||||||||||||||||||||||||||||
J. Joel Hackney, Jr. | 2010 | 1,425 | — | 1,095 | — | — | — | — | 43,847 | 46,367 | 2012 | $ | 6,250 | — | $ | 1,095 | $ | 8,077 | $ | 150 | $ | 185 | $ | 15,756 | ||||||||||||||||||||||||||||||||||||||||||||||||
| 2011 | $ | 6,125 | — | $ | 1,095 | — | — | — | $ | 7,220 | ||||||||||||||||||||||||||||||||||||||||||||||||||||||||||||||
James M. Chirico, Jr. | 2010 | 1,425 | — | 2,701 | 104,511 | 17,005 | — | — | — | 125,642 | ||||||||||||||||||||||||||||||||||||||||||||||||||||||||||||||
| 2009 | 3,583 | 25,465 | 2,396 | 131,913 | 65,401 | 40,000 | 16,800 | — | 285,558 | 2010 | $ | 1,425 | — | $ | 1,095 | — | — | $ | 43,847 | $ | 46,367 | |||||||||||||||||||||||||||||||||||||||||||||||||||
Thomas G. Mitchell | 2012 | — | — | $ | 3,155 | — | — | $ | 185 | $ | 3,340 | |||||||||||||||||||||||||||||||||||||||||||||||||||||||||||||
| 2011 | — | — | $ | 2,960 | — | — | — | $ | 2,960 | |||||||||||||||||||||||||||||||||||||||||||||||||||||||||||||||
Christopher M. Formant | 2012 | $ | 6,250 | — | $ | 6,266 | $ | 10,011 | $ | 246 | $ | 185 | $ | 22,958 | ||||||||||||||||||||||||||||||||||||||||||||||||||||||||||
Alan E. Baratz | 2010 | — | — | 4,011 | — | — | — | — | 4,616 | 8,627 | 2012 | — | — | $ | 3,418 | — | — | $ | 1,350,000 | $ | 1,353,418 | |||||||||||||||||||||||||||||||||||||||||||||||||||
| 2011 | — | — | $ | 4,283 | — | — | — | $ | 4,283 | |||||||||||||||||||||||||||||||||||||||||||||||||||||||||||||||
J. David Manganello | 2010 | 2,363 | — | 1,514 | — | — | — | — | — | 3,877 | ||||||||||||||||||||||||||||||||||||||||||||||||||||||||||||||
| 2010 | — | — | $ | 4,011 | — | — | $ | 4,616 | $ | 8,627 | ||||||||||||||||||||||||||||||||||||||||||||||||||||||||||||||
| (A) | Represents amounts payable under the Company’s relocation policies in connection with offers of employment. The amount for Mr. |
| (B) | The |
| program in which the Company allowed employees the option of choosing to monetize two unused vacation days in return for a payment equivalent to the value of those days in their base |
Grants of Plan-Based Awards in Fiscal Year 20102012
The following table sets forth information concerning individual grants of stock options made under the 2007 Plan duringnon-equity and equity incentive awards granted fiscal year 20102012 to each of the Named Executive Officers.
Name | Grant Date | Board Approval Date | Estimated Future Payouts Under Non-Equity Incentive Plan Awards(1) | Estimated Future Payouts Under Equity Incentive Plan Awards | Exercise or Base Price of Option Awards(2) | Grant Date Fair Value of Stock and Option Awards(3) | ||||||||||||||||||||||||||||||
| Target | Maximum | Threshold | Target | Maximum | ||||||||||||||||||||||||||||||||
Kevin J. Kennedy | — | — | $ | 1,250,000 | $ | 2,500,000 | $ | — | $ | — | $ | — | $ | — | $ | — | ||||||||||||||||||||
| 11/17/09 | (4) | 10/14/09 | * | — | — | — | 3,250,000 | — | $ | 3.00 | — | |||||||||||||||||||||||||
| 11/17/09 | (5) | 10/14/09 | * | — | — | 875,000 | 1,750,000 | — | $ | 3.00 | — | |||||||||||||||||||||||||
| 11/19/09 | (6) | 11/19/09 | — | — | — | 650,000 | — | $ | 3.00 | 903,500 | ||||||||||||||||||||||||||
| 11/19/09 | (5) | 11/19/09 | — | — | 175,000 | 350,000 | — | $ | 3.00 | — | ||||||||||||||||||||||||||
Anthony J. Massetti | — | — | 437,502 | — | — | — | — | — | — | |||||||||||||||||||||||||||
| 11/19/09 | (4) | 11/19/09 | — | — | — | 650,000 | — | $ | 3.00 | 903,500 | ||||||||||||||||||||||||||
| 11/19/09 | (5) | 11/19/09 | — | — | 175,000 | 350,000 | — | $ | 3.00 | — | ||||||||||||||||||||||||||
| 11/19/09 | (6) | 11/19/09 | — | — | — | 162,500 | — | $ | 3.00 | 225,875 | ||||||||||||||||||||||||||
| 11/19/09 | (5) | 11/19/09 | — | — | 43,750 | 87,500 | — | $ | 3.00 | — | ||||||||||||||||||||||||||
| 11/19/09 | (7) | 11/19/09 | — | — | — | 150,000 | — | — | 1,950,000 | |||||||||||||||||||||||||||
J. Joel Hackney, Jr. | — | — | 377,750 | — | — | — | — | — | — | |||||||||||||||||||||||||||
| 12/19/09 | (4) | 11/19/09 | — | — | — | 390,000 | — | $ | 3.00 | 542,100 | ||||||||||||||||||||||||||
| 12/19/09 | (5) | 11/19/09 | — | — | 105,000 | 210,000 | — | $ | 3.00 | — | ||||||||||||||||||||||||||
| 7/1/10 | (4) | 6/28/10 | — | — | — | 520,000 | — | $ | 3.00 | 722,800 | ||||||||||||||||||||||||||
| 7/1/10 | (5) | 6/28/10 | — | — | 140,000 | 280,000 | — | $ | 3.00 | 0 | ||||||||||||||||||||||||||
| 7/1/10 | (8) | 6/28/10 | — | — | — | 100,000 | — | — | 300,000 | |||||||||||||||||||||||||||
James M. Chirico, Jr. | — | — | 470,313 | — | — | — | — | — | — | |||||||||||||||||||||||||||
| 11/17/09 | (4) | 10/14/09 | * | — | — | — | 650,000 | — | $ | 3.00 | 156,000 | |||||||||||||||||||||||||
| 11/17/09 | (5) | 10/14/09 | * | — | — | 175,000 | 350,000 | — | $ | 3.00 | — | |||||||||||||||||||||||||
| 11/17/09 | (4) | 10/14/09 | * | — | — | — | 162,500 | — | $ | 3.00 | — | |||||||||||||||||||||||||
| 11/17/09 | (5) | 10/14/09 | * | — | — | 43,750 | 87,500 | — | $ | 3.00 | — | |||||||||||||||||||||||||
| 11/19/09 | (6) | 11/19/09 | — | — | — | 260,000 | — | $ | 3.00 | 361,400 | ||||||||||||||||||||||||||
| 11/19/09 | (5) | 11/19/09 | — | — | 70,000 | 140,000 | — | $ | 3.00 | — | ||||||||||||||||||||||||||
| 7/1/10 | (8) | 6/28/10 | — | — | — | 75,000 | — | — | 225,000 | |||||||||||||||||||||||||||
Alan E. Baratz | 11/17/09 | (4) | 10/14/09 | * | — | — | — | 715,000 | — | $ | 3.00 | — | ||||||||||||||||||||||||
| 11/17/09 | (5) | 10/14/09 | * | — | — | 192,500 | 385,000 | — | $ | 3.00 | — | |||||||||||||||||||||||||
| 11/19/09 | (6) | 11/19/09 | — | — | — | 325,000 | — | $ | 3.00 | 451,750 | ||||||||||||||||||||||||||
| 11/19/09 | (5) | 11/19/09 | — | — | 87,500 | 175,000 | — | $ | 3.00 | 0 | ||||||||||||||||||||||||||
J. David Manganello | — | — | 175,000 | — | — | — | — | — | — | |||||||||||||||||||||||||||
| 11/17/09 | (4) | 10/14/09 | * | — | — | — | 195,000 | — | $ | 3.00 | 46,800 | |||||||||||||||||||||||||
| 11/17/09 | (5) | 10/14/09 | * | — | — | 52,500 | 105,000 | — | $ | 3.00 | — | |||||||||||||||||||||||||
| 11/19/09 | (6) | 11/19/09 | — | — | — | 97,500 | — | $ | 3.00 | 135,525 | ||||||||||||||||||||||||||
| 11/19/09 | (5) | 11/19/09 | — | — | 26,250 | 52,500 | — | $ | 3.00 | — | ||||||||||||||||||||||||||
The equity incentive awards were made under the 2007 Plan.
Name | Grant Date | Board Approval Date | Estimated Future Payouts Under Non-Equity Incentive Plan Awards | Estimated Future Payouts Under Non-Equity Incentive Plan Awards | Exercise or Base Price of Option Awards(3) | Grant Date Fair Value of Stock and Option Awards(4) | ||||||||||||||||||||||||||||||||||
| Threshold | Target | Maximum | Threshold | Target | Maximum | |||||||||||||||||||||||||||||||||||
Kevin J. Kennedy | — | — | — | $ | 1,562,500 | $ | 2,500,000 | (1) | — | — | — | — | — | |||||||||||||||||||||||||||
| — | 12/22/10 | $ | 937,500 | $ | 1,250,000 | $ | 2,000,000 | (2) | — | — | — | — | — | |||||||||||||||||||||||||||
Anthony J. Massetti | — | — | — | $ | 526,500 | — | (1) | — | — | — | — | — | ||||||||||||||||||||||||||||
| — | 12/22/10 | $ | 422,813 | $ | 563,750 | $ | 902,000 | (2) | — | — | — | — | — | |||||||||||||||||||||||||||
J. Joel Hackney, Jr. | — | — | — | $ | 585,000 | — | (1) | — | — | — | — | — | ||||||||||||||||||||||||||||
| — | 12/22/10 | $ | 487,500 | $ | 650,000 | $ | 1,040,000 | (2) | — | — | — | — | — | |||||||||||||||||||||||||||
| 12/05/11 | 12/05/11 | (5) | — | — | — | 28,409 | 56,818 | — | — | $ | 250,000 | |||||||||||||||||||||||||||||
Thomas G. Mitchell | — | — | — | $ | 400,000 | — | (1) | — | — | — | — | — | ||||||||||||||||||||||||||||
| — | 12/22/10 | $ | 375,000 | $ | 500,000 | $ | 800,000 | (2) | — | — | — | — | — | |||||||||||||||||||||||||||
| 12/05/11 | 12/05/11 | (5) | — | — | — | 22,727 | 45,455 | — | — | $ | 200,000 | |||||||||||||||||||||||||||||
| 02/16/12 | 02/16/12 | (6) | — | — | — | — | 100,000 | — | — | $ | 440,000 | |||||||||||||||||||||||||||||
| 02/16/12 | 02/16/12 | (7) | — | — | — | — | 100,000 | — | $ | 4.40 | $ | 135,850 | ||||||||||||||||||||||||||||
Christopher M. Formant | — | — | — | $ | 425,000 | — | (1) | — | — | — | — | — | ||||||||||||||||||||||||||||
| — | 12/22/10 | $ | 375,000 | $ | 500,000 | $ | 800,000 | (2) | — | — | — | — | — | |||||||||||||||||||||||||||
| 12/05/11 | 12/05/11 | (5) | — | — | — | 22,727 | 45,455 | — | — | $ | 200,000 | |||||||||||||||||||||||||||||
Alan E. Baratz | — | — | — | $ | 607,500 | — | (1) | — | — | — | — | — | ||||||||||||||||||||||||||||
| — | 12/22/10 | $ | 506,250 | $ | 675,000 | $ | 1,080,000 | (2) | — | — | — | — | — | |||||||||||||||||||||||||||
| (1) | Represents fiscal |
|
| (2) | Represents fiscal 2012 threshold, target and maximum potential awards under the 2011—2013 EC Performance Recognition Plan. The 2011—2013 EC Performance Recognition Plan is discussed above within “-Elements of Executive Officer Compensation-Long Term Incentives.” As part of Dr. Baratz’s separation agreement, he forfeited his right to participate in this plan and received a one-time payment of $675,000. See “—Employment, Change in Control and Separation Agreements—Dr. Baratz’s Separation Agreement.” |
| (3) | Under the terms of the 2007 Plan, the |
| Amounts shown represent the grant date fair value of each award as calculated in accordance with ASC 718, without regard to forfeiture assumptions. For more information regarding the valuation of stock-based awards (including assumptions made in such valuation), refer to Note 14, “Share-based Compensation,” to our |
| Represents award opportunities under the 2012 Sales Incentive Program discussed above under “—Elements of Executive Officer Compensation—Long Term Incentives.” Applicable targets were not met. Therefore, no vesting will occur and the awards will be cancelled. |
| (6) | Represents time-based stock option awards vesting 25% annually until fully vested four years from the date of grant. |
| Represents time-based stock option awards vesting 25% annually until fully vested four years from the date of grant and MoM stock options vesting 50% or 100% upon the achievement of certain returns on the Sponsors’ initial investment in the Company as described under “—Elements of Executive Officer |
Outstanding Equity Awards at Fiscal Year End
The following table below sets forth the outstanding equity awards at the end of fiscal year 20102012 for each of the Named Executive Officers:Officers. It does not reflect the results of the stock option exchange program that closed in April 2013 (see “Fiscal 2013 Actions and Changes to Compensation Approach—Stock Option Exchange Offer”).
| OPTION AWARDS | STOCK AWARDS | OPTION AWARDS | STOCK AWARDS | |||||||||||||||||||||||||||||||||||||||||||||||||||||
Name | Number of Securities Underlying Unexercised Options #(1) Exercisable | Number of Securities Underlying Unexercised Options # Unexercisable | Equity Incentive Plan Awards: Number of Securities Underlying Unexercised Unearned Options(2) | Option Exercise Price | Option Expiration Date | Equity Incentive Plan Awards: Number of Unearned Shares, Units or Other Rights That Have Not Vested(3) | Equity Incentive Plan Awards: Market or Payout Value of Unearned Shares, Units or Other Rights That Have Not Vested(4) | Number of Securities Underlying Unexercised Options # Exercisable(1) | Number of Securities Underlying Unexercised Options # Unexercisable | Equity Incentive Plan Awards : Number of Securities Underlying Unexercised Unearned Options(2) | Option Exercise Price | Option Expiration Date | Equity Incentive Plan Awards: Number of Unearned Shares, Units or Other Rights That have Not Vested(3) | Equity Incentive Plan Awards: Market or Payout Value of Unearned Shares, Units or Other Rights That Have Not Vested(4) | ||||||||||||||||||||||||||||||||||||||||||
Kevin J. Kennedy | — | — | 5,000,000 | $ | 3.00 | 11/17/19 | 1,625,000 | — | 3,375,000 | $ | 3.00 | 11/17/19 | ||||||||||||||||||||||||||||||||||||||||||||
| 130,000 | — | 870,000 | $ | 3.00 | 11/19/19 | 390,000 | — | 610,000 | $ | 3.00 | 11/19/19 | |||||||||||||||||||||||||||||||||||||||||||||
| 300,000 | $ | 3,000,000 | 100,000 | $ | 1,000,000 | |||||||||||||||||||||||||||||||||||||||||||||||||||
Anthony J. Massetti | — | — | 1,000,000 | $ | 3.00 | 11/19/19 | 325,000 | — | 675,000 | $ | 3.00 | 11/19/19 | ||||||||||||||||||||||||||||||||||||||||||||
| 32,500 | — | 217,500 | $ | 3.00 | 11/19/19 | 97,500 | — | 152,500 | $ | 3.00 | 11/19/19 | |||||||||||||||||||||||||||||||||||||||||||||
| 150,000 | 1,950,000 | $ | 37,500 | $ | 487,500 | |||||||||||||||||||||||||||||||||||||||||||||||||||
J. Joel Hackney, Jr. | — | — | 600,000 | $ | 3.00 | 12/19/19 | 195,000 | — | 405,000 | $ | 3.00 | 12/19/09 | ||||||||||||||||||||||||||||||||||||||||||||
| — | — | 800,000 | $ | 3.00 | 7/1/20 | 260,000 | — | 540,000 | $ | 3.00 | 07/01/20 | |||||||||||||||||||||||||||||||||||||||||||||
| 100,000 | 300,000 | 56,818 | $ | 227,272 | ||||||||||||||||||||||||||||||||||||||||||||||||||||
James M. Chirico, Jr. | — | — | 1,000,000 | $ | 3.00 | 11/17/19 | ||||||||||||||||||||||||||||||||||||||||||||||||||
Thomas G. Mitchell | 146,250 | — | 753,750 | $ | 3.00 | 03/31/21 | ||||||||||||||||||||||||||||||||||||||||||||||||||
| — | — | 250,000 | $ | 3.00 | 11/17/19 | — | — | 100,000 | $ | 4.40 | 02/16/22 | |||||||||||||||||||||||||||||||||||||||||||||
| 170,455 | $ | 681,820 | ||||||||||||||||||||||||||||||||||||||||||||||||||||||
Christopher M. Formant | 292,500 | — | 607,500 | $ | 3.00 | 11/17/19 | ||||||||||||||||||||||||||||||||||||||||||||||||||
| 52,000 | — | 348,000 | $ | 3.00 | 11/19/19 | 234,000 | — | 366,000 | $ | 3.00 | 11/19/19 | |||||||||||||||||||||||||||||||||||||||||||||
| 75,000 | 225,000 | 45,455 | $ | 181,820 | ||||||||||||||||||||||||||||||||||||||||||||||||||||
Alan E. Baratz | — | — | 1,100,000 | $ | 3.00 | 11/17/19 | 446,875 | — | 653,125 | $ | 3.00 | 11/03/13 | ||||||||||||||||||||||||||||||||||||||||||||
| 65,000 | — | 435,000 | $ | 3.00 | 11/19/19 | 227,500 | — | 272,500 | $ | 3.00 | 11/03/13 | |||||||||||||||||||||||||||||||||||||||||||||
J. David Manganello | — | — | 300,000 | $ | 3.00 | 11/17/19 | ||||||||||||||||||||||||||||||||||||||||||||||||||
| 19,500 | — | 130,500 | $ | 3.00 | 11/19/19 | |||||||||||||||||||||||||||||||||||||||||||||||||||
| (1) | Represents the exercisable portion of stock options granted and outstanding. See “Employment, Change in Control and Separation Agreements—Dr. Baratz’s Separation Agreement.” |
| (2) | The vesting dates for the stock option awards indicated are as follows: |
Name | Original Stock Option Grant | Grant Date | Type of Stock Option Award | Options Per Type | Vesting Description | |||||||||||
Kevin J. Kennedy | 5,000,000 | 11/17/09 | Time-Based | 3,250,000 | 25% annually (4 year full vest) | |||||||||||
| MoM | 1,750,000 | 50% or 100% on the achievement of certain returns on the Sponsors’ initial investment in us | ||||||||||||||
| 1,000,000 | 11/19/09 | Time-Based | 650,000 | 20% on 12/19/09; 20% annually thereafter (fully vested 12/19/13) | ||||||||||||
| MoM | 350,000 | 50% or 100% on the achievement of certain returns on the Sponsors’ initial investment in us | ||||||||||||||
Anthony J. Massetti | 1,000,000 | 11/19/09 | Time-Based | 650,000 | 25% annually (4 year full vest) | |||||||||||
| MoM | 350,000 | 50% or 100% on the achievement of certain returns on the Sponsors’ initial investment in us | ||||||||||||||
| 250,000 | 11/19/09 | Time-Based | 162,500 | 20% on 12/19/09; 20% annually thereafter (fully vested 12/19/13) | ||||||||||||
| MoM | 87,500 | 50% or 100% on the achievement of certain returns on the Sponsors’ initial investment in us | ||||||||||||||
J. Joel Hackney, Jr. | 600,000 | 12/19/09 | Time-Based | 390,000 | 25% annually (4 year full vest) | |||||||||||
| MoM | 210,000 | 50% or 100% on the achievement of certain returns on the Sponsors’ initial investment in us | ||||||||||||||
| 800,000 | 7/1/10 | Time-Based | 520,000 | 25% annually (4 year full vest) | ||||||||||||
| MoM | 280,000 | 50% or 100% on the achievement of certain returns on the Sponsors’ initial investment in us | ||||||||||||||
James M. Chirico, Jr. | 1,000,000 | 11/17/09 | Time-Based | 650,000 | 25% annually (4 year full vest) | |||||||||||
| MoM | 350,000 | 50% or 100% on the achievement of certain returns on the Sponsors’ initial investment in us | ||||||||||||||
| 250,000 | 11/17/09 | Time-Based | 162,500 | 25% annually (4 year full vest) | ||||||||||||
| MoM | 87,500 | 50% or 100% on the achievement of certain returns on the Sponsors’ initial investment in us | ||||||||||||||
| 400,000 | 11/19/09 | Time-Based | 260,000 | 20% on 12/19/09; 20% annually thereafter (fully vested 12/19/13) | ||||||||||||
| MoM | 140,000 | 50% or 100% on the achievement of certain returns on the Sponsors’ initial investment in us | ||||||||||||||
Alan E. Baratz | 1,100,000 | 11/17/09 | Time-Based | 715,000 | 25% annually (4 year full vest) | |||||||||||
| MoM | 385,000 | 50% or 100% on the achievement of certain returns on the Sponsors’ initial investment in us | ||||||||||||||
| 500,000 | 11/19/09 | Time-Based | 325,000 | 20% on 12/19/09; 20% annually thereafter (fully vested 12/19/13) | ||||||||||||
| MoM | 175,000 | 50% or 100% on the achievement of certain returns on the Sponsors’ initial investment in us | ||||||||||||||
J. David Manganello | 300,000 | 11/17/09 | Time-Based | 195,000 | 25% annually (4 year full vest) | |||||||||||
| MoM | 105,000 | 50% or 100% on the achievement of certain returns on the Sponsors’ initial investment in us | ||||||||||||||
| 150,000 | 11/19/09 | Time-Based | 97,500 | 20% on 12/19/09; 20% annually thereafter (fully vested 12/19/13) | ||||||||||||
| MoM | 52,500 | 50% or 100% on the achievement of certain returns on the Sponsors’ initial investment in us | ||||||||||||||
Name | Original Stock Option Grant | Grant Date | Type Of Stock Option Award | Options Per Type | Vesting Description | |||||||||||
Kevin J. Kennedy | 5,000,000 | 11/17/09 | Time-Based | 3,250,000 | 25% annually (4 year full vest) | |||||||||||
| MoM | 1,750,000 | 50% or 100% on the achievement of certain returns on the Sponsors’ initial investment in us | ||||||||||||||
| 1,000,000 | 11/19/09 | Time-Based | 650,000 | 20% on 12/19/09; 20% annually thereafter (fully vested 12/19/13) | ||||||||||||
| MoM | 350,000 | 50% or 100% on the achievement of certain returns on the Sponsors’ initial investment in us | ||||||||||||||
Anthony J. Massetti | 1,000,000 | 11/19/09 | Time-Based | 650,000 | 25% annually (4 year full vest) | |||||||||||
| MoM | 350,000 | 50% or 100% on the achievement of certain returns on the Sponsors’ initial investment in us | ||||||||||||||
| 250,000 | 11/19/09 | Time-Based | 162,500 | 20% on 12/19/09; 20% annually thereafter (fully vested 12/19/13) | ||||||||||||
| MoM | 87,500 | 50% or 100% on the achievement of certain returns on the Sponsors’ initial investment in us | ||||||||||||||
J. Joel Hackney, Jr. | 600,000 | 12/19/09 | Time-Based | 390,000 | 25% annually (4 year full vest) | |||||||||||
| MoM | 210,000 | 50% or 100% on the achievement of certain returns on the Sponsors’ initial investment in us | ||||||||||||||
| 800,000 | 07/01/10 | Time-Based | 520,000 | 20% on 12/19/09; 20% annually thereafter (fully vested 12/19/13) | ||||||||||||
| MoM | 280,000 | 50% or 100% on the achievement of certain returns on the Sponsors’ initial investment in us | ||||||||||||||
Thomas G. Mitchell | 900,000 | 03/31/11 | Time-Based | 585,000 | 25% annually (4 year full vest) | |||||||||||
| MoM | 315,000 | 50% or 100% on the achievement of certain returns on the Sponsors’ initial investment in us | ||||||||||||||
| 100,000 | 02/16/12 | Time-Based | 65,000 | 25% annually (4 year full vest) | ||||||||||||
| MoM | 35,000 | 50% or 100% on the achievement of certain returns on the Sponsors’ initial investment in us | ||||||||||||||
Christopher M. Formant | 900,000 | 11/17/09 | Time-Based | 585,000 | 25% annually (4 year full vest) | |||||||||||
| MoM | 315,000 | 50% or 100% on the achievement of certain returns on the Sponsors’ initial investment in us | ||||||||||||||
| 600,000 | 11/19/09 | Time-Based | 390,000 | 25% annually (4 year full vest) | ||||||||||||
| MoM | 210,000 | 50% or 100% on the achievement of certain returns on the Sponsors’ initial investment in us | ||||||||||||||
Alan E. Baratz | 1,100,000 | 11/17/09 | Time-Based | 715,000 | No future vesting. See Dr. Baratz’s Separation Agreement. | |||||||||||
| MoM | 385,000 | No future vesting. See Dr. Baratz’s Separation Agreement. | ||||||||||||||
| 500,000 | 11/19/09 | Time-Based | 325,000 | No future vesting. See Dr. Baratz’s Separation Agreement. | ||||||||||||
| MoM | 175,000 | No future vesting. See Dr. Baratz’s Separation Agreement. | ||||||||||||||
| (3) | Represents awards of RSUs made pursuant to Mr. Kennedy’s employment agreement and Mr. Massetti’s offer of |
Name | RSU Award | Grant Date | RSUs Vested | RSUs Unvested | Vesting Description | RSU Award | Grant Date | RSUs Vested | RSUs Cancelled | RSUs Unvested | Vesting Description | |||||||||||||||||||||||||||||
Kevin J. Kennedy | 400,000 | 12/22/08 | 100,000 | 300,000 | 25% Annually (4 years to full vest) | 400,000 | 12/22/08 | 300,000 | — | 100,000 | 25% Annually | |||||||||||||||||||||||||||||
Anthony J. Massetti | 150,000 | 11/19/09 | — | 150,000 | 50% on 11/19/10; 25% on each of 11/19/11 and 11/19/12 | 150,000 | 11/19/09 | 112,500 | — | 37,500 | 50% after year 1, 25% after years 2 & 3 | |||||||||||||||||||||||||||||
J. Joel Hackney, Jr. | 100,000 | 7/1/10 | — | 100,000 | 50% Annually (2 years to full vest) | 56,818 | 12/05/11 | — | — | 56,818 | Sales Incentive | |||||||||||||||||||||||||||||
James M. Chirico, Jr. | 75,000 | 7/1/10 | — | 75,000 | 50% Annually (2 years to full vest) | |||||||||||||||||||||||||||||||||||
Thomas G. Mitchell | 45,455 | 12/05/11 | — | — | 45,455 | Sales Incentive | ||||||||||||||||||||||||||||||||||
| 50,000 | 03/31/11 | 25,000 | — | 25,000 | 50% after year 1 & year 2 | |||||||||||||||||||||||||||||||||||
| 100,000 | 02/16/12 | — | — | 100,000 | 25% annually | |||||||||||||||||||||||||||||||||||
Christopher M. Formant | 45,455 | 12/05/11 | — | — | 45,455 | Sales Incentive | ||||||||||||||||||||||||||||||||||
| 50,000 | 02/27/09 | 50,000 | — | — | 100% on 2/27/11 | |||||||||||||||||||||||||||||||||||
Alan E. Baratz | 100,000 | 04/01/11 | 50,000 | 50,000 | — | 50% after year 1 & year 2 | ||||||||||||||||||||||||||||||||||
| (4) | Determined using the fair market value of our common stock on the last day of the fiscal year, which was |
Options Exercised and Stock Vested
During fiscal year 2010,2012, there were no exercises of stock options by any of the Named Executive Officers. The following table sets forth the vesting of RSU awards in fiscal year 2010:2012:
Name Kevin J. Kennedy Anthony J. Massetti J. Joel Hackney, Jr. Thomas G. Mitchell Christopher M. Formant Alan E. Baratz | ||||||||||||||||||||||||||||||||||||||||||||||||||||||||||||||||||||||||||||||||||||||||||||||||||||||||||||||||||||||||||||||||||||||||||||||||||||||||
| ||||||||||||||||||||||||||||||||||||||||||||||||||||||||||||||||||||||||||||||||||||||||||||||||||||||||||||||||||||||||||||||||||||||||||||||||||||||||
| ||||||||||||||||||||||||||||||||||||||||||||||||||||||||||||||||||||||||||||||||||||||||||||||||||||||||||||||||||||||||||||||||||||||||||||||||||||||||
| ||||||||||||||||||||||||||||||||||||||||||||||||||||||||||||||||||||||||||||||||||||||||||||||||||||||||||||||||||||||||||||||||||||||||||||||||||||||||
| ||||||||||||||||||||||||||||||||||||||||||||||||||||||||||||||||||||||||||||||||||||||||||||||||||||||||||||||||||||||||||||||||||||||||||||||||||||||||
| ||||||||||||||||||||||||||||||||||||||||||||||||||||||||||||||||||||||||||||||||||||||||||||||||||||||||||||||||||||||||||||||||||||||||||||||||||||||||
| ||||||||||||||||||||||||||||||||||||||||||||||||||||||||||||||||||||||||||||||||||||||||||||||||||||||||||||||||||||||||||||||||||||||||||||||||||||||||
| (1) | Represents shares subject to an RSU award granted to Mr. Kennedy pursuant to his employment agreement, the receipt of which shares has been deferred. The shares will be delivered on, or within thirty (30) days before or after, the earliest to occur of the following: (i) a “change in control event,” (ii) December 22, 2012, (iii) Mr. Kennedy’s termination by the Company without “cause” or (iv) Mr. Kennedy’s voluntary termination of employment for “good reason” (with each term having the meaning assigned to it in his RSU award agreement and the 2007 Plan). The amount that vested represents the |
| (2) | Represents shares subject to an RSU award granted to Mr. |
| (3) | Represents shares subject to an RSU award granted to Mr. Mitchell in recognition of his increased role and responsibilities within the Company. This is the first of two installments of 50% each occurring on March 31, 2012 and March 31, 2013 subject to certain restrictions including, but not limited to, continued employment and change in control events. |
| (4) | As noted above, except with respect to Dr. Baratz, the receipt of shares subject to each of these RSU awards has been deferred. Had the shares been delivered to the recipients on vesting, the value realized by each individual per share would have been |
Pension Benefits
As discussed in the Compensation Discussion and Analysis (see “Elements of Executive Officer Compensation—Other Compensation—Post-Employment Benefit Information—Pension Plans”), the Company maintains the APPSE and the ASPP. Of the Named Executive Officers, only Mr. Manganello is eligible to participate in either of these plans as he is the only Named Executive Officer hired before December 31, 2003, the date on which the benefits under these plans were frozen.
The APPSE is a non-contributory qualified pension plan that covers U.S. salaried employees hired before January 1, 2004 and is divided into a Service-Based Program (for those hired before January 1, 1999) and an Account Balance Program (for those hired January 1, 1999 through December 31, 2003). The Service-Based Program provides a traditional pension benefit and the Account Balance Program, in which Mr. Manganello participates, provides a formula of pay-based and interest credits. The APPSE (Account Balance Program)
provided pay credits each January 1st from 1999 through 2004. Based on a participant’s age as of January 1, between 3% and 10% of eligible pay was credited to his or her account. Annual interest credits are posted each December 31st for as long as a participant continues to have an account balance. The interest rate may vary from a minimum annual rate of 4% to a maximum of 10% as determined by Avaya. There is a three-year cliff vesting schedule (five-year cliff vesting schedule before January 1, 2008). After termination of employment for any reason, participants may receive their vested benefit. When the present value of the vested benefit exceeds $1,000, participants may choose between an annuity option, lump sum distribution, rollover into the Avaya 401(k) Plan, rollover into an IRA or another employer’s qualified plan, or they can keep their balance in the Plan and allow it to continue to grow with annual interest credits.
The ASPP is intended to constitute both (i) an unfunded “excess benefit plan” as defined in § 3(36) of ERISA, and (ii) an unfunded plan primarily for the purpose of providing deferred compensation and pension benefits for a select group of management or highly compensated employees for purposes of Title I of ERISA. To the extent that the total amount of credits added to an individual’s account under the APPSE exceed limitations under the Code in any given year, the amount of the excess is added to that individual’s account under the ASPP. For fiscal year 2010, that annual Code limitation was $195,000. In general the ASPP mirrors the APPSE in annual interest credit rates and distribution options.
| ||||||||||||||
| ||||||||||||||
| ||||||||||||||
| ||||||||||||||
| ||||||||||||||
| ||||||||||||||
| ||||||||||||||
Nonqualified Deferred Compensation
The table below sets forth information concerning all nonqualified deferred compensation earned by each of the Named Executive Officers during fiscal year 2010.2012.
All information represents data from the ASRP, a nonqualified defined contribution plan designed to restore lost tax-deferred savings opportunities for executives unavailable under the ASPSE, the Company’s qualified savings plan, due to Code limitations. Executives may contribute from 1-25% of eligible compensation (including base pay, short-term disability payments, short-term incentive compensation and marketing/sales compensation paid after the executive reaches the maximum contribution and/or compensation limit established by the Code). Effective March 1, 2009, and through the end of fiscal year 2010, the Company suspended matching contributions to this plan. Earnings are based on the individual fund allocations selected by each participant from among the variety of different investment fund choices available; investment elections can be changed daily, subject to certain funds’ trading restrictions.
Name | Executive Contributions in the Last Fiscal Year | Registrant Contributions in the Last Fiscal Year | Aggregate Earnings in the Last Fiscal Year | Aggregate Withdrawals / Distributions in the Last Fiscal Year | Aggregate Balance at the Last Fiscal Year End(1) | |||||||||||||||
Kevin J. Kennedy | $ | 74,984 | $ | — | $ | 5,987 | $ | — | $ | 108,551 | ||||||||||
Anthony J. Massetti | — | — | — | — | — | |||||||||||||||
J. Joel Hackney, Jr. | — | — | — | — | — | |||||||||||||||
James M. Chirico, Jr. | 18,877 | — | 10,250 | — | 116,314 | (2) | ||||||||||||||
Alan E. Baratz | — | — | — | — | — | |||||||||||||||
J. David Manganello | 3,298 | — | 3,075 | — | 49,589 | |||||||||||||||
All participants are fully vested.
Name | Executive Contributions in the Last Fiscal Year | Registrant Contributions in the Last Fiscal Year | Aggregate Earnings in the Last Fiscal Year | Aggregate Withdrawals / Distributions in the Last Fiscal Year | Aggregate Balance at the Last Fiscal Year End | |||||||||||||||
Kevin J. Kennedy | $ | 68,747 | — | $ | 10,527 | — | $ | 246,079 | ||||||||||||
Anthony J. Massetti | — | — | — | — | — | |||||||||||||||
J. Joel Hackney, Jr. | $ | 30,432 | — | $ | 4,613 | — | $ | 50,356 | ||||||||||||
Thomas G. Mitchell | — | — | — | — | — | |||||||||||||||
Christopher M. Formant | $ | 16,758 | — | $ | 8,401 | — | $ | 68,349 | ||||||||||||
Potential Payments on Occurrence of Change of Control and Other Events
General
The sections below indicate amounts that could have been received by each of the Named Executive Officers following, or in connection with, involuntary separation and resignation/retirement. The sections assume that the triggering event happened as of September 30, 2010.2012. It should be noted that each of the sections below represents the various amounts that could have been received by the Named Executive Officers under alternative scenarios, and they are not cumulative in nature.
Involuntary Separation
Cash and Benefits
During fiscal year 2010,2012, the Named Executive Officers with the exception of Mr. Manganello (see below), were participants under the Avaya Inc. Involuntary Separation Plan for Senior Officers, or the Senior Officer Plan. The Plan is designed to provide a specific payment and certain benefit enhancements to eligible “Senior Officers” of Avaya and its affiliated companies and subsidiaries in the event that their employment is involuntarily terminated under certain conditions.
The Senior Officer Plan covers the CEO and each other officer of the Company who is elected by the Company’s board of directors at a level above vice president and who is designated “At Risk” under the Avaya Force Management Program Guidelines.
The Senior Officer Plan provides that a Senior Officer is “At Risk” if there is a Company initiated termination other than for “cause,” defined as: (i) a material breach of duties and responsibilities as an executive officer of the Company (other than as a result of incapacity due to physical or mental illness) which is demonstrably willful and deliberate, which is committed in bad faith or without reasonable belief that such breach is in the best interests of the Company and which is not remedied in a reasonable period of time after receipt of written notice from the Company specifying such breach; (ii) conviction (including a plea of guilty or nolo contendere) of a felony involving moral turpitude; (iii) the commission of theft, fraud, breach of trust or any act of dishonesty involving the Company or its subsidiaries; or (iv) any significant violation of the Company’s Code of Conduct or any statutory or common law duty of loyalty to the Company or its subsidiaries.
In the event that a Senior Officer (other than Mr. Kennedy) is terminated by the Company other than for “cause,” that Senior Officer is entitled to receive under the Senior Officer Plan, upon executing a termination agreement and release, 100% of final annual base salary, along with certain other benefits to continue for a period of time post-termination of employment, including certain medical benefits as prescribed by applicable law, and outplacement services. With respect to Mr. Kennedy, the terms of his employment agreement provide that his involuntary termination would be governed by the same plan, but he would be entitled to 200% of his base salary plus 200% of his target STIP award for the year of termination, in addition to the other benefits offered generally to Senior Officers under the Senior Officer Plan.
Mr. Manganello was not a Senior Officer as defined by the Senior Officer Plan on September 30, 2010. Instead, he was eligible to participate in the Avaya Inc. Involuntary Separation Plan for Vice Presidents, or the VP Plan. The VP Plan is designed to provide a specific payment and certain benefit enhancements to eligible “Vice Presidents” of Avaya and its affiliated companies and subsidiaries who have been designated “At Risk” under the Avaya Force Management Program Guidelines. The term “At Risk” under the VP Plan has the same definition as under the Senior Officer Plan. In the event that a vice president is terminated by the Company other than for “cause,” that vice president is entitled to receive under the VP Plan, upon executing a termination agreement and release, a payment of 50% of final annual base salary, along with certain other benefits to continue for a period of time post-termination of employment, including certain medical benefits as prescribed by applicable law, and outplacement services.
The table below represents amounts that could have been received by each of the Named Executive Officers as of September 30, 2010,2012, assuming an involuntary separation occurred on that date.
Name | Cash Payment Based on Salary(1) | Cash Payment Based on Target Bonus(2) | Outplacement Services(3) | Total | ||||||||||||
Kevin J. Kennedy | $ | 2,500,000 | $ | 2,500,000 | $ | 10,000 | $ | 5,010,000 | ||||||||
Anthony J. Massetti | 550,000 | 420,750 | 10,000 | 980,750 | ||||||||||||
J. Joel Hackney, Jr. | 650,000 | 398,125 | 10,000 | 1,058,125 | ||||||||||||
James M. Chirico, Jr. | 625,000 | 484,375 | 10,000 | 1,119,375 | ||||||||||||
Alan E. Baratz | 600,000 | — | 10,000 | 610,000 | ||||||||||||
J. David Manganello | 175,000 | 175,000 | 10,000 | 360,000 | ||||||||||||
Name | Cash Payment Based on Salary(1) | Cash Payment Based on Target Bonus(2) | Outplacement Services(3) | Total | ||||||||||||
Kevin J. Kennedy | $ | 2,500,000 | $ | 3,125,000 | $ | 10,000 | $ | 5,635,000 | ||||||||
Anthony J. Massetti | $ | 563,750 | $ | 507,375 | $ | 10,000 | $ | 1,081,125 | ||||||||
Joel J. Hackney | $ | 650,000 | $ | 585,000 | $ | 10,000 | $ | 1,245,000 | ||||||||
Thomas G. Mitchell | $ | 500,000 | $ | 400,000 | $ | 10,000 | $ | 910,000 | ||||||||
Christopher M. Formant | $ | 500,000 | $ | 425,000 | $ | 10,000 | $ | 935,000 | ||||||||
| (1) | Amounts represent two times annual base salary for Mr. Kennedy, and one times annual base salary for each of Messrs. Massetti, Hackney, |
| (2) | Amount for Mr. Kennedy is equal to two times his target STIP award as per his employment agreement. Amounts indicated for Named Executive Officers other than Mr. Kennedy assume that the last date of employment was September 30, |
| (3) | Represents an estimated cost to the Company for outplacement services based upon historical experience. |
Stock Options
Termination without Cause (Outside of the Change in Control Context)
If an employee is terminated without “cause,” generally there would be an acceleration of vesting of time-based stock options as follows: one quarter of the shares that otherwise would have vested at the end of the vesting year had the termination not occurred will vest for each partial or full quarter in which the optionee was employed during that vesting year. “Vesting year” means a twelve-month period beginning on the date of grant or an anniversary of the date of grant, as applicable, and ending on the first anniversary of such beginning date. There would be no acceleration of vesting of MoM stock options.
Generally, the employee would have 90 days post-termination of employment to exercise any vested stock options, and any unvested stock options would be forfeited as of the date of termination. However, Mr. Kennedy’s employment agreement would allow him 12 months, and not 90 days, to exercise his vested stock options in such an event. Had each of Messrs. Kennedy, Massetti, Hackney, Chirico, Baratz and Manganello been involuntarily terminated without cause as of September 30, 2010, they would have 942,500, 195,000, 130,000, 255,125, 243,750 and 68,250 stock options, respectively, for which vesting would be accelerated. However, because the exercise prices for those stock options were equal toAs the fair market value of a share of our common stock on that date, no value would be attributed toSeptember 30, 2012 was $4.00, and the exercise price of each option held by the Named Executive Officers was $3.00, with the exception of one award for Mr. Mitchell having an exercise price of $4.40, the number of stock options for which vesting would be accelerated due to an involuntary termination as of September 30, 2012 and the value of the accelerated options is represented in connection with such accelerated vesting.the table below.
Name | Number of Time-based Stock Options Accelerated Vesting | Exercise Price | Value of Accelerated Vesting Options | |||||||||
Kevin J. Kennedy | 942,500 | $ | 3.00 | $ | 942,500 | |||||||
Anthony J. Massetti | 195,000 | $ | 3.00 | $ | 195,000 | |||||||
Joel J. Hackney | 130,000 | $ | 3.00 | $ | 130,000 | |||||||
Thomas G. Mitchell | 73,125 | $ | 3.00 | $ | 73,125 | |||||||
| 12,188 | $ | 4.40 | — | |||||||||
Christopher M. Formant | 224,250 | $ | 3.00 | $ | 224,250 | |||||||
Termination without Cause (Change in Control Context)
Stock option award agreements also contain certain provisions that are triggered upon a change in control. Under the 2007 Plan, “change in control” is defined to mean the acquisition by a person or group of at least forty percent (40%) of the issued and outstanding shares of common stock or securities representing at least forty percent (40%) of the voting power of Avaya Holdings Corp.
With respect to time-based stock options, if an employee is terminated without cause within one-year following a change in control, then, unless the stock option has been terminated, exercised or exchanged for other current or deferred cash or property in connection with the change in control, the time-based stock option is treated as having vested in full immediately prior to such termination of employment. There would be no acceleration of vesting of MoM stock options.
Generally, a terminated employee would have 90 days post-termination of employment to exercise any of such vested time-based stock options. Mr. Kennedy’s employment agreement would allow him 12 months to exercise all of his stock options, including any vested MoM stock options, in such an event. Messrs. Kennedy, Massetti, Hackney, Chirico, Baratz and Manganello would have 3,770,000, 780,000, 910,000, 1,020,500, 975,000 and 273,000 stock options, respectively, for which vesting would be accelerated upon termination following a change in control as of September 30, 2010. However, because the exercise prices for those stock options were equal toAs the fair market value of a share of our common stock on that date, no value would be attributed toSeptember 30, 2012 was $4.00, and the exercise price of each option held by the Named Executive Officers was $3.00, with the exception of one award for Mr. Mitchell having an exercise price of $4.40, the number of stock options for which vesting would be accelerated due to an involuntary termination due to a change in connection with suchcontrol as of September 30, 2012 and the value of the accelerated vesting.options is represented in the table below.
Name | Number of Time-based Stock Options Accelerated Vesting | Exercise Price | Value of Accelerated Vesting Options | |||||||||
Kevin J. Kennedy | 1,885,000 | $ | 3.00 | $ | 1,885,000 | |||||||
Anthony J. Massetti | 390,000 | $ | 3.00 | $ | 390,000 | |||||||
Joel J. Hackney | 455,000 | $ | 3.00 | $ | 455,000 | |||||||
Thomas G. Mitchell | 438,750 | $ | 3.00 | $ | 412,750 | |||||||
| 65,000 | $ | 4.40 | — | |||||||||
Christopher M. Formant | 448,500 | $ | 3.00 | $ | 448,500 | |||||||
Restricted Stock Units
RSU awards issued under the 2007 Plan generally provide for accelerated vesting upon termination without “cause” or upon a termination following a change in control. Had a termination occurred on September 30, 2010, the unvested RSUs granted to each of Messrs. Kennedy, Massetti, Hackney and Chirico representing 300,000, 150,000, 100,000 and 75,000 shares, respectively, would have vested on an accelerated basis. UsingAs the fair market value of a share of our common stock on September 30, 20102012 was $4.00, the number of $3.00,RSUs granted for which vesting would be accelerated due to an involuntary termination as of September 30, 2012 and the value of the accelerated RSUs for eachis represented in the table below.
Name | Number of Restricted Stock Units Accelerated Vesting | Exercise Price | Value of Accelerated Vesting Units | |||||||||
Kevin J. Kennedy | 100,000 | $ | 4.00 | $ | 400,000 | |||||||
Anthony J. Massetti | 37,500 | $ | 4.00 | $ | 150,000 | |||||||
J. Joel Hackney, Jr. | — | $ | — | — | ||||||||
Thomas G. Mitchell | 125,000 | $ | 4.00 | $ | 500,000 | |||||||
Christopher M. Formant | — | $ | — | — | ||||||||
In addition to the acceleration of those individuals would be $900,000, $450,000, $300,000 and $225,000 respectively. In addition,RSUs noted, to the extent that receipt of shares underlying previously vested RSUs has been deferred, those shares would also be distributed upon termination without “cause.” With respect to eachAs the fair market value of a share of our common stock on September 30, 2012 was $4.00, the number of shares and value of previously vested and deferred for Messrs. Kennedy and Chirico of 100,000 and 50,000, respectively,shares is represented in the value as of September 30, 2010 would have been $300,000 and $150,000, respectively. table below.
Name | Number of Restricted Stock Units Deferred Vesting | Exercise Price | Value of Deferred Vesting Units | |||||||||
Kevin J. Kennedy | 300,000 | $ | 4.00 | $ | 1,200,000 | |||||||
Anthony J. Massetti | 112,500 | $ | 4.00 | $ | 450,000 | |||||||
J. Joel Hackney, Jr. | — | $ | — | $ | — | |||||||
Thomas G. Mitchell | 25,000 | $ | 4.00 | $ | 100,000 | |||||||
Christopher M. Formant | 50,000 | $ | 4.00 | $ | 200,000 | |||||||
Pursuant to Mr. Kennedy’s employment agreement, and Mr. Massetti’s offer of employment, eachhe has the right to require us to repurchase shares issued upon the vesting of their RSU awardshis initial award of RSUs at $10 and $13 per share respectively, inunder certain circumstances (see “—Employment, Change in Control and Separation Agreements” for further details).
Resignation/Retirement
Cash and Benefits
Mr. Kennedy’s employment agreement provides that, in the event he resigns for “good reason,” he would be entitled to receive the same amount as set forth under “Involuntary Separation—CashSeparation-Cash and Benefits” above. Under the agreement, “good reason” means: a material reduction by the Company in his base salary; a material breach of the agreement by the Company which shall include a material reduction or material negative change by the Company in the type or level of compensation and benefits (other than base salary) to which he is entitled under the agreement, other than any such reduction or change that is part of and consistent with a general reduction or change applicable to all senior officers of the Company; a material failure by the Company to pay or provide to him any compensation or benefits to which he is entitled; a change in Mr. Kennedy’s status, positions, titles,
offices or responsibilities that constitutes a material and adverse change from his status, positions, titles, offices or responsibilities as in effect immediately before such change; the assignment to him of any duties or responsibilities that are materially and adversely inconsistent with his status, positions, titles, offices or responsibilities as in effect immediately before such assignment; any removal of Mr. Kennedy from or failure to reappoint or reelect him to any of such positions, titles or offices; the Company changing the location of its principal executive offices to a location more than 50 miles from its current principal office; any material breach by us or the CompanyAvaya Inc. of the agreement or any other agreement between us or Avaya Inc. and Mr. Kennedy incorporated by reference in the agreement; or the provision of notice by the Avaya Inc. of its intention not to renew the agreement.
In all other contexts, upon resignation or retirement, there would be no continuation of benefits (other than certain medical benefits as prescribed by applicable law) and no additional payments made under any of the Company’s defined contribution (qualified and nonqualified) plans to any of the Named Executive Officers, other than as set forth under the “Nonqualified Deferred Compensation Plans” table.
Equity Awards
Generally, each of the Named Executive Officers has up to 30 days subsequent to a resignation to exercise vested stock options, and any unvested stock options as of the date of termination of employment are forfeited. If the resignation is for “good reason” (as defined in the 2007 Plan), then each of the Named Executive Officers would have 90 days from the date of such termination to exercise any vested stock options. However, Mr. Kennedy’s employment agreement provides that, with respect to his stock option awards, he would have 12 months, and not 90 days, following his termination of employment to exercise those stock options.
In addition, with respect to time-based stock options, if the resignation is for “good reason” and it occurs within one-year following a change in control (as defined under the 2007 Plan), then, unless the time-based stock option has been terminated, exercised or exchanged for other current or deferred cash or property in connection with the change in control, the time-based stock option is treated as having vested in full immediately prior to such termination of employment. For a summary of the time-based stock options held by each of the Named Executive Officers, please see “Outstanding Equity Awards at Fiscal Year-End.” The Named Executive Officers would have received nonumber and value upon an acceleration of these time-based stock options as of September 30, 2010, because the exercise price was equalshares accelerated on resignation for “good reason” is identical to the fair market value of a share of our common stock on such date.section above labeled “Termination withoutCause (Change in Control Context).”
Confidentiality; Non-Compete; Non-Solicitation; Recoupment of Profits
All of the Company’s senior officers, including the Named Executive Officers, have signed confidentiality agreements as a requirement for receiving certain stock-based compensation. The agreements stipulate that these officers will not misappropriate or disclose the Company’s proprietary information.
The agreements generally provide that, during the term of their employment and for a period of twelve months from the date of termination of employment, the officers will not directly or indirectly: (i) subject to
certain exceptions, work for or provide services to, in any capacity, whether as an employee, independent contractor or otherwise, whether with or without compensation, a material competitor of the Company; (ii) hire or solicit for hire any employee of the Company or seek to persuade or induce any employee of the Company to discontinue employment with the Company; (iii) hire or engage any independent contractor providing services to the Company, or solicit, encourage or induce any independent contractor providing services to the Company to terminate or diminish in any substantial respect its relationship with the Company; (iv) subject to certain limitations, (a) solicit, encourage or induce any customer of the Company to terminate or diminish in any substantial respect its relationship with the Company or (b) seek to persuade or induce any such customer or prospective customer of the Company to conduct with anyone else any substantial business or activity which such customer or prospective customer conducts or could conduct with the Company.
If the officers breach the provisions of these agreements, then the Company shall, in addition to any other remedies available to it, have the right to institute legal proceedings to enjoin the offending conduct. In addition, the Company generally has the immediate right to call and repurchase any shares of stock that have been issued under any stock options that have been awarded to the optionee by the Company at a purchase price that is the lesser of cost or fair market value.
Director Compensation
We currently do not pay ourIn August 2011, we implemented a non-affiliated director compensation program in which independent directors any compensation for servingwill receive an initial grant of restricted stock units with a market value of $200,000 upon joining the board of directors and an annual retainer of $100,000 in cash (which shall be reduced to $80,000 at such time as we have at least three independent directors on our board of directors) plus restricted stock units with a market value of $150,000. Each independent director who serves on the Audit Committee, Compensation Committee and Nominating and Governance Committee will receive an additional $10,000 as part of his annual retainer in lieu of meeting attendance fees. The Audit Committee Chairperson will receive an additional $20,000 as part of his annual retainer and each of the Compensation Committee Chairperson and the Nominating and Governance Committee Chairperson will receive an additional $15,000 as part of his annual retainer. Eligible directors may elect to receive their cash retainers in the form of restricted stock units, provided that at least 50% of their aggregate annual compensation must be in the form of restricted stock units. Each restricted stock unit granted under the director compensation program will vest immediately upon issuance and be distributed to a director upon his or her resignation or removal from the board of directors. The market value of all restricted stock units granted under the director compensation program will be established based on the closing price of a share of the Company’s common stock on the date prior to the date on which such director is elected or appointed to serve.
In December 2011, the Company and Avaya Inc. appointed Mr. Gary Smith as an independent director to serve on their respective boards of directors and noon our Audit and Compensation Committees. Upon his election, he received an initial grant of 79,546 restricted stock units, representing an inaugural grant of 45,455 restricted stock units and an annual equity grant of 34,091 restricted stock units. In addition, of his total annual retainer worth $120,000, based on his service on the board and his appointment as a member of the Audit and Compensation Committees, Mr. Smith elected to receive that retainer $60,000 in cash and $60,000 in restricted stock units (equaling 13,636 restricted stock units). All restricted stock units were awarded to Mr. Smith based upon the fair market value of our common stock on December 6, 2011, the date of grant, which was $4.40 per share. The restricted stock units were granted pursuant to the terms of the 2007 Plan and were fully vested on the date of grant. The shares underlying the restricted stock units will not be distributed to him until his resignation or removal from the board of directors.
Below is a summary of the compensation received by Mr. Smith for his service as a director of the Company and Avaya Inc. during fiscal 2012. Except as indicated below, none of our other directors received compensation from us for service on the board of directors during the fiscal year ended September 30, 2010.2012:
Prior to completion of this offering, we expect to adopt a director compensation policy. Under such policy, non-affiliated directors will receive a $ annual retainer, a $ attendance fee for each regular meeting, and a $ attendance fee for each committee meeting. The Audit Committee Chairperson will receive an additional $ as part of his annual retainer, the Compensation Committee Chairperson will receive an additional $ as part of his annual retainer and the Nominating and Governance Committee Chairperson will receive an additional $ as part of his annual retainer. Each other Audit Committee, Compensation Committee and Nominating and Governance Committee member will receive an additional $ as part of his annual retainer.
Name | Fees Earned or Paid in Cash ($) | Stock Awards ($)(1) | Option Awards ($) | Non- Equity Incentive Plan Comp. ($) | Change in Pension Value and Non- Qualified Deferred Comp.on Earnings ($) | All Other Comp. ($)(2) | Total ($) | |||||||||||||||||||||
Gary Smith | $ | 60,000 | $ | 410,001 | $ | — | $ | — | $ | — | $ | 788 | $ | 470,789 | ||||||||||||||
Following his tenure as interim Chief Executive Officer from June 30, 2008 to December 22, 2008, the Compensation Committee granted to Mr. Giancarlo a one time recognition award in the form of (i) $1,000,000 paid by the Company in January 2009 and (ii) a grant of 500,000 stock options under the 2007 Plan. Mr. Giancarlo was eligible for, and elected to participate in, the stock option exchange program with respect to those 500,000 stock options. Please see “—Elements of Executive Officer Compensation—Long Term Incentives—Stock Option Awards—Fiscal Year 2010 Awards” for more information regarding the stock option exchange program. His replacement stock option award for 500,000 options was granted as described on November 17, 2010, with an exercise price of $3.00 per share. As described in footnote 8 of the Summary Compensation Table, there was no incremental fair value of the replacement stock options granted to Mr. Giancarlo, calculated in accordance with ASC 718. As of September 30, 2010 this award of stock options held no financial value for Mr. Giancarlo because the exercise price was equal to the fair market value of a share of our common stock on such date.
| (1) | Amount represents the aggregate grant date fair value of the awards as calculated in accordance with FASB ASC Topic 718, “Compensation-Stock Compensation,” or ASC 718, without regard to forfeiture assumption. For more information regarding the valuation of stock-based awards (including assumptions made in such valuation), refer to Note 14, “Share-based Compensation,” to our audited Consolidated Financial Statements included elsewhere in this report. |
| (2) | This amount represents the cost of communications equipment provided to each of the Company’s non-employee directors for the purpose of showcasing the Company’s technology to customers and other third parties. |
CERTAIN RELATIONSHIPS AND RELATED PARTY TRANSACTIONS
Arrangements with Our Sponsors
In connection with their investment in us, we entered into certain stockholder agreements and registrationsregistration rights agreements with the Sponsors and various co-investors. Certain of those agreements were amended in connection with the financing of the NES acquisition and again in connection with the financing of the Radvision acquisition (see Note 9, “Financing Arrangements,” to our unaudited consolidated financial statementsConsolidated Financial Statements for the periodfiscal year ended March 31, 2011September 30, 2012 for more information). The co-investors include individuals and entities invited by our Sponsors to participate in our financings, such as affiliated investment funds, individuals employed by affiliates of our Sponsors, limited partners of our Sponsors and members of our management. In addition, we entered into a management services agreement with affiliates of the Sponsors and, from time to time, we may enter into various other contracts with companies affiliated with our Sponsors.
Stockholders’ Agreement
In connection with the Merger, we entered into a stockholders’ agreement with the Sponsors and certain of their affiliates. This stockholders’ agreement was amended and restated in connection with the financing of the NES acquisition and again in connection with the financing of the Radvision acquisition. The stockholders’ agreement contains certain restrictions on the Sponsors’ and their affiliates’ transfer of our equity securities, contains provisions regarding participation rights, and rights of first refusal upon disposition of shares, contains standard tag-along and drag-along provisions, provides for the election of our directors, mandates board approval of certain matters to include the consent of each Sponsor and generally sets forth the respective rights and obligations of the stockholders who are parties to that agreement. In connectionNone of our officers or directors are parties to this agreement, although our non-employee directors may have an indirect interest in the agreement to the extent of their affiliations with the consummation of this offering, certain of the provisions in the stockholders’ agreement are likely to be terminated or amended.Sponsors.
Registration Rights Agreement
In addition, in connection with the Merger, we entered into a registration rights agreement with the Sponsors and certain of their affiliates which was amended and restated in connection with the financing of the NES acquisition and again in connection with the financing of the Radvision acquisition. Pursuant to the registration rights agreement, as amended, we will provide the Sponsors and certain of their affiliates party thereto with certain demand registration rights following the expiration of the 180-day lockup period in respect of the shares of our common stock held by them. In addition, in the event that we register additional shares of common stock for sale to the public following the consummation of this offering, we will be required to give notice of such registration to the Sponsors and their affiliates party to the agreement of our intention to effect such a registration, and, subject to certain limitations, the Sponsors and such holders will have piggyback registration rights providing them with the right to require us to include shares of common stock held by them in such registration. We will be required to bear the registration expenses, other than underwriting discounts and commissions and transfer taxes, if any, associated with any registration of shares by the Sponsors or other holders described above. We have agreed to indemnify each holder of our common stock covered by the registration rights agreement for violations of federal or state securities laws by us in connection with any registration statement, prospectus or any preliminary prospectus. Each holder of such securities has in turn agreed to indemnify us for federal or state securities law violations that occur in reliance upon written information the holder provides to the Company in connection with any registration statement in which a holder of such securities is participating. None of our officers or directors are parties to this agreement, although our non-employee directors may have an indirect interest in the agreement to the extent of their affiliations with the Sponsors.
Management Services Agreement and Consulting Services
Both Avaya Holdings Corp. and Avaya Inc. are party to a management services agreement with Silver Lake Management Company, L.L.C., an affiliate of Silver Lake, and TPG Capital, L.P., an affiliate of TPG, who are
collectively referred to as the Managers, pursuant to which the Managers provide management and financial advisory services to us. Pursuant to the management services agreement, the Managers receive a monitoring fee of $7 million per annum, or the monitoring fees, and reimbursement on demand for out-of-pocket expenses incurred in connection with the provision of such services. In the event of a financing, acquisition, disposition or
change of control transaction involving us during the term of the management services agreement, the Managers have the right to require us to pay to the Managers a fee equal to customary fees charged by internationally-recognized investment banks for serving as a financial advisor in similar transactions. The management services agreement may be terminated at any time by the Managers, but will otherwise havehas an initial term ending on December 31, 2017 that will automatically be extendedextends each December 31st for an additional year unless earlier terminated by us or the Managers. The term has automatically extended five times since the execution of the agreement such that the current term is December 31, 2023. The management services agreement will terminate pursuant to its terms upon consummation of this offering, and, upon termination, the Managers will receive a one-time fee in an amount equal to $ , which is the net present values of the monitoring fees that would have been payable during the remaining term of the management services agreement. The termination fee will be calculated using the current term ending December 31, 2023. The management services agreement contains customary exculpation and indemnification provisions in favor of the Managers and their affiliates.
In the course of business, Avaya will enter into arrangements with affiliates of the Sponsors pursuant to which consultants are engaged to provide services to the Company. For the six-month periodfiscal year ended March 31,September 30, 2012 and September 30, 2011, expenses associated with these consulting agreements with affiliates of TPG were less than $1 million. For each of the fiscal years 2010, and 2009 and the period October 27, 2007 through September 30, 2008, we recorded $2 million of expenses associated with these consulting agreements with affiliates of TPG. No such consulting services were provided during the period October 1, 2007 through October 26, 2007.
Transactions with Other Sponsor Portfolio Companies
The Sponsors are private equity firms that have investments in companies that do business with Avaya. For the six-month period ended March 31,fiscal 2012, 2011 and 2010, we recorded $4$7 million, associated with sales of the Company’s products and services to companies in which one or both of the Sponsors have investments. For the fiscal years 2010 and 2009 and the period October 27, 2007 through September 30, 2008, we recorded $8 million $11 million and $15$8 million, respectively, associated with sales of the Company’s products and services to companies in which one or both of the Sponsors have investments. For the six-month period ended March 31,fiscal 2012, 2011 and 2010, we purchased goods and services of $2 million, $3 million and $1 million, from companies in which one or both of the Sponsors have investments. For each of the fiscal years 2010, 2009 and 2008, we purchased goods and services of $1 millionrespectively from companies in which one or both of the Sponsors have investments.
Financing
InTerm Loans Held by Sponsors
Since April 2008, affiliates of TPG acquired $200 millionhave held some of Avaya Inc.’s outstanding senior secured term B-1 loans. Based on the amount of the senior secured term loans that were held during the six-month period ended March 31,fiscal 2012, 2011 and during fiscal year 2010, and consistent with the terms of the loan, those affiliates received payments of principal and interest aggregating approximately $3$4 million, $6 million, and $6 million, for the six-month period ended March 31, 2011 and for fiscal year 2010, respectively. InAs of September 30, 2012, affiliates of TPG owned approximately $44 million principal amount of senior secured term B-1 loans.
Since September 2008, an affiliate of Silver Lake acquired $200 millionhas held some of Avaya Inc.’s outstanding senior secured term B-1 loans. On February 11, 2011, certain of the term B-1 loans held by this affiliate were reclassified as term B-3 loans (see Note 9, “Financing Arrangements,” to our consolidated audited financial statements included in this prospectus). Based on the amount of the senior secured term loans that were held by an affiliate of Silver Lake during the six-month period ended March 31,fiscal 2012, 2011 and during fiscal year 2010, and consistent with the terms of the loan, that affiliate received payments of principal and interest aggregating approximately $4$10 million, $8 million and $8 million, for the six-month period ended March 31, 2011 and for fiscal year 2010, respectively. In connection with the financingAs of the NES acquisition, affiliatesSeptember 30, 2012, an affiliate of TPG and Silver Lake each fundedowned approximately $222$45 million of incremental term B-2 loans. Avaya Inc. repaid the incremental term B-2 loans in full on February 11, 2011 (see Note 9, “Financing Arrangements,” to our unaudited consolidated financial statements for the period ended March 31, 2011). Similar to other holdersprincipal amount of senior secured incremental term B-2B-1 loans thoseand approximately $122 million principal amount of senior secured incremental term B-2 loans held by TPG and Silver Lake were repaid in connection with the issuance ofB-3 loans.
On October 29, 2012, Avaya Inc.’s senior secured notes. Consistent with amended the terms of the term B-2 loans, affiliates of TPGits credit agreements and Silver Lake each received payments (consisting of principal and interest, inclusive of amounts paid by Avaya Inc. in connection with the payment in full of all term B-2 loans on February 11, 2011) of approximately $285 million for the six-month period ended March 31, 2011 and approximately $25 million for fiscal year 2010.
In addition, on February 11, 2011,reclassified certain of Avaya Inc.’sthe senior secured term B-1 loans were reclassified as senior secured term B-3B-4 loans (see Note 9, “Financing Arrangements,” to our unaudited
consolidated audited financial statements forincluded in this prospectus). Lenders who consented to the period ended March 31, 2011). Foramendment of the six-month period ended March 31, 2011, an affiliateterms of the credit agreements, including affiliates of each of Silver Lake and TPG, received payments of principal and interest aggregating approximately $0.6 million with respectfees in exchange for their consents. Similarly, lenders who agreed to its holdings of Avaya Inc.’sreclassify their senior secured term B-3 loans. As of March 31, 2011,B-1 loans as senior secured term B-4 loans received fees in exchange for their reclassification. The total fees paid to affiliates of each of Silver Lake and TPG owned approximately $144as a result of these transactions aggregated $0.68 million principal amount ofand $0.06 million, respectively.
On December 21, 2012, Avaya Inc.’s amended the terms of its senior secured credit facility and reclassified certain of the senior secured term B-1 loans and no senior secured term B-3B-4 loans as senior secured term B-5 loans (see Note 9, “Financing Arrangements,” to our consolidated audited financial statements included in this prospectus). Lenders who consented to the amendment of the terms of the senior secured credit facility, including affiliates of each of Silver Lake and TPG, received fees in exchange for their consents. The total fees paid to affiliates of Silver Lake owned approximately $54and TPG as a result of these transactions aggregated $0.25 million principal amountand $0.07 million, respectively.
On February 13, 2013, Avaya Inc. amended the terms of its credit agreements to permit Avaya Inc. to refinance all of Avaya Inc.’s then outstanding senior unsecured notes with junior secured term B-1notes or junior secured loans and approximately $124 million principal amount(see Note 9, “Financing Arrangements,” to our consolidated audited financial statements included in this prospectus). Lenders who consented to the amendment of Avaya Inc.’s senior secured term B-3 loan.the terms of the credit agreements, including affiliates of Silver Lake, received fees in exchange for their consents. The total fees paid to affiliates of Silver Lake as a result of these transactions aggregated $0.17 million.
Preferred Stock Ownership by Sponsors
In addition, in connection with the financing of the NES acquisition, we issued shares of our Series A Preferred Stock. As of March 31, 2011,September 30, 2012, affiliates of TPG owned 38,864.13 shares of our non-voting Series A Preferred Stock (representing 31.1% of the issued and outstanding shares of Series A Preferred Stock) and affiliates of Silver Lake owned 38,864.13 shares of our non-voting Series A Preferred Stock (representing 31.1% of the issued and outstanding shares of Series A Preferred Stock). See “Description of Our Capital Stock—Preferred Stock.” As described in “Use of Proceeds” above, we intend to redeem all outstanding shares of Series A Preferred Stock plus accrued unpaid dividends, in an aggregate amount of $ with the net proceeds from this offering.
In connection with the financing of the Radvision acquisition, we issued shares of our Series B Convertible Preferred Stock. As of September 30, 2012, affiliates of TPG owned 32,649 shares of our non-voting Series B Convertible Preferred Stock (representing 66.7% of the issued and outstanding shares of Series B Convertible Preferred Stock) and affiliates of Silver Lake owned 32,649 shares of our Series B Convertible Preferred Stock (representing 66.7% of the issued and outstanding shares of Series B Convertible Preferred Stock). See “Description of Our Capital Stock—Preferred Stock.”
For information regarding the equity holdings of affiliates of TPG and Silver Lake, please see “Principal Stockholders.”
Arrangements Involving our Directors and Executive Officers
Sponsor Board Appointments
Messrs. Chen, Giancarlo Mondre and RouxMondre are Directors of each of Avaya Holdings Corp. and Avaya Inc. and they hold the positions of Managing Director,Special Advisor, Managing Director, and Chairman,Managing Director and Managing Partner, respectively, of Silver Lake. Messrs. Frantz,Marren and Mohebbi and Rollins are Directors of each of Avaya Holdings Corp. and Avaya Inc. and they hold the positions of Partner Senior Advisor and Senior Advisor, respectively, of TPG.
Share Ownership of Mr. Giancarlo
Effective June 30, 2008, Mr. Giancarlo was elected President and CEO of each of Avaya Holdings Corp. and Avaya Inc. on an interim basis. On November 24, 2008, Mr. Giancarlo received a grant of 500,000 stock options having an exercise price of $3.80 per share, the fair market value of a share of our common stock on the date of the grant. The stock options were issued with standard vesting provisions using the standard weightings of time-based, EBITDA-based and MoM-based awards as discussed in the section “Executive Compensation—Compensation Discussion and Analysis—Elements of Executive Officer Compensation—Long-Term Incentives.” Mr. Giancarlo resigned as President and CEO when Mr. Kennedy took such office effective December 22, 2008. Mr. Giancarlo participated in the Company’s stock option tender offer and tendered all of his stock options for new stock options with an exercise price of $3.00 per share, a grant date of November 17, 2009 and new vesting terms. See Note 14, “Share-based Compensation,” to our audited consolidated financial statements and “Compensation Disclosure and Analysis” for more information regarding the stock option exchange offer in which Mr. Giancarlo and our executive officers participated.
Senior Manager Registration and Preemptive Rights Agreement and Management Stockholders’ Agreement
In connection with the Merger, we entered into a senior manager registration and preemptive rights agreement with certain current and former members of our senior management who own shares of our common stock and options and RSUs convertible into shares of our common stock, including certain of our Named Executive Officers.Messrs, Chirico, Giancarlo and Kennedy. Pursuant to the senior manager registration and preemptive rights agreement we will provide the senior managers party thereto that hold registrable securities thereunder with certain registration rights upon either (a) the exercise of the Sponsors or their affiliates of demand registration rights under the Sponsors’ registration rights agreement discussed above or (b) any request by the Sponsors to file a shelf registration statement for the resale of such shares. In addition, in the event that we register additional shares of common stock for sale to the public following the consummation
of this offering, we will be required to give notice of such registration to senior managers partypursuant to the senior manager registration and preemptive rights agreement, senior managers party thereto that hold registrable securities thereunder are entitled to notice of such registration and, subject to certain limitations, such senior managers will have piggyback registration rights providing them with the right to require us to include shares of common stock held by them in such registration. We will be required to bear the registration expenses, other than underwriting discounts and commissions and transfer taxes, if any, associated with any registration of stock by the senior managers as described above. We have agreed to indemnify each holder of our common stockregistrable securities covered by this agreement for violations of federal or state securities laws by us in connection with any registration statement, prospectus or any preliminary prospectus. Each holder of such registrable securities has in turn agreed to indemnify us for federal or state securities law violations that occur in reliance upon written information the holder provides to the Company in connection with any registration statement in which a holder of such registrable securities is participating.
In addition, pursuant to the senior manager registration and preemptive rights agreement, the Company agreed to provide each senior manager party thereto with certain preemptive rights to participate in any future issuance of shares of our common stock to the Sponsors or their affiliates. The preemptive rights granted under the senior manager registration and preemptive rights agreement will terminate upon completion of this offering.
In connection with the Merger, we also entered into a management stockholders’ agreement with management stockholders, including certainall of our directorsnamed executive officers and executive officers.Mr. Giancarlo. The stockholders’ agreement contains certain restrictions on such stockholders’ transfer of our equity securities, contains rights of first refusal upon disposition of shares, contains standard tag-along and drag-along provisions, and generally sets forth the respective rights and obligations of the stockholders who are parties to that agreement. In connection
Transactions with Ciena Corporation
Gary B. Smith serves on the consummationBoard of this offering, certainDirectors of Avaya Holdings Corp. and Avaya Inc. and also currently serves as president, Chief Executive Officer and Director of Ciena Corporation, a network infrastructure company. During fiscal 2012, the Company recorded less than $1 million associated with sales of the provisions in the stockholders’ agreement are likelyCompany’s products and services to be terminated or amended.Ciena. The Company also purchased goods and services of less than $1 million from Ciena during fiscal 2012.
Related Party Transaction Policy
In February 2009, the Avaya Inc.August 2011, our board of directors adopted procedures for the review, approval and/or ratification of “related party transactions,” which are those transactions required to be disclosed pursuant to Item 404 of Regulation S-K as promulgated by the SEC. Prior to the completion of this offering, our board of directors will adopt procedures that are substantially identical to those that are currently in effect for the review, approval and/or ratification of such transactions by Avaya Inc.
The procedures give our Audit Committee the power to approve or disapprove existing and potential related party transactions involving our directors and certain of our executive officers. Upon becoming aware of an existing or potential related party transaction, the Audit Committee is required to conduct a full inquiry into the facts and circumstances concerning that transaction and to determine the appropriate actions, if any, for us to
take. If the Audit Committee does not approve a transaction that is brought before it, then the matter is automatically forwarded to our full board of directors for consideration. A director who is the subject of a potential related party transaction is not permitted to participate in the decision-making process of the Audit Committee or full board of directors, as applicable, relating to what actions, if any, shall be taken by us in light of that transaction.
Because Avaya Inc.’s procedures were adopted subsequent to the related party transaction disclosures listed above (other than those relating to the financing of the NES acquisition and the stock option exchange offer), those matters were not subject to the procedures. All related party transactions arising outidentified above that occurred during fiscal 2012 or that are currently proposed were subject to these review procedures (other than those listed under the heading “Arrangements with our Sponsors-Transactions with Other Sponsor Portfolio Companies” which were transacted in the ordinary course of the financing of the NES acquisition were placed before and approved by the full Avaya Inc. board of directors. The stock option exchange offer was unanimously approved by the Compensation Committee. As indicated in Note 14, “Share-based Compensation,” to our audited consolidated financial statements for the fiscal year ended September 30, 2010, the exchange offer was made available to all individuals holding eligible stock options on the same terms and conditions as those offered to Mr. Giancarlo.Company’s business).
The following table sets forth certain information with respect to the beneficial ownership of our common stock at May 1, 20112013 for:
each person whom we know beneficially owns more than five percent of our common stock;
each of our directors;
each of our named executive officers; and
all of our directors and executive officers as a group.
The number of shares beneficially owned by each stockholder is determined under rules issued by the SEC.
The percentage of common stock beneficially owned by each person before the offering is based on 487,389,017488,663,114 shares of common stock outstanding as of May 1, 2011,2013, and shares of common stock expected to be outstanding following this offering after giving effect to the shares of common stock offered hereby. See “Description of Capital Stock.” Shares of common stock that may be acquired within 60 days following May 1, 20112013 pursuant to the exercise of options or warrants are deemed to be outstanding for the purpose of computing the percentage ownership of such holder but are not deemed to be outstanding for computing the percentage ownership of any other person shown in the table. Beneficial ownership representing less than one percent is denoted with an “*.”
Upon the completion of this offering, investment funds affiliated with the Sponsors will own, in the aggregate, approximately % of our common stock, assuming the underwriters do not exercise their option to purchase additional shares of our common stock. As a result, we intend to be a “controlled company” within the meaning of the corporate governance rules of the .”New York Stock Exchange.
| Shares Beneficially Owned Prior to this Offering | % of Common Stock Beneficially Owned After this Offering | |||||||||||||||
Name | Number | Percentage | Without Option | With Option | ||||||||||||
Silver Lake Funds and affiliates(1) | 403,457,030 | 72.3 | % | |||||||||||||
TPG Funds and affiliates(2) | 403,457,030 | 72.3 | % | |||||||||||||
Alan E. Baratz(3)(4) | 348,750 | * | ||||||||||||||
James M. Chirico Jr.(3)(4) | 357,125 | * | ||||||||||||||
J. Joel Hackney Jr.(3) | 97,500 | * | ||||||||||||||
Kevin J. Kennedy(3)(4) | 1,601,447 | * | ||||||||||||||
David J. Manganello(3) | 150,308 | * | ||||||||||||||
Anthony J. Massetti(3)(4) | 302,500 | * | ||||||||||||||
Eugene J. Frantz(2)(5) | — | * | ||||||||||||||
Charles H. Giancarlo(1)(3)(6) | 81,250 | * | ||||||||||||||
Afshin Mohebbi(2)(7) | — | * | ||||||||||||||
Greg K. Mondre(1)(8) | — | * | ||||||||||||||
Kevin B. Rollins(2)(9) | — | * | ||||||||||||||
David J. Roux(1)(10) | — | * | ||||||||||||||
Directors and executive officers as a group, including those named above (20 Persons)(3)(4)(5)(6)(7)(8)(9)(10) | 5,133,945 | 1.1 | % | |||||||||||||
Name | Common Stock of Avaya Holdings Corp. Beneficially Owned | Percentage of Outstanding Shares Beneficially Owned | ||||||
Silver Lake Funds and affiliates(1) | 419,814,172 | 72.9 | % | |||||
TPG Funds and affiliates(2) | 419,814,172 | 72.9 | % | |||||
Alan E. Baratz(3)(4) | 791,118 | * | ||||||
Christopher M. Formant(3)(4) | 823,775 | * | ||||||
J. Joel Hackney, Jr.(3)(4) | 651,050 | * | ||||||
Kevin J. Kennedy(3)(5) | 3,686,447 | * | ||||||
Anthony J. Massetti(3) | 150,000 | * | ||||||
Thomas G. Mitchell(3)(4) | 383,388 | * | ||||||
David Vellequette | — | * | ||||||
John Chen(1)(6) | — | * | ||||||
Charles H.Giancarlo(1)(3)(7) | 243,750 | * | ||||||
John W. Marren(2)(8) | — | * | ||||||
Afshin Mohebbi(2)(9) | — | * | ||||||
Greg K. Mondre(1)(10) | — | * | ||||||
Gary B. Smith(4) | — | * | ||||||
Directors and executive officers as a group (21 Persons)(3)(4)(5)(6)(7)(8)(9)(10)(11) | 8,758,984 | 1.8 | % | |||||
| (1) | The shares of our common stock that are attributed to Silver Lake Funds (as defined below) and affiliates consist of an aggregate of 332,450,000 shares of our common stock, 32,649 shares of our common stock issuable upon conversion of shares of our convertible Series B Convertible Preferred Stock and |
| prior to December 18, |
attributed to Silver Lake Funds and affiliates represent |
| The shares of common stock, Series B Convertible Preferred Stock and warrants (rounded to the nearest whole share) that are attributed to the Silver Lake Funds and their affiliates in this table represent direct holdings by the following entities: |
| Common Stock | Warrants | Common Stock | Series B Preferred | Warrants | ||||||||||||||||
Silver Lake Partners II, L.P., or SLP II | 39,815,641 | 7,695,824 | 39,815,641 | 4,319 | 9,855,464 | |||||||||||||||
Silver Lake Partners III, L.P., or SLP III | 109,624,955 | 21,189,020 | 109,624,955 | 11,892 | 27,135,186 | |||||||||||||||
Silver Lake Technology Investors II, L.P., or SLTI II | 184,359 | 35,634 | 184,359 | 20 | 45,634 | |||||||||||||||
Silver Lake Technology Investors III, L.P., or SLTI III | 375,045 | 72,491 | 375,045 | 40 | 92,834 | |||||||||||||||
Total fractional shares held by SLP II, SLP III, SLTI II and | — | 1 | ||||||||||||||||||
Sierra Co-Invest, LLC, or Sierra Co-Invest | 182,450,000 | — | 182,450,000 | — | — | |||||||||||||||
Sierra Co-Invest II, LLC, or Sierra Co-Invest II | — | 42,014,060 | — | — | 42,014,060 | |||||||||||||||
Sierra Co-Invest III, LLC, or Sierra Co-Invest III | — | 16,376 | 8,188,344 | |||||||||||||||||
Total fractional shares held by Silver Lake Funds and Affiliates | — | 2 | 1 | |||||||||||||||||
|
|
| ||||||||||||||||||
Total | 332,450,000 | 71,007,030 | 332,450,000 | 32,649 | 87,331,523 | |||||||||||||||
| For ease of reference, we refer to SLP II, SLP III, SLTI II and SLTI III collectively as the Silver Lake Funds. The general partner of each of SLP II and SLTI II is Silver Lake Technology Associates II, L.L.C., whose managing member is Silver Lake Group, L.L.C. The general partner of each of SLP III and SLTI III is Silver Lake Technology Associates III, L.P., whose general partner is SLTA III (GP), L.L.C., whose managing member is Silver Lake Group, L.L.C. |
| The managing member of Sierra Co-Invest, Sierra Co-Invest II and Sierra Co-Invest |
| The mailing address for John Chen, Charles Giancarlo and Greg Mondre |
| (2) | The shares of our common stock that are attributed to the TPG Funds (as defined below) and affiliates in this table consist of an aggregate of 332,450,000 shares of our common stock, 32,649 shares of our common stock issuable upon conversion of shares of our convertible Series B Convertible Preferred Stock and |
| prior to December 18, |
| The shares of our common stock and warrants (rounded to the nearest whole share) that are attributed to TPG Partners V, L.P., a Delaware limited partnership, or Partners, TPG FOF V-A, L.P., a Delaware limited partnership, or FOF A, and TPG FOF V-B, L.P., a Delaware limited partnership, or FOF B, which, together with Partners and FOF A, are collectively referred to as the TPG Funds, and their affiliates in this table represent direct holdings by the following entities: |
| Common Stock | Warrants | Common Stock | Series B Preferred | Warrants | ||||||||||||||||
Partners | 149,294,510 | 28,856,608 | 149,294,510 | 16,195 | 36,954,491 | |||||||||||||||
FOF A | 390,556 | 75,489 | 390,556 | 42 | 96,673 | |||||||||||||||
FOF B | 314,933 | 60,872 | 314,933 | 34 | 77,954 | |||||||||||||||
Total fractional shares held by Partners, FOF A and FOF B | 1 | 1 | ||||||||||||||||||
Sierra Co-Invest | 182,450,000 | — | 182,450,000 | — | — | |||||||||||||||
Sierra Co-Invest II | — | 42,014,060 | — | — | 42,014,060 | |||||||||||||||
Sierra Co-Invest III | — | 16,376 | 8,188,344 | |||||||||||||||||
Total fractional shares held by TPG Funds and Affiliates | 1 | 2 | 1 | |||||||||||||||||
|
|
| ||||||||||||||||||
Total | 332,450,000 | 71,007,030 | 332,450,000 | 32,649 | 87,331,523 | |||||||||||||||
| The general partner of each of the TPG Funds is TPG GenPar V, L.P., a Delaware limited partnership, or GenPar, whose general partner is TPG GenPar V Advisors, LLC, a Delaware limited liability company, or GenPar Advisors, whose sole member is TPG Holdings I, L.P., a Delaware limited partnership, or Holdings I, whose general partner is TPG Holdings I-A, LLC, a Delaware limited liability company, or Holdings I GP, whose sole member is TPG Group Holdings (SBS), L.P., a Delaware limited partnership, or Group Holdings, whose general partner is TPG Group Holdings (SBS) Advisors, Inc., a Delaware corporation, or Group Advisors, which, together with the TPG Funds, GenPar, GenPar Advisors, Holdings I, Holdings I GP and Group Holdings we collectively refer to as the TPG Entities). The managing member of Sierra Co-Invest, Sierra Co-Invest II and Sierra Co-Invest |
| Because of these relationships, Group Advisors may be deemed to beneficially own the shares and warrants directly held by the TPG Funds, Sierra Co-Invest, Sierra Co-Invest II and Sierra Co-Invest |
The mailing address for each of Group Advisors and Messrs. Bonderman, Coulter and |
| (3) | Includes beneficial ownership of the following numbers of shares of common stock that may be acquired within 60 days of May 1, |
| • Alan E. Baratz | 308,750 | • David J. Manganello | 87,750 | |||||||
| • James M. Chirico, Jr. | 307,125 | • Anthony J. Massetti | 227,500 | |||||||
| • J. Joel Hackney | 97,500 | • Charles H. Giancarlo | 81,250 | |||||||
| • Kevin J. Kennedy | 1,072,500 | • Directors and executive officers | 3,747,074 |
| • J. Joel Hackney, Jr. | 552,500 | • Charles H. Giancarlo | 243,750 | |||||||
| • Kevin J. Kennedy | 2,957,500 | • Directors and executive officers | 7,136,699 | |||||||
| • Thomas G. Mitchell | 308,750 |
| Note that the number of options held by Directors and executive officers as a group excludes stock options held by the following individuals: Dr. Baratz, who ceased serving as Senior Vice President, Corporate Development & Strategy on May 6, 2012; Mr. Massetti, who ceased serving as Chief Financial Officer, effective August 15, 2012; and Mr. Formant, who ceased serving as Senior Vice President and President, Avaya Government Solutions on April 30, 2013. Including options held by Messrs. Baratz, Massetti and Formant, Directors and executive officers as a group would beneficially own 8,460,262 shares of common stock that may be acquired within 60 days of May 1, 2013 pursuant to stock options. |
| On February 25, 2013, the Compensation Committee of our Board of Directors approved a stock option exchange program through which individuals holding market-based “multiple-of-money” and performance-based “EBITDA” stock options could exchange them on a three-for-one basis for RSUs. The grant date for the awards was May 6, 2013, and the replacement RSUs will vest in full on December 16, 2013, and vesting will be accelerated in the event of a change in control (as defined in the RSU award agreement), death, disability, involuntary termination without cause or upon termination of employment under certain voluntary programs. As a result, the table above does not reflect the results of the stock option exchange program. For more information on the results of the stock option exchange program, please see the “Executive Compensation” section of this prospectus. |
| (4) | Includes ownership of the following numbers of shares of common stock underlying RSUs that have vested or that may vest within 60 days of May 1, |
| • Alan E. Baratz | 40,000 | • Anthony J. Massetti | 75,000 | |||||||
| • James M. Chirico, Jr. | 50,000 | • Directors and executive officers as | 752,115 | |||||||
| • Kevin J. Kennedy | 200,000 |
| • J. Joel Hackney, Jr. | 98,550 | • Gary B. Smith | 163,182 | |||||||
| • Thomas G. Mitchell | 74,638 | • Directors and executive officers | 510,740 |
| Note that the number of units held by Directors and executive officers as a group excludes units held by Dr. Baratz, who ceased serving as Senior Vice President, Corporate Development & Strategy on May 6, 2012, and Mr. |
| The information above does not reflect the results of the stock option exchange program referenced in |
| Includes 320,000 shares held by Mr. Kennedy and his spouse as trustees under grantor retained annuity trusts and a family trust. |
| John Chen is a special advisor to |
| Charles Giancarlo is a managing director of Silver Lake Group, L.L.C. Mr. Giancarlo has no voting or investment power over the shares and warrants held directly by the Silver Lake Funds and disclaims beneficial ownership of any shares of our common stock and warrants exercisable for and preferred shares convertible into shares of our common stock held by the Silver Lake Funds, Sierra Co-Invest, Sierra Co-Invest II or Sierra Co-Invest |
| (6) | John Marren is a TPG partner. Mr. Marren has no voting or investment power over and disclaims beneficial ownership of any shares of our common stock and warrants exercisable for and preferred shares convertible into shares of our common stock held directly or indirectly by the TPG Entities, Sierra Co-Invest, Sierra Co-Invest II or Sierra Co-Invest III. |
| (7) | Afshin Mohebbi is a TPG senior |
| (8) | Greg Mondre is (a) a managing director of Silver Lake Group, L.L.C., (b) a member of Sierra Manager’s management committee and (c) a vice president of Sierra Manager. Mr. Mondre |
| (9) | Note that the number of shares beneficially owned by Directors and executive officers as a group excludes shares beneficially owned by the following individuals: Dr. Baratz, who ceased serving as Senior Vice President, Corporate Development & Strategy on May 6, 2012; Mr. Massetti, who ceased serving as Chief Financial Officer, effective August 15, 2012; and Mr. Formant, who ceased serving as Senior Vice President and President, Avaya Government Solutions on April 30, 2013. Including shares beneficially owned by Messrs. Baratz, Massetti and Formant, the number of shares beneficially owned by Directors and executive officers as a group would equal 10,523,877 or 2.1% of outstanding shares of our common stock. |
| The information above does not reflect the results of the stock option exchange program referenced in note 3 above. For more information on the results of the stock option exchange program, please see the “Executive Compensation” section of this prospectus. |
DESCRIPTION OF CERTAIN OUTSTANDING INDEBTEDNESS
Senior secured multi-currency asset-based revolving credit facility
Overview
In connection with the Merger, Avaya Inc. entered into a credit agreement and related security and other agreements, dated as of October 26, 2007, or the Merger date,“Merger Date”, for a senior secured multi-currency asset-based revolving credit facility. The senior secured multi-currency asset-based revolving credit facility was amended and restated as of October 29, 2012, and amended as of February 13, 2013, as discussed under “-Amendments of senior secured multi-currency asset-based revolving credit facility” below.
The senior secured multi-currency asset-based revolving credit facility provides senior secured revolving financing of up to $335 million, subject to availability under a borrowing base.base, of which $150 million may be in the form of letters of credit. The borrowing base at any time equals the sum of 85% of eligible accounts receivable plus 85% of the net orderly liquidation value of eligible inventory, subject to certain reserves and other adjustments. The senior secured multi-currency asset-based revolving credit facility includes borrowing capacity available for letters of credit and for short-term borrowings, referred to as swingline loans, and is available in Euroseuros in addition to dollars. At March 31, 2011,2013, there were no borrowings under this facility and $72facility. At March 31, 2013, there were $76 million of letters of credit issued in the ordinary course of business under this facility resulting in remaining availability of $205$218 million.
Avaya Inc. has the right to request up to $100 million of additional commitments under this facility, although the lenders under this facility are not under any obligation to provide any such additional commitments, and any increase in commitments is subject to certain conditions precedent. If Avaya Inc. were to request any such additional commitments and the existing lenders or new lenders were to agree to provide such commitments, the facility size could be increased by up to $100 million, but Avaya Inc.’s ability to borrow under this facility would still be limited by the amount of the borrowing base.
Amendments of senior secured multi-currency asset-based revolving credit facility
On October 29, 2012, Avaya Inc., the several subsidiary borrowers party thereto, Citicorp USA, Inc. and the lenders party thereto entered into Amendment No. 2 to Credit Agreement, pursuant to which the senior secured multi-currency asset-based revolving credit facility was amended and restated in its entirety.
The modified terms of the senior secured multi-currency asset-based revolving credit facility include permission to issue or incur, as applicable, secured indebtedness in the form of (1) one or more series of incremental replacement junior secured notes in lieu of the $100 million of additional commitments discussed in the final paragraph of “-Senior secured multi-currency asset-based revolving credit facility-Overview” above, plus the amount by which unused commitments have been previously reduced under the senior secured multi-currency asset-based revolving credit facility, less the amount of all revolving commitment increases effected at or prior to the time of issuance of such incremental replacement junior secured notes, and (2) one or more series of junior secured notes or junior secured loans, in the case of each such issuance or incurrence, in connection with a modification, refinancing, refunding, renewal, replacement, exchange or extension of senior unsecured indebtedness and subject to certain other conditions and limitations set forth in the senior secured multi-currency asset-based revolving credit facility.
On February 13, 2013, Avaya Inc., the several subsidiary borrowers party thereto, Citicorp USA, Inc. and the lenders party thereto entered into Amendment No. 3 to Credit Agreement pursuant to which the senior secured multi-currency asset-based revolving credit facility was amended.
The modified terms of the senior secured multi-currency asset-based revolving credit facility permitted Avaya Inc. to refinance all of Avaya Inc.’s outstanding senior unsecured notes with junior secured notes or junior
secured loans, subject to certain other conditions and limitations set forth in the senior secured multi-currency asset-based revolving credit facility. Further, the terms of the amendment permit certain other obligations of Avaya Inc. and certain of its subsidiaries to be secured by the ABL Priority Collateral on a junior-priority basis.
Interest rate and fees
Borrowings under the senior secured multi-currency asset-based revolving credit facility bear interest at a rate per annum equal to, at Avaya Inc.’s option, either (a) a base rate determined by reference to the higher of (1) the prime rate of Citicorp USA, Inc. and (2) the federal funds effective rate plus 1/2 of 1% or (b) a LIBOR rate determined by reference to the costs of funds for U.S. dollar deposits for the interest period relevant to such borrowing adjusted for certain additional costs, in each case plus an applicable margin. The applicable margin for borrowings under the senior secured multi-currency asset-based revolving credit facility is based on excess availability under that facility and ranges from (1) 0.50% to 0.75% per annum with respect to base rate borrowings and (2) 1.50% to 1.75% per annum with respect to LIBOR borrowings. Swingline loans bear interest at a rate per annum equal to the base rate plus the applicable margin.
In addition to paying interest on outstanding principal under the senior secured multi-currency asset-based revolving credit facility, Avaya Inc. is required to pay a commitment fee of 0.25% per annum in respect of the unutilized commitments thereunder. Avaya Inc. must also pay customary letter of credit fees equal to the applicable margin on LIBOR loans and agency fees.
Mandatory repayments
If at any time the aggregate amount of outstanding loans, unreimbursed letter of credit drawings and undrawn letters of credit under the senior secured multi-currency asset-based revolving credit facility exceeds the lesser of (i) the commitment amount and (ii) the borrowing base, Avaya Inc. will be required to repay outstanding loans and cash collateralize letters of credit in an aggregate amount equal to such excess, with no reduction of the commitment amount. If the amount available under the senior secured multi-currency asset-based revolving credit facility is less than $33.5 million for five consecutive business days or a payment or bankruptcy event of default has occurred, Avaya Inc. will be required to deposit cash from specified
concentration accounts daily in a collection account maintained with the administrative agent under the senior secured multi-currency asset-based revolving credit facility, which will be used to repay outstanding loans and cash collateralize letters of credit.
Voluntary repayments
Avaya Inc. may voluntarily reduce the unutilized portion of the commitment amount and repay outstanding loans at any time without premium or penalty other than customary “breakage” costs with respect to LIBOR loans.
Amortization and final maturity
There is no scheduled amortization under the senior secured multi-currency asset-based revolving credit facility. AllPursuant to an amendment to this facility effective August 8, 2011, all outstanding loans under the senior secured multi-currency asset-based revolving credit facility are due and payable in full on October 25, 2013. Avaya Inc. has received commitments (subject to customary closing conditions) from certain existing lenders and other financial institutions to either extend the final maturity of the entire aggregate principal amount of the commitments under the senior secured multi-currency asset-based revolving credit facility to October 2016 or to provide a replacement senior secured multi-currency asset-based revolving credit facility that will mature in October 2016 in the same aggregate principal amount with the same interest rates and fees and having substantially the same terms as Avaya Inc.’s existing facility.26, 2016.
Co-borrowers, guarantees and security
All obligations under the senior secured multi-currency asset-based revolving credit facility are unconditionally guaranteed by Avaya Holdings Corp. In addition, all of our existing 100% owned domestic subsidiaries (with certain agreed-upon exceptions), or the subsidiary borrowers, act as co-borrowers under the facility, and certain of our future domestic 100% owned subsidiaries will act as co-borrowers under the facility.
All obligations under the senior secured multi-currency asset-based revolving credit facility, and the guarantees of those obligations, are secured, subject to certain exceptions, on a pari passu basis (subject to intercreditor arrangements) with the senior secured credit facility, the 7% Senior Secured Notes, the 9% Senior Secured Notes and any future senior obligations, by substantially all of our assets and the assets of Avaya Inc. and the subsidiary borrowers, including:
a first-priority security interest in personal property consisting of accounts receivable, inventory, cash, deposit accounts, securities accounts, chattel paper and certain related assets and proceeds of the foregoing, which are collectively referred to as ABL“ABL Priority Collateral;Collateral”;
a second-priority pledge of all of Avaya Inc.’s capital stock and all of the capital stock held by Avaya Inc. and the subsidiary borrowers (which pledge, in the case of the capital stock of any foreign subsidiary or of any U.S. subsidiary that holds capital stock of a foreign subsidiary and is a disregarded entity for U.S. federal income tax purposes, is limited to 65% of the voting stock of such subsidiary); and
a second-priority security interest in, and mortgages on, substantially all other tangible and intangible assets of us, Avaya Inc. and each subsidiary borrower, including substantially all of our material owned real property and equipment, fixtures, intellectual property, investment property, instruments, commercial tort claims, documents and general intangibles, which are collectively, and together with the pledge of capital stock described in the previous bullet-point, referred to as Non-ABL“Non-ABL Priority Collateral.Collateral”.
Certain covenants and events of default
The senior secured multi-currency asset-based revolving credit facility contains a number of covenants that, among other things and subject to certain exceptions, restrict Avaya Inc.’s ability and the ability of Avaya Inc.’s subsidiaries to:
incur or guarantee additional debt and issue or sell certain preferred stock;
pay dividends on, redeem or repurchase our capital stock;
make certain acquisitions or investments;
incur or assume certain liens;
enter into transactions with affiliates;
merge or consolidate with another company;
transfer or otherwise dispose of assets;
redeem subordinated debt;
incur obligations that restrict the ability of its subsidiaries to make dividends or other payments to us; and
create or designate unrestricted subsidiaries.
The covenants limiting the incurrence of unsecured or subordinated debt, dividends and other restricted payments, investments, loans, advances and acquisitions, and prepayments or redemptions of Avaya Inc.’s subordinated indebtedness, each permit the restricted actions in an unlimited amount, subject to the satisfaction of certain payment conditions, principally that Avaya Inc. must have pro forma excess availability greater than $33.5 million under the senior secured multi-currency asset-based revolving credit facility and that it must be in pro forma compliance with the fixed charge coverage ratio described in the next paragraph.
Although the senior secured multi-currency asset-based revolving credit facility does not require Avaya Inc. to comply with any financial ratio maintenance covenants, if Avaya Inc. has excess availability under the facility
of less than $33.5 million at any time, it will not be permitted to borrow any additional amounts thereunder unless its pro forma Consolidated Fixed Charge Coverage Ratio (as defined in the senior secured multi-currency asset-based revolving credit agreement governing the facility) is at least 1.0 to 1.0.
The senior secured multi-currency asset-based revolving credit facility also contains certain customary affirmative covenants and events of default, including an event of default that would result from the failure to make payment beyond any applicable grace period in respect of any indebtedness having an aggregate principal amount of not less than $75 million, the failure to observe or perform any other agreement or condition relating to any such indebtedness (other than the senior secured credit facility) which results in the acceleration of, or permits the holders of such indebtedness to accelerate, the maturity of such indebtedness or the failure to observe or perform any other agreement or condition relating to the senior secured credit facility which results in the lenders thereunder accelerating the maturity of such facility.
Senior secured credit facility
Overview
In connection with the Merger, Avaya Inc. also entered into a credit agreement and related security and other agreements, dated as of the Merger date.Date. The senior secured credit facility was amended and restated as of February 11, 2011, amended and restated as of October 29, 2012, amended and restated as of December 21, 2012, amended as of February 13, 2013, and amended as of March 12, 2013, as discussed under “—Amendment and restatement“-Amendments of senior secured credit facility” below.
The senior secured credit facility consists of (a) a senior secured multi-currency revolver allowing for borrowings of up to $200 million, (b) $3,800 million of senior secured term loans borrowed on the Merger date and of which $3,643$50 million may be in the form of remaining face value wasletters of credit, (b) term B-3 loans with an outstanding principal amount as of March 31, 2011, consisting2013 of $1,457$2,139 million, senior secured(c) term B-1B-4 loans with an outstanding principal amount as of March 31, 2013 of $1 million, and $2,186 million senior secured(d) term B-3B-5 loans (as such terms are defined below) and (c) $1,000 millionwith an outstanding principal amount as of incremental senior secured term B-2 loans, which was drawn in full at an original issue discountMarch 31, 2013 of 20% on December 18, 2009 in connection with the NES acquisition and which was repaid in full on February 11, 2011 from the proceeds of the senior secured note issuance (which is discussed in greater detail below).$1,148 million. The senior secured multi-currency revolver includes borrowing capacity available for letters of credit and for short-term borrowings, referred to as swingline loans, and is available in Euroseuros in addition to dollars. As of March 31, 2011,2013, there were no amounts outstanding under the senior secured multi-currency revolver.
Amendment and restatementAmendments of senior secured credit facility
On February 11, 2011, Avaya Inc. amended and restated the senior secured credit facility to reflect modifications to certain provisions of the senior secured credit facility.was amended and restated. The modified terms included amendments to:
permit the Company to effect a refinancing (see below) in which the maturity of 60% of the senior secured term loans representing outstanding principal amounts of $2.2 billion was extended from October 26, 2014 to October 26, 2017 by converting such loans into a new tranche of senior secured term loans (the senior secured term loans that remain due October 26, 2014 are referred to as the senior secured term B-1 loans and the senior secured term loans that are due October 26, 2017 are referred to as the senior secured term B-3 loans);
permit, at the election of Avaya Inc., prepayments to the senior secured incremental term B-2 loans prior to the senior secured term B-1 loans and senior secured term B-3 loans and thereafter to the class of term loans with the next earliest maturity;
permit the issuance of indebtedness (including the senior secured notes)7% Senior Secured Notes) to refinance a portion of the term loans under the senior secured credit facility and to secure such indebtedness (including the senior secured notes)7% Senior Secured Notes) on a pari passu basis with the obligations under the senior secured credit facility;
permit future refinancing of the term loans under the senior secured credit facility; and
permit future extensions of the term loans and revolving credit commitments (including, in the case of the revolving credit commitments, by obtaining new revolving credit commitments) under the senior secured credit facility.
On October 29, 2012, Avaya Inc., Citibank, N.A. and the lenders party thereto entered into Amendment No. 4 to Credit Agreement pursuant to which the senior secured credit facility was amended and restated in its entirety. The modified terms included:
an amendment to extend the maturity of a portion of the term B-1 loans representing outstanding principal amounts of $135 million from October 26, 2014 to October 26, 2017;
permission to issue incremental replacement junior secured notes, junior secured notes and junior secured loans as described above under the heading “—Amendments of senior secured multi-currency asset-based revolving credit facility” (except, pursuant to the senior secured credit facility, such incremental replacement junior secured notes, junior secured notes and junior secured loans must be secured by a lien on the collateral ranking junior to the lien securing the obligations under the senior secured credit facility); and
permission to issue indebtedness to refinance a portion of the term loans outstanding under the senior secured credit facility and to secure such indebtedness by a lien on the collateral ranking junior to the lien securing the obligations under the senior secured credit facility, subject to certain other conditions and limitations set forth in the senior secured credit facility.
On December 21, 2012, Avaya Inc., Citibank, N.A. and the lenders party thereto entered into Amendment No. 5 to Credit Agreement, pursuant to which the senior secured credit facility was amended and restated in its entirety. The modified terms included:
an amendment to extend the maturity of $713 million aggregate principal amount of the outstanding term B-1 loans from October 26, 2014 to March 31, 2018 and $134 million aggregate principal amount of the outstanding term B-4 loans from October 26, 2017 to March 31, 2018, in each case, by converting such loans into a new tranche of term B-5 loans; and
permission to apply net proceeds from the issuance of the 9% Senior Secured Notes to refinance term B-5 loans.
Additionally, as discussed more fully below, on December 21, 2012, Avaya Inc. completed a private placement of $290 million of the 9% Senior Secured Notes, the net proceeds of which were used to repay $284 million of term B-5 loans outstanding under the senior secured credit facility. Funds affiliated with TPG were holders of $22 million of term B-5 loans repaid with the proceeds of the 9% Senior Secured Notes.
On February 13, 2013, Avaya Inc. and Citibank, N.A. and the lenders party thereto entered into Amendment No. 6 to Credit Agreement pursuant to which the senior secured credit facility was amended. The modified terms of the senior secured credit facility permitted Avaya Inc. to refinance all of Avaya Inc.’s outstanding senior unsecured notes with indebtedness secured by a lien on the collateral ranking junior to the lien on the collateral securing the obligations under the senior secured credit facility, subject to certain other conditions and limitations set forth in the senior secured credit facility.
On March 12, 2013, Avaya Inc., Citibank, N.A. and the lenders party thereto entered into Amendment No. 7 to Credit Agreement pursuant to which the senior secured credit facility was further amended. The modified terms of the senior secured credit facility resulted in the refinancing in full all the outstanding term B-1 loans with the cash proceeds from the issuance of $589 million aggregate principal amount of term B-5 loans under the senior secured credit facility.
Interest rate and fees
Borrowings under the senior secured credit facility bear interest at a rate per annum equal to, at Avaya Inc.’s option, either a base rate (subject to a floor of 2.25% in the case of the term B-4 loans and term B-5 loans) or a LIBOR rate (subject to a floor of 1.25% in the case of the term B-4 loans and term B-5 loans), in each case plus an applicable margin. TheSubject to the floor described in the immediately preceding sentence, the base rate is determined by reference to the higher of (1) the prime rate of Citibank, N.A. and (2) the federal funds effective rate plus 1/2 of 1%. TheSubject to the floor described in the first sentence of this paragraph, the LIBOR rate is determined by reference to the costs of funds for U.S. dollar deposits for the interest period relevant to such borrowing adjusted for certain additional costs.
The applicable marginsmargin for borrowings of revolving loans and senior secured term B-1 loans under the senior secured credit facility are subject to adjustment each fiscal quarter based on its senior secured leverage ratio and range from (A) (1) 1.00% to 1.75% per annum with respect to revolving loans that are base rate borrowings and (2)(B) 2.00% to 2.75% per annum with respect to revolving loans that are LIBOR borrowings and (B) (1) 1.50% to 1.75% per annum with respect to senior secured term B-1 loans that are base rate borrowings and (2) 2.50% to 2.75% per annum with respect to senior secured term B-1 loans that are LIBOR borrowings.
The applicable margins for borrowings of revolvingterm B-3 loans, term B-4 loans, and senior secured term B-3B-5 loans under the senior secured credit facility isare equal at all times to (1) 3.50%, 5.25%, and 5.75%, respectively per annum with respect to loans that are base rate borrowings and (2) 4.50%, 6.25%, and 6.75%, respectively per annum with respect to loans that are LIBOR borrowings.
The applicable margin for borrowings ofmargins on the term B-4 loans and term B-5 loans are subject to increase pursuant to the senior secured incrementalcredit facility in connection with the making of certain refinancing, extended or replacement term B-2 loans was equalunder the senior secured credit facility with an effective yield greater than the applicable effective yield payable in respect of the applicable loans at all times to (1) 6.50% per annum with respect to loans that are base rate borrowings and (2) 7.50% per annum with respect to loans that are LIBOR borrowings; provided that (i) base rate borrowings were subject to a floor of 4.00% and (ii) LIBOR borrowings were subject to a floor of 3.00%.such time plus 50 basis points.
In addition to paying interest on outstanding principal under the senior secured credit facility, Avaya Inc. is required to pay a commitment fee of 0.50% per annum in respect of the unutilized commitments under the senior secured multi-currency revolver. This commitment fee is subject to adjustment to 0.375% each fiscal quarter based on Avaya Inc.’s senior secured leverage ratio. Avaya Inc. is also required to pay customary letter of credit fees equal to the applicable margin on LIBOR loans and agency fees under this facility.
Mandatory repayments
Avaya Inc. is required to prepay outstanding term loans under its senior secured credit facility with (x) 100% of the net cash proceeds of any debt issued by it or its subsidiaries (with exceptions for certain debt permitted to be incurred under the facility), (y) 50% (which percentage is reduced to 25% and to 0% if Avaya Inc.’s senior secured leverage ratio is less than or equal to 3.00:1.00 and 2.50:1.00, respectively) of Avaya Inc.’s annual excess cash flow (as defined in the facility) and (z) if Avaya Inc.’s senior secured leverage ratio exceeds 2.50:1.00, 100% of the net cash proceeds of all non-ordinary course asset sales, casualty events or other dispositions of property by it or its subsidiaries, subject to reinvestment rights and certain other exceptions.
Voluntary repayments
Avaya Inc. may voluntarily prepay outstanding loans under its senior secured credit facility and reduce the unutilized portion of the commitment amount in respect of the senior secured multi-currency revolver at any time without premium or penalty other than customary “breakage” costs with respect to LIBOR loans;provided, that (A) if Avaya Inc. prepays or undertakes certain amendments to the senior secured term B-3B-4 loans with certain secured loans having a lower effective yield than the senior secured term B-3 loans or effects an amendment which reduces the interest rate margin on the senior secured term B-3 loans, in each case on or prior to February 11, 2012,October 29, 2013, then Avaya Inc. will be required to pay to the senior secured term B-3B-4 lenders a fee equal to 1.0%2.0% of the aggregate principal amount of the senior secured term B-3B-4 loans so prepaid or amended.amended, which fee decreases to 1.0% after October 29, 2013 and on or prior to October 29, 2014 and (B) if Avaya Inc. prepays or undertakes certain amendments to the term B-5 loans on or prior to December 21, 2013, then Avaya Inc. will be required to pay to the term B-5 lenders a fee equal to 2.0% of the aggregate principal amount of the term B-5 loans so prepaid or amended, which fee decreases to 1.0% after December 21, 2013 and on or prior to December 21, 2014.
Amortization and final maturity
Avaya Inc. is required to make scheduled quarterly payments under its senior secured term loan facility equal to 0.25% of the original principal amount of the senior secured term loans, with the balance of theterm B-3 loans and the senior secured B-1 term B-4 loans paid on October 26, 20142017, and the balance of the senior secured B-3 term B-5 loans paid on October 26, 2017;providedthatMarch 31, 2018.
Pursuant to an amendment to this facility effective August 8, 2011, the maturity of the senior secured term B-3 loans will automatically become July 26, 2015 unless (i) the total net leverage ratio as tested on such date based upon the most recent financial statements provided to the lenders under the senior secured credit facility is no greater than 5.0 to 1.0 or (ii) on or prior to such date, either (x) an initial public offering shall have occurred or (y) at least $750 million in aggregate principal amount of Avaya Inc.’s existing senior unsecured cash-pay notes or senior unsecured PIK toggle notes have been repaid or refinanced or their maturity has been extended to a date no earlier than 91 days after October 26, 2017. The principal amount outstanding of the loans under the senior secured multi-currency revolver is due and payable in full on October 25, 2013. Avaya Inc. has received commitments (subject to customary closing conditions) from certain existing lenders and other financial institutions to either extend the final maturity of the entire aggregate principal amount of the commitments under the senior secured multi-currency revolver to October 2016 or to provide new revolving credit commitments that will mature in October 2016 in the same aggregate principal amount with the same interest rates and fees and having substantially the same terms as Avaya Inc.’s existing senior secured multi-currency revolver.26, 2016.
Guarantees and security
All obligations under the senior secured credit facility are unconditionally guaranteed by Avaya Holdings Corp. and all of our existing 100% owned domestic subsidiaries (with certain agreed-upon exceptions) and will be required to be guaranteed by certain of our future domestic 100% owned subsidiaries. All obligations under the senior secured credit facility, and the guarantees of those obligations, are secured, subject to certain exceptions, on a pari passu basis (subject to intercreditor arrangements) with the senior secured multi-currency asset-based revolving credit facility, the 7% Senior Secured Notes, the 9% Senior Secured Notes and any future senior obligations, by substantially all of our assets and the assets of Avaya Inc. and the subsidiary guarantors, including:
a second-priority security interest in personal property consisting of accounts receivable, inventory, cash, deposit accounts, securities accounts, chattel paper and certain related assets and proceeds of the foregoing;
a first-priority pledge of all of Avaya Inc.’s capital stock and all of the capital stock held by Avaya Inc. and the subsidiary guarantors (which pledge, in the case of the capital stock of any foreign subsidiary or of any U.S. subsidiary that holds capital stock of a foreign subsidiary and is a disregarded entity for U.S. federal income tax purposes, is limited to 65% of the voting stock of such subsidiary); and
|
a first-priority security interest in, and mortgages on, substantially all other tangible and intangible assets of us, Avaya Inc. and each subsidiary guarantor, including substantially all of our material owned real property and equipment, fixtures, intellectual property, investment property, instruments, commercial tort claims, demands and general intangibles.
Certain covenants and events of default
The credit agreement governing the senior secured credit facility contains a number of covenants that, among other things and subject to certain exceptions, restrict Avaya Inc.’s ability and the ability of its subsidiaries to:
incur or guarantee additional debt and issue or sell certain preferred stock;
pay dividends on, redeem or repurchase its capital stock;
make certain acquisitions or investments;
incur or assume certain liens;
enter into transactions with affiliates;
merge or consolidate with another company;
transfer or otherwise dispose of assets;
redeem subordinated debt;
incur obligations that restrict the ability of its subsidiaries to make dividends or other payments to Avaya Inc.; and
create or designate unrestricted subsidiaries.
The facility also contains certain customary affirmative covenants and events of default, including an event of default that would result from the failure to make payment beyond any applicable grace period in respect of any indebtedness having an aggregate principal amount of not less than $75 million, the failure to observe or perform any other agreement or condition relating to any such indebtedness (other than the senior secured multi-currency asset-based revolving credit facility) which results in the acceleration of, or permits the holders of such indebtedness to accelerate, the maturity of such indebtedness or the failure to observe or perform any other agreement or condition relating to the senior secured multi-currency asset-based revolving credit facility which results in the lenders thereunder accelerating the maturity of such facility.
Senior unsecured cash-pay notes and senior unsecured PIK toggle notes due 2015
Overview
As of March 31, 2011,2013, Avaya Inc. had outstanding an aggregate principal amount of $700.0$58 million senior unsecured cash-pay notes due 2015 and $834.0$92 million senior unsecured PIK toggle notes due 2015, which were issued on October 24, 2008 in exchange for all of the outstanding loans under a bridge loan facility entered into in connection with the Merger.
On March 7, 2013, Avaya Inc. completed the exchange offer in which $1,384 million of senior unsecured notes (including $642 million of senior unsecured cash-pay notes and $742 million of senior unsecured PIK toggle notes) were exchanged for the 10.50% Senior Secured Notes. Prior to March 7, 2013, Avaya Inc. had $700 million and $750 million of senior unsecured cash-pay notes and senior unsecured PIK toggle notes, respectively.
Interest rate
The senior unsecured cash-pay notes were issued in the aggregate principal amount of $700.0$700 million and bear interest in cash at the rate of 9.75% per annum.
The senior unsecured PIK toggle notes were issued in the aggregate principal amount of $750.0$750 million. Cash interest on the senior unsecured PIK toggle notes accrues at the rate of 10.125% per annum. PIK interest on the
senior unsecured PIK toggle notes accrues at the rate of 10.875% per annum. For any interest period through November 1, 2011, Avaya Inc. may elect to pay interest on the senior unsecured PIK toggle notes, at its option, (i) entirely in cash, (ii) entirely by increasing the principal amount of the senior unsecured PIK toggle notes or issuing new senior unsecured PIK toggle notes (such increase or issuance referred to as PIK interest) or (iii) by paying interest 50% in cash and 50% as PIK interest. After November 1, 2011, Avaya Inc. must make all interest payments on the senior unsecured PIK toggle notes entirely in cash. For the periods May 1, 2009 through October 31, 2009 and November 1, 2009 through April 30, 2010, Avaya Inc. elected to pay interest in kind on its senior unsecured PIK toggle notes. As a result, payment-in-kind interest of $41 million and $43 million was added, for these periods, respectively, to the principal amount of the senior unsecured PIK toggle notes effective November 1, 2009 and May 1, 2010, respectively, and will be payable when those notes become due. For the period of May 1, 2010 through October 31, 2010 and November 1, 2010 through April 30, 2011 the Company hasAvaya Inc. elected to make such payments in cash interest. On April 29, 2011,Under the Company delivered notice to its creditors that, with respect toterms of the interest period of Maysenior unsecured PIK toggle notes, after November 1, 2011 Avaya Inc. is required to October 31, 2011,make all interest payments on the Company will make such paymentssenior unsecured PIK toggle notes entirely in cash interest.cash.
Interest is payable semi-annually on April 15 and October 15.
Optional redemption
On and after November 1, 2011, Avaya Inc. may redeem the senior unsecured cash-pay notes and senior unsecured PIK toggle notes, in whole or in part, at a price equal to 100% of the principal amount thereof, plus the applicable premium declining ratably to par, plus accrued and unpaid interest.
Prior to November 1, 2011, Avaya Inc. may redeem the senior unsecured cash-pay notes and senior unsecured PIK toggle notes, in whole or in part, at a price equal to 100% of the principal amount thereof, plus a “make-whole” premium, plus accrued and unpaid interest.
Change of control offer
If a change of control occurs, Avaya Inc. must give holders of its senior unsecured cash-pay notes and holders of its senior unsecured PIK toggle notes an opportunity to sell their notes to Avaya Inc. at a purchase price equal to 101% of the principal amount thereof, plus accrued and unpaid interest.
Mandatory offer to purchase following certain asset sales
If Avaya Inc. or its subsidiaries engage in certain asset sales, unless they invest the cash proceeds from such sales in their business or use the proceeds to prepay secured indebtedness (including under the credit facilities) within a specified period of time, Avaya Inc. must offer to repurchase the senior unsecured cash-pay notes and the senior unsecured PIK toggle notes at 100% of the principal amount thereof, plus accrued and unpaid interest, if any, with such proceeds (if applicable, on a pro rata basis with certain pari passu indebtedness).
Final maturity
The senior unsecured cash-pay notes and the senior unsecured PIK toggle notes mature on November 1, 2015, and do not have required principal payments prior to maturity.maturity with the exception of a $15 million payment required on the senior unsecured PIK toggle notes on May 1, 2015.
Guarantees
Avaya Inc.’s domestic 100% owned subsidiaries that are borrowers or guarantors of the senior secured multi-currency asset-based revolving credit facility, the senior secured credit facility, the 7% Senior Secured Notes, the 9% Senior Secured Notes and the senior secured notes10.50% Senior Secured Notes guarantee the senior unsecured cash-pay notes and the senior unsecured PIK toggle notes.
Certain covenants and events of default
In connection with the exchange offer, on February 1, 2013, Avaya Inc. commenced a consent solicitation related to the senior unsecured cash-pay notes and senior unsecured PIK toggle notes. Upon receiving consents from holders of a majority of the outstanding principal amount of the senior unsecured cash-pay notes and senior unsecured PIK toggle notes in connection with the exchange offer, Avaya Inc. entered into a supplemental indenture, dated as of February 15, 2013 with The Bank of New York Mellon Trust Company, N.A., as trustee, which, effective as of March 7, 2013, eliminated substantially all of the affirmative and restrictive covenants contained in the indenture governing the senior unsecured cash-pay notes and senior unsecured PIK toggle notes contains a number of covenants that,(other than, among other thingscovenants, the covenant to pay interest and subject topremium, if any, on and principal of, the cash-pay notes and senior unsecured PIK toggle notes) and certain exceptions, restrict Avaya Inc.’s ability and the ability of its subsidiaries to:
incur additional debt and issue preferred stock;
pay dividends on, redeem or repurchase capital stock;
issue capital stock of restricted subsidiaries;
make certain investments;
enter into certain types of transactions with affiliates;
create liens; and
sell certain assets or merge with or into other companies.
The indenture governing these notes also contains certain customary affirmative covenants and events of default, including an event of default that would result from either the failure to pay at stated final maturity,and modified or acceleration of the maturity of, a principal amount of anyeliminated certain other indebtedness of Avaya Inc. or any of its restricted subsidiaries if the aggregate principal amount of such indebtedness, together with the principal amount of any other such indebtedness in default for failure to pay principal at final maturity or the maturity of which has been accelerated, aggregates $85 million or more at any time.provisions contained therein.
7% Senior secured notesSecured Notes due 2019
Overview
As of March 31, 2011,2013, Avaya Inc. had outstanding an aggregate principal amount of $1,009 million senior secured notes due 2019 (the “7% Senior Secured Notes”), which were issued on February 11, 2011.
Interest rate
The senior secured notes7% Senior Secured Notes were issued in the aggregate principal amount of $1,009 million and bear interest in cash at the rate of 7.00% per annum.
Interest is payable semi-annually on April 1 and October 1 commencing on October 1, 2011.
Optional redemption
On and afterCommencing April 1, 2015, Avaya Inc. may redeem the senior secured notes,7% Senior Secured Notes, in whole or in part, at a price equal to 100%103.5% of the principal amount thereof, plus the applicable premium declining ratablyredeemed, which decreases to par,101.75% on April 1, 2016 and to 100% on or after April 1, 2017, plus accrued and unpaid interest.
Prior to April 1, 2015, Avaya Inc. may redeem the senior secured notes,7% Senior Secured Notes, in whole or in part, at a price equal to 100% of the principal amount thereof, plus a “make-whole” premium, plus accrued and unpaid interest.
In addition, at any time until April 1, 2014, Avaya Inc. may redeem up to 35% of the aggregate principal amount of the senior secured notes7% Senior Secured Notes at a redemption price equal to 107% of the face amount thereof plus accrued and unpaid interest, if any, to the redemption date, with the net cash proceeds raised in or more equity offerings by Avaya Inc. or Avaya Holdings Corp.; provided that the aggregate principal amount of senior secured notes7% Senior Secured Notes that remain outstanding immediately after such redemption is equal to or greater than 50% of the aggregate principal amount of senior secured notes7% Senior Secured Notes issued under the indenture governing the senior secured notes.
Change of control offer
If a change of control occurs, Avaya Inc. must give holders of its senior secured notes7% Senior Secured Notes an opportunity to sell their notes to Avaya Inc. at a purchase price equal to 101% of the principal amount thereof, plus accrued and unpaid interest.
Mandatory offer to purchase following certain asset sales
If Avaya Inc. or its subsidiaries engage in certain asset sales, unless they invest the cash proceeds from such sales in their business or use the proceeds to prepay secured indebtedness (including under the credit facilities) within a specified period of time, Avaya Inc. must offer to repurchase the senior secured notes7% Senior Secured Notes at 100% of the principal amount thereof, plus accrued and unpaid interest, if any, with such proceeds (if applicable, on a pro rata basis with certain pari passu indebtedness).
Final maturity
The senior secured notes7% Senior Secured Notes mature on April 1, 2019, and do not have required principal payments prior to maturity.
Guarantees and security
Avaya Inc.’s‘s domestic 100% owned subsidiaries that are borrowers or guarantors of the senior secured multi-currency asset-based revolving credit facility, the senior secured credit facility, the senior unsecured notes and the senior unsecured PIK toggle notes guarantee the senior secured notes.7% Senior Secured Notes.
All obligations under the indenture governing the senior secured notes,7% Senior Secured Notes, and the guarantees of those obligations, are secured, subject to certain exceptions, on a pari passu basis (subject to intercreditor arrangements) with the senior secured multi-currency asset-based revolving credit facility, the senior secured credit facility, the 9% Senior Secured Notes and any future senior obligations, by a first-priority lien on substantially all of the assets of Avaya Inc. and the subsidiary guarantors other than real estate and other than the ABL Priority Collateral and by a second-priority lien on the ABL Priority Collateral, subject to certain limited exceptions.Collateral.
Certain covenants and events of default
The indenture governing the senior secured notes7% Senior Secured Notes contains a number of covenants that, among other things and subject to certain exceptions, restrict Avaya Inc.’s ability and the ability of its subsidiaries to:
incur additional debt and issue preferred stock;
pay dividends on, redeem or repurchase capital stock;
issue capital stock of restricted subsidiaries;
make certain investments;
enter into certain types of transactions with affiliates;
create liens; and
sell certain assets or merge with or into other companies.
The indenture governing the 7% Senior Secured Notes also contains certain customary affirmative covenants and events of default, including an event of default that would result from either the failure to pay at stated final maturity, or acceleration of the maturity of, a principal amount of any other indebtedness of Avaya Inc. or any of its restricted subsidiaries if the aggregate principal amount of such indebtedness, together with the principal amount of any other such indebtedness in default for failure to pay principal at final maturity or the maturity of which has been accelerated, aggregates $85 million or more at any time.
9% Senior Secured Notes due 2019
Overview
As of March 31, 2013, Avaya Inc. had outstanding an aggregate principal amount of $290 million senior secured notes due 2019 (the “9% Senior Secured Notes”), which were issued on December 21, 2012.
Interest rate
The 9% Senior Secured Notes were issued in the aggregate principal amount of $290 million and bear interest in cash at the rate of 9.00% per annum. Interest is payable semi-annually on April 1 and October 1 commencing on April 1, 2013.
Optional redemption
Commencing
April 1, 2015, Avaya Inc. may redeem the 9% Senior Secured Notes, in whole or in part, at a price equal to 104.5% of the principal amount redeemed, which decreases to 102.25% on April 1, 2016 and to 100% on or after April 1, 2017, plus accrued and unpaid interest.
Prior to April 1, 2015, Avaya Inc. may redeem the 9% Senior Secured Notes, in whole or in part, at a price equal to 100% of the principal amount thereof, plus a “make-whole” premium, plus accrued and unpaid interest.
In addition, at any time until April 1, 2015, Avaya Inc. may redeem up to 35% of the aggregate principal amount of the 9% Senior Secured Notes at a redemption price equal to 109% of the face amount thereof plus accrued and unpaid interest, if any, to the redemption date, with the net cash proceeds raised in or more equity offerings by Avaya Inc. or Avaya Holdings Corp.; provided that the aggregate principal amount of 9% Senior Secured Notes that remain outstanding immediately after such redemption is equal to or greater than 50% of the aggregate principal amount of 9% Senior Secured Notes issued under the indenture governing the 9% Senior Secured Notes.
Change of control offer
If a change of control occurs, Avaya Inc. must give holders of its 9% Senior Secured Notes an opportunity to sell their notes to Avaya Inc. at a purchase price equal to 101% of the principal amount thereof, plus accrued and unpaid interest.
Mandatory offer to purchase following certain asset sales
If Avaya Inc. or its subsidiaries engage in certain asset sales, unless they invest the cash proceeds from such sales in their business or use the proceeds to prepay secured indebtedness (including under the credit facilities) within a specified period of time, Avaya Inc. must offer to repurchase the 9% Senior Secured Notes at 100% of the principal amount thereof, plus accrued and unpaid interest, if any, with such proceeds (if applicable, on a pro rata basis with certain pari passu indebtedness).
Final maturity
The 9% Senior Secured Notes mature on April 1, 2019, and do not have required principal payments prior to maturity.
Guarantees and security
Avaya Inc.’s domestic 100% owned subsidiaries that are borrowers or guarantors of the senior secured multi-currency asset-based revolving credit facility, the senior secured credit facility, the senior unsecured notes, the senior unsecured PIK toggle notes and the 7% Senior Secured Notes guarantee the 9% Senior Secured Notes.
All obligations under the indenture governing the 9% Senior Secured Notes, and the guarantees of those obligations, are secured, subject to certain exceptions, on a pari passu basis (subject to intercreditor arrangements) with the senior secured multi-currency asset-based revolving credit facility, the senior secured credit facility, the 7% Senior Secured Notes and any future senior obligations, by a first-priority lien on substantially all of the assets of Avaya Inc. and the subsidiary guarantors other than real estate and other than the ABL Priority Collateral and by a second-priority lien on the ABL Priority Collateral.
Certain covenants and events of default
The indenture governing the 9% Senior Secured Notes contains a number of covenants that, among other things and subject to certain exceptions, restrict Avaya Inc.’s ability and the ability of its subsidiaries to:
incur additional debt and issue preferred stock;
pay dividends on, redeem or repurchase capital stock;
issue capital stock of restricted subsidiaries;
make certain investments;
enter into certain types of transactions with affiliates;
create liens; and
sell certain assets or merge with or into other companies.
The indenture governing the 9% Senior Secured Notes also contains certain customary affirmative covenants and events of default, including an event of default that would result from either the failure to pay at stated final maturity, or acceleration of the maturity of, a principal amount of any other indebtedness of Avaya Inc. or any of its restricted subsidiaries if the aggregate principal amount of such indebtedness, together with the principal amount of any other such indebtedness in default for failure to pay principal at final maturity or the maturity of which has been accelerated, aggregates $85 million or more at any time.
10.50% Senior Secured Notes due 2019
Overview
On March 7, 2013, the Avaya Inc. completed an Exchange Offer in which $1,384 million of senior unsecured notes were exchanged for $1,384 million of 10.50% senior secured notes due 2021 (the “10.50% Senior Secured Notes”). As of March 31, 2013, Avaya Inc. had outstanding an aggregate principal amount of $1,384 million senior secured notes due 2021, which were issued on March 7, 2013.
Interest rate
The 10.50% Senior Secured Notes were issued in the aggregate principal amount of $1,384 million and bear interest in cash at the rate of 10.50% per annum. Interest is payable semi-annually on March 1 and September 1 commencing on September 1, 2013.
Optional redemption
Commencing March 1, 2017, Avaya Inc. may redeem the 10.50% Senior Secured Notes, in whole or in part, at a price equal to 107.875% of the principal amount redeemed, which decreases to 105.250% on March 1, 2018, to 102.625% on March 1, 2019 and to 100% on or after March 1, 2020, plus accrued and unpaid interest.
Prior to March 1, 2017, Avaya Inc. may redeem the 10.50% Senior Secured Notes, in whole or in part, at a price equal to 100% of the principal amount thereof, plus a “make-whole” premium, plus accrued and unpaid interest.
In addition, at any time until March 1, 2016, Avaya Inc. may redeem up to 35% of the aggregate principal amount of the 10.50% Senior Secured Notes at a redemption price equal to 110.50% of the face amount thereof plus accrued and unpaid interest, if any, to the redemption date, with the net cash proceeds raised in or more equity offerings by Avaya Inc. or Avaya Holdings Corp.; provided that the aggregate principal amount of 10.50% Senior Secured Notes that remain outstanding immediately after such redemption is equal to or greater than 50% of the aggregate principal amount of 10.50% Senior Secured Notes issued under the indenture governing the 10.50% Senior Secured Notes.
Change of control offer
If a change of control occurs, Avaya Inc. must give holders of its 10.50% Senior Secured Notes an opportunity to sell their notes to Avaya Inc. at a purchase price equal to 101% of the principal amount thereof, plus accrued and unpaid interest.
Mandatory offer to purchase following certain asset sales
If Avaya Inc. or its subsidiaries engage in certain asset sales, unless they invest the cash proceeds from such sales in their business or use the proceeds to prepay secured indebtedness (including under the credit facilities) within a specified period of time, Avaya Inc. must offer to repurchase the 10.50% Senior Secured Notes at 100% of the principal amount thereof, plus accrued and unpaid interest, if any, with such proceeds (if applicable, on a pro rata basis with certain pari passu indebtedness).
Final maturity
The 10.50% Senior Secured Notes mature on March 1, 2021, and do not have required principal payments prior to maturity.
Guarantees and security
Avaya Inc.’s domestic 100% owned subsidiaries that are borrowers or guarantors of the senior secured multi-currency asset-based revolving credit facility, the senior secured credit facility, the senior unsecured notes, the 7% Senior Secured Notes and the 9% Senior Secured Notes guarantee the 10.50% Senior Secured Notes.
All obligations under the indenture governing the 10.50% Senior Secured Notes, and the guarantees of those obligations, are secured, subject to certain exceptions, on a junior priority basis to the senior secured multi-currency asset-based revolving credit facility, the senior secured credit facility, the 7% Senior Secured Notes, the 9% Senior Secured Notes and any future senior obligations by a lien on substantially all of the assets of Avaya Inc. and the subsidiary guarantors other than real estate, subject to certain limited exceptions.
Certain covenants and events of default
The indenture governing the 10.50% Senior Secured Notes contains a number of covenants that, among other things and subject to certain exceptions, restrict Avaya Inc.’s ability and the ability of its subsidiaries to:
incur additional debt and issue preferred stock;
pay dividends on, redeem or repurchase capital stock;
issue capital stock of restricted subsidiaries;
make certain investments;
enter into certain types of transactions with affiliates;
create liens; and
sell certain assets or merge with or into other companies.
The indenture governing the 10.50% Senior Secured Notes also contains certain customary affirmative covenants and events of default, including an event of default that would result from either the failure to pay at stated final maturity, or acceleration of the maturity of, a principal amount of any other indebtedness of Avaya Inc. or any of its restricted subsidiaries if the aggregate principal amount of such indebtedness, together with the principal amount of any other such indebtedness in default for failure to pay principal at final maturity or the maturity of which has been accelerated, aggregates $85 million or more at any time.
The following is a description of the material terms of our certificate of incorporation and bylaws as each is anticipated to be in effect upon the consummation of this offering.
General
Upon the consummation of this offering, the total amount of our authorized capital stock will consist of shares of common stock, par value $0.001 per share and shares of preferred stock, par value $0.001 per share. As of May 1, 2011,2013, we had 487,389,017488,663,114 shares of common stock outstanding, held by 96126 holders, and 125,000 shares of Series A Preferred Stock outstanding, held by 33 holders and 48,921 shares of Series B Convertible Preferred Stock outstanding, held by 8 holders.
Immediately following the consummation of this offering, and giving effect to the application of the net proceeds from this offering as described in “Use of Proceeds” above, we expect to have issued and outstanding shares of common stock ( common stock if the underwriters’ over-allotment option is exercised in full) and no Series A Preferred Stock outstanding. Immediately outstanding following the closing of this offer, we also expect to have:
outstanding vested and unvested options to acquire common stock and options available for grant under our 2007 Plan to acquire common stock;
outstanding RSUs issued under the 2007 Plan, each representing the right to receive one share of common stock, subject to certain restrictions on their transfer and sale as provided for in the 2007 Plan and the related award agreements; and
outstanding warrants to acquire a total of 100,000,000 shares of common stock (see “—Warrants”).
Common Stock
Holders of our common stock are entitled to one vote for each share held on all matters submitted to a vote of stockholders and do not have cumulative voting rights. An election of directors by our stockholders shall be determined by a plurality of the votes cast by the stockholders entitled to vote on the election. Holders of common stock are entitled to receive proportionately any dividends as may be declared by our board of directors, subject to any preferential dividend rights of any series of preferred stock that is outstanding at the time of the dividend.
In the event of our liquidation or dissolution, the holders of common stock are entitled to receive proportionately our net assets available for distribution to stockholders after payment of all debts and other liabilities and subject to the prior rights of any outstanding preferred stock.
All shares of common stock will, when issued, be duly authorized, fully paid and nonassessable. The rights, preferences and privileges of holders of common stock are subject to the rights of the holders of shares of any series of preferred stock that we may designate and issue in the future.
Warrants
In connection with the financing of the acquisition of NES, on December 18, 2009, we issued warrants to purchase 100,000,000 shares of our common stock. The warrants have a cashless exercise feature. The warrants contain customary adjustment provisions for stock splits, capital reorganizations and certain other distributions. The warrants have an exercise price of $3.25 per share and are exercisable at any time prior to December 18, 2019.
In connection with the issuance on May 29, 2012 of Series B Convertible Preferred Stock described below, we issued warrants to purchase 26,250,000 shares of our common stock. The warrants have a cashless exercise
feature. The warrants contain customary adjustment provisions for stock splits, capital reorganizations and certain other distributions. The warrants have an exercise price of $4.00 per share and are exercisable at any time prior to May 29, 2022.
Options and Restricted Stock Units
As of May 1, 2011,March 31, 2013, we had outstanding options to acquire 43,340,96936,262,394 shares of common stock which are held by our employees, directors and advisors, with exercise prices ranging from $3.00 to $5.00 per share and a
weighted average exercise price of $3.03$3.28 per share. As of May 1, 2011,March 31, 2013, we also had 1,470,0003,436,684 outstanding RSUs issued under the 2007 Plan. Each RSU represents the right to receive one share of common stock, subject to certain restrictions on their transfer and sale as provided for in the 2007 Plan and the related award agreements. In addition, as of May 1, 2011,March 31, 2013, we had outstanding Continuation Options to acquire 429,761 shares of common stock which are held by employees, with an exercise price of $1.25 per share, and Continuation Units to acquire 972,341 shares of common stock which are held by current and former employees.share.
Preferred Stock
Our board of directors is authorized to issue shares of preferred stock in one or more series, with such designations, preferences and relative participating, optional or other special rights, qualifications, limitations or restrictions as determined by our board of directors, without any further vote or action by our stockholders. We believe that the board of directors’ authority to set the terms of, and our ability to issue, preferred stock will provide flexibility in connection with possible financing transactions in the future. The issuance of preferred stock, however, could adversely affect the voting power of holders of common stock and the likelihood that such holders will receive dividend payments and payments upon a liquidation, dissolution or winding up of us.
Series A Preferred Stock
Our board of directors has designated 125,000 shares of preferred stock as Series A Preferred Stock. As of May 1,December 12, 2011 we had 125,000 shares of Series A Preferred Stock issued and outstanding. The certificate of designations for the Series A Preferred Stock grants holders of our Series A Preferred Stock the right to receive, as when and if declared by our board of directors and in preference to the holders of any and all other series or classes of capital stock, payable either in cash or, at our option, by issuance of additional shares of Series A Preferred Stock, cumulative annual dividends at a rate of 5% per annum on $1,000 per share (which value is to be proportionately adjusted to reflect any stock dividend, stock split, combination of shares, reclassification, reorganization, recapitalization or other similar event affecting the Series A Preferred Stock), compounded quarterly from and after the date of issuance of such shares of Series A Preferred Stock. Except as required by Delaware law or as otherwise provided by our certificate of incorporation, the holders of Series A Preferred Stock have no right to vote their shares at any stockholders’ meeting or provide consent to any action taken by stockholders in writing in lieu of a meeting.
In the event of certain events including our liquidation, dissolution or winding up, either voluntarily or involuntarily, a sale of all or substantially all of our assets, or our merger or consolidation, the holders of the Series A Preferred Stock are entitled to receive, in cash, prior and in preference to any other distribution of any of our assets to the holders of all series and classes of our stock, an amount per share equal to the sum of $1,000 (as adjusted to reflect any stock dividend, stock split, combination of shares, reclassification, reorganization, recapitalization or other similar event affecting the Series A Preferred Stock) plus the amount of accrued unpaid dividends for any prior dividend periods on such share, if any (such sum being referred to as the Series A Preferential Amount).We. We may at any time redeem, in cash, to the extent of lawfully available funds therefor, any or all Series A Preferred Shares at a price per share equal to the Series A Preferential Amount allocable to each share of Series A Preferred Stock.
As disclosed under “Use of Proceeds” above, we intend to use a portion of the net proceeds from this offering to redeem all outstanding shares of Series A Preferred Stock.
Series B Convertible Preferred Stock
Our board of directors has designated 52,500 shares of preferred stock as Series B Convertible Preferred Stock. As of March 31, 2013 we had 48,921 shares of Series B Convertible Preferred Stock issued and outstanding. The certificate of designations for the Series B Convertible Preferred Stock grants holders of our Series B Convertible Preferred Stock the right to receive, as when and if declared by our board of directors and in preference to the holders of any and all other series or classes of capital stock, payable either in cash or, at our option, by issuance of additional shares of Series B Convertible Preferred Stock, cumulative annual dividends at a rate of 8% per annum on $4,000 per share (which value is to be proportionately adjusted to reflect any stock dividend, stock split, combination of shares, reclassification, reorganization, recapitalization or other similar event affecting the Series B Convertible Preferred Stock), compounded annually from and after the date of issuance of such shares of Series B Convertible Preferred Stock. Except as required by Delaware law or as otherwise provided by our certificate of incorporation, the holders of Series B Convertible Preferred Stock have no right to vote their shares at any stockholders’ meeting or provide consent to any action taken by stockholders in writing in lieu of a meeting.
In the event of certain events including our liquidation, dissolution or winding up, either voluntarily or involuntarily, a sale of all or substantially all of our assets, or our merger or consolidation, the holders of the Series B Convertible Preferred Stock are entitled to receive, in cash, prior and in preference to any other distribution of any of our assets to the holders of all series and classes of our stock, an amount per share equal to the sum of $4,000 (as adjusted to reflect any stock dividend, stock split, combination of shares, reclassification, reorganization, recapitalization or other similar event affecting the Series B Convertible Preferred Stock) multiplied by the redemption premium, calculated as follows based on the date fixed for redemption: (1) from the date of issuance through the date of the 1st anniversary thereof, 110%; (2) from the date that follows the 1st anniversary through the date of the 2nd anniversary, 120%; (3) from the date that follows the 2nd anniversary through the date of the 3rd anniversary, 130%; (4) from the date that follows the 3rd anniversary through the date of the 4th anniversary, 140% and (4) any date that follows the 4th anniversary of the date of issuance, 150%, plus the amount of accrued unpaid dividends for any prior dividend periods on such share, if any (such sum being referred to as the Series B Preferential Amount). A majority of the holders of Series B Convertible Stock may elect at any time prior to this offering to redeem, in cash, to the extent of lawfully available funds therefor, all Series B Convertible Preferred Shares at a price per share equal to the Series B Preferential Amount allocable to each share of Series B Convertible Preferred Stock. We may at any time redeem, in cash, to the extent of lawfully available funds therefor, all Series B Convertible Preferred Shares at a price per share equal to the Series B Convertible Preferential Amount allocable to each share of Series B Convertible Preferred Stock.
Each holder of the Series B Convertible Preferred Stock may at any time prior to this offering elect to convert the shares of Series B Preferred Stock into shares of common stock, the number of which will be determined by dividing $4,000 (as adjusted to reflect any stock dividend, stock split, combination of shares, reclassification, reorganization, recapitalization or other similar event affecting the Series B Convertible Preferred Stock) plus all accrued and unpaid dividends by the lesser of (a) $4.00 (as adjusted to reflect any stock dividend, stock split, combination of shares, reclassification, reorganization, recapitalization or other similar event affecting the Series B Convertible Preferred Stock); or (b) in the event that such conversion is in connection with this offering, the offering price per share in such offering (such amount being referred to as the Conversion Price).
Notwithstanding the optional conversion and redemption rights described above, concurrently with the consummation of this offering, the Series B Convertible Preferred Stock will be converted into common stock at the Conversion Price or redeemed for cash at the Series B Preferential Amount. The determination of which will occur will be made by the majority of the holders of Series B Convertible Stock; however, if our Total Leverage Ratio (as defined in our senior secured credit facility) after giving effect to this offering would be greater than 5.0x, the Series B Convertible Preferred Stock will automatically convert into shares of our common stock.
Anti-takeover Effects of the Delaware General Corporation Law and Our Certificate of Incorporation and Bylaws
Our certificate of incorporation and our bylaws contain provisions that may delay, defer or discourage another party from acquiring control of us.us, some of which may only become effective when the Sponsors collectively cease to beneficially own at least 40% or more of our outstanding common stock (such time referred to in this section as the “triggering event”). We expect that these provisions, which are summarized below, will discourage coercive takeover practices or inadequate takeover bids. These provisions are also designed to encourage persons seeking to acquire control of us to negotiate first negotiate with the board of directors, which we believe may result in an improvement of the terms of any such acquisition in favor of our stockholders. However, they may also discourage acquisitions that some stockholders may favor. This offering will not constitute a triggering event.
Board of Directors
Immediately following this offering, the board of directors will consist of nine members, though it is the Company’s intention that another independent director will be added to the board of directors within one year of completion of this offering. Our certificate of incorporation provides that the board of directors will not have more than fifteen members. See “Certain Relationships and Related Party Transactions—Arrangements with Our Sponsors.”
Potential Staggered Board
Our current board is, and upon completion of this offering will be, comprised of a single class of directors. Our certificate of incorporation provides that at the first annual meeting after the triggering event, the Board shall be divided into three classes with staggered three-year terms. The classification of our Board could make it more difficult for a third party to acquire, or discourage a third party from seeking to acquire, control of our company.
Action by Written Consent
The Delaware General Corporation Law, or the DGCL, provides that, unless otherwise stated in a corporation’s certificate of incorporation, the stockholders may act by written consent without a meeting. Our certificate of incorporation and bylaws provide that, following the triggering event, any action required or permitted to be taken by our stockholders at an annual meeting or special meeting of the stockholders may only be taken if it is properly brought before such meeting, and not by written consent without a meeting. Prior to the triggering event, stockholders may act by written consent without a meeting.
Special Meeting of Stockholders and Advance Notice Requirements for Stockholder Proposals
Our certificate of incorporation and bylaws provide that, except as otherwise required by law, special meetings of the stockholders can only be called by (a) our chairman or, if one is appointed, vice chairman of the Board, (b) our president, (c) a majority of the board of directors through a special resolution or (d) prior to the triggering event, a Sponsor-nominated director.
In addition, following the first annual meeting of stockholders that occurs at least 90 days after the triggering event described above, our bylaws will require advance notice procedures for stockholder proposals to be brought before an annual meeting of the stockholders, including the nomination of directors. Stockholders at an annual meeting may only consider the proposals specified in the notice of meeting or brought before the meeting by or at the direction of the board of directors, or by a stockholder of record on the record date for the meeting, who is entitled to vote at the meeting and who has delivered a timely written notice in proper form to our secretary, of the stockholder’s intention to bring such business before the meeting.
These provisions could have the effect of delaying until the next stockholder meeting any stockholder actions that are favored by the holders of a majority of our outstanding voting securities.
Requirements for Removal and Interim Election of Directors
Our certificate of incorporation and bylaws provide that, prior to the triggering event, directors may be removed, with or without cause, by the holders of a majority of the shares entitled to vote on the election of directors, voting together as a single class.
Following the triggering event, our certificate of incorporation and bylaws provide that the directors may only be removed for cause and only by the affirmative vote of the holders of at least two-thirds of the voting power of our outstanding capital stock entitled to vote generally in the election of directors, voting together as a single class.
Vacancies and newly created directorships may be filled only by a vote of a majority of the directors then in office, even though less than a quorum, and not by the stockholders, except that, prior to a triggering event, such vacancies may be filled by a vote of holders of a majority of the outstanding common stock. In addition, the certificate of incorporation provides that any vacancy created by the removal of a director by the stockholders shall only be filled by, in addition to any other vote otherwise required by law, the affirmative vote of a majority of the outstanding common stock. Our bylaws allow the presiding officer at a meeting of the stockholders to adopt rules and regulations for the conduct of meetings, which may have the effect of precluding the conduct of certain business at a meeting if the rules and regulations are not followed.
These provisions may have the effect of deferring, delaying or discouraging hostile takeovers, or changes in control or management of our company.
Amendment to Certificate of Incorporation and Bylaws
The DGCL provides generally that the affirmative vote of a majority of the shares entitled to vote on any matter is required to amend a corporation’s certificate of incorporation or bylaws, unless a corporation’s certificate of incorporation or bylaws, as the case may be, requires a greater percentage. Prior to the triggering event, our bylaws may be amended by a majority vote of our board of directors or the affirmative vote of the holders of a majority of the outstanding common stock. Following the triggering event, our bylaws may be amended or repealed by a majority vote of our board of directors or, in addition to any other vote otherwise required by law, the affirmative vote of the holders of at least two-thirds of the voting power of our outstanding shares of common stock. Additionally, prior to the triggering event, our certificate of incorporation may be amended by the affirmative vote of the holders of a majority of the outstanding common stock. Following the triggering event, the affirmative vote of at least two-thirds of the voting power of the outstanding shares of capital stock entitled to vote on the adoption, alteration, amendment or repeal of our certificate of incorporation, voting as a single class, is required to amend or repeal or to adopt any provision inconsistent with the “Board of Directors,” “No Action by Written Consent,” “Special Meetings of Stockholders,” “Amendments to the Amended and Restated Certificate of Incorporation and Bylaws” and “Business Combinations” provisions described in our certificate of incorporation. These provisions may have the effect of deferring, delaying or discouraging the removal of any anti-takeover defenses provided for in our certificate of incorporation and our bylaws.
Exclusive Jurisdiction of Certain Actions
Our certificate of incorporation requires, to the fullest extent permitted by law, that derivative actions brought in the name of the company, actions against directors, officers and employees for breach of fiduciary duty and other similar actions may be brought only in the Court of Chancery in the State of Delaware. Although we believe this provision benefits the Company by providing increased consistency in the application of Delaware law in the types of lawsuits to which it applies, the provision may have the effect of discouraging lawsuits against our directors and officers.
Authorized but Unissued Shares
The authorized but unissued shares of common stock and preferred stock are available for future issuance without stockholder approval, subject to any limitations imposed by the listing standards of the New York Stock Exchange. These additional shares may be used for a variety of corporate finance transactions, acquisitions and employee benefit plans. The existence of authorized but unissued common stock and preferred stock could make more difficult or discourage an attempt to obtain control of us by means of a proxy contest, tender offer, merger or otherwise.
Business Combinations
We have elected to not be subject to Section 203 of the DGCL, which regulates business combinations with “interested stockholders,” until such time as neither Sponsor is an “interested stockholder” under the DGCL.
Corporate Opportunities
Our certificate of incorporation will provide that none of our Sponsors or non-employee directors, or any of their respective affiliates, partners, principals, directors, officers, members, managers or employees, shall have any fiduciary duty to refrain from engaging directly or indirectly in the same or similar business activities or lines of business as we do or offer us business opportunities of which they become aware. The affirmative vote of eighty percent (80%) of the voting power of the outstanding shares of capital stock entitled to vote on the adoption, alteration, amendment or repeal of amendments to our certificate of incorporation, voting together as a single class, shall be required to alter, amend or repeal, or to adopt any provision inconsistent with that provision.
Transfer Agent and Registrar
The transfer agent and registrar for our common stock is .
Listing
We intendhave applied to list our shares of common stock on the New York Stock Exchange under the symbol “ .”“AVYA.”
SHARES ELIGIBLE FOR FUTURE SALE
Before this offering, there has not been a public market for our common stock. As described below, only a limited number of shares currently outstanding will be available for sale immediately after this offering due to contractual and legal restrictions on resale. Nevertheless, future sales of substantial amounts of our common stock, including shares issued upon exercise of outstanding options and warrants, in the public market after the restrictions lapse, or the possibility of such sales, could cause the prevailing market price of our common stock to fall or impair our ability to raise equity capital in the future.
Upon the consummation of this offering, we will have outstanding an aggregate of approximately shares of common stock. In addition, as of the closing of this offering, (a) options to purchase an aggregate of approximately shares of our common stock will be outstanding, (b) restricted stock units, each representing the right to receive one share of common stock will be outstanding and (c) warrants to acquire 100,000,000 shares of our common stock will be outstanding. Of the outstanding shares, the shares sold in this offering will be freely tradable in the public market without restriction or further registration under the Securities Act, unless these shares are held by our affiliates, as that term is defined in Rule 144 under the Securities Act. Shares purchased by our affiliates may not be resold except pursuant to an effective registration statement or an exemption from registration.
The remaining shares of our common stock will be “restricted securities,” as that term is defined in Rule 144 under the Securities Act. These restricted securities may be sold in the public market only pursuant to an effective registration statement or an exemption from registration under Rule 144 and Rule 701 under the Securities Act. These rules are summarized below. Subject to our stockholders’ agreement and the lock-up agreements described below and the provisions of Rule 144 and Rule 701, these restricted securities will be available for sale in the public market as follows:
Number of Shares | Date of Availability for Sale | |
| Various times after the date of this prospectus pursuant to Rule 144 | ||
| Various times beginning 180 days after the date of this prospectus |
Lock-Up Arrangements
We and our officers, directors, employees and certain stockholders, including the Sponsors, who together hold an aggregate of shares of our common stock after the consummation of this offering, have agreed, subject to limited exceptions, not to directly or indirectly sell or dispose of any shares of common stock or any securities convertible into or exchangeable or exercisable for shares of common stock for a period of 180 days after the date of this prospectus, unless extended pursuant to its terms, without the prior written consent of Morgan Stanley & Co. LLC, Goldman, Sachs & Co. and J.P. Morgan Securities LLC. For additional information, see “Underwriters.”
Rule 144
In general, under Rule 144, immediately upon the completion of this offering, a person who is not our affiliate and has not been our affiliate at any time during the preceding three months will be entitled to sell any shares of our common stock that such person has held for at least six months, including the holding period of any prior owner other than one of our affiliates, without regard to volume limitations. Sales of our common stock by any such person would be subject to the availability of current public information about us if the shares to be sold were held by such person for less than one year.
Our affiliates who have beneficially owned shares of our common stock for at least six months, including the holding period of any prior owner other than another of our affiliates, would be entitled to sell within any three-month period those shares and any other shares they have acquired that are not restricted securities, provided that the aggregate number of shares sold does not exceed the greater of:
1% of the number of shares of our common stock then outstanding, which will equal approximately shares immediately after this offering, and
the average weekly trading volume in our common stock on during the four calendar weeks preceding the date of filing of a Notice of Proposed Sale of Securities Pursuant to Rule 144 with respect to the sale.
Sales under Rule 144 by our affiliates are also subject to manner of sale provisions and notice requirements and to the availability of current public information about us.
Rule 701
In general, under Rule 701, any of an issuer’s employees, directors, officers, consultants or advisors who purchases shares from the issuer in connection with a compensatory stock or option plan or other written agreement before the effective date of a registration statement under the Securities Act is entitled to sell such shares 90 days after such effective date in reliance on Rule 144. An affiliate of the issuer can resell shares in reliance on Rule 144 without having to comply with the holding period requirement, and non-affiliates of the issuer can resell shares in reliance on Rule 144 without having to comply with the current public information and holding period requirements.
The SEC has indicated that Rule 701 will apply to typical stock options granted by an issuer before it becomes subject to the reporting requirements of the Exchange Act, along with the shares acquired upon exercise of such options, including exercises after an issuer becomes subject to the reporting requirements of the Exchange Act.
Stock Plans
We intend to file a registration statement on Form S-8 under the Securities Act covering shares of our common stock issuable upon exercise of outstanding options under the 2007 Plan and for future equity incentive plans to be effective upon consummation of this offering. Resale of these shares will be subject to any applicable contractual lock-up periods.
Registration Rights
Subject to the lock-up agreements described above, certain holders of our common stock may demand that we register their shares under the Securities Act or, if we file another registration statement under the Securities Act other than a Form S-8 covering securities issuable under our equity plans or on Form S-4, may elect to include their shares of common stock in such registration. Shares sold pursuant to any such registration statement will be freely tradable without restriction under the Securities Act, unless held by our affiliates.
CERTAIN MATERIAL U.S. FEDERAL INCOME TAX CONSIDERATIONS FOR
NON-U.S. HOLDERS OF COMMON STOCK
The following is a summary of certainthe material U.S. federal income and estate tax considerations relating to the purchase, ownership and disposition of our common stock by Non-U.S. Holders (defined below). This summary does not purport to be a complete analysis of all the potential tax considerations relevant to Non-U.S. Holders of our common stock. This summary is based upon the Internal Revenue Code of 1986, as amended (the “Code”), the U.S. Treasury regulations promulgated or proposed thereunder and administrative and judicial interpretations thereof, all as of the date hereof and all of which are subject to change at any time, possibly on awith retroactive basis.effect.
This summary deals only with shares of our common stock that are purchased in this offering and held as “capital assets” within the meaning of Section 1221 of the Code. This summary does not purport to deal with all aspects of U.S. federal income and estate taxation that might be relevant to particular Non-U.S. Holders in light of their particular investment circumstances or status, nor does it address specific tax considerations that may be relevant to particular persons (including, for example, financial institutions, broker-dealers, insurance companies, partnerships or other pass-through entities, certain U.S. expatriates, tax-exempt organizations,entities, pension plans, “controlled foreign corporations,” “passive foreign investment companies,” corporations that accumulate earnings to avoid U.S. federal income tax, persons in special situations, such as those who have elected to mark securities to market or those who hold common stock as part of a straddle, hedge, conversion transaction, synthetic security or other integrated investment, or holders subject to the alternative minimum tax). In addition, this summary does not address any U.S. federal income tax consequences other than U.S. federal income tax consequences (such as estate and gift tax considerations) or considerations under the tax laws of the United States, any state, local or non-U.S. jurisdiction.
For purposes of this summary, a “Non-U.S. Holder” means a beneficial owner of common stock that is, for U.S. federal income tax purposes, an individual, corporation, estate or trust and is not:
an individual who is a citizen or resident of the United States;
a corporation or any other organization taxable as a corporation for U.S. federal income tax purposes, created or organized in or under the laws of the United States, any state thereof or the District of Columbia;
an estate, the income of which is included in gross income for U.S. federal income tax purposes regardless of its source; or
a trust, if (1)(i) a U.S. court is able to exercise primary supervision over the trust’s administration and one or more U.S. persons have the authority to control all of the trust’s substantial decisions or (2)(ii) the trust has a valid election in effect under applicable U.S. Treasury Regulationsregulations to be treated as a U.S. person.
If an entity that is classifiedtreated as a partnership for U.S. federal income tax purposes holds our common stock, the tax treatment of its partners will generally depend upon the status of the partner and the activities of the partnership. Partnerships and other entitiesEntities that are classifiedtreated as partnerships for U.S. federal income tax purposes and persons holdingconsidering an investment in our common stock through a partnership or otheran entity classifiedtreated as a partnership for U.S. federal income tax purposes are urged to consult their own tax advisors.
There can be no assurance that the IRSInternal Revenue Service (“IRS”) will not challenge one or more of the tax consequences described herein, and we have not obtained, nor do we intend to obtain, an opinion of counsela ruling from the IRS with respect to the U.S. federal income or estate tax consequences to a Non-U.S. Holder of the purchase, ownership or disposition of our common stock.
THIS SUMMARY IS FOR GENERAL INFORMATION ONLY AND NOT INTENDEDSPECIFIC TO BE TAX ADVICE.ANY PARTICULAR INVESTOR. NON-U.S. HOLDERS ARE URGED TO CONSULT THEIR OWN TAX ADVISORS CONCERNING THE U.S. FEDERAL, INCOME AND ESTATE TAXATION, STATE, LOCAL AND NON-U.S. TAXATIONINCOME AND
OTHER TAX CONSEQUENCES TO THEM OF THE PURCHASE, OWNERSHIP AND DISPOSITION OF OUR COMMON STOCK, AS WELL AS THE APPLICATION OF U.S. FEDERAL STATE, LOCAL AND NON-U.S. INCOME AND OTHER TAX LAWS.
Distributions on Our Common Stock
As discussed under “Dividend Policy” above, we do not currently expect to pay dividends. In the event thatdividends on our common stock. If we do make a distribution of cash or other property with respect to our common stock, any such distributions generally will constitute dividends for U.S. federal income tax purposes to the extent of our current or accumulated earnings and profits, as determined under U.S. federal income tax principles. If a distribution exceeds our current and accumulated earnings and profits, the excess will be treated asfirst constitute a tax-free return of capital and will reduce the Non-U.S. Holder’s investment, up to such holder’s tax basis in theour common stock.stock (normally determined on a share by share basis), but not below zero. Any remaining excess will be treated as capital gain, subject to the tax treatment described below in “Gain“—Gain on Sale, Exchange or Other Taxable Disposition of Our Common Stock.” Any such distribution would also be subject to the discussion below in “—Additional FATCA Withholding.”
Dividends paid to a Non-U.S. Holder generally will be subject to a 30% U.S. federal withholding tax unless such Non-U.S. Holder provides us or our agent, as the case may be, with the appropriate IRS Form W-8, such as:
IRS Form W-8BEN (or successor form) claiming,certifying, under penalties of perjury, a reduction in or exemption from withholding under an applicable income tax treaty;treaty, or
IRS Form W-8ECI (or successor form) statingcertifying that a dividend paid on common stock is not subject to such withholding tax because it is effectively connected with a trade or business in the United States of the Non-U.S. Holder (in which case such dividend generally will be subject to regular graduated U.S. federal income tax rates as described below).
The certification requirement described above also may require a Non-U.S. Holder that provides an IRS form or that claims treaty benefits to provide its U.S. taxpayer identification number.
Special certification and other requirements apply in the case of certain Non-U.S. Holders that are intermediaries or pass-through entities for U.S. federal income tax purposes. Each Non-U.S. Holder is urged to consult its own tax advisor about the specific methods for satisfying these requirements. A claim for exemption will not be valid if the person receiving the applicable form has actual knowledge or reason to know that the statements on the form are false.
If dividends are effectively connected with a trade or business in the United States of thea Non-U.S. Holder, (and, if required by an applicable income tax treaty, attributable to a U.S. permanent establishment), the Non-U.S. Holder, although exempt from the withholding tax described above (provided that the certifications described above are satisfied), generally will be subject to U.S. federal income tax on such dividends on a net income basis in the same manner as if it were a U.S. person.resident of the United States (unless an applicable tax treaty provides otherwise). In addition, if sucha Non-U.S. Holder is treated as a non-U.S. corporation and dividends are effectively connected with its trade or business in the United States (and, if required by an applicablefor U.S. federal income tax treaty, attributable to a U.S. permanent establishment), suchpurposes, the Non-U.S. Holder may be subject to an additional “branch profits tax” equal to 30% (unless reduced by an applicable income treaty) of its earnings and profits, subject to adjustments, in respect of such effectively-connectedeffectively connected dividend income.
If a Non-U.S. Holder is eligible for a reduced rate of U.S. federal withholding tax pursuant to an income tax treaty, suchthe holder may obtain a refund or credit of any excess amount withheld by timely filing an appropriate claim for refund with the IRS.
Gain on Sale, Exchange or Other Taxable Disposition of Our Common Stock
Subject to the discussion below under the Section titled “Recently Enacted Legislation Affecting Taxation of Our Common Stock Held By or Through Foreign Entities,in “—Additional FATCA Withholding,” in general, a Non-U.S. holderHolder will not be subject to U.S. federal income tax or withholding tax on any gain realized upon such holder’s sale, exchange or other taxable disposition of shares of our common stock unless (i) such Non-U.S. Holder is an individual who is present in the United States for 183 days or more in the taxable year of disposition, and certain
other conditions are met, (ii) we are or have been a “United States real property holding corporation,” or a USRPHC as defined in the Code (a “USRPHC”), at any time within the shorter of the five-year period preceding the disposition and the Non-U.S. Holder’s holding period in the shareshares of our common stock, and certain other requirements are met, or (iii) such gain is effectively connected with the conduct by such Non-U.S. Holder of a trade or business in the United States (and, if required by an applicable income tax treaty, is attributable to a permanent establishment maintained by such Non-U.S. Holder)Holder in the United States).
If the first exception applies, the Non-U.S. Holder generally will be subject to U.S. federal income tax at a rate of 30% (or at a reduced rate under an applicable income tax treaty) on the amount by which such Non-U.S. Holder’s capital gains allocable to U.S. sources (including gain, if any, realized on a disposition of our common stock) exceed capital losses allocable to U.S. sources during the taxable year of the disposition. If the third exception applies, the Non-U.S. Holder generally will be subject to U.S. federal income tax with respect to such gain on a net income basis in the same manner as if it were a U.S. holder, unless otherwise provided in an applicable income tax treaty,resident of the United States, and a Non-U.S. Holder that is a corporation for U.S. federal income tax purposes may also be subject to a branch profits tax with respect any earnings and profits, subject to adjustments, attributable to such gain at a rate of 30% (or at a reduced rate under an applicable income tax treaty).
For purposes of the second exception,Generally, a corporation generally is a U.S. real property holding corporationUSRPHC only if the fair market value of its U.S. real property interests (as defined in the Internal Revenue Code) equals or exceeds 50% of the sum of the fair market value of its worldwide real property interests plus its other assets used or held for use in a trade or business. Although there can be no assurance in this regard, we believe that we are not, and do not currently anticipate becoming, a USRPHC. However, because the determination of whether we are a USRPHC depends on the fair market value of our U.S. real property relative to the fair market value of other business assets, there can be no assurance that we will not become a USRPHC in the future. Even if we were to become a USRPHC, a Non-U.S. Holder would not be subject to U.S. federal income tax on a sale, exchange or other taxable disposition of our common stock by reason of our status as a USRPHC so long as our common stock continues to beis regularly traded on an established securities market at any time during the calendar year in which the disposition occurs and such Non-U.S. Holder does not own and is not deemed to own (directly, indirectly or constructively) more than 5% of our common stock at any time during the shorter of the five-year period ending on the date of disposition and the holder’s holding period.
Recently Enacted Legislation Affecting Taxation of Our Common Stock Held By or Through Foreign Entities
Under recently enacted legislation, the relevant withholding agent may However, no assurance can be required to withhold 30% of any dividends and the proceeds of a sale ofprovided that our common stock paid after December 31, 2012 to (i) a foreign financial institution (whether holding stockwill be regularly traded on an established securities market for its own account or on behalf of its account holders/investors) unless such foreign financial institution agrees to verify, report and disclose its U.S. account holders and meets certain other specified requirements or (ii) a non-financial foreign entity that is the beneficial ownerpurposes of the payment unless such entity certifies that it does not have any substantial U.S. owners or provides the name, address and taxpayer identification number of each substantial U.S owner and such entity meets certain other specified requirements. The scope of these requirements remains unclear and potentially subjectrules described above. Prospective investors are encouraged to material changes resulting from any future guidance. Non-U.S. Holders should consult their own tax advisors regarding the effect of this newly enacted legislation.possible consequences to them if we are, or were to become, a USRPHC.
Additional FATCA Withholding
Under Sections 1471 through 1474 of the Internal Revenue Code and related Treasury guidance (“FATCA”), a withholding tax of 30% will be imposed in certain circumstances on payments of (a) dividends on our common stock on or after January 1, 2014, and (b) gross proceeds from the sale or other disposition of our common stock on or after January 1, 2017 to certain foreign financial institutions or foreign entities that are not foreign financial institutions. In the case of payments made to a ‘‘foreign financial institution’’ as defined under FATCA (including, among other entities, an investment fund), as a beneficial owner or as an intermediary, the tax generally will be imposed, subject to certain exceptions, unless such institution (i) enters into (or is otherwise subject to) and complies with an agreement with the U.S. government (a “FATCA Agreement”) or (ii) complies with applicable foreign law enacted in connection with an intergovernmental agreement between the United States and a foreign jurisdiction (an “IGA”), in either case to, among other things, collect and provide to the U.S. or other relevant taxing authorities certain information regarding U.S. account holders of such institution. In the case of payments made to a foreign entity that is not a foreign financial institution (as a beneficial owner or an intermediary), the tax generally will be imposed, subject to certain exceptions, unless such foreign entity provides the withholding agent with a certification that it does not have any “substantial U.S. owner” (generally, any specified U.S. person that directly or indirectly owns more than a specified percentage of such entity) or that identifies its substantial U.S. owners. If our common stock is held through a foreign financial institution that enters into (or is otherwise subject to) a FATCA Agreement, such foreign financial institution (or, in certain
cases, a person paying amounts to such foreign financial institution) generally will be required, subject to certain exceptions, to withhold such tax on payments of dividends and proceeds described above made to (x) a person (including an individual) that fails to comply with certain information requests or (y) a foreign financial institution that has not entered into (and is not otherwise subject to) a FATCA Agreement and is not required to comply with FATCA pursuant to applicable foreign law enacted in connection with an IGA. Each Non-U.S. Holder should consult its own tax advisor regarding the application of FATCA to the ownership and disposition of our common stock, including through an intermediary.
Backup Withholding and Information Reporting
Subject to the discussion in the preceding paragraph, weWe must report annually to the IRS and to each Non-U.S. Holder the gross amount of the distributions on our common stock paid to suchthe holder and the tax withheld, if any, with respect to suchthe distributions.
Non-U.S. holders mayHolders must generally have to comply with specific certification procedures to establish that the holder is not a U.S.United States person (as defined in the Internal Revenue Code) in order to avoid backup withholding at the applicablea rate currentlyof 28% and scheduled to increase to 31% in 2013, with respect to dividends on our common stock. Dividends paid to Non-U.S. Holders subject to the U.S. withholding tax, as described above in “Distributions on Our Common Stock,” generally will be exempt from U.S. backup withholding.stock, or otherwise establish an exemption.
Information reporting and backup withholding will generally apply to the proceeds of a disposition of our common stock by a Non-U.S. Holder effected by or through the U.S. office of any broker, U.S. or foreign, unless the holder certifies its status as a Non-U.S. Holder and satisfies certain other requirements, or otherwise establishes an exemption. Generally, information reporting and backup withholding will not apply to a payment of disposition proceeds to a Non-U.S. Holder where the transaction is effected outside the United States through
a non-U.S. office of a broker. However, for information reporting purposes, dispositionsDispositions effected through a non-U.S. office of a U.S. broker or a non-U.S. broker with substantial U.S. ownership or operations generally will be treated in a manner similar to dispositions effected through a U.S. office of a broker. Non-U.S. holdersProspective investors should consult their own tax advisors regarding the application of the information reporting and backup withholding rules to them.
Copies of information returns may be made available to the tax authorities of the country in which the Non-U.S. Holder resides or is incorporated under the provisions of a specific treaty or agreement.
Backup withholding is not an additional tax. Any amounts withheld under the backup withholding rules from a payment to a Non-U.S. Holder can be refunded or credited against the Non-U.S. Holder’s U.S. federal income tax liability, if any, provided that an appropriate claim is timely filed with the IRS.
Federal EstateAdditional Tax on Net Investment Income
Common stock held by an individual whoFor taxable years beginning after December 31, 2012, a 3.8% tax is not a citizen or resident ofimposed on the United States at the time of death for U.S. federal estate tax purposes,net investment income (which includes dividends and common stock held by certain entities the property of which is includible in such an individual’s gross estate for U.S. federal estate tax purposes, will be included in such an individual’s gross estate for U.S. federal estate tax purposes, unless an applicable estate tax treaty provides otherwise. Under current law, the taxable estategains recognized upon of a decedent dyingdisposition of stock) of certain individuals, trusts, and estates with adjusted gross income in 2011 or 2012excess of certain thresholds. The tax is subject toexpressly not imposed on nonresident aliens, and proposed guidance suggests estates and trusts that are Non-U.S. Holders and have no U.S. federal estatebeneficiaries are exempted from the tax. Therefore, Non-U.S. Holders of our common shares should consult their own tax at a maximum rateadvisors regarding application of 35%. The taxable estate of a decedent dying after 2012 will be subject to U.S. federal estatethis tax at a maximum rate of 55%, but before the end of 2012 Congress may pass legislation amending the U.S. federal estate tax rates or other aspects of the U.S. federal estate tax applicable to estates of decedents dying after 2012.in their particular situations.
Under the terms and subject to the conditions contained in an underwriting agreement dated the date of this prospectus, Morgan Stanley & Co. LLC, Goldman, Sachs & Co. and J.P. Morgan Securities LLC are acting as the representatives and joint book-running managers. Citigroup Global Markets Inc., Deutsche Bank Securities Inc., Merrill Lynch, Pierce, Fenner & Smith Incorporated, Barclays Capital Inc., UBS Securities LLC and Credit Suisse Securities (USA) LLC are also acting as joint book-running managers for the offering. The underwriters have severally agreed to purchase, and we have agreed to sell to them, severally the number of shares indicated below:
Name | Number of Shares | |||
Morgan Stanley & Co. LLC | ||||
Goldman, Sachs & Co. | ||||
J.P. Morgan Securities LLC | ||||
Citigroup Global Markets Inc. | ||||
Deutsche Bank Securities Inc. | ||||
Merrill Lynch, Pierce, Fenner & Smith Incorporated | ||||
Barclays Capital Inc. | ||||
UBS Securities LLC | ||||
Credit Suisse Securities (USA) LLC | ||||
Total | $ | |||
The underwriters and the representatives are collectively referred to as the “underwriters” and the “representatives,” respectively. The underwriters are offering the shares of common stock subject to their acceptance of the shares from us and subject to prior sale. The underwriting agreement provides that the obligations of the several underwriters to pay for and accept delivery of the shares of common stock offered by this prospectus are subject to the approval of certain legal matters by their counsel and to certain other conditions. The underwriters are obligated to take and pay for all of the shares of common stock offered by this prospectus if any such shares are taken. However, the underwriters are not required to take or pay for the shares covered by the underwriters’ over-allotment option described below. The offering of the shares by the underwriters is subject to receipt and acceptance and subject to the underwriters’ right to reject any order in whole or in part.
The underwriters initially propose to offer part of the shares of common stock directly to the public at the public offering price listed on the cover page of this prospectus and part to certain dealers at a price that represents a concession not in excess of $ a share under the public offering price. After the initial offering of the shares of common stock, the offering price and other selling terms may from time to time be varied by the representatives, including in connection with sales of unsold allotments of common stock or subsequent sales of common stock purchased by the representatives in stabilizing and related transactions.
We granted to the underwriters an option, exercisable for 30 days from the date of this prospectus, to purchase up to additional shares of our common stock at the public offering price listed on the cover page of this prospectus, less underwriting discounts and commissions. To the extent the option is exercised, each underwriter will become obligated, subject to certain conditions, to purchase about the same percentage of the additional shares of common stock as the number listed next to the underwriter’s name in the preceding table bears to the total number of shares of common stock listed next to the names of all underwriters in the preceding table.
The following table shows the per share and total public offering price, underwriting discounts and commissions and proceeds before expenses to us. These amounts are shown assuming both no exercise and full exercise of the underwriters’ option to purchase up to additional shares of our common stock.
| Total | ||||||||||||
| Per Share | No Exercise | Full Exercise | ||||||||||
Public offering price | $ | $ | $ | |||||||||
Underwriting discounts and commissions | $ | $ | $ | �� | ||||||||
Proceeds, before expenses, to us | $ | $ | $ | |||||||||
The estimated offering expenses payable by us, are approximately $ million, which includes legal, accounting and printing costs and various other fees associated with the registration of the common stock to be sold pursuant to this prospectus.
The underwriters have informed us that they do not intend sales to discretionary accounts to exceed 5% of the total number of shares of common stock offered by them.
We have applied to list our common stock on the New York Stock Exchange under the symbol “ .”“AVYA.”
We and all of our directors and officers have agreed that, without the prior written consent of Morgan Stanley & Co. LLC, Goldman, Sachs & Co. and J.P. Morgan Securities LLC on behalf of the underwriters, we and they will not, during the period ending 180 days after the date of this prospectus:
offer, pledge, sell, contract to sell, sell any option or contract to purchase, purchase any option or contract to sell, grant any option, right or warrant to purchase, lend or otherwise transfer or dispose of, directly or indirectly, any shares of common stock or any securities convertible into or exercisable or exchangeable for shares of common stock; or
enter into any swap or other arrangement that transfers to another, in whole or in part, any of the economic consequences of ownership of the common stock.
in our case, file any registration statement with the SEC relating to the offering of any shares of common stock or any securities convertible into or exercisable or exchangeable for common stock;
whether any such transaction described in the first two bullet points above is to be settled by delivery of common stock or such other securities, in cash or otherwise. In addition, we and each such person agrees that, without the prior written consent of Morgan Stanley & Co. LLC, Goldman, Sachs & Co. and J.P. Morgan Securities LLC, on behalf of the underwriters, it will not, during the period ending 180 days after the date of this prospectus, make any demand for, or exercise any right with respect to, the registration of any shares of common stock or any security convertible into or exercisable or exchangeable for common stock.
The restrictions described in the immediately preceding paragraph do not apply to:
the sale of shares to the underwriters;
| • | transactions by persons other than us relating to shares of our common stock or other securities acquired in open market transactions after the completion of the offering of the shares,provided that no filing under Section 16(a) of the Exchange Act shall be required or shall be voluntarily made in connection with subsequent sales of our common stock or other securities acquired in such open market transactions; |
| • | transfers by any person other than us of shares of our common stock or any security convertible into our common stock as abona fide gift,provided that each donee shall enter into a written agreement accepting the restrictions set forth herein and no filing under Section 16(a) of the Exchange Act, |
reporting a reduction in beneficial ownership of shares of our common stock, shall be required or shall be voluntarily made during the restricted period; |
| • | distributions by any persons other than us of shares of common stock or any security convertible into our common stock to partners, members, stockholders, affiliates or any entity which is directly or indirectly controlled by, or is under common control with, such person,provided that each distributee shall enter into a written agreement accepting the restrictions set forth herein and no filing under Section 16(a) of the Exchange Act, reporting a reduction in beneficial ownership of shares of our common stock, shall be required or shall be voluntarily made during the restricted period; or |
| • | the establishment of a trading plan pursuant to Rule 10b5-1 under the Exchange Act for the transfer of shares of our common stock,provided that such plan does not provide for the transfer of our common stock during the restricted period and no public announcement or filing under the Exchange Act regarding the establishment of such plan shall be required of or voluntarily made by or on behalf of such person or us. |
The 180-day restricted period described in the preceding paragraphs will be extended if:
during the last 17 days of the 180-day restricted period, we issue an earnings release or material news or a material event relating to us occurs; or
prior to the expiration of the 180-day restricted period, we announce that we will release earnings results during the 16-day period beginning on the last day of the 180-day period;
in which case the restrictions described in the preceding paragraphs will continue to apply until the expiration of the 18-day period beginning on the issuance of the earnings release or the occurrence of the material news or material event.
In order to facilitate this offering of the common stock, the underwriters may engage in transactions that stabilize, maintain or otherwise affect the price of the common stock. Specifically, the underwriters may sell more shares than they are obligated to purchase under the underwriting agreement, creating a short position. A short sale is covered if the short position is no greater than the number of shares available for purchase by the underwriters under the over-allotment option. The underwriters can close out a covered short sale by exercising the over-allotment option or purchasing shares in the open market. In determining the source of shares to close out a covered short sale, the underwriters will consider, among other things, the open market price of shares compared to the price available under the over-allotment option. The underwriters may also sell shares in excess of the over-allotment option, creating a naked short position. The underwriters must close out any naked short position by purchasing shares in the open market. A naked short position is more likely to be created if the underwriters are concerned that there may be downward pressure on the price of the common stock in the open market after pricing that could adversely affect investors who purchase in this offering. In addition, to stabilize the price of common stock, the underwriters may bid for, and purchase, shares of common stock in the open market. Finally, the underwriting syndicate may reclaim selling concessions allowed to an underwriter or a dealer for distributing the common stock in this offering, if the syndicate repurchases previously distributed common stock to cover syndicate short positions or to stabilize the price of the common stock. These activities may raise or maintain the market price of the common stock above independent market levels or prevent or retard a decline in the market price of the common stock. The underwriters are not required to engage in these activities and may end any of these activities at any time.
The underwriters may also impose a penalty bid. This occurs when a particular underwriter repays to the underwriters a portion of the underwriting discount received by it because the representatives have repurchased shares sold by or for the account of such underwriter in stabilizing or short covering transactions.
The underwriters and their respective affiliates are full-service financial institutions engaged in various activities, which may include securities trading, commercial and investment banking, financial advisory,
investment management, investment research, principal investment, hedging, financing and brokerage activities. From time to time, certain of the underwriters and/or their respective affiliates may provide investment banking services to us. In addition, affiliates of certain of the underwriters are our customers and the contracts governing such relationships were entered into at arm’s length and on customary terms. In the ordinary course of their various business activities, the underwriters and their respective affiliates may make or hold a broad array of investments and actively trade debt and equity securities (or related derivative securities) and financial instruments (including bank loans) for their own account and for the accounts of their customers, and such investment and securities activities may involve securities and/or instruments of Avaya, including the existing senior unsecured notes. The underwriters and their respective affiliates may also make investment recommendations and/or publish or express independent research views in respect of such securities or instruments and may at any time hold, or recommend to clients that they acquire, long and/or short positions in such securities and instruments. The underwriters and their affiliates have in the past engaged, currently engage and may in the future engage, in transactions with and perform services for, including commercial banking, financial advisory and investment banking services, us and our affiliates in the ordinary course of business for which they have received or will receive customary fees and expenses. We also have, and expect to continue to have, economic hedges, cash management relationships and/or other swaps and hedges in place with certain of the underwriters or their affiliates on customary economic terms. An affiliate of J.P. Morgan Securities LLC owns shares representing less than 5% of our outstanding stock. Affiliates of certain of the underwriters are lenders and/or agents under our existing credit facilities.
We and the several underwriters have agreed to indemnify each other against certain liabilities, including liabilities under the Securities Act.
A prospectus in electronic format may be made available on websites maintained by one or more underwriters, or selling group members, if any, participating in this offering. The representatives may agree to allocate a number of shares of common stock to underwriters for sale to their online brokerage account holders. Internet distributions will be allocated by the representatives to underwriters that may make Internet distributions on the same basis as other allocations.
Selling Restrictions
European Economic Area
In relation to each Member State of the European Economic Area which has implemented the Prospectus Directive (each referred to as a Relevant Member State), each underwriter has represented and agreed that with effect from and including the date on which the Prospectus Directive is implemented in that Relevant Member State, or the Relevant Implementation Date, it has not made and will not make an offer of shares which are the subject of the offering contemplated by this prospectus to the public in that Relevant Member State other than:
(a) to any legal entity which is a qualified investor as defined in the Prospectus Directive.
(b) to fewer than 100 or, if the Relevant Member State has implemented the relevant provision of the 2010 PD Amending Directive, 150, natural or legal persons (other than qualified investors as defined in the Prospectus Directive), as permitted under the Prospectus Directive subject to obtaining the prior consent of the relevant Dealer or Dealers nominated by the Issuer for any such offer; or
(c) in any other circumstances falling within Article 3(2) of the Prospectus Directive,
provided that no such offer of shares shall require the Issuer or any underwriter to publish a prospectus pursuant to Article 3 of the Prospectus Directive.
For the purposes of this provision, the expression an “offer of shares to the public” in relation to any shares in any Relevant Member State means the communication in any form and by any means of sufficient information on the terms of the offer and the shares to be offered so as to enable an investor to decide to purchase or
subscribe the shares, as the same may be varied in that Member State by any measure implementing the Prospectus Directive in that Member State, the expression “Prospectus Directive” means Directive 2003/71/EC (and amendments thereto, including the 2010 PD Amending Directive, to the extent implemented in the Relevant Member State), and includes any relevant implementing measure in the Relevant Member State and the expression “2010 PD Amending Directive” means Directive 2010/73/EU.
United Kingdom
Each underwriter has represented and agreed that:
(a) (i) it is a person whose ordinary activities involve it in acquiring, holding, managing or disposing of investments (as principal or agent) for the purposes of its business and (ii) it has not offered or sold and will not offer or sell the shares other than to persons whose ordinary activities involve them in acquiring, holding, managing or disposing of investments (as principal or as agent) for the purposes of their businesses or who it is reasonable to expect will acquire, hold, manage or dispose of investments (as principal or agent) for the purposes of their businesses where the issue of the shares would otherwise constitute a contravention of Section 19 of the FSMA by the Issuer;
(b) it has only communicated or caused to be communicated and will only communicate or cause to be communicated an invitation or inducement to engage in investment activity (within the meaning of Section 21 of the FSMA) received by it in connection with the issue or sale of the shares in circumstances in which Section 21(1) of the FSMA does not apply to the Issuer or the Guarantors; and
(c) it has complied and will comply with all applicable provisions of the FSMA with respect to anything done by it in relation to the shares in, from or otherwise involving the United Kingdom.
France
Neither this prospectus nor any other offering material relating to the shares described in this prospectus has been submitted to the clearance procedures of the Autorité des Marchés Financiers or of the competent authority of another member state of the European Economic Area and notified to the Autorité des Marchés Financiers. The shares have not been offered or sold and will not be offered or sold, directly or indirectly, to the public in France. Neither this prospectus nor any other offering material relating to the shares has been or will be:
released, issued, distributed or caused to be released, issued or distributed to the public in France; or
used in connection with any offer for subscription or sale of the shares to the public in France.
Such offers, sales and distributions will be made in France only:
to qualified investors (investisseurs qualifiés) and/or to a restricted circle of investors (cercle restreint d’investisseurs), in each case investing for their own account, all as defined in, and in accordance with articles L.411-2, D.411-1, D.411-2, D.734-1, D.744-1, D.754-1 and D.764-1 of the French Code monétaire et financier;
to investment services providers authorized to engage in portfolio management on behalf of third parties; or
in a transaction that, in accordance with article L.411-2-II-1°-or-2°-or 3° of the French Code monétaire et financier and article 211-2 of the General Regulations (Règlement Général) of the Autorité des Marchés Financiers, does not constitute a public offer (appel public à l’épargne).
The shares may be resold directly or indirectly, only in compliance with articles L.411-1, L.411-2, L.412-1 and L.621-8 through L.621-8-3 of the French Code monétaire et financier.
Hong Kong
The shares may not be offered or sold by means of any document other than (i) in circumstances which do not constitute an offer to the public within the meaning of the Companies Ordinance (Cap.32, Laws of Hong Kong), or (ii) to “professional investors” within the meaning of the Securities and Futures Ordinance (Cap.571, Laws of Hong Kong) and any rules made thereunder, or (iii) in other circumstances which do not result in the document being a “prospectus” within the meaning of the Companies Ordinance (Cap.32, Laws of Hong Kong), and no advertisement, invitation or document relating to the shares may be issued or may be in the possession of any person for the purpose of issue (in each case whether in Hong Kong or elsewhere), which is directed at, or the contents of which are likely to be accessed or read by, the public in Hong Kong (except if permitted to do so under the laws of Hong Kong) other than with respect to shares which are or are intended to be disposed of only to persons outside Hong Kong or only to “professional investors” within the meaning of the Securities and Futures Ordinance (Cap. 571, Laws of Hong Kong) and any rules made thereunder.
Singapore
This prospectus has not been registered as a prospectus with the Monetary Authority of Singapore. Accordingly, this prospectus and any other document or material in connection with the offer or sale, or invitation for subscription or purchase, of the shares may not be circulated or distributed, nor may the shares be offered or sold, or be made the subject of an invitation for subscription or purchase, whether directly or indirectly, to persons in Singapore other than (i) to an institutional investor under Section 274 of the Securities and Futures Act, Chapter 289 of Singapore (the “SFA”), (ii) to a relevant person, or any person pursuant to Section 275(1A), and in accordance with the conditions, specified in Section 275 of the SFA or (iii) otherwise pursuant to, and in accordance with the conditions of, any other applicable provision of the SFA.
Where the shares are subscribed or purchased under Section 275 by a relevant person which is: (a) a corporation (which is not an accredited investor) the sole business of which is to hold investments and the entire share capital of which is owned by one or more individuals, each of whom is an accredited investor; or (b) a trust (where the trustee is not an accredited investor) whose sole purpose is to hold investments and each beneficiary is an accredited investor, shares, debentures and units of shares and debentures of that corporation or the beneficiaries’ rights and interest in that trust shall not be transferable for 6 months after that corporation or that trust has acquired the shares under Section 275 except: (1) to an institutional investor under Section 274 of the SFA or to a relevant person, or any person pursuant to Section 275(1A), and in accordance with the conditions, specified in Section 275 of the SFA; (2) where no consideration is given for the transfer; or (3) by operation of law.
Japan
The shares offered in this prospectus have not been registered under the Financial Instruments and Exchange Law of Japan. The shares have not been offered or sold and will not be offered or sold, directly or indirectly, in Japan or to or for the account of any resident of Japan, (which term as used herein means any person resident in Japan, including any corporation or other entity organized under the laws of Japan) or to others for re-offering or resale, directly or indirectly, in Japan or to a resident of Japan, except (i) pursuant to an exemption from the registration requirements of the Securities and Exchange Law and (ii) in compliance with any other applicable requirements of the Financial Instruments and Exchange Law and any other applicable laws, regulations and ministerial guidelines of Japan.
Switzerland
This document as well as any other material relating to the shares which are the subject of the offering contemplated by this Prospectus, or the Shares, do not constitute an issue prospectus pursuant to Article 652a of the Swiss Code of Obligations. The Shares will not be listed on the SWX Swiss Exchange and, therefore, the
documents relating to the Shares, including, but not limited to, this document, do not claim to comply with the disclosure standards of the listing rules of SWX Swiss Exchange and corresponding prospectus schemes annexed to the listing rules of the SWX Swiss Exchange.
The Shares are being offered in Switzerland by way of a private placement, i.e. to a small number of selected investors only, without any public offer and only to investors who do not purchase the Shares with the intention to distribute them to the public. The investors will be individually approached by the Company from time to time.
This document as well as any other material relating to the Shares is personal and confidential and do not constitute an offer to any other person. This document may only be used by those investors to whom it has been handed out in connection with the offering described herein and may neither directly nor indirectly be distributed or made available to other persons without express consent of the Company. It may not be used in connection with any other offer and shall in particular not be copied and/or distributed to the public in (or from) Switzerland.
Dubai International Financial Centre
This document relates to an exempt offer in accordance with the Offered Securities Rules of the Dubai Financial Services Authority. This document is intended for distribution only to persons of a type specified in those rules. It must not be delivered to, or relied on by, any other person. The Dubai Financial Services Authority has no responsibility for reviewing or verifying any documents in connection with exempt offers. The Dubai Financial Services Authority has not approved this document nor taken steps to verify the information set out in it, and has no responsibility for it. The shares which are the subject of the offering contemplated by this Prospectus, or the Shares, may be illiquid and/or subject to restrictions on their resale.
Prospective purchasers of the Shares offered should conduct their own due diligence on the Shares. If you do not understand the contents of this document you should consult an authorised financial adviser.
Ropes & Gray LLP, Boston, Massachusetts, will pass for us on the validity of the shares of common stock offered by this prospectus. The underwriters are being represented by Cahill Gordon & ReindelLLP, New York, New York. Ropes & Gray LLP and some partners of Ropes & Gray LLP are members of RGIP, LLC, which is an investor in certain investment funds associated with Silver Lake and TPG and often a co-investor with such funds. RGIP, LLC directly or indirectly owns shares of our common stock representing less than 1% of the outstanding shares of each of our common stock, Series A Preferred Stock, Series B Convertible Preferred Stock and Warrants.
The consolidated financial statementsConsolidated Financial Statements of Avaya Inc.Holdings Corp. as of September 30, 2012 and 2011, and for each of the three years in the period from October 1, 2007 through October 26, 2007ended September 30, 2012 included in this prospectus have been so included in reliance on the report of PricewaterhouseCoopers LLP, an independent registered public accounting firm, given on the authority of said firm as experts in auditing and accounting.
The consolidated financial statements of Avaya Holdings Corp. as of September 30, 2010 and 2009, and for each of the three years in the period ended September 30, 2010 included in this prospectus have been so included in reliance on the report of PricewaterhouseCoopers LLP, an independent registered public accounting firm, given on the authority of said firm as experts in auditing and accounting.
The combined financial statements of NES, as of September 30, 2009 and December 31, 2008, and for the nine months ended September 30, 2009 and the year ended December 31, 2008, have been included herein and in the registration statement in reliance upon the report of KPMG LLP, independent auditors, appearing elsewhere herein, and upon the authority of said firm as experts in accounting and auditing. The audit report covering the September 30, 2009, combined financial statements contains an explanatory paragraph that states that: (i) NES’s owner, Nortel Networks Corporation, and certain of its Canadian subsidiaries filed for creditor protection pursuant to the provisions of the Companies’ Creditors Arrangement Act; certain of Nortel Networks Corporation’s United States subsidiaries filed voluntary petitions seeking to reorganize under Chapter 11 of the United States Bankruptcy Code; certain of Nortel Networks Corporation’s subsidiaries in Europe, the Middle East and Africa made consequential filings under the Insolvency Act 1986 in the United Kingdom; and Nortel Networks Corporation’s Israeli subsidiaries made consequential filings under the Israeli Companies Law 1999; (ii) these conditions raise substantial doubt about Nortel Networks Corporation’s and NES’s ability to continue as a going concern; and (iii) combined financial statements do not include any adjustments that might result from the outcome of that uncertainty. The report of KPMG LLP also refers to changes in NES’s method of accounting for fair value measurements and the date at which it measures the funded status of its defined benefit pension plans and other postretirement plans.
WHERE YOU CAN FIND ADDITIONAL INFORMATION
We have filed with the SEC a registration statement on Form S-1 under the Securities Act that registers the shares of our common stock to be sold in this offering. This prospectus does not contain all of the information set forth in the registration statement and the exhibits and schedules filed as part of the registration statement. For further information with respect to us and our common stock, we refer you to the registration statement and the exhibits and schedules filed as a part of the registration statement. Statements contained in this prospectus concerning the contents of any contract or any other document are not necessarily complete. If a contract or document has been filed as an exhibit to the registration statement, we refer you to the copy of the contract or document that has been filed. Each statement in this prospectus relating to a contract or document filed as an exhibit is qualified in all respects by the filed exhibit.
The reports and other information we file with the SEC can be read and copied at the SEC’s Public Reference Room at 100 F Street, N.E., Washington D.C. 20549. You may obtain information regarding the operation of the public reference room by calling 1-800-SEC-0330. The SEC also maintains a website (http://www.sec.gov) that contains reports, proxy and information statements and other information that we file electronically with the SEC. Our website address is www.avaya.com. Our subsidiary, Avaya Inc., currently is a voluntary filer and makes available free of charge, through our website, its annual report on Form 10-K, quarterly reports on Form 10-Q, current reports on Form 8-K and all amendments to those reports, as soon as reasonably practicable after such material is electronically filed with or furnished to the SEC. Please note that our website address is provided as an inactive textual reference only. The information contained on, or accessible through, our website is not part of this prospectus, and is therefore not incorporated by reference.
Index to Consolidated and Combined Financial Statements
| Page | |||
| F-2 | |||
For the fiscal years ended September 30, 2012, 2011 and 2010 | ||||
| F-3 | ||||
| F-4 | ||||
| F-5 | ||||
| F-6 | ||||
| F-7 | ||||
| F-8 | ||||
| ||||
| F-73 | |||
| F-74 | |||
| F-75 | |||
| ||||
| F-76 | |||
Notes to | F-77 | |||
Report of Independent Registered Public Accounting Firm
To the Board of Directors and Stockholders of Avaya Holdings Corp.:
In our opinion, the accompanying consolidated balance sheets and the related consolidated statements of operations, of comprehensive loss, of changes in stockholders’ equity (deficiency) and comprehensive lossdeficiency and of cash flows present fairly, in all material respects, the financial position of Avaya Holdings Corp. and its subsidiaries (the “Successor”) at September 30, 20102012 and 2009,2011, and the results of their operations and their cash flows for each of the three years in the period ended September 30, 20102012 in conformity with accounting principles generally accepted in the United States of America. These financial statements are the responsibility of the Successor’sCompany’s management. Our responsibility is to express an opinion on these financial statements based on our audits. We conducted our audits of these statements in accordance with the standards of the Public Company Accounting Oversight Board (United States). Those standards require that we plan and perform the audit to obtain reasonable assurance about whether the financial statements are free of material misstatement. An audit includes examining, on a test basis, evidence supporting the amounts and disclosures in the financial statements, assessing the accounting principles used and significant estimates made by management, and evaluating the overall financial statement presentation. We believe that our audits provide a reasonable basis for our opinion.
/s/ PricewaterhouseCoopers LLP
Florham Park, NJ
June 8, 2011
Report of Independent Registered Public Accounting Firm
To the Board of Directors and Stockholders of Avaya Holdings Corp.:
In our opinion, the accompanying consolidated statements of operations, of changes in stockholders’ equity (deficiency) and comprehensive loss and of cash flows present fairly, in all material respects, the financial position of Avaya Inc. and its subsidiaries (the “Predecessor”) for the period from October 1, 2007 through October 26, 2007 in conformity with accounting principles generally accepted in the United States of America. These financial statements are the responsibility of the Predecessor’s management. Our responsibility is to express an opinion on these financial statements based on our audit. We conducted our audit of these statements in accordance with the standards of the Public Company Accounting Oversight Board (United States). Those standards require that we plan and perform the audit to obtain reasonable assurance about whether the financial statements are free of material misstatement. An audit includes examining, on a test basis, evidence supporting the amounts and disclosures in the financial statements, assessing the accounting principles used and significant estimates made by management, and evaluating the overall financial statement presentation. We believe that our audit provides a reasonable basis for our opinion.
As discussed onin Note 122 to the consolidated financial statements, the PredecessorCompany changed the manner in which it accounts for uncertain tax positions effective October 1, 2007.revenue recognition in 2011.
/s/ PricewaterhouseCoopers LLP
Florham Park, NJNew Jersey
December 24, 2008, except for the changes in segment reporting as discussed in Note 17 and the supplemental condensed consolidating financial information of the Predecessor as included in Note 22, as to which the date is December 16, 2009, and the net loss per share as included in Note 16, as to which the date is June 8, 2011May 31, 2013
Consolidated Statements of Operations
(In millions, except per share amounts)
| Predecessor | Successor | |||||||||||||||||||||||||||||||||||||||
| Period from October 1, 2007 through October 26, 2007 | Years ended September 30, | Six months ended March 31, | ||||||||||||||||||||||||||||||||||||||
| 2008 | 2009 | 2010 | 2010 | 2011 | Years ended September 30, | |||||||||||||||||||||||||||||||||||
| (unaudited) | 2012 | 2011 | 2010 | |||||||||||||||||||||||||||||||||||||
REVENUE | ||||||||||||||||||||||||||||||||||||||||
Products | $ | 96 | $ | 2,595 | $ | 1,923 | $ | 2,602 | $ | 1,193 | $ | 1,479 | $ | 2,672 | $ | 2,976 | $ | 2,602 | ||||||||||||||||||||||
Services | 150 | 2,328 | 2,227 | 2,458 | 1,187 | 1,277 | 2,499 | 2,571 | 2,458 | |||||||||||||||||||||||||||||||
|
|
| ||||||||||||||||||||||||||||||||||||||
| 246 | 4,923 | 4,150 | 5,060 | 2,380 | 2,756 | 5,171 | 5,547 | 5,060 | ||||||||||||||||||||||||||||||||
|
|
| ||||||||||||||||||||||||||||||||||||||
COSTS | ||||||||||||||||||||||||||||||||||||||||
Products: | ||||||||||||||||||||||||||||||||||||||||
Costs (exclusive of amortization of intangibles) | 56 | 1,256 | 872 | 1,243 | 548 | 675 | 1,145 | 1,314 | 1,243 | |||||||||||||||||||||||||||||||
Amortization of technology intangible assets | 1 | 231 | 248 | 291 | 142 | 133 | 192 | 257 | 291 | |||||||||||||||||||||||||||||||
Services | 100 | 1,403 | 1,164 | 1,354 | 644 | 687 | 1,248 | 1,344 | 1,354 | |||||||||||||||||||||||||||||||
|
|
| ||||||||||||||||||||||||||||||||||||||
| 157 | 2,890 | 2,284 | 2,888 | 1,334 | 1,495 | 2,585 | 2,915 | 2,888 | ||||||||||||||||||||||||||||||||
|
|
| ||||||||||||||||||||||||||||||||||||||
GROSS MARGIN | 89 | 2,033 | 1,866 | 2,172 | 1,046 | 1,261 | ||||||||||||||||||||||||||||||||||
GROSS PROFIT | 2,586 | 2,632 | 2,172 | |||||||||||||||||||||||||||||||||||||
|
|
| ||||||||||||||||||||||||||||||||||||||
OPERATING EXPENSES | ||||||||||||||||||||||||||||||||||||||||
Selling, general and administrative | 111 | 1,456 | 1,272 | 1,721 | 833 | 931 | 1,630 | 1,845 | 1,721 | |||||||||||||||||||||||||||||||
Research and development | 29 | 376 | 309 | 407 | 197 | 236 | 464 | 461 | 407 | |||||||||||||||||||||||||||||||
Amortization of intangible assets | 4 | 187 | 207 | 218 | 107 | 112 | 226 | 226 | 218 | |||||||||||||||||||||||||||||||
Impairment of long-lived assets | — | 10 | 2 | 16 | 16 | — | ||||||||||||||||||||||||||||||||||
Impairment of indefinite-lived intangible assets | — | 130 | 60 | — | — | — | ||||||||||||||||||||||||||||||||||
Goodwill impairment | — | 899 | 235 | — | — | — | ||||||||||||||||||||||||||||||||||
Restructuring charges, net | 1 | — | 160 | 171 | 83 | 64 | ||||||||||||||||||||||||||||||||||
In-process research and development charge | — | 112 | 12 | — | — | — | ||||||||||||||||||||||||||||||||||
Restructuring and impairment charges, net | 147 | 189 | 187 | |||||||||||||||||||||||||||||||||||||
Acquisition-related costs | — | — | 29 | 20 | 19 | 4 | 4 | 5 | 20 | |||||||||||||||||||||||||||||||
Merger-related costs | 57 | 1 | — | — | — | — | ||||||||||||||||||||||||||||||||||
|
|
| ||||||||||||||||||||||||||||||||||||||
| 202 | 3,171 | 2,286 | 2,553 | 1,255 | 1,347 | 2,471 | 2,726 | 2,553 | ||||||||||||||||||||||||||||||||
|
|
| ||||||||||||||||||||||||||||||||||||||
OPERATING LOSS | (113 | ) | (1,138 | ) | (420 | ) | (381 | ) | (209 | ) | (86 | ) | ||||||||||||||||||||||||||||
OPERATING INCOME (LOSS) | 115 | (94 | ) | (381 | ) | |||||||||||||||||||||||||||||||||||
Interest expense | — | (377 | ) | (409 | ) | (487 | ) | (229 | ) | (240 | ) | (432 | ) | (460 | ) | (487 | ) | |||||||||||||||||||||||
Loss on extinguishment of debt | — | — | — | — | — | (246 | ) | — | (246 | ) | — | |||||||||||||||||||||||||||||
Other income, net | 1 | 27 | 14 | 15 | 5 | 1 | ||||||||||||||||||||||||||||||||||
Other (expense) income, net | (29 | ) | 5 | 15 | ||||||||||||||||||||||||||||||||||||
|
|
| ||||||||||||||||||||||||||||||||||||||
LOSS BEFORE INCOME TAXES | (112 | ) | (1,488 | ) | (815 | ) | (853 | ) | (433 | ) | (571 | ) | (346 | ) | (795 | ) | (853 | ) | ||||||||||||||||||||||
(Benefit from) provision for income taxes | (24 | ) | (183 | ) | 30 | 18 | (16 | ) | 41 | |||||||||||||||||||||||||||||||
Provision for income taxes | (8 | ) | (68 | ) | (18 | ) | ||||||||||||||||||||||||||||||||||
|
|
| ||||||||||||||||||||||||||||||||||||||
NET LOSS | (88 | ) | (1,305 | ) | (845 | ) | (871 | ) | (417 | ) | (612 | ) | (354 | ) | (863 | ) | (871 | ) | ||||||||||||||||||||||
Less net income attributable to non-controlling interests | — | 2 | 2 | 3 | 2 | — | — | — | 3 | |||||||||||||||||||||||||||||||
|
|
| ||||||||||||||||||||||||||||||||||||||
NET LOSS ATTRIBUTABLE TO AVAYA HOLDINGS CORP. | (88 | ) | (1,307 | ) | (847 | ) | (874 | ) | (419 | ) | (612 | ) | (354 | ) | (863 | ) | (874 | ) | ||||||||||||||||||||||
Less: Accretion and accrued dividends on Series A preferred stock | — | — | — | (62 | ) | (2 | ) | (3 | ) | |||||||||||||||||||||||||||||||
Less: Accretion and accrued dividends on Series A and Series B preferred stock | (71 | ) | (7 | ) | (62 | ) | ||||||||||||||||||||||||||||||||||
|
|
| ||||||||||||||||||||||||||||||||||||||
NET LOSS ATTRIBUTABLE TO AVAYA HOLDINGS CORP. COMMON STOCKHOLDERS | $ | (88 | ) | $ | (1,307 | ) | $ | (847 | ) | $ | (936 | ) | $ | (421 | ) | $ | (615 | ) | $ | (425 | ) | $ | (870 | ) | $ | (936 | ) | |||||||||||||
|
|
| ||||||||||||||||||||||||||||||||||||||
Net loss per share attributable to common stockholders | $ | (0.19 | ) | $ | (2.87 | ) | $ | (1.74 | ) | $ | (1.92 | ) | $ | (0.86 | ) | $ | (1.26 | ) | $ | (0.87 | ) | $ | (1.78 | ) | $ | (1.92 | ) | |||||||||||||
|
|
| ||||||||||||||||||||||||||||||||||||||
Weighted average basic and diluted shares outstanding | 462.9 | 455.9 | 488.1 | 488.6 | 488.5 | 488.9 | 489.6 | 489.0 | 488.6 | |||||||||||||||||||||||||||||||
|
|
| ||||||||||||||||||||||||||||||||||||||
The accompanying Notes to Consolidated Financial Statements are an integral part of these statements.
Avaya Inc.
Consolidated Statements of Comprehensive Loss
(In millions)
| Years ended September 30, | ||||||||||||
| 2012 | 2011 | 2010 | ||||||||||
Net loss | $ | (354 | ) | $ | (863 | ) | $ | (871 | ) | |||
Other comprehensive income (loss): | ||||||||||||
Pension, postretirement and postemployment benefit-related items, net of tax of $54, $0 and $0 for the years ended September 30, 2012, 2011 and 2010, respectively | 2 | (97 | ) | (187 | ) | |||||||
Cumulative translation adjustment | 37 | (22 | ) | 67 | ||||||||
Change in interest rate swaps, net of tax of $7, $0 and $0 for the years ended September 30, 2012, 2011 and 2010, respectively | 11 | 23 | 45 | |||||||||
Unrealized loss on investments reclassified into earnings, net of tax of $1 for the year ended September 30, 2012 | 1 | — | — | |||||||||
Unrealized loss on investments, net of tax of $0 for the year ended September 30, 2012 | 1 | — | — | |||||||||
Other | — | (1 | ) | 2 | ||||||||
|
|
|
|
|
| |||||||
Other comprehensive income (loss) | 52 | (97 | ) | (73 | ) | |||||||
|
|
|
|
|
| |||||||
Comprehensive loss | $ | (302 | ) | $ | (960 | ) | $ | (944 | ) | |||
|
|
|
|
|
| |||||||
Avaya Holdings Corp.
(In millions, except share amounts)
| September 30, | March 31, 2011 | |||||||||||||||||||
| 2009 | 2010 | September 30, | ||||||||||||||||||
| (unaudited) | 2012 | 2011 | ||||||||||||||||||
ASSETS | ||||||||||||||||||||
Current assets: | ||||||||||||||||||||
Cash and cash equivalents | $ | 582 | $ | 594 | $ | 468 | $ | 338 | $ | 415 | ||||||||||
Accounts receivable, net | 655 | 792 | 734 | 782 | 755 | |||||||||||||||
Inventory | 126 | 234 | 311 | 255 | 280 | |||||||||||||||
Deferred income taxes, net | 7 | 3 | 4 | 18 | 8 | |||||||||||||||
Other current assets | 173 | 276 | 307 | 249 | 272 | |||||||||||||||
|
| |||||||||||||||||||
TOTAL CURRENT ASSETS | 1,543 | 1,899 | 1,824 | 1,642 | 1,730 | |||||||||||||||
|
| |||||||||||||||||||
Property, plant and equipment, net | 419 | 450 | 423 | 364 | 397 | |||||||||||||||
Deferred income taxes, net | 13 | 22 | 20 | 43 | 28 | |||||||||||||||
Intangible assets, net | 2,636 | 2,603 | 2,367 | 1,775 | 2,129 | |||||||||||||||
Goodwill | 3,695 | 4,075 | 4,080 | 4,188 | 4,079 | |||||||||||||||
Other assets | 359 | 227 | 206 | 172 | 198 | |||||||||||||||
|
| |||||||||||||||||||
TOTAL ASSETS | $ | 8,665 | $ | 9,276 | $ | 8,920 | $ | 8,184 | $ | 8,561 | ||||||||||
|
| |||||||||||||||||||
LIABILITIES | ||||||||||||||||||||
Current liabilities: | ||||||||||||||||||||
Debt maturing within one year | $ | 38 | $ | 48 | $ | 37 | $ | 37 | $ | 37 | ||||||||||
Accounts payable | 321 | 464 | 519 | 438 | 465 | |||||||||||||||
Payroll and benefit obligations | 265 | 311 | 313 | 262 | 323 | |||||||||||||||
Deferred revenue | 466 | 650 | 653 | 616 | 639 | |||||||||||||||
Business restructuring reserves, current portion | 148 | 113 | 91 | |||||||||||||||||
Business restructuring reserve, current portion | 84 | 130 | ||||||||||||||||||
Other current liabilities | 334 | 430 | 390 | 328 | 352 | |||||||||||||||
|
| |||||||||||||||||||
TOTAL CURRENT LIABILITIES | 1,572 | 2,016 | 2,003 | 1,765 | 1,946 | |||||||||||||||
|
| |||||||||||||||||||
Long-term debt | 5,112 | 5,880 | 6,139 | 6,084 | 6,120 | |||||||||||||||
Pension obligations | 1,381 | 1,540 | 1,542 | 1,763 | 1,636 | |||||||||||||||
Other postretirement obligations | 518 | 478 | 459 | 360 | 502 | |||||||||||||||
Deferred income taxes, net | 134 | 154 | 163 | 204 | 168 | |||||||||||||||
Business restructuring reserves, non-current portion | 66 | 52 | 49 | |||||||||||||||||
Business restructuring reserve, non-current portion | 51 | 56 | ||||||||||||||||||
Other liabilities | 518 | 569 | 568 | 429 | 496 | |||||||||||||||
|
| |||||||||||||||||||
TOTAL NON-CURRENT LIABILITIES | 7,729 | 8,673 | 8,920 | 8,891 | 8,978 | |||||||||||||||
|
| |||||||||||||||||||
Commitments and contingencies | ||||||||||||||||||||
Preferred stock, par value $.001 per share, authorized nil, 250,000 and 250,000 at September 30, 2009, September 30, 2010 and March 31, 2011, respectively | ||||||||||||||||||||
Series A, nil, 125,000 and 125,000 shares issued and outstanding at September 30, 2009, September 30, 2010 and March 31, 2011, respectively | — | 130 | 133 | |||||||||||||||||
DEFICIENCY | ||||||||||||||||||||
Common stock, par value $.001 per share; 600,000,000, 750,000,000 and 750,000,000 shares authorized; 487,346,991, 487,389,017 and 487,389,017 shares issued and outstanding at September 30, 2009, September 30, 2010 and March 31, 2011, respectively | — | — | — | |||||||||||||||||
Preferred stock, par value $.001 per share, authorized 250,000 and 250,000 at September 30, 2012 and September 30, 2011, respectively | ||||||||||||||||||||
Convertible Series B, 48,921 shares and nil issued and outstanding at September 30, 2012 and September 30, 2011, respectively | 227 | — | ||||||||||||||||||
Series A, 125,000 and 125,000 shares issued and outstanding at September 30, 2012 and September 30, 2011, respectively | 144 | 137 | ||||||||||||||||||
STOCKHOLDERS’ DEFICIENCY | ||||||||||||||||||||
Common stock, par value $.001 per share; 750,000,000 and 750,000,000 shares authorized; 487,630,509 and 487,401,790 shares issued and outstanding at September 30, 2012 and September 30, 2011, respectively | — | — | ||||||||||||||||||
Additional paid-in capital | 2,480 | 2,566 | 2,569 | 2,528 | 2,569 | |||||||||||||||
Accumulated deficit | (2,154 | ) | (3,028 | ) | (3,640 | ) | (4,245 | ) | (3,891 | ) | ||||||||||
Accumulated other comprehensive loss | (1,008 | ) | (1,081 | ) | (1,065 | ) | (1,126 | ) | (1,178 | ) | ||||||||||
|
| |||||||||||||||||||
TOTAL AVAYA HOLDINGS CORP. STOCKHOLDERS’ DEFICIENCY | (682 | ) | (1,543 | ) | (2,136 | ) | ||||||||||||||
Noncontrolling interest | 46 | — | — | |||||||||||||||||
TOTAL STOCKHOLDERS’ DEFICIENCY | (2,843 | ) | (2,500 | ) | ||||||||||||||||
|
| |||||||||||||||||||
TOTAL DEFICIENCY | (636 | ) | (1,543 | ) | (2,136 | ) | ||||||||||||||
TOTAL LIABILITIES AND STOCKHOLDERS’ DEFICIENCY | $ | 8,184 | $ | 8,561 | ||||||||||||||||
|
| |||||||||||||||||||
TOTAL LIABILITIES AND DEFICIENCY | $ | 8,665 | $ | 9,276 | $ | 8,920 | ||||||||||||||
The accompanying Notes to Consolidated Financial Statements are an integral part of these statements.
CONSOLIDATED STATEMENTS OF CHANGES IN
STOCKHOLDERS’ EQUITY (DEFICIENCY) AND COMPREHENSIVE LOSSDEFICIENCY
(In millions)
| Number of Shares | Common Stock | Additional Paid-In Capital | (Accumulated Deficit) / Retained Earnings | Accumulated Other Comprehensive Loss | Treasury Stock | Total Avaya Stockholders’ Equity / (Deficiency) | Noncontrolling Interest | Total Stockholders’ Equity / (Deficiency) | Comprehensive Loss | |||||||||||||||||||||||||||||||
Predecessor | ||||||||||||||||||||||||||||||||||||||||
Balance as of September 30, 2007 | 461.6 | $ | 5 | $ | 2,842 | $ | 337 | $ | (546 | ) | $ | (52 | ) | $ | 2,586 | $ | 18 | $ | 2,604 | |||||||||||||||||||||
Issuance of common stock under employee stock option plan | 2.4 | 93 | 93 | 93 | ||||||||||||||||||||||||||||||||||||
Amortization of vested restricted stock units | 6 | 6 | 6 | |||||||||||||||||||||||||||||||||||||
Other stock transactions | (2 | ) | (2 | ) | (2 | ) | ||||||||||||||||||||||||||||||||||
Net loss | (88 | ) | (88 | ) | (88 | ) | $ | (88 | ) | |||||||||||||||||||||||||||||||
Cumulative impact for adoption of new accounting guidance relating to uncertainty in income taxes | (52 | ) | (52 | ) | (52 | ) | ||||||||||||||||||||||||||||||||||
Foreign currency translation | 23 | 23 | 23 | 23 | ||||||||||||||||||||||||||||||||||||
Other | 1 | 1 | 1 | 1 | ||||||||||||||||||||||||||||||||||||
Change in unamortized pension, postretirement and postemployment actuarial gains, net of tax effect | 4 | 4 | 4 | 4 | ||||||||||||||||||||||||||||||||||||
Purchase of treasury stock | (99 | ) | (99 | ) | (99 | ) | ||||||||||||||||||||||||||||||||||
Total comprehensive loss | $ | (60 | ) | |||||||||||||||||||||||||||||||||||||
Balance as of October 26, 2007 | 464.0 | $ | 5 | $ | 2,939 | $ | 197 | $ | (518 | ) | $ | (151 | ) | $ | 2,472 | $ | 18 | $ | 2,490 | |||||||||||||||||||||
Successor | ||||||||||||||||||||||||||||||||||||||||
Balance as of Oct 1, 2007 | — | $ | — | $ | — | $ | — | $ | — | $ | — | $ | — | $ | — | $ | — | |||||||||||||||||||||||
Issuance of common stock in connection with the acquisition of Avaya Inc. | 487.0 | 2,452 | 2,452 | 2,452 | ||||||||||||||||||||||||||||||||||||
Issuance of common stock | 0.2 | 1 | 1 | 1 | ||||||||||||||||||||||||||||||||||||
Purchase and cancellation of common stock | (0.6 | ) | (3 | ) | (3 | ) | (3 | ) | ||||||||||||||||||||||||||||||||
Fair value adjustment of noncontrolling interest in the accounting of the Merger | 42 | 42 | ||||||||||||||||||||||||||||||||||||||
Amortization of share-based compensation | 21 | 21 | 21 | |||||||||||||||||||||||||||||||||||||
Net loss | (1,307 | ) | (1,307 | ) | 2 | (1,305 | ) | $ | (1,305 | ) | ||||||||||||||||||||||||||||||
Change in unamortized pension, postretirement and postemployment actuarial losses, net of tax effect of $59 | (36 | ) | (36 | ) | (36 | ) | (36 | ) | ||||||||||||||||||||||||||||||||
Foreign currency translation | (36 | ) | (36 | ) | (36 | ) | (36 | ) | ||||||||||||||||||||||||||||||||
Unrealized loss on interest rate swap instruments, net of tax effect of $17 | (26 | ) | (26 | ) | (26 | ) | (26 | ) | ||||||||||||||||||||||||||||||||
Other | (3 | ) | (3 | ) | (3 | ) | (3 | ) | ||||||||||||||||||||||||||||||||
Total comprehensive loss | $ | (1,406 | ) | |||||||||||||||||||||||||||||||||||||
Balance as of September 30, 2008 | 486.6 | $ | — | $ | 2,471 | $ | (1,307 | ) | $ | (101 | ) | $ | — | $ | 1,063 | $ | 44 | $ | 1,107 | |||||||||||||||||||||
Issuance of common stock | 0.3 | 1 | 1 | 1 | ||||||||||||||||||||||||||||||||||||
Issuance of common stock, net of shares redeemed and cancelled, under employee stock option plan | 0.4 | (1 | ) | (1 | ) | (1 | ) | |||||||||||||||||||||||||||||||||
Amortization of share-based compensation | 9 | 9 | 9 | |||||||||||||||||||||||||||||||||||||
Net loss | (847 | ) | (847 | ) | 2 | (845 | ) | $ | (845 | ) | ||||||||||||||||||||||||||||||
Change in unamortized pension, postretirement and postemployment actuarial losses, net of tax effect of $0 | (791 | ) | (791 | ) | (791 | ) | (791 | ) | ||||||||||||||||||||||||||||||||
Foreign currency translation | (59 | ) | (59 | ) | (59 | ) | (59 | ) | ||||||||||||||||||||||||||||||||
Unrealized loss on interest rate swap instruments, net of tax effect of $0 | (56 | ) | (56 | ) | (56 | ) | (56 | ) | ||||||||||||||||||||||||||||||||
Other | (1 | ) | (1 | ) | (1 | ) | (1 | ) | ||||||||||||||||||||||||||||||||
Total comprehensive loss | $ | (1,752 | ) | |||||||||||||||||||||||||||||||||||||
Balance as of September 30, 2009 | 487.3 | $ | — | $ | 2,480 | $ | (2,154 | ) | $ | (1,008 | ) | $ | — | $ | (682 | ) | $ | 46 | $ | (636 | ) | |||||||||||||||||||
CONSOLIDATED STATEMENTS OF CHANGES IN STOCKHOLDERS’ EQUITY (DEFICIENCY) AND COMPREHENSIVE LOSS (Continued)
(In millions)
| Number of Shares | Common Stock | Additional Paid-In Capital | (Accumulated Deficit) / Retained Earnings | Accumulated Other Comprehensive Loss | Treasury Stock | Total Avaya Stockholders’ Equity / (Deficiency) | Noncontrolling Interest | Total Stockholders’ Equity / (Deficiency) | Comprehensive Loss | Number of Shares | Common Stock | Additional Paid-In Capital | Accumulated Deficit | Accumulated Other Comprehensive Loss | Avaya Stockholders’ Deficiency | Noncontrolling Interest | Total Stockholders’ Deficiency | |||||||||||||||||||||||||||||||||||||||||||||||||||||||
Balance as of October 1, 2009 | 487.3 | $ | — | $ | 2,480 | $ | (2,154 | ) | $ | (1,008 | ) | $ | (682 | ) | $ | 46 | $ | (636 | ) | |||||||||||||||||||||||||||||||||||||||||||||||||||||
Issuance of common stock, net of shares redeemed and cancelled, under employee stock option plan | 0.1 | 0.1 | ||||||||||||||||||||||||||||||||||||||||||||||||||||||||||||||||||||||
Issuance of warrants on preferred stock | 57 | 57 | 57 | |||||||||||||||||||||||||||||||||||||||||||||||||||||||||||||||||||||
Accretion on Series A preferred stock | (57 | ) | (57 | ) | (57 | ) | ||||||||||||||||||||||||||||||||||||||||||||||||||||||||||||||||||
Issuance of warrants on Series A preferred stock | 57 | 57 | 57 | |||||||||||||||||||||||||||||||||||||||||||||||||||||||||||||||||||||
Accretion of Series A preferred stock | (57 | ) | (57 | ) | (57 | ) | ||||||||||||||||||||||||||||||||||||||||||||||||||||||||||||||||||
Issuance of warrants in connection with B-2 loans | 74 | 74 | 74 | 74 | 74 | 74 | ||||||||||||||||||||||||||||||||||||||||||||||||||||||||||||||||||
Amortization of share-based compensation | 17 | 17 | 17 | 17 | 17 | 17 | ||||||||||||||||||||||||||||||||||||||||||||||||||||||||||||||||||
Accrued dividends on Series A preferred stock | (5 | ) | (5 | ) | (5 | ) | (5 | ) | (5 | ) | (5 | ) | ||||||||||||||||||||||||||||||||||||||||||||||||||||||||||||
Net loss | (874 | ) | (874 | ) | 3 | (871 | ) | $ | (871 | ) | (874 | ) | (874 | ) | 3 | (871 | ) | |||||||||||||||||||||||||||||||||||||||||||||||||||||||
Change in unamortized pension, postretirement and postemployment actuarial losses, net of tax effect of $0 | (187 | ) | (187 | ) | (187 | ) | (187 | ) | (187 | ) | (187 | ) | (187 | ) | ||||||||||||||||||||||||||||||||||||||||||||||||||||||||||
Foreign currency translation | 67 | 67 | 67 | 67 | 67 | 67 | 67 | |||||||||||||||||||||||||||||||||||||||||||||||||||||||||||||||||
Unrealized gain on interest rate swap instruments, net of tax effect of $0 | 45 | 45 | 45 | 45 | ||||||||||||||||||||||||||||||||||||||||||||||||||||||||||||||||||||
Change in interest rate swap instruments, net of tax effect of $0 | 45 | 45 | 45 | |||||||||||||||||||||||||||||||||||||||||||||||||||||||||||||||||||||
Sale of AGC | (49 | ) | (49 | ) | — | (49 | ) | (49 | ) | |||||||||||||||||||||||||||||||||||||||||||||||||||||||||||||||
Other | 2 | 2 | 2 | 2 | 2 | 2 | 2 | |||||||||||||||||||||||||||||||||||||||||||||||||||||||||||||||||
Total comprehensive loss | $ | (944 | ) | |||||||||||||||||||||||||||||||||||||||||||||||||||||||||||||||||||||
|
|
|
|
|
|
|
| |||||||||||||||||||||||||||||||||||||||||||||||||||||||||||||||||
Balance as of September 30, 2010 | 487.4 | $ | — | $ | 2,566 | $ | (3,028 | ) | $ | (1,081 | ) | $ | — | $ | (1,543 | ) | $ | — | $ | (1,543 | ) | 487.4 | — | 2,566 | (3,028 | ) | (1,081 | ) | (1,543 | ) | — | (1,543 | ) | |||||||||||||||||||||||||||||||||||||||
|
|
|
|
|
|
|
| |||||||||||||||||||||||||||||||||||||||||||||||||||||||||||||||||
Amortization of share-based compensation | 6 | 6 | 6 | 10 | 10 | 10 | ||||||||||||||||||||||||||||||||||||||||||||||||||||||||||||||||||
Accrued dividends on Series A preferred stock | (3 | ) | (3 | ) | (3 | ) | (7 | ) | (7 | ) | (7 | ) | ||||||||||||||||||||||||||||||||||||||||||||||||||||||||||||
Net loss | (612 | ) | (612 | ) | — | (612 | ) | $ | (612 | ) | (863 | ) | (863 | ) | — | (863 | ) | |||||||||||||||||||||||||||||||||||||||||||||||||||||||
Change in unamortized pension, postretirement and postemployment actuarial gains, net of tax effect of $13 | 18 | 18 | 18 | 18 | ||||||||||||||||||||||||||||||||||||||||||||||||||||||||||||||||||||
Change in unamortized pension, postretirement and postemployment actuarial gains, net of tax effect of $0 | (97 | ) | (97 | ) | (97 | ) | ||||||||||||||||||||||||||||||||||||||||||||||||||||||||||||||||||
Foreign currency translation | (21 | ) | (21 | ) | (21 | ) | (21 | ) | (22 | ) | (22 | ) | (22 | ) | ||||||||||||||||||||||||||||||||||||||||||||||||||||||||||
Unrealized gain on interest rate swap instruments, net of tax effect of $12 | 18 | 18 | 18 | 18 | ||||||||||||||||||||||||||||||||||||||||||||||||||||||||||||||||||||
Change in interest rate swap instruments, net of tax effect of $0 | 23 | 23 | 23 | |||||||||||||||||||||||||||||||||||||||||||||||||||||||||||||||||||||
Other | 1 | 1 | 1 | 1 | (1 | ) | (1 | ) | (1 | ) | ||||||||||||||||||||||||||||||||||||||||||||||||||||||||||||||
Total comprehensive loss | $ | (596 | ) | |||||||||||||||||||||||||||||||||||||||||||||||||||||||||||||||||||||
|
|
|
|
|
|
|
| |||||||||||||||||||||||||||||||||||||||||||||||||||||||||||||||||
Balance as of March 31, 2011 (unaudited) | 487.4 | $ | — | $ | 2,569 | $ | (3,640 | ) | $ | (1,065 | ) | $ | — | $ | (2,136 | ) | $ | — | $ | (2,136 | ) | |||||||||||||||||||||||||||||||||||||||||||||||||||
Balance as of September 30, 2011 | 487.4 | — | 2,569 | (3,891 | ) | (1,178 | ) | (2,500 | ) | — | (2,500 | ) | ||||||||||||||||||||||||||||||||||||||||||||||||||||||||||||
|
|
|
|
|
|
|
| |||||||||||||||||||||||||||||||||||||||||||||||||||||||||||||||||
Issuance of common stock, net of shares redeemed and cancelled, under employee stock option plan | 0.2 | |||||||||||||||||||||||||||||||||||||||||||||||||||||||||||||||||||||||
Amortization of share-based compensation | 7 | 7 | 7 | |||||||||||||||||||||||||||||||||||||||||||||||||||||||||||||||||||||
Accrued dividends on Series A preferred stock | (7 | ) | (7 | ) | (7 | ) | ||||||||||||||||||||||||||||||||||||||||||||||||||||||||||||||||||
Issuance of warrants on Series B preferred stock | 23 | 23 | 23 | |||||||||||||||||||||||||||||||||||||||||||||||||||||||||||||||||||||
Accrued dividends on Series B preferred stock | (5 | ) | (5 | ) | (5 | ) | ||||||||||||||||||||||||||||||||||||||||||||||||||||||||||||||||||
Accretion on Series B preferred stock | (59 | ) | (59 | ) | (59 | ) | ||||||||||||||||||||||||||||||||||||||||||||||||||||||||||||||||||
Net loss | (354 | ) | (354 | ) | — | (354 | ) | |||||||||||||||||||||||||||||||||||||||||||||||||||||||||||||||||
Change in unamortized pension, postretirement and postemployment actuarial gains, net of tax effect of $54 | 2 | 2 | 2 | |||||||||||||||||||||||||||||||||||||||||||||||||||||||||||||||||||||
Foreign currency translation | 37 | 37 | 37 | |||||||||||||||||||||||||||||||||||||||||||||||||||||||||||||||||||||
Change in interest rate swap instruments, net of tax effect of $7 | 11 | 11 | 11 | |||||||||||||||||||||||||||||||||||||||||||||||||||||||||||||||||||||
Unrealized loss on investments reclassified into earnings, net of tax effect of $1 | 1 | 1 | 1 | |||||||||||||||||||||||||||||||||||||||||||||||||||||||||||||||||||||
Unrealized loss on investments, net of tax effect of $0 | 1 | 1 | 1 | |||||||||||||||||||||||||||||||||||||||||||||||||||||||||||||||||||||
|
|
|
|
|
|
|
| |||||||||||||||||||||||||||||||||||||||||||||||||||||||||||||||||
Balance as of September 30, 2012 | 487.6 | $ | — | $ | 2,528 | $ | (4,245 | ) | $ | (1,126 | ) | $ | (2,843 | ) | $ | — | $ | (2,843 | ) | |||||||||||||||||||||||||||||||||||||||||||||||||||||
|
|
|
|
|
|
|
| |||||||||||||||||||||||||||||||||||||||||||||||||||||||||||||||||
The accompanying Notes to Consolidated Financial Statements are an integral part of these statements.
Consolidated Statements of Cash Flows
(In millions)
| Predecessor | Successor | |||||||||||||||||||||||||||||||||||||||
| Period from October 1, 2007 through October 26, 2007 | Years ended September 30 | Six months ended March 31 | ||||||||||||||||||||||||||||||||||||||
| 2008 | 2009 | 2010 | 2010 | 2011 | Years ended September 30, | |||||||||||||||||||||||||||||||||||
| (unaudited) | 2012 | 2011 | 2010 | |||||||||||||||||||||||||||||||||||||
OPERATING ACTIVITIES: | ||||||||||||||||||||||||||||||||||||||||
Net loss | $ | (88 | ) | $ | (1,305 | ) | $ | (845 | ) | $ | (871 | ) | $ | (417 | ) | $ | (612 | ) | $ | (354 | ) | $ | (863 | ) | $ | (871 | ) | |||||||||||||
Adjustments to reconcile net loss to net cash provided by (used for) operating activities: | ||||||||||||||||||||||||||||||||||||||||
Adjustments to reconcile net loss to net cash provided (used for) by operating activities: | ||||||||||||||||||||||||||||||||||||||||
Depreciation and amortization | 23 | 616 | 652 | 691 | 342 | 335 | 564 | 653 | 691 | |||||||||||||||||||||||||||||||
Share-based compensation | 6 | 21 | 10 | 19 | 11 | 6 | 8 | 12 | 19 | |||||||||||||||||||||||||||||||
Amortization of debt issuance costs | — | 17 | 22 | 23 | 11 | 11 | 21 | 23 | 23 | |||||||||||||||||||||||||||||||
Accretion of debt discount | — | — | — | 33 | 11 | 17 | 1 | 18 | 33 | |||||||||||||||||||||||||||||||
Payment of amortized discount of incremental B-2 term loans | — | — | — | — | — | (50 | ) | — | (50 | ) | — | |||||||||||||||||||||||||||||
Non-cash charge for debt issuance costs upon redemption of incremental B-2 term loans | — | — | — | — | — | 5 | — | 5 | — | |||||||||||||||||||||||||||||||
Third-party fees expensed in connection with the debt modification | — | — | — | — | — | 9 | — | 9 | — | |||||||||||||||||||||||||||||||
Change in fair value of Preferred Series B embedded derivative | 6 | — | — | |||||||||||||||||||||||||||||||||||||
Payment in kind interest | — | — | 35 | 49 | 42 | — | — | — | 49 | |||||||||||||||||||||||||||||||
Provision for uncollectible receivables | 3 | (3 | ) | (6 | ) | 5 | 2 | 2 | 5 | — | 5 | |||||||||||||||||||||||||||||
Deferred income taxes, net | (19 | ) | (295 | ) | (16 | ) | (13 | ) | 4 | 8 | (37 | ) | (3 | ) | 7 | |||||||||||||||||||||||||
Impairment of goodwill | — | 899 | 235 | — | — | — | ||||||||||||||||||||||||||||||||||
Impairment of long-lived and intangible assets | — | 140 | 62 | 16 | 16 | — | ||||||||||||||||||||||||||||||||||
(Gain) loss on sale of long-lived assets | — | — | 2 | 3 | — | (1 | ) | |||||||||||||||||||||||||||||||||
Loss on sale of investments and long-lived assets, net | 3 | 1 | 3 | |||||||||||||||||||||||||||||||||||||
Gain on sale of AGC | — | — | — | (7 | ) | — | — | — | — | (7 | ) | |||||||||||||||||||||||||||||
Realization of fair value adjustments applied to inventory in the accounting of the Merger | — | 182 | — | — | — | — | ||||||||||||||||||||||||||||||||||
In-process research and development charge | — | 112 | 12 | — | — | — | ||||||||||||||||||||||||||||||||||
Unrealized losses (gains) on foreign currency exchange | 9 | (22 | ) | (30 | ) | 41 | 23 | (29 | ) | |||||||||||||||||||||||||||||||
Write-down of assets held for sale to net realizable value | 5 | — | — | |||||||||||||||||||||||||||||||||||||
Impairment of long-lived assets | 6 | — | 16 | |||||||||||||||||||||||||||||||||||||
Pension curtailments | 5 | 7 | — | |||||||||||||||||||||||||||||||||||||
Unrealized loss (gain) on foreign currency exchange | 29 | (38 | ) | 41 | ||||||||||||||||||||||||||||||||||||
Changes in operating assets and liabilities: | ||||||||||||||||||||||||||||||||||||||||
Accounts receivable | 144 | (31 | ) | 211 | (119 | ) | (83 | ) | 62 | (5 | ) | 34 | (119 | ) | ||||||||||||||||||||||||||
Inventory | (39 | ) | 86 | 101 | 1 | (5 | ) | (73 | ) | 27 | (45 | ) | 1 | |||||||||||||||||||||||||||
Accounts payable | 34 | 7 | (45 | ) | 144 | 110 | 52 | (25 | ) | 2 | 144 | |||||||||||||||||||||||||||||
Payroll and benefit obligations | 18 | (139 | ) | (191 | ) | (6 | ) | (7 | ) | 3 | (109 | ) | (32 | ) | (6 | ) | ||||||||||||||||||||||||
Business restructuring reserve | (7 | ) | (117 | ) | 15 | (39 | ) | (7 | ) | (28 | ) | (43 | ) | 27 | (39 | ) | ||||||||||||||||||||||||
Deferred revenue | 71 | 87 | 29 | 126 | 71 | (9 | ) | (45 | ) | (29 | ) | 126 | ||||||||||||||||||||||||||||
Other assets and liabilities | (22 | ) | 49 | (11 | ) | (54 | ) | (126 | ) | (57 | ) | (18 | ) | (31 | ) | (74 | ) | |||||||||||||||||||||||
|
|
| ||||||||||||||||||||||||||||||||||||||
NET CASH PROVIDED BY (USED FOR) OPERATING ACTIVITIES | 133 | 304 | 242 | 42 | (2 | ) | (349 | ) | 44 | (300 | ) | 42 | ||||||||||||||||||||||||||||
|
|
| ||||||||||||||||||||||||||||||||||||||
INVESTING ACTIVITIES: | ||||||||||||||||||||||||||||||||||||||||
Acquisition of Avaya Inc., net of cash acquired | — | (6,925 | ) | — | — | — | — | |||||||||||||||||||||||||||||||||
Capital expenditures | (8 | ) | (120 | ) | (76 | ) | (79 | ) | (30 | ) | (35 | ) | (92 | ) | (83 | ) | (79 | ) | ||||||||||||||||||||||
Capitalized software development costs | (7 | ) | (74 | ) | (43 | ) | (43 | ) | (23 | ) | (14 | ) | (35 | ) | (42 | ) | (43 | ) | ||||||||||||||||||||||
Escrow payment for proposed acquisition | — | — | (100 | ) | — | — | — | |||||||||||||||||||||||||||||||||
Acquisition of businesses, net of cash acquired | — | — | (11 | ) | (805 | ) | (805 | ) | (14 | ) | (234 | ) | (16 | ) | (805 | ) | ||||||||||||||||||||||||
Return of funds held in escrow from the NES acquisition | — | — | — | 5 | — | 6 | — | 6 | 5 | |||||||||||||||||||||||||||||||
Liquidation of securities available for sale | — | — | 98 | 18 | 2 | — | ||||||||||||||||||||||||||||||||||
Proceeds from sale of long-lived assets | 3 | 7 | 11 | |||||||||||||||||||||||||||||||||||||
Proceeds from sale of investments | 74 | — | 18 | |||||||||||||||||||||||||||||||||||||
Purchase of securities available for sale | — | (98 | ) | (1 | ) | (5 | ) | (3 | ) | — | — | — | (5 | ) | ||||||||||||||||||||||||||
Proceeds from sale of long-lived assets | — | 18 | 4 | 11 | 8 | 3 | ||||||||||||||||||||||||||||||||||
Net proceeds from sale of AGC, net of cash sold | — | — | — | 32 | — | — | — | — | 32 | |||||||||||||||||||||||||||||||
Restricted cash | — | — | (26 | ) | 2 | 1 | 24 | 1 | 27 | 2 | ||||||||||||||||||||||||||||||
Other investing activities, net | (1 | ) | (6 | ) | — | — | — | — | ||||||||||||||||||||||||||||||||
|
|
| ||||||||||||||||||||||||||||||||||||||
NET CASH USED FOR INVESTING ACTIVITIES | (16 | ) | (7,205 | ) | (155 | ) | (864 | ) | (850 | ) | (30 | ) | (283 | ) | (101 | ) | (864 | ) | ||||||||||||||||||||||
|
|
| ||||||||||||||||||||||||||||||||||||||
FINANCING ACTIVITIES: | ||||||||||||||||||||||||||||||||||||||||
Cash received from borrowings for the acquisition of Avaya Inc. | — | 5,250 | — | — | — | — | ||||||||||||||||||||||||||||||||||
Issuance of common stock | 11 | 2,427 | 1 | — | — | — | ||||||||||||||||||||||||||||||||||
Purchase of common stock | — | (3 | ) | — | — | — | — | |||||||||||||||||||||||||||||||||
Withholding taxes—share-based compensation | — | (1 | ) | — | — | — | ||||||||||||||||||||||||||||||||||
Net proceeds from incremental B-2 term loans and warrants | — | — | — | 783 | 783 | — | — | — | 783 | |||||||||||||||||||||||||||||||
Proceeds from issuance of preferred stock and warrants | — | — | — | 125 | 125 | — | 196 | — | 125 | |||||||||||||||||||||||||||||||
Repayment of incremental B-2 term loans | — | — | — | — | — | (696 | ) | — | (696 | ) | — | |||||||||||||||||||||||||||||
Debt issuance costs and third-party debt modification costs | — | (131 | ) | (29 | ) | (5 | ) | (5 | ) | (42 | ) | — | (42 | ) | (5 | ) | ||||||||||||||||||||||||
Proceeds from senior secured notes | — | — | — | — | — | 1,009 | — | 1,009 | — | |||||||||||||||||||||||||||||||
Repayment of long-term debt | — | (28 | ) | (72 | ) | (48 | ) | (24 | ) | (22 | ) | (37 | ) | (42 | ) | (48 | ) | |||||||||||||||||||||||
Borrowings under revolving credit facility | 60 | — | — | |||||||||||||||||||||||||||||||||||||
Repayments of borrowings under revolving credit facility | (60 | ) | — | — | ||||||||||||||||||||||||||||||||||||
Other financing activities, net | — | (3 | ) | — | (2 | ) | (1 | ) | (1 | ) | (4 | ) | (1 | ) | (2 | ) | ||||||||||||||||||||||||
|
|
| ||||||||||||||||||||||||||||||||||||||
NET CASH PROVIDED BY (USED FOR) FINANCING ACTIVITIES | 11 | 7,512 | (101 | ) | 853 | 878 | 248 | |||||||||||||||||||||||||||||||||
NET CASH PROVIDED BY FINANCING ACTIVITIES | 155 | 228 | 853 | |||||||||||||||||||||||||||||||||||||
|
|
| ||||||||||||||||||||||||||||||||||||||
Effect of exchange rate changes on cash and cash equivalents | 7 | (17 | ) | 2 | (19 | ) | (17 | ) | 5 | 7 | (6 | ) | (19 | ) | ||||||||||||||||||||||||||
|
|
| ||||||||||||||||||||||||||||||||||||||
NET INCREASE (DECREASE) IN CASH AND CASH EQUIVALENTS | 135 | 594 | (12 | ) | 12 | 9 | (126 | ) | ||||||||||||||||||||||||||||||||
Cash and cash equivalents at beginning of period | 1,270 | — | 594 | 582 | 582 | 594 | ||||||||||||||||||||||||||||||||||
NET (DECREASE) INCREASE IN CASH AND CASH EQUIVALENTS | (77 | ) | (179 | ) | 12 | |||||||||||||||||||||||||||||||||||
Cash and cash equivalents at beginning of year | 415 | 594 | 582 | |||||||||||||||||||||||||||||||||||||
|
|
| ||||||||||||||||||||||||||||||||||||||
Cash and cash equivalents at end of period | $ | 1,405 | $ | 594 | $ | 582 | $ | 594 | $ | 591 | $ | 468 | ||||||||||||||||||||||||||||
Cash and cash equivalents at end of year | $ | 338 | $ | 415 | $ | 594 | ||||||||||||||||||||||||||||||||||
|
|
| ||||||||||||||||||||||||||||||||||||||
The accompanying Notes to Consolidated Financial Statements are an integral part of these statements.
Notes to Consolidated Financial Statements
1. DescriptionBackground, Merger, NES Acquisition, Radvision Acquisition, and Basis of Business, Merger and NES AcquisitionPresentation
BusinessBackground
Avaya Holdings Corp. (formerly Sierra Holdings Corp.) together with its consolidated subsidiaries (collectively, the “Company” or “Avaya”) is a leading global provider of real-time business collaboration and communications solutions. The Company’s solutions are designed to enable business users to work together more effectively as a team internally orand with their customers and suppliers increasing innovation, improving productivity and acceleratingto accelerate decision-making and business outcomes.
At the coreAvaya conducts its business operations in three segments. Two of thethose segments, Global Communications Solutions and Avaya Networking, make up Avaya’s Enterprise Collaboration Solutions product portfolio. The third segment contains Avaya’s services portfolio and is called Avaya Global Services.
The Company’s business is a largesolutions and diverse global installed customer base which includesservices are aimed at large enterprises, small- and medium-sizedmid-sized businesses and government organizations. Avaya providesAvaya’s solutions are in fivethree key business collaboration and communications product and related services categories:
Real-Time Collaboration, Video and Unified Communications Software, Infrastructure and EndpointsEndpoints;
Real Time Video CollaborationCustomer Experience Interaction Management, including Contact Center applications; and
Contact CenterNetworking.
Data Communications
Applications,These three categories are supported by Avaya’s portfolio of services including product support, integration, and professional manged services. Theses services enable customers to optimize and manage their Integrationcommunications networks worldwide and Enablementachieve enhanced business results.
Avaya sells solutions directly through its worldwide sales force and through its global network of channel partners. As of September 30, 2010,2012, Avaya had approximately 9,2009,900 channel partners, worldwide, including distributors, service providers, dealers, value-added resellers, system integrators service providers, value-added resellers and business partners that provide sales and service support.
Merger
Avaya Holdings Corp. is a holding company formed by affiliates of two private equity firms, Silver Lake Partners (“Silver Lake”) and TPG (“TPG”) (collectively, the “Sponsors”) on June 1, 2007, solely for the purpose of entering into an Agreement and Plan of Merger (the “Merger Agreement”) with Avaya Inc. Prior to the Merger Agreement, Avaya Inc. was a registered company with the U.S. Securities and Exchange Commission (“SEC”) and had common stock traded on the New York Stock Exchange. On June 4, 2007, the Company and its wholly owned subsidiary, Sierra Merger Corp., a Delaware corporation, (“Merger Sub”), entered into a Merger Agreement with Avaya Inc. pursuant to which Merger Sub would be merged with and into Avaya Inc., with Avaya Inc. continuing as the surviving corporation and a wholly owned subsidiary of Avaya Holdings Corp. (the “Merger”). The Merger Agreement provided for a purchase price of $8.4 billion of Avaya Inc.’s common stock and was completed on October 26, 2007 pursuant to the terms of the Merger Agreement.
In connection with the Merger, Avaya Inc. entered into financing arrangements consisting of (i) a senior secured multi-currency asset-based revolving credit facility that provides financing of up to $335 million, subject to availability under a borrowing base, (ii) a senior secured credit facility including (a) a senior secured term loan in the aggregate principal amount of $3.8 billion and (b) a senior secured multi-currency revolver in an aggregate commitment amount of up to $200 million and (iii) a senior unsecured credit facility consisting of (a) a $700 million senior unsecured cash pay loan and (b) a $750 million senior unsecured PIK toggle loan. On October 24, 2008, the senior unsecured cash-pay loan was converted into senior unsecured cash-pay notes and the senior unsecured PIK toggle loan was converted into senior unsecured PIK toggle notes. The senior unsecured notes had the same interest rates and maturity dates as the senior unsecured loans. See Note 9, “Financing Arrangements” for further details. The Company expensed approximately $163 million of Merger-related costs, including investment banking, legal and other third-party costs, of which approximately $96 million was non-cash stock compensation resulting from the accelerated vesting of stock options and restricted stock units in connection with the Merger.
The Company entered into a Management Services Agreement with Silver Lake Management Company III, L.L.C., an affiliate of Silver Lake, and TPG Capital, L.P., an affiliate of TPG, collectively “the Managers,” pursuant to which the Managers provide financial advisory services to the Company. In connection with the Merger, the Company paid the Managers $75 million in fees and $2 million in reimbursed out of pocket expenses for financial and structural advice and analysis as well as assistance with due diligence investigations and debt financing negotiations. These amounts have been expensed, allocated as debt issuance costs, or included in the overall purchase price of the Company. Pursuant to the Management Services Agreement, the Managers receive a monitoring fee of $7 million per annum and reimbursement for out-of-pocket expenses incurred in connection with the provision of such services. In the event of a financing, acquisition, disposition or change of control transaction involving the Company during the term of the Management Services Agreement, the Managers will have the right to require the Company to pay a fee equal to customary fees charged by internationally-recognized investment banks for serving as a financial advisor in similar transactions. The Management Services Agreement may be terminated at any time by the Managers, but will otherwise have an initial term ending on December 31, 2017 that will automatically be extended each December 31st for an additional year unless the Company or the Managers provide written notice of their desire not to extend the agreement. The Management Services Agreement will automatically terminate upon an initial public offering unless otherwise determined by the Managers, and, upon such a termination, the Managers will receive a one-time success fee in an amount equal to the net present values of the monitoring fees that would have been payable during the remaining term of the Management Services Agreement. In accordance with the Management Services Agreement, the Company recorded $7 million, $7 million and $6 million of monitoring fees during fiscal 2010, 2009 and 2008, respectively. For the six months ended March 31, 2011 and 2010, the Company recorded $4 million (unaudited) of monitoring fees for each respective period.
Acquisition of Enterprise Solutions Business of Nortel Networks Corporation
On December 18, 2009, Avaya acquired certain assets and assumed certain liabilities of the enterprise solutions business (“NES”) of Nortel Networks Corporation (“Nortel”), including all the shares of Nortel Government Solutions Incorporated, for $943 million in cash consideration. The Company and Nortel were
required to determine the final purchase price post-closing based upon the various purchase price adjustments included in the acquisition agreements. During the first quarter of fiscal 2011, the Company and Nortel agreed on a final purchase price of $933 million, and the Company received $6 million, representing all remaining amounts due to Avaya from funds held in escrow.million. The terms of the acquisition dodid not include any significant contingent consideration arrangements. During the years ended September 30, 2010
Acquisition of RADVISION Ltd.
On June 5, 2012, Avaya acquired RADVISION Ltd. (“Radvision”) for $230 million in cash. Radvision is a global provider of videoconferencing and 2009, acquisition costs of $20 milliontelepresence technologies over internet protocol and $29 million were expensed as incurred, respectively.wireless networks. These consolidated financial statementsaudited Consolidated Financial Statements include the operating results of NES as of December 19, 2009.Radvision since June 5, 2012.
Basis of Presentation
Avaya Holdings Corp. has no material assets or standalone operations other than its ownership in Avaya Inc. and its subsidiaries. The consolidated financial statementsConsolidated Financial Statements as of September 30, 2012 and 2011 and for the years ended September 30, 2010, 2009 and 2008 and the six months ended March 31,2012, 2011 and 2010 reflect the operating results of Avaya Holdings Corp. and its consolidated subsidiaries and are referred to as those of the “Successor” period. The consolidated financial statements as of and for the year ended September 30, 2008 reflects the operating results of Avaya Holdings Corp. for the entire fiscal year and includes the results of Avaya Inc. and its consolidated subsidiaries for the period October 27, 2007 (the date of the Merger) through September 30, 2008. Avaya Holdings Corp. did not have assets or operations prior to the Merger.
The consolidated financial statements as of and for the period October 1, 2007 through October 26, 2007 reflect the results of Avaya Inc. prior to the Merger and are referred to as those of the “Predecessor” period.
The accompanying unaudited interim consolidated financial statements of Avaya and its subsidiaries as of March 31, 2011 and for the six months ended March 31, 2011 and 2010 included herein have been prepared, without audit, pursuant to the rules and regulations of the Securities and Exchange Commission (“SEC”). The
financial data and the other information disclosed in these notes to the consolidated financial statements related to these six-month periods and as of March 31, 2011 are unaudited. Certain information and disclosures normally included in the financial statements prepared in accordance with accounting principles generally accepted in the United States of America (“GAAP”) have been condensed or omitted pursuant to such rules and regulations. In management’s opinion, these unaudited interim consolidated financial statements reflect all adjustments, consisting of normal and recurring adjustments, necessary for a fair statement of the financial condition, results of operations and cash flows for the periods indicated. The results for the six months ended March 31, 2011 are not necessarily indicative of the results to be expected for the fiscal year ending September 30, 2011 or any other interim period.subsidiaries.
2. Summary of Significant Accounting Policies
Use of Estimates
The consolidated financial statementsConsolidated Financial Statements and related disclosures are prepared in conformity with accounting principles generally accepted in the United States of America.America (“GAAP”). Management is required to make estimates and assumptions that affect the reported amounts of assets and liabilities, the disclosure of contingent assets and liabilities at the date of the financial statements, and revenue and expenses during the periods reported. These estimates include assessing the collectibility of accounts receivable, sales returns and allowances, the use and recoverability of inventory, the realization of deferred tax assets, business restructuring reserves, pension and postretirement benefit costs, the fair value of equity compensation, the fair value of assets and liabilities acquired in business combinations, the recoverability of long-lived assets, and useful lives and impairment of tangible and intangible assets including goodwill, the amount of exposure from potential loss contingencies, and fair value measurements, among others. The markets for the Company’s products are characterized by intense competition, rapid technological development and frequent new product introductions, all of which could affect the future recoverability of the Company’s assets. Estimates and assumptions are reviewed periodically and the effects of revisions are reflected in the consolidated financial statementsConsolidated Financial Statements in the period they are determined to be necessary. Actual results could differ from these estimates.
Principles of Consolidation
The consolidated financial statementsConsolidated Financial Statements include the accounts of Avaya and its subsidiaries. In the event that the Company is a primary beneficiary of a variable interest entity, the assets, liabilities, and results of operations of the variable interest entity will be included in the Company’s consolidated financial statements.Consolidated Financial Statements. All intercompany transactions and balances have been eliminated in consolidation. Certain prior year amounts have been reclassified to conform to the current presentation.
Acquisition Accounting
The Company accounts for business combinations under the new authoritative guidance using the acquisition method, which requires an allocation of the purchase price of an acquired entity to the assets acquired and liabilities assumed based on their estimated fair values at the date of acquisition. Goodwill represents the excess of the purchase price over the net tangible and intangible assets acquired.
Revenue Recognition
The Company derives revenue primarily from the sale of products, software, and services for communications systems and applications. The Company’s products are sold directly through its worldwide sales force and indirectly through its global network of distributors, service providers, dealers, value-added resellers, systems integrators and systems integrators.business partners. Services includes (i) supplemental maintenancesupport service, including services provided under contracts to monitor and optimize customers’ communications network performance; (ii) professional services for implementation and integration of converged voice and data networks, network security and unified communications; and (iii) operations, or managed services. MaintenanceSupport service contracts typically have terms that range from one to
five years. Contracts for professional services typically have terms that range from twofour to foursix weeks for standard solutions and from six months to one year for customized solutions. Contracts for operationsmanaged services typically have terms that range from one to seven years.
In accordance with GAAP, revenue is recognized when persuasive evidence of an arrangement exists, delivery has occurred, the fee is fixed or determinable, and collectability is reasonably assured, contractual obligations have been satisfied and title and risk of loss have been transferred to the customer. In instances in which finalassured. For arrangements that require acceptance of the product, system, or solution isas specified by the customer, revenue is deferred until allthe acceptance criteria have been met.
The Company’s indirect sales to distributionchannel partners are generally recognized at the time of shipment if all contractual obligations have been satisfied. The Company accrues a provision for estimated sales returns and other allowances, and deferrals relating to inventory levels held by distributors,including promotional marketing programs etc.and other incentives as a reduction of revenue at time of revenue recognition pursuant to Financial Accounting Standards Board (“FASB”) Accounting Standard Codification (“ASC”) Topic 605, “Revenue Recognition” (“ASC 605”).sale.When estimating returns, the Company considers customary inventory levels held by distributors.
Fiscal years 2010 and prior
The Company enters into multipleMultiple deliverable arrangements which may include any combination of products, software and services. A multiple deliverable arrangement is separated into more than one unit of accounting if all of the following criteria are met: (i) the delivered item(s) has value to the customer on a standalone basis; (ii) there is objective and reliable evidence of the fair value of the undelivered item(s); and (iii) the arrangement includes a general right of return relative to the delivered item(s), delivery or performance of the undelivered item(s) is considered probable and substantiallybeginning in the control of the Company. If these criteria are not met, the delivered products are combined with the undelivered items to form a single unit of accounting and revenue for the delivered and undelivered items are recognized on a straight-line basis or deferred until the earlier of when such criteria are met or when the last undelivered item is delivered.
Most delivered and undelivered items qualify as separate units of accounting and can be sold standalone or in various combinations across the Company’s geographies or customer markets. The Company uses the residual method to allocate arrangement consideration for multiple deliverable transactions where objective reliable evidence of fair value of the delivered items cannot be determined but can be determined for the undelivered items. Under the residual method, the amount of consideration allocated to the delivered items equals the total arrangement consideration less the fair value of the undelivered items. To the extent that a deliverable in a multiple deliverable arrangement is subject to specific guidance on whether and/or how to separate multiple deliverable arrangements into separate units of accounting, that deliverable is accounted for in accordance with such specific guidance.
The Company limits the amount of revenue recognition for delivered items to the amount that is not contingent on the future delivery of products or services, future performance obligations, or subject to customer-specific return or refund privileges. Once the Company allocates revenue to each deliverable, the Company recognizes revenue on each deliverable in accordance with its policies for product and service revenue recognition. Supplemental maintenance services and operations services revenues are deferred and recognized ratably over the period during which the services are to be performed. Professional services arrangements are generally recognized upon delivery or completion of performance. For services performed on a time and materials basis, revenue is recognized upon performance.
The Company uses objective and reliable evidence of fair value to separate an arrangement into more than one unit of accounting if the Company has evidenced vendor-specific objective evidence of fair value (“VSOE”) or third-party evidence of fair value (“TPE”) for an item. VSOE is based on the price charged when the deliverable is sold separately. TPE of fair value is established by evaluating largely interchangeable competitor products or services in standalone sales to similarly situated customers. As the Company is unable to reliably determine what competitors products’ selling prices are on a standalone basis, the Company is not typically able to determine TPE.
The Company recognizes revenue in accordance with the subtopic of Revenue Recognition under FASB ASC Topic 985, “Software” (“ASC 985”) for arrangements that include software that is more than incidental to the products or services as a whole. In multiple deliverable software arrangements, the Company uses the residual method to allocate arrangement consideration. Under the residual method, the amount of consideration allocated to the delivered items equals the total arrangement consideration less the fair value of the undelivered items. Where VSOE of the undelivered items cannot be determined, the Company defers revenue until all items are delivered and services have been performed, or until VSOE can be determined for the undelivered items.
Fiscal yearfiscal 2011 (unaudited)
In October 2009, the FASBFinancial Accounting Standards Board (“FASB”) amended the accounting standards forsoftware revenue recognition guidance to remove from its scope tangible products containing software components and non-software components that function together to deliver the product’s essential functionality from the scope of industry specific software revenue recognition guidance. In October 2009, thefunctionality. The FASB also amended the accounting standardsguidance for multiple deliverable revenue arrangements (formerly Emerging Issues Task Force No. 08-1) to: (i) provide updated guidance on whether multiple deliverables exist, how the deliverables in an arrangement should be separated and how the consideration should be allocated; and (ii) require an entitychange the term “fair value” to allocate revenue in an arrangement using estimated selling prices (“ESP”) of deliverables if a vendor does not have vendor-specific objective evidence of selling price (“VSOE”) or third-party evidence of selling price (“TPE”); and (iii) eliminate the use of the residual method“selling price” and require an entity to allocate revenue using the relativeestimated selling price method.prices of the deliverables when a vendor does not have vendor-specific or third-party evidence of selling price. The Company adopted the new guidance on a prospective basis as of the beginning of fiscal 2011 for revenue arrangements entered into or materially modified on or after October 1, 2010.
The new guidance did not generally change the units of accounting for the Company’s revenue transactions as delivered and undelivered items in most transactionsgenerally qualified as separate units of accounting under the historical guidance. The new guidance does affectaffects the timing of revenue recognition for multiple deliverable arrangements that included delivered productsitems and undelivered items for which the Company was unable to demonstrate fair value pursuant to the historical guidance. In such cases, under the historical guidance, the delivered productsitems were combined with the undelivered items to form a single unit of accounting and revenue for the delivered and undelivered items was recognized on either a straight-line basis over the services period or deferred until the earlier of when the fair value requirements were met or when the last item was delivered. In addition, under the historical guidance, the Company previously used the residual method to allocate the arrangement consideration for multiple deliverable transactionsin cases where objective and reliable evidence of fair value of the delivered items could not be determined but couldonly be determined for the undelivered items. Under the new guidance, the Company allocates the total arrangement consideration to each separable deliverable of an arrangement based upon the relative selling price of each deliverable and revenue is recognized upon delivery or completion of those units of accounting. As a result of adopting the new guidance, net revenues for the six months ended March 31, 2011 were not materially different from the net revenues that would have been recorded under the historical accounting guidance. The Company cannot reasonably estimate the effect of adopting the new guidance on future financial periods as the impact will vary depending on the nature and volume of new or materially modified multiple deliverable arrangements in any given period.each item is delivered.
The Company enters into multiple deliverable arrangements, which may include any combinationvarious combinations of products, software and services. Most product and service deliverables qualify as separate units of accounting and can be sold on a standalone or in various combinations across the Company’s geographies or customer markets.basis. A deliverable constitutes a separate unit of accounting when it has standalone value and, there are no customer-negotiated refunds orwhere return rights for the delivered items. If the arrangement includes a customer-negotiated refundexist, delivery or return right relative to the delivered items, and the delivery and performance of the undelivered itemitems is considered probable and substantially inwithin the Company’s control,control. When the delivered item constitutes a separate unitCompany sells products with implementation services, they are generally combined as one or more units of accounting.accounting, depending on the nature of the services and the customer’s acceptance requirements.
Most all of the Company’s solutions have both software and non-software components that function together to deliver the products’ essential functionality. For these multiple deliverable arrangements, that contain both
software and non-software components that function together to deliver a product’s essential functionality, the Company allocates revenue to allthe deliverables based on their relative selling prices. In such circumstances, the Company uses a hierarchy of VSOE, TPE and ESP to determine the selling price to be used for allocating revenue to the deliverables. To the extent that a deliverable in a multiple deliverable arrangement is subject to specific guidance on whether and/or how to separateallocate the consideration in a multiple deliverable arrangements into separate units of accounting,element arrangement, that deliverable is accounted for in accordance with such specific guidance. In addition, theThe Company limits the amount of revenue recognition for delivered items to the amount that is not contingent on the future delivery of products or services or meeting other future performance obligations, or subject to customer-specific return or refund privileges.obligations.
VSOEThe Company allocates revenue based on a selling price hierarchy of vendor-specific objective evidence, third-party evidence, and then estimated selling price. Vendor-specific objective evidence is based on the price charged when the deliverable is sold separately. TPE of selling priceThird-party evidence is established by evaluatingbased on largely interchangeable competitor products or services in standalone sales to similarly situated customers. As the Company is unable to reliably determine what competitors products’ selling prices are on a standalone basis, the Company is not typically able to determine TPE. ESPthird-party evidence. Estimated selling price is based on the Company’s best estimates of what the selling prices of deliverables would be if they were sold regularly on a standalone basis. The ESPEstimated selling price is established considering multiple factors including, but not limited to, pricing practices in different geographies and through different sales channels, major product and services groups, and customer classifications.
Once the Company allocates revenue to each deliverable, the Company recognizes revenue on each deliverable in accordance with its policies for productwhen all revenue recognition criteria are met. Product revenue is generally recognized upon delivery and servicesupport and managed services revenue recognition. Supplemental maintenance services and operations services revenues are deferred andis generally recognized ratably over the period during which the services are to be performed. ProfessionalHowever, revenue for professional services arrangements areis generally recognized upon delivery or completion of performance. For services performed on a timeperformance and materials basis, revenue for arrangements that require acceptance of the product, system or solution, is recognized upon performance.when the acceptance criteria have been met.
Standalone or subsequent sales of software or software-related productsitems are recognized in accordance with FASB ASC Topic 985, “Software.” Inthe software revenue recognition guidance. For multiple deliverable arrangements that only include standalone software and software-related products,items, the Company generally uses the residual method to allocate the arrangement consideration. Under the residual method, the amount of consideration allocated to the delivered items equals the total arrangement consideration, less the fair value of the undelivered items. Where VSOEvendor-specific objective evidence of fair value for the undelivered items cannot be determined, the Company defers revenue until all items are delivered and services have been performed, or until VSOEsuch evidence of fair value can be determined for the undelivered items.
Multiple deliverable arrangements in fiscal 2010 and prior
Prior to fiscal 2011, a multiple deliverable arrangement is separated into more than one unit of accounting if all of the following criteria are met: (i) the delivered item(s) has value to the customer on a standalone basis; (ii) there is objective and reliable evidence of the fair value of the undelivered item(s); and (iii) if the arrangement includes a general right of return relative to the delivered item(s), delivery or performance of the undelivered item(s) is considered probable and substantially within the control of the Company. If these criteria are not met, the delivered items are combined with the undelivered items to form a single unit of accounting and revenue is recognized on either a straight-line basis over the services period or deferred until the earlier of when such criteria are met or when the last item is delivered.
The Company uses the residual method to allocate the arrangement consideration for multiple deliverable arrangements for which objective and reliable evidence of fair value can only be determined for the undelivered items. Under the residual method, the amount of consideration allocated to the delivered items equals the total arrangement consideration, less the fair value of the undelivered items.
The Company uses objective and reliable evidence of fair value to separate the deliverables into more than one unit of accounting if the Company has vendor-specific objective evidence or third-party evidence of fair
value for all of the deliverables. The accounting guidance does not permit the Company to use an estimated selling price for these arrangements when objective and reliable evidence of fair value is not available.
The Company recognizes revenue in accordance with the software revenue recognition guidance for arrangements that include software that is more than incidental to the products or services as a whole. In multiple deliverable software arrangements, the Company generally uses the residual method to allocate the arrangement consideration. When vendor-specific objective evidence of fair value cannot be determined for the undelivered items, the Company defers revenue until all items have been delivered or until such evidence can be determined.
Cash and Cash Equivalents
Cash and cash equivalents consist of highly liquid investments with original maturities of three months or less when purchased, and are stated at cost, which approximates market value.
Concentrations of Risk
The Company’s cash and cash equivalents are invested in various investment grade institutional money market accounts and bank term deposits, with the majority of these investments having government backing.deposits. Deposits held at banks may exceed the amount of insurance provided on such deposits. Generally, these deposits may be redeemed upon demand and are maintained with financial institutions with reputable credit and therefore bear minimal credit risk. The Company seeks to mitigate such risks by spreading its risk across multiple counterparties and monitoring the risk profiles of these counterparties.
The Company relies on a limited number of contract manufacturers and suppliers to provide manufacturing services for its products. The inability of a contract manufacturer or supplier to fulfill supply requirements of the Company could materially impact future operating results.
Accounts Receivable and Allowance for Doubtful Accounts
Accounts receivable are recorded net of reserves for sales returns and allowances and provisions for doubtful accounts. The Company performs ongoing credit evaluations of its customers and generally does not
require collateral from its customers. The allowances are based on analyses of historical trends, aging of accounts receivable balances and the creditworthiness of customers as determined by credit checks, and analyses, as well as customers’and payment history. There can be no assurance that the Company’s credit loss experience will remain at or near historic levels. At September 30, 20102012 and 2009, no single2011, one customer accounted for more than 10% of accounts receivable.
Inventory
Inventory includes goods awaiting sale (finished goods), equipment that is being installed at customer locations for various installations that are not yet complete and goods to be used in connection with providing maintenancesupport services. Inventory is stated at the lower of cost or market, determined on a first-in, first-out method. Reserves to reduce the inventory cost to market value are based on current inventory levels, assumptions about future demand and product life cycles for the various inventory types.
As discussed in detail in Note 19, the Company has outsourced the manufacturing of substantially all of its products and may be obligated to purchase certain excess inventory levels from its outsourced manufacturers that could result if actual sales of product vary from forecast, in which case additional inventory provisions may need to be recorded in the future.
Research and Development Costs
Research and development costs are charged to expense as incurred. The costs incurred for the development of communications software that will be sold, leased or otherwise marketed, however, are capitalized when technological feasibility has been established in accordance with FASB ASCAccounting Standards Codification
(“ASC”) Topic 985, “Software” (“ASC 985”). These capitalized costs are subject to an ongoing assessment of recoverability based on anticipated future revenues and costs and changes in hardware and software technologies. Costs that are capitalized include direct labor and related overhead.
Amortization of capitalized software development costs begins when the product is available for general release to customers. Amortization is recognized on a product-by-product basis generally on the straight-line method over a period of up to two years. Unamortized software development costcosts determined to be in excess of net realizable value of the product isare expensed immediately. Included in other assets at March 31, 2011, September 30, 20102012 and 20092011 is unamortized software development costcosts of $46 million (unaudited), $55$51 million and $70$58 million, respectively.
Property, Plant and Equipment
Property, plant and equipment are stated at cost less accumulated depreciation. Depreciation is determined using a straight-line method over the estimated useful lives of the assets. Estimated lives range from three to ten years for machinery and equipment, up to five years for rental equipment and up to forty40 years for buildings. Improvements that extend the useful life of assets are capitalized and maintenance and repairs are charged to expense as incurred. Upon retirement or disposal of assets, the cost and related accumulated depreciation are removed from the Consolidated Balance Sheets and any gain or loss is reflected in the Consolidated Statements of Operations.
Internal Use Software
Certain costs of computer software developed or obtained for internal use are capitalized and amortized on a straight-line basis generally over three to seven years. General and administrative costs, overhead, maintenance and training, as well as the cost of software that does not add functionality to the existing system, are expensed as incurred. The Company had unamortized internal use software costs of $31 million (unaudited), $38$19 million and $38$26 million as of March 31, 2011, September 30, 20102012 and 2009.
Goodwill
Goodwill is not amortized but is subject to periodic testing for impairment in accordance with FASB ASC Topic 350, “Intangibles-Goodwill and Other” (“ASC 350”) at the reporting unit level which is one level below the Company’s operating segments. The assessment of goodwill impairment is conducted by estimating and comparing the fair value of the Company’s reporting units’ net assets,units, as defined in ASC 350, to their carrying value as of that date. The fair value is estimated using an income approach whereby the fair value of the assetreporting unit is based on the future cash flows that each reporting unit’s assets can be expected to generate. Future cash flows are based on forward-looking information regarding market share and costs for each reporting unit and are discounted using an appropriate discount rate. Future discounted cash flows can be affected by changes in industry or market conditions or the rate and extent to which anticipated synergies or cost savings are realized with newly acquired entities. The test for impairment is conducted annually each September 30th, and more frequently if events occur or circumstances change that indicate that the fair value of a reporting unit may be below its carrying amount.
Intangible and Long-lived Assets
Intangible assets include technology, customer relationships, trademarks and trade namestrade-names and other intangibles. Intangible assets with finite lives are amortized using the straight-line method over the estimated economic lives of the assets, which range from two to fifteen years. Long-lived assets, including intangible assets with finite lives, are reviewed for impairment whenever events or changes in circumstances indicate that the carrying amount of such assets may not be recoverable in accordance with FASB ASC Topic 360-10-35, “Impairment or Disposal of Long-Lived Assets”360, “Property, Plant, and Equipment” (“ASC 360-10-35”360”). Determination of recoverability is based on an estimate of undiscounted future cash flows resulting from the use of the asset and its eventual disposition. Measurement of an impairment
loss for long-lived assets that management expects to hold and use is based on the estimated fair value of the asset. Long-lived assets to be disposed of are reported at the lower of carrying amount or estimated fair value less costs to sell. Intangible assets determined to have indefinite useful lives are not amortized but are tested for impairment annually each September 30th and more frequently if events occur or circumstances change that indicate an asset may be impaired.
Financial Instruments
The Company uses foreign currency forward contracts to manage and reduce risk to the Company by generating cash flows that offset the cash flows of certain transactions in foreign currencies in relation to their amounts and timing. The Company’s derivative financial instruments are used as risk management tools and not for speculative or trading purposes. These derivative instruments represent assets and liabilities and are classified as other current assets or other current liabilities on the Consolidated Balance Sheets. Gains and losses on the changes in the fair values of the Company’s derivative instrumentsforeign currency forward contracts are included in other income (expense), net. As permitted under FASB ASC Topic 815 “Derivatives and Hedging” (“ASC 815”), the Company has elected not to designate its forward contracts as hedges thereby precluding the use of hedge accounting for these instruments.
The Company uses interest rate swap agreements in order to reduce its exposure to variable rate interest payments associated with its senior secured term loan. Thecredit facility. Those interest rate swaps that are designated and qualify as cash flow hedges under ASC 815 and are included at estimated fair value as an asset or liability in the Consolidated Balance Sheets. These are bifurcated into current and non-current components depending upon the timing of the cash flows. Fair valuesvalue related to the cash flows occurring within one year are classified as current and beyond one year as non-current. Unrealized gains/losses related to the change in market value on these interest rate swaps are recorded in other comprehensive loss and reclassified to earnings in the same period or periods during which the hedged transaction affects earnings. The market value of the interest rate swaps recorded in other comprehensive loss may be recognized in the Consolidated Statement of Operations earlier if the interest rate swaps are determined to be ineffective, for example, if certain terms of the senior secured term loancredit facility change, if the loan is
extinguished, if the counterparty’s ability to honor its obligation under the agreement changes, or if the interest rate swap agreements are terminated prior to maturity.
As discussed more fully in Note 15 “Capital Stock”, the Company has issued Series B Convertible Preferred Stock (“preferred series B”) containing certain features which are considered an embedded derivative under GAAP. This embedded derivative was separated from the host contract (i.e. the preferred stock) and recognized as a current liability on the Consolidated Balance Sheet at fair value. Gains and losses on the changes in the fair value of the embedded derivative are included in other income (expense), net.
The Company also utilizes non-derivative financial instruments including letters of credit and commitments to extend credit.
Restructuring Programs
The Company accounts for exit or disposal of activities in accordance with FASB ASC Topic 420, “Exit or Disposal Cost Obligations” (“ASC 420”). In accordance with ASC 420, a business restructuring is defined as an exit or disposal activity that includes but is not limited to a program that is planned and controlled by management and materially changes either the scope of a business or the manner in which that business is conducted. Business restructuring charges includes (i) one-time termination benefits related to employee separations, (ii) contract termination costs and (iii) other costs associated with exit or disposal activities including, but not limited to, costs for consolidating or closing facilities and relocating employees.
A liability is recognized and measured at its fair value for one-time termination benefits once the plan of termination is communicated to affected employees and it meets all of the following criteria: (i) management
commits to a plan of termination, (ii) the plan identifies the number of employees to be terminated and their job classifications or functions, locations and the expected completion date, (iii) the plan establishes the terms of the benefit arrangement and (iv) it is unlikely that significant changes to the plan will be made or the plan will be withdrawn. Contract termination costs include costs to terminate a contract or costs that will continue to be incurred under the contract without benefit to the Company. A liability is recognized and measured at its fair value when the Company either terminates the contract or ceases using the rights conveyed by the contract. A liability is recognized and measured at its fair value for other associated costs in the period in which the liability is incurred.
In connection with the Merger, the Company adopted a plan to exit certain activities of the newly acquired company. A liability was recognized as of the consummation date of the acquisition for the costs under the exit plan in accordance with the authoritative guidance at that time if these costs were not associated with or were not incurred to generate revenues of the combined entity after the consummation date and either (i) had no future economic benefit to the combined company, were incremental to other costs incurred by either the acquired company or the acquiring company in the conduct of activities prior to the consummation date, and were expected to be incurred as a direct result of the plan to exit an activity of the acquired company or (ii) the cost represented an amount to be incurred by the combined company under a contractual obligation of the acquired company that existed prior to the consummation date and will either continue after the plan is completed with no economic benefit to the combined company or be a penalty incurred by the combined company to cancel that contractual obligation.
Pension and Postretirement Benefit Obligations
The Company sponsors non-contributory defined benefit pension plans covering certaina portion of its U.S. employees and retirees, and postretirement benefit plans for certaincovering a portion of its U.S. retirees that include healthcare benefits and life insurance coverage. Certain non-U.S. operations have various retirement benefit programs covering substantially all of their employees. Some of these programs are considered to be defined benefit pension plans for accounting purposes.
The Company’s pension and postretirement benefit costs are developed from actuarial valuations. Inherent in these valuations are key assumptions, including the discount rate and expected long-term rate of return on plan assets. Material changes in pension and postretirement benefit costs may occur in the future due to changes in these assumptions, changes in the number of plan participants, changes in the level of benefits provided, changes in asset levels and changes in legislation.
The market-related value of the Company’s plan assets as of the measurement date is developed using a 5-yearfive-year smoothing technique. First, a preliminary market-related value is calculated by adjusting the market-related value at the beginning of the year for payments to and from plan assets and the expected return on assets during the year. The expected return on assets represents the expected long-term rate of return on plan assets adjusted up to plus or minus 2% based on the actual 10-yearten-year average rate of return on plan assets. A final market-related value is determined as the preliminary market-related value, plus 20% of the difference between the actual return and expected return for each of the past five years.
These pension and other postretirement benefits are accounted for in accordance with FASB ASC Topic 715, “Compensation—Retirement Benefits” (“ASC 715”). ASC 715 requires that plan assets and obligations be measured as of the reporting date and the over-funded, under-funded or unfunded status of plans be recognized as of the reporting date as an asset or liability in the Consolidated Balance Sheets. In addition, ASC 715 requires costs and related obligations and assets arising from pensions and other postretirement benefit plans to be accounted for based on actuarially-determined estimates.
The plans use different factors, including years of service, eligible compensation and age, to determine the benefit amount for eligible participants. The Company funds its U.S. qualified pension plans in compliance with applicable laws. See Note 13, “Benefit Obligations,” for a discussion of the Company’s pension and postretirement plans which froze benefit accruals and additional participation effective December 31, 2003.plans.
Share-based Compensation
The Company accounts for share-based compensation in accordance with FASB Topic ASC 718, “Compensation—Stock Compensation” (“ASC 718”), which requires the measurement and recognition of compensation expense for all share-based payment awards made to employees and directors including stock options, restricted stock units and stock purchases based on estimated fair values.
The Company adopted the alternative transition method for calculating the tax effects of share-based compensation pursuant to authoritative guidance provided by the FASB. The alternative transition method includes simplified methods to establish the beginning balance of the additional paid-in capital pool (“APIC pool”) related to the tax effects of employee share-based compensation, and to determine the subsequent impact on the APIC pool and Consolidated Statements of Cash Flows of the tax effects of employee share-based compensation awards that are outstanding upon adoption of ASC 718.
Income Taxes
Income taxes are accounted for under the asset and liability method. Under this method, deferred tax assets and liabilities are recognized for the estimated future tax consequences attributable to differences between the financial statement carrying amounts of existing assets and liabilities and their respective tax bases, and operating loss and tax credit carryforwards. Deferred tax assets and liabilities are measured using enacted tax rates in effect for the year in which those temporary differences are expected to be recovered or settled. The effect on deferred tax assets and liabilities of a change in tax rates is recognized in the Consolidated Statements of Operations in the period that includes the enactment date. A valuation allowance is recorded to reduce the carrying amounts of deferred tax assets if it is more likely than not that such assets will not be realized. Additionally, the accounting for income taxes requires the Company to evaluate and make an assertion as to whether undistributed foreign earnings will be indefinitely reinvested or repatriated. As discussed more fully in Note 12 “Income Taxes”, the Company changed its indefinite reinvestment of undistributed foreign earnings assertion.
FASB ASC subtopicSubtopic 740-10, “Income Taxes—Overall” (“ASC 740-10”) prescribes a comprehensive model for the financial statement recognition, measurement, classification, and disclosure of uncertain tax positions. ASC 740-10 contains a two-step approach to recognizing and measuring uncertain tax positions. The first step is to evaluate the tax position for recognition by determining if the weight of available evidence indicates that it is more likely than not that the position will be sustained on audit, based on the technical merits of the position. The second step is to measure the tax benefit as the largest amount that is more than 50% likely of being realized upon settlement.
Significant judgment is required in evaluating uncertain tax positions and determining the provision for income taxes. Although the Company believes its reserves are reasonable, no assurance can be given that the final tax outcome of these matters will not be different from that which is reflected in the historical income tax provision and accruals. The Company adjusts these reserves in light of changing facts and circumstances.
Net Loss Per Share
Basic net loss per share is computed by dividing the net loss attributable to common stockholders by the weighted average number of common shares outstanding during the period. Net loss attributable to common stockholders is adjusted (increased) for preferred stock dividends earned during the period. Diluted loss per share is computed by dividing the net loss attributable to common stockholders by the weighted average number of common shares outstanding plus potentially dilutive common shares. Because the Company reported losses for the periods presented, all potentially dilutive common shares comprised of stock options, convertible preferred stock, unvested restricted stock and warrants are anti-dilutive.
Deferred Financing Costs
Deferred financing costs, which are included in other assets, are amortized as interest expense over the contractual lives of the related credit facilities.
Foreign Currency Translation
Assets and liabilities of non-U.S. subsidiaries that operate in a local currency environment, where the local currency is the functional currency, are translated from foreign currencies into U.S. dollars at period-end exchange rates while income and expenses are translated at the spot rate. Translation gains or losses related to net assets located outside the U.S. are shown as a component of accumulated other comprehensive loss in the Consolidated Statements of Changes in Stockholder’s Equity (deficiency)Deficiency and of Comprehensive Loss. Gains and losses resulting from foreign currency transactions, which are denominated in currencies other than the entity’sAvaya’s functional currency, are included in other income (loss), net in the Consolidated Statements of Operations.
Other Comprehensive Loss
Other comprehensive loss is recorded directly to a separate section of stockholders’ equity (deficiency)deficiency in accumulated other comprehensive loss and primarily includes unrealized gains and losses excluded from the Consolidated Statements of Operations. These unrealized gains and losses consist of changes in our foreign currency translation, interest rate swaps, and changes in unamortized pension, postretirement and postemployment actuarial gains and losses.
3. Recent Accounting Pronouncements
New Accounting Guidance Recently Adopted
Milestone MethodDisclosure of Revenue Reconition
In April 2010, the FASB issued accounting guidance on the milestone method of revenue recognition. The guidance defines the term “milestone” and the prescribed criteria that should be met to apply the milestone method of revenue recognitionSupplementary Pro Forma Information for research or development transactions. The guidance requires that the milestone should meet all criteria to be considered substantive to recognize consideration that is contingent upon the achievement of a milestone in its entirety as revenue in the period in which the milestone is achieved. This accounting guidance became effective for the Company beginning October 1, 2010. The adoption of this accounting guidance did not have an impact on the Company’s consolidated financial statements.
Business Combinations and Noncontrolling Interests
In the first quarter of fiscal 2010, the Company adopted new guidance under the acquisition method for business combinations. The more significant changes include: an expanded definition of a business and a business combination; recognition of acquisition-related expenses and restructuring costs separately from the
business combination; recognition of assets acquired and liabilities assumed at their acquisition-date fair values with subsequent changes recognized in earnings; and capitalization of in-process research and development at fair value as an indefinite-lived intangible asset. The guidance also amends and clarifies the application issues on initial recognition and measurement, subsequent measurement and accounting, and disclosure of assets and liabilities arising from contingencies in a business combination. The impact of the revised accounting guidance on the Company’s results of operations and financial position will vary depending on each future specific business combination or asset purchase.
Effective the first quarter of fiscal 2010, the Company adopted revised accounting guidance which requires noncontrolling interests (formerly minority interest) to be presented as a separate component within the equity section of the Consolidated Balance Sheets and separate presentation of net income attributable to noncontrolling interests on the Consolidated Statements of Operations. The relevant presentation and disclosures have been applied retrospectively for all periods presented. The adoption of this accounting guidance did not have a material impact on the Company’s consolidated financial statements.
Fair Value Measures
In September 2006, the FASB issued an accounting standard related to fair value measurements of financial and non-financial assets and liabilities. The provisions of the standard applicable to financial assets and liabilities were effective and adopted by the Company on October 1, 2008. On October 1, 2009 the provisions of this standard became effective for the Company’s non-financial assets and liabilities. The adoption of this accounting guidance did not have a material impact on the Company’s consolidated statement of operations.
In January 2010, the FASB issued revised guidance intended to improve disclosures related to fair value measurements. This guidance requires new disclosures and clarifies certain existing disclosure requirements. New disclosures under this guidance require separate information about significant transfers into and out of Level 1 and Level 2 and the reasons for such transfers, and also require purchases, sales, issuances, and settlements information for Level 3 measurements to be included in the rollforward of activity on a gross basis. The guidance also clarifies the requirement to determine the level of disaggregation for fair value measurement disclosures and the requirement to disclose valuation techniques and inputs used for both recurring and nonrecurring fair value measurements in either Level 2 or Level 3. This accounting guidance became effective for the Company beginning in the second quarter of fiscal 2010, except for the rollforward of activity on a gross basis for Level 3 fair value measurements, which will be effective for the Company in the first quarter of fiscal 2012. The adoption of this accounting guidance is reflected in Note 11, “Fair Value Measures” and did not have a material impact on the Company’s financial statement disclosures.
In August 2009, the FASB issued guidance to clarify the fair value measurements and disclosure requirements related to the measurement of liabilities at fair value. The guidance provides clarification that in circumstances in which a quoted price in an active market for the identical liability is not available, a reporting entity is required to measure fair value using one or more of the following methods: 1) a valuation technique that uses a) the quoted market price of the identical liability when traded as an asset or b) quoted prices for similar liabilities or similar liabilities when traded as assets and/or 2) a valuation technique that is consistent with the principles of ASC 820, Fair Value Measurements and Disclosures. The accounting guidance became effective for the Company beginning in fiscal 2010. The adoption of this accounting guidance did not have an impact on the Company’s consolidated statement of operations.
Variable Interest Entities
In December 2009, the FASB issued revised guidance for the accounting for variable interest entities. The revised guidance replaces the quantitative-based risks and rewards approach with a qualitative approach that focuses on which enterprise has the power to direct the activities of a variable interest entity that most significantly impact the entity’s economic performance. The accounting guidance also requires an entity to
perform an ongoing analysis to determine whether the entity’s variable interest or interests give it a controlling financial interest in a variable interest entity. This accounting guidance became effective for the Company beginning October 1, 2010 and did not have an impact on the Company’s consolidated financial statements.
Recent Accounting Guidance Not Yet Effective
In December 2010, the FASBFinancial Accounting Standards Board (“FASB”) issued revised guidance which requires that if a company presents pro forma comparative financial statements for business combinations, the company should disclose revenue and earnings of the combined entity as though the business combination(s) that occurred during the current year had occurred as of the beginning of the comparable prior annual reporting period only. This guidance also expands the supplemental pro forma disclosures to include a description of the nature and amount of material, nonrecurring pro forma adjustments directly attributable to the business combination included in the reported pro forma revenue and earnings. This accounting guidance isbecame effective for the Company for business combinations for which the acquisition date was on a prospective basis beginning in fiscal 2012.or after October 1, 2011. The adoption of this guidance isdid not expected to have a material impact on the Company’s financial statement disclosures.
Goodwill Impairment Test
In December 2010, the FASB issued revised guidance on when a company should perform step two of the goodwill impairment test for reporting units with zero or negative carrying amounts. This guidance requires that for reporting units with zero or negative carrying amounts, a company is required to perform step two of the goodwill impairment test if it is more likely than not that a goodwill impairment exists. In determining whether it is more likely than not that a goodwill impairment exists, an entity should consider whether there are any adverse qualitative factors indicating that an impairment may exist. This accounting guidance became effective for the Company beginning October 1, 2011 and did not have a material impact on the Company’s Consolidated Financial Statements or financial statement disclosures.
Fair Value Measures
In May 2011, the FASB issued revised guidance which is intended to achieve common fair value measurement and disclosure guidance in GAAP and International Financial Reporting Standards. The majority of the changes represent a clarification to existing GAAP. Additionally, the revised guidance includes expanded disclosure requirements. This accounting guidance became effective for the Company beginning in the second quarter of fiscal 2012 and did not have a material impact on the Company’s Consolidated Financial Statements or financial statement disclosures.
Multiemployer Pension Plan Disclosures
In September 2011, the FASB issued revised guidance which requires additional disclosure about an employer’s participation in a multiemployer pension plan. The accounting guidance became effective for the Company as of September 30, 2012 and is applied retrospectively for all prior periods presented. The adoption of this accounting guidance did not have a material impact on the Company’s financial statement disclosures.
Presentation of Comprehensive Income
In fiscal 2012, the Company adopted new guidance on the presentation of comprehensive income and its components in the financial statements. This guidance eliminated the option to report other comprehensive income and its components in the statement of changes in equity and instead requires presentation either in a single continuous statement or in two separate, but consecutive statements. The relevant presentation and disclosures have been applied retrospectively for all periods presented.
Recent Accounting Guidance Not Yet Effective
In September 2011, the FASB issued revised guidance intended to simplify how an entity tests goodwill for impairment. As a result of the guidance, an entity will be allowed to first assess qualitative factors to determine whether it is necessary to perform the two-step quantitative goodwill impairment test. An entity will not be required to calculate the fair value of a reporting unit unless the entity determines, based on a qualitative assessment, that it is more likely than not that its fair value is less than its carrying amount. The accounting guidance is effective for the Company beginning in fiscal 2012. The2013 and early adoption of thisis permitted. This accounting guidance is not expected to have a material impact on the Consolidated Financial Statements or financial statement disclosures.
In July 2012, the FASB issued revised guidance intended to simplify how an entity tests indefinite-lived intangible assets other than goodwill for impairment. As a result of the guidance, an entity will be allowed to first assess qualitative factors to determine whether it is necessary to perform the quantitative impairment test. An entity will not be required to perform the quantitative impairment test unless the entity determines, based on a qualitative assessment, that it is more likely than not that the indefinite-lived asset is impaired. The accounting guidance is effective for the Company beginning in fiscal 2013. This accounting guidance is not expected to have a material impact on the Consolidated Financial Statements or financial statement disclosures.
On February 5, 2013, the FASB issued Accounting Standards Update No. 2013-02 “Reporting of Amounts Reclassified Out of Accumulated Other Comprehensive Income”. The standard requires that companies present, either in a single note or parenthetically on the face of the financial statements, the effect of significant amounts reclassified from each component of accumulated other comprehensive income based on its source and the income statement line items affected by the reclassification. This accounting guidance is effective for the Company beginning in the first quarter of fiscal 2014 and is only expected to impact the presentation of the Company’s consolidated financial statements.Consolidated Financial Statements and related notes.
4. Business Combinations and Other Transactions
Merger TransactionRADVISION Ltd.
On June 5, 2012, Avaya acquired Radvision for $230 million in cash. The totalpurchase price was funded with (i) $196 million from the proceeds from the issuance of Series B Preferred Stock and warrants to purchase common stock, and (ii) approximately $34 million of Avaya’s cash.
The acquisition of Radvision has been accounted for under the acquisition method, which requires an allocation of the purchase price of the Merger was allocatedacquired entity to the Company’s net tangibleassets acquired and intangible assetsliabilities assumed based on their estimated fair values set forth below. from a market-participant perspective at the date of acquisition. The allocation of the purchase price as reflected within these Consolidated Financial Statements is based on the best information available to management at the time these Consolidated Financial Statements were issued and is provisional pending the completion of the final valuation analysis of the Radvision assets and liabilities and the completion of an appraisal of the long-lived assets acquired as of the acquisition date, which the Company has partially relied upon. During the measurement period (which is not to exceed one year from the acquisition date), the Company will be required to retrospectively adjust the provisional amounts recognized to reflect new information obtained about facts and circumstances that existed as of the acquisition date that, if known, would
have affected the measurement of the amounts recognized as of that date. Further, during the measurement period, the Company is also required to recognize additional assets or liabilities if new information is obtained about facts and circumstances that existed as of the acquisition date that, if known, would have resulted in the recognition of those assets or liabilities as of that date.
The fair values of the assets acquired and liabilities assumed were preliminarily determined using the income, cost and market approaches. The fair values of acquired technologies, trade names and customer relationships were estimated using the income approach which values the subject asset using the projected cash flows to be generated by the asset, discounted at a required rate of return that reflects the relative risk of achieving the cash flow and the time value of money. The cost approach was used to estimate the fair values of property, plant and equipment and reflects the estimated reproduction or replacement costs for the assets, less an allowance for loss in value due to depreciation. The market approach was utilized in combination with the income approach to estimate the fair values of most working capital accounts.
A preliminary allocation of the purchase price to the assets acquired and the liabilities assumed in the Radvision acquisition was performed based on their estimated fair values. As additional information becomes available, differences between the allocation of the purchase price and the allocation of the purchase price when finalized, particularly as it pertains to intangible assets, deferred income taxes and goodwill, may be identified. Intangible assets include acquired technologies of $31 million, trade names of $1 million and customer relationships of $10 million. The acquired technologies, trade names and customer relationships are being amortized over a weighted average useful life of five years, two years and eight years, respectively, on a straight-line basis. No in-process research and development was acquired in the Radvision acquisition. During the three months ended September 30, 2012 adjustments were made to the preliminary purchase price allocation to reflect revised estimates of the fair values of the assets acquired and liabilities assumed at June 5, 2012. Providing for these adjustments in previous periods would have had an immaterial impact on the reported operating results for the three months ended June 30, 2012 and therefore such amounts were recorded in the period in which the adjustments were identified.
The excess of the purchase price over the preliminary assessment of the net tangible and intangible assets was recorded as goodwill. The tax-deductible portionacquired resulted in goodwill of goodwill was $146 million.
In millions | ||||
Cash and cash equivalents | $ | 1,405 | ||
Accounts receivable | 832 | |||
Inventory | 499 | |||
Property, plant and equipment | 616 | |||
Intangible assets | 3,702 | |||
In-process research and development | 112 | |||
Accounts payable | (374 | ) | ||
Deferred income taxes, net | (428 | ) | ||
Business restructuring reserve | (330 | ) | ||
Payroll and benefit obligations | (1,794 | ) | ||
Deferred revenue | (464 | ) | ||
Other assets and liabilities, net | (275 | ) | ||
Net assets acquired | 3,501 | |||
Goodwill | 4,855 | |||
Purchase price | $ | 8,356 | ||
The Company’s trademarks and trade names had a combined estimated value of $545$96 million. The premium paid by the Company expectsin the transaction is largely attributable to generate cash flows relatedthe acquisition of an assembled workforce and the synergies and economies of scale provided to these assets indefinitely. Consequently, these assets were
classifieda market participant, particularly as indefinite-lived intangibles and accordingly are not amortized but reviewed for impairment annually, or sooner under certain circumstances. Intangible assets with finite lives include existing technologies, patents and licenses of $1,183 millionit pertains to marketing efforts and customer relationships and other intangiblesbase. None of $1,974 million.the goodwill is deductible for income tax purposes.
In-process researchThese Consolidated Financial Statements include the operating results of the Radvision business since June 5, 2012. The revenues and development (“IPRD”) represents certain technologies, primarily related to session initiation protocol products, expected to enhance the Company’s products when fully developed. The fair value of IPRD was $112 million, determined using a royalty savings method. This technology is anticipated to benefit the Company when completed in fiscal 2012 after additional development and testing. At the time of acquisition, these technologies were in the initial development stages and did not meet the technological feasibility standard necessary for capitalization. Accordingly, these amounts were chargedexpenses specific to the Radvision business and the pro forma results are not material to these Consolidated Statements of Operations at the date of the acquisition.
As a result of the Merger, the Company increased inventory $182 million to reflect its estimated fair value less costs to sell. This step-up in value was fully amortized to cost of goods sold in the Consolidated Statements of Operations as the inventory was sold during the period October 27, 2007 through September 30, 2008.Financial Statements.
Acquisition of Enterprise Solutions Business of Nortel Networks Corporation
On September 16, 2009, the Company emerged as the winning bidder in bankruptcy court proceedings to acquire NES for $900 million in cash consideration subject to certain purchase price adjustments as set forth in the acquisition agreements (the “Acquisition”). On December 18, 2009 (the “acquisition date”), Avaya acquired certain assets and assumed certain liabilities of NES, including all the shares of Nortel Government Solutions Incorporated, for $943 million in cash consideration. The Company and Nortel were required to determine the final purchase price post-closing based upon the various purchase price adjustments included in the acquisition agreements. During the first quarter of fiscal 2011, the Company and Nortel agreed on a final purchase price of $933 million. The adjustment to the purchase price has been reflected in the allocation of the purchase price to the assets acquired and liabilities assumed in the Acquisition. The terms of the Acquisition do not include any significant contingent consideration arrangements. For the six months ended March 31,During fiscal 2010, acquisition costs of $19$20 million (unaudited) were expensed as incurred and during the years ended September 30, 2010 and 2009, $20 million and $29 million of acquisition costs were expensed as incurred, respectively.incurred.
The purchase price of NES and the payment of related fees and expenses (including integration expenses) were funded with (i) cash proceeds of $783 million received by Avaya from its issuance of $1,000 million in aggregate principal amount of term loans and detachable warrants to purchase up to 61.5 million shares of common stock, (see Note 9, “Financing Arrangements”),and (ii) proceeds of $125 million received from the issuance of Series A preferred stock and warrants to purchase up to 38.5 million shares of common stock (see Note 15, “Capital Stock”), and (iii) $112approximately $237 million of Avaya’s existing cash.
Funds affiliated with Silver Lake and TPG purchased an aggregate of $78 million of Series A preferred stock, with each sponsor-affiliated group of investors investing $39 million of such amount. In consideration for such investment, the Silver Lake and TPG funds received an aggregate of 77,728 shares of Series A preferred stock and warrants to purchase 23,916,384 shares of common stock at an exercise price of $3.25 per share.
The acquisition of NES has been accounted for under the acquisition method, which requires an allocation of the purchase price of the acquired entity to the assets acquired and liabilities assumed based on their estimated fair values from a market-participant perspective at the date of acquisition. The allocation of the purchase price has been finalized as of December 18, 2010 as reflected within these consolidated financial statements.Consolidated Financial Statements. The fair values of the assets acquired and liabilities assumed were determined using the income, cost, and market approaches. The fair values of acquired technologies and customer relationships were estimated using the income approach, which values the subject asset using the projected cash flows to be generated by the asset, discounted at a required rate of return that reflects the relative risk of achieving the cash flow and the time value of money.approach. The cost approach was used to estimate the fair values of plant, property plant, and equipment and reflects the
estimated reproduction or replacement cost for the asset, less an allowance for loss in value due to depreciation.equipment. The market approach was utilized in combination with the income approach to estimate the fair values of most working capital accounts.
The following table summarizes the consideration paid and the allocation of the purchase price to the assets acquired and the liabilities assumed in the acquisition based on their estimated fair values as of the close of the acquisition.
In millions | ||||
Cash and cash equivalents | $ | 38 | ||
Accounts receivable | 47 | |||
Inventory | 115 | |||
Property, plant and equipment | 103 | |||
Intangible assets | 476 | |||
Accounts payable | (17 | ) | ||
Payroll and benefit obligations | (124 | ) | ||
Deferred revenue | (79 | ) | ||
Other assets and liabilities | (51 | ) | ||
|
| |||
Net assets acquired | 508 | |||
Goodwill | 425 | |||
|
| |||
Purchase price | $ | 933 | ||
|
| |||
Adjustments to the preliminary purchase price allocation were made to reflect revised estimates of the fair values of the assets acquired and liabilities assumed at December 18, 2009. The most significant revisions were associated with valuations of property, plant and equipment and identifiable intangible assets, and the resulting changes to goodwill. Providing for these adjustments in previous periods would have had an immaterial impact on the reported operating results for the three month periods ended December 31, 2009, March 31, 2010 and June 30, 2010 and therefore such amounts were recorded in the quarter in which the adjustments were identified.
Intangible assets includeincluded existing technologies of $188 million and customer relationships of $288 million, respectively. The existing technologies and customer relationships are being amortized over a weighted average useful life of five years and twelve years, respectively, on a straight-line basis. No in-process research and development was acquired in the Acquisition.
The excess of the purchase price over the net tangible and intangible assets acquired resulted in goodwill of $425 million which is attributable to the synergies and economies of scale provided to a market participant including marketing efforts principally located within the Company’s primary operating jurisdiction. The tax-deductible portion of goodwill was $383 million.
In connection with the acquisition of NES, management has identified certain technologies that were acquired, that, based on their functionality, overlapped the Company’s pre-existing technologies. In order to take advantage of synergies and reduce expenditures on research and development and marketing, management identified certain pre-existing technologies associated with the Company’s Global Communications Solutions segment which it no longer aggressively developeddevelops and marketed and will eventually phase out.markets. The net book value of these technologies was $16 million and, based on management’s plans, these technologies havehad a minimal estimated net realizable value. The Company had recorded an impairment charge of $16 million in the three months ended December 31, 2009 to reflect these technologies at their net realizable values.
These consolidated financial statementsConsolidated Financial Statements include the operating results of the NES business as of December 19, 2009. Revenues specific to the NES business for the period December 19, 2009 through
September 30, 2010 were $1,247 million. As the Company has begunbegan eliminating overlapping processes and expenses and integrating its products and sales efforts with those of the acquired NES business upon acquisition, it is impractical to determine the earnings specific to the NES business for the period December 19, 2009 through September 30, 2010, included in the Consolidated Statement of Operations.
Unaudited Pro Forma Financial Information
The following unaudited pro forma financial information presents certain information of the combined results of operations of the Company as though the Acquisition and related financing had been consummated as of the beginning of the periods presented. The unaudited pro forma financial information reflects certain adjustments associated with the Acquisition and related financing, including increases in amortization and depreciation expenses related to intangible assets and property, plant and equipment acquired, additional interest expense associated with the financing relating to the Acquisition and incremental employee compensation costs. No adjustments to the unaudited pro forma financial information have been made related to conforming Avaya and NES accounting policies. The unaudited pro forma financial information is not necessarily indicative of the results of operations that would have been realized if the Acquisition and related financing were completed on October 1, 2009, and October 1, 2008, nor is it indicative of future operating results.
The following unaudited pro forma financial information for the fiscal year ended September 30, 2010 combines the historical results of Avaya for the fiscal year ended September 30, 2010 and the historical results of NES for the period October 1 to December 18, 2009, and the effects of the pro forma adjustments listed above. The unaudited pro forma financial information for the fiscal year ended September 30, 2009 combined the historical results of Avaya and NES for the fiscal year ended September 30, 2009, and the effects of the pro forma adjustments listed above. The unaudited pro forma financial information for the six months ended March 31, 2010 combines the historical results of Avaya for the six months ended March 31, 2010 and the historical results of NES for the period October 1 to December 18, 2009, and the effects of the pro forma adjustments listed above.
In millions | ||||
Revenue | $ | 5,476 | ||
Net loss | $ | (1,004 | ) | |
Other Acquisitions
During fiscal 2012 and 2011, the Company completed several other acquisitions primarily to enhance the Company’s technology portfolio. The acquisitions have been accounted for under the acquisition method.
The unauditedaggregate purchase price of the other acquisitions completed by the Company was $36 million during fiscal 2012. On January 3, 2011, the Company acquired all outstanding shares of Konftel AB (“Konftel”), for $14 million in cash consideration, inclusive of a working capital adjustment. Konftel is a Swedish-based vendor of conference room terminals, offering analog, internet protocol, soft, cellular, and session initiation protocol terminals.
Intangible assets include acquired technologies of $20 million during fiscal 2012. The acquired technologies are being amortized over a weighted average useful life of five years, on a straight-line basis. No in-process research and development was acquired in the acquisitions.
The excess of the purchase price over the preliminary assessment of the net tangible and intangible assets acquired in connection with these other acquisitions during fiscal 2012 resulted in goodwill of $15 million. The premiums paid by the Company in the transactions are largely attributable to the acquisition of assembled workforces and the synergies and economies of scale provided to a market participant, particularly as it pertains to marketing efforts and customer base. None of the goodwill is deductible for tax purposes.
These Consolidated Financial Statements include the operating results of the acquired entities since their respective acquisition dates. The revenues and expenses specific to these businesses and their pro forma financial information for the fiscal year ended September 30, 2010 and 2009 and for the six months ended March 31, 2010 was as follows:results are not material to these Consolidated Financial Statements.
| Fiscal years ended September 30, | Six months ended March 31, | |||||||||||
In millions | 2009 | 2010 | 2010 | |||||||||
Revenue | $ | 6,259 | $ | 5,476 | $ | 2,796 | ||||||
Net loss | $ | (1,991 | ) | $ | (1,004 | ) | $ | (551 | ) | |||
Sale of AGC Networks Ltd.
On May 30, 2010, Avaya entered into a Share Purchase Agreement with Essar Services Holdings Limited (“Essar”) to sell its 59.13% ownership interest in AGC Networks Limited (formerly Avaya GlobalConnect Ltd.) (“AGC”), a publicly-traded Indian reseller of the Company’s products and services in the Indian and Australian markets, for $44.5 million in cash. The sale was consummated August 31, 2010. As a result of the sale,2010 and a $7 million gain was recognized and included in other income, net.
net in fiscal 2010. The assets and liabilities of AGC sold are as follows and were not reduced for noncontrolling interest:
In millions | ||||
ASSETS SOLD | ||||
Cash and cash equivalents | $ | 13 | ||
Accounts receivable | 25 | |||
Inventory | 5 | |||
Property, plant and equipment | 5 | |||
Goodwill | 36 | |||
Other | 32 | |||
|
| |||
| $ | 116 | |||
|
| |||
LIABILITIES SOLD | ||||
Accounts payable | $ | 14 | ||
Payroll and benefit obligations | 4 | |||
Other | 14 | |||
|
| |||
| $ | 32 | |||
|
| |||
Other Acquisitions
Acquisition of Konftel AB (unaudited)
On January 3, 2011, the Company acquired all outstanding shares of Konftel AB (“Konftel”), for $14 million in cash consideration, inclusive of a working capital adjustment. Konftel is a Swedish-based vendor of conference room terminals, offering analog, internet protocol, soft, cellular and session initiation protocol terminals.
The acquisition of Konftel has been accounted for under the acquisition method, which requires an allocation of the purchase price of the acquired entity to the assets acquired and liabilities assumed based on their estimated fair values from a market-participant perspective at the date of acquisition. The allocation of the purchase price as reflected within these consolidated financial statements is based on the best information available to management at the time these consolidated financial statements were issued and is provisional pending the completion of the valuation analysis of Konftel’s assets and liabilities. During the measurement period (which is not to exceed one-year from the acquisition date), the Company will be required to retrospectively adjust the provisional amounts recognized to reflect new information obtained about facts and circumstances that existed as of the acquisition date that, if known, would have affected the measurement of the amounts recognized as of that date. Further, during the measurement period, the Company is also required to recognize additional assets or liabilities if new information is obtained about facts and circumstances that existed as of the acquisition date that, if known, would have resulted in the recognition of those assets or liabilities as of that date.
The fair values of the assets acquired and liabilities assumed were preliminarily determined using the income and market approaches. The fair values of acquired technologies and customer relationships were estimated using the income approach which values the subject asset using the projected cash flows to be generated by the asset, discounted at a required rate of return that reflects the relative risk of achieving the cash flow and the time value of money. The market approach was utilized in combination with the income approach to estimate the fair values of most working capital accounts.
The following table summarizes the consideration paid and the preliminary allocation of the purchase price to the assets acquired and the liabilities assumed in the acquisition based on their estimated fair values as of the close of the acquisition:
In millions | ||||
Accounts receivable | $ | 5 | ||
Inventory | 2 | |||
Intangible assets | 5 | |||
Accounts payable | (2 | ) | ||
Payroll and benefit obligations | (1 | ) | ||
Net assets acquired | 9 | |||
Goodwill | 5 | |||
Purchase price | $ | 14 | ||
Intangible assets include existing technologies of $3 million and customer relationships of $2 million, respectively. The existing technologies and customer relationships are being amortized over a weighted average useful life of 5 years, on a straight-line basis. No in-process research and development was acquired in the Konftel acquisition. Pro forma financial information was not prepared as the acquisition was not material.
The excess of the purchase price over the net tangible and intangible assets acquired resulted in goodwill of $5 million. The premiums paid by the Company in the transaction are largely attributable to the acquisition of an assembled workforce and the synergies and economies of scale provided to a market participant, particularly as it pertains to marketing efforts and customer base. None of the goodwill is deductible for tax purposes.
Adomo, Inc.
On July 24, 2009, Avaya acquired all outstanding shares of Adomo, Inc. (“Adomo”) for $11 million, net of cash acquired. Adomo developed and held the rights to certain unified messaging solutions which Avaya intends to further develop and incorporate into future product lines. The purchase price was allocated to the net assets acquired based on their estimated fair values which included $12 million of IPRD, the fair value of which was determined using a royalty savings method. This technology is anticipated to benefit the Company when completed in fiscal 2011 after additional development and testing. At the time of acquisition, these technologies were in the development stages and did not meet the technological feasibility standard necessary for capitalization. In accordance with authoritative guidance on business combinations, these amounts were charged to the Consolidated Statements of Operations at the date of the acquisition. No goodwill was recognized in connection with this acquisition.
5. Goodwill
Goodwill is not amortized but is subject to periodic testing for impairment in accordance with ASC 350 at the reporting unit level which is one level below the Company’s operating segments. The test for impairment is conducted annually each September 30th or when events occur or circumstances change indicating that the fair value of a reporting unit may be below its carrying amount. The Company determined that no events occurred or circumstances changed during the six months ended March 31, 2011 and 2010 (unaudited) that would indicate that the fair value of a reporting unit may be below its carrying amount.
The impairment test for goodwill is a two-step process. Step one consists of a comparison of the fair value of a reporting unit with its carrying amount, including the goodwill allocated to that reporting unit. The Company estimated the fair value of each reporting unit using an income approach which values the unit based on the future cash flows expected from that reporting unit. Future cash flows are based on forward-looking information regarding market share and costs for each reporting unit and are discounted using an appropriate discount rate.
Future discounted cash flows can be affected by changes in industry or market conditions or the rate and extent to which anticipated synergies or cost savings are realized with newly acquired entities. In step one of the test, a market approach was used as a reasonableness test but was not given significant weighting in the final determination of fair value.
The discounted cash flows model used in the Company’s income approach relies on assumptions regarding revenue growth rates, gross margin, percentages, projected working capital needs, selling, general and administrative expenses, research and development expenses, business restructuring costs, capital expenditures, income tax rates, discount rates and terminal growth rates. To estimate fair value, the Company discounts the expected cash flows of each reporting unit. The discount rate Avaya uses represents the estimated weighted average cost of capital, which reflects the overall level of inherent risk involved in its reporting unit operations and the rate of return an outside investor would expect to earn. To estimate cash flows beyond the final year of its model, Avaya uses a terminal value approach. Under this approach, Avaya uses the estimated cash flows in the final year of its models and applies a perpetuity growth assumption and discountdiscounts by a perpetuity discount factor to determine the terminal value. Avaya incorporates the present value of the resulting terminal value into its estimate of fair value.
The Company forecasted cash flows for each of its reporting units and took into consideration current economic conditions and trends, estimated future operating results, Avaya’s view of growth rates and anticipated future economic conditions. Revenue growth rates inherent in this forecast are based on input from internal and external market intelligence research sources that compare factors such as growth in global economies, regional trends in the telecommunications industry and product evolution from a technological segment basis. Macro economic factors such as changes in economies, product evolutions, industry consolidations and other changes beyond Avaya’s control could have a positive or negative impact on achieving its targets.
September 30, 2012
At September 30, 2012, the Company performed its annual goodwill impairment test and determined that the respective book values of the Company’s reporting units did not exceed their estimated fair values and therefore no impairment existed.
March 31, 2012
During the three months ended March 31, 2012, the Company experienced a decline in revenue as compared to the same period of the prior year and sequential quarters. This revenue decline impacted the Company’s forecasts for the remainder of fiscal 2012. As a result of these events, the Company determined that an interim impairment test of its long-lived assets and goodwill should be performed.
The estimated fair value of each reporting unit at March 31, 2012 reflected the additional market risks, lower discount rates and the updated sales forecasts for the Company’s reporting units based off recent results. Using the revised valuations at March 31, 2012 the results of step one of the goodwill impairment test indicated that although the estimated fair values of each reporting unit were lower at March 31, 2012 when compared to September 30, 2011, their respective book values did not exceed their estimated fair values and therefore no impairment existed.
September 30, 2011 and 2010
At September 30, 2011 and 2010, the Company performed its annual goodwill impairment test and determined that the respective book values of the Company’s reporting units did not exceed their estimated fair values and that it was not necessary to recordtherefore no impairment charges.existed.
June 30, 2010
Upon classification of the AGC business, which represents a portion of certain Global Communication Solutions (“GCS”) and Avaya Global Services (“AGS”) reporting units, as held for sale, the Company tested the goodwill remaining in the portion of the reporting units to be retained for impairment, as of May 31, 2010, in accordance with the authoritative guidance. Based on this goodwill impairment test, the Company determined that the respective book values for these reporting units did not exceed their estimated fair values and goodwill was not impaired. Excluding the AGC transaction, which requires that goodwill be tested for impairment, the Company determined that no events occurred or circumstances changed during the nine months ended June 30, 2010 that would indicate that the fair value of a reporting unit may be below its carrying amount.
September 30, 2009
At September 30, 2009, the Company performed its annual goodwill impairment test and determined that the respective book values of the Company’s reporting units did not exceed their estimated fair values and that it was not necessary to record impairment charges.
March 31, 2009
During the three months ended March 31, 2009, the global economic downturn experienced during fiscal 2008 continued and negatively affected most markets beyond the Company’s expectations utilized in its annual
testing of goodwill at September 30, 2008. Several of the Company’s customers and competitors reduced their financial outlooks or disclosed that they were experiencing very challenging market conditions with little visibility of a rebound. Indications were that companies were not willing to spend on enterprise communications technology, and the revenue growth experienced in previous years was not expected in the near term. As demonstrated by the Company’s results, the demand for products fell as revenues for the six months ended March 31, 2009 were down when compared to the same period of the prior year. Cutbacks in spending, access to credit, employment variability, corporate profit growth, interest rates, energy prices, and other factors in specific markets were expected to further impact customer willingness to spend on communications technology in the near term. In March 2009, in response to these adverse business indicators, and the rapidly declining revenue trends experienced during the second quarter of the 2009 fiscal year, the Company reduced its near and long term financial projections. As a result of the deteriorating business climate during the second quarter of fiscal 2009, the Company determined that goodwill and long-lived assets should be tested for impairment.
The results from step one of the goodwill impairment test indicated that the estimated fair value of two GCS reporting units was less than the respective carrying value of its net assets (including goodwill) as of March 31, 2009 and as such the Company performed step two of the impairment test for these reporting units. The second step of the goodwill impairment test compares the implied fair value of the reporting unit’s goodwill with the carrying value of that goodwill. If the carrying amount of the reporting unit’s goodwill exceeds the implied fair value of that goodwill, an impairment loss is recognized in an amount equal to that excess. The implied fair value of the goodwill is determined in the same manner as the amount of goodwill recognized in a business combination. That is, the fair value of the reporting unit is allocated to all of the assets and liabilities of that unit as if the reporting unit had been acquired in a business combination and the fair value of the reporting unit was the purchase price paid to acquire the reporting unit.
During the three months ended March 31, 2009, the Company recorded an impairment to goodwill of $235 million associated with these GCS reporting units. The impairment was primarily the result of the continued weakness in the global economy. The reduced valuation of the affected reporting unit reflects the additional market risks, higher discount rates and the lower sales forecasts for the Company’s GCS product lines, which is consistent with economic trends at that time. The allocation discussed above is performed only for purposes of assessing goodwill for impairment; accordingly Avaya did not adjust the net book value of the assets and liabilities on its Consolidated Balance Sheets other than goodwill as a result of this process.
September 30, 2008
For the period October 27, 2007 through September 30, 2008, the Company recorded an impairment to goodwill of $899 million associated with the GCS segment. The impairment was primarily the result of the weakness in the economy, particularly in the U.S. The reduced valuation of the affected reporting units reflects the additional market risks, higher discount rates and the lower sales forecasts for the Company’s GCS product lines consistent with economic trends.
The changes in the carrying amount of goodwill by operating segment are as follows:
In millions | Global Communications Solutions | Data Networking | Avaya Global Services | Total | ||||||||||||
September 30, 2008 | $ | 1,469 | $ | — | $ | 2,487 | $ | 3,956 | ||||||||
Impairment | (235 | ) | — | — | (235 | ) | ||||||||||
Adjustments | (16 | ) | — | (10 | ) | (26 | ) | |||||||||
September 30, 2009 | 1,218 | — | 2,477 | 3,695 | ||||||||||||
Acquisition of NES | 219 | — | 206 | 425 | ||||||||||||
Goodwill allocated to AGC | (13 | ) | — | (23 | ) | (36 | ) | |||||||||
Adjustments | (3 | ) | — | (6 | ) | (9 | ) | |||||||||
September 30, 2010 | 1,421 | — | 2,654 | 4,075 | ||||||||||||
Acquisition of Konftel AB | 5 | — | — | 5 | ||||||||||||
Adjustments | — | — | (1 | ) | (1 | ) | ||||||||||
Impact of foreign currency fluctuations | 1 | — | — | 1 | ||||||||||||
March 31, 2011 (unaudited) | $ | 1,427 | $ | — | $ | 2,653 | $ | 4,080 | ||||||||
Balance as of September 30, 2010: | ||||||||||||||||
Goodwill | $ | 2,555 | $ | — | $ | 2,654 | $ | 5,209 | ||||||||
Accumulated impairment | (1,134 | ) | — | — | (1,134 | ) | ||||||||||
| $ | 1,421 | $ | — | $ | 2,654 | $ | 4,075 | |||||||||
Balance as of March 31, 2011 (unaudited) : | ||||||||||||||||
Goodwill | $ | 2,561 | $ | — | $ | 2,653 | $ | 5,214 | ||||||||
Accumulated impairment | (1,134 | ) | — | — | (1,134 | ) | ||||||||||
| $ | 1,427 | $ | — | $ | 2,653 | $ | 4,080 | |||||||||
In millions | Global Communications Solutions | Networking | Avaya Global Services | Total | ||||||||||||
Balance as of October 1, 2010 | $ | 1,421 | — | $ | 2,654 | $ | 4,075 | |||||||||
Acquisitions | 7 | — | — | 7 | ||||||||||||
Adjustments | (2 | ) | — | (1 | ) | (3 | ) | |||||||||
|
|
|
|
|
|
|
| |||||||||
Balance as of September 30, 2011 | 1,426 | — | $ | 2,653 | 4,079 | |||||||||||
Acquisitions | 86 | — | 25 | 111 | ||||||||||||
Adjustments | (1 | ) | — | (1 | ) | (2 | ) | |||||||||
|
|
|
|
|
|
|
| |||||||||
Balance as of September 30, 2012 | $ | 1,511 | $ | — | $ | 2,677 | $ | 4,188 | ||||||||
|
|
|
|
|
|
|
| |||||||||
Balance as of September 30, 2012: | ||||||||||||||||
Goodwill | $ | 2,645 | $ | — | $ | 2,677 | $ | 5,322 | ||||||||
Accumulated Impairment | (1,134 | ) | — | — | (1,134 | ) | ||||||||||
|
|
|
|
|
|
|
| |||||||||
| $ | 1,511 | $ | — | $ | 2,677 | $ | 4,188 | |||||||||
|
|
|
|
|
|
|
| |||||||||
“Adjustments” substantially pertain to the reversal of business restructuring reserves, and tax valuation allowances.allowances, and the impact of foreign currency fluctuations.
6. Intangible Assets
Intangible assets include acquired technology, customer relationships, trademarks and trade namestrade-names and other intangibles. Intangible assets with finite lives are amortized using the straight-line method over the estimated economic lives of the assets, which range from fivetwo to fifteen years.
The Company’s intangible assets consist of:
In millions | Acquired technology and patents | Customer relationships and other intangibles | Trademarks and trade names | Total | Acquired technology and patents | Customer relationships and other intangibles | Trademarks and trade names | Total | ||||||||||||||||||||||||
Gross Carrying Amount | $ | 1,183 | $ | 1,970 | $ | 545 | $ | 3,698 | $ | 1,366 | $ | 2,261 | $ | 545 | $ | 4,172 | ||||||||||||||||
Accumulated Amortization | (486 | ) | (386 | ) | — | (872 | ) | (1,025 | ) | (828 | ) | — | (1,853 | ) | ||||||||||||||||||
Accumulated Impairment | — | — | (190 | ) | (190 | ) | — | — | (190 | ) | (190 | ) | ||||||||||||||||||||
|
|
|
| |||||||||||||||||||||||||||||
September 30, 2009 | $ | 697 | $ | 1,584 | $ | 355 | $ | 2,636 | ||||||||||||||||||||||||
Balance as of September 30, 2011 | $ | 341 | $ | 1,433 | $ | 355 | $ | 2,129 | ||||||||||||||||||||||||
|
|
|
| |||||||||||||||||||||||||||||
Gross Carrying Amount | $ | 1,371 | $ | 2,258 | $ | 545 | $ | 4,174 | $ | 1,415 | $ | 2,272 | $ | 546 | $ | 4,233 | ||||||||||||||||
Accumulated Amortization | (777 | ) | (604 | ) | — | (1,381 | ) | (1,215 | ) | (1,053 | ) | — | (2,268 | ) | ||||||||||||||||||
Accumulated Impairment | — | — | (190 | ) | (190 | ) | — | — | (190 | ) | (190 | ) | ||||||||||||||||||||
|
|
|
| |||||||||||||||||||||||||||||
September 30, 2010 | $ | 594 | $ | 1,654 | $ | 355 | $ | 2,603 | ||||||||||||||||||||||||
Balance as of September 30, 2012 | $ | 200 | $ | 1,219 | $ | 356 | $ | 1,775 | ||||||||||||||||||||||||
|
|
|
| |||||||||||||||||||||||||||||
Gross Carrying Amount | $ | 1,368 | $ | 2,261 | $ | 545 | $ | 4,174 | ||||||||||||||||||||||||
Accumulated Amortization | (901 | ) | (716 | ) | — | (1,617 | ) | |||||||||||||||||||||||||
Accumulated Impairment | — | — | (190 | ) | (190 | ) | ||||||||||||||||||||||||||
Balance as of March 31, 2011 (unaudited) | $ | 467 | $ | 1,545 | $ | 355 | $ | 2,367 | ||||||||||||||||||||||||
Long-lived assets, including intangible assets with finite lives, are reviewed for impairment whenever events or changes in circumstances indicate that the carrying amount of such assets may not be recoverable. Intangible assets determined to have indefinite useful lives are not amortized but are tested for impairment annually, or more frequently if events or changes in circumstances indicate the asset may be impaired. The Company determined that no events occurred or circumstances changed during the six months ended March 31, 2011 (unaudited) that would indicate that its indefinite-lived intangible assets may be impaired.
The Company’s trademarks and trade names are expected to generate cash flows indefinitely. Consequently, these assets arewere classified as indefinite-lived intangibles.
intangibles and accordingly are not amortized but reviewed for impairment annually, or sooner under certain circumstances. Prior to the goodwill testing discussed above, the Company tested its intangible assets with indefinite lives in accordance with ASC 360-10-35. ASC 360-10-35lives. The test for impairment requires thatthe Company to compare the fair value of its indefinite-lived intangible assets with indefinite lives be compared to the carrying value of those assets. In situations where the carrying value exceeds the fair value of the intangible asset, an impairment loss equal to the difference is recognized. The Company estimates the fair value of its indefinite-lived intangible assets using an income approach; specifically, based on discounted cash flows.
September 30, 2010 and 20092012
At September 30, 20102012, the Company performed its annual test of recoverability of indefinite-lived intangible assets. The Company determined that the respective book values of the Company’s indefinite-lived intangible assets did not exceed their estimated fair values and 2009,therefore no impairment existed.
March 31, 2012
Prior to the goodwill testing discussed above, the Company tested its intangible assets with indefinite lives and other long-lived assets as of March 31, 2012. Using the revised forecasts as of March 31, 2012, the Company performed step one of the impairment test of long-lived assets with finite lives. Although the revised forecasts provided for lower cash flows, in each case the revised undiscounted cash flows for each asset group were in excess of their respective net book values and therefore no impairment was identified. The Company estimates the fair value of its indefinite-lived intangible assets using an income approach; specifically, based on discounted cash flows. Although the estimated fair values of the Company’s tradenames and trademarks were lower at March 31, 2012 when compared to September 30, 2011, their respective book values did not exceed their estimated fair values and therefore no impairment existed.
September 30, 2011 and 2010
At September 30, 2011 and 2010, the Company performed annual tests of recoverability of indefinite-lived intangible assets. The Company determined that the respective book values of the Company’s indefinite-lived intangible assets did not exceed their estimated fair values and that it was not necessary to recordtherefore no impairment charges.
March 31, 2009
The Company determined that the continued deterioration in the business climate discussed above was also an indicator requiring the interim testing of its long-lived assets and performed the appropriate testing as of March 31, 2009.
The estimated fair values of the Company’s indefinite-lived intangible assets using the discounted cash flows model was $355 million and accordingly, the Company recorded an impairment charge of $60 million related to trademark and trade name indefinite-lived intangible assets during the three months ended March 31, 2009. The impairment is predominantly the result of the weakness in the global economy that existed at that
time. The reduced valuation of these intangible assets reflects the additional market risks, higher discount rates and the lower sales forecasts associated with these indefinite-lived intangible assets consistent with economic trends that existed at that time.
September 30, 2008
At September 30, 2008, the Company estimated the fair value of its indefinite-lived intangible assets, using the discounted cash flows model, at $415 million. Accordingly, the Company recorded an impairment charge of $130 million related to trademark and trade name indefinite-lived intangible assets for the period October 27, 2007 through September 30, 2008. The impairment is predominantly the result of the weakness in the economy, particularly in the U.S. that existed at that time. The reduced valuation of these intangible assets reflects the additional market risks, higher discount rates and the lower sales forecasts associated with these indefinite-lived intangible assets consistent with economic trends that existed at that time.existed.
Future amortization expense of intangible assets for the years ending September 30 is as follows:
In millions | Estimated future amortization expense | |||||||
2011 | $ | 481 | ||||||
2012 | 407 | |||||||
2013 | 275 | $ | 290 | |||||
2014 | 265 | 279 | ||||||
2015 | 242 | 255 | ||||||
2016 and thereafter | 578 | |||||||
2016 | 248 | |||||||
2017 and thereafter | 348 | |||||||
| ||||||||
Total | $ | 2,248 | $ | 1,420 | ||||
| ||||||||
7. Supplementary Financial Information
Consolidated Statements of Operations Information
| Predecessor | Successor | |||||||||||||||||||||||||||||||||||||||
| Period from October 1, 2007 through October 26, 2007 | ||||||||||||||||||||||||||||||||||||||||
| Years ended September 30, | Six months ended March 31, | Fiscal years ended September 30, | ||||||||||||||||||||||||||||||||||||||
In millions | 2008 | 2009 | 2010 | 2010 | 2011 | 2012 | 2011 | 2010 | ||||||||||||||||||||||||||||||||
| (unaudited) | ||||||||||||||||||||||||||||||||||||||||
DEPRECIATION AND AMORTIZATION | ||||||||||||||||||||||||||||||||||||||||
Amortization of software development costs included in costs | $ | 5 | $ | 6 | $ | 32 | $ | 42 | 21 | 23 | $ | 36 | $ | 39 | $ | 42 | ||||||||||||||||||||||||
Amortization of intangible assets | 5 | 418 | 455 | 509 | 249 | 245 | 417 | 483 | 509 | |||||||||||||||||||||||||||||||
Depreciation and amortization of property, plant and equipment and internal use software included in costs and operating expenses | 13 | 192 | 165 | 140 | 72 | 67 | 111 | 131 | 140 | |||||||||||||||||||||||||||||||
|
|
| ||||||||||||||||||||||||||||||||||||||
Total depreciation and amortization | $ | 23 | $ | 616 | $ | 652 | $ | 691 | $ | 342 | $ | 335 | $ | 564 | $ | 653 | $ | 691 | ||||||||||||||||||||||
|
|
| ||||||||||||||||||||||||||||||||||||||
OTHER INCOME, NET | ||||||||||||||||||||||||||||||||||||||||
OTHER (EXPENSE) INCOME, NET | ||||||||||||||||||||||||||||||||||||||||
Interest income | $ | 5 | $ | 20 | $ | 6 | $ | 5 | $ | 3 | $ | 2 | $ | 3 | $ | 5 | $ | 5 | ||||||||||||||||||||||
(Loss) gain on foreign currency transactions and forward contracts | (1 | ) | 15 | 8 | (1 | ) | 2 | 9 | (21 | ) | 12 | (1 | ) | |||||||||||||||||||||||||||
Third-party fees incurred in connection with debt modification | — | — | — | — | — | (9 | ) | |||||||||||||||||||||||||||||||||
Third party fees incurred in connection with debt modification | — | (9 | ) | — | ||||||||||||||||||||||||||||||||||||
Gain on sale of AGC | — | — | — | 7 | — | — | — | — | 7 | |||||||||||||||||||||||||||||||
Change in fair value of Preferred Series B embedded derivative | (6 | ) | — | — | ||||||||||||||||||||||||||||||||||||
Securities registration fees | (3 | ) | — | — | ||||||||||||||||||||||||||||||||||||
Other, net | (3 | ) | (8 | ) | — | 4 | — | (1 | ) | (2 | ) | (3 | ) | 4 | ||||||||||||||||||||||||||
|
|
| ||||||||||||||||||||||||||||||||||||||
Total other income, net | $ | 1 | $ | 27 | $ | 14 | $ | 15 | $ | 5 | $ | 1 | ||||||||||||||||||||||||||||
Total other (expense) income, net | $ | (29 | ) | $ | 5 | $ | 15 | |||||||||||||||||||||||||||||||||
|
|
| ||||||||||||||||||||||||||||||||||||||
Consolidated Balance Sheet Information
| Predecessor | Successor | |||||||||||||||||||||||||||||||
| Period from October 1, 2007 through October 26, 2007 | Years ended September 30, | |||||||||||||||||||||||||||||||
| Fiscal years ended September 30, | ||||||||||||||||||||||||||||||||
In millions | 2008 | 2009 | 2010 | 2012 | 2011 | 2010 | ||||||||||||||||||||||||||
VALUATION AND QUALIFYING ACCOUNTS | ||||||||||||||||||||||||||||||||
Allowance for Accounts Receivable: | ||||||||||||||||||||||||||||||||
Balance at beginning of period | $ | 59 | $ | 65 | $ | 58 | $ | 49 | ||||||||||||||||||||||||
Balance at beginning of year | $ | 28 | $ | 39 | $ | 49 | ||||||||||||||||||||||||||
Charged to expense | 6 | — | (3 | ) | — | (2 | ) | (7 | ) | — | ||||||||||||||||||||||
Deductions | — | (7 | ) | (6 | ) | (10 | ) | (2 | ) | (4 | ) | (10 | ) | |||||||||||||||||||
|
|
| ||||||||||||||||||||||||||||||
Balance at end of period | $ | 65 | $ | 58 | $ | 49 | $ | 39 | ||||||||||||||||||||||||
Balance at end of year | $ | 24 | $ | 28 | $ | 39 | ||||||||||||||||||||||||||
|
|
| ||||||||||||||||||||||||||||||
Deferred Tax Asset Valuation Allowance: | ||||||||||||||||||||||||||||||||
Balance at beginning of period | $ | 149 | $ | 182 | $ | 185 | $ | 738 | ||||||||||||||||||||||||
Charged to expense | 2 | 3 | 193 | 330 | ||||||||||||||||||||||||||||
Additions | — | — | 360 | 26 | ||||||||||||||||||||||||||||
Balance at end of period | $ | 151 | $ | 185 | $ | 738 | $ | 1,094 | ||||||||||||||||||||||||
In millions Deferred Tax Asset Valuation Allowance: Balance at beginning of year Charged to expense Additions Balance at end of year Fiscal years ended
September 30, 2012 2011 2010 $ 1,410 $ 1,094 $ 738 60 238 330 57 78 26 $ 1,527 $ 1,410 $ 1,094
| September 30, | ||||||||||||||||||||
In millions | September 30, 2009 | September 30, 2010 | March 31, 2011 | 2012 | 2011 | |||||||||||||||
| (unaudited) | ||||||||||||||||||||
PROPERTY, PLANT AND EQUIPMENT, NET | ||||||||||||||||||||
Land and improvements | $ | 35 | $ | 37 | $ | 38 | $ | 17 | $ | 38 | ||||||||||
Buildings and improvements | 247 | 279 | 287 | 270 | 296 | |||||||||||||||
Machinery and equipment | 183 | 247 | 263 | 275 | 260 | |||||||||||||||
Rental equipment | 143 | 157 | 165 | 192 | 164 | |||||||||||||||
Assets under construction | 4 | 3 | 2 | 16 | 2 | |||||||||||||||
Internal use software | 108 | 129 | 132 | 127 | 120 | |||||||||||||||
|
| |||||||||||||||||||
Total property, plant and equipment | 720 | 852 | 887 | 897 | 880 | |||||||||||||||
Less: Accumulated depreciation and amortization | (301 | ) | (402 | ) | (464 | ) | (533 | ) | (483 | ) | ||||||||||
|
| |||||||||||||||||||
Property, plant and equipment, net | $ | 419 | $ | 450 | $ | 423 | $ | 364 | $ | 397 | ||||||||||
|
| |||||||||||||||||||
Included in buildings and improvements are $24is $21 million and $22 million (unaudited) at September 30, 2010 and March 31, 2011, respectively, under a capital lease related to an office facility acquired in the Acquisition.acquisition of NES and $4 million in a capital lease for equipment the Company entered into during fiscal 2012.
| September 30, | ||||||||||||||||||||||||
In millions | September 30, 2009 | September 30, 2010 | March 31, 2011 | 2012 | 2011 | 2010 | ||||||||||||||||||
| (unaudited) | ||||||||||||||||||||||||
ACCUMULATED OTHER COMPREHENSIVE LOSS | ||||||||||||||||||||||||
Change in unamortized pension, postretirement and postemployment benefit-related items, net of tax | $ | (827 | ) | $ | (1,014 | ) | $ | (996 | ) | $ | (1,109 | ) | $ | (1,111 | ) | $ | (1,014 | ) | ||||||
Foreign currency translation | (95 | ) | (28 | ) | (49 | ) | (13 | ) | (50 | ) | (28 | ) | ||||||||||||
Unrealized loss on term loan interest rate swap | (82 | ) | (37 | ) | (19 | ) | (3 | ) | (14 | ) | (37 | ) | ||||||||||||
Other | (4 | ) | (2 | ) | (1 | ) | (1 | ) | (3 | ) | (2 | ) | ||||||||||||
|
|
| ||||||||||||||||||||||
Accumulated other comprehensive loss | $ | (1,008 | ) | $ | (1,081 | ) | $ | (1,065 | ) | $ | (1,126 | ) | $ | (1,178 | ) | $ | (1,081 | ) | ||||||
|
|
| ||||||||||||||||||||||
Supplemental Cash Flow Information
| Predecessor | Successor | |||||||||||||||||||||||||||||||||||||||
| Period from October 1, 2007 through October 26, 2007 | Years ended September 30, | Six months ended March 31, | ||||||||||||||||||||||||||||||||||||||
| Fiscal years ended September 30, | ||||||||||||||||||||||||||||||||||||||||
In millions | 2008 | 2009 | 2010 | 2010 | 2011 | 2012 | 2011 | 2010 | ||||||||||||||||||||||||||||||||
| (unaudited) | ||||||||||||||||||||||||||||||||||||||||
OTHER PAYMENTS | ||||||||||||||||||||||||||||||||||||||||
Interest payments | $ | — | $ | 310 | $ | 348 | $ | 345 | $ | 167 | $ | 204 | $ | 416 | $ | 371 | $ | 345 | ||||||||||||||||||||||
Income tax payments | $ | 2 | $ | 39 | $ | 35 | $ | 39 | $ | 20 | $ | 23 | $ | 39 | $ | 44 | $ | 39 | ||||||||||||||||||||||
8. Business Restructuring Reserves and Programs
Fiscal 20112012 Restructuring Program (unaudited)
During fiscal 2012, the first six monthsCompany continued to identify opportunities to streamline operations and generate cost savings which include exiting facilities and eliminating employee positions. Restructuring charges associated with these initiatives include employee separation costs primarily associated with employee severance actions in Germany, as well as the US, Europe, Middle East and Africa (“EMEA”) excluding Germany, and Canada. Employee separation charges included $70 million related to an agreement reached with the works council representing employees of certain of Avaya’s German subsidiaries for the elimination of 327 positions. The headcount reductions identified in this action are expected to be completed in fiscal 2013 with the related payments to be completed in fiscal 2014. The payments include, but are not limited to, social pension fund payments and health care and unemployment insurance costs to be paid to or on behalf of the affected employees. The payments related to the headcount reductions for the other actions taken, globally, excluding Germany, are expected to be completed in fiscal 2015. As the Company continues to evaluate and identify additional operational synergies, additional cost saving opportunities may be identified.
The Company has initiated a plan to dispose of a Company owned facility in Munich, Germany and relocate to a new facility. Accordingly, the Company has written the value of this asset down to its net realizable value of $3 million and has reclassified this asset as held for sale. Included in restructuring and impairment charges, net in the Statement of Operations is an impairment charge of $5 million for fiscal 2012.
The following table summarizes the components of the fiscal 2012 restructuring program:
In millions | Employee Separation Costs | Lease Obligations | Total | |||||||||
2012 restructuring charges | $ | 123 | $ | 17 | $ | 140 | ||||||
Cash payments | (62 | ) | (4 | ) | (66 | ) | ||||||
Impact of foreign currency fluctuations | (3 | ) | (1 | ) | (4 | ) | ||||||
|
|
|
|
|
| |||||||
Balance as of September 30, 2012 | $ | 58 | $ | 12 | $ | 70 | ||||||
|
|
|
|
|
| |||||||
Fiscal 2011 Restructuring Program
During fiscal 2011, the Company continued to identify opportunities to streamline operations and generate cost savings which include exiting facilities and terminating employees.eliminating employee positions. Restructuring charges recorded during the six months ended March 31,fiscal 2011 associated with these initiatives, net of adjustments to previous periods, were $64$189 million and include employee separation costs primarily associated with employee severance actions in Germany, as well as in Europe, the Middle East and Africa (“EMEA”)EMEA and U.S. regions. The headcount reductionsEmployee separation charges includes $56 million associated with an agreement reached with the works council representing employees of certain of Avaya’s German subsidiaries for the elimination of 210 positions. Severance and relatedemployment benefits payments identified inassociated with this action are expected to be completed in fiscal 2011.2014, and include, but are not limited to, social pension fund payments and health care and unemployment insurance costs to be paid to or on behalf of the affected employees. Future rental payments, net of estimated sublease income, related to operating lease obligations for unused space in connection with the closing or consolidation of facilities are expected to continue through fiscal 2020. As the Company continues to evaluate and identify additional operational synergies, additional cost saving opportunities may be identified.
The following table summarizes the components of the fiscal 2011 restructuring program during the six months ended March 31, 2011:program:
In millions | Employee Separation Costs | Lease Obligations | Total | Employee Separation Costs | Lease Obligations | Total | ||||||||||||||||||
2011 restructuring charges | $ | 56 | $ | 11 | $ | 67 | $ | 155 | $ | 30 | $ | 185 | ||||||||||||
Cash payments | (9 | ) | (2 | ) | (11 | ) | (49 | ) | (6 | ) | (55 | ) | ||||||||||||
Impact of foreign currency fluctuations | 1 | — | 1 | (5 | ) | — | (5 | ) | ||||||||||||||||
|
|
| ||||||||||||||||||||||
Balance as of March 31, 2011 (unaudited) | $ | 48 | $ | 9 | $ | 57 | ||||||||||||||||||
Balance as of September 30, 2011 | 101 | 24 | 125 | |||||||||||||||||||||
Cash payments | (90 | ) | (7 | ) | (97 | ) | ||||||||||||||||||
Adjustments (1) | (2 | ) | 1 | (1 | ) | |||||||||||||||||||
Impact of foreign currency fluctuations | (1 | ) | (1 | ) | (2 | ) | ||||||||||||||||||
|
|
| ||||||||||||||||||||||
Balance as of September 30, 2012 | $ | 8 | $ | 17 | $ | 25 | ||||||||||||||||||
|
|
| ||||||||||||||||||||||
| (1) | Included in adjustments are changes in estimates, whereby all increases and decreases in costs related to the fiscal 2011 restructuring program are recored to the restructuring charges line item in operating expenses in the period of the adjustment. |
Fiscal 2010 Restructuring Program
During fiscal 2010, in response to the global economic climate and in anticipation ofconnection with the acquisition of NES,Acquisition, the Company began implementing initiatives designed to streamline the operations of the Company and generate cost savings and developed initiatives to eliminate overlapping processes and expenses associated with that acquisition.the Acquisition. During the second and third quarters of fiscal 2010, the Company exited certain facilities and terminatedseparated or relocated certain employees. Restructuring charges recorded during the fiscal year ended September 30, 2010, net of adjustments to previous periods, were $171 million, and include employee separation costs associated with involuntary employee severance actions primarily in EMEA and the U.S., as well as costs associated with closing and consolidating facilities. The headcount reductions and related payments identified in this action are expected to bethese actions were completed in fiscal 2011. Future rental payments, net of estimated sublease income, related to operating lease obligations for unused space in connection with the closing or consolidation of facilities are expected to continue through fiscal 2020.
The following table summarizes the components of the fiscal 2010 restructuring program:
In millions | Employee Separation Costs | Lease Obligations | Total | |||||||||
2010 restructuring charges | $ | 151 | $ | 24 | $ | 175 | ||||||
Reserves acquired with NES | — | 8 | 8 | |||||||||
Cash payments | (76 | ) | (8 | ) | (84 | ) | ||||||
Impact of foreign currency fluctuations | 1 | — | 1 | |||||||||
Balance as of September 30, 2010 | 76 | 24 | 100 | |||||||||
Cash payments | (53 | ) | (7 | ) | (60 | ) | ||||||
Adjustments(1) | (5 | ) | 1 | (4 | ) | |||||||
Impact of foreign currency fluctuations | — | (1 | ) | (1 | ) | |||||||
Balance as of March 31, 2011 (unaudited) | $ | 18 | $ | 17 | $ | 35 | ||||||
Fiscal 2009 Restructuring Program
During fiscal 2009, as a response to the global economic downturn, the Company began implementing initiatives designed to streamline the operations of the Company and generate cost savings, which include exiting facilities and terminating or relocating employees. Restructuring charges recorded during fiscal 2009 associated with these initiatives were $160 million and include employee separation costs primarily associated with involuntary employee severance actions in Germany, as well as in the EMEA and U.S. regions. The headcount reductions and related payments identified in this action are expected to be completed in fiscal 2011.2012. Future rental payments, net of estimated sublease income, related to operating lease obligations for unused space in connection with the closing or consolidation of facilities are expected to continue through fiscal 2020.
The Acquisition provided the Company with access to several proprietary technologies that previously were not available to Avaya. Some of these technologies, based on their functionality, overlapped with pre-existing technologies. In order to realize synergies and reduce expenditures on research and development and marketing, the number of technologies Avaya supports is being reduced. As a result, the Company identified certain technologies associated with its GCS products segment that are redundant to others that Avaya no longer aggressively develops and markets. Included in restructuring and impairment charges, net in the Statement of Operations is an impairment charge of $16 million in fiscal 2010 associated with these technologies.
The following table summarizes the components of the fiscal 20092010 restructuring program:
In millions | Employee Separation Costs | Lease Obligations | Total | Employee Separation Costs | Lease Obligations | Total | ||||||||||||||||||
2009 restructuring charges | $ | 151 | $ | 9 | $ | 160 | ||||||||||||||||||
2010 restructuring charges | $ | 151 | $ | 24 | $ | 175 | ||||||||||||||||||
Reserves acquired with NES | — | 8 | 8 | |||||||||||||||||||||
Cash payments | (44 | ) | (1 | ) | (45 | ) | (76 | ) | (8 | ) | (84 | ) | ||||||||||||
Impact of foreign currency fluctuations | 5 | — | 5 | |||||||||||||||||||||
Balance as of September 30, 2009 | 112 | 8 | 120 | |||||||||||||||||||||
Cash payments | (88 | ) | (3 | ) | (91 | ) | ||||||||||||||||||
Adjustments (1) | (5 | ) | — | (5 | ) | |||||||||||||||||||
Impact of foreign currency fluctuations | (7 | ) | — | (7 | ) | 1 | — | 1 | ||||||||||||||||
|
|
| ||||||||||||||||||||||
Balance as of September 30, 2010 | 12 | 5 | 17 | 76 | 24 | 100 | ||||||||||||||||||
Cash payments | (10 | ) | (2 | ) | (12 | ) | (64 | ) | (13 | ) | (77 | ) | ||||||||||||
Adjustments (1) | 1 | — | 1 | (7 | ) | 4 | (3 | ) | ||||||||||||||||
Impact of foreign currency fluctuations | (1 | ) | 2 | 1 | — | (1 | ) | (1 | ) | |||||||||||||||
|
|
| ||||||||||||||||||||||
Balance as of March 31, 2011 (unaudited) | $ | 2 | $ | 5 | $ | 7 | ||||||||||||||||||
Balance as of September 30, 2011 | 5 | 14 | 19 | |||||||||||||||||||||
Cash payments | (6 | ) | (8 | ) | (14 | ) | ||||||||||||||||||
Adjustments(1) | 1 | 1 | 2 | |||||||||||||||||||||
Impact of foreign currency fluctuations | — | 1 | 1 | |||||||||||||||||||||
|
|
| ||||||||||||||||||||||
Balance as of September 30, 2012 | $ | — | $ | 8 | $ | 8 | ||||||||||||||||||
|
|
| ||||||||||||||||||||||
| (1) | Included in adjustments are changes in estimates, whereby all increases and decreases in costs related to the |
Fiscal 2009 Restructuring Program
The following table summarizes the components of the fiscal 2009 restructuring program:
In millions | Employee Separation Costs | Lease Obligations | Total | |||||||||
Balance as of October 1, 2009 | $ | 112 | $ | 8 | $ | 120 | ||||||
Cash payments | (88 | ) | (3 | ) | (91 | ) | ||||||
Adjustments(1) | (5 | ) | — | (5 | ) | |||||||
Impact of foreign currency fluctuations | (7 | ) | — | (7 | ) | |||||||
|
|
|
|
|
| |||||||
Balance as of September 30, 2010 | 12 | 5 | 17 | |||||||||
Cash payments | (13 | ) | (4 | ) | (17 | ) | ||||||
Adjustments(1) | 5 | 2 | 7 | |||||||||
Impact of foreign currency fluctuations | (1 | ) | — | (1 | ) | |||||||
|
|
|
|
|
| |||||||
Balance as of September 30, 2011 | 3 | 3 | 6 | |||||||||
Cash payments | (3 | ) | (1 | ) | (4 | ) | ||||||
Adjustments(1) | 1 | — | 1 | |||||||||
|
|
|
|
|
| |||||||
Balance as of September 30, 2012 | $ | 1 | $ | 2 | $ | 3 | ||||||
|
|
|
|
|
| |||||||
| (1) | Included in adjustments are changes in estimates, whereby all increases and decreases in costs related to the fiscal 2009 restructuring program are recored to the restructuring charges line item in operating expenses in the period of the adjustment. |
Fiscal 2008 Restructuring Reserve
In connection with the Merger, Avaya’s management and board of directors developed various plans and initiatives designedthe Company adopted a plan to streamline the operationsexit certain activities of the Company and generate cost savings, which include exiting facilities and terminating or relocating employees. As a result,newly acquired company. A liability was recognized as of the Company recorded approximately $251 millionconsummation date of liabilities associated with involuntary employee severance actions and approximately $79 million establishedthe acquisition for future lease payments on properties expected to be closed or consolidated as part of these initiatives. These amounts include the remaining payments associatedcosts under the exit
plan in accordance with the restructuring reserves of periods prior to the Merger. The headcount reductions associated with this restructuring program were substantially completed in 2009 and the related payments are expected to be completed in fiscal 2011. Cash payments associated with the lease obligations, net of sub-lease income, are expected to continue through 2020.
authoritative guidance at that time. The following table summarizes the componentsremaining liability of thisthe fiscal 2008 restructuring reserve:
In millions | Employee Separation Costs | Lease Obligations | Total | Employee Separation Costs | Lease Obligations | Total | ||||||||||||||||||
Balance as of September 30, 2008 | $ | 146 | $ | 67 | $ | 213 | ||||||||||||||||||
Cash payments | (89 | ) | (11 | ) | (100 | ) | ||||||||||||||||||
Adjustments (1) | (15 | ) | (7 | ) | (22 | ) | ||||||||||||||||||
Impact of foreign currency fluctuations | 3 | — | 3 | |||||||||||||||||||||
Balance as of September 30, 2009 | 45 | 49 | 94 | |||||||||||||||||||||
Balance as of October 1, 2009 | $ | 45 | $ | 49 | $ | 94 | ||||||||||||||||||
Cash payments | (29 | ) | (6 | ) | (35 | ) | (29 | ) | (6 | ) | (35 | ) | ||||||||||||
Adjustments (1) | 1 | (8 | ) | (7 | ) | 1 | (8 | ) | (7 | ) | ||||||||||||||
Impact of foreign currency fluctuations | (3 | ) | (1 | ) | (4 | ) | (3 | ) | (1 | ) | (4 | ) | ||||||||||||
|
|
| ||||||||||||||||||||||
Balance as of September 30, 2010 | 14 | 34 | 48 | 14 | 34 | 48 | ||||||||||||||||||
Cash payments | (7 | ) | (2 | ) | (9 | ) | (9 | ) | (4 | ) | (13 | ) | ||||||||||||
Adjustments (1) | (1 | ) | — | (1 | ) | (1 | ) | (1 | ) | (2 | ) | |||||||||||||
Impact of foreign currency fluctuations | 2 | 1 | 3 | 2 | 1 | 3 | ||||||||||||||||||
|
|
| ||||||||||||||||||||||
Balance as of March 31, 2011 (unaudited) | $ | 8 | $ | 33 | $ | 41 | ||||||||||||||||||
Balance as of September 30, 2011 | 6 | 30 | 36 | |||||||||||||||||||||
Cash payments | — | (4 | ) | (4 | ) | |||||||||||||||||||
Adjustments (1) | (1 | ) | (2 | ) | (3 | ) | ||||||||||||||||||
Impact of foreign currency fluctuations | (1 | ) | 1 | — | ||||||||||||||||||||
|
|
| ||||||||||||||||||||||
Balance as of September 30, 2012 | $ | 4 | $ | 25 | $ | 29 | ||||||||||||||||||
|
|
| ||||||||||||||||||||||
| (1) | Included in adjustments are changes in estimates, whereby all increases in costs related to the |
9. Financing Arrangements
In connection with the Merger, on October 26, 2007, Avaya Inc. entered into financing arrangements consisting of a senior secured credit facility, a senior unsecured credit facility, which later became senior unsecured notes, and a senior secured multi-currency asset basedasset-based revolving credit facility. On February 11, 2011, Avaya Inc. amended and extended its senior secured credit facility and issued senior secured notes, the proceeds of which were used to repay the senior secured incremental term B-2 loans in full under the Avaya Inc.’s senior secured credit facility and related fees and expenses.
Long-term debt consists of the following:
| September 30, | ||||||||||||||||||||
In millions | September 30, 2009 | September 30, 2010 | March 31, 2011 | 2012 | 2011 | |||||||||||||||
| (unaudited) | ||||||||||||||||||||
Senior secured term B-1 loans | $ | 3,700 | $ | 3,662 | $ | 1,457 | $ | 1,434 | $ | 1,449 | ||||||||||
Senior secured incremental term B-2 loans | — | 732 | — | |||||||||||||||||
Senior secured term B-3 loans | — | — | 2,176 | 2,144 | 2,165 | |||||||||||||||
Senior secured notes | — | — | 1,009 | 1,009 | 1,009 | |||||||||||||||
9.75% senior unsecured cash pay notes due 2015 | 700 | 700 | 700 | 700 | 700 | |||||||||||||||
10.125%/10.875% senior unsecured PIK toggle notes due 2015 | 750 | 834 | 834 | 834 | 834 | |||||||||||||||
|
| |||||||||||||||||||
| 5,150 | 5,928 | 6,176 | 6,121 | 6,157 | ||||||||||||||||
Debt maturing within one year | (38 | ) | (48 | ) | (37 | ) | (37 | ) | (37 | ) | ||||||||||
|
| |||||||||||||||||||
Long-term debt | $ | 5,112 | $ | 5,880 | $ | 6,139 | $ | 6,084 | $ | 6,120 | ||||||||||
|
| |||||||||||||||||||
Senior Secured Credit Facility
Prior to refinancing on February 11, 2011, the senior secured credit facility consisted of (a) a senior secured multi-currency revolver allowing for borrowings of up to $200 million, (b) a $3,800 million senior secured term
loan (the “term B-1 loans”), which was drawn in full on the closing date of the Merger, and (c) a $1,000 million incremental senior secured term loan (the “incremental term B-2 loans”), which was drawn in full at an original issue discount of 20.0% on December 18, 2009 the date ofto finance the Acquisition.
Borrowings under the term B-1 loans originally bore interest at a rate per annum equal to either a base rate or a LIBOR rate, in each case plus an applicable margin. The base rate is determined by reference to the higher of (1) the prime rate of Citibank, N.A. and (2) the federal funds effective rate plus 1/2 of 1%. The LIBOR rate is determined by a reference rate. The applicable margin for borrowings was 1.75% per annum with respect to the base rate and 2.75% per annum with respect to LIBOR borrowings.
In connection with the financing of the Acquisition, the Company received $800 million in exchange for incremental term B-2 loans payable with a face value of $1,000 million and detachable warrants to purchase 61.5 million shares of the Avaya Holdings Corp.’s common stock. The incremental term B-2 loans bore interest at a rate equal to, at Avaya Inc.’s option, either (1) a LIBOR rate (subject to a floor of 3.0%) plus a margin of 7.5%, or (2) a base rate (subject to a floor of 4.0%) plus a margin of 6.5%. Except with respect to interest rates, the incremental term B-2 loans had substantially the same terms as the term B-1 loans, including the maturity dates, security interests, amortization, covenants and events of default. The terms of the incremental term B-2 loans were negotiated and agreed during the spring of 2009 at the time the Company submitted its stalking horse bid for the Acquisition, and based on the agreed terms in relation to the market conditions existing at the time, the discount from the face amount of the loans was determined. In addition to receiving payments of principal and interest, upon funding of their loans at the closing of the Acquisition, the financing sources that committed to provide the new term loans in July 2009 in connection with the Company’s proposal to purchase NES received an aggregate commitment fee of $16 million. Proceeds from the issuance of the incremental term B-2 loans and associated warrants, net of commitment fees and reimbursement of the creditors’ costs of $1 million, was $783 million.
In accordance with GAAP, the Company allocated the net proceeds received at closing between debt and warrants based on their relative fair values. The estimated fair value of the incremental term B-2 loans on December 18, 2009 was $1,096 million and was estimated using a discounted cash flow analysis based on the Company’s current incremental borrowing rates for similar types of borrowing arrangements (e.g. a Level 2 Input). The warrants have a term of 10 years, have an exercise price of $3.25 per share and an aggregate estimated fair value of $114 million. The fair value of each warrant was determined utilizing the Cox-Ross-Rubinstein (“CRR”) binomial option under the following assumptions: estimated fair value of underlying stock of $3.00; expected term to exercise of 10 years; expected volatility of 48.8%; risk-free interest rate of 3.6%; and no dividend yield. The Company allocated the net cash proceeds of $783 million received to the incremental term B-2 loans and the warrants based on their relative fair values, or $709 million and $74 million, respectively. The difference between the carrying value of the incremental term B-2 loans as calculated and the $1,000 million face value of the incremental term B-2 loans at the date of issuance was recorded as a debt discount to be accreted over the term of the debt as interest expense using the effective interest rate method.
Funds affiliated with Silver Lake and TPG provided an aggregate of $443 million of cash proceeds from the issuance of the incremental term B-2 loans, with each sponsor-affiliated lending group providing approximately $222 million of such cash proceeds. In connection with their financing commitment, the Silver Lake and TPG funds received an aggregate of $14 million of commitment fees. Based upon funding of their loans at the closing of the Acquisition, the Silver Lake and TPG funds received warrants to purchase an aggregate of 34,069,554 shares of the common stock of Parent at an exercise price equal to $3.25 per share.
On February 11, 2011, Avaya Inc. amended and restated the senior secured credit facility to reflect modifications to certain provisions thereof. The modified terms of the senior secured credit facility includeincluded (1) an amendment which allowed the CompanyAvaya Inc. to extend the maturity of a portion of the term B-1 loans representing outstanding principal amounts of $2.2 billion from October 26, 2014 to October 26, 2017 (potentially springing to July 26, 2015, under the circumstances described below) by converting such loans into a new tranche of senior secured B-3 loans (the “term B-3 loans”); (2) permission, at the election of Avaya Inc., to apply prepayments of term loans to the incremental term B-2 loans prior to the term B-1 loans and term B-3 loans and thereafter to the class of term loans with the next earliest maturity; (3) permission to issue indebtedness (including the senior secured notes described below) to refinance a portion of the term loans under the senior secured credit facility and to secure such indebtedness (including the senior secured notes) on a pari passu basis with the obligations under the senior secured credit facility;facility, (4) permission for future refinancing of the term loans under the senior secured credit facility;facility, and (5) permission for future extensions of the term loans and revolving credit commitments (including, in the case of the revolving credit commitments, by obtaining new revolving credit commitments) under the senior secured credit facility.
The new tranche of term B-3 loans bears interest at a rate per annum equal to either a base rate or a LIBOR rate, in each case plus an applicable margin. The base rate is determined by reference to the higher of (1) the prime rate of Citibank, N.A. and (2) the federal funds effective rate plus 1/2of 1%. The applicable margin for borrowings of term B-3 loans is 3.50% per annum with respect to base rate borrowings and 4.50% per annum with respect to LIBOR borrowings. No changes were made to the maturity date or interest rates payable with respect to the non-extended term B-1 loans described above.
The maturity of the term B-3 loans will automatically become due July 26, 2015 unless (i) the total net leverage ratio as tested on that date based upon the most recent financial statements provided to the lenders under the senior secured credit facility is no greater than 5.0 to 1.0 or (ii) on or prior to such date, either (x) an initial public offering of Avaya Holdings Corp.’s common stock shall have occurred or (y) at least $750 million in aggregate principal amount of Avaya Inc.’s senior unsecured cash-pay notes and/or senior unsecured paid-in-kind (“PIK”) toggle notes have been repaid or refinanced or their maturity has been extended to a date no earlier than 91 days after October 26, 2017.
The February 11, 2011 amendment and restatement of the senior secured credit facility represents a debt modification for accounting purposes. Accordingly, third party expenses of $9 million incurred in connection with the transaction
were expensed as incurred and included in other income, net.net during fiscal 2011. Avaya Inc.’s financing sources that held term B-1 loans and/or revolving credit commitments under the senior secured credit facility and consented to the amendment and restatement of the senior secured credit facility received in aggregate a consent fee of $10 million. Fees paid to or on behalf of the creditors in connection with the modification were recorded as a discount to the face value of the debt and will beare being accreted over the term of the debt as interest expense.
Additionally, as discussed more fully below, on February 11, 2011, Avaya Inc. completed a private placement of $1,009 million of senior secured notes, the proceeds of which were used to repay in full the incremental term B-2 loans outstanding under the Company’s senior secured credit facility.
The senior secured multi-currency revolver, which allows for borrowings of up to $200 million, was not impacted by the February 11, 2011 refinancing. The senior secured multi-currency revolver includes capacity available for letters of credit and for short-term borrowings, and is available in euros in addition to dollars. Borrowings are guaranteed by the Company and substantially all of the Avaya Inc.’s U.S. subsidiaries. The senior secured facility, consisting of the term loans and the senior secured multi-currency revolver referenced above, is secured by substantially all assets of Avaya Holdings Corp., Avaya Inc. and the subsidiary guarantors.
On August 8, 2011, Avaya Inc. amended the terms of the senior secured multi-currency revolver to extend the final maturity from October 26, 2013 to October 26, 2016. All other terms and conditions of the senior secured credit facility remain unchanged. As of March 31, 2011 (unaudited),September 30, 2012 there were no amounts outstanding under the senior secured multi-currency revolver.
During the six months ended March 31,fiscal 2012 and 2011, fiscal 2010 and 2009, the Company paid $22 million (unaudited), $48$37 million and $38$42 million, respectively in aggregate quarterly principal payments on the senior secured term loans outstanding under the senior secured credit facility. In addition, in fiscal 2009, the Company also made anAvaya Inc. is required to prepay outstanding term loans based on its annual principal payment equal to 50% of the Company’s prior year excess cash flow, as defined in the senior secured credit facility. The excess cash flow payment associated with the period ended September 30, 2008 was $34 million and was made in January 2009. No such excess cash payment was required during fiscal 20102012 and 2011 based on fiscal 20092011 and 2010 cash flows.flows, respectively.
As a result of the February 11, 2011 refinancing transaction, the term loans outstanding under the senior secured credit facility includeincluded term B-1 loans and term B-3 loans with remaining face values as of March 31, 2011September 30, 2012 (after all principal payments to date) of $1,457$1,434 million (unaudited) and $2,186$2,152 million, (unaudited), respectively. Avaya Inc. is required to make scheduled quarterly principal payments under the term B-1 loans and the term B-3 loans, equal to $10 million in the aggregate.
In connection with the senior secured credit facility, the Company subsequentlyAvaya Inc. entered into interest rate swaps to effectively convert a portion of the floating-rate debt into fixed rate debt. During fiscal 20102012 and 2009, the Company2011, Avaya Inc. made interest payments aggregating $277$183 million and $239$218 million, respectively, related to the term B-1 loans, term B-3 loans and incremental term B-2 loans portion of this facility, respectively, net of related swaps. In addition to paying interest on outstanding principal under the senior secured credit facility, Avaya Inc. is required to pay a commitment fee of 0.50% per annum in respect of unutilized commitments under the revolver portion of this facility.
As more fully described in Note 22, “Subsequent Events,” the senior secured credit facility was further amended subsequent to September 30, 2012.
Senior Unsecured Notes
Avaya Inc. issued $700 million of senior unsecured cash-pay notes and $750 million of senior unsecured PIK toggle notes.notes, each due November 1, 2015. The interest rate for the cash-pay notes is fixed at 9.75% and the interest rates for the cash interest and PIK interest portions of the PIK togglePIK-toggle notes are fixed at 10.125% and 10.875%, respectively. Avaya Inc. may prepay the senior unsecured notes commencing November 1, 2011 at 104.875%102.4375% of the cash paycash-pay note and at 105.0625%102.5313% of PIK togglethe PIK-toggle note principal amount which decreases to 102.4375% and 102.5313%, respectively,redeemed on November 1, 2012 andwhich decreases to 100% of each on or after November 1, 2013.
In accordance with its debt agreements, Upon the occurrence of specific kinds of changes of control, Avaya Inc. waswill be required to file a registration statement with the SECmake an offer to provide for the exchange of the senior unsecured notes for publicly registered securities having similar terms to the senior unsecured notes. The agreements provided that Avaya Inc. use reasonable efforts to have such
registration statement effective and the exchange offer completed prior to October 24, 2009 (the “Effectiveness Date”). In connection with the then pending acquisition of NES, SEC regulations required that Avaya Inc. includes in its registration statement certain audited financial statements of NES. The preparation of these financial statements was outside of the control of Avaya Inc. and they were not available prior to the Effectiveness Date. Therefore, the registration statement could not be completed by the Effectiveness Date. Avaya Inc. was required to pay additional interest onpurchase the senior unsecured notes at the rate101% of $0.05 per week per $1,000 principal amount for the first 90-day period immediately following the Effectiveness Date, and such rate was due to increase by an additional $0.05 per week per $1,000 principal amount with respect to each subsequent 90-day period until the exchange offer was completed, up to a maximum additional interest rate of $0.10 per week per $1,000their principal amount. If Avaya Inc. or any of its restricted subsidiaries engages in certain asset sales, under certain circumstances Avaya Inc. will be required to use the net proceeds to make an offer to purchase the senior unsecured notes at 100% of their principal amount. Substantially all of Avaya Inc.’s Registration Statement on Form S-4 was filed withU.S. 100%-owned subsidiaries are guarantors of the SEC on December 23, 2009 and declared effective by the SEC on January 14, 2010. Avaya Inc. subsequently completed the exchange offer on February 12, 2010. The additional interest expense associated with this debt of $1 million was expensed through September 30, 2009 when such additional interest became probable in accordance with GAAP.senior unsecured notes.
For the periods May 1, 2009 through October 31, 2009 and November 1, 2009 through April 30, 2010, the CompanyAvaya Inc. elected to pay interest in kind on Avaya Inc.’sits senior PIK toggle notes. PIK interest of $41 million and $43 million was added, for these periods, respectively, to the principal amount of the senior unsecured notes effective
November 1, 2009 and May 1, 2010, respectively, and will be payable when the senior unsecured notes become due. For the period ofperiods from May 1, 2010 throughto October 31, 2010 and November 1, 2010 through April 30, 2011 the Company hasAvaya Inc. elected to make such payments in cash interest. On April 29, 2011,Under the Company delivered notice to Avaya Inc.’s creditors that, with respect to the interest periodterms of Maythese notes, after November 1, 2011 Avaya Inc. is required to October 31, 2011,make all interest payments on the Company will make such paymentssenior unsecured PIK toggle notes entirely in cash interest.cash.
As more fully described in Note 22, “Subsequent Events,” Avaya Inc. refinanced $1,384 million of senior unsecured notes subsequent to September 30, 2012.
Senior Secured Asset-Based Credit Facility
Avaya Inc.’s senior secured multi-currency asset-based revolving credit facility allows for borrowings of up to $335 million, subject to availability under a borrowing base, of which $150 million may be in the form of letters of credit. The borrowing base at any time equals the sum of 85% of eligible accounts receivable plus 85% of the net orderly liquidation value of eligible inventory, subject to certain reserves and other adjustments. Avaya Inc. and substantially all of its U.S. subsidiaries are borrowers under this facility, and borrowings are guaranteed by Avaya Holdings Corp., Avaya Inc. and substantially all of the Avaya Inc.’s U.S. subsidiaries. The facility is secured by substantially all assets of Avaya Holdings Corp., Avaya Inc. and the subsidiary guarantors. The senior secured multi-currency asset basedasset-based revolving credit facility also provides Avaya Inc. with the right to request up to $100 million of additional commitments under this facility. The principal amount outstanding under this
On August 8, 2011, Avaya Inc. amended the terms of its senior secured multi-currency asset-based revolving credit facility is payable in full onto extend its final maturity from October 26, 2013. 2013 to October 26, 2016. All other terms and conditions of the senior secured multi-currency asset-based revolving credit facility remained unchanged.
In connection with the acquisition of Radvision, Avaya Inc. borrowed $60 million under its senior secured multi-currency revolving asset-based credit facility. Following the completion of the acquisition, all amounts borrowed were repaid in full. Borrowings under the senior secured multi-currency asset-based revolving credit facility bear interest at a rate per annum equal to, at Avaya Inc.’s option, either a LIBOR rate or a base rate plus an applicable margin in each case. The applicable margin for borrowings during fiscal 2012 was 1.50% per annum with respect to LIBOR borrowings and 0.50% per annum with respect to base rate borrowings. The interest rate election made was the base rate.
At March 31, 2011 (unaudited)September 30, 2012 and September 30, 2010,2011, there were no borrowings under this facility. At March 31, 2011, September 30, 20102012 and 2009September 30, 2011 there were $72 million (unaudited), $53$77 million and $47$75 million, respectively, of letters of credit issued in the ordinary course of business under the senior secured multi-currency revolverasset-based revolving credit facility resulting in remaining availability of borrowings under that facility of $205 million (unaudited), $237$258 million and $200$252 million, respectively.
As more fully described in Note 22, “Subsequent Events,” the senior secured multi-currency revolving asset-based credit facility was further amended subsequent to September 30, 2012.
Senior Secured Notes
On February 11, 2011, Avaya Inc. completed a private placement of $1,009 million of senior secured notes. The senior secured notes were issued at par, bear interest at a rate of 7% per annum and mature on April 1, 2019. The senior secured notes were sold through a private placement to qualified institutional buyers pursuant to Rule 144A (and outside the United States in reliance on Regulation S) under the Securities Act of 1933, as amended (the “Securities Act”) and have not been, and will not be, registered under the Securities Act or applicable state securities laws.
Avaya Inc. may redeem the senior secured notes commencing April 1, 2015 at 103.5% of the principal amount redeemed, which decreases to 101.75% on April 1, 2016 and to 100% on or after April 1, 2017.
Avaya Inc. may redeem all or part of the notes at any time prior to April 1, 2015 at 100% of the principal amount redeemed plus a “make-whole” premium. In addition, Avaya Inc. may redeem up to 35% of the original aggregate principal balance of the senior secured notes at any time prior to April 1, 2014 with the net proceeds of certain equity offerings at 107% of the aggregate principal amount of senior secured notes redeemed. Upon the
occurrence of specific kinds of changes of control, Avaya Inc. will be required to make an offer to purchase the senior secured notes at 101% of their principal amount. If Avaya Inc. or any of its restricted subsidiaries engages in certain asset sales, under certain circumstances the CompanyAvaya Inc. will be required to use the net proceeds to make an offer to purchase the senior secured notes at 100% of their principal amount.
Substantially all of Avaya Inc.’s U.S. 100%-owned subsidiaries are guarantors of the senior secured notes. The facility issenior secured notes are secured by substantially all of the assets of Avaya Inc. and the subsidiary guarantors.
The proceeds from the senior secured notes were used to repay in full the senior secured incremental term B-2 loans outstanding under the senior secured credit facility (representing $988 million in aggregate principal amount and $12 million in accrued and unpaid interest) and to pay related fees and expenses.
The issuance of the senior secured notes and repayment of the incremental term B-2 loans was accounted for as an extinguishment of the incremental term B-2 loans and issuance of new debt. Accordingly, the difference between the reacquisition price of the incremental term B-2 loans (including consent fees paid by the CompanyAvaya Inc. to the holders of the incremental term B-2 loans that consented to the amendment and restatement of the senior secured credit facility of $1 million) and the carrying value of the incremental term B-2 loans (including unamortized debt discount and debt issue costs) of $246 million was recognized as a loss upon debt extinguishment during the quarter ended March 31,fiscal 2011. In connection with the issuance of the senior secured notes, the Company capitalized financing costs of $23 million during fiscal 2011 and is amortizing these costs over the term of the senior secured notes.
Avaya Inc.’s senior secured credit facility, senior secured multi-currency asset-based revolving credit facility, and the indentures governing Avaya Inc.’sits senior secured notes, senior unsecured cash-pay notes and senior unsecured PIK toggle notes contain a number of covenants that, among other things and subject to certain exceptions, restrict Avaya Inc.’s ability and the ability of certain of its subsidiaries to: (a) incur or guarantee additional debt and issue or sell certain preferred stock; (b) pay dividends on, redeem or repurchase capital stock; (c) make certain acquisitions or investments; (d) incur or assume certain liens; (e) enter into transactions with affiliates; (f) merge or consolidate with another company; (g) transfer or otherwise dispose of assets; (h) redeem subordinated debt; (i) incur obligations that restrict the ability of its subsidiaries to make dividends or other payments to Avaya Holdings Corp. or Avaya Inc.; and (j) create or designate unrestricted subsidiaries. They also contain customary affirmative covenants and events of default.
As of March 31, 2011 (unaudited)September 30, 2012 and September 30, 2010,2011, Avaya Inc. was not in default under its senior secured credit facility, the indenture governing its senior secured notes, the indenture governing its senior unsecured notes or its senior secured multi-currency asset-based revolving credit facility.
The weighted average interest ratesrate of the Company’s outstanding debt as of March 31, 2011 and September 30, 2010 were 6% (unaudited) and 6%, respectively,2012 was 6.1% excluding the impact of the interest rate swaps described in Note 10, “Derivatives and Other Financial Instruments”.
As of September 30, 2010, annualAnnual maturities of long-term debt for the next five years ending September 30 and thereafter consist of:
In millions | ||||||||
2011 | 48 | |||||||
2012 | 48 | |||||||
2013 | 48 | $ | 38 | |||||
2014 | 48 | 38 | ||||||
2015 | 4,475 | 1,442 | ||||||
2016 and thereafter | 1,519 | |||||||
2016 | 1,542 | |||||||
2017 | 23 | |||||||
2018 and thereafter | 3,046 | |||||||
| ||||||||
Total | $ | 6,186 | ||||||
| $ | 6,129 | |||||||
| ||||||||
As
These maturities represent the minimum principal payments owed per year and do not reflect a potential springing of March 31, 2011, annual maturities of long-term debt for the next five years ending September 30 and thereafter consist of:term B-3 loans to July 26, 2015 as described above or any contingent mandatory principal repayments that may be required upon Avaya Inc. achieving certain excess cash flow targets, as defined in the senior secured credit facility.
In millions | (Unaudited) | |||
Remainder of fiscal 2011 | 19 | |||
2012 | 38 | |||
2013 | 38 | |||
2014 | 38 | |||
2015 | 1,442 | |||
2016 and thereafter | 4,611 | |||
Total | $ | 6,186 | ||
Capital Lease Obligations
Included in other liabilities are $25is $24 million and $24$23 million (unaudited) of capital lease obligations as of September 30, 20102012 and March 31, 2011, respectively, primarily associated with an office facility assumed in the acquisition of NES.facility.
10. Derivatives and Other Financial Instruments
Interest Rate Swaps
The Company uses interest rate swaps to manage the amount of its floating rate debt in order to reduce its exposure to variable rate interest payments associated with certain borrowings under the senior secured credit facility. The interest rate swaps presented below are designated as cash flow hedges. The fair valuesvalue of theeach interest rate swaps areswap is reflected as an asset or liability in the Consolidated Balance Sheets, reported as a component of other comprehensive loss and reclassified to earnings in the same period or periods during which the hedged transaction affects earnings. Gains and losses on derivative instruments representing hedge ineffectiveness are recognized in current earnings. The fair valuesvalue of theeach interest rate swaps areswap is estimated as the net present value of their projected cash flows at the balance sheet date.
The details of these swaps are as follows:
| Notional Amount | ||||||||||||||||||||||||||||||||||||||||||
In millions | Effective Date | Maturity Date | September 30, 2010 | March 31, 2011 | Floating Rate Received by Avaya | Fixed Rate Paid by Avaya | Effective Date | Maturity Date | Notional Amount | Floating Rate Received by Avaya | Fixed Rate Paid by Avaya | |||||||||||||||||||||||||||||||
| (unaudited) | ||||||||||||||||||||||||||||||||||||||||||
3-year swap | November 26, 2007 | November 26, 2010 | $ | 1,000 | $ | — | 3-month LIBOR | 4.379 | % | |||||||||||||||||||||||||||||||||
4-year swap | November 26, 2007 | November 26, 2011 | 200 | 200 | 3-month LIBOR | 4.485 | % | |||||||||||||||||||||||||||||||||||
5-year swap | November 26, 2007 | November 26, 2012 | 300 | 300 | 3-month LIBOR | 4.591 | % | November 26, 2007 | November 26, 2012 | $ | 300 | 3-month LIBOR | 4.591 | % | ||||||||||||||||||||||||||||
Notional amount—2007 swaps | 1,500 | 500 | ||||||||||||||||||||||||||||||||||||||||
2.5-year swap | May 27, 2008 | November 26, 2010 | 250 | — | 3-month LIBOR | 2.984 | % | |||||||||||||||||||||||||||||||||||
Notional amount—2008 swaps | 250 | — | ||||||||||||||||||||||||||||||||||||||||
3-year swap | August 26, 2010 | August 26, 2013 | 750 | 750 | 3-month LIBOR | 1.160 | % | August 26, 2010 | August 26, 2013 | 750 | 3-month LIBOR | 1.160 | % | |||||||||||||||||||||||||||||
3-year swap | August 26, 2010 | August 26, 2013 | 750 | 750 | 3-month LIBOR | 1.135 | % | August 26, 2010 | August 26, 2013 | 750 | 3-month LIBOR | 1.135 | % | |||||||||||||||||||||||||||||
| ||||||||||||||||||||||||||||||||||||||||||
Notional amount—2010 swaps | 1,500 | 1,500 | ||||||||||||||||||||||||||||||||||||||||
Notional amount—Total | Notional amount—Total | $ | 3,250 | $ | 2,000 | Notional amount—Total |
| $ | 1,800 | |||||||||||||||||||||||||||||||||
| ||||||||||||||||||||||||||||||||||||||||||
The following table summarizes the gains(gains) and losses of the interest rate contracts qualifying and designated as cash flow hedging instruments under ASC 815:instruments:
| Years ended September 30, | Six months ended March 31, | Fiscal year ended September 30, | ||||||||||||||||||||||||||||||
In millions | 2008 | 2009 | 2010 | 2010 | 2011 | 2012 | 2011 | 2010 | ||||||||||||||||||||||||
| (unaudited) | ||||||||||||||||||||||||||||||||
Loss (Gain) on interest rate swaps | ||||||||||||||||||||||||||||||||
(Gain) Loss on interest rate swaps | ||||||||||||||||||||||||||||||||
Recognized in other comprehensive loss | $ | 43 | $ | 56 | $ | (45 | ) | $ | (29 | ) | $ | (30 | ) | $ | (18 | ) | $ | (23 | ) | $ | (45 | ) | ||||||||||
|
|
| ||||||||||||||||||||||||||||||
Reclassified from accumulated other comprehensive loss into interest expense | $ | 19 | $ | 76 | $ | 76 | $ | 41 | $ | 25 | $ | 25 | $ | 42 | $ | 76 | ||||||||||||||||
|
|
| ||||||||||||||||||||||||||||||
Recognized in operations (ineffective portion) | $ | — | $ | — | $ | — | $ | — | $ | — | $ | — | $ | — | $ | — | ||||||||||||||||
|
|
| ||||||||||||||||||||||||||||||
The Company expects to reclassify approximately $38$13 million and $28 million (unaudited) from accumulated other comprehensive loss into expense in the next twelve months related to the Company’s interest rate swaps based on the projected borrowing rates atas of September 30, 2010 and March 31, 2011, respectively.2012.
Foreign Currency Forward Contracts
The Company utilizes foreign currency forward contracts primarily to manage short-term exchange rate exposures on certain receivables, payables and intercompany loans residing on foreign subsidiaries’ books, which are denominated in currencies other than the subsidiary’s functional currency. When those items are revalued into the subsidiaries’ functional currencies at the month-end exchange rates, the fluctuations in the exchange rates are recognized in the Consolidated Statements of Operations as the other income (expense), net. Changes in the fair value of the Company’s foreign currency forward contracts used to offset these exposed items are also recognized in the Consolidated Statements of Operations as other income (expense), net in the period in which the exchange rates change. During the periods ended September 30, 2010 and 2009, the changes in the fair value of the foreign currency forward contracts were substantially offset by changes resulting from the revaluation of the items subject to foreign currency exposure.
The gains and (losses) of the foreign currency forward contracts included in other income (expense), net were $27$(4) million, ($24) million, ($7)$(7) million and $8$27 million for fiscal years 2010 and 2009 and the periods
October 27, 2007 through September 30, 2008 and October 1, 2007 through October 26, 2007, respectively. For the six months ended March 31,2012, 2011 and 2010, the gains and (losses) of the foreign currency forward contracts included in other income (expense), net were ($3) million (unaudited) and $30 million (unaudited), respectively.
The notional amount of the Company’s financial instruments represents the face amount of the contractual arrangements and the basis on which U.S. dollars are to be exchanged. They areIt is not a measure of market or credit exposure. The following table summarizes these notional amounts that principally represent the equivalent in U.S. dollars for contracts in their respective currencies:
| September 30, | ||||||||||||||||||||
In millions | September 30, 2009 | September 30, 2010 | March 31, 2011 | 2012 | 2011 | |||||||||||||||
| (unaudited) | ||||||||||||||||||||
Euros | $ | 188 | $ | 429 | $ | 11 | ||||||||||||||
Indian rupee | $ | 28 | $ | 21 | ||||||||||||||||
Japanese yen | 26 | 24 | ||||||||||||||||||
Chinese yuan | 15 | 10 | ||||||||||||||||||
euros | 13 | — | ||||||||||||||||||
British pound sterling | 168 | 170 | 44 | 11 | 45 | |||||||||||||||
Canadian dollars | 6 | 64 | 22 | — | 28 | |||||||||||||||
Australian dollars | 42 | 53 | 5 | |||||||||||||||||
Singapore dollars | 36 | 11 | 2 | |||||||||||||||||
Mexican peso | 25 | 23 | 28 | |||||||||||||||||
Hungarian forints | 23 | 20 | 7 | |||||||||||||||||
Japanese yen | 17 | 19 | 23 | |||||||||||||||||
All other foreign currencies | 63 | 69 | 75 | 48 | 68 | |||||||||||||||
|
| |||||||||||||||||||
| $ | 568 | $ | 858 | $ | 217 | $ | 141 | $ | 196 | |||||||||||
|
| |||||||||||||||||||
Preferred Series B Embedded Derivative
As discussed more fully in Note 15 “Capital Stock”, the Company has issued preferred series B containing certain features which are considered an embedded derivative under generally accepted accounting principles. This embedded derivative was separated from the host contract (i.e. the preferred stock) and recognized as a current liability on the Consolidated Balance Sheet at fair value. When the embedded derivative is revalued at each balance sheet date, the changes in the fair value are recognized in the Consolidated Statement of Operations as other income (expense), net. During the year ended September 30, 2012, the loss on the preferred series B embedded derivative included in other income (expense), net was $6 million.
The following table summarizes the estimated fair value of derivatives:
In millions | September 30, 2009 | September 30, 2010 | March 31, 2011 | September 30, 2012 | September 30, 2011 | |||||||||||||||||||||||||||||||||||||||||||||||||||||||||||
Balance Sheet Location | Total | Foreign Currency Forward Contracts | Interest Rate Swaps | Total | Foreign Currency Forward Contracts | Interest Rate Swaps | Total | (unaudited) Foreign Currency Forward Contracts | Interest Rate Swaps | Total | Foreign Currency Forward Contracts | Interest Rate Swaps | Series B Preferred Embedded Derivative | Total | Foreign Currency Forward Contracts | Interest Rate Swaps | ||||||||||||||||||||||||||||||||||||||||||||||||
Other current assets | $ | 3 | $ | 3 | $ | — | $ | 5 | $ | 5 | $ | — | $ | 1 | $ | 1 | $ | — | $ | 2 | $ | 2 | $ | — | $ | — | $ | 1 | $ | 1 | $ | — | ||||||||||||||||||||||||||||||||
Other non-current assets | — | — | — | — | — | 2 | — | 2 | ||||||||||||||||||||||||||||||||||||||||||||||||||||||||
Other current liabilities | (79 | ) | (6 | ) | (73 | ) | (67 | ) | (23 | ) | (44 | ) | (30 | ) | (1 | ) | (29 | ) | (31 | ) | — | (15 | ) | (16 | ) | (26 | ) | (2 | ) | (24 | ) | |||||||||||||||||||||||||||||||||
Other non-current liabilities | (26 | ) | — | (26 | ) | (18 | ) | — | (18 | ) | — | — | — | — | — | — | — | (10 | ) | — | (10 | ) | ||||||||||||||||||||||||||||||||||||||||||
|
|
|
|
|
|
| ||||||||||||||||||||||||||||||||||||||||||||||||||||||||||
Net Liability | $ | (102 | ) | $ | (3 | ) | $ | (99 | ) | $ | (80 | ) | $ | (18 | ) | $ | (62 | ) | $ | (27 | ) | $ | — | $ | (27 | ) | $ | (29 | ) | $ | 2 | $ | (15 | ) | $ | (16 | ) | $ | (35 | ) | $ | (1 | ) | $ | (34 | ) | ||||||||||||||||||
|
|
|
|
|
|
| ||||||||||||||||||||||||||||||||||||||||||||||||||||||||||
11. Fair Value Measures
Pursuant to the accounting guidance for fair value measurements and its subsequent updates, fair value is defined as the price that would be received from selling an asset or paid to transfer a liability in an orderly transaction between market participants at the measurement date. When determining the fair value measurements for assets and liabilities required or permitted to be recorded at fair value, the Company considers the principal or most advantageous market in which it would transact and it considers assumptions that market participants would use when pricing the asset or liability.
Fair Value Hierarchy
The accounting guidance for fair value measurementmeasurements also requires an entity to maximize the use of observable inputs and minimize the use of unobservable inputs when measuring fair value. A financial instrument’s categorization within the fair value hierarchy is based upon the lowest level of input that is significant to the fair value measurement. The inputs are prioritized into three levels that may be used to measure fair value:
Level 1: Inputs that reflect quoted prices for identical assets or liabilities in active markets that are observable.
Level 2: Inputs that reflect quoted prices for similar assets or liabilities in active markets; quoted prices for identical or similar assets or liabilities in markets with insufficient volume or infrequent transactions (less active markets);that are not active; or model-derived valuations in which significant inputs are observable or can be derived principally from, or corroborated by, observable market data.
Level 3: Inputs that are unobservable to the extent that observable inputs are not available for the asset or liability at the measurement date.
Asset and Liabilities Measured at Fair Value on a Recurring Basis
Assets and liabilities measured at fair value on a recurring basis as of March 31, 2011, September 30, 20102012 and 20092011 were as follows:
| Fair Value Measurements Using | ||||||||||||||||
In millions | Fair Value at March 31, 2011 | Quoted Prices in Active Markets for Identical Instruments (Level 1) | Significant Other Observable Inputs (Level 2) | Significant Unobservable Inputs (Level 3) | ||||||||||||
| (unaudited) | ||||||||||||||||
Other Current Assets: | ||||||||||||||||
Foreign currency forward contracts | $ | 1 | $ | — | $ | 1 | $ | — | ||||||||
Other Non-Current Assets: | ||||||||||||||||
Investments | $ | 11 | $ | 11 | $ | — | $ | — | ||||||||
Interest rate swaps | 2 | — | 2 | — | ||||||||||||
| $ | 13 | $ | 11 | $ | 2 | $ | — | |||||||||
Other Current Liabilities: | ||||||||||||||||
Foreign currency forward contracts | $ | 1 | $ | — | $ | 1 | $ | — | ||||||||
Interest rate swaps | 29 | — | 29 | — | ||||||||||||
| $ | 30 | $ | — | $ | 30 | $ | — | |||||||||
In millions Other Current Assets: Foreign currency forward contracts Other Non-Current Assets: Investments Other Current Liabilities: Foreign currency forward contracts Interest rate swaps Other Non-Current Liabilities: Interest rate swaps Fair Value Measurements Using Fair Value at
September 30,
2010 Quoted Prices in
Active Markets
for Identical
Instruments
(Level 1) Significant Other
Observable
Inputs
(Level 2) Significant
Unobservable
Inputs
(Level 3) $ 5 $ — $ 5 $ — $ 10 $ 10 $ — $ — $ 23 $ — $ 23 $ — 44 — 44 — $ 67 $ — $ 67 $ — $ 18 $ — $ 18 $ —
| September 30, 2012 | ||||||||||||||||||||||||||||||||
| Fair Value Measurements Using | Fair Value Measurements Using | |||||||||||||||||||||||||||||||
In millions | Fair Value at September 30, 2009 | Quoted Prices in Active Markets for Identical Instruments (Level 1) | Significant Other Observable Inputs (Level 2) | Significant Unobservable Inputs (Level 3) | Total | Quoted Prices in Active Markets for Identical Instruments (Level 1) | Significant Other Observable Inputs (Level 2) | Significant Unobservable Inputs (Level 3) | ||||||||||||||||||||||||
Other Current Assets: | ||||||||||||||||||||||||||||||||
Foreign currency forward contracts | $ | 3 | $ | — | $ | 3 | $ | — | $ | 2 | $ | — | $ | 2 | $ | — | ||||||||||||||||
Investments | 1 | 1 | — | — | ||||||||||||||||||||||||||||
|
|
|
| |||||||||||||||||||||||||||||
| $ | 3 | $ | 1 | $ | 2 | $ | — | |||||||||||||||||||||||||
|
|
|
| |||||||||||||||||||||||||||||
Other Non-Current Assets: | ||||||||||||||||||||||||||||||||
Investments | $ | 9 | $ | 9 | $ | — | $ | — | $ | 4 | $ | 2 | $ | 2 | $ | — | ||||||||||||||||
|
|
|
| |||||||||||||||||||||||||||||
Other Current Liabilities: | ||||||||||||||||||||||||||||||||
Foreign currency forward contracts | $ | 6 | $ | — | $ | 6 | $ | — | ||||||||||||||||||||||||
Preferred series B embedded derivative | $ | 16 | $ | — | $ | — | $ | 16 | ||||||||||||||||||||||||
Interest rate swaps | 73 | — | 73 | — | 15 | — | 15 | — | ||||||||||||||||||||||||
|
|
|
| |||||||||||||||||||||||||||||
| $ | 79 | $ | — | $ | 79 | $ | — | $ | 31 | $ | — | $ | 15 | $ | 16 | |||||||||||||||||
|
|
|
| |||||||||||||||||||||||||||||
Other Non-Current Liabilities: | ||||||||||||||||||||||||||||||||
Interest rate swaps | $ | 26 | $ | — | $ | 26 | $ | — | ||||||||||||||||||||||||
In millions Other Current Assets: Foreign currency forward contracts Other Non-Current Assets: Investments Other Current Liabilities: Foreign currency forward contracts Interest rate swaps Other Non-Current Liabilities: Interest rate swaps September 30, 2011 Fair Value Measurements Using Total Quoted Prices in
Active Markets
for Identical
Instruments
(Level 1) Significant Other
Observable
Inputs
(Level 2) Significant
Unobservable
Inputs
(Level 3) $ 1 $ — $ 1 $ — $ 11 $ 9 $ 2 $ — $ 2 $ — $ 2 $ — 24 — 24 — $ 26 $ — $ 26 $ — $ 10 $ — $ 10 $ —
Interest Rate Swaps
Interest rate swaps classified as Level 2 assets and liabilities are priced using non-binding market prices thatdiscounted cash flow techniques which are corroborated by observableusing non-binding market data, or discounted cash flow techniques.prices. Significant inputs to the discounted cash flow model include projected future cash flows based on projected 3-month LIBOR rates, and the average margin for companies with similar credit ratings and similar maturities. These are classified as Level 2 as they are not actively traded and are valued using pricing models that use observable market inputs.
Foreign Currency Forward Contracts
Foreign currency forward contracts classified as Level 2 assets and liabilities are priced using quoted market prices for similar assets or liabilities in active markets.
Investments
Investments classified as Level 2 assets and liabilities are priced using quoted market prices for identical assets which are subject to infrequent transactions (i.e. a less active market).
Preferred Series B Embedded Derivative
The preferred series B embedded derivative classified as a Level 3 liability is priced by calculating the difference in the fair value of the preferred series B with and without the aggregated embedded features. To estimate the fair value of the preferred series B a Binomial Lattice model was used. Significant inputs into the binomial lattice model include the total equity value of the Company, risk-free rate, volatility, and expected term.
The following table presents the changes in the fair value of the preferred series B embedded derivative for the year ended September 30, 2012:
In millions | Preferred Series B Embedded Derivative | |||
Balance as of October 1, 2011 | $ | — | ||
Issuance of preferred series B | 10 | |||
Change in fair value | 6 | |||
|
| |||
Balance as of September 30, 2012 | $ | 16 | ||
|
| |||
Fair Value of Financial Instruments
The fair values of cash and cash equivalents, accounts receivable, accounts payable and accrued expenses, to the extent the underlying liability will be settled in cash, approximate carrying values because of the short-term nature of these instruments.
The estimated fair values of the amounts borrowed under the Company’s financing arrangements at March 31, 2011September 30, 2012 and September 30, 20102011 were estimated based on a Level 2 input using quoted market prices in markets with insufficient volume.for the Company’s debt which is subject to infrequent transactions (i.e. a less active market).
The estimated fair values of the amounts borrowed under the Company’s credit agreements at March 31, 2011, September 30, 20102012 and 2009September 30, 2011 are as follows:
| September 30, 2009 | September 30, 2010 | March 31, 2011 | ||||||||||||||||||||||||||||||||||||||
| (unaudited) | September 30, 2012 | September 30, 2011 | ||||||||||||||||||||||||||||||||||||||
In millions | Carrying Amouunt | Fair Value | Carrying Amouunt | Fair Value | Carrying Amouunt | Fair Value | Carrying Amount | Fair Value | Carrying Amount | Fair Value | ||||||||||||||||||||||||||||||
Senior secured term B-1 loans | $ | 3,700 | $ | 3,161 | $ | 3,662 | $ | 3,250 | $ | 1,457 | $ | 1,410 | $ | 1,434 | $ | 1,392 | $ | 1,449 | $ | 1,298 | ||||||||||||||||||||
Senior secured incremental term B-2 loans | — | — | 732 | 1,018 | — | — | ||||||||||||||||||||||||||||||||||
Senior secured term B-3 loans | — | — | — | 2,176 | 2,134 | 2,144 | 1,960 | 2,165 | 1,833 | |||||||||||||||||||||||||||||||
Senior secured notes | — | — | — | — | 1,009 | 985 | 1,009 | 938 | 1,009 | 854 | ||||||||||||||||||||||||||||||
9.75% senior unsecured cash pay notes due 2015 | 700 | 697 | 700 | 665 | 700 | 712 | 700 | 622 | 700 | 511 | ||||||||||||||||||||||||||||||
10.125%/10.875% senior unsecured PIK toggle notes due 2015 | 750 | 692 | 834 | 792 | 834 | 850 | 834 | 749 | 834 | 612 | ||||||||||||||||||||||||||||||
|
|
|
| |||||||||||||||||||||||||||||||||||||
Total | $ | 5,150 | $ | 4,550 | $ | 5,928 | $ | 5,725 | $ | 6,176 | $ | 6,091 | $ | 6,121 | $ | 5,661 | $ | 6,157 | $ | 5,108 | ||||||||||||||||||||
|
|
|
| |||||||||||||||||||||||||||||||||||||
12. Income Taxes
Fiscal years 2008, 2009 and 2010
The (benefit from) provision for income taxes is comprised of U.S. Federal, state and non-U.S. taxes. A reconciliation of the Company’s loss before income taxes at the U.S. Federal statutory rate to the (benefit from) provision for income taxes is as follows:
| Predecessor | Successor | Fiscal years ended September 30, | ||||||||||||||||||||||||||||||
In millions | Period from October 1, 2007 through October 26, 2007 | Years ended September 30, | ||||||||||||||||||||||||||||||
| 2008 | 2009 | 2010 | 2012 | 2011 | 2010 | |||||||||||||||||||||||||||
Income tax benefit computed at the U.S. Federal statutory rate of 35% | $ | (39 | ) | $ | (522 | ) | $ | (286 | ) | $ | (300 | ) | $ | (121 | ) | $ | (278 | ) | $ | (300 | ) | |||||||||||
State and local income taxes (benefit), net of federal income tax effect | (2 | ) | (20 | ) | 17 | (3 | ) | (3 | ) | 3 | (3 | ) | ||||||||||||||||||||
Tax differentials on foreign earnings | 12 | 3 | 26 | 25 | (16 | ) | 106 | 25 | ||||||||||||||||||||||||
Non-deductible transaction costs | 3 | — | 6 | (6 | ) | — | — | (6 | ) | |||||||||||||||||||||||
Research and experimental credit | — | (2 | ) | (7 | ) | 4 | — | — | 4 | |||||||||||||||||||||||
Non-deductible portion of goodwill impairment | — | 306 | 81 | — | ||||||||||||||||||||||||||||
Unremitted foreign earnings | 51 | — | — | |||||||||||||||||||||||||||||
Other differences—net | 2 | 21 | 10 | 11 | — | 13 | 11 | |||||||||||||||||||||||||
Subsidiary divestiture | — | — | — | 13 | ||||||||||||||||||||||||||||
Divestiture of AGC | — | — | 13 | |||||||||||||||||||||||||||||
Audit settlements | — | — | — | (28 | ) | 18 | — | (28 | ) | |||||||||||||||||||||||
In-process research and development charge | — | 28 | 4 | — | ||||||||||||||||||||||||||||
Tax allocated to other comprehensive income | (56 | ) | — | — | ||||||||||||||||||||||||||||
Valuation allowance | — | 3 | 179 | 302 | 135 | 224 | 302 | |||||||||||||||||||||||||
|
|
| ||||||||||||||||||||||||||||||
(Benefit from) provision for income taxes | $ | (24 | ) | $ | (183 | ) | $ | 30 | $ | 18 | ||||||||||||||||||||||
Provision for income taxes | $ | 8 | $ | 68 | $ | 18 | ||||||||||||||||||||||||||
|
|
| ||||||||||||||||||||||||||||||
In fiscal 2012, the Company recorded a federal and state income tax charge of $62 million to other comprehensive income primarily relating to post-employment benefits. The charge to other comprehensive income and decrease in deferred tax assets resulted in the recording of a $56 million federal and a $6 million state income tax benefit in continuing operations related to the release of the corresponding valuation allowance.
In fiscal 2012, the $135 million of net increase in the valuation allowance relates to a net $5 million decrease in U.S. net deferred tax assets, offset by a $140 million increase in non-U.S. net deferred tax assets,
primarily in Germany and Luxembourg. The U.S. decrease is primarily attributable to changes relating to unremitted foreign earnings, other comprehensive income allocations, and utilization of net operating losses. In fiscal 2011, $197 million of the $224 million increase in the valuation allowance relates to net deferred tax assets generated from pre-tax book losses in the U.S. and $27 million outside the U.S., primarily in Germany. In fiscal 2010, $233 million of the $302 million increase in the valuation allowance relates to net deferred tax assets generated from pre-tax book tax losses in the U.S. and $69 million outside the U.S. In fiscal 2009, $111 million of the $179 million increase in the valuation allowance relates to net deferred tax assets generated from pre-tax book tax losses in the U.S. and $68 million outside of the U.S., primarily in Germany. The reconciliations for fiscal 2009 and 2008 include the effects of the non-deductible portion of goodwill impairment and non-deductible IPRD charge.
On March 23, 2010 the Patient Protection and Affordable Care Act (“PPACA”) was signed into law, and on March 30, 2010 the Health Care and Education Reconciliation Act of 2010 (“H.R. 4872”), which makes various amendments to certain aspects of the PPACA, was also signed. The PPACA effectively changes the tax treatment of federal subsidies paid to sponsors of retiree health benefit plans that provide a benefit that is at least actuarially equivalent to the benefits under Medicare Part D. As a result of the PPACA and H.R. 4872, these subsidy payments will effectively become taxable in tax years beginning after December 31, 2012 or in the Company’s fiscal year ending September 30, 2014. Due to the valuation allowance on the Company’s U.S. deferred tax assets, the signing of the PPACA and H.R. 4872 has no net financial statement impact.
The following table presents the U.S. and foreign components of income (loss)loss before income taxes and the provision for (benefit from) income taxes for the periods presented:taxes:
| Predecessor | Successor | Fiscal years ended September 30, | ||||||||||||||||||||||||||||||
In millions | Period from October 1, 2007 through October 26, 2007 | Years ended September 30, | ||||||||||||||||||||||||||||||
| 2008 | 2009 | 2010 | 2012 | 2011 | 2010 | |||||||||||||||||||||||||||
LOSS BEFORE INCOME TAXES: | ||||||||||||||||||||||||||||||||
U.S. | $ | (65 | ) | $ | (1,520 | ) | $ | (704 | ) | $ | (647 | ) | $ | (209 | ) | $ | (587 | ) | $ | (647 | ) | |||||||||||
Foreign | (47 | ) | 32 | (111 | ) | (206 | ) | (137 | ) | (208 | ) | (206 | ) | |||||||||||||||||||
|
|
| ||||||||||||||||||||||||||||||
Loss before income taxes | $ | (112 | ) | $ | (1,488 | ) | $ | (815 | ) | $ | (853 | ) | $ | (346 | ) | $ | (795 | ) | $ | (853 | ) | |||||||||||
|
|
| ||||||||||||||||||||||||||||||
(BENEFIT FROM) PROVISION FOR INCOME TAXES: | ||||||||||||||||||||||||||||||||
PROVISION FOR INCOME TAXES: | ||||||||||||||||||||||||||||||||
CURRENT | ||||||||||||||||||||||||||||||||
Federal | $ | — | $ | — | $ | — | $ | (1 | ) | $ | — | $ | (1 | ) | $ | (12 | ) | |||||||||||||||
State and local | — | — | 3 | — | 2 | 3 | — | |||||||||||||||||||||||||
Foreign | (3 | ) | 35 | 43 | 32 | 43 | 69 | 23 | ||||||||||||||||||||||||
|
|
| ||||||||||||||||||||||||||||||
Subtotal | (3 | ) | 35 | 46 | 31 | |||||||||||||||||||||||||||
| 45 | 71 | 11 | ||||||||||||||||||||||||||||||
|
|
| ||||||||||||||||||||||||||||||
DEFERRED | ||||||||||||||||||||||||||||||||
Federal | (16 | ) | (165 | ) | (45 | ) | 1 | (39 | ) | 15 | 21 | |||||||||||||||||||||
State and local | (4 | ) | (29 | ) | 21 | (3 | ) | (5 | ) | — | (3 | ) | ||||||||||||||||||||
Foreign | (1 | ) | (24 | ) | 8 | (11 | ) | 7 | (18 | ) | (11 | ) | ||||||||||||||||||||
|
|
| ||||||||||||||||||||||||||||||
Subtotal | (21 | ) | (218 | ) | (16 | ) | (13 | ) | ||||||||||||||||||||||||
| (37 | ) | (3 | ) | 7 | ||||||||||||||||||||||||||||
(Benefit from) provision for income taxes | $ | (24 | ) | $ | (183 | ) | $ | 30 | $ | 18 | ||||||||||||||||||||||
|
|
| ||||||||||||||||||||||||||||||
Provision for income taxes | $ | 8 | $ | 68 | $ | 18 | ||||||||||||||||||||||||||
|
|
| ||||||||||||||||||||||||||||||
The components of deferred tax assets and liabilities as of September 30, 20102012 and 20092011 are as follows:
| September 30, | ||||||||||||||||
In millions | September 30, 2009 | September 30, 2010 | 2012 | 2011 | ||||||||||||
DEFERRED TAX ASSETS: | ||||||||||||||||
DEFERRED INCOME TAX ASSETS: | ||||||||||||||||
Benefit obligations | $ | 712 | $ | 801 | $ | 793 | $ | 822 | ||||||||
Accrued liabilities | — | 11 | 72 | — | ||||||||||||
Net operating loss / credit carryforwards | 827 | 854 | ||||||||||||||
Net operating losses / credit carryforwards | 1,111 | 1,038 | ||||||||||||||
Property, plant and equipment | 12 | 30 | 34 | 26 | ||||||||||||
Other | 92 | 102 | 44 | 72 | ||||||||||||
Valuation allowance | (738 | ) | (1,094 | ) | (1,527 | ) | (1,410 | ) | ||||||||
|
| |||||||||||||||
Gross deferred tax assets | 905 | 704 | ||||||||||||||
Gross deferred income tax assets | 527 | 548 | ||||||||||||||
|
| |||||||||||||||
DEFERRED TAX LIABILITIES: | ||||||||||||||||
DEFERRED INCOME TAX LIABILITIES: | ||||||||||||||||
Goodwill and intangible assets | (1,018 | ) | (829 | ) | (506 | ) | (672 | ) | ||||||||
Other | (1 | ) | (4 | ) | (85 | ) | (5 | ) | ||||||||
Accrued liabilities | (79 | ) | (3 | ) | ||||||||||||
|
| |||||||||||||||
Gross deferred tax liabilities | (1,019 | ) | (833 | ) | ||||||||||||
Gross deferred income tax liabilities | (670 | ) | (680 | ) | ||||||||||||
|
| |||||||||||||||
Net deferred tax liability | $ | (114 | ) | $ | (129 | ) | ||||||||||
Net deferred income tax liabilities | $ | (143 | ) | $ | (132 | ) | ||||||||||
|
| |||||||||||||||
As of September 30, 2010,2012, the Company had tax-effected NOLnet operating loss (“NOL’s”) carryforwards of $777$1,038 million, comprised of $523$543 million for U.S. federal,Federal, state and local taxes and $254$495 million for foreign taxes, primarilyincluding $180 million, $255 million and $24 million in Germany.Germany, Luxembourg and France, respectively. U.S. federalFederal and state NOL carryforwards expire through the year 2030,2031, with the majority expiring in excess of 10 years. The majority of foreign NOL carryforwards (after-tax) have no expiration. Additionally, the Company has various other tax credit carryforwardscarry-forwards totaling $77$73 million. Of this total, $28$17 million expire within five5 years, $17$21 million expire between five5 and 15 years and $32$35 million expire in excess of 15 years.
As a result of the Merger, a significant change in the ownership of the Company occurred which, pursuant to Section 382 of the U.S. Internal Revenue Code, will limit on an annual basis the Company’s ability to utilize its federal NOLs.U.S. Federal NOLs and U.S. Federal tax credits. The Company’s NOLs and credits will continue to be available to offset taxable income and tax liabilities (until such NOLs and credits are either used or expire) subject to the Section 382 annual limitation. If the Section 382 annual limitation amount is not fully utilized in a particular tax year, then the unused portion from that particular tax year will be added to the Section 382 annual limitation in subsequent years. On June 9, 2011, the Company filed with the Securities and Exchange Commission a registration statement on Form S-1 relating to a proposed initial public offering of its common stock. The Company does not believe that this share issuance will itself, or when aggregated with other prior shareholder ownership changes during the applicable testing period, cause an ownership change that would further limit, on an annual basis, its ability to utilize its current U.S. Federal net operating losses and U.S. Federal tax credits.
In fiscal 2009 andfiscals 2008 Avaya recognized significant impairments to its intangible assets and goodwill which contributed to athrough 2012, the Company has incurred significant book taxable losslosses in the U.S. The Company also incurred and expects to continue to incur significant interest expense related to its debt and amortization and depreciation expense associated with the step-up in basisMerger and acquisition of its assets in purchase accounting.NES. As a result of continuing pre-tax losses incurred subsequent to the Merger, as of September 30, 2010,2012, excluding the U.S. deferred tax liabilities on indefinite-lived intangible assets, the Company’s deferred tax assets exceed its deferred tax liabilities in the U.S. Further, as of September 30, 2010,and the Company is in a three-year cumulative book taxable loss position in the U.S.
Further, as a result of operational losses and continued business restructuring accruals in Germany, Spain and France as well as intercompany interest expense in Luxembourg, the Company’s subsidiaries in Germany, Luxembourg, Spain and France are in a three-year cumulative book taxable loss position.
In assessing the realization of U.S. deferred tax assets, the Company considers whether it is more likely than not that some portion or all of the deferred tax assets will not be realized. The Company considered the scheduled reversal of U.S. deferred tax assets and liabilities, projected future U.S. taxable income, and certain distinct tax planning strategies in making this assessment. Based on this assessment in fiscal 20092012, 2011 and 2010, the Company determined that it is more likely than not that the U.S., German, Luxembourg, Spanish and French deferred tax assets will not be realized to the extent they exceed the scheduled reversal of deferred tax liabilities will not be realized.liabilities. Accordingly, the Company has provided a valuation allowance against its U.S.these net deferred tax assets which has and will continue to adversely affect its effective income tax rate.
At September 30, 2010,2012, the valuation allowance of $1,094$1,527 million is comprised of $786$962 million relating to U.S. deferred tax assets and $308$565 million relating to foreign deferred tax assets for which $180$260 million, $255 million and $24 million relates to
its the Company’s German, operations.Luxembourg and French subsidiaries, respectively. In fiscal 2010,2012, the Company recorded an increase of $356$117 million to its valuation allowance. The increase in the valuation allowance is comprised of a $330$60 million charge included in the provision for income taxes (which includes $135 million charge for federal and international income taxes, $56 million release of valuation allowance associated with federal tax expense on net gains in other comprehensive income and $19 million benefit for state income taxes) and a $57 million change to net deferred tax assets primarily related to other changes in other comprehensive income.
As of September 30, 2012, the Company changed its indefinite reinvestment of undistributed foreign earnings assertion with respect to its non-U.S. subsidiaries. As a result the Company recorded a deferred tax
liability of $74 million related to the foreign earnings. The tax charge was partially offset by the release of $57 million of valuation allowance in the U.S., with the residual charge of $17 million relating to non-U.S. taxes. In the future, the Company will continue to evaluate whether or not to indefinitely reinvest future undistributed foreign earnings.
During the fourth quarter of fiscal 2012, the Company recorded a correction to prior year deferred tax assets and liabilities for certain non-U.S. legal entities. This adjustment decreased the provision for income taxes by $9 million. Without this adjustment the Company’s provision for income taxes would have been $17 million for the year ended September 30, 2012. The Company evaluated the correction in relation to the current quarter and the year ended September 30, 2012, as well as the periods in which the adjustment originated, and concluded that the adjustment is not material to the current year and any prior quarter or year.
The Company has not provided for U.S. deferred income taxes or foreign withholding taxes on $263 million and $286 million of undistributed earnings of its non-U.S. subsidiaries as of September 30, 2009 and 2010, respectively, since the Company intends to reinvest these earnings indefinitely.
On October 1, 2007, the Company adopted the provisions of ASC 740-10 related to uncertain tax positions. The Company’s policy is to include interest and penalties related to income taxes within the provision for income taxes did not change as a result of the adoption. Included in the calculation of benefit from income taxes for fiscal 2008 is interest expense of $6 million.taxes. Included in the calculation of provision for income taxes in fiscal 20092012, 2011 and fiscal 2010 is interest expense of $6$2 million, interest benefit of $1 million and interest benefit of $10 million, respectively. As of September 30, 2010,2012, the Company had gross unrecognized tax benefits (“UTB”) of $185$248 million. Also, included in non-current liabilities is $7$9 million relating to audits by state and local and foreign taxing authorities for the periods prior to the Company’s separation from Alcatel-Lucent pursuant to the Company’s Tax Sharing Agreement. Further, an additional $28$37 million for gross interest and penalties relating to these amounts had been classified as non-current liabilities. At this time, the Company is unable to make a reasonably reliable estimate of the timing of payments in connection with these tax liabilities.
The Company files corporate income tax returns with the federal government in the U.S. and with multiple U.S. state and local jurisdictions and non-U.S. tax jurisdictions. In the ordinary course of business these income tax returns will be examined by the tax authorities. The Internal Revenue Service (“IRS”) has completedconcluded its examination of Avaya Inc.’sthe Company’s U.S. Federal income tax returns for fiscal years ended September 30, 2005 and 2006 and is now beginning its examination for fiscal years ended September 30, 2009,2007, 2008 and 2007 and for2009, including the period from October 1, 2007 through October 26, 2007. The settlement had an inconsequential impact on the tax provision for fiscal 2012. Various state, local, and foreign income tax returns are under examination by taxing authorities for tax years ranging from 2001 through 2008, including those income tax returns filed with the German, U.K. and Canadian tax authorities.2011. It is reasonably possible that the total amount of UTB will increase or decrease in the next 12 months as a result of these examinations; however, quantification of an estimated range cannot be made at this time.
The following table summarizes the changes in the gross UTBsUTB liability for fiscal 20102012, 2011 and 2009:2010:
In millions | ||||||||
Gross UTB balance at September 30, 2008 | $ | 224 | ||||||
Additions based on tax positions relating to the period | 4 | |||||||
Additions based on tax positions relating to prior periods | 5 | |||||||
Gross UTB balance at September 30, 2009 | 233 | |||||||
Gross UTB balance at October 1, 2009 | $ | 233 | ||||||
Additions based on tax positions relating to the period | 15 | 15 | ||||||
Additions based on tax positions relating to prior periods | 12 | 12 | ||||||
Settlements with taxing authorities | (70 | ) | (70 | ) | ||||
Statute of limitations expirations | (5 | ) | (5 | ) | ||||
| ||||||||
Gross UTB balance at September 30, 2010 | $ | 185 | 185 | |||||
Additions based on tax positions relating to the period | 36 | |||||||
Additions based on tax positions relating to prior periods | 17 | |||||||
Settlements with taxing authorities | (7 | ) | ||||||
Statute of limitations expirations | (5 | ) | ||||||
| ||||||||
Gross UTB balance at September 30, 2011 | 226 | |||||||
Additions based on tax positions relating to the period | 28 | |||||||
Change to tax positions relating to prior periods | (1 | ) | ||||||
Settlements with taxing authorities | (4 | ) | ||||||
Statute of limitations expirations | (1 | ) | ||||||
| ||||||||
Gross UTB balance at September 30, 2012 | $ | 248 | ||||||
| ||||||||
Interim periods six months ended March 31, 2010 and 2011 (unaudited)
The provision for income taxes for the six months ended March 31, 2011 was $41 million, as compared to the benefit from income taxes for the six months ended March 31, 2010 of $16 million. The effective tax rate for the six months ended March 31, 2011 was 7.2% and the benefit rate for the six months ended March 31, 2010 was 3.7%, and differs from the U.S. Federal tax rate primarily due to the effect of taxable income in non-U.S.
jurisdictions and due to the valuation allowance established against the Company’s U.S. deferred tax assets. The tax benefit for the six months ended March 31, 2010 includes a $10 million reduction in the Company’s unrecognized tax benefits due to the settlement of a global tax issue plus the reversal of interest in the amount of $5 million.
13. Benefit Obligations
Fiscal years 2009Pension, Postretirement and 2010
Pension and PostretirementPostemployment Benefits
The Company sponsors non-contributory defined benefit pension plans covering a portion of its U.S. employees and retirees, and postretirement benefit plans forcovering a portion of its U.S. retirees that include healthcare benefits and life insurance coverage. The Company froze benefit accruals and additional participation in the pension and postretirement plan for its U.S. management employees effective December 31, 2003. Effective May 24, 2009, the Company entered into a new three-year collective bargaining agreement (the “Agreement”) with the Communications Workers of America (“CWA”) and the International Brotherhood of Electrical Workers (“IBEW”). The Agreement affects the level of pension and postretirement benefits available to U.S. employees of the Company who are represented by the CWA or IBEW (“represented employees”).
Certain non-U.S. operations have various retirement benefit programs covering substantially all of their employees. Some of these programs are considered to be defined benefit pension plans for accounting purposes.
The Company froze benefit accruals and additional participation in the pension and postretirement plans for its U.S. management employees effective December 31, 2003. On August 28, 2012, the Company approved an amendment to the postretirement plan for its U.S. management employees effective January 1, 2013, to terminate retiree dental coverage and to cease providing medical and prescription drug coverage to a retiree, dependent, or lawful spouse who has attained age 65. The impact of the plan amendment was a $78 million reduction to the accumulated postretirement benefit obligation as of August 31, 2012.
Effective October 12, 2011 and November 18, 2011, the Company entered into a two-year contract extension through June 7, 2014 with the Communications Workers of America (“CWA”) and the International Brotherhood of Electrical Workers (“IBEW”), respectively. The contract extension did not affect the level of pension and postretirement benefits available to U.S. employees of the Company who are represented by the CWA or IBEW (“represented employees”). However, under the terms of the contract extension, the Voluntary Employee Beneficiary Association (“VEBA”) trust assets are expected to be exhausted in 2016, at which time represented participants will be required to contribute toward these benefits in order to maintain the same coverage. Under these circumstances, it is expected that a portion of the participants will opt-out of coverage. The Company has revised its actuarial assumptions to reflect this expectation, which resulted in a $50 million reduction to the accumulated postretirement benefit obligation as of September 30, 2012.
The Company’s general funding policy with respect to the qualified pension plans is to contribute amounts at least sufficient to satisfy the minimum amount required by applicable law and regulations, or to directly pay benefits where appropriate. Contributions to the U.S. pension plans were $18 million, $51 million, $2 millionin fiscal 2012 and $24 million, for fiscal 2010 and 2009 and for the period October 1, 2007 through October 26, 2007 and the period October 27, 2007 through September 30, 2008, respectively. Contributions to the non-U.S. pension plans were $20 million, $18 million, $1 million and $16 million, for fiscal 2010 and 2009 and for the period October 1, 2007 through October 26, 2007, the period October 27, 2007 through September 30, 2008, respectively. The contributions to the U.S. pension plans for fiscal 2010 and 2009 and the period October 27, 2007 through September 30, 2008 included2011 consisted of payments totalingof $6 million, $8 million and $6 million respectively, for certain pension benefits that were not pre-funded. Cashpre-funded, and cash contributions of $12 million, $43 million, $2$95 million and $18$69 million were made to satisfy the minimum statutory funding requirements, for fiscal 2010 and 2009 and the period October 1, 2007 through October 26, 2007, the period October 27, 2007 through September 30, 2008, respectively. In fiscal 2011,2013, the Company estimates that it will make payments totalingcontributions of $7 million for certain U.S. pension benefits that are not pre-funded, contributions totaling $72$102 million to satisfy the minimum statutory funding requirements in the U.S. and contributions totaling $24$27 million for non-U.S. plans.
Most postretirementpost-retirement medical benefits are not pre-funded. Consequently, the Company makes payments directly to the claims administrator as these retiree medical benefitsbenefit claims are disbursed. However,These payments are funded by the Company up to the maximum contribution amounts specified in the plan documents and contract with the CWA and IBEW, and contributions from the participants, if required. In addition to these payments, in compliance with the terms of the Agreementcontract with the CWA and IBEW, the Company agreed to contribute $5 million at the beginning of each calendar year 2010 through 2012, the Company contributed an additional $5 million to the represented employees’ post-retirement health trust to fund retirement medical benefits for the U.S. represented employees. The Company and its Predecessor company Avaya Inc. also had a contractual obligation to contribute $47 million each calendar year 2007 through 2009 in compliance with the terms of a 2006 agreement between the Predecessor company Avaya Inc. and the CWA and IBEW, which was fulfilled by the Company’s final contribution of $12 million during the first quarter of fiscal 2010. At the end of each calendar year, any unused portion of the contributions will beis carried forward to offset the subsequent year’s retiree medical and dental costs, if any, which would otherwise be the obligation of the retirees. As a result, contributions plusIn fiscal 2013, the Company estimates payments for retiree medical and dental benefits were $70 million, $66 million, $5 million and $60 million, for fiscal 2010 and 2009 and for the period October 1, 2007 through October 26, 2007 and the period October 27, 2007 through September 30, 2008, respectively. In fiscal 2011, estimated contributions plus payments for retiree medical and dental benefitswill total $61$49 million.
A reconciliation of the changes in the benefit obligations and fair value of assets of the defined benefit pension and postretirement plans, the funded status of the plans, and the amounts recognized in the Consolidated Balance Sheets is provided in the tablestable below:
| Pension Benefits U.S. | Pension Benefits Non-U.S. | Postretirement Benefits | Pension Benefits U.S. | Pension Benefits Non-U.S. | Postretirement Benefits | |||||||||||||||||||||||||||||||||||||||||||
| September 30, | September 30, | September 30, | September 30, | September 30, | September 30, | |||||||||||||||||||||||||||||||||||||||||||
In millions | 2009 | 2010 | 2009 | 2010 | 2009 | 2010 | 2012 | 2011 | 2012 | 2011 | 2012 | 2011 | ||||||||||||||||||||||||||||||||||||
CHANGE IN BENEFIT OBLIGATION | ||||||||||||||||||||||||||||||||||||||||||||||||
Benefit obligation as of beginning of period | $ | 2,449 | $ | 2,927 | $ | 371 | $ | 466 | $ | 592 | $ | 707 | $ | 3,323 | $ | 3,130 | $ | 479 | $ | 522 | $ | 702 | $ | 675 | ||||||||||||||||||||||||
Liability assumed in the Acquisition | — | — | — | 3 | — | — | ||||||||||||||||||||||||||||||||||||||||||
Liability assumed in the Acquisitions | — | — | 3 | — | — | — | ||||||||||||||||||||||||||||||||||||||||||
Service cost | 7 | 8 | 7 | 9 | 3 | 4 | 6 | 6 | 7 | 9 | 3 | 3 | ||||||||||||||||||||||||||||||||||||
Interest cost | 177 | 160 | 24 | 23 | 42 | 37 | 149 | 150 | 22 | 23 | 30 | 31 | ||||||||||||||||||||||||||||||||||||
Employee contributions | — | — | — | — | 15 | 15 | ||||||||||||||||||||||||||||||||||||||||||
Amendments | 11 | — | — | — | 13 | (12 | ) | — | — | — | — | (78 | ) | — | ||||||||||||||||||||||||||||||||||
Actuarial loss | 520 | 260 | 53 | 72 | 125 | 12 | ||||||||||||||||||||||||||||||||||||||||||
Actuarial loss (gain) | 288 | 260 | 96 | (56 | ) | (27 | ) | 57 | ||||||||||||||||||||||||||||||||||||||||
Benefits paid | (237 | ) | (225 | ) | (16 | ) | (18 | ) | (68 | ) | (73 | ) | (225 | ) | (223 | ) | (21 | ) | (20 | ) | (79 | ) | (79 | ) | ||||||||||||||||||||||||
Exchange rate movements | — | — | 21 | (32 | ) | — | — | — | — | (18 | ) | (5 | ) | — | — | |||||||||||||||||||||||||||||||||
Curtailments, settlements and other | — | — | 6 | (1 | ) | — | — | 1 | — | 3 | 6 | (2 | ) | — | ||||||||||||||||||||||||||||||||||
|
|
|
|
|
| |||||||||||||||||||||||||||||||||||||||||||
Benefit obligation as of end of period | $ | 2,927 | $ | 3,130 | $ | 466 | $ | 522 | $ | 707 | $ | 675 | $ | 3,542 | $ | 3,323 | $ | 571 | $ | 479 | $ | 564 | $ | 702 | ||||||||||||||||||||||||
|
|
|
|
|
| |||||||||||||||||||||||||||||||||||||||||||
CHANGE IN PLAN ASSETS | ||||||||||||||||||||||||||||||||||||||||||||||||
Fair value of plan assets as of beginning of period | $ | 2,051 | $ | 1,954 | $ | 27 | $ | 33 | $ | 125 | $ | 123 | $ | 2,099 | $ | 2,046 | $ | 37 | $ | 39 | $ | 137 | $ | 134 | ||||||||||||||||||||||||
Asset assumed in the Acquisitions | — | — | 3 | — | — | — | ||||||||||||||||||||||||||||||||||||||||||
Actual return on plan assets | 82 | 298 | 3 | 7 | — | 14 | 296 | 201 | 7 | (2 | ) | 22 | 3 | |||||||||||||||||||||||||||||||||||
Employer contributions | 51 | 18 | 18 | 20 | 66 | 70 | 101 | 75 | 22 | 21 | 58 | 63 | ||||||||||||||||||||||||||||||||||||
Employee contributions | — | — | — | — | 15 | 15 | ||||||||||||||||||||||||||||||||||||||||||
Benefits paid | (237 | ) | (225 | ) | (16 | ) | (18 | ) | (68 | ) | (73 | ) | (225 | ) | (223 | ) | (21 | ) | (20 | ) | (79 | ) | (79 | ) | ||||||||||||||||||||||||
Exchange rate movements | — | — | 1 | (2 | ) | — | — | — | — | (1 | ) | (1 | ) | — | — | |||||||||||||||||||||||||||||||||
Settlements and other | 7 | 1 | — | (1 | ) | — | — | — | — | — | — | — | 1 | |||||||||||||||||||||||||||||||||||
|
|
|
|
|
| |||||||||||||||||||||||||||||||||||||||||||
Fair value of plan assets as of end of period | $ | 1,954 | $ | 2,046 | $ | 33 | $ | 39 | $ | 123 | $ | 134 | $ | 2,271 | $ | 2,099 | $ | 47 | $ | 37 | $ | 153 | $ | 137 | ||||||||||||||||||||||||
|
|
|
|
|
| |||||||||||||||||||||||||||||||||||||||||||
AMOUNT RECOGNIZED IN THE CONSOLIDATED BALANCE SHEETS CONSISTS OF: | ||||||||||||||||||||||||||||||||||||||||||||||||
Noncurrent assets | $ | — | $ | — | $ | — | $ | — | $ | — | $ | — | $ | — | $ | — | $ | — | $ | — | $ | — | $ | — | ||||||||||||||||||||||||
Accrued benefit liability, current | (7 | ) | (7 | ) | (18 | ) | (20 | ) | (66 | ) | (63 | ) | (7 | ) | (7 | ) | (25 | ) | (23 | ) | (51 | ) | (63 | ) | ||||||||||||||||||||||||
Accrued benefit liability, noncurrent | (966 | ) | (1,077 | ) | (415 | ) | (463 | ) | (518 | ) | (478 | ) | (1,264 | ) | (1,217 | ) | (499 | ) | (419 | ) | (360 | ) | (502 | ) | ||||||||||||||||||||||||
|
|
|
|
|
| |||||||||||||||||||||||||||||||||||||||||||
Net amount recognized | $ | (973 | ) | $ | (1,084 | ) | $ | (433 | ) | $ | (483 | ) | $ | (584 | ) | $ | (541 | ) | $ | (1,271 | ) | $ | (1,224 | ) | $ | (524 | ) | $ | (442 | ) | $ | (411 | ) | $ | (565 | ) | ||||||||||||
|
|
|
|
|
| |||||||||||||||||||||||||||||||||||||||||||
AMOUNT RECOGNIZED IN ACCUMULATED OTHER COMPREHENSIVE LOSS (PRE-TAX) CONSISTS OF: | ||||||||||||||||||||||||||||||||||||||||||||||||
Net prior service cost | $ | 10 | $ | 9 | $ | — | $ | — | $ | 12 | $ | (5 | ) | |||||||||||||||||||||||||||||||||||
Net prior service cost (credit) | $ | 6 | $ | 8 | $ | — | $ | — | $ | (87 | ) | $ | (8 | ) | ||||||||||||||||||||||||||||||||||
Net actuarial loss | 867 | 979 | 1 | 68 | 94 | 103 | 1,211 | 1,148 | 104 | 14 | 116 | 164 | ||||||||||||||||||||||||||||||||||||
|
|
|
|
|
| |||||||||||||||||||||||||||||||||||||||||||
Net amount recognized | $ | 877 | $ | 988 | $ | 1 | $ | 68 | $ | 106 | $ | 98 | $ | 1,217 | $ | 1,156 | $ | 104 | $ | 14 | $ | 29 | $ | 156 | ||||||||||||||||||||||||
|
|
|
|
|
| |||||||||||||||||||||||||||||||||||||||||||
In connection with the acquisition of Radvision in fiscal 2010, an amendment to2012, the Company assumed a defined benefit pension plan consisting of a projected benefit obligation and plan assets both valued at $3 million as of the acquisition date. Also, as a result of restructuring initiatives during fiscal 2012, the U.S. pension and postretirement benefit planplans for U.S. salaried employees, which placed a cap on the amount of basic life insurance coverage for participants who retired effective January 1, 2010 or later, resulted in a $12 million decrease to the Company’s postretirement benefit obligation. In fiscal 2009, plan amendments to increase the pension benefit for U.S. represented employees, who terminated employment on or after July 1, 2009 and to contribute $5 million at the beginning of each calendar year 2010 through 2012 to fund retirement medical benefits for U.S. represented employees pursuant to the terms of the Agreement, resulted incertain non-U.S. pension plans experienced a $11 million increase to the Company’s pension obligation and a $13 million increase to the Company’s postretirement benefit obligation. These amounts were charged to accumulated unrecognized postretirement benefit obligation in the periods the amendments were finalized.curtailment.
The following table provides the accumulated benefit obligation for all defined benefit pension plans and information for pension plans with an accumulated benefit obligation in excess of plan assets:
| U.S. Plans | Non - U.S. Plans | |||||||||||||||
| September 30, | September 30, | |||||||||||||||
In millions | 2009 | 2010 | 2009 | 2010 | ||||||||||||
Accumulated benefit obligation for all plans | $ | 2,927 | $ | 3,130 | $ | 452 | $ | 504 | ||||||||
Plans with accumulated benefit obligation in excess of plan assets | ||||||||||||||||
Projected benefit obligation | $ | 2,927 | $ | 3,130 | $ | 430 | $ | 514 | ||||||||
Accumulated benefit obligation | 2,927 | 3,130 | 425 | 500 | ||||||||||||
Fair value of plan assets | 1,954 | 2,046 | 3 | 34 | ||||||||||||
| U.S. Plans | Non - U.S. Plans | |||||||||||||||
| September 30, | September 30, | |||||||||||||||
In millions | 2012 | 2011 | 2012 | 2011 | ||||||||||||
Accumulated Benefit Obligation for all plans | $ | 3,542 | $ | 3,323 | $ | 554 | $ | 464 | ||||||||
Plans with Accumulated Benefit Obligation in Excess of Plan Assets | ||||||||||||||||
Projected Benefit Obligation | $ | 3,542 | $ | 3,323 | $ | 528 | $ | 443 | ||||||||
Accumulated Benefit Obligation | 3,542 | 3,323 | 517 | 436 | ||||||||||||
Fair Value of Plan Assets | 2,271 | 2,099 | 8 | 3 | ||||||||||||
Estimated future benefits expected to be paid in each of the next five fiscal years, and in aggregate for the five fiscal years thereafter, are presented below:
| Pension Benefits | Other Benefits | Federal Prescription Drug Subsidy Receipts | Pension Benefits | Other Benefits | Federal Prescription Drug Subsidy Receipts | |||||||||||||||||||||||||||
In millions | US | Non-U.S. | US | Non-U.S. | ||||||||||||||||||||||||||||
2011 | $ | 209 | $ | 22 | $ | 65 | $ | 1 | ||||||||||||||||||||||||
2012 | 210 | 23 | 62 | 2 | ||||||||||||||||||||||||||||
2013 | 210 | 25 | 54 | 3 | $ | 212 | $ | 25 | $ | 53 | $ | 2 | ||||||||||||||||||||
2014 | 210 | 25 | 51 | 3 | 212 | 25 | 49 | 2 | ||||||||||||||||||||||||
2015 | 209 | 25 | 50 | 3 | 212 | 25 | 46 | 2 | ||||||||||||||||||||||||
2016 - 2020 | 1,040 | 143 | 214 | 20 | ||||||||||||||||||||||||||||
2016 | 212 | 26 | 42 | 3 | ||||||||||||||||||||||||||||
2017 | 212 | 26 | 38 | 3 | ||||||||||||||||||||||||||||
2018 - 2022 | 1,059 | 144 | 157 | 21 | ||||||||||||||||||||||||||||
|
|
|
| |||||||||||||||||||||||||||||
Total | $ | 2,088 | $ | 263 | $ | 496 | $ | 32 | $ | 2,119 | $ | 271 | $ | 385 | $ | 33 | ||||||||||||||||
|
|
|
| |||||||||||||||||||||||||||||
The components of the pension net periodic benefit cost (credit) are provided in the tables below for the periods indicated:
| Pension Benefits - U.S. | ||||||||||||||||||||
| Predecessor | Successor | |||||||||||||||||||
| Period from October 1, 2007 through October 26, 2007 | Years ended September 30, | |||||||||||||||||||
In millions | 2008 | 2009 | 2010 | |||||||||||||||||
Components of net periodic benefit cost (credit) | ||||||||||||||||||||
Service cost | $ | 1 | $ | 10 | $ | 7 | $ | 8 | ||||||||||||
Interest cost | 14 | 156 | 177 | 160 | ||||||||||||||||
Expected return on plan assets | (17 | ) | (192 | ) | (197 | ) | (183 | ) | ||||||||||||
Amortization of unrecognized prior service cost | — | — | — | 1 | ||||||||||||||||
Amortization of previously unrecognized net actuarial loss | 2 | — | — | 33 | ||||||||||||||||
Net periodic benefit cost (credit) | $ | — | $ | (26 | ) | $ | (13 | ) | $ | 19 | ||||||||||
In millions Components of Net Periodic Benefit Cost Service cost Interest cost Expected return on plan assets Amortization of previously unrecognized net actuarial gain Curtailment, settlement gain Net periodic benefit cost Pension Benefits - Non-U.S. Predecessor Successor Period from
October 1, 2007
through
October 26, 2007 Years ended
September 30, 2008 2009 2010 $ 1 $ 9 $ 7 $ 9 2 21 24 23 — (1 ) (2 ) (2 ) — — (2 ) — — — 1 1 $ 3 $ 29 $ 28 $ 31
The components of the postretirement net periodic benefit costpension plans are provided in the table belowbelow:
| Pension Benefits - U.S. | Pension Benefits - Non-U.S. | |||||||||||||||||||||||
| Year ended September 30, | Year ended September 30, | |||||||||||||||||||||||
In millions | 2012 | 2011 | 2010 | 2012 | 2011 | 2010 | ||||||||||||||||||
Components of net periodic benefit cost (credit) | ||||||||||||||||||||||||
Service cost | $ | 6 | $ | 6 | $ | 8 | $ | 7 | $ | 9 | $ | 9 | ||||||||||||
Interest cost | 149 | 150 | 160 | 22 | 23 | 23 | ||||||||||||||||||
Expected return on plan assets | (171 | ) | (174 | ) | (183 | ) | (2 | ) | (2 | ) | (2 | ) | ||||||||||||
Amortization of unrecognized prior service cost | 1 | 1 | 1 | — | — | — | ||||||||||||||||||
Amortization of previously unrecognized net actuarial loss | 101 | 64 | 33 | — | 1 | — | ||||||||||||||||||
Curtailment, settlement loss | 2 | — | — | 3 | 7 | 1 | ||||||||||||||||||
|
|
|
|
|
|
|
|
|
|
|
| |||||||||||||
Net periodic benefit cost | $ | 88 | $ | 47 | $ | 19 | $ | 30 | $ | 38 | $ | 31 | ||||||||||||
|
|
|
|
|
|
|
|
|
|
|
| |||||||||||||
The components of net periodic benefit cost (credit) for the periods indicated:postretirement plans are provided in the table below:
| Postretirement Benefits - U.S. | ||||||||||||||||||||||||||||||||
| Predecessor | Successor | Postretirement Benefits - U.S. | ||||||||||||||||||||||||||||||
| Period from October 1, 2007 through October 26, 2007 | Years ended September 30, | Year ended September 30, | ||||||||||||||||||||||||||||||
In millions | 2008 | 2009 | 2010 | 2012 | 2011 | 2010 | ||||||||||||||||||||||||||
Components of Net Periodic Benefit Cost | ||||||||||||||||||||||||||||||||
Components of net periodic benefit cost (credit) | ||||||||||||||||||||||||||||||||
Service cost | $ | — | $ | 4 | $ | 3 | $ | 4 | $ | 3 | $ | 3 | $ | 4 | ||||||||||||||||||
Interest cost | 3 | 38 | 42 | 37 | 30 | 31 | 37 | |||||||||||||||||||||||||
Expected return on plan assets | — | (8 | ) | (10 | ) | (12 | ) | (11 | ) | (11 | ) | (12 | ) | |||||||||||||||||||
Amortization of unrecognized prior service cost | 3 | — | 1 | 5 | 1 | 4 | 5 | |||||||||||||||||||||||||
Amortization of previously unrecognized net actuarial loss | — | — | — | 1 | 8 | 2 | 1 | |||||||||||||||||||||||||
|
|
| ||||||||||||||||||||||||||||||
Net periodic benefit cost | $ | 6 | $ | 34 | $ | 36 | $ | 35 | $ | 31 | $ | 29 | $ | 35 | ||||||||||||||||||
|
|
| ||||||||||||||||||||||||||||||
Other changes in plan assets and benefit obligations recognized in other comprehensive loss are provided in the table below:
| Pension Benefits - U.S. | Pension Benefits - Non-U.S. | Postretirement Benefits - U.S. | ||||||||||||||||||||||
| Year ended September 30, | Year ended September 30, | Year ended September 30, | ||||||||||||||||||||||
In millions | 2012 | 2011 | 2012 | 2011 | 2012 | 2011 | ||||||||||||||||||
Net loss (gain) | $ | 165 | $ | 234 | $ | 94 | $ | (46 | ) | $ | (40 | ) | $ | 64 | ||||||||||
Prior service cost (credit) | — | — | — | — | (78 | ) | — | |||||||||||||||||
Amortization of prior service cost (credit) | (1 | ) | (1 | ) | — | — | (1 | ) | (4 | ) | ||||||||||||||
Amortization of net loss (gain) | (101 | ) | (64 | ) | — | (1 | ) | (8 | ) | (2 | ) | |||||||||||||
Prior service cost (credit) and net loss (gain) recognition due to curtailment | (2 | ) | — | (3 | ) | (7 | ) | — | — | |||||||||||||||
|
|
|
|
|
|
|
|
|
|
|
| |||||||||||||
Total recognized in other comprehensive loss | $ | 61 | $ | 169 | $ | 91 | $ | (54 | ) | $ | (127 | ) | $ | 58 | ||||||||||
|
|
|
|
|
|
|
|
|
|
|
| |||||||||||||
Total recognized in net periodic benefit cost and other comprehensive loss | $ | 149 | $ | 216 | $ | 121 | $ | (16 | ) | $ | (96 | ) | $ | 87 | ||||||||||
|
|
|
|
|
|
|
|
|
|
|
| |||||||||||||
The estimated amounts to be amortized from accumulated other comprehensive income/loss into net periodic benefit cost during fiscal 20112013 are provided in the table below:
In millions | Pension Benefits U.S. | Pension Benefits Non-US | Postretirement Benefits | Pension Benefits - US | Pension Benefits - Non-US | Postretirement Benefits | ||||||||||||||||||
Amortization of prior service cost | $ | 1 | $ | — | $ | 3 | $ | 1 | $ | — | $ | (15 | ) | |||||||||||
Recognized net actuarial loss | 64 | 1 | 2 | 126 | 5 | 7 | ||||||||||||||||||
|
|
| ||||||||||||||||||||||
| $ | 65 | $ | 1 | $ | 5 | $ | 127 | $ | 5 | $ | (8 | ) | ||||||||||||
|
|
| ||||||||||||||||||||||
The weighted-averageweighted average assumptions used to determine the projected benefit obligation and net periodic benefit cost for the pension and postretirement plans are provided in the tables below for the periods indicated:table below:
| Pension Benefits - U.S. | Pension Benefits - Non- U.S. | |||||||||||||||
| September 30, 2009 | September 30, 2010 | September 30, 2009 | September 30, 2010 | |||||||||||||
Weighted-average assumptions used to determine benefit obligations | ||||||||||||||||
Discount rate | 5.65 | % | 4.95 | % | 5.55 | % | 4.34 | % | ||||||||
Rate of compensation increase | 4.00 | % | 4.00 | % | 3.29 | % | 3.28 | % | ||||||||
| Pension Benefits - U.S. | ||||||||||||||||||||
| Predecessor | Successor | |||||||||||||||||||
| Period from October 1, 2007 through October 26, 2007 | Years ended September 30, | |||||||||||||||||||
| 2008 | 2009 | 2010 | ||||||||||||||||||
Weighted-average assumptions used to determine net periodic benefit cost | ||||||||||||||||||||
Discount rate | 6.30 | % | 6.30 | % | 7.60 | % | 5.65 | % | ||||||||||||
Expected return on plan assets | 9.00 | % | 9.00 | % | 8.75 | % | 8.50 | % | ||||||||||||
Rate of compensation increase | 4.00 | % | 4.00 | % | 4.00 | % | 4.00 | % | ||||||||||||
| Pension Benefits - Non-U.S. | Pension Benefits - U.S. | Pension Benefits - Non-U.S. | Postretirement Benefits | |||||||||||||||||||||||||||||||||||||||||
| Predecessor | Successor | September 30, | September 30, | September 30, | ||||||||||||||||||||||||||||||||||||||||
| Period from October 1, 2007 through October 26, 2007 | Years ended September 30, | 2012 | 2011 | 2012 | 2011 | 2012 | 2011 | |||||||||||||||||||||||||||||||||||||
| 2008 | 2009 | 2010 | ||||||||||||||||||||||||||||||||||||||||||
Weighted-average assumptions used to determine net periodic benefit cost | ||||||||||||||||||||||||||||||||||||||||||||
Weighted-average assumptions used to determine benefit obligations | ||||||||||||||||||||||||||||||||||||||||||||
Discount rate | 5.26 | % | 5.26 | % | 6.70 | % | 5.55 | % | 3.94 | % | 4.65 | % | 3.61 | % | 4.99 | % | 3.81 | % | 4.58 | % | ||||||||||||||||||||||||
Expected return on plan assets | 5.17 | % | 5.17 | % | 6.34 | % | 5.28 | % | ||||||||||||||||||||||||||||||||||||
Rate of compensation increase | 3.16 | % | 3.20 | % | 3.22 | % | 3.29 | % | 4.00 | % | 4.00 | % | 3.37 | % | 3.37 | % | 4.00 | % | 4.00 | % | ||||||||||||||||||||||||
The weighted average assumptions used to determine the accumulated postretirement benefit obligation and net periodic benefit cost for the pension and postretirement plans are provided in the tables below as of and for the periods presented:below:
| Postretirement Benefits | Pension Benefits - U.S. | Pension Benefits - Non-U.S. | ||||||||||||||||||||||||||||||
| September 30, 2009 | September 30, 2010 | Year ended September 30, | Year ended September 30, | |||||||||||||||||||||||||||||
Weighted-average assumptions used to determine benefit obligations | ||||||||||||||||||||||||||||||||
| 2012 | 2011 | 2010 | 2012 | 2011 | 2010 | |||||||||||||||||||||||||||
Weighted-average assumptions used to determine net periodic benefit cost | ||||||||||||||||||||||||||||||||
Discount rate | 5.50 | % | 4.85 | % | 4.65 | % | 4.95 | % | 5.65 | % | 4.99 | % | 4.34 | % | 5.55 | % | ||||||||||||||||
Expected return on plan assets | 8.50 | % | 8.50 | % | 8.50 | % | 5.11 | % | 4.12 | % | 5.28 | % | ||||||||||||||||||||
Rate of compensation increase | 4.00 | % | 4.00 | % | 4.00 | % | 4.00 | % | 4.00 | % | 3.37 | % | 3.28 | % | 3.29 | % | ||||||||||||||||
| Postretirement Benefits | ||||||||||||||||||||||||||||||||
| Predecessor | Successor | Postretirement Benefits | ||||||||||||||||||||||||||||||
| Period from October 1, 2007 through October 26, 2007 | Years ended September 30, | Year ended September 30, | ||||||||||||||||||||||||||||||
| 2008 | 2009 | 2010 | 2012 | 2011 | 2010 | |||||||||||||||||||||||||||
Weighted-average assumptions used to determine net periodic benefit cost | ||||||||||||||||||||||||||||||||
Discount rate | 6.23 | % | 6.23 | % | 7.58 | % | 5.50 | % | 4.58 | % | 4.85 | % | 5.50 | % | ||||||||||||||||||
Expected return on plan assets | 7.00 | % | 7.00 | % | 6.75 | % | 8.00 | % | 7.50 | % | 7.50 | % | 8.00 | % | ||||||||||||||||||
Rate of compensation increase | 4.00 | % | 4.00 | % | 4.00 | % | 4.00 | % | 4.00 | % | 4.00 | % | 4.00 | % | ||||||||||||||||||
The discount rate is subject to change each year, consistent with changes in rates of return on high-quality fixed-income investments currently available and expected to be available during the expected benefit payment period. TheAs of September 30, 2012, the Company selects the assumed discount rate for its U.S. pension and postretirement plans by applying the published rates of existingfrom the AonHewitt AA Only and AonHewitt AA Only Above Median yield curves such as the Citigroup Pension Discount Curve and the Citigroup Above Median Pension Discount Curve, to the expected benefit payment streams and develops a rate at which it is believed the benefit obligations could be effectively settled. Previously, the Company applied rates from the Citigroup Pension Discount Curve and the Citigroup Above Median Pension Discount Curve. The Company follows a similar process for its non-U.S. pension plans by applying the published iBoxx indices. Based on the published rates as of September 30, 2010,2012, the Company used a weighted average discount rate of 4.95%for fiscal 2013 is 3.94% for the U.S. pension plans, 4.34%3.61% for the non-U.S. pension plans, and 4.85%3.81% for the postretirement plans, a decrease of 7071 basis points, 121138 basis points and 6577 basis points, respectively, from the rates used as of September 30, 2009.2011. As of September 30, 2010,2012, this had the effect of increasing the projected U.S. andpension benefit obligation, non-U.S. pension benefit obligations by approximately $229 millionobligation, and $83 million, respectively, and the accumulated postretirement benefit obligation by approximately $42 million.$272 million, $106 million, and $38 million, respectively. For fiscal 2011,2013, this has the effect of increasing the U.S. pension and postretirement service cost by approximatelyless than $1 million.
The expected long-term rate of return on U.S. pension and postretirement plan assets is selected by applying forward-looking capital market assumptions to the strategic asset allocation approved by the governing body for each plan. The forward-looking capital market assumptions are developed by an investment adviser and reviewed
by the Company for reasonableness. The return and risk assumptions consider such factors as anticipated long-term performance of individual asset classes, risk premium for active management based on qualitative and quantitative analysis, and correlations of the asset classes that comprise the asset portfolio.
Based on an analysis of the U.S. qualified pension plans completed in fiscal 2010,2012, the expected long-term rate of return for fiscal 2011 will remain unchanged at 8.50%.2013 is 8.0%, a reduction of 50 basis points from fiscal 2012. A 25 basis point change in the expected long-term rate of return will result in approximately a $5 million change in pension expense.
Based on an analysis of the postretirement plans completed in fiscal 2010, the weighted average targeted asset allocation for the postretirement plans changed from 68% equity securities/32% debt securities to 55% equity securities/45% debt securities. Based on application of the investment adviser’s capital market assumptions to the targeted asset allocation,2012, the expected long-term rate of return for fiscal 2011 was changed2013 is 7.0%, a reduction of 50 basis points from 8.0% to 7.5%. Thefiscal 2012. A 25 basis point change in the expected long-term rate of return will result in approximately a $1 million increasechange in postretirement expense.expense of less than $1 million.
The assumed health care cost trend rates for postretirement benefit plans were as follows:
| September 30, 2009 | September 30, 2010 | September 30, 2012 | September 30, 2011 | |||||||||||||
Health care cost trend rate assumed for next year | 7.8 | % | 9.4 | % | 8.4 | % | 8.9 | % | ||||||||
Rate to which the cost trend rate is assumed to decline (ultimate trend rate) | 5.5 | % | 5.5 | % | 5.0 | % | 5.5 | % | ||||||||
Year that the rate reaches the ultimate trend rate | 2014 | 2019 | 2020 | 2019 | ||||||||||||
The Company’s cost for postretirement healthcare claims is capped and the projected postretirement healthcare claims exceed the cap. Therefore, postretirement healthcare trend rates have little or no effect on the amounts reported for the postretirement health care plan. As of September 30, 2010,2012, neither a one-percentage-point increase nor a one-percentage-point decrease in the Company’s healthcare cost trend rates would have any impact on the postretirement benefit obligation and the service and interest cost components of net periodic benefit cost.
The weighted-average asset allocation of the pension and postretirement plans by asset category and target allocation is as follows:
| Pension Plan Assets - U.S. | Pension Plan Assets - Non-U.S. | Postretirement Plan Assets | Pension Plan Assets - U.S. | Pension Plan Assets - Non-U.S. | Postretirement Plan Assets | |||||||||||||||||||||||||||||||||||||||||||||||||||||||||||
| September 30, | Long-term Target | September 30, | September 30, | Long-term Target | September 30, | Long-term Target | September 30, | September 30, | Long-term Target | |||||||||||||||||||||||||||||||||||||||||||||||||||||||
Asset Category | 2009 | 2010 | 2009 | 2010 | 2009 | 2010 | 2012 | 2011 | 2012 | 2011 | 2012 | 2011 | ||||||||||||||||||||||||||||||||||||||||||||||||||||
Equity Securities | 35 | % | 33 | % | 36 | % | 12 | % | 17 | % | 66 | % | 54 | % | 55 | % | 24 | % | 24 | % | 30 | % | 7 | % | 8 | % | 53 | % | 52 | % | 55 | % | ||||||||||||||||||||||||||||||||
Debt Securities | 40 | % | 40 | % | 37 | % | 62 | % | 73 | % | 34 | % | 46 | % | 45 | % | 47 | % | 42 | % | 39 | % | 76 | % | 71 | % | 47 | % | 48 | % | 45 | % | ||||||||||||||||||||||||||||||||
Hedge Funds | 9 | % | 9 | % | 10 | % | 0 | % | 0 | % | 0 | % | 0 | % | 0 | % | 9 | % | 9 | % | 10 | % | — | — | — | — | — | |||||||||||||||||||||||||||||||||||||
Private Equity | 7 | % | 7 | % | 7 | % | 0 | % | 0 | % | 0 | % | 0 | % | 0 | % | 6 | % | 7 | % | 7 | % | — | — | — | — | — | |||||||||||||||||||||||||||||||||||||
Real Estate | 1 | % | 2 | % | 3 | % | 0 | % | 1 | % | 0 | % | 0 | % | 0 | % | 3 | % | 3 | % | 3 | % | — | — | — | — | — | |||||||||||||||||||||||||||||||||||||
Commodities | 2 | % | 1 | % | 3 | % | — | — | — | — | — | |||||||||||||||||||||||||||||||||||||||||||||||||||||
Other(1) | 8 | % | 9 | % | 7 | % | 26 | % | 9 | % | 0 | % | 0 | % | 0 | % | 9 | % | 14 | % | 8 | % | 17 | % | 21 | % | — | — | — | |||||||||||||||||||||||||||||||||||
|
|
|
|
|
|
|
| |||||||||||||||||||||||||||||||||||||||||||||||||||||||||
Total | 100 | % | 100 | % | 100 | % | 100 | % | 100 | % | 100 | % | 100 | % | 100 | % | 100 | % | 100 | % | 100 | % | 100 | % | 100 | % | 100 | % | 100 | % | 100 | % | ||||||||||||||||||||||||||||||||
|
|
|
|
|
|
|
| |||||||||||||||||||||||||||||||||||||||||||||||||||||||||
| (1) | The Other category for U.S. pension plan assets includes cash/cash equivalents and derivative financial instruments. The Other category for non-U.S. pension assets includes insurance contracts |
The Company’s asset investment strategy focuses on maintaining a diversified portfolio of professionally managed assets designed to optimize returns subject to a prudent level of risk. Risk management practices include diversification across asset classes and investment styles and periodic rebalancing toward asset allocation targets. An asset-liability study is performed on an annual basis for the pension plans, and on an as-necessary basis for the postretirement plans, to determine the optimal asset mix to meet future benefit obligations. The most recent pension asset-liability studies were completed in fiscal 2010.2012 for the pension plans and fiscal 2010 for the postretirement plans.
As part of the Company’s investment and risk management strategy, the U.S. pension plans enter into both derivatives and long bond portfolios to minimize their sensitivity to interest rate movements. The derivative financial instruments used in support of the interest rate risk management investment strategy include forwards, futures, swaptions and swaps. The use of derivative financial instruments for speculative purposes is prohibited by the Company’s investment policy.
Also, as part of the Company’s investment strategy, the U.S. pension plans invest in hedge funds, andreal estate funds, private equity and close-ended real estate fundscommodities to provide additional uncorrelated returns. All funds are broadly diversified to minimize exposure to any one specific investment.
The fair value of the plans’plan assets is measureddetermined by the trustee, and reviewed by the Company, using unadjusted quoted prices in an active market (classified as Level 1 within the fair value hierarchy discussedhierarchy) when available. Assets for which quoted market prices are not available are valued using other observable valuation inputs (classified as Level 2 within the fair value hierarchy) when available. Level 2 inputs include quoted prices for similar assets in Note 11, “Fair Value Measures.”
The following table summarizestables summarize the fair value of the U.S. pension plans assets by asset class as of September 30, 2010:class:
| Fair Value Measurements of U.S. Pension Assets as of September 30, 2012 | ||||||||||||||||||||||||||||||||
In millions | Level 1 | Level 2 | Level 3 | Total | Level 1 | Level 2 | Level 3 | Total | ||||||||||||||||||||||||
Cash and cash equivalents(a) | $ | 5 | $ | 116 | $ | — | $ | 121 | $ | — | $ | 19 | $ | — | $ | 19 | ||||||||||||||||
U.S. Government debt securities(b) | — | 209 | — | 209 | — | 283 | — | 283 | ||||||||||||||||||||||||
Corporate debt securities(c): | ||||||||||||||||||||||||||||||||
Investment grade | — | 201 | 4 | 205 | — | 311 | 5 | 316 | ||||||||||||||||||||||||
Other debt securities | — | 4 | — | 4 | — | 9 | — | 9 | ||||||||||||||||||||||||
Equity securities(d): | ||||||||||||||||||||||||||||||||
U.S. large/mid-cap | 98 | — | — | 98 | 65 | — | — | 65 | ||||||||||||||||||||||||
U.S. small cap | 52 | — | — | 52 | 26 | — | — | 26 | ||||||||||||||||||||||||
Non-U.S. EAFE | 73 | — | — | 73 | ||||||||||||||||||||||||||||
Non-U.S. equity | 70 | — | — | 70 | ||||||||||||||||||||||||||||
Real estate(e) | — | — | 42 | 42 | — | 7 | 70 | 77 | ||||||||||||||||||||||||
Private equity partnerships(f) | — | — | 150 | 150 | ||||||||||||||||||||||||||||
Private equity(f) | — | — | 123 | 123 | ||||||||||||||||||||||||||||
Investment funds(g): | ||||||||||||||||||||||||||||||||
Cash and cash equivalents | — | 134 | — | 134 | ||||||||||||||||||||||||||||
Investment grade corporate debt | — | 248 | — | 248 | — | 312 | — | 312 | ||||||||||||||||||||||||
High-yield debt | 34 | 34 | — | 68 | 40 | 41 | — | 81 | ||||||||||||||||||||||||
Emerging market debt | — | 80 | — | 80 | — | 76 | — | 76 | ||||||||||||||||||||||||
U.S. equity | — | 191 | — | 191 | — | 163 | — | 163 | ||||||||||||||||||||||||
Non-U.S. equity | — | 159 | — | 159 | — | 132 | — | 132 | ||||||||||||||||||||||||
Emerging market equity | — | 103 | — | 103 | — | 88 | — | 88 | ||||||||||||||||||||||||
Multi-strategy hedge funds(h) | — | 142 | 31 | 173 | — | 165 | 29 | 194 | ||||||||||||||||||||||||
Derivative instruments(i) | 1 | 79 | — | 80 | ||||||||||||||||||||||||||||
Commodities(i) | — | 52 | — | 52 | ||||||||||||||||||||||||||||
Derivative instruments(j) | — | 65 | — | 65 | ||||||||||||||||||||||||||||
Other plan assets (liabilities) | — | (10 | ) | — | (10 | ) | — | (14 | ) | — | (14 | ) | ||||||||||||||||||||
|
|
|
| |||||||||||||||||||||||||||||
Total plan assets at fair value | $ | 263 | $ | 1,556 | $ | 227 | $ | 2,046 | $ | 201 | $ | 1,843 | $ | 227 | $ | 2,271 | ||||||||||||||||
|
|
|
| |||||||||||||||||||||||||||||
In millions Cash and cash equivalents(a) U.S. Government debt securities(b) Corporate debt securities(c): Investment grade Other debt securities Equity securities(d): U.S. large/mid-cap U.S. small cap Non-U.S. equity Real estate(e) Private equity(f) Investment funds(g): Cash and cash equivalents Investment grade corporate debt High-yield debt Emerging market debt U.S. equity Non-U.S. equity Emerging market equity Multi-strategy hedge funds(h) Commodities(i) Derivative instruments(j) Other plan assets (liabilities) Total plan assets at fair value Fair Value Measurements of U.S. Pension Assets
as of September 30, 2011 Level 1 Level 2 Level 3 Total $ — $ 50 $ — $ 50 — 225 — 225 — 227 4 231 — 8 — 8 74 — — 74 39 — — 39 60 — — 60 — 7 61 68 — — 148 148 — 207 — 207 — 270 — 270 34 35 — 69 — 81 — 81 — 143 — 143 — 113 — 113 — 73 — 73 — 166 13 179 — 26 — 26 1 59 — 60 — (25 ) — (25 ) $ 208 $ 1,665 $ 226 $ 2,099
| (a) | Includes certificates of deposit, commercial paper, securities issued or guaranteed by the U.S. government or its agencies with less than one year to maturity, and repurchase agreements which are valued at cost plus accrued interest. |
| (b) | Includes U.S. treasury bonds, notes and inflation linked bonds, which are generally valued using institutional bid evaluations from various contracted pricing vendors. Institutional bid evaluations are estimated prices that represent the price a dealer would pay for a security. Pricing inputs to the institutional bid evaluation vary by security, and include benchmark yields, reported trades, unadjusted broker/dealer quotes, issuer spreads, bids, offers or other observable market data. |
| (c) | Includes |
| (d) | Includes U.S. and non-U.S. corporate stocks, which are generally valued using the composite close price from an active exchange. The composite close price is the last trade of the day and can come from any exchange on which the security trades. Generally, the last trade of the day comes from the primary exchange; therefore, the composite close and the primary close price are generally the same. |
| (e) | Includes open ended |
| (“NAV”) on either a monthly or quarterly basis. Shares can be redeemed at the NAV on a quarterly basis, provided a written redemption request is received in advance (generally 45—90 days) of the redemption date. Therefore, the undiscounted NAV is used as the fair value measurement. For limited partnerships, the fair value of the underlying assets and the capital account for each investor is determined by the General Partner (“GP”) |
discounted cash flow analysis, analysis of recent comparable sales transactions, actual sale negotiations and bona fide purchase offers received from third parties. The partnerships are typically funded over time as capital is needed to fund asset purchases, and distributions from the partnerships are received as the partnerships liquidate their underlying asset holdings. Therefore, the life cycle for a typical investment in a real estate limited partnership is expected to be approximately 10 years from initial funding. |
| (f) | Includes |
| (g) | Includes open-end funds and unit investment trusts that invest in various asset classes including: U.S. corporate debt, emerging market debt, U.S. equity and non-U.S equity. The funds and trusts account for their portfolio of assets at fair value and calculate the |
| (h) | Includes hedge fund of funds and |
| (i) | Consists of partnership interests in limited liability companies (“LLC”) that invest in long-only, unleveraged portfolios of exchange-traded, U.S. dollar-denominated futures and forward contracts in tangible commodities. The NAV of each LLC is determined at the end of each month. The underlying futures and forward contracts are valued based upon the settlement price on the exchanges where they are traded, and where there is no settlement price, value is based upon the last trade price. An investor can withdraw all or any portion of its capital account effective as of the last day of the calendar month. |
| (j) | Includes futures, options and swap agreements. Futures and options are generally valued using the last trade price at which a specific contract/security was last traded on the primary exchange, which is provided by a contracted vendor. If pricing is not available from the contracted vendor, then pricing is obtained from other sources such as Bloomberg, broker bid, ask/offer quotes or the investment manager. Swaps and Swaptions are generally valued by one of several contracted pricing vendors who use inputs such as interdealer broker rates and benchmark yields to create a |
| swap yield curve and determine price based on the terms of the swap. If pricing is not available through one of the contracted vendors, then pricing is obtained from another source such as the investment manager, who obtains the |
The following table summarizestables summarize the changes in fair value of Level 3 U.S. pension plan assets for the year ended September 30, 2010:assets:
| Level 3 U.S. Pension Plan Asset Activity | ||||||||||||||||||||||||
In millions | Corporate Debt Securities | Real Estate | Private Equity | Hedge Funds | Derivative Instruments | Total | ||||||||||||||||||
Balance at October 1, 2009 | $ | 7 | $ | 22 | $ | 140 | $ | 71 | $ | — | $ | 240 | ||||||||||||
Realized gains/(losses) | — | 6 | (5 | ) | 3 | 1 | 5 | |||||||||||||||||
Unrealized gains/(losses) relating to investments still held at the end of the period | 3 | (9 | ) | 19 | (3 | ) | — | 10 | ||||||||||||||||
Purchases, sales and settlements (net) | (6 | ) | 23 | (4 | ) | (13 | ) | (1 | ) | (1 | ) | |||||||||||||
Transfers in/(out) of Level 3 | — | — | — | (27 | ) | — | (27 | ) | ||||||||||||||||
Balance at September 30, 2010 | $ | 4 | $ | 42 | $ | 150 | $ | 31 | $ | — | $ | 227 | ||||||||||||
For real estate, private equity partnership interests and multi-strategy hedge funds and fund of hedge funds whose fair value is based on the NAV of the investment (or its equivalent), the attributes of the investments, such as the investment strategies of the investee, and any unfunded commitments and any restrictions on the Plan’s ability to redeem its investments at September 30, 2010, are presented below:
| Level 3 U.S. Pension Plan Asset Activity | ||||||||||||||||||||
| Fiscal year ended September 30, 2012 | ||||||||||||||||||||
In millions | Corporate Debt Securities | Real Estate | Private Equity | Hedge Funds | Total | |||||||||||||||
Balance at October 1, 2011 | $ | 4 | $ | 61 | $ | 148 | $ | 13 | $ | 226 | ||||||||||
Realized gains/(losses) | — | — | (11 | ) | 1 | (10 | ) | |||||||||||||
Unrealized gains/(losses) relating to investments still held at the end of the period | 1 | 6 | 17 | (1 | ) | 23 | ||||||||||||||
Purchases, sales and settlements (net) | — | 2 | (31 | ) | 16 | (13 | ) | |||||||||||||
Transfers in/(out) | — | 1 | — | — | 1 | |||||||||||||||
|
|
|
|
|
|
|
|
|
| |||||||||||
Balance at September 30, 2012 | $ | 5 | $ | 70 | $ | 123 | $ | 29 | $ | 227 | ||||||||||
|
|
|
|
|
|
|
|
|
| |||||||||||
In millions | Fair Value | Unfunded Commitments | Redemption Frequency | Redemption Notice Period | ||||||||||||
Real estate(a) | $ | 42 | $ | 19 | ||||||||||||
Private equity partnerships(b) | 150 | 26 | ||||||||||||||
Multi-strategy hedge funds(c) | 173 | — | | monthly, quarterly, semi-annually and annually | | 5 - 120 days | ||||||||||
Total | $ | 365 | $ | 45 | ||||||||||||
| Level 3 U.S. Pension Plan Asset Activity | ||||||||||||||||||||
| Fiscal year ended September 30, 2011 | ||||||||||||||||||||
In millions | Corporate Debt Securities | Real Estate | Private Equity | Hedge Funds | Total | |||||||||||||||
Balance at October 1, 2010 | $ | 4 | $ | 42 | $ | 150 | $ | 31 | $ | 227 | ||||||||||
Realized gains/(losses) | 4 | (1 | ) | 10 | — | 13 | ||||||||||||||
Unrealized gains relating to investments still held at the end of the period | — | 7 | 25 | 2 | 34 | |||||||||||||||
Purchases, sales and settlements (net) | (4 | ) | 13 | (37 | ) | (20 | ) | (48 | ) | |||||||||||
Transfers in/(out) | — | — | — | — | — | |||||||||||||||
|
|
|
|
|
|
|
|
|
| |||||||||||
Balance at September 30, 2011 | $ | 4 | $ | 61 | $ | 148 | $ | 13 | $ | 226 | ||||||||||
|
|
|
|
|
|
|
|
|
| |||||||||||
The following table summarizes the fair value of the non-U.S. pension plansplan assets by asset class:
| Fair Value Measurements of Non-U.S. Pension Assets as of September 30, 2010 | Fair Value Measurements of Non-U.S. Pension Assets as of September 30, 2012 | |||||||||||||||||||||||||||||||
In millions | Level 1 | Level 2 | Level 3 | Total | Level 1 | Level 2 | Level 3 | Total | ||||||||||||||||||||||||
Insurance contracts | $ | — | $ | 39 | $ | — | $ | 39 | ||||||||||||||||||||||||
Investment funds: | ||||||||||||||||||||||||||||||||
Equity securities | $ | — | $ | 3 | $ | — | $ | 3 | ||||||||||||||||||||||||
Debt securities | — | 1 | — | 1 | ||||||||||||||||||||||||||||
Insurance contracts(a) | — | 43 | — | 43 | ||||||||||||||||||||||||||||
|
|
|
| |||||||||||||||||||||||||||||
Total plan assets at fair value | $ | — | $ | 47 | $ | — | $ | 47 | ||||||||||||||||||||||||
|
|
|
| |||||||||||||||||||||||||||||
| Fair Value Measurements of Non-U.S. Pension Assets as of September 30, 2011 | ||||||||||||||||
In millions | Level 1 | Level 2 | Level 3 | Total | ||||||||||||
Insurance contracts(a) | $ | — | $ | 37 | $ | — | $ | 37 | ||||||||
|
|
|
|
|
|
|
| |||||||||
The non-U.S. pension plans are funded through insurance contracts, which provide for a guaranteed interest credit, and a profit-sharing adjustment based on the actual performance of the underlying investment assets of the insurer. The fair value of the contract is determined by the insurer based on the premiums paid by the Company plus interest credits plus the profit-sharing adjustment less benefit payments. The underlying assets of the insurer are invested in compliance with local rules or law, which tend to require a high allocation to fixed income securities. For example, in the Netherlands, where the pension plan assets account for 79% of the Company’s total non-U.S. pension assets, the insurer’s underlying asset allocation at September 30, 2010 was 79% bonds/21% equities, which is in line with the typical targeted allocation for Dutch insurance companies of 80% bonds/20% equities. Also, in Belgium, where the pension plan assets account for another 12% of the Company’s total non-U.S. pension assets, the insurer’s underlying asset allocation at September 30, 2010 was 83% bonds/9% equities/8% real estate in compliance with allocation limits set by Belgian law.
| (a) | Most non-U.S. pension plans are funded through insurance contracts, which provide for a guaranteed interest credit, and a profit-sharing adjustment based on the actual performance of the |
| underlying investment assets of the insurer. The fair value of the contract is determined by the insurer based on the premiums paid by the Company plus interest credits plus the profit-sharing adjustment less benefit payments. The underlying assets of the insurer are invested in compliance with local rules or law, which tend to require a high allocation to fixed income securities. For example, in the Netherlands, where the pension plan assets account for 74% of the Company’s total non-U.S. pension assets, the insurer’s underlying asset allocation at September 30, 2012 was 100% bonds. |
The following table summarizes the fair value of the postretirement plans assets by asset class:
| Fair Value Measurements of Postretirement Assets as of September 30, 2010 | Fair Value Measurements of Postretirement Assets as of September 30, 2012 | |||||||||||||||||||||||||||||||
In millions | Level 1 | Level 2 | Level 3 | Total | Level 1 | Level 2 | Level 3 | Total | ||||||||||||||||||||||||
Investment funds: | ||||||||||||||||||||||||||||||||
Blended asset fund(a) | $ | 8 | $ | — | $ | — | $ | 8 | $ | 10 | $ | — | $ | — | $ | 10 | ||||||||||||||||
Group life insurance contracts(b) | — | 126 | — | 126 | — | 143 | — | 143 | ||||||||||||||||||||||||
|
|
|
| |||||||||||||||||||||||||||||
Total plan assets at fair value | $ | 8 | $ | 126 | $ | — | $ | 134 | $ | 10 | $ | 143 | $ | — | $ | 153 | ||||||||||||||||
|
|
|
| |||||||||||||||||||||||||||||
| Fair Value Measurements of Postretirement Assets as of September 30, 2011 | ||||||||||||||||
In millions | Level 1 | Level 2 | Level 3 | Total | ||||||||||||
Investment funds: | ||||||||||||||||
Blended asset fund(a) | $ | 11 | $ | — | $ | — | $ | 11 | ||||||||
Group life insurance contracts(b) | — | 126 | — | 126 | ||||||||||||
|
|
|
|
|
|
|
| |||||||||
Total plan assets at fair value | $ | 11 | $ | 126 | $ | — | $ | 137 | ||||||||
|
|
|
|
|
|
|
| |||||||||
| (a) | An investment in a broadly diversified registered investment company (mutual fund). As of September 30, |
| (b) | The group life insurance contracts are held in a reserve of an insurance company that provides for investment of pre-funding amounts in a family of pooled separate accounts. The fair value of each group life insurance contract is primarily determined by the value of the units it owns in the pooled separate accounts that back the policy. Each of the pooled separate accounts provides a unit NAV on a daily basis, which is based on the fair value of the underlying assets owned by the account. The postretirement plans can transact daily at the unit NAV without restriction. As of September 30, |
Multi-employer Pension Plan
In connection with the Acquisition, the Company retained certain U.S. employees of NES that are covered by a multi-employer pension plan. Company contributions to this plan during fiscal 2012 and 2011 and the period from December 19, 2009 through September 30, 2010 were less than $1 million.
Savings Plans
Substantially all of the Company’s U.S. employees are eligible to participate in savings plans sponsored by the Company. The plans allow employees to contribute a portion of their compensation on a pre-tax and after-tax basis in accordance with specified guidelines. Avaya matches a percentage of employee contributions up to certain limits. From March 1, 2009 through March 31, 2010, the Company suspended its contributions to all non-represented employees. Pursuant to thea 2009 Agreement,agreement, the Company has suspended its contributions to all represented employees during the period January 1, 2010 through December 31, 2010. The Company’s expense related to these savings plans was $5 million, $17 million, $4 million and $45$18 million in fiscal 20102012 and 2009 and for the period October 1, 2007 through October 26, 2007 and the period October 27, 2007 through September 30, 2008, respectively.
Six Months Ended March 31, 2011 and 2010 (unaudited)
The components of the pension and postretirement net periodic benefit cost for the six months ended March 31, 2011 and 2010 are provided$5 million in the table below:fiscal 2010.
| Pension Benefits - U.S. | Pension Benefits - Non-U.S. | Postretirement Benefits - U.S. | ||||||||||||||||||||||
In millions | 2011 | 2010 | 2011 | 2010 | 2011 | 2010 | ||||||||||||||||||
| (Unaudited) | ||||||||||||||||||||||||
Components of Net Periodic Benefit Cost (Credit) | ||||||||||||||||||||||||
Service cost | $ | 3 | $ | 4 | $ | 5 | $ | 4 | $ | 2 | $ | 2 | ||||||||||||
Interest cost | 75 | 80 | 11 | 12 | 16 | 19 | ||||||||||||||||||
Expected return on plan assets | (87 | ) | (91 | ) | (1 | ) | — | (6 | ) | (6 | ) | |||||||||||||
Amortization of unrecognized prior service cost | 1 | — | — | — | 2 | 2 | ||||||||||||||||||
Amortization of previously unrecognized net actuarial loss | 32 | 17 | 1 | — | 1 | 1 | ||||||||||||||||||
Net periodic benefit cost | $ | 24 | $ | 10 | $ | 16 | $ | 16 | $ | 15 | $ | 18 | ||||||||||||
14. Share-based Compensation
Fiscal years 2010, 2009 and 2008
Post-Merger Equity Incentive Plan
The Avaya Holdings Corp’sCorp. Amended and Restated 2007 Equity Incentive Plan (“2007 Plan”) governs the issuance of equity awards, including restricted stock units and stock options, to eligible plan participants. Key employees, directors, and consultants of the Company may be eligible to receive awards under the 2007 Plan. Each stock option, when vested and exercised, and each restricted stock unit, when vested, entitles the holder to receive one share of common stock, subject to certain restrictions on their transfer and sale as defined in the 2007 Plan and the related award agreements. As of September 30, 2010,2012, the Company had authorized the issuance of up to 49,848,157 shares of its common stock under the 2007 Plan, in addition to 2,924,125 shares underlying the continuation awards described below.
Option Awards
Under the 2007 Plan, stock options may not be granted with an exercise price of less than the fair market value of the underlying stock on the date of grant. Share-based compensation expense recognized in the Consolidated Statements of Operations is based on awards ultimately expected to vest. Forfeitures are estimated at the time of grant and revised, if necessary, in subsequent periods if actual forfeitures differ from those
estimates in accordance with authoritative guidance. All options awarded under the 2007 Plan expire the earlier of ten years from the date of grant or upon cessation of employment, in which event there are limited exercise provisions allowed for vested options.
During the period from October 27, 2007 through September 30, 2008 and during the year ended September 30, 2009, the Company granted time-based, performance-based “EBITDA,” and market-based “multiple-of-money” options to purchase common stock. Options granted during the period October 27, 2007 through September 30, 2008 have an exercise price of $5.00, and options granted during the year ended September 30, 2009 have an exercise price of $3.80, which was the fair market value (as defined under the 2007 Plan) of the underlying shares at the time granted.
Time-based options granted prior to November 17, 2009 vest over their performance periods, generally four years, and are payable in shares of common stock upon vesting and exercise. Compensation expense equal to the fair value of the option measured on the grant date is recognized utilizing graded attribution over the requisite service period.
EBITDA options granted prior to November 17, 2009 vest in equal installments each year over a four-year period assuming annual EBITDA targets are met. In the event that any annual EBITDA target is not met, cumulative targets would permit catch-up vesting in subsequent years should these annual EBITDA targets be achieved on a cumulative basis. The fair value of EBITDA options was measured on the date of grant. Compensation expense is recorded utilizing graded attribution over the requisite service period. Vesting, and therefore compensation expense, is estimated at the time that the achievement of the annual or cumulative EBITDA targets become probable. Compensation expense is adjusted for subsequent changes in the expected outcome of the annual and cumulative EBITDA targets until the vesting date.
Multiple-of-money options granted prior to November 17, 2009 vest upon the achievement of defined returns on the Sponsors’ initial investment (a “triggering event”) in the Company. Because vesting of the multiple-of-money market-based options is outside the control of the Company and the award recipients, vesting and resulting compensation expense relative to the multiple-of-money options must only be recognized upon the occurrence of a triggering event (e.g., sale or initial public offering of the Company). Such a triggering eventAchievement of defined returns on the Sponsors’ initial investment may also cause any unvested portion of the EBITDA options to vest.
In November 2009, the Board approved a stock option exchange program through which individuals holding stock options having exercise prices of $5.00 and $3.80 per share could exchange them on a one-option-for-one-option basis, for replacement options with an exercise price of $3.00 per share, the fair market value (as defined under the 2007 Plan) of the underlying shares at the time of exchange, and with new vesting terms. The replacement options issued to participants in the exchange program include time-based and market-based multiple-of-money options. The time-based options vest ratably over four years following the date of exchange. The multiple-of-money options vest upon the achievement of defined returns on the Sponsors’ initial investment in the Company. The exchange offer was closed on November 16, 2009 and 28,595,000 options were tendered for exchange and have an effective exchange date of November 17, 2009. 2,295,000 stock options were not tendered in the exchange offer. The Company has treated the stock option exchange as a modification of the terms of the options tendered for exchange. For financial reporting purposes, the Company willcompensation expense equal to the incremental fair value for all unvested and modified options is recognized as these options vest. The incremental fair value of the modification was determined as the difference in the fair value of each option immediately before and after the modification using the CRR binomial model (discussed below). The unrecognized incremental compensation related to the time-based options as a result of the modification is $3 million and will beis recognized over the four-year vesting period which began November 17, 2009. Because vesting of the multiple-of-money market-based options is outside the control of the Company and the award recipients, vesting and resulting compensationCompensation expense relative to the multiple-of-money options must only be recognized upon the occurrence of a triggering event.
During fiscal 2012, the Company granted 3,745,464 time-based and 2,016,789 multiple-of-money options in the ordinary course of business. During fiscal 2011, the Company granted 4,465,500 time-based and 2,404,500 multiple-of-money options in the ordinary course of business.
In conjunction with the NES acquisition of NES and to provide employee retention during the integration of NES, the Company granted 7,445,750 time-based and 2,574,250 multiple-of-money options to purchase common stock to certain key employees of Avaya and to certain key employees of NES who became employees of Avaya upon completion of the Acquisition. In addition, during fiscal 2010, the Company granted 5,138,250 time-based and 2,766,750 multiple-of-money options in the ordinary course of business.
Excluding stock options issued in the exchange offer, 6,734,000 of all time-based options granted during fiscal 2010 vest over their performance periods, generally four years. The other 5,850,000 time-based options granted during fiscal 2010 (excluding stock options issued in the exchange offer) vested 20% on December 18, 2009, the date on which the closing of the AcquisitionNES acquisition was completed, and will vest 20% annually thereafter for the following four years. All other time-based options granted on or subsequent to November 17, 2009 (excluding stock options issued in the exchange offer) vest over their performance periods, generally four years. Compensation expense related to time-based options equal to the fair value of the option measured on the grant date is recognized utilizing graded attribution over the requisite service period.
As is the case with multiple-of-money options issued in the exchange offer, all other multiple-of-money options granted during fiscal 2010on or subsequent to November 17, 2009 vest upon the achievement of defined returns on the Sponsors’ initial investment in the Company. Because vesting of the multiple-of-money market-based options is outside the control of the Company and the award recipients, vesting and resultingrelated compensation expense relative to the multiple-of-money options must only be recognized upon the occurrence of a triggering event (e.g., sale or initial public offering of the Company).
For fiscal 2012, 2011, and 2010 (excluding stock options issued in the exchange offer), the weighted-average grant-date fair value of options granted during the year was $1.68, $1.27, and $1.23, respectively. The fair value of option awards is determined at the date of grant utilizing the Cox-Ross-Rubinstein (“CRR”)
binomial option pricing model which is affected by the fair value of the Company’s common stock as well as a number of complex and subjective assumptions. Expected volatility is based primarily on a combination of the Company’s peer group’s historical volatility and estimates of implied volatility of the Company’s peer group. The risk-free interest rate assumption was derived from reference to the U.S. Treasury Spot rates for the expected term of the stock options. The dividend yield assumption is based on the Company’s current intent not to issue a dividend under its dividend policy. The expected holding period assumption was estimated based on the Company’s historical experience. The underlying assumptions used in the valuation were as follows:
Options granted during the year ended September 30, 2010, including those granted in the exchange offer, have an exercise price of $3.00, which was the estimated fair value of the underlying shares at the time granted. The fair value of each of the time-based options was $1.39 and was determined utilizing the following assumptions: grant and strike price of $3.00; expected term to exercise of 5 years; expected volatility of 51.01%; risk-free interest rate of 2.28%; and no dividend yield.
The fair value of options granted during the year ended September 30, 2009 was $2.09 and was determined utilizing the following assumptions: grant and strike price of $3.80; expected term to exercise of 5 years; expected volatility of 63.94%; risk-free interest rate of 2.24%; and no dividend yield.
The fair value of options granted during the period October 27, 2007 through September 30, 2008 was $2.28 and was determined utilizing the following assumptions: grant and strike price of $5.00; expected term to exercise of 5 years; expected volatility of 46.5%; risk-free interest rate of 3.93%; and no dividend yield.
| Five months ended September 30, 2012 | Seven months ended April 30, 2012 | Four months ended September 30, 2011 | Six months ended March 31, 2011 | Fiscal 2010 | ||||||||||||||||
Exercise price | $4.00 | $4.40 | $4.40 | $3.00 | $3.00 | |||||||||||||||
Stock price | $4.00 | $4.40 | $4.40 | $3.00 | $3.00 | |||||||||||||||
Term | 5 years | 5 years | 5 years | 5 years | 5 years | |||||||||||||||
Volatility | 52.22 | % | 55.91 | % | 48.55 | % | 47.82 | % | 51.01 | % | ||||||||||
Risk-free rate | 0.75 | % | 0.92 | % | 1.48 | % | 1.64 | % | 2.28 | % | ||||||||||
Dividend yield | 0.00 | % | 0.00 | % | 0.00 | % | 0.00 | % | 0.00 | % | ||||||||||
For the year ended September 30,fiscal 2012, 2011, and 2010, and 2009, and the period October 27, 2007 through September 30, 2008, the Company recognized share-based compensation associated with these options of $16$5 million, $9$10 million, and $21$16 million, respectively, which is included in costs and operating expenses. At September 30, 2010,2012, there was $17$8 million of unrecognized share-based compensation that the Company expects to recognize as expense over the next three to four years associated with 2007 Plan options. The expected expense does not include any compensation associated with the multiple-of-money and EBITDA awards. At September 30, 20102012 there are 1,488,43811,312,926 vested and exercisable options outstanding with a weighted average exercise price of $3.44,$3.10, a fair value at the date of grant of $2$22 million, an intrinsic value of $11 million, and no intrinsic value.a weighted average remaining contractual term of 7 years. At September 30, 2010,2012, exercisable options and unvested time-based options that are expected to vest aggregate to 27,346,515 and24,605,846, have a weighted average
exercise price of $3.03,$3.27, a fair value at the date of grant of $54$48 million, an intrinsic value of $20 million, and noa weighted average remaining contractual term of 8 years.
During fiscal 2012, and 2011, 1,093,806 and 54,609 options were exercised with an intrinsic value. Through September 30, 2010,value of $1 million and less than $1 million, respectively. There were no options have been exercised (in each case other than continuation options, as discussed below).during fiscal 2010.
The following table summarizes option awards under the 2007 Plan (excluding the continuation options, as discussed below):
Options (in 000s) | Time-based | EBITDA | Multiple-of - Money | Total | Weighted Average Exercise Price | Fair Value at Date of Grant (in 000s) | Time-based | EBITDA | Multiple-of- Money | Total | Weighted Average Exercise Price | Fair Value at Date of Grant (in 000s) | ||||||||||||||||||||||||||||||||||||
Outstanding—October 1, 2011 | 29,103 | 96 | 14,397 | 43,596 | $ | 3.11 | 67,554 | |||||||||||||||||||||||||||||||||||||||||
Granted | 25,471 | 6,857 | 6,857 | 39,185 | $ | 5.00 | $ | 89,342 | 3,745 | — | 2,017 | 5,762 | $ | 4.22 | 9,696 | |||||||||||||||||||||||||||||||||
Exercised | (1,094 | ) | — | — | (1,094 | ) | $ | 3.00 | (2,067 | ) | ||||||||||||||||||||||||||||||||||||||
Forfeited | (5,570 | ) | (1,500 | ) | (1,500 | ) | (8,570 | ) | $ | 5.00 | (19,540 | ) | (5,991 | ) | (14 | ) | (3,911 | ) | (9,916 | ) | $ | 3.14 | (14,064 | ) | ||||||||||||||||||||||||
|
|
|
|
|
| |||||||||||||||||||||||||||||||||||||||||||
Outstanding—September 30, 2008 | 19,901 | 5,357 | 5,357 | 30,615 | $ | 5.00 | 69,802 | |||||||||||||||||||||||||||||||||||||||||
Granted | 8,161 | 2,197 | 2,197 | 12,555 | $ | 3.80 | 26,240 | |||||||||||||||||||||||||||||||||||||||||
Forfeited | (7,628 | ) | (2,123 | ) | (2,123 | ) | (11,874 | ) | $ | 4.94 | (26,953 | ) | ||||||||||||||||||||||||||||||||||||
Outstanding—September 30, 2012 | 25,763 | 82 | 12,503 | 38,348 | $ | 3.28 | 61,119 | |||||||||||||||||||||||||||||||||||||||||
|
|
|
|
|
| |||||||||||||||||||||||||||||||||||||||||||
Outstanding—September 30, 2009 | 20,434 | 5,431 | 5,431 | 31,296 | $ | 4.54 | 69,089 | |||||||||||||||||||||||||||||||||||||||||
Tendered—November 2009 | (18,587 | ) | (5,004 | ) | (5,004 | ) | (28,595 | ) | $ | 4.53 | (63,064 | ) | ||||||||||||||||||||||||||||||||||||
Exchanged—November 2009 | 18,587 | — | 10,008 | 28,595 | $ | 3.00 | 52,173 | |||||||||||||||||||||||||||||||||||||||||
Granted | 12,584 | — | 5,341 | 17,925 | $ | 3.00 | 22,013 | |||||||||||||||||||||||||||||||||||||||||
Forfeited | (3,421 | ) | (273 | ) | (1,393 | ) | (5,087 | ) | $ | 3.52 | (9,411 | ) | ||||||||||||||||||||||||||||||||||||
Outstanding—September 30, 2010 | 29,597 | 154 | 14,383 | 44,134 | $ | 3.03 | $ | 70,800 | ||||||||||||||||||||||||||||||||||||||||
Restricted Stock Units
The Company has issued restricted stock units (“RSUs”) each of which represents the right to receive one share of the Company’s common stock when fully vested. The fair value of the common stock underlying the RSUs was estimated by the Board of Directors at the date of grant.
2012 Awards
During fiscal 2012, the Company awarded 1,533,389 RSUs in the ordinary course of business. The fair market value of these awards (as defined under the 2007 Plan) at the date of grant was $4.40 per share for RSUs awarded prior to May 2012 and $4.00 per share for RSUs awarded subsequent to May 2012.
In addition, in December 2011, the Company and Avaya Inc. appointed Mr. Gary Smith as an independent director to serve on their respective boards of directors and on our Audit and Compensation Committees. Upon his election, he received an initial grant of 79,546 RSUs, representing an inaugural grant of 45,455 RSUs and an annual equity grant of 34,091 RSUs. In addition, of his total annual retainer worth $120,000, based on his service on the board and his appointment as a member of the Audit and Compensation Committees, Mr. Smith elected to receive that retainer $60,000 in cash and $60,000 in RSUs (equaling 13,636 RSUs). All RSUs were awarded to Mr. Smith based upon the fair market value of our common stock on December 6, 2011, the date of grant, which was $4.40 per share. The RSUs were granted pursuant to the terms of the 2007 Plan and were fully vested on the date of grant. The shares underlying the RSUs will not be distributed to him until he ceases to serve on the board of directors.
On December 5, 2011, the Compensation Committee approved a plan to provide incentives to certain executive officers of the Company to continue to grow revenue in fiscal 2012 (the “2012 Sales Incentive Program”). Under the terms of the 2012 Sales Incentive Program, effective December 6, 2011 the committee approved a grant to each program participant of the conditional right to receive a number of RSUs under the 2007 Plan upon the achievement of certain revenue objectives. All RSUs awarded under the 2012 Sales Incentive Program were to be based upon the fair market value of our common stock on the date of grant. During the fiscal year ended September 30, 2012 certain executive officers were granted the opportunity to receive up to 329,545 RSUs under the 2012 Sales Incentive Program.
On February 16, 2012, the Compensation Committee approved amendments to the 2012 Sales Incentive Program with respect to all participants to set certain revenue targets and to reduce certain other revenue targets previously established. All other terms and conditions of the 2012 Sales Incentive Program remained unchanged.
Because the targets under the 2012 Sales Incentive Plan were not achieved in fiscal 2012, no RSU awards granted under the 2012 Sales Incentive Program will vest, and no compensation expense has been recognized.
2011 Awards
During fiscal 2011, the Company awarded 305,000 RSUs in the ordinary course of business. The fair market value of these awards (as defined under the 2007 Plan) at the date of grant was $3.00 per share for RSUs awarded prior to May 2011 and $4.40 per share for RSUs awarded subsequent to May 2011.
2010 Awards
In November 2009, the Company granted to its former Chief Financial Officer, Anthony Massetti, in connection with his offer of employment 150,000 RSUs, which vest 50% on the first anniversary of the grant date and 25% on each of the second and third anniversaries of the grant date. In accordance with the terms of this grant, following Mr. Massetti’s termination of employment, the Company has the right to purchase from him shares issued on the vesting of these RSUs at a purchase price per share equal to the greater of the fair market value of a share of our common stock or $13.00. Further, (i) if Mr. Massetti’s employment is terminated other than for cause, (ii) if he voluntarily resigns for good reason or (iii) upon his death or disability, Mr. Massetti has the right to require the Company to purchase from him any and all of the shares of common stock subject to his vested RSUs at a purchase price per share equal to the greater of the fair market value orof a share of common stock and $13.00. If Mr. Massetti exercises this right, then the Company will have the right to defer the payment to a change in control event, as defined in the 2007 Plan. At September 30, 2010,2012, the estimated fair value of each of Mr. Massetti’s RSUs was $13.00.
In addition, during fiscal 2010, the Company awarded 345,000 RSUs in the ordinary course of business. The fair market value of these awards (as defined under the 2007 Plan) at the date of grant was $3.00 per share. These awards generally vest 50% on each of the first and second anniversaries of the grant date.
2009 Awards
During fiscal 2009, the Company awarded 330,789 RSUs to several employees, of which 40,000 RSUs vested through January 2009 and the rest of which vest through May 2013. The fair market value of these awards (as defined under the 2007 Plan) at the date of grant was $3.80 per share.
In December 2008, the Company granted to its chief executive officer, Kevin Kennedy, 400,000 RSUs, which vest equally on the first, second, third and fourth anniversary dates of the effective date of his employment agreement, December 22, 2008. In accordance with the terms of these RSU grants, prior to December 22, 2010, and prior to an initial public offering, (i) if Mr. Kennedy’s employment is terminated other than for cause, (ii) if he voluntarily resigns for good reason or (iii) upon his death or disability, Mr. Kennedy has the right to require Company to purchase from him any or all of the shares of common stock underlying his vested RSUs at fair market value, unless fair market value is less than $10 per share, in which case the purchase price shall be $10 per share (the “RSU Price”). After December 22, 2010, and prior to an initial public offering, (i) if Mr. Kennedy’s employment is terminated other than for cause, (ii) if he voluntarily resigns for any reason or (iii) upon his death or disability, Mr. Kennedy has the right to require the Company to purchase from him any or all of the shares of common stock subject to his vested RSUs at the RSU Price. Further, in the event that certain “drag-along” or “tag-along” provisions under the management stockholders’ agreement are exercised and Mr. Kennedy sells shares of common stock underlying vested RSUs in certain transactions and receives less than $10 per share, then the Company is obligated to pay to Mr. Kennedy the difference between $10 per share and the amount realized by Mr. Kennedy in such transaction. At September 30, 2010, the estimated fair value of each of Mr. Kennedy’s RSUs was $10.00.
2008 Awards
In November 2007, the Company awarded 60,000 RSUs which vested in three equal installments from December 2007 through February 2008. In January 2008 the Company awarded 50,000 RSUs which will fully vest January 2010. The fair market value (as defined under the 2007 Plan) of each RSU at the date of grant was $5.00.
For the year ended September 30,fiscal 2012, 2011, and 2010, and 2009, the Company recognized compensation expense associated with RSUs of $3 million, $2 million and $1$3 million, respectively. Compensation expense for the period October 27, 2007 through September 30, 2008 associated with RSUs was not material.
As of September 30, 2010,2012, there was $5$6 million of unrecognized share based compensation associated with RSUs that the Company expects to recognize as expense through May 2013.September 2016. The following table summarizes the RSUs granted under the 2007 Plan:
Nonvested Shares | Shares | |||
| ||||
| ||||
| ||||
| ||||
| ||||
| 740,789 | |||
Granted | 495,000 | |||
Forfeited | (15,000 | ) | ||
Vested | (295,000 | ) | ||
Non-vested shares at September 30, 2010 | 925,789 | |||
Granted | 305,000 | |||
Forfeited | (65,789 | ) | ||
Vested | (432,500 | ) | ||
Non-vested shares at September 30, 2011 | 732,500 | |||
Granted | 1,956,115 | |||
Forfeited | (220,682 | ) | ||
Vested | (547,046 | ) | ||
Non-vested shares at September 30, 2012 | 1,920,887 | |||
Continuation Awards
Following the closing of the Merger, fully vested options to purchase shares of the Predecessor Company held by certain members of management that were not exercised before the Merger were substituted for fully-vested stock options to purchase 1,592,970 shares of Avayacommon stock having the same intrinsic value of $6 million (“continuation options”). The continuation options have an exercise price of $1.25 and have an average remaining life of 2.90.9 years. As of September 30, 2010,2012, 1,163,209 of these continuation options had been exercised, with the remaining 429,761 continuation options still outstanding.
Additionally, following the closing of the Merger, fully vested performance based RSUs of the Predecessor Company held by certain members of management were substituted for 1,331,155 fully-vested RSUs of Avaya, having the same intrinsic value of $7 million (“continuation units”). During the period October 27, 2007 through September 30, 2008, 358,814 of the continuation units were cancelled.canceled. Each continuation unit represents the right to receive one share of Avaya common stock. In accordance with the 2007 Plan, the continuation options and continuation units do not detract from the authorized shares under the 2007 Plan.
Six months ended March 31, 2011 and 2010 (unaudited)
As of March 31, 2011, there remained 4,405,201 shares available for grant under the 2007 Plan.
Option Awards
During the six months ended March 31, 2011, the Company granted 2,616,250 time-based and 1,408,750 multiple-of-money options in the ordinary course of business. All of the options have an exercise price of $3.00 per share and expire ten years from the date of grant or upon cessation of employment, in which event there are limited exercise provisions allowed for vested options.
Time-based options granted during the six months ended March 31, 2011 vest over their performance periods, generally four years. Compensation expense equal to the fair value of the option measured on the grant date is recognized utilizing graded attribution over the requisite service period.
For the six months ended March 31, 2011 and 2010, the Company recognized share-based compensation associated with options issued under the 2007 Plan of $5 million and $10 million, respectively, which is included in costs and operating expenses.
Restricted Stock Units
During the six months ended March 31, 2011, the Company awarded 115,000 RSUs in the ordinary course of business. The fair market value (as defined in the 2007 Plan) of these awards at the date of grant was $3.00 per share.
At March 31, 2011, there were 1,370,000 awarded RSUs outstanding under the 2007 Plan, of which 660,000 were fully vested. For each of the six months ended March 31, 2011 and 2010, the Company recognized share-based compensation associated with RSUs granted under the 2007 Plan of $1 million.
Pre-Merger Share-based Compensation
Prior to the Merger, Avaya Inc. had stock compensation plans and a stock purchase plan which have been terminated.
Stock Options
Prior to the Merger, stock options were provided for under the Avaya Inc. 2004 Long Term Incentive Plan and several other plans (the “Pre-Merger Plans”). Stock options under the Pre-Merger Plans were generally granted with an exercise price equal to or above the fair market value of a share of common stock of the Predecessor Company on the date of grant, had terms of seven to ten years and generally vested three or four years from the date of grant.
In connection with the Merger, all unvested stock options of the Predecessor Company then outstanding vested in full on September 28, 2007. Accordingly, each option outstanding immediately prior to the Merger was cancelled and converted into the right to receive a cash amount equal to the excess, if any, of $17.50 over the exercise price payable with respect of such option.
Restricted Stock Units
The Pre-Merger Plans permitted grants of RSUs to eligible employees and non-employee Directors at the fair market value of a share of the Predecessor Company’s common stock on the date of grant.
Pre-Merger RSUs that vested over time typically vested over a four-year period and were payable in shares of the Predecessor Company’s common stock. In accordance with the terms of the Pre-Merger Plans under which they were issued, these Pre-Merger time-based RSUs accelerated on September 28, 2007.
In addition to time-based RSUs, performance-based RSUs were granted under the Pre-Merger Plans. On December 15, 2005, the Compensation Committee of the Board of Directors approved awards of 350,000 performance-vesting RSUs to executive officers of the Predecessor Company pursuant to the terms of the Pre-Merger Plans. Effective December 19, 2006, the Compensation Committee of the Board of Directors approved awards of 381,000 RSUs to executive officers of the Predecessor Company under the Pre-Merger Plans each with a market-vesting condition based on the Company’s total stockholder return performance as a percentile against a peer group. As of September 30, 2007, there was approximately $6 million of total unrecognized compensation cost related to non-vested share-based compensation arrangements granted under the Pre-Merger Plans. That cost was recognized upon consummation of the Merger during fiscal 2008.
15. Capital Stock
Capital Stock
Effective December 17, 2009, the CompanyThe certificate of incorporation, as amended and restated, its certificate of incorporation. As amended and restated the certificate of incorporation authorizes the Company to issue up to 750,000,000 shares of Common Stock with a par value of $.001 per share and 250,000 shares of Preferred Stock with a par value of $0.001 per share.
Preferred Stock
Preferred Series A
On December 19, 2009 the Company issued 125,000 shares of Series A preferred stock (“preferred series A”) with detachable warrants to purchase up to 38.5 million common shares at a price of $3.25 per share which expire December 19, 2019. The aggregate proceeds from the issuance of the preferred series A and associated warrants were $125 million and were used to partially fund the acquisition of NES. The preferred series A shares are non-voting, redeemable at the Company’s election and have a liquidation preference of $1,000 per share plus cumulative, compounded quarterly, accrued unpaid dividends at a rate of 5 percent per annum in cash.
Funds affiliated with Silver Lake and TPG provided an aggregate of $78 million of the cash proceeds from the issuance of the preferred series A shares and the warrants, with each sponsor-affiliated group providing $39 million of the cash proceeds. Based on their contributed cash, the Silver Lake and TPG funds each received 38,864 preferred series A shares and warrants to purchase up to 11,958,192 common shares. Under the terms of the preferred stock agreement, the preferred series A shares are redeemable at the Company’s election only; however, because affiliates of Silver Lake and TPG control the board of directors and hold a substantial portion of the preferred series A shares, they could trigger a demand for redemption at their discretion and therefore, the preferred series A shares have been classified in the mezzanine section between debt and stockholders’ deficiency in the Consolidated Balance Sheets.
In accordance with GAAP, the Company allocated the aggregate proceeds received at closing between the preferred series A shares and warrants issued based on their relative fair values at December 19, 2009. The estimated fair value of the preferred series A shares on December 19, 2009 was $85 million, which was estimated using the discounted cash flow analysis based on the Company’s current borrowing rates for similar types of borrowing arrangements (e.g. Level 2 Input). The warrants have a term of 10-years, have an exercise price of $3.25 per share and an aggregate estimated fair value of $71.5 million. The fair value of each warrant was determined utilizing the CRR binomial option model under the following assumptions: estimated fair value of underlying stock of $3.00; expected term to exercise of 10 years; expected volatility of 48.8%; risk-free interest rate of 3.6%; and no dividend yield. The Company allocated the cash proceeds of $125 million received to the preferred series A shares and warrants based on their relative fair values, or $68 million and $57 million, respectively. Contemporaneously, the Company recorded a discount accretion of $57 million to the carrying amount of the preferred series A at the date of issuance, so that the carrying amount will equal the original redemption amount.amount of $125 million.
As of September 30, 20102012, the carrying value of the preferred series A was $144 million, which includes $19 million of accumulated and March 31, 2011, total accretion and accrued unpaid dividends as well as $57 million of discount accretion. As of September 30, 2011, the carrying value of the preferred series A was $137 million, which includes $12 million of accumulated and unpaid dividends as well as $57 million of discount accretion.
Preferred Series B
On May 29, 2012 the Company issued 48,921 shares of preferred series B with detachable warrants to purchase up to 24.5 million common shares at a price of $4.00 per share which expire May 29, 2022. The aggregate proceeds from the issuance of the preferred series B and associated warrants were $62$196 million and $65were used to partially fund the acquisition of Radvision. The preferred series B shares are non-voting and earn cumulative dividends at a rate of 8 percent per annum, compounded annually, whether or not declared, and are payable in cash or additional shares of preferred series B at the Company’s option. Preferred series B dividends must be paid prior to dividends on any other series or classes of the Company’s stock. Additionally, holders of preferred series B participate in any dividends payable on shares of the Company’s common stock on an as converted basis.
The preferred series B are redeemable at the Company’s election. The Redemption Price is equal to (1) 110% of the Original Purchase Price of $4,000 per share which increases by 10% on each anniversary of the date of issuance up to 150% following the fourth anniversary of the date of issuance, plus (2) any accrued and unpaid dividends. Upon consummation of a Qualified Public Offering or, if so determined by the Required Holders, an Initial Public Offering (as each such term is defined in the agreement), the preferred series B will mandatorily convert into common stock at the Conversion Price as described below or will be redeemed for cash at the option of the holders at the Redemption Price in effect at such time. However, if the Total Leverage Ratio (as defined in the Cash Flow Credit Agreement), after giving effect to such Qualified Public Offering or Initial Public Offering and the application of the proceeds there from, would be greater than 5.0, the preferred series B will mandatorily convert into common stock. The preferred series B is convertible into common stock at a Conversion Price equal to the lesser of (1) $4.00 per share (subject to certain anti-dilution provisions) or (2) the offering price per share in a Qualified Public Offering or an Initial Public Offering.
If a Qualified Public Offering or an Initial Public Offering has not occurred, on or after 5 years from the date of issuance, the preferred series B are redeemable in cash at the option of the holders at the Redemption Price in effect at such time.
Upon liquidation, the holders of the preferred series B are entitled to the greater of (1) the amount which would be receivable if such preferred series B was converted into common stock immediately prior to the liquidation event, or (2) the Redemption Price in effect at such time. Such payment must be made in preference to any other distribution to the holders of any other series and classes of the Company’s stock.
The preferred series B were issued to funds affiliated with Silver Lake and TPG. Because the preferred series B shares are redeemable at the Company’s election at any time and affiliates of Silver Lake and TPG control the board of directors, the holders of the preferred series B could trigger a demand for redemption. In addition, the preferred series B is redeemable at the option of the holders in certain cases. As a result, the preferred series B shares have been classified in the mezzanine section between debt and stockholders’ deficiency in the Consolidated Balance Sheets.
In accordance with GAAP, the Company allocated the aggregate proceeds received at closing between the preferred series B shares and the warrants. The estimated fair value of the preferred series B on May 29, 2012 was $210 million, (unaudited),which was estimated using a Binomial Lattice model. The warrants had an aggregate fair value of $27 million. The fair value of each warrant was $1.11 and was estimated utilizing the CRR binomial option under the following assumptions: estimated fair value of underlying stock of $1.75 per share; expected term to exercise of 10 years; expected volatility of 70%; risk-free interest rate of 1.7%; and no dividend yield. The Company allocated the cash proceeds of $196 million received to the preferred series B shares and warrants based on their relative fair values, or $173 million and $23 million, respectively.
Because the preferred series B shares contain certain features which are required to be bifurcated and accounted for as a derivative instrument, a portion of the $173 million of cash proceeds allocated to the preferred series B shares was assigned to the embedded derivative and recognized as a liability in the Consolidated Balance Sheets. The amount assigned to the embedded derivative or $10 million, was equivalent to the fair value of such features and was determined by estimating the fair value of the preferred series B with and without such features.
Contemporaneous to the allocation of the preferred series B proceeds, the Company recorded discount accretion of $33 million to the carrying amount of the preferred series B at the date of issuance. Additionally, the Company is recording periodic accretion to the Redemption Price.
As of September 30, 2012, the carrying value of the preferred series B was $227 million, which includes $5 million of accumulated and unpaid dividends, $26 million of accretion to the Redemption Price, as well as $33 million of discount accretion at the date of issuance.
Warrants
In connection with the financing of the acquisition of NES, on December 18, 2009, wethe Company issued warrants to purchase 100 million shares of ourits common stock of which 61.5 million warrants were issued in connection with the incremental B-2 term loans as discussed in Note 9 “Financing Arrangements” and 38.5 million warrants were issued in connection with the issuance of the preferred series A. The warrants have an exercise price of $3.25 per share and are exercisable any time prior to December 18, 2019.
In connection with the financing of the acquisition of Radvision, on May 29, 2012, the Company issued warrants to purchase 24.5 million shares of its common stock in connection with the issuance of the preferred series B. The warrants have an exercise price of $4.00 per share and are exercisable any time prior to May 29, 2022.
All such warrants have a cashless exercise feature. The warrantsfeature, contain customary adjustment provisions for stock splits, capital reorganizations and certain other distributions. The warrants have an exercise price of $3.25 per sharedistributions and are exercisable at any time prior to December 18, 2019. All of these warrants are currently outstanding as of September 30, 2010 and March 31, 2011.2012.
16. Net Loss Per Share
The following table sets forth the computation of basic and diluted net loss per share of common stock as discussed in Note 2, “Summary of Significant Accounting Policies—Net Loss Per Share”:
| Predecessor | Successor | |||||||||||||||||||||||||||||||||||||||
| Period from October 1, 2007 through October 26, 2007 | Years ended September 30, | Six months ended March 31, | ||||||||||||||||||||||||||||||||||||||
| 2008 | 2009 | 2010 | 2010 | 2011 | Years ended September 30, | |||||||||||||||||||||||||||||||||||
| (Unaudited) | 2012 | 2011 | 2010 | |||||||||||||||||||||||||||||||||||||
Numerator (in millions): | ||||||||||||||||||||||||||||||||||||||||
Net loss attributable to Avaya Holdings Corp. | $ | (88 | ) | $ | (1,307 | ) | $ | (847 | ) | $ | (874 | ) | $ | (419 | ) | $ | (612 | ) | $ | (354 | ) | $ | (863 | ) | $ | (874 | ) | |||||||||||||
Dividends on Series A preferred stock | — | — | — | (5 | ) | (2 | ) | (3 | ) | (7 | ) | (7 | ) | (5 | ) | |||||||||||||||||||||||||
Accretion on Series A preferred stock | — | — | — | (57 | ) | — | — | — | — | (57 | ) | |||||||||||||||||||||||||||||
Dividends on Series B preferred stock | (5 | ) | — | — | ||||||||||||||||||||||||||||||||||||
Accretion on Series B preferred stock | (59 | ) | — | — | ||||||||||||||||||||||||||||||||||||
|
|
| ||||||||||||||||||||||||||||||||||||||
Net loss attributable to common stockholders | $ | (88 | ) | $ | (1,307 | ) | $ | (847 | ) | $ | (936 | ) | $ | (421 | ) | $ | (615 | ) | $ | (425 | ) | $ | (870 | ) | $ | (936 | ) | |||||||||||||
|
|
| ||||||||||||||||||||||||||||||||||||||
Denominator (in millions): | ||||||||||||||||||||||||||||||||||||||||
Weighted average common shares—basic and diluted | 462.9 | 455.9 | 488.1 | 488.6 | 488.5 | 488.9 | 489.6 | 489.0 | 488.6 | |||||||||||||||||||||||||||||||
|
|
| ||||||||||||||||||||||||||||||||||||||
Net loss per share—basic and diluted* | $ | (0.19 | ) | $ | (2.87 | ) | $ | (1.74 | ) | $ | (1.92 | ) | $ | (0.86 | ) | $ | (1.26 | ) | $ | (0.87 | ) | $ | (1.78 | ) | $ | (1.92 | ) | |||||||||||||
|
|
| ||||||||||||||||||||||||||||||||||||||
| * | Basic net loss per share is computed by dividing the net loss attributable to common stockholders by the weighted average number of common shares outstanding during the period. Net loss |
attributable to common stockholders is increased for preferred stock dividends earned during the period. For the periods with net losses, all potentially dilutive common shares consisting of stock options, restricted stock units, convertible preferred stock and warrants are antidilutive. |
17. Reportable Segments
Avaya conducts its business operations in three segments. Two of those segments, Global Communications Solutions (“GCS”) and DataAvaya Networking (“Data”Networking”), make up Avaya’s Enterprise Collaboration Solutions (“ECS”) product portfolio. The third segment contains Avaya’s services portfolio and is called Avaya Global Services (“AGS”).
The GCS segment primarily develops, markets, and sells unified communications and contact center solutions by integrating multiple forms of communications, including telephone, e-mail, instant messaging and video. Avaya’s DataNetworking segment’s portfolio of products offers integrated networking solutions which are scalable across customer enterprises. The AGS segment develops, markets and sells comprehensive end-to-end global service offerings that allow customers to evaluate, plan, design, implement, monitor, manage and manageoptimize complex enterprise communications networks.
For internal reporting purposes, the Company’s chief operating decision maker makes financial decisions and allocates resources based on segment marginprofit information obtained from the Company’s internal management systems. Management does not include in its segment measures of profitability selling, general, and administrative expenses, research and development expenses, amortization of intangible assets, and certain discrete items, such as charges relating to restructuring actions, impairment charges, and merger-related costs as these costs are not core to the measurement of segment management’s performance, but rather are controlled at the corporate level. This measure of segment margin was adopted by the Company during the fiscal year ended September 30, 2009 and the period from October 1, 2007 through October 26, 2007 reportable segment disclosures were appropriately conformed.
No single customer accounted for more than 10% of net revenue for the periods October 1, 2007 through October 26, 2007, and fiscal 2008, 2009, 2010 and six months ended March 31, 2010 (unaudited) and 2011 (unaudited).
Reportable Segments
Summarized financial information relating to the Company’s reportable segments is shown in the following table:
| Predecessor | Successor | |||||||||||||||||||||||||||||||||||||||
| Period from October 1, 2007 through October 26, 2007 | ||||||||||||||||||||||||||||||||||||||||
| Years ended September 30, | Six months ended March 31, | Fiscal year ended September 30, | ||||||||||||||||||||||||||||||||||||||
In millions | 2008 | 2009 | 2010 | 2010 | 2011 | 2012 | 2011 | 2010 | ||||||||||||||||||||||||||||||||
| REVENUE | (unaudited) | |||||||||||||||||||||||||||||||||||||||
Global Communications Solutions | $ | 96 | $ | 2,638 | $ | 1,939 | $ | 2,327 | $ | 1,089 | $ | 1,325 | $ | 2,390 | $ | 2,675 | $ | 2,329 | ||||||||||||||||||||||
Data Networking | — | — | — | 282 | 107 | 155 | ||||||||||||||||||||||||||||||||||
Avaya Networking | 284 | 304 | 280 | |||||||||||||||||||||||||||||||||||||
|
|
| ||||||||||||||||||||||||||||||||||||||
Enterprise Collaboration Solutions | 2,674 | 2,979 | 2,609 | |||||||||||||||||||||||||||||||||||||
Avaya Global Services | 150 | 2,328 | 2,227 | 2,463 | 1,190 | 1,279 | 2,499 | 2,573 | 2,463 | |||||||||||||||||||||||||||||||
Unallocated Amounts(1) | — | (43 | ) | (16 | ) | (12 | ) | (6 | ) | (3 | ) | (2 | ) | (5 | ) | (12 | ) | |||||||||||||||||||||||
|
|
| ||||||||||||||||||||||||||||||||||||||
| 246 | 4,923 | 4,150 | 5,060 | 2,380 | 2,756 | $ | 5,171 | $ | 5,547 | $ | 5,060 | |||||||||||||||||||||||||||||
GROSS MARGIN | ||||||||||||||||||||||||||||||||||||||||
|
|
| ||||||||||||||||||||||||||||||||||||||
GROSS PROFIT | ||||||||||||||||||||||||||||||||||||||||
Global Communications Solutions | 40 | 1,474 | 1,066 | 1,249 | 604 | 736 | $ | 1,387 | $ | 1,532 | $ | 1,249 | ||||||||||||||||||||||||||||
Data Networking | — | — | — | 117 | 45 | 67 | ||||||||||||||||||||||||||||||||||
Avaya Networking | 115 | 131 | 117 | |||||||||||||||||||||||||||||||||||||
|
|
| ||||||||||||||||||||||||||||||||||||||
Enterprise Collaboration Solutions | 1,502 | 1,663 | 1,366 | |||||||||||||||||||||||||||||||||||||
Avaya Global Services | 50 | 918 | 1,065 | 1,119 | 553 | 599 | 1,224 | 1,222 | 1,119 | |||||||||||||||||||||||||||||||
Unallocated Amounts(1) | (1 | ) | (359 | ) | (265 | ) | (313 | ) | (156 | ) | (141 | ) | (140 | ) | (253 | ) | (313 | ) | ||||||||||||||||||||||
|
|
| ||||||||||||||||||||||||||||||||||||||
| 89 | 2,033 | 1,866 | 2,172 | 1,046 | 1,261 | 2,586 | 2,632 | 2,172 | ||||||||||||||||||||||||||||||||
OPERATING EXPENSES | ||||||||||||||||||||||||||||||||||||||||
Selling, general and administrative | 111 | 1,456 | 1,272 | 1,721 | 833 | 931 | 1,630 | 1,845 | 1,721 | |||||||||||||||||||||||||||||||
Research and development | 29 | 376 | 309 | 407 | 197 | 236 | 464 | 461 | 407 | |||||||||||||||||||||||||||||||
Amortization of intangible assets | 4 | 187 | 207 | 218 | 107 | 112 | 226 | 226 | 218 | |||||||||||||||||||||||||||||||
Impairment of long-lived assets | — | 10 | 2 | 16 | 16 | — | ||||||||||||||||||||||||||||||||||
Impairment of indefinite-lived intangible assets | — | 130 | 60 | — | — | — | ||||||||||||||||||||||||||||||||||
Goodwill impairment | — | 899 | 235 | — | — | — | ||||||||||||||||||||||||||||||||||
Restructuring charges, net | 1 | — | 160 | 171 | 83 | 64 | ||||||||||||||||||||||||||||||||||
In-process research and development charge | — | 112 | 12 | — | — | — | ||||||||||||||||||||||||||||||||||
Restructuring and impairment charges, net | 147 | 189 | 187 | |||||||||||||||||||||||||||||||||||||
Acquisition-related costs | — | — | 29 | 20 | 19 | 4 | 4 | 5 | 20 | |||||||||||||||||||||||||||||||
Merger-related costs | 57 | 1 | — | — | — | — | ||||||||||||||||||||||||||||||||||
|
|
| ||||||||||||||||||||||||||||||||||||||
| 202 | 3,171 | 2,286 | 2,553 | 1,255 | 1,347 | 2,471 | 2,726 | 2,553 | ||||||||||||||||||||||||||||||||
|
|
| ||||||||||||||||||||||||||||||||||||||
OPERATING LOSS | (113 | ) | (1,138 | ) | (420 | ) | (381 | ) | (209 | ) | (86 | ) | ||||||||||||||||||||||||||||
INTEREST EXPENSE, LOSS ON EXTINGUISHMENT OF DEBT AND OTHER INCOME, NET | 1 | (350 | ) | (395 | ) | (472 | ) | (224 | ) | (485 | ) | |||||||||||||||||||||||||||||
OPERATING INCOME (LOSS) | 115 | (94 | ) | (381 | ) | |||||||||||||||||||||||||||||||||||
INTEREST EXPENSE, LOSS ON EXTINGUISHMENT OF DEBT AND OTHER INCOME (EXPENSE), NET | (461 | ) | (701 | ) | (472 | ) | ||||||||||||||||||||||||||||||||||
|
|
| ||||||||||||||||||||||||||||||||||||||
LOSS BEFORE INCOME TAXES | $ | (112 | ) | $ | (1,488 | ) | $ | (815 | ) | $ | (853 | ) | $ | (433 | ) | $ | (571 | ) | $ | (346 | ) | $ | (795 | ) | $ | (853 | ) | |||||||||||||
|
|
| ||||||||||||||||||||||||||||||||||||||
ASSETS: | ||||||||||||||||||||||||||||||||||||||||
Global Communications Solutions | $ | 1,246 | $ | 1,572 | $ | 1,633 | $ | 1,623 | ||||||||||||||||||||||||||||||||
Data Networking | — | 23 | ||||||||||||||||||||||||||||||||||||||
Avaya Networking | 47 | 29 | ||||||||||||||||||||||||||||||||||||||
|
| |||||||||||||||||||||||||||||||||||||||
Enterprise Collaboration Solutions | 1,680 | 1,652 | ||||||||||||||||||||||||||||||||||||||
Avaya Global Services | 2,575 | 2,714 | 2,763 | 2,707 | ||||||||||||||||||||||||||||||||||||
Unallocated Assets(2) | 4,844 | 4,967 | 3,741 | 4,202 | ||||||||||||||||||||||||||||||||||||
|
| |||||||||||||||||||||||||||||||||||||||
Total | $ | 8,665 | $ | 9,276 | $ | 8,184 | $ | 8,561 | ||||||||||||||||||||||||||||||||
|
| |||||||||||||||||||||||||||||||||||||||
| (1) | Unallocated Amounts in Gross |
| but rather are controlled at the corporate level. Unallocated Amounts in Revenue and Gross |
| (2) | Unallocated Assets consist of cash and cash equivalents, accounts receivable, deferred income tax assets, property, plant and equipment, intangible assets and other assets. Unallocated Assets are managed at the corporate level and are not identified with a specific segment. |
Geographic Information
Financial information relating to the Company’s revenue and long-lived assets by geographic area is as follows:
| Revenue (1) | ||||||||||||||||||||||||||||||||||||||||
| Revenue (1) | Years ended September 30, | |||||||||||||||||||||||||||||||||||||||
In millions | Predecessor | Successor | 2012 | 2011 | 2010 | |||||||||||||||||||||||||||||||||||
| Period from October 1, 2007 through October 26, 2007 | Years ended September 30, | Six months ended March 31, | ||||||||||||||||||||||||||||||||||||||
| 2008 | 2009 | 2010 | 2010 | 2011 | ||||||||||||||||||||||||||||||||||||
| (unaudited) | ||||||||||||||||||||||||||||||||||||||||
U.S. | $ | 142 | $ | 2,513 | $ | 2,276 | $ | 2,764 | $ | 1,289 | $ | 1,494 | $ | 2,786 | $ | 2,998 | $ | 2,764 | ||||||||||||||||||||||
International: | ||||||||||||||||||||||||||||||||||||||||
Germany | 42 | 715 | 579 | 537 | 285 | 251 | 461 | 505 | 537 | |||||||||||||||||||||||||||||||
EMEA (excluding Germany) | 29 | 857 | 613 | 846 | 383 | 491 | 888 | 983 | 846 | |||||||||||||||||||||||||||||||
|
|
| ||||||||||||||||||||||||||||||||||||||
Total EMEA | 71 | 1,572 | 1,192 | 1,383 | 668 | 742 | 1,349 | 1,488 | 1,383 | |||||||||||||||||||||||||||||||
APAC—Asia Pacific | 15 | 473 | 350 | 464 | 217 | 254 | 497 | 515 | 464 | |||||||||||||||||||||||||||||||
Americas International—Canada and Central and Latin America | 18 | 365 | 332 | 449 | 206 | 266 | 539 | 546 | 449 | |||||||||||||||||||||||||||||||
|
|
| ||||||||||||||||||||||||||||||||||||||
Total International | 104 | 2,410 | 1,874 | 2,296 | 1,091 | 1,262 | 2,385 | 2,549 | 2,296 | |||||||||||||||||||||||||||||||
|
|
| ||||||||||||||||||||||||||||||||||||||
Total revenue | $ | 246 | $ | 4,923 | $ | 4,150 | $ | 5,060 | $ | 2,380 | $ | 2,756 | $ | 5,171 | $ | 5,547 | $ | 5,060 | ||||||||||||||||||||||
|
|
| ||||||||||||||||||||||||||||||||||||||
| Long-Lived Assets (2) | ||||||||||||||||||||
| Long-Lived Assets(2) | September 30, | |||||||||||||||||||
In millions | September 30, 2009 | September 30, 2010 | March 31, 2011 | 2012 | 2011 | |||||||||||||||
| (unaudited) | ||||||||||||||||||||
North America: | ||||||||||||||||||||
U.S. | $ | 249 | $ | 296 | $ | 277 | $ | 244 | $ | 268 | ||||||||||
International: | ||||||||||||||||||||
Germany | 109 | 75 | 72 | 54 | 68 | |||||||||||||||
EMEA (excluding Germany) | 22 | 26 | 25 | 27 | 22 | |||||||||||||||
|
| |||||||||||||||||||
Total EMEA | 131 | 101 | 97 | 81 | 90 | |||||||||||||||
APAC—Asia Pacific | 28 | 31 | 29 | 24 | 24 | |||||||||||||||
Americas International—Canada and Central and Latin America | 11 | 22 | 20 | |||||||||||||||||
Americas International—Canada and Latin America | 15 | 15 | ||||||||||||||||||
|
| |||||||||||||||||||
Total International | 170 | 154 | 146 | 120 | 129 | |||||||||||||||
|
| |||||||||||||||||||
Total | $ | 419 | $ | 450 | $ | 423 | $ | 364 | $ | 397 | ||||||||||
|
| |||||||||||||||||||
| (1) | Revenue is attributed to geographic areas based on the location of customers. |
| (2) | Represents property, plant and equipment, net. |
18. Related Party Transactions
Both Avaya Holdings Corp. and Avaya Inc. are party to a Management Services Agreement with Silver Lake Management Company, III, L.L.C., an affiliate of Silver Lake, and TPG Capital, L.P., an affiliate of TPG, collectively “the Managers,” pursuant to which the Managers provide management and financial advisory services to the Company. Pursuant to the Management Services Agreement, the Managers receive a monitoring fee of $7 million per annum and reimbursement on demand for out-of-pocket expenses incurred in connection with the provision of such services. In the event of a financing, acquisition, disposition or change of control transaction involving the Company
during the term of the Management Services Agreement, the Managers have the right to require the Company to pay a fee equal to customary fees charged by internationally-recognized investment banks for serving as a financial advisor in similar transactions. The Management Services Agreement may be terminated at any time by the Managers, but otherwise has an initial term ending on December 31, 2017 that automatically extends each December 31st for an additional year unless earlier terminated by us or the Managers. The term has automatically extended four times since the execution of the agreement such that the current term is December 31, 2022. In the event that the Management Services Agreement is terminated, the Company is required to pay a termination fee equal to the net present value of the monitoring fees that would have been payable during the remaining term of the Management Services Agreement. Therefore, if the management services agreement were terminated as of September 30, 2012, the termination fee would be calculated using the current term ending December 31, 2022. In accordance with the Management Services Agreement, the Company recorded
$4 million (unaudited), $4 million (unaudited), $7 million, $7 million and $6 million of monitoring fees per year during the six months ended March 31,fiscal 2012, 2011 and 2010, fiscal years 2010, 2009 and 2008, respectively. No monitoring fees were provided during the period October 1, 2007 through October 26, 2007.
In the course of business, Avaya will enter into arrangements with affiliates of TPG and Silver Lake pursuant to which consultants are engaged to provide services to the Company. For the six month periods ended March 31, 2011 and 2010, expenses associated with these consulting agreements were less than $1 million (unaudited), and $1 million (unaudited), respectively. For each of the fiscal years 2010, 2009 and the period October 27, 2007 through September 30, 2008 the Company recorded $2 million of expenses associated with these consulting agreements with affiliates of TPG. No such consulting services were provided during the period October 1, 2007 through October 26, 2007.2010.
The Sponsors are private equity firms that have investments in companies that do business with Avaya. For the six month periods ended March 31,fiscal 2012, 2011 and 2010, fiscal years 2010, 2009 and the period October 27, 2007 through September 30, 2008 the Company recorded $4$7 million, (unaudited), $4 million (unaudited), $8 million $11 million and $15$8 million, respectively, associated with sales of the Company’s products and services to companies in which one or both of the Sponsors have investments. For the six month periods ended March 31,fiscal 2012, 2011 and 2010, the Company purchased goods and services from companies in which one or both of the Sponsors have investments were not material. For each of the fiscal years 2010, 2009$2 million, $3 million and 2008 the Company purchased goods and services of $1 million, respectively from companies in which one or both of the Sponsors have investments.
Charles Giancarlo, Greg Mondre and David Roux are Directors of each of Avaya Holdings Corp. and Avaya Inc. and they hold the positions of Managing Director, Managing Partner and Managing Director, and Chairman,Senior Director, respectively, of Silver Lake. Eugene Frantz,John W. Marren and Afshin Mohebbi and Kevin Rollins are Directors of each of Avaya Holdings Corp. and Avaya Inc. and they hold the positions of Partner, Senior Advisor and Senior Advisor, respectively, of TPG.
Effective June 30, 2008, Mr. Giancarlo was elected President and Chief Executive OfficerGary B. Smith serves on the Board of eachDirectors of Avaya Holdings Corp. and Avaya Inc. Pursuant to an agreement executed in July 2008 and subsequently amended in January 2009 between the Company and Silver Lake Management Company III, L.L.C., the Company was entitled to reduce the portion of the monitoring fee payable to Silver Lake under the Management Services Agreement discussed above by the amount of any compensation (excluding any one-time cash bonus compensation) paid by the Company or any of its affiliates to Mr. Giancarlo (plus any employer taxes paid with respect to such compensation during such period) in return for his service. During fiscal 2009 and the period October 27, 2007 through September 30, 2008, an aggregate of $1.4 million and $0.3 million, respectively, was paid to Mr. Giancarlo for servicesalso serves as President andpresident, Chief Executive Officer and Director of Ciena Corporation, or Ciena, a network infrastructure company. During fiscal 2012, the Company of whichrecorded less than $1 million in fiscal 2009 was a one-time cash bonus compensation. In addition, on November 24, 2008, Mr. Giancarlo received a grant of 500,000 stock options having an exercise price of $3.80 per share, the fair market value of a shareassociated with sales of the Company’s common stock on the dateproducts and services to Ciena. The Company also purchased goods and services of the grant. The stock options were issued with standard vesting provisions using the standard weightings of time-based, EBITDA-based and MoM-based awards used when making grants to employees generally. Effective December 22, 2008, Kevin J. Kennedy joined the Company as President and Chief Executive Officer. Subsequently, Mr. Giancarlo remained with the Company as the Chairman of the Board of Directors. Mr. Giancarlo participated in the Company’s stock option tender offer (see Note 14, “Share-based Compensation”) and tendered all of his stock options for an identical number of new stock options having a grant date of November 17, 2009, an exercise price of $3.00 per share and new vesting provisions.less than $1 million from Ciena during fiscal 2012.
During fiscal 2008, the Company purchased approximately $3 million of products and/or services from Cognos ULC (“Cognos”). Thomas Manley joined the Company as its Chief Financial Officer effective July 7, 2008. Prior to that time, Mr. Manley served as the Chief Financial Officer of Cognos, a position he relinquished when he joined the Company.
InSince April 2008, affiliates of TPG acquired $200 millionhave held some of the Avaya Inc’sCompany’s outstanding senior secured term B-1 loan.loans. Based on the amount of the senior secured term B-1 loans that were held during the period,fiscal 2012, 2011 and 2010, and consistent with the terms of the loan, those affiliates received payments of principal and interest aggregating approximately $3$4 million, (unaudited), $3 million (unaudited), $6 million $12and $6 million, and $5 million for the six months ended March 31, 2011 and 2010, fiscal 2010, fiscal 2009, and the period October 27, 2007 through September 30, 2008, respectively. In
Since September 2008, an affiliate of Silver Lake acquired $200 millionhas held some of the Avaya Inc’sInc.’s senior secured term B-1 loan.loans. On February 11, 2011, certain of the term B-1 loans held by this affiliate were reclassified as term B-3 loans (see Note 9, “Financing Arrangements”). Based on the amount of the senior secured term B-1 and term B-3 loans that were held by an affiliate of Silver Lake during the period,fiscal 2012, 2011 and 2010, and consistent with the terms of the loan, that affiliate received payments of principal and interest aggregating approximately $4$10 million, (unaudited), $4 million (unaudited), $8 million and $12$8 million, for the six months ended March 31, 2011 and 2010, fiscal 2010 and fiscal 2009, respectively.
In connection with the financing of the Acquisition,NES acquisition, affiliates of TPG and Silver Lake each funded an aggregate of approximately $222 million and $222 million, respectively, of incremental term B-2 loans. Avaya Inc. paid theThe incremental term B-2 loans were repaid in full on February 11, 2011 (see Note 9, “Financing Arrangements”). Similar to other holders of senior secured incremental term B-2 loans, those senior secured incremental term B-2 loans held by affiliates of TPG and Silver Lake were repaid in connection with the issuance of the Avaya Inc.’s senior secured notes. Consistent with the terms of the incremental term B-2 loans, affiliates of TPG and Silver Lake each received payments (consisting of principal and interest, inclusive of amounts paid by Avaya Inc. in connection with the payment in full of all incremental term B-2 loans on February 11, 2011) aggregating approximately $285 million (unaudited), and $285 million (unaudited), respectively, for the six month period ended March 31,fiscal 2011 aggregating approximately $9 million (unaudited) and $9 million (unaudited), respectively for the six month period ended March 31, 2010, and aggregating approximately $25 million and $25 million respectively, for fiscal 2010. In addition, on February 11, 2011, certain of Avaya Inc.’s term B-1 loans were reclassified as term B-3 loans (see Note 9, “Financing Arrangements”). For the six month period ended March 31, 2011, an affiliate of Silver Lake received payments of principal and interest aggregating approximately $1 million (unaudited) with respect to its holdings of Avaya Inc.’s senior secured term B-3 loans.
As of March 31, 2011September 30, 2012 affiliates of Silver Lake held $54$45 million (unaudited) and $124$122 million (unaudited) in outstanding principal amounts of term B-1 loans and term B-3 loans, respectively. As of September 30, 20102011 affiliates of Silver Lake held $194$54 million and $274$123 million in outstanding principal amounts of term B-1 loans and incremental term B-2B-3 loans, respectively. As of September 30, 2009 affiliates of Silver Lake held $196 million in outstanding principal amounts of term B-1 loans.
As of March 31, 2011September 30, 2012 affiliates of TPG held $144$44 million (unaudited) in outstanding principal amounts of term B-1 loans. As of September 30, 2010,2011 affiliates of TPG held $145 million and $274 million in outstanding principal amounts of term B-1 loans and incremental term B-2 loans, respectively. As of September 30, 2009 affiliates of TPG held $195$119 million in outstanding principal amounts of term B-1 loans.
In addition, in connection with the financing of the Acquisition, weNES acquisition, the Company issued shares of ourits Series A preferred stock.Preferred Stock. As of March 31, 2011,September 30, 2012, affiliates of TPG owned 38,864.13 shares (unaudited) of ourthe Company’s non-voting Series A preferred stockPreferred Stock (representing 31.1% of the issued and outstanding shares of Series A preferred stock)Preferred Stock) and affiliates of Silver Lake owned 38,864.13 shares (unaudited) of ourthe Company’s non-voting Series A preferred stockPreferred Stock (representing 31.1% of the issued and outstanding shares of Series A Preferred Stock).
In connection with the financing of the Radvision acquisition, the Company issued shares of its preferred stock) (see Note 15, “Capital Stock”).Series B to affiliates of TPG and Silver Lake. As of September 30, 2012, affiliates of TPG owned 32,649 shares of the Company’s preferred Series B and affiliates of Silver Lake owned 32,649 shares of the Company’s preferred Series B.
19. Commitments and Contingencies
Legal Proceedings
In the ordinary course of business, the Company is involved in litigation, claims, government inquiries, investigations and proceedings, including, but not limited to, those identified below, relating to intellectual property, commercial, securities, employment, employee benefits, environmental and regulatory matters.
Other than as described below, the Company believes there is no litigation pending or environmental and regulatory matters against the Company that could have, individually or in the aggregate, a material adverse effect on the Company’s financial position, results of operations or cash flows.
Government Subpoenas
On May 3, 2005, the Company received a subpoena from the Office of Inspector General, U.S. General Services Administration, relating to a federal investigation of the Company’s billing for telecommunications equipment and maintenance services. In January 2011, the Company settled this matter, as well as ancillary state matters, for approximately $16 million, including legal fees for plaintiffs’ lawyers.
Antitrust Litigation
In 2006, the Company instituted an action in the U.S. District Court, District of New Jersey, against defendants Telecom Labs, Inc., TeamTLI.com Corp. and Continuant Technologies, Inc. and subsequently amended its complaint to include certain individual officers of these companies as defendants. Defendants purportedly provide maintenance services to customers who have purchased or leased the Company’s communications equipment. The Company asserts in its amended complaint that, among other things, defendants, or each of them, have engaged in tortious conduct and/or violated federal intellectual property laws by improperly accessing and utilizing the Company’s proprietary software, including passwords, logins and maintenance service permissions, to perform certain maintenance services on the Company’s customers’ equipment. Defendants have filed a counterclaimcounterclaims against the Company, alleging a number of tort claims and alleging that the Company has violated the Sherman Act’s prohibitions against anticompetitive conduct through the manner in which the Company sells its products and services. The Company filed a motionDefendants seek to dismissrecover the profits they claim they would have earned from maintaining Avaya’s products, and ask for injunctive relief prohibiting the conduct they claim is anticompetitive. Under the federal anticompetitive claims, whichantitrust laws, defendants could be entitled to three times the court granted in partamount of any actual damages awarded for lost profits plus attorney’s fees and denied in part. Defendants filed a motion to dismiss the Company’s claims to the extent they assert violations of the federal Digital Millennium Copyright Act. The court denied Defendants’ motion in its entirety. Defendants also filed a motion to amend their complaint, which was denied in part and affirmed in part.costs. The parties have engaged in extensive discovery and motion practice to, among other things, amend and dismiss pleadings and compel and oppose discovery requests. A trial date originally set for September 2011 has been adjourned and no new date has been set by the court. At this pointIn January 2012, Avaya’s motions to dismiss defendants’ counterclaims were granted in part and denied in part. In February 2012, the proceeding,parties filed motions for reconsideration of certain
aspects of the Court’s ruling and Avaya filed a motion for certification of an interlocutory appeal. The parties’ motions were denied on April 26, 2012. Expert discovery on the Company’s claims and the defendants’ surviving counter-claims continues.is completed, and in July 2012 the parties filed motions to exclude the opinion testimony of certain of each others’ experts, which were denied without prejudice on August 28, 2012. On August 17, 2012, defendants filed motions for partial summary judgment, seeking to dismiss the Company’s claims for tortious interference with contractual relations and misappropriation of trade secrets, which were denied on October 26, 2012. Therefore, at this time an outcome cannot be predicted and, as a result, the Company cannot be assured that this case will not have a material adverse effect on the manner in which it does business, its financial position, results of operations, or cash flows.
Intellectual Property
In the ordinary course of business, the Company is involved in litigation alleging it has infringed upon third parties’ intellectual property rights, including patents.patents; some litigation may involve claims for infringement against customers by third parties relating to the use of Avaya’s products, as to which the Company may provide indemnifications of varying scope to certain customers. These matters are on-going and the outcomes are subject to inherent uncertainties. As a result, the Company cannot be assured that any such matter will not have a material adverse effect on its financial position, results of operations or cash flows. However, management does provide for estimated losses if and when it believes the facts and circumstances indicate that a loss is probable and the loss can be reasonably estimated. While it is not possible at this time to determine with certainty the ultimate outcome of these cases, the Company believes there are no such infringement matters that could have, individually or in aggregate, a material adverse effect on the Company’s financial position, results of operations or cash flows.
Other
In August 2007, CIT Communications Finance Corp. (“CIT”), instituted an arbitration proceeding, alleging that the Company breached a number of agreements dating back to 1998, including agreements wherein CIT Corp. purchased a certain number of customer leases from the Company’s predecessor, Lucent. CIT filed amended claims in August 2007 and then in June 2008. CIT alleges that the Company and Lucent breached provisions in the agreements, including representations, warranties and covenants regarding the nature of the assets CIT purchased. The parties have entered into a settlement agreement to resolve this issue for an amount which will not have a material adverse effect on the Company’s financial position, results of operations or cash flows.
Since November 2008, OpenLink Software Inc. (“OpenLink”), a former supplier of software utilized by Avaya in its Call Management System, has alleged that the Company breached the terms of software licenses in
an OEM agreement dated June 23, 1997, as amended from time to time. In April 2011, the Company settled this matter without the Company admitting wrongdoing and for an amount that did not have a material adverse effect on the Company’s financial position, results of operations, or cash flows.
In October 2009, a former supplier in France, Combel, made a claim for improper termination of the Company’s relationship under French law seeking damages of at least €10 million and a provisional (interim) indemnity by the Company of €5 million. The Company disputes that Combel is entitled to any such damages and that it has not improperly terminated the relationship. In December 2010, the court rejected all claims of Combel based on the allegedly improper termination of the commercial relationship and only a claim with respect to the buyback of inventory remains open. To assess the value of the remaining inventory, the court appointed an expert. Combel has filed an appeal against the Court decision. The next hearing is scheduled in September 2011. An outcome cannot be predicted and, as a result, the Company cannot be assured that this case will not have a material adverse effect on its financial position, results of operations or cash flows.
In October 2009, a group of former employees of Avaya’s former Shreveport, Louisiana manufacturing facility brought suit in Louisiana state court, naming as defendants Alcatel-Lucent USA, Inc., Lucent Technologies Services Company, Inc., and AT&T Technologies, Inc. The former employees allege hearing loss due to hazardous noise exposure from the facility dating back over forty years, and stipulate that the total amount of each individual’s damages does not exceed fifty thousand dollars. In February 2010 plaintiffs amended their complaint to add Avaya Inc.the Company as a named defendant. There are 101 plaintiffs in the case. This matter is inDefendants’ motion to dismiss plaintiffs’ complaint was denied on April 30, 2012. At this time an outcome cannot be predicted, however, because the early phasesamount of discovery. Thethe claims are not material, the Company cannot determine ifbelieves the outcome of this matter will have an effect on our business or, if it does, whether its outcome willnot have a material adverse effect on ourthe manner in which it does business, its financial position, results of operations, or cash flow.flows.
General
The Company records accruals for legal contingencies to the extent that it has concluded it is probable that a liability has been incurred and the amount of the loss can be reasonably estimated. No estimate of the possible loss or range of loss in excess of amounts accrued, if any, can be made at this time regarding the matters specifically described above because the inherently unpredictable nature of legal proceedings may be exacerbated by various factors, including: (i) the damages sought in the proceedings are unsubstantiated or indeterminate; (ii) discovery is not complete; (iii) the proceeding is in its early stages; (iv) the matters present legal uncertainties; (v) there are significant facts in dispute; (vi) there are a large number of parties (including where it is uncertain how liability, if any, will be shared among multiple defendants); or (vii) there is a wide range of potential outcomes.
Product Warranties
The Company recognizes a liability for the estimated costs that may be incurred to remedy certain deficiencies of quality or performance of the Company’s products. These product warranties extend over a specified period of time generally ranging up to two years from the date of sale depending upon the product subject to the warranty. The Company accrues a provision for estimated future warranty costs based upon the historical relationship of warranty claims to sales. The Company periodically reviews the adequacy of its product warranties and adjusts, if necessary, the warranty percentage and accrued warranty reserve, which is included in other current liabilities in the Consolidated Balance Sheets, for actual experience.
In millions Balance as of October 1, 2010 Reductions for payments and costs to satisfy claims Accruals for warranties issued during the period Adjustments Balance as of September 30, 2011 Reductions for payments and costs to satisfy claims Accruals for warranties issued during the period Balance as of September 30, 2012 $ 45 (40 ) 21 (2 ) 24 (19 ) 11 $ 16
In millions | ||||
Balance as of September 30, 2009 | $ | 21 | ||
Reductions for payments and costs to satisfy claims | (41 | ) | ||
Accruals for warranties issued during the period | 36 | |||
Reserves acquired with NES | 34 | |||
Adjustments | (5 | ) | ||
Balance as of September 30, 2010 | 45 | |||
Reductions for payments and costs to satisfy claims | (22 | ) | ||
Accruals for warranties issued during the period | 13 | |||
Adjustments | (2 | ) | ||
Balance as of March 31, 2011 (unaudited) | $ | 34 | ||
The Company provides indemnifications of varying scope to certain customers against claims of intellectual property infringement made by third parties arising from the use of Avaya’s products. To date, the Company has not incurred any losses as a result of such obligations and it has not accrued any liabilities related to such indemnifications.
Guarantees of Indebtedness and Other Off-Balance Sheet Arrangements
Letters of Credit
The Company has uncommitted credit facilities that vary in term totaling $51 million asAs of September 30, 2010 for2012, the purposeCompany had outstanding an aggregate of obtaining third party financial guarantees such as$119 million in irrevocable letters of credit which ensure the Company’s performance or payment to third parties. As of September 30, 2010 and 2009, the Company had outstanding an aggregate of $104Included in this amount is $77 million and $101 million, respectively, in irrevocable letters of credit under the committed and uncommitted credit facilities (including $53 million and $47 million, respectively,issued under its $535 million committed credit facilities).
As of March 31, 2011, the Company has uncommittedrevolving credit facilities, of $50which facilities are available through October 26, 2016. Also included is $42 million (unaudited), of which the Company had entered into letters of credit totaling $48 million (unaudited) that vary in term for the purpose of securing third party financial guarantees, such as letters of credit that ensure the Company’s performance or payment to third parties. As of March 31, 2011, the Company had outstanding an aggregate of $120 million (unaudited) in irrevocable letters of creditissued under its committed and uncommitted credit facilities (including $72 million (unaudited) under its $535 million (unaudited) committed credit facilities).facilities.
Surety Bonds
The Company arranges for the issuance of various types of surety bonds, such as license, permit, bid and performance bonds, which are agreements under which the surety company guarantees that the Company will perform in accordance with contractual or legal obligations. These bonds vary in duration although most are issued and outstanding from sixthree months to three years. These bonds are backed by $12 million of the Company’s letters of credit. If the Company fails to perform under its obligations, the maximum potential payment under these surety bonds is $24 million (unaudited), $34 million and $36$12 million as of March 31, 2011, September 30, 2010 and 2009, respectively.2012. Historically, no surety bonds have been drawn upon.
Purchase Commitments and Termination Fees
The Company purchases components from a variety of suppliers and uses several contract manufacturers to provide manufacturing services for its products. During the normal course of business, in order to manage manufacturing lead times and to help assure adequate component supply, the Company enters into agreements with contract manufacturers and suppliers that allow them to produce and procure inventory based upon forecasted requirements provided by the Company. If the Company does not meet these specified purchase commitments, it could be required to purchase the inventory, or in the case of certain agreements, pay an early termination fee. Historically, the Company has not been required to pay a charge for not meeting its designated purchase commitments with these suppliers.suppliers, but has been obligated to purchase certain excess inventory levels from its outsourced manufacturers due to actual sales of product varying from forecast and due to transition of manufacturing from one vendor to another.
The Company’s outsourcing agreementagreements with its two most significant contract manufacturer expiresmanufacturers expire in July and September 2013. After the initial term, the outsourcing agreement isagreements are automatically renewed for successive periods of twelve months each, subject to specific termination rights for the Company and the contract manufacturer.manufacturers. All manufacturing of the Company’s products is performed in accordance with either detailed requirements or specifications and product designs furnished by the Company, and is subject to rigorous quality control standards.
Product Financing Arrangements
The Company sells products to various resellers that may obtain financing from certain unaffiliated third-party lending institutions. For the Company’s product financing arrangement with resellers outside the U.S., in the event participating resellers default on their payment obligations to the lending institution, the Company is obligated under certain circumstances to guarantee repayment to the lending institution. The repayment amount fluctuates with the level of product financing activity. The guaranteed repayment amount was approximately $3 million (unaudited) and $4 million as of March 31, 2011 and September 30, 2010, respectively.2012. The Company
reviews and sets the maximum credit limit for each reseller participating in this financing arrangement. Historically, there have not been any guarantee repayments by the Company. The Company has estimated the fair value of this guarantee as of March 31, 2011 and September 30, 2010,2012, and has determined that it is not significant. There can be no assurance that the Company will not be obligated to repurchase inventory under this arrangement in the future.
Long-Term Cash Incentive Bonus Plan
The Company has established a long-term incentive cash bonus plan (“LTIP”). Under the LTIP, the Company will make cash awards available to compensate certain key employees upon the achievement of defined returns on the Sponsors’ initial investment in the Company (a “triggering event”). The Company has issuedauthorized LTIP awards covering a total of $60 million, of which $43 million (unaudited) and $41$44 million in awards were outstanding as of March 31, 2011 and September 30, 2010, respectively. Compensation2012. The Company will begin to recognize compensation expense relative to the LTIP awards will be recognized upon the occurrence of a triggering event (e.g., a sale or initial public offering). As of March 31, 2011,September 30, 2012, no compensation expense associated with the LTIP has been recognized.
Performance Guarantee
In connection with the sales of certain businesses, the Company has assigned its rights and obligations under several real estate leases to the acquiring companies (the “assignees”). The remaining terms of these leases vary from one year to four years. While the Company is no longer the primary obligor under these leases, the lessor has not completely released the Company from its obligation, and holds it secondarily liable in the event that the assignees default on these leases. The maximum potential future payments the Company could be required to make, if all of the assignees were to default as of March 31, 2011 and September 30, 2010, would be approximately $3 million (unaudited) and $5 million, respectively. The Company has assessed the probability of default by the assignees and has determined it to be remote.
Credit Facility Indemnification
In connection with its obligations under the credit facilityfacilities described in Note 9, “Financing Arrangements,” the Company has agreed to indemnify the third-party lending institutions for costs incurred by the institutions related to changes in tax law or other legal requirements. While there have been no amounts paid to the lenders pursuant to this indemnity in the past, there can be no assurance that the Company will not be obligated to indemnify the lenders under this arrangement in the future.
Transactions with Alcatel-Lucent
Pursuant to the Contribution and Distribution Agreement effective October 1, 2000, Lucent Technologies, Inc. (now Alcatel-Lucent) contributed to the Company substantially all of the assets, liabilities and operations associated with its enterprise networking businesses (“(the “Company’s Businesses”) and distributed the Company’s Businesses”stock pro-rata to the shareholders of Lucent (“distribution”). The Contribution and Distribution Agreement, among other things, provides that, in general, the Company will indemnify LucentAlcatel-Lucent for all liabilities including certain pre-distribution tax obligations of LucentAlcatel-Lucent relating to its businessesthe Company’s Businesses and all contingent liabilities accruing pre-distribution primarily relating to its businessesthe Company’s Businesses or otherwise assigned to it.the Company. In addition, the Contribution and Distribution Agreement provides that certain contingent liabilities not directly identifiable withallocated to one of the parties accruing pre-distribution will be shared by Alcatel-Lucent and the Company in the proportion of 90% by Lucent and 10% by the Company.prescribed percentages. The Contribution and Distribution Agreement also provides that each party will share specified portions of contingent liabilities accruing pre-distribution in excess of $50 million that are primarilybased upon agreed percentages related to Lucent’s businesses shallthe business of the other party that exceed $50 million. The Company is unable to determine the maximum potential amount of other future payments, if any, that it could be borne 90% by Lucent and 10% by the Company and contingent liabilities accruing pre-distribution in excess of $50 million that are primarily relatedrequired to our businesses shall be borne equally by the parties.make under this agreement.
In addition, if the separation from Alcatel-Lucent fails to qualify as a tax-free distribution under Section 355 of the Internal Revenue Code because of an acquisition of the Company’s stock or assets, or some other actions of the Company, then the Company will be solely liable for any resulting corporate taxes.
The Tax Sharing Agreement governs Alcatel-Lucent’s and the Company’s respective rights, responsibilities and obligations after the distribution with respect to taxes for the periods ending on or before the distribution. Generally, pre-distribution taxes or benefits that are clearly attributable to the business of one party will be borne solely by that party, and other pre-distribution taxes or benefits will be shared by the parties based on a formula set forth in the Tax Sharing Agreement. The Company may be subject to additional taxes or benefits pursuant to the Tax Sharing Agreement related to future settlements of audits by state and local and foreign taxing authorities for the periods prior to the Company’s separation from Alcatel-Lucent.
Leases
The Company leases land, buildings and equipment under agreements that expire in various years through 2026. Rental expense under operating leases, excluding any lease termination costs incurred related to the Company’s restructuring programs, was $138$112 million, $115 million, $9$122 million and $116$138 million for fiscal 20102012, 2011 and 2009 and for the period October 1, 2007 through October 26, 2007 and the period October 27, 2007 through September 30, 2008,2010, respectively.
The table below sets forth future minimum lease payments, net of sublease income, due under non-cancelable operating leases, of which $63$64 million of such payments have been accrued for as of September 30, 20102012 in accordance with accounting principles generally accepted in the U.S. pertaining to restructuring and exit activities.
In millions | ||||||||
2011 | $ | 116 | ||||||
2012 | 85 | |||||||
2013 | 61 | $ | 101 | |||||
2014 | 49 | 83 | ||||||
2015 | 42 | 70 | ||||||
2016 and thereafter | 145 | |||||||
2016 | 60 | |||||||
2017 and thereafter | 185 | |||||||
| ||||||||
Future minimum lease payments | $ | 498 | $ | 499 | ||||
| ||||||||
20. Quarterly information (unaudited)
| First Quarter | Second Quarter | Third Quarter | Fourth Quarter | Total | ||||||||||||||||||||||||||||||||||||
In millions | First Quarter | Second Quarter | Third Quarter | Fourth Quarter | Total | |||||||||||||||||||||||||||||||||||
Year Ended September 30, 2009 | ||||||||||||||||||||||||||||||||||||||||
Fiscal Year Ended September 30, 2012 | ||||||||||||||||||||||||||||||||||||||||
Revenue | $ | 1,113 | $ | 1,000 | $ | 986 | $ | 1,051 | $ | 4,150 | $ | 1,387 | $ | 1,257 | $ | 1,250 | $ | 1,277 | $ | 5,171 | ||||||||||||||||||||
Gross margin | 501 | 443 | 439 | 483 | 1,866 | |||||||||||||||||||||||||||||||||||
Gross profit | 704 | 613 | 623 | 646 | 2,586 | |||||||||||||||||||||||||||||||||||
Operating income (loss) | 5 | (317 | ) | (109 | ) | 1 | (420 | ) | 82 | (66 | ) | 23 | 76 | 115 | ||||||||||||||||||||||||||
Provision for (benefit from) income taxes | 1 | (17 | ) | 11 | 35 | 30 | ||||||||||||||||||||||||||||||||||
Benefit from (provision for) income taxes | 2 | 24 | (88 | ) | 54 | (8 | ) | |||||||||||||||||||||||||||||||||
Net (loss) income | (26 | ) | (165 | ) | (169 | ) | 6 | (354 | ) | |||||||||||||||||||||||||||||||
Net loss attributable to common stockholders | $ | (28 | ) | $ | (166 | ) | $ | (226 | ) | $ | (5 | ) | $ | (425 | ) | |||||||||||||||||||||||||
Net loss per share—basic and diluted | $ | (0.06 | ) | $ | (0.34 | ) | $ | (0.46 | ) | $ | (0.01 | ) | $ | (0.87 | ) | |||||||||||||||||||||||||
Fiscal Year Ended September 30, 2011 | ||||||||||||||||||||||||||||||||||||||||
Revenue | $ | 1,366 | $ | 1,390 | $ | 1,372 | $ | 1,419 | $ | 5,547 | ||||||||||||||||||||||||||||||
Gross profit | 619 | 642 | 653 | 718 | 2,632 | |||||||||||||||||||||||||||||||||||
Operating (loss) income | (39 | ) | (47 | ) | (92 | ) | 84 | (94 | ) | |||||||||||||||||||||||||||||||
(Provision for) benefit from income taxes | (22 | ) | (19 | ) | 52 | (79 | ) | (68 | ) | |||||||||||||||||||||||||||||||
Net loss | (90 | ) | (401 | ) | (224 | ) | (130 | ) | (845 | ) | (180 | ) | (432 | ) | (152 | ) | (99 | ) | (863 | ) | ||||||||||||||||||||
Net loss attributable to common stockholders | $ | (90 | ) | $ | (401 | ) | $ | (225 | ) | $ | (131 | ) | $ | (847 | ) | $ | (181 | ) | $ | (434 | ) | $ | (154 | ) | $ | (101 | ) | $ | (870 | ) | ||||||||||
Net loss per share—basic and diluted | $ | (0.19 | ) | $ | (0.82 | ) | $ | (0.46 | ) | $ | (0.27 | ) | $ | (1.74 | ) | $ | (0.37 | ) | $ | (0.89 | ) | $ | (0.31 | ) | $ | (0.21 | ) | $ | (1.78 | ) | ||||||||||
Year Ended September 30, 2010 | ||||||||||||||||||||||||||||||||||||||||
Revenue | $ | 1,060 | $ | 1,320 | $ | 1,332 | $ | 1,348 | $ | 5,060 | ||||||||||||||||||||||||||||||
Gross margin | 510 | 536 | 555 | 571 | 2,172 | |||||||||||||||||||||||||||||||||||
Operating loss | (35 | ) | (174 | ) | (105 | ) | (67 | ) | (381 | ) | ||||||||||||||||||||||||||||||
Provision for (benefit from) income taxes | 3 | (19 | ) | 9 | 25 | 18 | ||||||||||||||||||||||||||||||||||
Net loss | (136 | ) | (281 | ) | (240 | ) | (214 | ) | (871 | ) | ||||||||||||||||||||||||||||||
Net loss attributable to common stockholders | $ | (194 | ) | $ | (284 | ) | $ | (241 | ) | $ | (217 | ) | $ | (936 | ) | |||||||||||||||||||||||||
Net loss per share—basic and diluted | $ | (0.40 | ) | $ | (0.58 | ) | $ | (0.49 | ) | $ | (0.45 | ) | $ | (1.92 | ) | |||||||||||||||||||||||||
21. Condensed Financial Information of Parent Company
Avaya Holdings Corp. has no material assets or standalone operations other than its ownership in Avaya Inc. and its subsidiaries.
There are significant restrictions on the Company’s ability to obtain funds from any of its subsidiaries through dividends, loans or advances. Accordingly, these condensed financial statements have been presented on a “Parent-only” basis. Under a Parent-only presentation, the Company’s investments in its consolidated subsidiaries are presented under the equity method of accounting. These Parent-only financial statements should be read in conjunction with the Company’s consolidated financial statements.Consolidated Financial Statements.
The following tables present the financial position the results of operations and cash flows of Avaya Holdings Corp. as of September 30, 20092012 and 2010 and March 31, 2011 and the fiscalresults of its operations and cash flows for the years ended September 30, 2008, 20092012, 2011 and 2010 and the six months ended March 31, 2010 and 2011.2010.
Avaya Holdings Corp.
Condensed Balance Sheets
| September 30, | ||||||||||||||||||||
In millions | Years ended September 30, | March 31, 2011 | 2012 | 2011 | ||||||||||||||||
| 2009 | 2010 | |||||||||||||||||||
| (Unaudited) | ||||||||||||||||||||
Cash and cash equivalents | $ | 15 | $ | 15 | $ | 15 | $ | 1 | $ | 15 | ||||||||||
Other non-current assets | — | 2 | ||||||||||||||||||
|
| |||||||||||||||||||
TOTAL | $ | 15 | $ | 15 | $ | 15 | $ | 1 | $ | 17 | ||||||||||
|
| |||||||||||||||||||
DEFICIENCY IN EXCESS OF INVESTMENT IN AVAYA INC., PREFERRED STOCK AND STOCKHOLDERS’ DEFICIENCY | ||||||||||||||||||||
LIABILITIES, DEFICIENCY IN EXCESS OF INVESTMENT IN AVAYA INC., PREFERRED STOCK AND STOCKHOLDERS’ DEFICIENCY | ||||||||||||||||||||
Due to Avaya Inc. | $ | 3 | $ | 2 | ||||||||||||||||
Other current liabilities | 26 | — | ||||||||||||||||||
Note payable to Avaya Inc. | 8 | — | ||||||||||||||||||
Deficiency in excess of investment in Avaya Inc. | $ | 651 | $ | 1,428 | $ | 2,018 | 2,436 | 2,378 | ||||||||||||
Commitments and contingencies | ||||||||||||||||||||
Preferred stock Series A | — | 130 | 133 | |||||||||||||||||
Preferred stock, Series B | 227 | — | ||||||||||||||||||
Preferred stock, Series A | 144 | 137 | ||||||||||||||||||
Stockholders’ deficiency | (636 | ) | (1,543 | ) | (2,136 | ) | (2,843 | ) | (2,500 | ) | ||||||||||
|
| |||||||||||||||||||
TOTAL | $ | 15 | $ | 15 | $ | 15 | $ | 1 | $ | 17 | ||||||||||
|
| |||||||||||||||||||
Avaya Holdings Corp.
Condensed Statements of Operations
| Years ended September 30, | Six months ended March 31, | Years ended September 30, | ||||||||||||||||||||||||||||||
In millions | 2008 | 2009 | 2010 | 2010 | 2011 | 2012 | 2011 | 2010 | ||||||||||||||||||||||||
Equity in net loss of Avaya Inc. | $ | (344 | ) | $ | (863 | ) | $ | (871 | ) | |||||||||||||||||||||||
| (Unaudited) | ||||||||||||||||||||||||||||||||
Interest income | $ | 1 | $ | — | $ | — | $ | — | $ | — | ||||||||||||||||||||||
Equity in net loss of Avaya Inc. | (1,308 | ) | (847 | ) | (874 | ) | (419 | ) | (612 | ) | ||||||||||||||||||||||
Change in fair value of Preferred Series B derivative | (6 | ) | — | — | ||||||||||||||||||||||||||||
Securities registration fees | (3 | ) | — | — | ||||||||||||||||||||||||||||
Interest expense | (1 | ) | — | — | ||||||||||||||||||||||||||||
|
|
| ||||||||||||||||||||||||||||||
LOSS BEFORE INCOME TAXES | (1,307 | ) | (847 | ) | (874 | ) | (419 | ) | (612 | ) | (354 | ) | (863 | ) | (871 | ) | ||||||||||||||||
Provision for income taxes | — | — | — | — | — | — | — | — | ||||||||||||||||||||||||
|
|
| ||||||||||||||||||||||||||||||
NET LOSS | $ | (1,307 | ) | $ | (847 | ) | $ | (874 | ) | $ | (419 | ) | $ | (612 | ) | $ | (354 | ) | $ | (863 | ) | $ | (871 | ) | ||||||||
|
|
| ||||||||||||||||||||||||||||||
Avaya Holdings Corp.
Condensed Statements of Comprehensive Loss
| Years ended September 30, | ||||||||||||
In millions | 2012 | 2011 | 2010 | |||||||||
Net loss | $ | (354 | ) | $ | (863 | ) | $ | (871 | ) | |||
Equity in comprehensive income (loss) of Avaya Inc. | 52 | (97 | ) | (73 | ) | |||||||
|
|
|
|
|
| |||||||
Comprehensive loss | $ | (302 | ) | $ | (960 | ) | $ | (944 | ) | |||
|
|
|
|
|
| |||||||
Avaya Holdings Corp.
Condensed Statements of Cash Flows
| Years ended September 30, | Six months ended March 31, | Years ended September 30, | ||||||||||||||||||||||||||||||
In millions | 2008 | 2009 | 2010 | 2010 | 2011 | 2012 | 2011 | 2010 | ||||||||||||||||||||||||
| (Unaudited) | ||||||||||||||||||||||||||||||||
Net loss | $ | (1,307 | ) | (847 | ) | (874 | ) | (419 | ) | (612 | ) | $ | (354 | ) | $ | (863 | ) | $ | (874 | ) | ||||||||||||
Adjustments to reconcile net loss to net cash used by operating activities | ||||||||||||||||||||||||||||||||
Equity in net loss of Avaya Inc. | 1,307 | 847 | 874 | 419 | 612 | 344 | 863 | 874 | ||||||||||||||||||||||||
Change in fair value of Preferred Series B derivative | 6 | — | — | |||||||||||||||||||||||||||||
Changes in operating assets and liabilities | — | — | — | — | — | 4 | — | — | ||||||||||||||||||||||||
|
|
| ||||||||||||||||||||||||||||||
Net cash used for operating activities: | — | — | — | — | — | |||||||||||||||||||||||||||
Net cash used for operating activities | — | — | — | |||||||||||||||||||||||||||||
|
|
| ||||||||||||||||||||||||||||||
Investing activities: | ||||||||||||||||||||||||||||||||
Investment in Avaya Inc. | (2,409 | ) | — | (199 | ) | (199 | ) | — | (196 | ) | — | (199 | ) | |||||||||||||||||||
Fiancing activities: | ||||||||||||||||||||||||||||||||
Issuance of common stock | 2,427 | 1 | — | — | — | |||||||||||||||||||||||||||
Purchase of common stock | (3 | ) | — | — | — | — | ||||||||||||||||||||||||||
Withholding taxes—shared based compensation | — | (1 | ) | — | — | — | ||||||||||||||||||||||||||
Acquisition of businesses, net of cash acquired | (22 | ) | — | — | ||||||||||||||||||||||||||||
|
|
| ||||||||||||||||||||||||||||||
Net cash used for investing activities | (218 | ) | — | (199 | ) | |||||||||||||||||||||||||||
|
|
| ||||||||||||||||||||||||||||||
Financing activities: | ||||||||||||||||||||||||||||||||
Proceeds from loan from Avaya Inc. | 8 | — | — | |||||||||||||||||||||||||||||
Issuance of preferred stock and warrants | — | — | 125 | 125 | — | 196 | — | 125 | ||||||||||||||||||||||||
Net proceeds from issuance of warrants | — | — | 74 | 74 | — | — | — | 74 | ||||||||||||||||||||||||
|
|
| ||||||||||||||||||||||||||||||
Net cash provided by financing activities | 2,424 | — | 199 | 199 | — | 204 | — | 199 | ||||||||||||||||||||||||
Net increase in cash and cash equivalents | 15 | — | — | — | — | |||||||||||||||||||||||||||
|
|
| ||||||||||||||||||||||||||||||
Net decrease in cash and cash equivalents | (14 | ) | — | — | ||||||||||||||||||||||||||||
Cash and cash equivalents at beginning of period | — | 15 | 15 | 15 | 15 | 15 | 15 | 15 | ||||||||||||||||||||||||
|
|
| ||||||||||||||||||||||||||||||
Cash and cash equivalents at end of period | $ | 15 | $ | 15 | $ | 15 | $ | 15 | $ | 15 | $ | 1 | $ | 15 | $ | 15 | ||||||||||||||||
|
|
| ||||||||||||||||||||||||||||||
22. Guarantor—Non Guarantor financial information
Borrowings by Avaya Inc. under the senior secured credit facility are jointly and severally, fully and unconditionally guaranteed by all wholly owned U.S. subsidiaries of Avaya Inc. (with certain agreed-upon exceptions) (collectively, the “Guarantors”) and Avaya Holdings Corp. The senior secured notes, the senior unsecured cash-pay notes and the senior unsecured PIK toggle notes issued by Avaya Inc. are jointly and severally, fully and unconditionally guaranteed by the Guarantors. None of the other subsidiaries of Avaya Inc., either directly or indirectly, guarantees the senior secured credit facility, the senior secured notes, the senior unsecured cash-pay notes or the senior unsecured PIK toggle notes (“Non-Guarantors”).
Avaya Inc. and each of the Guarantors are authorized to borrow under the senior secured asset-based credit facility. Borrowings under that facility are jointly and severally, fully, and unconditionally guaranteed by Avaya Inc. and the Guarantors. Additionally these borrowings are fully and unconditionally guaranteed by Avaya Holdings Corp. The senior secured notes and the related guarantees are secured equally and ratably (other than with respect to real estate) with the senior secured credit facility and any future first lien obligations by (i) a first-priority lien on substantially all of the Avaya Inc.’s and the Guarantors’ assets, other than (x) any real estate and (y) collateral that secures the senior secured multi-currency asset based revolving credit facility on a first-priority basis (the “ABL Priority Collateral”) and (ii) a second-priority lien on the ABL Priority Collateral, subject to certain limited exceptions.
The following tables present the results of operations and cash flows of Avaya Inc., the Guarantor subsidiaries, the Non-Guarantor subsidiaries and Eliminations for the Predecessor period from October 1, 2007 through October 26, 2007 to arrive at the information for Avaya Inc. on a consolidated basis.
Supplemental Condensed Consolidating Schedule of Operations
(Predecessor)
| Period from October 1, 2007 through October 26, 2007 | ||||||||||||||||||||
In millions | Avaya Inc. | Guarantor Subsidiaries | Non-Guarantor Subsidiaries | Eliminations | Consolidated | |||||||||||||||
REVENUE | $ | 151 | $ | — | $ | 102 | $ | (7 | ) | $ | 246 | |||||||||
COST | 92 | 4 | 68 | (7 | ) | 157 | ||||||||||||||
GROSS MARGIN | 59 | (4 | ) | 34 | — | 89 | ||||||||||||||
OPERATING EXPENSES | ||||||||||||||||||||
Selling, general and administrative | 45 | — | 66 | — | 111 | |||||||||||||||
Research and development | 18 | 2 | 9 | — | 29 | |||||||||||||||
Amortization of intangible assets | — | — | 4 | — | 4 | |||||||||||||||
Restructuring charges, net | — | — | 1 | — | 1 | |||||||||||||||
Merger-related costs | 57 | — | — | — | 57 | |||||||||||||||
TOTAL OPERATING EXPENSES | 120 | 2 | 80 | — | 202 | |||||||||||||||
OPERATING LOSS | (61 | ) | (6 | ) | (46 | ) | — | (113 | ) | |||||||||||
Interest expense | — | — | — | — | — | |||||||||||||||
Other income, net | (2 | ) | 2 | 1 | — | 1 | ||||||||||||||
LOSS BEFORE INCOME TAXES | (63 | ) | (4 | ) | (45 | ) | — | (112 | ) | |||||||||||
Benefit from income taxes | (19 | ) | — | (5 | ) | — | (24 | ) | ||||||||||||
Equity in net loss of consolidated subsidiaries | (44 | ) | — | — | 44 | — | ||||||||||||||
NET LOSS | (88 | ) | (4 | ) | (40 | ) | 44 | (88 | ) | |||||||||||
Less net income attributable to noncontrolling interests | — | — | — | — | — | |||||||||||||||
NET LOSS ATTRIBUTABLE TO AVAYA INC. | $ | (88 | ) | $ | (4 | ) | $ | (40 | ) | $ | 44 | $ | (88 | ) | ||||||
Supplemental Condensed Consolidating Schedule of Cash Flows
(Predecessor)
| Period from October 1, 2007 through October 26, 2007 | ||||||||||||||||||||
In millions | Avaya Inc. | Guarantor Subsidiaries | Non-Guarantor Subsidiaries | Eliminations | Consolidated | |||||||||||||||
OPERATING ACTIVITIES: | ||||||||||||||||||||
Net loss | $ | (88 | ) | $ | (4 | ) | $ | (40 | ) | $ | 44 | $ | (88 | ) | ||||||
Adjustments to reconcile net loss to net cash provided by operating activities | (2 | ) | — | 24 | — | 22 | ||||||||||||||
Changes in operating assets and liabilities | 199 | 1 | (1 | ) | — | 199 | ||||||||||||||
Investment in consolidated subsidiaries | 44 | — | — | (44 | ) | — | ||||||||||||||
NET CASH PROVIDED BY (USED FOR) OPERATING ACTIVITIES | 153 | (3 | ) | (17 | ) | — | 133 | |||||||||||||
INVESTING ACTIVITIES: | ||||||||||||||||||||
Capital expenditures | (5 | ) | — | (3 | ) | — | (8 | ) | ||||||||||||
Capitalized software development costs | (6 | ) | — | (1 | ) | — | (7 | ) | ||||||||||||
Other investing activities, net | (1 | ) | — | — | — | (1 | ) | |||||||||||||
NET CASH USED FOR INVESTING ACTIVITIES | (12 | ) | — | (4 | ) | — | (16 | ) | ||||||||||||
FINANCING ACTIVITIES: | ||||||||||||||||||||
Issuance of common stock | 11 | — | — | — | 11 | |||||||||||||||
Net (repayments) borrowings of intercompany debt | (10 | ) | 3 | 7 | — | — | ||||||||||||||
NET CASH PROVIDED BY FINANCING ACTIVITIES | 1 | 3 | 7 | — | 11 | |||||||||||||||
Effect of exchange rate changes on cash and cash equivalents | — | — | 7 | — | 7 | |||||||||||||||
NET INCREASE (DECREASE) IN CASH AND CASH EQUIVALENTS | 142 | — | (7 | ) | — | 135 | ||||||||||||||
Cash and cash equivalents at beginning of period | 971 | 4 | 295 | — | 1,270 | |||||||||||||||
Cash and cash equivalents at end of period | $ | 1,113 | $ | 4 | $ | 288 | $ | — | $ | 1,405 | ||||||||||
23. Subsequent Events
The financial statements of Avaya Holdings Corp. are substantially comprised of the financial statements of Avaya Inc., which issued its annual financial statements on December 7, 2010.12, 2012. Accordingly, the Company has evaluated transactions for consideration as recognized subsequent events in the annual financial statements through the date of December 7, 2010 and in the interim March 31, 2011 (unaudited) financial statements through May 12, 2011.2012. Additionally, the Company has evaluated transactions that occurred as of the issuance of these financial statements, June 8, 2011,May 31, 2013, for purposes of disclosure of unrecognized subsequent events.
Independent Auditors’ ReportShare-based Compensation
On February 25, 2013, Avaya’s Compensation Committee approved a stock option exchange program through which individuals holding market-based “multiple-of-money” and performance-based “EBITDA” stock options could exchange them on a three-for-one basis for RSUs. The Ownersreplacement RSUs will vest in full in December 2013. The tender offer was closed on April 30, 2013 and 10,204,689 options were tendered for exchange. In connection with the exchange offer, 3,401,654 replacement RSUs were granted which have an effective grant date of
Enterprise and Government Solutions, Businesses of Nortel Networks Corporation: May 6, 2013.
We have auditedGoodwill, Intangible and Long-lived Assets
During the accompanying combined balance sheetssecond quarter of Enterprisefiscal 2013, the Company tested the long-lived assets and Government Solutions, Businessesgoodwill of Nortel Networks Corporation (the Businesses)its IT Professional Services (“ITPS”) reporting unit, which provides specialized information technology services exclusively to U.S. government customers, for impairment. The reporting unit was impacted by reduced government spending in anticipation of sequestration and general budget cuts and experienced a decline in revenues as of September 30, 2009compared to previous periods and December 31, 2008,its forecasts for fiscal 2013. Additionally, there is much
uncertainty regarding how sequestration cuts will be implemented and the related combined statementsimpact they will have on contractors supporting the government. As a result of operations, changes in invested equitythese events, the Company determined that an interim impairment test of the reporting unit’s goodwill and comprehensive losslong-lived assets should be performed.
The Company tested the intangible assets and cash flowsother long-lived assets of the ITPS reporting unit for impairment during the ninesix months ended September 30, 2009March 31, 2013 and the year ended December 31, 2008. These combined financial statements are the responsibility of the Businesses management. Our responsibility is to express an opinionno impairment was identified. Based on these combined financial statements based on our audits.
We conducted our audits in accordance with auditing standards generally accepted in the United States of America. Those standards require that we plan and perform the audit to obtain reasonable assurance about whether the financial statements are free of material misstatement. An audit includes consideration of internal control over financial reporting as a basis for designing audit procedures that are appropriate in the circumstances, but not for the purpose of expressing an opinion on the effectiveness of the Businesses’ internal control over financial reporting. Accordingly, we express no such opinion. An audit also includes examining, on a test basis, evidence supporting the amounts and disclosures in the financial statements, assessing the accounting principles used and significant estimates made by management, as well as evaluating the overall financial statement presentation. We believe that our audits provide a reasonable basis for our opinion.
In our opinion, the combined financial statements referred to above present fairly, in all material respects, the financial position of the Businesses as of September 30, 2009 and December 31, 2008, and the results of theirthe goodwill impairment test, the Company determined that the book value of the reporting unit’s goodwill exceeded its implied fair value and the Company recognized an impairment to goodwill of $89 million. The impairment was primarily the result of budgetary constraints, sequestration and uncertainty regarding spending on the part of the U.S. government.
Financing Arrangements
Subsequent to September 30, 2012, Avaya Inc. completed a series of transactions which allowed it to refinance (1) its term B-1 loans outstanding under its senior secured credit facility originally due October 26, 2014, and (2) $642 million of its 9.75% senior unsecured cash-pay notes and $742 million of its senior unsecured PIK toggle notes each originally due November 1, 2015 (collectively, the “Old Notes”).
During the first quarter of fiscal 2013, Avaya Inc. completed three transactions to refinance $848 million of term loans under its senior secured credit facility, which were (1) an amendment and restatement of the senior secured credit facility and the senior secured multi-currency asset-based revolving credit facility on October 29, 2012 along with the extension of the maturity date of $135 million aggregate principal amount of term B-1 loans by converting such loans into a new tranche of senior secured term B-4 loans (the “term B-4 loans”), (2) an amendment and restatement of the senior secured credit facility on December 21, 2012 along with the extension of the maturity date of $713 million aggregate principal amount of term B-1 loans and $134 million aggregate principal amount of term B-4 loans, in each case, by converting such loans into a new tranche of senior secured term B-5 loans (the “term B-5 loans”) and (3) the issuance on December 21, 2012 of $290 million of 9% senior secured notes due April 2019, the net proceeds of which were used to repay $284 million of term B-5 loans.
On March 12, 2013, Avaya Inc. entered into an amendment of the senior secured credit facility, pursuant to which Avaya Inc. refinanced the remaining $584 million of term B-1 loans outstanding under its senior secured credit facility with cash proceeds from the issuance of $589 million aggregate principal amount of term B-5 loans due October 26, 2017 under the senior secured credit facility.
Additionally, during the second quarter of fiscal 2013, Avaya Inc. refinanced $1,384 million of senior unsecured notes, through (1) amendments to the senior secured credit facility and the senior secured multi-currency asset-based revolving credit facility completed on February 13, 2013 permitting the refinancing of the Old Notes with indebtedness secured by a lien on certain collateral on a junior-priority basis and (2) the exchange of $1,384 million of Old Notes for $1,384 million of 10.50% senior secured notes due 2021 on March 7, 2013.
Fiscal 2013 Restructuring Program
During fiscal 2013, the Company continued to identify opportunities to streamline operations and their cash flowsgenerate cost savings the most significant of which include a plan to eliminate 234 positions in EMEA and a voluntary program offered to certain management employees in the U.S. which resulted in the elimination of 195 positions. The Company also vacated its Maidenhead, United Kingdom and Highlands Ranch, Colorado facilities. Restructuring charges, net for the ninesix months ended September 30, 2009March 31, 2013 associated with these and the year ended December 31, 2008 in conformity with U.S. generally accepted accounting principles.other actions were $102 million.
Avaya Holdings Corp.
Consolidated Statements of Operations (Unaudited)
(In millions, except per share amounts)
| Six months ended March 31, | ||||||||
| 2013 | 2012 | |||||||
REVENUE | ||||||||
Products | $ | 1,160 | $ | 1,386 | ||||
Services | 1,198 | 1,258 | ||||||
|
|
|
| |||||
| 2,358 | 2,644 | |||||||
|
|
|
| |||||
COSTS | ||||||||
Products: | ||||||||
Costs (exclusive of amortization of intangibles) | 497 | 591 | ||||||
Amortization of technology intangible assets | 36 | 99 | ||||||
Services | 573 | 637 | ||||||
|
|
|
| |||||
| 1,106 | 1,327 | |||||||
|
|
|
| |||||
GROSS PROFIT | 1,252 | 1,317 | ||||||
|
|
|
| |||||
OPERATING EXPENSES | ||||||||
Selling, general and administrative | 765 | 847 | ||||||
Research and development | 231 | 228 | ||||||
Amortization of intangible assets | 114 | 112 | ||||||
Goodwill impairment | 89 | — | ||||||
Restructuring and impairment charges, net | 102 | 111 | ||||||
Acquisition-related costs | — | 3 | ||||||
|
|
|
| |||||
| 1,301 | 1,301 | |||||||
|
|
|
| |||||
OPERATING (LOSS) INCOME | (49 | ) | 16 | |||||
Interest expense | (224 | ) | (217 | ) | ||||
Loss on extinguishment of debt | (6 | ) | — | |||||
Other income (expense), net | 4 | (16 | ) | |||||
|
|
|
| |||||
LOSS BEFORE INCOME TAXES | (275 | ) | (217 | ) | ||||
Benefit from income taxes | 6 | 26 | ||||||
|
|
|
| |||||
NET LOSS | (269 | ) | (191 | ) | ||||
Less: Accretion and accrued dividends on Series A and Series B preferred stock | (21 | ) | (3 | ) | ||||
|
|
|
| |||||
NET LOSS ATTRIBUTABLE TO AVAYA HOLDINGS CORP. COMMON STOCKHOLDERS | $ | (290 | ) | $ | (194 | ) | ||
|
|
|
| |||||
Net loss per share attributable to common stockholders | $ | (0.59 | ) | $ | (0.40 | ) | ||
|
|
|
| |||||
Weighted average basic and diluted shares outstanding | 489.3 | 489.3 | ||||||
|
|
|
| |||||
The accompanying combined financial statements have been prepared assuming that the Businesses will continue as a going concern. As discussed in Note 2Notes to the combined financial statements, the Businesses’ owner, Nortel Networks Corporation, and certain of its Canadian subsidiaries filed for creditor protection pursuant to the provisions of the Companies’ Creditors Arrangement Act; certain of Nortel Networks Corporation’s United States subsidiaries filed voluntary petitions seeking to reorganize under Chapter 11 of the United States Bankruptcy Code; certain of Nortel Networks Corporation’s subsidiaries in Europe, the Middle East and Africa made consequential filings under the Insolvency Act 1986 in the United Kingdom; and Nortel Networks Corporation’s Israeli subsidiaries made consequential filings under the Israeli Companies Law 1999. These conditions raise substantial doubt about Nortel Networks Corporation’s and the Businesses’ ability to continue as a going concern. Management’s plans in regard to these matters are also described in Note 2 to the combined financial statements. The combined financial statements do not include any adjustments that might result from the outcome of this uncertainty.
As discussed in Note 4 to the combined financial statements, effective January 1, 2008, the Company changed its method of accounting for fair value measurements and the date at which it measures the funded status of its defined benefit pension plans and other postretirement plans.
/s/ KPMG LLP
Chartered Accountants, Licensed Public Accountants
Toronto, Canada
December 7, 2009
ENTERPRISE AND GOVERNMENT SOLUTIONS, BUSINESSES OF NORTEL NETWORKS CORPORATION
(Under Creditor Protection Proceedings as of January 14, 2009—Note 2)
CombinedConsolidated Financial Statements of Operations
(Millions of U.S. Dollars) | Nine months ended September 30, 2009 | Year Ended December 31, 2008 | ||||||
Revenues: | ||||||||
Products | $ | 1,010 | $ | 2,133 | ||||
Services | 436 | 654 | ||||||
Total revenues | 1,446 | 2,787 | ||||||
Cost of revenues: | ||||||||
Products | 679 | 1,215 | ||||||
Services | 293 | 417 | ||||||
Total cost of revenues | 972 | 1,632 | ||||||
Gross profit | 474 | 1,155 | ||||||
Operating expenses: | ||||||||
Selling, general and administrative expense (Note 6) | 670 | 1,187 | ||||||
Research and development expense | 298 | 481 | ||||||
Amortization of intangible assets | 20 | 26 | ||||||
Special charges (Note 8 and 9) | — | 114 | ||||||
Goodwill impairment (Note 7) | 49 | 808 | ||||||
Other operating expense (income)—net (Note 6) | 23 | (23 | ) | |||||
Total operating expenses | 1,060 | 2,593 | ||||||
Operating loss | (586 | ) | (1,438 | ) | ||||
Other income (expense)—net (Note 6) | (19 | ) | 19 | |||||
Interest income | — | 1 | ||||||
Interest expense | (2 | ) | (2 | ) | ||||
Loss from operations before reorganization items and income taxes | (607 | ) | (1,420 | ) | ||||
Reorganization items (Note 5) | (147 | ) | — | |||||
Income tax recovery (expense) (Note 10) | 1 | (6 | ) | |||||
Net loss from continuing operations | (753 | ) | (1,426 | ) | ||||
Net income (loss) from discontinued operations—net of tax (Note 16) | 15 | (3 | ) | |||||
Net loss | $ | (738 | ) | $ | (1,429 | ) | ||
The accompanying notes are an integral part of these combined financial statementsstatements.
Avaya Holdings Corp.
ENTERPRISE AND GOVERNMENT SOLUTIONS, BUSINESSES OF NORTEL NETWORKS CORPORATIONConsolidated Statements of Comprehensive (Loss) Income (Unaudited)
(Under Creditor Protection Proceedings as of January 14, 2009—Note 2)In millions)
Combined Balance Sheets
| Six months ended March 31, | ||||||||
| 2013 | 2012 | |||||||
Net loss | $ | (269 | ) | $ | (191 | ) | ||
Other comprehensive (loss) income: | ||||||||
Pension, postretirement and postemployment benefit-related items, net of tax of $18 for the six months ended March 31, 2013 and 2012, respectively | 28 | 28 | ||||||
Cumulative translation adjustment | (19 | ) | 15 | |||||
Change in interest rate swaps, net of tax of $3 and $4 for the six months ended March 31, 2013 and 2012, respectively | 5 | 6 | ||||||
Income tax benefit reclassified into earnings upon the expiration of certain interest rate swaps | (17 | ) | — | |||||
Unrealized loss on investments reclassified into earnings, net of tax of $2 for the six months ended March 31, 2012 | — | 3 | ||||||
|
|
|
| |||||
Other comprehensive (loss) income | (3 | ) | 52 | |||||
|
|
|
| |||||
Comprehensive loss | $ | (272 | ) | $ | (139 | ) | ||
|
|
|
| |||||
(Millions of U.S. Dollars) | September 30, 2009 | December 31, 2008 | ||||||
| ASSETS | ||||||||
Current assets | ||||||||
Cash and cash equivalents | $ | 38 | $ | 44 | ||||
Restricted cash and cash equivalents | 2 | — | ||||||
Accounts receivable—net | 305 | 426 | ||||||
Inventories—net | 226 | 284 | ||||||
Deferred income taxes—net | 7 | 6 | ||||||
Other current assets (Note 6) | 63 | 54 | ||||||
Current assets related to discontinued operations (Note 16) | — | 8 | ||||||
Total current assets | 641 | 822 | ||||||
Investments | — | 3 | ||||||
Plant and equipment—net | 68 | 97 | ||||||
Goodwill | 122 | 171 | ||||||
Intangible assets—net | 45 | 61 | ||||||
Other assets (Note 6) | 27 | 46 | ||||||
Total assets | $ | 903 | $ | 1,200 | ||||
| LIABILITIES AND INVESTED EQUITY | ||||||||
Current liabilities | ||||||||
Trade and other accounts payable | $ | 45 | $ | 136 | ||||
Payroll and benefit-related liabilities | 121 | 124 | ||||||
Contractual liabilities | 21 | 36 | ||||||
Restructuring liabilities | 11 | 23 | ||||||
Other accrued liabilities (Note 6) | 361 | 499 | ||||||
Long-term debt due within one year | 2 | 1 | ||||||
Current liabilities related to discontinued operations (Note 16) | — | 9 | ||||||
Total current liabilities | 561 | 828 | ||||||
Long-term debt | 26 | 27 | ||||||
Deferred income taxes—net | 7 | 11 | ||||||
Other liabilities (Note 6) | 50 | 116 | ||||||
Total long-term liabilities | 83 | 154 | ||||||
Liabilities subject to compromise (Note 20) | 198 | — | ||||||
Total liabilities | $ | 842 | $ | 982 | ||||
Commitments, guarantees and contingencies (Note 19) | ||||||||
Subsequent events (Notes 2 and 21) | ||||||||
| INVESTED EQUITY | ||||||||
Net parent investment | 70 | 218 | ||||||
Accumulated other comprehensive income (loss) | (9 | ) | — | |||||
Total invested equity | 61 | 218 | ||||||
Total liabilities and invested equity | $ | 903 | $ | 1,200 | ||||
The accompanying notesNotes to Consolidated Financial Statements are an integral part of these combined financial statementsstatements.
Avaya Holdings Corp.
ENTERPRISE AND GOVERNMENT SOLUTIONS, BUSINESSES OF NORTEL NETWORKS CORPORATIONConsolidated Balance Sheets
(Under Creditor Protection Proceedings as of January 14, 2009—Note 2)In millions, except share amounts)
Combined Statements of Changes in Invested Equity and Comprehensive Loss
Nine months ended September 30, 2009 and the year ended December 31, 2008
(Millions of U.S. Dollars) | Net Parent Investment | Accumulated Other Comprehensive Income (Loss) | Total Invested Equity | Comprehensive Loss | ||||||||||||
Balance at December 31, 2007 | $ | 929 | $ | (8 | ) | $ | 921 | |||||||||
Net loss | $ | (1,429 | ) | $ | — | $ | (1,429 | ) | $ | (1,429 | ) | |||||
Foreign currency translation adjustment | 8 | 8 | 8 | |||||||||||||
Comprehensive loss: | $ | (1,421 | ) | |||||||||||||
Contributions attributed to: | ||||||||||||||||
Corporate and shared employee overhead costs funded by Nortel | 467 | — | 467 | |||||||||||||
Tax transfers to Nortel | 8 | — | 8 | |||||||||||||
Share-based compensation costs funded by Nortel | 35 | — | 35 | |||||||||||||
Non-cash restructuring charges | 53 | — | 53 | |||||||||||||
Pension costs funded by Nortel | 19 | — | 19 | |||||||||||||
Other transfers—net | 136 | — | 136 | |||||||||||||
Balance at December 31, 2008 | $ | 218 | $ | — | $ | 218 | ||||||||||
Net loss | $ | (738 | ) | $ | — | $ | (738 | ) | $ | (738 | ) | |||||
Foreign currency translation adjustment | (9 | ) | (9 | ) | (9 | ) | ||||||||||
Comprehensive loss: | $ | (747 | ) | |||||||||||||
Contributions attributed to: | ||||||||||||||||
Corporate and shared employee overhead costs funded by Nortel | 333 | — | 333 | |||||||||||||
Tax transfers to Nortel | 4 | — | 4 | |||||||||||||
Share-based compensation costs funded by Nortel | 30 | — | 30 | |||||||||||||
Non-cash restructuring charges | 83 | — | 83 | |||||||||||||
Pension costs funded by Nortel | 45 | — | 45 | |||||||||||||
Reorganization costs funded by Nortel | 40 | — | 40 | |||||||||||||
Other transfers—net | 55 | — | 55 | |||||||||||||
Balance at September 30, 2009 | $ | 70 | $ | (9 | ) | $ | 61 | |||||||||
| March 31, 2013 | September 30, 2012 | |||||||
| (unaudited) | ||||||||
ASSETS | ||||||||
Current assets: | ||||||||
Cash and cash equivalents | $ | 303 | $ | 338 | ||||
Accounts receivable, net | 681 | 782 | ||||||
Inventory | 255 | 255 | ||||||
Deferred income taxes, net | 21 | 18 | ||||||
Other current assets | 277 | 249 | ||||||
|
|
|
| |||||
TOTAL CURRENT ASSETS | 1,537 | 1,642 | ||||||
|
|
|
| |||||
Property, plant and equipment, net | 353 | 364 | ||||||
Deferred income taxes, net | 44 | 43 | ||||||
Intangible assets, net | 1,625 | 1,775 | ||||||
Goodwill | 4,093 | 4,188 | ||||||
Other assets | 178 | 172 | ||||||
|
|
|
| |||||
TOTAL ASSETS | $ | 7,830 | $ | 8,184 | ||||
|
|
|
| |||||
LIABILITIES | ||||||||
Current liabilities: | ||||||||
Debt maturing within one year | $ | 35 | $ | 37 | ||||
Accounts payable | 409 | 438 | ||||||
Payroll and benefit obligations | 247 | 262 | ||||||
Deferred revenue | 689 | 616 | ||||||
Business restructuring reserve, current portion | 103 | 84 | ||||||
Other current liabilities | 261 | 328 | ||||||
|
|
|
| |||||
TOTAL CURRENT LIABILITIES | 1,744 | 1,765 | ||||||
|
|
|
| |||||
Long-term debt | 6,068 | 6,084 | ||||||
Pension obligations | 1,708 | 1,763 | ||||||
Other postretirement obligations | 343 | 360 | ||||||
Deferred income taxes, net | 209 | 204 | ||||||
Business restructuring reserve, non-current portion | 56 | 51 | ||||||
Other liabilities | 443 | 429 | ||||||
|
|
|
| |||||
TOTAL NON-CURRENT LIABILITIES | 8,827 | 8,891 | ||||||
|
|
|
| |||||
Commitments and contingencies | ||||||||
Preferred stock, par value $.001 per share, authorized 250,000 and 250,000 at March 31, 2013 and September 30, 2012, respectively | ||||||||
Convertible Series B, 48,921 and 48,921 shares issued and outstanding at March 31, 2013 and September 30, 2012, respectively | 245 | 227 | ||||||
Series A, 125,000 and 125,000 shares issued and outstanding at March 31, 2013 and September 30, 2012, respectively | 147 | 144 | ||||||
STOCKHOLDERS’ DEFICIENCY | ||||||||
Common stock, par value $.001 per share; 750,000,000 and 750,000,000 shares authorized; 488,662,389 and 487,630,509 shares issued and outstanding at March 31, 2013 and September 30, 2012, respectively | — | — | ||||||
Additional paid-in capital | 2,510 | 2,528 | ||||||
Accumulated deficit | (4,514 | ) | (4,245 | ) | ||||
Accumulated other comprehensive loss | (1,129 | ) | (1,126 | ) | ||||
|
|
|
| |||||
TOTAL STOCKHOLDERS’ DEFICIENCY | (3,133 | ) | (2,843 | ) | ||||
|
|
|
| |||||
TOTAL LIABILITIES AND STOCKHOLDERS’ DEFICIENCY | $ | 7,830 | $ | 8,184 | ||||
|
|
|
| |||||
The accompanying notesNotes to Consolidated Financial Statements are an integral part of these combined financial statementsstatements.
ENTERPRISE AND GOVERNMENT SOLUTIONS, BUSINESSES OF NORTEL NETWORKS CORPORATIONAvaya Holdings Corp.
(Under Creditor Protection Proceedings as of January 14, 2009—Note 2)
CombinedConsolidated Statements of Cash Flows (Unaudited)
(In millions)
(Millions of U.S. Dollars) | Nine months ended September 30, 2009 | Year ended December 31, 2008 | ||||||
Cash flows from (used in) operating activities | ||||||||
Net loss | ||||||||
Adjustments to reconcile net loss to net cash used in operating activities: | $ | (738 | ) | $ | (1,429 | ) | ||
Amortization and depreciation | 39 | 59 | ||||||
Goodwill impairment | 49 | 808 | ||||||
Deferred income taxes | (5 | ) | (2 | ) | ||||
Corporate and shared employee overhead costs funded by Nortel | 333 | 467 | ||||||
Tax transfers to Nortel | 4 | 8 | ||||||
Share-based compensation costs funded by Nortel | 30 | 35 | ||||||
Non-cash restructuring charges | 83 | 53 | ||||||
Pension costs funded by Nortel | 45 | 19 | ||||||
Reorganization costs funded by Nortel | 40 | — | ||||||
Non-cash portion of special charges and related asset write downs | 3 | — | ||||||
Loss on sales and writedown of investments, businesses and assets, net | 2 | — | ||||||
Other non-cash—net | (4 | ) | 12 | |||||
Change in operating assets and liabilities (Note 6) | 63 | (137 | ) | |||||
Net cash used in operating activities | (56 | ) | (107 | ) | ||||
Cash flows from (used in) investing activities | ||||||||
Expenditures for plant and equipment | (3 | ) | (33 | ) | ||||
Change in restricted cash and cash equivalents | (2 | ) | — | |||||
Acquisitions of investments and businesses—net of cash acquired | — | (38 | ) | |||||
Proceeds from the sales of investments and businesses and assets—net | 1 | 10 | ||||||
Net cash from (used in) investing activities | (4 | ) | (61 | ) | ||||
Cash flows from (used in) financing activities | ||||||||
Other transfers—net | 55 | 136 | ||||||
Repayments of capital lease obligations | (1 | ) | (1 | ) | ||||
Net cash from financing activities | 54 | 135 | ||||||
Net increase (decrease) in cash and cash equivalents | (6 | ) | (33 | ) | ||||
Cash and cash equivalents at beginning of period | 44 | 77 | ||||||
Cash and cash equivalents at end of period | $ | 38 | $ | 44 | ||||
| Six months ended March 31, | ||||||||
| 2013 | 2012 | |||||||
OPERATING ACTIVITIES: | ||||||||
Net loss | $ | (269 | ) | $ | (191 | ) | ||
Adjustments to reconcile net loss to net cash provided (used for) by operating activities: | ||||||||
Depreciation and amortization | 221 | 286 | ||||||
Share-based compensation | 3 | 5 | ||||||
Amortization of debt issuance costs | 10 | 11 | ||||||
Accretion of debt discount | 2 | 1 | ||||||
Non-cash charge for debt issuance costs upon redemption of incremental B-2 term loans | 5 | — | ||||||
Third-party fees expensed in connection with the debt modification | 18 | — | ||||||
Premium on issuance of senior secured term B-5 loans | 3 | — | ||||||
Change in fair value of Preferred Series B embedded derivative | (8 | ) | — | |||||
Provision for uncollectible receivables | 1 | 2 | ||||||
Deferred income taxes, net | (17 | ) | 5 | |||||
Loss on sale of investments and long-lived assets, net | — | 3 | ||||||
Goodwill impairment | 89 | — | ||||||
Unrealized loss (gain) on foreign currency exchange | (27 | ) | 11 | |||||
Changes in operating assets and liabilities: | ||||||||
Accounts receivable | 103 | 25 | ||||||
Inventory | — | �� | 8 | |||||
Accounts payable | (28 | ) | 5 | |||||
Payroll and benefit obligations | (35 | ) | (69 | ) | ||||
Business restructuring reserve | 32 | 4 | ||||||
Deferred revenue | 83 | (8 | ) | |||||
Other assets and liabilities | (98 | ) | (67 | ) | ||||
|
|
|
| |||||
NET CASH PROVIDED BY OPERATING ACTIVITIES | 88 | 31 | ||||||
|
|
|
| |||||
INVESTING ACTIVITIES: | ||||||||
Capital expenditures | (47 | ) | (38 | ) | ||||
Capitalized software development costs | (10 | ) | (19 | ) | ||||
Acquisition of businesses, net of cash acquired | (11 | ) | (26 | ) | ||||
Proceeds from sale of long-lived assets | 9 | 2 | ||||||
Proceeds from sale of investments | 1 | 6 | ||||||
Other investing activities, net | (1 | ) | — | |||||
|
|
|
| |||||
NET CASH USED FOR INVESTING ACTIVITIES | (59 | ) | (75 | ) | ||||
|
|
|
| |||||
FINANCING ACTIVITIES: | ||||||||
Proceeds from 9% senior secured notes | 290 | — | ||||||
Repayment of term B-5 loans | (284 | ) | — | |||||
Proceeds from term B-5 loans | 589 | — | ||||||
Repayment of term B-1 loans | (584 | ) | — | |||||
Debt issuance and third-party debt modification costs | (49 | ) | — | |||||
Repayment of long-term debt | (19 | ) | (19 | ) | ||||
Other financing activities, net | (2 | ) | (3 | ) | ||||
|
|
|
| |||||
NET CASH USED FOR FINANCING ACTIVITIES | (59 | ) | (22 | ) | ||||
|
|
|
| |||||
Effect of exchange rate changes on cash and cash equivalents | (5 | ) | 7 | |||||
|
|
|
| |||||
NET DECREASE IN CASH AND CASH EQUIVALENTS | (35 | ) | (59 | ) | ||||
Cash and cash equivalents at beginning of period | 338 | 415 | ||||||
|
|
|
| |||||
Cash and cash equivalents at end of period | $ | 303 | $ | 356 | ||||
|
|
|
| |||||
The accompanying notesNotes to Consolidated Financial Statements are an integral part of these combined financial statementsstatements.
ENTERPRISE AND GOVERNMENT SOLUTIONS, BUSINESSES OF NORTEL NETWORKS CORPORATIONAvaya Holdings Corp.
(Under Creditor Protection Proceedings as of January 14, 2009—Note 2)
Notes to CombinedConsolidated Financial Statements
(Millions of U.S. Dollars, unless otherwise stated) (Unaudited)
1. NatureBackground, Merger, Acquisition of operationsNES, Acquisition of Radvision, and basisBasis of presentationPresentation
Background
Avaya Holdings Corp. (formerly Sierra Holdings Corp.) together with its consolidated subsidiaries (collectively, the “Company” or “Avaya”) is a leading global provider of real-time business collaboration and communications solutions. The Company’s solutions are designed to enable business users to work together more effectively internally and with their customers and suppliers to accelerate decision-making and business outcomes.
Avaya conducts its business operations in three segments. Two of those segments, Global Communications Solutions and Avaya Networking, make up Avaya’s Enterprise Collaboration Solutions product portfolio. The third segment contains Avaya’s services portfolio and is called Avaya Global Services.
The Company’s solutions and services are aimed at large enterprises, small- and mid-sized businesses and government organizations. Avaya’s solutions are in three key business collaboration and communications categories:
Real-Time Collaboration, Video and Unified Communications Software, Infrastructure and Endpoints;
Customer Experience Interaction Management, including Contact Center applications; and
Networking.
These three categories are supported by Avaya’s portfolio of services including product support, integration, and professional manged services. Theses services enable customers to optimize and manage their communications networks worldwide and achieve enhanced business results.
Avaya sells solutions directly through its worldwide sales force and through its global network of channel partners. As of March 31, 2013, the Company had approximately 10,800 channel partners, including distributors, service providers, dealers, value-added resellers, system integrators and business partners that provide sales and service support.
Merger
Avaya Holdings Corp. is a holding company formed by affiliates of two private equity firms, Silver Lake Partners (“Silver Lake”) and TPG (“TPG”) (collectively, the “Sponsors”) on June 1, 2007, solely for the purpose of entering into an Agreement and Plan of Merger (the “Merger Agreement”) with Avaya Inc. Prior to the Merger Agreement, Avaya Inc. was a registered company with the U.S. Securities and Exchange Commission (“SEC”) and had common stock traded on the New York Stock Exchange. On June 4, 2007, the Company and its wholly owned subsidiary, Sierra Merger Corp., a Delaware corporation, (“Merger Sub”), entered into a Merger Agreement with Avaya Inc. pursuant to which Merger Sub would be merged with and into Avaya Inc., with Avaya Inc. continuing as the surviving corporation and a wholly owned subsidiary of Avaya Holdings Corp. (the “Merger”). The Merger Agreement provided for a purchase price of $8.4 billion of Avaya Inc.’s common stock and was completed on October 26, 2007 pursuant to the terms of the Merger Agreement.
In connection with the Merger, Avaya Inc. entered into financing arrangements consisting of (i) a senior secured multi-currency asset-based revolving credit facility that provides financing of up to $335 million, subject to availability under a borrowing base, (ii) a senior secured credit facility including (a) a senior secured term loan in the aggregate principal amount of $3.8 billion and (b) a senior secured multi-currency revolver in an aggregate commitment amount of up to $200 million and (iii) a senior unsecured credit facility consisting of (a) a $700 million senior unsecured cash pay loan and (b) a $750 million senior unsecured PIK toggle loan. On October 24, 2008, the senior unsecured cash-pay loan was converted into senior unsecured cash-pay notes and the senior unsecured PIK toggle loan was converted into senior unsecured PIK toggle notes. See Note 7, “Financing Arrangements” for further details.
Acquisition of the Enterprise Solutions Business of Nortel Networks Corporation
On December 18, 2009, Avaya acquired certain assets and assumed certain liabilities of the enterprise solutions business (“NES”) of Nortel Networks Corporation (“Nortel” or “NNC”), including all the shares of Nortel Government Solutions Incorporated, for $943 million in cash consideration. The Company and Nortel were required to determine the final purchase price post-closing based upon the various purchase price adjustments included in the acquisition agreements. During the first quarter of fiscal 2011, the Company and Nortel agreed on a final purchase price of $933 million. The terms of the acquisition did not include any significant contingent consideration arrangements.
Acquisition of RADVISION Ltd.
On June 5, 2012, Avaya acquired RADVISION Ltd. (“Radvision”) for $230 million in cash. Radvision is a global supplierprovider of end-to-end networking productsvideoconferencing and solutions serving both service providers and enterprise customers. Nortel’stelepresence technologies span access and core networks and support multimedia and business-critical applications. Nortel’s networking solutions consist of hardware, software and services. Nortel designs, develops, engineers, markets, sells, licenses, installs, services and supports these networking solutions worldwide. Nortel Networks Limitedover internet protocol (“NNL”) is Nortel’s principal direct operating subsidiary and its results are consolidated into Nortel’s results.
The Enterprise Solutions business of Nortel (“Enterprise Solutions”IP”) and Nortel Government Solutions Inc. (“NGS”) (collectively “Enterprise and Government Solutions” orwireless networks. These unaudited Consolidated Financial Statements include the “Businesses”) are businessesoperating results of Nortel that operate in Nortel, or certain of its direct and indirect legal subsidiaries throughout the world. The Businesses provide communications services that address the headquarters, branch and home office needs of large and small businesses globally across a variety of industries, including healthcare and financial service providers, retailers, manufacturers, utilities, educational institutions and government agencies. The Businesses provide reliable, secure and scalable products spanning Unified Communications, Ethernet routing and multiservice switching, IP and digital telephony (including phones), wireless LANs, security, IP and SIP contact centers, self-service solutions, messaging, conferencing, SIP-based multimedia solutions and professional services to the U.S. Government. Nortel entered into creditor protection proceedings on January 14, 2009 and restructuring activities had an impact on the operations of the Businesses as discussed in Note 2.Radvision since June 5, 2012.
Basis of presentationPresentation
Avaya Holdings Corp. has no material assets or standalone operations other than its ownership in Avaya Inc. and its subsidiaries. The Consolidated Financial Accounting Standards Board Accounting Standards Codification (“ASC”) 852, “Reorganizations,” which is applicable to companies that have filed petitions under applicable bankruptcy code provisionsStatements as of and as a resultfor the six months ended March 31, 2013 and 2012 reflect the operating results of the Creditor Protection Proceedings (as defined in Note 2) is applicable to Nortel, generally does not change the manner in which financial statements are prepared. However, it does require that Nortel’s financial statements for periods subsequent to the filing of an applicable bankruptcy petition distinguish transactionsAvaya Holdings Corp. and events that are directly associated with a reorganization from the ongoing operations of the business. Although, as described below, the Businesses do not constitute a legal entity that has filed under bankruptcy laws, certain of the Enterprise Solutions assets, liabilities, revenues and expenses are included in legal entities that are subject to the Creditor Protection Proceedings. NGS has not filed and is not part of the Creditor Protection Proceedings. The Businesses’ revenues, expenses, realized gains and losses, and provisions for losses that can be directly associated with the Creditor Protection Proceedings must be reported separately as reorganization items in the statements of operations. The balance sheets must distinguish pre-petition liabilities subject to compromise from both those pre-petition liabilities that are not subject to compromise and from post-petition liabilities. Liabilities that may be affected by a plan of reorganization must be reported at the amounts expected to be allowed, even if they may be settled for lesser amounts. In addition, reorganization items must be disclosed separately in the statements of cash flows. The Businesses adopted the provisions of ASC 852 effective on January 14, 2009 and have segregated those items outlined above for all reporting periods subsequent to such date, consistent with Nortel’s presentation. ASC 852 requires that the financial statements of a legal entity that has filed for bankruptcy protection include Debtor financial statements as supplementary disclosure. These combined financial statements do not include such debtor financial statements as the Businesses do not constitute a legal entity that has filed under bankruptcy laws.its consolidated subsidiaries.
The accompanying combined financial statementsunaudited interim Consolidated Financial Statements as of March 31, 2013 and for the six months ended March 31, 2013 and 2012 have been prepared in accordance with accounting principles generally accepted in the United States of America (“GAAP”) and the rules and regulations of the U.S. Securities and Exchange Commission (“U.S. GAAP”SEC”) for interim financial statements, and should be read in conjunction with the Consolidated Financial Statements and other financial information for the fiscal year ended September 30, 2012. The Consolidated Balance Sheet as of September 30, 2012 was derived from the consolidatedCompany’s audited financial statementsstatements. The significant accounting policies used in preparing these unaudited Consolidated Financial Statements are the same as those described in Note 2 to those audited Consolidated Financial Statements except for recently adopted accounting guidance as discussed in Note 2 “Recent Accounting Pronouncements” of these unaudited interim Consolidated Financial Statements. In management’s opinion, these unaudited Consolidated Financial Statements reflect all adjustments, consisting of only normal and
accounting records recurring adjustments, necessary for a fair statement of Nortel using the historicalfinancial condition, results of operations and historical cost basis ofcash flows for the assets and liabilities of Nortel that comprise the Businesses. These combined financial statementsperiods indicated.
Certain prior period amounts have been prepared on a combined basis asreclassified to conform to the Businesses represent a portion of Nortel’s business and do not constitute a separate legal entity.current period’s presentation. The historicalconsolidated results of operations financial position, and cash flows of the Businesses may not be indicative of what they would actually have been had the Businesses been a separate stand-alone entity, nor are they indicative of what the Businesses’ results of operations, financial position and cash flows may be in the future. The combined financial statements have been prepared solely for purposes of Nortel’s proposed sale of the Businesses to demonstrate the historical results of operations, financial position, and cash flows of the Businesses for the indicatedinterim periods under Nortel’s management and, accordingly, do not reflect the presentation and classification of the Businesses’ operations in the same manner as Nortel.
The accompanying combined financial statements only include assets and liabilities that are specifically identifiable with the Businesses. Costs directly related to the Businesses have been entirely attributed to the Businesses in the accompanying combined financial statements. The Businesses also receive services and support functions from Nortel. The Businesses’ operations are dependent upon Nortel’s ability to perform these services and support functions. The costs associated with these services and support functions have been allocated to the Businesses using methodologies primarily based on proportionate revenues or proportionate headcount of the Businesses compared to Nortel, which is considered to be most meaningful in the circumstances. These allocated costs are primarily related to corporate administrative expenses and reorganization costs, employee related costs including pensions and other benefits, for corporate and shared employees, and rental and usage fees for shared assets for the following functional groups: information technology, legal services, accounting and finance services, human resources, marketing and product support, product development, customer support, treasury, facility and other corporate and infrastructural services. These allocated costs are recorded primarily in cost of revenues, research and development (“R&D”), and selling, general and administrative (“SG&A”) expenses in the combined statements of operations. Income taxes have been accounted for in these combined financial statements as described in Notes 3(f) and 10.
For each of Nortel’s businesses, except for NGS which historically was managed as a separate business, Nortel used a centralized approach to cash management and financing of its operations. Central treasury activities include the investment of surplus cash, the issuance, repayment and repurchase of short-term and long-term debt and interest rate management. The financial systems of the Businesses were not designed to track certain balances and transactions at a business unit level. Accordingly, none of the cash or cash equivalents, debt or capital leases, including interest thereon, and hedging positions through which derivatives and other financial contracts are used at the Nortel corporate level have been reflected in these combined financial statements with the exception of cash, investment and debt balances that are specifically attributable to NGS. All Nortel funding to the Businesses since inception has been accounted for as a capital contribution from Nortel and all cash remittances from the Businesses to Nortel have been accounted for as distributions to Nortel, including allocation of expenses and settlement of transactions with Nortel. In addition, the net parent investment represents Nortel’s interest in the recorded net assets of the Businesses and represents the cumulative net investment by Nortel in the Businesses through the dates presented and includes cumulative operating results, including other comprehensive loss.
Management believes the assumptions and allocations underlying the combined financial statements are reasonable and appropriate under the circumstances. The expenses and cost allocations have been determined on a basis considered by Nortel and the Businesses to be a reasonable reflection of the utilization of services provided to or the benefit received by the Businesses during the periods presented. However, these assumptions and allocationsreported are not necessarily indicative of the costs the Businesses would have incurred if it had operated on a standalone basis or as an entity independent of Nortel.
Going concern issues
The commencement of the Creditor Protection Proceedings raises substantial doubt asresults to whether Nortel, and therefore the Businesses, will be able to continue as a going concern. While the Debtors (as defined in Note 2) have filed for and been granted creditor protection, the combined financial statements continue to be
prepared using the going concern basis, which assumes that the Businesses will be able to realize their respective assets and discharge their respective liabilities in the normal course of businessexperienced for the foreseeable future. During the Creditor Protection Proceedings, and until the completion of any proposed divestitures or a decision to cease operations in certain countries is made, the Businesses continue to operate under the jurisdictions and orders of the applicable courts and in accordance with applicable legislation. The Businesses have continued to operate by renewing and seeking to grow business with existing customers, competing for new customers, continuing significant R&D investments, and ensuring the ongoing supply of goods and services through the supply chain in an effort to maintain or improve customer service and loyalty levels. The Businesses have also continued their focus on cost containment and cost reduction initiatives during this time. However, it is not possible to predict the outcome of the Creditor Protection Proceedings and, as such, the realization of assets and discharge of liabilities are each subject to significant uncertainty. If the going concern basis is not appropriate, adjustments will be necessary to the carrying amounts and/or classification of the Businesses’ assets and liabilities. Further, a court approved plan in connection with the Creditor Protection Proceedings could materially change the carrying amounts and classifications reported in the combined financial statements.
The combined financial statements do not purport to reflect or provide for the consequences of the Creditor Protection Proceedings. In particular, such combined financial statements do not purport to show: (a) as to assets, their realizable value on a liquidation basis or their availability to satisfy liabilities; (b) as to pre-petition liabilities, all amounts that may be allowed for claims or contingencies, or the status and priority thereof, or the amounts at which they may ultimately be settled; (c) as to shareholders’ accounts, the effect of any changes that may be made in Nortel’s capitalization; or (d) as to operations, the effect of any changes that may be made in the Businesses.entire fiscal year.
2. Creditor protection proceedings
On January 14, 2009, after extensive consideration of all other alternatives, with the unanimous decision of the Board of Directors after thorough consultation with advisors, Nortel initiated creditor protection proceedings under the respective restructuring regimes of Canada, the U.S. and the United Kingdom (U.K.). Nortel’s affiliates based in Asia, including LG-Nortel Co. Ltd. (“LGN”), in the CALA region and the NGS business are not currently included in these proceedings. At this point in the Creditor Protection Proceedings, Nortel is focused on maximizing value for its stakeholders. On June 19, 2009 Nortel announced that it was advancing in discussions with external parties to sell its businesses.
On June 19, 2009, Nortel also announced a stalking horse asset sale agreement with Nokia Siemens Networks B.V. for the planned sale of substantially all of its Code Division Multiple Access (“CDMA”) business and Long Term Evolution (“LTE”) Access assets for a purchase price of $650, subject to purchase price adjustments under certain circumstances. On July 24, 2009, in accordance with court approved procedures, Nortel concluded a successful auction for these assets and executed a formal asset sale agreement for the sale of these assets with Telefonaktiebolaget LM Ericsson (“Ericsson”), who emerged as the successful agreeing to pay $1,130, subject to price adjustments under certain circumstances. At a joint hearing on July 28, 2009, Nortel obtained approval from the United States Bankruptcy Court for the District of Delaware (“U.S. Court”) and the Ontario Superior Court of Justice (“Canadian Court”) for the sale to Ericsson. On November 13, 2009, Nortel announced that following satisfaction of all closing conditions, the sale was concluded.
On July 20, 2009 Nortel announced a stalking horse and other sale agreements with Avaya Inc. (“Avaya”) for the planned sale of substantially all of the assets of the Enterprise Solutions business globally, as well as the shares of NGS and DiamondWare, Ltd for a purchase price of $475, subject to purchase price adjustments under certain circumstances. On September 14, 2009, in accordance with court approved procedures, Nortel concluded a successful auction for the sale of these assets to Avaya, who emerged as the successful bidder agreeing to pay $900 in cash to Nortel, with an additional pool of $15 reserved for an employee retention program, subject to purchase price adjustments under certain circumstances. At a joint hearing on September 16, 2009, Nortel obtained U.S. Court and Canadian Court approval of the sale to Avaya. The sale is also subject to court approvals
in France and Israel, information and consultation with employee representatives and/or employees in certain EMEA jurisdictions, as well as regulatory approvals and other customary closing conditions. See “Enterprise Solutions Business Divestiture” in this Note 2 for further details.
On September 21, 2009 Nortel announced it plans to sell, by “open auction”, the assets of its Wireless Networks business associated with the development of Next Generation Packet Core network components. On October 25, 2009, in accordance with court approved procedures, certain of Nortel’s subsidiaries entered into an agreement with Hitachi, Ltd. (“Hitachi”) for the sale of these assets for a purchase price of $10 subject to purchase price adjustments under certain circumstances. On October 28, 2009, Nortel obtained U.S. Court and Canadian Court approval of the sale to Hitachi. The sale is also subject to regulatory approvals and other customary closing conditions.
On September 30, 2009 Nortel announced that it planned to sell by “open auction” substantially all of its Global System for Mobile communications (“GSM”)/ GSM for Railways (“GSM-R”) business. On November 24, 2009, in accordance with court approved procedures, Nortel concluded a successful auction for the sale of theses assets to Ericsson and Kapsch CarrierCom AG (“Kapsch”) who emerged as the winning joint bidders with a purchase price of $103 in cash, subject to purchase price adjustments under certain circumstances. At a joint hearing on December 2, 2009, Nortel obtained U.S. Court and Canadian Court approval of the sale to Ericsson and Kapsch. The sale is also subject to court approval in France, information and consultation with employee representatives and/or employees in certain EMEA jurisdictions, as well as regulatory approvals and other customary closing conditions.
On October 7, 2009, Nortel announced a “stalking horse” and other sale agreements with Ciena Corp. (“Ciena”) for the planned sale of substantially all of the assets of its Optical Networking and Carrier Ethernet businesses globally for a purchase price of $390 in cash and 10 million shares of Ciena common stock, subject to purchase price adjustments under certain circumstances. On November 22, 2009, in accordance with court approved procedures Nortel concluded a successful auction for the sale of these assets to Ciena, who emerged as the successful bidder agreeing to pay $530 in cash, plus $239 principal amount of convertible notes due June 2017, subject to purchase price adjustments under certain circumstances. At a joint hearing on December 2, 2009, Nortel obtained U.S. Court and Canadian Court approval of the sale to Ciena. The sale is also subject to court approvals in the France and Israel, information and consultation with employee representatives and/or employees in certain EMEA jurisdictions, as well as regulatory approvals and other customary closing conditions.
Nortel continues to advance in its discussions with external parties to sell its other businesses. To provide maximum flexibility Nortel has also taken appropriate steps to complete the move to organizational standalone businesses. Nortel will assess other restructuring alternatives for these businesses in the event it is unable to maximize value through sales.
On August 10, 2009, Nortel announced that it was at a natural transition point resulting in a number of leadership changes and a new organizational structure designed to work towards the completion of the sales of its businesses and other restructuring activities. Effective August 10, 2009, President and Chief Executive Officer Mike Zafirovski stepped down. Also effective August 10, 2009, the Boards of Directors of Nortel and NNL were reduced from nine to three members: John A. MacNaughton, Jalynn H. Bennett and David I. Richardson, with Mr. Richardson serving as Chair. These individuals also serve as members of Nortel’s and NNL’s audit committees.
In connection with these changes Nortel obtained Canadian Court approval for the Canadian Monitor to take on an enhanced role with respect to the oversight of its business, sales processes, claims processes and other restructuring activities under the CCAA Proceedings (as defined below). Further, Nortel is in the process of confirming the appointment of a principal officer for the U.S. Debtors who will work in conjunction with the U.S. Creditors’ Committee (as defined below), Bondholder Group (as defined below), and the Canadian Monitor, which appointment will be subject to the approval of the U.S. Court.
Nortel has also established a streamlined structure that is enabling it to effectively continue to serve its customers, and also facilitate the sales of its businesses and integration processes with acquiring companies as well as continue with its restructuring activities. Nortel’s business units currently report to the Chief Restructuring Officer, Pavi Binning. The mergers and acquisitions teams continue their work under the Chief Strategy Officer, George Riedel. Nortel Business Services continues to be led by Joe Flanagan and continues to serve the transitional operations needs of Nortel’s businesses as they are sold to ensure customer and network service levels are maintained throughout the sale and integration processes. A core Corporate Group has been established that is primarily responsible for the management of ongoing restructuring activities during the sales process as well as post business dispositions. This group is lead by John Doolittle, Senior Vice President Finance and Corporate Services (formerly Nortel’s Treasurer). These leaders report to the Nortel and NNL Boards of Directors and the Canadian Monitor (as defined below) and will also report to the proposed U.S. principal officer.
CCAA Proceedings
On January 14, 2009 (“Petition Date”), Nortel, NNL and certain other Canadian subsidiaries (“Canadian Debtors”) obtained an initial order from the Canadian Court for creditor protection for 30 days, pursuant to the provisions of the Companies’ Creditors Arrangement Act (“CCAA”), which has since been extended to December 18, 2009 and is subject to further extension by the Canadian Court (“CCAA Proceedings”). There is no guarantee that the Canadian Debtors will be able to obtain court orders or approvals with respect to motions the Canadian Debtors may file from time to time to extend further the applicable stays of actions and proceedings against them. Pursuant to the initial order, the Canadian Debtors received approval to continue to undertake various actions in the normal course in order to maintain stable and continuing operations during the CCAA Proceedings.
Under the terms of the initial order, Ernst & Young Inc. was named as the court-appointed monitor under the CCAA Proceedings (“Canadian Monitor”). The Canadian Monitor has reported and will continue to report to the Canadian Court from time to time on the Canadian Debtors’ financial and operational position and any other matters that may be relevant to the CCAA Proceedings. In addition, the Canadian Monitor may advise and, to the extent required, assist the Canadian Debtors on matters relating to the Creditor Protection Proceedings. On August 14, 2009, the Canadian Court approved an order that permits the Canadian Monitor to take on an enhanced role with respect to the oversight of the business, sales processes, claims processes and other restructuring activities under the CCAA Proceedings.
As a consequence of the CCAA Proceedings, generally, all actions to enforce or otherwise effect payment or repayment of liabilities of any Canadian Debtor preceding the Petition Date and substantially all pending claims and litigation against the Canadian Debtors and their officers and directors have been stayed until December 18, 2009, or such further date as may be ordered by the Canadian Court. In addition, the CCAA Proceedings have been recognized by the U.S. Court as “foreign proceedings” pursuant to the provisions of Chapter 15 of the U.S. Bankruptcy Code, giving effect in the U.S. to the stay granted by the Canadian Court. A cross-border court-to-court protocol (as amended) has also been approved by the U.S. Court and the Canadian Court. This protocol provides the U.S. Court and the Canadian Court with a framework for the coordination of the administration of the Chapter 11 Proceedings (as defined below) and the CCAA Proceedings on matters of concern to both courts.
Chapter 11 Proceedings
Also on the Petition Date, Nortel Networks Inc. (“NNI”), Nortel Networks Capital Corporation and certain other of Nortel’s U.S. subsidiaries (“U.S. Debtors”), other than Nortel Networks (CALA) Inc. (“NNCI”), filed voluntary petitions under Chapter 11 with the U.S. Court (“Chapter 11 Proceedings”). The U.S. Debtors received approval from the U.S. Court for a number of motions enabling them to continue to operate their businesses generally in the ordinary course. Among other things, the U.S. Debtors received approval to continue paying
employee wages and certain benefits in the ordinary course; to generally continue their cash management system, including approval of a revolving loan agreement between NNI as lender and NNL as borrower with an initial advance to NNL of $75, to support NNL’s ongoing working capital and general corporate funding requirements; and to continue honoring customer obligations and paying suppliers for goods and services received on or after the Petition Date. On July 14, 2009, NNCI, a U.S. based subsidiary that operates in the CALA region, also filed a voluntary petition for relief under Chapter 11 in the U.S. Court and thereby became one of the U.S. Debtors subject to the Chapter 11 Proceedings. On July 17, 2009, the U.S. Court entered an order of joint administration that provided for the joint administration of NNCI’s case with the pre-existing cases of the other U.S. Debtors.
As required under the U.S. Bankruptcy Code, on January 22, 2009, the United States Trustee for the District of Delaware appointed an official committee of unsecured creditors, which currently includes The Bank of New York Mellon, Flextronics Corporation, Airvana, Inc., Pension Benefit Guaranty Corporation and Law Debenture Trust Company of New York (“U.S. Creditors’ Committee”). The U.S. Creditors’ Committee has the right to be heard on all matters that come before the U.S. Court with respect to the U.S. Debtors. There can be no assurance that the U.S. Creditors’ Committee will support the U.S. Debtors’ positions on matters to be presented to the U.S. Court. In addition, a group purporting to hold substantial amounts of Nortel’s publicly traded debt has organized (“Bondholder Group”). Nortel’s management and the Canadian Monitor have met with the Bondholder Group and its advisors to provide status updates and share information with them that has been shared with other major stakeholders. Disagreements between the Debtors and the U.S. Creditors’ Committee and the Bondholder Group could protract and negatively impact the Creditor Protection Proceedings (as defined below), and the Debtors’ ability to operate.
As a consequence of the commencement of the Chapter 11 Proceedings, generally, all actions to enforce or otherwise effect payment or repayment of liabilities of any U.S. Debtor preceding the Petition Date and substantially all pending claims and litigation against the U.S. Debtors have been automatically stayed for the pendency of the Chapter 11 Proceedings (absent any court order lifting the stay). In addition, the U.S. Debtors applied for and obtained an order in the Canadian Court recognizing the Chapter 11 Proceedings in the U.S. as “foreign proceedings” in Canada and giving effect, in Canada, to the automatic stay under the U.S. Bankruptcy Code.
Administration Proceedings
Also on the Petition Date, certain of Nortel’s EMEA subsidiaries (“EMEA Debtors”) made consequential filings and each obtained an administration order from the High Court of England and Wales (“English Court”) under the Insolvency Act 1986 (“U.K. Administration Proceedings”). The filings were made by the EMEA Debtors under the provisions of the European Union’s Council Regulation (EC) No 1346/2000 on Insolvency Proceedings (“EC Regulation”) and on the basis that each EMEA Debtor’s center of main interests was in England. Under the terms of the orders, a representative of Ernst & Young LLP (in the U.K.) and a representative of Ernst & Young Chartered Accountants (in Ireland) were appointed as joint administrators with respect to the EMEA Debtor in Ireland, and representatives of Ernst & Young LLP were appointed as joint administrators for the other EMEA Debtors (collectively, “U.K. Administrators”) to manage each of the EMEA Debtors’ affairs, business and property under the jurisdiction of the English Court and in accordance with the applicable provisions of the Insolvency Act 1986. The Insolvency Act 1986 provides for a moratorium during which creditors may not, without leave of the English Court or consent of the U.K. Administrators, wind up the company, enforce security, or commence or progress legal proceedings. All of Nortel’s operating EMEA subsidiaries except those in the following countries are included in the U.K. Administration Proceedings: Nigeria, Russia, Ukraine, Israel, Norway, Switzerland, South Africa and Turkey. Certain of Nortel’s Israeli subsidiaries (“Israeli Debtors”) have commenced separate creditor protection proceedings in Israel (“Israeli Administration Proceedings”). On January 19, 2009, an Israeli court (“Israeli Court”) appointed administrators over the Israeli Debtors (“Israeli Administrators”). The orders of the Israeli Court provide for a stay in respect of the Israeli Debtors whose creditors are prevented from taking steps against the companies or their assets and which, subject to further orders of the Israeli Court, remains in effect during the Israeli Administration
Proceedings. The period for the Israeli Administration Proceedings recently expired on November 24, 2009; however, a request to extend the Israeli Administration Proceedings is pending. Under Israeli law, the Israeli Administration Proceedings are required to end with either a scheme of arrangement, which returns Networks Israel (Sales and Marketing) Limited to solvency, or a liquidation. On November 24, 2009, the Israeli Court approved a scheme of arrangement which returned the company to solvency. A proposed scheme of arrangement for Nortel Communications Holdings (1997) Limited has been submitted to the Israeli Court, and remains subject to the approval of the Israeli Court.
The U.K. Administration Proceedings in relation to NNUK have been recognized by the U.S. Court as “foreign main proceedings” pursuant to the provisions of Chapter 15 of the U.S. Bankruptcy Code, giving effect in the U.S. to the moratorium provided by the Insolvency Act 1986.
On May 28, 2009, at the request of the U.K. Administrators of NNSA, the Commercial Court of Versailles, France (“French Court”) ordered the commencement of secondary proceedings in respect of NNSA (“French Secondary Proceedings”). The secondary proceedings consist of liquidation proceedings during which NNSA continued to operate as a going concern for an initial period of three months. On August 20, 2009, the French Court extended the secondary proceedings until November 28, 2009. In accordance with the EC Regulation, the U.K. Administration Proceedings remain the main proceedings in respect of NNSA although a French administrator (“French Administrator”) and a French liquidator (“French Liquidator”) have been appointed and are in charge of the day-to-day affairs and continuing business of NNSA in France. On October 1, 2009, pursuant to a motion filed by the U.K. Administrators, the French Court approved an order to: (i) suspend the liquidation operations relating to the sale of the assets and/or businesses of NNSA for a renewable period of two months; (ii) authorize the continuation of the business of NNSA so long as the liquidation operations are suspended; and (iii) maintain the powers of the French Administrator and French Liquidator during the suspension period, except with respect to the sale of assets and/or businesses of NNSA.
The Canadian Debtors, U.S. Debtors, EMEA Debtors and Israeli Debtors are together referred to as the Debtors; the CCAA Proceedings, the Chapter 11 Proceedings, the U.K. Administration Proceeding, the Israeli Administration Proceedings and the French Secondary Proceedings are together referred to as the Creditor Protection Proceedings.
Enterprise and Government Solutions Business Divestiture
On July 20, 2009, Nortel announced that it, NNL, and certain of Nortel’s other subsidiaries including NNI and NNUK, had entered into a “stalking horse” asset and share sale agreement with Avaya for its North American, CALA, and Asian ES business, and an asset sale agreement with Avaya for the EMEA portion of its ES business for a purchase price of $475 subject to purchase price adjustments under certain circumstances. These agreements include the planned sale of substantially all of the assets of the ES business globally as well as the shares of NGS and DiamondWare, Ltd. This sale required a court-approved “stalking-horse” sale process under Chapter 11 that allowed other qualified bidders to submit higher or otherwise better offers. Bidding procedures were approved by the U.S. Court and Canadian Court on August 4, 2009. Competing bids were required to be submitted by September 4, 2009 and an auction with the qualified bidders commenced on September 11, 2009. On September 14, 2009, Avaya emerged as the successful bidder for the sale of substantially all of the assets of the ES business globally as well as the shares of NGS and DiamondWare, Ltd. for a purchase price of $900 in cash to Nortel, with an additional pool of $15 reserved for an employee retention program, subject to purchase price adjustments under certain circumstances. Nortel obtained U.S. Court and Canadian Court approvals for the sale to Avaya on September 16, 2009.
Except in relation to NNSA, the U.K. Administrators have the authority, without further court approval, to enter into the EMEA asset sale agreement on behalf of each of the EMEA Debtors. In some EMEA jurisdictions, this transaction is subject to compliance with information and consultation obligations with employee representatives prior to finalization of the terms of the sale.
In addition to the processes and approvals outlined above, consummation of the transaction is subject to the satisfaction of regulatory and other conditions and the receipt of various approvals, including governmental approvals in Canada and the United States and the approval of the courts in France and Israel. The sale is expected to close late in the fourth quarter of fiscal 2009, subject to receipt of all required approvals.
Business Operations
During the Creditor Protection Proceedings, and until the completion of any proposed divestitures or a decision to cease operations in certain countries is made, the businesses of the Debtors continue to operate under the jurisdictions and orders of the applicable courts and in accordance with applicable legislation. Nortel has continued to engage with its existing customer base in an effort to maintain delivery of products and services, minimize interruptions as a result of the Creditor Protection Proceedings and Nortel’s divestiture efforts and resolve any interruptions in a timely manner. At the beginning of the proceedings, Nortel established a senior procurement team, along with appropriate advisors, to address supplier issues and concerns as they arose to ensure ongoing supply of goods and services and minimize any disruption in its global supply chain. This procedure continues to function effectively and any supply chain issues are being dealt with on a timely basis.
Contracts
Under the U.S. Bankruptcy Code, the U.S. Debtors may assume, assume and assign, or reject certain executory contracts including unexpired leases, subject to the approval of the U.S. Court and certain other conditions. Pursuant to the initial order of the Canadian Court, the Canadian Debtors are permitted to repudiate any arrangement or agreement, including real property leases. Any reference to any such agreements or instruments and to termination rights or a quantification of Nortel’s obligations under any such agreements or instruments is qualified by any overriding rejection, repudiation or other rights the Debtors may have as a result of or in connection with the Creditor Protection Proceedings. The administration orders granted by the English Court do not give any similar unilateral rights to the U.K. Administrators. The U.K. Administrators and in the case of NNSA, the French Administrator and the French Liquidator, decide in each case whether an EMEA Debtor should continue to perform under an existing contract on the basis of whether it is in the interests of that administration to do so. Claims may arise as a result of a Debtor rejecting, repudiating or no longer continuing to perform under any contract or arrangement, which claims would usually be unsecured. Since the Petition Date, the Debtors have assumed and rejected or repudiated various contracts, including real property leases and commercial agreements. The Debtors will continue to review other contracts throughout the Creditor Protection Proceedings.
Creditor Protection Proceeding Claims
On August 4, 2009, the U.S. Court approved the establishment of a claims process in the U.S. for claims that arose prior to the Petition Date. Under this claims process, proof of claims, except in relation to NNCI, had to be received by the U.S. Claims Agent, Epiq Bankruptcy Solutions, LLC (“Epiq”), by no later than 4:00 p.m. (Eastern Time) on September 30, 2009 (subject to certain exceptions as provided in the order establishing the claims bar date). For claims in relation to NNCI, on December 2, 2009, the U.S. Court approved the establishment of 4:00 p.m. (Eastern Time) on January 25, 2010 as the deadline for receipt by Epiq of proof of claims against NNCI (subject to certain exceptions as provided in the order establishing the claims bar date).
On July 30, 2009, Nortel announced that the Canadian Court approved the establishment of a claims process in Canada in connection with the CCAA Proceedings. Under this claims process, subject to certain exceptions, proof of claims for claims arising prior to the Petition Date, had to be received by the Canadian Monitor, by no later than September 30, 2009. This claims notification deadline does not apply to certain claims, including most inter-company claims as between the Canadian Debtors themselves or as between any of the Canadian Debtors and their direct or indirect subsidiaries and affiliates (other than joint ventures), compensation claims by current or former employees or directors of any of the Canadian Debtors, and claims of current or former directors or
officers for indemnification and/or contribution, for which claims notification deadlines have yet to be set by the Canadian Court. Proof of claims for claims arising on or after the Petition Date as a result of the restructuring, termination, repudiation or disclaimer of any lease, contract or other agreement or obligation must be received by the Canadian Monitor by the later of September 30, 2009 and 30 days after a proof of claims package has been sent by the Canadian Monitor to the person in respect of such claim.
In relation to NNSA, claims had to be submitted to the French Administrator and the French Liquidator no later than August 12, 2009 with respect to French creditors and October 12, 2009 with respect to foreign creditors.
In relation to the Israeli Debtors, the Israeli Court determined that claims had to be submitted to the Israeli Administrators by no later than July 26, 2009. Other than as set forth above with respect to NNSA, no outside date for the submission of claims has been established in connection with U.K. Administration Proceedings.
The combined financial statements for the nine months ended September 30, 2009 do not include the effects of any current or future claims relating to the Creditor Protection Proceedings. Certain claims filed may have priority over those of the Debtors’ unsecured creditors. Currently, it is not possible to determine the extent of claims filed and to be filed, whether such claims will be disputed and whether they will be subject to discharge or disallowance in the Creditor Protection Proceedings. It is also not possible at this time to determine whether to establish any additional liabilities in respect of claims. The Debtors are reviewing all claims filed and are beginning the claims reconciliation process. Differences between claim amounts identified by the Debtors and claims filed by creditors will be investigated and resolved in connection with the claims reconciliation process or, if necessary, the relevant court will make the final determination as to the amount, nature and validity of claims. The aggregate amount of claims will likely exceed the amount that ultimately will be allowed by the relevant courts. Certain claims may be duplicative (particularly given the multiple jurisdictions involved in the Creditor Protection Proceedings), based on contingencies that have not occurred, or may be otherwise overstated, and would therefore be invalid. The determination of how liabilities will ultimately be settled and treated cannot be made until each of the relevant courts approve a plan and in light of the number of creditors of the Debtors, the claims resolution process may take considerable time to complete.
Interim Funding and Settlement Agreement
Historically, Nortel has deployed its cash through a variety of intercompany borrowing and transfer pricing arrangements to allow it to operate on a global basis and to allocate profits and losses, and certain costs, among the corporate group. In particular, the Canadian Debtors have continued to allocate profits and losses, and certain costs, among the corporate group through transfer pricing agreement payments (“TPA Payments”). Other than one $30 payment made by NNI to NNL in respect of amounts that Nortel believes are owed in connection with the transfer pricing agreement, TPA Payments had been suspended since the Petition Date. However, the Canadian Debtors and the U.S. Debtors, with the support of the U.S. Creditors’ Committee and the Bondholder Group, as well as the EMEA Debtors (other than NNSA) entered into an Interim Funding and Settlement Agreement (“IFSA”) dated June 9, 2009 under which NNI paid $157 to NNL, in four installments during the period ended September 30, 2009 in full and final settlement of TPA Payments for the period from the Petition Date to September 30, 2009. A portion of this funding may be repayable by NNL to NNI in certain circumstances. The IFSA was approved by the U.S. Court and Canadian Court on June 29, 2009 and on June 23, 2009, the English Court confirmed that the U.K. Administrators were at liberty to enter into the IFSA on behalf of each of the EMEA Debtors (except for NNSA which was authorized to enter into the IFSA by the French Court on July 7, 2009). NNSA acceded to the IFSA on September 11, 2009. Further arrangements will be necessary in order to address TPA Payments, or other funding issues, for periods post-September 30, 2009 and NNL’s future liquidity needs and there can be no assurance that the Canadian Debtors will be able to arrange additional funding sufficient to fund future operations. Negotiations between NNL and the U.S. Debtors for reimbursement of a portion of these costs for the fourth quarter of 2009 are on-going. In addition, the Debtors and other Nortel entities are engaged in discussions in order to address NNL’s liquidity needs for periods subsequent to December 31, 2009.
APAC Debt Restructuring Agreement
As a consequence of the Creditor Protection Proceedings, certain amounts of intercompany payables to certain Nortel subsidiaries (“APAC Agreement Subsidiaries”) in the Asia-Pacific (“APAC”) region as of the Petition Date became impaired. To enable the APAC Agreement Subsidiaries to continue their respective business operations and to facilitate any potential divestitures, the Debtors (other than NNSA) entered into an Asia Restructuring Agreement (“APAC Agreement”). Under the APAC Agreement, the APAC Agreement Subsidiaries will pay a portion of certain of the APAC Agreement Subsidiaries’ net intercompany debt outstanding as of the Petition Date (“Pre-Petition Intercompany Debt”) and the Canadian Debtors, the U.S. Debtors and the EMEA Debtors (including NNSA to the extent it elects to participate in the APAC Agreement) will initially receive approximately $15, $18, and $15, respectively, in aggregate. A further portion of the Pre-Petition Intercompany Debt will be repayable in monthly amounts but only to the extent of such APAC Agreement Subsidiary’s net cash balance, and subject to certain reserves and provisions. The remainder of each APAC Agreement Subsidiary’s Pre-Petition Intercompany Debt will be subordinated and postponed to the prior payment in full of such APAC Agreement Subsidiary’s liabilities and obligations. Implementation of the APAC Agreement is subject to receipt of approvals (court and/or administrator) in the U.S., Canada and EMEA, as well as receipt of certain regulatory approvals in certain APAC jurisdictions.
Flextronics
On January 14, 2009, Nortel announced that NNL had entered into an amendment to arrangements (“Amending Agreement”) with a major supplier, Flextronics Telecom Systems, Ltd. (“Flextronics”). Under the terms of the amendment, NNL agreed to commitments to purchase $120 of existing inventory by July 1, 2009 and to make quarterly purchases of other inventory, and to terms relating to payment and pricing. Approximately $28 of this total commitment is related to the Businesses and is subject to finalization. Flextronics had notified Nortel of its intention to terminate certain other arrangements upon 180 days’ notice (in July 2009) pursuant to the exercise by Flextronics of its contractual termination rights, while the other arrangements between the parties will continue in accordance with their terms. Following subsequent negotiations, Nortel has resolved all ongoing disputes and issues relating to the interpretation of the Amending Agreement and has confirmed, among other things, its obligation to purchase inventory in accordance with existing plans of record of $25. In addition, one of the supplier agreements with Flextronics was not terminated on July 12, 2009, as originally referenced in the Amending Agreement, but instead has been extended to December 12, 2009, with a further extension for certain products to July 2010. Flextronics is a significant supplier to the Businesses and is also a supplier to several of Nortel’s other businesses.
Nortel and Flextronics have entered into an agreement dated November 20, 2009, which was approved by the courts on December 2, 2009, that, among other things, provides a mechanism for the transfer of the Nortel supply relationship to interested parties, being the purchasers of Nortel’s other businesses or assets, on terms and conditions described in the agreement. In addition, this latest agreement serves to resolve certain receivable amounts from and payable amounts due to Flextronics. A portion of these receivable and payable amounts are related to the Businesses, the accounting for which will be addressed in the period subsequent to the balance sheet.
Workforce Reductions; Employee Compensation Program Changes
On February 25, 2009, Nortel announced a workforce reduction plan. Under this plan, Nortel intends to reduce its global workforce by approximately 5,000 net positions. Nortel has commenced and will continue to implement these reductions, in accordance with local country legal requirements, including those that impact the Business. During the nine months ended September 30, 2009, Nortel, including the Businesses, undertook additional workforce reduction activities. Given the Creditor Protection Proceedings, Nortel, and therefore the Businesses, has discontinued all remaining activities under its previously announced restructuring plans as of the Petition Date. For further information, refer to Notes 8 and 9. In addition, Nortel has taken and expects to take further, ongoing workforce and other cost reduction actions as it works through the Creditor Protection Proceedings.
Nortel also announced on February 25, 2009 several changes to its employee compensation programs. Upon the recommendation of management, its Board of Directors approved no payment of bonuses under the Nortel Networks Limited Annual Incentive Plan (AIP) for 2008. Nortel has continued its AIP in 2009 for all eligible full- and part-time employees. The AIP has been modified to permit quarterly rather than annual award determinations and payouts, if any. This has provided a more immediate incentive for employees upon the achievement of critical shorter-term objectives. Where required, Nortel has obtained court approvals for retention and incentive compensation plans for certain key eligible employees deemed essential to the business during the Creditor Protection Proceedings and Nortel has since implemented such plans.
On February 27, 2009, Nortel obtained Canadian Court approval to terminate its equity-based compensation plans (the Nortel 2005 Stock Incentive Plan, As Amended and Restated (“2005 SIP”), the Nortel Networks Corporation 1986 Stock Option Plan, As Amended and Restated (“1986 Plan”) and the Nortel Networks Corporation 2000 Stock Option Plan (“2000 Plan”)) and certain equity plans assumed in prior acquisitions, including all outstanding equity under these plans (stock options, stock appreciation rights (“SARs”), restricted stock units (“RSUs”) and performance stock units (“PSUs”)), whether vested or unvested. Nortel sought this approval given the decreased value of Nortel’s common shares (“NNC common shares”) and the administrative and associated costs of maintaining the plans to Nortel as well as the plan participants. See Note 14 for additional information about Nortel’s share-based compensation plans.
3. Significant accounting policiesRecent Accounting Pronouncements
(a) Principles of combinationNew Accounting Guidance Recently Adopted
The combined financial statements include the global historical assets, liabilities and operations of the Businesses. All significant transactions and balances between operations within the Businesses have been eliminated in combination. All significant transactions between the Businesses and other Nortel businesses are included in these combined financial statements and are disclosed as related party transactions in Note 17. All transactions between the Businesses and Nortel are considered to be effectively settled through the net parent investment at the time the transactions are recorded.Goodwill Impairment Test
In 2005, Nortel entered intoSeptember 2011, the Financial Accounting Standards Board (“FASB”) issued revised guidance intended to simplify how an entity tests goodwill for impairment. As a joint venture, LGN, with LG Electronics Inc. (“LGE”) which offers telecommunications and networking solutions to customers in the Republic of Korea and other markets globally. In exchange for a cash contribution paid to LGE, Nortel received 50% plus one share in the equity of LGN. Nortel’s investment in this joint venture and other joint ventures are excluded from the Businesses’ combined financial statements. However, transactions between the Businesses and LGN are reflected in these combined financial statements and disclosed as related party transactions in Note 17.
(b) Use of estimates
The preparation of financial statements in accordance with U.S. GAAP requires management to make estimates and assumptions that affect the amounts reported in the financial statements and accompanying notes. The Businesses make estimates and assumptions that affect the reported amounts of assets and liabilities and disclosure of contingent assets and liabilities asresult of the date of the combined financial statements, and the reported amounts of revenues and expenses during the reporting period. Actual results may differ from those estimates. Estimates are used when accounting for items and matters such as revenue recognition and accruals for losses on contracts, allowances for uncollectible accounts receivable, inventory provisions and outsourced manufacturing related obligations, product warranties, estimated useful lives of intangible assets and plant and equipment, asset valuations, impairment and recoverability assessments, employee benefits including pensions and share-based compensation, taxes and related valuation allowances and provisions, restructuring and other provisions, contingencies and allocations of various expenses that have historically been incurred by the Businesses.
(c) Translation of foreign currencies
The Businesses’ combined financial statements are presented in U.S. Dollars. The financial statements of the Businesses’ operations whose functional currency is not the U.S. Dollar are translated into U.S. Dollars at the exchange rates in effect at the balance sheet dates for assets and liabilities, and at average rates for the period for revenues and expenses. The unrealized translation gains and losses on the net investment in these foreign operations are accumulated as a component of other comprehensive income (loss).
The financial statements of operations where the functional currency is the U.S. Dollar but where the underlying transactions are in a different currency are translated into U.S. Dollars at the exchange rate in effect at the balance sheet date with respectguidance, an entity will be allowed to monetary assets and liabilities. Non-monetary assets and liabilities of these operations, and related amortization and depreciation expenses, are translated at the historical exchange rate. Revenues and expenses, other than amortization and depreciation, are translated at the average rate for the period in which the transaction occurred. The applicable gain/loss from foreign currency remeasurement has been allocated to these combined financial statements proportionate based on revenue (for revenue generating entities) or selling, general, and administrative expense (for non-revenue generating entities). The allocated gain/loss from foreign currency remeasurement is included in other income (expense) in the combined statements of operations.
(d) Revenue recognition
The Businesses’ products and services are generally sold pursuant to a contract and the terms of the contract, taken as a whole, determine the appropriate revenue recognition models to be applied. Product revenue includes revenue from arrangements that include services such as installation, engineering and network planning where the services could not be separated from the arrangement because the services are essential or fair value could not be established. Where services are not bundled with product sales, services revenue is reported separately in the combined statements of operations.
Depending on the terms of the contract and types of products and services sold, the Businesses recognize revenue under American Institute of Certified Public Accountants Statement of Position (“SOP”) 81-1, “Accounting for Performance of Construction-Type and Certain Production-Type Contracts” which is now codified as ASC 605-35 (“ASC 605-35”), SOP 97-2 which is now codified as ASC 985-605, “Software Revenue Recognition” (“ASC 985-605”) and FASB Emerging Issues Task Force (“EITF”) 00-21 which is now codified as ASC 605-25, “Revenue Arrangements with Multiple Deliverables” (“ASC 605-25”). Revenues are reduced for returns, allowances, rebates, discounts and other offerings in accordance with the agreement terms.
The Businesses regularly enter into multiple contractual agreements with the same customer. These agreements are reviewed to determine whether they should be evaluated as one arrangement in accordance with ASC 985-605. For arrangements with multiple deliverables entered into after June 30, 2003, where the deliverables are governed by more than one authoritative accounting standard, the Businesses apply ASC 605-25 and evaluate each deliverablefirst assess qualitative factors to determine whether it represents a separate unit of accounting based onis necessary to perform the following criteria: (a) whether the delivered item has valuetwo-step quantitative goodwill impairment test. An entity will not be required to the customer on a stand-alone basis, (b) whether there is objective and reliable evidence ofcalculate the fair value of a reporting unit unless the undelivered item(s) and (c) if the contract includes a general right of return relative to the delivered item, delivery or performance of the undelivered item(s) is considered probable and substantially in the control of the Businesses.
If objective and reliable evidence of fair value exists for all units of accounting in the arrangement, revenue is allocated to each unit of accounting or elemententity determines, based on relative fair values. In situations where there is objective and reliable evidence of fair value for all undelivered elements, but not for delivered elements, the residual method is used to allocate the arrangement consideration. Under the residual method, the amount of revenue allocated to delivered elements equals the total arrangement consideration less the aggregate fair value of any undelivered elements. Each unit of accounting is then accounted for under the applicable revenue recognition guidance. So long as elements otherwise governed by separate authoritative accounting standards cannot be treated as separate units of accounting under the guidance in ASC 605-25, the elements are combined
into a single unit of accounting for revenue recognition purposes. In this case, revenue allocated to the unit of accounting is deferred until all combined elements have been delivered or, once there is only one remaining element to be delivered, based on the revenue recognition guidance applicable to the last delivered element within the unit of accounting.
For arrangements where software is considered more than incidental and essential to the functionality of the hardware, or where the hardware is not considered a separate element from the software deliverables, revenue is recognized for the software and the hardware as a single unit of accounting pursuant to ASC 985-605 for off-the-shelf products and pursuant to ASC 605-35 for customized products.
Software revenue is generally recognized under ASC 985-605. For software arrangements involving multiple elements, the Businesses allocate revenue to each element based on the relative fair value or the residual method, as applicable using vendor specific objective evidence to determine fair value, which is based on prices charged when the element is sold separately. Software revenue accounted for under ASC 985-605 is recognized when persuasive evidence of an arrangement exists, the software is delivered in accordance with all terms and conditions of the customer contracts, the fee is fixed or determinable and collectability is probable. Revenue related to post-contract customer support (“PCS”), including technical support and unspecified when-and-if available software upgrades, is recognized ratably over the PCS term.
Under ASC 985-605, if fair value does not exist for any undelivered element, revenue is not recognized until the earlier of (i) delivery of such element or (ii) when fair value of the undelivered element is established, unless the undelivered element is a service, in which case revenue is recognized as the service is performed once the service is the only undelivered element.
For elements related to customized solutions designed and built to customer specific requirements, revenues are recognized in accordance with ASC 605-35, generally using the percentage-of-completion method. In using the percentage-of-completion method, revenues are recorded based on the percentage of costs incurred to date on a contract relative to the estimated total expected contract costs. Profit estimates on these contracts are revised periodically based on changes in circumstances and any losses on contracts are recognized in the periodqualitative assessment, that such losses become known. In circumstances where reasonably dependable cost estimates cannot be made for a customized solution or build-out, all revenues and related costs are deferred until completion of the solution or element (“completed contract method”). Generally, the terms of ASC 605-35 contracts provide for progress billings based on completion of certain phases of work. Unbilled ASC 605-35 contract revenues recognized are accumulated in the contracts in progress account included in accounts receivable—net. Billings in excess of revenues recognized to date on these contracts are recorded as advance billings in excess of revenues recognized to date on contracts within other accrued liabilities until recognized as revenue. This classification also applies to billings in advance of revenue recognized on combined units of accounting under ASC 605-25 that contain both ASC 605-35 and non ASC 605-35 elements.
For arrangements where the criteria for revenue recognition have not been met because legal title or risk of loss on products does not transfer to the customer until final payment has been received or where delivery has not occurred, revenue is deferred to a later period when the outstanding criteria have been met. For arrangements where the customer agrees to purchase products but the Businesses retain physical possession until the customer requests delivery (“bill and hold arrangements”), revenue is not recognized until delivery to the customer has occurred and all other revenue recognition criteria have been met.
Services revenue is generally recognized according to the proportional performance method. The proportional performance method is used when the provision of services extends beyond an accounting period with more than one performance act, and permits the recognition of revenue ratably over the services period when no other pattern of performance is discernable. The nature of the service contract is reviewed to determine which revenue recognition method best reflects the nature of services performed. Provided all other revenue recognition criteria have been met, the revenue recognition method selected reflects the pattern in which the obligations to the customers have been fulfilled.
The Businesses make certain sales through multiple distribution channels, primarily resellers and distributors. These customers are generally given certain rights of return. For products sold through these distribution channels, revenue is recognized from product sale at the time of shipment to the distribution channel when persuasive evidence of an arrangement exists, delivery has occurred, the fee is fixed or determinable and collectability is reasonably assured. Accruals for estimated sales returns and other allowances are recorded at the time of revenue recognition and are based on contract terms and prior claims experience.
Deferred costs are presented as current or long-term in the combined balance sheet, consistent with the classification of the related deferred revenues.
(e) Research and development
Research and development (“R&D”) costs are charged to net earnings (loss) in the periods in which they are incurred. However, costs incurred pursuant to specific contracts with third parties, for which the Businesses are obligated to deliver a product, are charged to cost of revenues in the same period as the related revenue is recognized.
(f) Income taxes
The Businesses do not file separate tax returns, but rather are included in the income tax returns filed by Nortel and its subsidiaries in various domestic and foreign jurisdictions. For the purpose of these combined financial statements, the tax provision of the Businesses was derived from financial information included in the consolidated financial statements of Nortel, including allocations and eliminations deemed necessary by management, as though the Businesses were filing their own separate tax returns.
The Businesses account for income taxes by the asset and liability method. This approach recognizes the amount of taxes payable or refundable in the current year as well as deferred tax assets and liabilities for the future tax consequences, determined on the separate return basis, of events recognized in these combined financial statements. Deferred income taxes are adjusted to reflect changes in enacted tax rates.
Nortel manages its tax position for the benefit of its entire portfolio of businesses, and its tax strategies, including utilization of loss carryforwards, are not necessarily reflective of what the Businesses would have followed as a stand alone entity. Losses generated by the Businesses have been available to, and as appropriate were utilized by, Nortel in its tax strategies with respect to entities or operations not forming part of the Businesses. Due to difficulties inherent in separating the Businesses’ results from Nortel’s consolidated results during periods pre-dating the periods presented in these combined financial statements, any deferred tax assets in respect of loss carryforwards and tax credits are not recognized in these combined financial statements.
In establishing the appropriate income tax valuation allowances, the Businesses assess its net deferred tax assets based on all available evidence, both positive and negative, to determine whether it is more likely than not that its fair value is less than its carrying amount. The accounting guidance became effective for the remaining net deferred tax assetsCompany beginning in fiscal 2013 and did not have an impact on the Consolidated Financial Statements or a portion thereof will be realized.financial statement disclosures.
Indefinite-lived Intangible Asset Impairment Test
In accordance with ASC 740-10, “AccountingJuly 2012, the FASB issued revised guidance intended to simplify how an entity tests indefinite-lived intangible assets other than goodwill for Uncertainty in Income Taxes—impairment. As a result of the guidance, an interpretation of FASB Statement No. 109” (“ASC 740-10”), as applied by the separate return method, the Businesses evaluate tax positions using a two-step process, whereby (1) the Businessesentity will be allowed to first assess qualitative factors to determine whether it is more likely thannecessary to perform the quantitative impairment test. An entity will not that the tax positions will be sustained based on the technical merits of the position and (2) for those tax positions that meet the more likely-than-not recognition threshold, the Businesses recognize the largest amount of tax benefit that has a greater than 50% likelihood of being realized upon ultimate settlement with the related tax authority. In accordance with ASC 740-10, the Businesses classify interest and penalties associated with income tax positions in income tax expense. For additional information, see Note 10.
(g) Cash and cash equivalents
Cash and cash equivalents consist of cash and short term investments in bank accounts of NGS. Treasury activities at Nortel are generally centralized such that cash collections by the Enterprise Solutions business are automatically distributed to Nortel and are reflected as a component of net parent investment.
(h) Restricted cash and cash equivalents
Cash and cash equivalents are considered restricted when they are subject to contingent rights of a third party customer in the normal course of business. From time to time, the Businesses may be required to post cash and cash equivalents as collateral to a third party as a result ofperform the general economic and industry environment.
(i) Provision for doubtful accounts
The provision for doubtful accounts for trade receivables due from customers is establishedquantitative impairment test unless the entity determines, based on ana qualitative assessment, of a customer’s credit quality, as well as subjective factors and trends, including the aging of receivable balances. Generally, these credit assessments occur prior to the inception of the credit exposure and at regular reviews during the life of the exposure.
(j) Inventories
Inventories are valued at the lower of cost (calculated generally on a first-in, first-out basis) or market value. The standard cost of finished goods and work in process is comprised of material, labor and manufacturing overhead, which approximates actual cost. Provisions for inventory are based on estimates of future customer demand for existing products, as well as general economic conditions, growth prospects within the customer’s ultimate marketplaces and general market acceptance of current and pending products. Full provisions are generally recorded for surplus inventory in excess of one year’s forecast demand or inventory deemed obsolete. In addition, the Businesses record a liability for firm, non-cancelable and unconditional inventory purchase commitments with contract manufacturers and suppliers for product-related quantities in excess of its future demand forecasts and related claims in accordance with the Businesses’ excess and obsolete inventory policies.
Inventory includes certain direct and incremental deferred costs associated with arrangements where title and risk of loss were transferred to customers but revenue was deferred due to other revenue recognition criteria not being met.
(k) Investments
Investments in equity securities of private companies over which the Businesses do not exert significant influence are accounted for using the cost method. Investments in associated companies and joint ventures are accounted for using the equity method. An impairment loss is recorded when there has been a loss in value of the investment that is other than temporary.
The Businesses monitor its investments for factors indicating other-than-temporary impairment and records a charge to net earnings (loss) when appropriate. Investments are classified as long-term and short-term, based on expected time of maturity.
(l) Plant and equipment
Plant and equipment are stated at cost less accumulated depreciation. Depreciation is generally calculated on a straight-line basis over the expected useful lives of the plant and equipment. The expected useful life of machinery and equipment including related capital leases is three to ten years.
(m) Impairment or disposal of long-lived assets
The Businesses test long-lived assets or asset groups held and used for recoverability when events or changes in circumstances indicate that their carrying amount may not be recoverable. Circumstances which could trigger a review include, but are not limited to: significant decreases in the market price of the asset or asset group; significant adverse changes in the business climate or legal factors; the accumulation of costs significantly in excess of the amount originally expected for the acquisition or construction of the asset; current period cash flow or operating losses combined with a history of losses or a forecast of continuing losses associated with the use of the asset; and a current expectation that the asset will more likely than not be sold or disposed of significantly before the end of its previously estimated useful life.
Recoverability is assessed based on the carrying amount of the asset or asset group and the sum of the undiscounted cash flows expected to result from the use and the eventual disposal of the asset or asset group. An impairment loss is recognized when the carrying amount is not recoverable and exceeds the fair value of the asset or asset group. The impairment loss is measured as the amount by which the carrying amount exceeds fair value.
(n) Goodwill
Goodwill represents the excess of the purchase price of an acquired business over the fair value of the identifiable assets acquired and liabilities assumed. The Businesses test for impairment of goodwill on an annual basis as of October 1, and at any other time if events occur or circumstances change that would indicate that it is more likely than not that the fair value of a reporting unit has been reduced below its carrying amount. See Note 7indefinite-lived asset is impaired. The accounting guidance became effective for further informationthe Company beginning in fiscal 2013 and did not have an impact on the Businesses’ goodwill impairment testing policy.Consolidated Financial Statements or financial statement disclosures.
(o) Warranty costsRecent Accounting Guidance Not Yet Effective
As partOn February 5, 2013, the FASB issued Accounting Standards Update No. 2013-02 “Reporting of Amounts Reclassified Out of Accumulated Other Comprehensive Income”. The standard requires that companies present, either in a single note or parenthetically on the face of the normal salefinancial statements, the effect of product,significant amounts reclassified from each component of accumulated other comprehensive income based on its source and the Businesses provide its customers with product warranties that extend for periods generally ranging from one to six years fromincome statement line items affected by the date of sale. A liabilityreclassification. This accounting guidance is effective for the Company beginning in the first quarter of fiscal 2014 and is only expected costto impact the presentation of warranty-related claims is established when the product is deliveredCompany’s Consolidated Financial Statements and completed. In estimating warranty liability, historical material replacement costs and the associated labor costs to correct the product defect are considered. Revisions are made when actual experience differs materially from historical experience. Warranty-related costs incurred before revenue is recognized are capitalized and recognized as an expense when the related revenue is recognized. Known product defects are specifically accrued for as the Businesses become aware of such defects.notes.
(p) Pension, post-retirement and post-employment benefits
Substantially all employees of the Businesses participate in defined benefit pension plans and post-retirement plans as administered and sponsored by Nortel. The Businesses account for their defined benefit pension plans and post-retirement plans in accordance with SFAS No. 87, “Employers’ Accounting for Pensions” and SFAS No. 106, “Employers’ Accounting for Post-retirement Benefits Other Than Pensions,” as amended by SFAS 158 (see Note 4(b)) which is now codified as ASC 715. No pension assets or liabilities are reflected on the Businesses’ combined balance sheets, and pension and other post-retirement expenses for the Businesses have been determined on a multiemployer plan basis and pension expense is calculated by employee and is reflected in net earnings (loss). Employees of the Businesses participate in Nortel’s defined benefit pension plans and the plans’ assets and liabilities are combined with those related to other Nortel businesses. Similarly, Nortel manages its post-retirement benefit plans on a combined basis with claims data and liability information related to the Businesses aggregated and combined with other Nortel businesses.
The Businesses follows the accounting guidance as specified in SFAS No. 112, “Employers Accounting for Postemployment Benefits,” which is now codified as ASC 712 for the recognition of certain disability benefits. The Businesses recognize an actuarial-based obligation at the onset of disability for certain benefits provided to individuals after employment but before retirement that include medical, dental, vision, life and other benefits.
(q) Share-based compensation
Employees of the Businesses participated in equity-based compensation plans sponsored by Nortel, which have since been terminated (see Notes 2 and 14). The accounting for significant share-based compensation plans under the fair value-based method is as follows:
Stock options
The grant date fair value of stock options has been estimated using the Black-Scholes-Merton option-pricing model. Compensation cost has been recognized on a straight-line basis over the stock option vesting period of the entire award based on the estimated number of stock options that have been expected to vest. When exercised, stock options have been settled through the issuance of Nortel common shares and have therefore been treated as equity awards.
Stock appreciation rights (“SARs”)
Prior to its termination, stand-alone SARs or SARs in tandem with options could be granted under the 2005 SIP. SARs that have been settled in cash have been accounted for as liability awards and SARs that have been settled in Nortel common shares have been accounted for as equity awards. Upon the exercise of a vested stand-alone SAR, a holder would have been entitled to receive payment, in cash, of Nortel common shares or any combination thereof of an amount equal to the excess of the market value of a common share on the date of exercise over the subscription or base price under the SAR. Stand-alone SARs awarded under the 2005 SIP generally vested in equal installments on the first four anniversary dates of the grant date of the award. All SARs granted prior to the termination of the equity-based compensation plans, were to be settled in cash at the time of vesting however, for purposes of these combined financial statements such awards have been reflected in net parent investment as such awards were to be settled by Nortel. Such awards have been classified as liability awards based on this cash settlement provision. The measurement of the liability and compensation cost of previously outstanding SARs is based on the fair value of the awards and is remeasured each period through the date of settlement. Compensation cost has been amortized over the requisite service period (generally the vesting period) of the award based on the proportionate amount of the requisite service that had been rendered to date.
Restricted Stock Units (“RSUs”)
Prior to the termination of the equity-based compensation plans, RSUs were settled with common shares and valued on the grant date using the grant date market price of the underlying shares. This valuation of compensation cost has not subsequently been adjusted for changes in the market price of the shares. Each RSU granted under the 2005 SIP represented the right to receive one common share subject to the terms and conditions of the award. Prior to the termination of the equity-based compensation plans, compensation cost has been recognized on a straight-line basis over the vesting period of the entire award based on the estimated number of RSU awards that were expected to vest. RSUs were awarded to executive officers beginning in 2005, (employees from January 1, 2007) and prospectively vested in equal installments on the first three anniversary dates of the grant of the award. With the exception of RSUs granted in China, all RSUs granted prior to the termination of the equity-based compensation plans, have been classified as equity instruments as their terms required that they be settled in common shares. To address country specific rules and regulations RSUs awarded prior to the termination of the equity-based compensation plans to employees working in China were cash settled awards. For purposes of these combined financial statements such awards have been reflected in net parent investment as such awards were to be settled by Nortel and compensation cost has been remeasured each period based on the fair value of the underlying shares at period end.
Performance Stock Units (“PSUs”)
Relative Total Shareholder Return Metric Awards (“PSU-rTSRs”)
Prior to January 1, 2008 all awards of PSU-rTSRs under the 2005 SIP had vesting conditions based on a relative total shareholder return metric and had a 36-month performance period. The extent to which PSU-rTSRs
vested and settled at the end of a three year performance period depended upon the level of achievement of certain market performance criteria based on the total shareholder return on the Nortel Networks Corporation common shares compared to the total shareholder return on the common shares of a comparative group of companies included in the Dow Jones Technology Titans Index. Awards of PSU-rTSRs granted after January 1, 2008 had an additional 30-day employment service period in addition to the prior vesting conditions based on the relative total shareholder return metric and a 36-month performance period. The number of Nortel common shares issued for vested PSU-rTSRs could have ranged from 0% to 200% of the number of PSU-rTSR awards granted.
Prior to the termination of the equity-based compensation plans, PSU-rTSRs were generally settled with common shares and were valued using a Monte Carlo simulation model. The number of awards expected to be earned, based on achievement of the PSU-rTSR market condition, was factored into the grant date Monte Carlo valuation for the PSU-rTSR award. The grant date fair value has not subsequently been adjusted regardless of the eventual number of awards that were earned based on the market condition. Compensation cost has been recognized on a straight-line basis over the requisite service period. Compensation cost has been reduced for estimated PSU-rTSR awards that would not vest due to not meeting continued employment vesting conditions. All PSU-rTSRs currently granted prior to the termination of the equity-based compensation plans, have been classified as equity instruments as their terms required settlement in shares.
Management Operating Margin Metric Awards (“PSU-Management OMs”)
In March, 2008, Nortel issued PSU-Management OMs, which vested based on the satisfaction of a one-year performance condition an additional 24-month continued service condition and Nortel’s Management Operating Margin (“Management OM”) exceeding the minimum threshold level of 4.80% or $550 in accordance with Nortel’s payout curve for a one year performance period. The number of Nortel common shares to be issued for vested PSU-Management OMs is determined based on Nortel’s Management OM and could have ranged from 0% to 200% of the number of PSU-Management OM awards granted. Prior to the termination of the equity-based compensation plans PSU-Management OMs were generally settled in shares and compensation cost for these awards has been measured based on the grant date fair value of the underlying common shares that would have been issuable based on the terms of the award. Prior to the termination of the equity-based compensation plans, compensation cost has been recognized over the requisite service period of the award based on the probable number of shares to be issued by achievement of the performance condition, reduced by the expected awards that would not vest due to not meeting the continued service condition. Compensation cost recognized has been adjusted to equal the grant date fair value of the actual shares that vested once known.
For PSU-Management-OMs that may have been settled in cash, such awards has been reflected in net parent investment as the awards were to be settled by Nortel and compensation cost for the award has been remeasured each period based on the fair value of the underlying shares at period end. Compensation cost has then been recognized in the same manner as described above.
Employee stock purchase plans
Nortel maintained the Nortel Global Stock Purchase Plan, as amended and restated, the Nortel U.S. Stock Purchase Plan, As Amended and Restated and the Nortel Stock Purchase Plan for Members of the Nortel Saving and Retirement Program, As Amended (collectively, the “ESPPs”), to facilitate the acquisition of Nortel common shares at a discount. The discount was such that the ESPPs were considered compensatory and the Businesses’ contribution to the ESPPs was recorded as compensation cost on a quarterly basis as the obligation to contribute was incurred. Nortel’s contribution to the ESPPs, as defined in Note 14, has been recorded as compensation expense on a quarterly basis as the obligation to contribute has been incurred.
(r) Recent accounting pronouncements
4. Accounting changes3. Business Combinations
(a) Fair Value MeasurementsRADVISION Ltd.
In September 2006,On June 5, 2012, Avaya acquired Radvision for $230 million in cash. The purchase price was funded with (i) $196 million from the FASB issued ASC 820,proceeds from the issuance of Series B Convertible Preferred Stock and warrants to purchase common stock, and (ii) approximately $34 million of Avaya’s cash.
The acquisition of Radvision has been accounted for under the acquisition method, which establishes a single definitionrequires an allocation of fair value and requires expanded disclosures about fair value measurements. ASC 820 is effective for financial statements issued for fiscal years beginning after November 15, 2007. The Businesses partially adopted the provisionspurchase price of ASC 820 effective January 1, 2008. The effective date for ASC 820 as it relatesthe acquired entity to fair value measurements for non-financialthe assets acquired and liabilities that are not measuredassumed based on their estimated fair values from a market-participant perspective at fair value on a recurring basis was deferred to fiscal years beginning after December 15, 2008 in accordance with ASC 820. The Businesses adopted the deferred portiondate of ASC 820 on January 1, 2009. The adoption of the deferred portion of ASC 820 did not have a material impact on the Businesses’ results of operations and financial condition.acquisition.
(b) Employers’ Accounting for Defined Benefit Pension and Other Post-retirement Plans—An Amendment of FASB Statements No. 87, 88, 106, and 132(R)Acquisitions
In September 2006,During the FASB issued SFAS 158, “Employer’s Accountingsix months ended March 31, 2013 and 2012, the Company completed other acquisitions primarily to enhance the Company’s technology portfolio. The aggregate purchase price of acquisitions completed by the Company was $1 million and $36 million during the six months ended March 31, 2013 and 2012, respectively. These acquisitions have been accounted for Defined Benefit Pensionunder the acquisition method. The acquired technologies and Other Postretirement Plans—An Amendment of FASBother intangible assets associated with these acquisitions were not material.
These unaudited Consolidated Financial Statements No. 87, 88, 106, and 132(R)”, which is now codified as part of FASB ASC 715 “Compensation-Retirement Benefits” (“ASC 715”). ASC 715 requiresinclude the Businesses to measure the funded status of its plans asoperating results of the date of its year end statement of financial position, being December 31. Nortel had historically measured the funded status of its significant plans on September 30. ASC 715 provided two approaches for an employeracquired entities since their respective acquisition dates. The revenues and expenses specific to transitionthese businesses and their pro forma results are not material to a fiscal year end measurement date. Nortel adopted the second approach, whereby Nortel continues to use the measurements determined for the December 31, 2007 fiscal year end reporting to estimate the effects of the transition. Under this approach, the net periodic benefit cost (exclusive of any curtailment or settlement gain or loss) for the period between the earlier measurement date, being September 30, 2007, and the end of the fiscal year that the new measurement date provisions are applied, being December 31, 2008, are allocated proportionately between amounts to be recognized as an adjustment to opening accumulated deficit in 2008 and the net periodic benefit cost for the fiscal year ended December 31, 2008. The adoption did not have a material impact on the Businesses as pension costs are reflected within these combined financial statements on a multiemployer basis. See Note 12 for additional information on the Businesses’ involvement in Nortel’s pension and post-retirement plans.unaudited Consolidated Financial Statements.
(c) Determination of the Useful life of intangible assets
In April 2008, the FASB issued FSP FAS 142-3, “Determination of the Useful Life of4. Goodwill and Intangible Assets” which is now codified as part of FASB ASC 350-30 “General Intangibles Other than Goodwill” (“ASC 350-30”). ASC 350-30 provides guidance with respect to estimating the useful lives of recognized intangible assets and requires additional disclosure related to the renewal or extension of the terms of recognized intangible assets. ASC 350-30 is effective for fiscal years and interim periods beginning after December 15, 2008. The Businesses adopted the provisions of ASC 350-30 on January 1, 2009. The adoption of ASC 350-30 did not have a material impact on the Businesses’ results of operations, financial condition and disclosures.
(d) Collaborative ArrangementsAssets
In September 2007, the FASB Emerging Issues Task Force (“EITF”) reached a consensus on EITF Issue No. 07-1, “Collaborative Arrangements”, which is now codified as FASB ASC 808 “Collaborative Arrangements” (“ASC 808”). ASC 808 addresses the accounting for arrangements in which two companies work together to achieve a common commercial objective, without forming a separate legal entity. The nature and purpose of a company’s collaborative arrangements are required to be disclosed, along with the accounting policies and the classification and amounts for significant financial activities related to the arrangements. Nortel adopted the provisions of ASC 808 on January 1, 2009. The adoption of ASC 808 did not have a material impact on the Businesses’ results of operations and financial condition.
(e) Determining Fair Value when the Volume and Level of Activity for the Asset or Liability have Significantly Decreased and Identifying Transactions that are not Orderly
In April 2009, FASB issued FSP FAS 157-4, “Determining Fair Value when the Volume and Level of Activity for the Asset or Liability have Significantly Decreased and Identifying Transactions that are not Orderly” which is now codified as part of ASC 820. ASC 820 provides additional guidance on determining fair value for a financial asset when the volume or level of activity for that asset or liability has significantly decreased and also assists in identifying circumstances that indicate a transaction is not orderly. An orderly transaction is a transaction that assumes exposure to the market for a period prior to the measurement date to allow for marketing activities that are usual and customary. ASC 820 is effective for interim and annual reporting periods ending after June 15, 2009 and will be applied prospectively. The Businesses adopted the provisions of ASC 820 on June 30, 2009. The adoption of ASC 820 did not have a material impact on the Businesses’ results of operations and financial condition.
(f) Subsequent Events
In June 2009, the FASB issued SFAS No. 165, “Subsequent Events”, which is now codified as FASB ASC 855 “Subsequent Events” (“ASC 855”). ASC 855 requires Management to evaluate subsequent events through the date the financial statements are either issued or available to be issued, depending on the company’s expectation of whether it will widely distribute its financial statements to its shareholders and other financial statement users. Companies are required to disclose the date through which subsequent events have been evaluated. ASC 855 is effective for interim or annual financial periods ending after June 15, 2009. Nortel adopted the provisions of ASC 855 on June 30, 2009. The adoption of ASC 855 did not have a material impact on the Businesses’ results of operations and financial condition.
(g) FASB Accounting Standards Codification and the Hierarchy of Generally Accepted Accounting Principles
In July 2009, the FASB issued SFAS No. 168, “FASB Accounting Standards Codification and the Hierarchy of Generally Accepted Accounting Principles”, which is now codified as FASB ASC 105 “Generally Accepted Accounting Principles” (“ASC 105”). ASC 105 establishes the FASB Accounting Standards Codification as the single source of authoritative U.S. GAAP recognized by the FASB to be applied to nongovernmental entities. Rules and interpretive releases of the SEC under authority of federal securities laws are also sources of authoritative U.S. GAAP for SEC registrants. ASC 105 is effective for financial statements issued for interim and annual periods after September 15, 2009. Nortel adopted the provisions of ASC 105 on September 30, 2009. The adoption of ASC 105 did not have a material impact on the Businesses’ results of operations and financial condition.
5. Reorganization items—net
Reorganization items represent the direct and incremental costs incurred by Nortel related to the Creditor Protection Proceedings such as revenues, expenses such as professional fees directly related to the process of reorganizing the Debtors, realized gains and losses, and provisions for losses resulting from the reorganization and restructuring of the business. Reorganization costs, except the pension adjustments below, are comprised of costs that were specifically attributable to the Businesses as well as shared costs that were allocated based on proportionate headcount and proportionate revenues. The pension adjustments were allocated based on the Businesses’ projected benefit obligations relative to the total projected benefit obligation of the related plans. For the nine months ending September 30, 2009, the Businesses’ reorganization items consisted of the following:
Professional fees(a) | $ | (63 | ) | |
Key Executive Incentive Plan / Key Employee Retention Plan(b) | (16 | ) | ||
Pension adjustments(c) | (28 | ) | ||
Penalties(d) | (24 | ) | ||
Other(e) | (16 | ) | ||
Total reorganization items—net | $ | (147 | ) | |
6. Combined financial statement details
The following tables provide details of selected items presented in the combined statements of operations and cash flows for the nine months ended September 30, 2009 and the year ended December 31, 2008, and the combined balance sheets as of September 30, 2009 and December 31, 2008.
Combined statements of operations
SG&A expense:
SG&A expense includes bad debt expense of $1 and $1 for the nine months ended September 30, 2009 and the year ended December 31, 2008.
Other operating expense (income)—net:
| Nine months ended September 30, 2009 | Year ended December 31, 2008 | |||||||
Royalty license income—net | $ | (10 | ) | $ | (22 | ) | ||
Pension curtailment (Note 12) | 34 | — | ||||||
Other—net | (1 | ) | (1 | ) | ||||
Other operating income—net | $ | 23 | $ | (23 | ) | |||
| �� | ||||||||
Other income (expense)—net:
| Nine months ended September 30, 2009 | Year ended December 31, 2008 | |||||||
Currency exchange gains (losses)—net | $ | (15 | ) | $ | 28 | |||
Other—net | (4 | ) | (9 | ) | ||||
Other income (expense)—net | $ | (19 | ) | $ | 19 | |||
Combined balance sheets
Cash and Cash Equivalents:
| September 30, 2009 | December 31, 2008 | |||||||
Cash on hand and balances with banks | $ | 27 | $ | 34 | ||||
Cash equivalents | 11 | 10 | ||||||
Cash and Cash equivalents at end of the period | $ | 38 | $ | 44 | ||||
Accounts receivable—net:
| September 30, 2009 | December 31, 2008 | |||||||
Trade Receivables | $ | 302 | $ | 440 | ||||
Accrued receivables | 17 | 19 | ||||||
Contracts in progress | 20 | 25 | ||||||
| 339 | 484 | |||||||
Less: provision for doubtful accounts | (25 | ) | (26 | ) | ||||
Less: advance billings | (9 | ) | (32 | ) | ||||
Accounts receivable—net | $ | 305 | $ | 426 | ||||
Inventories—net:
| September 30, 2009 | December 31, 2008 | |||||||
Raw materials | $ | 5 | $ | 11 | ||||
Work in process | 3 | 1 | ||||||
Finished goods | 163 | 140 | ||||||
Deferred Costs | 130 | 218 | ||||||
| 301 | 370 | |||||||
Less: provision for inventories | (59 | ) | (43 | ) | ||||
Inventories—net | 242 | 327 | ||||||
Less: long-term deferred costs(a) | (16 | ) | (43 | ) | ||||
Current inventories—net | $ | 226 | $ | 284 | ||||
Other current assets:
| September 30, 2009 | December 31, 2008 | |||||||
Prepaid expenses | $ | 13 | $ | 8 | ||||
Current investments | 21 | 17 | ||||||
Contract manufacturing receivables | 16 | 11 | ||||||
Other receivables | 13 | 16 | ||||||
Other | — | 2 | ||||||
Other current assets | $ | 63 | $ | 54 | ||||
Investments:
In 2008, the Businesses classified its auction rate securities as available-for-sale within current assets. In October 2008, the Businesses entered into an agreement with the investment firm that originally sold the Businesses its auction rate securities. As a result, the Businesses transferred these auction rate securities from available-for-sale to held-for-trading investment securities in consideration of the terms of such agreement. During 2009, the Businesses held $18 in auction rate securities, which after consideration of partial redemptions throughout the year and the execution of the aforementioned agreement, has been classified as trading securities within other current assets as of September 30, 2009. See Note 15 for more information.
Plant and equipment—net:
| September 30, 2009 | December 31, 2008 | |||||||
Cost: | ||||||||
Machinery and equipment | $ | 166 | $ | 204 | ||||
Assets under capital lease | 46 | 28 | ||||||
| 212 | 232 | |||||||
Less: accumulated depreciation | ||||||||
Machinery and equipment | $ | (124 | ) | $ | (131 | ) | ||
Assets under capital lease | (20 | ) | (4 | ) | ||||
| (144 | ) | (135 | ) | |||||
Plant and equipment—net | $ | 68 | $ | 97 | ||||
Other assets:
| September 30, 2009 | December 31, 2008 | |||||||
Long-term deferred costs | $ | 16 | $ | 43 | ||||
Long-term inventories | 11 | 3 | ||||||
Other assets | $ | 27 | $ | 46 | ||||
Intangible assets—net:
| Acquired technology | Customer relationships | Other intangibles | Total | |||||||||||||
Cost at September 30, 2009 | $ | 45 | $ | 93 | $ | 5 | $ | 143 | ||||||||
Less: accumulated amortization | (28 | ) | (67 | ) | (3 | ) | (98 | ) | ||||||||
Intangible assets—net at September 30, 2009 | $ | 17 | $ | 26 | $ | 2 | $ | 45 | ||||||||
Cost at December 31, 2008 Less accumulated amortization Intangible assets—net at December 31, 2008 Acquired
technology Customer
relationships Other
intangibles Total $ 44 $ 93 $ 4 $ 141 (21 ) (58 ) (1 ) (80 ) $ 23 $ 35 $ 3 $ 61
Intangible assets are being amortized over a weighted-average period of approximately 5 years ending in 2013. Amortization expense for each of the next five years commencing in 2010 is expected to be $11, $10, $9, $9, and $6 respectively.
Other accrued liabilities:
| September 30, 2009 | December 31, 2008 | |||||||
Deferred revenue | $ | 234 | $ | 335 | ||||
Warranty provisions (Note 13) | 43 | 49 | ||||||
Product-related provisions | 23 | 40 | ||||||
Outsourcing and selling, general and administrative related provisions | 25 | 36 | ||||||
Advance billings in excess of revenue recognized to date on contracts(a) | 17 | 10 | ||||||
Customer deposits | 2 | — | ||||||
Other | 17 | 29 | ||||||
Other accrued liabilities | $ | 361 | $ | 499 | ||||
Other liabilities:
| September 30, 2009 | December 31, 2008 | |||||||
Deferred revenue | $ | 34 | $ | 92 | ||||
Restructuring liabilities (Notes 8 and 9) | 3 | 2 | ||||||
Other long-term provisions | 13 | 22 | ||||||
Other liabilities | $ | 50 | $ | 116 | ||||
Combined statements of cash flows
Change in operating assets and liabilities—net:
| Nine months ended September 30, 2009 | Year ended December 31, 2008 | |||||||
Accounts receivable—net | $ | 125 | $ | 58 | ||||
Inventories—net | (6 | ) | 26 | |||||
Deferred costs | 86 | 59 | ||||||
Accounts payable | 26 | (37 | ) | |||||
Payroll and benefit-related, other accrued and contractual liabilities | (143 | ) | (71 | ) | ||||
Deferred revenue | (79 | ) | (156 | ) | ||||
Advance billings in excess of revenues recognized to date on contracts | 7 | (33 | ) | |||||
Restructuring liabilities | 61 | 22 | ||||||
Other | (14 | ) | (5 | ) | ||||
Change in operating assets and liabilities—net | $ | 63 | $ | (137 | ) | |||
Acquisitions of investments and businesses—net of cash acquired:
| Nine months ended September 30, 2009 | Year ended December 31, 2008 | |||||||
Cash acquired | $ | — | $ | — | ||||
Total net assets acquired other than cash | — | (38 | ) | |||||
Total purchase price | — | (38 | ) | |||||
Less: | ||||||||
Cash acquired | — | — | ||||||
Acquisitions of investments and businesses—net of cash acquired | $ | — | $ | (38 | ) | |||
Interest and taxes paid:
| Nine months ended September 30, 2009 | Year ended December 31, 2008 | |||||||
Cash interest paid | $ | 2 | $ | 2 | ||||
Cash taxes paid | $ | — | $ | — | ||||
7. Goodwill
The following table outlines goodwill by reporting unit as such units are defined relative to the Businesses:
| Applications | Data | Voice | NGS | Total | ||||||||||||||||
Balance—as of December 31, 2007 | 114 | 207 | 489 | 171 | 981 | |||||||||||||||
Change: | ||||||||||||||||||||
Additions | — | — | — | — | — | |||||||||||||||
Disposals | — | — | — | — | — | |||||||||||||||
Foreign exchange | — | — | (2 | ) | — | (2 | ) | |||||||||||||
Other | — | — | — | — | — | |||||||||||||||
Impairment | (114 | ) | (207 | ) | (487 | ) | — | (808 | ) | |||||||||||
Balance—as of December 31, 2008 | — | — | — | 171 | 171 | |||||||||||||||
Change: | ||||||||||||||||||||
Additions | — | — | — | — | — | |||||||||||||||
Disposals | — | — | — | — | — | |||||||||||||||
Foreign exchange | — | — | — | — | — | |||||||||||||||
Other | — | — | — | — | — | |||||||||||||||
Impairment | — | — | — | (49 | ) | (49 | ) | |||||||||||||
Balance—as of September 30, 2009 | $ | — | $ | — | $ | — | $ | 122 | $ | 122 | ||||||||||
The application, data and voice reporting units of the Businesses are distinct units within the Enterprise Solutions business and comprise both the product and services aspects of those units.
Goodwill Impairment Testing Policy
Goodwill is not amortized but is subject to periodic testing for impairment in accordance with GAAP at the reporting unit level which is one level below the Company’s operating segments.
The Businesses test goodwill for possible impairment on an annual basis as of October 1 ofis conducted annually each year and at any other timeSeptember 30th or more frequently if an event occursevents occur or circumstances change that would more likely than not reduce the fair value of a reporting unit below its carrying amount. Circumstances
March 31, 2013
During the three months ended March 31, 2013 the Company’s IT professional services (“ITPS”) reporting unit, which provides specialized information technology services exclusively to government customers in the U.S., experienced a decline in revenues as a result of reduced government spending in anticipation of sequestration and budget cuts. Additionally, there is uncertainty regarding how the sequestration cuts will be implemented and the impact they will have on contractors supporting the government. As a result of these events, the Company determined that could trigger an interim impairment test between annual tests include, but are not limited to:
a significant adverse change inof the business climate or legal factors;
an adverse action or assessment by a regulator;
unanticipated competition;
loss of key personnel;
the likelihood that a reporting unit or a significant portion of a reporting unit willunit’s goodwill should be sold or disposed of;performed.
a change in reportable segments;
results of testing for recoverability of a significant asset group within a reporting unit; and
recognition of a goodwill impairment loss in the financial statements of a subsidiary that is a component of a reporting unit.
The impairment test for goodwill is a two-step process. Step one consists of a comparison of the fair value of athe reporting unit with its carrying amount, including the goodwill allocated to thethat reporting unit. The Businesses determineCompany estimated the fair value of itsthe ITPS reporting unitsunit using an income approach; specifically,approach which values the unit based on the future cash flows expected from that reporting unit. Future cash flows are based on forward-looking information regarding market share and costs for the reporting unit and are discounted using an appropriate discount rate. Future discounted cash flows can be affected by changes in industry or market conditions or the rate and extent to which cost savings are realized. In step one of the test, a Discounted Cash Flow (“DCF”) Model. A market approach may also bewas considered but was not used to evaluate the reasonableness of the fair value determined under the DCF Model, but results of the market approach are not given any specific weighting in the final determination of fair value. Both approaches involve significant management judgment
The discounted cash flows model used in the Company’s income approach relies on assumptions regarding revenue growth rates, gross margin, projected working capital needs, selling, general and as a result, estimatesadministrative expenses, research and development expenses, business restructuring costs, capital expenditures, income tax rates, discount rates and terminal growth rates. To estimate fair value, the Company discounts the expected cash flows of value determined under the approaches are subject to changereporting unit. The discount rate Avaya uses represents the estimated weighted average cost of capital, which reflects the overall level of inherent risk involved in relation to evolving market conditionsthe reporting unit’s operations and the Enterpriserate of return an outside investor would expect to earn. To estimate cash flows beyond the final year of its model, Avaya uses a terminal value approach. Under this approach, Avaya uses the estimated cash flows in the final year of its model, applies a perpetuity growth assumption and Government Solutions’ business environment.
Ifdiscounts by a perpetuity discount factor to determine the carrying amount of a reporting unit exceeds its fair value, step two ofterminal value. Avaya incorporates the goodwill impairment test requires the fairpresent value of the reporting unit be allocated to the underlying assets and liabilitiesresulting terminal value into its estimate of that reporting unit, whether or not previously recognized, resulting in the determination of an implied fair value of goodwill. If the carrying amount of the reporting unit goodwill exceeds the implied fair value of that goodwill, an impairment loss equal to the excess is recorded in net earnings (loss).value.
The fair value of each reporting unit is determined using discounted cash flows or other evidence of fair value as applicable. When circumstances warrant, a multiple of earnings before interest, taxes, depreciation and amortization (“EBITDA”) of each reporting unit is calculated and compared to market participants to corroborate the results of the calculated fair value (“EBITDA Multiple Model”). The following are the significant assumptions involved in the application of each valuation approach:
|
|
2009 Goodwill Assessment
During the first quarter of 2009, in accordance with the provisions of FASB ASC 350 “Intangibles—Goodwill and Other” (“ASC 350”), the Businesses concluded that events had occurred and circumstances had changed that required it to perform an interim period goodwill impairment test for the reporting unit in NGS.
Given the nature of the business operations and the decline in the economic outlook, management decided to place significant weighting on the results of the DCF model in establishing the fair value of this reporting unit. The decision was based on a lack of direct comparable companies. The results from step one of the two-step goodwill impairment test indicated that the estimated fair value of NGS was less than the carrying value of its net assets and as such the Businesses performed step two of the impairment test for this reporting unit.
In step two of the impairment test, the Businesses were required to measure the potential impairment loss by allocating the estimated fair value of the reporting unit, as determined in step one, to the reporting unit’s recognized and unrecognized assets and liabilities, with the residual amount representing the implied fair value of goodwill and, to the extent the implied fair value of goodwill was less than the carrying value, an impairment loss was recognized. As such, the step two test required the Businesses to perform a theoretical purchase price allocation for NGS to determine the implied fair value of goodwill as of the evaluation date. In accordance with the guidance in ASC 350, the Businesses completed a preliminary assessment of the expected impact of the step two tests using reasonable estimates for the theoretical purchase price allocation and recorded a preliminary goodwill impairment charge of approximately $49. The Businesses finalized the goodwill assessment during the second quarter of 2009 and as a result recorded no additional goodwill impairment charge.
During the second quarter of 2009, the Businesses tested the long-lived asset groups for recoverability in accordance with ASC 360 “Accounting for the Impairment or Disposal of Long-Lived Assets” (“ASC 360”). Testing a significant asset group within the NGS reporting unit for recoverability constituted a triggering event under ASC 350 requiring an impairment test for goodwill. The Businesses concluded that the existence and evaluation of this triggering event did not result in the recognition of additional goodwill impairment in the period because assumptions in respect of the NGS reporting unit have not changed materially since March 31, 2009.
During the third quarter of 2009, no triggering events occurred that would require the Businesses to test the remaining goodwill for impairment.
2008 Goodwill Assessment
In 2008, in accordance with the provisions of ASC 350, the Businesses concluded that estimated revenues would decline as a result of the economic downturn and the unfavorable impact of foreign exchange fluctuations thereby requiring the Businesses to perform an interim period goodwill impairment test for its application, data and voice reporting units of Enterprise Solutions.
As part of its goodwill impairment test, the Businesses updated itsCompany forecasted cash flows for each of itsthe ITPS reporting units. This update consideredunit and took into consideration current economic conditions and trends, estimated future operating results, the Businesses’Avaya’s view of growth rates and anticipated future economic conditions.conditions applicable to the ITPS reporting unit. Revenue growth rates inherent in this forecast are based on input from internal and external market intelligence research sources that compare factors such as growth in global economies, regional trends in the telecommunications industry and product evolution from a technological segment basis.sources. Macro economic factors such as changes in economies, product evolutions, industry consolidations and other changes beyond the Businesses’Avaya’s control could have a positive or negative impact on ITPS achieving its targets.
The results fromof step one of the two-step goodwill impairment test of each reporting unit indicated that the estimated fair valuesvalue of the application, data and voiceITPS reporting units wereunit was less than the respective carrying valuesvalue of theirits net assets (including goodwill) and as such, the BusinessesCompany performed step two of the impairment test. The second step of the impairment test for thesecompares the implied fair value of the reporting units.unit’s goodwill with the carrying value of that goodwill. If the carrying amount of the reporting unit’s goodwill exceeds the implied fair value of the goodwill, an impairment loss is recognized in an amount equal to that excess. The implied fair value is determined in the same manner as the amount of goodwill recognized in a business combination. That is, the fair value of the reporting unit is allocated to all of the assets and liabilities of that unit as if the reporting unit had been acquired in a business combination and the fair value of the reporting unit was the purchase price paid to acquire the reporting unit.
InThis allocation is performed only for purposes of assessing goodwill for impairment; accordingly Avaya did not adjust the net book value of the assets and liabilities on its Consolidated Balance Sheets other than goodwill as a result of this process.
As a result of the application of step two of the goodwill impairment test, the BusinessesCompany estimated the implied fair value of the goodwill of each of these reporting units andto be $44 million as compared it to thewith a carrying value of $133 million and
recorded an impairment to goodwill of $89 million associated with the goodwillITPS reporting unit within the Avaya Global Services segment. This fair value measurement is considered a nonrecurring level 3 measurement pursuant to the accounting guidance for eachfair value measurements.
The impairment was primarily the result of the application, datacontinued budgetary constraints, sequestration and voiceuncertainty regarding spending on the part of the U.S. government. The reduced valuation of the reporting units. Specifically,unit reflects additional market risks and lower sales forecasts for the Businesses allocatedreporting unit, which is consistent with economic trends at that time.
The Company determined that no events occurred or circumstances changed during the six months ended March 31, 2013 that would more likely than not reduce the fair value of the application, data and voice
its other reporting units as determinedbelow their respective carrying amounts. However, if market conditions deteriorate, it may be necessary to record impairment charges in the first step to their respective recognized and unrecognized net assets, including allocations to identified intangible assets. The allocations of fair values of the application, data and voice reporting units also require the Businesses to make significant estimates and assumptions, including those in determining the fair values of the identified intangible assets. Such intangible assets had fair values substantially in excess of current book values. The resulting implied goodwill for each of these reporting units was nil; accordingly, the Businesses reduced the goodwill recorded prior to the assessment by $808 to write down the goodwill related to application, data and voice reporting units to the implied goodwill amount.
The NGS reporting unit was tested for impairment on October 1, 2008 and no impairment was recognized.future.
Related AnalysesMarch 31, 2012
In 2008 and 2009, priorDuring the six months ended March 31, 2012, the Company experienced a decline in revenue as compared to the goodwill analysis discussed above,same period of the Businesses performedprior year and sequential quarters. This revenue decline impacted the Company’s forecasts for the remainder of fiscal 2012. As a recoverabilityresult of these events, the Company determined that an interim impairment test of its long-lived assets in accordance with ASC 360-10-35. The Businesses included cash flow projections from operations along with cash flows associated with the eventual disposition of specific asset groupings and compared those aggregate cash flows with the respective carrying values. No impairment charges were recorded as a result of this testing.goodwill should be performed.
8. Pre-Petition Date cost reduction plans
As a resultThe estimated fair value of each reporting unit at March 31, 2012 reflected the additional market risks, lower discount rates and the updated sales forecasts for the Company’s reporting units based off recent results. Using the revised valuations at March 31, 2012 the results of step one of the Creditor Protection Proceedings, Nortel ceased taking any further actions undergoodwill impairment test indicated that although the previously announced workforce and cost reduction plans asestimated fair values of January 14, 2009. Any revisionseach reporting unit were lower at March 31, 2012 when compared to actions taken up to that date under previously announced workforce and cost reduction plans will continue to be accounted for under such plans, and will be classified in cost of revenues, SG&A and R&D as applicable. Any remaining actions under these plans will be accounted for under the workforce reduction plan announced on February 25, 2009 (see Note 9). Nortel’s contractual obligations are subject to re-evaluation in connection with the Creditor Protection Proceedings and, as a result, expected cash outlays disclosed below relating to contract settlement and lease costs are subject to change. As well, Nortel is not following its pre-Petition Date practices with respect to the payment of severance in jurisdictions under the Creditor Protection Proceedings.
On November 10, 2008, Nortel announced a restructuring plan that included net workforce reductions related to the Businesses and shifting additional positions from higher-cost to lower-cost locations (collectively “November 2008 Restructuring Plan”). As of December 31, 2008 approximately $8 of the total charges incurred related to the net reduction of 93 positions under the November 2008 Restructuring Plan. There were no significant workforce reductions under this plan after December 31, 2008 and prior to its discontinuance on January 14, 2009.
During the first quarter of 2008, Nortel announced a restructuring plan that included net workforce reductions related to the Businesses and shifting additional positions from higher-cost to lower-cost locations. In addition to the workforce reductions, Nortel announced steps to achieve additional cost savings by efficiently managing its various business locations and further consolidating real estate requirements (collectively, “2008 Restructuring Plan”). As of December 31, 2008, approximately $43 of the total charges incurred related to the net reduction of approximately 621 positions and real estate reduction initiatives under the 2008 Restructuring Plan. There were no significant workforce reductions under this plan after December 31, 2008 and prior to its discontinuance on January 14, 2009. The real estate provision of $3 and $2 at September 30, 20092011, their respective book values did not exceed their estimated fair values and December 31, 2008, respectively, relates to discounted cash outlays, net of estimated future sublease revenues, for leases with payment terms through to 2013 related to the Businesses.
During the first quarter of 2007, Nortel announced a restructuring plan that included workforce reductions related to the Businesses. In addition to the workforce reductions, Nortel announced steps to achieve additional cost savings by efficiently managing its various business locations and consolidating real estate requirements (collectively, “2007 Restructuring Plan”). As of December 31, 2008 approximately $11 of the total charges incurred related the net reduction of approximately 140 positions and real estate reduction initiatives under the 2007 Restructuring Plan. There weretherefore no significant workforce reductions under this plan after December 31,
2008 and prior to its discontinuance on January 14, 2009. The real estate provision of $1 and $1 at September 30, 2009 and December 31, 2009, respectively, relates to discounted cash outlays net of estimated future sublease revenues for leases with payment terms through to 2016.
During 2006, 2004 and 2001, the Businesses implemented work plans impacting the Businesses to streamline operations through workforce reductions and real estate optimization strategies (“2006 Restructuring Plan”, “2004 Restructuring Plan” and “2001 Restructuring Plan”). All of the charges with respect to these workforce reductions have been incurred.
During the nine months ended September 30, 2009 and the year ended December 31, 2008, changes to the Businesses’ provision balances were as follows:
| Workforce reduction | Contract settlement and lease costs | Total | ||||||||||
November 2008 Restructuring Plan | ||||||||||||
Provision balance as of December 31, 2007 | $ | — | $ | — | $ | — | ||||||
Current period charges | 8 | — | 8 | |||||||||
Cash payment funded by Nortel | (2 | ) | — | (2 | ) | |||||||
Provision balance as of December 31, 2008 | $ | 6 | $ | — | $ | 6 | ||||||
Current period charges | — | 1 | 1 | |||||||||
Revisions to prior accruals | (1 | ) | — | (1 | ) | |||||||
Cash payment funded by Nortel | 1 | — | 1 | |||||||||
Provision balance as of September 30, 2009 | $ | 6 | $ | 1 | $ | 7 | ||||||
2008 Restructuring Plan | ||||||||||||
Provision balance as of December 31, 2007 | $ | — | $ | — | $ | — | ||||||
Current period charges | 39 | 4 | 43 | |||||||||
Revisions to prior accruals | (1 | ) | — | (1 | ) | |||||||
Cash payment funded by Nortel | (23 | ) | (2 | ) | (25 | ) | ||||||
Provision balance as of December 31, 2008 | $ | 15 | $ | 2 | $ | 17 | ||||||
Current period charges | — | — | — | |||||||||
Revisions to prior accruals | (3 | ) | — | (3 | ) | |||||||
Cash payment funded by Nortel | (3 | ) | 1 | (2 | ) | |||||||
Provision balance as of September 30, 2009 | $ | 9 | $ | 3 | $ | 12 | ||||||
2007 Restructuring Plan | ||||||||||||
Provision balance as of December 31, 2007 | $ | 3 | $ | — | $ | 3 | ||||||
Current period charges | 1 | 1 | 2 | |||||||||
Cash payment funded by Nortel | (3 | ) | — | (3 | ) | |||||||
Provision balance as of December 31, 2008 | $ | 1 | $ | 1 | $ | 2 | ||||||
Current period charges | — | — | — | |||||||||
Cash payment funded by Nortel | — | — | — | |||||||||
Provision balance as of September 30, 2009 | $ | 1 | $ | 1 | $ | 2 | ||||||
2006 Restructuring Plan | ||||||||||||
Provision balance as of December 31, 2007 | $ | — | $ | — | $ | — | ||||||
Current period charges | — | — | — | |||||||||
Cash payment funded by Nortel | — | — | — | |||||||||
Provision balance as of December 31, 2008 | $ | — | $ | — | $ | — | ||||||
Current period charges | — | — | — | |||||||||
Cash payment funded by Nortel | — | — | — | |||||||||
Provision balance as of September 30, 2009 | $ | — | $ | — | $ | — | ||||||
Total provision balance as of September 30, 2009 (a) | $ | 16 | $ | 5 | $ | 21 | ||||||
During the nine months ended September 30, 2009 and the year ended December 31, 2008, total charges specifically related to Enterprise and Government Solutions were ($5) and $53, respectively.
During the nine months ended September 30, 2009 recovery by profit and loss category specifically related to Enterprise and Government Solutions was as follows:
Cost of revenues | $ | (1 | ) | |
SG&A | (1 | ) | ||
R&D | (3 | ) | ||
Total recovery | $ | (5 | ) | |
In addition, during the nine months ended September 30, 2009 and the year ended December 31, 2008, total charges (recovery) related to contract settlement and lease costs allocated to the Businesses based on headcount of Enterprise and Government Solutions’ employees were ($2) and $32, respectively. Furthermore, these combined financial statements include an allocation of charges pertaining to restructuring activities related to shared employees that provide benefits to multiple Nortel businesses of ($2) and $29 for the nine months ended September 30, 2009 and the year ended December 31, 2008, respectively.
A significant portion of the Businesses’ provisions for workforce reductions and contract settlement and lease costs is associated with shared services. These costs have been allocated to the Businesses based generally on headcount and revenue.
9. Post-Petition Date cost reduction activities
In connection with the Creditor Protection Proceedings, Nortel has commenced certain workforce and other cost reduction activities and will undertake further workforce and cost reduction activities during this process, including related to the Businesses. The actions related to these activities are expected to occur as they are identified. The following current estimated charges are based upon accruals made in accordance with U.S. GAAP. The current estimated total charges and cash outlays are subject to change as a result of Nortel’s ongoing review of applicable law. In addition, the current estimated total charges to earnings and cash outlays do not reflect all potential claims or contingency amounts that may be allowed under the Creditor Protection Proceedings and thus are also subject to change.impairment existed.
Workforce Reduction ActivitiesIntangible Assets
On February 25, 2009, Nortel announced a workforce reduction planIntangible assets include acquired technology, customer relationships, trademarks and trade-names and other intangibles. Intangible assets with finite lives are amortized using the straight-line method over the estimated economic lives of the assets, which range from five years to reduce its global workforce by approximately 5,000 net positions which, upon completion, is currently expected to result in total charges to earnings of approximately $270 and total cash outlays of approximately $160.fifteen years.
For the nine months endedAcquired technology and patents do not include capitalized software development costs. Unamortized capitalized software developments costs of $45 million at March 31, 2013 and $51 million at September 30, 2009, the Businesses recorded allocated charges of $78 associated with the workforce reduction that2012 are included approximately 2,450 employees of the Businesses, all of whom were notified of termination or voluntarily terminated during the period. The workforce reduction was primarilyin other assets in the U.S. and Canada.
During the nine months ended September 30, 2009, changes to the provision balance were as follows:
| Workforce reduction (a) | ||||
Provision balance as of December 31, 2008 | $ | — | ||
Current period charges | 78 | |||
Revisions to prior accruals | — | |||
Cash drawdowns | (14 | ) | ||
Non-cash drawdowns | — | |||
Foreign exchange and other adjustments | — | |||
Provision balance as of September 30, 2009 | $ | 64 | ||
During the nine months ended September 30, 2009, workforce reduction charges specifically related to Enterprise and Government Solutions were reclassified as follows:
Cost of revenues | $ | 26 | ||
SG&A | 38 | |||
R&D | 14 | |||
Total charges | $ | 78 | ||
In addition, during the nine months ended September 30, 2009, total workforce reduction charges related to contract settlement and lease costs allocated to the Businesses based on headcount of Enterprise and Government Solutions’ employees were nil. Furthermore, these combined financial statements include an allocation of charges pertaining to restructuring activities related to shared employees that provide benefits to multiple Nortel businesses of $19 for the nine months ended September 30, 2009.Company’s Consolidated Balance Sheet.
These costs have been allocated based generally on headcount and revenue.
Other Cost Reduction Activities
During the nine months ended September 30, 2009, includedLong-lived assets, including intangible assets with finite lives, are reviewed for impairment whenever events or changes in these combined financial statements are plant and equipment write downs of nil.
During the nine months ended September 30, 2009, in these combined financial statements are pension curtailment and other pension related expenses of $7. Refer to Note 12, “Employee benefit plans,” for further discussion.
10. Income taxes
During the nine months ended September 30, 2009, the Businesses recorded a tax recovery of $1 on loss from operations before income taxes of $754. The tax recovery of $1 was comprised of $1 of income taxes in profitable jurisdictions and $3 of income tax expense resulting from increases in uncertain tax positions and $5 of deferred tax recovery related to NGS.
During the year ended December 31, 2008, the Businesses recorded a tax expense of $6 on loss from operations before income taxes of $1,420.
Under the method of accounting for income taxes described in Note 3, the Businesses assessed its deferred tax assets and the need for a valuation allowance on a separate return basis, and excluded from that assessment
the utilization of all or a portion of those losses incurred by Nortel under the separate return method. This assessment requires considerable judgment on the part of management with respect to the benefits that could be realized from future taxable income, as well as other positive and negative factors. For purposes of the valuation allowance assessment, the Enterprise and Government Solutions businesses have incurred losses. During the third and fourth quarters of 2008 the expanding global economic downturn dramatically worsened, and in January 2009, the Debtors commenced the Creditor Protection Proceedings. In assessing the need for valuation allowances against their deferred tax assets for the year ended December 31, 2008, the Businesses considered the negative effect of these events on their revised modeled forecasts and the resulting increased uncertainty inherent in these forecasts. The Businesses determined that there was significant negative evidence against and insufficient positive evidence to support a conclusioncircumstances indicate that the Businesses’ net deferred taxcarrying amount of such assets weremay not be recoverable. Intangible assets determined to have indefinite useful lives are not amortized but are tested for impairment annually, or more likely than not to be realizedfrequently if events or changes in future tax years in all tax jurisdictions. Therefore, a full valuation allowance was necessary against the Businesses’ net deferred tax assets in 2008. These factors continue to support the Businesses conclusioncircumstances indicate that as of September 30, 2009 a full valuation allowance continues to be necessary against the Businesses’ deferred tax assets in all jurisdictions.
In accordance with ASC 740, the Businesses recognized the tax benefit from an uncertain tax position only if it is more likely than not that the tax position willasset is impaired.
Certain of the Company’s trademarks and trade names are expected to generate cash flow indefinitely. Consequently, these assets are classified as indefinite-lived intangibles.
March 31, 2013
Prior to the goodwill testing discussed above, the Company tested the intangible assets and other long-lived assets of the ITPS reporting unit for impairment during the six months ended March 31, 2013 and no impairment was identified. The Company determined that no events had occurred or circumstances changed during the six months ended March 31, 2013 that would indicate that the intangible assets and long-lived assets of its other reporting units may not be sustained on examination byrecoverable.
March 31, 2012
Prior to the taxing authorities,goodwill testing discussed above, the Company tested its intangible assets with indefinite lives and other long-lived assets as of March 31, 2012. Using the revised forecasts as of March 31, 2012, the Company performed step one of the impairment test of long-lived assets with finite lives and determined that the carrying amount of these assets was recoverable and, therefore, no impairment was identified. GAAP requires that the fair value of intangible assets with indefinite lives be compared to the carrying value of those assets. In situations where the carrying value exceeds the fair value of the intangible asset, an impairment loss equal to the difference is recognized. The Company estimates the fair value of its indefinite-lived intangible assets using an income approach; specifically, based on discounted cash flows. Although the technical meritsestimated fair values of the position. AllCompany’s tradenames and trademarks were lower at March 31, 2012 when compared to September 30, 2011, their respective book values did not exceed their estimated fair values and therefore no impairment existed.
5. Supplementary Financial Information
Consolidated Statements of Operations Information
| Six months ended March 31, | ||||||||
In millions | 2013 | 2012 | ||||||
OTHER INCOME (EXPENSE), NET | ||||||||
Interest income | $ | 1 | $ | 2 | ||||
Gain (loss) on foreign currency transactions | 15 | (12 | ) | |||||
Third party fees incurred in connection with debt modifications | (18 | ) | — | |||||
Venezuela hyperinflationary and devaluation charges | (1 | ) | — | |||||
Change in fair value of Preferred Series B embedded derivative | 8 | — | ||||||
Securities registration fees | — | (3 | ) | |||||
Other, net | (1 | ) | (3 | ) | ||||
|
|
|
| |||||
Total other income (expense), net | $ | 4 | $ | (16 | ) | |||
|
|
|
| |||||
6. Business Restructuring Reserve and Programs
Fiscal 2013 Restructuring Program
The Company continued to identify opportunities to streamline operations and generate cost savings which included exiting facilities and eliminating employee positions. During the six months ended March 31, 2013, the Company recognized restructuring charges of $102 million, net. These charges included employee separation costs of $80 million primarily associated with employee severance actions in Europe, the Middle East and Africa (“EMEA”) and the U.S. The EMEA approved plan provides for the elimination of 234 positions and resulted in a charge of $47 million. The elimination of employee positions identified in this action and the related payments are expected to be completed in fiscal 2015. The separation charges include, but are not limited to, social pension fund payments and health care and unemployment insurance costs to be paid to or on behalf of the Businesses’ uncertain tax positions remain with Nortel. The Businesses recorded a tax expense of $3 for the nine months ended September 30, 2009, and $3 for the year ended December 31, 2008, associated with the movement in uncertain tax positions.
During 2007 and 2008, Nortel requested new bilateral APAs for tax years 2007 through at least 2010 (“2007-2010 APA”), for Canada, the U.S. and France, with a request for rollbackimpacted employees. A voluntary program offered to 2006certain management employees in the U.S. resulted in the elimination of 195 positions and Canada, following methods generally similarresulted in a charge of $9 million, for which the related payments are expected to those under negotiation for 2001 through 2005. During the nine months ended September 30, 2009 the Canadian tax authority requested that Nortel rescind its 2007-2010 application as a result of the uncertain commercial environment.be completed in fiscal 2013.
Although NortelRestructuring charges also include $17 million of lease obligations primarily related to the Company’s Maidenhead, United Kingdom and Highlands Ranch, Colorado facilities. The future rental payments, net of estimated sublease income, related to operating lease obligations for unused space in connection with the closing or consolidation of facilities during fiscal 2013 are expected to continue through fiscal 2021.
As the Company continues to apply the transfer pricing methodology that was requested in the 2007-2010 APA, the ultimate outcome is uncertainevaluate and the ultimate reallocation of losses cannotidentify additional operational synergies, additional cost saving opportunities may be determined at this time. There could be a further material shift in historical earnings between the above mentioned parties, particularly the U.S. and Canada. If these matters are resolved unfavorably, they could have a material effect on the Businesses’ consolidated financial position, results of operations and/or cashflows.identified.
The following is a reconciliation of income taxes, calculated at the Canadian combined federal and provincial income tax rate, to the income tax recovery (expense) included in the combined statements of operations for the nine months ended September 30, 2009 and the year ended December 31, 2008:
| Nine months ended September 30, 2009 | Year ended December 31, 2008 | |||||||
Income taxes recovery at Canadian rates (2009—31.8%, 2008—31.4%) | $ | 238 | $ | 446 | ||||
Difference between statutory and other tax rates | 8 | 58 | ||||||
Valuation allowances on tax benefits | (226 | ) | (189 | ) | ||||
Non-deductible impairment of goodwill | (13 | ) | (314 | ) | ||||
Adjustments to provisions and reserves | (3 | ) | (3 | ) | ||||
Impact of non-deductible items and other differences | (3 | ) | (4 | ) | ||||
Income tax recovery (expense) | $ | 1 | $ | (6 | ) | |||
Income tax expense: | ||||||||
Current | $ | (4 | ) | $ | (8 | ) | ||
Deferred | 5 | 2 | ||||||
Income tax recovery (expense) | $ | 1 | $ | (6 | ) | |||
The following table showssummarizes the significant components included in deferred income taxes as of September 30, 2009 and Decemberthe fiscal 2013 restructuring program during the six months ended March 31, 2008:2013:
| September 30, 2009 | December 31, 2008 | |||||||
Assets: | ||||||||
Deferred revenue | $ | 63 | $ | 87 | ||||
Provisions and reserves | 14 | 22 | ||||||
Plant and equipment | 60 | 54 | ||||||
Other | 17 | 14 | ||||||
Valuation allowance | (137 | ) | (166 | ) | ||||
| $ | 17 | $ | 11 | |||||
Liabilities: | ||||||||
Intangible assets | (17 | ) | (16 | ) | ||||
Net deferred income tax assets/(liabilities) | $ | — | $ | (5 | ) | |||
In millions | Employee Separation Costs | Lease Obligations | Total | |||||||||
2013 restructuring charges | $ | 80 | $ | 17 | $ | 97 | ||||||
Cash payments | (23 | ) | (1 | ) | (24 | ) | ||||||
Impact of foreign currency fluctuations | (1 | ) | (1 | ) | (2 | ) | ||||||
|
|
|
|
|
| |||||||
Balance as of March 31, 2013 | $ | 56 | $ | 15 | $ | 71 | ||||||
|
|
|
|
|
| |||||||
Information regarding net tax loss carryforwardsFiscal 2012 Restructuring Program
During fiscal 2012, the Company identified opportunities to streamline operations and non-refundable investment tax credits has not been providedgenerate cost savings which include exiting facilities and eliminating employee positions. Restructuring charges associated with these initiatives include employee separation costs primarily associated with employee severance actions in Germany, as well as the table above byUS, EMEA excluding Germany, and Canada. Employee separation charges included $70 million related to an agreement reached with the Businesses as such information is not consideredworks council representing employees of certain of Avaya’s German subsidiaries for the elimination of 327 positions. The headcount reductions identified in this action are expected to be meaningful. As previously indicated,completed in fiscal 2013 with the amounts above have been calculatedrelated payments to be completed in fiscal 2014. The payments include, but are not limited to, social pension fund payments and health care and unemployment insurance costs to be paid to or on behalf of the separate return basis of accounting.affected employees. The payments related to the headcount reductions for the other actions taken, globally, excluding Germany, are expected to be completed in fiscal 2014.
The Businesses have not providedCompany initiated a plan to dispose of a Company owned facility in Munich, Germany and relocate to a new facility. Accordingly, the Company wrote the value of this asset down to its net realizable value of $3 million and had reclassified this asset as held for foreign withholding taxes or deferred income tax liabilities for temporary differences related to the undistributed earnings of foreign operations since the Businesses do not currently expect to repatriate earnings that would create any material tax consequences. It is not practical to reasonably estimate the amount of additional deferred income tax liabilities or foreign withholding taxes that may be payable should these earnings be distributed in the future.
sale. During the thirdfirst quarter of 2009,fiscal 2013, the U.S. Debtors filed an objection to a claim filed by the Internal Revenue Service (“IRS”) on August 20, 2009. The IRS claim asserts an unsecured priority claim against NNICompany sold this facility for the tax years 1998-2007, for income taxes due in the amount of approximately $1,805, and interest to the Petition Date in the amount of approximately $1,163 for an aggregate amount of approximately $2,968 (IRS Claim), and an unsecured non-priority claim for penalties (including interest thereon) to August 20, 2009 in the amount of approximately $49 for a total claim of approximately $3,017. The IRS Claim also includes an unassessed, unliquidated and contingent U.S. federal FICA withholding tax claim. On October 13, 2009, the U.S. Debtors obtained an order approving a stipulation between NNI and the IRS pursuant to which the IRS waived its claims against certain assets of the Enterprise Solutions business in exchange for NNI’s acknowledgement of a claim in favor of the IRS for not less than $9.8 and a lien against certain proceeds of the ES sale for such amount. The stipulation reserved all rights of both NNI and the IRS in respect of all other aspects of the IRS Claim.
11. Acquisitions, divestitures and closuresnet realizable value.
The following table sets out certain information forsummarizes the acquisitions completed by Nortel that are relevant tocomponents of the Businesses in 2008. No acquisitions related to the Businesses occurredfiscal 2012 restructuring program during the ninesix months ended September 30, 2009. All of these acquisitions were accounted for using the purchase method. The combined financial statements include the operating results of each of these Businesses as of their respective dates of acquisition.March 31, 2013:
Acquisition | Closing Date | Purchase Price | Goodwill | Acquired Technology | Other Intangibles | Net Tangible Assets (Liabilities) | ||||||||||||||||||
Pingtel (a) | 8-Aug-08 | $ | 6 | $ | — | $ | 6 | $ | — | $ | — | |||||||||||||
Diamondware Ltd. (b) | 19-Aug-08 | $ | 5 | $ | — | $ | 3 | $3 | $ | — | ||||||||||||||
In millions | Employee Separation Costs | Lease Obligations | Total | |||||||||
Balance as of October 1, 2012 | $ | 58 | $ | 12 | $ | 70 | ||||||
Cash payments | (30 | ) | (2 | ) | (32 | ) | ||||||
Adjustments(1) | (1 | ) | 2 | 1 | ||||||||
|
|
|
|
|
| |||||||
Balance as of March 31, 2013 | $ | 27 | $ | 12 | $ | 39 | ||||||
|
|
|
|
|
| |||||||
|
|
12. Employee benefit plansFiscal 2008 through 2011 Restructuring Programs
During fiscals 2008 through 2011, the Company identified opportunities to streamline operations and generate cost savings which included exiting facilities and eliminating employee positions. The payments related to the headcount reductions identified in those programs are expected to be completed in fiscal 2018. Future rental payments, net of estimated sublease income, related to operating lease obligations for unused space in connection with the closing or consolidation of facilities are expected to continue through fiscal 2021.
The following table aggregates the remaining components of the fiscal 2008 through 2011 restructuring programs during the six months ended March 31, 2013:
In millions | Employee Separation Costs | Lease Obligations | Total | |||||||||
Balance as of October 1, 2012 | $ | 13 | $ | 52 | $ | 65 | ||||||
Cash payments | (7 | ) | (7 | ) | (14 | ) | ||||||
Adjustments (1) | (1 | ) | — | (1 | ) | |||||||
Impact of foreign currency fluctuations | — | (1 | ) | (1 | ) | |||||||
|
|
|
|
|
| |||||||
Balance as of March 31, 2013 | $ | 5 | $ | 44 | $ | 49 | ||||||
|
|
|
|
|
| |||||||
Included in adjustments are changes in estimates, whereby all increases and decreases in costs related to the fiscal 2009 through 2011 restructuring programs are recorded to the restructuring charges line item in operating expenses in the period of the adjustment. Included in adjustments are changes in estimates whereby all increases in costs related to the fiscal 2008 restructuring reserve are recorded in the restructuring charges line item in operating expenses in the period of the adjustments and decreases in costs are recorded as adjustments to goodwill.
7. Financing Arrangements
In connection with the Merger, on October 26, 2007, Avaya Inc. entered into financing arrangements consisting of a senior secured credit facility, a senior unsecured credit facility, which later became senior unsecured notes, and a senior secured multi-currency asset-based revolving credit facility, certain of which arrangements were amended on December 18, 2009 in connection with the acquisition of NES and amended on February 11, 2011 in connection with a debt refinancing. During the six months ended March 31, 2013, Avaya Inc. completed a series of transactions which allowed Avaya Inc. to refinance term loans under its senior secured credit facility that originally matured October 26, 2014 and to refinance $1,384 million of senior unsecured notes that originally matured on November 1, 2015.
During the three months ended December 31, 2012, Avaya Inc. completed three transactions to refinance $848 million of term loans under its senior secured credit facility, which were (1) an amendment and restatement of the senior secured credit facility and the senior secured multi-currency asset-based revolving credit facility on October 29, 2012 along with the extension of the maturity date of $135 million aggregate principal amount of senior secured term B-1 loans (the “term B-1 loans”) by converting such loans into a new tranche of senior secured term B-4 loans (the “term B-4 loans”), (2) an amendment and restatement of the senior secured credit facility on December 21, 2012 along with the extension of the maturity date of $713 million aggregate principal amount of term B-1 loans and $134 million aggregate principal amount of term B-4 loans, in each case, by converting such loans into a new tranche of senior secured term B-5 loans (the “term B-5 loans”) and (3) the issuance on December 21, 2012 of $290 million of 9% senior secured notes due April 2019, the net proceeds of which were used to repay $284 million of term B-5 loans.
During the three months ended March 31, 2013, Avaya Inc. refinanced the remaining $584 million of term B-1 loans outstanding under its senior secured credit facility with cash proceeds from the issuance of $589 million aggregate principal amount of term B-5 loans under the senior secured credit facility.
Additionally, during the three months ended March 31, 2013, Avaya Inc. refinanced $1,384 million of senior unsecured notes, through (1) amendments to the senior secured credit facility and the senior secured multi-currency asset-based revolving credit facility permitting the refinancing of the 9.75% senior unsecured notes due 2015 and 10.125%/10.875% senior unsecured paid-in-kind (“PIK”) toggle notes due 2015 (collectively, the “Old Notes”) with indebtedness secured by a lien on certain collateral on a junior-priority basis and (2) the exchange of $1,384 million of Old Notes for $1,384 million of 10.50% senior secured notes due 2021.
Long-term debt consists of the following:
In millions | March 31, 2013 | September 30, 2012 | ||||||
Senior secured term B-1 loans | $ | — | $ | 1,434 | ||||
Senior secured term B-3 loans | 2,139 | 2,152 | ||||||
Senior secured term B-4 loans | 1 | — | ||||||
Senior secured term B-5 loans | 1,148 | — | ||||||
7% senior secured notes | 1,009 | 1,009 | ||||||
9% senior secured notes | 290 | — | ||||||
10.50% senior secured notes | 1,384 | — | ||||||
9.75% senior unsecured cash pay notes due 2015 | 58 | 700 | ||||||
10.125%/10.875% senior unsecured PIK toggle notes due 2015 | 92 | 834 | ||||||
Unaccreted discount | (18 | ) | (8 | ) | ||||
|
|
|
| |||||
| 6,103 | 6,121 | |||||||
Debt maturing within one year | (35 | ) | (37 | ) | ||||
|
|
|
| |||||
Long-term debt | $ | 6,068 | $ | 6,084 | ||||
|
|
|
| |||||
Senior Secured Credit Facility
Prior to the fiscal 2013 refinancing transactions, the senior secured credit facility consisted of (a) a senior secured multi-currency revolver allowing for borrowings of up to $200 million, (b) term B-1 loans with an outstanding principal amount as of September 30, 2012 of $1,434 million, and (c) senior secured term B-3 loans (the “term B-3 loans”) with an outstanding principal amount as of September 30, 2012 of $2,152 million.
On October 29, 2012, Avaya Inc., Citibank, N.A. and the lenders party thereto entered into Amendment No. 4 to Credit Agreement pursuant to which the senior secured credit facility was amended and restated in its entirety (as so amended and restated, the “Cash Flow Credit Agreement”). The modified terms of the Cash Flow Credit Agreement included (1) an amendment which allowed Avaya Inc. to extend the maturity of a portion of the term B-1 loans representing outstanding principal amounts of $135 million from October 26, 2014 to October 26, 2017 (potentially springing to July 26, 2015, under the circumstances described below) by converting such loans into a new tranche of term B-4 loans, (2) permission to issue Incremental Replacement Secured Notes and Junior Secured Debt as described below under the heading “Senior Secured Asset-Based Credit Facility” (except, pursuant to the Cash Flow Credit Agreement, such Incremental Replacement Secured Notes and Junior Secured Debt must be secured by a lien on the Collateral (as defined in the Cash Flow Credit Agreement) ranking junior to the lien securing the obligations under the Cash Flow Credit Agreement) and (3) permission to issue indebtedness to refinance a portion of the term loans outstanding under the Cash Flow Credit Agreement and to secure such indebtedness by a lien on the Collateral (as defined in the Cash Flow Credit Agreement) ranking junior to the lien securing the obligations under the Cash Flow Credit Agreement, subject to certain other conditions and limitations set forth in the Cash Flow Credit Agreement.
On December 21, 2012, Avaya Inc., Citibank, N.A. and the lenders party thereto entered into Amendment No. 5 to Credit Agreement, pursuant to which the Cash Flow Credit Agreement was amended and restated in its entirety. The modified terms of the Cash Flow Credit Agreement included (1) an amendment which allowed Avaya Inc. to extend the maturity of $713 million aggregate principal amount of the outstanding term B-1 loans from October 26, 2014 to March 31, 2018 (potentially springing to July 26, 2015, under the circumstances described below) and $134 million aggregate principal amount of the outstanding term B-4 loans from October 26, 2017 to March 31, 2018 (potentially springing to July 26, 2015, under the circumstances described below), in each case, by converting such loans into a new tranche of term B-5 loans; and (2) permission to apply net proceeds from Credit Agreement Refinancing Indebtedness (as defined in the Cash Flow Credit Agreement) incurred or issued on December 21, 2012 to refinance, at Avaya Inc.’s election, any class or classes of senior secured term loans, including the new term B-5 loans.
Additionally, as discussed more fully below, on December 21, 2012, Avaya Inc. completed a private placement of $290 million of senior secured notes, the net proceeds of which were used to repay $284 million of term B-5 loans outstanding under the Cash Flow Credit Agreement. Funds affiliated with TPG were holders of $22 million of term B-5 loans repaid with the proceeds of the senior secured notes.
On February 13, 2013, Avaya Inc. and Citibank, N.A. and the lenders party thereto entered into Amendment No. 6 to Credit Agreement pursuant to which the Cash Flow Credit Agreement was amended. The modified terms of the Cash Flow Credit Agreement permitted Avaya Inc. to refinance all of Avaya Inc.’s outstanding Old Notes with indebtedness secured by a lien on the Collateral (as defined in the Cash Flow Credit Agreement) ranking junior to the lien on the Collateral securing the obligations under the Cash Flow Credit Agreement, subject to certain other conditions and limitations set forth in the Cash Flow Credit Agreement.
On March 12, 2013, Avaya Inc., Citibank, N.A. and the lenders party thereto entered into Amendment No. 7 to Credit Agreement pursuant to which the Cash Flow Credit Agreement was amended. Pursuant to the amendment, Avaya Inc. refinanced in full all the outstanding term B-1 loans with the cash proceeds from the issuance of $589 million aggregate principal amount of term B-5 loans under the Cash Flow Credit Agreement.
Subsequent to the fiscal 2013 refinancing transactions, the Cash Flow Credit Agreement consists of (a) a senior secured multi-currency revolver allowing for borrowings of up to $200 million, (b) term B-3 loans with an outstanding principal amount as of March 31, 2013 of $2,139 million, (c) term B-4 loans with an outstanding principal amount as of March 31, 2013 of $1 million million, and (d) term B-5 loans with an outstanding principal amount as of March 31, 2013 of $1,148 million.
The term B-3 loans, term B-4 loans, and term B-5 loans each bear interest at a rate per annum equal to either a base rate (subject to a floor of 2.25% in the case of the term B-4 loans and term B-5 loans) or a LIBOR rate (subject to a floor of 1.25% in the case of the term B-4 loans and term B-5 loans), in each case plus an applicable margin. Subject to the floor described in the immediately preceding sentence the base rate is determined by reference to the higher of (1) the prime rate of Citibank, N.A. and (2) the federal funds effective rate plus 1/2 of 1%. The applicable margin for borrowings of term B-3 loans, term B-4 loans, and term B-5 loans is 3.50%, 5.25%, and 5.75%, respectively per annum with respect to base rate borrowings and 4.50%, 6.25%, and 6.75%, respectively per annum with respect to LIBOR borrowings.
The applicable margin on the term B-4 loans and term B-5 loans is subject to increase pursuant to the Cash Flow Credit Agreement in connection with the making of certain refinancing, extended or replacement term loans under the Cash Flow Credit Agreement with an Effective Yield (as defined in the Cash Flow Credit Agreement) greater than the applicable Effective Yield payable in respect of the applicable loans at such time plus 50 basis points.
Under the terms of the Cash Flow Credit Agreement the term B-3 loans, term B-4 loans, and term B-5 loans, would automatically have become due on July 26, 2015 unless (i) the total net leverage ratio as tested on that date based upon the most recent financial statements provided to the lenders under the Cash Flow Credit Agreement was no greater than 5.0 to 1.0 or (ii) on or prior to such date, either (x) an initial public offering of the Company shall have occurred or (y) at least $750 million in aggregate principal amount of Avaya Inc.’s senior
unsecured cash-pay notes and/or senior unsecured PIK toggle notes had been repaid or refinanced or their maturity had been extended to a date no earlier than 91 days after October 26, 2017. As discussed more fully below, Avaya Inc. completed an exchange offer in which $642 million of senior unsecured cash pay notes and $742 million of senior unsecured PIK toggle notes were exchanged for 10.50% senior secured notes due in 2021 thereby preventing the maturity date of the term B-3 loans, term B-4 loans and term B-5 loans from being accelerated under the terms of this provision.
The October 29, 2012, December 21, 2012, and February 13, 2013 amendments and restatements of the Cash Flow Credit Agreement represent debt modifications for accounting purposes. Accordingly, third party
expenses of $6 million incurred in connection with the transactions were expensed as incurred and included in other income, net during the six months ended March 31, 2013. Avaya Inc.’s financing sources that held term B-1 loans, term B-3 loans, term B-5 loans and/or revolving credit commitments under the Cash Flow Credit Agreement and consented to each amendment and restatement of the Cash Flow Credit Agreement received in aggregate a consent fee of $15 million. Fees paid to or on behalf of the holders of term loans in connection with the modification were recorded as a discount to the face value of the respective debt and are being accreted over the term of the debt as interest expense. Fees paid to or on behalf of the holders of the revolving credit commitments in connection with the modification were recorded as deferred debt issuance costs and are being amortized over the term of the debt as interest expense.
The March 12, 2013 amendment and restatement of the Cash Flow Credit Agreement was accounted for as a modification of debt to the extent the existing term B-1 loans were refinanced with term B-5 loans issued to the same creditor and an extinguishment of debt to the extent refinanced with term B-5 loans issued to a different creditor. Accordingly, for the portion accounted for as a debt extinguishment the difference between the reacquisition price and the carrying value of the term B-1 loans (including any unamortized discount and debt issue costs) of $3 million was recognized as a loss upon debt extinguishment during fiscal 2013. Third party expenses of $5 million associated with the issuance of the new term B-5 loans were capitalized and are being amortized over the term of the term B-5 loans. Third party expenses of $3 million associated with the modification of debt were expensed as incurred and included in other income, net.
The senior secured multi-currency revolver allows for borrowings of up to $200 million. The senior secured multi-currency revolver includes capacity available for letters of credit and for short-term borrowings, and is available in euros in addition to dollars. Borrowings are guaranteed by Avaya Holdings Corp. and substantially all of Avaya Inc.’s U.S. subsidiaries. The Cash Flow Credit Agreement, consisting of the term loans and the senior secured multi-currency revolver, is secured by substantially all assets of Parent, Avaya Inc. and the subsidiary guarantors.
As of March 31, 2013 affiliates of Silver Lake held $106 million and $45 million in outstanding principal amounts of term B-3 loans and term B-5 loans, respectively. As of September 30, 2012 affiliates of Silver Lake held $45 million and $122 million in outstanding principal amounts of term B-1 loans and term B-3 loans, respectively.
As of March 31, 2013 affiliates of TPG held no outstanding principal amounts of term loans under the Cash Flow Credit Agreement. As of September 30, 2012 affiliates of TPG held $44 million in outstanding principal amounts of term B-1 loans.
Senior Unsecured Notes
Avaya Inc. has issued senior unsecured cash-pay notes and senior unsecured PIK toggle notes, each due November 1, 2015. The interest rate for the cash-pay notes is fixed at 9.75% and the interest rates for the cash interest and PIK interest portions of the PIK-toggle notes are fixed at 10.125% and 10.875%, respectively. Avaya Inc. may prepay the senior unsecured notes at 102.4375% of the cash-pay note and 102.5313% of the PIK-toggle note principal amount redeemed on November 1, 2012 which decreases to 100% of each on or after November 1, 2013. Upon the occurrence of specific kinds of changes of control, Avaya Inc. will be required to make an offer to purchase the senior unsecured notes at 101% of their principal amount. If Avaya Inc. or any of its restricted subsidiaries engages in certain asset sales, under certain circumstances Avaya Inc. will be required to use the net proceeds to make an offer to purchase the senior unsecured notes at 100% of their principal amount. Substantially all of Avaya Inc.’s U.S. 100%-owned subsidiaries are guarantors of the senior unsecured notes. Prior to March 7, 2013, Avaya Inc. had $700 million and $750 million of cash-pay and PIK-toggle notes, respectively.
For the periods May 1, 2009 through October 31, 2009 and November 1, 2009 through April 30, 2010, Avaya Inc. elected to pay interest in kind on its senior unsecured PIK toggle notes. PIK interest of $41 million
and $43 million was added, for these periods, respectively, to the principal amount of the senior unsecured notes effective November 1, 2009 and May 1, 2010, respectively. For the periods from May 1, 2010 to October 31, 2011 Avaya Inc. elected to make such payments in cash interest. Under the terms of these notes, after November 1, 2011 Avaya Inc. is required to make all interest payments on the senior unsecured PIK toggle notes entirely in cash.
As discussed more fully below, on March 7, 2013, Avaya Inc. completed an exchange offer (the “Exchange Offer”) in which $1,384 million of Old Notes (including $642 million of senior unsecured cash-pay notes and $742 million of senior unsecured PIK toggle notes) were exchanged for 10.50% senior secured notes due 2021. The Exchange Offer represents a debt modification for accounting purposes. Accordingly, third party expenses of $9 million incurred in connection with the transaction were expensed as incurred and included in other income, net during the six months ended March 31, 2013. Avaya Inc.’s financing sources that held the Old Notes that elected to exchange received a consent fee in aggregate of $4 million. Fees paid to or on behalf of the holders of the Old Notes in connection with the modification were recorded as a discount to the face value of the 10.50% senior secured notes due 2021 and are being accreted over the term of the debt as interest expense.
Senior Secured Asset-Based Credit Facility
Avaya Inc.’s senior secured multi-currency asset-based revolving credit facility allows for borrowings of up to $335 million, subject to availability under a borrowing base, of which $150 million may be in the form of letters of credit. The borrowing base at any time equals the sum of 85% of eligible accounts receivable plus 85% of the net orderly liquidation value of eligible inventory, subject to certain reserves and other adjustments. Avaya Inc. and substantially all of its U.S. subsidiaries are borrowers under this facility, and borrowings are guaranteed by Avaya Holdings Corp. Avaya Inc. and substantially all of Avaya Inc.’s U.S. subsidiaries. The facility is secured by substantially all assets of Avaya Holdings Corp Avaya Holdings Corp, Avaya Inc. and the subsidiary guarantors. The senior secured multi-currency asset-based revolving credit facility also provides Avaya Inc. with the right to request up to $100 million of additional commitments under this facility.
On October 29, 2012 Avaya Inc., the several subsidiary borrowers (the “Subsidiary Borrowers”) party thereto, Citicorp USA, Inc. and the lenders party thereto entered into Amendment No. 2 to Credit Agreement, pursuant to which the senior secured multi-currency asset-based revolving credit facility was amended and restated in its entirety (as so amended and restated, the “ABL Credit Agreement”).
The modified terms of the ABL Credit Agreement include permission to issue or incur, as applicable, secured indebtedness in the form of (1) one or more series of secured notes in lieu of any Revolving Commitment Increases (as defined in the ABL Credit Agreement) in an aggregate principal amount not to exceed $100 million, plus the amount by which unused Commitments (as defined in the ABL Credit Agreement) have been previously reduced pursuant to the ABL Credit Agreement, less the amount of all Revolving Commitment Increases effected at or prior to the time of issuance of such notes (“Incremental Replacement Secured Notes”), and (2) one or more series of secured notes or secured loans in an aggregate principal amount not to exceed $750 million (“Junior Secured Debt”). Any such Incremental Replacement Secured Notes or Junior Secured Debt (a) must be (x) issued or incurred, as applicable, in connection with a modification, refinancing, refunding, renewal, replacement, exchange or extension of senior unsecured indebtedness and (y) secured by a lien on the Collateral (as defined in the ABL Credit Agreement) ranking junior to the lien securing the obligations under the ABL Credit Agreement and (b) will be subject to certain other conditions and limitations set forth in the ABL Credit Agreement.
On February 13, 2013, Avaya Inc., the Subsidiary Borrowers, Citicorp USA, Inc. and the lenders party thereto entered into Amendment No. 3 to Credit Agreement pursuant to which the ABL Credit Agreement was amended. The modified terms of the ABL Credit Agreement permitted Avaya Inc. to refinance all of Avaya Inc.’s outstanding Old Notes with indebtedness secured by a lien on the Collateral (as defined in the ABL Credit
Agreement) ranking junior to the lien on the Collateral securing the obligations under the ABL Credit Agreement, subject to certain other conditions and limitations set forth in the ABL Credit Agreement. Further, the terms of the amendment permit certain other obligations of Avaya Inc. and certain of its subsidiaries to be secured by the ABL Priority Collateral (as defined in the ABL Credit Agreement) on a junior-priority basis.
Borrowings under the ABL Credit Agreement bear interest at a rate per annum equal to, at Avaya Inc.’s option, either (a) a LIBOR rate plus a margin of 1.50% or (b) a base rate plus a margin of 0.50%.
At March 31, 2013 and September 30, 2012, there were no borrowings under this facility. At March 31, 2013 and September 30, 2012 there were $76 million and $77 million, respectively, of letters of credit issued in the ordinary course of business under the ABL Credit Agreement resulting in remaining availability of $218 million and $258 million, respectively.
7% Senior Secured Notes
On February 11, 2011, Avaya Inc. completed a private placement of $1,009 million of senior secured notes (the “7% Senior Secured Notes”). The 7% Senior Secured Notes bear interest at a rate of 7% per annum, mature on April 1, 2019 and were sold at par through a private placement to qualified institutional buyers pursuant to Rule 144A (and outside the United States in reliance on Regulation S) under the Securities Act of 1933, as amended (the “Securities Act”) and have not been, and will not be, registered under the Securities Act or applicable state securities laws.
Avaya Inc. may redeem the 7% Senior Secured Notes commencing April 1, 2015 at 103.5% of the principal amount redeemed, which decreases to 101.75% on April 1, 2016 and to 100% on or after April 1, 2017. Avaya Inc. may redeem all or part of the notes at any time prior to April 1, 2015 at 100% of the principal amount redeemed plus a “make-whole” premium. In addition, Avaya Inc. may redeem up to 35% of the original aggregate principal balance of the 7% Senior Secured Notes at any time prior to April 1, 2014 with the net proceeds of certain equity offerings at 107% of the aggregate principal amount of 7% Senior Secured Notes redeemed. Upon the occurrence of specific kinds of changes of control, Avaya Inc. will be required to make an offer to purchase the 7% Senior Secured Notes at 101% of their principal amount. If Avaya Inc. or any of its restricted subsidiaries engages in certain asset sales, under certain circumstances Avaya Inc. will be required to use the net proceeds to make an offer to purchase the 7% Senior Secured Notes at 100% of their principal amount.
Substantially all employeesof Avaya Inc.’s U.S. 100%-owned subsidiaries are guarantors of the Businesses participate in retirement programs, consisting of defined benefit, defined contribution and investment plans which, other than the Nortel Networks Retirement Income Plan (the “Retirement Income Plan”),7% Senior Secured Notes. The 7% Senior Secured Notes are administered and sponsoredsecured by Nortel. Nortel has multiple capital accumulation and retirement programs including: defined contribution and investment programs available to substantially all of its North American employees; the flexible benefits plan, which includes a group personal pension plan, available to substantially all of its employees in the U.K.; and traditional defined benefit programs that are closed to new entrants. Although these programs represent Nortel’s major retirement programs and may be available to employees in combination and/or as options within a program, Nortel also has smaller pension plan arrangements in other countries.
Nortel also provides other benefits, including post-retirement benefits and post-employment benefits. Employees previously enrolled in the capital accumulation and retirement programs offering post-retirement benefits are eligible for company sponsored post-retirement health care and/or death benefits, depending on age and/or years of service. Substantially all other employees have access to post-retirement benefits by purchasing a Nortel-sponsored retiree health care plan at their own cost.
As a result of workforce reductions in connection with the Creditor Protection Proceedings, Nortel remeasured the post-retirement benefit obligations for the U.S. and Canada and recorded the impacts of these remeasurements in the second quarter of 2009 in accordance with ASC 715-60 “Defined Benefit Plans—Other Post Retirement” (“ASC 715-60”). Curtailment gains of $5 were recorded to the Businesses.
As a result of workforce reductions in connection with the Creditor Protection Proceedings and the sale agreements for the planned sale of substantially all of the assets of Avaya Inc. and the ES business globallysubsidiary guarantors (other than with respect to real estate). The notes and the guarantees are secured equally and ratably with the Cash Flow Credit Agreement and any future first lien obligations by (i) a first-priority lien on substantially all of Avaya Inc.’s and the guarantors’ assets, other than (x) any real estate and (y) collateral that secures the ABL Credit Agreement on a first-priority basis (the “ABL Priority Collateral”), and (ii) a second-priority lien on the ABL Priority Collateral, in each case, subject to certain customary exceptions.
9% Senior Secured Notes
On December 21, 2012, Avaya Inc. completed a private placement of $290 million of senior secured notes (the “9% Senior Secured Notes”). The 9% Senior Secured Notes bear interest at a rate of 9% per annum, mature on April 1, 2019, and were sold at par through a private placement to qualified institutional buyers pursuant to Rule 144A (and outside the United States in reliance on Regulation S) under the Securities Act. The 9% Senior Secured Notes have not been, and will not be, registered under the Securities Act or applicable state securities laws and may not be offered or sold absent registration under the Securities Act or applicable state securities laws or applicable exemptions from registration requirements.
The 9% Senior Secured Notes are redeemable commencing April 1, 2015 at 104.5% of the principal amount redeemed, which decreases to 102.25% on April 1, 2016 and to 100% on or after April 1, 2017. Avaya Inc. may redeem all or part of the notes at any time prior to April 1, 2015 at 100% of the principal amount redeemed plus a “make-whole” premium, as well as the shares of NGS and DiamondWare, Ltd., Nortel remeasured the post-retirement benefit obligations for the U.S. and Canada and recorded the impacts of these remeasurementsdefined in the third quarterindenture governing the 9% Senior Secured Notes. In addition, Avaya Inc. may redeem up to 35% of 2009the original aggregate principal balance of the 9% Senior Secured Notes at any time prior to April 1, 2015 with the net proceeds of certain equity offerings at 109% of the aggregate principal amount redeemed. Upon the occurrence of specific kinds of changes of control, Avaya Inc. will be required to make an offer to purchase the 9% Senior Secured Notes at 101% of their principal amount. If Avaya Inc. or any of its restricted subsidiaries engages in accordance with ASC 715-60. Curtailment gainscertain asset sales, under certain circumstances Avaya Inc. will be required to use the net proceeds to make an offer to purchase the 9% Senior Secured Notes at 100% of $1 were recorded to the Businesses.their principal amount.
As a result of workforce reductions in connection with the Creditor Protection Proceedings and the sale agreements for the planned sale ofThe 9% Senior Secured Notes are secured by substantially all of the assets of Avaya Inc. and substantially all of Avaya Inc.’s U.S. 100%-owned subsidiaries (other than with respect to real estate). The notes and the ES business globally as well asguarantees are secured equally and ratably with the sharesCash Flow Credit Agreement, the 7% Senior Secured Notes due 2019 and any future first lien obligations by (i) a first-priority lien on substantially all of NGSAvaya Inc.’s and DiamondWare, Ltd., Nortel remeasured the pension benefit obligations for certain of its Canadian pension plans inguarantors’ assets, other than (x) any real estate and (y) collateral that secures the third quarter and recorded the impacts of these remeasurements in accordance with FASB ASC 715-30 “Defined Benefit Plans—Pension” (“ASC 715-30”). A curtailment loss of $34 and a settlement loss of $11 were recorded to the Businesses.
Currently, as a result of the U.K. Administration Proceedings, all further service cost accruals to its U.K. defined benefit pension plan have ceased. Also, the Ireland defined benefit pension plan is in the process of being wound up and all future service cost accruals have ceased.
As discussed in Note 3, these combined financial statements reflect the plansABL Credit Agreement on a multiemployerfirst-priority basis in accordance with ASC 715-60. As such, Nortel allocated costs associated with the pension plans to the Businesses based upon actual service cost(the “ABL Priority Collateral”), and allocated costs associated with other components of pension expense, such as interest costs, amortization of actuarial gains/losses, etc., based on projected benefit obligations relative to the
total projected benefit obligation of the plans. Management of the Businesses believes this methodology is(ii) a reasonable basis of allocation. Additionally, Nortel allocated service costs associated with the post-retirement plans based upon actual service cost and allocated costs associated with other components of post-retirement expense basedsecond-priority lien on the Businesses’ accumulated projected benefit obligation relativeABL Priority Collateral, in each case, subject to the total accumulated projected benefit obligation of the plans. Management of the Businesses believes this methodology is a reasonable basis of allocation.
For the nine months ended September 30, 2009 and the year ended December 31, 2008, the defined benefit pension expense and post-retirement expense allocated to the Businesses from Nortel for specifically identified Enterprise and Government Solutions employees participating in Nortel pension and post-retirement plans was approximately $37 and $19, respectively.
In addition, these combined financial statements reflect a portion of defined benefit pension expense and post-retirement expense related to employees that were not specifically identified to the Businesses but rather provided services to multiple Nortel businesses, including Enterprise and Government Solutions. Total defined benefit pension expense and post-retirement expense recognized associated with these employees was $4 and $7 for the nine months ended September 30, 2009 and the year ended December 31, 2008, respectively. These costs were determined using a consistent methodology as described above and were allocated to the Businesses based on global revenue of the Businesses compared to total Nortel global revenue and management of the Businesses believes that such allocation is reasonable.
On July 17, 2009, the PBGC provided a notice to NNI that the PBGC had determined under the Employee Retirement Income Securities Act of 1974 (“ERISA”) that: (i) the Retirement Income Plan, a defined benefit pension plan sponsored by NNI, will be unable to pay benefits when due; (ii) under Section 4042(c) of ERISA, the Retirement Income Plan must be terminated in order to protect the interests of participants and to avoid any unreasonable increase in the liability of the PBGC insurance fund; and (iii) July 17, 2009 was to be established as the date of termination of the Retirement Income Plan. On the same date, the PBGC filed a complaint in the Middle District of Tennessee against NNI and the Retirement Plan Committee of the Nortel Networks Retirement Income Plan seeking to proceed with termination of the Retirement Income Plan though this was not served against Nortel. NNI worked to voluntarily assign trusteeship of the Retirement Income Plan to the PBGC and avoid further court involvement in the termination process.
On September 8, 2009, pursuant to an agreement between the PBGC and the Retirement Plan Committee, the Retirement Income Plan was terminated with a termination date of July 17, 2009, and the PBGC was appointed trustee of the plan. The PBGC withdrew the complaint it had filed in the Middle District of Tennessee. As a result of the PBCG termination, the Businesses recorded the impacts of the settlement in accordance with FASB ASC 715-30 “Defined Benefit Plans—Pension.” A settlement gain of $12 was recorded to earnings of the Businesses in the third quarter of 2009 in reorganization items. Nortel allocated the settlement gain based on the Businesses’ projected benefit obligation relative to the total projected benefit obligation of the plans.certain customary exceptions.
The PBGC has filed a proofproceeds from the 9% Senior Secured Notes were used to repay $284 million aggregate principal amount of claim against NNIterm B-5 loans and eachto pay related fees and expenses. In connection with the issuance of the Debtors in9% Senior Secured Notes, Avaya Inc. capitalized financing costs of $7 million during fiscal 2013 and is amortizing these costs over the Chapter 11 proceedings for the unfunded benefit liabilitiesterm of the Pension Plan in the amount of $593. 9% Senior Secured Notes.
The PBGC has also filed unliquidated claims for contributions necessary to satisfy the minimum funding standards, a claim for insurance premiums, interest and penalties, and a claim for shortfall and amortization charges. Under ERISA, the PBGC may have the ability to impose certain claims and liens on NNI and certain NNI subsidiaries and affiliates (including liens on assets of certain Nortel entities not subject to the Creditor Protection Proceedings). Nortel has recorded a liability of $334 representing Nortel’s current best estimaterepayment of the probable claim amount in accordance with ASC 852 in relation to these claims. Toterm B-5 loans was accounted for as an extinguishment of debt. Accordingly the extent that information available indifference between the future indicates a difference fromreacquisition price and the recognized amounts, the provision will be adjusted. The Businesses recorded expense of $40 representing their portioncarrying value of the current best estimateterm B-5 loans (including unamortized debt issue costs) of the probable claim amount in accordance with ASC 852 in relation to these claims. Nortel allocated the expense based on the Businesses’ projected benefit obligation relative to the total projected benefit obligation of the plans.
Defined Contribution Plans10.50% Senior Secured Notes
Certain employeesOn March 7, 2013, Avaya Inc. completed an Exchange Offer in which $1,384 million of Old Notes were exchanged for $1,384 million of senior secured notes due 2021 (the “10.50% Senior Secured Notes”). The 10.50% Senior Secured Notes were issued at par, bear interest at a rate of 10.50% per annum and mature on March 1, 2021. The 10.50% Senior Secured Notes have not been, and will not be, registered under the Securities Act or applicable state securities laws and may not be offered or sold absent registration under the Securities Act or applicable state securities laws or applicable exemptions from registration requirements.
The 10.50% Senior Secured Notes are redeemable commencing March 1, 2017 at 107.875% of the Businesses participate in Nortel’s defined contribution plans. Basedprincipal amount redeemed, which decreases to 105.250% on the specific program in which the employee is enrolled, Nortel matches a percentageMarch 1, 2018, to 102.625% on March 1, 2019 and to 100% on or after March 1, 2020. Avaya Inc. may redeem all or part of the employee’s contributionsnotes at any time prior to March 1, 2017 at 100% of the principal amount redeemed plus a “make-whole” premium. In addition, Avaya Inc. may redeem up to 35% of the original aggregate principal balance of the notes at any time prior to March 1, 2016 with the net proceeds of certain equity offerings at 110.50% of the aggregate principal amount redeemed. Upon the occurrence of specific kinds of changes of control, Avaya Inc. will be required to make an offer to purchase the 10.50% Senior Secured Notes at 101% of their principal amount. If Avaya Inc. or any of its restricted subsidiaries engages in certain asset sales, under certain circumstances Avaya Inc. will be required to use the net proceeds to make an offer to purchase the 10.50% Senior Secured Notes at 100% of their principal amount.
The 10.50% Senior Secured Notes are secured by substantially all of the assets of Avaya Inc. and substantially all of Avaya Inc.’s U.S. 100%-owned subsidiaries (other than with respect to real estate). The notes
and the corresponding guarantees are secured on a junior priority basis to Avaya Inc.’s ABL Credit Agreement, Avaya Inc.’s Cash Flow Credit Agreement, Avaya Inc.’s existing 7% Senior Secured Notes due 2019, Avaya Inc.’s existing 9% Senior Secured Notes due 2019 and any future senior obligations by a junior priority lien on substantially all of Avaya Inc.’s and the guarantors’ assets, other than any real estate.
Avaya Inc.’s Cash Flow Credit Agreement, ABL Credit Agreement, and indentures governing its notes contain a number of covenants that, among other things and subject to certain limit. Inexceptions, restrict Avaya Inc.’s ability and the ability of certain of its subsidiaries to: (a) incur or guarantee additional debt and issue or sell certain preferred stock; (b) pay dividends on, redeem or repurchase capital stock; (c) make certain acquisitions or investments; (d) incur or assume certain liens; (e) enter into transactions with affiliates; (f) merge or consolidate with another company; (g) transfer or otherwise dispose of assets; (h) redeem subordinated debt; (i) incur obligations that restrict the ability of Avaya Inc.’s subsidiaries to make dividends or other defined contribution plans, Nortel contributes a fixed percentagepayments to Avaya Inc. or Avaya Holdings Corp; and (j) create or designate unrestricted subsidiaries. They also contain customary affirmative covenants and events of employees’ eligible earnings to a defined contribution plan arrangement. The aggregate costdefault. As of March 31, 2013 and September 30, 2012, Avaya Inc. was not in default under any of these investment plansagreements.
The weighted average interest rate of the Company’s outstanding debt as of March 31, 2013 was $277.4% excluding the impact of the interest rate swaps described in Note 8, “Derivatives and $48Other Financial Instruments.”
Annual maturities of long-term debt for the nine months endednext five years ending September 30 2009 and the year ended Decemberthereafter consist of:
In millions | ||||
Remainder of fiscal 2013 | $ | 19 | ||
2014 | 38 | |||
2015 | 53 | |||
2016 | 174 | |||
2017 | 38 | �� | ||
2018 and thereafter | 5,799 | |||
|
| |||
Total | $ | 6,121 | ||
|
| |||
Capital Lease Obligations
Included in other liabilities at March 31, 2008, respectively.2013 is $23 million of capital lease obligations, primarily associated with an office facility.
13. Warranties8. Derivatives and Other Financial Instruments
Product warrantiesInterest Rate Swaps
The Company uses interest rate swaps to manage the amount of its floating rate debt in order to reduce its exposure to variable rate interest payments associated with certain borrowings under the Cash Flow Credit Agreement. The interest rate swaps presented below are designated as cash flow hedges. The fair value of each interest rate swap is reflected as an asset or liability in the Consolidated Balance Sheets, reported as a component of other comprehensive loss and reclassified to earnings in the same period or periods during which the hedged transaction affects earnings. Gains and losses on derivative instruments representing hedge ineffectiveness are recognized in current earnings. The fair value of each interest rate swap is estimated as the net present value of their projected cash flows at the balance sheet date.
The details of these swaps are as follows:
In millions | Effective Date | Maturity Date | Notional Amount | Floating Rate Received by Avaya | Fixed Rate Paid by Avaya | |||||||||||||||
3-year swap | August 26, 2010 | August 26, 2013 | $ | 750 | 3-month LIBOR | 1.160 | % | |||||||||||||
3-year swap | August 26, 2010 | August 26, 2013 | 750 | 3-month LIBOR | 1.135 | % | ||||||||||||||
|
| |||||||||||||||||||
Notional amount—Total |
| $ | 1,500 | |||||||||||||||||
|
| |||||||||||||||||||
The following table summarizes the accrual for product warranties that was recorded(gains) and losses of the interest rate contracts qualifying and designated as part ofcash flow hedging instruments:
| Six months ended March 31, | ||||||||
In millions | 2013 | 2012 | ||||||
(Gain) Loss on interest rate swaps | ||||||||
Recognized in other comprehensive loss | $ | (7 | ) | $ | (10 | ) | ||
|
|
|
| |||||
Reclassified from accumulated other comprehensive loss into interest expense | $ | 8 | $ | 13 | ||||
|
|
|
| |||||
Recognized in operations (ineffective portion) | $ | — | $ | — | ||||
|
|
|
| |||||
The Company expects to reclassify approximately $5 million from accumulated other accrued liabilitiescomprehensive loss into expense in the combined balance sheets as of September 30, 2009 and December 31, 2008:
| Nine months ended September 30, 2009 | Year ended December 31, 2008 | |||||||
Balance at the beginning of the period | $ | 49 | $ | 59 | ||||
Payments | (42 | ) | (68 | ) | ||||
Warranties issued | 41 | 75 | ||||||
Revisions | (5 | ) | (17 | ) | ||||
Balance at the end of the period | $ | 43 | $ | 49 | ||||
14. Share-based compensation plans
Priornext twelve months related to the termination of the equity-based compensation plans as described below, certain employees of the Businesses participated in Nortel’s various share-based compensation plans. For purposes of these combined financial statements, all share-based compensation plans and related costs, whether equity or cash settled, are reflected in net parent investment on the basis that prior to the termination of the equity-based compensation plans, these costs were required to be settled by Nortel.
On February 27, 2009, Nortel obtained Canadian Court approval to terminate its equity-based compensation plans (2005 SIP, 1986 Plan and 2000 Plan) and certain equity-based compensation plans assumed in prior acquisitions, including all outstanding equity under these plans (stock options, SARs, RSUs and PSUs), whether vested or unvested. Nortel sought this approval given the decreased value of NNC common shares and the administrative and associated costs of maintaining the plans to itself as well as the plan participants. As a result of the cancellation of the plans, $36 of the remaining unrecognized compensation cost for unvested awards has been recognized as compensation cost in the nine months ended September 30, 2009, in addition to expense of $4 attributable to share-based compensation cost incurred in the normal course.
Prior to 2006, Nortel granted options to employees to purchase common shares under two existing stock option plans, the 2000 Plan and the 1986 Plan. Under these two plans, options to purchase common shares could be granted to employees and, under the 2000 Plan, options could also be granted to directors of Nortel. The options under both plans entitled the holders to purchase one common share at a subscription price of not less than 100% (as defined under the applicable plan) of the market value on the effective date of the grant. Subscription prices are stated and payable in U.S. Dollars for U.S. options and in Canadian Dollars for Canadian options. Options granted prior to 2003 generally vested 33-1/3% each year over a three-year period on the anniversary date of the grant. Commencing in 2003, options granted generally vested 25% each year over a four-year period on the anniversary of the date of grant. The term of an option could not exceed ten years.
In 2005, Nortel’s shareholders approved the 2005 SIP, a share-based compensation plan, which permitted grants of stock options, including incentive stock options, SARs, RSUs and PSUs to employees of Nortel and its subsidiaries, including Enterprise and Government Solutions. Nortel generally met its obligations under the 2005
SIP by issuing its common shares. On November 6, 2006, the 2005 SIP was amended and restated effective as of December 1, 2006, to adjust the number of common shares available for grant thereunder to reflect the 1 for 10 consolidation of issued and outstanding common shares. The subscription price for each share subject to an option could not be less than 100% of the market value (as defined under the 2005 SIP) of common shares on the date of the grant. Subscription prices have been stated and payable in U.S. Dollars for U.S. options and in Canadian Dollars for Canadian options. Options granted under the 2005 SIP generally vested 25% each year over a four-year period on the anniversary of the date of grant. Options granted under the 2005 SIP may not have become exercisable within the first year (except in the event of death), and in no case could the term of an option exceed ten years. All stock options granted have been classified as equity instrumentsCompany’s interest rate swaps based on the settlement provisionsprojected borrowing rates as of the share-based compensation plans.
At the annual meeting of Nortel’s shareholders held on May 7, 2008 (“Meeting”), the following amendments to the 2005 SIP were approved by Nortel’s shareholders in accordance with the rules of the Toronto Stock Exchange (“TSX”) and New York Stock Exchange (“NYSE”) and the terms of the 2005 SIP: (i) an increase in the number of Nortel common shares issuable under the 2005 SIP; (ii) the addition of certain additional types of amendments to the 2005 SIP or awards under it requiring shareholder approval; and (iii) amendments to reflect current market practices with respect to blackout periods.
The tables set out below include grants made in prior periods to individual employees of the Businesses who are employed by legal entities that, commencing January 14, 2009, are accounted for by the equity method in Nortel’s consolidated financial statements. These entities are combined in these Enterprise and Government Solutions combined financial statements.March 31, 2013.
Stock Options
During the nine months ended September 30, 2009, there were no common shares issued pursuant to the exercise of stock options granted to employees of Enterprise and Government Solutions. During the nine months ended September 30, 2009, no stock options were granted to employees of Enterprise and Government Solutions under the 2005 SIP.
The following is a summary of the total number of outstanding options for Enterprise and Government Solutions employees under the 2005 SIP, the 2000 Plan, the 1986 Plan and assumed stock options plans and the maximum number of stock options available for grant under the 2005 SIP as of the following dates:
| Outstanding Options (Thousands) | Weighted- Average Exercise Price | Weighted- Average Remaining Contractual Life (In Years) | Aggregate Intrinsic Value (Thousands) | |||||||||||||
Balance at December 31, 2007 | 8,468 | $ | 69.55 | 5.9 | $ | 5,900 | ||||||||||
Options transferred out | (840 | ) | $ | 72.41 | ||||||||||||
Options transferred in | 86 | $ | 80.49 | |||||||||||||
Granted options under all stock option plans | 995 | $ | 7.97 | |||||||||||||
Options exercised | — | $ | — | — | ||||||||||||
Options forfeited | (86 | ) | $ | 22.95 | ||||||||||||
Options expired | (282 | ) | $ | 118.83 | ||||||||||||
Options cancelled | (2 | ) | $ | 6.99 | ||||||||||||
Balance at December 31, 2008 | 8,339 | $ | 58.39 | 5.6 | $ | — | ||||||||||
Options transferred out | (340 | ) | $ | 59.70 | ||||||||||||
Options transferred in | 525 | $ | 58.13 | |||||||||||||
Granted options under all stock option plans | — | $ | — | |||||||||||||
Options exercised | — | $ | — | |||||||||||||
Options forfeited | (70 | ) | $ | 16.47 | ||||||||||||
Options expired | (54 | ) | $ | 174.18 | ||||||||||||
Options cancelled | (8,400 | ) | $ | 57.49 | ||||||||||||
Balance at September 30, 2009 | — | $ | — | — | $ | — | ||||||||||
The following tables summarize information about stock options outstanding and exercisable for Enterprise and Government Solutions’ employees as of December 31, 2008:
| Options Outstanding | ||||||||||||||||
| Number Outstanding (thousands) | Weighted- Average Remaining Contractual Life (in years) | Weighted- Average Exercise Price | Aggregate Intrinsic Value (thousands) | |||||||||||||
Range of exercise prices | ||||||||||||||||
$ 0.00 – $ 20.20 | 1,259 | 8.8 | $ | 10.24 | $ | — | ||||||||||
$ 20.21 – $ 23.90 | 1,885 | 5.5 | $ | 22.50 | $ | — | ||||||||||
$ 23.91 – $ 27.80 | 1,981 | 7.4 | $ | 26.68 | $ | — | ||||||||||
$ 27.81 – $ 36.00 | 400 | 5.2 | $ | 29.93 | $ | — | ||||||||||
$ 36.01 – $ 52.00 | 30 | 3.2 | $ | 48.63 | $ | — | ||||||||||
$ 52.01 – $ 72.00 | 1,027 | 3.0 | $ | 65.78 | $ | — | ||||||||||
$ 72.01 – $ 80.00 | 765 | 4.7 | $ | 76.75 | $ | — | ||||||||||
$ 80.01 – $120.00 | 280 | 3.9 | $ | 88.63 | $ | — | ||||||||||
$120.01 – $180.00 | 91 | 0.2 | $ | 158.28 | $ | — | ||||||||||
$180.01 – $977.65 | 621 | 1.0 | $ | 321.84 | $ | — | ||||||||||
| 8,339 | 5.6 | $ | 58.39 | $ | — | |||||||||||
Fully vested options and options expected to vest as of December 31, 2008 | 8,051 | 5.5 | $ | 59.90 | $ | — | ||||||||||
| Options Exercisable | ||||||||||||||||
| Number Exercisable (thousands) | Weighted- Average Remaining Contractual Life (in years) | Weighted- Average Exercise Price | Aggregate Intrinsic Value (thousands) | |||||||||||||
Range of exercise prices | ||||||||||||||||
$ 0.00 – $ 20.20 | 128 | 7.0 | $ | 18.89 | $ | — | ||||||||||
$ 20.21 – $ 23.90 | 1,482 | 5.0 | $ | 22.85 | $ | — | ||||||||||
$ 23.91 – $ 27.80 | 982 | 6.9 | $ | 27.21 | $ | — | ||||||||||
$ 27.81 – $ 36.00 | 353 | 4.9 | $ | 29.85 | $ | — | ||||||||||
$ 36.01 – $ 52.00 | 30 | 3.2 | $ | 48.63 | $ | — | ||||||||||
$ 52.01 – $ 72.00 | 1,027 | 3.0 | $ | 65.78 | $ | — | ||||||||||
$ 72.01 – $ 80.00 | 765 | 4.7 | $ | 76.75 | $ | — | ||||||||||
$ 80.01 – $120.00 | 280 | 3.9 | $ | 88.63 | $ | — | ||||||||||
$120.01 – $180.00 | 91 | 0.2 | $ | 158.28 | $ | — | ||||||||||
$180.01 – $977.65 | 621 | 1.0 | $ | 321.84 | $ | — | ||||||||||
| 5,759 | (a) | 4.4 | $ | 76.46 | $ | — | ||||||||||
The aggregate intrinsic value of outstanding and exercisable stock options provided in the preceding table represents the total pre-tax intrinsic value of outstanding and exercisable stock options based on Nortel’s closing share price of $0.26 as of December 31, 2008, the last trading day for Nortel’s common shares in 2008, which is assumed to be the price that would have been received by the stock option holders had all stock option holders exercised and sold their options on that date. The total number of in-the-money options exercisable as of December 31, 2008 was nil.
SARs
During the year ended December 31, 2008, Nortel granted to employees of Enterprise and Government Solutions 14,146 stand-alone SARs under the 2005 SIP. As of December 31, 2008, no tandem SARs had been granted under the 2005 SIP. As of December 31, 2008, 10,483 stand-alone SARs were outstanding under the 2005 SIP. During the period ended September 30, 2009, no stand-alone SARs were granted to employees of Enterprise and Government Solutions under the 2005 SIP. As of September 30, 2009, no tandem SARs had been granted under the 2005 SIP. As of September 30, 2009, no stand-alone SARs are outstanding under the 2005 SIP.
RSUs
During the nine months ended September 30, 2009, no share based RSUs were granted to employees of Enterprise and Government Solutions under the 2005 SIP. During the nine months ended September 30, 2009, there were no Nortel common shares issued to employees of Enterprise and Government Solutions pursuant to the vesting of RSUs granted under the 2005 SIP.
The following is a summary of the total number of outstanding RSU awards granted to employees of Enterprise and Government Solutions at each of the following dates:
| RSU Awards | ||||||||||||
| Outstanding RSU Awards(c) (Thousands) | Weighted- Average Grant Date Fair Value(a) | Weighted Average Remaining Contractual Life (In Years) | ||||||||||
Balance at December 31, 2007 | 708 | $ | 25.04 | 2.1 | ||||||||
Awards transferred out | (83 | ) | $ | 25.79 | ||||||||
Awards transferred in | 4 | $ | 25.53 | |||||||||
Granted RSU awards | 1,047 | $ | 7.94 | |||||||||
Awards settled(b) | (229 | ) | $ | 25.03 | ||||||||
Awards forfeited | (43 | ) | $ | 14.43 | ||||||||
Awards cancelled | (9 | ) | $ | 8.05 | ||||||||
Balance as of December 31, 2008 | 1,395 | $ | 12.60 | 1.9 | ||||||||
Awards transferred out | (29 | ) | $ | 15.61 | ||||||||
Awards transferred in | 73 | $ | 13.09 | |||||||||
Granted RSU awards | — | $ | — | |||||||||
Awards settled(b) | — | $ | — | |||||||||
Awards forfeited | (40 | ) | $ | 11.91 | ||||||||
Awards cancelled | (1,399 | ) | $ | 12.58 | ||||||||
Balance as of September 30, 2009 | — | $ | — | — | ||||||||
PSUs
PSU-rTSRs
During the nine months ended September 30, 2009, no share-based PSU-rTSRs were granted to employees of Enterprise and Government Solutions under the 2005 SIP. During the period ended September 30, 2009, there were no PSU-rTSRs that vested under the 2005 SIP.
The following is a summary of the total number of outstanding PSU-rTSR awards granted to employees of Enterprise and Government Solutions at each of the following dates:
| PSU-rTSR Awards | ||||||||||||
| Outstanding PSU- rTSR Awards(b) (Thousands) | Weighted- Average Grant Date Fair Value(a) | Weighted Average Remaining Contractual Life (In Years) | ||||||||||
Balance at December 31, 2007 | 108 | $ | 21.28 | 1.6 | ||||||||
Awards transferred out | (6 | ) | $ | 22.15 | ||||||||
Granted PSU-rTSR awards | 131 | $ | 6.71 | |||||||||
Awards settled | — | $ | — | |||||||||
Awards forfeited | — | $ | — | |||||||||
Awards expired | — | $ | — | |||||||||
Balance at December 31, 2008 | 233 | $ | 13.08 | 1.5 | ||||||||
Awards transferred out | — | $ | — | |||||||||
Granted PSU-rTSR awards | — | $ | — | |||||||||
Awards settled | — | $ | — | |||||||||
Awards forfeited | — | $ | — | |||||||||
Awards expired | — | $ | — | |||||||||
Awards cancelled | (233 | ) | $ | (13.08 | ) | |||||||
Balance at September 30, 2009 | — | $ | — | — | ||||||||
PSU-Management OMs
During the nine months ended September 30, 2009, no share-based PSU-Management OMs were granted to employees of Enterprise and Government Solutions under the 2005 SIP.
The following is a summary of the total number of outstanding PSU-Management OMs granted to Enterprise and Government Solutions employees at each of the following dates:
| PSU-Management OM | ||||||||||||
| Outstanding PSU- Management OM Awards (Thousands) | Weighted- Average Grant Date Fair Value | Weighted- Average Contractual Life (In Years) | ||||||||||
Balance as of December 31, 2007 | — | $ | — | — | ||||||||
Granted PSU-Management OMs Awards | 256 | $ | 7.90 | — | ||||||||
Awards settled | — | $ | — | — | ||||||||
Awards forfeited | (5 | ) | $ | 8.05 | — | |||||||
Awards expired | — | $ | — | — | ||||||||
Balance as of December 31, 2008 | 251 | $ | 7.89 | 2.0 | ||||||||
Awards transferred out | (3 | ) | $ | 8.05 | — | |||||||
Awards transferred in | 9 | $ | 8.05 | — | ||||||||
Awards forfeited | (9 | ) | $ | 8.05 | — | |||||||
Awards cancelled | (248 | ) | $ | 7.89 | — | |||||||
Balance as of September 30, 2009 | — | $ | — | — | ||||||||
Employee stock purchase plansForeign Currency Forward Contracts
The ESPPs were designedCompany utilizes foreign currency forward contracts primarily to have four offering periods each year, with each offering period beginningmanage short-term exchange rate exposures on certain receivables, payables and intercompany loans residing on foreign subsidiaries’ books, which are denominated in currencies other than the first day of each calendar quarter. Eligible employees were permitted to have up to 10% of their eligible compensation deducted from their pay during each offering period to contribute towardssubsidiary’s functional currency. When those items are revalued into the purchase of Nortel common shares. Nortel common shares were purchased on behalf of plan participantssubsidiaries’ functional currencies at the month-end exchange rates, the fluctuations in the open market on eitherexchange rates are recognized in the NYSE or TSX for delivery to participating employees. The purchase price per common share to participating employees was effectively equal to 85%Consolidated Statements of Operations as other income (expense), net. Changes in the fair value of the prices atCompany’s foreign currency forward contracts used to offset these exposed items are also recognized in the Consolidated Statements of Operations as other income (expense), net in the period in which common shares were purchased on the TSX for Canadian participants and on the NYSE for all other participants on the purchase date.exchange rates change.
The following amendments to the ESPPs were approved by Nortel’s shareholders at the Meeting: (i) an increase in the number of Nortel common shares available for purchase under the ESPPs; (ii) amendments to the ESPPs to permit participation by certain employees of Nortel, its participating subsidiariesgains and designated affiliate companies who previously were excluded from participating; and (iii) approval(losses) of the amended U.S. planforeign currency forward contracts included in order to qualifyother income (expense) were $(7) million and $(5) million for special tax treatment under Section 423 of the United States Internal Revenue Code.six months ended March 31, 2013 and 2012, respectively.
The ESPPs were terminated effective December 12, 2008. There were no further purchases of Nortel common shares under the ESPPs. Any payment deductions made for the purchase period that began on October 1, 2008 (originally scheduled to end December 31, 2008) were returned to employees, and no additional employee payroll deductions were accepted effective December 12, 2008.
Total expense associated with the ESPPs was allocated to Enterprise and Government Solutions based on active headcount of the Businesses as a percentage of total Nortel headcount. Total ESPP expense recognized in these combined financial statements was nil for the nine months ended September 30, 2009 and was $1 for the year ended December 31, 2008.
Share-based compensationPreferred Series B Embedded Derivative
Share-based compensation recorded duringOn May 29, 2012, the nine months ended September 30, 2009Company issued Series B preferred stock (“preferred series B”) containing certain features which are considered an embedded derivative under generally accepted accounting principles. This embedded derivative was separated from the host contract (i.e. the preferred stock) and recognized as a current liability on the year ended December 31, 2008 was as follows:
| Nine months ended September 30, 2009 | Year ended December 31, 2008 | |||||||
Share-based compensation: | ||||||||
Options | $ | 16 | $ | 24 | ||||
RSUs | 12 | 9 | ||||||
PSU—rTSRs | 2 | 2 | ||||||
PSU—Management OMs | — | — | ||||||
Total share-based compensation reported | $ | 30 | $ | 35 | ||||
On March 29, 2005,Consolidated Balance Sheet at fair value. When the SEC issued SAB No. 107 (“SAB 107”), which providesembedded derivative is revalued at each balance sheet date, the Staff’s views on a variety of matters relating to stock-based payments. SAB 107 requires stock-based compensation to be classifiedchanges in the same expense line items as cash compensation.
In addition to stock-based compensation set out above, which is attributable to employees of Enterprise and Government Solutions, the Businesses recognized an allocation of stock-based compensation expense related to employees that provide services to multiple Nortel businesses of $10 and $4 for the nine months ended September 30, 2009 and December 31, 2008, respectively.
The Businesses estimate the fair value are recognized in the Consolidated Statement of stock optionsOperations as other income (expense), net. During the six months ended March 31, 2013, the gain on the preferred series B embedded derivative included in other income (expense), net was $8 million.
The following table summarizes the estimated fair value of derivatives:
In millions | March 31, 2013 | September 30, 2012 | ||||||||||||||||||||||||||||||
Balance Sheet Location | Total | Foreign Currency Forward Contracts | Interest Rate Swaps | Series B Preferred Embedded Derivative | Total | Foreign Currency Forward Contracts | Interest Rate Swaps | Series B Preferred Embedded Derivative | ||||||||||||||||||||||||
Other current assets | $ | 1 | $ | 1 | $ | — | $ | — | $ | 2 | $ | 2 | $ | — | $ | — | ||||||||||||||||
Other current liabilities | (15 | ) | (1 | ) | (6 | ) | (8 | ) | (31 | ) | — | (15 | ) | (16 | ) | |||||||||||||||||
|
|
|
|
|
|
|
|
|
|
|
|
|
|
|
| |||||||||||||||||
Net Liability | $ | (14 | ) | $ | — | $ | (6 | ) | $ | (8 | ) | $ | (29 | ) | $ | 2 | $ | (15 | ) | $ | (16 | ) | ||||||||||
|
|
|
|
|
|
|
|
|
|
|
|
|
|
|
| |||||||||||||||||
9. Fair Value Measures
Pursuant to the accounting guidance for fair value measurements and SARs usingits subsequent updates, fair value is defined as the Black-Scholes-Merton option-pricing model, consistent withprice that would be received from selling an asset or paid to transfer a liability in an orderly transaction between market participants at the provisions of SFAS 123R and SAB 107 which are now codified as ASC 718. The key input assumptions used to estimatemeasurement date. When determining the fair value of stock optionsmeasurements for assets and SARs include the grant price of the award, the expected term of the award, the volatility of Nortel common shares, the risk-free interest rate and Nortel’s dividend yield. The Businesses believe that the Black-Scholes-Merton option-pricing model adequately captures the substantive features of the option and SAR awards and is appropriateliabilities required or permitted to calculate the fair values of the options and SARs.
The following ranges of assumptions were used in computing thebe recorded at fair value, of stock optionsthe Company considers the principal or most advantageous market in which it would transact and SARs for accounting purposes, forit considers assumptions that market participants would use when pricing the nine months ended September 30, 2009 and the year ended December 31, 2008:
| Nine months ended September 30, 2009 | Year ended December 31, 2008 | |||||||
Black-Scholes-Merton assumptions | ||||||||
Expected dividend yield | 0.00% | 0.00% | ||||||
Expected volatility(a) | 44.21% – 61.51% | 44.21% – 74.28% | ||||||
Risk-free interest rate(b) | 1.96% – 3.33% | 1.55% – 3.33% | ||||||
Expected term of options in years(c) | 2.64 – 4.5 | 2.64 – 4.5 | ||||||
Range of fair value per option granted | $2.72 – $3.78 | $0.38 – $3.78 | ||||||
Range of fair value per SAR granted | $.02 – $3.13 | $.002 – $3.13 | ||||||
The fair value of all RSUs and PSU-Management OMs granted after January 1, 2008 was calculated using the closing share price from the NYSE on the date of grant. For RSU awards granted before January 1, 2008, the fair value is calculated using an average of the high and low share prices from the highest trading value of either the NYSEasset or TSX on the date of the grant. There were no PSU-Management OMs granted before January 1, 2008. The Businesses estimate the fair value of PSU-rTSR awards using a Monte Carlo simulation model. Certain assumptions used in the model include (but are not limited to) the following:
| ||||||||
| ||||||||
| ||||||||
| ||||||||
The total income tax benefit recognized in the statements of operations for share-based compensation awards was nil for each of the periods ended September 30, 2009 and December 31, 2008.
Cash received from exercises under all share-based payment arrangements was nil for both the nine months ended September 30, 2009 and the year ended December 31, 2008. Tax benefits realized by the Businesses related to these exercises were nil for each of the nine months ended September 30, 2009 and the year ended December 31, 2008.
15. Fair Valueliability.
Fair Value MeasurementsHierarchy
The Businesses adopted the provisions of ASC 820 applicable to financial assets and liabilities measured ataccounting guidance for fair value on a recurring basis and to certain non-financial assets and liabilities that are measured at fair value on a recurring basis, effective January 1, 2008. ASC 820 defines fair value, establishes a consistent framework for measuring fair value and expands disclosure requirements about fair value measurements. ASC 820, among other things,measurements also requires the Businessesan entity to maximize the use of observable inputs and minimize the use of unobservable inputs when measuring fair value.
Fair A financial instrument’s categorization within the fair value hierarchy
ASC 820 provides a hierarchy is based upon the lowest level of valuation techniques based on whetherinput that is significant to the fair value measurement. The inputs to those valuation techniques are observable or unobservable. Observable inputs reflect market data obtained from independent sources, while unobservable inputs reflect the Businesses’ assumptions with respect to how market participants would price an asset or liability. These two inputsprioritized into three levels that may be used to measure fair value fall into the following three different levels of the fair value hierarchy:value:
Level 1: QuotedInputs that reflect quoted prices for identical instrumentsassets or liabilities in active markets that are observable.
Level 2: QuotedInputs that reflect quoted prices for similar instrumentsassets or liabilities in active markets; quoted prices for identical or similar instrumentsassets or liabilities in markets that are non-active;not active; or model-derived valuations in which significant inputs other than quoted prices that are observable andor can be derived principally from, or corroborated by, observable market data.
Level 3: Valuations derived from valuation techniques in which one or more significantInputs that are unobservable to the extent that observable inputs are unobservable.not available for the asset or liability at the measurement date.
This hierarchy requires the use of observable market data when available.
Determination of fair valueAsset and Liabilities Measured at Fair Value on a Recurring Basis
The following section describes the valuation methodologies used by the Businesses to measure different instruments at fair value, including an indication of the level in the fair value hierarchy in which each instrument is classified. Where applicable, the descriptions include the key inputsAssets and significant assumptions used in the valuation models.
Investments
In October 2008, the Businesses entered into an agreement (“Agreement”) with the investment firm that sold NGS a portion of its auction rate securities, which have a par value of $18 at September 30, 2009. By entering into the Agreement, the Businesses (1) received the right (“Put Option”) to sell these auction rate securities back to the investment firm at par, at its sole discretion, anytime during the period from June 30, 2010 through July 2, 2012, and (2) gave the investment firm the right to purchase these auction rate securities or sell them on the Businesses’ behalf at par anytime after the execution of the Agreement through July 2, 2012. The Businesses elected to measure the Put Option under the fair value option of ASC 825, “Financial Instruments,” and recorded income of approximately $3 pre-tax, and recorded a corresponding long term investment. Simultaneously, the Businesses transferred these auction rate securities from available-for-sale to trading investment securities. As a result of this transfer, the Businesses recognized an impairment loss of approximately $3 pre-tax. The recognition of the Put Option and the impairment loss resulted in no net impact to the results of operations for the nine months ended September 30, 2009 and year ended December 31, 2008. The Businesses anticipate that any future changes in the fair value of the Put Option will be offset by the changes in the fair value of the related auction rate securities with no material net impact to the results of operations. The Put Option will continue to be measured at fair value utilizing Level 3 inputs until the earlier of its maturity or exercise.
Market valuation adjustments
The fair value of financial liabilities must include the effects of Nortel’s and the counterparty’s non-performance risk, including credit risk.
The following table presents, for each of the fair value hierarchy levels, the assets and liabilities that are measured at fair value on a recurring basis as of March 31, 2013 and September 30, 2009:2012 were as follows:
| Fair Value | Level 1 | Level 2 | Level 3 | |||||||||||||
Assets | ||||||||||||||||
Cash equivalents (money market fund) | $ | 11 | $ | 11 | $ | — | $ | — | ||||||||
Treasury notes | 2 | — | 2 | — | ||||||||||||
Auction rate securities (including Put Option) | 18 | — | 18 | |||||||||||||
Total Assets | $ | 31 | $ | 11 | $ | 2 | $ | 18 | ||||||||
| March 31, 2013 | ||||||||||||||||
| Fair Value Measurements Using | ||||||||||||||||
In millions | Total | Quoted Prices in Active Markets for Identical Instruments (Level 1) | Significant Other Observable Inputs (Level 2) | Significant Unobservable Inputs (Level 3) | ||||||||||||
Other Current Assets: | ||||||||||||||||
Foreign currency forward contracts | $ | 1 | $ | — | $ | 1 | $ | — | ||||||||
|
|
|
|
|
|
|
| |||||||||
In millions Other Non-Current Assets: Investments Other Current Liabilities: Foreign currency forward contracts Preferred series B embedded derivative Interest rate swaps March 31, 2013 Fair Value Measurements Using Total Quoted Prices in
Active Markets for
Identical Instruments
(Level 1) Significant Other
Observable
Inputs
(Level 2) Significant
Unobservable
Inputs
(Level 3) $ 3 $ 2 $ 1 $ — $ 1 $ — $ 1 $ — 8 — — 8 6 — 6 — $ 15 $ — $ 7 $ 8
| September 30, 2012 | ||||||||||||||||
| Fair Value Measurements Using | ||||||||||||||||
In millions | Total | Quoted Prices in Active Markets for Identical Instruments (Level 1) | Significant Other Observable Inputs (Level 2) | Significant Unobservable Inputs (Level 3) | ||||||||||||
Other Current Assets: | ||||||||||||||||
Foreign currency forward contracts | $ | 2 | $ | — | $ | 2 | $ | — | ||||||||
Investments | 1 | 1 | — | — | ||||||||||||
|
|
|
|
|
|
|
| |||||||||
| $ | 3 | $ | 1 | $ | 2 | $ | — | |||||||||
|
|
|
|
|
|
|
| |||||||||
Other Non-Current Assets: | ||||||||||||||||
Investments | $ | 4 | $ | 2 | $ | 2 | $ | — | ||||||||
|
|
|
|
|
|
|
| |||||||||
Other Current Liabilities: | ||||||||||||||||
Preferred series B embedded derivative | $ | 16 | $ | — | $ | — | $ | 16 | ||||||||
Interest rate swaps | 15 | — | 15 | — | ||||||||||||
|
|
|
|
|
|
|
| |||||||||
| $ | 31 | $ | — | $ | 15 | $ | 16 | |||||||||
|
|
|
|
|
|
|
| |||||||||
Interest Rate Swaps
Interest rate swaps classified as Level 2 assets and liabilities are priced using discounted cash flow techniques which are corroborated by using non-binding market prices. Significant inputs to the discounted cash flow model include projected future cash flows based on projected 3-month LIBOR rates, and the average margin for companies with similar credit ratings and similar maturities. These are classified as Level 2 as they are not actively traded and are valued using pricing models that use observable market inputs.
Foreign Currency Forward Contracts
Foreign currency forward contracts classified as Level 2 assets and liabilities are priced using quoted market prices for similar assets or liabilities in active markets.
Investments
Investments classified as Level 2 assets and liabilities are priced using quoted market prices for identical assets which are subject to infrequent transactions (i.e. a less active market).
Preferred Series B Embedded Derivative
The preferred series B embedded derivative classified as a Level 3 liability is priced by calculating the difference in the fair value of the preferred series B stock with and without the aggregated embedded features. To estimate the fair value of the preferred series B a Binomial Lattice model was used. Significant inputs into the binomial lattice model include the total equity value of the Company, risk-free rate, volatility, and expected term.
The following table presents the changes in the Level 3 fair value categoryof the preferred series B embedded derivative for fiscal 2012 and for the ninesix months ended March 31, 2013(in millions):
Balance as of October 1, 2011 | $ | — | ||
Issuance of preferred series B stock and embedded derivative | 10 | |||
Change in fair value | 6 | |||
|
| |||
Balance as of September 30, 2012 | $ | 16 | ||
Change in fair value | (8 | ) | ||
|
| |||
Balance as of March 31, 2013 | $ | 8 | ||
|
|
Assets and Liabilities Measured at Fair Value on a Nonrecurring Basis
Assets and liabilities measured at fair value on a nonrecurring basis as of March 31, 2013 were as follows:
| Fair Value Measurements Using | ||||||||||||||||||||
In millions | Total | Quoted Prices in Active Markets for Identical Instruments (Level 1) | Significant Other Observable Inputs (Level 2) | Significant Unobservable Inputs (Level 3) | Total Loss | |||||||||||||||
Goodwill of ITPS reporting unit: | $ | 44 | $ | — | $ | — | $ | 44 | $ | 89 | ||||||||||
|
|
|
|
|
|
|
|
|
| |||||||||||
During the three months ended March 31, 2013 the Company performed an interim impairment test of goodwill for the ITPS reporting unit. Using level 3 inputs, the Company estimated the implied fair value of its goodwill to be $44 million as compared with a carrying value of $133 million and recorded an impairment to goodwill of $89 million. See Note 4 “Goodwill and Intangible Assets”.
Fair Value of Financial Instruments
The fair values of cash and cash equivalents, accounts receivable, accounts payable and accrued expenses, to the extent the underlying liability will be settled in cash, approximate carrying values because of the short-term nature of these instruments.
The estimated fair values of the amounts borrowed under the Company’s financing arrangements at March 31, 2013 and September 30, 2009:2012 were estimated based on a Level 2 input using quoted market prices for the Company’s debt which is subject to infrequent transactions (i.e. a less active market).
| January 1, 2009 | Net Realized/Unrealized Gains (Losses) included in Earnings | Other | Purchases, Sales, Issuances and (Settlements) | Transfers in and/or (out) of Level 3 | September 30, 2009 | |||||||||||||||||||
Assets | ||||||||||||||||||||||||
Auction rate securities | $ | 19 | — | — | (1 | ) | — | $ | 18 | |||||||||||||||
The following table presentsestimated fair values of the amounts borrowed under the Company’s credit agreements at March 31, 2013 and September 30, 2012 are as follows:
| March 31, 2013 | September 30, 2012 | |||||||||||||||
In millions | Principal Amount | Fair Value | Principal Amount | Fair Value | ||||||||||||
Senior secured term B-1 loans | $ | — | $ | — | $ | 1,434 | $ | 1,392 | ||||||||
Senior secured term B-3 loans | 2,139 | 2,013 | 2,152 | 1,960 | ||||||||||||
Senior secured term B-4 loans | 1 | 1 | — | — | ||||||||||||
In millions Senior secured term B-5 loans 7% Senior secured notes 9% Senior secured notes 10.50% Senior secured notes 9.75% senior unsecured cash pay notes due 2015 10.125%/10.875% senior unsecured PIK toggle notes due 2015 Total March 31, 2013 September 30, 2012 Principal
Amount Fair
Value Principal
Amount Fair
Value $ 1,148 $ 1,153 $ — $ — 1,009 982 1,009 938 290 300 — — 1,384 1,314 — — 58 57 700 622 92 91 834 749 $ 6,121 $ 5,911 $ 6,129 $ 5,661
10. Income Taxes
The benefit from income taxes for the six months ended March 31, 2013 was $6 million, as compared to the benefit from income taxes of $26 million for the six months ended March 31, 2012.
The effective rate for the six months ended March 31, 2013 differs from the statutory U.S. Federal income tax rate primarily due to (1) the effect of tax rate differentials on foreign income/loss, (2) changes in the Level 3 fair value categoryvaluation allowance established against the Company’s deferred tax assets, (3) $17 million of income tax benefit recognized upon the expiration of certain interest rate swaps, and (4) $16 million release of valuation allowance associated with tax expense on net gains in other comprehensive income.
During the six months ended March 31, 2013, the Company recognized $17 million of income tax benefit related to the elimination of the tax effect of certain interest rate swaps in other comprehensive income. The tax effect of such interest rate swaps was recognized in other comprehensive income prior to the establishment of a valuation allowance against the Company’s U.S. net deferred tax assets and was eliminated following the expiration of the final interest rate swap upon which the tax effect was established.
During the six months ended March 31, 2013, the Company recorded a tax charge of $16 million to other comprehensive income primarily relating to pension benefits. The charge to other comprehensive income and decrease in related deferred tax assets resulted in the recording of an income tax benefit in continuing operations related to the release of the corresponding valuation allowance.
The effective rate for the yearsix months ended DecemberMarch 31, 2008:2012 differs from the statutory U.S. Federal income tax rate primarily due to (1) the effect of tax rate differentials on foreign income/loss, (2) changes in the valuation allowance established against the Company’s deferred tax assets and (3) $6 million release of valuation allowance associated with tax expense on net gains in other comprehensive income.
| January 1, 2008 | Net Realized/Unrealized Gains (Losses) included in | Purchases, Sales, Issuances and (Settlements) | Transfers in and/or (out) of Level 3 | December 31, 2008 | ||||||||||||||||||||
| Earnings | Other | |||||||||||||||||||||||
Assets | ||||||||||||||||||||||||
Auction rate securities | $ | — | — | — | 19 | — | $ | 19 | ||||||||||||||||
During the six months ended March 31, 2012, the Company recorded a tax charge of $6 million to other comprehensive income primarily relating to pension benefits. The charge to other comprehensive income and decrease in related deferred tax assets resulted in the recording of an income tax benefit in continuing operations related to the release of the corresponding valuation allowance.
For interim financial statement purposes, U.S. GAAP income tax expense related to ordinary income is determined by applying an estimated annual effective income tax rate against the Company’s ordinary income. Income tax expense related to items not characterized as ordinary income is recognized as a discrete item when incurred. The estimation of the Company’s annual effective income tax rate requires the use of management forecasts and other estimates, projection of jurisdictional taxable income and losses, statutory income tax rates, and valuation allowances. The Company’s estimated annual effective income tax rate may be revised, if necessary, in each interim period during the fiscal year.
16. Discontinued operations11. Benefit Obligations
OnThe Company sponsors non-contributory defined benefit pension plans covering a portion of its U.S. employees and retirees, and postretirement benefit plans covering a portion of its U.S. retirees that include healthcare benefits and life insurance coverage.
Certain non-U.S. operations have various retirement benefit programs covering substantially all of their employees. Some of these programs are considered to be defined benefit pension plans for accounting purposes.
The Company froze benefit accruals and additional participation in the pension and postretirement plans for its U.S. management employees effective December 31, 2003. In addition, the Company amended the postretirement plan for its U.S. management employees effective January 1, 2013, to terminate retiree dental coverage, and to cease providing medical and prescription drug coverage to a retiree, dependent, or lawful spouse who has attained age 65.
Effective October 12, 2011 and November 18, 2011, the Company entered into a two-year contract extension with the Communications Workers of America (“CWA”) and the International Brotherhood of Electrical Workers (“IBEW”), respectively. With the contract extension, the contracts with the CWA and IBEW now terminate on June 7, 2014. The contract extension did not affect the level of pension and postretirement benefits available to U.S. employees of the Company who are represented by the CWA or IBEW (“represented employees”).
The components of the pension and postretirement net periodic benefit cost for the six months ended March 31, 2013 and 2012 are provided in the table below:
| Pension Benefits - U.S. | Pension Benefits - Non-U.S. | Postretirement Benefits - U.S. | ||||||||||||||||||||||
| Six months ended March 31, | Six months ended March 31, | Six months ended March 31, | ||||||||||||||||||||||
In millions | 2013 | 2012 | 2013 | 2012 | 2013 | 2012 | ||||||||||||||||||
Components of Net Periodic Benefit Cost | ||||||||||||||||||||||||
Service cost | $ | 3 | $ | 3 | $ | 4 | $ | 3 | $ | 1 | $ | 1 | ||||||||||||
Interest cost | 68 | 75 | 10 | 12 | 10 | 15 | ||||||||||||||||||
Expected return on plan assets | (80 | ) | (86 | ) | (1 | ) | (1 | ) | (5 | ) | (5 | ) | ||||||||||||
Amortization of unrecognized prior service cost | — | 1 | — | — | (7 | ) | 1 | |||||||||||||||||
Amortization of previously unrecognized net actuarial loss | 64 | 49 | 2 | — | 4 | 4 | ||||||||||||||||||
|
|
|
|
|
|
|
|
|
|
|
| |||||||||||||
Net periodic benefit cost | $ | 55 | $ | 42 | $ | 15 | $ | 14 | $ | 3 | $ | 16 | ||||||||||||
|
|
|
|
|
|
|
|
|
|
|
| |||||||||||||
The Company’s general funding policy with respect to its U.S. qualified pension plans is to contribute amounts at least sufficient to satisfy the minimum amount required by applicable law and regulations. For the six month period ended March 31, 2013, the Company made contributions of $35 million to satisfy minimum statutory funding requirements. Estimated payments to satisfy minimum statutory funding requirements for the remainder of fiscal 2013 are $67 million.
The Company provides certain pension benefits for U.S. employees, which are not pre-funded, and certain pension benefits for non-U.S. employees, the majority of which are not pre-funded. Consequently, the Company
makes payments as these benefits are disbursed or premiums are paid. For the six month period ended March 31, 2013, the Company made payments for these U.S. and non-U.S. pension benefits totaling $3 million and $19 million, respectively. Estimated payments for these U.S. and non-U.S. pension benefits for the remainder of fiscal 2013 are $4 million and $8 million, respectively.
During the six months ended March 31, 2013, the Company contributed $22 million to the represented employees’ post-retirement health trust to fund current benefit claims and costs of administration in compliance with the terms of the 2009 agreements between the Businesses completedCompany and the CWA and IBEW, as extended through June 7, 2014. Estimated contributions under the terms of the 2009 Agreement are $21 million for the remainder of fiscal 2013.
The Company also provides certain retiree medical benefits for U.S. employees, which are not pre-funded. Consequently, the Company makes payments as these benefits are disbursed. For the six month period ended March 31, 2013, the Company made payments totaling $4 million for these retiree medical benefits. Estimated payments for these retiree medical benefits for the remainder of fiscal 2013 are $4 million.
12. Share-based Compensation
Avaya Holdings Corp.’s Amended and Restated 2007 Equity Incentive Plan (“2007 Plan”) governs the issuance of equity awards, including restricted stock units (“RSUs”) and stock options, to eligible plan participants. Key employees, directors, and consultants of the Company may be eligible to receive awards under the 2007 Plan. Each stock option, when vested and exercised, and each RSU, when vested, entitles the holder to receive one share of common stock, subject to certain restrictions on their transfer and sale as defined in the 2007 Plan and related award agreements. As of certain portionsMarch 31, 2013, the Company had authorized the issuance of up to 49,848,157 shares of its application delivery portfoliocommon stock under the 2007 Plan, in addition to Radware, Ltd.,resulting in $182,924,125 shares of net proceeds. The assets and liabilitiescommon stock underlying certain continuation awards that were permitted to be issued at the time of the application delivery portfolioMerger. There remained 9,748,283 shares available for grant under the 2007 Plan as of March 31, 2013.
On February 25, 2013, Avaya’s Compensation Committee approved a stock option exchange program through which individuals holding market-based “multiple-of-money” and performance-based “EBITDA” stock options could exchange them on a three-for-one basis for RSUs. The replacement RSUs will vest in full in December 2013. The tender offer was closed on April 30, 2013 and 10,204,689 options were classifiedtendered for exchange. In connection with the exchange offer, 3,401,654 replacement RSUs were granted which have an effective grant date of May 6, 2013.
Option Awards
During the six months ended March 31, 2013, 1,769,500 time-based and 185,500 multiple-of-money options were granted in the ordinary course of business. All of the options expire ten years from the date of grant or upon cessation of employment, in which event there are limited exercise provisions allowed for vested options. Options granted between October 1, 2012 and November 30, 2012 have an exercise price of $4.00 per share. Options granted subsequent to November 30, 2012 have an exercise price of $3.00 per share.
Time-based options granted during the six months ended March 31, 2013 vest over their performance periods, generally four years. Compensation expense equal to the fair value of the option measured on the grant date is recognized utilizing graded attribution over the requisite service period.
Multiple-of-money options vest upon the achievement of defined returns on the Sponsors’ initial investment in the Company. Because vesting of the multiple-of-money market-based options is outside the control of the Company and the award recipients, compensation expense relative to the multiple-of-money options must be recognized upon the occurrence of a triggering event (e.g., sale or initial public offering of the Company).
The fair value of option awards is determined at the date of grant utilizing the Cox-Ross Rubinstein (“CRR”) binomial option pricing model which is affected by the fair value of common stock as held for sale in accordance with ASC 360, “Accountingwell as a number of complex and subjective assumptions. Expected volatility is based primarily on a combination of the Company’s peer group’s historical volatility and estimates of implied volatility of the Company’s peer group. The risk-free interest rate assumption was derived from reference to the U.S. Treasury Spot rates for the Impairment or Disposalexpected term of Long-Lived Assets.”the stock options. The dividend yield assumption is based on the Company’s current intent not to issue a dividend under its dividend policy. The expected holding period assumption was estimated based on the Company’s historical experience.
For the six months ended March 31, 2013 and 2012, the Company recognized share-based compensation associated with options issued under the 2007 Plan of $2 million and $3 million, respectively, which is included in costs and operating expenses.
Restricted Stock Units
The Company has issued RSUs each of which represents the right to receive one share of the Company’s common stock when fully vested.
The fair value of the RSUs is estimated by the Board of Directors on the respective dates of grant.
During the six months ended March 31, 2013, 555,003 RSUs were awarded in the ordinary course of business. For RSUs awarded between October 1, 2012 and November 30, 2012, the fair market value (as defined in the 2007 Plan) of these awards at the date of grant was $4.00 per share. For RSUs awarded subsequent to November 30, 2012, the fair market value (as defined in the 2007 Plan) of these awards at the date of grant was $3.00 per share.
At March 31, 2013, there were 3,436,684 awarded RSUs outstanding under the 2007 Plan, of which 1,716,876 were fully vested. For the six months ended March 31, 2013 and 2012, the Company recognized share-based compensation associated with RSUs granted under the 2007 Plan of $1 million and $2 million, respectively.
13. Net Loss Per Share
The following table summarizessets forth the computation of basic and diluted net assets and liabilitiesloss per share of common stock as discussed in Note 2, “Summary of Significant Accounting Policies—Net Loss Per Share” in our audited Consolidated Financial Statements for the application delivery portfolio as of December 31, 2008:fiscal year ended September 30, 2012:
Balance Sheets | ||||
Assets related to discontinued operations: | ||||
Accounts receivable, net | $ | 4 | ||
Inventories, net | 3 | |||
Other current assets | 1 | |||
Total current assets related to discontinued operations | 8 | |||
Plant and equipment, net | — | |||
Total assets related to discontinued operations | $ | 8 | ||
Liabilities related to discontinued operations: | ||||
Trade and other accounts payable | $ | 3 | ||
Other accrued liabilities | 6 | |||
Total liabilities related to discontinued operations | $ | 9 | ||
| Six months ended March 31, | ||||||||
| 2013 | 2012 | |||||||
Numerator (in millions): | ||||||||
Net loss attributable to Avaya Holdings Corp. | $ | (269 | ) | $ | (191 | ) | ||
Dividends on Series A preferred stock | (3 | ) | (3 | ) | ||||
Dividends on Series B preferred stock | (8 | ) | — | |||||
Accretion on Series B preferred stock | (10 | ) | — | |||||
|
|
|
| |||||
Net loss attributable to common stockholders | $ | (290 | ) | $ | (194 | ) | ||
|
|
|
| |||||
Denominator (in millions): | ||||||||
Weighted average common shares—basic and diluted | 489.3 | 489.3 | ||||||
|
|
|
| |||||
Net loss per share—basic and diluted* | $ | (0.59 | ) | $ | (0.40 | ) | ||
|
|
|
| |||||
| * | Basic net loss per share is computed by dividing the net loss attributable to common stockholders by the weighted average number of common shares outstanding during the period. Net loss attributable to common stockholders is increased for preferred stock dividends earned during the period. For the periods with net losses, all potentially dilutive common shares consisting of stock options, restricted stock units and warrants are antidilutive. |
14. Reportable Segments
Avaya conducts its business operations in three segments. Two of those segments, Global Communications Solutions (“GCS”) and Avaya Networking (“Networking”), make up Avaya’s Enterprise Collaboration Solutions (“ECS”) product portfolio. The third segment contains Avaya’s services portfolio and is called Avaya Global Services (“AGS”).
The following table summarizesGCS segment primarily develops, markets, and sells unified communications and contact center solutions by integrating multiple forms of communications, including telephone, e-mail, instant messaging and video. Avaya’s Networking segment’s portfolio of products offers integrated networking solutions which are scalable across customer enterprises. The AGS segment develops, markets and sells comprehensive end-to-end global service offerings that allow customers to evaluate, plan, design, implement, monitor, manage and optimize complex enterprise communications networks.
For internal reporting purposes, the resultsCompany’s chief operating decision maker makes financial decisions and allocates resources based on segment profit information obtained from the Company’s internal management systems. Management does not include in its segment measures of operationsprofitability selling, general, and administrative expenses, research and development expenses, amortization of intangible assets, and certain discrete items, such as charges relating to restructuring actions, impairment charges, and merger-related costs as these costs are not core to the application delivery portfolio, included in discontinued operationsmeasurement of segment management’s performance, but rather are controlled at the corporate level.
Summarized financial information relating to the Company’s reportable segments is shown in the combined statement of operations for the nine months ended September 30, 2009 and for the year ended December 31, 2008:following table:
| Nine months ended September 30, 2009 | Year ended December 31, 2008 | |||||||
Statements of Operations | ||||||||
Revenues | $ | 7 | $ | 57 | ||||
Costs, expenses and other expenses, net | (6 | ) | 62 | |||||
Gain (loss) from operations of the discontinued operations | 1 | (5 | ) | |||||
Income tax benefit | — | 2 | ||||||
Gain on sale of discontinued operations, net of tax | 14 | — | ||||||
Net income (loss) from discontinued operations | $ | 15 | $ | (3 | ) | |||
| Six months ended March 31, | ||||||||
In millions | 2013 | 2012 | ||||||
REVENUE | ||||||||
Global Communications Solutions | $ | 1,046 | $ | 1,241 | ||||
Avaya Networking | 114 | 146 | ||||||
|
|
|
| |||||
Enterprise Collaboration Solutions | 1,160 | 1,387 | ||||||
Avaya Global Services | 1,198 | 1,258 | ||||||
Unallocated Amounts(1) | — | (1 | ) | |||||
|
|
|
| |||||
| $ | 2,358 | $ | 2,644 | |||||
|
|
|
| |||||
GROSS PROFIT | ||||||||
Global Communications Solutions | $ | 619 | $ | 718 | ||||
Avaya Networking | 45 | 64 | ||||||
|
|
|
| |||||
Enterprise Collaboration Solutions | 664 | 782 | ||||||
Avaya Global Services | 626 | 609 | ||||||
Unallocated Amounts(1) | (38 | ) | (74 | ) | ||||
|
|
|
| |||||
| 1,252 | 1,317 | |||||||
In millions OPERATING EXPENSES Selling, general and administrative Research and development Amortization of intangible assets Goodwill impairment Restructuring and impairment charges, net Acquisition-related costs OPERATING (LOSS) INCOME INTEREST EXPENSE, LOSS ON EXTINGUISHMENT OF DEBT AND OTHER INCOME (EXPENSE), NET LOSS BEFORE INCOME TAXES Six months ended
March 31, 2013 2012 $ 765 $ 847 231 228 114 112 89 — 102 111 — 3 1,301 1,301 (49 ) 16 (228 ) (233 ) $ (277 ) $ (217 )
| (1) | Unallocated Amounts in Gross Profit include the effect of the amortization of acquired technology intangibles and costs that are not core to the measurement of segment management’s performance, but rather are controlled at the corporate level. Unallocated Amounts in Revenue and Gross Profit also include the impacts of certain fair value adjustments recorded in purchase accounting in connection with the Merger. |
17. Related party transactions15. Commitments and Contingencies
Legal Proceedings
In the ordinary course of business, the Businesses engageCompany is involved in transactions with certain related parties. These transactions are saleslitigation, claims, government inquiries, investigations and purchases of goods and services under usual trade terms and are measured at their exchange amounts.
The Businesses receive services and support functions from Nortel for the following functions among others: information technology, legal services, accounting and finance services, human resources, marketing and product support, product development, customer support, treasury, facility and other corporate and infrastructural services. The costs associated with these services generally include employee related costs, including payroll and benefit costs as well as overhead costs related to the support functions. Functional costs are charged to the Businesses based on utilization measuresproceedings, including, but not limited to, headcount. Where determinations based on utilization are impracticable, Nortel uses other methodsthose identified below, relating to intellectual property, commercial, employment, environmental and criteria suchregulatory matters.
Other than as global revenue, U.S. revenue, advertisingdescribed below, the Company believes there is no litigation pending or environmental and sales promotion spending, warehousing and delivery spending, and capital spending;regulatory matters against the Company that are believed to be reasonable estimates of costs attributable to the Businesses. All such amountscould have, been deemed to have been paid by the Businesses to Nortelindividually or in the period in whichaggregate, a material adverse effect on the costs were recorded. Total allocated expenses, including the employee benefits and share-based compensation for shared employees as discussed in Notes 12 and 14 and rental expense for shared assets as discussed in Note 19, recorded in these combinedCompany’s financial statements were as follows:
| Nine months ended September 30, 2009 | Year ended December 31, 2008 | |||||||
Cost of revenues | $ | 65 | $ | 111 | ||||
Selling, general and administrative expenses | 120 | 224 | ||||||
Research and development expenses | 39 | 70 | ||||||
Amortization of intangible assets | 1 | 1 | ||||||
Special charges | — | 61 | ||||||
Reorganization items | 108 | — | ||||||
Total allocated expenses | $ | 333 | $ | 467 | ||||
In addition, as discussed in Note 1, Nortel uses a centralized approach forposition, results of operations or cash management and to finance its operations. During the periods covered by these combined financial statements, cash deposits were remitted to Nortel on a regular basis and are reflected within net parent investment in invested equity in the combined balance sheets. Similarly, the Businesses’ cash disbursements were funded through Nortel’s cash accounts.
Transactions with other related parties for the nine months ended September 30, 2009 and the year ended December 31, 2008 are summarized as follows:
| Nine months ended September 30, 2009 | Year ended December 31, 2008 | |||||||
Revenues: | ||||||||
LGN(a) | $ | 6 | $ | 27 | ||||
Other | $ | — | $ | 3 | ||||
Total | $ | 6 | $ | 30 | ||||
For purposes of these combined financial statements, accounts receivable balances due from LGN have been included in net parent investment. As of September 30, 2009 and December 31, 2008, accounts receivable from other related parties were nil and $1, respectively. As of September 30, 2009 and December 31, 2008, accounts payable to related parties were nil.
The Businesses also enter into transactions with third parties jointly with other business units of Nortel. These transactions are not considered to be related party transactions and the Businesses’ share of the revenues and expenses are included in these combined financial statements.
18. Long-term debt
The following table shows the components of long-term debt of NGS as of the periods ended:
| September 30, 2009 | December 31, 2008 | |||||||
Obligations under capital leases and sale leasebacks with a weighted-average interest rate of 7.58% | $ | 28 | $ | 28 | ||||
| 28 | 28 | |||||||
Less: Long-term debt within one year | (2 | ) | (1 | ) | ||||
| $ | 26 | $ | 27 | |||||
As of September 30, 2009, the amounts of long-term debt payable for each of the following years ending December 31 consisted of:
2009 | $ | — | ||
2010 | 2 | |||
2011 | 2 | |||
2012 | 2 | |||
2013 | 3 | |||
Thereafter | 19 | |||
Total long-term debt payable | $ | 28 | ||
19. Commitments, guarantees and contingenciesflows.
Bid, performance-related and other bondsAntitrust Litigation
NortelIn 2006, the Company instituted an action in the U.S. District Court, District of New Jersey, against defendants Telecom Labs, Inc., TeamTLI.com Corp. and Continuant Technologies, Inc. and subsequently amended its complaint to include certain individual officers of these companies as defendants. Defendants purportedly provide maintenance services to customers who have purchased or leased the Company’s communications equipment. The Company asserts in its amended complaint that, among other things, defendants, or each of them, have engaged in tortious conduct and/or violated federal intellectual property laws by improperly accessing and utilizing the Company’s proprietary software, including passwords, logins and maintenance service permissions, to perform certain maintenance services on the Company’s customers’ equipment. Defendants have filed counterclaims against the Company, alleging a number of tort claims and alleging that the Company has entered into bid, performance-relatedviolated the Sherman Act’s prohibitions against anticompetitive conduct through the manner in which the Company sells its products and services. Defendants seek to recover the profits they claim they would have earned from maintaining Avaya’s products, and ask for injunctive relief prohibiting the conduct they claim is anticompetitive. Under the federal antitrust laws, defendants could be entitled to three times the amount of any actual damages awarded for lost profits plus attorney’s fees and costs. The parties have engaged in extensive discovery and motion practice to, among other bonds associatedthings, amend and dismiss pleadings and
compel and oppose discovery requests. In January 2012, Avaya’s motions to dismiss defendants’ counterclaims were granted in part and denied in part. In February 2012, the parties filed motions for reconsideration of certain aspects of the Court’s ruling and Avaya filed a motion for certification of an interlocutory appeal. The parties’ motions were denied on April 26, 2012. Expert discovery on the Company’s claims and the defendants’ surviving counter-claims is completed, and in July 2012 the parties filed motions to exclude the opinion testimony of certain of each others’ experts, which were denied without prejudice on August 28, 2012. On August 17, 2012, defendants filed motions for partial summary judgment, seeking to dismiss the Company’s claims for tortious interference with various contracts related tocontractual relations and misappropriation of trade secrets, which were denied on October 26, 2012. The trial has been scheduled for September 9, 2013. Therefore, at this time an outcome cannot be predicted and, as a result, the Businesses. Bid bonds generallyCompany cannot be assured that this case will not have a term of less than twelve months, dependingmaterial adverse effect on the lengthmanner in which it does business, its financial position, results of the bid period for the applicable contract. Other bonds primarily relate to warranty, rental, real estate and customs contracts. Performance-related and other bonds generally have a term consistent with the term of the underlying contract. The various contracts to which these bonds apply generally have terms ranging from one to five years. Any potential payments which might become due under these bonds would be related to the Businesses’ non-performance under the applicable contract. Historically, the Businesses have not made material payments under these types of bonds and do not anticipate that they will be required to make such payments during the pendency of the Creditor Protection Proceedings.operations, or cash flows.
The following table sets forth the maximum potential amount of future payments under bid, performance-related and other bonds, as of September 30, 2009 and December 31, 2008:
| September 30, 2009 | December 31, 2008 | |||||||
Bid and performance-related bonds(a) | $ | — | $ | 3 | ||||
Other bonds(b) | 1 | 1 | ||||||
Total bid, performance-related and other bonds | $ | 1 | $ | 4 | ||||
Purchase commitmentsIntellectual Property
In the ordinary course of business, the Company is involved in litigation alleging it has infringed upon third parties’ intellectual property rights, including patents; some litigation may involve claims for infringement against customers by third parties relating to the use of Avaya’s products, as to which the Company may provide indemnifications of varying scope to certain customers. These matters are on-going and the outcomes are subject to inherent uncertainties. As a result, the Company cannot be assured that any such matter will not have a material adverse effect on its financial position, results of operations or cash flows.
Other
In October 2009, a group of former employees of Avaya’s former Shreveport, Louisiana manufacturing facility brought suit in Louisiana state court, naming as defendants Alcatel-Lucent USA, Inc., Lucent Technologies Services Company, Inc., and AT&T Technologies, Inc. The former employees allege hearing loss due to hazardous noise exposure from the facility dating back over forty years, and stipulate that the total amount of each individual’s damages does not exceed fifty thousand dollars. In February 2010 plaintiffs amended their complaint to add the Company as a named defendant. There are 101 plaintiffs in the case. Defendants’ motion to dismiss plaintiffs’ complaint was denied on April 30, 2012. At this time an outcome cannot be predicted however, because the amounts of the claims are not material, the Company believes the outcome of this matter will not have a material adverse effect on the manner in which it does business, its financial position, results of operations, or cash flows.
General
The Businesses have entered into purchase commitments with certain suppliers under which it commits to buy a minimum amount or percentage of designated products or services in exchangeCompany records accruals for price guarantees or similar concessions. In certain of these agreements, the Businesses may be required to acquire and pay for such products or services uplegal contingencies to the prescribed minimum or forecasted purchases. As of September 30, 2009, the Businesses had aggregate purchase commitments of $3, primarily related to commitments expected to be made in 2010. In accordance with the agreements with certain of its inventory suppliers, the Businesses recordextent that it has concluded it is probable that a liability for firm, non-cancelable,has been incurred and unconditional purchase commitments for quantities purchasedthe amount of the loss can be reasonably estimated. No estimate of the possible loss or range of loss in excess of future demand forecasts.
The following table sets forth the expected purchase commitments as of September 30, 2009 toamounts accrued, if any, can be made overat this time regarding the next several years:
| 2009 | 2010 | 2011 | Thereafter | Total Obligations | ||||||||||||||||
Purchase commitments | $ | 1 | $ | 1 | $ | 1 | $ | — | $ | 3 | ||||||||||
Amounts paidmatters specifically described above because the inherently unpredictable nature of legal proceedings may be exacerbated by various factors, including: (i) the Businesses underdamages sought in the above purchase commitments duringproceedings are unsubstantiated or indeterminate; (ii) discovery is not complete; (iii) the nine months ended September 30, 2009 andproceeding is in its early stages; (iv) the year ended December 31, 2008 were $7 and $4, respectively.matters present legal uncertainties; (v) there are significant facts in dispute; (vi) there are a large number of parties (including where it is uncertain how liability, if any, will be shared among multiple defendants); or (vii) there is a wide range of potential outcomes.
Operating leasesProduct Warranties
The Company recognizes a liability for the estimated costs that may be incurred to remedy certain deficiencies of quality or performance of the Company’s products. These product warranties extend over a specified period of time generally ranging up to two years from the date of sale depending upon the product
subject to the warranty. The Company accrues a provision for estimated future warranty costs based upon the historical relationship of warranty claims to sales. The Company periodically reviews the adequacy of its product warranties and adjusts, if necessary, the warranty percentage and accrued warranty reserve, which is included in other current and non-current liabilities in the Consolidated Balance Sheets, for actual experience.
In millions | ||||
Balance as of October 1, 2012 | $ | 16 | ||
Reductions for payments and costs to satisfy claims | (8 | ) | ||
Accruals for warranties issued during the period | 8 | |||
|
| |||
Balance as of March 31, 2013 | $ | 16 | ||
|
| |||
Guarantees of Indebtedness and Other Off-Balance Sheet Arrangements
Letters of Credit
As of September 30, 2009, the future minimum payments under direct operating leases that are specifically related to the Businesses consisted of:
2009 | $ | 2 | ||
2010 | 6 | |||
2011 | 4 | |||
2012 | 2 | |||
2013 | 1 | |||
Thereafter | — | |||
Total future minimum payments | $ | 15 | ||
Rental expense on operating leases that are specifically related to the Businesses for the nine months ended September 30, 2009 and the year ended December 31, 2008, net of applicable sublease income, amounted to $3 and $8, respectively. In addition, these combined financial statements reflect rental charges for the Businesses’ usage of shared Nortel assets in the amount of $92 and $166 for the nine months ended September 30, 2009 and the year ended December 31, 2008.
Nortel and Microsoft Corporation Alliance
In the third quarter of 2006, Nortel and Microsoft Corporation (“Microsoft”) entered into a four-year agreement, with provisions for extension, to form a strategic alliance to jointly develop, market and sell communications solutions, which are applicable to the Businesses. This strategic alliance is substantially related to the Enterprise Solutions business product portfolio and is directed and managed by the Enterprise Solutions business. Under the agreement, Nortel and Microsoft agreed to form joint teams to collaborate on product development spanning enterprise, mobile and wireline carrier solutions. The agreement engages the companies at the technology, marketing and business levels and includes joint product development, solutions and systems integration and go-to-market initiatives. Both companies will invest resources in marketing, business development and delivery.
Microsoft will make available to Nortel up to $52 in marketing and telephony systems integration funds to be offset against marketing costs incurred by Nortel, and up to $40 in research and development funds over the initial four year term of the agreement. Payments are received by Nortel upon Nortel achieving certain mutually agreed upon performance metrics. Microsoft will recoup its payment of research and development funds by receiving payments from Nortel of 5% of revenue over a mutually agreed upon enterprise voice and application business base plan. Any research and development funds that have not been recouped must be repaid in full by Nortel to Microsoft by March 31, 2012. As2013, the Company had outstanding an aggregate of September 30, 2009, Nortel has not received any$119 million in irrevocable letters of credit which ensure the research and development funds from Microsoft.
Microsoft and Nortel will each retain all revenues from salesCompany’s performance or licensespayment to third parties. Included in this amount is $76 million issued under its $535 million committed revolving credit facilities, which facilities are available through October 26, 2016. Also included is $43 million of each party’s respective software, sales or leasingletters of each party’s respective hardware and delivery of services to customers and partners in accordance with separate agreements with each party’s respective channel partners and/or customers.credit issued under uncommitted facilities.
Concentrations of riskSurety Bonds
The BusinessesCompany arranges for the issuance of various types of surety bonds, such as license, permit, bid and performance bonds, which are agreements under which the surety company guarantees that the Company will perform ongoing credit evaluationsin accordance with contractual or legal obligations. These bonds vary in duration although most are issued and outstanding from three months to three years. These bonds are backed by $12 million of their customersthe Company’s letters of credit. If the Company fails to perform under its obligations, the maximum potential payment under these surety bonds is $12 million as of March 31, 2013. Historically, no surety bonds have been drawn upon.
Purchase Commitments and with the exception of certain financing transactions, does not require collateral from their customers. The Businesses’ global market presence has resulted in a large number of diverse customers which reduces concentrations of credit risk.Termination Fees
The Businesses receive certain of theirCompany purchases components from sole suppliers. Additionally, the Businesses rely on a limited numbervariety of suppliers and uses several contract manufacturers and suppliers to provide manufacturing services for theirits products. The inabilityDuring the normal course of abusiness, in order to manage manufacturing lead times and to help assure adequate component supply, the Company enters into agreements with contract manufacturer or supplier to fulfill supply requirements of the Businesses could materially impact future operating results.
Guarantees
Nortel has entered into guarantees that meet the definition of a guarantee under FASB Interpretation No. 45, “Guarantor’s Accounting and Disclosure Requirements for Guarantees, Including Indirect Guarantees of Indebtedness of Other” (“FIN 45”), which is now codified as ASC 460-10. These arrangements create two types of obligations for Nortel:
These guarantees require it make payments (either in cash, financial instruments, NNC common shares or through the provision of services) to a third party that will be triggered as a result of changes in an underlying economic characteristic (such as interest rates or market value) that is related to an asset, liability or an equity
security of the guaranteed party or a third party’s failure to perform under a specific agreement. Included within Nortel’s guarantees are agreements Nortel has periodically entered into with customersmanufacturers and suppliers that include intellectual property indemnification obligations that are customary inallow them to produce and procure inventory based upon forecasted requirements provided by the industry. These agreements generally require Nortel to compensateCompany. If the other party for certain damages and costs incurred as a result of third party intellectual property claims arising from these transactions. These types of guarantees typically have indefinite terms; however, under some agreements, Nortel has provided specific terms extending to February 2011. As of September 30, 2009, Nortel has not made any payments to settle such claims andCompany does not expect to do so in the future. The nature of such guarantees and indemnification agreements generally prevent Nortel from making a reasonable estimate of the maximum potential amountmeet these specified purchase commitments, it could be required to purchase the inventory, or in the case of certain agreements, pay an early termination fee. Historically, the Company has not been required to pay a charge for not meeting its designated purchase commitments with these suppliers, but has been obligated to purchase certain excess inventory levels from its outsourced manufacturers due to actual sales of product varying from forecast and due to transition of manufacturing from one vendor to another.
The Company’s outsourcing agreements with its most significant contract manufacturers expire in July and September 2013. After the initial term, the outsourcing agreements are automatically renewed for successive periods of twelve months each, subject to specific termination rights for the Company and the contract manufacturers. All manufacturing of the Company’s products is performed in accordance with either detailed requirements or specifications and product designs furnished by the Company, and is subject to rigorous quality control standards.
Product Financing Arrangements
The Company sells products to various resellers that may obtain financing from certain unaffiliated third-party lending institutions. For the Company’s product financing arrangement with resellers outside the U.S., in the event participating resellers default on their payment obligations to the lending institution, the Company is obligated under such agreements.certain circumstances to guarantee repayment to the lending institution. The carryingrepayment amount fluctuates with the level of product financing activity. The guaranteed repayment amount was approximately $3 million as of March 31, 2013. The Company reviews and sets the maximum credit limit for each reseller participating in this financing arrangement. Historically, there have not been any guarantee repayments by the Company. The Company has estimated the fair value of this guarantee as of March 31, 2013, and has determined that it is not significant. There can be no assurance that the Businesses’ liability for their obligationsCompany will not be obligated to repurchase inventory under Nortel’s guarantees at September 30, 2009 and December 31, 2008 is nil and nil, respectively,this arrangement in these combined financial statements.the future.
Creditor Protection ProceedingsLong-Term Cash Incentive Bonus Plan
Generally, as a result of the Creditor Protection Proceedings, as outlined in Note 2, all actions to enforce or otherwise effect payment or repayment of liabilities of any Debtor preceding the Petition Date, as well as pending litigation against any Debtor, are stayed as of the Petition Date. Absent further order of the applicable courts and subject to certain exceptions, no party may take any action to recover on pre-petition claims against any Debtor.
20. Liabilities subject to compromise
As described in Note 2, as a result of the Creditor Protection Proceedings, pre-petition liabilities may be subject to compromise or other treatment and generally, actions to enforce or otherwise effect payment of pre-petition liabilities are stayed. Although pre-petition claims are generally stayed, under the Creditor Protection Proceedings, the Debtors are permitted to undertake certain actions designed to stabilize the Debtors’ operations including, among other things, payment of employee wages and benefits, maintenance of Nortel’s cash management system, satisfaction of customer obligations, payments to suppliers for goods and services received after the Petition Date and retention of professionals. The Debtors have been paying and intend to continue to pay undisputed post-petition claims in the ordinary course of business. As further described in Note 2, under the Creditor Protection Proceedings, the Debtors have certain rights, which vary by jurisdiction, to reject, repudiate or no longer continue to perform various types of contracts or arrangements. Damages resulting from rejecting, repudiating or no longer continuing to perform a contract or arrangement are treated as general unsecured claims and will be classified as liabilities subject to compromise.
Pre-Petition Date liabilities of the Debtors that are subject to compromise are reported at the claim amounts expected to be allowed, even if they may be settled for lesser amounts. The amounts currently classified as liabilities subject to compromise may be subject to future adjustments depending on actions of the applicable courts, further developments with respect to disputed claims, determinations of the secured status of certain claims, if any, the values of any collateral securing such claims, or other events.
Liabilities subject to compromise as of September 30, 2009 consist of the following:
Trade and other accounts payable | $ | 120 | ||
Restructuring liabilities | 71 | |||
Contractual liabilities | 1 | |||
Other accrued liabilities | 6 | |||
Total liabilities subject to compromise | $ | 198 | ||
21. Subsequent events
The Company has evaluated subsequent events upestablished a long-term incentive cash bonus plan (“LTIP”). Under the LTIP, the Company will make cash awards available to Decembercompensate certain key employees upon the achievement of defined returns on the Sponsors’ initial investment in the Company (a “triggering event”). The Company has authorized LTIP awards covering a total of $60 million, of which $42 million in awards were outstanding as of March 31, 2013. The Company will begin to recognize compensation expense relative to the LTIP awards upon the occurrence of a triggering event (e.g., a sale or initial public offering). As of March 31, 2013, no compensation expense associated with the LTIP has been recognized.
Credit Facility Indemnification
In connection with its obligations under the credit facilities described in Note 7, 2009“Financing Arrangements,” the Company has agreed to indemnify the third-party lending institutions for costs incurred by the institutions related to changes in accordancetax law or other legal requirements. While there have been no amounts paid to the lenders pursuant to this indemnity in the past, there can be no assurance that the Company will not be obligated to indemnify the lenders under this arrangement in the future.
Transactions with ASC 855Alcatel-Lucent
Pursuant to the Contribution and such eventsDistribution Agreement effective October 1, 2000, Lucent Technologies, Inc. (now Alcatel-Lucent) contributed to the Company substantially all of the assets, liabilities and operations associated with its enterprise networking businesses (the “Company’s Businesses”) and distributed the Company’s stock pro-rata to the shareholders of Lucent (“distribution”). The Contribution and Distribution Agreement, among other things, provides that, in general, the Company will indemnify Alcatel-Lucent for all liabilities including certain pre-distribution tax obligations of Alcatel-Lucent relating to the Company’s Businesses and all contingent liabilities primarily relating to the Company’s Businesses or otherwise assigned to the Company. In addition, the Contribution and Distribution Agreement provides that certain contingent liabilities not allocated to one of the parties will be shared by Alcatel-Lucent and the Company in prescribed percentages. The Contribution and Distribution Agreement also provides that each party will share specified portions of contingent liabilities based upon agreed percentages related to the business of the other party that exceed $50 million. The Company is unable to determine the maximum potential amount of other future payments, if any, that it could be required to make under this agreement.
The Tax Sharing Agreement governs Alcatel-Lucent’s and the Company’s respective rights, responsibilities and obligations after the distribution with respect to taxes for the periods ending on or before the distribution. Generally, pre-distribution taxes or benefits that are disclosed herein.clearly attributable to the business of one party will be borne solely by that party, and other pre-distribution taxes or benefits will be shared by the parties based on a formula set forth in the Tax Sharing Agreement. The Company may be subject to additional taxes or benefits pursuant to
the Tax Sharing Agreement related to future settlements of audits by state and local and foreign taxing authorities for the periods prior to the Company’s separation from Alcatel-Lucent.
16. Condensed Financial Information of Parent Company
Avaya Holdings Corp. has no material assets or standalone operations other than its ownership in Avaya Inc. and its subsidiaries.
There are significant restrictions on the Company’s ability to obtain funds from any of its subsidiaries through dividends, loans or advances. Accordingly, these condensed financial statements have been presented on a “Parent-only” basis. Under a Parent-only presentation, the Company’s investments in its consolidated subsidiaries are presented under the equity method of accounting. These Parent-only financial statements should be read in conjunction with the Company’s Consolidated Financial Statements.
The following tables present the financial position of Avaya Holdings Corp. as of March 31, 2013 and September 30, 2012 and the results of its operations and cash flows for the six months ended March 31, 2013 and 2012.
Avaya Holdings Corp.
Condensed Balance Sheets
In millions | March 31, 2013 | September 30, 2012 | ||||||
Cash and cash equivalents | $ | 1 | $ | 1 | ||||
|
|
|
| |||||
LIABILITIES, DEFICIENCY IN EXCESS OF INVESTMENT IN AVAYA INC., PREFERRED STOCK AND STOCKHOLDERS’ DEFICIENCY | ||||||||
Due to Avaya Inc. | $ | 3 | $ | 3 | ||||
Other current liabilities | 10 | 26 | ||||||
Note payable to Avaya Inc. | 18 | 8 | ||||||
Deficiency in excess of investment in Avaya Inc. | 2,713 | 2,436 | ||||||
Commitments and contingencies | ||||||||
Preferred stock, Series B | 245 | 227 | ||||||
Preferred stock, Series A | 147 | 144 | ||||||
Stockholders’ deficiency | (3,135 | ) | (2,843 | ) | ||||
|
|
|
| |||||
TOTAL | $ | 1 | $ | 1 | ||||
|
|
|
| |||||
Avaya Holdings Corp.
Condensed Statements of Operations
| Six months ended March 31, | ||||||||
In millions | 2013 | 2012 | ||||||
Equity in net loss of Avaya Inc. | $ | (277 | ) | $ | (188 | ) | ||
Change in fair value of Preferred Series B derivative | 8 | — | ||||||
Securities registration fees | — | (3 | ) | |||||
|
|
|
| |||||
LOSS BEFORE INCOME TAXES | (269 | ) | (191 | ) | ||||
Provision for income taxes | — | — | ||||||
|
|
|
| |||||
NET LOSS | $ | (269 | ) | $ | (191 | ) | ||
|
|
|
| |||||
Avaya Holdings Corp.
Condensed Statements of Comprehensive Loss
| Six months ended March 31, | ||||||||
In millions | 2013 | 2012 | ||||||
Net loss | $ | (269 | ) | $ | (191 | ) | ||
Equity in comprehensive (loss) income of Avaya Inc. | (3 | ) | 52 | |||||
|
|
|
| |||||
Comprehensive loss | $ | (272 | ) | $ | (139 | ) | ||
|
|
|
| |||||
Avaya Holdings Corp.
Condensed Statements of Cash Flows
| Six months ended March 31, | ||||||||
In millions | 2013 | 2012 | ||||||
Net loss | $ | (269 | ) | $ | (191 | ) | ||
Adjustments to reconcile net loss to net cash used by operating activities | ||||||||
Equity in net loss of Avaya Inc. | 277 | 188 | ||||||
Change in fair value of Preferred Series B derivative | (8 | ) | — | |||||
Changes in operating assets and liabilities | — | 3 | ||||||
|
|
|
| |||||
Net cash used for operating activities | — | — | ||||||
Investing activities: | ||||||||
Acquisition of businesses, net of cash acquired | (10 | ) | (22 | ) | ||||
|
|
|
| |||||
Net cash used for investing activities | (10 | ) | (22 | ) | ||||
Financing activities: | ||||||||
Proceeds from loan from Avaya Inc. | 10 | 8 | ||||||
|
|
|
| |||||
Net cash provided by financing activities | 10 | 8 | ||||||
Net increase in cash and cash equivalents | — | (14 | ) | |||||
Cash and cash equivalents at beginning of period | 1 | 15 | ||||||
|
|
|
| |||||
Cash and cash equivalents at end of period | $ | 1 | $ | 1 | ||||
|
|
|
| |||||
PART II
INFORMATION NOT REQUIRED IN PROSPECTUS
| Item 13. | Other Expenses of Issuance and Distribution |
The following table sets forth the fees and expenses, other than the underwriting discounts and commissions, payable by us in connection with the registration of the shares of common stock hereunder. All amounts are estimates except the Securities and Exchange Commission registration fee and the FINRA filing fee.
Securities and Exchange Commission registration fee | $ | 116,100 | $ | 116,100 | ||||
FINRA filing fee | 75,000 | 75,500 | ||||||
Stock exchange listing fee | * | * | ||||||
Printing and engraving expenses | * | * | ||||||
Legal fees and expenses | * | * | ||||||
Accounting fees and expenses | * | * | ||||||
Transfer Agent and Registrar fees | * | * | ||||||
Miscellaneous expenses | * | * | ||||||
Total Expenses | $ | * | $ | * |
| * | To be filed by amendment. |
| Item 14. | Indemnification of Directors and Officers |
Section 102(b)(7) of the DGCL enables a corporation in its original certificates of incorporation or an amendment thereto to eliminate or limit the personal liability of a director for violations of the director’s fiduciary duty, except (i) for any breach of the director’s duty of loyalty to the corporation or its stockholders, (ii) for acts or omissions not in good faith or which involve intentional misconduct or a knowing violation of law, (iii) for liability of directors for unlawful payment of dividends or unlawful stock purchase or redemptions pursuant to Section 174 of the DGCL or (iv) for any transaction from which a director derived an improper personal benefit. Our certificate of incorporation includes a provision that eliminates the personal liability of directors for monetary damages for actions taken as a director to the fullest extent authorized by the DGCL.
Section 145(a) of the DGCL provides in relevant part that a corporation may indemnify any person who was or is a party or is threatened to be made a party to any threatened, pending or completed action, suit or proceeding (other than an action by or in the right of the corporation) by reason of the fact that such person is or was a director or officer of the corporation, or is or was serving at the request of the corporation as a director or officer of another entity, against expenses (including attorneys’ fees), judgments, fines and amounts paid in settlement actually and reasonably incurred by such person in connection with such action, suit or proceeding if such person acted in good faith and in a manner such person reasonably believed to be in or not opposed to the best interests of the corporation, and, with respect to any criminal action or proceeding, had no reasonable cause to believe such person’s conduct was unlawful. The termination of any action, suit or proceeding by judgment, order, settlement, conviction or upon a plea ofnolo contendere or its equivalent, shall not, of itself, create a presumption that such person did not act in good faith and in a manner which such person reasonably believed to be in or not opposed to the best interests of the corporation, and, with respect to any criminal action or proceeding, had reasonable cause to believe that such person’s conduct was lawful.
Section 145(b) of the DGCL provides in relevant part that a corporation may indemnify any person who was or is a party or is threatened to be made a party to any threatened, pending or completed action or suit by or in the right of the corporation to procure a judgment in its favor by reason of the fact that the person is or was a director or officer of the corporation, or is or was serving at the request of the corporation as a director or officer of another entity, against expenses (including attorneys’ fees) actually and reasonably incurred by such person in connection with the defense or settlement of such action or suit if the person acted in good faith and in a manner the person reasonably believed to be in or not opposed to the best interests of the corporation and except that no
II-1
indemnification shall be made in respect of any claim, issue or matter as to which such person shall have been adjudged to be liable to the corporation unless and only to the extent that the Court of Chancery or the court in which such action or suit was brought shall determine upon application that, despite the adjudication of liability but in view of all the circumstances of the case, such person is fairly and reasonably entitled to indemnity for such expenses which the Court of Chancery or such other court shall deem proper.
Our certificate of incorporation that will be in effect upon the closing of this offering will provide that we will indemnify our directors and officers to the fullest extent permitted by law. Our certificate of incorporation also will provide that the indemnification and advancement of expenses provided by, or granted pursuant to the certificate of incorporation, are not exclusive of any other rights to which those seeking indemnification or advancement of expenses may be entitled under any bylaw, agreement, vote of stockholders or otherwise. Section 145(f) of the DGCL further provides that a right to indemnification or to advancement of expenses arising under a provision of the certificate of incorporation shall not be eliminated or impaired by an amendment to such provision after the occurrence of the act or omission which is the subject of the civil, criminal, administrative or investigative action, suit or proceeding for which indemnification or advancement of expenses is sought.
We have also entered into indemnification agreements with certain of our directors and officers. Such agreements generally provide for indemnification by reason of being our director or officer, as the case may be. These agreements are in addition to the indemnification provided by our charters and bylaws.
We have also obtained officers’ and directors’ liability insurance that insures against liabilities that officers and directors of the registrant may, in such capacities, incur. Section 145(g) of the DGCL provides that a corporation shall have power to purchase and maintain insurance on behalf of any person who is or was a director or officer of the corporation, or is or was serving at the request of the corporation as a director or officer of another entity, against any liability asserted against such person and incurred by such person in any such capacity, or arising out of such person’s status as such, whether or not the corporation would have the power to indemnify such person against such liability under that section.
| Item 15. | Recent Sales of Unregistered Securities |
Equity Securities
In connection with the closing of the Merger, on October 26, 2007, we issued 1,592,970 Continuation Options with an exercise price of $1.25 per share, and 1,331,155 continuation units resulting from the rollover of certain equity awards. For more information on continuation options and continuation units issued in connection with the Merger, see “Executive Compensation—Elements of Executive Officer Compensation—Long-Term Incentives.” Of the continuation options issued on the closing of the Merger, options representing shares of 1,037,609 and 125,600 shares were exercised in fiscal years 2009 and 2010, respectively, resulting in the issuance of common stock representing 380,347 and 42,026 shares, during each of fiscal years 2009 and 2010, respectively. In fiscal year 2008, continuation units representing 358,814 shares were cancelled. The continuation options, continuation units and net shares were issued without registration in reliance on the exemptions afforded by Section 4(2)4(a)(2) of the Securities Act and pursuant to Rule 506 of Regulation D promulgated under the Securities Act.
During the year ended September 30, 2008, we granted to certain eligible participants 110,000 RSUsrestricted stock units and options to purchase 39,185,000 shares of common shares under the 2007 Plan. The exercise price for each of these options was $5.00 per share. During the year ended September 30, 2008, options representing 8,570,000 shares were cancelled. The restricted stock units and options were issued without registration in reliance on the exemption afforded by Section 4(2)4(a)(2) of the Securities Act, as a transaction by an issuer not involving a public offering, or Rule 701 promulgated under Section 3(b) of the Securities Act, as a transaction pursuant to a compensatory benefit plan.
II-2
During the year ended September 30, 2009, we granted to certain eligible participants 730,789 restricted stock units and options to purchase 12,555,000 common shares under the 2007 Plan. The exercise price for each of these options was $3.80 per share. During the year ended September 30, 2009 options representing 11,874,469 shares were cancelled. The restricted stock units and options were issued without registration in reliance on the exemption afforded by Section 4(2)4(a)(2) of the Securities Act, as a transaction by an issuer not involving a public offering, or Rule 701 promulgated under Section 3(b) of the Securities Act, as a transaction pursuant to a compensatory benefit plan.
Following the completion of fiscal year 2009, we extended an offer to our outstanding stock option holders to exchange their existing stock options having an exercise price equal to or greater than $3.80 per share for new stock options in a one-for-one option exchange. The new “replacement” stock options were awarded on November 17, 2009 (“replacement option date of grant”) following the completion of the exchange offer, have an exercise price of $3.00 per share, which was the fair market value of a share of our common stock on the replacement option date of grant, and have new vesting provisions. In aggregate there were 30,890,000 stock options eligible for exchange, for which 28,595,000 were validly tendered in the offer. No consideration was paid to the registrant by any recipient. The replacement stock options were issued without registration in reliance on the exemptions afforded by Section 3(a)(9) of the Securities Act, as an exchange by the issuer with its existing security holders without commission.
The purchase price for the NES acquisition was funded, in part, with the issuance on December 18, 2009 of (a) warrants to acquire 100,000,000 shares of our common stock at a price of $3.25 per share, which warrants are exercisable at any time prior to December 18, 2019 at an exercise price of $3.25 per share, and (b) 125,000 shares of our Series A Preferred Stock. The issuance of warrants and Series A Preferred Stock was consummated without registration in reliance on the exemption afforded by Section 4(2)4(a)(2) of the Securities Act as a transaction by an issuer not involving a public offering. All of the shares of our Series A Preferred Stock will be redeemed with the proceeds of this offering.
During the year ended September 30, 2010, we granted to certain eligible participants 495,000 restricted stock units and options to purchase 17,925,000 common shares under the 2007 Plan, excluding options granted in conjunction with the exchange offer noted above. The exercise price for each of these options was $3.00 per share. During the year ended September 30, 2010 restricted stock units representing 15,000 shares, and options representing 5,086,487 shares were cancelled, exclusive of the options cancelled in the exchange offer. The restricted stock units and options were issued without registration in reliance on the exemption afforded by Section 4(2)4(a)(2) of the Securities Act, as a transaction by an issuer not involving a public offering, or Rule 701 promulgated under Section 3(b) of the Securities Act, as a transaction pursuant to a compensatory benefit plan.
During the six monthsyear ended March 31,September 30, 2011, we granted to certain eligible participants 115,000305,000 restricted stock units and options to purchase 4,025,0006,870,000 common shares under the 2007 Plan. TheOptions granted prior to May 2011 have an exercise price for each of these$3.00 per share and options was $3.00granted subsequent to May 2011 have an exercise price or $4.40 per share. During the six monthsyear ended March 31,September 30, 2011 restricted stock units representing 65,789 shares, and options representing 4,086,0887,353,528 shares were cancelled. The restricted stock units and options were issued without registration in reliance on the exemption afforded by Section 4(2)4(a)(2) of the Securities Act, as a transaction by an issuer not involving a public offering, or Rule 701 promulgated under Section 3(b) of the Securities Act, as a transaction pursuant to a compensatory benefit plan.
During the three months ended December 31, 2011, we granted to certain eligible participants 778,182 restricted stock units and options to purchase 2,027,253 common shares under the 2007 Plan. The exercise price for each of these options was $4.40 per share. During the three months ended December 31, 2011 restricted stock units representing 50,000 shares, and options representing 1,869,422 shares were cancelled. The restricted stock units and options were issued without registration in reliance on the exemption afforded by Section 4(a)(2) of the Securities Act, as a transaction by an issuer not involving a public offering, or Rule 701 promulgated under Section 3(b) of the Securities Act, as a transaction pursuant to a compensatory benefit plan.
II-3
The purchase price for the Radvision acquisition was funded, in part, with the issuance on May 29, 2012 of (a) warrants to acquire 24,500,000 shares of our common stock at a price of $4.00 per share, which warrants are exercisable at any time prior to May 29, 2022 at an exercise price of $4.00 per share, and (b) 48,921 shares of our Series B Preferred Stock, which is convertible at any time at a price equal to the lesser of (1) $4.00 per share (subject to certain anti-dilution provisions) and (2) the offering price per share in this offering. The issuance of warrants and Series B Preferred Stock was consummated without registration in reliance on the exemption afforded by Section 4(a)(2) of the Securities Act as a transaction by an issuer not involving a public offering.
During the year ended September 30, 2012, we granted to certain eligible participants 1,956,115 restricted stock units and options to purchase 5,762,253 common shares under the 2007 Plan. Options granted prior to May 2012 have an exercise price of $4.40 per share and options granted subsequent to May 2012 have an exercise price of $4.00 per share. During the year ended September 30, 2012 restricted stock units representing 220,682 shares, and options representing 9,916,162 shares were cancelled. The restricted stock units and options were issued without registration in reliance on the exemption afforded by Section 4(a)(2) of the Securities Act, as a transaction by an issuer not involving a public offering, or Rule 701 promulgated under Section 3(b) of the Securities Act, as a transaction pursuant to a compensatory benefit plan.
Following the completion of fiscal year 2012, we extended an offer to certain of our outstanding stock option holders to exchange certain of their existing stock options for restricted stock units. Option holders who participated in the exchange program received three “replacement” restricted stock units for each stock option exchanged. The new restricted stock units were awarded on May 6, 2013 (“replacement RSU date of grant”) following the completion of the exchange offer and have new vesting provisions. The fair market value of a share of our common stock on the replacement RSU date of grant was equal to or less than the exercise price of each option exchanged. In aggregate there were 11,494,439 stock options eligible for exchange, for which 10,204,689 were validly tendered in the offer. No consideration was paid to the registrant by any recipient. The replacement restricted stock units were issued without registration in reliance on the exemptions afforded by Section 3(a)(9) of the Securities Act, as an exchange by the issuer with its existing security holders without commission.
With regard to the foregoing, to the extent an individual acquires shares of our common stock upon exercise of a stock option or vesting of an RSU,a restricted stock unit, those shares are subject to the restrictions on transfer and other provisions contained in a stockholders’ agreement.
Debt Securities
On October 24, 2008, Avaya Inc. issued $700 million of senior unsecured cash-pay notes and $750 million of senior unsecured PIK toggle notes upon conversion of the senior cash-pay loans and the senior PIK toggle
II-3
loans. The issuance of the senior unsecured cash-pay notes and senior unsecured PIK toggle notes was conducted pursuant to the exemptions afforded by Section 4(2)4(a)(2) of the Securities Act, as a transaction by an issuer not involving a public offering. The interest rate for the cash-pay notes is fixed at 9.75% and the interest rates for the cash interest and PIK interest portions of the PIK-toggle notes are fixed at 10.125% and 10.875%, respectively. In connection with the conversion of the senior cash-pay loans and the senior PIK toggle loans, Avaya Inc. and the guarantors of the outstanding notes entered into a registration rights agreement in which they agreed, among other things, to file a registration statement to exchange the notes for similar notes registered under the Securities Act. The registration statement on Form S-4 registering such notes was filed with the Securities and Exchange Commission on December 23, 2009 and declared effective on January 14, 2010.
On February 11, 2011, Avaya Inc. issued $1,009 million aggregate principal amount of its 7.00% Senior Secured Notes due 2019 at an issue price of 100% of the principal amount of the notes, pursuant to the exemptions afforded by Section 4(2)4(a)(2) of the Securities Act, as a transaction by an issuer not involving a public offering, to “qualified institutional buyers” in the United States as defined in Rule 144A of the Securities Act, and outside the United States pursuant to Regulation S under the Securities Act. These notes mature on April 1,
II-4
2019 and bear interest at a rate of 7.00% per annum, payable semi-annually on April 1 and October 1 of each year, commencing on October 1, 2011. All of the proceeds from the offering were used to repay term B-2 loans outstanding under Avaya Inc.’s senior secured credit facility.
On December 21, 2012, Avaya Inc. issued $290 million aggregate principal amount of its 9.00% Senior Secured Notes due 2019 at an issue price of 100% of the principal amount of the notes, pursuant to the exemptions afforded by Section 4(a)(2) of the Securities Act, as a transaction by an issuer not involving a public offering, to “qualified institutional buyers” in the United States as defined in Rule 144A of the Securities Act, and outside the United States pursuant to Regulation S under the Securities Act. These notes mature on April 1, 2019 and bear interest at a rate of 7.00%9.00% per annum, payable semi-annually on April 1 and October 1 of each year, commencing on OctoberApril 1, 2011.2013. All of the proceeds from the offering were used to repay term B-2B-5 loans outstanding under Avaya Inc.’s senior secured credit facility.
On March 7, 2013, Avaya Inc. completed an exchange offer in which $642 million of its 9.75% senior unsecured cash-pay notes due 2015 and $742 million of 10.125%/10.875% senior unsecured PIK toggle notes due November 1, 2015 were exchanged for $1,384 million of 10.50% senior secured notes due March 1, 2021. The 10.50% Senior Secured Notes were issued at par, bear interest at a rate of 10.50% per annum and mature on March 1, 2021. The 10.5% Senior Secured Notes were issued without registration in reliance on the exemptions afforded by Section 4(a)(2) of the Securities Act, as a transaction by an issuer not involving a public offering, to “qualified institutional buyers” in the United States as defined in Rule 144A of the Securities Act, and outside the United States pursuant to Regulation S under the Securities Act.
| Item 16. | Exhibits and Financial Statement Schedules |
(a) Exhibits
Exhibit | Exhibit Title | |||
| 1.1 | Form of Underwriting Agreement* | |||
| 3.1 | Amended and Restated Certificate of Incorporation of Avaya Holdings Corp. (to be effective upon completion of this offering)* | |||
| 3.2 | Amended and Restated By-Laws of Avaya Holdings Corp. (to be effective upon completion of this offering)* | |||
| 4.1 | Exchange Note Indenture, dated as of October 24, 2008, by and among Avaya Inc., the Guarantors named therein and The Bank of New York Mellon, as Trustee (Incorporated by reference to Exhibit 4.1 to Avaya Inc.’s Registration Statement on Form S-4 filed with the SEC on December 23, 2009) | |||
| 4.2 | Supplemental Indenture, dated as of February 19, 2010, by and among Avaya Government Solutions Inc., Integrated Information Technology Corporation, AC Technologies, Inc. and The Bank of New York Mellon, as Trustee (Incorporated by reference to Exhibit 4.5 to Avaya Inc.’s Quarterly Report on Form 10-Q filed with the SEC on May 13, 2010) | |||
| 4.3 | Supplemental Indenture, dated as of July 20, 2012, among RADVision, Inc., AvayaLive Inc. and The Bank of New York Mellon, as Trustee (Incorporated by reference to Exhibit 4.1 to Avaya Inc.’s Quarterly Report on Form 10-Q filed with the SEC on August 14, 2012) | |||
| 4.4 | Supplemental Indenture dated February 15, 2013 between Avaya Inc. and The Bank of New York Mellon Trust Company, N.A., as Trustee (Incorporated by reference to Exhibit 4.3 to Avaya Inc.’s Current Report on Form 8-K filed with the SEC on March 7, 2013) | |||
| 4.5 | Indenture dated February 11, 2011 by and among Avaya Inc., the Guarantors party thereto and The Bank of New York Mellon Trust Company, N.A., as Trustee (Incorporated by reference to Exhibit 4.1 to Avaya Inc.’s Quarterly Report on Form 10-Q filed with the SEC on February 14, 2011) | |||
II-5
Exhibit | Exhibit Title | |||
| 4.6 | Supplemental Indenture, dated as of July 20, 2012, among RADVision, Inc., AvayaLive Inc. and The Bank of New York Mellon, as Trustee and Collateral Agent (Incorporated by reference to Exhibit 4.2 to Avaya Inc.’s Quarterly Report on Form 10-Q filed with the SEC on August 14, 2012) | |||
| 4.4 | Pledge and Security Agreement dated February 11, 2011 by and among Avaya Inc., certain subsidiaries of Avaya Inc. from time to time party thereto and The Bank of New York Mellon Trust Company, N.A., as Collateral Agent (Incorporated by reference to Exhibit 4.3 to Avaya Inc.’s Quarterly Report on Form 10-Q filed with the SEC on February 14, 2011) | |||
| 4.5 | Supplement No. 1 dated as of July 20, 2012, to the Pledge and Security Agreement, dated as of February 11, 2011, by and among Avaya Inc., certain subsidiaries of Avaya Inc. from time to time party thereto and The Bank of New York Mellon Trust Company, N.A., as Notes Collateral Agent. (Incorporated by reference to Exhibit 10.3 to Avaya Inc.’s Quarterly Report on Form 10-Q filed with the SEC on August 14, 2012) | |||
| 4.6 | Indenture dated December 21, 2012 by and among Avaya Inc., the Guarantors party thereto and The Bank of New York Mellon Trust Company, N.A., as Trustee (Incorporated by reference to Exhibit 4.1 to Avaya Inc.’s Current Report on Form 8-K filed with the SEC on December 21, 2012) | |||
| 4.7 | Pledge and Security Agreement dated December 21, 2012 by and among Avaya Inc., certain subsidiaries of Avaya Inc. from time to time party thereto and The Bank of New York Mellon Trust Company, N.A., as Notes Collateral Agent (Incorporated by reference to Exhibit 4.3 to Avaya Inc.’s Current Report on Form 8-K filed with the SEC on December 21, 2012) | |||
| 4.8 | Indenture dated March 7, 2013 by and among Avaya Inc., the guarantors party thereto and The Bank of New York Mellon Trust Company, N.A., as Trustee (Incorporated by reference to Exhibit 4.1 to Avaya Inc.’s Current Report on Form 8-K filed with the SEC on March 7, 2013) | |||
| 4.9 | Pledge and Security Agreement dated as of March 7, 2013 among Avaya Inc., the guarantors party thereto and The Bank of New York Mellon Trust Company, N.A., as Notes Collateral Agent (Incorporated by reference to Exhibit 4.4 to Avaya Inc.’s Current Report on Form 8-K filed with the SEC on March 7, 2013) | |||
| 4.10 | Form of 9.75% Senior Unsecured Notes due 2015 (included in the Exchange Note Indenture filed as Exhibit 4.1) | |||
| Form of 10.125%/10.875% Senior PIK Toggle Unsecured Notes due 2015 (included in the Exchange Note Indenture filed as Exhibit 4.1) | ||||
II-4
|
| |||
| Form of 7% Senior Secured Notes due 2019 (Incorporated by reference to Exhibit 4.2 to Avaya Inc.’s Quarterly Report on Form 10-Q filed with the SEC on February 14, 2011) | ||||
| Form of 9% Senior Secured Note due 2019 (Incorporated by reference to Exhibit 4.2 to Avaya Inc.’s Current Report on Form 8-K filed with the SEC on December 21, 2012) | ||||
| 4.14 | Form of 10.50% Senior Secured Note due 2021 (Incorporated by reference to Exhibit 4.2 to Avaya Inc.’s Current Report on Form 8-K filed with the SEC on March 7, 2013) | |||
| 4.15 | Specimen Common Stock Certificate of Avaya Holdings Corp.* | |||
| Certificate of Designations of Series A Preferred Stock of Avaya Holdings Corp. (previously filed as Exhibit 4.9 to this Registration Statement on June 9, 2011)** | ||||
| Certificate of Designation for Series B Preferred Stock of Avaya Holdings Corp.* | ||||
| 4.18 | Form of Warrant, dated December 18, 2009 (previously filed as Exhibit 4.10 to this Registration Statement on June 9, 2011)** | |||
| Form of Warrant, dated May 29, 2012* | ||||
| 4.20 | Second Amended and Restated Registration Rights Agreement dated as of | |||
II-6
Exhibit | Exhibit Title | |||
| Senior Manager Registration and Preemptive Rights Agreement, dated as of October 26, 2007, by and among Sierra Holdings Corp. and the individual members of management listed on Schedule A | ||||
| 5.1 | Opinion of Ropes & Gray LLP* | |||
| 10.1 | Purchase Agreement dated February 8, 2011 between Avaya Inc. and Morgan Stanley & Co. Incorporated, as Representative for the several Initial Purchasers identified therein (Incorporated by reference to Exhibit 10.1 to Avaya Inc.’s Quarterly Report on Form 10-Q filed with the SEC on February 14, 2011) | |||
| 10.2 | Purchase Agreement dated December 18, 2012 between Avaya Inc., the Guarantors party thereto and Citigroup Global Markets Inc., as Representative for the several Initial Purchasers identified therein (Incorporated by reference to Exhibit 10.1 to Avaya Inc.’s Current Report on Form 10-K filed with the SEC on December 21, 2012) | |||
| 10.3 | Credit Agreement, dated as of October 26, 2007, by and among Avaya Inc., as Borrower, Sierra Holdings Corp. (n/k/a Avaya Holdings Corp.), Citibank, N.A., as Administrative Agent, Swing Line Lender and L/C Issuer, the other lenders party thereto, Morgan Stanley Senior Funding, Inc., as Syndication Agent, JPMorgan Chase Bank, N.A., as Documentation Agent, and Citigroup Global Markets Inc., Morgan Stanley Senior Funding, Inc., and J.P. Morgan Securities Inc., as Joint Lead Arrangers and Joint Bookrunners (Incorporated by reference to Exhibit 10.1 to Avaya Inc.’s Registration Statement on Form S-4 filed with the SEC on December 23, 2009) | |||
| Amendment No. 1 to Credit Agreement, dated as of December 18, 2009, among Avaya Inc., the lenders party thereto and Citibank, N.A., as Administrative Agent (Incorporated by reference to Exhibit 10.5 to Avaya Inc.’s Registration Statement on Form S-4 filed with the SEC on December 23, 2009) | ||||
| Amendment No. 2 to Credit Agreement dated February 11, 2011, by and among Avaya Inc., Citibank, N.A., as Administrative Agent, and each lender party thereto, amending Credit Agreement, dated as of October 26, 2007, by and among Avaya Inc., Sierra Holdings Corp. (n/k/a Avaya Holdings Corp.), Citibank, N.A., as Administrative Agent, Swing Line Lender and L/C Issuer and each lender party thereto (Incorporated by reference to Exhibit 10.2 to Avaya Inc.’s Quarterly Report on Form 10-Q filed with the SEC on February 14, 2011) | ||||
| Amended and Restated Credit Agreement dated February 11, 2011, by and among Avaya Inc., Sierra Holdings Corp. (n/k/a Avaya Holdings Corp.), Citibank N.A., as Administrative Agent, Swing Line Lender and L/C Issuer, and each lender from time to time party thereto (Incorporated by reference to Exhibit 10.3 to Avaya Inc.’s Quarterly Report on Form 10-Q filed with the SEC on February 14, 2011) | ||||
| Amendment No. 3 to Credit Agreement dated August 8, 2011, by and among Avaya Inc., Citibank, N.A., as Administrative Agent, and each lender party thereto, amending the Amended and Restated Credit Agreement, dated as of February 11, 2011, by and among Avaya Inc., Avaya Holdings Corp., Citibank, N.A., as Administrative Agent, Swing Line Lender and L/C Issuer and each lender party thereto (Incorporated by reference to Exhibit 10.1 to Avaya Inc.’s Quarterly Report on Form 10-Q filed with the SEC on August 11, 2011) | ||||
| 10.8 | Amendment No. 4 to Credit Agreement, dated as of October 29, 2012, among Avaya Inc., Citibank, N.A., as Administrative Agent, and the lenders party thereto (Incorporated by reference to Exhibit 10.3 to Avaya Inc.’s Current Report on Form 8-K filed with the SEC on November 2, 2012) | |||
| 10.9 | Second Amended and Restated Credit Agreement, dated as of October 29, 2012, among Avaya Inc., Avaya Holdings Corp., Citibank N.A., as Administrative Agent, Swing Line Lender and L/C Issuer, and each lender from time to time party thereto* (Incorporated by reference to Exhibit 10.4 to Avaya Inc.’s Current Report on Form 8-K filed with the SEC on November 2, 2012) | |||
II-7
Exhibit | Exhibit Title | |||
| 10.10 | Amendment No. 5 to Credit Agreement, dated as of December 21, 2012, among Avaya Inc., Citibank, N.A., as Administrative Agent, and the lenders party thereto (Incorporated by reference to Exhibit 10.1 to Avaya Inc.’s Current Report on Form 8-K filed with the SEC on December 21, 2012) | |||
| 10.11 | Third Amended and Restated Credit Agreement, dated as of December 21, 2012, among Avaya Inc., Avaya Holdings Corp., Citibank N.A., as Administrative Agent, Swing Line Lender and L/C Issuer, and each lender from time to time party thereto (Incorporated by reference to Exhibit 10.2 to Avaya Inc.’s Current Report on Form 8-K filed with the SEC on December 21, 2012) | |||
| 10.12 | Amendment No. 6 to Credit Agreement, dated as of February 13, 2013, among Avaya Inc., Citibank, N.A., as Administrative Agent, and the lenders party thereto (Incorporated by reference to Exhibit 10.3 to Avaya Inc.’s Current Report on Form 8-K filed with the SEC on February 19, 2013) | |||
| 10.13 | Amendment No. 7 to Credit Agreement, dated as of March 12, 2013, among Avaya Inc., Citibank, N.A., as Administrative Agent, and the lenders party thereto (Incorporated by reference to Exhibit 10.1 to Avaya Inc.’s Current Report on Form 8-K filed with the SEC on March 14, 2013) | |||
| 10.14 | Pledge and Security Agreement, dated as of October 26, 2007, by and among Avaya Inc., as Borrower, Sierra Holdings Corp. (n/k/a Avaya Holdings Corp.), certain subsidiaries of Avaya Inc. identified therein and Citibank, N.A., as Administrative Agent (Incorporated by reference to Exhibit 10.2 to Avaya Inc.’s Registration Statement on Form S-4 filed with the SEC on December 23, 2009) | |||
| 10.15 | Supplement No. 1 dated as of February 15, 2008, to the Pledge and Security Agreement, dated as of October 26, 2007, by and among Avaya Inc., certain subsidiaries of Avaya Inc. from time to time party thereto and The Bank of New York Mellon Trust Company, N.A., as Notes Collateral Agent. (Incorporated by reference to Exhibit 10.6 to Avaya Inc.’s Quarterly Report on Form 10-Q filed with the SEC on August 14, 2012) | |||
| 10.16 | Supplement No. 2 dated as of January 29, 2010, to the Pledge and Security Agreement, dated as of October 26, 2007, by and among Avaya Inc., as Borrower, Sierra Holdings Corp. (n/k/a Avaya Holdings Corp.), certain subsidiaries of Avaya Inc. identified therein and Citibank, N.A., as Administrative Agent. (Incorporated by reference to Exhibit 10.6 to Avaya Inc.’s Quarterly Report on Form 10-Q filed with the SEC on August 14, 2012) | |||
| 10.17 | Supplement No. 3 dated as of July 20, 2012, to the Pledge and Security Agreement, dated as of October 26, 2007, by and among Avaya Inc., as Borrower, Avaya Holdings Corp., certain subsidiaries of Avaya Inc. identified therein and Citibank, N.A., as Administrative Agent. (Incorporated by reference to Exhibit 10.2 to Avaya Inc.’s Quarterly Report on Form 10-Q filed with the SEC on August 14, 2012) | |||
| 10.18 | Guaranty, dated as of October 26, 2007, by and among Sierra Holdings Corp. (n/k/a Avaya Holdings Corp.), certain subsidiaries of Avaya Inc. identified therein and Citibank, N.A., as Administrative Agent (Incorporated by reference to Exhibit 10.3 to Avaya Inc.’s Registration Statement on Form S-4 filed with the SEC on December 23, 2009) | |||
| 10.19 | Supplement No. 1 dated as of February 15, 2008, to the Guaranty, dated as of October 26, 2007, by and among Sierra Holdings Corp. (n/k/a Avaya Holdings Corp.), certain subsidiaries of Avaya Inc. from time to time party thereto and Citibank, N.A., as Administrative Agent (Incorporated by reference to Exhibit 10.10 to Avaya Inc.’s Quarterly Report on Form 10-Q filed with the SEC on August 14, 2012) | |||
| 10.20 | Supplement No. 2 dated as of January 29, 2010, to the Guaranty, dated as of October 26, 2007, by and among Sierra Holdings Corp. (n/k/a Avaya Holdings Corp.), certain subsidiaries of Avaya Inc. from time to time party thereto and Citibank, N.A., as Administrative Agent (Incorporated by reference to Exhibit 10.7 to Avaya Inc.’s Quarterly Report on Form 10-Q filed with the SEC on August 14, 2012) | |||
II-5II-8
Exhibit | Exhibit Title | |||
| 10.21 | Supplement No. 3 dated as of July 20, 2012, to the Guaranty, dated as of October 26, 2007, by and among Avaya Holdings Corp., certain subsidiaries of Avaya Inc. from time to time party thereto and Citibank, N.A., as Administrative Agent (Incorporated by reference to Exhibit 10.4 to Avaya Inc.’s Quarterly Report on Form 10-Q filed with the SEC on August 14, 2012) | |||
| 10.22 | Credit Agreement, dated as of October 26, 2007, by and among Avaya Inc., as Parent Borrower, the several subsidiary borrowers party thereto, Sierra Holdings Corp. (n/k/a Avaya Holdings Corp.), Citicorp USA, Inc., as Administrative Agent and Swing Line Lender, Citibank, N.A., as L/C Issuer, the other lenders party thereto, Morgan Stanley Senior Funding, Inc., as Syndication Agent, JPMorgan Chase Bank, N.A., as Documentation Agent, and Citigroup Global Markets Inc., Morgan Stanley Senior Funding, Inc. and J.P. Morgan Securities Inc., as Joint Lead Arrangers and Joint Bookrunners (Incorporated by reference to Exhibit 10.4 to Avaya Inc.’s Registration Statement on Form S-4 filed with the SEC on December 23, 2009) | |||
| Amendment No. 1 to Credit Agreement, dated as of August 8, 2011, by and among Avaya Inc., the several subsidiary borrowers party thereto, Citicorp USA, Inc., as Administrative Agent and the lenders party thereto, amending the Credit Agreement, dated as of October 26, 2007, by and among Avaya Inc., the several subsidiary borrowers party thereto, Avaya Holdings Corp., Citicorp USA, Inc., as Administrative Agent and the lenders party thereto (Incorporated by reference to Exhibit 10.2 to Avaya Inc.’s Quarterly Report on Form 10-Q filed with the SEC on August 11, 2011) | ||||
| 10.24 | Amendment No. 2 to Credit Agreement, dated as of October 29, 2012, among Avaya Inc., the several Subsidiary Borrowers party thereto, Citicorp USA, Inc., as Administrative Agent, and the lenders party thereto (Incorporated by reference to Exhibit 10.1 to Avaya Inc.’s Current Report on Form 8-K filed with the SEC on November 2, 2012) | |||
| 10.25 | Amended and Restated Credit Agreement, dated as of October 29, 2012, among Avaya Inc., the several Subsidiary Borrowers party thereto, Avaya Holdings Corp., Citicorp USA, Inc., as Administrative Agent and Swing Line Lender, Citibank, N.A., as L/C Issuer, and each lender from time to time party thereto (Incorporated by reference to Exhibit 10.2 to Avaya Inc.’s Current Report on Form 8-K filed with the SEC on November 2, 2012) | |||
| 10.26 | Amendment No. 3 to Credit Agreement, dated as of February 13, 2013, among Avaya Inc., the several Subsidiary Borrowers party thereto, Citicorp USA, Inc., as Administrative Agent, and the lenders party thereto (Incorporated by reference to Exhibit 10.3 to Avaya Inc.’s Current Report on Form 8-K filed with the SEC on February 19, 2013) | |||
| 10.27 | Pledge and Security Agreement, dated as of October 26, 2007, by and among Avaya Inc., as Parent Borrower, Sierra Holdings Corp. (n/k/a Avaya Holdings Corp.), certain subsidiaries of Avaya Inc. identified therein, as Subsidiary Borrowers and Citicorp USA, Inc., as Administrative Agent (Incorporated by reference to Exhibit 10.6 to Avaya Inc.’s Registration Statement on Form S-4 filed with the SEC on December 23, 2009) | |||
| Supplement No. 1 dated as of February 15, 2008, to the Pledge and Security Agreement, dated as of October 26, 2007, by and among Avaya Inc., as Parent Borrower, Sierra Holdings Corp. (n/k/a Avaya Holdings Corp.), certain subsidiaries of Avaya Inc. identified therein, as Subsidiary Borrowers and Citicorp USA, Inc., as Administrative Agent. (Incorporated by reference to Exhibit 10.8 to Avaya Inc.’s Quarterly Report on Form 10-Q filed with the SEC on August 14, 2012) | ||||
| 10.29 | Supplement No. 2 dated as of January 29, 2010, to the Pledge and Security Agreement, dated as of October 26, 2007, by and among Avaya Inc., as Parent Borrower, Sierra Holdings Corp. (n/k/a Avaya Holdings Corp.), certain subsidiaries of Avaya Inc. identified therein and Citibank, N.A., as Administrative Agent. (Incorporated by reference to Exhibit 10.5 to Avaya Inc.’s Quarterly Report on Form 10-Q filed with the SEC on August 14, 2012) | |||
II-9
Exhibit | Exhibit Title | |||
| 10.30 | Supplement No. 3 dated as of July 20, 2012, to the Pledge and Security Agreement, dated as of October 26, 2007, by and among Avaya Inc., as Parent Borrower, Avaya Holdings Corp., certain subsidiaries of Avaya Inc. identified therein, as Subsidiary Borrowers and Citicorp USA, Inc., as Administrative Agent. (Incorporated by reference to Exhibit 10.1 to Avaya Inc.’s Quarterly Report on Form 10-Q filed with the SEC on August 14, 2012) | |||
| 10.31 | Guaranty, dated as of October 26, 2007, by and among Sierra Holdings Corp., certain subsidiaries of Avaya Inc. from time to time party thereto and Citicorp USA, Inc., as Administrative Agent (Incorporated by reference to Exhibit 10.7 to Avaya Inc.’s Registration Statement on Form S-4 filed with the SEC on December 23, 2009) | |||
| Executive Employment Agreement, dated as of December 22, 2008, by and among Kevin J. Kennedy, Avaya Inc. and Sierra Holdings Corp. (Incorporated by reference to Exhibit 10.8 to Avaya Inc.’s Registration Statement on Form S-4 filed with the SEC on December 23, 2009) | ||||
| Amendment to Executive Employment Agreement, dated October 12, 2009 among Kevin J. Kennedy, Avaya Inc. and Sierra Holdings Corp. (Incorporated by reference to Exhibit 10.9 to Avaya Inc.’s Registration Statement on Form S-4 filed with the SEC on December 23, 2009) | ||||
| Avaya Inc. Involuntary Separation Plan for Senior Officers, as amended (Incorporated by reference to Exhibit 10.10 to Avaya Inc.’s Registration Statement on Form S-4 filed with the SEC on December 23, 2009) | ||||
| Form of Indemnity Agreement between Sierra Holdings Corp., Avaya Inc. and certain directors of the Registrant (Incorporated by reference to Exhibit 10.11 to Avaya Inc.’s Registration Statement on Form S-4 filed with the SEC on December 23, 2009) | ||||
| Form of Indemnity Agreement between Sierra Holdings Corp., Avaya Inc. and certain officers of the Registrant (Incorporated by reference to Exhibit 10.12 to Avaya Inc.’s Registration Statement on Form S-4 filed with the SEC on December 23, 2009) | ||||
| Avaya Inc. Savings Restoration Plan, as amended (Incorporated by reference to Exhibit 10.13 to Avaya Inc.’s Registration Statement on Form S-4 filed with the SEC on December 23, 2009) | ||||
| Avaya Inc. Short Term Incentive Plan (Incorporated by reference to Exhibit 10.14 to Avaya Inc.’s Registration Statement on Form S-4 filed with the SEC on December 23, 2009) | ||||
| Management Services Agreement, dated as of October 2, 2007, by and among Sierra Holdings Corp., Avaya Inc. (as successor by merger to Sierra Merger Corp.), TPG Capital, L.P. and Silver Lake Management Company III, L.L.C. (Incorporated by reference to Exhibit 10.15 to Avaya Inc.’s Registration Statement on Form S-4 filed with the SEC on December 23, 2009) | ||||
II-6
|
| |||
| Sierra Holdings Corp. Amended and Restated 2007 Equity Incentive Plan (Incorporated by reference to Exhibit 10.2 to Avaya Inc.’s Current Report on Form 8-K filed with the SEC on July 1, 2010) | ||||
| Form of Sierra Holdings Corp. Amended and Restated 2007 Equity Incentive Plan Restricted Stock Unit Award Agreement (Incorporated by reference to Exhibit 10.3 to Avaya Inc.’s Current Report on Form 8-K filed with the SEC on July 1, 2010) | ||||
| Form of Sierra Holdings Corp. Amended and Restated 2007 Equity Incentive Plan Stock Option Award Agreement for Senior Vice Presidents and Vice Presidents (Incorporated by reference to Exhibit 10.4 to Avaya Inc.’s Current Report on Form 8-K filed with the SEC on July 1, 2010) | ||||
| Avaya Inc. Executive Committee 2011-2013 Performance Recognition Plan (Incorporated by reference to Exhibit 10.1 to Avaya Inc.’s Quarterly Report on Form 10-Q filed with the SEC on May 12, 2011) | ||||
| Avaya Inc. Executive Committee Performance Recognition Plan as amended and restated effective as of December 6, 2012 (Incorporated by reference to Exhibit 10.37 to Avaya Inc.’s Annual Report on Form 10-K filed with the SEC on December 12, 2012) | ||||
II-10
Exhibit | Exhibit Title | |||
| 10.45 | Form of Award Agreement for the Avaya Inc. Executive Committee 2011-2013 Performance Recognition Plan (Incorporated by reference to Exhibit 10.2 to Avaya Inc.’s Quarterly Report on Form 10-Q filed with the SEC on May 12, 2011) | |||
| Form of Award Agreement for the Avaya Inc. Executive Committee Performance Recognition Plan for 2014-2015 (Incorporated by reference to Exhibit 10.39 to Avaya Inc.’s Annual Report on Form 10-K filed with the SEC on December 12, 2012) | ||||
| 10.47 | Management Stockholders’ Agreement, dated as of October 26, 2007, by and among Sierra Holdings Corp., the Majority Stockholders (as defined therein) and the individuals listed on Schedule A thereto (previously filed as Exhibit 10.25 to this Registration Statement on June 9, 2011)** | |||
| 10.48 | Form of Amended and Restated Stockholders’ Agreement, by and among TPG Partners V, L.P., TPG FOF V-A, L.P., TPG FOF V-B, L.P., Silver Lake Partners II, L.P., Silver Lake Technology Investors II, L.P., Silver Lake Partners III, L.P., Silver Lake Technology Investors III, L.P., Sierra Co-Invest, LLC, Sierra Co-Invest II, LLC and Avaya Holdings Corp.* | |||
| 10.49 | Form of Award Agreement for 2012 Sales Incentive Program (Incorporated by reference to Exhibit 10.28 to Avaya Inc.’s Annual Report on Form 10-K filed with the SEC on December 9, 2011) | |||
| 10.50 | Avaya Holdings Corp. 2013 Equity Incentive Plan* | |||
| 10.51 | Avaya Holdings Corp. Employee Stock Purchase Plan* | |||
| 21.1 | List of | |||
| 23.1 | Consent of PricewaterhouseCoopers LLP | |||
| 23.2 | ||||
| Consent of Ropes & Gray LLP (included in the opinion filed as Exhibit 5.1)* | ||||
| 24.1 | Powers of Attorney (included in the signature pages of this Registration Statement) | |||
| * | To be filed by amendment. |
| ** | Previously filed. |
II-11
(b) Financial Statement Schedules
All schedules are omitted because the required information is presented within consolidated financial statements included in the prospectus that is part of this registration statement.
| Item 17. | Undertakings |
(a) The undersigned registrant hereby undertakes to provide to the underwriter at the closing specified in the underwriting agreements certificates in such denominations and registered in such names as required by the underwriter to permit prompt delivery to each purchaser.
(b) Insofar as indemnification for liabilities arising under the Securities Act of 1933 may be permitted to directors, officers and controlling persons of the registrant pursuant to the foregoing provisions, or otherwise, the registrant has been advised that in the opinion of the Securities and Exchange Commission such indemnification is against public policy as expressed in the Act and is, therefore, unenforceable. In the event that a claim for indemnification against such liabilities (other than the payment by the registrant of expenses incurred or paid by a director, officer or controlling person of the registrant in the successful defense of any action, suit or proceeding) is asserted by such director, officer or controlling person in connection with the securities being registered, the registrant will, unless in the opinion of its counsel the matter has been settled by controlling precedent, submit to a court of appropriate jurisdiction the question whether such indemnification by it is against public policy as expressed in the Act and will be governed by the final adjudication of such issue.
II-7
(c) The undersigned registrant hereby undertakes that:
1. For purposes of determining any liability under the Securities Act of 1933, the information omitted from the form of prospectus filed as part of this registration statement in reliance upon Rule 430A and contained in a form of prospectus filed by the registrant pursuant to Rule 424(b)(1) or (4) or 497(h) under the Securities Act shall be deemed to be part of this registration statement as of the time it was declared effective.
2. For the purpose of determining any liability under the Securities Act of 1933, each post-effective amendment that contains a form of prospectus shall be deemed to be a new registration statement relating to the securities offered therein, and the offering of such securities at that time shall be deemed to be the initial bona fide offering thereof.
II-8II-12
SIGNATURES
Pursuant to the requirements of the Securities Act of 1933, the registrant has duly caused this registration statement to be signed on its behalf by the undersigned, thereunto duly authorized in the City of Basking Ridge, State of New Jersey, on the 931thst day of June, 2011.May, 2013.
| Avaya Holdings Corp. | ||||
| By: | /s/ | |||
| Name: | ||||
| Title: | Senior Vice President and Chief Financial Officer | |||
* * * *
POWER OF ATTORNEY
��
The undersigned directors and officers of Avaya Holdings Corp., hereby appoint each of Anthony J. MassettiDavid Vellequette and Pamela F. Craven, as attorney-in-fact for the undersigned, with full power of substitution for, and in the name, place and stead of the undersigned, to sign and file with the Securities and Exchange Commission under the Securities Act of 1933, any and all amendments (including post-effective amendments) and exhibits to this registration statement on FormForms S-1 (or any other registration statement for the same offering that is to be effective upon filing pursuant to Rule 462(b) under the Securities Act of 1933) and any and all applications and other documents to be filed with the Securities and Exchange Commission pertaining to the registration of the securities covered hereby, with full power and authority to do and perform any and all acts and things whatsoever requisite and necessary or desirable, hereby ratifying and confirming all that said attorney-in-fact, or his substitute or substitutes, may lawfully do or cause to be done by virtue hereof.
Pursuant to the requirements of the Securities Act of 1933, this registration statement has been signed by the following persons in the capacities and on the dates indicated.
Signature | Title | Date | ||
/S/ KEVIN J. KENNEDY Kevin J. Kennedy | Director, President and Chief Executive Officer (Principal Executive Officer) | |||
/S/
| Senior Vice President and Chief Financial Officer (Principal Financial Officer) | |||
/S/ KEVIN J. MACKAY Kevin J. MacKay | Vice President, Controller and Chief Accounting Officer (Principal Accounting Officer) | |||
/S/
| Director | |||
/S/ CHARLES H. GIANCARLO Charles H. Giancarlo | Chairman of the Board of Directors | |||
/S/
| Director | |||
II-9II-13
Signature | Title | Date | ||
/S/
| Director | |||
/S/
| Director | |||
| ||||
II-10II-14
EXHIBIT INDEX
Exhibit | Exhibit Title | |||
| 1.1 | Form of Underwriting Agreement* | |||
| 3.1 | Amended and Restated Certificate of Incorporation of Avaya Holdings Corp. (to be effective upon completion of this offering)* | |||
| 3.2 | Amended and Restated By-Laws of Avaya Holdings Corp. (to be effective upon completion of this offering)* | |||
| 4.1 | Exchange Note Indenture, dated as of October 24, 2008, by and among Avaya Inc., the Guarantors named therein and The Bank of New York Mellon, as Trustee (Incorporated by reference to Exhibit 4.1 to Avaya Inc.’s Registration Statement on Form S-4 filed with the SEC on December 23, 2009) | |||
| 4.2 | Supplemental Indenture, dated as of February 19, 2010, by and among Avaya Government Solutions Inc., Integrated Information Technology Corporation, AC Technologies, Inc. and The Bank of New York Mellon, as Trustee (Incorporated by reference to Exhibit 4.5 to Avaya Inc.’s Quarterly Report on Form 10-Q filed with the SEC on May 13, 2010) | |||
| 4.3 | Supplemental Indenture, dated as of July 20, 2012, among RADVision, Inc., AvayaLive Inc. and The Bank of New York Mellon, as Trustee (Incorporated by reference to Exhibit 4.1 to Avaya Inc.’s Quarterly Report on Form 10-Q filed with the SEC on August 14, 2012) | |||
| 4.4 | Supplemental Indenture dated February 15, 2013 between Avaya Inc. and The Bank of New York Mellon Trust Company, N.A., as Trustee (Incorporated by reference to Exhibit 4.3 to Avaya Inc.’s Current Report on Form 8-K filed with the SEC on March 7, 2013) | |||
| 4.5 | Indenture dated February 11, 2011 by and among Avaya Inc., the Guarantors party thereto and The Bank of New York Mellon Trust Company, N.A., as Trustee (Incorporated by reference to Exhibit 4.1 to Avaya Inc.’s Quarterly Report on Form 10-Q filed with the SEC on February 14, 2011) | |||
| 4.6 | Supplemental Indenture, dated as of July 20, 2012, among RADVision, Inc., AvayaLive Inc. and The Bank of New York Mellon, as Trustee and Collateral Agent (Incorporated by reference to Exhibit 4.2 to Avaya Inc.’s Quarterly Report on Form 10-Q filed with the SEC on August 14, 2012) | |||
| 4.4 | Pledge and Security Agreement dated February 11, 2011 by and among Avaya Inc., certain subsidiaries of Avaya Inc. from time to time party thereto and The Bank of New York Mellon Trust Company, N.A., as Collateral Agent (Incorporated by reference to Exhibit 4.3 to Avaya Inc.’s Quarterly Report on Form 10-Q filed with the SEC on February 14, 2011) | |||
| 4.5 | Supplement No. 1 dated as of July 20, 2012, to the Pledge and Security Agreement, dated as of February 11, 2011, by and among Avaya Inc., certain subsidiaries of Avaya Inc. from time to time party thereto and The Bank of New York Mellon Trust Company, N.A., as Notes Collateral Agent. (Incorporated by reference to Exhibit 10.3 to Avaya Inc.’s Quarterly Report on Form 10-Q filed with the SEC on August 14, 2012) | |||
| 4.6 | Indenture dated December 21, 2012 by and among Avaya Inc., the Guarantors party thereto and The Bank of New York Mellon Trust Company, N.A., as Trustee (Incorporated by reference to Exhibit 4.1 to Avaya Inc.’s Current Report on Form 8-K filed with the SEC on December 21, 2012) | |||
| 4.7 | Pledge and Security Agreement dated December 21, 2012 by and among Avaya Inc., certain subsidiaries of Avaya Inc. from time to time party thereto and The Bank of New York Mellon Trust Company, N.A., as Notes Collateral Agent (Incorporated by reference to Exhibit 4.3 to Avaya Inc.’s Current Report on Form 8-K filed with the SEC on December 21, 2012) | |||
| 4.8 | Indenture dated March 7, 2013 by and among Avaya Inc., the guarantors party thereto and The Bank of New York Mellon Trust Company, N.A., as Trustee (Incorporated by reference to Exhibit 4.1 to Avaya Inc.’s Current Report on Form 8-K filed with the SEC on March 7, 2013) | |||
II-15
Exhibit | Exhibit Title | |||
| 4.9 | Pledge and Security Agreement dated as of March 7, 2013 among Avaya Inc., the guarantors party thereto and The Bank of New York Mellon Trust Company, N.A., as Notes Collateral Agent (Incorporated by reference to Exhibit 4.4 to Avaya Inc.’s Current Report on Form 8-K filed with the SEC on March 7, 2013) | |||
| 4.10 | Form of 9.75% Senior Unsecured Notes due 2015 (included in the Exchange Note Indenture filed as Exhibit 4.1) | |||
| Form of 10.125%/10.875% Senior PIK Toggle Unsecured Notes due 2015 (included in the Exchange Note Indenture filed as Exhibit 4.1) | ||||
| Form of 7% Senior Secured | ||||
| Form of 9% Senior Secured Note due 2019 (Incorporated by reference to Exhibit 4.2 to Avaya Inc.’s Current Report on Form 8-K filed with the SEC on December 21, 2012) | ||||
| 4.14 | Form of 10.50% Senior Secured Note due 2021 (Incorporated by reference to Exhibit 4.2 to Avaya Inc.’s Current Report on Form 8-K filed with the SEC on March 7, 2013) | |||
| 4.15 | Specimen Common Stock Certificate of Avaya Holdings Corp.* | |||
| Certificate of Designations of Series A Preferred Stock of Avaya Holdings Corp. (previously filed as Exhibit 4.9 to this Registration Statement on June 9, 2011)** | ||||
| Certificate of Designation for Series B Preferred Stock of Avaya Holdings Corp.* | ||||
| 4.18 | Form of Warrant, dated December 18, 2009 (previously filed as Exhibit 4.10 to this Registration Statement on June 9, 2011)** | |||
| Form of Warrant, dated May 29, 2012* | ||||
| 4.20 | Second Amended and Restated Registration Rights Agreement dated as of | |||
| Senior Manager Registration and Preemptive Rights Agreement, dated as of October 26, 2007, by and among Sierra Holdings Corp. and the individual members of management listed on Schedule A | ||||
| 5.1 | Opinion of Ropes & Gray LLP* | |||
II-11
| 10.1 | Purchase Agreement dated February 8, 2011 between Avaya Inc. and Morgan Stanley & Co. Incorporated, as Representative for the several Initial Purchasers identified therein (Incorporated by reference to Exhibit | |||||
| 10.2 | Purchase Agreement dated December 18, 2012 between Avaya Inc., the Guarantors party thereto and Citigroup Global Markets Inc., as Representative for the several Initial Purchasers identified therein (Incorporated by reference to Exhibit 10.1 to Avaya Inc.’s Current Report on Form 10-K filed with the SEC on December 21, 2012) | ||||||
| 10.3 | Credit Agreement, dated as of October 26, 2007, by and among Avaya Inc., as Borrower, Sierra Holdings Corp. (n/k/a Avaya Holdings Corp.), Citibank, N.A., as Administrative Agent, Swing Line Lender and L/C Issuer, the other lenders party thereto, Morgan Stanley Senior Funding, Inc., as Syndication Agent, JPMorgan Chase Bank, N.A., as Documentation Agent, and Citigroup Global Markets Inc., Morgan Stanley Senior Funding, Inc., and J.P. Morgan Securities Inc., as Joint Lead Arrangers and Joint Bookrunners (Incorporated by reference to Exhibit 10.1 to Avaya Inc.’s Registration Statement on Form S-4 filed with the SEC on December 23, 2009) | ||||||
II-16
Exhibit | Exhibit Title | |||
| Amendment No. 1 to Credit Agreement, dated as of December 18, 2009, among Avaya Inc., the lenders party thereto and Citibank, N.A., as Administrative Agent (Incorporated by reference to Exhibit 10.5 to Avaya Inc.’s Registration Statement on Form S-4 filed with the SEC on December 23, 2009) | ||||
| Amendment No. 2 to Credit Agreement dated February 11, 2011, by and among Avaya Inc., Citibank, N.A., as Administrative Agent, and each lender party thereto, amending Credit Agreement, dated as of October 26, 2007, by and among Avaya Inc., Sierra Holdings Corp. (n/k/a Avaya Holdings Corp.), Citibank, N.A., as Administrative Agent, Swing Line Lender and L/C Issuer and each lender party thereto (Incorporated by reference to Exhibit 10.2 to Avaya Inc.’s Quarterly Report on Form 10-Q filed with the SEC on February 14, 2011) | ||||
| Amended and Restated Credit Agreement dated February 11, 2011, by and among Avaya Inc., Sierra Holdings Corp. (n/k/a Avaya Holdings Corp.), Citibank N.A., as Administrative Agent, Swing Line Lender and L/C Issuer, and each lender from time to time party thereto (Incorporated by reference to Exhibit 10.3 to Avaya Inc.’s Quarterly Report on Form 10-Q filed with the SEC on February 14, 2011) | ||||
| Amendment No. 3 to Credit Agreement dated August 8, 2011, by and among Avaya Inc., Citibank, N.A., as Administrative Agent, and each lender party thereto, amending the Amended and Restated Credit Agreement, dated as of February 11, 2011, by and among Avaya Inc., Avaya Holdings Corp., Citibank, N.A., as Administrative Agent, Swing Line Lender and L/C Issuer and each lender party thereto (Incorporated by reference to Exhibit 10.1 to Avaya Inc.’s Quarterly Report on Form 10-Q filed with the SEC on August 11, 2011) | ||||
| 10.8 | Amendment No. 4 to Credit Agreement, dated as of October 29, 2012, among Avaya Inc., Citibank, N.A., as Administrative Agent, and the lenders party thereto (Incorporated by reference to Exhibit 10.3 to Avaya Inc.’s Current Report on Form 8-K filed with the SEC on November 2, 2012) | |||
| 10.9 | Second Amended and Restated Credit Agreement, dated as of October 29, 2012, among Avaya Inc., Avaya Holdings Corp., Citibank N.A., as Administrative Agent, Swing Line Lender and L/C Issuer, and each lender from time to time party thereto* (Incorporated by reference to Exhibit 10.4 to Avaya Inc.’s Current Report on Form 8-K filed with the SEC on November 2, 2012) | |||
| 10.10 | Amendment No. 5 to Credit Agreement, dated as of December 21, 2012, among Avaya Inc., Citibank, N.A., as Administrative Agent, and the lenders party thereto (Incorporated by reference to Exhibit 10.1 to Avaya Inc.’s Current Report on Form 8-K filed with the SEC on December 21, 2012) | |||
| 10.11 | Third Amended and Restated Credit Agreement, dated as of December 21, 2012, among Avaya Inc., Avaya Holdings Corp., Citibank N.A., as Administrative Agent, Swing Line Lender and L/C Issuer, and each lender from time to time party thereto (Incorporated by reference to Exhibit 10.2 to Avaya Inc.’s Current Report on Form 8-K filed with the SEC on December 21, 2012) | |||
| 10.12 | Amendment No. 6 to Credit Agreement, dated as of February 13, 2013, among Avaya Inc., Citibank, N.A., as Administrative Agent, and the lenders party thereto (Incorporated by reference to Exhibit 10.3 to Avaya Inc.’s Current Report on Form 8-K filed with the SEC on February 19, 2013) | |||
| 10.13 | Amendment No. 7 to Credit Agreement, dated as of March 12, 2013, among Avaya Inc., Citibank, N.A., as Administrative Agent, and the lenders party thereto (Incorporated by reference to Exhibit 10.1 to Avaya Inc.’s Current Report on Form 8-K filed with the SEC on March 14, 2013) | |||
| 10.14 | Pledge and Security Agreement, dated as of October 26, 2007, by and among Avaya Inc., as Borrower, Sierra Holdings Corp. (n/k/a Avaya Holdings Corp.), certain subsidiaries of Avaya Inc. identified therein and Citibank, N.A., as Administrative Agent (Incorporated by reference to Exhibit 10.2 to Avaya Inc.’s Registration Statement on Form S-4 filed with the SEC on December 23, 2009) | |||
| 10.15 | Supplement No. 1 dated as of February 15, 2008, to the Pledge and Security Agreement, dated as of October 26, 2007, by and among Avaya Inc., certain subsidiaries of Avaya Inc. from time to time party thereto and The Bank of New York Mellon Trust Company, N.A., as Notes Collateral Agent. (Incorporated by reference to Exhibit 10.6 to Avaya Inc.’s Quarterly Report on Form 10-Q filed with the SEC on August 14, 2012) | |||
II-17
Exhibit | Exhibit Title | |||
| 10.16 | Supplement No. 2 dated as of January 29, 2010, to the Pledge and Security Agreement, dated as of October 26, 2007, by and among Avaya Inc., as Borrower, Sierra Holdings Corp. (n/k/a Avaya Holdings Corp.), certain subsidiaries of Avaya Inc. identified therein and Citibank, N.A., as Administrative Agent. (Incorporated by reference to Exhibit 10.6 to Avaya Inc.’s Quarterly Report on Form 10-Q filed with the SEC on August 14, 2012) | |||
| 10.17 | Supplement No. 3 dated as of July 20, 2012, to the Pledge and Security Agreement, dated as of October 26, 2007, by and among Avaya Inc., as Borrower, Avaya Holdings Corp., certain subsidiaries of Avaya Inc. identified therein and Citibank, N.A., as Administrative Agent. (Incorporated by reference to Exhibit 10.2 to Avaya Inc.’s Quarterly Report on Form 10-Q filed with the SEC on August 14, 2012) | |||
| 10.18 | Guaranty, dated as of October 26, 2007, by and among Sierra Holdings Corp. (n/k/a Avaya Holdings Corp.), certain subsidiaries of Avaya Inc. identified therein and Citibank, N.A., as Administrative Agent (Incorporated by reference to Exhibit 10.3 to Avaya Inc.’s Registration Statement on Form S-4 filed with the SEC on December 23, 2009) | |||
| 10.19 | Supplement No. 1 dated as of February 15, 2008, to the Guaranty, dated as of October 26, 2007, by and among Sierra Holdings Corp. (n/k/a Avaya Holdings Corp.), certain subsidiaries of Avaya Inc. from time to time party thereto and Citibank, N.A., as Administrative Agent (Incorporated by reference to Exhibit 10.10 to Avaya Inc.’s Quarterly Report on Form 10-Q filed with the SEC on August 14, 2012) | |||
| 10.20 | Supplement No. 2 dated as of January 29, 2010, to the Guaranty, dated as of October 26, 2007, by and among Sierra Holdings Corp. (n/k/a Avaya Holdings Corp.), certain subsidiaries of Avaya Inc. from time to time party thereto and Citibank, N.A., as Administrative Agent (Incorporated by reference to Exhibit 10.7 to Avaya Inc.’s Quarterly Report on Form 10-Q filed with the SEC on August 14, 2012) | |||
| 10.21 | Supplement No. 3 dated as of July 20, 2012, to the Guaranty, dated as of October 26, 2007, by and among Avaya Holdings Corp., certain subsidiaries of Avaya Inc. from time to time party thereto and Citibank, N.A., as Administrative Agent (Incorporated by reference to Exhibit 10.4 to Avaya Inc.’s Quarterly Report on Form 10-Q filed with the SEC on August 14, 2012) | |||
| 10.22 | Credit Agreement, dated as of October 26, 2007, by and among Avaya Inc., as Parent Borrower, the several subsidiary borrowers party thereto, Sierra Holdings Corp. (n/k/a Avaya Holdings Corp.), Citicorp USA, Inc., as Administrative Agent and Swing Line Lender, Citibank, N.A., as L/C Issuer, the other lenders party thereto, Morgan Stanley Senior Funding, Inc., as Syndication Agent, JPMorgan Chase Bank, N.A., as Documentation Agent, and Citigroup Global Markets Inc., Morgan Stanley Senior Funding, Inc. and J.P. Morgan Securities Inc., as Joint Lead Arrangers and Joint Bookrunners (Incorporated by reference to Exhibit 10.4 to Avaya Inc.’s Registration Statement on Form S-4 filed with the SEC on December 23, 2009) | |||
| Amendment No. 1 to Credit Agreement, dated as of August 8, 2011, by and among Avaya Inc., the several subsidiary borrowers party thereto, Citicorp USA, Inc., as Administrative Agent and the lenders party thereto, amending the Credit Agreement, dated as of October 26, 2007, by and among Avaya Inc., the several subsidiary borrowers party thereto, Avaya Holdings Corp., Citicorp USA, Inc., as Administrative Agent and the lenders party thereto (Incorporated by reference to Exhibit 10.2 to Avaya Inc.’s Quarterly Report on Form 10-Q filed with the SEC on August 11, 2011) | ||||
| 10.24 | Amendment No. 2 to Credit Agreement, dated as of October 29, 2012, among Avaya Inc., the several Subsidiary Borrowers party thereto, Citicorp USA, Inc., as Administrative Agent, and the lenders party thereto (Incorporated by reference to Exhibit 10.1 to Avaya Inc.’s Current Report on Form 8-K filed with the SEC on November 2, 2012) | |||
II-18
Exhibit | Exhibit Title | |||
| 10.25 | Amended and Restated Credit Agreement, dated as of October 29, 2012, among Avaya Inc., the several Subsidiary Borrowers party thereto, Avaya Holdings Corp., Citicorp USA, Inc., as Administrative Agent and Swing Line Lender, Citibank, N.A., as L/C Issuer, and each lender from time to time party thereto (Incorporated by reference to Exhibit 10.2 to Avaya Inc.’s Current Report on Form 8-K filed with the SEC on November 2, 2012) | |||
| 10.26 | Amendment No. 3 to Credit Agreement, dated as of February 13, 2013, among Avaya Inc., the several Subsidiary Borrowers party thereto, Citicorp USA, Inc., as Administrative Agent, and the lenders party thereto (Incorporated by reference to Exhibit 10.3 to Avaya Inc.’s Current Report on Form 8-K filed with the SEC on February 19, 2013) | |||
| 10.27 | Pledge and Security Agreement, dated as of October 26, 2007, by and among Avaya Inc., as Parent Borrower, Sierra Holdings Corp. (n/k/a Avaya Holdings Corp.), certain subsidiaries of Avaya Inc. identified therein, as Subsidiary Borrowers and Citicorp USA, Inc., as Administrative Agent (Incorporated by reference to Exhibit 10.6 to Avaya Inc.’s Registration Statement on Form S-4 filed with the SEC on December 23, 2009) | |||
| Supplement No. 1 dated as of February 15, 2008, to the Pledge and Security Agreement, dated as of October 26, 2007, by and among Avaya Inc., as Parent Borrower, Sierra Holdings Corp. (n/k/a Avaya Holdings Corp.), certain subsidiaries of Avaya Inc. identified therein, as Subsidiary Borrowers and Citicorp USA, Inc., as Administrative Agent. (Incorporated by reference to Exhibit 10.8 to Avaya Inc.’s Quarterly Report on Form 10-Q filed with the SEC on August 14, 2012) | ||||
| 10.29 | Supplement No. 2 dated as of January 29, 2010, to the Pledge and Security Agreement, dated as of October 26, 2007, by and among Avaya Inc., as Parent Borrower, Sierra Holdings Corp. (n/k/a Avaya Holdings Corp.), certain subsidiaries of Avaya Inc. identified therein and Citibank, N.A., as Administrative Agent. (Incorporated by reference to Exhibit 10.5 to Avaya Inc.’s Quarterly Report on Form 10-Q filed with the SEC on August 14, 2012) | |||
| 10.30 | Supplement No. 3 dated as of July 20, 2012, to the Pledge and Security Agreement, dated as of October 26, 2007, by and among Avaya Inc., as Parent Borrower, Avaya Holdings Corp., certain subsidiaries of Avaya Inc. identified therein, as Subsidiary Borrowers and Citicorp USA, Inc., as Administrative Agent. (Incorporated by reference to Exhibit 10.1 to Avaya Inc.’s Quarterly Report on Form 10-Q filed with the SEC on August 14, 2012) | |||
| 10.31 | Guaranty, dated as of October 26, 2007, by and among Sierra Holdings Corp., certain subsidiaries of Avaya Inc. from time to time party thereto and Citicorp USA, Inc., as Administrative Agent (Incorporated by reference to Exhibit 10.7 to Avaya Inc.’s Registration Statement on Form S-4 filed with the SEC on December 23, 2009) | |||
II-12
|
| ||||||
| Executive Employment Agreement, dated as of December 22, 2008, by and among Kevin J. Kennedy, Avaya Inc. and Sierra Holdings Corp. (Incorporated by reference to Exhibit 10.8 to Avaya Inc.’s Registration Statement on Form S-4 filed with the SEC on December 23, 2009) | |||||||
| Amendment to Executive Employment Agreement, dated October 12, 2009 among Kevin J. Kennedy, Avaya Inc. and Sierra Holdings Corp. (Incorporated by reference to Exhibit 10.9 to Avaya Inc.’s Registration Statement on Form S-4 filed with the SEC on December 23, 2009) | |||||||
| Avaya Inc. Involuntary Separation Plan for Senior Officers, as amended (Incorporated by reference to Exhibit 10.10 to Avaya Inc.’s Registration Statement on Form S-4 filed with the SEC on December 23, 2009) | |||||||
| Form of Indemnity Agreement between Sierra Holdings Corp., Avaya Inc. and certain directors of the Registrant (Incorporated by reference to Exhibit 10.11 to Avaya Inc.’s Registration Statement on Form S-4 filed with the SEC on December 23, 2009) | |||||||
II-19
Exhibit | Exhibit Title | |||
| Form of Indemnity Agreement between Sierra Holdings Corp., Avaya Inc. and certain officers of the Registrant (Incorporated by reference to Exhibit 10.12 to Avaya Inc.’s Registration Statement on Form S-4 filed with the SEC on December 23, 2009) | ||||
| Avaya Inc. Savings Restoration Plan, as amended (Incorporated by reference to Exhibit 10.13 to Avaya Inc.’s Registration Statement on Form S-4 filed with the SEC on December 23, 2009) | ||||
| Avaya Inc. Short Term Incentive Plan (Incorporated by reference to Exhibit 10.14 to Avaya Inc.’s Registration Statement on Form S-4 filed with the SEC on December 23, 2009) | ||||
| Management Services Agreement, dated as of October 2, 2007, by and among Sierra Holdings Corp., Avaya Inc. (as successor by merger to Sierra Merger Corp.), TPG Capital, L.P. and Silver Lake Management Company III, L.L.C. (Incorporated by reference to Exhibit 10.15 to Avaya Inc.’s Registration Statement on Form S-4 filed with the SEC on December 23, 2009) | ||||
| Sierra Holdings Corp. Amended and Restated 2007 Equity Incentive Plan (Incorporated by reference to Exhibit 10.2 to Avaya Inc.’s Current Report on Form 8-K filed with the SEC on July 1, 2010) | ||||
| Form of Sierra Holdings Corp. Amended and Restated 2007 Equity Incentive Plan Restricted Stock Unit Award Agreement (Incorporated by reference to Exhibit 10.3 to Avaya Inc.’s Current Report on Form 8-K filed with the SEC on July 1, 2010) | ||||
| Form of Sierra Holdings Corp. Amended and Restated 2007 Equity Incentive Plan Stock Option Award Agreement for Senior Vice Presidents and Vice Presidents (Incorporated by reference to Exhibit 10.4 to Avaya Inc.’s Current Report on Form 8-K filed with the SEC on July 1, 2010) | ||||
| Avaya Inc. Executive Committee 2011-2013 Performance Recognition Plan (Incorporated by reference to Exhibit 10.1 to Avaya Inc.’s Quarterly Report on Form 10-Q filed with the SEC on May 12, 2011) | ||||
| Avaya Inc. Executive Committee Performance Recognition Plan as amended and restated effective as of December 6, 2012 (Incorporated by reference to Exhibit 10.37 to Avaya Inc.’s Annual Report on Form 10-K filed with the SEC on December 12, 2012) | ||||
| 10.45 | Form of Award Agreement for the Avaya Inc. Executive Committee 2011-2013 Performance Recognition Plan (Incorporated by reference to Exhibit 10.2 to Avaya Inc.’s Quarterly Report on Form 10-Q filed with the SEC on May 12, 2011) | |||
| Form of Award Agreement for the Avaya Inc. Executive Committee Performance Recognition Plan for 2014-2015 (Incorporated by reference to Exhibit 10.39 to Avaya Inc.’s Annual Report on Form 10-K filed with the SEC on December 12, 2012) | ||||
| 10.47 | Management Stockholders’ Agreement, dated as of October 26, 2007, by and among Sierra Holdings Corp., the Majority Stockholders (as defined therein) and the individuals listed on Schedule A thereto (previously filed as Exhibit 10.25 to this Registration Statement on June 9, 2011)** | |||
| 10.48 | Form of Amended and Restated Stockholders’ Agreement, by and among TPG Partners V, L.P., TPG FOF V-A, L.P., TPG FOF V-B, L.P., Silver Lake Partners II, L.P., Silver Lake Technology Investors II, L.P., Silver Lake Partners III, L.P., Silver Lake Technology Investors III, L.P., Sierra Co-Invest, LLC, Sierra Co-Invest II, LLC and Avaya Holdings Corp.* | |||
| 10.49 | Form of Award Agreement for 2012 Sales Incentive Program (Incorporated by reference to Exhibit 10.28 to Avaya Inc.’s Annual Report on Form 10-K filed with the SEC on December 9, 2011) | |||
| 10.50 | Avaya Holdings Corp. 2013 Equity Incentive Plan* | |||
| 10.51 | Avaya Holdings Corp. Employee Stock Purchase Plan* | |||
| 21.1 | List of Subsidiaries* | |||
II-13II-20
Exhibit | Exhibit Title | |||||
| 23.1 | Consent of PricewaterhouseCoopers LLP | |||||
| 23.2 | ||||||
| Consent of Ropes & Gray LLP (included in the opinion filed as Exhibit 5.1)* | ||||||
| 24.1 | Powers of Attorney (included in the signature pages of this Registration Statement) | |||||
| * | To be filed by amendment. |
| ** | Previously filed. |
II-14II-21