Executive Vice President and Chief Legal Officer
Bloomin’ Brands, Inc.
2202 North West Shore Boulevard, Suite 500, Tampa, Florida 33607
(813) 282-1225
(Name, Address, Including Zip Code, and Telephone Number, Including Area Code, of Agent For Service)
Joseph J. Kadow
Executive Vice President and Chief Legal Officer
Bloomin’ Brands, Inc.
2202 North West Shore Boulevard, Suite 500, Tampa, Florida 33607
(813) 282-1225
(Name, Address, Including Zip Code, and Telephone Number, Including Area Code, of Agent For Service)
John M. Gherlein Janet A. Spreen Baker & Hostetler LLP PNC Center 1900 East 9th Street Cleveland, Ohio 44114 Telephone: (216) 621-0200 Facsimile: (216) 696-0740 | Keith F. Higgins Marko S. Zatylny Ropes & Gray LLP Prudential Tower 800 Boylston Street Boston, Massachusetts 02199-3600 Telephone: (617) 951-7000 Facsimile: (617) 951-7050 |
Approximate date of commencement of proposed sale to the public: As soon as practicable after the effective date of this Registration Statement.
If any of the securities being registered on this Form are to be offered on a delayed or continuous basis pursuant to Rule 415 under the Securities Act of 1933, check the following box.box: ¨
If this Form is filed to register additional securities for an offering pursuant to Rule 462(b) under the Securities Act, please check the following box and list the Securities Act registration statement number of the earlier effective registration statement for the same offering. ¨
If this Form is a post-effective amendment filed pursuant to Rule 462 under the Securities Act, check the following box and list the Securities Act registration statement number of the earlier effective registration statement for the same offering. ¨
If this Form is a post-effective amendment filed pursuant to Rule 462(d) under the Securities Act, check the following box and list the Securities Act registration statement number of the earlier effective registration statement for the same offering. ¨
Indicate by check mark whether the registrant is a large accelerated filer, an accelerated filer, a non-accelerated filer or a smaller reporting company. See the definitions of “large accelerated filer,” “accelerated filer” and “smaller reporting company” in Rule 12b-2 of the Exchange Act.
| Large accelerated filer ¨ | Accelerated filer ¨ | Non-accelerated filer x | Smaller reporting company ¨ |
CALCULATION OF REGISTRATION FEE
| ||||
| Title of Each Class of Securities to be Registered | Proposed Maximum Aggregate Offering Price (1)(2) | Amount of Registration Fee | ||
Common Stock, $.01 par value per share | $300,000,000 | $34,380 | ||
| ||||
| ||||
The Registrant hereby amends this Registration Statement on such date or dates as may be necessary to delay its effective date until the Registrant shall file a further amendment which specifically states that this Registration Statement shall thereafter become effective in accordance with Section 8(a) of the Securities Act or until the Registration Statement shall become effective on such date as the Commission, acting pursuant to said Section 8(a), may determine.
Index to Financial Statements
The information in this prospectus is not complete and may be changed. We may not sell these securities until the registration statement filed with the Securities and Exchange Commission is effective. This prospectus is not an offer to sell these securities and it is not soliciting an offer to buy these securities in any state where the offer or sale is not permitted.
Subject to Completion
Preliminary Prospectus dated April 6, 2012May 20, 2013
P R O S P E C T U S
17,000,000 Shares


Common Stock
This isThe selling stockholders identified in this prospectus are selling 17,000,000 shares of Bloomin’ Brands Inc.’s initial public offering.common stock. We arewill not receive any proceeds from the sale of shares by the selling sharesstockholders.
Our common stock is listed on the Nasdaq Global Select Market under the symbol “BLMN.” On May 17, 2013, the last sale price of our common stock.
We expectstock as reported on the public offering price to be between $ and $Nasdaq Global Select Market was $21.75 per share. Currently, no public market exists for the shares. After pricing of the offering, we expect that the shares will trade on the under the symbol “BLM.”
Investing in theour common stock involves risks that are described in the “Risk Factors”“Risk Factors” section beginning on page 13 of this prospectus.
Per Share | Total | |||||||||
Public offering price | $ | $ | ||||||||
Underwriting discount (1) | $ | $ | ||||||||
Proceeds, before expenses, to | $ | $ | ||||||||
| (1) | See “Underwriting” for additional compensation details. |
The underwriters may also exercise their option to purchase up to an additional 2,550,000 shares from us,certain of the selling stockholders at the public offering price, on the same terms and conditions as set forth above, for 30 days after the date of this prospectus.
Neither the Securities and Exchange Commission nor any state securities commission has approved or disapproved of these securities or determined if this prospectus is truthful or complete. Any representation to the contrary is a criminal offense.
The shares will be ready for delivery on or about , 2012.2013.
| BofA Merrill Lynch | Morgan Stanley | J.P. Morgan |
| Deutsche Bank Securities | Goldman, Sachs & Co. |
Jefferies
William Blair | Raymond James | Wells Fargo Securities | The Williams Capital Group, L.P. |
The date of this prospectus is , 2012.2013.
Index to Financial Statements

Index to Financial Statements

Index to Financial Statements

Index to Financial Statements
| Page No. | ||||
| 1 | ||||
| 9 | ||||
| 13 | ||||
| 34 | ||||
| 35 | ||||
MANAGEMENT’S DISCUSSION AND ANALYSIS OF FINANCIAL CONDITION AND RESULTS OF OPERATIONS | ||||
MATERIAL U.S. FEDERAL INCOME AND ESTATE TAX CONSIDERATIONS FOR NON-U.S. HOLDERS | ||||
| F-1 | ||||
You should rely only on the information contained in this prospectus or in any free writing prospectus that we authorize be distributed to you. We have not, and the underwriters have not, authorized anyone to provide you with additional or different information. This document may only be used where it is legal to sell these securities. You should assume that the information contained in this prospectus is accurate only as of the date of this prospectus.
No action is being taken in any jurisdiction outside the United States to permit a public offering of the common stock or possession or distribution of this prospectus in that jurisdiction. Persons who come into possession of this prospectus in jurisdictions outside the United States are required to inform themselves about and to observe any restrictions as to this offering and the distribution of the prospectus applicable to that jurisdiction.
Until , 2012, all dealers that effect transactions in these securities, whether or not participating in this offering, may be required to deliver a prospectus. This is in addition to the dealer’s obligation to deliver a prospectus when acting as underwriters and with respect to their unsold allotments or subscriptions.
i
Index to Financial Statements
MARKET AND OTHER INDUSTRY DATA
In this prospectus, we rely on and refer to information regarding the restaurant industry, sectors within the restaurant industry, such as full-service restaurants, and categories within the full-service sector that are generally defined by price point (e.g., casual or fine dining) and menu type (e.g., steak or Italian), based on information published by industry research firms Technomic, Inc., The NPD Group, Inc. (which prepares and disseminates Consumer Reported Eating Share Trends (“CREST®”) data), Euromonitor International and Knapp-Track, or compiled from market research reports, analyst reports and other publicly available information.International. Delineations of our competitors by price or menu categories may vary by data source.
Unless otherwise indicated in this prospectus:
market data relating to the U.S. market positions of Outback Steakhouse, Carrabba’s Italian Grill, Bonefish Grill or Fleming’s Prime Steakhouse and Wine Bar was published by, or derived by ustaken from Technomic, Inc.’s 2013 Top 500 Chain Restaurant Report and is based on 20112012 calendar year sales; and
market data relating to the size of the U.S. full-service restaurant sector’s menu categories of steak, Italian and seafood was published by Technomic, Inc. and is based on 2010 calendar year sales, which is the most recent available data;
|
market data relating to a foreign country’s full-service restaurant sector or the market position of Outback Steakhouse restaurants in a particular foreign market was published by, or was derived by us from, Euromonitor International, and such data is as of December 31, 2010, which is the most recent available data.2011.
All other industry and market data included in this prospectus are from internal analyses based upon publicly available data or other proprietary research and analysis. We believe these datathis information to be accurate as of the date of this prospectus. However, this information may prove to be inaccurate becausetrue and accurate; however, this information cannot always be verified with complete certainty because of the limitations on the availability and reliability of raw data, the voluntary nature of the data gathering process and other limitations and uncertainties. As a result, you should be aware that market and other similar industry data included in this prospectus, and estimates and beliefs based on that data, may not be reliable.
TRADEMARKS, SERVICE MARKS AND COPYRIGHTS
We own or have rights to trademarks, service marks or trade names that we use in connection with the operation of our business, including our corporate names, logos and website names. Solely for convenience, some of the trademarks, service marks, trade names and copyrights referred to in this prospectus are listed without the©,©®,® and ™ symbols, but we will assert, to the fullest extent permissible under applicable law, our rights to our copyrights, trademarks, service marks and trade names. All brand names or other trademarks appearing in this prospectus are the property of their respective owners, and their use or display should not be construed to imply a relationship with, or an endorsement or a sponsorship of us by, these other parties.
ii
Index to Financial Statements
This summary highlights information appearing elsewhere in this prospectus. This summary does not contain all of the information that you should consider before investing in our common stock. You should carefully read the entire prospectus, including the financial data and related notes and the section entitled “Risk Factors”Factors,” before deciding whether to invest in our common stock. Unless otherwise indicated or the context otherwise requires, references in this prospectus to the “company,“Company,” “Bloomin’ Brands,” “we,” “us” and “our” refer to Bloomin’ Brands, Inc. and its consolidated subsidiaries.
Our Company
We are one of the largest casual dining restaurant companies in the world, with a portfolio of leading, differentiated restaurant concepts. We own and operate 1,2481,275 restaurants and have 195203 restaurants operating under franchise or joint venture arrangements across 4948 states, Puerto Rico, Guam and 21 countries and territories.19 countries. We have five founder-inspired concepts: Outback Steakhouse, Carrabba’s Italian Grill, Bonefish Grill, Fleming’s Prime Steakhouse and Wine Bar and Roy’s. Outback Steakhouse holds the #1 U.S. market position, and Carrabba’s and Bonefish Grill hold the #2 U.S. market position, in their respective full-service restaurant categories. Fleming’s is the fourth largest fine dining steakhouse brand in the U.S.
In 2010, we launched a new strategic plan and operating model, leveraging beststrengthened our management team and adapted practices from the consumer products and retail industries to complement our restaurant acumen and enhance our brand competitiveness.management, analytics and innovation. This new model keeps the customer at the center of our decision-making and focuses on continuous innovation and productivity to drive sustainable sales and profit growth. We have significantly strengthened our management team and implemented initiatives to accelerate innovation, improve analytics and increase productivity. We have made these changes while preserving our entrepreneurial culture at the operating level. Our restaurant managing partners are a key element of this culture, each of whom shares in the cash flows of his or her restaurant after making a required initial cash investment.
We believe our new strategic plan and operating modelSince 2010, we have driven our recentcontinued to balance near-term growth in market share gainswith investments to achieve sustainable growth. As a result of continued improvements in infrastructure and improved margins while providing a solid foundation for continuing salesorganizational effectiveness, in 2012 we grew average restaurant volumes and profit growth. In 2011, we had $3.8 billion of revenue, $100.0 million of net income and $361.5 million of Adjusted EBITDA. In the U.S., each of our four core concepts generated positive comparable restaurant sales over the last seven consecutive quarters, and in 2010 and 2011, our combined comparable restaurant sales at our core concepts grew 2.7% and 4.9%, respectively. Additionally, over the last two years,existing domestic Company-owned restaurants for our Outback Steakhouse, Carrabba’s andItalian Grill, Bonefish Grill have significantly outperformedand Fleming’s Prime Steakhouse and Wine Bar concepts, which we refer to as our core concepts. In addition, we improved our operating margins at the Knapp-Track Casual Dining Index on traffic growthrestaurant level (calculated as Restaurant sales after deduction of main restaurant-level operating costs, which are comprised of Cost of sales, Labor and other related costs and Other restaurant operating expenses) by 8.5%6.1% in 2012 as compared to 2011. Across our restaurant system, we opened 37 restaurants (22 domestic and 15 international), 11.2% and 20.2%, respectively. Overwe increased Total revenues by 3.8% in 2012.
For the three yearsmonths ended March 31, 2013 and the year ended December 31, 2011, our2012, we had $1.1 billion and $4.0 billion of Total revenues, $63.2 million and $50.0 million of Net income attributable to Bloomin’ Brands, Inc. and $63.2 million and $114.0 million of Adjusted net income increased from a net loss of $64.5 millionattributable to Bloomin’ Brands, Inc., respectively. Adjusted net income attributable to Bloomin’ Brands, Inc. is a non-GAAP measure. See note (5) of $100.0 million,“Summary Consolidated Financial and Adjusted EBITDA increased from $319.9 millionOther Data” for information about our use of this measure and a reconciliation of the differences between this measure and Net income attributable to $361.5 million. Over the same period, our Adjusted EBITDA margins grew from 8.9% to 9.4%.Bloomin’ Brands, Inc.
Our concepts seek to provide a compelling customer experience combining great food, highly attentive service and lively and contemporary ambience at attractive prices. EachOur ingredients are carefully selected to offer a high degree of freshness and quality and maintain the authenticity of our recipes, while keeping costs in line with our
target pricing. We believe each of our concepts maintains a unique, founder-inspired brand identity and entrepreneurial culture, while leveraging our scale and enhanced operating model. Below is an overview of our four core concepts:

| A casual dining steakhouse featuring high quality, freshly prepared food, attentive service and Australian dé |

Index to Financial Statements

| An authentic Italian casual dining restaurant featuring high quality handcrafted dishes, an exhibition kitchen and | ||
| A polished casual seafood restaurant featuring market fresh grilled fish, high-end yet approachable service and a lively bar. Bonefish Grill’s bar provides an energetic setting for drinks, dining and socializing with a | ||

| |||


Recent Evolution of Our Business
In November 2009, we hired Elizabeth A. Smith as Chief Executive Officer. Ms. Smith brought close to 20 years of consumer products experience, including five years as a senior executive at Avon Products, Inc. and 14 years at Kraft Foods Inc. Under Ms. Smith’s leadership, we launched our new strategic plan and operating model. The key initiatives we implemented as part of this plan and model, many of which are ongoing, are summarized below:
|
| |

Evolved our menus by supplementing our classic items with a greater variety of lighter dishes and lower priced items, such as small plates and handhelds, and enhanced bar and happy hour offerings to broaden appeal, improve our value perception and increase traffic.
Shifted our marketing strategy away from principally using brand awareness messages to traffic generating messages focused on quality, value and limited-time offers.
Initiated a remodel program focused on Outback Steakhouse and Carrabba’s to refresh the restaurant base, through which we have remodeled one-third of our domestic Outback Steakhouse restaurants to date; we are testing remodel designs at Carrabba’s.
Refocused our service to improve execution on aspects of the dining experience that matter most to our customers as indicated through ongoing customer surveys.
Index to Financial Statements
|
|
|
|
|
Competitive Strengths
We believe the following competitive strengths, when combined with our strategic plan and operating model, provide a platform to deliver sustainable sales and profit growth:
Strong Market Position With Highly Recognizable Brands. We have market leadership positions in each of our core concepts domestically, as well as in our core international markets. Based on 20112012 sales in the U.S., Outback Steakhouse ranked #1 in the full-service steak restaurant category, Carrabba’s Italian Grill ranked #2 in the full-service Italian restaurant category, Bonefish Grill ranked #2 in the full-service seafood restaurant category and Fleming’s Prime Steakhouse and Wine Bar is the fourth largest fine dining steakhouse brand. In 20102011, Outback Steakhouse ranked #1 in market share in Brazil among full-service restaurants and in South Korea among western full-service restaurant concepts. We believe our market leadership positions and scale will allow us to continue to gain market share in the fragmented restaurant industry.
Compelling 360-Degree Customer Experience. We believe we offer a compelling 360-degree customer experience with superioroutstanding value by providing great food, highly attentive service and lively and contemporary ambience at attractive prices. We believe our customer experience and value perception, are differentiating factors thatbased on the following elements, drive strong customer loyalty.loyalty:
| • | Great Food.We deliver consistently executed, freshly prepared meals using high quality ingredients. |
| • |
|
Index to Financial Statements
| • | Lively and Contemporary Ambience. |
| • | Attractive Prices. |
Diversified Portfolio With Global Presence. Our diversified portfolio of distinct concepts and global presence provide us with a broad growth platform to capture additional market share domestically and internationally. We are diversified by concept, category and geography as follows:
| • | By Concept and Category. We believe our concepts are differentiated relative to each other by category and to their respective key competitors. Our core concepts target three separate, large and highly fragmented menu categories of the full-service restaurant sector: steak, |
| • | By Geography. The system-wide sales of our international Outback Steakhouse restaurants |
Business Model Focused on Continuous Innovation and Productivity. Our business model keeps the customer at the center of our decision-making and focuses on innovation and productivity to drive sustainable sales and profit growth. We reinvest a portion of productivity savings in innovation to enable us to respond to continuously evolving consumer trends.
| • | Innovation. We have established an enterprise-wide innovation process to enhance every dimension of the customer experience. Cross-functional innovation teams collaborate |
| • | Productivity.Without compromising the customer experience, we continuously explore opportunities to increase productivity and reduce costs. Our cost-savings allow us to reinvest in innovation initiatives, |
Experienced Executive and Field Management Teams. Our organization maintains deep restaurant experience at the operating level coupled with a functional corporate support team that drives innovation, productivity and scale efficiencies. Our management team is led by our Chairman and Chief Executive Officer, Elizabeth A. Smith, and since she joined us in November 2009, we have further enhancedSmith. The other members of our senior leadership team by addinginclude executives from best-in-class consumer and retail companies. Our senior team possesses strongcompanies with experience in brand management, innovation and innovation expertise, which facilitates our focus on analytics and customer testing.analytics. This complements our field operating and management teams, who have deep experience operating our restaurants and in the restaurant industry. Our core concept presidents have been with us for an average of 20 years and have an average of 30 years of industry experience. Our regional field management team has an average of over 13 years of experience working with us at the managing partner level or above.
Index to Financial Statements
Our Growth Strategy
We believe there are significant opportunities to continuefocused on the following three strategies for continuing to drive sustainable sales and profit growth through the following three strategies:growth:
Grow Comparable Restaurant Sales.Building on the strong momentum of the business, weWe believe we have the following opportunities to continue to grow comparable restaurant sales:
| • | Remodel and Relocate Our Restaurants. In the near term, we are focused on continuing our |
| • | Continue to Improve Promotional Marketing to Drive Traffic. We plan to continue to improve our limited-time offers and multimedia marketing campaigns. By promoting continuously evolving |
| • | Expand Share of Occasions and Increase Frequency. We believe we have a strong market share of weekend dinner occasions and a significant opportunity to grow our share of other dining occasions across all concepts. |
| • | Continue Innovating New Menu Items and Categories. Our research and development, or R&D, team will seek to continue to introduce innovative menu items that we believe match evolving consumer preferences and broaden appeal. In addition to continuous menu enhancements, we periodically evaluate our menus at each of our concepts. For example, we are working on significant menu updates at Bonefish Grill and at Carrabba’s Italian Grill in connection with our revitalization plan. |
Pursue New Domestic and International Development With Strong Unit Level Economics.We believe that a substantial development opportunity remains for our concepts in the U.S. and internationally. We expect to open 30 company-ownedbetween 45 and five joint venture units55 system-wide locations in 20122013 and increase the pace thereafter. We expect that the mix of development thereafter.new units will be weighted approximately 60% to domestic restaurants in 2013, but will shift to a higher weight of international units as we continue to implement our international expansion plans.
| • | Pursue Domestic Development Focused on Bonefish Grill and Carrabba’ |
to six years. Bonefish Grill unit growth |
| • | Accelerate International Growth Focused on Outback Steakhouse.We believe we are well-positioned to continue to expand internationally beyond our |
Index to Financial Statements
Drive Margin Improvement.We believe that we have the opportunity to increase our margins through continued productivity and increased fixed-cost leverage as we grow comparable restaurant sales. We have developed a multi-year productivity plan that focuses on high value initiatives across four categories: labor, food cost, supply chain and restaurant facilities. This strategy is expected to yieldWe set a target for productivity and cost savings of $50.0 million annually for 2012 through 2014 and estimate that these initiatives allowed us to save approximately $50$59.0 million in 2012the aggregate in 2012. Our ability to achieve the targets and additionalour actual savings in future years.will depend on successful execution of identified initiatives, various economic factors, including commodity and labor costs, and other circumstances that impact our supply chain.
Our Challenges and Risk Factors
The restaurant industry continues to face many challenges due to the current economic environment. For example, the ongoing impacts of high unemployment, financial market volatility and unpredictability, the housing crisis, the so-called “sequester” and related governmental spending and budget matters, other national, regional and local regulatory and economic conditions, gasoline prices, reduced disposable consumer income and consumer confidence have had a negative effect on discretionary consumer spending. This has negatively affected customer traffic and comparable restaurant sales for us and throughout our industry thus far in 2013. We believe these factors and conditions, among other items, are creating a challenging sales environment in the casual dining sector for 2013. As these conditions persist, we will face increased pressure with respect to our pricing, traffic levels and commodity costs, which could negatively impact our business and results of operations.
We continue to have a significant amount of debt (approximately $1.5 billion as of March 31, 2013) and have pledged substantially all of our assets under certain of our loan arrangements. We believe that our leverage, as well as competition in our industry and economic conditions that impact customer spending and our costs, are among the challenges we face in continuing to implement our strategic plan.
Before you invest in our common stock, you should carefully consider all of the information in this prospectus, including matters set forth under the heading “Risk Factors.” Risks relating to our business include the following, among others:
we face significant competition for customers, real estate and employees that could affect our profit margins;
general economic factors and changes in consumer preference may adversely affect our performance;performance and growth plans;
our plans depend on initiatives designed to increase sales, reduce costs and improve the efficiency and effectiveness of our operations, and failure to achieve or sustain these plans could affect our performance adversely;
our failure to comply with governmental regulation, and the costs of compliance or non-compliance, could adversely affect our business;
changes in consumer perception of food safety, damage to our reputation or infringement of our intellectual property could harm our business; and
our substantial leverage could adversely affect our ability to raise additional capital to fund our operations.
Our History
Our predecessor, OSI Restaurant Partners, Inc., was incorporated in August 1987, and we opened our first Outback Steakhouse restaurant in 1988. We became a Delaware corporation in 1991 as part of a corporate reorganization completed in connection with our predecessor’s initial public offering.
BloominBloomin’ Brands, Inc., formerly known as Kangaroo Holdings, Inc., was incorporated in Delaware in October 2006 by an investor group comprised of funds advised by Bain Capital Partners, LLC and Catterton Management Company, LLC, who we collectively refer to as our “Sponsors,” and Chris T. Sullivan, Robert D. Basham and J. Timothy Gannon, who we collectively refer to as our Founders,“Founders,” and members of our management. On June 14, 2007, we acquired OSI Restaurant Partners, Inc. by means of a merger and related transactions, referred to in this prospectus as the Merger.“Merger.” At the time of the Merger, OSI Restaurant Partners, Inc. was converted into a Delaware limited liability company named OSI Restaurant Partners, LLC, or OSI.“OSI.” In connection with the Merger, we implemented a new ownership and financing arrangement for our owned restaurant properties, pursuant to which Private Restaurant Properties, LLC, or PRP,“PRP,” our indirect wholly-owned subsidiary, acquired 343 restaurant properties then owned by OSI and leased them back to subsidiaries of OSI. In March 2012, we refinanced the commercial mortgage-backed securities loan that we entered into in 2007 in connection with the Merger with a new $500.0 million commercial mortgage-backed loan. See Note 20 of our Notes to Consolidated Financial Statements. Following the refinancing, OSI remains our primary operating entity and New Private Restaurant Properties, LLC, another indirect wholly-owned subsidiary of ours, continues to lease 261 of our owned restaurant properties to an OSI subsidiaries.subsidiary.
In August and September 2012, we and certain of our stockholders sold a total of 18.4 million shares of our common stock in our initial public offering. Since that time, our shares of common stock have been listed on the Nasdaq Global Select Market under the symbol “BLMN.”
Index to Financial Statements
Our Sponsors and Founders
Upon completion of this offering, Bain Capital, LLCan investor group consisting of investment funds advised by our Sponsors and Catterton Management Company, LLC, which we refer to astwo of our Sponsors,Founders, Robert D. Basham and Chris T. Sullivan, will continue to hold a controlling interest in, us and will continue to have significant influence over, us and decisions made by stockholders, and they may have interests that differ from yours. This investor group is expected to collectively beneficially own an aggregate of 63.7% of our outstanding common stock (or 61.6% if the underwriters exercise their option to purchase additional shares from certain of the selling stockholders in full) upon completion of this offering, and will therefore continue to control a majority of the voting power of our outstanding common stock. See “Principal and Selling Stockholders” and “Risk Factors—Risks Related to this Offering and Our Common Stock.” We are a party to a stockholders agreement (the “Stockholders Agreement”), pursuant to which our Sponsors have the right, subject to certain conditions, to nominate up to three representatives to our Board of Directors and committees of our Board of Directors so long as they collectively own more than 3% of our outstanding common stock. See “Related Party Transactions—Arrangements With Our Investors.”
Certain of our Directors are affiliated with our Sponsors, which could result in conflicts of interest arising from the fiduciary duties owed to these various entities, business opportunities that may arise and the time and attention needed to fulfill these commitments. One of our Founders also serves as a Director and, due to his interests in certain transactions with us and our affiliates, he may also experience conflicts of interest. See “Related Party Transactions—Arrangements With Our Sponsors and Founders” and “Risk Factors—Risks Related to this Offering and Our Common Stock.”
Bain Capital Partners, LLC
Bain Capital LLC, whose affiliates include Bain Capital Partners, LLC (along with its associated investment funds, or Bain Capital,any successor to its investment management business, “Bain Capital”) is a global private investment firm that manages several pools of capital including private equity, venture capital, public equity, credit products and absolute return investments with approximately $60$70 billion in assets under management. Since its inception in 1984, Bain Capital has made private equity investments and add-on acquisitions in more than 300 companies in a variety of industries around the world, including such restaurant concepts as Domino’s Pizza, Dunkin’ Brands, Burger King and Skylark Company (Japan), and retail businesses including Toys “R” Us, AMC Entertainment, Michael’s Stores, Staples and Gymboree. Headquartered in Boston, Bain Capital has offices in New York, Palo Alto, Chicago, London, Melbourne, Munich, Hong Kong, Shanghai, Tokyo, and Mumbai.
Catterton Management Company, LLC
Catterton Management Company, LLC, or Catterton, is a leading private equity firm with a focus on providing equity capital in support of small to middle-market consumer companies that are positioned for attractive growth. Since its founding in 1989, Catterton has invested in approximately 80 companies and led equity investments totaling over $3.6 billion.companies. Presently, Catterton is actively managing more than $2.5 billion of equity capital focused on all sectors of the consumer industry.
Company Information
Our principal executive offices are located at 2202 North West Shore Boulevard, Suite 500, Tampa, Florida 33607, and our telephone number at that address is (813) 282-1225.282-1225 and our website address is www.bloominbrands.com. Our website and the information contained on or accessible through our website are not part of this prospectus.
Index to Financial Statements
The Offering
Common stock offered by | 17,000,000 shares |
|
immediately after completion of this offering
Option to purchase additional shares |
Use of proceeds | We |
Dividend policy | We do not currently pay cash dividends on our common stock and do not anticipate paying any dividends on our common stock in the foreseeable future. Any future determinations relating to our dividend policies will be made at the discretion of our |
Principal stockholders | Upon completion of this offering, an investor group consisting of investment funds |
Risk factors | You should read carefully the “Risk Factors” section of this prospectus for a discussion of factors that you should consider before deciding to invest in shares of our common stock. |
| “ |
The number of shares of our common stock to be outstanding after this offering excludes (1) outstanding options to purchase 11,863,378 shares of our common stock at a weighted average exercise price of $7.52 per share, of which options to purchase 5,673,525 shares were exercisable as of March 15, 2012, and (2) an additional shares of our common stock issuable pursuant to future awards under our 2012 Incentive Award Plan.
Index to Financial Statements
SUMMARY CONSOLIDATED FINANCIAL AND OTHER DATA
The following table sets forth our summary consolidated financial and other data as of the dates and for the periods indicated. The summary consolidated financial data as of December 31, 20102012 and December 31, 2011 and for each of the three years in the period ended December 31, 20112012 presented in this table have been derived from the audited consolidated financial statements included elsewhere in this prospectus. The summary consolidated balance sheet data as of December 31, 20092010 has been derived from our historical audited consolidated financial statements for that year, which are not included in this prospectus. The summary consolidated financial data as of March 31, 2013 and for the three months ended March 31, 2013 and 2012 have been derived from the unaudited interim consolidated financial statements included in this prospectus. The summary consolidated balance sheet data as of March 31, 2012 has been derived from our historical unaudited interim consolidated financial statements for that year, which are not included in this prospectus. The total number of system-wide restaurants in the following table is unaudited for all periods presented. Historical results are not necessarily indicative of the results to be expected for future periods.
This summary consolidated financial and other data should be read in conjunction with the disclosures set forth under “Capitalization,” “Management’s Discussion and Analysis of Financial Condition and Results of Operations” and “Unaudited Pro Forma Consolidated Financial Statements” and the consolidated financial statements and the related notes thereto appearing elsewhere in this prospectus.
| Years Ended December 31, | ||||||||||||
| 2009 | 2010 | 2011 | ||||||||||
| ($ in thousands, except per share amounts) | ||||||||||||
Statement of Operations Data: | ||||||||||||
Revenues | ||||||||||||
Restaurant sales | $ | 3,573,760 | $ | 3,594,681 | $ | 3,803,252 | ||||||
Other revenues | 27,896 | 33,606 | 38,012 | |||||||||
|
|
|
|
|
| |||||||
Total revenues | 3,601,656 | 3,628,287 | 3,841,264 | |||||||||
|
|
|
|
|
| |||||||
Costs and expenses | ||||||||||||
Cost of sales | 1,184,074 | 1,152,028 | 1,226,098 | |||||||||
Labor and other related | 1,024,063 | 1,034,393 | 1,094,117 | |||||||||
Other restaurant operating | 849,696 | 864,183 | 890,004 | |||||||||
Depreciation and amortization | 186,074 | 156,267 | 153,689 | |||||||||
General and administrative (1) | 252,298 | 252,793 | 291,124 | |||||||||
Recovery of note receivable from affiliated entity (2) | — | — | (33,150 | ) | ||||||||
Loss on contingent debt guarantee | 24,500 | — | — | |||||||||
Goodwill impairment | 58,149 | — | — | |||||||||
Provision for impaired assets and restaurant closings (3) | 134,285 | 5,204 | 14,039 | |||||||||
Income from operations of unconsolidated affiliates | (2,196 | ) | (5,492 | ) | (8,109 | ) | ||||||
|
|
|
|
|
| |||||||
Total costs and expenses | 3,710,943 | 3,459,376 | 3,627,812 | |||||||||
|
|
|
|
|
| |||||||
Income (loss) from operations | (109,287 | ) | 168,911 | 213,452 | ||||||||
Gain on extinguishment of debt (4) | 158,061 | — | — | |||||||||
Other income (expense), net | (199 | ) | 2,993 | 830 | ||||||||
Interest expense, net | (115,880 | ) | (91,428 | ) | (83,387 | ) | ||||||
|
|
|
|
|
| |||||||
Income (loss) before provision (benefit) for income taxes | (67,305 | ) | 80,476 | 130,895 | ||||||||
Provision (benefit) for income taxes | (2,462 | ) | 21,300 | 21,716 | ||||||||
|
|
|
|
|
| |||||||
Net income (loss) | (64,843 | ) | 59,176 | 109,179 | ||||||||
Less: net income (loss) attributable to noncontrolling interests | (380 | ) | 6,208 | 9,174 | ||||||||
|
|
|
|
|
| |||||||
Net income (loss) attributable to Bloomin’ Brands, Inc. | $ | (64,463 | ) | $ | 52,968 | $ | 100,005 | |||||
|
|
|
|
|
| |||||||
Basic net income (loss) per share (5) | $ | (0.62 | ) | $ | 0.50 | $ | 0.94 | |||||
Diluted net income (loss) per share (5) | $ | (0.62 | ) | $ | 0.50 | $ | 0.94 | |||||
Weighted average shares outstanding | ||||||||||||
Basic | 104,442 | 105,968 | 106,224 | |||||||||
Diluted | 104,442 | 105,968 | 106,689 | |||||||||
| Years Ended December 31, | Three Months Ended March 31, | |||||||||||||||||||
| 2012 | 2011 | 2010 | 2013 | 2012 | ||||||||||||||||
| (unaudited) | (unaudited) | |||||||||||||||||||
| (in thousands) | ||||||||||||||||||||
Statements of Operations Data: | ||||||||||||||||||||
Revenues | ||||||||||||||||||||
Restaurant sales | $ | 3,946,116 | $ | 3,803,252 | $ | 3,594,681 | $ | 1,082,356 | $ | 1,045,466 | ||||||||||
Other revenues | 41,679 | 38,012 | 33,606 | 9,894 | 10,160 | |||||||||||||||
|
|
|
|
|
|
|
|
|
| |||||||||||
Total revenues | 3,987,795 | 3,841,264 | 3,628,287 | 1,092,250 | 1,055,626 | |||||||||||||||
|
|
|
|
|
|
|
|
|
| |||||||||||
Costs and expenses | ||||||||||||||||||||
Cost of sales | 1,281,002 | 1,226,098 | 1,152,028 | 349,989 | 335,859 | |||||||||||||||
Labor and other related | 1,117,624 | 1,094,117 | 1,034,393 | 299,867 | 293,501 | |||||||||||||||
Other restaurant operating | 918,522 | 890,004 | 864,183 | 233,809 | 218,965 | |||||||||||||||
Depreciation and amortization | 155,482 | 153,689 | 156,267 | 40,196 | 38,860 | |||||||||||||||
General and administrative (1)(2) | 326,473 | 291,124 | 252,793 | 72,491 | 76,002 | |||||||||||||||
Recovery of note receivable from affiliated entity (3) | — | (33,150 | ) | — | — | — | ||||||||||||||
Provision for impaired assets and restaurant closings | 13,005 | 14,039 | 5,204 | 1,896 | 4,435 | |||||||||||||||
Income from operations of unconsolidated affiliates | (5,450 | ) | (8,109 | ) | (5,492 | ) | (2,858 | ) | (2,404 | ) | ||||||||||
|
|
|
|
|
|
|
|
|
| |||||||||||
Total costs and expenses | 3,806,658 | 3,627,812 | 3,459,376 | 995,390 | 965,218 | |||||||||||||||
|
|
|
|
|
|
|
|
|
| |||||||||||
Income from operations | 181,137 | 213,452 | 168,911 | 96,860 | 90,408 | |||||||||||||||
Loss on extinguishment and modification of debt (4) | (20,957 | ) | — | — | — | (2,851 | ) | |||||||||||||
Other (expense) income, net | (128 | ) | 830 | 2,993 | (217 | ) | 54 | |||||||||||||
Interest expense, net (4) | (86,642 | ) | (83,387 | ) | (91,428 | ) | (20,880 | ) | (20,974 | ) | ||||||||||
|
|
|
|
|
|
|
|
|
| |||||||||||
Income before provision for income taxes | 73,410 | 130,895 | 80,476 | 75,763 | 66,637 | |||||||||||||||
Provision for income taxes | 12,106 | 21,716 | 21,300 | 10,707 | 12,805 | |||||||||||||||
|
|
|
|
|
|
|
|
|
| |||||||||||
Net income | 61,304 | 109,179 | 59,176 | 65,056 | 53,832 | |||||||||||||||
Less: net income attributable to noncontrolling interests | 11,333 | 9,174 | 6,208 | 1,833 | 3,833 | |||||||||||||||
|
|
|
|
|
|
|
|
|
| |||||||||||
Net income attributable to Bloomin’ Brands, Inc. | $ | 49,971 | $ | 100,005 | $ | 52,968 | $ | 63,223 | $ | 49,999 | ||||||||||
|
|
|
|
|
|
|
|
|
| |||||||||||
Index to Financial Statements
| Years Ended December 31, | ||||||||||||
| 2009 | 2010 | 2011 | ||||||||||
| ($ in thousands) | ||||||||||||
Statement of Cash Flows Data: | ||||||||||||
Net cash provided by (used in): | ||||||||||||
Operating activities | $ | 195,537 | $ | 275,154 | $ | 322,450 | ||||||
Investing activities | (39,171 | ) | (71,721 | ) | (113,142 | ) | ||||||
Financing activities | (137,397 | ) | (167,315 | ) | (89,300 | ) | ||||||
Other Financial and Operating Data: | ||||||||||||
Number of system-wide restaurants at end of period | 1,477 | 1,439 | 1,443 | |||||||||
Comparable domestic restaurant sales (6) | (8.6 | )% | 2.7 | % | 4.9 | % | ||||||
Capital expenditures | $ | 57,528 | $ | 60,476 | $ | 120,906 | ||||||
Adjusted EBITDA (7) | 319,925 | 338,898 | 361,478 | |||||||||
Adjusted EBITDA margin (7) | 8.9 | % | 9.3 | % | 9.4 | % | ||||||
Balance Sheet Data (at period end, 2009 unaudited): | ||||||||||||
Cash and cash equivalents | $ | 330,957 | $ | 365,536 | $ | 482,084 | ||||||
Net working capital (deficit) (8) | (187,648 | ) | (120,135 | ) | (248,145 | ) | ||||||
Total assets | 3,340,708 | 3,243,411 | 3,353,936 | |||||||||
Total debt (4)(9) | 2,302,233 | 2,171,524 | 2,109,290 | |||||||||
Total shareholders’ (deficit) equity | (116,625 | ) | (55,911 | ) | 40,297 | |||||||
Pro Forma Balance Sheet Data (9): | ||||||||||||
Cash and cash equivalents | $ | |||||||||||
Net working capital (deficit) | $ | |||||||||||
Total assets | $ | |||||||||||
Total debt | $ | |||||||||||
Total shareholders’ equity | $ | |||||||||||
| Years Ended December 31, | Three Months Ended March 31, | |||||||||||||||||||
| 2012 | 2011 | 2010 | 2013 | 2012 | ||||||||||||||||
| (unaudited) | (unaudited) | |||||||||||||||||||
| (in thousands, except per share amounts) | ||||||||||||||||||||
Basic earnings per share | $ | 0.45 | $ | 0.94 | $ | 0.50 | $ | 0.52 | $ | 0.47 | ||||||||||
Diluted earnings per share | 0.44 | 0.94 | 0.50 | 0.50 | 0.47 | |||||||||||||||
Weighted average shares outstanding | ||||||||||||||||||||
Basic | 111,999 | 106,224 | 105,968 | 121,238 | 106,332 | |||||||||||||||
Diluted | 114,821 | 106,689 | 105,968 | 126,507 | 107,058 | |||||||||||||||
Pro forma diluted weighted average common shares outstanding (5) | 123,505 | 120,886 | 120,165 | 126,507 | 121,255 | |||||||||||||||
Statement of Cash Flows Data: | ||||||||||||||||||||
Net cash provided by (used in): | ||||||||||||||||||||
Operating activities | $ | 340,091 | $ | 322,450 | $ | 275,154 | $ | 18,100 | $ | 2,096 | ||||||||||
Investing activities | 19,944 | (113,142 | ) | (71,721 | ) | (38,394 | ) | 155,820 | ||||||||||||
Financing activities | (586,219 | ) | (89,300 | ) | (167,315 | ) | (21,226 | ) | (306,404 | ) | ||||||||||
Other Financial and Operating Data: | ||||||||||||||||||||
Number of system-wide restaurants at end of period | 1,471 | 1,443 | 1,439 | 1,478 | 1,442 | |||||||||||||||
Comparable domestic restaurant sales (6) | 3.7 | % | 4.9 | % | 2.7 | % | 1.6 | % | 5.2 | % | ||||||||||
Capital expenditures | $ | 178,720 | $ | 120,906 | $ | 60,476 | $ | 40,950 | $ | 34,019 | ||||||||||
Adjusted income from operations (5) | 236,908 | 197,255 | 179,618 | 96,860 | 99,495 | |||||||||||||||
Adjusted net income attributable to Bloomin’ Brands, Inc. (5) | 114,038 | 86,497 | 60,838 | 63,223 | 59,646 | |||||||||||||||
Adjusted diluted earnings per share (5) | 0.99 | 0.81 | 0.57 | 0.50 | 0.56 | |||||||||||||||
Adjusted diluted earnings per pro forma share (5) | 0.92 | 0.72 | 0.51 | 0.50 | 0.49 | |||||||||||||||
Balance Sheet Data: | ||||||||||||||||||||
Cash and cash equivalents (7) | $ | 261,690 | $ | 482,084 | $ | 365,536 | $ | 217,469 | $ | 335,059 | ||||||||||
Net working capital (deficit) (4)(8) | (203,566 | ) | (248,145 | ) | (120,135 | ) | (146,838 | ) | (29,981 | ) | ||||||||||
Total assets | 3,016,553 | 3,353,936 | 3,243,411 | 2,954,393 | 3,037,222 | |||||||||||||||
Total debt, net (4) | 1,494,440 | 2,109,290 | 2,171,524 | 1,464,861 | 1,825,153 | |||||||||||||||
Total stockholders’ equity (deficit) (9) | 220,205 | 40,297 | (55,911 | ) | 298,739 | 95,124 | ||||||||||||||
| (1) | Includes management fees and out-of-pocket and other reimbursable expenses paid to a management company owned by our Sponsors and Founders of |
| (2) |
| (3) | During 2011, we |
During |
| As a result of these transactions, we recorded a loss from the |
| 2012. In March |
Index to Financial Statements
Adjusted EBITDA does not reflect our capital expenditures or future requirements for capital expenditures;
Adjusted EBITDA does not reflect the cost of stock-based compensation;
Adjusted EBITDA does not reflect the interest expense, or the cash requirements necessary to service interest or principal payments, associated with our indebtedness;
Adjusted EBITDA does not reflect depreciation and amortization, which are non-cash charges, although the assets being depreciated and amortized will likely have to be replaced in the future, and it does not reflect cash requirements for such replacements; and
Adjusted EBITDA does not reflect changes in, or cash requirements for, our working capital needs.
Index to Financial Statements
| Years Ended December 31, | ||||||||||||
| 2009 | 2010 | 2011 | ||||||||||
| (in thousands) | ||||||||||||
Net income (loss) attributable to Bloomin’ Brands, Inc. | $ | (64,463 | ) | $ | 52,968 | $ | 100,005 | |||||
(Benefit) provision for income taxes | (2,462 | ) | 21,300 | 21,716 | ||||||||
Interest expense, net | 115,880 | 91,428 | 83,387 | |||||||||
Depreciation and amortization | 186,074 | 156,267 | 153,689 | |||||||||
|
|
|
|
|
| |||||||
EBITDA | $ | 235,029 | $ | 321,963 | $ | 358,797 | ||||||
|
|
|
|
|
| |||||||
Impairments and disposals | 192,572 | 4,915 | 15,062 | |||||||||
Stock-based compensation expense | 15,215 | 3,146 | 3,907 | |||||||||
Other losses (gains) | 884 | (1,833 | ) | (90 | ) | |||||||
Deal-related expenses (a) | — | 1,157 | 7,582 | |||||||||
Management fees and expenses | 9,786 | 9,550 | 9,370 | |||||||||
Gain on extinguishment of debt | (158,061 | ) | — | — | ||||||||
Unusual loss (gain) (b) | 24,500 | — | (33,150 | ) | ||||||||
|
|
|
|
|
| |||||||
Adjusted EBITDA | $ | 319,925 | $ | 338,898 | $ | 361,478 | ||||||
|
|
|
|
|
| |||||||
| (5) | In addition to the results provided in accordance with generally accepted accounting principles in the United States (“U.S. GAAP”), we have provided non-GAAP measures that present operating results in 2012, 2011 and 2010 and for the three months ended March 31, 2013 and 2012 on an adjusted and/or pro forma basis. These are supplemental measures of performance that are not required by or presented in accordance with U.S. GAAP. They are not measurements of our operating or financial performance under U.S. GAAP and should not be considered as an alternative to Income from operations, Net income attributable to Bloomin’ Brands, Inc., Diluted earnings per share or any other performance measures derived in accordance with U.S. GAAP. |
| We provide these adjusted operating results because we believe they are useful for investors to assess the operating performance of our business without the effect of certain charges. For the periods presented, these charges include transaction-related expenses primarily attributable to costs incurred in connection with the initial public offering, the refinancing of debt and other deal costs, management fees paid to the management company associated with our Sponsors and Founders, loss on the extinguishment and modification of debt, collection of a promissory note and other amounts in connection with the 2009 sale of one of our restaurant concepts and the tax effect of these items. Pro forma amounts give effect to the issuance of the shares in the initial public offering as if they were all outstanding on January 1, 2010. The use of these measures permits a comparative assessment of our operating performance relative to our performance based on U.S. GAAP results, while isolating the effects of certain items that vary from period to period without correlation to core operating performance or that vary widely among similar companies. However, our inclusion of these adjusted measures should not be construed as an inference that our future results will be unaffected by excluded or unusual items or that the items for which we have made adjustments are unusual or infrequent. In the future, we may incur expenses or generate income similar to the adjusted items. We further believe that the disclosure of these non-GAAP measures is useful to investors as they form the basis for how our management team and Board of Directors evaluate our performance including for achievement of objectives under our cash and equity compensation plans. By disclosing these non-GAAP measures, we believe that we provide investors a greater understanding of, and an enhanced level of transparency into, the means by which our management team operates our business. |
| The following table reconciles Adjusted income from operations, Adjusted net income attributable to Bloomin’ Brands, Inc., Adjusted diluted earnings per share and Adjusted diluted earnings per pro forma share for the years ended December 31, 2012, 2011 and 2010 and the three months ended March 31, 2013 and 2012 to their respective most comparable GAAP measures: |
| Years Ended December 31, | Three Months Ended March 31, | |||||||||||||||||||
| 2012 | 2011 | 2010 | 2013 | 2012 | ||||||||||||||||
| (in thousands) | ||||||||||||||||||||
Income from operations | $ | 181,137 | $ | 213,452 | $ | 168,911 | $ | 96,860 | $ | 90,408 | ||||||||||
Transaction-related expenses (a) | 45,495 | 7,583 | 1,157 | — | 6,761 | |||||||||||||||
Management fees and expenses (b) | 13,776 | 9,370 | 9,550 | — | 2,326 | |||||||||||||||
Other gains (c) | (3,500 | ) | (33,150 | ) | — | — | — | |||||||||||||
|
|
|
|
|
|
|
|
|
| |||||||||||
Adjusted income from operations | $ | 236,908 | $ | 197,255 | $ | 179,618 | $ | 96,860 | $ | 99,495 | ||||||||||
|
|
|
|
|
|
|
|
|
| |||||||||||
Net income attributable to Bloomin’ Brands, Inc. | $ | 49,971 | $ | 100,005 | $ | 52,968 | $ | 63,223 | $ | 49,999 | ||||||||||
Transaction-related expenses (a) | 45,495 | 7,583 | 1,157 | — | 6,761 | |||||||||||||||
Management fees and expenses (b) | 13,776 | 9,370 | 9,550 | — | 2,326 | |||||||||||||||
Other gains (c) | (3,500 | ) | (33,150 | ) | — | — | — | |||||||||||||
Loss on extinguishment and modification of debt (d) | 20,956 | — | — | — | 2,851 | |||||||||||||||
|
|
|
|
|
|
|
|
|
| |||||||||||
Total adjustments, before income taxes | 76,727 | (16,197 | ) | 10,707 | — | 11,938 | ||||||||||||||
| Years Ended December 31, | Three Months Ended March 31, | |||||||||||||||||||
| 2012 | 2011 | 2010 | 2013 | 2012 | ||||||||||||||||
| (in thousands) | ||||||||||||||||||||
Income tax effect of adjustments (e) | (12,660 | ) | 2,689 | (2,837 | ) | — | (2,291 | ) | ||||||||||||
|
|
|
|
|
|
|
|
|
| |||||||||||
Net adjustments | 64,067 | (13,508 | ) | 7,870 | — | 9,647 | ||||||||||||||
|
|
|
|
|
|
|
|
|
| |||||||||||
Adjusted net income attributable to Bloomin’ Brands, Inc. | $ | 114,038 | $ | 86,497 | $ | 60,838 | $ | 63,223 | $ | 59,646 | ||||||||||
|
|
|
|
|
|
|
|
|
| |||||||||||
Diluted earnings per share | $ | 0.44 | $ | 0.94 | $ | 0.50 | $ | 0.50 | $ | 0.47 | ||||||||||
|
|
|
|
|
|
|
|
|
| |||||||||||
Adjusted diluted earnings per share | $ | 0.99 | $ | 0.81 | $ | 0.57 | $ | 0.50 | $ | 0.56 | ||||||||||
|
|
|
|
|
|
|
|
|
| |||||||||||
Adjusted diluted earnings per pro forma share (f) | $ | 0.92 | $ | 0.72 | $ | 0.51 | $ | 0.50 | $ | 0.49 | ||||||||||
|
|
|
|
|
|
|
|
|
| |||||||||||
Diluted weighted average shares outstanding | 114,821 | 106,689 | 105,968 | 126,507 | 107,058 | |||||||||||||||
Pro forma initial public offering adjustment (f) | 8,684 | 14,197 | 14,197 | — | 14,197 | |||||||||||||||
|
|
|
|
|
|
|
|
|
| |||||||||||
Pro forma diluted weighted average common shares outstanding (f) | 123,505 | 120,886 | 120,165 | 126,507 | 121,255 | |||||||||||||||
|
|
|
|
|
|
|
|
|
| |||||||||||
| (a) | Transaction-related expenses primarily relate to costs incurred in association with the initial public offering, the refinancing of debt and other deal costs. Refer to note (2) above for additional detail regarding 2012 transaction-related expenses. |
| Represents management fees and out-of-pocket and certain other reimbursable expenses paid to |
| (c) | During 2012, we recorded a gain associated with the collection of the promissory note and other amounts in connection with |
| (d) | Loss on extinguishment and modification of debt is related to the refinancing of OSI’s senior secured credit facilities in the fourth quarter of 2012, the CMBS refinancing completed in the first quarter of 2012 and the retirement of OSI’s senior notes in the third quarter of 2012. Refer to note (4) above for additional detail regarding these refinancing transactions. |
| (e) | Income tax effect of adjustments for the years ended December 31, 2012, 2011 and 2010 were calculated using our full-year effective tax rates of 16.5%, 16.6% and 26.5%, respectively. Income tax effect of adjustments for the three months ended March 31, 2012 were calculated using our projected full-year effective tax rate of 19.2%. |
| (f) | Gives pro forma effect to the issuance of shares in our initial public offering as if |
| (6) | Represents combined comparable restaurant sales of our core domestic Company-owned restaurants open 18 months or more. |
| (7) | Excludes restricted cash. |
| (8) | We have, and in the future may continue to have, negative working capital balances (as is common for many restaurant companies). We operate successfully with negative working capital because cash collected on restaurant sales is typically received before payment is due on our current liabilities, and our inventory turnover rates require relatively low investment in inventories. Additionally, ongoing cash flows from restaurant operations and gift card sales are used to service debt obligations and for capital expenditures. |
| (9) | On August 13, 2012, we completed an initial public offering in which (i) we issued and sold an aggregate of 14,196,845 shares of common stock (including 1,196,845 shares sold pursuant to an underwriters’ option to purchase additional shares) at a price to the public of $11.00 per share for aggregate gross offering proceeds of $156.2 million and (ii) certain of our stockholders sold 4,196,845 shares of our common stock (including 1,196,845 shares pursuant to the underwriters’ option to purchase additional shares) at a price to the public of $11.00 per share for aggregate gross offering proceeds of $46.2 million. We received net proceeds in the offering of approximately $142.2 million after deducting underwriting discounts and commissions of approximately $9.4 million on our sale of shares and $4.6 million of offering related expenses payable by us. We did not receive any proceeds from the sale of shares of common stock by the selling stockholders. All of the net proceeds, together with cash on hand, were applied to the retirement of OSI’s outstanding senior notes. |
Index to Financial Statements
An investment in our common stock involves various risks. You should carefully consider the following risks and all of the other information contained in this prospectus before investing in our common stock. The risks described below are those that we believe are the material risks that we face. The trading price of our common stock could decline due to any of these risks, and you may lose all or part of your investment in our common stock.
Risks Related to Our Business and Industry
We face significant competition for customers, real estate and employees and competitive pressure to adapt to changes in conditions driving customer traffic. Our inability to compete effectively may affect our traffic, sales and profit margins, which could adversely affect our business, financial condition and results of operations.
The restaurant industry is intensely competitive with a substantial number of restaurant operators that compete directly and indirectly with us in respect to price, service, location and food quality, and there are other well-established competitors with significant financial and other resources. There is also active competition for management personnel as well as attractive suitable real estate sites. Consumer tastes, nutritional and dietary trends, traffic patterns and the type, number and location of competing restaurants often affect the restaurant business, and our competitors may react more efficiently and effectively to those conditions. Further, we face growing competition from the supermarket industry, with the improvement of their “convenient meals” in the deli section,and prepared food sections, and from quick service and fast casual restaurants, as a result of higher-quality food and beverage offerings by those restaurants. If we are unable to continue to compete effectively, our traffic, sales and margins could decline and our business, financial condition and results of operations would be adversely affected.
Challenging economic conditions may have a negative effect on our cash flowsbusiness and financial results through lower consumer confidence and discretionary spending, availability and cost of credit, foreign currency exchange rates and other items.
Challenging economic conditions may negatively impact consumer confidence and discretionary spending and thus cause a decline in our cash flowflows from operations. For example, during the economic downturn starting in 2008, continuing disruptions in the overall economy, including the ongoing impacts of the housing crisis, high unemployment, and financial market volatility and unpredictability, caused athe housing crisis, the so-called “sequester” and related reduction in consumer confidence, which negatively affected customer trafficgovernmental spending and sales throughout our industry. These factors, as well asbudget matters, other national, regional and local regulatory and economic conditions, gasoline prices, reduced disposable consumer income and consumer confidence affecthave had a negative effect on discretionary consumer spending. This has negatively affected customer traffic and comparable restaurant sales for us and throughout our industry thus far in 2013. We believe these factors and conditions, among other items, are creating a challenging sales environment in the casual dining sector for 2013. If challenging economic conditions persist for an extended period of time or worsen, consumers might make long-lasting changes to their discretionary spending behavior, including dining out less frequently. The ability of the U.S. economy to continue to recover from these challenging economic conditions is likely to be affected by many national and international factors that are beyond our control, including current economic trends in Europe. Continued weakness in or a further worsening of the economy, generally or in a number of our markets, and our customers’ reactions to these trends could adversely affectresult in increased pressure with respect to our pricing, traffic levels and commodity costs and to continue our innovation and productivity initiatives, which could negatively impact our business and results of operations. These factors could also cause us to, among other things, reduce the number and frequency of new restaurant openings, close restaurants or delay remodeling of our existing restaurant locations.
In addition, as noted in our other risk factors, our high degree of leverage could increase our vulnerability to general economic and industry conditions and require that a substantial portion of cash flow from operations be dedicated to the payment of principal and interest on our indebtedness. Further, the availability of
credit already arranged for under our revolving credit facilities and the cost and availability of future credit may be adversely impacted by economic challenges. Foreign currency exchange rates for the countries in which we operate may decline. In addition, we may experience interruptions in supplies and other services from our third-party vendors as a result of market conditions. These disruptions in the economy are beyond our control, and there is no guarantee that any government response will restore consumer confidence, stabilize the economy or increase the availability of credit.
Index to Financial Statements
Loss of key management personnel could hurt our business and inhibit our ability to operate and grow successfully.
Our success will continue to depend, to a significant extent, on our leadership team and other key management personnel. If we are unable to attract and retain sufficiently experienced and capable management personnel, our business and financial results may suffer. If members of our leadership team or other key management personnel leave, we may have difficulty replacing them, and our business may suffer. There can be no assurance that we will be able to successfully attract and retain our leadership team and other key management personnel that we need.
Risks associated with our expansion and relocation plans may have adverse effects on our ability to increase revenues.
As part of our business strategy, we intend to continue to expand our current portfolio of restaurants. Current development schedules call for the construction of between 45 and 55 new system-wide locations in 2013 and we expect to increase the pace thereafter. We also plan to accelerate our restaurant relocation plan, primarily related to our Outback Steakhouse brand, beginning with the relocation of approximately 10 to 20 restaurants in 2013. A variety of factors could cause the actual results and outcome of those expansion and relocation plans to differ from the anticipated results, including among other things:
our ability to generate sufficient funds from operations or to obtain acceptable financing to support our development;
the availability of attractive sites for new restaurants and the ability to acquire or lease appropriate real estate at those sites at acceptable prices;
our ability to obtain all required governmental permits, including zoning approvals and liquor licenses, on a timely basis;
the impact of moratoriums or approval processes of state, local or foreign governments, which could result in significant delays;
our ability to obtain all necessary contractors and sub-contractors;
union activities such as picketing and hand billing, which could delay construction;
our ability to negotiate suitable lease terms;
our ability to recruit and train skilled management and restaurant employees;
our ability to receive the premises from the landlord’s developer without any delays;
weather, natural disasters and disasters beyond our control resulting in construction delays; and
consumer tastes in new geographic regions and acceptance of our restaurant concepts.
Some of our new restaurants may take several months to reach planned operating levels due to lack of market awareness, start-up costs and other factors typically associated with new restaurants. There is also the possibility that new restaurants may attract customers away from other restaurants we own, thereby reducing the revenues of those existing restaurants or that we may lose customers due to relocation.
Development rates for each concept may differ significantly. The development of each concept may not be as successful as our experience in the past. It is difficult to estimate the performance of newly opened or relocated restaurants. Earnings achieved to date by restaurants open for less than two years may not be indicative of future operating results. Should enough of these new restaurants not meet targeted performance, it could have a material adverse effect on our operating results.
We could face labor shortages that could slow our growth and adversely impact our ability to operate our restaurants.
Our success depends in part upon our ability to attract, motivate and retain a sufficient number of qualified employees, including managing partners, restaurant managers, kitchen staff and servers, necessary to keep pace with our anticipated expansion schedule and meet the needs of our existing restaurants. A sufficient number of qualified individuals of the requisite caliber to fill these positions may be in short supply in some communities. Competition in these communities for qualified staff could require us to pay higher wages and provide greater benefits. Any inability to recruit and retain qualified individuals may also delay the planned openings of new restaurants and could adversely impact our existing restaurants. Any such inability to retain or recruit qualified employees, increased costs of attracting qualified employees or delays in restaurant openings could adversely affect our business and results of operations.
Risks associated with our expansion plans may have adverse effects on our ability to increase revenues.
As part of our business strategy, we intend to continue to expand our current portfolio of restaurants. Current development schedules call for the construction of approximately 30 or more new restaurants in 2012. A variety of factors could cause the actual results and outcome of those expansion plans to differ from the anticipated results, including among other things:
the availability of attractive sites for new restaurants and the ability to obtain appropriate real estate at those sites at acceptable prices;
the ability to obtain all required governmental permits, including zoning approvals and liquor licenses, on a timely basis;
the impact of moratoriums or approval processes of state, local or foreign governments, which could result in significant delays;
the ability to obtain all necessary contractors and sub-contractors;
union activities such as picketing and hand billing, which could delay construction;
the ability to negotiate suitable lease terms;
the ability to recruit and train skilled management and restaurant employees;
the ability to receive the premises from the landlord’s developer without any delays; and
weather, natural disasters and disasters beyond our control resulting in construction delays.
Some of our new restaurants may take several months to reach planned operating levels due to lack of market awareness, start-up costs and other factors typically associated with new restaurants. There is also the possibility that new restaurants may attract customers away from other restaurants we own, thereby reducing the revenues of those existing restaurants.
Index to Financial Statements
Development rates for each concept may differ significantly. The development of each concept may not be as successful as our experience in the past. It is difficult to estimate the performance of newly opened restaurants. Earnings achieved to date by restaurants open for less than two years may not be indicative of future operating results. Should enough of these new restaurants not meet targeted performance, it could have a material adverse effect on our operating results.
Our business is subject to seasonal fluctuations and past results are not indicative of future results.
Historically, customer spending patterns for our established restaurants are generally highest in the first quarter of the year and lowest in the third quarter of the year. Additionally, holidays may affect sales volumes seasonally in some of the markets in which we operate. Our quarterly results have been and will continue to be affected by the timing of new restaurant openings and their associated pre-opening costs, as well as restaurant closures and exit-related costs and impairments of goodwill, intangible assets and property, fixtures and equipment. As a result of these and other factors, our financial results for any quarter may not be indicative of the results that may be achieved for a full fiscal year.
Significant adverse weather conditions and other disasters could negatively impact our results of operations.
Adverse weather conditions and natural disasters, such as regional winter storms, floods, major hurricanes and earthquakes, severe thunderstorms and other disasters, such as oil spills, could negatively impact our results of operations. Temporary and prolonged restaurant closures may occur and customer traffic may decline due to the actual or perceived effects from these events.
We may be required to use cash to pay one of our franchisees in connection with a put right under a settlement agreement, which could have an adverse impact on our development plans and operating results.
In connection with the settlement of litigation with T-Bird, which includeincluded the franchisees of 56 Outback Steakhouse restaurants in California, we entered into an agreement with T-Bird pursuant to which T-Bird has the right, referred to as the Put“Put Right,” to require us to purchase for cash all of the equityownership interests in the T-Bird entities (which include general and limited partnership interests in such entities) that own Outback Steakhouse56 restaurants. The Put Right will becomeis exercisable by T-Bird for a one-year period beginning on the date of closing of this offering. The Put Right is also exercisable if we sell our Outback Steakhouse concept.until August 13, 2013. If the Put Right is exercised, we will pay a purchase price equal to a multiple of the T-Bird entities’ adjusted EBITDA, net of liabilities, for the trailing 12 months as of the closing of the purchase from T-Bird. The multiple will be equal to 75% of the multiple of our adjusted EBITDA for the same trailing 12-month period as reflected in our stock price in the case of this offering or, in a sale of our Outback Steakhouse concept, 75% of the multiple of adjusted EBITDA that we are receiving in the sale.price. We have a one-time right to reject the exercise of the Put Right if the transaction would be dilutive to our consolidated
earnings per share. In that event, the Put Right is extended until the first anniversary of our notice to the T-Bird entities of that rejection. We have agreed to waive all rights of first refusal in our franchise arrangements with the T-Bird entities in connection with a sale of all, and not less than all, of the assets, or at least 75% of the ownership, of the T-Bird entities. If the Put Right is exercised, we will have to use cash to pay the purchase price that could have been allocated to more profitable development initiatives or other business needs, and we will then own restaurants that may not fit our current expansion criteria. This could have an adverse impact on our operating results.
We have limited control with respect to the operations of our franchisees and joint venture partners, which could have a negative impact on our business.
Our franchisees and joint venture partners are obligated to operate their restaurants according to the specific guidelines we set forth. We provide training opportunities to these franchisees and joint venture partners to fully integrate them into our operating strategy. However, since we do not have control over these restaurants,
Index to Financial Statements
we cannot give assurance that there will not be differences in product quality or that there will be adherence to all of our guidelines at these restaurants. The failure of these restaurants to operate effectively or in accordance with our guidelines could adversely affect our cash flows from those operations or have a negative impact on our reputation or our business.
Our failure to comply with government regulation, and the costs of compliance or non-compliance, could adversely affect our business.
We are subject to various federal, state, local and foreign laws affecting our business. Each of our restaurants is subject to licensing and regulation by a number of governmental authorities, which may include, among others, alcoholic beverage control, health and safety, nutritional menu labeling, health care, environmental and fire agencies in the state, municipality or country in which the restaurant is located. Difficulty in obtaining or failing to obtain the required licenses or approvals could delay or prevent the development of a new restaurant in a particular area. Additionally, difficulties or inabilities to retain or renew licenses, or increased compliance costs due to changed regulations, could adversely affect operations at existing restaurants.
Approximately 15% of our consolidated restaurant sales are attributable to the sale of alcoholic beverages. Alcoholic beverage control regulations require each of our restaurants to apply to a state authority and, in certain locations, county or municipal authorities for a license or permit to sell alcoholic beverages on the premises and to provide service for extended hours and on Sundays. Typically, licenses must be renewed annually and may be revoked or suspended for cause at any time. Alcoholic beverage control regulations relate to numerous aspects of daily operations of our restaurants, including minimum age of patrons and employees, hours of operation, advertising, training, wholesale purchasing, inventory control and handling and storage and dispensing of alcoholic beverages. The failure of a restaurant to obtain or retain liquor or food service licenses would adversely affect the restaurant’s operations. Additionally, we are subject in certain states to “dramshop”“dram shop” statutes, which generally provide a person injured by an intoxicated person the right to recover damages from an establishment that wrongfully served alcoholic beverages to the intoxicated person.
Our restaurant operations are also subject to federal and state labor laws, including the Fair Labor Standards Act, governing such matters as minimum wages, overtime, tip credits and worker conditions. Our employees who receive tips as part of their compensation, such as servers, are generally paid at a minimum wage rate, after giving effect to applicable tip credits. We rely on our employees to accurately disclose the full amount of their tip income, and we base our FICA tax reporting on the disclosures provided to us by such tipped employees. Our other personnel, such as our kitchen staff, are typically paid in excess of minimum wage. As significant numbers of our food service and preparation personnel are paid at rates related to the applicable minimum wage, further increases in the minimum wage, including the recent proposal by President Obama to increase the federal minimum wage by $1.75 per hour and index future increases to inflation, or other changes in these laws could increase our labor costs. Our ability to respond to minimum wage increases by increasing menu prices will depend on the responses of our competitors and customers.
Further, we are continuingcontinue to assess our health care benefit costs. Due to the impactbreadth and complexity of federal health care legislation and the staggered implementation of its provisions and corresponding regulations, it is difficult to predict the overall impact of the health care legislation on our business over the coming years. Although these laws do not mandate that employers offer health careinsurance to all employees who are eligible under the legislation, beginning in 2014 penalties will be assessed on large employers who do not offer health insurance that meets certain affordability or benefit costs. The imposition of any requirement that we providerequirements. Providing health insurance benefits to employees that are more extensive than the health insurance benefits we currently provide and to a potentially larger proportion of our employees, or the impositionpayment of additional employer paid employment taxes on income earned bypenalties if the specified level of coverage is not provided at an affordable cost to employees, will increase our employees,expenses. If we are unable to raise our prices or cut other costs to cover this expense, such increases in expenses could have an adverse effect onmaterially reduce our results of operations and financial position.operating profit. Our distributors and suppliers also may be affected by higher minimum wage and benefit standards, which could result in higher costs for goods and services supplied to us.
The Patient Protection and Affordability Act of 2010 (the “PPACA”) enacted in March 2010 requires chain restaurants with 20 or more locations in the United States to comply with federal nutritional disclosure requirements. The FDA has indicated that it intends to issue final regulations by the middleend of 20122013 and begin enforcing the regulations by the end of 2012.shortly thereafter. A number of states, counties and cities have also enacted menu labeling laws requiring multi-unit restaurant operators to disclose certain nutritional information to customers, or have enacted legislation restricting the use of certain types of ingredients in restaurants. Although the federal legislation is intended to preempt conflicting state or local laws on nutrition labeling, until we are required to comply with the federal law we will be subject to a patchwork of state and local laws and regulations regarding nutritional content disclosure requirements. Many of these requirements are inconsistent or are interpreted
Index to Financial Statements
differently from one jurisdiction to another. The effect of such labeling requirements on consumer choices, if any, is unclear at this time. We may also become subject to other legislation or regulation seeking to tax or regulate high fat and high sodium foods, particularly in the United States, which could be costly to comply with.
There is also a potential for increased regulation of food in the United States under the recent changes in the HACCPHazard Analysis & Critical Control Points (“HACCP”) system requirements. HACCP refers to a management system in which food safety is addressed through the analysis and control of potential hazards from production, procurement and handling, to manufacturing, distribution and consumption of the finished product. Many states have required restaurants to develop and implement HACCP Systems and the United States government continues to expand the sectors of the food industry that must adopt and implement HACCP programs. For example, the Food Safety Modernization Act (the “FSMA”), signed into lawenacted in January 2011, granted the FDA new authority regarding the safety of the entire food system, including through increased inspections and mandatory food recalls. Although restaurants are specifically exempted from or not directly implicated by some of these new requirements, we anticipate that the new requirements may impact our industry. Additionally, our suppliers may initiate or otherwise be subject to food recalls that may impact the availability of certain products, result in adverse publicity or require us to take actions that could be costly for us or otherwise harm our business.
We are subject to the Americans with Disabilities Act, or the ADA, which, among other things, requires our restaurants to meet federally mandated requirements for the disabled. The ADA prohibits discrimination in employment and public accommodations on the basis of disability. Under the ADA, we could be required to expend funds to modify our restaurants to provide service to, or make reasonable accommodations for the employment of, disabled persons. In addition, our employment practices are subject to the requirements of the Immigration and Naturalization Service relating to citizenship and residency. Government regulations could affect and change the items we procure for resale such as commodities. We may also become subject to legislation or regulation seeking to tax or regulate high fat and high sodium foods, particularly in the United States, which could be costly to comply with. Our results can be impacted by tax legislation and regulation in the jurisdictions in which we operate and by accounting standards or pronouncements.
We are also subject to laws and regulations relating to information security, privacy, cashless payments, gift cards and consumer credit, protection and fraud, and any failure or perceived failure to comply with these laws and regulations could harm our reputation or lead to litigation, which could adversely affect our financial condition.
Changes in tax laws and unanticipated tax liabilities could adversely affect the taxes we pay and our profitability.
We are subject to income and other taxes in the United States and numerous foreign jurisdictions. Our effective income tax rate in the future could be adversely affected by a number of factors, including: changes in the mix of earnings in countries with different statutory tax rates; changes in the valuation of deferred tax assets and liabilities; changes in tax laws; the outcome of income tax audits; and any repatriation of non-U.S. earnings for which we have not previously provided for U.S. taxes. Although we believe our tax estimates are reasonable, the final determination of tax audits could be materially different from our historical income tax provisions and accruals. The results of a tax audit could have a material effect on our income tax provision, results of operations or cash flows in the period or periods for which that determination is made. In addition, our effective income tax rate and our results may be impacted by our ability to realize deferred tax benefits and by any release of our valuation allowances applied to our existing deferred tax assets.
We face a variety of risks associated with doing business in foreign markets that could have a negative impact on our financial performance.
We have a significant number of franchised, joint venture and company-ownedCompany-owned Outback Steakhouse restaurants outside the United States, and we intend to continue our efforts to grow internationally. Although we believe we have developed thean appropriate support structure for international operations and growth, there is no assurance that international operations will be profitable or international growth will continue.
Our foreign operations are subject to all of the same risks as our domestic restaurants, as well as additional risks including, among others, international economic and political conditions and the possibility of instability and unrest, differing cultures and consumer preferences, diverse government regulations and tax systems, the ability to source high quality ingredients and other commodities in a cost-effective manner, uncertain or differing interpretations of rights and obligations in connection with international franchise agreements and the collection of ongoing royalties from international franchisees, the availability and cost of land and construction costs, and the availability of experienced management, appropriate franchisees and area operating partners.
Currency regulations and fluctuations in exchange rates could also affect our performance. We have direct investments in restaurants in South Korea, Hong Kong, China and Brazil, as well as international franchises in a total of 2115 other countries and territories.Guam. As a result, we may experience losses from foreign currency translation, and such losses could adversely affect our overall sales and earnings.
Index to Financial Statements
We are subject to governmental regulation throughout the world, including antitrust and tax requirements, anti-boycott regulations, import/export/customs regulations and other international trade regulations, the USA Patriot Act and the Foreign Corrupt Practices Act. Any new regulatory or trade initiatives could impact our operations in certain countries. Failure to comply with any such legal requirements could subject us to monetary liabilities and other sanctions, which could harm our business, results of operations and financial condition.
Increased commodity, energy and other costs could decrease our profit margins or cause us to limit or otherwise modify our menus, which could adversely affect our business.
The performance of our restaurants depends on our ability to anticipate and react to changes in the price and availability of food commodities, including among other things beef, chicken, seafood, butter, cheese and produce. Prices may be affected due to market changes, increased competition, the general risk of inflation, shortages or interruptions in supply due to weather, disease or other conditions beyond our control, or other reasons. Increased prices or shortages could affect the cost and quality of the items we buy or require us to raise prices or limit our menu options. For example, in 2012, commodity costs increased by approximately 3% and, as
a result, we increased our prices at each of our concepts in the range of 2.0% to 2.3%. These events, combined with other more general economic and demographic conditions, could impact our pricing and negatively affect our sales and profit margins.
The performance of our restaurants is also adversely affected by increases in the price of utilities, such as natural gas, whether as a result of inflation, shortages or interruptions in supply, or otherwise. We use derivative instruments to mitigate some of our overall exposure to material increases in natural gas prices. We do not apply hedge accounting to these instruments, and any changes in the fair value of the derivative instruments are marked-to-market through earnings in the period of change. To date, the effects of these derivative instruments have been immaterial to our financial statements for all periods presented.
Our business also incurs significant costs for insurance, labor, marketing, taxes, real estate, borrowing and litigation, all of which could increase due to inflation, changes in laws, competition or other events beyond our control.
Our ability to respond to increased costs by increasing menu prices or by implementing alternative processes or products will depend on our ability to anticipate and react to such increases and other more general economic and demographic conditions, as well as the responses of our competitors and customers. All of these things may be difficult to predict and beyond our control. In this manner, increased costs could adversely affect our performance.
Infringement of our intellectual property could diminish the value of our restaurant concepts and harm our business.
We regard our service marks, including “Outback Steakhouse,” “Carrabba’s Italian Grill,” “Bonefish Grill” andGrill,” “Fleming’s Prime Steakhouse and Wine Bar,”Bar” and “Roy’s” and our “Bloomin’ Onion” trademark as having significant value and as being important factors in the marketing of our restaurants. We have also obtained trademarks for several of our other menu items and for various advertising slogans. In addition, the overall layout, appearance and designs of our restaurants are valuable assets. We believe that these and other intellectual property are valuable assets that are critical to our success. We rely on a combination of protections provided by contracts, copyrights, patents, trademarks, and other common law rights, such as trade secret and unfair competition laws, to protect our restaurants and services from infringement. We have registered certain trademarks and service marks and have other registration applications pending in the United States and foreign jurisdictions. However, not all of the trademarks or service marks that we currently use have been registered in all of the countries in which we do business, and they may never be registered in all of these countries. There may not be adequate protection for certain intellectual property such as the overall appearance of our restaurants. We are aware of names and marks similar to our service marks being used by other persons in certain geographic areas in which we have restaurants. Although we believe such uses will not adversely affect us, further or currently unknown unauthorized uses or other misappropriation of our trademarks or service marks could diminish the value of our brands and restaurant concepts and may adversely affect our business. We may be unable to detect such unauthorized use of, or take appropriate steps to enforce, our intellectual property rights.
Index to Financial Statements
Effective intellectual property protection may not be available in every country in which we have or intend to open or franchise a restaurant. Failure to adequately protect our intellectual property rights could damage or even destroy our brands and impair our ability to compete effectively. Even where we have effectively secured statutory protection for intellectual property, our competitors may misappropriate our intellectual property and our employees, consultants and suppliers may breach their obligations not to reveal our confidential information, including trade secrets. Although we have taken appropriate measures to protect our intellectual property, there can be no assurance that these protections will be adequate or that our competitors will not independently develop products or concepts that are substantially similar to our restaurants and services. Despite our efforts, it may be possible for third-parties to reverse-engineer, otherwise obtain, copy, and use information that we regard as proprietary. Furthermore, defending or enforcing our trademark rights, branding practices and
other intellectual property, and seeking injunctions against and/or compensation for misappropriation of confidential information, could result in the expenditure of significant resources.
Restaurant companies, including ours, have been the target of class action lawsuits and other proceedings alleging, among other things, violations of federal and state workplace and employment laws. Proceedings of this nature are costly, divert management attention and, if successful, could result in our payment of substantial damages or settlement costs.
Our business is subject to the risk of litigation by employees, consumers, suppliers, shareholdersfranchisees, minority investors, stockholders or others through private actions, class actions, administrative proceedings, regulatory actions or other litigation. The outcome of litigation, particularly class action and regulatory actions, is difficult to assess or quantify. In recent years, we and other restaurant companies have been subject to lawsuits, including class action lawsuits, alleging violations of federal and state laws regarding workplace and employment matters, discrimination and similar matters. A number of these lawsuits have resulted in the payment of substantial damages by the defendants. Similar lawsuits have been instituted from time to time alleging violations of various federal and state wage and hour laws regarding, among other things, employee meal deductions, the sharing of tips among certain employees, overtime eligibility of assistant managers and failure to pay for all hours worked. If we are required to pay substantial damages and expenses as a result of these or other types of lawsuits our business and results of operations would be adversely affected.
Occasionally, our customers file complaints or lawsuits against us alleging that we are responsible for some illness or injury they suffered at or after a visit to one of our restaurants, including actions seeking damages resulting from food borne illness and relating to notices with respect to chemicals contained in food products required under state law. We are also subject to a variety of other claims from third parties arising in the ordinary course of our business, including personal injury claims, contract claims and claims alleging violations of federal and state laws. In addition, our restaurants are subject to state “dram shop” or similar laws which generally allow a person to sue us if that person was injured by a legally intoxicated person who was wrongfully served alcoholic beverages at one of our restaurants. The restaurant industry has also been subject to a growing number of claims that the menus and actions of restaurant chains have led to the obesity of certain of their customers. We may also be subject to lawsuits from our employees, the U.S. Equal Employment Opportunity Commission or others alleging violations of federal and state laws regarding workplace and employment matters, discrimination and similar matters. For example, in December 2009, we entered into a Consent Decree in settlement of certain litigation brought by the U.S. Equal Employment Opportunity Commission alleging gender discrimination in promotions to management within the Outback Steakhouse organization, which required us to make a settlement payment of $19.0 million. In addition, during the four-year term of the Consent Decree, we are required to fulfill certain training, record-keeping and reporting requirements and maintain an open access system for restaurant employees to express interest in promotions within the Outback Steakhouse organization, and employ a human resources executive. If we fail to comply with the terms of the Consent Decree, it could have adverse consequences on our business.
Regardless of whether any claims against us are valid or whether we are liable, claims may be expensive to defend and may divert time and money away from our operations. In addition, they may generate negative publicity, which could reduce customer traffic and sales. Although we maintain what we believe to be adequate levels of insurance, insurance may not be available at all or in sufficient amounts to cover any liabilities with respect to these or other matters. A judgment or other liability in excess of our insurance coverage for any claims or any adverse publicity resulting from claims could adversely affect our business and results of operations.
Index to Financial Statements
Our insurance policies may not provide adequate levels of coverage against all claims, and fluctuating insurance requirements and costs could negatively impact our profitability.
We are self-insured, or carry insurance programs with specific retention levels or deductibles, for a significant portion of our risks and associated liabilities with respect to workers’ compensation, general liability, liquor liability, employment practices liability, property, health benefits and other insurable risks. However, there
are types of losses we may incur that cannot be insured against or that we believe are not commercially reasonable to insure. These losses, if they occur, could have a material and adverse effect on our business and results of operations. Additionally, health insurance costs in general have risen significantly over the past few years and are expected to continue to increase. These increases could have a negative impact on our profitability, and there can be no assurance that we will be able to successfully offset the effect of such increases with plan modifications and cost control measures, additional operating efficiencies or the pass-through of such increased costs to our customers or employees.
Conflict or terrorism could negatively affect our business.
We cannot predict the effects of actual or threatened armed conflicts or terrorist attacks, efforts to combat terrorism, military action against any foreign state or group located in a foreign state or heightened security requirements on local, regional, national, or international economies or consumer confidence. Such events could negatively affect our business, including by reducing customer traffic or the availability of commodities.
If our advertising and marketing programs are unsuccessful in maintaining or driving increased customer traffic or are ineffective in comparison to those of our competitors, our results of operations could be adversely affected.
We conduct ongoing promotion-based brand awareness advertising campaigns and customer loyalty programs. If these programs are not successful or conflict with evolving customer preferences, we may not increase or maintain our customer traffic and will incur expenses without the benefit of higher revenues. In addition, if our competitors increase their spending on marketing and advertising programs, or develop more effective campaigns, this could have a negative effect on our brand relevance, customer traffic and results of operations.
Unfavorable publicity could harm our business by reducing demand for our concepts or specific menu offerings.
Our business could be negatively affected by publicity resulting from complaints or litigation, either against us or other restaurant companies, alleging poor food quality, food-borne illness, personal injury, adverse health effects (including obesity) or other concerns. Regardless of the validity of any such allegations, unfavorable publicity relating to any number of restaurants or even a single restaurant could adversely affect public perception of the entire brand.
Additionally, unfavorable publicity towards a food product generally could negatively impact our business. For example, publicity regarding health concerns or outbreaks of disease in a food product, such as bovine spongiform encephalopathy (also known as “mad cow” disease), could reduce demand for our menu offerings. These factors could have a material adverse effect on our business.
Consumer reaction to public health issues, such as an outbreak of flu viruses or other diseases, could have an adverse effect on our business.
Our business could be harmed if the United States or other countries in which we operate experience an outbreak of flu viruses or other diseases. If a virus is transmitted by human contact, our employees or customers could become infected or could choose or be advised to avoid gathering in public places. This could adversely affect our restaurant traffic, our ability to adequately staff our restaurants, our ability to receive deliveries on a timely basis or our ability to perform functions at the corporate level. Our business could also be negatively affected if mandatory closures, voluntary closures or restrictions on operations are imposed in the jurisdictions in which we operate. Even if such measures are not implemented and a virus or other disease does not spread significantly, the perceived risk of infection or significant health risk may have a material adverse effect on our business.
Index to Financial Statements
Food safety and food-borne illness concerns throughout the supply chain may have an adverse effect on our business by reducing demand and increasing costs.
Food safety issues could be caused by food suppliers or distributors and, as a result, be out of our control. In addition, regardless of the source or cause, any report of food-borne illnesses and other food safety issues including food tampering or contamination at one of our restaurants could adversely affect the reputation of our brands and have a negative impact on our sales. Even instances of food-borne illness, food tampering or food contamination occurring solely at restaurants of our competitors could result in negative publicity about the food service industry generally and adversely impact our sales. The occurrence of food-borne illnesses or food safety issues could also adversely affect the price and availability of affected ingredients, resulting in higher costs and lower margins.
The food service industry is affected by consumer preferences and perceptions. Changes in these preferences and perceptions may lessen the demand for our products, which would reduce sales and harm our business.
Food service businesses are affected by changes in consumer tastes and demographic trends. For instance, if prevailing health or dietary preferences cause consumers to avoid steak and other products we offer in favor of foods that are perceived as more healthy, our business and operating results would be harmed.
We have a limited number of suppliers for our major products.products and rely on one custom distribution company for our national distribution program in the U.S. If our suppliers or custom distributor are unable to fulfill their obligations under their contracts or we are unable to develop or maintain relationships with these or new suppliers or distributors, if needed, we could encounter supply shortages and incur higher costs.
We have a limited number of suppliers for our major products, such as beef. In 2011,2012, we purchased more than 90%75% of our beef raw materials from four beef suppliers who represent approximately 75%85% of the total beef marketplace in the U.S. Due to the nature of our industry, we expect to continue to purchase a substantial amount of our beef from a small number of suppliers. In addition, we use one distribution company to provide distribution services in the U.S. Although we have not experienced significant problems with our suppliers or distributor, if our suppliers or distributor are unable to fulfill their obligations under their contracts, we could encounter supply shortages and incur higher costs. In addition, if we are unable to maintain current purchasing terms or ensure service availability with our suppliers and distributor, we may lose customers and experience an increase in costs in seeking alternative supplier services. The failure to develop and maintain supplier and distributor relationships and any resulting disruptions to the provision of food and other supplies to our restaurant locations could adversely affect our operating results.
Shortages or interruptions in the supply or delivery of fresh food products could adversely affect our operating results.
We are dependent on frequent deliveries of fresh food products that meet our specifications. Shortages or interruptions in the supply of fresh food products caused by unanticipated demand, problems in production or distribution, inclement weather or other conditions could adversely affect the availability, quality and cost of ingredients, which would adversely affect our operating results.
We outsource certain accounting processes to a third-party vendor, which subjects us to many unforeseen risks that could disrupt our business, increase our costs and negatively impact our internal control processes.
In early 2011, we began to outsource certain accounting processes to a third-party vendor. The third-party vendor may not be able to handle the volume of activity or perform the quality of service that we have currently achieved at a cost-effective rate, which could adversely affect our business. The decision to outsource was made based on cost savings initiatives; however, we may not achieve these savings because of unidentified
intangible costs and legal and regulatory matters, which could adversely affect our results of operations or financial condition. In addition, the transitionperformance of certain business processes to outsourcingin an outsourced capacity could negatively impact our internal control processes.
Index to Financial Statements
We rely heavily on information technology in our operations and any material failure, weakness, interruption or breach of security could prevent us from effectively operating our business.
We rely heavily on information systems across our operations and corporate functions, including for point-of-sale processing in our restaurants, management of our supply chain, payment of obligations, collection of cash, data warehousing to support analytics, finance and accounting systems, labor optimization tools and other various processes and procedures. Our ability to efficiently and effectively manage our business depends significantly on the reliability and capacity of these systems. The failure of these systems to operate effectively, maintenance problems, upgrading or transitioning to new platforms, or a breach in security of these systems could result in delays in customer service and reduce efficiency in our operations. Remediation of such problems could result in significant unplanned capital investments.
We are also in the process of implementing a finance and accounting system. Large-scale system implementations are complex and time-consuming projects that are capital intensive and can span 12 months or longer. Certain business and financial processes will also require transformation in order to effectively leverage the system’s benefits. Our business and results of operations may be adversely affected if we experience system usage problems and/or cost overruns during the implementation process, or if associated process changes do not give rise to the benefits that we expect. Additionally, if we do not effectively implement the system as planned or if the system does not operate as intended, it could adversely affect the effectiveness of our internal controls over financial reporting.
Security breaches of confidential customer information in connection with our electronic processing of credit and debit card transactionsor personal employee information may adversely affect our business.
The majority of our restaurant sales are by credit or debit cards. Other restaurants and retailers have experienced security breaches in which credit and debit card information of their customers has been stolen. We also maintain certain personal information regarding our employees. We may in the future become subject to lawsuits or other proceedings for purportedly fraudulent transactions arising out of the actual or alleged theft of our customers’ credit or debit card information.information or if customer or employee information is obtained by unauthorized persons or used inappropriately. Any such claim or proceeding, or any adverse publicity resulting from these allegations,such an event, may have a material adverse effect on our business.
An impairment in the carrying value of our goodwill or other intangible assets could adversely affect our financial condition and results of operations.
We test goodwill for impairment in the second quarter of each fiscal year and whenever events or changes in circumstances indicate that impairment may have occurred. A significant amount of judgment is involved in determining if an indication of impairment exists. Factors may include, among others:
a significant decline in our expected future cash flows;
a significant adverse change in legal factors or in the business climate;
unanticipated competition;
the testing for recoverability of a significant asset group within a reporting unit; and
slower growth rates.
Any adverse change in these factors would have a significant impact on the recoverability of these assets and negatively affect our financial condition and results of operations. We compare the carrying value of a reporting unit, including goodwill, to the fair value of the reporting unit. Carrying value is based on the assets and liabilities associated with the operations of that reporting unit. If the carrying value is less than the fair value, no impairment exists. If the carrying value is higher than the fair value, there is an indication of impairment and a second step is required to measure a goodwill impairment loss, if any. We are required to record a non-cash impairment charge if the testing performed indicates that goodwill has been impaired.
We evaluate our other intangible assets, primarily the Outback Steakhouse (domestic and international), Carrabba’s Italian Grill, Bonefish Grill, Fleming’s Prime Steakhouse and Wine Bar and Roy’s trademarks or trade names, to determine if they are definite or indefinite-lived. Reaching a determination on useful life requires significant judgments and assumptions regarding the future effects of obsolescence, demand, competition, other economic factors (such as the stability of the industry, legislative action that results in an uncertain or changing regulatory environment, and expected changes in distribution channels), the level of required maintenance expenditures, and the expected lives of other related groups of assets.
Index to Financial Statements
As with goodwill, we test our indefinite-lived intangible assets for impairment in the second quarter of each fiscal year and whenever events or changes in circumstances indicate that their carrying value may not be recoverable. We estimate the fair value of these indefinite-lived intangible assets based on an income valuation model using the relief from royalty method, which requires assumptions related to projected revenues from our annual long-range plan, assumed royalty rates that could be payable if we did not own the assets and a discount rate.
During the years ended December 31, 2012, 2011 and 2010, we did not record any goodwill or material intangible asset impairment charges. DuringHowever, during the year ended December 31, 2009, we recorded goodwill and intangible asset impairment charges of $58.1 million and $43.7 million, respectively. We cannot accurately predict the amount and timing of any impairment of assets. Should the value of goodwill or other intangible assets become further impaired in the future, there could be an adverse effect on our financial condition and results of operations.
Changes to estimates related to our property, fixtures and equipment and definite-lived intangible assets or operating results that are lower than our current estimates at certain restaurant locations may cause us to incur impairment charges on certain long-lived assets, which may adversely affect our results of operations.
In accordance with accounting guidance as it relates to the impairment of long-lived assets, we make certain estimates and projections with regard to individual restaurant operations, as well as our overall performance, in connection with our impairment analyses for long-lived assets. When impairment triggers are deemed to exist for any location, the estimated undiscounted future cash flows are compared to its carrying value. If the carrying value exceeds the undiscounted cash flows, an impairment charge equal to the difference between the carrying value and the sum of the discounted cash flows is recorded. The projections of future cash flows used in these analyses require the use of judgment and a number of estimates and projections of future operating results. If actual results differ from our estimates, additional charges for asset impairments may be required in the future. If impairment charges are significant, our results of operations could be adversely affected.
The possibility of future misstatement exists due to inherent limitations in our control systems, which could adversely affect our business.
We cannot be certain that our internal control over financial reporting and disclosure controls and procedures will prevent all possible error and fraud. A control system, no matter how well conceived and operated, can provide only reasonable, not absolute, assurance that the objectives of the control system are met. Because of inherent limitations in all control systems, no evaluation of controls can provide absolute assurance that all control issues and instances of error or fraud, if any, in our companyCompany have been detected. These inherent
limitations include the realities that judgments in decision-making can be faulty and that breakdowns can occur because of simple error or mistake, which could have an adverse impact on our business.
Our reported financial results may be adversely affected by changes in accounting principles applicable to us.
Generally accepted accounting principles in the U.S. are subject to interpretation by the Financial Accounting Standards Board, or FASB, the American Institute of Certified Public Accountants, the SECSecurities and Exchange Commission (“SEC”) and various bodies formed to promulgate and interpret appropriate accounting principles. A change in these principles or interpretations could have a significant effect on our reported financial results, and could affect the reporting of transactions completed before the announcement of a change, such as standards relating to leasing. In addition, the SEC has announced a multi-year plan that could ultimately lead to the use of International Financial Reporting Standards by U.S. issuers in their SEC filings. Any such change could have a significant effect on our reported financial results.
Index to Financial Statements
We are a holding company and rely on dividends, distributions and other payments, advances and transfers of funds from our subsidiaries to fund our operations, which could prevent us from meeting our obligations.
We have no direct operations and derive all of our cash flow from our subsidiaries. Because we conduct our operations through our subsidiaries, we depend on those entities for dividends and other payments or distributions to fund our operations. TheOur ability to obtain funds from our subsidiaries is limited by our debt agreements. Our inability to comply with these covenants and the deterioration of the earnings from, or other available assets of, our subsidiaries for any reason could limit or impair their ability to pay dividends or other distributions to us.
Risks Related to Our Indebtedness
Our substantial leverage could adversely affect our ability to raise additional capital to fund our operations, limit our ability to react to changes in the economy or our industry and expose us to interest rate risk in connection with our variable-rate debt.
We are highly leveraged. As of DecemberMarch 31, 2011,2013, our total indebtedness was approximately $2.1$1.5 billion. See “Description of Indebtedness.” As of DecemberMarch 31, 2011,2013, we also had approximately $82.4$187.4 million in available unused borrowing capacity under our working capital revolving credit facility (after giving effect to undrawn letters of credit of approximately $67.6$37.6 million) and $67.0 million in available unused borrowing capacity under our pre-funded revolving credit facility that provides financing for capital expenditures only..
Our high degree of leverage could have important consequences, including:
making it more difficult for us to make payments on indebtedness;
increasing our vulnerability to general economic, industry and competitive conditions;
increasing our cost of borrowing;
requiring a substantial portion of cash flow from operations to be dedicated to the payment of principal and interest on our indebtedness, thereby reducing our ability to use our cash flow to fund our operations, capital expenditures and future business opportunities;
exposing us to the risk of increased interest rates because certain of our borrowings under our senior secured credit facilities and commercial mortgage-backed securities loans are at variable rates of interest;
restricting us from making strategic acquisitions or causing us to make non-strategic divestitures;
limiting our ability to obtain additional financing for working capital, capital expenditures, restaurant development, debt service requirements, acquisitions and general corporate or other purposes; and
limiting our ability to adjust to changing market conditions and placing us at a competitive disadvantage compared to our competitors who may not be as highly leveraged.
We may incur substantial additional indebtedness in the future, subject to the restrictions contained in our senior secured credit facilities,New Facilities and the 2012 CMBS Loan and the indenture governing our Senior Notes.Loan. If new indebtedness is added to our current debt levels, the related risks that we now face could increase.
Approximately $1.0 billionAt March 31, 2013, approximately $975.0 million of debt outstanding under our senior secured credit facilitiesNew Facilities and approximately $49.0$48.7 million of our 2012 CMBS Loan bearsbear interest based on a floating rate index. An increase in these floating rates could cause a material increase in our interest expense.
Index to Financial Statements
Our debt agreements contain restrictions that limit our flexibility in operating our business.
We are a holding company and conduct our operations through our subsidiaries, certain of which have incurred their own indebtedness. Our subsidiaries’ debt agreements contain various covenants that limit our ability to obtain funds from our subsidiaries through dividends, loans or advances. In addition, certain of our debt agreements limit our and our subsidiaries’ ability to, among other things, incur or guarantee additional indebtedness, pay dividends on, redeem or repurchase our capital stock, make certain acquisitions or investments, incur or permit to exist certain liens, enter into transactions with affiliates or sell our assets to, merge or consolidate with or into, another company. Our debt agreements require us to satisfy certain financial tests and ratios and limit our ability to make capital expenditures.ratios. Our ability to satisfy such tests and ratios may be affected by events outside of our control.
Upon aIf we breach of the covenants under our debt agreements, the lenders could elect to declare all amounts outstanding under the agreements to be immediately due and payable and terminate all commitments to extend further credit. If we are unable to repay those amounts, the lenders under the senior secured credit facilitiesNew Facilities and the 2012 CMBS Loan could proceed against the collateral granted to them to secure that indebtedness. We have pledged a significant portionsubstantially all of our assets as collateral under the senior secured credit facilitiesour New Facilities and the 2012 CMBS Loan. If the lenders under the senior secured credit facilitiesNew Facilities and the 2012 CMBS Loan accelerate the repayment of borrowings, we cannot be certain that we will have sufficient assets to repay them and our unsecured indebtedness.them.
We may not be able to generate sufficient cash to service all of our indebtedness and operating lease obligations, and we may be forced to take other actions to satisfy our obligations under our indebtedness and operating lease obligations, which may not be successful. If we fail to meet these obligations, we would be in default under our debt agreements and the lenders could elect to declare all amounts outstanding under them to be immediately due and payable and terminate all commitments to extend further credit.
Our ability to make scheduled payments on or to refinance our debt obligations and to satisfy our operating lease obligations depends on our financial condition and operating performance, which isare subject to prevailing economic and competitive conditions and to certain financial, business and other factors beyond our control. We cannot be certain that we will maintain a level of cash flow from operating activities sufficient to permit us to pay the principal, premium, if any, and interest on our indebtedness, or to pay our operating lease obligations. If our cash flow and capital resources are insufficient to fund our debt service obligations and operating lease obligations, we may be forced to reduce or delay capital expenditures, sell assets, seek additional capital or restructure or refinance our indebtedness. These alternative measures may not be successful and may not permit us to meet our scheduled debt service obligations. In the absence of sufficient operating results and resources, we could face substantial liquidity problems and might be required to dispose of material assets or operations or take other actions to meet our debt service and other obligations. Our debt agreements restrict our ability to dispose of assets and how we may use
the proceeds from the disposition. We may not be able to consummate those dispositions or to obtain the proceeds that we could otherwise realize from such dispositions and any such proceeds that are realized may not be adequate to meet any debt service obligations then due. The failure to meet our debt service obligations or the failure to remain in compliance with the financial covenants under our debt agreements would constitute an event of default under those agreements and the lenders could elect to declare all amounts outstanding under them to be immediately due and payable and terminate all commitments to extend further credit.
Index to Financial Statements
Risks Related to this Offering and Our Common Stock
We are a “controlled company” within the meaning of Nasdaq Stock Market (“Nasdaq”) rules, and as a result, we will qualify for, and intend to rely on, exemptions from certain corporate governance requirements. You will not have the same protections afforded to stockholders of companies that are subject to such requirements.
After completionAn investor group consisting of this offeringinvestment funds advised by our Sponsors will continue to controland two of our Founders controls a majority of the voting power of our outstanding common stock.stock and, upon completion of this offering, will continue to hold a controlling interest in us. As a result, we qualify as a “controlled company” within the meaning of the corporate governance rules of the . Under theseNasdaq. “Controlled companies” under those rules a companyare companies of which more than 50% of the voting power is held by an individual, a group or another company iscompany. Each member of the investor group has filed a Statement of Beneficial Ownership on Schedule 13G with the SEC relating to its respective holdings and the group’s arrangements with respect to disposition of the shares. On this basis, we currently avail ourselves of the “controlled company” exception under the Nasdaq rules and may elect not to comply with certain corporate governance requirements, including:
the requirement that a majority of the boardour Board of directorsDirectors consist of independent directors;Directors;
the requirement that we have a nominating and corporate governance committee that is composed entirely of independent directors with a written charter addressing the committee’s purpose and responsibilities,Directors, or otherwise have directorDirector nominees selected by vote of a majority of the independent directors;
the requirement that we have a compensation committee that is composed entirely of independent directors with a written charter addressing the committee’s purpose and responsibilities;Directors; and
the requirement for an annual performance evaluation of the nominating and corporate governance and compensation committees.
Following this offering, we intend toWe utilize these exemptions. As a result,exemptions, as we willdo not currently have a majority of independent directors,Directors and our compensation committee and nominating and corporate governance committee willdo not consist entirely of independent directors and the board committees will not be subject to annual performance evaluations.Directors. Accordingly, you willdo not have the same protections afforded to stockholders of companies that are subject to all of the Nasdaq corporate governance requirements.
Our Sponsors,The investor group, however, areis not subject to any contractual obligation to retain theirits controlling interest except that theythe members of the group have agreed, subject to certain exceptions, not to sell or otherwise dispose of any shares of our common stock or other capital stock or other securities exercisable or convertible therefor for a period of at least 18090 days after the date of this prospectus without the prior written consent of the underwriters for this offering. Except for this brief period, there can be no assurance as to the period of time during which any of our Sponsorssuch investor group will maintain theirits ownership of our common stock following the offering.
Our stock price could be extremely volatileis subject to volatility and, as a result, you may not be able to resell your shares at or above the price you paid for them.
Volatility in the market price of our common stock may prevent you from being able to sell your shares at or above the price you paid for your shares. Since our initial public offering in August 2012 through May 7,
2013, the price of our common stock, as reported by Nasdaq, has ranged from a low of $11.57 on August 8, 2012 to a high of $22.50 on May 7, 2013. The stock market in general has been highly volatile. As a result, the market price of our common stock is likely to be similarly volatile. You may experience a decrease, which could be substantial, in the value of your stock, including decreases unrelated to our operating performance or prospects, and you could lose part or all of your investment. The price of our common stock could be subject to wide fluctuations in response to a number of factors, including those described elsewhere in this prospectus and others such as:
actual or anticipated fluctuations in our quarterly or annual operating results and the performance of our competitors;
publication of research reports by securities analysts about us, our competitors or our industry;
Index to Financial Statements
our failure or the failure of our competitors to meet analysts’ projections or guidance that we or our competitors may give to the market;
additions and departures of key personnel;
sales, or anticipated sales, of large blocks of our stock or of shares held by our directorsDirectors, executive officers, Sponsors or executive officers;Founders;
strategic decisions by us or our competitors, such as acquisitions, divestitures, spin-offs, joint ventures, strategic investments or changes in business strategy;
the passage of legislation or other regulatory developments affecting us or our industry;
speculation in the press or investment community, whether or not correct, involving us, our suppliers or our competitors;
changes in accounting principles;
litigation and governmental investigations;
terrorist acts, acts of war or periods of widespread civil unrest;
a food borne illness outbreak;
natural disasters and other calamities; and
changes in general market and economic conditions.
As we operate in a single industry, we are especially vulnerable to these factors to the extent that they affect our industry or our products. In the past, securities class action litigation has often been initiated against companies following periods of volatility in their stock price. This type of litigation could result in substantial costs and divert our management’s attention and resources, and could also require us to make substantial payments to satisfy judgments or to settle litigation.
There is no existing market for our common stock, and we do not know if one will develop to provide you with adequate liquidity.
Prior to this offering, there has not been a public market for our common stock. An active market for our common stock may not develop following the completion of this offering, or if it does develop, may not be maintained. If an active trading market does not develop, you may have difficulty selling any of our common stock that you buy. The initial public offering price for the shares of our common stock will be determined by negotiations between us and the representatives of the underwriters and may not be indicative of prices that will prevail in the open market following this offering. Consequently, you may not be able to sell shares of our common stock at prices equal to or greater than the price you paid in this offering.
There may be sales of a substantial amount of our common stock after this offering by our current stockholders, and these sales could cause the price of our common stock to fall.
After this offering, there will be shares of common stock outstanding. Of our issued and outstanding shares, all the common stock sold in this offering will be freely transferable, except for any shares held by our “affiliates,” as that term is defined in Rule 144 under the Securities Act of 1933, as amended (the “Securities Act”). Following completion of this offering, approximately % of our outstanding common stock will be held by investment funds affiliated with our Sponsors and members of our management and employees.
Index to Financial Statements
Each of our directors and executive officers and substantially all of our stockholders have entered into a lock-up agreement with the representatives of the underwriters which regulates their sales of our common stock for a period of at least 180 days after the date of this prospectus, subject to certain exceptions and automatic extensions in certain circumstances. See “Related Party Transactions—Arrangements With Our Investors.”
Sales of substantial amounts of our common stock in the public market, after this offering, or the perception that such sales will occur, could adversely affect the market price of our common stock and make it difficult for us to raise funds through securities offerings in the future.
At May 6, 2013, there were 123,165,107 shares of our common stock issued and outstanding. Of these shares, the 18,393,690 shares to be outstanding after thesold in our initial public offering the shares offered by this prospectus will beare eligible for immediate sale in the public market without restriction by persons other than our affiliates. Our remaining outstandingaffiliates and the 17,000,000 shares to be sold in this offering (which includes 300,000 shares to be issued and sold upon exercise of options held by certain selling stockholders), plus any shares sold upon exercise of the underwriters’ option to purchase additional shares, will become availableeligible for resaleimmediate sale in the public market as shown inwithout restriction by persons other than our affiliates.
Upon the chart below, subjectcompletion of this offering, it is expected that an aggregate of approximately 63.7% of our issued and outstanding shares will continue to be held by an investor group consisting of investment funds associated with our Sponsors and two of our Founders, assuming the provisions of Rule 144underwriters do not exercise their option to purchase additional shares. Pursuant to a registration rights agreement that we are party to with our Sponsors and Rule 701.
|
| |
Beginning 180our Founders, beginning 90 days after the date of this prospectus, and after the expiration of the lock-up agreement related to this offering, subject to certain exceptions and automatic extensions in certain circumstances, holdersour Sponsors and our Founders may require us to register additional shares for resale under federal securities laws. Registration of such shares would allow our Sponsors and/or Founders, as applicable, to immediately sell the shares into the public market and shares that are sold pursuant to any such registration statement would become eligible for sale without restriction by persons other than our affiliates.
We filed registration statements on Form S-8 under the Securities Act registering the issuance of shares of our common stock may require usupon the exercise of 12,362,216 options that were outstanding under our 2007 Equity Incentive Plan (the “2007 Equity Plan”) at the time of our initial public offering and up to register their5,422,969 shares for resaleissuable under our 2012 Incentive Award Plan (the “2012 Equity Plan”). As a result such registration, any such shares issued to persons other than our affiliates will be freely tradable in the federal securities laws, and holders of additional sharespublic market. However, our existing stockholders were subject to a lock-up agreement restricting sales of our common stock would be entitled to have their shares included in any such registration statement, allfrom the date of our initial public offering until February 3, 2013. Many of these holders are subject to reduction upon the request of the underwriter of the offering, if any. See “Related Party Transactions—Arrangements With Our Investors.” Registration of those shares would allow the holders to immediately resell their sharesour insider trading policy and some can engage in the public market. Any such sales or anticipation thereof could cause the market price oftransactions in our common stock to decline.
In addition, after this offering, we intend to register sharesonly during designated trading windows, which will impact the timing of common stock that are reserved for issuance under our stock incentive plans. See “Executive Compensation—Equity Incentive Plans.”any sales by any such holders.
Provisions in our certificate of incorporation and bylaws, our 2012 CMBS Loan documents and Delaware law may discourage, delay or prevent a change of control of our companyCompany or changes in our management and, therefore, may depress the trading price of our stock.
Our certificate of incorporation and bylaws include certain provisions that could have the effect of discouraging, delaying or preventing a change of control of our companyCompany or changes in our management, including, among other things:
our boardBoard of Directors is classified into three classes of directorsDirectors with only one class subject to election each year;
restrictions on the ability of our stockholders to fill a vacancy on the boardBoard of directors;Directors;
our ability to issue preferred stock with terms that the boardBoard of directorsDirectors may determine, without stockholder approval, which could be used to significantly dilute the ownership of a hostile acquirer;
the inability of our stockholders to call a special meeting of stockholders;
our directorsDirectors may only be removed from the boardBoard of directorsDirectors for cause by the affirmative vote of the holders of at least 75% of the voting power of outstanding shares of our capital stock entitled to vote generally in the election of directors;Directors;
Index to Financial Statements
the absence of cumulative voting in the election of directors,Directors, which may limit the ability of minority stockholders to elect directors;Directors; and
advance notice requirements for stockholder proposals and nominations, which may discourage or deter a potential acquirer from soliciting proxies to elect a particular slate of directorsDirectors or otherwise attempting to obtain control of us.
In addition, the mortgage loan agreement for the 2012 CMBS Loan requires that following this offering, our Sponsors, our Founders and our management stockholders or other permitted holders either own no less than 51% of our common stock or if they do not, that certain other conditions are satisfied. These provisions in our certificate of incorporation and bylaws and the 2012 CMBS Loan documents may discourage, delay or prevent a transaction involving a change in control of our companyCompany that is in the best interests of our minority stockholders. Even in the absence of a takeover attempt, the existence of these provisions may adversely affect the prevailing market price of our common stock if they are viewed as discouraging future takeover attempts.
Section 203 of the Delaware General Corporation Law may affect the ability of an “interested stockholder” to engage in certain business combinations, including mergers, consolidations or acquisitions of additional shares, for a period of three years following the time that the stockholder becomes an “interested stockholder.” An “interested stockholder” is defined to include persons owning directly or indirectly 15% or more of the outstanding voting stock of a corporation. We have elected in our certificate of incorporation not to be subject to Section 203 of the Delaware General Corporation Law. However, our certificate of incorporation will containcontains provisions that have the same effect as Section 203, except that they provide that our Sponsors and their respective affiliates will not be deemed to be “interested stockholders,” regardless of the percentage of our voting stock owned by them, and accordingly will not be subject to such restrictions.
If you purchase shares in this offering, you will suffer immediate and substantial dilution.
If you purchase shares of our common stock in this offering, you will incur immediate and substantial dilution in the book value of your stock of $ per share as of , 2012, because the price that you pay will be substantially greater than the net tangible book value per share of the shares you acquire. You will experience additional dilution upon the exercise of options and warrants to purchase our common stock, including those options currently outstanding and possibly those granted in the future, and the issuance of restricted stock or other equity awards under our stock incentive plans. To the extent we raise additional capital by issuing equity securities, our stockholders may experience substantial additional dilution. See “Dilution.”
If securities analysts or industry analysts downgrade our stock, publish negative research or reports, or do not publish reports about our business, our stock price and trading volume could decline.
We expect that theThe trading market for our common stock willmay be influenced by the research and reports that industry or securities analysts publish about us, our business and our industry. If one or more analysts adversely change their recommendation regarding our stock or our competitors’ stock, our stock price would likely decline. If one or more analysts cease coverage of us or fail to regularly publish reports on us, we could lose visibility in the financial markets, which in turn could cause our stock price or trading volume to decline.
Our Sponsors will continue toand Founders have significant influence over us, after this offering, including control over decisions that require the approval of stockholders, which could limit your ability to influence the outcome of key transactions, including a change of control.
We are currently controlled, and, afterupon completion of this offering, is completed will continue to be controlled, by an investor group consisting of investment funds advised by our Sponsors.Sponsors and two of our Founders. At May 6, 2013, such group beneficially owned an aggregate of approximately 77.2% of our outstanding common stock. Upon completion of this offering, investment funds affiliated with our Sponsorsit is expected that such group will beneficially own approximately %63.7% of our outstanding common stock.stock, assuming the underwriters do not exercise their option to purchase additional shares. For as long as our Sponsors continuesuch group continues to beneficially own shares of common stock representing more than 50% of the voting power of our common stock, theyit will be able
Index to Financial Statements
to direct the election of all of the members of our boardBoard of directorsDirectors and could exercise a controlling influence over our business and affairs, including any determinations with respect to mergers or other business combinations, the acquisition or disposition of assets, the incurrence of indebtedness, the issuance of any additional common stock or other equity securities, the repurchase or redemption of common stock and the payment of dividends. Similarly, these entitiesthe investor group will have the power to determine matters submitted to a vote of our stockholders without the consent of our other stockholders, will have the powerbe able to prevent or approve a change in our control and could take other actions that might be favorable to them.the members of the group. Even if theirthe investor group’s ownership falls below 50%, our Sponsors will continue to be able to strongly influence or effectively control our decisions. In addition, pursuant to our Stockholders Agreement, our Sponsors have the right, subject to certain conditions, to nominate representatives to our Board of Directors and committees of our Board of Directors so long as they collectively own more than 3% of our outstanding common stock. See “Related Party Transactions—Arrangements with Our Investors.”
Additionally, certain of our directorsDirectors are also officers or control persons of our Sponsors. Although these directorsDirectors owe a fiduciary duty to manage us in a manner beneficial to us and our stockholders, these individuals also owe fiduciary duties to these other entities and their stockholders, members and limited partners. Because our Sponsors have such interests in other companies and engage in other business activities, certain of our directorsDirectors may experience conflicts of interest in allocating their time and resources among our business and these other activities. One of our Founders also currently serve as our Directors and, due to his interests in certain transactions with us and our affiliates, he may also experience conflicts of interest. Furthermore, these individuals could make substantial profits as a result of investment opportunities allocated to entities other than us. As a result, these individuals could pursue transactions that may not be in our best interest, which could have a material adverse effect on our operations and your investment.
Because we have no plans to pay cash dividends on our common stock for the foreseeable future, you may not receive any return on investment unless you sell your common stock for a price greater than that which you paid for it.
We may retain future earnings, if any, for future operations, expansion and debt repayment and have no current plans to pay any cash dividends for the foreseeable future. Any decision to declare and pay dividends in the future will be made at the discretion of our boardBoard of directorsDirectors and will depend on, among other things, our results of operations, financial condition, cash requirements, contractual restrictions and other factors that our boardBoard of directorsDirectors may deem relevant. In addition, our ability to pay dividends may be limited by covenants of any existing and future outstanding indebtedness we or our subsidiaries incur, including our senior credit facility.New Facilities. As a result, you may not receive any return on an investment in our common stock unless you sell our common stock for a price greater than that which you paid for it. See “Dividend Policy.”
Our ability to raise capital in the future may be limited, which could make us unable to fund our capital requirements.
Our business and operations may consume resources faster than we anticipate. In the future, we may need to raise additional funds through the issuance of new equity securities, debt or a combination of both. Additional financing may not be available on favorable terms or at all. If adequate funds are not available on acceptable terms, we may be unable to fund our capital requirements. If we issue new debt securities, the debt holders would have rights senior to common stockholders to make claims on our assets, and the terms of any debt could restrict our operations, including our ability to pay dividends on our common stock. If we issue additional equity securities, existing stockholders may experience dilution, and the new equity securities could have rights senior to those of our common stock. Because our decision to issue securities in any future offering will depend on market conditions and other factors beyond our control, we cannot predict or estimate the amount, timing or nature of our future offerings. Thus, our stockholders bear the risk of our future securities offerings reducing the market price of our common stock and diluting their interest.
Index to Financial Statements
CAUTIONARY NOTE REGARDING FORWARD-LOOKING STATEMENTS
This prospectus includes statements that express our opinions, expectations, beliefs, plans, objectives, assumptions or projections regarding future events or future results and therefore are, or may be deemed to be, “forward-looking statements.”statements�� within the meaning of Section 27A of the Securities Act of 1933, as amended. These forward-looking statements can generally be identified by the use of forward-looking terminology, including the terms “believes,” “estimates,” “anticipates,” “expects,” “seeks,” “projects,” “intends,” “plans,” “may,” “will”“will,” “should,” “could” or “should”“would” or, in each case, their negative or other variations or comparable terminology. These forward-looking statements include all matters that are not historical facts. They appear in a number of places throughout this prospectus and include statements regarding our intentions, beliefs or current expectations concerning, among other things, our results of operations, financial condition, liquidity, prospects, growth, strategies and the industry in which we operate.
By their nature, forward-looking statements involve risks and uncertainties because they relate to events and depend on circumstances that may or may not occur in the future. We believe that these risks and uncertainties include, but are not limited to, those described in the “Risk Factors” section of this prospectus,filing, which include, but are not limited to, the following:
the restaurant industry is a highly competitive industry with many well-established competitors;
challenging economic conditions may affect our liquidity by adversely impacting numerous items that include, but are not limited to: consumer confidence and discretionary spending; the availability of credit presently arranged from our revolving credit facilities; the future cost and availability of credit; interest rates; foreign currency exchange rates; and the liquidity or operations of our third-party vendors and other service providers;
our ability to expand is dependent upon various factors such as the availability of attractive sites for new or relocated restaurants; our ability to obtain appropriate real estate sites at acceptable prices; our ability to obtain all required governmental permits including zoning approvals and liquor licenses on a timely basis; the impact of government moratoriums or approval processes, which could result in significant delays; our ability to obtain all necessary contractors and subcontractors; union activities such as picketing and hand billing that could delay construction; our ability to generate or borrow funds; our ability to negotiate suitable lease terms; our ability to recruit and train skilled management and restaurant employees; and our ability to receive the premises from the landlord’s developer without any delays;
our results can be impacted by changes in consumer tastes and the level of consumer acceptance of our restaurant concepts (including consumer tolerance of our prices); local, regional, national and international economic and political conditions; the seasonality of our business; demographic trends; traffic patterns and our ability to effectively respond in a timely manner to changes in traffic patterns; changes in consumer dietary habits; employee availability; the cost of advertising and media; government actions and policies; inflation or deflation; unemployment rates; interest rates; exchange rates; and increases in various costs, including construction, real estate and health insurance costs;
weather, natural disasters and other disasters could result in construction delays and also adversely affect the results of one or more restaurants for an indeterminate amount of time;
our results can be negatively impacted by the effects of actual or threatened armed conflicts or terrorist attacks, efforts to combat terrorism, or other military action affecting countries in which we do business and by the effects of heightened security requirements on local, regional, national, or international economies or consumer confidence;
our results can be impacted by tax and other legislation and regulation in the jurisdictions in which we operate and by accounting standards or pronouncements;
our results can be impacted by unanticipated changes in our tax rates, exposure to additional income tax liabilities, a change in our ability to realize deferred tax benefits or the timing and amount of a reversal of recorded deferred tax benefit valuation allowances;
minimum wage increases and mandated employee benefits could cause a significant increase in our labor costs;
Index to Financial Statements
commodities, including but not limited to, such items as beef, chicken, shrimp, pork, seafood, dairy, produce, potatoes, onions and energy supplies, are subject to fluctuation in price and availability and price could increase or decrease more than we expect;
our results can be affected by consumer reaction to public health issues;
our results can be affected by consumer perception of food safety;
inabilitywe could face liabilities if we are unable to protect customer credit and debit card data;data or personal employee information; and
our substantial leverage and significant restrictive covenants in our various credit facilities could adversely affect our ability to raise additional capital to fund our operations, limit our ability to make capital expenditures to invest in new or renovate restaurants, limit our ability to react to changes in the economy or our industry, and expose us to interest rate risk in connection with our variable-rate debt.
Those factors should not be construed as exhaustive and should be read with the other cautionary statements in this prospectus.
Although we base these forward-looking statements on assumptions that we believe are reasonable when made, we caution you that forward-looking statements are not guarantees of future performance and that our actual results of operations, financial condition and liquidity, and industry developments may differ materially from statements made in or suggested by the forward-looking statements contained in this prospectus. In addition, even if our results of operations, financial condition and liquidity, and industry developments are consistent with the forward-looking statements contained in this prospectus, those results or developments may not be indicative of results or developments in subsequent periods.
In light of these risks and uncertainties, we caution you not to place undue reliance on these forward-looking statements. Any forward-looking statement that we make in this prospectus speaks only as of the date of such statement, and we undertake no obligation to update any forward-looking statement or to publicly announce the results of any revision to any of those statements to reflect future events or developments. Comparisons of results for current and any prior periods are not intended to express any future trends or indications of future performance, unless specifically expressed as such, and should only be viewed as historical data.
Index to Financial Statements
We estimate that the netwill not receive any proceeds we will receive from the sale of shares of common stock by the selling stockholders in this offering. See “Principal and Selling Stockholders.”
MARKET PRICE OF OUR COMMON STOCK
Our common stock has been listed on the Nasdaq Global Select Market under the symbol “BLMN” since August 8, 2012. Prior to that time, there was no public market for our common stock. The following table sets forth for the periods indicated the high and low sales prices per share of our common stock in this offering, after deducting underwriter discounts and commissions and estimated expenses payable by us, will be approximately $ million (or $ million, ifas reported on the underwriters exercise their option to purchase additional shares in full). This estimate assumes anNasdaq Global Select Market:
High | Low | |||||||
2012: | ||||||||
Third quarter (1) | $ | 16.53 | $ | 11.57 | ||||
Fourth quarter | $ | 16.98 | $ | 13.01 | ||||
2013: | ||||||||
First quarter | $ | 18.99 | $ | 15.86 | ||||
Second quarter (through May 17, 2013) | 22.50 | 17.41 | ||||||
| (1) | Represents the period from August 8, 2012, the date of our initial public offering, through September 30, 2012, the end of our third quarter. |
A recent reported closing price of $ per share, the midpoint of the price rangefor our common stock is set forth on the cover page of this prospectus.
We intend to use the net proceeds from this offering to retire all As of May 6, 2013, there were 56 holders of record of our outstanding Senior Notes and to use any remaining net proceeds for working capital and for general corporate purposes. The Senior Notes bear interest at 10% per annum and mature on June 15, 2015. There was outstanding approximately $248.1 million in aggregate principal amount of Senior Notes as of December 31, 2011. See “Description of Indebtedness—Senior Notes.”common stock.
We dodid not currentlydeclare or pay cash dividends on our common stock and do not anticipate paying any dividends on our common stock during 2011, 2012 or the first quarter of 2013. Our Board of Directors does not intend to pay regular dividends on our common stock. However, we expect to reevaluate our dividend policy on a regular basis and may, subject to compliance with the covenants contained in the foreseeable future. Any future determinations relating to our dividend policies will be made atNew Facilities, including the discretion of our board of directors and will depend on conditions then existing, including our financial condition, results of operations, contractual restrictions, capital requirements, business prospectsNew Term Loan B, and other factors our board of directors may deem relevant. In addition,considerations, determine to pay dividends in the future.
Our ability to pay dividends is dependent on our ability to obtain funds from our subsidiaries and thereforesubsidiaries. Payment of dividends by OSI to declare and pay dividendsBloomin’ Brands is restricted by covenants in our debt agreements.under the New Facilities, including the New Term Loan B, to dividends for the purpose of paying Bloomin’ Brands’ franchise and income taxes and ordinary course operating expenses; dividends for certain other limited purposes; and other dividends subject to an aggregate cap over the term of the agreement. For an explanation of these restrictions, see “Management’s Discussion and Analysis of Financial Condition and Results of Operations—Liquidity and Capital Resources—Credit Facilities and Other Indebtedness” and “Description of Indebtedness.”
Index to Financial Statements
The following table sets forth our cash and cash equivalents and our consolidated capitalization as of DecemberMarch 31, 2011 on (i) an actual basis and (ii) an as adjusted basis to give effect to the issuance of common stock in this offering and the application of the net proceeds as described in “Use of Proceeds.”
2013. This table should be read in conjunction with “Use of Proceeds,” “Selected Historical Consolidated Financial and Other Data,” “Management’s Discussion and Analysis of Financial Condition and Results of Operations” and our consolidated financial statements and related notes appearing elsewhere in this prospectus.
| As of December 31, 2011 | ||||||||
| Actual | As Adjusted | |||||||
| ($ in thousands) | ||||||||
Cash and cash equivalents (1) | $ | 482,084 | $ | |||||
|
|
|
| |||||
Debt, including current portion: | ||||||||
Senior secured term loan facility | $ | 1,014,400 | $ | |||||
Senior secured working capital revolving credit facility (2) | — | |||||||
Senior secured pre-funded revolving credit facility | 33,000 | |||||||
CMBS Loan (3) | 775,326 | |||||||
Senior notes, interest rate of 10.00% | 248,075 | |||||||
Guaranteed debt, sale-leaseback and capital lease obligations and other notes | 38,489 | |||||||
|
|
|
| |||||
Total debt, including current portion | 2,109,290 | |||||||
|
|
|
| |||||
Shareholders’ equity: | ||||||||
Preferred stock, $.01 par value; no shares authorized, issued and outstanding on an actual basis; 25,000,000 shares authorized and no shares issued and outstanding on an as adjusted basis | — | |||||||
Common stock $.01 par value; 120,000,000 shares authorized and 106,573,193 shares issued and outstanding on an actual basis; 475,000,000 shares authorized and shares issued and outstanding on an as adjusted basis | 1,066 | |||||||
Additional paid-in capital | 874,753 | |||||||
Accumulated deficit | (822,625 | ) | ||||||
Accumulated other comprehensive income | (22,344 | ) | ||||||
|
|
|
| |||||
Total Bloomin’ Brands, Inc. shareholders’ equity | 30,850 | |||||||
Noncontrolling interests | 9,447 | |||||||
|
|
|
| |||||
Total shareholders’ equity | 40,297 | |||||||
|
|
|
| |||||
Total capitalization | $ | 2,149,587 | $ | |||||
|
|
|
| |||||
As of | ||||
| ($ in thousands) | ||||
Cash and cash equivalents (1) | $ | 217,469 | ||
|
| |||
Total debt, net: | ||||
Senior secured term loan B facility | $ | 965,733 | ||
Senior secured revolving credit facility (2) | — | |||
2012 CMBS Loan | 487,654 | |||
Sale-leaseback, capital lease obligations and other notes payable | 11,474 | |||
|
| |||
Total debt, net | 1,464,861 | |||
|
| |||
Stockholders’ equity: | ||||
Preferred stock, $.01 par value; 25,000,000 shares authorized and no shares issued and outstanding | — | |||
Common stock, $.01 par value; 475,000,000 shares authorized and 122,569,475 shares issued and outstanding | 1,226 | |||
Additional paid-in capital | 1,021,393 | |||
Accumulated deficit | (709,862 | ) | ||
Accumulated other comprehensive loss | (19,333 | ) | ||
|
| |||
Total Bloomin’ Brands, Inc. stockholders’ equity | 293,424 | |||
Noncontrolling interests | 5,315 | |||
|
| |||
Total stockholders’ equity | 298,739 | |||
|
| |||
Total capitalization | $ | 1,763,600 | ||
|
| |||
| (1) | Excludes |
| (2) | There were no loans outstanding under the revolving credit facility at |
Index to Financial Statements
If you invest in our common stock, your ownership interest will experience immediate book value dilution to the extent of the difference between the initial public offering price per share of our common stock and the net tangible book value per share of our common stock after this offering. Dilution results from the fact that the initial public offering price per share of the common stock is substantially in excess of the net tangible book value per share of common stock attributable to the existing stockholders for the presently outstanding shares of common stock. Net tangible book value per share represents the amount of our total tangible assets less our total liabilities, divided by the number of shares of our common stock outstanding.
Our net tangible book value deficiency at was approximately $ , or $ per share of our common stock before giving effect to this offering. Dilution in net tangible book value deficiency per share represents the difference between the amount per share that you pay in this offering and the net tangible book value deficiency per share immediately after this offering.
After giving effect to our sale of shares in this offering, assuming an initial public offering price of $ per share (the midpoint of the price range set forth on the cover of this prospectus), and the application of the estimated net proceeds as described under “Use of Proceeds,” our as adjusted net tangible book value deficiency at would have been approximately $ , or $ per share of common stock. This represents an immediate decrease in net tangible book value deficiency per share of $ to existing stockholders and an immediate increase in net tangible book value deficiency per share of $( ) to you. The following table illustrates this dilution per share.
| ||||
| ||||
| ||||
| ||||
|
If the underwriters were to fully exercise their option to purchase additional shares, the pro forma as adjusted net tangible book value deficiency per share of our common stock after giving effect to this offering would be $ per share of our common stock. This represents a decrease in pro forma as adjusted net tangible book value deficiency of $ per share of our common stock to existing stockholders and dilution in pro forma as adjusted net tangible book value deficiency of $ per share of our common stock to you.
A $1.00 increase (decrease) in the assumed initial public offering price of $ per share of our common stock would decrease (increase) our pro forma net tangible book value deficiency after giving effect to the offering by $ million, or by $ per share of our common stock, assuming no change to the number of shares of our common stock offered by us as set forth on the cover page of this prospectus, and after deducting the estimated underwriting discounts and estimated expenses payable by us.
The following table sets forth, as of , 2012, the number of shares of common stock purchased from us, the total consideration paid to us and the average price per share paid by existing stockholders and to be paid by new investors purchasing shares of common stock in this offering, before deducting underwriting discounts and commissions and estimated offering expenses payable by us.
| Shares Purchased | Total Consideration | |||||||||||||||||
| Number | Percent | Amount | Percent | Average Price Per Share | ||||||||||||||
Existing stockholders | % | $ | % | $ | ||||||||||||||
New investors | $ | |||||||||||||||||
|
|
|
|
|
|
| ||||||||||||
Total | 100 | % | $ | 100 | % | $ | ||||||||||||
|
|
|
|
|
|
|
|
| ||||||||||
Index to Financial Statements
If the underwriters were to exercise in full their option to purchase additional shares of our common stock from us, the percentage of shares of our common stock held by existing stockholders would be %, and the percentage of shares of our common stock held by new investors would be %.
To the extent any outstanding options or other equity awards are exercised or become vested or any additional options or other equity awards are granted and exercised or become vested or other issuances of shares of our common stock are made, there may be further economic dilution to new investors.
Index to Financial Statements
SELECTED CONSOLIDATED FINANCIAL AND OTHER DATA
The following table sets forth our selected consolidated financial and other data as of the dates and for the periods indicated. The selected consolidated financial data as of December 31, 20102012 and December 31, 2011 and for each of the three years in the period ended December 31, 20112012 presented in this table have been derived from our audited consolidated financial statements included elsewhere in this prospectus. The selected consolidated financial data as of December 31, 2007,2010 and for the year ended December 31, 20082009 have been derived from our audited consolidated financial statements for such year and period, which are not included in this prospectus. The selected consolidated financial data as of December 31, 2009 and for the periods from January 1 to June 14, 2007 and from June 15 to December 31, 20072008 and for the year ended December 31, 2008 have been derived from our unaudited consolidated financial statements for such years and periods, which are not included in this prospectus. The selected consolidated financial data as of March 31, 2013 and for the three months ended March 31, 2013 and 2012 have been derived from the unaudited interim consolidated financial statements included in this prospectus. The selected consolidated balance sheet data as of March 31, 2012 has been derived from our historical unaudited interim consolidated financial statements that are not included in this prospectus. Historical results are not necessarily indicative of future results.
ThisThe selected consolidated financial and other data presented below should be read in conjunction with the disclosure set forth under “Risk Factors,” “Capitalization,” “Management’s Discussion and Analysis of Financial Condition and Results of Operations” and the Consolidated Financial Statementsconsolidated financial statements and the related notes thereto appearing elsewhere in this prospectus.
| Predecessor (1) | Successor (1) | |||||||||||||||||||||||||
| Period From January 1 to June 14, | Period From June 15 to December 31, | Years Ended December 31, | ||||||||||||||||||||||||
(in thousands, except per share amounts) | 2007 | 2007 | 2008 | 2009 | 2010 | 2011 | ||||||||||||||||||||
| (unaudited) | (unaudited) | (unaudited) | ||||||||||||||||||||||||
Statements of Operations Data: | ||||||||||||||||||||||||||
Revenues | ||||||||||||||||||||||||||
Restaurant sales | $ | 1,916,689 | $ | 2,229,468 | $ | 3,937,894 | $ | 3,573,760 | $ | 3,594,681 | $ | 3,803,252 | ||||||||||||||
Other revenues | 9,948 | 12,015 | 23,262 | 27,896 | 33,606 | 38,012 | ||||||||||||||||||||
|
|
|
|
|
|
|
|
|
|
|
| |||||||||||||||
Total revenues | 1,926,637 | 2,241,483 | 3,961,156 | 3,601,656 | 3,628,287 | 3,841,264 | ||||||||||||||||||||
|
|
|
|
|
|
|
|
|
|
|
| |||||||||||||||
Costs and expenses | ||||||||||||||||||||||||||
Cost of sales | 681,455 | 790,749 | 1,389,365 | 1,184,074 | 1,152,028 | 1,226,098 | ||||||||||||||||||||
Labor and other related | 540,281 | 623,158 | 1,094,907 | 1,024,063 | 1,034,393 | 1,094,117 | ||||||||||||||||||||
Other restaurant operating | 440,545 | 512,236 | 938,374 | 849,696 | 864,183 | 890,004 | ||||||||||||||||||||
Depreciation and amortization | 74,846 | 112,693 | 205,492 | 186,074 | 156,267 | 153,689 | ||||||||||||||||||||
General and administrative (2) | 158,147 | 141,246 | 264,021 | 252,298 | 252,793 | 291,124 | ||||||||||||||||||||
Allowance (recovery) of note receivable from affiliated | — | — | 33,150 | — | — | (33,150 | ) | |||||||||||||||||||
Loss on contingent debt guarantee | — | — | — | 24,500 | — | — | ||||||||||||||||||||
Goodwill impairment | — | — | 726,486 | 58,149 | — | — | ||||||||||||||||||||
Provision for impaired assets and restaurant closings (4) | 8,530 | 23,023 | 117,699 | 134,285 | 5,204 | 14,039 | ||||||||||||||||||||
Loss (income) from operations of unconsolidated affiliates | 692 | (1,260 | ) | (2,343 | ) | (2,196 | ) | (5,492 | ) | (8,109 | ) | |||||||||||||||
|
|
|
|
|
|
|
|
|
|
|
| |||||||||||||||
Total costs and expenses | 1,904,496 | 2,201,845 | 4,767,151 | 3,710,943 | 3,459,376 | 3,627,812 | ||||||||||||||||||||
|
|
|
|
|
|
|
|
|
|
|
| |||||||||||||||
Income (loss) from operations | 22,141 | 39,638 | (805,995 | ) | (109,287 | ) | 168,911 | 213,452 | ||||||||||||||||||
Gain on extinguishment of | — | — | 48,409 | 158,061 | — | — | ||||||||||||||||||||
Other (expense) income, net | — | — | (11,122 | ) | (199 | ) | 2,993 | 830 | ||||||||||||||||||
Interest expense, net (5) | (4,651 | ) | (132,339 | ) | (197,041 | ) | (115,880 | ) | (91,428 | ) | (83,387 | ) | ||||||||||||||
|
|
|
|
|
|
|
|
|
|
|
| |||||||||||||||
Income (loss) before provision (benefit) for income taxes | 17,490 | (92,701 | ) | (965,749 | ) | (67,305 | ) | 80,476 | 130,895 | |||||||||||||||||
Provision (benefit) for income taxes | (1,656 | ) | (49,427 | ) | (99,416 | ) | (2,462 | ) | 21,300 | 21,716 | ||||||||||||||||
|
|
|
|
|
|
|
|
|
|
|
| |||||||||||||||
Net income (loss) | 19,146 | (43,274 | ) | (866,333 | ) | (64,843 | ) | 59,176 | 109,179 | |||||||||||||||||
Less: net income (loss) attributable to noncontrolling interests | 1,685 | 871 | (3,041 | ) | (380 | ) | 6,208 | 9,174 | ||||||||||||||||||
|
|
|
|
|
|
|
|
|
|
|
| |||||||||||||||
Net income (loss) attributable to Bloomin’ Brands, Inc. | $ | 17,461 | $ | (44,145 | ) | $ | (863,292 | ) | $ | (64,463 | ) | $ | 52,968 | $ | 100,005 | |||||||||||
|
|
|
|
|
|
|
|
|
|
|
| |||||||||||||||
| Years Ended December 31, | Three Months Ended March 31, | |||||||||||||||||||||||||||
| 2012 | 2011 | 2010 | 2009 | 2008 | 2013 | 2012 | ||||||||||||||||||||||
| (unaudited) | (unaudited) | (unaudited) | ||||||||||||||||||||||||||
| (in thousands) | ||||||||||||||||||||||||||||
Statements of Operations and Comprehensive Income (Loss) Data: | ||||||||||||||||||||||||||||
Revenues | ||||||||||||||||||||||||||||
Restaurant sales | $ | 3,946,116 | $ | 3,803,252 | $ | 3,594,681 | $ | 3,573,760 | $ | 3,937,894 | $ | 1,082,356 | $ | 1,045,466 | ||||||||||||||
Other revenues | 41,679 | 38,012 | 33,606 | 27,896 | 23,262 | 9,894 | 10,160 | |||||||||||||||||||||
|
|
|
|
|
|
|
|
|
|
|
|
|
| |||||||||||||||
Total revenues | 3,987,795 | 3,841,264 | 3,628,287 | 3,601,656 | 3,961,156 | 1,092,250 | 1,055,626 | |||||||||||||||||||||
|
|
|
|
|
|
|
|
|
|
|
|
|
| |||||||||||||||
Costs and expenses | ||||||||||||||||||||||||||||
Cost of sales | 1,281,002 | 1,226,098 | 1,152,028 | 1,184,074 | 1,389,365 | 349,989 | 335,859 | |||||||||||||||||||||
Labor and other related | 1,117,624 | 1,094,117 | 1,034,393 | 1,024,063 | 1,094,907 | 299,867 | 293,501 | |||||||||||||||||||||
Other restaurant operating | 918,522 | 890,004 | 864,183 | 849,696 | 938,374 | 233,809 | 218,965 | |||||||||||||||||||||
Depreciation and amortization | 155,482 | 153,689 | 156,267 | 186,074 | 205,492 | 40,196 | 38,860 | |||||||||||||||||||||
General and administrative (1) (2) | 326,473 | 291,124 | 252,793 | 252,298 | 264,021 | 72,491 | 76,002 | |||||||||||||||||||||
(Recovery) allowance for note receivable from affiliated entity (3) | — | (33,150 | ) | — | — | 33,150 | — | — | ||||||||||||||||||||
Loss on contingent debt guarantee | — | — | — | 24,500 | — | — | — | |||||||||||||||||||||
Goodwill impairment | — | — | — | 58,149 | 726,486 | — | — | |||||||||||||||||||||
Provision for impaired assets and restaurant closings (4) | 13,005 | 14,039 | 5,204 | 134,285 | 117,699 | 1,896 | 4,435 | |||||||||||||||||||||
Income from operations of unconsolidated affiliates | (5,450 | ) | (8,109 | ) | (5,492 | ) | (2,196 | ) | (2,343 | ) | (2,858 | ) | (2,404 | ) | ||||||||||||||
|
|
|
|
|
|
|
|
|
|
|
|
|
| |||||||||||||||
Total costs and expenses | $ | 3,806,658 | $ | 3,627,812 | $ | 3,459,376 | $ | 3,710,943 | $ | 4,767,151 | $ | 995,390 | $ | 965,218 | ||||||||||||||
|
|
|
|
|
|
|
|
|
|
|
|
|
| |||||||||||||||
Index to Financial Statements
| Predecessor(1) | Successor(1) | |||||||||||||||||||||||
| Period From January 1 to June 14, | Period From June 15 to December 31, | Years Ended December 31, | ||||||||||||||||||||||
(in thousands, except Share and per share amounts) | 2007 | 2007 | 2008 | 2009 | 2010 | 2011 | ||||||||||||||||||
| (unaudited) | (unaudited) | (unaudited) | ||||||||||||||||||||||
Basic net income (loss) per | $ | (0.43 | ) | $ | (8.43 | ) | $ | (0.62 | ) | $ | 0.50 | $ | 0.94 | |||||||||||
Diluted net income (loss) per | $ | (0.43 | ) | $ | (8.43 | ) | $ | (0.62 | ) | $ | 0.50 | $ | 0.94 | |||||||||||
Weighted average shares outstanding | ||||||||||||||||||||||||
Basic | 101,896 | 102,383 | 104,442 | 105,968 | 106,224 | |||||||||||||||||||
Diluted | 101,896 | 102,383 | 104,442 | 105,968 | 106,689 | |||||||||||||||||||
| Successor(1) | ||||||||||||||||||||
| December 31, | ||||||||||||||||||||
(in thousands) | 2007 | 2008 | 2009 | 2010 | 2011 | |||||||||||||||
| (unaudited) | (unaudited) | (unaudited) | ||||||||||||||||||
Balance Sheet Data: | ||||||||||||||||||||
Cash and cash equivalents (7) | 174,406 | 311,118 | 330,957 | 365,536 | 482,084 | |||||||||||||||
Net working capital (deficit) (8) | (197,870 | ) | (171,095 | ) | (187,648 | ) | (120,135 | ) | (248,145 | ) | ||||||||||
Total assets | 4,672,969 | 3,695,696 | 3,340,708 | 3,243,411 | 3,353,936 | |||||||||||||||
Total debt (5)(9) | 2,648,027 | 2,562,889 | 2,302,233 | 2,171,524 | 2,109,290 | |||||||||||||||
Total Bloomin’ Brands, Inc. shareholders’ equity (deficit) | 807,957 | (93,521 | ) | (135,597 | ) | (69,234 | ) | 30,850 | ||||||||||||
Total shareholders’ equity (deficit) | 842,819 | (66,814 | ) | (116,625 | ) | (55,911 | ) | 40,297 | ||||||||||||
| Years Ended December 31, | Three Months Ended March 31, | |||||||||||||||||||||||||||
| 2012 | 2011 | 2010 | 2009 | 2008 | 2013 | 2012 | ||||||||||||||||||||||
| (unaudited) | (unaudited) | (unaudited) | ||||||||||||||||||||||||||
(in thousands, except per share amounts) | ||||||||||||||||||||||||||||
Income (loss) from operations | $ | 181,137 | $ | 213,452 | $ | 168,911 | $ | (109,287 | ) | $ | (805,995 | ) | $ | 96,860 | $ | 90,408 | ||||||||||||
(Loss) gain on extinguishment and modification of debt (5) | (20,957 | ) | — | — | 158,061 | 48,409 | — | (2,851 | ) | |||||||||||||||||||
Other (expense) income, net | (128 | ) | 830 | 2,993 | (199 | ) | (11,122 | ) | (217 | ) | 54 | |||||||||||||||||
Interest expense, net (5) | (86,642 | ) | (83,387 | ) | (91,428 | ) | (115,880 | ) | (197,041 | ) | (20,880 | ) | (20,974 | ) | ||||||||||||||
|
| �� |
|
|
|
|
|
|
|
|
|
|
|
| ||||||||||||||
Income (loss) before provision (benefit) for income taxes | 73,410 | 130,895 | 80,476 | (67,305 | ) | (965,749 | ) | 75,763 | 66,637 | |||||||||||||||||||
Provision (benefit) for income taxes | 12,106 | 21,716 | 21,300 | (2,462 | ) | (99,416 | ) | 10,707 | 12,805 | |||||||||||||||||||
|
|
|
|
|
|
|
|
|
|
|
|
|
| |||||||||||||||
Net income (loss) | 61,304 | 109,179 | 59,176 | (64,843 | ) | (866,333 | ) | 65,056 | 53,832 | |||||||||||||||||||
Less: net income (loss) attributable to noncontrolling interests | 11,333 | 9,174 | 6,208 | (380 | ) | (3,041 | ) | 1,833 | 3,833 | |||||||||||||||||||
|
|
|
|
|
|
|
|
|
|
|
|
|
| |||||||||||||||
Net income (loss) attributable to Bloomin’ Brands, Inc. | $ | 49,971 | $ | 100,005 | $ | 52,968 | $ | (64,463 | ) | $ | (863,292 | ) | $ | 63,223 | $ | 49,999 | ||||||||||||
|
|
|
|
|
|
|
|
|
|
|
|
|
| |||||||||||||||
Net income (loss) | $ | 61,304 | $ | 109,179 | $ | 59,176 | $ | (64,843 | ) | $ | (866,333 | ) | $ | 65,056 | $ | 53,832 | ||||||||||||
Other comprehensive income (loss): | ||||||||||||||||||||||||||||
Foreign currency translation adjustment | 7,543 | (2,711 | ) | 4,556 | 10,273 | (33,380 | ) | (4,532 | ) | 3,149 | ||||||||||||||||||
|
|
|
|
|
|
|
|
|
|
|
|
|
| |||||||||||||||
Comprehensive income (loss) | 68,847 | 106,468 | 63,732 | (54,570 | ) | (899,713 | ) | 60,524 | 56,981 | |||||||||||||||||||
Less: comprehensive income (loss) attributable to noncontrolling interests | 11,333 | 9,174 | 6,208 | (380 | ) | (3,041 | ) | 1,833 | 3,833 | |||||||||||||||||||
|
|
|
|
|
|
|
|
|
|
|
|
|
| |||||||||||||||
Comprehensive income (loss) attributable to Bloomin’ Brands, Inc. | $ | 57,514 | $ | 97,294 | $ | 57,524 | $ | (54,190 | ) | $ | (896,672 | ) | $ | 58,691 | $ | 53,148 | ||||||||||||
|
|
|
|
|
|
|
|
|
|
|
|
|
| |||||||||||||||
Basic earnings (loss) per share | $ | 0.45 | $ | 0.94 | $ | 0.50 | $ | (0.62 | ) | $ | (8.43 | ) | $ | 0.52 | $ | 0.47 | ||||||||||||
Diluted earnings (loss) per share | $ | 0.44 | $ | 0.94 | $ | 0.50 | $ | (0.62 | ) | $ | (8.43 | ) | $ | 0.50 | $ | 0.47 | ||||||||||||
Weighted average shares outstanding: | ||||||||||||||||||||||||||||
Basic | 111,999 | 106,224 | 105,968 | 104,442 | 102,383 | 121,238 | 106,332 | |||||||||||||||||||||
Diluted | 114,821 | 106,689 | 105,968 | 104,442 | 102,383 | 126,507 | 107,058 | |||||||||||||||||||||
| December 31, | March 31, | |||||||||||||||||||||||||||
| 2012 | 2011 | 2010 | 2009 | 2008 | 2013 | 2012 | ||||||||||||||||||||||
| (unaudited) | (unaudited) | (unaudited) | (unaudited) | |||||||||||||||||||||||||
| (in thousands) | ||||||||||||||||||||||||||||
Balance Sheet Data: | ||||||||||||||||||||||||||||
Cash and cash equivalents (6) | $ | 261,690 | $ | 482,084 | $ | 365,536 | $ | 330,957 | $ | 311,118 | $ | 217,469 | $ | 335,059 | ||||||||||||||
Net working capital (deficit) (5) (7) | (203,566 | ) | (248,145 | ) | (120,135 | ) | (187,648 | ) | (171,095 | ) | (146,838 | ) | (29,981 | ) | ||||||||||||||
Total assets | 3,016,553 | 3,353,936 | 3,243,411 | 3,340,708 | 3,695,696 | 2,954,393 | 3,037,222 | |||||||||||||||||||||
Total debt, net (5) | 1,494,440 | 2,109,290 | 2,171,524 | 2,302,233 | 2,562,889 | 1,464,861 | 1,825,153 | |||||||||||||||||||||
Total stockholders’ equity (deficit) (8) | 220,205 | 40,297 | (55,911 | ) | (116,625 | ) | (66,814 | ) | 298,739 | 95,124 | ||||||||||||||||||
| (1) |
| Includes management fees and out-of-pocket and other reimbursable expenses paid to a management company owned by our Sponsors and Founders of |
| (2) | The expense for the year ended December 31, 2012 includes approximately $34.1 million of certain executive compensation costs and non-cash stock compensation charges recorded upon completion of our initial public offering and approximately $6.7 million of legal and other professional fees from the amendment and restatement of a lease between OSI and PRP. |
| (3) | In November 2011, we received a settlement payment from T-Bird, a limited liability company affiliated with our California franchisees of Outback Steakhouse restaurants, in connection with a settlement agreement that satisfied all outstanding litigation with T-Bird. This litigation began in early 2009 and therefore, we had recorded an allowance for the note receivable for the year ended December 31, 2008. |
| (4) |
Index to Financial Statements
| (5) | During the fourth quarter of 2012, OSI completed a refinancing of the 2007 Credit Facilities and entered into the New Facilities with a syndicate of institutional lenders and financial institutions. The New Facilities provide for senior secured financing of up to $1.225 billion, consisting of a $1.0 billion term loan B and a $225.0 million revolving credit facility, including letter of credit and swing-line loan sub-facilities. The term loan B was issued with an original issue discount of $10.0 million. We recorded a $9.1 million loss related to the extinguishment and modification of the 2007 Credit Facilities during the fourth quarter of 2012. In |
Index to Financial Statements
UNAUDITED PRO FORMA CONSOLIDATED FINANCIAL STATEMENTS
The following unaudited pro forma consolidated financial statements of Bloomin’ Brands, Inc. as of and for the year ended December 31, 2011 are based on historical consolidated financial statements of Bloomin’ Brands, Inc. included elsewhere in this prospectus and give effect to the following transactions (collectively, the “Transactions”) as if they had occurred on January 1, 2011 or December 31, 2011, as indicated below.
|
|
| (6) |
| (7) | We have, and in the future may continue to have, negative working capital balances (as is common for many restaurant companies). We operate successfully with negative working capital because cash collected on restaurant sales is typically received before payment is due on our current liabilities and our inventory turnover rates require relatively low investment in inventories. Additionally, ongoing cash flows from restaurant operations and gift card sales are used to service debt obligations and for capital expenditures. |
| (8) |
|
|
The unaudited pro forma consolidated balance sheet at December 31, 2011 gives effect to the Transactions, as if each had occurred on December 31, 2011.
The unaudited pro forma consolidated statement of operations for the year ended December 31, 2011 gives effect to the Transactions as if each had occurred on January 1, 2011. The unaudited consolidated statement of operations does not reflect the following charges that we will incur: (1) professional fees associated with the CMBS Refinancing; (2) estimated selling costs associated with the Sale-Leaseback Transaction; (3) loss on debt extinguishment related to the CMBS Refinancing and repayment of the Senior Notes; (4) the compensation expense with respect to the time vested portion of stock options containing a management call option resulting from the automatic termination of the call option upon completion of this offering; and (5) the expense associated with the incentive bonus payable to our Chief Executive Officer as a result of the completion of this offering. We expect these charges will be approximately $ million in the aggregate and will be recorded by us in the period in which these transactions are completed.
Index to Financial Statements
The unaudited pro forma consolidated financial statements are presented for informational purposes only and do not purport to represent what the actual financial condition or results of operations of Bloomin’ Brands, Inc. would have been if the Transactions had been completed as of the date or for the period indicated above or that may be achieved as of any future date or for any future period. The unaudited pro forma consolidated financial statements should be read in conjunction with the accompanying notes, “Management’s Discussion and Analysis of Financial Condition and Results of Operations,” and our historical consolidated financial statements and accompanying notes included elsewhere in this prospectus.
Index to Financial Statements
Bloomin’ Brands, Inc.
Unaudited Pro Forma Consolidated Balance Sheet
December 31, 2011
| Pro Forma Adjustments | ||||||||||||||
(in thousands) | Historical As Reported December 31, 2011 | CMBS Refinancing/ Sale-Leaseback Transaction | Initial Public Offering | Pro Forma | ||||||||||
Assets | ||||||||||||||
Current Assets | ||||||||||||||
Cash | $ | 482,084 | (a) | (l) | ||||||||||
Current portion of restricted cash | 20,640 | |||||||||||||
Inventories | 69,223 | |||||||||||||
Deferred income tax assets | 31,959 | (m) | ||||||||||||
Other current assets, net | 104,373 | |||||||||||||
|
|
|
|
|
|
| ||||||||
Total current assets | 708,279 | |||||||||||||
Restricted cash | 3,641 | |||||||||||||
Property, fixtures and equipment, net | 1,635,898 | (b) | ||||||||||||
Investments in and advances to unconsolidated affiliates, net | 35,033 | |||||||||||||
Goodwill | 268,772 | |||||||||||||
Intangible assets, net | 566,148 | |||||||||||||
Other assets, net | 136,165 | (c) | (n) | |||||||||||
|
|
|
|
|
|
| ||||||||
Total assets | $ | 3,353,936 | ||||||||||||
|
|
|
|
|
|
| ||||||||
Liabilities and Shareholders’ Deficit | ||||||||||||||
Current Liabilities | ||||||||||||||
Accounts payable | $ | 97,393 | (d) | |||||||||||
Accrued and other current liabilities | 211,486 | (e) | (o) | |||||||||||
Current portion of accrued buyout liability | 15,044 | |||||||||||||
Unearned revenue | 299,596 | |||||||||||||
Current portion of long-term debt | 332,905 | (f) | ||||||||||||
|
|
|
|
|
|
| ||||||||
Total current liabilities | 956,424 | |||||||||||||
Partner deposit and accrued buyout liability | 98,681 | |||||||||||||
Deferred rent | 70,135 | (g) | ||||||||||||
Deferred income tax liabilities | 193,262 | (h) | �� | (p) | ||||||||||
Long-term debt | 1,751,885 | (i) | (q) | |||||||||||
Guaranteed debt | 24,500 | |||||||||||||
Other long-term liabilities, net | 218,752 | (j) | ||||||||||||
|
|
|
|
|
|
| ||||||||
Total liabilities | 3,313,639 | |||||||||||||
|
|
|
|
|
|
| ||||||||
Commitments and contingencies | ||||||||||||||
Shareholders’ Equity | ||||||||||||||
Bloomin’ Brands, Inc. Shareholder’s Equity | ||||||||||||||
Common units | 1,066 | |||||||||||||
Additional paid-in capital | 874,753 | (r | ) | |||||||||||
Accumulated deficit | (822,625 | ) | (k | ) | (s | ) | ||||||||
Accumulated other comprehensive loss | (22,344 | ) | ||||||||||||
|
|
|
|
|
|
| ||||||||
Total Bloomin’ Brands, Inc. shareholder’s equity | 30,850 | |||||||||||||
Noncontrolling interests | 9,447 | |||||||||||||
|
|
|
|
|
|
| ||||||||
Total shareholders’ equity | 40,297 | |||||||||||||
|
|
|
|
|
|
| ||||||||
Total liabilities and shareholders’ equity | $ | 3,353,936 | ||||||||||||
|
|
|
|
|
|
| ||||||||
Index to Financial Statements
Adjustments Related to the CMBS Refinancing and the Sale-Leaseback Transaction
| ||||
| ||||
| ||||
| ||||
| ||||
| ||||
| ||||
| ||||
Index to Financial Statements
| ||||
| ||||
| ||||
Write-off of deferred financing fees of $2.0 million and remaining debt discount of $0.3 million related to the CMBS Loan | $ | (2,294 | ) | |
Estimated non-capitalizable professional fees associated with the 2012 CMBS Loan | ||||
Estimated selling costs associated with the Sale-Leaseback Transaction | ||||
|
| |||
Loss on debt extinguishment, refinancing, and the Sale-Leaseback Transaction before income taxes | ||||
Tax benefit at an estimated statutory tax rate of 38.7% | ||||
|
| |||
Loss on debt extinguishment, refinancing and the Sale-Leaseback Transaction after income taxes | $ |
Adjustments Related to the Offering
| ||||
| ||||
| ||||
| ||||
| ||||
| ||||
| ||||
|
Index to Financial Statements
| ||||
| ||||
| ||||
| ||||
| ||||
| ||||
|
Index to Financial Statements
Write-off of deferred financing costs associated with the Senior Notes | $ | (2,983 | ) | |
Redemption premium resulting from early repayment of the Senior Notes | ||||
|
| |||
Loss on debt extinguishment before income taxes | ||||
Income tax benefit at an estimated statutory tax rate of 38.7% | ||||
|
| |||
Loss on debt extinguishment after income taxes | $ |
Index to Financial Statements
Bloomin’ Brands, Inc.
Unaudited Pro Forma Consolidated Statement of Operations
Year Ended December 31, 2011
| Pro Forma Adjustments | ||||||||||||||
(in thousands) | Historical As Reported December 31, 2011 | CMBS Refinancing/ Sale-Leaseback Transaction | Initial Public Offering | Pro Forma | ||||||||||
Revenues | ||||||||||||||
Restaurant sales | $ | 3,803,252 | ||||||||||||
Other revenues | 38,012 | |||||||||||||
|
|
|
|
|
|
| ||||||||
Total revenues | 3,841,264 | |||||||||||||
|
|
|
|
|
|
| ||||||||
Costs and expenses | ||||||||||||||
Cost of sales | 1,226,098 | |||||||||||||
Labor and other related | 1,094,117 | |||||||||||||
Other restaurant operating | 890,004 | (a) | (e) | |||||||||||
Depreciation and amortization | 153,689 | (b) | ||||||||||||
General and administrative | 291,124 | (f) | ||||||||||||
Recovery of note receivable from affiliated entity | (33,150 | ) | ||||||||||||
Loss on contingent debt guarantee | — | |||||||||||||
Goodwill impairment | — | |||||||||||||
Provision for impaired assets and restaurant closings | 14,039 | (b) | ||||||||||||
Allowance for note receivable for affiliated entity | — | |||||||||||||
Income from operations of unconsolidated affiliates | (8,109 | ) | ||||||||||||
|
|
|
|
|
|
| ||||||||
Total costs and expenses | 3,627,812 | |||||||||||||
|
|
|
|
|
|
| ||||||||
Income (loss) from operations | 213,452 | |||||||||||||
Gain on extinguishment of debt | — | |||||||||||||
Other income, net | 830 | |||||||||||||
Interest expense, net | (83,387 | ) | (c) | (g) | ||||||||||
|
|
|
|
|
|
| ||||||||
Income (loss) before provision (benefit) for income taxes | 130,895 | |||||||||||||
Provision (benefit) for income taxes | 21,716 | (d) | (h) | |||||||||||
|
|
|
|
|
|
| ||||||||
Net income (loss) | 109,179 | |||||||||||||
Less: net income attributable to noncontrolling interests | 9,174 | |||||||||||||
|
|
|
|
|
|
| ||||||||
Net income (loss) attributable to Bloomin’ Brands, Inc. | $ | 100,005 | ||||||||||||
|
|
|
|
|
|
| ||||||||
Pro forma earnings per share: | ||||||||||||||
Basic | ||||||||||||||
Diluted | ||||||||||||||
Pro forma weighted average shares outstanding: | ||||||||||||||
Basic | ||||||||||||||
Diluted | ||||||||||||||
Index to Financial Statements
Adjustments Related to the CMBS Refinancing and the Sale-Leaseback Transaction
| ||||
| ||||
| ||||
| ||||
| ||||
| ||||
| ||||
| ||||
|
| ||||
| ||||
| ||||
Index to Financial Statements
Adjustments Related to the Initial Public Offering
Index to Financial Statements
MANAGEMENT’S DISCUSSION AND ANALYSIS OF
FINANCIAL CONDITION AND RESULTS OF OPERATIONS
The following discussion of our financial condition and results of operations should be read in conjunction with the “Selected Historical Consolidated Financial and Other Data” and the audited and unaudited historical consolidated financial statements and related notes. This discussion contains forward-looking statements about our markets, the demand for our products and services and our future results and involves numerous risks and uncertainties. Forward-looking statements can be identified by the fact that they do not relate strictly to historical or current facts and generally contain words such as “believes,” expects,” “may,” “will,” “should,” “seeks,” “approximately,” “intends,” “plans,” “estimates,” or “anticipates” or similar expressions. Our forward-looking statements are subject to risks and uncertainties, which may cause actual results to differ materially from those projected or implied by the forward-looking statement. Forward-looking statements are based on current expectations and assumptions and currently available data and are neither predictions nor guarantees of future events or performance. You should not place undue reliance on forward-looking statements, which speak only as of the date hereof. See “Risk Factors” and “Cautionary Note Regarding Forward-Looking Statements” for a discussion of factors that could cause our actual results to differ from those expressed or implied by forward-looking statements.
Overview
We are one of the largest casual dining restaurant companies in the world with a portfolio of leading, differentiated restaurant concepts. We ownAs of March 31, 2013, we owned and operate 1,248operated 1,275 restaurants and have 195had 203 restaurants operating under a franchise or joint venture arrangement across 4948 states, Puerto Rico, Guam and 21 countries and territories.19 countries. We have five founder-inspired concepts: Outback Steakhouse, Carrabba’s Italian Grill, Bonefish Grill, Fleming’s Prime Steakhouse and Wine Bar and Roy’s. Our concepts seek to provide a compelling customer experience combining great food, highly attentive service and lively and contemporary ambience at attractive prices. Our restaurants attract customers across a variety of occasions, including everyday dining, celebrations and business entertainment. Each of our concepts maintains a unique, founder-inspired brand identity and entrepreneurial culture, while leveraging our scale and enhanced operating model. We consider Outback Steakhouse, Carrabba’s Italian Grill, Bonefish Grill and Fleming’s Prime Steakhouse and Wine Bar to be our core concepts.
The restaurant industry is a highly competitive and fragmented industry and is sensitive to changes in the economy, trends in lifestyles, seasonality (customer spending patterns at restaurants are generally highest in the first quarter of the year and lowest in the third quarter of the year) and fluctuating costs. Operating margins for restaurants can vary due to competitive pricing strategies, labor and fluctuations in prices of commodities, including beef, chicken, seafood, butter, cheese, produce and other necessities to operate a restaurant, such as natural gas or other energy supplies. The pace of new unit growth has slowed in the casual dining category over the last few years. Given this dynamic,Restaurant companies tend to be more focused on increasing market share, and comparable restaurant sales growth and new unit growth. Competitive pressure for market share, commodity inflation, foreign currency exchange rates and other market conditions have had and could continue to have an adverse impact on our business.
Our industry is characterized by high initial capital investment, coupled with high labor costs, and chain restaurants have been increasingly taking share from independent restaurants over the past several years. We believe that this trend will continue due to increasing barriers that may prevent independent restaurants and/or start-up chains from building scale operations, including menu labeling, burdensome labor regulations and healthcarehealth care reforms that will be enforcedapply once chains grow past a certain number of restaurants or number of employees. The combination of these factors underscores our initiative to drive increased sales at existing restaurants in order to raise margins and profits, because the incremental contribution to profits from every additional dollar of sales above the minimum costs required to open, staff and operate a restaurant is relatively high. Historically, we have not focused on growth in the number of restaurants just to generate additional sales. Our expansion and operating strategies have balanced investment and operating cost considerations in order to generate reasonable, sustainable margins and achieve acceptable returns on investment from our restaurant concepts.
Index to Financial Statements
In 2010, we launched a new strategic plan and operating model, leveraging bestadded experienced executives to our management team and adapted practices from the consumer products and retail industries to complement our restaurant acumen and enhance our brand competitiveness.management, analytics and innovation. This new model keeps the customer at the center of our decision-making and focuses on continuous innovation and productivity to drive sustainable sales and profit growth. We have significantly strengthened our management team and implemented initiatives to accelerate innovation, improve analytics and increase productivity. As a result of these initiatives, we are recommitted to new unit development after curtailing expansion from 2009 to 2011. We believe that a substantial development opportunity remains for our concepts in the U.S. and internationally.
Since 2010, we have continued to balance near-term growth in market share with investments to achieve sustainable growth. As a result of continued improvements in infrastructure and organizational effectiveness, in 2012 we grew average restaurant volumes and comparable restaurant sales at our existing domestic Company-owned restaurants for our core concepts. In addition, we improved our operating margins at the restaurant level by 6.1% in 2012 as compared to 2011. Operating margins at the restaurant level are calculated as restaurant sales after deduction of main restaurant-level operating costs (comprised of Cost of sales, Labor and other related and Other restaurant operating expenses). Across our restaurant system, we opened 37 restaurants (22 were domestic and 15 international), and we increased system-wide sales by 4.5% in 2012.
We believe that the combination of macro-economic and other factors put considerable pressure on sales in the casual dining industry thus far in 2013, and as a result, the first quarter of 2013 has reflected a slowdown in our comparable restaurant sales growth. For example, the ongoing impacts of high unemployment, the housing crisis, the so-called “sequester” and related governmental spending and budget matters, gasoline prices, reduced disposable consumer income and consumer confidence have had a negative effect on discretionary consumer spending. As these conditions persist, we will face increased pressure with respect to our pricing, traffic levels and commodity costs. We believe that in this environment, we will need to maintain our focus on value and innovation to continue to drive sales.
Key Performance Indicators
Key measures that we use in evaluating our restaurants and assessing our business include the following:
| • | Average restaurant unit volumes—average sales per restaurant to measure changes in customer traffic, pricing and development of the brand; |
| • |
|
Comparable restaurant sales—year-over-year comparison of sales volumes for domestic, |
| • | System-wide sales—total restaurant sales volume for all Company-owned, franchise and unconsolidated joint venture restaurants, regardless of ownership, to interpret the overall health of our brands; |
| • | Adjusted |
| • | Customer satisfaction scores—measurement of our customers’ experiences in a variety of key attributes. |
2011Recent Business and Financial Highlights
Our 2011recent business and financial results include:
An increase in consolidated revenues of 5.9%3.5% to $3.8$1.1 billion in the three months ended March 31, 2013 as compared to the same period in 2012;
10 Company-owned restaurant openings primarily consisting of Bonefish Grill restaurants and 15 Company-owned restaurant renovations during the three months ended March 31, 2013; and
In April 2013, a repricing of OSI’s existing senior secured term loan B facility by replacing it with the New Term Loan B, which has the same principal amount outstanding (as of the repricing date) of $975.0 million and maturity date, but a lower applicable interest rate than the existing senior secured term loan B facility.
Our 2012 business and financial results include:
An increase in consolidated revenues of 3.8% to $4.0 billion, driven primarily by 4.9%3.7% growth in combined comparable restaurant sales at existing domestic company-ownedCompany-owned core restaurants;restaurants, in 2012 as compared to 2011;
1537 system-wide restaurant openings across most brands (27 were Company-owned and 194ten were franchise and unconsolidated joint venture locations), and 150 Outback Steakhouse renovations in 2011;2012;
Productivity and cost management initiatives that we estimate allowed us to save over $50approximately $59 million in the aggregate in 2011;2012, while our costs increased due to rising commodity prices;
Income from operations of $181.1 million in 2012 compared to $213.5 million in 2011, which was primarily due to increased expenses of $42.1 million associated with our initial public offering partially offset by an increase of 6.1% in operating margins at the restaurant level;
A reorganization of our entire capital structure by refinancing PRP’s CMBS Loan in the first quarter of 2012, completing our initial public offering and retiring OSI’s senior notes in the third quarter of 2012 and refinancing OSI’s 2007 Credit Facilities in the fourth quarter of 2012; and
Generation of income from operations of $213.5 millionAcquiring the remaining interests in 2011 compared to $168.9 million in 2010, primarily attributable to the increase in consolidated revenues described aboveour Roy’s joint venture and the T-Bird settlement describedremaining limited partnership interests in “—Costs and Expenses—Recovery of Notes Receivable from Affiliated Entity.”
Index to Financial Statements
In 2011, we continued to balance near-term growth in share gains with investments to achieve sustainable growth. Our key objectives for 2011 and some of the steps we took to achieve those objectives included:
Continuation of Share Growth by Enhancing Brand Competitiveness in a Challenging Environment. In order to drive share growth, we continued to develop unique promotions throughout our concepts that fit our brand positioning and focus on delivering a superior dining experience. We identified additional opportunities to increase innovation in our menu, service and operations across allcertain of our concepts, such as broadening our Outback Steakhouse menu by adding more salads, seafood and side items and offering the choice between our traditional seared steak and one prepared onlimited partnerships that either owned or had a wood-fired grill. In addition, Carrabba’s introduced a Cucina Casuale sectioncontractual right to its menu during the third quartervarying percentages of 2011 to offer consumers a more casual dining experience with salads, sandwiches and other smaller or lighter offerings.
Acceleration of Brand Investment, Including Renovations and New Unit Development. Our brand investments have focused on accelerating our multi-year Outback Steakhouse renovation plan and increasing unit developmentcash flows in higher return, high growth concepts with a focus on Bonefish Grill. We renovated 194 Outback Steakhouse locations and opened six44 Bonefish Grill restaurants in 2011.and 17 Carrabba’s Italian Grill restaurants.
Growth Strategies
Improvement of Organizational Effectiveness and Infrastructure for Sustainable Growth. We focused on building our competencies in human resources, information technology and real estate, design and construction to support accelerated growth. This is a multi-year effort that includes the implementation of a human resource information system, expanded data warehousing capability, and increased resources and tools to accelerate renovations and new unit site selection. We also implemented a modified managing and chef partner compensation structure that seeks to drive sustainable growth by aligning field incentives and paying higher amounts for growth in restaurant sales and cash flow on an annual basis. See “—Liquidity and Capital Resources—Stock-Based and Deferred Compensation Plans.”
Effective Cost Management by Mitigating Commodity Risk and Accelerating Continuous Productivity Improvement. We leveraged our scale and long-term supply agreements when they were attractive relative to market trends, accelerated productivity improvements and took modest pricing action to maintain value perceptions among consumers.
Our Growth Strategies and Outlook
For the remainder of 2012,In 2013, our key growth strategies which are enabled by continued improvements in infrastructure and organizational effectiveness, are:include:
| • | Grow Comparable Restaurant Sales.We plan to continue our efforts to remodel our Outback Steakhouse and Carrabba’s Italian Grill restaurants, use limited-time offers and multimedia marketing campaigns to drive traffic, |
| • | Pursue New Domestic and International Development With Strong Unit Level Economics.We believe that a substantial development opportunity remains for our concepts in the U.S. and internationally. |
| • | Drive Margin Improvement.We believe we have the opportunity to increase our margins through leveraging increases in average unit volumes and cost reductions in labor, food cost, supply chain and restaurant facilities. |
Index to Financial Statements
Ownership Structures
Our restaurants are predominantly company-ownedCompany-owned or controlled, including through joint ventures, and otherwise operated under franchise arrangements. We generate our revenues primarily from our company-ownedCompany-owned or controlled restaurants and secondarily through ongoing royalties from our franchised restaurants and sales of franchise rights.
Company-owned or controlled restaurants include restaurants owned directly by us, by limited partnerships in which we are athe general partner and our managing partners and chef partners are limited partners and by joint ventures in which we are a member. Our legal ownership interests in these partnershipsjoint ventures and joint venturesour legal ownership interests as general partner in these limited partnerships generally range from 50% to 90%. Our cash flows from these entities are limited to the relative portion of our ownership. The results of operations of Company-owned restaurants are included in our consolidated operating results. The portion of income or loss attributable to the other partners’ interests is eliminated in Net income attributable to noncontrolling interests in our Consolidated Statements of Operations and Comprehensive Income.
In the future, we do not expectplan to useutilize limited partnerships for domestic company-ownedCompany-owned restaurants. Instead, newthe restaurants will be wholly-owned by us and we are transitioning our compensation structure so that the area operating, managing and chef partners will receive their distributions of restaurant cash flow as employee compensation rather than partnership distributions.
We pay royalties on approximately 95% of our Carrabba’s Italian Grill restaurants ranging from 1.0% to 1.5% of sales pursuant to agreements we entered into with the Carrabba’s Italian Grill founders.
Historically, Company-owned restaurants also includeincluded restaurants owned by our Roy’s joint venture, and our consolidated financial statements includeincluded the accounts and operations of our Roy’s joint venture even though we havehad less than majority ownership. See Note 18 ofEffective October 1, 2012, we purchased the remaining interests in our Notes to Consolidated Financial StatementsRoy’s joint venture from our joint venture partner, RY-8, for additional information.$27.4 million (see “—Liquidity and Capital Resources—Transactions”).
Through a joint venture arrangement with PGS Participacoes Ltda., we hold a 50% ownership interest in PGS Consultoria e Serviços Ltda. (the “Brazilian Joint Venture”). The Brazilian Joint Venture was formed in 1998 for the purpose of operating Outback Steakhouse franchise restaurants in Brazil. We account for the Brazilian Joint Venture under the equity method of accounting. We are responsible for 50% of the costs of new restaurants operated by the Brazilian Joint Venture and our joint venture partner is responsible for the other 50% and has operating control. Income and loss derived from the Brazilian Joint Venture is presented in the line item “IncomeIncome from operations of unconsolidated affiliates”affiliates in our Consolidated Statements of Operations. We do not consider restaurantsOperations and Comprehensive Income. Restaurants owned by the Brazilian Joint Venture as “company-owned”are included in “Unconsolidated Joint Venture” restaurants.
We derive no direct income from operations of franchised restaurants other than initial and developmental franchise fees and ongoing royalties, which are included in “Other revenues”Other revenues in our Consolidated Statements of Operations.Operations and Comprehensive Income.
Factors Impacting Financial Results
As discussedThe table below presents the number of our restaurants in more detail below and in addition tooperation at the other factors discussed above, under “Risk Factors” and elsewhere in this prospectus, the following factors have impacted our 2011 results and will impact our future financial results.
Effective March 14, 2012, we entered into the Sale-Leaseback Transaction with two third-party real estate institutional investors in which we sold 67 restaurant properties at fair market value for $194.9 million and then simultaneously leased these properties back under nine master leases. We will defer the recognitionend of the $42.7 million gain on the saleperiods indicated:
| December 31, | March 31, | |||||||||||||||||||
| 2012 | 2011 | 2010 | 2013 | 2012 | ||||||||||||||||
Number of restaurants (at end of the period): | ||||||||||||||||||||
Outback Steakhouse | ||||||||||||||||||||
Company-owned—domestic (1) | 665 | 670 | 671 | 663 | 670 | |||||||||||||||
Company-owned—international (1) | 115 | 110 | 119 | 117 | 110 | |||||||||||||||
Franchised—domestic | 106 | 106 | 108 | 106 | 106 | |||||||||||||||
Franchised and joint venture—international | 89 | 81 | 70 | 89 | 81 | |||||||||||||||
|
|
|
|
|
|
|
|
|
| |||||||||||
Total | 975 | 967 | 968 | 975 | 967 | |||||||||||||||
|
|
|
|
|
|
|
|
|
| |||||||||||
Carrabba’s Italian Grill | ||||||||||||||||||||
Company-owned | 234 | 231 | 232 | 234 | 230 | |||||||||||||||
Franchised | 1 | 1 | 1 | 1 | 1 | |||||||||||||||
|
|
|
|
|
|
|
|
|
| |||||||||||
Total | 235 | 232 | 233 | 235 | 231 | |||||||||||||||
|
|
|
|
|
|
|
|
|
| |||||||||||
Bonefish Grill | ||||||||||||||||||||
Company-owned | 167 | 151 | 145 | 174 | 151 | |||||||||||||||
Franchised | 7 | 7 | 7 | 7 | 7 | |||||||||||||||
|
|
|
|
|
|
|
|
|
| |||||||||||
Total | 174 | 158 | 152 | 181 | 158 | |||||||||||||||
|
|
|
|
|
|
|
|
|
| |||||||||||
Fleming’s Prime Steakhouse and Wine Bar | ||||||||||||||||||||
Company-owned | 65 | 64 | 64 | 65 | 64 | |||||||||||||||
|
|
|
|
|
|
|
|
|
| |||||||||||
Roy’s | ||||||||||||||||||||
Company-owned | 22 | 22 | 22 | 22 | 22 | |||||||||||||||
|
|
|
|
|
|
|
|
|
| |||||||||||
System-wide total | 1,471 | 1,443 | 1,439 | 1,478 | 1,442 | |||||||||||||||
|
|
|
|
|
|
|
|
|
| |||||||||||
| (1) | One Company-owned restaurant in Puerto Rico that was previously included in Outback Steakhouse (international) is now included in Outback Steakhouse (domestic). Prior years have been revised to conform to the current year presentation. |
We operate restaurants under brands that have similar economic characteristics, nature of certainproducts and services, class of the properties over the initial term of the lease. See “—Liquiditycustomer and Capital Resources—Transactions”distribution methods, and Note 20 of our Notes to Consolidated Financial Statements for a further description of the Sale-Leaseback Transaction.
Effective March 27, 2012, New PRP entered into the 2012 CMBS Loan, which totals $500.0 million and comprises a first mortgage loan in the amount of $324.8 million, collateralized by 261 of our properties, and two mezzanine loans totaling $175.2 million. The loans have a maturity date of April 10, 2017, and a weighted average interest rate as of the closing of 6.12%. The proceeds from the 2012 CMBS Loan, together with the proceeds from the Sale-Leaseback Transaction and excess cash, were used to repay the existing CMBS Loan. As a result, of the CMBS Refinancing, the net amount repaid along with scheduled maturities within one year,we aggregate our operating segments into a single reporting segment.
Index to Financial Statements
$281.3 million, was classified as current at December 31, 2011. During the first quarter of 2012, we recorded a $2.9 million Loss on extinguishment of debt. See “Description of Indebtedness” and Note 20 of our Notes to Consolidated Financial Statements for a further description of the 2012 CMBS Loan.
Upon completion of this offering, we expect to record approximately $ of non-cash compensation expense with respect to the time vested portion of stock options containing a management call option due to the automatic termination of the call option upon completion of the offering. See “—Critical Accounting Policies and Estimates—Stock-Based Compensation” for a further description of the call option. Additionally, this offering will trigger payment of $ of an incentive bonus due to our Chief Executive Officer.
As our net income increases, we expect our effective income tax rate to increase due to the benefit of U.S. income tax credits becoming a smaller percentage of net income and the fact that the substantial majority of our earnings are generated in the U.S., where we have higher statutory rates. We expect our effective income tax rate for 2012 to range between 20% and 30%. We expect to maintain a full valuation allowance on our net deferred income tax assets until we sustain an appropriate level of profitability that generates taxable income that would enable us to conclude that it is more likely than not that a portion of our deferred income tax assets will be realized. Such a decrease in the valuation allowance could result in a significant decrease in our effective income tax rate for the period in which it occurs.
Index to Financial Statements
Results of Operations
The following tables settable sets forth, for the periods indicated, (1) percentages that items in our Consolidated Statements of Operations and Comprehensive Income bear to totalTotal revenues or restaurantRestaurant sales, as indicated, and (2) selected operating data:indicated:
| Years Ended December 31, | Years Ended December 31, | Three Months Ended March 31, | ||||||||||||||||||||||||||||||
| 2009 | 2010 | 2011 | 2012 | 2011 | 2010 | 2013 | 2012 | |||||||||||||||||||||||||
Revenues | ||||||||||||||||||||||||||||||||
Restaurant sales | 99.2 | % | 99.1 | % | 99.0 | % | 99.0 | % | 99.0 | % | 99.1 | % | 99.1 | % | 99.0 | % | ||||||||||||||||
Other revenues | 0.8 | 0.9 | 1.0 | 1.0 | 1.0 | 0.9 | 0.9 | 1.0 | ||||||||||||||||||||||||
|
|
|
|
|
|
|
| |||||||||||||||||||||||||
Total revenues | 100.0 | 100.0 | 100.0 | 100.0 | 100.0 | 100.0 | 100.0 | 100.0 | ||||||||||||||||||||||||
Costs and expenses | ||||||||||||||||||||||||||||||||
Cost of sales (1) | 33.1 | 32.0 | 32.2 | 32.5 | 32.2 | 32.0 | 32.3 | 32.1 | ||||||||||||||||||||||||
Labor and other related (1) | 28.7 | 28.8 | 28.8 | 28.3 | 28.8 | 28.8 | 27.7 | 28.1 | ||||||||||||||||||||||||
Other restaurant operating (1) | 23.8 | 24.0 | 23.4 | 23.3 | 23.4 | 24.0 | 21.6 | 20.9 | ||||||||||||||||||||||||
Depreciation and amortization | 5.2 | 4.3 | 4.0 | 3.9 | 4.0 | 4.3 | 3.7 | 3.7 | ||||||||||||||||||||||||
General and administrative | 7.0 | 7.0 | 7.6 | 8.2 | 7.6 | 7.0 | 6.6 | 7.2 | ||||||||||||||||||||||||
Recovery of note receivable from affiliated entity | — | — | (0.9 | ) | — | (0.9 | ) | — | — | — | ||||||||||||||||||||||
Loss on contingent debt guarantee | 0.7 | — | — | |||||||||||||||||||||||||||||
Goodwill impairment | 1.6 | — | — | |||||||||||||||||||||||||||||
Provision for impaired assets and restaurant closings | 3.7 | 0.1 | 0.4 | 0.3 | 0.4 | 0.1 | 0.2 | 0.4 | ||||||||||||||||||||||||
Income from operations of unconsolidated affiliates | (0.1 | ) | (0.2 | ) | (0.2 | ) | (0.1 | ) | (0.2 | ) | (0.2 | ) | (0.3 | ) | (0.2 | ) | ||||||||||||||||
Total costs and expenses | 103.0 | 95.3 | 94.4 | 95.5 | 94.4 | 95.3 | 91.1 | 91.4 | ||||||||||||||||||||||||
|
|
|
|
|
|
|
| |||||||||||||||||||||||||
Income (loss) from operations | (3.0 | ) | 4.7 | 5.6 | ||||||||||||||||||||||||||||
Gain on extinguishment of debt | 4.4 | — | — | |||||||||||||||||||||||||||||
Income from operations | 4.5 | 5.6 | 4.7 | 8.9 | 8.6 | |||||||||||||||||||||||||||
Loss on extinguishment and modification of debt | (0.5 | ) | — | — | — | (0.3 | ) | |||||||||||||||||||||||||
Other (expense) income, net | (* | ) | 0.1 | * | (* | ) | * | 0.1 | (* | ) | * | |||||||||||||||||||||
Interest expense, net | (3.3 | ) | (2.5 | ) | (2.2 | ) | (2.2 | ) | (2.2 | ) | (2.5 | ) | (2.0 | ) | (2.0 | ) | ||||||||||||||||
|
|
|
|
|
|
|
| |||||||||||||||||||||||||
Income (loss) before (benefit) provision for income taxes | (1.9 | ) | 2.3 | 3.4 | ||||||||||||||||||||||||||||
(Benefit) provision for income taxes | (0.1 | ) | 0.6 | 0.6 | ||||||||||||||||||||||||||||
Income before provision for income taxes | 1.8 | 3.4 | 2.3 | 6.9 | 6.3 | |||||||||||||||||||||||||||
Provision for income taxes | 0.3 | 0.6 | 0.6 | 0.9 | 1.2 | |||||||||||||||||||||||||||
|
|
|
|
|
|
|
| |||||||||||||||||||||||||
Net income (loss) | (1.8 | ) | 1.7 | 2.8 | ||||||||||||||||||||||||||||
Less: net income (loss) attributable to noncontrolling interests | (* | ) | 0.2 | 0.2 | ||||||||||||||||||||||||||||
Net income | 1.5 | 2.8 | 1.7 | 6.0 | 5.1 | |||||||||||||||||||||||||||
Less: net income attributable to noncontrolling interests | 0.3 | 0.2 | 0.2 | 0.2 | 0.4 | |||||||||||||||||||||||||||
|
|
|
|
|
|
|
| |||||||||||||||||||||||||
Net income (loss) attributable to Bloomin’ Brands, Inc. | (1.8 | )% | 1.5 | % | 2.6 | % | ||||||||||||||||||||||||||
Net income attributable to Bloomin’ Brands, Inc. | 1.2 | % | 2.6 | % | 1.5 | % | 5.8 | % | 4.7 | % | ||||||||||||||||||||||
|
|
|
|
|
|
|
| |||||||||||||||||||||||||
Net income | 1.5 | % | 2.8 | % | 1.7 | % | 6.0 | % | 5.1 | % | ||||||||||||||||||||||
Other comprehensive income: | ||||||||||||||||||||||||||||||||
Foreign currency translation adjustment | 0.2 | (0.1 | ) | 0.1 | (0.4 | ) | 0.3 | |||||||||||||||||||||||||
|
|
|
|
| ||||||||||||||||||||||||||||
Comprehensive income | 1.7 | 2.7 | 1.8 | 5.6 | 5.4 | |||||||||||||||||||||||||||
Less: comprehensive income attributable to noncontrolling interests | 0.3 | 0.2 | 0.2 | 0.2 | 0.4 | |||||||||||||||||||||||||||
|
|
|
|
| ||||||||||||||||||||||||||||
Comprehensive income attributable to Bloomin’ Brands, Inc. | 1.4 | % | 2.5 | % | 1.6 | % | 5.4 | % | 5.0 | % | ||||||||||||||||||||||
|
|
|
|
| ||||||||||||||||||||||||||||
| (1) | As a percentage of |
| (2) | General and administrative costs exclusive of $42.1 million of initial public offering related expenses would have been 7.1% of Total revenues for the year ended December 31, 2012 (see “—General and administrative expenses” discussion). |
| * | Less than 1/10th of one percent of |
Index to Financial Statements
The table below presents the numberResults of our restaurants in operation at the end of the periods indicated:Operations—Three Months Ended March 31, 2013 and 2012
Revenues
Restaurant Sales
| December 31, | ||||||||||||
| 2009 | 2010 | 2011 | ||||||||||
Number of restaurants (at end of the period): | ||||||||||||
Outback Steakhouse | ||||||||||||
Company-owned—domestic | 680 | 670 | 669 | |||||||||
Company-owned—international | 119 | 120 | 111 | |||||||||
Franchised—domestic | 108 | 108 | 106 | |||||||||
Franchised and joint venture—international | 63 | 70 | 81 | |||||||||
|
|
|
|
|
| |||||||
Total | 970 | 968 | 967 | |||||||||
|
|
|
|
|
| |||||||
Carrabba’s Italian Grill | ||||||||||||
Company-owned | 232 | 232 | 231 | |||||||||
Franchised | 1 | 1 | 1 | |||||||||
|
|
|
|
|
| |||||||
Total | 233 | 233 | 232 | |||||||||
|
|
|
|
|
| |||||||
Bonefish Grill | ||||||||||||
Company-owned | 145 | 145 | 151 | |||||||||
Franchised | 7 | 7 | 7 | |||||||||
|
|
|
|
|
| |||||||
Total | 152 | 152 | 158 | |||||||||
|
|
|
|
|
| |||||||
Fleming’s Prime Steakhouse and Wine Bar | ||||||||||||
Company-owned | 64 | 64 | 64 | |||||||||
|
|
|
|
|
| |||||||
Other | ||||||||||||
Company-owned (1) | 58 | 22 | 22 | |||||||||
|
|
|
|
|
| |||||||
System-wide total | 1,477 | 1,439 | 1,443 | |||||||||
|
|
|
|
|
| |||||||
| Three Months Ended March 31, |
|
| ||||||||||||||
| (dollars in millions): | 2013 | 2012 | $ Change | % Change | ||||||||||||
Restaurant sales | $ | 1,082.4 | $ | 1,045.5 | $ | 36.9 | 3.5 | % | ||||||||
The increase in restaurant sales in the three months ended March 31, 2013 as compared to the same period in 2012 was primarily attributable to (i) additional revenues of approximately $24.7 million from the opening of 44 new restaurants not included in our comparable restaurant sales base and (ii) a $15.9 million increase in comparable restaurant sales at our existing restaurants (including a 1.6% combined comparable restaurant sales increase in the first quarter of 2013 at our core domestic concepts) which was primarily due to increases in customer traffic and general menu prices which were partially offset by mix in our product sales. The increases in customer traffic were primarily driven by selective daypart expansion across certain concepts, innovations in menu, service, promotions and operations across the portfolio and renovations at additional Outback Steakhouse locations partially offset by unfavorable winter weather conditions and the additional day in February 2012 due to Leap Year. The increase in restaurant sales in the three months ended March 31, 2013 as compared to the same period in 2012 was partially offset by a $3.7 million decrease from the closing of eight restaurants since March 31, 2012.
The following table includes additional information about changes in restaurant sales at domestic Company-owned restaurants for our core concepts:
| Three Months Ended March 31, | ||||||||
| 2013 | 2012 | |||||||
Average restaurant unit volumes (weekly): | ||||||||
Outback Steakhouse (1) | $ | 66,943 | $ | 64,452 | ||||
Carrabba’s Italian Grill | $ | 62,134 | $ | 62,510 | ||||
Bonefish Grill | $ | 65,604 | $ | 64,869 | ||||
Fleming’s Prime Steakhouse and Wine Bar | $ | 84,966 | $ | 80,511 | ||||
Operating weeks: | ||||||||
Outback Steakhouse (1) | 8,542 | 8,706 | ||||||
Carrabba’s Italian Grill | 3,009 | 2,991 | ||||||
Bonefish Grill | 2,192 | 1,957 | ||||||
Fleming’s Prime Steakhouse and Wine Bar | 836 | 832 | ||||||
Year over year percentage change: | ||||||||
Menu price increases: (2) | ||||||||
Outback Steakhouse | 2.1 | % | 2.0 | % | ||||
Carrabba’s Italian Grill | 1.4 | % | 2.4 | % | ||||
Bonefish Grill | 1.9 | % | 2.7 | % | ||||
Fleming’s Prime Steakhouse and Wine Bar | 2.1 | % | 2.4 | % | ||||
Comparable restaurant sales (stores open 18 months or more): | ||||||||
Outback Steakhouse (1) | 2.5 | % | 5.2 | % | ||||
Carrabba’s Italian Grill | (1.7 | )% | 4.3 | % | ||||
Bonefish Grill | 0.5 | % | 6.2 | % | ||||
Fleming’s Prime Steakhouse and Wine Bar | 5.0 | % | 5.4 | % | ||||
Combined (concepts above) | 1.6 | % | 5.2 | % | ||||
| (1) | One Company-owned restaurant in |
| average restaurant unit volumes, operating weeks and comparable restaurant sales. The prior period has been revised to |
| (2) | The stated menu price changes exclude the impact of |
We operate restaurants under brands that have similar economic characteristics, natureCosts and Expenses
Cost of productsSales
| Three Months Ended March 31, | ||||||||||||
| (dollars in millions): | 2013 | 2012 | Change | |||||||||
Cost of sales | $ | 350.0 | $ | 335.9 | ||||||||
% of Restaurant sales | 32.3 | % | 32.1 | % | 0.2 | % | ||||||
Cost of sales, consisting of food and services, classbeverage costs, increased as a percentage of customerrestaurant sales in the three months ended March 31, 2013 as compared to the same period in 2012. The increase as a percentage of restaurant sales was primarily 0.8% from increases in the cost of beef and 0.4% from changes in our liquor, beer and wine mix and product mix. The increase was partially offset by decreases as a percentage of restaurant sales of 0.4% from the impact of certain cost savings initiatives, 0.4% from menu price increases and 0.2% from decreases in seafood.
Labor and Other Related Expenses
| Three Months Ended March 31, | ||||||||||||
| (dollars in millions): | 2013 | 2012 | Change | |||||||||
Labor and other related | $ | 299.9 | $ | 293.5 | ||||||||
% of Restaurant sales | 27.7 | % | 28.1 | % | (0.4 | )% | ||||||
Labor and other related expenses include all direct and indirect labor costs incurred in operations, including distribution methods,expense to managing partners, costs related to the Partner Equity Plan (“PEP”) and Partner Ownership Account (“POA”) deferred compensation plans (see “—Liquidity and Capital Resources—Deferred Compensation Plans”), and other incentive compensation expenses. Labor and other related expenses decreased as a percentage of restaurant sales in the three months ended March 31, 2013 as compared to the same period in 2012. The decrease as a percentage of restaurant sales was primarily attributable to the following: (i) 0.4% from changes in deferred compensation participant accounts, (ii) 0.3% from the impact of certain cost savings initiatives and (iii) 0.3% from higher average unit volumes at the majority of our restaurants. The decreases were partially offset by increases as a percentage of restaurant sales of 0.6% from higher kitchen and service labor costs and 0.2% from higher field management labor and bonus expenses.
Other Restaurant Operating Expenses
| Three Months Ended March 31, | ||||||||||||
| (dollars in millions): | 2013 | 2012 | Change | |||||||||
Other restaurant operating | $ | 233.8 | $ | 219.0 | ||||||||
% of Restaurant sales | 21.6 | % | 20.9 | % | 0.7 | % | ||||||
Other restaurant operating expenses include certain unit-level operating costs such as operating supplies, rent, repairs and maintenance, advertising expenses, utilities, pre-opening costs and other occupancy costs. A substantial portion of these expenses is fixed or indirectly variable. The increase as a percentage of restaurant sales in the three months ended March 31, 2013 as compared to the same period in 2012 was primarily due to the following: (i) 0.4% of higher restaurant occupancy costs as a result aggregateof the sale-leaseback transaction entered into
in March 2012 (the “Sale-Leaseback Transaction”) (see “—Liquidity and Capital Resources—Transactions”), (ii) 0.4% in higher advertising expense and (iii) 0.2% in higher restaurant pre-opening and repair and maintenance costs. The increases were offset by decreases as a percentage of restaurant sales primarily from 0.3% from higher average unit volumes at the majority of our restaurants and 0.2% from certain cost savings initiatives.
General and Administrative Expenses
| Three Months Ended March 31, | ||||||||||||
| (in millions): | 2013 | 2012 | Change | |||||||||
General and administrative | $ | 72.5 | $ | 76.0 | $ | (3.5 | ) | |||||
General and administrative costs decreased in the three months ended March 31, 2013 as compared to the same period in 2012 primarily due to the following: (i) $6.7 million of lower legal and other professional fees resulting from amendment and restatement of a lease between OSI and PRP in the first quarter of 2012, (ii) $2.3 million of lower management fees due to the termination of the management agreement in connection with our initial public offering, (iii) $2.2 million of net gain on the termination of split-dollar life insurance policies and (iv) $1.9 million of decreased general and administrative costs associated with field support, managers-in-training and field compensation and bonus expense. These decreases were partially offset by the following: (i) $3.9 million of increased expenses due to the timing of our annual managing partner conference, (ii) $3.7 million of higher stock-based compensation and (iii) $1.6 million net decrease in gains associated with the cash surrender value of life insurance investments.
Provision for Impaired Assets and Restaurant Closings
Three Months Ended | ||||||||||||
| (in millions): | 2013 | 2012 | Change | |||||||||
Provision for impaired assets and restaurant closings | $ | 1.9 | $ | 4.4 | $ | (2.5 | ) | |||||
Restaurant impairment charges primarily resulted from the carrying value of a restaurant’s assets exceeding its estimated fair market value, mainly due to declining future cash flows from lower projected sales at existing locations and locations identified for relocation or renovation (see “—Liquidity and Capital Resources—Fair Value Measurements” for additional information).
Income from Operations
| Three Months Ended March 31, | ||||||||||||
| (dollars in millions): | 2013 | 2012 | Change | |||||||||
Income from operations | $ | 96.9 | $ | 90.4 | ||||||||
% of Total revenues | 8.9 | % | 8.6 | % | 0.3 | % | ||||||
During the three months ended March 31, 2013, income from operations increased as a percentage of total revenues as compared to the same period in 2012 primarily attributable to lower General and administrative expenses and charges for asset impairment and restaurant closings.
Loss on Extinguishment of Debt
During the first quarter of 2012, we recorded a $2.9 million loss related to the extinguishment of the CMBS Loan in connection with New PRP entering into the 2012 CMBS Loan. See “—Liquidity and Capital Resources—Credit Facilities and Other Indebtedness” for a further description.
Provision for Income Taxes
| Three Months Ended March 31, | ||||||||||||
| 2013 | 2012 | Change | ||||||||||
Effective income tax rate | 14.1 | % | 19.2 | % | (5.1 | )% | ||||||
The net decrease in the effective income tax rate in the three months ended March 31, 2013 as compared to the same period in the prior year was primarily due to a decrease in the projected foreign pretax book income and the foreign provision being a smaller percentage of projected consolidated pretax annual income.
The effective income tax rate for the three months ended March 31, 2013 was lower than the blended federal and state statutory rate of 38.6% primarily due to the benefit of the tax credit for excess FICA tax on employee-reported tips, the foreign rate differential, a decrease in the valuation allowance and the elimination of noncontrolling interest together being such a large percentage of projected annual pretax income. The effective income tax rate for the three months ended March 31, 2012 was lower than the blended federal and state statutory rate of 38.7% due to the benefit of the tax credit for excess FICA tax on employee-reported tips and the elimination of noncontrolling interest together being such a large percentage of pretax income. This was partially offset by an increase in the valuation allowance.
Results of Operations—Years Ended December 31, 2012, 2011 and 2010
Revenues
Restaurant Sales
| Years Ended December 31, | Years Ended December 31, | |||||||||||||||||||||||||||||||
| (dollars in millions): | 2012 | 2011 | $ Change | % Change | 2011 | 2010 | $ Change | % Change | ||||||||||||||||||||||||
Restaurant sales | $ | 3,946.1 | $ | 3,803.3 | $ | 142.8 | 3.8 | % | 3,803.3 | 3,594.7 | $ | 208.6 | 5.8 | % | ||||||||||||||||||
The increase in restaurant sales in 2012 as compared to 2011 was primarily attributable to (i) a $123.2 million increase in comparable restaurant sales at our existing restaurants (including a 3.7% combined comparable restaurant sales increase in 2012 at our core domestic restaurants), which was primarily due to increases in customer traffic and general menu prices and (ii) a $50.6 million increase in sales from 36 restaurants not included in our comparable restaurant sales base. The increase in customer traffic was primarily a result of promotions throughout our concepts, innovations in our menu, service and operations, mild winter weather conditions, the additional day in February due to Leap Year, weekend lunch expansions in our Outback Steakhouse concept and renovations at additional Outback Steakhouse locations. The increase in restaurant sales in 2012 as compared to 2011 was partially offset by a $6.8 million decrease from the closing of seven restaurants during 2012 and a $24.2 million decrease from the sale (and franchise conversion) of nine of our Company-owned Outback Steakhouse restaurants in Japan in October 2011.
The increase in restaurant sales in 2011 as compared to 2010 was primarily attributable to (i) a $195.7 million increase in comparable restaurant sales at our existing restaurants (including a 4.9% combined comparable restaurant sales increase in 2011 at our core domestic restaurants) which was primarily due to increases in customer traffic and general menu prices and (ii) a $15.9 million increase in sales from 17 restaurants not included in our comparable restaurant sales base. The increase in customer traffic was primarily a result of promotions throughout our concepts, innovations in our menu, service and operations and renovations at Outback Steakhouse. The increase in restaurant sales in 2011 as compared to 2010 was partially offset by a $2.0 million decrease from the closing of three restaurants during 2011 and a $1.0 million decrease from the sale (and franchise conversion) of nine of our Company-owned Outback Steakhouse restaurants in Japan in October 2011.
The following table includes additional information about changes in restaurant sales at domestic Company-owned restaurants for our core brands:
| Years Ended December 31, | ||||||||||||
| 2012 | 2011 | 2010 | ||||||||||
Average restaurant unit volumes (in thousands): | ||||||||||||
Outback Steakhouse (1) | $ | 3,165 | $ | 3,030 | $ | 2,907 | ||||||
Carrabba’s Italian Grill | $ | 2,999 | $ | 2,946 | $ | 2,816 | ||||||
Bonefish Grill | $ | 3,162 | $ | 3,023 | $ | 2,781 | ||||||
Fleming’s Prime Steakhouse and Wine Bar | $ | 3,929 | $ | 3,730 | $ | 3,476 | ||||||
Operating weeks: | ||||||||||||
Outback Steakhouse (1) | 34,959 | 34,966 | 35,252 | |||||||||
Carrabba’s Italian Grill | 12,078 | 12,077 | 12,097 | |||||||||
Bonefish Grill | 8,163 | 7,600 | 7,553 | |||||||||
Fleming’s Prime Steakhouse and Wine Bar | 3,350 | 3,337 | 3,337 | |||||||||
Year over year percentage change: | ||||||||||||
Menu price increases (decreases): (2) | ||||||||||||
Outback Steakhouse | 2.2 | % | 1.5 | % | (0.1 | )% | ||||||
Carrabba’s Italian Grill | 2.3 | % | 1.5 | % | 0.4 | % | ||||||
Bonefish Grill | 2.2 | % | 1.9 | % | 0.2 | % | ||||||
Fleming’s Prime Steakhouse and Wine Bar | 2.0 | % | 3.0 | % | 0.5 | % | ||||||
Comparable restaurant sales (restaurants open 18 months or more): | ||||||||||||
Outback Steakhouse (1) | 4.4 | % | 4.0 | % | 1.5 | % | ||||||
Carrabba’s Italian Grill | 1.7 | % | 4.6 | % | 2.9 | % | ||||||
Bonefish Grill | 3.2 | % | 8.3 | % | 6.5 | % | ||||||
Fleming’s Prime Steakhouse and Wine Bar | 5.1 | % | 7.4 | % | 10.4 | % | ||||||
Combined (concepts above) | 3.7 | % | 4.9 | % | 2.7 | % | ||||||
| (1) | One Company-owned restaurant in Puerto Rico that was previously included in Outback Steakhouse (international) in prior filings is now included in Outback Steakhouse (domestic). This change affects the calculation of average restaurant unit volumes, operating weeks and comparable restaurant sales. Prior years have been revised to conform to the current year presentation. |
| (2) | The stated menu price changes exclude the impact of product mix shifts to new menu offerings. |
Costs and Expenses
Cost of Sales
| Years Ended December 31, | Years Ended December 31, | |||||||||||||||||||||||
| (dollars in millions): | 2012 | 2011 | Change | 2011 | 2010 | Change | ||||||||||||||||||
Cost of sales | $ | 1,281.0 | $ | 1,226.1 | $ | 1,226.1 | $ | 1,152.0 | ||||||||||||||||
% of Restaurant sales | 32.5 | % | 32.2 | % | 0.3 | % | 32.2 | % | 32.0 | % | 0.2 | % | ||||||||||||
Cost of sales, consisting of food and beverage costs, increased as a percentage of restaurant sales in 2012 as compared to 2011. The increase as a percentage of restaurant sales was primarily 1.1% from increases in beef, seafood and other commodity costs and 0.5% from changes in our liquor, beer and wine mix and product mix. The increase was partially offset by decreases as a percentage of restaurant sales of 0.8% from the impact of certain cost savings initiatives and 0.6% from menu price increases.
The increase as a percentage of restaurant sales in 2011 as compared to 2010 was primarily 1.4% from increases in seafood, dairy, beef and other commodity costs. The increase was partially offset by decreases as a percentage of restaurant sales of 0.9% from the impact of certain cost savings initiatives and 0.4% from menu price increases.
Labor and Other Related Expenses
| Years Ended December 31, | Years Ended December 31, | |||||||||||||||||||||||
| (dollars in millions): | 2012 | 2011 | Change | 2011 | 2010 | Change | ||||||||||||||||||
Labor and other related | $ | 1,117.6 | $ | 1,094.1 | $ | 1,094.1 | $ | 1,034.4 | ||||||||||||||||
% of Restaurant sales | 28.3 | % | 28.8 | % | (0.5 | )% | 28.8 | % | 28.8 | % | — | % | ||||||||||||
Labor and other related expenses include all direct and indirect labor costs incurred in operations, including distribution expense to managing partners, costs related to the PEP and the POA (see “—Liquidity and Capital Resources—Deferred Compensation Plans”), and other incentive compensation expenses. Labor and other related expenses decreased as a percentage of restaurant sales in 2012 as compared to 2011. Items that contributed to a decrease as a percentage of restaurant sales primarily included 0.7% from higher average unit volumes at our restaurants and 0.4% from the impact of certain cost savings initiatives. These decreases were partially offset by increases as a percentage of restaurant sales of the following: (i) 0.5% from higher kitchen and service labor costs, (ii) 0.1% from higher field management labor and bonus expenses and (iii) 0.1% from an increase in health insurance costs.
Labor and other related expenses were flat as a percentage of restaurant sales in 2011 as compared with 2010. Items that contributed to an increase as a percentage of restaurant sales included the following: (i) 0.4% from higher kitchen and service labor costs, (ii) 0.3% from higher field management labor, bonus and distribution expenses, (iii) 0.2% from a settlement of an Internal Revenue Service assessment of employment taxes and (iv) 0.1% from an increase in health insurance costs. These increases were offset by decreases as a percentage of restaurant sales of 0.7% from higher average unit volumes at our restaurants and 0.3% from the impact of certain cost savings initiatives.
Other Restaurant Operating Expenses
| Years Ended December 31, | Years Ended December 31, | |||||||||||||||||||||||
| (dollars in millions): | 2012 | 2011 | Change | 2011 | 2010 | Change | ||||||||||||||||||
Other restaurant operating | $ | 918.5 | $ | 890.0 | $ | 890.0 | $ | 864.2 | ||||||||||||||||
% of Restaurant sales | 23.3 | % | 23.4 | % | (0.1 | )% | 23.4 | % | 24.0 | % | (0.6 | )% | ||||||||||||
Other restaurant operating expenses include certain unit-level operating costs such as operating supplies, rent, repairs and maintenance, advertising expenses, utilities, pre-opening costs and other occupancy costs. A substantial portion of these expenses is fixed or indirectly variable. The decrease as a percentage of restaurant sales in 2012 as compared to 2011 was primarily 0.5% from higher average unit volumes at our restaurants and 0.3% from certain cost savings initiatives. The decrease was partially offset by increases as a percentage of restaurant sales primarily attributable to 0.3% of higher general liability insurance expense and 0.3% of higher restaurant occupancy costs as a result of the Sale-Leaseback Transaction.
The decrease as a percentage of restaurant sales in 2011 as compared with 2010 was primarily 0.7% from higher average unit volumes at our restaurants and 0.4% from certain cost savings initiatives. The decrease was partially offset by increases as a percentage of restaurant sales of 0.2% in operating supplies expense and 0.2% in advertising costs.
Depreciation and Amortization Expenses
| Years Ended December 31, | Years Ended December 31, | |||||||||||||||||||||||
| (dollars in millions): | 2012 | 2011 | Change | 2011 | 2010 | Change | ||||||||||||||||||
Depreciation and amortization | $ | 155.5 | $ | 153.7 | $ | 153.7 | $ | 156.3 | ||||||||||||||||
% of Total revenues | 3.9 | % | 4.0 | % | (0.1 | )% | 4.0 | % | 4.3 | % | (0.3 | )% | ||||||||||||
Depreciation and amortization expense decreased as a percentage of total revenues in 2012 as compared to 2011. This decrease as a percentage of total revenues was primarily driven by higher average unit volumes at our restaurants.
The decrease as a percentage of total revenues in 2011 as compared to 2010 was primarily 0.2% from certain assets being fully depreciated as of June 2010 as a result of purchase accounting adjustments recorded in conjunction with the Merger and 0.2% from higher average unit volumes at our restaurants. The decrease was partially offset by an increase as a percentage of restaurant sales of 0.1% from depreciation expense on property, fixtures and equipment additions during 2011 primarily due to our Outback Steakhouse renovations.
General and Administrative Expenses
| Years Ended December 31, | Years Ended December 31, | |||||||||||||||||||||||
| (in millions): | 2012 | 2011 | Change | 2011 | 2010 | Change | ||||||||||||||||||
General and administrative | $ | 326.5 | $ | 291.1 | $ | 35.4 | $ | 291.1 | $ | 252.8 | $ | 38.3 | ||||||||||||
General and administrative costs increased in 2012 as compared to 2011 primarily due to $42.1 million of additional expenses associated with our initial public offering, including $18.1 million of accelerated Chief Executive Officer retention bonus and incentive bonus expense, $16.0 million of non-cash stock compensation expense for the vested portion of outstanding stock options and an $8.0 million management agreement termination fee. Exclusive of these initial public offering related expenses, General and administrative costs decreased $6.7 million in the year ended December 31, 2012 as compared to the same period in 2011 primarily due to the following: (i) $5.2 million net increase in the cash surrender value of life insurance investments, (ii) $4.3 million loss from the sale of nine of our Company-owned Outback Steakhouse restaurants in Japan in October 2011, (iii) $4.2 million decrease in legal and professional fees, (iv) $3.5 million lower management fees, exclusive of the termination fee, due to the termination of the management agreement in August 2012, (v) $3.5 million gain from the collection of proceeds from the 2009 sale of our Cheeseburger in Paradise concept and (vi) $3.2 million gain from the settlement of lawsuits. This decrease was partially offset by (i) $8.1 million of increased general and administrative costs associated with field support, managers-in-training and field compensation, bonus, distribution and buyout expense, (ii) $7.4 million of additional legal and other professional fees mainly resulting from amendment and restatement of a lease between OSI and PRP and (iii) $2.7 million of net additional corporate compensation, payroll taxes, benefits and bonus expenses primarily as a result of increasing our resources in consumer insights, research and development, productivity and human resources.
The increase in 2011 as compared to 2010 was primarily due to the following: (i) $12.1 million of additional corporate compensation, bonus and relocation expenses primarily as a result of increasing our resources in consumer insights, research and development, productivity and human resources, (ii) $8.2 million of increased general and administrative costs associated with field support, managers-in-training and field compensation, bonus, distribution and buyout expense, (iii) a $6.2 million net decline in the cash surrender value of life insurance investments, (iv) $7.4 million of additional legal and other professional fees, (v) a $4.3 million loss from the sale of nine of our Company-owned Outback Steakhouse restaurants in Japan in October 2011, (vi) $3.8 million of additional information technology expense, (vii) $1.7 million of increased corporate business travel and meeting-related expenses and (viii) $0.5 million of expenses incurred in 2011 in connection with the Sale-Leaseback Transaction. This increase was partially offset by $5.3 million of cost savings initiatives and a $2.0 million allowance for the PRG promissory note recorded in the first quarter of 2010.
Recovery of Note Receivable from Affiliated Entity
In November 2011, we received a settlement payment of $33.3 million from T-Bird in connection with a settlement agreement that satisfied all outstanding litigation with that franchisee.
Provision for Impaired Assets and Restaurant Closings
| Years Ended December 31, | Years Ended December 31, | |||||||||||||||||||||||
| (in millions): | 2012 | 2011 | Change | 2011 | 2010 | Change | ||||||||||||||||||
Provision for impaired assets and restaurant closings | $ | 13.0 | $ | 14.0 | $ | (1.0 | ) | $ | 14.0 | $ | 5.2 | $ | 8.8 | |||||||||||
During the years ended December 31, 2012, 2011 and 2010, we recorded a provision for impaired assets and restaurant closings of $13.0 million, $14.0 million and $5.2 million, respectively, for certain of our restaurants, intangible assets and other assets (see “—Liquidity and Capital Resources—Fair Value Measurements”).
Restaurant impairment charges primarily resulted from the carrying value of a restaurant’s assets exceeding its estimated fair market value, primarily due to declining future cash flows from lower projected future sales at existing locations and locations identified for closure, relocation or renovation (see “—Critical Accounting Policies and Estimates—Impairment or Disposal of Long-Lived Assets”).
Income from Operations
| Years Ended December 31, | Years Ended December 31, | |||||||||||||||||||||||
| (dollars in millions): | 2012 | 2011 | Change | 2011 | 2010 | Change | ||||||||||||||||||
Income from operations | $ | 181.1 | $ | 213.5 | $ | 213.5 | $ | 168.9 | ||||||||||||||||
% of Total revenues | 4.5 | % | 5.6 | % | (1.1 | )% | 5.6 | % | 4.7 | % | 0.9 | % | ||||||||||||
Income from operations decreased in 2012 as compared to 2011 primarily as a result of the increased expenses in General and administrative associated with our initial public offering partially offset by an increase of 6.1% in operating margins at the restaurant level.
Income from operations increased in 2011 as compared to 2010 primarily as a result of a 9.0% increase in operating margins, higher average unit volumes at our restaurants and certain other items as described above.
Loss on Extinguishment and Modification of Debt
During the first quarter of 2012, we recorded a $2.9 million loss related to the extinguishment of PRP’s CMBS Loan in connection with the refinancing. During the third quarter of 2012, we recorded a loss from the extinguishment of OSI’s senior notes of $9.0 million which included $2.4 million for the write-off of unamortized deferred financing fees that related to the extinguished senior notes. During the fourth quarter of 2012, we recorded a loss from the extinguishment and modification of OSI’s 2007 Credit Facilities of $9.1 million which included $6.2 million for the write-off of unamortized deferred financing fees and $2.9 million of third-party financing costs related to the modified portion of the credit facilities. See “—Liquidity and Capital Resources—Credit Facilities and Other Indebtedness” for further discussion of the individual transactions resulting in a loss on the extinguishment and modification of OSI’s and PRP’s debt.
Interest Expense, Net
| Years Ended December 31, | Years Ended December 31, | |||||||||||||||||||||||
| (in millions): | 2012 | 2011 | Change | 2011 | 2010 | Change | ||||||||||||||||||
Interest expense, net | $ | 86.6 | $ | 83.4 | $ | 3.2 | $ | 83.4 | $ | 91.4 | $ | (8.0 | ) | |||||||||||
The increase in net interest expense in 2012 as compared to 2011 was primarily due to higher interest rates from the refinancing of the 2012 CMBS Loan and the New Facilities resulting in increased interest expense of $9.8 million and $2.7 million, respectively. This increase was partially offset by an $8.8 million decline in interest expense for OSI’s senior notes that were satisfied and discharged in August 2012.
The decrease in net interest expense in 2011 as compared to 2010 was primarily due to a $4.6 million decline in interest expense for OSI’s senior secured credit facilities, largely as a result of a decline in the total outstanding balance of those facilities, and to $1.4 million of interest expense on our interest rate collar for OSI’s senior secured credit facilities during 2010 that was not incurred in 2011 (since the collar matured in 2010).
Provision for Income Taxes
| Years Ended December 31, | Years Ended December 31, | |||||||||||||||||||||||
| 2012 | 2011 | Change | 2011 | 2010 | Change | |||||||||||||||||||
Effective income tax rate | 16.5 | % | 16.6 | % | (0.1 | )% | 16.6 | % | 26.5 | % | (9.9 | )% | ||||||||||||
The effective income tax rate in 2012 was consistent with the prior year. The net decrease in the effective income tax rate in 2011 as compared to the previous year was primarily due to the increase in the domestic pretax book income as to which the deferred income tax assets are subject to a valuation allowance and the state and foreign income tax provision being a lower percentage of consolidated pretax income as compared to the prior year.
The effective income tax rate for the year ended December 31, 2012 was lower than the blended federal and state statutory rate of 38.6% primarily due to the benefit of the tax credit for excess FICA tax on employee-reported tips, elimination of noncontrolling interests and foreign rate differential together being such a large percentage of pretax income, which was partially offset by the valuation allowance. The effective income tax rate for the year ended December 31, 2011 was lower than the blended federal and state statutory rate of 38.7% primarily due to the benefit of the tax credit for excess FICA tax on employee-reported tips and loss on investments as a result of the sale of assets in Japan together being such a large percentage of pretax income. The effective income tax rate for the year ended December 31, 2010 was lower than the blended federal and state statutory rate of 38.9% primarily due to the benefit of the tax credit for excess FICA tax on employee-reported tips, which was partially offset by the valuation allowance and income taxes in states that only have limited deductions in computing the state current income tax provision.
Non-GAAP Financial Measures
In addition to the results provided in accordance with U.S. GAAP, we provide non-GAAP measures which present operating results on an adjusted and/or pro forma basis. These are supplemental measures of performance that are not required by or presented in accordance with U.S. GAAP and include system-wide sales, Adjusted income from operations, Adjusted net income attributable to Bloomin’ Brands, Inc., Adjusted diluted earnings per share and Adjusted diluted earnings per pro forma share. These non-GAAP measures are not measurements of our operating segments intoor financial performance under U.S. GAAP and should not be considered as an alternative to performance measures derived in accordance with U.S. GAAP. These non-GAAP measures may not be comparable to similarly titled measures used by other companies and should not be considered in isolation or as a single reporting segment.substitute for measures of performance prepared in accordance with U.S. GAAP.
Index to Financial Statements
System-Wide Sales
System-wide sales increased 7.0% in 2011 and 2.2% in 2010. System-wide sales is a non-GAAP financial measure that includes sales of all restaurants operating under our brand names, whether we own them or not. System-wide sales comprisesis comprised of sales of company-ownedCompany-owned restaurants and sales of franchised and unconsolidated joint venture restaurants. The table below presents the first component of system-wide sales, which is sales of company-ownedCompany-owned restaurants:
| Years Ended December 31, | Years Ended December 31, | Three Months Ended March 31, | ||||||||||||||||||||||||||||||
| 2009 | 2010 | 2011 | 2012 | 2011 | 2010 | 2013 | 2012 | |||||||||||||||||||||||||
Company-Owned Restaurant Sales (in millions): | ||||||||||||||||||||||||||||||||
Company-owned Restaurant Sales (in millions): | ||||||||||||||||||||||||||||||||
Outback Steakhouse | ||||||||||||||||||||||||||||||||
Domestic | $ | 1,954 | $ | 1,960 | $ | 2,027 | $ | 2,115 | $ | 2,031 | $ | 1,964 | $ | 572 | $ | 561 | ||||||||||||||||
International | 260 | 281 | 336 | 315 | 332 | 277 | 88 | 82 | ||||||||||||||||||||||||
|
|
|
|
|
|
|
| |||||||||||||||||||||||||
Total | 2,214 | 2,241 | 2,363 | 2,430 | 2,363 | 2,241 | 660 | 643 | ||||||||||||||||||||||||
Carrabba’s Italian Grill | 633 | 653 | 682 | 693 | 682 | 653 | 187 | 187 | ||||||||||||||||||||||||
Bonefish Grill | 375 | 403 | 441 | 494 | 441 | 403 | 143 | 127 | ||||||||||||||||||||||||
Fleming’s Prime Steakhouse and Wine Bar | 199 | 223 | 239 | 252 | 239 | 223 | 71 | 67 | ||||||||||||||||||||||||
Other | 153 | 75 | 78 | 77 | 78 | 75 | 21 | 21 | ||||||||||||||||||||||||
|
|
|
|
|
|
|
| |||||||||||||||||||||||||
Total company-owned restaurant sales | $ | 3,574 | $ | 3,595 | $ | 3,803 | ||||||||||||||||||||||||||
Total Company-owned restaurant sales | $ | 3,946 | $ | 3,803 | $ | 3,595 | $ | 1,082 | $ | 1,045 | ||||||||||||||||||||||
|
|
|
|
|
|
|
| |||||||||||||||||||||||||
| (1) |
The following information presents the second component of system-wide sales, which is sales of franchised and unconsolidated joint venture restaurants. These are restaurants that are not consolidated and from which we only receive a franchise royalty or a portion of their total income. Management believes that franchise and unconsolidated joint venture sales information is useful in analyzing our revenues because franchisees and affiliates pay royalties and/or service fees that generally are based on a percentage of sales. Management also uses this information to make decisions about future plans for the development of additional restaurants and new concepts as well as evaluation of current operations.
Index to Financial Statements
The following do not represent our sales and are presented only as an indicator of changes in the restaurant system, which management believes is important information regarding the health of our restaurant concepts.
| Years Ended December 31, | Years Ended December 31, | Three Months Ended March 31, | ||||||||||||||||||||||||||||||
| 2009 | 2010 | 2011 | 2012 | 2011 | 2010 | 2013 | 2012 | |||||||||||||||||||||||||
Franchise and Unconsolidated Joint Venture Sales (in millions) (1): | ||||||||||||||||||||||||||||||||
Outback Steakhouse | ||||||||||||||||||||||||||||||||
Domestic | $ | 294 | $ | 296 | $ | 300 | $ | 310 | $ | 300 | $ | 296 | $ | 83 | $ | 82 | ||||||||||||||||
International | 170 | 234 | 311 | 357 | 311 | 234 | 94 | 87 | ||||||||||||||||||||||||
|
|
|
|
|
|
|
| |||||||||||||||||||||||||
Total | 464 | 530 | 611 | 667 | 611 | 530 | 177 | 169 | ||||||||||||||||||||||||
Carrabba’s Italian Grill | 3 | 4 | 4 | 4 | 4 | 4 | 1 | 1 | ||||||||||||||||||||||||
Bonefish Grill | 16 | 16 | 18 | 18 | 18 | 16 | 5 | 5 | ||||||||||||||||||||||||
|
|
|
|
|
|
|
| |||||||||||||||||||||||||
Total franchise and unconsolidated joint venture sales (1) | $ | 483 | $ | 550 | $ | 633 | $ | 689 | $ | 633 | $ | 550 | $ | 183 | $ | 175 | ||||||||||||||||
|
|
|
|
|
|
|
| |||||||||||||||||||||||||
Income from franchise and unconsolidated joint ventures (2) | $ | 26 | $ | 31 | $ | 36 | $ | 41 | $ | 36 | $ | 31 | $ | 11 | $ | 11 | ||||||||||||||||
|
|
|
|
|
|
|
| |||||||||||||||||||||||||
| (1) | Franchise and unconsolidated joint venture sales are not included in revenues in the Consolidated Statements of |
| (2) | Represents the franchise royalty and the portion of total income related to restaurant operations included in the Consolidated Statements of Operations and Comprehensive Income in |
RevenuesOther Financial Measures
Restaurant Sales
| Years Ended December 31, | Years Ended December 31, | |||||||||||||||||||||||||||||||
| (dollars in millions): | 2011 | 2010 | $ Change | % Change | 2010 | 2009 | $ Change | % Change | ||||||||||||||||||||||||
Restaurant sales | $ | 3,803.3 | $ | 3,594.7 | $ | 208.6 | 5.8 | % | $ | 3,594.7 | $ | 3,573.8 | $ | 20.9 | 0.6 | % | ||||||||||||||||
The increase in restaurant sales in 2011 as comparedAdjusted income from operations, Adjusted net income attributable to 2010 wasBloomin’ Brands, Inc., Adjusted diluted earnings per share and Adjusted diluted earnings per pro forma share are non-GAAP measures calculated by eliminating from income from operations, net income and diluted earnings per share the impact of items we do not consider indicative of our ongoing operations. We provide these adjusted operating results because we believe they are useful for investors to assess the operating performance of our business without the effect of these adjustments. For the periods presented, the non-GAAP adjustments include transaction-related expenses primarily attributable to (i)costs incurred in connection with our initial public offering, the refinancing of our long-term debt and other deal costs, management fees paid to the management company associated with our Sponsors and Founders, losses incurred on the extinguishment and modification of long-term debt, collection of a $195.7 million increase in comparablepromissory note and other amounts associated with the 2009 sale of one of our restaurant sales at our existing restaurants (including a 4.9% combined comparable restaurant sales increase in 2011 at our core domestic restaurants), which was primarily dueconcepts and the tax effect of these items. Pro forma amounts give effect to increases in customer traffic and general menu prices and (ii) a $15.9 million increase in sales from 17 restaurants not includedthe issuance of the shares in our comparable restaurant sales base. initial public offering as if they were all outstanding on January 1, 2010.
The increase in customer traffic was primarilyuse of these measures permits a result of promotions throughout our concepts, innovations in our menu, service and operations and renovations at Outback Steakhouse. The increase in restaurant sales in 2011 as compared to 2010 was partially offset by a $2.0 million decrease from the closing of three restaurants during 2011 and a $1.0 million decrease from the sale (and franchise conversion) of ninecomparative assessment of our company-owned Outback Steakhouse restaurants in Japan in October 2011.
The increase in restaurant sales in 2010operating performance relative to our performance based on U.S. GAAP results, while isolating the effects of certain items that vary from period to period without correlation to core operating performance or that vary widely among similar companies. However, our inclusion of these adjusted measures should not be construed as comparedan indication that our future results will be unaffected by unusual or infrequent items or that the items for which we have made adjustments are unusual or infrequent. In the future, we may incur expenses or generate income similar to 2009 was primarily attributablethe adjusted items. We further believe that the disclosure of these non-GAAP measures is useful to (i)investors as they form the basis for how our management team and Board of Directors evaluate our performance, including for achievement of objectives under our cash and equity compensation plans. By disclosing these non-GAAP measures, we believe that we create for investors a $90.0 million increase in comparable restaurant sales at our existing restaurants (2.7% combined comparable restaurant sales increase in 2010 at our core domestic restaurants) primarily due to an increase in customer traffic and partially offset by customer selectiongreater understanding of, lower-priced menu items and (ii) a $23.1 million increase in sales from 32 restaurants not included in our comparable restaurant sales base. The increase in customer traffic was primarily a result of promotions throughout our concepts, innovations in our menu, service and operations and an increase in the overallenhanced level of marketing spending. The increase in restaurant sales in 2010 as compared to 2009 was partially offsettransparency into, the means by a $75.5 million decrease from the sale and de-consolidation of 34 Cheeseburger in Paradise locations and a $16.7 million decrease from the closing of 16 restaurants during 2010.which our management team operates our business.
Index to Financial Statements
The following table includes additional information about changes in restaurant sales at domestic company-owned restaurants for our core brands:
| Years Ended December 31, | ||||||||||||
| 2009 | 2010 | 2011 | ||||||||||
Average restaurant unit volumes (in thousands): | ||||||||||||
Outback Steakhouse | $2,857 | $2,906 | $3,029 | |||||||||
Carrabba’s Italian Grill | $2,737 | $2,816 | $2,946 | |||||||||
Bonefish Grill | $2,606 | $2,781 | $3,023 | |||||||||
Fleming’s Prime Steakhouse and Wine Bar | $3,148 | $3,476 | $3,730 | |||||||||
Operating weeks: | ||||||||||||
Outback Steakhouse | 35,720 | 35,200 | 34,914 | |||||||||
Carrabba’s Italian Grill | 12,065 | 12,097 | 12,077 | |||||||||
Bonefish Grill | 7,491 | 7,553 | 7,600 | |||||||||
Fleming’s Prime Steakhouse and Wine Bar | 3,292 | 3,337 | 3,337 | |||||||||
Year over year percentage change: | ||||||||||||
Menu price increases (decreases):(1) | ||||||||||||
Outback Steakhouse | 1.3 | % | (0.1 | )% | 1.5 | % | ||||||
Carrabba’s Italian Grill | 1.6 | % | 0.4 | % | 1.5 | % | ||||||
Bonefish Grill | 1.5 | % | 0.2 | % | 1.9 | % | ||||||
Fleming’s Prime Steakhouse and Wine Bar | 0.6 | % | 0.5 | % | 3.0 | % | ||||||
Comparable restaurant sales (restaurants open 18 months or more): | ||||||||||||
Outback Steakhouse | (8.8 | )% | 1.5 | % | 4.0 | % | ||||||
Carrabba’s Italian Grill | (6.1 | )% | 2.9 | % | 4.6 | % | ||||||
Bonefish Grill | (5.9 | )% | 6.5 | % | 8.3 | % | ||||||
Fleming’s Prime Steakhouse and Wine Bar | (16.4 | )% | 10.4 | % | 7.4 | % | ||||||
Combined (concepts above) | (8.6 | )% | 2.7 | % | 4.9 | % | ||||||
Costs and Expenses
Cost of Sales
| Years Ended December 31, | Years Ended December 31, | |||||||||||||||||||||||
| (dollars in millions): | 2011 | 2010 | Change | 2010 | 2009 | Change | ||||||||||||||||||
Cost of sales | $ | 1,226.1 | $ | 1,152.0 | $ | 1,152.0 | $ | 1,184.1 | ||||||||||||||||
% of Restaurant sales | 32.2 | % | 32.0 | % | 0.2 | % | 32.0 | % | 33.1 | % | (1.1 | )% | ||||||||||||
Cost of sales, consisting of food and beverage costs, increased as a percentage of restaurant sales in 2011 as compared to 2010. The increase as a percentage of restaurant sales was primarily 1.4%reconciles Adjusted income from increases in seafood, dairy, beef and other commodity costs. The increase was partially offset by decreases as a percentage of restaurant sales of 0.9% from the impact of certain cost savings initiatives and 0.4% from menu price increases.
The decrease as a percentage of restaurant sales in 2010 as compared to 2009 was primarily 1.1% from the impact of certain cost savings initiatives and 0.7% from decreases in beef costs. The decrease was partially offset by increases as a percentage of restaurant sales of the following: (i) 0.3% from increases in produce, dairy and other commodity costs, (ii) 0.2% due to changes in our product mix and (iii) 0.2% from changes in our limited-time offers and other promotions.
Index to Financial Statements
Labor and Other Related Expenses
| Years Ended December 31, | Years Ended December 31, | |||||||||||||||||||||||
| (dollars in millions): | 2011 | 2010 | Change | 2010 | 2009 | Change | ||||||||||||||||||
Labor and other related | $ | 1,094.1 | $ | 1,034.4 | $ | 1,034.4 | $ | 1,024.1 | ||||||||||||||||
% of Restaurant sales | 28.8 | % | 28.8 | % | — | % | 28.8 | % | 28.7 | % | 0.1 | % | ||||||||||||
Labor and other related expenses include all direct and indirect labor costs incurred in operations, including distribution expense to managing partners, costs related to the Partner Equity Plan and the Partner Ownership Account Plan (see “Liquidity and Capital Resources—Stock-Based and Deferred Compensation Plans”), and other incentive compensation expenses. Labor and other related expenses were flat as a percentage of restaurant sales in 2011 as compared to 2010. Items that contributed to an increase as a percentage of restaurant sales included the following: (i) 0.4% from higher kitchen and service labor costs, (ii) 0.3% from higher field management labor, bonus and distribution expenses, (iii) 0.2% from a settlement of an Internal Revenue Service assessment of employment taxes and (iv) 0.1% from an increase in health insurance costs. These increases were offset by decreases as a percentage of restaurant sales of 0.7% from higher average unit volumes at our restaurants and 0.3% from the impact of certain cost savings initiatives.
Labor and other related expenses increased as a percentage of restaurant sales in 2010 as compared with 2009. The increase as a percentage of restaurant sales was primarily due to the following: (i) 0.4% from higher kitchen, service and field management labor costs, (ii) 0.2% from an increase in health insurance costs and (iii) 0.2% from higher distribution expense to managing partners. The increase was partially offset by decreases as a percentage of restaurant sales of 0.5% from the impact of certain cost savings initiatives and 0.2% from higher average unit volumes at our restaurants.
Other Restaurant Operating Expenses
| Years Ended December 31, | Years Ended December 31, | |||||||||||||||||||||||
| (dollars in millions): | 2011 | 2010 | Change | 2010 | 2009 | Change | ||||||||||||||||||
Other restaurant operating | $ | 890.0 | $ | 864.2 | $ | 864.2 | $ | 849.7 | ||||||||||||||||
% of Restaurant sales | 23.4 | % | 24.0 | % | (0.6 | )% | 24.0 | % | 23.8 | % | 0.2 | % | ||||||||||||
Other restaurant operating expenses include certain unit-level operating costs such as operating supplies, rent, repairs and maintenance, advertising expenses, utilities, pre-opening costs and other occupancy costs. A substantial portion of these expenses is fixed or indirectly variable. The decrease as a percentage of restaurant sales in 2011 as compared to 2010 was primarily 0.7% from higher average unit volumes at our restaurants and 0.4% from certain cost savings initiatives. The decrease was partially offset by increases as a percentage of restaurant sales of 0.2% in operating supplies expense and 0.2% in advertising costs.
The increase as a percentage of restaurant sales in 2010 as compared to 2009 was primarily due to the following: (i) 0.4% from increases in advertising costs, (ii) 0.2% from increases in the recognition of deferred gift card fees, (iii) 0.2% from increases in repairs and maintenance costs, occupancy costs and operating supplies expense and (iv) 0.2% from higher general liability insurance expense. The increase was partially offset by decreases as a percentage of restaurant sales of 0.5% from higher average unit volumes at our restaurants and 0.2% from certain cost savings initiatives.
Index to Financial Statements
Depreciation and Amortization
| Years Ended December 31, | Years Ended December 31, | |||||||||||||||||||||||
| (dollars in millions): | 2011 | 2010 | Change | 2010 | 2009 | Change | ||||||||||||||||||
Depreciation and amortization | $ | 153.7 | $ | 156.3 | $ | 156.3 | $ | 186.1 | ||||||||||||||||
% of Total revenues | 4.0 | % | 4.3 | % | (0.3 | )% | 4.3 | % | 5.2 | % | (0.9 | )% | ||||||||||||
Depreciation and amortization expense decreased as a percentage of total revenues in 2011 as compared to 2010. This decrease as a percentage of total revenues was primarily 0.2% from certain assets being fully depreciated as of June 2010 as a result of purchase accounting adjustments recorded in conjunction with the Merger and 0.2% from higher average unit volumes at our restaurants. The decrease was partially offset by an increase as a percentage of restaurant sales of 0.1% from depreciation expense on property, fixtures and equipment additions during 2011 primarily due to our Outback Steakhouse renovations.
The decrease as a percentage of total revenues in 2010 as compared to 2009 was primarily 0.7% from certain assets being fully depreciated as of June 2009 and June 2010 as a result of purchase accounting adjustments recorded in conjunction with the Merger and 0.1% from higher average unit volumes at our restaurants.
General and Administrative
| Years Ended December 31, | Years Ended December 31, | |||||||||||||||||||||||
| (in millions): | 2011 | 2010 | Change | 2010 | 2009 | Change | ||||||||||||||||||
General and administrative | $ | 291.1 | $ | 252.8 | $ | 38.3 | $ | 252.8 | $ | 252.3 | $ | 0.5 | ||||||||||||
General and administrative costs increased in 2011 as compared to 2010 primarily due to the following: (i) $12.1 million of additional corporate compensation, bonus and relocation expenses primarily as a result of increasing our resources in consumer insights, research and development, productivity and human resources, (ii) $8.2 million of increased general and administrative costs associated with field support, managers-in-training and field compensation, bonus, distribution and buyout expense, (iii) a $6.2 millionAdjusted net decline in the cash surrender value of life insurance investments, (iv) $7.4 million of additional legal and other professional fees, (v) a $4.3 million loss from the sale of nine of our company-owned Outback Steakhouse restaurants in Japan in October 2011, (vi) $3.8 million of additional information technology expense, (vii) $1.7 million of increased corporate business travel and meeting-related expenses and (viii) $0.5 million of expenses incurred in 2011 in connection with the Sale-Leaseback Transaction. This increase was partially offset by $5.3 million of cost savings initiatives and a $2.0 million allowance for the PRG promissory note recorded in the first quarter of 2010.
The increase in 2010 as compared to 2009 was primarilyincome attributable to the following: (i) $10.2 million of increased generalBloomin’ Brands, Inc., Adjusted diluted earnings per share and administrative costs associated with field support, managers-in-training and distribution expense, (ii) $10.0 million of additional consulting and legal fees primarily related to our productivity improvement and brand growth strategies, (iii) $4.4 million of additional corporate compensation expense as a result of increasing our resources in consumer insights, research and development, productivity and human resources and (iv) a $4.1 million net decline in the cash surrender value of life insurance investments. This increase was substantially offset by the following: (i) a $14.0 million decrease in restricted stock, deferred compensation and partner buyout expenses that was mostly attributable to accelerated vesting of restricted stockAdjusted diluted earnings per pro forma share, for certain executive officers in 2009, (ii) a $7.1 million reduction of bonus and severance expenses, (iii) a $3.8 million decrease from certain cost savings initiatives and (iv) a $1.3 million decrease in ongoing operating costs at closed locations.
Index to Financial Statements
Recovery of Note Receivable From Affiliated Entity
In November 2011, we received a settlement payment of $33.3 million from T-Bird in connection with a settlement agreement that satisfied all outstanding litigation with T-Bird.
Loss on Contingent Debt Guarantee
We are the guarantor of an uncollateralized line of credit that permits borrowing of up to $24.5 million for the company’s joint venture partner, RY-8, in the development of Roy’s restaurants (see “—Liquidity and Capital Resources—Debt Guarantees”). We recorded a $24.5 million loss associated with this guarantee in the year ended December 31, 2009.
Goodwill Impairment
We did not record a goodwill impairment charge during the years ended December 31, 2011 and 2010. We recorded a goodwill impairment charge of $58.1 million for the domestic Outback Steakhouse concept during the second quarter of 2009 in connection with our annual impairment test.
Our review of the recoverability of goodwill was based primarily upon an analysis of the discounted cash flows of the related reporting units as compared to their carrying values. These goodwill impairment charges occurred due to poor overall economic conditions, declining sales at our restaurants, reductions in our projected results for future periods and a challenging environment for the restaurant industry (see “—Critical Accounting Policies and Estimates”).
Provision for Impaired Assets and Restaurant Closings
| Years Ended December 31, | Years Ended December 31, | |||||||||||||||||||||||
| (in millions): | 2011 | 2010 | Change | 2010 | 2009 | Change | ||||||||||||||||||
Provision for impaired assets and restaurant closings | $ | 14.0 | $ | 5.2 | $ | 8.8 | $ | 5.2 | $ | 134.3 | $ | (129.1 | ) | |||||||||||
During the years ended December 31,2012, 2011 and 2010 and 2009, we recorded a provision for impaired assetsthe three months ended March 31, 2013 and restaurant closings of $14.0 million, $5.2 million and $134.3 million, respectively, for certain of our restaurants, intangible assets and other assets (see “—Liquidity and Capital Resources—Fair Value Measurements”).
During 2009, our provision for impaired assets and restaurant closings primarily included: (i) $46.0 million of impairment charges to reduce the carrying value of the assets of Cheeseburger in Paradise2012 to their estimated fair market value due to our sale of the concept in the third quarter of 2009, (ii) $47.6 million of impairment charges and restaurant closing expense for certain of our other restaurants and (iii) $36.0 million of impairment charges for the domestic Outback Steakhouse and Carrabba’s Italian Grill trade names.
We used the discounted cash flow method to determine the fair value of our intangible assets. The trade name impairment charges occurred due to poor overall economic conditions, declining sales at our restaurants, reductions in our projected results for future periods and a challenging environment for the restaurant industry. Restaurant impairment charges primarily resulted from the carrying value of a restaurant’s assets exceeding its estimated fair market value, primarily due to anticipated closures or declining future cash flows from lower projected future sales at existing locations (see “—Critical Accounting Policies and Estimates”).
Index to Financial Statements
Income (Loss) From Operationsrespective most comparable U.S. GAAP measures (in thousands, except per share amounts):
| Years Ended December 31, | Years Ended December 31, | |||||||||||||||||||||||
| (dollars in millions): | 2011 | 2010 | Change | 2010 | 2009 | Change | ||||||||||||||||||
Income (loss) from operations | $ | 213.5 | $ | 168.9 | $ | 168.9 | $ | (109.3 | ) | |||||||||||||||
% of Total revenues | 5.6 | % | 4.7 | % | 0.9 | % | 4.7 | % | (3.0 | )% | 7.7 | % | ||||||||||||
Income from operations Transaction-related expenses (1) Management fees and expenses (2) Other gains (3) Adjusted income from operations Net income attributable to Bloomin’ Brands, Inc. Transaction-related expenses (1) Management fees and expenses (2) Other gains (3) Loss on extinguishment and modification of debt (4) Total adjustments, before income taxes Income tax effect of adjustments (5) Net adjustments Adjusted net income attributable to Bloomin’ Brands, Inc. Income (loss) from operations increased in 2011 as compared to 2010 and in 2010 as compared to 2009 primarily as a result of a 9.0% and 5.5% increase in operating margins, respectively, higher average unit volumes at our restaurants and certain other items as described above. Years Ended December 31, Three Months
Ended March 31, 2012 2011 2010 2013 2012 $ 181,137 $ 213,452 $ 168,911 $ 96,860 $ 90,408 45,495 7,583 1,157 — 6,761 13,776 9,370 9,550 — 2,326 (3,500 ) (33,150 ) — — — $ 236,908 $ 197,255 $ 179,618 $ 96,860 $ 99,495 $ 49,971 $ 100,005 $ 52,968 $ 63,223 $ 49,999 45,495 7,583 1,157 — 6,761 13,776 9,370 9,550 — 2,326 (3,500 ) (33,150 ) — — — 20,956 — — — 2,851 76,727 (16,197 ) 10,707 — 11,938 (12,660 ) 2,689 (2,837 ) — (2,291 ) 64,067 (13,508 ) 7,870 — 9,647 $ 114,038 $ 86,497 $ 60,838 $ 63,223 $ 59,646
Gain on Extinguishment of Debt
During the first quarter of 2009, OSI purchased $240.1 million in aggregate principal amount of its Senior Notes in a cash tender offer. OSI paid $73.0 million for the Senior Notes purchased and $6.7 million of accrued interest. We recorded a gain from the extinguishment of debt of $158.1 million in 2009. The gain was reduced by $6.1 million for the pro rata portion of unamortized deferred financing fees that related to the extinguished Senior Notes and by $3.0 million for fees related to the tender offer.
Interest Expense, Net
| Years Ended December 31, | Three Months Ended March 31, | |||||||||||||||||||
| 2012 | 2011 | 2010 | 2013 | 2012 | ||||||||||||||||
Diluted earnings per share | $ | 0.44 | $ | 0.94 | $ | 0.50 | $ | 0.50 | $ | 0.47 | ||||||||||
|
|
|
|
|
|
|
|
|
| |||||||||||
Adjusted diluted earnings per share | $ | 0.99 | $ | 0.81 | $ | 0.57 | $ | 0.50 | $ | 0.56 | ||||||||||
|
|
|
|
|
|
|
|
|
| |||||||||||
Adjusted diluted earnings per pro forma share | $ | 0.92 | $ | 0.72 | $ | 0.51 | $ | 0.50 | $ | 0.49 | ||||||||||
|
|
|
|
|
|
|
|
|
| |||||||||||
Diluted weighted average shares outstanding | 114,821 | 106,689 | 105,968 | 126,507 | 107,058 | |||||||||||||||
Pro forma IPO adjustment (6) | 8,684 | 14,197 | 14,197 | — | 14,197 | |||||||||||||||
|
|
|
|
|
|
|
|
|
| |||||||||||
Pro forma diluted weighted average common shares outstanding (6) | 123,505 | 120,886 | 120,165 | 126,507 | 121,255 | |||||||||||||||
|
|
|
|
|
|
|
|
|
| |||||||||||
| Years Ended December 31, | Years Ended December 31, | |||||||||||||||||||||||
| (in millions): | 2011 | 2010 | Change | 2010 | 2009 | Change | ||||||||||||||||||
Interest expense, net | $ | 83.4 | $ | 91.4 | $ | (8.0 | ) | $ | 91.4 | $ | 115.9 | $ | (24.5 | ) | ||||||||||
The decrease in net interest expense in 2011 as compared to 2010 was primarily due to a $4.6 million decline in interest expense for OSI’s senior secured credit facilities, largely as a result of a decline in the total outstanding balance of those facilities, and to $1.4 million of interest expense on our interest rate collar for OSI’s senior secured credit facilities during 2010 that was not incurred in 2011 (since the collar matured in 2010).
The decrease in net interest expense in 2010 as compared to 2009 was primarily due to a net $14.1 million decrease in interest expense mainly due to mark to market adjustments on our interest rate collar for OSI’s senior secured credit facilities that matured effective September 30, 2010 and a reduction of approximately $5.2 million of interest expense as a result of the $240.1 million decrease in principal outstanding on OSI’s senior notes from its completion of a cash tender offer during March of 2009.
Provision (Benefit) For Income Taxes
| Years Ended December 31, | Years Ended December 31 | |||||||||||||||||||||||
| 2011 | 2010 | Change | 2010 | 2009 | Change | |||||||||||||||||||
Effective income tax rate | 16.6 | % | 26.5 | % | (9.9 | )% | 26.5 | % | 3.7 | % | 22.8 | % | ||||||||||||
The net decrease in the effective income tax rate in 2011 as compared to the previous year was primarily due to the increase in the domestic pretax book income in which the deferred income tax assets are subject to a valuation allowance and the state and foreign income tax provision being a lower percentage of consolidated pretax income as compared to the prior year. The net increase in the effective income tax rate in 2010 as compared to the previous year was primarily due to the effect of the change in the valuation allowance against deferred income tax assets.
The effective income tax rate for the year ended December 31, 2011 was lower than the combined federal and state statutory rate of 38.7% primarily due to the benefit of the tax credit for excess FICA tax on
Index to Financial Statements
employee-reported tips and loss on investments as a result of the sale of assets in Japan together being such a large percentage of pretax income. The effective income tax rate for the year ended December 31, 2010 was lower than the combined federal and state statutory rate of 38.9% primarily due to the benefit of the tax credit for excess FICA tax on employee-reported tips, which was partially offset by the valuation allowance and income taxes in states that only have limited deductions in computing the state current income tax provision. The effective income tax rate for the year ended December 31, 2009 was significantly lower than the combined federal and state statutory rate of 38.9% primarily due to an increase in the valuation allowance on deferred income tax assets, which was partially offset by the benefit of the tax credit for excess FICA tax on employee-reported tips being such a large percentage of pretax loss.
| (1) | Transaction-related expenses primarily relate to costs incurred in association with our initial public offering, the refinancing of our long-term debt and other deal costs. The expenses related to the initial public offering primarily include $18.1 million of accelerated Chief Executive Officer retention bonus and incentive bonus and $16.0 million of non-cash stock compensation charges for the vested portion of outstanding stock options recorded upon completion of the initial public offering. |
| (2) | Represents management fees, out-of-pocket expenses and certain other reimbursable expenses paid to a management company owned by our Sponsors and Founders under a management agreement with us. In accordance with the terms of an amendment, this agreement terminated immediately prior to the completion of our initial public offering, and a termination fee of $8.0 million was paid to the management company in 2012, in addition to a pro-rated periodic fee. |
| (3) | During 2012, we recorded a gain associated with the collection of the promissory note and other amounts in connection with the 2009 sale of the Cheeseburger in Paradise concept. During 2011, we recorded a recovery of a note receivable from T-Bird in connection with a settlement agreement that satisfied all outstanding litigation with T-Bird. |
| (4) | Loss on extinguishment and modification of debt is related to the refinancing of OSI’s senior secured credit facilities, charges associated with PRP’s CMBS Loan refinancing and the retirement of the senior notes. |
| (5) | Income tax effect of adjustments for the years ended December 31, 2012, 2011 and 2010 were calculated using our full-year effective tax rate of 16.5%, 16.6% and 26.5%, respectively. Income tax effect of adjustments for the three months ended March 31, 2012 was calculated using our projected full-year effective tax rate of 19.2%. |
| (6) | Gives pro forma effect to the issuance of shares in our initial public offering as if they were all outstanding on January 1, 2010. There is no effect of this adjustment to the three months ended March 31, 2013. |
Liquidity and Capital Resources
Potential Impacts of Market Conditions on Capital Resources
During 2010 and 2011, we experienced a strengthening of trends in consumer traffic and increases in comparable restaurant sales and operating cash flows, and generated an increase in operating income. However, the restaurant industry continues to be challenged and uncertainty exists as to the sustainability of these favorable trends. We have continued to implement various cost savings initiatives, including food cost decreases through waste reduction and supply chain and labor efficiency initiatives. We developed new menu items to appeal to value-conscious consumers and used marketing campaigns to promote these items.
As of December 31, 2011, we had approximately $82.4 million in available unused borrowing capacity under our working capital revolving credit facility (after giving effect to undrawn letters of credit of approximately $67.6 million) and $67.0 million in available unused borrowing capacity under our pre-funded revolving credit facility that provides financing for capital expenditures only (see “Description of Indebtedness”).
We believe that expected cash flow from operations, plannedavailable borrowing capacity short-term investments and restricted cash balances are adequate to finance our growth strategies and to fund debt service requirements, operating lease obligations, capital expenditures, and working capital obligations and other significant commitments for the next twelve months. At December 31, 2011, we were in compliance with our covenants. However, our ability to continue to meet these requirements and obligations will depend on, among other things, our ability to achieve anticipated levels of revenue and cash flow and our ability to manage costs and working capital successfully.
Transactions
Effective March 14, 2012, we entered into a Sale-Leaseback Transaction with two third-party real estate institutional investors in which we sold 67 restaurant properties at fair market value for net proceeds of $192.9 million. We then simultaneously leased these properties back under nine master leases (collectively, the “REIT Master Leases”). The initial term of the REIT Master Leases are 20 years with four five-year renewal options. One renewal period is at a fixed rental amount and the last three renewal periods are generally based at then-current fair market values. The sale at fair market value and subsequent leaseback qualified for sale-
leaseback accounting treatment, and the REIT Master Leases are classified as operating leases. We deferred the recognition of the $42.9 million gain on the sale of certain of the properties over the initial term of the lease. In accordance with the applicable accounting guidance, the 67 restaurant properties are not classified as held for sale at December 31, 2011 since we leased the properties.
Effective March 27, 2012, New PRP entered into the 2012 CMBS Loan, which totaled $500.0 million at origination and was comprised of a first mortgage loan in the amount of $324.8 million, collateralized by 261 of our properties, and two mezzanine loans totaling $175.2 million. The loans have a maturity date of April 10, 2017, and a weighted average interest rate as of the closing of 6.1%. The proceeds from the 2012 CMBS Loan, together with the proceeds from the Sale-Leaseback Transaction and excess cash held in PRP, were used to repay PRP’s existing CMBS Loan. As a result of refinancing the CMBS Loan (the “CMBS Refinancing”), the net amount repaid along with scheduled maturities within one year, $281.3 million, was classified as current at December 31, 2011. During the first quarter of 2012, we recorded a $2.9 million loss on extinguishment of debt (see “—Credit Facilities and Other Indebtedness”).
On May 10, 2012, we entered into a first amendment to our management agreement with Kangaroo Management Company I, LLC (the “Management Company”), whose members are entities associated with Bain Capital, Catterton and our Founders. In accordance with the terms of this amendment, the management agreement terminated immediately prior to the completion of our initial public offering, and a termination fee of $8.0 million was paid to the Management Company in the third quarter of 2012, in addition to a pro-rated periodic fee.
On May 10, 2012, the retention bonus and the incentive bonus agreements with our Chief Executive Officer were amended. Under the terms of the amendments, the remaining payments under each agreement were accelerated to a single lump sum payment of $22.4 million as a result of the completion of our initial public offering, which was paid in the third quarter of 2012. We recorded $18.1 million for the accelerated bonus expense in General and administrative expenses in our Consolidated Statement of Operations and Comprehensive Income for the year ended December 31, 2012.
On August 13, 2012, we completed an initial public offering of our common stock. On September 11, 2012, the underwriters in our initial public offering completed the exercise of their option to purchase up to 2,400,000 additional shares of common stock from us and certain of the selling stockholders. In the offering, (i) we issued and sold an aggregate of 14,196,845 shares of common stock (including 1,196,845 shares sold pursuant to the underwriters’ option to purchase additional shares) at a price to the public of $11.00 per share for aggregate gross offering proceeds of $156.2 million and (ii) certain of our stockholders sold 4,196,845 shares of our common stock (including 1,196,845 shares pursuant to the underwriters’ option to purchase additional shares) at a price to the public of $11.00 per share for aggregate gross offering proceeds of $46.2 million. We did not receive any proceeds from the sale of shares of common stock by the selling stockholders.
We received net proceeds in the offering of approximately $142.2 million after deducting underwriting discounts and commissions of approximately $9.4 million and offering related expenses of $4.6 million. All of the net proceeds, together with cash on hand, were applied to the retirement of OSI’s 10% senior notes due 2015.
Upon completion of the offering, our certificate of incorporation was amended and restated to provide for authorized capital stock of 475,000,000 shares of common stock, par value $0.01 per share, and 25,000,000 shares of undesignated preferred stock.
Upon completion of our initial public offering, we recorded approximately $16.0 million of aggregate non-cash compensation expense with respect to (i) certain stock options held by our Chief Executive Officer that become exercisable (to the extent then vested) if following the offering, the volume-weighted average trading price of our common stock is equal to or greater than specified performance targets over a six-month period and (ii) the time vested portion of outstanding stock options containing a management call option due to the automatic
termination of the call option upon completion of the offering. Additionally, at the time of the initial public offering, we expected to record an additional $19.6 million in stock-based compensation expense through 2017 (of which $2.7 million was incurred in 2012) related to the portion of these same stock options that will continue to vest following the offering. These amounts are only for the stock options described in (i) and (ii) above and are in addition to stock-based compensation expense we will recognize related to other outstanding equity awards and other equity awards that may be granted in the future. See “—Critical Accounting Policies and Estimates—Stock-Based Compensation” for additional information on the management call option.
During the third quarter of 2012, OSI retired the aggregate outstanding principal amount of its 10% senior notes through a combination of a tender offer and early redemption call. The senior notes retirement was funded using a portion of the net proceeds from our initial public offering together with cash on hand. OSI paid an aggregate of $259.8 million to retire the senior notes, which included $248.1 million in aggregate outstanding principal, $6.5 million of prepayment premium and early tender incentive fees and $5.2 million of accrued interest. The senior notes were satisfied and discharged on August 13, 2012. As a result of these transactions, we recorded a loss from the extinguishment of debt of $9.0 million in the third quarter of 2012 in Loss on extinguishment and modification of debt in our Consolidated Statement of Operations and Comprehensive Income. This loss included $2.4 million for the write-off of unamortized deferred financing fees that related to the extinguished senior notes.
Effective October 1, 2012, we purchased the remaining interests in our Roy’s joint venture from RY-8 for $27.4 million. This purchase price consisted of the assumption of RY-8’s $24.5 million line of credit guaranteed by OSI that had been recorded in Guaranteed debt in our Consolidated Balance Sheet at December 31, 2011, forgiveness of $1.8 million in loans due from RY-8 to OSI and a $1.1 million cash payment. This transaction resulted in a $0.7 million reduction in Additional paid-in capital in our Consolidated Balance Sheet at December 31, 2012. In December 2012, we paid the $24.5 million outstanding balance on the line of credit assumed from RY-8 and the line of credit was terminated.
On October 26, 2012, OSI completed a refinancing of its 2007 Credit Facilities and entered into a Credit Agreement with a syndicate of institutional lenders and financial institutions. The New Facilities provided for senior secured financing of up to $1.225 billion, consisting of a $1.0 billion term loan B and a $225.0 million revolving credit facility, including letter of credit and swing-line loan sub-facilities, maturing seven and five years after the closing date of the New Facilities, respectively. In the fourth quarter of 2012, we capitalized $11.0 million of third-party financing fees incurred to complete the transaction. These deferred financing costs are included in Other assets, net in our Consolidated Balance Sheet. In addition, we recorded a $9.1 million loss related to the extinguishment and modification of the 2007 Credit Facilities in Loss on extinguishment and modification of debt in our Consolidated Statement of Operations and Comprehensive Income during the fourth quarter of 2012. In the first quarter of 2013, OSI prepaid $25.0 million of outstanding principal under the term loan B. In April 2013, OSI completed a repricing of its existing senior secured term loan B facility by replacing it with the New Term Loan B, which has the same outstanding principal amount (as of the repricing date) of $975.0 million, maturity date of October 26, 2019, amortization schedule and financial covenants, but a lower applicable interest rate than the existing senior secured term loan B facility (see “—Credit Facilities and Other Indebtedness”).
During the third and fourth quarters of 2012, we purchased the remaining partnership interests in certain of our limited partnerships that either owned or had a contractual right to varying percentages of cash flows in 44 Bonefish Grill restaurants and 17 Carrabba’s Italian Grill restaurants for an aggregate purchase price of $39.5 million. The purchase price for each of the transactions was paid in cash by December 31, 2012. These transactions resulted in a $39.0 million reduction in Additional paid-in capital in our Consolidated Balance Sheet at December 31, 2012.
In connection with the settlement of litigation with T-Bird Nevada, LLC and its affiliates (collectively, “T-Bird”), which included the franchisees of 56 Outback Steakhouse restaurants in California, T-Bird has a right
(referred to as the “Put Right”), which would require us to purchase for cash all of the ownership interests in the T-Bird entities that own Outback Steakhouse restaurants and certain rights under the development agreement with T-Bird. The Put Right is non-transferable, other than under limited circumstances set forth in the settlement agreement. The Put Right is exercisable by T-Bird until August 13, 2013. If the Put Right is exercised, we will pay a purchase price equal to a multiple of the T-Bird entities’ adjusted EBITDA (earnings before interest, taxes, depreciation and amortization) for the trailing 12 months, net of liabilities of the T-Bird entities. The multiple is equal to 75% of the multiple of our adjusted EBITDA reflected in our stock price. We have a one-time right to reject the exercise of the Put Right if the transaction would be dilutive to our consolidated earnings per share. In such event, the Put Right is extended until the first anniversary of our notice to the T-Bird entities of such rejection. If exercised, the closing of the Put Right will be the last business day of the third full calendar month immediately following the month in which notification of the exercise of the Put Right (the “Put Notice”) is given. If the weighted average closing price of our common stock during the month immediately prior to the month the closing date is to occur is more than 20% less than the closing price on the date the Put Notice is delivered, the T-Bird entities will have a one-time right to delay the closing for two months. If the closing date is delayed, the T-Bird entities multiple will be calculated based on the weighted average closing price of our common stock during the calendar month immediately prior to the month of the newly scheduled closing date. The closing of the Put Right is subject to certain conditions, including the negotiation of a transaction agreement reasonably acceptable to the parties, the absence of dissenters’ rights being exercised by the equity owners above a specified level, non-revocation by the T-Bird entities of the exercise of the Put Right and compliance with our debt agreements.
Summary of Cash Flows
We require capital primarily for principal and interest payments on our debt, prepayment requirements under ourOSI’s term loan B facility (see “Description of“—Credit Facilities and Other Indebtedness”), obligations related to our deferred compensation plans, the development of new restaurants, remodeling older restaurants, investments in technology, and acquisitions of franchisees and joint venture partners.
The following table presents a summary of our cash flows provided by (used in) operating, investing and financing activities for the periods indicated (in thousands):
| Years Ended December 31, | ||||||||||||
| 2009 | 2010 | 2011 | ||||||||||
Net cash provided by operating activities | $ | 195,537 | $ | 275,154 | $ | 322,450 | ||||||
Net cash used in investing activities | (39,171 | ) | (71,721 | ) | (113,142 | ) | ||||||
Net cash used in financing activities | (137,397 | ) | (167,315 | ) | (89,300 | ) | ||||||
Effect of exchange rate changes on cash and cash equivalents | 870 | (1,539 | ) | (3,460 | ) | |||||||
|
|
|
|
|
| |||||||
Net increase in cash and cash equivalents | $ | 19,839 | $ | 34,579 | $ | 116,548 | ||||||
|
|
|
|
|
| |||||||
Index to Financial Statements
| Years Ended December 31, | Three Months Ended March 31, | |||||||||||||||||||
| 2012 | 2011 | 2010 | 2013 | 2012 | ||||||||||||||||
Net cash provided by operating activities | $ | 340,091 | $ | 322,450 | $ | 275,154 | $ | 18,100 | $ | 2,096 | ||||||||||
Net cash provided by (used in) investing activities | 19,944 | (113,142 | ) | (71,721 | ) | (38,394 | ) | 155,820 | ||||||||||||
Net cash used in financing activities | (586,219 | ) | (89,300 | ) | (167,315 | ) | (21,226 | ) | (306,404 | ) | ||||||||||
Effect of exchange rate changes on cash and cash equivalents | 5,790 | (3,460 | ) | (1,539 | ) | (2,701 | ) | 1,463 | ||||||||||||
|
|
|
|
|
|
|
|
|
| |||||||||||
Net (decrease) increase in cash and cash equivalents | $ | (220,394 | ) | $ | 116,548 | $ | 34,579 | $ | (44,221 | ) | $ | (147,025 | ) | |||||||
|
|
|
|
|
|
|
|
|
| |||||||||||
Operating Activities
Net cash provided by operating activities increased in the three months ended March 31, 2013 as compared to the same period in 2012 primarily as a result of the following: (i) timing of accounts payable and certain accrual payments, (ii) utilization of inventory on hand and (iii) a decrease in cash paid for income taxes. The increase in net cash provided by operating activities was partially offset by the following: (i) a decrease in cash due to timing of collections of holiday gift card sales from third-party vendors, (ii) an increase in cash paid for interest on our outstanding debt obligations and (iii) $2.2 million of cash paid to terminate certain split-dollar life insurance policies.
Net cash provided by operating activities increased in 2012 as compared to 2011 primarily as a result of the following: (i) timing of third-party gift card receipts, (ii) an increase in cash generated from restaurant operations due to comparable restaurant sales increases and (iii) certain food, labor and other cost savings initiatives. The increase in net cash provided by operating activities was partially offset by a bonus payment to our Chief Executive Officer of $18.1 million and a management agreement termination fee of $8.0 million, both made in connection with our initial public offering, as well as timing related increases in payments associated with our trade payables and accrued expenses.
Net cash provided by operating activities increased in 2011 as compared to 2010 primarily as a result of the following: (i) an increase in cash generated from restaurant operations due to comparable restaurant sales increases, (ii) certain food, labor and other cost savings initiatives, (iii) an acceleration of certain accounts payable and other related payments prior to the end of 2010 and (iv) a decrease in cash paid for interest, which was $72.1 million for the year ended December 31, 2011 compared to $96.7 million in 2010. The increase in net cash provided by operating activities was partially offset by an increase in other current assets primarily due to an increase in third-party gift card receivables and an increase in cash paid for income taxes, net of refunds, which was $27.7 million for the year ended December 31, 2011 compared to $10.8 million in 2010.
Investing Activities
Net cash used in investing activities during the three months ended March 31, 2013 consisted primarily of capital expenditures of $41.0 million partially offset by proceeds from the disposal of property, fixtures and equipment of $1.8 million and the $1.1 million net difference in restricted cash. Net cash provided by operatinginvesting activities increased in 2010 as compared to 2009during the three months ended March 31, 2012 consisted primarily as a result of proceeds from the following: (i) an increase inSale-Leaseback Transaction of $192.9 million partially offset by capital expenditures of $34.0 million and the $4.3 million net difference between restricted cash generated from restaurant operations due to comparable restaurant sales increases, (ii) certain food, laborreceived and other cost savings initiatives, (iii) a delay in accounts payable and other related payments at December 31, 2008, (iv) a decrease inrestricted cash paid for interest, which was $96.7 million forused.
Net cash provided by investing activities during the year ended December 31, 2010 compared to $109.02012 consisted primarily of the following: (i) proceeds from the Sale-Leaseback Transaction of $192.9 million, (ii) the $4.2 million net difference in restricted cash, (iii) proceeds from the sale of property, fixtures and equipment of $4.0 million and (iv) $3.5 million of proceeds from the collection of the promissory note and other amounts due in connection with the 2009 and (v) a decreasesale of the Cheeseburger in cash paid for income taxes, net of refunds, which was $10.8 million for the year ended December 31, 2010 compared to $21.3 million in 2009. The increase in net cash provided by operating activities wasParadise concept. These increases were partially offset by (i) a significant decline in inventory during 2009 as a resultcapital expenditures of utilization$178.7 million and purchases of inventory on hand, (ii) a significant increase in bonuses paid during 2010 as compared to 2009 and (iii) an accelerationCompany-owned life insurance of certain accounts payable and other related payments prior to the end of 2010.
Investing Activities
$6.5 million. Net cash used in investing activities during the year ended December 31, 2011 consisted primarily of capital expenditures of $120.9 million and a royalty termination fee of $8.5 million. This was partially offset by $10.1 million of proceeds from the sale of nine of our company-ownedCompany-owned Outback Steakhouse restaurants in Japan. Net cash used in investing activities during the year ended December 31, 2010 consisted primarily of the following: (i) capital expenditures of $60.5 million, (ii) the $11.3 million net difference between restricted cash received and restricted cash used which was primarily related to the use of restricted cash for deferred compensation plans and (iii) deconsolidated PRG cash of $4.4 million. This was partially offset by the $4.0 million net difference between the proceeds from the sale and purchases of company-owned life insurance. Net cash used in investing activities for the year ended December 31, 2009 was primarily attributable to capital expenditures of $57.5 million and was partially offset by the $10.3 million net difference between the proceeds from the sale and the purchases of company-ownedCompany-owned life insurance.
We estimate that our capital expenditures will total between approximately $180.0$220.0 million and $210.0$250.0 million in 2012.2013. The amount of actual capital expenditures may be affected by general economic, financial, competitive, legislative and regulatory factors, among other things, including restrictions imposed by our borrowing arrangements. We expect to continue to review the level of capital expenditures throughout 2012.2013.
Financing Activities
Net cash used in financing activities during the three months ended March 31, 2013 was primarily attributable to the following: (i) repayments of long-term debt of $30.6 million, (ii) repayments of partner deposits and accrued partner obligations of $4.2 million and (iii) distributions to noncontrolling interests of $2.4 million. This was partially offset by the receipt of proceeds from the exercise of stock options of $10.6 million and repayments of notes receivable due from stockholders of $5.3 million. Net cash used in financing activities
during the three months ended March 31, 2012 was primarily attributable to the following: (i) extinguishment of PRP’s CMBS Loan of $777.6 million, (ii) repayments of partner deposits and accrued partner obligations of $9.2 million, (iii) repayments of long-term debt of $6.6 million, (iv) deferral of $5.4 million of financing fees associated with the refinancing of PRP’s CMBS Loan and (v) distributions to noncontrolling interests of $4.2 million. This was partially offset by the proceeds received from the 2012 CMBS Loan of $495.2 million.
Net cash used in financing activities during the year ended December 31, 2012 was primarily attributable to the following: (i) the extinguishment and modification of the OSI 2007 Credit Facilities and extinguishment of the PRP CMBS Loan and OSI’s senior notes for an aggregate $2.0 billion, (ii) the repayment of borrowings on OSI’s revolving credit facilities of $144.0 million, (iii) the repayment of long-term debt of $46.9 million, (iv) the purchase of outstanding limited partnership interests in certain restaurants of $40.6 million, (v) the repayments of partner deposits and other contributions of $25.4 million, (vi) the financing fees incurred for PRP’s CMBS Refinancing and the refinancing of OSI’s 2007 Credit Facilities of $19.0 million and (vii) the net distributions to noncontrolling interests of $14.0 million. This was partially offset by proceeds on the issuance of long-term debt for OSI and New PRP and borrowings on OSI’s revolving credit facilities of $1.6 billion and proceeds from the issuance of common stock of $142.2 million.
Net cash used in financing activities during the year ended December 31, 2011 was primarily attributable to the following: (i) repayments of borrowings on long-term debt and OSI’s revolving credit facilities of $103.3 million, (ii) the net difference between repayments and receipts of partner deposits and other contributions of $36.0 million and (iii) distributions to noncontrolling interests of $13.5 million. This was partially offset by the collection of the note receivable from T-Bird of $33.3 million and proceeds from borrowings on OSI’s revolving credit facilities of $33.0 million. Net cash used in financing activities during the year ended December 31, 2010 was primarily attributable to the following: (i) repayments of borrowings on long-term debt and OSI’s revolving credit facilities of $196.8 million, (ii) the net difference between repayment and receipt of partner deposit and accrued buyout contributions of $18.0 million and (iii) distributions to noncontrolling interests of $11.6 million. This was partially offset by proceeds from borrowings on OSI’s
Index to Financial Statements
revolving credit facilities of $61.0 million. Net cash used in financing activities for the year ended December 31, 2009 was primarily attributable to: (i) $76.0 million of cash paid for the extinguishment of a portion of OSI’s Senior Notes and related fees, (ii) repayments of borrowings on long-term debt and OSI’s revolving credit facilities of $37.2 million, (iii) $33.3 million of cash paid for the purchase of the note related to OSI’s guaranteed debt for T-Bird and (iv) distributions to noncontrolling interests of $9.1 million. Net cash used in financing activities in 2009 was partially offset by $23.7 million of proceeds from borrowings on OSI’s revolving credit facilities.
Financial Condition as of March 31, 2013
Current assets increaseddecreased to $708.3$427.7 million at March 31, 2013 as compared with $487.8 million at December 31, 2011 as compared with $530.9 million at December 31, 20102012. This decrease was primarily due to an increasea $44.2 million decrease in Cash and cash equivalents (see “—Summary of $116.5 million. This increaseCash Flows”) and a $10.3 million decrease in CashInventories primarily due to the utilization of inventory on hand and cash equivalents was driven by a reduction in net repaymentstiming of long-term debt and borrowings on OSI’s revolving credit facilities during 2011deliveries at the end of the period. Current liabilities decreased to $574.6 million at March 31, 2013 as compared with $691.4 million at December 31, 2012 primarily due to 2010 of $65.5the following: (i) a $97.4 million the receipt of a $33.3 million settlement payment from T-Birddecrease in November 2011 and an increase in cash provided by our restaurant operations. This increase was partially offset by $60.4 million of additional capital expenditures during 2011 as compared to 2010. Other current assets also increased $32.6 million driven primarily by a $36.5 million increase in receivablesUnearned revenue as a result of third-partythe seasonal pattern of gift card and promotional sales.sales and redemptions, (ii) a $9.8 million decrease in the Current portion of long-term debt mainly due to the voluntary prepayments on the term loan B made in the first quarter of 2013 extending future principal payments in excess of 12 months, and (iii) a $18.6 million decrease in Accrued and other current liabilities primarily from a decrease in accrued payroll and other compensation for 2012 related compensation paid in March 2013. These decreases were partially offset by an increase of $9.2 million in Accounts payable due to the timing of payments.
Working capital (deficit) totaled ($248.1)146.8) million and ($120.1)203.6) million at March 31, 2013 and December 31, 2011 and 2010,2012, respectively, and included Unearned revenue from unredeemed gift cards of $299.6$232.1 million and $269.1$329.5 million at March 31, 2013 and December 31, 2012, respectively. We have, and in the future may continue to have, negative working capital balances (as is common for many restaurant companies). We operate successfully with negative working capital because cash collected on restaurant sales is typically received before payment is due on our current liabilities and our inventory turnover rates require relatively low investment in inventories. Additionally, ongoing cash flows from restaurant operations and gift card sales are used to service debt obligations and for capital expenditures.
Financial Condition as of December 31, 2012
Current assets decreased to $487.8 million at December 31, 2012 as compared with $708.3 million at December 31, 2011 primarily due to a decrease in Cash and 2010, respectively. Unearned revenue is a liability that does not require cash settlement.equivalents of $220.4 million (see “—Summary of Cash Flows”).
Current liabilities increaseddecreased to $691.4 million at December 31, 2012 as compared with $956.4 million at December 31, 2011 as compared with $651.0 million at December 31, 2010 primarily due to an increasea decrease in the Current portion of long-term debt of $237.6$309.9 million as a result of the June 2012 maturity of PRP’s CMBS Loan (see “DescriptionRefinancing in March 2012 and OSI’s refinancing of Indebtedness”).the 2007 Credit Facilities in October 2012. This increasedecrease was also due topartially offset by an increase in unearnedUnearned revenue of $30.5$29.9 million as a result of the increase in third-party gift card and promotional sales.sales and the net increase in Accounts payable also increased $19.1 million driven by an acceleration of certain accounts payableand Accrued and other current liabilities of $15.2 million primarily related payments prior to the endtiming of 2010 as well as an increase in our construction in progress accrual in 2011 due to increased remodeling activitypayments at year-end.
Working capital (deficit) totaled ($203.6) million and new restaurant development.
Transactions
Effective March 14, 2012, we entered into the Sale-Leaseback Transaction with two third-party real estate institutional investors in which we sold 67 restaurant properties at fair market value for $194.9 million. We then simultaneously leased these properties back under nine master leases (collectively, the “REIT Master Leases”). The initial term of the REIT Master Leases are 20 years with four five-year renewal options. One renewal period is at a fixed rental amount and the last three renewal periods are generally based on then-current fair market values. The sale at fair market value and subsequent leaseback qualified for sale-leaseback accounting treatment, and the REIT Master Leases are classified as operating leases. We will defer the recognition of the $42.7($248.1) million gain on the sale of certain of the properties over the initial term of the lease. In accordance with the applicable accounting guidance, the 67 restaurant properties are not classified as held for sale at December 31, 2012 and 2011, since we will be leasing back the properties.respectively, and included Unearned revenue from unredeemed gift cards of $329.5 million and $299.6 million at December 31, 2012 and 2011, respectively.
Credit Facilities and Other Indebtedness
Bloomin’ Brands isWe are a holding company and conducts itsconduct our operations through itsour subsidiaries, certain of which have incurred their own indebtedness as described below.
On June 14,October 26, 2012, OSI completed a refinancing of its 2007 OSICredit Facilities and entered into senior secured credit facilitiesa Credit Agreement with a syndicate of institutional lenders and financial institutions. These senior secured credit facilitiesThe New Facilities provide for senior secured financing of up to $1.225 billion, consisting of a $1.0 billion term loan B and a $225.0 million revolving credit facility, including letter of credit and swing-line loan sub-facilities, maturing seven and five years after the closing date of the New Facilities, respectively. The term loan B was issued with an original issue discount of $10.0 million. In the fourth quarter of 2012, we incurred $13.9 million of third-party financing costs to complete this transaction of which $11.0 million has been capitalized. These deferred financing costs are primarily included in Other assets, net in our Consolidated Balance Sheet. The remaining $2.9 million of third-party financing costs were expensed as they related to debt held by lenders that participated in both the original and refinanced debt and therefore, the debt was treated as modified rather than extinguished. An additional $6.2 million of loss was recorded for the write-off of deferred financing fees associated with the 2007 Credit Facilities treated as extinguished. We recorded the total $9.1 million loss related to the extinguishment and modification of the 2007 Credit Facilities in Loss on extinguishment and modification of debt in our Consolidated Statement of Operations and Comprehensive Income during the fourth quarter of 2012.
The new senior secured term loan B matures October 26, 2019. The borrowings under this facility bear interest at rates ranging from 225 to 250 basis points over the Base Rate or 325 to 350 basis points over the Eurocurrency Rate as defined in the Credit Agreement. The Base Rate option is the highest of (i) the prime rate of Deutsche Bank Trust Company Americas, (ii) the federal funds effective rate plus 0.5 of 1.0% or (iii) the Eurocurrency Rate with a one-month interest period plus 1.0% (“Base Rate”) (3.25% at March 31, 2013 and December 31, 2012). The Eurocurrency Rate option is the 30, 60, 90 or 180-day Eurocurrency Rate (“Eurocurrency Rate”) (ranging from 0.20% to 0.44% at March 31, 2013 and 0.21% to 0.51% at December 31, 2012). The Eurocurrency Rate may have a nine- or twelve-month interest period if agreed upon by the applicable lenders. With respect to the new senior secured term loan B, the Base Rate is subject to an interest rate floor of 2.25%, and the Eurocurrency Rate is subject to an interest rate floor of 1.25%.
OSI is required to prepay outstanding term loans, subject to certain exceptions, with:
50% of its “annual excess cash flow” (with step-downs to 25% and 0% based upon its consolidated first lien net leverage ratio), as defined in the Credit Agreement, beginning with the fiscal year ending December 31, 2013 and subject to certain exceptions;
100% of the net proceeds of certain assets sales and insurance and condemnation events, subject to reinvestment rights and certain other exceptions; and
100% of the net proceeds of any debt incurred, excluding permitted debt issuances.
The New Facilities require scheduled quarterly payments on the term loan B equal to 0.25% of the original principal amount of the term loans for the first six years and three quarters commencing with the quarter ending March 31, 2013. These payments are reduced by the application of any prepayments, and any remaining balance will be paid at maturity. The outstanding balance on the term loan B was $975.0 million and $1.0 billion at March 31, 2013 and December 31, 2012, respectively. At March 31, 2013, none of the outstanding balance on the term loan B was classified as current due to voluntary prepayments of $25.0 million made by OSI during the first quarter of 2013 and the results of its projected covenant calculations, which indicate the additional term loan prepayments, as described above, will not be required. The amount of outstanding term loans required to be prepaid in accordance with OSI’s debt covenants may vary based on year-end results. At December 31, 2012, $10.0 million of the outstanding balance on the term loan B was classified as current due to OSI’s required quarterly payments.
The revolving credit facility matures October 26, 2017 and provides for swing-line loans and letters of credit of up to $225.0 million for working capital and general corporate purposes. The revolving credit facility bears interest at rates ranging from 200 to 250 basis points over the Base Rate or 300 to 350 basis points over the Eurocurrency Rate. There were no loans outstanding under the revolving credit facility at March 31, 2013 and December 31, 2012. However, $37.6 million and $41.2 million, respectively of the credit facility was committed for the issuance of letters of credit and not available for borrowing. Total outstanding letters of credit issued under OSI’s new revolving credit facility may not exceed $100.0 million. Fees for the letters of credit are 3.63% and the commitment fees for unused revolving credit commitments are 0.50%.
The New Facilities require OSI to comply with certain covenants, including, in the case of the revolving credit facility, a covenant to maintain a specified quarterly Total Net Leverage Ratio (“TNLR”) test. The TNLR is the ratio of Consolidated Total Debt to Consolidated EBITDA (earnings before interest, taxes, depreciation and amortization and certain other adjustments as defined in the Credit Agreement) and may not exceed a level set at 6.00 to 1.00 for the last day of any fiscal quarter in 2012 or 2013, with step-downs over a four-year period to a maximum level of 5.00 to 1.00 in 2017. The other negative covenants limit, but provide exceptions for, OSI’s ability and the ability of its restricted subsidiaries to take various actions relating to indebtedness, significant payments, mergers and similar transactions. The Credit Agreement also contains customary representations and warranties, affirmative covenants and events of default. At March 31, 2013 and December 31, 2012, OSI was in compliance with its debt covenants under the New Facilities.
The New Facilities are guaranteed by each of OSI’s current and future domestic 100% owned restricted subsidiaries in the Outback Steakhouse and Carrabba’s Italian Grill concepts and certain other subsidiaries (the “Guarantors”) and by OSI HoldCo, Inc., OSI’s direct owner and our indirect, wholly-owned subsidiary (“OSI HoldCo”).
OSI’s obligations are secured by substantially all of its assets and assets of the Guarantors and OSI HoldCo, in each case, now owned or later acquired, including a pledge of all of OSI’s capital stock, the capital stock of substantially all of OSI’s domestic subsidiaries and 65% of the capital stock of foreign subsidiaries that are directly owned by OSI, OSI HoldCo, or a Guarantor. OSI is also required to provide additional guarantees of the New Facilities in the future from other domestic wholly-owned restricted subsidiaries if the Consolidated EBITDA attributable to OSI’s non-guarantor domestic wholly-owned restricted subsidiaries as a group exceeds 10% of the Consolidated EBITDA of OSI and its restricted subsidiaries. If this occurs, guarantees would be required from additional domestic wholly-owned restricted subsidiaries in such number that would be sufficient to lower the aggregate Consolidated EBITDA of the non-guarantor domestic wholly-owned restricted subsidiaries as a group to an amount not in excess of 10% of the Consolidated EBITDA of OSI and its restricted subsidiaries.
IndexOn April 10, 2013, OSI completed a repricing of its senior secured term loan B facility pursuant to Financial Statements
the First Amendment to Credit Agreement, Guaranty and Security Agreement, among OSI, OSI HoldCo, Inc., the subsidiary guarantors named therein, Deutsche Bank Trust Company Americas, as administrative agent and collateral agent, and a syndicate of institutional lenders and financial institutions.The Amended Credit Agreement replaces OSI’s existing senior secured term loan B facility with the New Term Loan B. The New Term Loan B has the same principal amount outstanding (as of the repricing date) of $975.0 million, maturity date of October 26, 2019, amortization schedule and financial covenants but a lower applicable interest rate than the existing senior secured term loan B facility. Voluntary prepayments made on the principal amount outstanding since the inception of the Credit Agreement will continue to be treated as prepayments for purposes of determining amortization payment and mandatory prepayment requirements under the New Term Loan B.
The Amended Credit Agreement decreased the interest rate applicable to the New Term Loan B to 150 basis points over the Base Rate or 250 basis points over the Eurocurrency Rate and reduced the interest rate floors applicable to the New Term Loan B to 2.00% for the Base Rate and 1.00% for the Eurocurrency Rate. Prepayments or amendments of the New Term Loan B that constitute a “repricing transaction” (as defined in the Amended Credit Agreement) will be subject to a premium of 1.00% of the New Term Loan B if prepaid or amended on or prior to October 10, 2013. Prepayments and repricings made after October 10, 2013 will not be subject to premium or penalty.
Pursuant to the terms of the Credit Agreement, we were required to pay a prepayment penalty of approximately $10.0 million at closing in connection with the repricing transaction. Additional professional fees will also be recorded in the second quarter of 2013 as well as an adjustment of the deferred financing fees and unamortized debt discount based on completion of our analysis of debt extinguishment or modification treatment for the repricing. We anticipate the costs incurred in connection with the repricing, including the prepayment penalty, will range from $14.0 million to $17.0 million. As a result of the repricing, we expect to reduce annual cash interest expense by approximately $12.0 million (approximately $9.0 million in 2013), assuming a constant principal balance and interest rate environment.
Prior to the New Facilities, OSI was party to the 2007 Credit Facilities with a syndicate of institutional lenders and financial institutions, which were entered into on June 14, 2007. These senior secured credit facilities provided for senior secured financing of up to $1.6 billion, consisting of a $1.3 billion term loan facility, a $150.0 million working capital revolving credit facility, including letter of credit and swing-line loan sub-facilities, and a $100.0 million pre-funded revolving credit facility that providesprovided financing for capital expenditures only.
The senior secured term loan facility matures June 14, 2014. At each rate adjustment, OSI hashad the option to select aan Original Base Rate plus 125 basis points or aan Original Eurocurrency Rate plus 225 basis points for the borrowings under this facility. The Base Ratebase rate option iswas the higher of the prime rate of Deutsche Bank AG New York Branch and the federal funds effective rate plus 0.5 of 1% (“Original Base Rate”) (3.25% at December 31, 2011 and 2010)2011). The Eurocurrency Rateeurocurrency rate option iswas the 30, 60, 90 or 180-day eurocurrency rate (“Original Eurocurrency RateRate”) (ranging from 0.38% to 0.88% and from 0.31% to 0.50% at December 31, 2011 and 2010, respectively)2011). The Original Eurocurrency Rate may have had a nine- or twelve-month interest period if agreed upon by the applicable lenders. With either the Original Base Rate or the Original Eurocurrency Rate, the interest rate iswould have been reduced by 25 basis points if the associated Moody’s Applicable Corporate Rating then most recently published iswas B1 or higher (the rating was Caa1 at December 31, 2011 and 2010)2011).
OSI iswas required to prepay outstanding term loans, subject to certain exceptions, with:
50% of its “annual excess cash flow” (with step-downs to 25% and 0% based upon its rent-adjusted leverage ratio), as defined in the credit agreement and subject to certain exceptions;
100% of its “annual minimum free cash flow,” as defined in the credit agreement, not to exceed $75.0 million for each fiscal year, if its rent-adjusted leverage ratio exceedsexceeded a certain minimum threshold;
100% of the net proceeds of certain assets sales and insurance and condemnation events, subject to reinvestment rights and certain other exceptions; and
100% of the net proceeds of any debt incurred, excluding permitted debt issuances.
Additionally, OSI iswas required, on an annual basis, to first, repay outstanding loans under the pre-funded revolving credit facility and second, fund a capital expenditure account to the extent amounts on deposit arewere less than $100.0 million, in both cases with 100% of its “annual true cash flow,” as defined in the credit agreement. In accordance with these requirements, in April 2012, OSI is required to repayrepaid its pre-funded revolving credit facility outstanding loan balance of $33.0 million and fundfunded $37.6 million to its capital expenditure account using its “annual true cash flow.” In April 2011, OSI repaid its pre-funded revolving credit facility outstanding loan balance of $78.1 million and funded $60.5 million to its capital expenditure account.
OSI’s senior secured credit facilities require2007 Credit Facilities required scheduled quarterly payments on the term loans equal to 0.25% of the original principal amount of the term loans for the first six years and three quarters following June 14, 2007. These payments arewere reduced by the application of any prepayments, and any remaining balance will be paid at maturity.prepayments. The outstanding balance on the term loans was $1.0 billion at December 31, 2011 and 2010. OSI2011. We classified $13.1 million of itsOSI’s term loans as current at December 31, 2011 and 2010 due to itsOSI’s required quarterly payments and the results of its covenant calculations, which indicateindicated the additional term loan prepayments, as described above, willwere not be required. In October 2011, we sold our nine company-ownedCompany-owned Outback Steakhouse restaurants in Japan to a subsidiary of S Foods, Inc. and used the net cash proceeds from this sale to pay down $7.5 million of OSI’s outstanding term loans in accordance with the terms of the OSI credit agreement amended in January 2010.
Proceeds of loans and letters of credit under OSI’s $150.0 million working capital revolving credit facility provideprovided financing for working capital and general corporate purposes and, subject to a rent-adjusted leverage condition, for capital expenditures for new restaurant growth. This revolving credit facility matures June 14, 2013 and bearsbore interest at rates ranging from 100 to 150 basis points over the Original Base Rate or 200 to 250 basis points over the Original Eurocurrency Rate. There were no loans outstanding under the revolving credit facility at December 31, 2011, and 2010; however, $67.6 million and $70.3 million, respectively, of the credit facility was
Index to Financial Statements
committed for the issuance of letters of credit and not available for borrowing. OSI may have to extend additionalOSI’s total outstanding letters of credit in the future. If the need for letters of credit exceeds the $75.0 million maximum permitted by OSI’sissued under its working capital revolving credit facility OSI may havewas not permitted to use cash to fulfill its collateral requirements.exceed $75.0 million. Fees for the letters of credit rangeranged from 2.00% to 2.25% and the commitment fees for unused working capital revolving credit commitments rangeranged from 0.38% to 0.50%.
Proceeds of loans under OSI’s $100.0 million pre-funded revolving credit facility which expires on June 14, 2013, arewere available to provide financing for capital expenditures, if the capital expenditure account described above hashad a zero balance. As of December 31, 2011, and 2010, OSI had $33.0 million and $78.1 million, respectively, outstanding on its pre-funded revolving credit facility. These borrowings wereThis borrowing was recorded in “CurrentCurrent portion of long-term debt”debt in our Consolidated Balance Sheets,Sheet, as OSI iswas required to repay any outstanding borrowings in April following each fiscal year using its “annual true cash flow,” as defined in the credit agreement. At each rate adjustment, OSI hashad the option to select the Original Base Rate plus 125 basis points or aan Original Eurocurrency Rate plus 225 basis points for the borrowings under this facility. In either case, the interest rate iswas reduced by 25 basis points if the associated Moody’s Applicable Corporate Rating then most recently published is B1 or higher. Fees for the unused portion of the pre-funded revolving credit facility arewere 2.43%.
At December 31, 2011, and 2010, OSI was in compliance with its debt covenants. See “Description of Indebtedness” for further information about OSI’s debt covenants.
On June 14,covenants under the 2007 Private Restaurant Properties LLC, or PRP, our indirect wholly owned subsidiary, entered into first mortgage and mezzanine loans (together, the commercial mortgage-backed securities loan, or the “CMBS Loan”) totaling $790.0 million. As part of the CMBS Loan, the lenders had a security interest in PRP’s properties and related improvements located throughout the United States and direct and indirect equity interests in PRP.
The CMBS Loan comprised a note payable and four mezzanine notes. The CMBS Loan had a maturity date of June 9, 2011, subject to one additional one-year extension by PRP to a maximum maturity date of June 9, 2012. During 2011, PRP exercised the one-year extension.
All notes bore interest at the one-month London Interbank Offered Rate (“LIBOR”) which was 0.28% and 0.27% at December 31, 2011 and 2010, respectively, plus an applicable spread which ranges from 0.51% to 4.25%. Interest-only payments were made on the ninth calendar day of each month and interest accrued beginning on the fifteenth calendar day of the preceding month.
PRP’s CMBS Loan required it to comply with certain financial covenants, including a lease coverage ratio and a loan to value ratio as defined in the CMBS Loan agreement. The CMBS Loan also contained customary representations, warranties, affirmative covenants and events of default. Upon disposal of any location that collateralizes the CMBS Loan, PRP was required to pay the portion of the CMBS Loan principal that related to each disposed location. During the years ended December 31, 2011 and 2010, PRP did not dispose of any locations and therefore did not pay any principal on the CMBS Loan for disposed locations. At December 31, 2011 and 2010, the outstanding balance on PRP’s CMBS Loan was $775.3 million and $774.7 million, respectively.Credit Facilities.
Effective March 27, 2012, New Private Restaurant Properties, LLC and two of our other indirect wholly-owned subsidiariesPRP entered into the 2012 CMBS Loan.Loan with German American Capital Corporation and Bank of America, N.A. The 2012 CMBS Loan totalstotaled $500.0 million at origination and compriseswas comprised of a first mortgage loan in the amount of $324.8 million, collateralized by 261 of our properties, and
two mezzanine loans totaling $175.2 million. The loans have a maturity date of April 10, 2017. The first mortgage loan has five fixed rate components and a floating rate component. The fixed rate components bear interest at a rate ofrates ranging from 2.37% to 6.81% per annum. The floating rate component bears interest at a rate per annum equal to the 30-day LIBOR rateLondon Interbank Offered Rate (“LIBOR”) (with a floor of 1%) plus 2.37%. The first mezzanine loan bears interest at a rate of 9.0%9.00% per annum, and the second mezzanine loan bears interest at a rate of 11.25% per annum. The proceeds from the 2012 CMBS Loan, together with the proceeds from the Sale-Leaseback Transaction in March 2012 (see “—Liquidity
Index to Financial Statements
and Capital Resources—Transactions”) and excess cash held in PRP, were used to repay thePRP’s existing CMBS Loan. As a result of the 2012 CMBS Loan refinancing,Refinancing, the net amount repaid along with scheduled maturities within one year, $281.3 million, was classified as current at December 31, 2011. During the first quarter of 2012, we recorded a $2.9 million loss related to the extinguishment in Loss on extinguishment and modification of debt. See “Descriptiondebt in our Consolidated Statement of Indebtedness” forOperations and Comprehensive Income. We deferred $7.6 million of financing costs incurred to complete this transaction of which $2.2 million had been capitalized as of December 31, 2011 and the remainder was capitalized in the first quarter of 2012. These deferred financing costs are included in Other assets, net in our Consolidated Balance Sheets. At March 31, 2013 and December 31, 2012, the outstanding balance, excluding the debt discount, on the 2012 CMBS Loan was $491.5 million and $493.9 million, respectively.
In connection with the 2012 CMBS Loan, New PRP entered into an interest rate cap (the “Rate Cap”) as a further descriptionmethod to limit the volatility of the floating rate component of the first mortgage loan. Under the Rate Cap, if the 30-day LIBOR market rate exceeds 7.00% per annum, the counterparty must pay to New PRP such excess on the notional amount of the floating rate component. If necessary, we would record mark-to-market changes in the fair value of this derivative instrument in earnings in the period of change. The Rate Cap has a term of approximately two years from the closing of the 2012 CMBS Loan. Upon the expiration or termination of the Rate Cap or the downgrade of the credit ratings of the counterparty under the Rate Cap’s specified thresholds, New PRP is required to replace the Rate Cap with a replacement interest rate cap in a notional amount equal to the outstanding principal balance (if any) of the floating rate component.
Prior to the 2012 CMBS Loan, PRP had first mortgage and mezzanine notes (together, the CMBS Loan) totaling $790.0 million, which were entered into on June 14, 2007. As part of the CMBS Loan, German American Capital Corporation and Bank of America, N.A. et al (the “Lenders”) had a security interest in the acquired real estate and related improvements, and direct and indirect equity interests of certain of our subsidiaries. The CMBS Loan comprised a note payable and four mezzanine notes. All notes bore interest at the one-month LIBOR which was 0.28% at December 31, 2011, plus an applicable spread which ranged from 0.51% to 4.25%. Interest-only payments were made on the ninth calendar day of each month and interest accrued beginning on the fifteenth calendar day of the preceding month. At December 31, 2011, the outstanding balance on PRP’s CMBS Loan was $775.3 million. We used an interest rate cap with a notional amount of $775.7 million as a method to limit the volatility of PRP’s variable-rate CMBS Loan. During the first quarter of 2012, this interest rate cap was terminated.
On June 14, 2007, OSI issued Senior Notessenior notes in an original aggregate principal amount of $550.0 million under an indenture among OSI, as issuer, OSI Co-Issuer, Inc., as co-issuer (“Co-Issuer”), a third-party trustee and the Guarantors. The Senior Notessenior notes were scheduled to mature on June 15, 2015. Interest iswas payable semiannually in arrears, at 10% per annum, in cash on each June 15 and December 15. Interest payments to the holders of record of the Senior Notes occursenior notes occurred on the immediately preceding June 1 and December 1. Interest iswas computed on the basis of a 360-day year consisting of twelve 30-day months. The principal balance of Senior Notessenior notes outstanding at December 31, 2011 and 2010 was $248.1 million. See “Description of Indebtedness” for a further description of the Senior Notes.
We may from time to time seek to retire or purchase our outstanding debt through cash purchases in the open market, privately negotiated transactions or otherwise. Such repurchases or exchanges, if any, will depend on prevailing market conditions, our liquidity requirements, contractual restrictions and other factors. The amounts involved may be material.
During the firstthird quarter of 2009,2012, OSI purchased $240.1 million inretired the aggregate outstanding principal amount of its Senior Notes in10% senior notes through a combination of a tender offer and early redemption call. The senior notes retirement was funded using a portion of the net proceeds from our initial public offering together with cash tender offer.on hand. OSI paid $73.0an aggregate of $259.8 million forto retire the Senior Notes purchased and $6.7senior notes, which included $248.1 million in aggregate outstanding principal, $6.5 million of prepayment premium and early tender incentive fees and $5.2 million of accrued
interest. WeThe senior notes were satisfied and discharged on August 13, 2012. As a result of these transactions, we recorded a gainloss from the extinguishment of debt of $158.1$9.0 million in the line item “Gainthird quarter of 2012 in Loss on extinguishment and modification of debt”debt in our Consolidated Statement of Operations for the year ended December 31, 2009. The gain was reduced by $6.1and Comprehensive Income. This loss included $2.4 million for the pro rata portionwrite-off of unamortized deferred financing fees that related to the extinguished Senior Notes and by $3.0 million for fees related to the tender offer. The purpose of the tender offer was to reduce the principal amount of debt outstanding, reduce the related debt service obligations and improve OSI’s financial covenant position under its senior secured credit facilities.notes.
As of March 31, 2013, December 31, 20112012 and 2010,2011, OSI had approximately $9.1$7.2 million, $9.8 million and $7.6$9.1 million, respectively, of notes payable at interest rates ranging from 0.76%0.62% to 7.00%, 0.63% to 7.00% and from 1.07%0.76% to 7.00%, respectively. These notes have been primarily issued for buyouts of managing and area operating partner interests in the cash flows of their restaurants and generally are payable over a period of two through five years.
Debt Guarantees
Effective October 1, 2012, we purchased the remaining interests in our Roy’s joint venture from RY-8 for $27.4 million. This purchase price consisted of the assumption of RY-8’s $24.5 million line of credit by OSI isthat had been recorded in Guaranteed debt in our Consolidated Balance Sheet at December 31, 2011, forgiveness of $1.8 million in loans due from RY-8 to OSI and a $1.1 million cash payment. In December 2012, we paid the $24.5 million outstanding balance on the line of credit assumed from RY-8.
Prior to this acquisition, OSI was the guarantor of an uncollateralized line of credit that permitspermitted borrowing of up to $24.5 million for its joint venture partner, RY-8 in the development of Roy’s restaurants. The line of credit originally expired in December 2004 and was amended for a fourth timeset to expire on April 1, 2009 to a revised termination date of April 15, 2013. According to the terms of the line of credit agreement, RY-8 mayhad the ability to borrow, repay, re-borrow or prepay advances at any time before the termination date of the agreement. On the termination date of the agreement, the entire outstanding principal amount of the loan then outstanding and any accrued interest iswould have been due. At December 31, 2011, and 2010, the outstanding balance on the line of credit was $24.5 million.
RY-8’s obligations under the line of credit arewere unconditionally guaranteed by OSI and Roy’s Holdings, Inc. (“RHI”). If an event of default occurs,had occurred, as defined in the agreement, the total outstanding balance, including any accrued interest, iswould have been immediately due from the guarantors. At December 31, 2011, and 2010, $24.5 million of OSI’s $150.0 million working capital revolving credit facility was committed for the issuance of a letter of credit for this guarantee.
OSI is not aware of any non-compliance with the underlying terms of the borrowing agreements for which it provides a guarantee that would result in it having to perform in accordance with the terms of the guarantee.
Index to Financial Statements
Goodwill and Indefinite-Lived Intangible Assets
During the second quarter of 2011,2012, we performed our annual assessment for impairment of goodwill and other indefinite-lived intangible assets. Our review of the recoverability of goodwill was based primarily upon an analysis of the discounted cash flows of the related reporting units as compared to the carrying values. We also used the discounted cash flowrelief from royalty method to determine the fair value of our indefinite-lived intangible assets. We did not record any goodwill or indefinite-lived intangible asset impairment charges as a result of this assessment and determined that none of our reporting units are at risk for material goodwill impairment.
Fair Value Measurements
Fair value is the price that would be received upon sale of an asset or paid upon transfer of a liability in an orderly transaction between market participants at the measurement date (exit price) and is a market-based measurement, not an entity-specific measurement. To measure fair value, we incorporate assumptions that market participants would use in pricing the asset or liability, and utilize market data to the maximum extent possible. Measurement of fair value incorporates nonperformance risk (i.e., the risk that an obligation will not be fulfilled). In measuring fair value, we reflect the impact of our own credit risk on our liabilities, as well as any collateral. We also consider the credit standing of our counterparties in measuring the fair value of our assets.
We are highly leveraged and are exposed
In connection with the 2012 CMBS Loan, we entered into a Rate Cap with a notional amount of $48.7 million as a method to limit the volatility of the floating rate component of the first mortgage loan. Additionally, we used an interest rate riskcap with a notional amount of $775.7 million as a method to limit the extentvolatility of ourPRP’s variable-rate debt. CMBS Loan, which was terminated in June 2012 (see “—Credit Facilities and Other Indebtedness”). The interest rate caps had a nominal fair market value at March 31, 2013 and December 31, 2012, respectively.
In September 2007, we entered into an interest rate collar with a notional amount of $1.0 billion as a method to limit the variability of OSI’s senior secured credit facilities.2007 Credit Facilities. The collar consisted of a LIBOR cap of 5.75% and a LIBOR floor of 2.99%. The collar’s first variable-rate set date was December 31, 2007, and the option pairs expired at the end of each calendar quarter beginning March 31, 2008 and ending September 30, 2010.2010, which was the maturity date of the collar. The quarterly expiration dates corresponded to the scheduled amortization payments of OSI’s term loan. Our interest rate collar matured on September 30, 2010.loan then in effect. We expensed $19.9 million and $21.4 million of interest for the yearsyear ended December 31, 2010 and 2009, respectively, as a result of the quarterly expiration of the collar’s option pairs. We recorded mark-to-market changes in the fair value of the derivative instrument in earnings in the period of change. We included $18.5 million and $5.8 million of net interest income for the yearsyear ended December 31, 2010, and 2009, respectively, in the line item “Interest expense”Interest expense, net in our Consolidated StatementsStatement of Operations and Comprehensive Income for the mark-to-market effects of this derivative instrument.
We used an interest rate cap with a notional amount of $775.7 million as a method to limit the volatility of PRP’s variable-rate CMBS Loan. Under this interest rate cap, interest rate payments had a ceiling of 6.31%. If the market rate exceeded the ceiling, the counterparty was required to pay us an amount sufficient to reduce the interest payment to 6.31%. The interest rate cap did not have any fair market value at December 31, 2011 and 2010. If necessary, we would record mark-to-market changes in the fair value of this derivative instrument in earnings in the period of change. The effects of this interest rate cap were immaterial to our consolidated financial statements for all periods presented.
We invested $37.7 million and $51.4 million of our excess cash in money market funds classified as Cash and cash equivalents or restricted cash on our Consolidated Balance Sheet at December 31, 2011, and 2010 at a net value of 1:1 for each dollar invested. The fair value of the investment in the money market funds is determined by using quoted prices for identical assets in an active market. As a result, we have determined that the inputs used to value this investment fall within Level 1 of the fair value hierarchy.
During the year ended The amount of excess cash invested in money market funds at March 31, 2013 and December 31, 2011, we did not have any goodwill2012 was immaterial to our consolidated financial statements.
We recorded $1.1 million and other indefinite-lived intangible asset$3.9 million of impairment charges but we did incur impairment chargesas a result of the fair value measurement on a nonrecurring basis of its long-lived assets held and used during the three months ended March 31, 2013 and 2012, respectively, primarily related to certain specifically identified restaurant locations that have, or are scheduled to be, relocated, closed or are under-performing. The impaired long-lived assets had $4.4 million and $0.9 million of remaining fair value at March 31, 2013 and 2012, respectively. Restaurant closure and related expenses of $0.8 million and $0.5 million were recognized for the three months ended March 31, 2013 and 2012, respectively. Impairment losses for long-lived assets held and used and restaurant closure and related expenses were recognized in Provision for impaired assets and restaurant closings in the Consolidated Statement of Operations and Comprehensive Income.
We recorded $10.6 million, $11.6 million and $2.2 million of impairment charges as a result of the fair value measurementsmeasurement on a nonrecurring basis. basis of its long-lived assets held and used during the years ended December 31, 2012, 2011 and 2010, respectively, primarily related to certain specifically identified restaurant locations that have, or are scheduled to be, closed, relocated or renovated or are under-performing. The impaired long-lived assets had $6.2 million and $30.8 million of remaining fair value at December 31, 2012 and 2011, respectively. Restaurant closure and related expenses of $2.4 million, $2.4 million and $3.0 million were recognized for the years ended December 31, 2012, 2011 and 2010, respectively. Impairment losses for long-lived assets held and used and restaurant closure and related expenses were recognized in Provision for impaired assets and restaurant closings in the Consolidated Statement of Operations and Comprehensive Income.
We primarily used a discounted cash flow model (Level 3) and quoted prices from brokers (Level 1), third-party market appraisals (Level 2) and discounted cash flow models (Level 3) to estimate the fair value of the long-lived assets. Discount rate and growth rate assumptions are derived from current economic conditions, expectations of management and projected
Index to Financial Statements
trends of current operating results. We recorded $11.6 million of impairment charges as a result of
The following table presents quantitative information related to the unobservable inputs used in our Level 3 fair value measurement on a nonrecurring basis of our long-lived assets held and used duringmeasurements for the impairment loss incurred in the year ended December 31, 2011. The impaired long-lived assets had $30.8 million of remaining fair value at December2012 and the three months ended March 31, 2011.2013 and 2012:
| Year Ended December 31, | Three Months Ended March 31, | |||||
Unobservable Input | 2012 | 2013 | 2012 | |||
Weighted-average cost of capital (1) | 9.5% - 11.2% | 9.5% | 11.2% | |||
Long-term growth rates | 3.0% | 2.0% | 3.0% | |||
Annual revenue growth rates (2) | (8.7)% - 4.3% | 2.4% - 3.0% | (8.7)% - 3.0% | |||
| (1) | Weighted average of the costs of capital unobservable input range for the year ended December 31, 2012 was 10.8%. |
| (2) | Weighted average of the annual revenue growth rate unobservable input range for the year end December 31, 2012 and the three months ended March 31, 2013 and 2012 was 2.6%, 2.6% and 2.4%, respectively. |
Sales declines at our restaurants, unplanned increases in health insurance, commodity or labor costs, deterioration in overall economic conditions and challenges in the restaurant industry may result in future impairment charges. It is possible that changes in circumstances or changes in our judgments, assumptions and estimates could result in a future impairment charge of a portion or all of our goodwill, other intangible assets or long-lived assets held and used.
During the year ended December 31, 2010, we did not incur any goodwill and other indefinite-lived intangible asset impairment charges or any other material impairment charges as a result of fair value measurements on a nonrecurring basis.
We recorded $91.4 million of impairment charges as a result of the fair value measurement on a nonrecurring basis of our long-lived assets held and used during the year ended December 31, 2009. The impaired long-lived assets had $9.3 million of remaining fair value at December 31, 2009.
We performed a separate valuation for five of our closed restaurant sites that collateralize the CMBS Loan using quoted prices from brokers for similar properties. The restaurant sites were written down to fair value resulting in impairment charges of $7.3 million (included in the total above) during the year ended December 31, 2009. We determined that the majority of these inputs are observable inputs that fall within Level 2 of the fair value hierarchy.
Due to the third quarter of 2009 sale of our Cheeseburger in Paradise concept, we recorded a $46.0 million impairment charge (included in the total above) during the second quarter of 2009 to reduce the carrying value of this concept’s long-lived assets to their estimated fair market value. We used a weighted-average probability analysis and estimates of expected future cash flows to determine the fair value of this concept. We have determined that the majority of the inputs used to value this concept are unobservable inputs that fall within Level 3 of the fair value hierarchy.
We used a discounted cash flow model to estimate the fair value of the remaining long-lived assets held and used in the total above. Discount rate and growth rate assumptions are derived from current economic conditions, expectations of management and projected trends of current operating results. We have determined that the majority of these inputs are unobservable inputs that fall within Level 3 of the fair value hierarchy. The long-lived assets were written down to fair value, resulting in impairment charges of $38.1 million (included in the total above) during the year ended December 31, 2009.
We recorded goodwill impairment charges of $58.1 million and indefinite-lived intangible asset impairment charges of $36.0 million during the year ended December 31, 2009 as a result of our annual impairment test. We test both our goodwill and our indefinite-lived intangible assets, which are trade names, for impairment by utilizing discounted cash flow models to estimate their fair values. These cash flow models
Index to Financial Statements
involve several assumptions. Changes in our assumptions could materially impact our fair value estimates. Assumptions critical to our fair value estimates are: (i) weighted-average cost of capital rates used to derive the present value factors used in determining the fair value of the reporting units and trade names; (ii) projected annual revenue growth rates used in the reporting unit and trade name models; and (iii) projected long-term growth rates used in the derivation of terminal year values. Other assumptions include estimates of projected capital expenditures and working capital requirements. These and other assumptions are impacted by economic conditions and expectations of management and will change in the future based on period-specific facts and circumstances. As a result, we have determined that the majority of the inputs used to value our goodwill and indefinite-lived intangible assets are unobservable inputs that fall within Level 3 of the fair value hierarchy.
The following table presents the range of assumptions we used to derive our fair value estimates among our reporting units, which vary between goodwill and trade names, during the annual impairment test conducted in the second quarter of 2009:
| Assumptions | ||||||||
| Goodwill | Trade Names | |||||||
Weighted-average cost of capital | 12.5% -15.0% | 13.0% -14.0% | ||||||
Long-term growth rates | 3.0% | 3.0% | ||||||
Annual revenue growth rates | (6.9)% -12.0% | (3.9)% - 5.0% | ||||||
Stock-Based and Deferred Compensation Plans
Managing and Chef Partners
Historically, the managing partner of each company-ownedCompany-owned domestic restaurant and the chef partner of each Fleming’s Prime Steakhouse and Wine Bar and Roy’s restaurant were required, as a condition of employment, to sign a five-year employment agreement and to purchase a non-transferable ownership interest in a partnership (“Management Partnership”) that provided management and supervisory services to his or her restaurant. The purchase price for a managing partner’s ownership interest was fixed at $25,000, and the purchase price for a chef partner’s ownership interest ranged from $10,000 to $15,000. Managing and chef partners had the right to receive monthly distributions from the Management Partnership based on a percentage of their restaurant’s monthly cash flows for the duration of the agreement, which varied by concept from 6% to 10% for managing partners and 2% to 5% for chef partners. Further, managing and chef partners were eligible to participate in the Partner Equity Plan (“PEP”),PEP, a deferred compensation program, upon completion of their five-year employment agreement. Amounts credited to partners’ PEP accounts are fully vested at all times and participants have no discretion with respect to the form of benefit payments under the PEP.
In April 2011, we implemented modifications tomodified our managing and chef partner compensation structure to provide greater incentives for sales and profit growth. Under the revised program, managing and chef partners continue to sign five-year employment agreements and receive monthly distributions of the same percentage of their restaurant’s cash flow as under the prior program. However, under the revised program, in lieu of participation in the PEP, managing partners and chef partners are eligible to receive deferred compensation payments under a new Partner Ownership Account Plan (the “POA”).the POA. The POA places greater emphasis on year-over-year growth in cash flow than the PEP. Managing and chef partners will receive a greater value under the POA than they would have received under the PEP if certain levels of year-over-year cash flow growth are achieved and a lesser value than under the PEP if these levels are not achieved.
The POA requires managing and chef partners to make an initial deposit of up to $10,000 into their “Partner Investment Account,” and we will make a bookkeeping contribution to each partner’s “Company Contributions Account” no later than the end of February of each year following the completion of each year (or
partial year where applicable) under the partner’s employment agreement. The value of each of our contributions will beis equal to a percentage of the partner’s restaurant’s positive distributable cash flow plus, if the restaurant has been open at least 18 calendar months, a percentage of the year-over-year increase in the restaurant’s positive distributable cash flow in accordance withflow.
In addition to the terms described in the partner’s employment agreement.
Index to Financial Statements
The revised programPOA, our managing and chef partners are also provideseligible for an annual bonus known as the President’s Club, paid in addition to the monthly distributions of cash flow, designed to reward increases in a restaurant’s annual sales above the concept sales plan with a required flow-through percentage of the incremental sales to cash flow.flow as defined in the plan. Managing and chef partners whose restaurants achieve certain annual sales targets above the concept’s sales plan (and the required flow-through percentage) receive a bonus equal to a percentage of the incremental sales, such percentage determined by the sales target achieved.
Amounts credited to each partner’s account under the POA may be allocated by the partner among benchmark funds offered under the POA, and the account balances of the partner will increase or decrease based on the performance of the benchmark funds. Upon termination of employment, all remaining balances in the Company Contributions Account in the POA are forfeited unless the partner has been with us for twenty years or more. Unless previously forfeited under the terms of the POA, 50% of the partner’s total account balances generally will be distributed in the March following the completion of the initial five-year contract term with subsequent distributions varying based on the length of continued employment as a partner. The deferred compensation obligations under the POA are our unsecured obligations.
All managing and chef partners who execute new employment agreements after May 1, 2011 are required to participate in the newrevised partner program, including the POA. Managing and chef partners with a currentan employment agreement scheduled to expire December 1, 2011 or later had the opportunity (from April 27, 2011 through July 27, 2011) to amend their employment agreements to convert their existing partner program to participation in the new partner program, including the POA, effective June 1, 2011. As a result of this conversion, $2.7 million of our total partner deposit liability was accelerated for the return of partners’ capital that was required under the old program. As ofMarch 31, 2013 and December 31, 2012 and 2011, our POA liability was $16.8 million, $15.3 million and $8.0 million, respectively, which primarily was recorded in the line item “PartnerPartner deposits and accrued partner obligations”obligations in our Consolidated Balance Sheet.Sheets.
Upon the closing of the Merger, certain stock options that had been granted to managing and chef partners under a pre-merger managing partner stock plan (the “MP Stock Plan”) upon completion of a previous employment contract were converted into the right to receive cash in the form of a “Supplemental PEP” contribution. Additionally, all outstanding, unvested partner employment grants
As of restricted stockMarch 31, 2013, our total vested liability with respect to obligations primarily under the MP Stock Plan were converted into the rightPEP and Supplemental PEP was approximately $127.6 million, of which $18.6 million and $109.0 million was included in Accrued and other current liabilities and Other long-term liabilities, net, respectively, in our Consolidated Balance Sheet. As of December 31, 2012, our total vested liability with respect to receive cash on a deferred basis. Additionally, certain members of management were given the option to either convert some or all of their restricted stock grantedobligations primarily under the pre-merger stock planPEP and Supplemental PEP was approximately $122.6 million, of which $17.8 million and $104.8 million was included in the same manner as managing partners or convert some or all of it into restricted stock of Kangaroo Holdings, now known as Bloomin’ Brands. Grants of restricted stock under the pre-merger stock plan that converted into the right to receive cash are referred to as “Restricted Stock Contributions.”
Accrued and other current liabilities and Other long-term liabilities, net, respectively, in our Consolidated Balance Sheet. As of December 31, 2011, our total vested liability with respect to obligations primarily under the PEP and Supplemental PEP and Restricted Stock Contributions was approximately $107.8 million, of which $11.8 million and $96.0 million was included in the line items “AccruedAccrued and other current liabilities”liabilities and “OtherOther long-term liabilities,” net, respectively, in our Consolidated Balance Sheet. As of December 31, 2010, our total vested liability with respect to obligations primarily under the PEP, Supplemental PEP and Restricted Stock Contributions was approximately $101.4 million, of which $14.0 million and $87.5 million was included in the line items “Accrued and other current liabilities” and “Other long-term liabilities,” respectively, in our Consolidated Balance Sheet. Partners and management may allocate the contributions into benchmark investment funds, and these amounts due to participants will fluctuate according to the performance of their allocated investments and may differ materially from the initial contribution and current obligation.
Prior to the Merger, certain partners participating in the PEP were to receive common stock (“Partner Shares”) upon completionAs of their employment contract. Upon closing of the Merger, these partners were entitled to receive a deferred payment of cash instead of common stock upon completion of their current employment term. Partners will not receive the deferred cash payment if they resign or are terminated for cause prior to completing their current employment terms. There will not be any future earnings or losses on these amounts prior to payment to the partners. The amount accrued for the Partner Shares obligation was approximately $0.7
Index to Financial Statements
million as ofMarch 31, 2013 and December 31, 20112012 and was included in the line item “Accrued and other current liabilities” in our Consolidated Balance Sheet. The amount accrued for the Partner Shares obligation was approximately $6.6 million as of December 31, 2010, of which $6.5 million and $0.1 million was included in the line items “Accrued and other current liabilities” and “Other long-term liabilities,” respectively, in our Consolidated Balance Sheet.
As of December 31, 2011, and 2010, we had approximately $56.9$69.2 million, $67.8 million and $58.0$56.9 million, respectively, in various corporate ownedcorporate-owned life insurance policies and at December 31, 2011, another $0.3 million and $1.0 million, respectively, of restricted cash, both of which are held within an irrevocable grantor or “rabbi” trust account for settlement of our obligations primarily under the PEP, Supplemental PEP Restricted Stock Contributions and POA. We are the sole owner of any assets within the rabbi trust and participants are considered our general creditors with respect to assets within the rabbi trust.
As of March 31, 2013 and December 31, 20112012 and 2010,2011, there were $55.6$73.8 million, $65.1 million and $49.0$55.6 million, respectively, of unfunded obligations primarily related to the PEP, Supplemental PEP Restricted Stock Contributions, Partner Shares liabilities and POA, excluding amounts not yet contributed to the partners’ investment funds, which may require the use of cash resources in the future.
We require the use of capital to fund the PEP and the POA as each managing and chef partner earns a contribution, and currently estimate funding requirements ranging from $21.0$17.0 million to $23.0$19.0 million for PEP and from $4.0$6.0 million to $6.0$8.0 million for POA in each of the next two years through DecemberMarch 31, 2013.2015. Actual funding of the current PEP and POA obligations and future funding requirements may vary significantly depending on timing of partner contracts, forfeiture rates and numbers of partner participants and may differ materially from estimates.
Area Operating Partners
AreaHistorically, an area operating partners arepartner was required, as a condition of employment and within 30 days of the opening of his or her first restaurant, to make an initial investment of $50,000 in the Management Partnership that provides supervisory services to the restaurants that the area operating partner oversees. This interest givesgave the area operating partner the right to distributions from the Management Partnership based on a percentage of his or her restaurants’ monthly cash flows for the duration of the agreement, typically ranging from 4% to 9%. We have the option to purchase an area operating partner’s interest in the Management Partnership after the restaurant has been open for a five-year period on the terms specified in the agreement.
For restaurants opened on or afterbetween January 1, 2007 and December 31, 2011, the area operating partner’s percentage of cash distributions and buyout percentage is calculated based on the associated restaurant’s return on investment compared to our targeted return on investment and may rangeranges from 3.0% to 12.0%. depending on the concept. This percentage is determined after the first five full calendar quarters from the date of the associated restaurant’s opening and is adjusted each quarter thereafter based on a trailing 12-month restaurant return on investment. The buy-outbuyout percentage is the area operating partner’s average distribution percentage for the 24 months immediately preceding the buy-out.buyout. Buyouts are paid in cash within 90 days or paid over a two-year period.
In 2011, we also began a version of the President’s Club annual bonus described above under “—Managing and Chef Partners” for area operating partners to provide additional rewards for achieving sales targets with a required flow-through of the incremental sales to cash flow.flow as defined in the plan.
In April 2012, we revised our area operating partner program for restaurants opened on or after January 1, 2012. For these restaurants, an area operating partner is required, as a condition of employment, to make a deposit of $10,000 within thirty days of the opening of each new restaurant that he or she oversees, up to a maximum deposit of $50,000 (taking into account investments under prior programs). This deposit gives the area operating partner the right to monthly payments based on a percentage of his or her restaurants’ monthly cash flows for the time period that the area operating parter oversees the restaurant, typically ranging from 4.0% to 4.5%. After the restaurant has been open for a five-year period, the area operating partner will receive a bonus equal to a multiple of the area operating partner’s average monthly payments for the 24 months immediately preceding the bonus date. The bonus will be paid within 90 days or over a two-year period, depending on the bonus amount.
Highly Compensated Employees
We provide a deferred compensation plan for our highly compensated employees who are not eligible to participate in the OSI Restaurant Partners, LLC Salaried Employees 401(k) Plan and Trust. The deferred compensation plan allows these employees to contribute from 5% to 90% of their base salary and up to 100% of their cash bonus on a pre-taxpretax basis to an investment account consisting of various investment fund options. We
Index to Financial Statements
do not currently intend to provide any matching or profit-sharing contributions, and participants are fully vested in their deferrals and their related returns. Participants are considered unsecured general creditors in the event of our bankruptcy or insolvency.
Income Taxes
Deferred income tax assets and liabilities are recognized for the future tax consequences attributable to differences between the financial statement carrying amounts of existing assets and liabilities and their respective tax basis. Deferred income tax assets and liabilities are measured using enacted tax rates expected to apply to taxable income in the years in which those temporary differences are expected to be recovered or settled. The effect on deferred income tax assets and liabilities of a change in the tax rate is recognized in income in the period that includes the enactment date of the rate change. We recorded a valuation allowance to reduce our deferred income tax assets to the amount that is more likely than not to be realized. We have considered future taxable income and ongoing feasible tax planning strategies in assessing the need for the valuation allowance.
Should we determine that we would be able to realize our remaining deferred income tax assets in the foreseeable future, a release of all, or part, of the related valuation allowance could cause an immediate material increase to income in the period such determination is made. Significant management judgment is required in determining the period in which the reversal of a valuation allowance should occur. We consider all available evidence, both positive and negative, such as historical levels of income and future forecasts of taxable income among other items in determining whether a full or partial release of a valuation allowance is required. In addition, our assessments sometimes require us to schedule future taxable income in accordance with the applicable tax accounting guidance to assess the appropriateness of a valuation allowance which further requires the exercise of significant management judgment. Such release of the valuation allowance could occur within the next nine to 12 months upon resolution of the aforementioned uncertainties.
Any release of valuation allowance will be recorded as a tax benefit increasing net income or as an adjustment to paid-in capital. We expect that a significant portion of the release of the valuation allowance will be recorded as an income tax benefit at the time of release, significantly increasing our reported net income. Because we expect our recorded tax rate to increase in subsequent periods following a significant release of the valuation allowance, our net income will be negatively affected in periods following the release.
As of March 31, 2013 and December 31, 2011,2012, we had $482.1$217.5 million and $261.7 million, respectively, in cash and cash equivalents (excluding restricted cash of $24.3 million)$19.0 million and $20.1 million, respectively), of which approximately $82.2$92.7 million and $92.9 million, respectively, was held by foreign affiliates, a portion of which would be subject to additional taxes if repatriated to the United States. Based on domestic cash and working capital projections within domestic tax jurisdictions, we believe we will generate sufficient cash flows from our United States operations to meet our future debt repayment requirements, anticipated working capital needs and planned capital expenditures, in the United States, as well as all of our other domestic business needs.needs in the United States.
A provision for income taxes has not been recorded for any United States or additional foreign taxes on undistributed earnings related to our foreign affiliates as these earnings were and are expected to continue to be permanently reinvested. If we identify an exception to our general reinvestment policy of undistributed earnings, additional taxes will be posted. It is not practical to determine the amount of unrecognized deferred income tax liabilities on the undistributed earnings. The international jurisdictions in which we operate do not have any known restrictions that would prohibit the repatriation of cash and cash equivalents.
We are currently under examination by the IRS for the years ended December 31, 2009 through 2011. At this time, we do not believe that the outcome of any examination will have a material impact on our results of operations or financial position.
Dividends
PaymentWe did not declare or pay any dividends on our common stock during 2011, 2012 or the first quarter of dividends by OSI to Bloomin’ Brands is prohibited under OSI’s credit agreements, except for certain limited circumstances.
2013. Our boardBoard of directorsDirectors does not intend to pay regular dividends on our common stock after the offering.stock. However, we expect to reevaluate our dividend policy on a regular basis following the offering and may, subject to compliance with the covenants contained in ourOSI’s senior secured credit facilityfacilities and other considerations, determine to pay dividends in the future.
Our ability to pay dividends is dependent on our ability to obtain funds from our subsidiaries. Payment of dividends by OSI to Bloomin’ Brands is restricted under OSI’s senior secured credit facilities to dividends for the purpose of paying Bloomin’ Brands’ franchise and income taxes and ordinary course operating expenses; dividends for certain other limited purposes; and other dividends subject to an aggregate cap over the term of the agreement.
Other Material Commitments
Our contractual obligations, debt obligations commitments and debt guaranteescommitments as of December 31, 20112012 are summarized in the table below (in thousands):
| Payments Due By Period | ||||||||||||||||||||
| Total | Less Than 1 Year | 1-3 Years | 3-5 Years | More Than 5 Years | ||||||||||||||||
Contractual Obligations | ||||||||||||||||||||
Long-term debt (including current portion) (1) | $ | 2,084,790 | $ | 332,905 | $ | 1,025,357 | $ | 270,746 | $ | 455,782 | ||||||||||
Interest (2) | 309,580 | 82,169 | 148,525 | 71,667 | 7,219 | |||||||||||||||
Operating leases (3) | 503,379 | 106,258 | 179,945 | 110,046 | 107,130 | |||||||||||||||
Purchase obligations (4) | 430,069 | 365,680 | 51,809 | 12,580 | — | |||||||||||||||
Partner deposits and accrued partner obligations (5) | 113,725 | 15,044 | 52,659 | 12,669 | 33,353 | |||||||||||||||
Other long-term liabilities (6) | 153,840 | — | 49,202 | 54,615 | 50,023 | |||||||||||||||
Other current liabilities (7) | 41,383 | 41,383 | — | — | — | |||||||||||||||
|
|
|
|
|
|
|
|
|
| |||||||||||
Total contractual obligations | $ | 3,636,766 | $ | 943,439 | $ | 1,507,497 | $ | 532,323 | $ | 653,507 | ||||||||||
|
|
|
|
|
|
|
|
|
| |||||||||||
Debt Guarantees | ||||||||||||||||||||
Maximum availability of debt guarantees | $ | 25,957 | $ | — | $ | 24,500 | $ | — | $ | 1,457 | ||||||||||
Amount outstanding under debt guarantees | 25,957 | — | 24,500 | — | 1,457 | |||||||||||||||
Carrying amount of liabilities | 24,500 | — | 24,500 | — | — | |||||||||||||||
Index to Financial Statements
| Payments Due By Period | ||||||||||||||||||||
| Total | Less Than 1 Year | 1-3 Years | 3-5 Years | More Than 5 Years | ||||||||||||||||
Contractual Obligations | ||||||||||||||||||||
Long-term debt (including current portion) | $ | 1,508,230 | $ | 25,604 | $ | 45,241 | $ | 485,010 | $ | 952,375 | ||||||||||
Interest (1) | 449,501 | 79,948 | 157,169 | 131,598 | 80,786 | |||||||||||||||
Operating leases (2) | 873,615 | 128,855 | 213,328 | 140,966 | 390,466 | |||||||||||||||
Purchase obligations (3) | 320,291 | 279,876 | 37,168 | 3,247 | — | |||||||||||||||
Partner deposits and accrued partner obligations (4) | 100,533 | 14,771 | 37,716 | 15,932 | 32,114 | |||||||||||||||
Other long-term liabilities (5) | 166,230 | — | 68,956 | 40,628 | 56,646 | |||||||||||||||
Other current liabilities (6) | 38,044 | 38,044 | — | — | — | |||||||||||||||
|
|
|
|
|
|
|
|
|
| |||||||||||
Total contractual obligations | $ | 3,456,444 | $ | 567,098 | $ | 559,578 | $ | 817,381 | $ | 1,512,387 | ||||||||||
|
|
|
|
|
|
|
|
|
| |||||||||||
| (1) |
| Includes |
| Total minimum lease payments have not been reduced by minimum sublease rentals of |
| We have minimum purchase commitments with various vendors through |
| Timing of payments of partner deposits and accrued partner obligations are estimates only and may vary significantly in amounts and timing of settlement based on employee turnover, return of deposits to us in accordance with employee agreements and changes to buyout values of employee partners. |
| Other long-term liabilities include but are not limited to: long-term |
| Other current liabilities include the current portion of amounts owed to managing and chef partners for various compensation programs, the current portion of insurance accruals, the current portion of the liability for unrecognized tax benefits and the accrued interest and penalties related to uncertain tax |
Critical Accounting Policies and Estimates
Our discussion and analysis of our financial condition and results of operations are based upon our consolidated financial statements, which have been prepared in accordance with accounting principles generally accepted in the United States of America.U.S. GAAP. The preparation of these accompanying consolidated financial
Index to Financial Statements
statements requires us to make estimates and judgments that affect the reported amounts of assets, liabilities, revenues and expenses, and related disclosure of contingent assets and liabilities during the reporting period. We base our estimates on historical experience and on various other assumptions that are believed to be reasonable under the circumstances, the results of which form the basis for making judgments about the carrying value of assets and liabilities that are not readily apparent from other sources. Actual results may differ from these estimates under different assumptions or conditions. We consider an accounting estimate to be critical if it requires assumptions to be made and changes in these assumptions could have a material impact on our consolidated financial condition or results of operations.
Property, Fixtures and Equipment
Property, fixtures and equipment are stated at cost, net of accumulated depreciation. Depreciation is computed on the straight-line method over the estimated useful lives of the assets. Improvements to leased properties are depreciated over the shorter of their useful life or the lease term, which includes renewal periods that are reasonably assured. The useful lives of the assets are based upon our expectations for the period of time that the asset will be used to generate revenues. We periodically review the assets for changes in circumstances, which may impact their useful lives.
Buildings and building improvements | 20 to 30 years | |||
Furniture and fixtures | 5 to 7 years | |||
Equipment | 2 to 7 years | |||
Leasehold improvements | 5 to 20 years | |||
Capitalized software | 3 to 5 years |
We capitalize direct and indirect internal costs clearly associated with the acquisition, development, design and construction of Company-owned restaurant locations as these costs will provide us a future benefit. Internal costs of $2.3 million and $2.4 million were capitalized during the three months ended March 31, 2013 and year ended December 31, 2012, respectively. Internal costs incurred for the years ended December 31, 2011 and 2010 were not material to our consolidated financial statements.
Our accounting policies regarding property, fixtures and equipment include certain management judgments and projections regarding the estimated useful lives of these assets, the residual values to which the assets are depreciated or amortized, the determination of expected lease terms and the determination of what
constitutes increasing the value and useful life of existing assets. These estimates, judgments and projections may produce materially different amounts of depreciation and amortization expense than would be reported if different assumptions were used.
Operating Leases
Rent expense for our operating leases, which generally have escalating rentals over the term of the lease and may include potential rent holidays, is recorded on a straight-line basis over the initial lease term and those renewal periods that are reasonably assured. The initial lease term includes the “build-out” period of our leases, which is typically before rent payments are due under the terms of the lease. The difference between rent expense and rent paid is recorded as deferred rent and is included in the Consolidated Balance Sheets. Payments received from landlords as incentives for leasehold improvements are recorded as deferred rent and are amortized on a straight-line basis over the term of the lease as a reduction of rent expense. Lease termination fees, if any, and future obligated lease payments for closed locations are recorded as an expense in the period they are incurred. Exit-related lease obligations of $0.8 million and $1.1 million are recorded in “Accrued and other current liabilities” and $0.4 million and $0.4 million are recorded in “Other long-term liabilities” in our Consolidated Balance Sheets as of December 31, 2011 and 2010, respectively. Assets and liabilities resulting from the Merger relating to favorable and unfavorable lease amounts are amortized on a straight-line basis to rent expense over the remaining lease term.
Impairment or Disposal of Long-Lived Assets
We assess the potential impairment of definite lived intangibles, including trademarks, franchise agreements and net favorable leases, and other long-lived assets whenever events or changes in circumstances indicate that the carrying value may not be recoverable. In evaluating long-lived restaurant assets for impairment, we consider a number of factors relevant to the assets’ current market value and future ability to generate cash flows.
Index to Financial Statements
If these factors indicate that we should review the carrying value of the restaurant’s long-lived assets, we perform a two-step impairment analysis. Each of our restaurants is evaluated individually for impairment since that is the lowest level at which identifiable cash flows can be measured independently from cash flows of other asset groups. If the total future undiscounted cash flows expected to be generated by the assets are less than the carrying amount, as prescribed by step one testing, recoverability is measured in step two by comparing fair value of the asset to its carrying amount. Should the carrying amount exceed the asset’s estimated fair value, an impairment loss is charged to earnings. Restaurant fair value is determined based on estimates of discounted future cash flows; and impairment charges primarily occur as a result of the carrying value of a restaurant’s assets exceeding its estimated fair market value, primarily due to anticipated closures or declining future cash flows from lower projected future sales at existing locations.
The companyWe incurred total long-lived asset impairment charges and restaurant closing expense of $1.9 million and $4.4 million for the three months ended March 31, 2013 and 2012, respectively, and $13.0 million, $14.0 million $5.2 million and $95.4$5.2 million for the years ended December 31, 2012, 2011 2010 and 2009,2010, respectively (see “—Results of Operations—Costs and Expenses—Provision for Impaired Assets and Restaurant Closings”). All impairment charges are recorded in the line item “ProvisionProvision for impaired assets and restaurant closings”closings in our Consolidated Statements of Operations.Operations and Comprehensive Income.
Our judgments and estimates related to the expected useful lives of long-lived assets are affected by factors such as changes in economic conditions, operating performance and expected use. As we assess the ongoing expected cash flows and carrying amounts of our long-lived assets, these factors could cause us to realize a material impairment charge.
Restaurant sites and certain other assets to be sold are included in assets held for sale when certain criteria are met, including the requirement that the likelihood of selling the assets within one year is probable. For assets that meet the held for sale criteria, we separately evaluate whether the assets also meet the requirements to be reported as discontinued operations. If we no longer had any significant continuing involvement with respect
to the operations of the assets and cash flows were discontinued, we would classify the assets and related results of operations as discontinued. Assets whose sale is not probable within one year remain in property, fixtures and equipment until their sale is probable within one year. We had $0.7 million, $2.4 million and $1.3 million of assets held for sale as of March 31, 2013, December 31, 2012 and 2011, and did not have anyrespectively, recorded in Other current assets, classified as held for sale as of December 31, 2010.net.
Generally, restaurant closure costs are expensed as incurred. When it is probable that we will cease using the property rights under a non-cancelable operating lease, we record a liability for the net present value of any remaining lease obligations net of estimated sublease income that can reasonably be obtained for the property. The associated expense is recorded in “ProvisionProvision for impaired assets and restaurant closings.” Any subsequent adjustments to the liability from changes in estimates are recorded in the period incurred.
Goodwill and Indefinite-Lived Intangible Assets
Our indefinite-lived intangible assets consist only of goodwill and our trade names. Goodwill represents the residual after allocation of the purchase price to the individual fair values and carryover basis of assets acquired. On an annual basis (during the second quarter of the fiscal year) or whenever events or changes in circumstances indicate that the carrying amounts may not be recoverable, we review the recoverability of goodwill and indefinite-lived intangible assets. The impairment test for goodwill involves comparing the fair value of the reporting units to their carrying amounts. If the carrying amount of a reporting unit exceeds its fair value, a second step is required to measure a goodwill impairment loss, if any. This step revalues all assets and liabilities of the reporting unit to their current fair values and then compares the implied fair value of the reporting unit’s goodwill to the carrying amount of that goodwill. If the carrying amount of the reporting unit’s goodwill exceeds the implied fair value of the goodwill, an impairment loss is recognized in an amount equal to the excess. The impairment test for trade names involves comparing the fair value of the trade name, as determined through a discounted cash flow approach,relief from royalty method, to its carrying value.
Index to Financial Statements
We test both our goodwill and our trade names for impairment primarily by utilizing discounted cash flow models to estimate their fair values. These cash flow models involve several assumptions. Changes in our assumptions could materially impact our fair value estimates. Assumptions critical to our fair value estimates are: (i) weighted-average cost of capital rates used to derive the present value factors used in determining the fair value of the reporting units and trade names; (ii) projected annual revenue growth rates used in the reporting unit and trade name models; and (iii) projected long-term growth rates used in the derivation of terminal year values. Other assumptions include estimates of projected capital expenditures and working capital requirements. These and other assumptions are impacted by economic conditions and expectations of management and will change in the future based on period-specific facts and circumstances.
We performed our annual impairment test in the second quarter of 20112012 and determined at that time that none of our fourfive reporting units with remaining goodwill were at risk for material goodwill impairment since the fair value of each reporting unit was substantially in excess of its carrying amount. We did not record any goodwill or indefinite-lived intangible asset impairment charges during the years ended December 31, 2012, 2011 and 2010. As a result of our annual impairment test in the second quarter of 2009, we recorded goodwill and indefinite-lived intangible asset impairment charges of $58.1 million and $36.0 million, respectively.
Sales declines at our restaurants, unplanned increases in health insurance, commodity or labor costs, deterioration in overall economic conditions and challenges in the restaurant industry may result in future impairment charges. It is possible that changes in circumstances or changes in our judgments, assumptions and estimates could result in an impairment charge of a portion or all of our goodwill or other intangible assets.
Revenue Recognition
We record food and beverage revenues upon sale. Initial and developmental franchise fees are recognized as income once we have substantially performed all of our material obligations under the franchise
agreement, which is generally upon the opening of the franchised restaurant. Continuing royalties, which are a percentage of net sales of the franchisee, are recognized as income when earned. Franchise-related revenues are included in Other revenues in our Consolidated Statements of Operations and Comprehensive Income.
We defer revenue for gift cards, which do not have expiration dates, until redemption by the customer. We also recognize gift card “breakage” revenue for gift cards when the likelihood of redemption by the customer is remote, which we determined are those gift cards issued on or before three years prior to the balance sheet date. We recorded breakage revenue of $13.3 million, $11.1 million and $11.0 million for the years ended December 31, 2012, 2011 and 2010, respectively. Breakage revenue is recorded as a component of Restaurant sales in our Consolidated Statements of Operations and Comprehensive Income.
Gift cards sold at a discount are recorded as revenue upon redemption of the associated gift cards at an amount net of the related discount. Gift card sales commissions paid to third-party providers are initially capitalized and subsequently recognized as Other restaurant operating expenses in our Consolidated Statements of Operations and Comprehensive Income upon redemption of the associated gift card. Deferred expenses are $10.9 million and $9.7 million as of December 31, 2012 and 2011, respectively, and are reflected in Other current assets, net in our Consolidated Balance Sheets. Gift card sales that are accompanied by a bonus gift card to be used by the customer at a future visit result in a separate deferral of a portion of the original gift card sale. Revenue is recorded when the bonus card is redeemed at a value based on the estimated fair market value of the bonus card.
We collect and remit sales, food and beverage, alcoholic beverage and hospitality taxes on transactions with customers and report such amounts under the net method in our Consolidated Statements of Operations and Comprehensive Income. Accordingly, these taxes are not included in gross revenue.
Insurance Reserves
We self-insure or maintain a deductible for a significant portion of expected losses under our workers’ compensation, general liability/liquor liability, health, property and propertymanagement liability insurance programs. We purchase insurance for individual claims that exceed the amounts listed in the following table:
| 2011 | 2012 | |||||||
Workers’ Compensation | $ | 1,500,000 | $ | 1,500,000 | ||||
General Liability | 1,500,000 | 1,500,000 | ||||||
Health (1) | 400,000 | 400,000 | ||||||
Property Coverage (2) | 2,500,000 / 500,000 | 2,500,000 / 500,000 | ||||||
Employment Practices Liability | 2,000,000 | 2,000,000 | ||||||
Directors’ and Officers’ Liability | 250,000 | 250,000 | ||||||
Fiduciary Liability | 25,000 | 25,000 | ||||||
| 2013 | 2012 | |||||||
Workers’ compensation | $ | 1,000,000 | $ | 1,500,000 | ||||
General liability / Liquor liability | 1,500,000 / 2,500,000 | 1,500,000 / 1,500,000 | ||||||
Health (1) | 400,000 | 400,000 | ||||||
Property coverage (2) | 500,000 / 2,500,000 | 500,000 / 2,500,000 | ||||||
Employment practices liability | 2,000,000 | 2,000,000 | ||||||
Directors’ and officers’ liability (3) | 1,000,000 | 1,000,000 | ||||||
Fiduciary liability | 25,000 | 25,000 | ||||||
| (1) | We are self-insured for all |
| (2) | We have a $0.5 million deductible per occurrence for those properties that collateralize |
| (3) | Retention increase in 2012 from $0.3 million was effective with our initial public offering on August 8, 2012. |
We record a liability for all unresolved claims and for an estimate of incurred but not reported claims at the anticipated cost to us. In establishing our reserves, we consider certain actuarial assumptions and judgments regarding economic conditions, the frequency and severity of claims and claim development history and settlement practices. Unanticipated changes in these factors or future adjustments to these estimates may produce materially different amounts of expense that would be reported under these programs. Reserves recorded for worker’sworkers’ compensation and general liability/liquor liability claims are discounted using the average of the 1-yearone-year and 5-yearfive-year risk free rate of monetary assets that have comparable maturities. When recovery for an insurance policy is considered probable, a receivable is recorded.
Index to Financial Statements
Revenue Recognition
We record food and beverage revenues upon sale. Initial and developmental franchise fees are recognized as income once we have substantially performed all of our material obligations under the franchise agreement, which is generally upon the opening of the franchised restaurant. Continuing royalties, which are a percentage of net sales of the franchisee, are recognized as income when earned. Franchise-related revenues are included in the line “Other revenues” in our Consolidated Statements of Operations.
We defer revenue for gift cards, which do not have expiration dates, until redemption by the customer. We also recognize gift card “breakage” revenue for gift cards when the likelihood of redemption by the customer is remote, which we determined are those gift cards issued on or before three years prior to the balance sheet date. We recorded breakage revenue of $11.1 million, $11.0 million and $9.3 million for the years ended December 31, 2011, 2010 and 2009, respectively. Breakage revenue is recorded as a component of “Restaurant sales” in our Consolidated Statements of Operations.
Gift cards sold at a discount are recorded as revenue upon redemption of the associated gift cards at an amount net of the related discount. Gift card sales commissions paid to third-party providers are initially capitalized and subsequently recognized as “Other restaurant operating” expenses upon redemption of the associated gift card. Deferred expenses are $9.7 million and $8.1 million as of December 31, 2011 and 2010, respectively, and are reflected in “Other current assets” in our Consolidated Balance Sheets. Gift card sales that are accompanied by a bonus gift card to be used by the customer at a future visit result in a separate deferral of a portion of the original gift card sale. Revenue is recorded when the bonus card is redeemed at a value based on the estimated fair market value of the bonus card.
We collect and remit sales, food and beverage, alcoholic beverage and hospitality taxes on transactions with customers and report such amounts under the net method in our Consolidated Statements of Operations. Accordingly, these taxes are not included in gross revenue.
Employee Partner Payments and Buyouts
The managing partner of each company-ownedCompany-owned domestic restaurant and the chef partner of each Fleming’s Prime Steakhouse and Wine Bar and Roy’s company-ownedCompany-owned domestic restaurant, as well as area operating partners, generally receive distributions or payments for providing management and supervisory services to their restaurants based on a percentage of their associated restaurants’ monthly cash flows. The expense associated with the monthly payments for managing and chef partners is included in “LaborLabor and other related”related expenses, and the expense associated with the monthly payments for area operating partners is included in “GeneralGeneral and administrative”administrative expenses in our Consolidated Statements of Operations.Operations and Comprehensive Income.
We estimate future area operating partner bonuses and purchases of area operating partners’ interests, as well as deferred compensation obligations to managing and chef partners, using current and historical information on restaurant performance and record the partner obligations in the line item “PartnerPartner deposits and accrued partner obligations”obligations in our Consolidated Balance Sheets. In the period we pay an area operating partner bonus or purchase the area operating partner’s interests, an adjustment is recorded to recognize any remaining expense associated with the bonus or purchase and reduce the related accrued buyout liability. Deferred compensation expenses for managing and chef partners are included in “LaborLabor and other related”related expenses and bonus and buyout expenses for area operating partners are included in “GeneralGeneral and administrative”administrative expenses in our Consolidated Statements of Operations.Operations and Comprehensive Income.
Stock-Based Compensation
OurUpon completion of our initial public offering, we adopted the 2012 Equity Plan, and no further awards will be made under our 2007 Equity IncentivePlan. The 2012 Equity Plan (the “Equity Plan”) permits the grant of stock options, andstock appreciation rights, restricted stock, restricted stock units, performance awards and other stock-based awards to our management and other key employees. We account for our stock-based employee compensation using a fair value basedvalue-based method of accounting.
Index to Financial Statements
Generally,Under the 2007 Equity Plan, stock options generally vest and become nominally exercisable in 20% increments over a period of five years contingent on continued employee service. Shares acquired upon the exercise of stock options under the 2007 Equity Plan arewere generally subject to a stockholder’s agreement that containscontained a management call option that allowsallowed us to repurchase all shares purchased through exercise of stock options upon termination of employment at any time prior to the earlier of an initial public offering or a change of control. If an employee’s termination of employment is a result of death or disability, by us other than for cause or by the employee for good reason, we may repurchase exercised stock under this call option at fair market value. If an employee’s termination of employment is by us for cause or by the employee without good reason, we may repurchase the stock under this call provision for the lesser of the exercise price or fair market value. Additionally, the holder of shares acquired upon the exercise of stock options is prohibited from transferring the shares to any person, subject to narrow exceptions, and should a permitted transfer occur, the transferred shares remain subject to the management call option. As a result of thecertain transfer restrictions and the management call option, we dodid not record compensation expense for these stock options upon vestingthat contained the call option since employees cannotwere not able to realize monetary benefit from the options or any shares acquired upon the exercise of the options unless the employee iswas employed at the time of an initial public offering or change of control. There have not been any exercisesThe management call option automatically terminated upon completion of the initial public offering. Under the 2012 Equity Plan, stock options by anygenerally vest and become exercisable in 25% increments over a period of four years on the grant anniversary date contingent on continued employee toservice. Stock options have an exercisable life of no more than ten years from the date and all stock options of terminated employees with a call provision have been forfeited.grant.
We use the Black-Scholes option pricing model to estimate the weighted-average grant date fair value of stock options granted. Expected volatilities are based on historical volatilities of the stock of comparable companies. The expected term of options granted represents the period of time that options granted are expected to be outstanding. The risk-free rate for periods within the contractual life of the option is based on the U.S. Treasury yield curve in effect at the time of grant. Results may vary depending on the assumptions applied within the model.
Restricted stock shares vest on the grant anniversary date at a rate of 33.3% per year for those issued to directors and 25% per year for all other issuances. Restricted stock vesting is dependent upon continued service with forfeiture of all unvested restricted stock shares upon termination, unless in the case of death or disability, in which case all restricted stock shares are immediately vested. Restricted stock awards are issued and measured at market value on the date of grant.
The benefits of tax deductions in excess of recognized compensation cost, if any, are reported as a financing cash flow.
We recorded compensation expense of $2.2$4.0 million and $20.1 million for the three months ended March 31, 2013 and the year ended December 31, 20112012, respectively, for vested stock options not subject to the call option described above.options. As of March 31, 2013 and December 31, 2011,2012, there is $5.7was $28.0 million and $22.6 million, respectively, of total unrecognized compensation expense related to non-vested stock options, not subject to the call option described above, which is expected to be recognized over a weighted-average period of approximately 3.7 years.2.7 years and 2.8 years, respectively.
Compensation expense related to restricted stock awards for the three months ended March 31, 2013 and the year ended December 31, 2011 is $1.72012 was $0.4 million and $1.4 million, respectively, and unrecognized pre-taxpretax compensation expense related to non-vested restricted stock awards iswas approximately $0.8$9.9 million and $3.7 million at March 31, 2013 and December 31, 20112012, respectively, and will be recognized over a weighted-average period of 0.5approximately 3.4 years.
Income Taxes
In determining net income for financial statement purposes, we make certain estimates and judgments in the calculation of tax expense and the resulting tax liabilities as well as in the recoverability of deferred tax assets that arise from temporary differences between the tax and financial statement recognition of revenue and expense.
Deferred income tax assets and liabilities are recognized for the future tax consequences attributable to differences between the financial statement carrying amounts of existing assets and liabilities and their respective tax basis. Deferred income tax assets and liabilities are measured using enacted tax rates expected to apply to taxable income in the years in which those temporary differences are expected to be recovered or settled. The effect on deferred income tax assets and liabilities of a change in the tax rate is recognized in income in the period that includes the enactment date of the rate change. We recorded a valuation allowance to reduce our deferred income tax assets to the amount that is more likely than not to be realized. We have considered future taxable income and ongoing feasible tax planning strategies in assessing the need for the valuation allowance.
Index to Financial Statements
Judgments made regarding future taxable income may change due to changes in market conditions, changes in tax laws or other factors. If the assumptions and estimates change in the future, the valuation allowance established may be increased or decreased, resulting in a respective increase or decrease in income tax expense.
We use an estimate of our annual effective tax rate at each interim period based on the facts and circumstances available at that time while the actual effective tax rate is calculated at year-end.
As our net income increases, we expect our effective income tax rate to increase due to the benefit of U.S. income tax credits becoming a smaller percentage of net income and the fact that the substantial majority of our earnings are generated in the U.S., where we have higher statutory rates. At December 31, 2012, we had a valuation allowance against deferred income tax assets recorded of $72.5 million, of which $67.7 million was for U.S. deferred income tax assets. We have reviewed and will continue to review our conclusions about the appropriate amount of our deferred income tax asset valuation allowance in light of circumstances existing in future periods. To the extent we continue to generate pretax income in the U.S. in fiscal 2013 at a sufficient level, then, absent other factors indicating a contrary conclusion, we will consider a potential reversal of the U.S. related valuation allowance within the next nine to 12 months. Should we reverse the valuation allowance, a discrete tax benefit ranging from $40.0 million to $50.0 million related to the valuation allowance recorded at December 31, 2012 could be realized. Any release of valuation allowance will be recorded as a tax benefit increasing net income or as an adjustment to paid-in capital. Such reversal will impact our quarterly and annual effective income tax rates and could result in an overall income tax benefit in the period of release. We expect to continue to generate significant U.S. income tax credits, which combined with the mix of U.S. and foreign earnings in periods subsequent to the reversal will result in an effective income tax rate that is lower than the blended federal and state statutory rate.
Recently Issued Financial Accounting Standards
In May 2011, the Financial Accounting Standards Board (the “FASB”) issued Accounting Standards Update (“ASU”) No. 2011-04, “Fair Value Measurement (Topic 820): Amendments to Achieve Common Fair Value Measurement and Disclosure Requirements in U.S. GAAP and IFRSs,” (“ASU No. 2011-04”) that establishes a number of new requirements for fair value measurements. These include: (i) a prohibition on grouping financial instruments for purposes of determining fair value, except when an entity manages market and credit risks on the basis of the entity’s net exposure to the group; (ii) an extension of the prohibition against the use of a blockage factor to all fair value measurements (that prohibition currently applies only to financial instruments with quoted prices in active markets); and (iii) a requirement that for recurring Level 3 fair value measurements, entities disclose quantitative information about unobservable inputs, a description of the valuation process used and qualitative details about the sensitivity of the measurements. Additionally, for items not carried at fair value but for which fair value is disclosed, entities will be required to disclose the level within the fair value hierarchy that applies to the fair value measurement disclosed. ASU No. 2011-04 is effective for interim and annual periods beginning after December 15, 2011. While the provisions of ASU No. 2011-04 will increase our fair value disclosures, this guidance will not have an impact on our financial position, results of operations or cash flows.
In June 2011,March 2013, the FASB issued ASU No. 2011-05, “Presentation2013-05, “Foreign Currency Matters (Topic 830): Parent’s Accounting for the Cumulative Translation Adjustment upon Derecognition of Comprehensive Income”Certain Subsidiaries or Groups of Assets within a Foreign Entity or of an Investment in a Foreign Entity (a consensus of the FASB Emerging Issues Task Force)” (“ASU No. 2011-05”2013-05”), which eliminates the option to report other comprehensive income and its components in the statement of changes in equity. Instead, the new guidance requires us to present the components of net income and other comprehensive income in one continuous statement, referred to as the statement of comprehensive income, or in two separate, but consecutive statements. While the new guidance changes the presentation of comprehensive income, there are no changes to the components that are recognized in net income or other comprehensive income under current accounting guidance.. Under ASU No. 2011-05 must be applied retrospectively and is effective for public companies during the interim and annual periods beginning after December 15, 2011, with early adoption permitted. Additionally, in December 2011, the FASB issued ASU No. 2011-12, “Comprehensive Income (Topic 220): Deferral of the Effective Date for Amendments to the Presentation of Reclassifications of Items Out of Accumulated Other Comprehensive Income in Accounting Standards Update No. 2011-05” (“ASU No. 2011-12”), which indefinitely defers the requirement in ASU No. 2011-05 to present reclassification adjustments out of accumulated other comprehensive income by component in both the statement in which net income is presented and the statement in which other comprehensive income is presented. The deferral of the presentation requirements does not impact the effective date of the other requirements in ASU 2011-05. During the deferral period, the existing requirements in generally accepted accounting principles in the United States (“U.S. GAAP”) for the presentation of reclassification adjustments must continue to be followed. ASU No. 2011-12 is effective for public companies during the interim and annual periods beginning after December 15, 2011. ASU No. 2011-05 and ASU No. 2011-12 will not have an impact on our financial position, results of operations or cash flows as the guidance only requires a presentation change to comprehensive income.
In September 2011, the FASB issued ASU No. 2011-08, “Intangibles—Goodwill and Other (Topic 350)—Testing Goodwill for Impairment” (“ASU No. 2011-08”), which permits2013-05, an entity to make a qualitative assessment of whetherwould recognize cumulative translation adjustments in earnings when it is more likely than not that a reporting unit’s fair value is less than its carrying value before applying the two-step quantitative goodwill impairment test. If it is determined through the qualitative assessment that a reporting unit’s fair value is more likely than not greater than its carrying value, the
Index to Financial Statements
remaining impairment steps would be unnecessary. The qualitative assessment is optional, allowing entities to go directly to the quantitative assessment. ASU No. 2011-08 is effective for annual and interim goodwill impairment tests performed in fiscal years beginning after December 15, 2011, with early adoption permitted. This guidance will not have a material impact on our financial position, results of operations or cash flows.
In December 2011, the FASB issued ASU No. 2011-10, “Property, Plant, and Equipment (Topic 360): Derecognition of in Substance Real Estate—a Scope Clarification” (“ASU No. 2011-10”), which applies to a parent company that ceases to have a controlling financial interest in a subsidiary that isor group of assets within a consolidated foreign entity and the sale or transfer results in substance real estate,the complete or substantially complete liquidation of the foreign entity in which the subsidiary or group of assets resided. However, when an entity sells either a part or all of its investment in a consolidated foreign entity, an entity would recognize cumulative translation adjustments in earnings only if the parent no longer has a controlling financial interest in the foreign entity as a result of the sale. In the case of sales of an equity method investment that is a default on the subsidiary’s nonrecourse debt. The new guidance emphasizes that the parent should only deconsolidate the real estate subsidiary when legal titleforeign entity, a pro rata portion of cumulative translation adjustments attributable to the real estate is transferred to the lender and the related nonrecourse debt has been extinguished. If the reporting entity ceases to have a controlling financial interest under subtopic 810-10, the reporting entityequity method investment would continue to include the real estate, debt, and the resultsbe recognized in earnings upon sale of the subsidiary’s operationsequity method investment. In addition, cumulative translation adjustments would be recognized in its consolidated financial statements until legal title to the real estateearnings upon a business combination achieved in stages such as a step acquisition. ASU No. 2013-05 is transferred to legally satisfy the debt. This standard takes effecteffective for public companies during the annual and interim periodsfor fiscal years beginning on or after JuneDecember 15, 2012. The adoption of this guidance is not expected to have a material impact on our financial statements.
In December 2011, the FASB issued ASU No. 2011-11, “Balance Sheet (Topic 210) -Disclosures about Offsetting Assets and Liabilities” (“ASU 2011-11”), which enhances current disclosures about financial instruments and derivative instruments that are either offset on the statement of financial position or subject to an enforceable master netting arrangement or similar agreement, irrespective of whether they are offset on the statement of financial position. The guidance requires us to provide both net and gross information for these assets and liabilities. ASU No. 2011-11 is effective for annual reporting periods beginning on or after January 1, 2013 and interim periods within those annual periodsfiscal years, with retrospectiveearly adoption permitted. We will adopt ASU No. 2013-05 effective January 1, 2014 with prospective application required. This guidance will not have anto the derecognition of any foreign entity subsidiaries, groups of assets or investments in foreign entities completed on or after January 1, 2014. The impact of ASU No. 2013-05 on our financial position, results of operations orand cash flows as it only requires a presentation change to offsetting (netting)is dependent on future transactions resulting in derecognition of our foreign assets, and liabilities.subsidiaries or investments in foreign entities completed on or after adoption.
Impact of Inflation
In the last three years, we have not operated in a period of high general inflation; however, we have experienced material increases in specific commodity costs. Our restaurant operations are subject to federal and state minimum wage laws governing such matters as working conditions, overtime and tip credits. Significant numbers of our food service and preparation personnel are paid at rates related to the federal and/or state minimum wage and, accordingly, increases in the minimum wage have increased our labor costs in the last three years. To the extent permitted by competition and the economy, we have mitigated increased costs by increasing menu prices and may continue to do so if deemed necessary in future years.
Quantitative and Qualitative Disclosures about Market Risk
We are exposed to market risk from changes in interest rates on debt, changes in foreign currency exchange rates and changes in commodity prices.
Interest Rate Risk
At March 31, 2013, December 31, 20112012 and 2010,2011, our total debt, excluding consolidated guaranteed debt, was approximately $1.5 billion, $1.5 billion and $2.1 billion.billion, respectively. For fixed-rate debt, interest rate changes affect the fair value of debt. However, for variable-rate debt, interest rate changes generally impact our earnings and cash flows, assuming other factors are held constant. Our current exposure to interest rate fluctuations includes OSI’s borrowings under its senior secured credit facilitiesNew Facilities and the floating rate component of the first mortgage loan in New PRP’s commercial mortgage-backed securities loan2012 CMBS Loan that bear interest at floating rates based on the Eurocurrency Rate or the Base Rate and the one-month LIBOR, respectively, plus an applicable borrowing margin. We manage our interest rate risk by offsetting some of our variable-rate debt with fixed-rate debt, through normal operating and financing activities and, when deemed appropriate, through the use of derivative financial instruments.
Index to Financial Statements
We use an interest rate cap which renews annually, to limit the volatility of the floating rate component of the first mortgage loan in New PRP’s variable-rate2012 CMBS Loan. From September 2007 to September 2010, we used an interest rate collar as part of our interest rate risk management strategy to manage our exposure to interest rate movements related to OSI’s senior secured credit facilities.2007 Credit Facilities. Given the interest rate environment, we did not enter into another derivative financial instrument upon the maturity of this interest rate collar on September 30, 2010. We do not enter into financial instruments for trading or speculative purposes.
At March 31, 2013 and December 31, 2012, we had $442.8 million and $445.2 million, respectively, of fixed-rate debt outstanding, excluding the debt discount, on New PRP’s 2012 CMBS Loan, and at December 31, 2011, and 2010, we had $248.1 million of fixed-rate debt outstanding through OSI’s Senior Notessenior notes. At March 31, 2013, December 31, 2012 and 2011, we had $1.0 billion, $1.0 billion and $1.8 billion, and $1.9 billion, respectively, of aggregate variable-rate debt outstanding on OSI’s senior secured credit facilities, New PRP’s 2012 CMBS Loan and PRP’s CMBS Loan. WeAt March 31, 2013 and December 31, 2012, we also had $82.4$187.4 million and $79.7$183.8 million, respectively, in available unused borrowing capacity under OSI’s revolving credit facility (after giving effect to undrawn letters of credit of approximately $37.6 million and $41.2 million, respectively). At December 31, 2011, we had $82.4 million in available unused borrowing capacity under OSI’s working capital revolving credit facility (after giving effect to undrawn letters of credit of approximately $67.6 million and $70.3 million, respectively),million) and $67.0 million and $21.9 million, respectively, in available unused borrowing capacity under OSI’s pre-funded revolving credit facility that providesprovided financing for capital expenditures only. Based on $1.8$1.0 billion of outstanding variable-rate debt at DecemberMarch 31, 2011,2013, an increase of one percentage point on JanuaryApril 1, 2012,2013, would cause an increase to cash interest expense of approximately $18.2$10.2 million per year.
If a one percentage point increase in interest rates were to occur over the next four quarters, such an increase would result in the following additional interest expense, assuming the current borrowing level remains constant:
| Principal Outstanding at December 31, | Additional Interest Expense | |||||||||||||||||||
| Q1 | Q2 | Q3 | Q4 | |||||||||||||||||
Variable-Rate Debt | 2011 | 2012 | 2012 | 2012 | 2012 | |||||||||||||||
Senior secured term loan facility, interest rate of 2.63% at December 31, 2011 | $ | 1,014,400,000 | $ | 2,536,000 | $ | 2,536,000 | $ | 2,536,000 | $ | 2,536,000 | ||||||||||
Senior secured pre-funded revolving credit facility, interest rate of 2.63% at December 31, 2011 | 33,000,000 | 82,500 | 82,500 | 82,500 | 82,500 | |||||||||||||||
Note payable, weighted average interest rate of 0.98% at December 31, 2011 (1) | 466,319,000 | 1,165,798 | 1,165,798 | 1,165,798 | 1,165,798 | |||||||||||||||
First mezzanine note, interest rate of 3.28% at December 31, 2011 (1) | 88,900,000 | 222,250 | 222,250 | 222,250 | 222,250 | |||||||||||||||
Second mezzanine note, interest rate of 3.53% at December 31, 2011 (1) | 123,190,000 | 307,975 | 307,975 | 307,975 | 307,975 | |||||||||||||||
Third mezzanine note, interest rate of 3.54% at December 31, 2011 (1) | 49,095,000 | 122,738 | 122,738 | 122,738 | 122,738 | |||||||||||||||
Fourth mezzanine note, interest rate of 4.53% at December 31, 2011 (1) | 48,113,000 | 120,283 | 120,283 | 120,283 | 120,283 | |||||||||||||||
|
|
|
|
|
|
|
|
|
| |||||||||||
Total | $ | 1,823,017,000 | $ | 4,557,544 | $ | 4,557,544 | $ | 4,557,544 | $ | 4,557,544 | ||||||||||
|
|
|
|
|
|
|
|
|
| |||||||||||
Principal Outstanding at March 31, | Additional Interest Expense | |||||||||||||||||||
| Q2 | Q3 | Q4 | Q1 | |||||||||||||||||
Variable-Rate Debt | 2013 | 2013 | 2013 | 2013 | 2014 | |||||||||||||||
Senior secured term loan B facility, interest rate of 4.75% at March 31, 2013 (1) | $ | 975,000,000 | $ | 2,437,500 | $ | 2,437,500 | $ | 2,437,500 | $ | 2,437,500 | ||||||||||
Floating rate component of mortgage loan, interest rate of 3.99% at March 31, 2013 (2) | 48,697,000 | 121,743 | 121,743 | 121,743 | 121,743 | |||||||||||||||
|
|
|
|
|
|
|
|
|
| |||||||||||
Total | $ | 1,023,697,000 | $ | 2,559,243 | $ | 2,559,243 | $ | 2,559,243 | $ | 2,559,243 | ||||||||||
|
|
|
|
|
|
|
|
|
| |||||||||||
| (1) | Represents an obligation of OSI. As a result of the |
| (2) | Represents an obligation of New PRP. |
A change in interest rates generally does not have an impact upon our future earnings and cash flow for fixed-rate debt instruments. As fixed-rate debt matures, however, and if additional debt is acquired to fund the debt repayment, future earnings and cash flow may be affected by changes in interest rates. This effect would be realized in the periods subsequent to the periods when the debt matures.
Index to Financial Statements
Foreign Currency Exchange Rate Risk
OurWe are subject to foreign currency exchange risk has not changed materially from 2010 to 2011.for our restaurants operating in foreign countries. If foreign currency exchange rates depreciate in certain of the countries in which we operate, we may experience declines in our international operating results but such exposure would not be material to the consolidated financial statements. We currently do not use financial instruments to hedge foreign currency exchange rate changes. Our foreign currency exchange risk has not changed materially from January 1, 2012 to March 31, 2013.
Commodity Pricing Risk
Many of the ingredients used in the products sold in our restaurants are commodities that are subject to unpredictable price volatility. Although we attempt to minimize the effect of price volatility by negotiating fixed price contracts for the supply of key ingredients, there are no established fixed price markets for certain commodities such as produce and wild fish, and we are subject to prevailing market conditions when purchasing those types of commodities. Other commodities are purchased based upon negotiated price ranges established with vendors with reference to the fluctuating market prices. The related agreements may contain contractual features that limit the price paid by establishing certain price floors and caps. Extreme changes in commodity prices or long-term changes could affect our financial results adversely. We expect that in most cases increased commodity prices could be passed through to our consumers through increases in menu prices. However, if there is a time lag between the increasing commodity prices and our ability to increase menu prices, or if we believe the commodity price increase to be short in duration and we choose not to pass on the cost increases, our short-term financial results could be negatively affected. Additionally, from time to time, competitive circumstances could limit menu price flexibility, and in those cases margins would be negatively impacted by increased commodity prices.
Our restaurants are dependent upon energy to operate and are impacted by changes in energy prices, including natural gas. We utilize derivative instruments to mitigate some of our overall exposure to material increases in natural gas prices. We record mark-to-market changes in the fair value of derivative instruments in earnings in the period of change. The effects of these derivative instruments were immaterial to our financial statements for all periods presented.
In addition to the market risks identified above and to the risks discussed elsewhere in “Management’s Discussion and Analysis of Financial Condition and Results of Operations,” we are subject to business risk as our U.S. beef supply is highly dependent upon a limited number of vendors. In 2011,2012, we purchased more than 90%75% of our beef raw materials from four beef suppliers who represent approximately 75%85% of the total beef marketplace in the U.S. Due to the nature of our industry, we expect to continue to purchase a substantial amount of our beef from a small number of suppliers. If these vendors were unable to fulfill their obligations under their contracts, we could encounter supply shortages and incur higher costs to secure adequate supplies.
This market risk discussion contains forward-looking statements. Actual results may differ materially from the discussion based upon general market conditions and changes in domestic and global financial markets.
Index to Financial Statements
Our Company
We are one of the largest casual dining restaurant companies in the world, with a portfolio of leading, differentiated restaurant concepts. We own and operate 1,2481,275 restaurants and have 195203 restaurants operating under franchise or joint venture arrangements across 4948 states, Puerto Rico, Guam and 21 countries and territories.19 countries. We have five founder-inspired concepts: Outback Steakhouse, Carrabba’s Italian Grill, Bonefish Grill, Fleming’s Prime Steakhouse and Wine Bar and Roy’s. Outback Steakhouse holds the #1 U.S. market position,Each of our concepts maintains its unique, founder-inspired brand identity and Carrabba’sentrepreneurial culture to provide a compelling customer experience combining great food, highly-attentive service and Bonefish Grill hold the #2 U.S. market position, in their respective full-service restaurant categories. Fleming’s is the fourth largest finelively ambience at attractive prices. Our restaurants attract customers across a variety of occasions, including everyday dining, steakhouse brand in the U.S. celebrations and business entertainment.
In 2010, we launched a new strategic plan and operating model, leveraging beststrengthened our management team and adapted practices from the consumer products and retail industries to complement our restaurant acumen and enhance our brand competitiveness.management, analytics and innovation. This new model keeps the customer at the center of our decision-making and focuses on continuous innovation and productivity to drive sustainable sales and profit growth. We have significantly strengthened our management team and implemented initiatives to accelerate innovation, improve analytics and increase productivity. We have made these changes while preserving our entrepreneurial culture at the operating level. Our restaurant managing partners are a key element of this culture, each of whom shares in the cash flows of his or her restaurant after making a required initial cash investment.
We believe our new strategic plan and operating model have driven our recent market share gains and improved margins while providing a solid foundation for continuing sales and profit growth. In 2011, we had $3.8 billion of revenue, $100.0 million of net income and $361.5 million of Adjusted EBITDA. In the U.S., each of our four core concepts generated positive comparable restaurant sales over the last seven consecutive quarters, and in 2010 and 2011, our combined comparable restaurant sales at our core concepts grew 2.7% and 4.9%, respectively. Additionally, over the last two years, Outback Steakhouse, Carrabba’s and Bonefish Grill have significantly outperformed the Knapp-Track Casual Dining Index on traffic growth by 8.5%, 11.2% and 20.2%, respectively. Over the three years ended December 31, 2011, our net income increased from a net loss of $64.5 million to net income of $100.0 million, and Adjusted EBITDA increased from $319.9 million to $361.5 million. Over the same period, our Adjusted EBITDA margins grew from 8.9% to 9.4%.
Our concepts provide a compelling customer experience combining great food, highly attentive service and lively and contemporary ambience at attractive prices. Our restaurants attract customers across a variety of occasions, including everyday dining, celebrations and business entertainment. Each of our concepts maintains its unique, founder-inspired brand identity and entrepreneurial culture, while leveraging our scale and enhanced operating model. Below is an overview of our four core concepts:
|
Index to Financial Statements
 | ||
 | ||
| | ||
History and Evolution of Our Business
Our predecessor was incorporated in August 1987, and we opened our first Outback Steakhouse restaurant in 1988. We changed our name to Outback Steakhouse, Inc. in 1990 and became a Delaware corporation in 1991 as part of a corporate reorganization completed in connection with our predecessor’s initial public offering. Between 19941993 and 2004,2002, we grew from approximately 200 restaurants to approximately 1,175 restaurants system-wideacquired or developed our other restaurant concepts, and acquired Carrabba’s, Fleming’s, Roy’s and Bonefish Grill. Wein 1996, we began expanding the Outback Steakhouse concept internationally in 1996, and as of December 31, 2011, we had 192 restaurants across 21 countries and territories, including 111 restaurants that we owned and operated, 47 restaurants that we franchised and 34 restaurants that are operated by a joint venture.internationally. In June 2007, we were acquired by investment funds advised by our Sponsors, our Founders, and certain members of our management.
Index In August 2012, we completed an initial public offering of our common stock, however, and investor group consisting of funds advised by our Sponsors and two of our Founders continues to Financial Statements
In November 2009, we hired Elizabeth A. Smith as Chief Executive Officer. Ms. Smith brought close to 20 years of consumer products experience, including five years asbeneficially own a senior executive at Avon Products, Inc.controlling interest in our common stock and, 14 years at Kraft Foods Inc. Under Ms. Smith’s leadership, we launched our new strategic plan and operating model. The key initiatives we implemented as partupon completion of this planoffering, will continue to beneficially own a controlling interest in our common stock.
Our Restaurant Concepts
As of March 31, 2013, the 1,478 full-service restaurants in our restaurant system consisted of the following, identified by concept and model, many of which are ongoing, are summarized below:ownership structure:
| Outback Steakhouse (domestic) | Outback Steakhouse (international) | Carrabba’s Italian Grill | Bonefish Grill | Fleming’s Prime Steakhouse and Wine Bar | Roy’s | Total | ||||||||
Company-owned (1) | 663 | 117 | 234 | 174 | 65 | 22 | 1,275 | |||||||
Development joint venture | — | 41 | — | — | — | — | 41 | |||||||
Franchise | 106 | 48 | 1 | 7 | — | — | 162 | |||||||
|
|
|
|
|
|
| ||||||||
Total | 769 | 206 | 235 | 181 | 65 | 22 | 1,478 | |||||||
|
|
|
|
|
|
|
| (1) |
|
Evolved our menus by supplementing our classic items with greater varietyOur core concepts are Outback Steakhouse, Carrabba’s Italian Grill, Bonefish Grill and lighter dishes to broaden appeal. We also added lower priced items, small platesFleming’s Prime Steakhouse and handheldsWine Bar. Our Roy’s concept operated as a 50/50 joint venture until October 1, 2012, when we acquired the remaining joint venture interests.
Our restaurant concepts range in price point and enhanced bar and happy hour offerings to improve our value perception and affordability and increase traffic.
Shifted our marketing strategy awaydegree of formality from principally using brand awareness messages to traffic generating messages focused on quality, value and limited-time offers. We also enhanced the quality of our marketing and altered our media mix to improve returns on investment.
Initiated a remodel program focused on Outbackcasual (Outback Steakhouse and Carrabba’s Italian Grill) to refreshpolished casual (Bonefish Grill) and fine dining (Fleming’s Prime Steakhouse and Wine Bar and Roy’s). Polished casual seeks to deliver the restaurant base. During 2010design elements, food quality and 2011, we remodeled 256 Outback Steakhouse restaurants to implement a more contemporary design, and we are testing remodel designs at Carrabba’s.
Refocused ourknowledgeable service to improve execution on aspectssuggestive of the dining experience that matter most to our customers as indicated through ongoing customer surveys. For example, the percentage of surveyed customers that rated their overall customer satisfaction at Outback Steakhouse as “excellent” or “very good” increased by 20% from April 2009 to December 2011, and is now above the average for casualfine dining restaurants, included inexcept that the Service Management Group (SMG) customer satisfaction measurement program asatmosphere is more relaxed and the prices are lower than fine dining. We source ingredients from around the world, which we believe allows us to achieve a high degree of December 2011.
|
|
|
Index to Financial Statements
|
|
Competitive Strengths
We believefreshness and quality and maintain the following competitive strengths, when combined with our strategic plan and operating model, provide a platform to deliver sustainable sales and profit growth:
strong market position with highly recognizable brands;
compelling 360-degree customer experience;
diversified portfolio with global presence;
business model focused on continuous innovation and productivity; and
experienced executive and field management teams.
Strong Market Position With Highly Recognizable Brands
We have market leadership positions in eachauthenticity of our core concepts domestically, as well asrecipes, while keeping costs in our core international markets. Based on 2011 sales inline with the U.S., Outback Steakhouse ranked #1 in the full-service steak category, Carrabba’s ranked #2 in the full-service Italian category and Bonefish Grill ranked #2 in the full-service seafood category. Fleming’s is the fourth largest fine dining steakhouse brand in the United States. Bonefish Grill, Carrabba’s and Outback Steakhouse held three of the top seven positions for top casual dining chains in the 2011 Nation’s Restaurant News Annual Consumer Picks survey. In 2010, Outback Steakhouse ranked #1 in market share in Brazil among full-service restaurants and in South Korea among western full-service restaurant concepts. We believe our market leadership positions and scale will allow us to continue to gain market share in the fragmented restaurant industry.
Compelling 360-Degree Customer Experience
We offer a compelling 360-degree customer experience with superior value by providing great food, highly attentive service and lively ambience at attractive prices. Our strategic plan and operating model keep the customer at the center of our decision-making and use customer research and analytics to continually improve each concept’s dining experience. We believe our customer experience and value perception are differentiating factors that drive strong customer loyalty.
|
Index to Financial Statements
|
|
|
Diversified Portfolio With Global Presence
Our diversified portfolio of distinct concepts and global presence provide us with a broad growth platform to capture additional market share domestically and internationally. We are diversified by concept, category and geography as follows:
|
|
Business Model Focused on Continuous Innovation and Productivity
Our business model leverages best practices from the consumer products and retail industries to keep the customer at the center of our decision-making and focuses on innovation and productivity to drive sustainable sales and profit growth. We utilize extensive market and product research and customer feedback to develop new
Index to Financial Statements
ideas and to mitigate the risks of implementation. We reinvest a portion of productivity savings in innovation to enable us to respond to continuously evolving consumer trends.
|
|
Experienced Executive and Field Management Teams
Our organization maintains deep restaurant experience at the operating level coupled with a functional corporate support team that drives innovation, productivity and scale efficiencies. Our management team is led by our Chairman and Chief Executive Officer, Elizabeth A. Smith, former President of Avon Products, Inc., who joined us in November 2009. Ms. Smith has nearly 20 years of experience in the consumer products industry with a strong track record of growth and operating discipline. Our senior leadership team also includes executives from best-in-class consumer and retail companies such as Starbucks, YUM Brands, Mars, Kraft, Best Buy and Home Depot. We have expanded our capabilities by adding resources in R&D, human resources, consumer research and analytics, real estate development, technology, supply chain management and productivity. Strong brand management and innovation expertise has been driven by our team’s focus on analytics and customer testing.
Our field operating and management teams are made up of individuals with deep experience operating our restaurants and in the restaurant industry. Our core concept presidents have been with us for an average of 20 years and have an average of 30 years of industry experience. Our regional field management team has an average of over 13 years of experience working with us at the managing partner level or above. Our operators are highly motivated to drive growth in sales and profits through our improved compensation structure. This structure requires an initial investment from our managing partners and allows them to share in a portion of the restaurants’ monthly cash flow and an annual bonus tied to increases in their restaurant’s sales above the concept’s sales plan and long-term compensation tied to growth in their restaurants’ cash flow. We believe this structure supports our entrepreneurial culture and differentiates us from our peers.
Our Growth Strategy
We believe there are significant opportunities to continue to drive sustainable sales and profit growth through the following three strategies:
Grow Comparable Restaurant Sales
Building on the strong momentum of the business, we believe we have the following opportunities to continue to grow comparable restaurant sales:
|
Index to Financial Statements
|
|
|
|
Pursue New Domestic and International Development With Strong Unit Level Economics
We are recommitted to new unit development after curtailing expansion from 2009 to 2011. We believe that a substantial development opportunity remainstarget pricing for our concepts in the U.S. and internationally, particularly given our revitalized concepts, improved margins, expanded affordability and broadened customer appeal. Resources in site selection, construction and design were added in 2010 and 2011 in order to increase the pace of new unit openings. We expect to open 30 company-owned and five joint venture units in 2012 and increase the pace of development thereafter. We are targeting a minimum of a 15% average pre-tax return on initial investment on our new domestic restaurants. We expect that the mix of new units will be initially weighted approximately 75% to domestic opportunities, but will shift to a greater weight of international units as we continue to implement our international expansion plans.
|
We see significant opportunities to expand Carrabba’s from an existing base of 232 units as of December 31, 2011. Currently, the majority of Carrabba’s restaurants are also located in the southern and eastern U.S., with significant geographic expansion potential in the top 100 U.S. markets. We are developing an updated restaurant design for Carrabba’s, and we plan to test this model in ten to 15 units over the next two years. Based on the results of this test, we plan to accelerate new unit development.
Index to Financial Statements
|
Drive Margin Improvement
We believe that we have the opportunity to increase our margins through continued productivity and increased fixed-cost leverage as we grow comparable restaurant sales. We plan to continue to focus additional resources on productivity improvement as needed to ensure continuous progress, including the recent creation of a Chief Value Chain Officer role that will have responsibility for global supply chain management, productivity and information technology. We have developed a multi-year productivity plan that is expected to yield productivity and cost savings of approximately $50 million in 2012 and additional savings in future years and focuses on high value initiatives across the following four categories:
|
|
|
|
Index to Financial Statements
Industry Overview
According to the National Restaurant Association, U.S. restaurant industry sales were $610.4 billion in 2011. We compete primarily in the $85 billion casual dining price category of the full-service restaurant sector. This sector is expected to grow 2.9% in 2012.
| 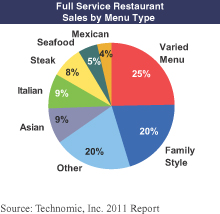 |
| 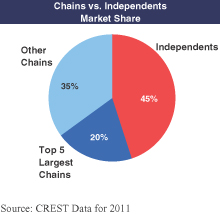 |
Our Concepts
Each of our concepts maintains its unique, founder-inspired brand identity and provides a compelling customer experience combining great food, highly attentive service and lively and contemporary ambience at attractive prices.concepts.
Outback SteakhouseSteakhouse—Domestic
Outback Steakhouse is a casual dining steakhouse featuring high quality, freshly prepared food, attentive service and Australian décor at a compelling value.cor. As of DecemberMarch 31, 2011,2013, we owned and operated 669663 restaurants and 106 restaurants were franchised across 49 states. Outback Steakhouse holds the #1 market position in the U.S. in the full-service steak restaurant category based on 2011 sales. In the 2011 Zagat’s full-service chain customer survey, Outback Steakhouse was ranked #1 in the “Best Steak” category.48 states and Puerto Rico.
The Outback Steakhouse menu offers several cuts of uniquely seasoned and seared or wood-fire grilled steaks, chops, chicken, seafood, pasta, salads and seasonal specials. We use fresh and authentic ingredients, such as USDA Choice steaks and imported Danish blue cheese, and make items such as our sauces, soups, salad dressings, and chocolate sauce from scratch. The menu also includes several specialty appetizers, including our signature “Bloomin’ Onion®,” and desserts, together with full bar service featuring Australian wine and beer. Alcoholic beverages account for approximately 12%11% of domestic Outback
Index to Financial Statements
Steakhouse’s restaurant sales. The average check per person, which varies for all of our concepts based on limited-time offers, special menu items and promotions, was approximately $20 during 2011. Outback Steakhouse also offers a low-priced children’s menu.2012.
The décor includes a contemporary, casual atmosphere with blond woods, large booths and tables and Australian artwork. Outback Steakhouse restaurants serve dinner every day of the week and most locations are open for lunch on Saturday and Sunday. Some locations are also open for lunch on Saturday.Monday through Friday.
Carrabba’s Italian Grill
Carrabba’s Italian Grill is an authentic Italian casual dining restaurant featuring high quality handcrafted dishes, an exhibition kitchen and warm Italian hospitality.a welcoming atmosphere. As of DecemberMarch 31, 2011,2013, we owned and operated 231234 restaurants and hadfranchised one franchised restaurant across 32 states. Carrabba’s holds the #2 market position in the U.S. in the full-service Italian restaurant category based on 2011 sales. In the 2011 Zagat’s full-service chain customer survey, Carrabba’s was ranked third in the “Top Food” and “Top Service” categories.
The Carrabba’s Italian Grill menu includes a variety of uniquely prepared Italian dishes, including pastas,pasta, chicken and seafood dishes and wood-fired pizza. Our use of a wood-fired grill, combined with our signature grill seasoning, produces Italian dishes with flavors we believe are unique to the category. Our ingredients are sourced from around the world, such as our Prince Edward Island mussels, our extra virgin olive oil imported from Catalonia, Spain, and our pasta imported from a small town outside Pompeii, to meet our quality specifications. We grate our fresh romano and parmesan cheese daily and prepare items such as soups, sauces, lasagna, mozzarella sticks, salad dressings and desserts, including the roasted cinnamon rum pecans that top our John Cole dessert, from scratch. The menu also includes specialty appetizers, desserts and coffees, together with full bar service featuring Italian wines and specialty drinks. Alcoholic beverages account for approximately 17%16% of Carrabba’s Italian Grill’s restaurant sales. The average check per person was approximately $21 during 2011.2012.
The décor includes dark woods, large booths and tables and Italian memorabilia featuring Carrabba family photos and authentic Italian pottery. ItsOur traditional Italian exhibition kitchen allows customers to watch hand-made dishes being prepared. The majority of Carrabba’s Italian Grill restaurants serve dinner every day of the week and the majority are open for lunch on Saturday and Sundays.Sunday. Select locations are also open for lunch Monday through Friday.
Bonefish Grill
Bonefish Grill is a polished casual seafood restaurant featuring market fresh grilled fish, high-end yet approachable service and a lively bar. Servers wear chef coats to underscore their knowledge and professionalism, and guide guests through a comfortable rather than stuffy dining experience. As of DecemberMarch 31, 2011,2013, we owned and operated 151174 and franchised seven restaurants across 2832 states. Bonefish Grill holds the #2 market position in the U.S. in the full-service seafood restaurant category based on 2011 sales. Bonefish Grill ranked “Top Overall” in 2010 and 2011 across all full-service dining chains according to Zagat’s and in 2011 was ranked #1 for all casual dining chains according to Nation’s Restaurant News. In the 2011 Zagat’s customer survey of all full-service chains, Bonefish Grill also received “Top Food” and “Top Service” rankings.
The Bonefish Grill menu is anchored by market fresh grilled fish, hand-cut and topped with freshly prepared sauces and regularly rotatingseasonal seafood specials. These selections are based on the types of seafood then available to the restaurant to ensure a fresh and flavorful meal. In addition, Bonefish Grill offers beef, pork and chicken entrees, several specialty appetizers, including our signature “Bang Bang Shrimp®,” and desserts. Bonefish Grill’s bar provides an energetic setting for drinks, dining and socializing, with large tables, music from emerging artists and a popular bar menu featuring a large variety of specialtyhand crafted cocktails, including a specialty martini list, wine and regional beer selections. Alcoholic beverages account for approximately 25%24% of Bonefish Grill’s restaurant sales. The average check per person was approximately $23 in 2011.2012.
The décor is warm and inviting, with hardwood floors, large booths and tables and distinctive artwork inspired by regional coastal settings. Bonefish Grill restaurants typically serve dinner only.only, but began serving Sunday brunch in 2012 at most locations.
Index to Financial Statements
Fleming’s Prime Steakhouse and Wine Bar
Fleming’s Prime Steakhouse and Wine Bar is an upscale, contemporary prime steakhouse for food and wine lovers seeking a stylish, lively and memorable dining experience. As of DecemberMarch 31, 2011,2013, we owned and operated 6465 Fleming’s Prime Steakhouse and Wine Bar restaurants across 28 states. Fleming’s is the fourth largest fine dining steakhouse brand in the U.S. based on 2011 sales. Fleming’s has been recognized with numerous awards for its beverage offerings, including best chain wine program in Cheers Magazine’s 2012 Beverage Excellence Awards, a 2012 VIBE Award for “innovative spirits,” and a Wine Spectator award at each of our 64 restaurants.
The Fleming’s Prime Steakhouse and Wine Bar menu features prime cuts of beef, fresh seafood, and pork, veal and chicken entrees accompanied by an extensive assortment of freshly prepared salads and side dishes available a la carte, plus several specialty appetizers and desserts. Fleming’s Prime Steakhouse and Wine Bar steak selection features USDA Prime corn-fed beef, aged up to four weeks for flavor and texture, and a selection of sizes and cuts, all seared and broiled at 1,600 degrees to seal in the beef’s natural juices and flavors. Among national high-end steak concepts, Fleming’s Prime Steakhouse and Wine Bar offers the largest selection of wines by the glass, with 100 quality wines available, as well as specialty cocktails. Alcoholic beverages account for approximately 30% of Fleming’s Prime Steakhouse and Wine Bar’s restaurant sales. The average check per person was approximately $68$67 in 2011.2012.
The décor features an open dining room built around an exhibition kitchen and expansive bar, with lighter woods and colors with rich cherry wood accents and high ceilings. Private dining rooms are available for private gatherings or corporate functions. Fleming’s Prime Steakhouse and Wine Bar restaurants serve dinner only.
Roy’s
Roy’s isprovides an upscale dining experience that combines contemporary cooking techniques, Asian cuisine and Hawaiian hospitality.featuring Pacific Rim cuisine. As of DecemberMarch 31, 2011,2013, we owned a 50% interest in a joint venture that owned and operated 22 Roy’s restaurants located across seven states. We did not have an economic interest in nine Roy’s as of March 31, 2013, including six in Hawaii and one each in the continental United States, Japan and Guam.
The Roy’s menu offers Chef Roy Yamaguchi’s “Hawaiian Fusion” cuisine, a blend of flavorfulbold Asian spices, European sauces and Asian spiceslocal ingredients, and features a variety of fish and seafood, beef, short ribs, pork, lamb and chicken. The menu also includes several specialty appetizers and desserts. In addition to full bar service, Roy’s offers a large selection of qualityhighly rated wines. Alcoholic beverages account for approximately 27% of Roy’s restaurant sales. The average check per person was approximately $57$58 during 2011.2012.
The décor features spaciouslarge dining rooms, an expansivea lounge area, an outdoor dining patio in certain locations and Roy’s signature exhibition kitchen. Private dining rooms are available for private gatherings or corporate functions. The majority of Roy’s restaurants serve dinner only.
Outback Steakhouse—International
Outback Steakhouse International is our business unit for developing and operating Outback Steakhouse restaurants outside of the U.S. In 2011, we enhanced our international organizational structure by adding a new unit president and recruiting internal and external talent from market-leading companies with the experience we believe is needed to drive international growth. ThisWe have integrated this team is integrating into our corporate headquarters to leverage enterprise-wide capabilities, including marketing, finance, consumer research and analytics, real estate development, information technology, legal, supply chain management and productivity in order to support both company-ownedCompany-owned and franchised locations. In addition, our company-ownedCompany-owned and joint venture operations in South Korea, Hong Kong, China and Brazil have cross-functional, local management staffsstaff in place to grow and support restaurants in those locations.
Index to Financial Statements
Our international Outback Steakhouse restaurants held the #1 position in both South Korea and Brazil among casual dining restaurants in the full-service sector as of 2010 based on sales in such countries. Our other concepts currently do not operate outside of the U.S. As of DecemberMarch 31, 2011,2013, we owned and operated 111117 international Outback Steakhouse restaurants, 3441 were owned and operated through a joint venture and 4748 were operated under franchise arrangements across 2119 countries and territoriesGuam as follows:
Country/Territory | Ownership Type | Total | ||||
South Korea | Company-owned | 108 | ||||
Hong Kong | Company-owned | 8 | ||||
| Company-owned | 1 | ||||
Brazil | Joint venture | 41 | ||||
Japan | Franchise | 10 | ||||
Australia | Franchise | 6 | ||||
Mexico | Franchise | 5 | ||||
Taiwan | Franchise | 5 | ||||
Canada | Franchise | 4 | ||||
Indonesia | Franchise | 3 | ||||
Philippines | Franchise | 3 | ||||
Saudi Arabia | Franchise | 3 | ||||
| ||||||
United Arab Emirates | Franchise | 2 | ||||
Costa Rica | Franchise | 1 | ||||
Dominican Republic | Franchise | 1 | ||||
Egypt | Franchise | 1 | ||||
Guam | Franchise | 1 | ||||
Malaysia | Franchise | 1 | ||||
Singapore | Franchise | 1 | ||||
Thailand | Franchise | 1 | ||||
| ||||||
| ||||||
Total | ||||||
|
International Outback Steakhouse restaurants have substantially the same core menu items as domestic Outback Steakhouse locations, although certain side items and other menu items are local in nature. The prices that we charge in individual locations are reflective of local demographics and related local costs involved in procuring product. Most of our international locations serve lunch and dinner.
We utilize a global core menu policy to ensure consistency and quality in our menu offerings. We allow local tailoring of the menu to best address the preference of local customers in a market. Prior to the addition of an item to the core menu, we conduct extensive customer research and it is reviewed and approved by our R&D team. In
South Korea, for example, we serve “lunch box sets,” offering affordable options to busy customers seeking a quick lunch at Outback Steakhouse. Similarly, in Brazil, we offer “set pricing” lunch options that provide various price point options for our lunchtime diners.
Our international Outback Steakhouse locations are similar in the look and feel of our domestic locations, although there is more diversity in certain restaurant locations, layouts and sizes.
Financial information about geographic areas is included in this prospectus in Note 192 of our Notes to Consolidated Financial Statements.consolidated financial statements for the year ended December 31, 2012. For the risks associated with our international operations, see “Risk Factors.”
Index to Financial Statements
Restaurant DevelopmentDesign and DesignDevelopment
Site Design
We generally construct freestanding buildings on leased properties, although our leased sites are also located in strip shopping centers. Construction of a new restaurant takes approximately 90 to 180 days from the date the location is leased or under contract and fully permitted. In the future, we intend to either convert existing third-party leased retail space or construct new restaurants through leases in the majority of circumstances. We typically design the interior of our restaurants in-house, utilizing outside architects when necessary.
A typical Outback Steakhouse is approximately 6,200 square feet and features a dining room and a full-service liquor bar. The dining area of a typical Outback Steakhouse consists of 45 to 48 tables and seats approximately 220 people. The bar area consists of approximately ten tables and has seating capacity for approximately 54 people. Appetizers and complete dinners are served in the bar area.
Outback Steakhouse international restaurants range in size from 3,500 to 10,000 square feet and may be basement, ground level or secondupper floor locations.
A typical Carrabba’s Italian Grill is approximately 6,500 square feet and features a dining room, pasta bar seating that overlooks the exhibition kitchen and a full-service liquor bar. The dining area of a typical Carrabba’s Italian Grill consists of 40 to 45 tables and seats approximately 230 people. The liquor bar area typically includes six tables and seating capacity for approximately 60 people, and the pasta bar has seating capacity for approximately ten people. Appetizers and complete dinners are served in both the pasta bar and liquor bar areas.
A typical Bonefish Grill is approximately 5,500 square feet and features a dining room and full-service liquor bar. The dining area of a typical Bonefish Grill consists of approximately 38 tables and seats approximately 145 people. The bar area is generally in the front of the restaurant and offers community-style seating with approximately ten tables and bar seating with a capacity for approximately 72 people. Appetizers and complete dinners are served in the bar area.
A typical Fleming’s Prime Steakhouse and Wine Bar is approximately 7,100 square feet and features a dining room, a private dining area, an exhibition kitchen and full-service liquor bar. The main dining area of a typical Fleming’s Prime Steakhouse and Wine Bar consists of approximately 35 tables and seats approximately 170 people, while the private dining area seats approximately 30 additional people. The bar area includes approximately six tables and bar seating with a capacity for approximately 35 people. Appetizers and complete dinners are served in the bar area.
A typical Roy’s is approximately 7,100 square feet and features a dining room, a private dining area, an exhibition kitchen and full-service liquor bar. The main dining area of a typical Roy’s consists of approximately 41 tables and seats approximately 155 people, while the private dining area seats an additional 50 people. The bar area includes tables and bar seating with a capacity for approximately 35 people. Appetizers and complete dinners are served in the bar area.
Remodel, / Renovation Planand Relocation Plans
We are committed to the strategy of continuing to maintain relevance with our décor by implementing an ongoing renovation program across all of our concepts.
In 2009, we began a remodeling program at Outback Steakhouse to refresh our restaurants base and modernize the look and feel of the dining experience. The Outback Steakhouse décor now features larger, more comfortable waiting areas, a brighter more upscale bar and a natural, contemporary dining area. To date, weWe have remodeled 256421 restaurants since the beginning of the remodeling program through March 31, 2013, including 194150 in 2011.2012 and 15 in the first quarter of 2013. We plan to complete 160approximately 80 remodels in 2012 and2013 for a cumulative total of approximately 450more than 485 remodels by the end of 2013. Going forward, we expect to remodel approximately 10% of our locations annually. Our average remodel cost has beenper restaurant was approximately $250,000, and$225,000 in 2010 and 2011 the program has lifted our traffic growth by approximately 3%, relative to comparable non-remodeled locations.
Index to Financial Statements
Carrabba’s Italian Grill is currently implementing a similar renovation program, which includes the creation of a more contemporary Italian-themed décor that maintains warmthits welcoming atmosphere and matches the high quality of our food. We are currently testingrecently finalized the new design alternatives,format and once testing is complete,expect to remodel between 50 and 60 locations in 2013.
In addition, in April 2013, we accelerated our restaurant relocation plan primarily related to the designOutback Steakhouse brand. This multi-year relocation plan will begin with approximately 10 to 20 restaurants in 2013, of which some will not be rolled outcompleted until 2014, and would result in additional expenses in the range of $4.0 million to additional locations.$8.0 million in 2013.
Site Selection Process
We consider the location of a restaurant to be critical to its long-term success and as such, we devote significant effort to the investigation and evaluation of potential sites. We have a central team serving all of our concepts comprised of real estate development, property/lease management and design and construction personnel. We have significantly increased the resources dedicated to this team since 2009, enabling the acceleration of remodels, unit additions and unit additions.relocations. Our site selection team utilizes a combination of existing field operations managers, internal development personnel and outside real estate brokers to identify and qualify potential sites. We have developed a robust analytical infrastructure, aided by site selection software we have recently acquired and customized to assist our site selection team in implementing our new restaurant growth plan. By leveraging expanded data regarding potential sites, developing success criteria and using predictive models, we are improving site selection.
We follow a phased approach to new site selection and approval, with all proposed sites reviewed and approved by the appropriate concept president, Chief Development Officer, Chief Resource Officer, Chief Financial Officer and Chief Executive Officer.
Restaurant Development
We are recommitted to new unit development after curtailing expansion from 2009 to 2011. We believe that a substantial development opportunity remains for our concepts in the U.S. and internationally. During 2012, we opened 37 new system-wide locations: 17 Bonefish Grill restaurants, four Carrabba’s Italian Grill restaurants, one Fleming’s Prime Steakhouse and Wine Bar restaurant and 15 international Outback Steakhouse restaurants comprised of five Company-owned, seven unconsolidated joint venture and three franchise locations. During the first quarter of 2013, we opened 10 new Company-owned locations: seven Bonefish Grill restaurants, one domestic Outback Steakhouse restaurant and two international Outback Steakhouse restaurants in Korea. We expect to open 30 company-ownedbetween 45 and five joint venture units55 system-wide locations in 20122013 and increase the pace thereafter. We expect that the mix of new units will be initially weighted approximately 75%60% to domestic opportunities in 2013, but will shift to a higher weight of international units as we continue to implement our international expansion plans.
Domestic Development
We believe we are well equippedwell-equipped to reaccelerateaccelerate new unit development with a disciplined approach focusing on achieving unit returns at target levels across each of our concepts. In 2012,2013, we plan to open approximately 30 locations. Bonefish Grill unit growth will continue to be our top domestic development priority in 2013, with 20 or more locations, with a primary domestic focus on opening new Bonefish Grill units.
restaurants planned. We believe we have the potential to doubleincrease the units in our Bonefish Grill concept to over time from an existing base of 158 units as of December 31, 2011.300 in the next four to six years. Currently, the majority of Bonefish Grill restaurants are located in the southern and eastern U.S., with significant geographic expansion potential in the top 100 U.S. markets. Bonefish Grill unit growth will be our top domestic development priority in 2012, with 20 or more new restaurants planned. Over the last five years, Bonefish Grill restaurants open for more than a year have averaged a pre-tax return on initial investment of greater than 20%.
We also see significant opportunities to expand Carrabba’s Italian Grill from an existing base of 232235 units as of DecemberMarch 31, 2011.2013. Currently, the majority of Carrabba’s Italian Grill restaurants are also located in the southern and eastern U.S., with significant geographic expansion potential in the top 100 U.S. markets. We are developingrecently finalized an updated restaurant design for Carrabba’s andItalian Grill, which we plan to test this modelimplement in ten to 15new units over the next two years. Based on the results of this test,in 2013. Following 2013, we plan to accelerate new unit development.
In addition, we believe that Fleming’s Prime Steakhouse and Wine Bar has existing geography fill-in and market expansion opportunities based on its current location mix.
International Development
We believe we are well-positioned to continue to expand internationally and plan to approach such growth in a disciplined, prioritized manner, leveraging existingestablished markets in South Korea, Brazil
Index to Financial Statements
and Hong Kong and Brazil while expanding in strategically selected new emerging and high growth developed markets. For 2011, themarkets, focusing on China, Mexico and South America. The system-wide sales of our international Outback Steakhouse restaurants represent 15%represented approximately 14% of our total system-wide sales.sales in 2012. We believe the international business represents a significant growth opportunity. We will continue to leverage our market position by offering our top-ranked Outback Steakhouse concept in a format adapted to local cultural preferences. For example, we believe that we can leverage existing infrastructure and expertise in the Asia-Pacific region and Latin America to grow in those areas and accelerate entry into nearby countries.
As a part of the restructuring of our international business unit, we developed a prioritized growth agenda. In the near term, we plan to focus our existing market growth in South Korea, Brazil and Hong Kong and our new market growth in China, Mexico and South America. Our company-ownedCompany-owned operations in Hong Kong and Korea, where we have over 100116 restaurants, provide operational expertise in running multi-unit operations, but also cultural insights and available talent to deploy into new Asian markets. In addition, our Outback Steakhouse International leadership team has significant experience in opening retail outlets in China that we can further leverage into our expansion efforts. As a result, during 2012, we opened our first Outback Steakhouse in Shanghai, China.
We will utilize the ownership structure and market entry strategy that best fits the need for a particular market, including company-ownedCompany-owned units, joint ventures and franchises. In markets where there is potential for a significant number of restaurants, we expect to focus on company-ownedCompany-owned and joint venture arrangements rather than franchises.
Research & Development / Innovation
In 2010, we added a company-wideCompany-wide head of R&D to our senior management team and increased the size of that team to approximately 20 people.team. We believe we have sincealso strengthened our innovation capability by establishing a focused, collaborative process and enhancing our R&D capabilities, and expanded the scope of innovation to focus on new product development, product efficiency and core menu quality. As a result, we believe we are now better able to continuously evolve our product offerings based on consumer trends and feedback and improve productivity. We have a 12-month pipeline of new consumer-driven menu and promotional items and are able to introduce items faster than we have in the past.
Our cross-functional innovation processes leverage the best practices of the consumer products industry to continuously research and enhance every dimension of the customer experience. Our innovation teams collaborate across R&D, purchasing,supply chain, operations, marketing, finance and market intelligence. Our goal is
continuous innovation of our new menu, service and marketing initiatives to improve brand relevance, productivity and competitiveness based on evolving consumer trends and direct customer feedback on our products. For example, as the direct result of extensive market and consumer research, we have added over 6085 new menu items across our concepts since 2010, including many items under 600 calories, which hashave broadened the appeal of our menus. By incorporating analytics, customer testing and customerin-store guest and operator feedback, we are able to refine and reduce the potential risks associated with these introductions or changes. For new menu items and significant product changes, we have a meaningful testing process that includes internal testing, testing at one restaurant and testing at a group of restaurants before the roll-out is staged across a concept based on the type of product change.system-wide. Throughout this process, our customers provide direct feedback on the product as well as pricing.
We also utilize our cross-functional processprocesses to develop limited-time offers with a compelling price pointpoints and attractive margins. This requires more occasion-based testing and research to validate that the special offer was valued by customers based on the occasion. For example, Outback Steakhouse has offered a recurring $14.99 steakfour-course meal promotion (the Outback 4) in 2012 and lobster promotion2013, which included a soup, salad, entree and dessert for $15.00 that haswas not only been very popular with our customers, but also meetsmet our profitability and food quality and execution efficiency objectives.
Index to Financial Statements
Strategy and Market Intelligence
Our strategy and market intelligence (SMI)(“SMI”) function was created in 2010 to identify opportunities for profitable growth based on customer research,market and consumer intelligence, and to help improve returns on the investments we make in capital and operations, through the targeted application of analytics. The following summarizes a fewOur customer feedback and testing process enables rapid assessment of how new ideas and productivity initiatives perform with customers, allowing us to make improvements before they are launched nationally. Our marketing mix models guide reallocation of our analytics initiatives usedmarketing investments to more efficient and effective programs and have prompted increased marketing investments in Bonefish Grill and Carrabba’s Italian Grill.
Our customer research techniques provide a greater perspective into customer behavior. We deploy a variety of qualitative approaches ranging from basic focus groups to techniques designed to capture deeper consumer insights based on emotional responses. On the quantitative side, we develop, execute and analyze consumer research related to menu items, restaurant design, consumer communication, brand positioning and casual dining segment health.
Information Systems
Beginning in 2010, we added significant resources that focused on building our competencies in human resources, information technology and real estate, design and construction, including the completion of standardized Point of Sale (“POS”) systems across our corporation functionscore concepts, the implementation of a Human Resources Information System (“HRIS”), uniform and concepts:
|
|
|
|
Management Information Systemscomprehensive training programs, expanded data warehousing capability, and increased resources and tools to accelerate renovations and new unit site selection.
In late 2010, we hired a new Chief Information Officer and developed a multi-year information technology strategy to further transform information technology into a growth enabling function by focusing on building infrastructure, increasing technical staff, creating a technology platform to support sales growth and enabling productivity improvements.
Beginning in 2010, we added significant resources that focused on building our competencies in human resources, information technology and real estate, design and construction, including the completion of standardized POS systems across our core concepts, the implementation of a HRIS system, uniform and comprehensive training programs, expanded data warehousing capability, and increased resources and tools to accelerate renovations and new unit site selection.
Restaurant level financial and accounting controls are handled through a point-of-sale computerthe POS system and network in each restaurant that communicates with our corporate headquarters. The POS system is also used to authorize and transmit credit card sales transactions and to manage the business and control costs, such as labor. Our company-ownedCompany-owned restaurants are connected through data centers and a portal to provide our corporate employees and regional partners with access to business information and tools that allow them to collaborate, communicate, train and share information between restaurants and the corporate office. During 2012, we expect to upgradeupgraded our wireless access points in all of our restaurants. This will provideprovided enhanced capability to pilot and roll out new mobile
technology devices within our restaurants to enhance our operational capability.
Index During 2013, we expect to Financial Statements
enhance our corporate office and restaurant information system infrastructure, such as labor optimization tools, for continued improvements to our operational capability.Advertising and Marketing
Our marketing strategy is designed to drive comparable restaurant sales growth by increasing the frequency of and occasions for visits by our current customers as well as attracting new customers.
To maintain customer interest and relevance, each concept leverages limited-time offers featuring seasonal specials, ingredients and flavors that are consistent with the concept’s offerings, but provide something new to discover on the menu. We have increased the frequency of these promotions so that Outback Steakhouse, Carrabba’s Italian Grill and Bonefish Grill generally have five to seven promotion periods each year. The nature of the message regarding these promotions has also changed to encourage prompt action, rather than just promote brand awareness, resulting in more immediate increases in traffic. For example, for the past few years, Outback Steakhouse has createdleveraged a “Back By Popular Demand” steak and lobster entree for $14.99. This offer reinforces the Thanks for Giving promotion that featured a special menu and donated a portion of the proceeds to Operation Homefront, a charity that supports members of the U.S. military and their families.high quality food at affordable prices available at Outback Steakhouse. We promoted the initiativelimited time offer through extensive television, radio, social media, public relations local marketing outreach and in-restaurant materials and celebrity support, which resulted in significant traffic and a donation of approximately $2 million for the charity.materials.
We promote our Outback Steakhouse and Carrabba’s Italian Grill restaurants through national and spot television and/or radio media and our Bonefish Grill restaurants through radio advertising. We advertise on television selectively when we have a sufficient number of restaurants in selected markets when our brands achieve sufficient penetrationa market to make the media purchase efficient (generally three to 10 restaurants in a meaningful broadcast schedule affordable.market, depending on the media cost in that market). Each of our concepts has an active public relations program and relies on word-of-mouth customer experience, site visibility, grassroots marketing in local venues, direct mail, on-line/digital advertising and billboards. We also create point-of-sale materials to communicate and promote key brand initiatives to our guests while they are dining in our restaurants. We have local marketing personnel who customize these programs to optimize them for their target market.
We also use the openings of new restaurants as an opportunity to employ a comprehensive marketing strategy. We reach out to various media outlets as well as the local community to obtain appearances on radio and television, establish relationships with local charities and gain coverage in local newspapers and magazines. The managing partner in each restaurant is the visible face of the concept and, with local involvement, reinforces our role as a concerned, active member of the community.
We have increased our use of e-marketing tools, which enable us to reach a significant number of people in a timely and targeted fashion at a fraction of the cost of traditional media. We believe that our customers are frequent internetInternet users and will explore e-applications to make dining decisions or to share dining experiences. We have set up pages and advertise on various social media and other websites.
These methods of advertising promote and maintain brand image and generate consumer awareness of new menu offerings, such as new items added to appeal to value-conscious consumers. We also strive to increase sales through excellence in execution. Our marketing strategy of enticing customers to visit frequently and also recommending our restaurants to others complements our goal of providing a compelling dining experience. Additionally, we engage in a variety of promotional activities, such as contributing goods, time and money to charitable, civic and cultural programs, in order to give back to the communities we serve and increase public awareness of our restaurants.
Index to Financial Statements
Restaurant Operations
TheWe believe the success of our restaurants depends on our service-oriented employees and consistent execution of our menu items in a well-managed restaurant.
Management and Employees
The management staff of a typical Outback Steakhouse, Carrabba’s Italian Grill or Bonefish Grill consists of one managing partner, one assistant manager and one kitchen manager. The management staff of a typical Fleming’s Prime Steakhouse and Wine Bar or Roy’s consists of one managing partner, a chef partner and two assistant managers. Each restaurant also employs approximately 5550 to 7595 hourly employees, many of whom work part-time. The managing partner of each restaurant has primary responsibility for the day-to-day operation of his or her restaurant and is required to abide by company-establishedCompany-established operating standards. Area operating partners are responsible for overseeing the operations of typically eightsix to 1514 restaurants and managing partners in a specific region.
Area Operating, Managing and Chef Partner Programs
We have established a compensation structure for our area operating, managing and chef partners that we believe encourages high quality restaurant operations, fosters long-term employee commitment and generally results in profitable restaurants.
Historically, the managing partner of each company-ownedCompany-owned domestic restaurant and the chef partner of each Fleming’s Prime Steakhouse and Wine Bar and Roy’s restaurant waswere required, as a condition of employment, to sign a five-year employment agreement and to purchase a non-transferable ownership interest in a partnership (“Management Partnership”)Partnership that provided management and supervisory services to his or her restaurant. The purchase price for a managing partner’s ownership interest was fixed at $25,000, and the purchase price for a chef partner’s ownership interest ranged from $10,000 to $15,000. Managing and chef partners had the right to receive monthly distributions from the Management Partnership based on a percentage of their restaurant’s monthly cash flows for the duration of the agreement, which varied by concept from 6% to 10% for managing partners and 2% to 5% for chef partners. Further, managing and chef partners were eligible to participate in the PEP,Partner Equity Plan (“PEP”), a deferred compensation program, upon completion of their five-year employment agreement.
In April 2011, we implemented modifications tomodified our managing and chef partner compensation structure to provide greater incentives for sales and profit growth. Under the revised program, managing and chef partners continue to sign five-year employment agreements and receive monthly distributions of the same percentage of their restaurant’s cash flow as under the prior program. However, under the revised program, in lieu of participation in the PEP, managing partners and chef partners are eligible to receive deferred compensation payments under the new POA.our Partner Ownership Account Plan (the “POA”). The POA places greater emphasis on year-over-year growth in cash flow than the PEP. Managing and chef partners will receive a greater value under the POA than they would have received under the PEP if certain levels of year-over-year cash flow growth are achieved and a lesser value than under the PEP if these levels are not achieved.
The POA requires managing and chef partners to make an initial deposit of up to $10,000 into their “PartnerPartner Investment Account,” and we will make a bookkeeping contribution to each partner’s “CompanyCompany Contributions Account”Account no later than the end of February of each year following the completion of each year (or partial year where applicable) under the partner’s employment agreement. The value of each of our contributions will beis equal to a percentage of the partner’s restaurant’s positive distributable cash flow plus, if the restaurant has been open at least 18 calendar months, a percentage of the year-over-year increase in the restaurant’s positive distributable cash flow in accordance withflow.
In addition to the terms described in the partner’s employment agreement.
The revised programPOA, our managing and chef partners are also provideseligible for an annual bonus known as the President’s Club, paid in addition to the monthly distributions of cash flow, designed to reward increases in theira restaurant’s annual sales above the concept sales plan with a required flow-through percentage of the incremental sales to cash flow.flow as defined in the plan. Managing and
Index to Financial Statements
chef partners whose restaurants achieve certain annual sales targets above the concept’s sales plan (and the required flow-through percentage) receive a bonus equal to a percentage of the incremental sales, such percentage determined by the sales target achieved.
All managing and chef partners who execute new employment agreements after May 1, 2011 are required to participate in the new partner program, including the POA. Managing and chef partners with an employment agreement scheduled to expire December 1, 2011 or later had the opportunity (from April 27, 2011 through July 27, 2011) to amend their employment agreements to convert their existing partner program to participation in the newrevised partner program, including the POA effective June 1, 2011. See(see “Liquidity and Capital Resources—Deferred Compensation Plans” included in “Management’s Discussion and Analysis of Financial Condition and Results of Operations—Liquidity and Capital Resources—Stock-Based and Deferred Compensation Plans.” As of December 3, 2011, approximately 52% of our managing and chef partners were participating in the POA.Operations”).
Many of Outback Steakhouse international restaurant managing partners enter into employment agreements and purchase participation interests in the cash distributions from the restaurants they manage. The amount and terms vary by country. This interest gives the managing partner the right to receive a percentage of his or her restaurant’s annual cash flows for the duration of the agreement. Additionally, each new unaffiliated franchisee is required to provide the same opportunity to the managing partner of each new restaurant opened by that franchisee.
AreaHistorically, an area operating partners are currentlypartner was required, as a condition of employment and within 30 days of the opening of his or her first restaurant, to make an initial investment of $50,000 in a Management Partnership within 30 days ofthat provides supervisory services to the opening of his or her first restaurant.restaurants that the area operating partner oversees. This interest givesgave the area operating partner the right to distributions from the Management Partnership based on a percentage of his or her restaurants’ monthly cash flows for the duration of the agreement, typically ranging from 4% to 9%. We have the option to purchase an area operating partner’s interest in the Management Partnership after the restaurant has been open for a five-year period on the terms specified in the agreement. For restaurants opened on or afterbetween January 1, 2007 and December 31, 2011, the area operating partner’s percentage of cash distributions and buyout percentage is calculated based on the associated restaurant’s return on investment compared to our targeted return on investment and may rangeranges from 3.0% to 12.0% depending on the concept.
In 2011, we also began a version of the President’s Club annual bonus described above for area operating partners to provide additional rewards for achieving sales targets with a required flow-through of the incremental sales to cash flow. We are evaluating additional changes toflow as defined in the compensation structure forplan.
In April 2012, we revised our area operating partners.partner program for restaurants opened on or after January 1, 2012. For these restaurants, an area operating partner is required, as a condition of employment, to make a deposit of $10,000 within 30 days of the opening of each new restaurant that he or she oversees, up to a maximum deposit of $50,000 (taking into account investments under prior programs). This deposit gives the area operating partner the right to monthly payments based on a percentage of his or her restaurants’ monthly cash flows for the time period that the area operating parter oversees the restaurant, typically ranging from 4.0% to 4.5%. After the restaurant has been open for a five-year period, the area operating partner will receive a bonus equal to a multiple of the area operating partner’s average monthly payments for the 24 months immediately preceding the bonus date. The bonus will be paid within 90 days or over a two-year period, depending on the bonus amount.
We have also improved our field operations performance evaluation and development processes since 2009. All field managing partners and area managers receive feedback on performance with consistent metrics linked to quarterly restaurant, area and concept business objectives.
By offering these types of compensation arrangements and by providing the area operating, managing and chef partners a significant interest in the success of their restaurants, we believe we are able to attract and retain experienced and highly motivated area operating, managing and chef partners.
Supervision and Training
We require our area operating partners and restaurant managing partners to have significant experience in the full-service restaurant industry. As part of our management development programs, we engage in succession planning at a total companyCompany and concept level to identify promotable personnel, with focused training programs to prepare managers for the next level of responsibility. Our current core concept presidents have been
with us for an average of 2015 years and have an average of 3029 years of industry experience. Our regional field management team has an average of over 1312 years of experience working with us at the managing partner level or above.
Index to Financial Statements
All operating partners and managing partners are required to complete a comprehensive training program that emphasizes our operating strategy, procedures and standards. Our senior management meets quarterly with our area operating partners to discuss business-related issues and to share ideas. In addition, members of senior management visit restaurants regularly to ensure that our concept, strategy and standards of quality are being adhered to in all aspects of restaurant operations.
The restaurant managing and area operating partners, together with our Presidents, Regional Vice Presidents, Senior Vice Presidents of Training and Directors of Training, are responsible for selecting and training the employees for each new restaurant. The training period for new non-management employees lasts approximately one week and is characterized by on-the-job supervision by an experienced employee. Ongoing employee training remains the responsibility of the restaurant manager. Written tests and observation in the work place are used to evaluate each employee’s performance. Special emphasis is placed on the consistency and quality of food preparation and service, which is monitored through monthly meetings between kitchen managers and management.
Service
We seek to deliver superior service to each customer at every opportunity. We offer customers prompt, friendly and efficient service, keep wait staff-to-table ratios high and staff each restaurant with experienced management teams to ensure consistent and attentive customer service. In Zagat’s customer surveyMembers of our wait staff demonstrate an attention to detail, culinary expertise and focus on execution and complete training programs specific to the concept’s menu (including the specific flavors of each dish), culture and brand positioning. They are trained to be responsive to the needs of our customers as they assist guests in 2011, Bonefish Grill and Carrabba’s were ranked first and third, respectively, for all full-service chains in the “Top Service” category.selecting menu items complementing individual preferences.
In order to better assess and improve our performance, in 2009 we began using Service Management Group (SMG)(“SMG”) to conduct an on-goingongoing satisfaction measurement program that utilizes a random invitation to participate in a web-based survey printed on 25% of our customer checks per week and provides us with benchmarking information from other restaurants. The program measures satisfaction across a wide range of experience elements, from the pace of the experience to the temperature of the food. Results are compiled and reported through a central web site at the national, regional and individual restaurant level.
Currently, 24 As of March 31, 2013, 31 casual dining restaurant concepts, including Outback Steakhouse, Carrabba’s Italian Grill and Bonefish Grill, and 11 fine dining concepts, including Fleming’s Prime Steakhouse and Wine Bar, participate in the SMG survey web methodology and contribute to the SMG average comparison measures for casual and fine dining, respectively, that we utilize in assessing our performance. The percentage of surveyed customers that rated their overall customer satisfaction at Outback Steakhouse as “excellent” or “very good” increased by 20% from April 2009 to December 2011, based onminimum sample size for our SMG customer satisfaction measurement program, which we believesurveys is attributable to the initiatives we implemented.100 customers per restaurant per month.
Food Preparation and Quality Control
We focus on using high quality ingredients in our menu items, including the grade of our beef and freshness of our seafood and vegetables, while keeping costs in line with target pricing for our concepts. Food safety is a critical priority, and we dedicate resources to ensuring that our customers enjoy safe, quality food products. We have taken various steps to mitigate food quality and safety risks and have central teams focused on this goal together with our supply chain, food safety/quality assurance and R&D teams.
We have an R&D facility located in Tampa, Florida that serves as a test kitchen and vendor product qualification site. Our supply chain organization manages internal auditors for vendor evaluations along with external third parties to inspect vendor adherence to quality, food safety and product specification on a risk based
schedule. Vendors that do not comply with quality, food safety and other specifications are not utilized until they have corrective actions in place and are re-certified for compliance. Additionally, a daily “line check” is performed by the restaurant managing partner and their key team members to inspect food prepared for that day, as well as the freshness of liquor, beverages, condiments and other perishables used for all menu items.
We also employ two outside advisory councils comprised of external subject matter experts to advise our senior management on industry trends and on quality, safety and animal considerations pertinent to our industry, such as well-being strategies and procedures.
Index to Financial Statements
Sourcing and Supply
We take a centralized approach to purchasing and supply chain management, with our corporate team serving all concepts domestically and internationally. In addition, we have dedicated supply chain management personnel at the local level in our larger international operations in Asia and South America. The supply chain management organization is responsible for all food and operating supply purchases as well as a large percentage of field and home office services. In addition, we have logistics teams dedicated to optimizing freight costs. The supply chain management organization’s mission is to utilize a combination of centralized domestic and locally-based supply to capture the efficiencies and economies of scale that come from making strategic buys, while maintaining (or improving) quality and building stronger partnerships with our key vendors.quality.
We work to address the end-to-end costs (from the source to the fork) associated with the products and goods we purchase. We utilize a “total cost of ownership” (TCO)(“TCO”) approach, which focuses on both the initial purchase price, coupled with the cost structure underlying the procurement and order fulfillment process. The TCO approach includes monitoring commodity markets and trends and seeking to execute product purchases at the most advantageous times. We develop commodity sourcing strategies for all major commodity categories based on the dynamics of each category. Those strategies include both spot purchases and long-term contracts of generally one year or less where we believe long-term contract prices are more attractive than anticipated spot prices. In addition, we limit exposure to potential risk by requiring our vendor partners to meet or exceed our quality assurance standards.
We have a national distribution program in place that includes food, beverage, and packaging goods. This program is with a custom distribution company that uses a limited number of warehouses that provide only products approved for our system.
Proteins represent about 50% of our commodity purchasing composition, with beef representing slightly over half of total purchased proteins. In 2011,2012, we purchased more than 90%75% of our beef raw materials from four beef suppliers who represent approximately 75%85% of the total beef marketplace in the U.S. Due to the nature of our industry, we expect to continue to purchase a substantial amount of our beef from a small number of suppliers. Other major commodity categories purchased include produce, dairy, bread and pasta and energy sources to operate our restaurants, such as natural gas.
Restaurant Ownership Structures
Our restaurants are predominately company-ownedCompany-owned or controlled, including through joint ventures, and otherwise operated under franchise arrangements. We generate our revenues primarily from our company-ownedCompany-owned or controlled restaurants and secondarily through ongoing royalties from our franchised restaurants and sales of franchise rights.
Company-Owned Restaurants
Company-owned or controlled restaurants include restaurants owned directly by us, by limited liability companies in which we are a member and by limited partnerships in which we are athe general partner and by joint ventures in which we are a member.partner. Our legal ownership interests in these partnershipslimited liability companies and, joint ventures as general partner, in these limited partnerships
generally range, in each case, from 50%54.5% to 90%100%. Our cash flows from these entities are limited to the relative portion of our ownership. The results of operations of company-ownedCompany-owned restaurants are included in our consolidated operating results. The portion of income or loss attributable to the other partners’ interests is eliminated in the line itemNet income attributable to noncontrolling interests in our Consolidated Statements of Operations entitled “Net income (loss) attributable to noncontrolling interests.”and Comprehensive Income.
In the future, we do not plan to utilize limited partnerships for domestic company-ownedCompany-owned restaurants. Instead, the restaurants will be wholly-owned by us and the area operating, managing and chef partners will receive their distributions of restaurant cash flow as employee compensation rather than partnership distributions.
Index to Financial Statements
With respect to Carrabba’s restaurants opened after 1994, weWe pay royalties to theon approximately 95% of our Carrabba’s foundersItalian Grill restaurants ranging from 1.0% to 1.5% of sales pursuant to agreements we entered into with the Carrabba’s Italian Grill founders.
WeHistorically, Company-owned restaurants also include theincluded restaurants owned by our Roy’s joint venture, as company-owned restaurants, and their accounts and operations are included in our consolidated financial statements included the accounts and operations of our Roy’s joint venture even though we havehad less than majority ownership. We determined we are theownership due to our status as primary beneficiary of the joint venture sinceand ability to control its significant activities. Effective October 1, 2012, we havepurchased the power to direct or cause the direction of the activities that most significantly impact the entity on a day-to-day basis, such as decisions regarding menu development, purchasing, restaurant expansion and closings and the management of employee-related processes. Additionally, we have the obligation to absorb losses or the right to receive benefits of theremaining interests in our Roy’s joint venture that could potentially be significant to the Roy’s joint venture. The majority of capital contributions made byfrom our partner in the Roy’s joint venture partner, RY-8, have been funded by loans to RY-8 from a third party, which we guarantee. The guarantee is secured by a collateral interestInc. (“RY-8”), for $27.4 million (see “Liquidity and Capital Resources—Transactions” included in RY-8’s membership interest in the joint venture. We did not have an economic interest in nine Roy’s as“Management’s Discussion and Analysis of December 31, 2011, including six in HawaiiFinancial Condition and one each in the continental United States, Japan and Guam.Results of Operations”).
Through ourthe Brazilian Joint Venture, with PGS Participacoes Ltda., we hold a 50% ownership interest in PGS Consultoria e Serviços Ltda. The Brazilian Joint Venture was formed in 1998 for the purpose of operating Outback Steakhouse franchise restaurants in Brazil. We account for the Brazilian Joint Venture under the equity method of accounting. We are responsible for 50% of the costs of new restaurants operated by the Brazilian Joint Venture, and our joint venture partner is responsible for the other 50%. and has operating control. Income and loss derived from the Brazilian Joint Venture is presented in the line item “Income from operations of unconsolidated affiliates” in our Consolidated Statements of Operations.Operations and Comprehensive Income. We do not consider restaurants owned by the Brazilian Joint Venture as “Company-owned” restaurants.
In addition, under ourconnection with the settlement agreementof litigation with T-Bird Nevada, LLC and its affiliates (collectively, “T-Bird”), which included the franchisees of 56 Outback Steakhouse restaurants in California, T-Bird has a right we refer(referred to as the Put Right,“Put Right”), which would require us to purchase for cash all of the equityownership interests in the T-Bird entities that own Outback Steakhouse restaurants and certain rights under the development agreement with T-Bird entity.T-Bird. The Put Right is non-transferable, other than under limited circumstances set forth in the Settlement Agreement. The Put Right will become exercisable by T-Bird for a one-year period beginning on the date of closing of this initial public offering.settlement agreement. The Put Right is also exercisable if we sell our Outback Steakhouse concept.by T-Bird until August 13, 2013. If the Put Right is exercised, we will pay a purchase price equal to a multiple of the T-Bird entities’ adjusted EBITDA (earnings before interest, taxes, depreciation and amortization) for the trailing 12 months, net of liabilities of the T-Bird entities. The multiple is equal to 75% of the multiple of our adjusted EBITDA reflected in our stock price in the case of an IPO or, in a sale of the Outback Steakhouse concept, 75% of the multiple of adjusted EBITDA that we are receiving in the sale.price. We have a one-time right to reject the exercise of the Put Right if the transaction would be dilutive to our consolidated earnings per share. In such event, the Put Right is extended until the first anniversary of our notice to the T-Bird entities of such rejection. If exercised, the closing of the Put Right will be the last business day of the third full calendar month immediately following the month in which notification of the exercise of the Put Right (the “Put Notice”) is given. If the weighted average closing price of our common stock during the month immediately prior to the month the closing date is to occur is more than 20% less than the closing price on the date the Put Notice is delivered, the T-Bird entities will have a one-time right to delay the closing for two months. If the closing date is delayed, the T-Bird entities multiple will be calculated based on the weighted average closing price of our common stock during the calendar month immediately prior to the month of the newly scheduled closing date. The closing of the Put Right is subject to certain conditions, including the negotiation of a transaction agreement reasonably acceptable to the parties, the absence of dissenters’ rights being exercised by the equity owners above a specified level, non-revocation by the T-Bird entities of the exercise of the Put Right and compliance with our debt agreements.
Unaffiliated Franchise Program
Our unaffiliated franchise arrangements grant third parties a license to establish and operate a restaurant using one of our concepts, our systems and our trademarks in a given area. The unaffiliated franchisee pays us for the concept ideas, strategy, marketing, operating system, training, purchasing power and brand recognition.
Franchised restaurants must be operated in compliance with eachtheir respective concept’s methods, standards and specifications, including regarding menu items, ingredients, materials, supplies, services, fixtures, furnishings, decor and signs, although the franchisee has full discretion to determine menu prices. In addition, all franchisees are required to purchase all food, ingredients, supplies and materials from approved suppliers. Our regional vice presidents regularlysemi-annually inspect franchised restaurants to confirm compliance with our requirements.
Index to Financial Statements
At DecemberMarch 31, 2011,2013, there were 106 domestic franchised Outback Steakhouse restaurants and 4748 international (including Guam) franchised Outback Steakhouse restaurants. Each domestic franchisee paid an initial franchise fee of $40,000 for each restaurant and is required to pay a continuing monthly royalty of 3.0% of gross restaurant sales and a monthly marketing administration fee of 0.5% of gross restaurant sales. Initial fees and royalties for international franchisees vary by market. Generally, each international franchisee paid an initial franchise fee of $40,000 to $200,000 for each restaurant and areis expected to pay a continuing monthly royalty of 2.0% to 4.0% of gross restaurant sales. Certain international franchisees enter into an international development agreement that requires them to pay a development fee in exchange for the right and obligation to develop and operate up to five restaurants within a defined development territory pursuant to separate franchise agreements. All domesticDomestic franchisees are required to expend an annually adjusted percentage of gross restaurant sales, up to a maximum of 3.5%, for national advertising on a monthly basis (3.0% in 2011)2012 and increased to 3.2% in 2013).
At DecemberMarch 31, 2011,2013, there was one domestic franchised Carrabba’s.Carrabba’s Italian Grill. The franchisee paid an initial franchise fee of $40,000 and pays a continuing monthly royalty of 5.75% of gross restaurant sales.
At DecemberMarch 31, 2011,2013, there were seven domestic franchised Bonefish Grills. Four of these franchisees paid an initial franchise fee of $50,000 for each restaurant and pay a continuing monthly royalty of 3.5% to 4.0% of gross restaurant sales. Three of these franchisees pay royalties up to 4.0%, depending on sales volumes. Under the terms of the franchise agreement, the franchisees are required to expend, on a monthly basis, a minimum of 2.5%1.5% of gross restaurant sales on local advertising and pay a monthly marketing administration fee of 0.5% of gross restaurant sales.
There were no unaffiliated franchises of any of our other restaurant concepts at DecemberMarch 31, 2011.2013.
Under the development agreement granted to one of the T-Bird entities, for the period ending in 2031, the T-Bird entities have the exclusive right through 2031 to develop and operate Outback Steakhouse restaurants as a franchisee in the State of California. We have agreed to waive all rights of first refusal in our franchise arrangements with the T-Bird entities in connection with a sale of all, and not less than all, of the assets, or at least 75% of the ownership of the T-Bird entities.
Competition
The restaurant industry is highly competitive with a substantial number of restaurant operators that compete directly and indirectly with us in respect to price, service, location and food quality, and there are other well-established competitors with significant financial and other resources. There is also active competition for management personnel, attractive suitable real estate sites, supplies and restaurant employees. Further, we face growing competition from the supermarket industry, with improved selections of prepared meals, and from quick service and fast casual restaurants, as a result of higher-quality food and beverage offerings. We expect intense competition to continue in all of these areas.
Industry and internal research conducted suggests that consumers consider casual dining restaurants within a given trade area when making dining decisions. As a result, an individual restaurant’s competitors will vary based on theirits trade area and will include both independent and chain restaurants. At an aggregate level, all major casual dining restaurants would be considered competitors of our concepts.
We believe our principal strategies, which include but are not limited to, the use of high quality ingredients that are in line with our target pricing, the variety of our menu and concepts, the quality and consistency of our food and service, the use of various promotions and the selection of appropriate locations for our restaurants, allow us to effectively and efficiently compete in the restaurant industry.
Index to Financial Statements
Government Regulation
We are subject to various federal, state, local and international laws affecting our business. Each of our restaurants is subject to licensing and regulation by a number of governmental authorities, which may include, among others, alcoholic beverage control, health and safety, nutritional menu labeling, health care, environmental and fire agencies in the state, municipality or country in which the restaurant is located. Difficulty in obtaining or failing to obtain the required licenses or approvals could delay or prevent the development of a new restaurant in a particular area. Additionally, difficulties or inabilities to retain or renew licenses, or increased compliance costs due to changed regulations, could adversely affect operations at existing restaurants.
Approximately 15% of our consolidated restaurant sales are attributable to the sale of alcoholic beverages. Alcoholic beverage control regulations require each of our restaurants to apply to a state authority and, in certain locations, county or municipal authorities for a license or permit to sell alcoholic beverages on the premises and to provide service for extended hours and on Sundays. Typically, licenses must be renewed annually and may be revoked or suspended for cause at any time. Alcoholic beverage control regulations relate to numerous aspects of daily operations of our restaurants, including minimum age of patrons and employees, hours of operation, advertising, training, wholesale purchasing, inventory control and handling and storage and dispensing of alcoholic beverages. The failure of a restaurant to obtain or retain liquor or food service licenses would adversely affect the restaurant’s operations. Additionally, we are subject in certain states to “dramshop”“dram shop” statutes, which generally provide a person injured by an intoxicated person the right to recover damages from an establishment that wrongfully served alcoholic beverages to the intoxicated person.
Our restaurant operations are also subject to federal and state labor laws, including the Fair Labor Standards Act, governing such matters as minimum wages, overtime, tip credits and worker conditions. Our employees who receive tips as part of their compensation, such as servers, are paid at a minimum wage rate, after giving effect to applicable tip credits. We rely on our employees to accurately disclose the full amount of their tip income, and we base our FICA tax reporting on the disclosures provided to us by such tipped employees. Our other personnel, such as our kitchen staff, are typically paid in excess of minimum wage. As significant numbers of our food service and preparation personnel are paid at rates related to the applicable minimum wage, further increases in the minimum wage or other changes in these laws could increase our labor costs. Our ability to respond to minimum wage increases by increasing menu prices will depend on the responses of our competitors and customers.
Further, we are continuingcontinue to assess our health care benefit costs. Due to the impactbreadth and complexity of federal health care legislation and the staggered implementation of its provisions and corresponding regulations, it is difficult to predict the overall impact of the health care legislation on our business over the coming years. Although these laws do not mandate that employers offer health careinsurance to all employees who are eligible under the legislation, beginning in 2014 penalties will be assessed on large employers who do not offer health insurance that meets certain affordability or benefit costs. The imposition of any requirement that we providerequirements. Providing health insurance benefits to employees that are more extensive than the health insurance benefits we currently provide and to a potentially larger proportion of our employees, or the impositionpayment of additional employer paid employment taxes on income earned by ourpenalties if the specified level of coverage is not provided at an affordable cost to employees, could have ana material adverse effect on our results of operations and financial
position. In addition, these laws require employers to comply with a significant number of new reporting and notice requirements from the Departments of Treasury, Labor and Health and Human Services, and we will have to develop systems and processes to track the requisite information and to comply with the reporting and notice requirements. Our distributors and suppliers also may be affected by higher minimum wage and benefit standards, which could result in higher costs for goods and services supplied to us.
We may also be subject to lawsuits from our employees, the U.S. Equal Employment Opportunity Commission or others alleging violations of federal and state laws regarding workplace and employment matters, discrimination and similar matters. A number of lawsuits have resulted in the payment of substantial damages by the defendants. For example, in December 2009, we entered into a Consent Decree in settlement of certain litigation brought by the U.S. Equal Employment Opportunity Commission alleging gender discrimination in promotions to management in the Outback Steakhouse organization, which required us to make a settlement payment of $19.0 million. In addition, during the four-year term of the Consent Decree, we are required to fulfill certain training, record-keeping and reporting requirements and maintain an open access system for restaurant employees to express interest in promotions within the Outback Steakhouse organization, and employ a human resources executive.
The Patient Protection and Affordability Act of 2010 (the “PPACA”) enacted in March 2010 requires chain restaurants with 20 or more locations in the United States to comply with federal nutritional disclosure requirements. The FDA has indicated that it intends to issue final regulations by the middleend of 20122013 and begin enforcing the regulations by the end of 2012.shortly thereafter. A number of states, counties and cities have also enacted menu labeling laws requiring multi-unit restaurant operators to disclose certain nutritional information to customers, or
Index to Financial Statements
have enacted legislation restricting the use of certain types of ingredients in restaurants. Although the federal legislation is intended to preempt conflicting state or local laws on nutrition labeling, until we are required to comply with the federal law we will be subject to a patchwork of state and local laws and regulations regarding nutritional content disclosure requirements. Many of these requirements are inconsistent or are interpreted differently from one jurisdiction to another. While our ability to adapt to consumer preferences is a strength of our concepts, the effect of such labeling requirements on consumer choices, if any, is unclear at this time.
There is potential for increased regulation of food in the United States under the recent changes in the HACCPHazard Analysis & Critical Control Points (“HACCP”) system requirements. HACCP refers to a management system in which food safety is addressed through the analysis and control of potential hazards from production, procurement and handling, to manufacturing, distribution and consumption of the finished product. Many states have required restaurants to develop and implement HACCP Systems and the United States government continues to expand the sectors of the food industry that must adopt and implement HACCP programs. For example, the Food Safety Modernization Act (the “FSMA”), signed into law in January 2011, granted the FDA new authority regarding the safety of the entire food system, including through increased inspections and mandatory food recalls. Although restaurants are specifically exempted from or not directly implicated by some of these new requirements, we anticipate that the new requirements may impact our industry. Additionally, our suppliers may initiate or otherwise be subject to food recalls that may impact the availability of certain products, result in adverse publicity or require us to take actions that could be costly for us or otherwise harm our business.
We are subject to the Americans with Disabilities Act, or the ADA, which, among other things, requires our restaurants to meet federally mandated requirements for the disabled. The ADA prohibits discrimination in employment and public accommodations on the basis of disability. Under the ADA, we could be required to expend funds to modify our restaurants to provide service to, or make reasonable accommodations for the employment of, disabled persons. In addition, our employment practices are subject to the requirements of the Immigration and Naturalization Service relating to citizenship and residency. Government regulations could affect and change the items we procure for resale. We may also become subject to legislation or regulation seeking to tax and/or regulate high-fat and high-sodium foods, particularly in the United States, which could be costly to comply with. Our results can be impacted by tax legislation and regulation in the jurisdictions in which we operate and by accounting standards or pronouncements.
We are also subject to laws and regulations relating to information security, privacy, cashless payments, gift cards and consumer credit, protection and fraud, and any failure or perceived failure to comply with these laws and regulations could harm our reputation or lead to litigation, which could adversely affect our financial condition.
See “Risk Factors” for a discussion of risks relating to federal, state, local and international regulation of our business.
Employees
As of DecemberMarch 31, 2011,2013, we employed approximately 85,00091,000 persons, of which 825870 are corporate personnel, approximately 5,2005,100 are restaurant management personnel and the remainder are hourly restaurant personnel. Of the 825870 corporate employees, approximately 185190 are in management and 640680 are administrative or office employees. None of our employees areis covered by a collective bargaining agreement.
Properties
DuringAs of March 31, 2013, we had 1,478 system-wide restaurants located across the year ended December 31, 2011, we added fifteen new restaurant sites, closed eleven others and, in October 2011, we sold our nine company-owned Outback Steakhouse restaurants in Japan to a subsidiary of S Foods, Inc. The buyer has the right to develop Outback Steakhouse international franchise restaurants in Japan in the future and will pay us a royalty based on sales volumes.
Index to Financial Statements
Company-Owned | ||||||||||||||
Alabama | 22 | Kansas | 9 | New Jersey | 41 | Utah | 6 | |||||||
Arizona | 31 | Kentucky | 17 | New Mexico | 5 | Vermont | 1 | |||||||
Arkansas | 11 | Louisiana | 21 | New York | 44 | Virginia | 60 | |||||||
California | 21 | Maryland | 42 | North Carolina | 64 | West Virginia | 8 | |||||||
Colorado | 28 | Massachusetts | 20 | Ohio | 48 | Wisconsin | 11 | |||||||
Connecticut | 13 | Michigan | 35 | Oklahoma | 11 | Wyoming | 2 | |||||||
Delaware | 2 | Minnesota | 9 | Pennsylvania | 44 | |||||||||
Florida | 216 | Mississippi | 2 | Puerto Rico | 1 | China (Mainland) | 1 | |||||||
Georgia | 51 | Missouri | 16 | Rhode Island | 4 | Hong Kong | 8 | |||||||
Hawaii | 7 | Montana | 1 | South Carolina | 37 | South Korea | 108 | |||||||
Illinois | 27 | Nebraska | 7 | South Dakota | 2 | |||||||||
Indiana | 22 | Nevada | 16 | Tennessee | 37 | |||||||||
Iowa | 8 | New Hampshire | 2 | Texas | 76 | |||||||||
Franchise and Development Joint Venture | ||||||||||||||
Alabama | 1 | Oregon | 8 | Dominican Republic | 1 | Singapore | 1 | |||||||
Alaska | 1 | South Carolina | 1 | Egypt | 1 | Taiwan | 5 | |||||||
California | 63 | Tennessee | 3 | Guam | 1 | Thailand | 1 | |||||||
Florida | 3 | Washington | 18 | Indonesia | 3 | United Arab Emirates | 2 | |||||||
Idaho | 6 | Japan | 10 | |||||||||||
Mississippi | 6 | Australia | 6 | Malaysia | 1 | |||||||||
Montana | 2 | Brazil | 41 | Mexico | 5 | |||||||||
North Carolina | 1 | Canada | 4 | Philippines | 3 | |||||||||
Ohio | 1 | Costa Rica | 1 | Saudia Arabia | 3 | |||||||||
As of DecemberMarch 31, 2011,2013, we had the following number of owned and franchised domestic restaurants located in the following states:
State | Outback | Carrabba’s | Bonefish | Fleming’s | Roy’s | Total | ||||||||||||||||||
Alabama | 14 | 4 | 4 | 1 | — | 23 | ||||||||||||||||||
Alaska | 1 | — | — | — | — | 1 | ||||||||||||||||||
Arizona | 16 | 8 | — | 5 | 2 | 31 | ||||||||||||||||||
Arkansas | 8 | 1 | 2 | — | — | 11 | ||||||||||||||||||
California | 63 | — | — | 11 | 9 | 83 | ||||||||||||||||||
Colorado | 16 | 6 | 4 | 1 | — | 27 | ||||||||||||||||||
Connecticut | 10 | 1 | — | 1 | — | 12 | ||||||||||||||||||
Delaware | 2 | — | — | — | — | 2 | ||||||||||||||||||
Florida | 92 | 65 | 45 | 7 | 6 | 215 | ||||||||||||||||||
Georgia | 28 | 12 | 8 | 1 | — | 49 | ||||||||||||||||||
Hawaii | 7 | — | — | — | — | 7 | ||||||||||||||||||
Idaho | 5 | — | 1 | — | — | 6 | ||||||||||||||||||
Illinois | 19 | 2 | 3 | 2 | 1 | 27 | ||||||||||||||||||
Indiana | 15 | 3 | 4 | 1 | — | 23 | ||||||||||||||||||
Iowa | 6 | — | 1 | 1 | — | 8 | ||||||||||||||||||
Kansas | 6 | 2 | 2 | — | — | 10 | ||||||||||||||||||
Kentucky | 11 | 3 | 3 | — | — | 17 | ||||||||||||||||||
Louisiana | 14 | 3 | 3 | 1 | — | 21 | ||||||||||||||||||
Maine | 1 | — | — | — | — | 1 | ||||||||||||||||||
Maryland | 23 | 9 | 6 | 1 | 1 | 40 | ||||||||||||||||||
Massachusetts | 15 | 3 | — | 1 | — | 19 | ||||||||||||||||||
Michigan | 23 | 8 | 2 | 2 | — | 35 | ||||||||||||||||||
Minnesota | 9 | — | — | — | — | 9 | ||||||||||||||||||
Mississippi | 6 | — | 2 | — | — | 8 | ||||||||||||||||||
Missouri | 13 | 1 | 1 | 1 | — | 16 | ||||||||||||||||||
Montana | 3 | — | — | — | — | 3 | ||||||||||||||||||
Nebraska | 4 | 1 | 1 | 1 | — | 7 | ||||||||||||||||||
Nevada | 11 | 2 | — | 1 | 2 | 16 | ||||||||||||||||||
New Hampshire | 2 | 1 | — | — | — | 3 | ||||||||||||||||||
New Jersey | 19 | 8 | 11 | 2 | — | 40 | ||||||||||||||||||
New Mexico | 5 | — | — | — | — | 5 | ||||||||||||||||||
New York | 33 | 6 | 4 | — | — | 43 | ||||||||||||||||||
North Carolina | 34 | 16 | 9 | 3 | — | 62 | ||||||||||||||||||
Ohio | 30 | 10 | 6 | 3 | — | 49 | ||||||||||||||||||
Oklahoma | 8 | 1 | 1 | 1 | — | 11 | ||||||||||||||||||
Oregon | 8 | — | — | — | — | 8 | ||||||||||||||||||
Pennsylvania | 26 | 9 | 5 | 1 | — | 41 | ||||||||||||||||||
Rhode Island | 1 | 1 | — | 1 | — | 3 | ||||||||||||||||||
South Carolina | 22 | 9 | 7 | — | — | 38 | ||||||||||||||||||
South Dakota | 2 | — | — | — | — | 2 | ||||||||||||||||||
Tennessee | 20 | 9 | 8 | 3 | — | 40 | ||||||||||||||||||
Texas | 52 | 14 | — | 6 | 1 | 73 | ||||||||||||||||||
Utah | 4 | 1 | — | 1 | — | 6 | ||||||||||||||||||
Vermont | 1 | — | — | — | — | 1 | ||||||||||||||||||
Virginia | 35 | 11 | 12 | 2 | — | 60 | ||||||||||||||||||
Washington | 16 | — | 2 | — | — | 18 | ||||||||||||||||||
West Virginia | 8 | — | — | — | — | 8 | ||||||||||||||||||
Wisconsin | 6 | 2 | 1 | 2 | — | 11 | ||||||||||||||||||
Wyoming | 2 | — | — | — | — | 2 | ||||||||||||||||||
|
|
|
|
|
|
|
|
|
|
|
| |||||||||||||
Total | 775 | 232 | 158 | 64 | 22 | 1251 | ||||||||||||||||||
|
|
|
|
|
|
|
|
|
|
|
| |||||||||||||
Index to Financial Statements
In connection with the Merger on June 14, 2007, we implemented a new ownership and financing arrangement for someapproximately 20% of our restaurant properties, pursuant to which Private Restaurant Properties, LLC, or PRP, our wholly-owned subsidiary, acquired 343 restaurant properties from our wholly-owned primary operating subsidiary, OSI Restaurant Partners, LLC, or OSI. Immediately after the purchase, PRP leased the properties back to a subsidiary of OSI (the “Tenant”), under a 15-year market rate master lease agreement (the “Master Lease”). PRP’s sole purpose is to own and lease all its real property to the Tenant and PRP. As of December 31, 2011, approximately 25% of our restaurant sites were leased by Tenant from PRP.sites. The remaining 75%80% of our restaurant sites were leased by our subsidiaries from third parties.
On March 14, 2012, PRP sold 67 propertiesIn the future, we intend to two independent real estate institutional investors andeither convert existing third-party leased retail space or construct new restaurants through leases in the Tenant entered into new 20-year market-rate leases with the buyers. The leases are net leases that require the Tenant to pay the costsmajority of insurance, taxes and common area operating costs. Also, on March 27, 2012, we completed the CMBS Refinancing associated with the remaining 261 properties. See “Management’s Discussion and Analysis of Financial Condition and Results of Operations—Liquidity and Capital Resources—Transactions” for a description of the CMBS Refinancing. Following the CMBS Refinancing, New PRP continues to own and lease the 261 restaurant properties to the Tenant under the Amended and Restated Master Lease, which has a 15-year term. The Amended and Restated Master Lease is a net lease that requires the Tenant to pay the costs of insurance, taxes and common area operating costs. Following the Sale-Leaseback Transaction, approximately 20% of our restaurant sites are leased by Tenant from New PRP. The remaining 80% of our restaurant sites are leased from third parties, including the buyers of the 67 properties from PRP.
circumstances. Initial lease expirations for our other leased properties typically range from five to ten years, with the majority of the leases providing for an option to renew for two or
more additional terms. All of our leases provide for a minimum annual rent, and many leases call for additional rent based on sales volume at the particular location over specified minimum levels. Generally, the leases are net leases that require us to pay our share of the costs of insurance, taxes and common area operating costs.
As of DecemberMarch 31, 2011,2013, we leased approximately 179,000168,000 square feet of office space in Tampa, Florida for our corporate headquarters and research and developmentR&D facilities under a leaseleases expiring on January 31, 2025.
Trademarks
We regard our “Outback Steakhouse,” “Carrabba’s Italian Grill,” “Bonefish Grill,” “Fleming’s Prime Steakhouse and Wine Bar” and “Roy’s” service marks and our “Bloomin’ Onion” trademark as having significant value and as being important factors in the marketing of our restaurants. We have also obtained trademarks for several of our other menu items and for various advertising slogans. We are aware of names and marks similar to the service marks of ours used by other persons in certain geographic areas in which we have restaurants. However, we believe such uses will not adversely affect us. Our policy is to pursue registration of our marks whenever possible and to oppose vigorously any infringement of our marks.
We license the use of our registered trademarks to franchisees and third parties through franchise arrangements and licenses. The franchise and license arrangements restrict franchisees’ and licensees’ activities with respect to the use of our trademarks, and impose quality control standards in connection with goods and services offered in connection with the trademarks.
Seasonality and Quarterly Results
Our business is subject to seasonal fluctuations. Historically, customer spending patterns for our established restaurants are generally highest in the first quarter of the year and lowest in the third quarter of the year. Additionally, holidays, severe winter weather, hurricanes, thunderstorms and similar conditions may affect sales volumes seasonally in some of our markets. Quarterly results have been and will continue to be significantly affected by general economic conditions, the timing of new restaurant openings and their associated
Index to Financial Statements
pre-opening costs, restaurant closures and exit-related costs and impairments of goodwill and property, fixtures and equipment. As a result of these and other factors, our financial results for any given quarter may not be indicative of the results that may be achieved for a full fiscal year.
Legal Proceedings
We are subject to legal proceedings, claims and liabilities, such as liquor liability, sexual harassment and slip and fall cases, which arise in the ordinary course of business and are generally covered by insurance.insurance if they exceed specified retention or deductible amounts. In the opinion of management, the amount of ultimate liability with respect to those actions will not have a material adverse impact on our financial position or results of operations and cash flows. We accrue for loss contingencies that are probable and reasonably estimable. Legal costs are reported in General and administrative expense in the Consolidated Statements of Operations and Comprehensive Income. We generally do not accrue for legal costs expected to be incurred with a loss contingency until those services are provided.
Index to Financial Statements
Below is a list of the names, ages as of March 15, 2012,May 1, 2013, positions, and a brief accountdescription of the business experience, of the individuals who serve as theour executive officers and directorsDirectors as of the date of this prospectus.
Name | Age | Position | ||||
Elizabeth A. Smith | 49 | Chairman of the Board of Directors and Chief Executive Officer | ||||
| Executive Vice President and Chief Financial Officer | |||||
David P. Berg (1) | 51 | Executive Vice President and President of Outback Steakhouse International | ||||
| ||||||
| 45 | Executive Vice President and President of Bonefish Grill | ||||
Joseph J. Kadow | 56 | Executive Vice President and Chief Legal Officer | ||||
David A. Pace | 54 | Executive Vice President and Chief Resources Officer | ||||
Steven T. Shlemon | 53 | Executive Vice President and President of Carrabba’s Italian Grill | ||||
Jeffrey S. Smith | 50 | Executive Vice President and President of Outback Steakhouse | ||||
Andrew B. Balson | ||||||
| 46 | Director | ||||
J. Michael Chu | 55 | Director | ||||
| Director | |||||
David Humphrey | 36 | Director | ||||
John J. Mahoney | 61 | Director | ||||
Mark E. Nunnelly | 54 | Director | ||||
Chris T. Sullivan | ||||||
| 65 | Director |
We will add one independent director before the completion of this offering. We anticipate that we will appoint at least one additional director who is not affiliated with us or any of our stockholders within 90 days of the completion of this offering and one additional director who is not affiliated with us or any of our stockholders within one year of the completion of this offering, resulting in a board that includes at least three independent directors.
| (1) | On May 6, 2013, Mr. Berg resigned from his employment with us, effective May 17, 2013, to pursue another opportunity. |
Elizabeth A. Smith was appointed Chairman of our boardBoard of directorsDirectors effective January 4, 2012 and has served as our Chief Executive Officer and a directorDirector since November 2009. From September 2007 to October 2009, Ms. Smith was President of Avon Products, Inc., a global beauty products company, and was responsible for its worldwide product-to-market processes, infrastructure and systems, including Global Brand Marketing, Global Sales, Global Supply Chain and Global Information Technology. In January 2005, Ms. Smith joined Avon Products, Inc. as President, Global Brand, and was given the additional role of leading Avon North America in August 2005. From September 1990 to November 2004, Ms. Smith worked in various capacities at Kraft Foods Inc. and from November 2004 to December 2008, served as a director of Carter’s, Inc. Ms. Smith is a member of the board of directors of Staples, Inc. The boardBoard of directorsDirectors believes Ms. Smith’s qualifications to serve as Chairman include her role as Chief Executive Officer, her extensive experience with global companies and retail sales, her expertise in corporate strategy development and her knowledge of marketing, sales, supply chain and information technology systems.
Dirk A. MontgomeryDavid J. Deno has served as our Executive Vice President and Chief Financial Officer (“CFO”) and Senior Vice President since November 2005, and as an Executive Vice President since January 1,May 2012. Prior to May 2012, and will take on the new position of Chief Value Chain Officer upon appointment of a new CFO, with responsibility for our productivity team, the Global Supply Chain organization and the information technology organization. Mr. Montgomery will remain in his current role as CFO until we hire a new Chief Financial Officer. From 2000 to 2004, Mr. Montgomery was employedDeno served as Chief Financial Officer by Express,of the international division of Best Buy Co. since December 2009. Prior to joining Best Buy Co., Mr. Deno was a subsidiaryconsultant with Obelysk Capital from February 2009 to December 2009. Prior to joining Obelysk Capital, Mr. Deno was a Managing Director of LimitedCCMP Capital Advisors, LLC (“CCMP”), a private equity firm from August 2006 to February 2009. While with CCMP, Mr. Deno was the President and then CEO of Quiznos, LLC, an operator of quick service restaurants. Prior to this, he had a 15 year career with YUM! Brands Inc.
Index towhere he served as Chief Financial Statements
Officer and later as Chief Operating Officer.David P. Berg has been the President of Outback Steakhouse International since September 2011 and our Executive Vice President since January 1, 2012. On May 6, 2013, Mr. Berg resigned from his employment with us, effective May 17, 2013, to pursue another opportunity. Prior to joining the company,Company, Mr. Berg was Executive Vice President and Chief Operating Officer of GNC Holdings, Inc., a global specialty retailer of vitamins, supplements and nutritional products that operates in 48 countries, from June 2010 to September 2011
and served as Executive Vice President—International from September 2009 to June 2010. Mr. Berg was the Executive Vice President and Chief Operating Officer—Best Buy International for Best Buy Co., Inc. from 2008 to 2009 and served as a Vice President and Senior Vice President of Best Buy from 2002 to 2008. Mr. Berg is a member of the board of directors of Imation Corp.
Jody L. Bilney has servedStephen K. Judge joined Bloomin’ Brands as Chief Brand Officer since January 2008 and our Executive Vice President since January 1, 2012. Ms. Bilney also has responsibility for our R&D function. She was Chief Marketing Officer of Outback Steakhouse from October 2006 to January 2008.
John W. Cooper has been theand President of Bonefish Grill since August 2001in January 2013. Prior to joining the Company, he was President of Seasons 52, which is a restaurant concept owned by Darden Restaurants, Inc., from March 2007 to December 2012. Prior to Seasons 52, Mr. Judge held Food & Beverage and our Executive Vice President since January 1, 2012.Operations leadership positions at the MGM Grand, one of the world’s largest hotels, Rosewood Hotels and Resorts, and the Princess and Premier Cruise Lines.
Joseph J. Kadow has been our Executive Vice President and Chief Legal Officer since April 2005 and served as our Senior Vice President and General Counsel from April 1994 to April 2005. Mr. Kadow has also served as Secretary since April 1994.
David A. Pace has served as our Chief Resources Officer and Executive Vice President since August 2010. Mr. Pace served as a consultant for Egon Zehnder International from 2009 to 2010. From 2002 to 2008, Mr. Pace served as Executive Vice President of Partner Resources for Starbucks Coffee Company. Mr. Pace has also held various positions with other companies prior to his position with Starbucks Coffee Company, including with PepsiCo, Inc. and YUMYUM! Brands.
Steven T. Shlemon has been the President of Carrabba’s Italian Grill since April 2000 and our Executive Vice President since January 1, 2012.
Jeffrey S. Smith has served as President of Outback Steakhouse since April 2007 and our Executive Vice President since January 1, 2012. Mr. Smith served as a Vice President of Bonefish Grill from May 2004 to April 2007 and as Regional Vice President—Operations of Outback Steakhouse from January 2002 to May 2004.
Andrew B. Balson has served as a directorDirector since June 2007 and is a Managing Director of Bain Capital. Mr. Balson serves on the boards of directors of Domino’s Pizza, Inc., Bright Horizons Family Solutions LLC and FleetCor Technologies, Inc., and Dunkin’ Brands Group, Inc. as well as a number of other private companies. TheMr. Balson previously served on the board of directors of Dunkin’ Brands Group, Inc. from March 2006 until June 2012 and on the board of directors of Burger King Holdings, Inc. from 2002 until June 2008. The Board of Directors believes Mr. Balson’s qualifications to serve as a member of our boardBoard include his extensive experience with global companies, his industry and financial expertise and his years of experience providing strategic advisory services to complex organizations.
Robert D. Basham is one of our Founders and has served as a director since 1991. Mr. Basham was Chief Operating Officer from 1991 until March 2005 when he resigned and became Vice Chairman of the board until June 2007. From 1988 to 1991, Mr. Basham founded OSI and developed Outback Steakhouse restaurants prior to its initial public offering in 1991. The board of directors believes Mr. Basham’s qualifications to serve as a member include his extensive experience in theorganizations, including restaurant industry and his historical perspective of our business and strategic challenges, including his leadership as a director and executive officer for over 20 years.companies.
J. Michael Chu has served as a directorDirector since June 2007 and is a Managing Partner of Catterton Partners, a leading consumer-focused private equity firm he co-founded in 1989. The boardMr. Chu serves on the boards of directors of Restoration Hardware Holdings, Inc. and Cheddar’s Casual Cafe, Inc. as well as other private companies. The Board of Directors believes Mr. Chu’s qualifications to serve as a member include his extensive experience in managing capital intensive operations, international operations, corporate financeconsumer businesses in both the U.S. and internationally and his years of providing strategic advisory services.
Index to Financial Statements
Philip H. LoughlinMindy Grossman has served as a directorDirector since June 2007September 2012. Ms. Grossman is currently the Chief Executive Officer of HSN, Inc. (“HSN”), a multi-channel retailer, offering retail experiences through various platforms, including television, online, mobile, catalogs, and retail and outlet stores, a position she has held since August 2008. Previously, she served as Chief Executive Officer of IAC Retailing, a business segment of HSN’s former parent company, InterActiveCorp, a media and Internet company focused in the areas of search, applications, online dating, local and media from 2006 to 2008 and Global Vice President of Nike, Inc.’s apparel business from 2000 to 2006. Ms. Grossman also serves on the board of directors of HSN. The Board of Directors
believes Ms. Grossman’s qualifications to serve as a member include her extensive experience leading, developing and launching consumer facing businesses and expertise in strategy, marketing, merchandising and business development, as well as her experience as the chief executive officer of a public company.
David Humphrey has served as a Director since September 2012 and is a Managing Director of Bain Capital.Capital, a global private investment firm. Prior to joining Bain Capital in 1996,2001, Mr. LoughlinHumphrey was a consultant at Bainan investment banker with Lehman Brothers Inc.’s mergers & Company and served in operating roles at Eagle Snacks, Inc. and Norton Company.acquisitions group. Mr. LoughlinHumphrey serves on the boards of directors of Applied Systems, Inc., Ariel Holdings, Ltd., AMC Entertainment, Inc.,Genpact Limited and RBS WorldPay (Ship Luxo 3 S.a.r.l).Bright Horizons Family Solutions LLC. The boardBoard of directorsDirectors believes Mr. Loughlin’sHumphrey’s qualifications to serve as a member include his strongexpertise in providing strategic advisory services and substantial knowledge of the capital markets from his experience as an investment banker that aid the Board of Directors in evaluating our capital and liquidity needs.
John J. Mahoney has served as a Director since May 2012. He previously served as Vice Chairman of Staples, Inc., a large office products and supply company, a position he held from January 2006 to his retirement in July 2012. Mr. Mahoney also served as Chief Financial Officer of Staples, Inc. from September 1996 to January 2012. He also served as Executive Vice President, Chief Administrative Officer and Chief Financial Officer of Staples, Inc. from October 1997 to January 2006, and as Executive Vice President and Chief Financial Officer of Staples, Inc. from September 1996, when he first joined Staples, Inc., to October 1997. Before joining Staples, Inc., Mr. Mahoney was a partner with the accounting firm of Ernst & Young LLP where he worked for 20 years, including service in the firm’s National Office Accounting and Auditing group. Mr. Mahoney also serves on the board of directors of Chico’s FAS, Inc. Mr. Mahoney previously served on the board of directors of Zipcar, Inc. from October 2010 until March 2013. The Board of Directors believes Mr. Mahoney’s qualifications to serve as a member include his experience as a financial executive backgroundand certified public accountant, with expertise in corporate strategic developmentthe retail industry, including accounting, controls, financial reporting, tax, finance, risk management and organizational acumen.financial management.
Mark E. Nunnelly has served as a directorDirector since June 2007 and is a Managing Director of Bain Capital. Prior to joining Bain Capital in 1989, Mr. Nunnelly was a Vice President of Bain & Company, with experience in the domestic, Asian and European strategy practices. Previously, Mr. Nunnelly worked at Procter & Gamble in product management. Mr. Nunnelly serves on the boardboards of directors of Dunkin’ Brands Group, Inc. The boardand Genpact Limited. Mr. Nunnelly previously served on the boards of directors of Domino’s Pizza, Inc. from 1998 until May 2011 and Warner Music Group from 2004 to July 2011. The Board of Directors believes Mr. Nunnelly’s qualifications to serve as a member include his industry experience, his extensive experience with managing capital intensive industry operations and his strong skills in international operations and strategic planning.
Chris T. Sullivan is one of our Founders and has served as a directorDirector since 1991. Mr. Sullivan was the Chairman of our boardBoard of directorsDirectors from 1991 until June 2007 and was our Chief Executive Officer from 1991 until March 2005. Mr. Sullivan founded OSI in 1988 and developed Outback Steakhouse restaurants prior to its initial public offering in 1991. Mr. Sullivan serves on the board of directors of Lightyear Network Solutions, Inc., a provider of telecommunications services to businesses and residential consumers. The boardBoard of directorsDirectors believes Mr. Sullivan’s qualifications to serve as a member include his four decades of experience in the restaurant industry and his historical perspective of our business and strategic challenges, including his leadership as a directorDirector and executive officer for over 20 years.
Mark A. VerdiOverview of Our Board Structure
Following our initial public offering, an investor group consisting of funds advised by our Sponsors and two of our Founders continues to beneficially own more than 50% of our common stock. As a result, we are considered a “controlled company” under the Nasdaq rules. “Controlled companies” under those rules are companies of which more than 50% of the voting power is held by an individual, a group or another company. Each member of the investor group has served asfiled a director since June 2007 and is a Managing DirectorStatement of Bain Capital. Prior to joining Bain Capital in 2004, Mr. Verdi worked for IBM Global Services and Mainspring, Inc., a public strategy consulting firm. Mr. Verdi servesBeneficial Ownership on the boards of directors of Burlington Coat Factory Warehouse Corporation, Burlington Coat Factory Investments Holdings, Inc., Burlington Coat Factory Holdings, Inc. and Styron Luxco Sarl. The board of directors believes Mr. Verdi’s qualifications to serve as a member include his executive background in public and financial accounting for complex global organizations and years of experience in providing strategic advisory services.
Board Structure and Committee Composition
Upon the completion of this offering, we will have an audit committee, a nominating and corporate governance committee and a compensation committeeSchedule 13G with the compositionSEC relating to its respective holdings and responsibilities described below. Each committee will operate under a charter that will be approved by our board of directors priorthe group’s arrangeme
nts with respect to completiondisposition of the offering. The members of each committee are appointed by and serve at the pleasure of the board of directors. In addition, from time to time, special committees may be established under the direction of the board of directors when necessary to address specific issues.
We intend toshares. On this basis, we currently avail ourselves of the “controlled company” exception under rules. Asthe Nasdaq rules and we are not subject to the Nasdaq listing requirements that would otherwise require us to have: (a) a result, we will not haveBoard of Directors comprised of a majority of independent directors,Directors; (b) compensation of our executive officers determined by a majority of the independent Directors or a compensation committee composed solely of independent Directors; and (c) Director nominees selected, or recommended for the Board of Director’s selection, either by a majority of the independent Directors or a nominating committee composed solely of independent Directors. The Board of Directors has established a Compensation Committee and a Nominating and Corporate Governance Committee in addition to an Audit Committee. Chris T. Sullivan, one of our Founders, Andrew Balson, David Humphrey and Mark Nunnelly, each of whom is associated with Bain Capital, and J. Michael Chu, who is associated with Catterton, serve as six of the eight members of our Board of Directors. Robert D. Basham served as a Director until his term ended at our annual meeting on April 24, 2013 as he declined to stand for re-election. The Board of Directors reduced the size of the Board to eight Directors effective upon the end of Mr. Basham’s term.
Under the Stockholders Agreement that we entered into with our Sponsors and two of our Founders at the time of the initial public offering, each of the Sponsors has a contractual right, subject to certain conditions, to nominate representatives to the Board of Directors and its committees. As long as the Sponsors collectively own (directly or indirectly) more than 15% of our outstanding common stock, Bain Capital will have the right to designate two nominees and Catterton will have the right to designate one nominee for election to the Board of Directors. Bain Capital also has certain contractual rights to have one of its nominees serve on each committee of the Board of Directors, other than the Audit Committee, as long as the Sponsors collectively own (directly or indirectly) at least 35% of our outstanding common stock. In addition, as long as the Sponsors collectively own (directly or indirectly) more than 40% of our outstanding common stock, the Board of Directors must not, and we are required to take all necessary action to ensure that the Board of Directors does not, exceed nine Directors, unless Bain Capital requests that the size of the Board of Directors be increased up to the maximum permitted under our organizational documents and appoints Directors to fill the vacancies. If a vacancy is created by the death, disability, retirement, resignation or removal of a Bain Capital or Catterton designee to the Board of Directors, we agreed to take all action necessary to cause the vacancy to be filled by a person designated by Bain Capital or Catterton, as the case may be. As of May 6, 2013, the Sponsors and two of our Founders collectively held approximately 77.2% of our outstanding common stock and, upon completion of this offering, are expected to hold approximately 63.7% of our outstanding common stock, assuming the underwriters do not exercise their option to purchase additional shares. See “Related Party Transactions—Arrangements With Our Sponsors and Founders” for additional information about the Stockholders Agreement and our nominatingrelationships with our Sponsors and corporate governanceFounders.
Independent Directors
As a controlled company, our Board of Directors is not required to consist of a majority of directors who meet the definition of independent under Nasdaq listing requirements, but the Audit Committee is currently required to consist of a majority of directors meeting the Nasdaq standards for independent audit committee and compensation committee will not be composed entirelymembers. The Audit Committee is required to consist solely of independent directors as defined under rules. Theby August 2013, the first anniversary of the initial public offering.
Our Corporate Governance Guidelines provide that after we cease to be a controlled company exception does not modifyand following any phase-in period permitted under the independenceNasdaq rules, our Board of Directors will consist of a majority of independent directors. The Nominating and Corporate Governance Committee evaluates any relationships of each director and nominee with Bloomin’ Brands and makes a recommendation to our Board of Directors as to whether to make an affirmative determination that such director or nominee is independent. Under our Corporate Governance Guidelines, an “independent” director is one who meets the qualification requirements for being independent under applicable laws and the corporate governance listing standards of Nasdaq. Upon recommendation of the Nominating and Corporate Governance Committee, our Board of Directors has affirmatively determined that Ms. Grossman and Mr. Mahoney, each of whom serve on our Audit Committee,
are independent under the criteria established by Nasdaq for director independence and for audit committee membership. The Board of Directors considered and we intenddeemed to comply withbe immaterial the requirementsfact that Bloomin’ Brands purchases office supplies from Staples, Inc., where Mr. Mahoney served as vice chairman of the Sarbanes-Oxley Actboard until July 2012 and rules with respect toserved as its chief financial officer until January 2012.
Board Committees
We have three standing committees: the audit committee. These rules require thatAudit Committee, the Compensation Committee and the Nominating and Corporate Governance Committee. Each of these committees has a written charter approved by the Board of Directors. A copy of each charter can be found by clicking on “Corporate Governance” in the Investors section of our audit committee be composedwebsite, www.bloominbrands.com.
The members of at least three members, onethe committees, as of whom must be independent on the date of listing on , a majority of whom must be independent within 90 days of the effective date of the registration statement containing this prospectus, and all of whom must be independent within one year ofare identified in the effective date of the registration statement containing this prospectus.
Index to Financial Statements
Director | Audit | Compensation | Nominating | |||
Andrew B. Balson | Chair | X | ||||
J. Michael Chu | X | Chair | ||||
Mindy Grossman | X | |||||
David Humphrey | X | |||||
John J. Mahoney | Chair | |||||
Mark E. Nunnelly | X | |||||
Chris T. Sullivan | X |
Audit Committee
The purpose of the audit committee will beAudit Committee is set forth in the audit committeeAudit Committee charter and will beis primarily to assist the boardBoard of Directors in overseeing:
the integrity of our financial statements, our financial reporting process and our systems of internal accounting and financial controls;
our compliance with legal and regulatory requirements;
the independent auditor’s qualifications and independence;
the evaluation of enterprise risk issues; and
the performance of our internal audit function and independent auditor.
Upon completionOur Board of this offering,Directors has determined, upon the audit committeerecommendation of the Nominating and Corporate Governance Committee, that Ms. Grossman and Mr. Mahoney are independent directors under applicable Nasdaq rules, which currently require that at least a majority of our Audit Committee members be independent. Beginning in August 2013, our Audit Committee will be required to consist of ,at least three directors, each of whom must be independent. Mr. Humphrey was not determined to satisfy Nasdaq’s independence requirements for Audit Committee members due to his association with Bain Capital. See “Related Party Transactions—Arrangements With Our Sponsors and . Our boardFounders” for a description the relationships and transactions involving us and Bain Capital. Ms. Grossman and Mr. Mahoney were determined by our Board of directors has determined that is an independent director and anDirectors to be “audit committee financial expert”experts” within the meaning of Item 407 of Regulation S-K. Prior toAll of the completion of this offering, our board of directors will adopt a written charter under whichmembers meet the requirements for audit committee will operate. A copy ofmembers under applicable Nasdaq rules regarding the charter, which will satisfy the applicable standards of the SECability to read and , will be available on our website.understand financial statements.
Nominating and Corporate Governance Committee
The purpose of the nominating and corporate governance committee will be set forth in the nominating and corporate governance committee charter and will be primarily to:
identify individuals qualified to become members of our board of directors, and to recommend to our board of directors the director nominees for each annual meeting of stockholders or to otherwise fill vacancies on the board;
review and recommend to our board of directors committee structure, membership and operations;
recommend to our board of directors the persons to serve on each committee and a chairman for such committee;
develop and recommend to our board of directors a set of corporate governance guidelines applicable to us; and
lead our board of directors in its annual review of its performance.
Upon completion of this offering, the nominating and corporate governance committee will consist of , and . Prior to the completion of this offering, our board of directors will adopt a written charter under which the nominating and corporate governance committee will operate. A copy of the charter, which will satisfy the applicable standards of the SEC and , will be available on our website.
Compensation Committee
The purpose of the compensation committee will beCompensation Committee is set forth in the compensation committeeCompensation Committee charter and will beis primarily to:
oversee our executive compensation policies and practices;
Index to Financial Statements
discharge the responsibilities of our boardBoard of directorsDirectors relating to executive compensation by determining and approving the compensation of our Chief Executive Officer and our other executive officers and reviewing and approving any compensation and employee benefit plans, policies and programs, and exercising discretion in the administration of such programs; and
produce, approve and recommend to our boardBoard of directorsDirectors for its approval reports on compensation matters required to be included in our annual proxy statement or annual report, in accordance with all applicable rules and regulations.
Upon completion of this offering, the compensation committee will consist of Messrs. Balson, Chu and Sullivan. Prior to the completion of this offering, our board of directors will adopt a written charter under which the compensation committee will operate. A copyFor additional description of the charter, which will satisfy the applicable standardsCompensation Committee’s processes and procedure for consideration and determination of executive officer compensation, see “Compensation Discussion and Analysis.”
Nominating and Corporate Governance Committee
The purpose of the SECNominating and , will be availableCorporate Governance Committee is set forth in the Nominating and Corporate Governance Committee charter and is primarily to:
identify individuals qualified to become members of our Board of Directors, and to recommend to our Board of Directors the director nominees for each annual meeting of stockholders or to otherwise fill vacancies on the Board of Directors;
review and recommend to our website.Board of Directors committee structure, membership and operations;
recommend to our Board of Directors the persons to serve on each committee and a chairman for such committee;
develop and recommend to our Board of Directors a set of corporate governance guidelines applicable to us; and
lead our Board of Directors in its annual review of its performance.
Board Leadership Structure
The boardBoard of directorsDirectors does not have a formal policy on whether the roles of Chief Executive Officer and chairmanChairman of the boardBoard of directorsDirectors should be separate. However, Elizabeth A.Ms. Smith currently serves as both Chief Executive Officer and chairmanChairman of the boardBoard of directors.Directors. The boardBoard of directorsDirectors has considered its leadership structure and believes at this time that the companyCompany and its stockholders are best served by having one person serve both positions. Combining the roles fosters accountability, effective decision-making and alignment between interests of the boardBoard of directorsDirectors and management. Ms. Smith also is able to use the in-depth focus and perspective gained in her executive function to assist our boardBoard of directorsDirectors in addressing both internal and external issues affecting the company.us. The boardBoard of directorsDirectors expects to periodically review its leadership structure to ensure that it continues to meet the company’sour needs.
Board’s Role in Risk Oversight
It is management’s responsibility to manage risk and bring to the Board of Director’s attention risks that are material to us. The entire boardBoard of directors is engaged in risk management oversight. At the present time, the board of directors has not established a separate committee to facilitateDirectors administers its risk oversight responsibilities. The board of directors will continue to monitorrole directly and assess whether such athrough its committee would be appropriate. The audit committee assists the board of directors in its oversight of our risk managementstructure and the process established to identify, measure, monitor, and manage risks, in particular major financial risks. The board of directors will receivecommittees’ regular reports from management, as well as fromto the audit committee, regarding relevantBoard of Directors, by reviewing strategic, financial and execution risks and exposures associated with the actions taken byannual plan and multi-year plans, major litigation and other matters that may present material risk to our operations, plans, prospects or reputation, acquisitions and divestitures and senior management succession planning. The Audit Committee reviews risks associated with financial and accounting matters, including financial reporting, accounting, disclosure, internal controls over financial reporting, ethics and compliance programs, compliance with orders and data security. The Compensation Committee reviews risks related to address those risks.executive compensation and the design of compensation programs, plans and arrangements.
Code of Business Conduct and Ethics
We have adopted a written codeCode of business conductBusiness Conduct and ethicsEthics that applies to our directors, officers and employees, including our principal executive officer, principal financial officer, principal accounting officer or controller, and persons performing similar functions. Following this offering, a currentA copy of the code,Code of Business Conduct and information regardingEthics, and any amendmentamendments or waivers to or waiver from its provisions, willit, can be postedfound by clicking on “Corporate Governance” in the Investors section of our website.website, www.bloominbrands.com.
Index to Financial Statements
COMPENSATION DISCUSSION AND ANALYSISANAYSIS
Introduction
This Compensation Discussion and Analysis discusses the objectives and design of our executive compensation program. It includes a description of the compensation provided for 2011in 2012 to our executive officers who are named in the Summary Compensation Table under “Executive Compensation.”below. Our “named executive officers” for 20112012 were:
Elizabeth A. Smith, Chairman of the Board of Directors and Chief Executive Officer
David J. Deno, Executive Vice President and Chief Financial Officer
Dirk A. Montgomery, Former Executive Vice President and Chief FinancialValue Chain Officer (1)
David P. Berg,Steven T. Shlemon, Executive Vice President and President of Carrabba’s Italian Grill
Jody L. Bilney, Former Executive Vice President and Chief Brand Officer (2)
Jeffrey S. Smith, Executive Vice President and President of Outback Steakhouse International
Jody L. Bilney, Executive Vice President and Chief Brand Officer
Joseph J. Kadow, Executive Vice President and Chief Legal Officer
| (1) | Mr. Montgomery is a named executive officer for 2012 because he was our Chief Financial Officer until May 2012. He resigned from his employment with us in January 2013. |
| (2) | Ms. Bilney resigned from her employment with us in March 2013. |
Overview of Compensation Philosophy and 20112012 Performance
For 2011, the compensation committee of the board of directors of OSI was responsible for setting the compensation of our executive officers and certain other corporate executives. Following the offering, executive compensation will be established by the compensation committee of the board of directors of Bloomin’ Brands. The compensation committee of OSI and Bloomin’ Brands, which we refer to in this prospectus collectively as the “compensation committee,” consist of the same members: Messrs. Balson, Chu and Sullivan.
The compensation committee’sCompensation Committee’s primary objective is to establish an executive compensation program that will enable us to to:
attract and retain qualified executives in today’s highly competitive market, that motivatesmarket;
motivate and rewards themreward executives whose knowledge, skills and performance are critical to achieve annual company-wide and concept-specific performance goals and that aligns management, employee and shareholder interests over the long-term. Our compensation program is designed to success of the business;
provide a total competitive compensation package that aligns themanagement and stockholder interests of executive officers and our shareholders by tying a significant portion of an executive’s cash compensation and long-term compensation to the achievement of annual performance goalsgoals; and long-term incentive compensation
ensure fairness among management by recognizing the contributions each executive makes to growth in the valuesuccess of the company.Bloomin’ Brands.
We achievedcontinued our strong financial performance in 2011,during 2012 and completed many significant transactions that reduced our debt and strengthened our balance sheet, and we believe that our named executive officers were instrumental in helping us achieve these results. Highlights of our 2011 performance includefor 2012 included the following:
an increase in consolidated revenues of 5.9%3.8% to $3.8$4.0 billion, driven primarily by 4.9%3.7% growth in combined comparable restaurant sales at existing domestic company-ownedCompany-owned core restaurants;restaurants, in 2012 as compared to 2011;
1537 system-wide restaurant openings across most brands (27 were Company-owned and 194ten were franchise and joint venture locations), and 150 Outback Steakhouse remodelsrenovations in 2011;2012;
productivity and cost management initiatives that we estimate allowed us to save over $50approximately $59 million in the aggregate in 2011;2012, while our costs increased due to rising commodity prices;
income from operations of $181.1 million in 2012 compared to $213.5 million in 2011, which was primarily due to increased expenses of $42.1 million associated with our initial public offering partially offset by an increase of 6.1% in operating margins at the restaurant level;
a reorganization of our entire capital structure by refinancing our commercial mortgage-backed debt securities in the first quarter of 2012, completing our initial public offering and retiring our senior notes in the third quarter of 2012 and refinancing our term loan and revolving credit facilities in the fourth quarter of 2012; and
generationthe acquisition of income from operationsthe remaining interests in our Roy’s joint venture and the remaining limited partnership interests in certain of $213.5 millionour limited partnerships that either owned or had a contractual right to varying percentages of cash flows in 2011 compared to $168.9 million in 2010, primarily attributable to the increase in consolidated revenues described above44 Bonefish Grill restaurants and a $33.3 million payment received in November 2011 from T-Bird in connection with a settlement agreement that satisfied all outstanding litigation.17 Carrabba’s Italian Grill restaurants.
This strong financial performance led to significant payments to our named executive officers under our annual cash incentive plan as described under “—Compensation Elements—Performance-Based Cash Incentives” below.
Index to Financial Statements
Compensation Setting Process
Our compensation committeeCompensation Committee oversees our executive compensation program and, is responsible for approvingtogether with the full Board of Directors in some cases, approves the type and amount of compensation paid to our named executive officers. The compensation committeeofficers, approves employment agreements with our executive officers and administers our equity compensation plan. Ms. Smith, as Chief Executive Officer, provides recommendations to the Compensation Committee for its consideration with respect to the compensation of other executive officers. The compensation committeeCompensation Committee also has overall responsibility for establishing, implementing and monitoring the executive compensation program for our corporate level executives other than our named executive officers. Salary and target bonus amounts, as well as stock optionequity awards for other corporate level executives, are recommended by management to the compensation committeeCompensation Committee (or the Board of Directors, in the case of equity awards for named executive officers and other executive officers subject to Section 16(a) reporting requirements) for its consideration and approval. Prior to 2012, decisions regarding executive compensation were made by the Board of Directors and Compensation Committee of our wholly-owned subsidiary, OSI. In preparation for the initial public offering, the Board of Directors of Bloomin’ Brands established a Compensation Committee, which had the same members as, and took over the responsibilities of, OSI’s Compensation Committee.
Each of our named executive officers has an employment agreement with us. Ms. Smith’s employment agreement was amended and restated in September 2012, in light of her contributions to the Company since she joined us that was entered into atin 2009, to extend its term until August 13, 2017, with one-year automatic renewals thereafter and to provide for the time of the Merger or, if later, at the time of hire.changes to her compensation discussed in more detail below. Each employment agreement establishes, among other things, the executive’s minimum base salary and minimum target bonus, measured as a percentage of base salary. The employment agreement that we entered into with Mr. Deno in May 2012 upon joining the Company guaranteed his bonus at the target amount. Each year, since the Merger, the compensation committee has reviewedCompensation Committee reviews with management whether any changes to base salary or bonus targets of our named executive officers are appropriate. The changes made for 2012 are described below.
The Compensation Committee begins its annual process for deciding how to compensate our executive officers by considering the competitive market data provided by its independent compensation consultant and our human resources staff. In 2012, the Compensation Committee engaged Radford, an Aon Hewitt Company, to provide advice and recommendations on competitive market practices and various elements of compensation provided to our executive officers. Radford was engaged by management from the third quarter of 2011 through 2012 to provide competitive market data and recommendations in connection with our analysis of cash and equity compensation practices for executive officers in anticipation of the initial public offering. The
comparative market data used by the Compensation Committee includes a combination of published survey data, proprietary Aon survey data and data from a peer group of companies.
The Compensation Committee, with assistance from Radford, identified criteria to select the following list of companies in the restaurant, hotel and retail industries that have annual revenues and numbers of employees roughly comparable to us, which comprised Bloomin’ Brands’ peer group for setting 2012 compensation:
Abercrombie & Fitch Co. | Limited Brands, Inc. | |
American Eagle Outfitters, Inc. | MGM Resorts International | |
Bed Bath & Beyond Inc. | PetSmart, Inc. | |
Big Lots, Inc. | Ross Stores, Inc. | |
Bob Evans Farms, Inc. | Royal Caribbean Cruises Ltd. | |
Brinker International, Inc. | Ruby Tuesday, Inc. | |
Cracker Barrel Old Country Store, Inc. | Starbucks Corporation | |
Darden Restaurants, Inc. | Starwoods Hotels & Resorts Worldwide, Inc. | |
Dollar Tree, Inc. | Texas Roadhouse, Inc. | |
Family Dollar Stores, Inc. | The Cheesecake Factory Incorporated | |
Foot Locker, Inc. | The Wendy’s Company | |
GameStop Corp. | V.F. Corporation | |
Hyatt Hotels Corporation | YUM! Brands, Inc. | |
Las Vegas Sands Corp. |
To determine competitive market compensation, the peer group data and survey data were appropriate. No changes were madecombined (unless there was insufficient comparable peer group data for the executive officer’s position, in which case only survey data was used) to establish market consensus information against which the Compensation Committee assessed base salaries orsalary, target bonus, targetstarget total cash, long-term incentive value and total target direct compensation. The Compensation Committee also considers the recommendations of our named executive officers for 2011.
The compensation committee did not, for compensation paid in 2011, use a compensation consultant or formally obtain competitive data, exceptChief Executive Officer with respect to salary adjustments, annual cash incentive bonus targets and awards and equity incentive awards for our other executive officers. Following the stock option grants describedinitial public offering, our Board of Directors generally has been responsible for approving, upon the recommendation or approval of the Compensation Committee, equity awards to our executive officers in order to qualify these awards as exempt awards under “—Rule 16b-3 under the Exchange Act. Compensation Elements—Long-Term Stock Incentives.”amounts were set relative to the market percentiles and based on the other factors discussed in more detail below.
Compensation Elements
The principal components of compensation for our named executive officers consist of the following:
base salary;
performance-based cash incentives;
for our Chief Executive Officer, retention-based cash incentives;
long-term stock incentives, generally in the form of stock options;
other benefits and perquisites; and
change in control and termination benefits.benefits; and
for our Chief Executive Officer, retention-based cash incentives.
Mix of Total Compensation
A significant percentage of cash compensation and total compensation for our named executive officers is allocated to performance-based compensation. Performance-based cash incentives are targeted to approach or exceed base salaries so that a meaningful percentage of their annual cash compensation is dependent on our performance. Long-term stock incentives in the form of stock options and, to a lesser extent, restricted stock supplement cash compensation and provide value to our executives when the company’sBloomin’ Brands’ equity value increases. Generally,Prior to the initial public offering, our executives are only able to realize value fromwere granted stock options uponthat could not be exercised until a liquidity event, such as a change in control or initial public offering, occurred. These options became exercisable, to the extent vested, at the time of the initial public offering. Some of our named executive officers hold restricted stock that was granted to them at the time of the Merger.Merger or in the case of Mr. Shlemon, in 2012. Since the Merger, the compensation committeeCompensation Committee has not used restricted stock as a form of compensation for our named executive officers other than in the case of Mr. Shlemon, but the compensation committee may re-evaluate itsCompensation Committee expects to use a mix of options, restricted stock and other performance-based equity awards in the future. In evaluating annual compensation of our named executive officers and other members of management, the compensation committeeCompensation Committee considers previous equity grants.
Base Salary
Base salaries are established pursuant to employment agreements with each of our named executive officers and generally reflect demonstrated experience, skills and competencies. Base salary levels of our named
Index to Financial Statements
executive officers may be increased as part of the annual performance review process, upon an executive officer’s promotion or other change in job responsibilities or if necessary to address internal or external equity issues as recommended by management.
In the fourth quarter of 2011, the compensation consultant was asked to provide comparative market data and recommendations in connection with our analysis of our cash and equity compensation practices for executive officers. As a result of its analysis of this data, in December 2011, the Compensation Committee made market-based adjustments to the base salaries for Ms. Smith and Ms. Bilney to reflect competitive positioning of base salaries for comparable positions within the applicable market data and the scope of the individual’s experience, responsibilities and performance. Ms. Smith’s base salary had been reduced from $1,000,000 to $925,000; however, in September 2012, Ms. Smith’s employment agreement was amended to increase her base salary at $975,000 to reflect her increased responsibilities following the initial public offering.
Base salaries of the named executive officers and the change, if any, from 2011, are listed in the table below.
Named Executive Officer | 2011 Base Salary | Change From 2010 | 2012 Base Salary | Change From 2011 | ||||||||||||
Elizabeth A. Smith | $ | 1,000,000 | — | $ | 975,000 | $ | (25,000 | ) | ||||||||
David J. Deno (1) | 600,000 | N/A | ||||||||||||||
Dirk A. Montgomery | 472,000 | — | 472,000 | — | ||||||||||||
David P. Berg (1) | 450,000 | N/A | ||||||||||||||
Steven T. Shlemon | 500,000 | — | ||||||||||||||
Jody L. Bilney | 400,000 | — | 450,000 | 50,000 | ||||||||||||
Joseph J. Kadow | 497,640 | — | ||||||||||||||
Jeffrey S. Smith | 500,000 | — | ||||||||||||||
| (1) | Mr. |
Performance-Based Cash Incentives and Other Cash Bonuses
Cash incentives are awarded to all of our executive officers under performance-based cash incentive plans. The design of the bonus plans, which follows a structure that is generally consistent from year to year, reflects the Compensation Committee’s belief that a significant portion of annual compensation for each named
executive officer should be based on the financial performance of the Company. These awards are payable based on the achievement of annually establishedannual financial objectives set within the existing plan structure, which are intended to provide incentives and rewards for achievement of the company’sCompany’s annual financial goals for corporate executive officers and a combination of companyCompany goals and concept goals for our executive officers who have operating responsibility at one of our concepts. The design of the bonus plans reflects the compensation committee’s belief that a significant portion of annual compensation for each named executive officer should be based on the financial performance of the company.
Annual performance-based cash incentive targets, measured as a percentage of base salary, are set forth in each named executive officer’s employment agreement, but may be adjusted by the Compensation Committee.
As part of its review and are listedanalysis of comparative market data in the table below. The compensation committee believes, based on its own analysis and experience infourth quarter of 2011, the restaurant industry, thatCompensation Committee made market-based adjustments to performance-based cash incentive targets to reflect competitive positioning around the 50th to 75th percentile of total potential annual cash compensation for comparable positions within the applicable market data and the scope of the named executive officers is competitive with the marketplace. individual’s experience, responsibilities and performance.
The following table presents the 20112012 annual performance-based cash incentive target for each named executive officer, as a percentage of his or her base salary.salary and the change, if any, from 2011.
| ||||||
| ||||||
| ||||||
| ||||||
| ||||||
| ||||||
Named Executive Officer | 2012 Annual | Change From 2011 | ||||||
Elizabeth A. Smith | 100 | % | 15 | % | ||||
David J. Deno (1) | 85 | % | N/A | |||||
Dirk A. Montgomery | 85 | % | (65 | )% | ||||
Steven T. Shlemon | 85 | % | (15 | )% | ||||
Jody L. Bilney | 85 | % | (15 | )% | ||||
Jeffrey S. Smith | 85 | % | (15 | )% | ||||
| (1) | In 2012, Mr. |
For 2011,2012, the annual performance-based cash incentive plan (the “2012 Corporate Bonus Plan”) for our named executive officers, exceptother than for Mr. Berg (the “2011 Corporate Bonus Plan”),Shlemon and Mr. Smith, was based on two equally weighted measures ofmeasures: OSI’s 2011 financial performance:adjusted EBITDA (as defined below) for 2012 (the “OSI Adjusted EBITDA (the “Adjusted EBITDA Bonus”) and 2012 comparable sales performance targets (the “Comparable Sales Bonus”). Under each of these measures, each named executive officer could earn up to 75% of such executive’s annual cash incentive target, with the aggregate maximum payout for each under the 20112012 Corporate Bonus Plan capped at 150% of the executive’s annual cash incentive target. In addition, each executive officer was assigned an individual performance rating for the year and the Compensation Committee had the discretion to decrease the payout amount for performance that did not meet expectations.
For purposes of the 20112012 Corporate Bonus Plan, “OSI Adjusted EBITDA” was calculated by adjusting OSI’s earnings before interest, taxes, depreciation and amortization (“EBITDA”) to exclude certain stock-based compensation expenses, non-cash expenses,management fees, the impact of restaurant closings, gains and significant non-recurring items. OSI Adjusted EBITDA is a
Index to Financial Statements
measure established for the 2011 Corporate Bonus Planlosses on disposed assets and is different than Adjusted EBITDA for Bloomin’ Brands used elsewhere in this prospectus. The OSI Adjusted EBITDA Bonus was payable on a sliding scale of OSI Adjusted EBITDA ranging from $365.0 million (representing payout at 15% of target) to a maximum payout at OSI Adjusted EBITDA of $435.0 million (representing payout at 75% of target), with OSI Adjusted EBITDA of $395.0 million representing payout at 50% of target. The Comparable Sales Bonus was based on the company’s 2011 comparable sales performance relative to the company’s 2011 comparable sales targets. The Comparable Sales Bonus was payable on a sliding scale of comparable sales ranging from 0% (representing payment at 25% of target) to a maximum payout at 4.1% (representing payout at 75% of target), with 2.1% representing payment at target.
certain other gains and losses. OSI Adjusted EBITDA and comparable sales performance payment levels were established by the compensation committeeCompensation Committee at the beginning of the year based on consideration of companyCompany initiatives as well as industry and general economic conditions and trends, among other considerations. The actual OSI Adjusted EBITDA Bonus was payable on a nonlinear, sliding scale of OSI Adjusted EBITDA ranging from $297.3 million (representing payout at 25% of target) to our named executive officers under the 2011 Corporate Bonus Plan wasa maximum payout at 65.9% of target which resulted from OSI Adjusted EBITDA of $424.0 million.$367.3 million (representing payout at 75% of target), with OSI Adjusted EBITDA of $341.9 million representing payout at 50% of target. The actual Comparable Sales Bonus payoutwas based on our 2012 comparable sales performance relative to our named executive officers2012 comparable sales targets. The Comparable Sales Bonus was payable on a nonlinear, sliding scale of comparable sales ranging from 1.0% (representing payment at 25% of target) to a maximum payout at 5.0% (representing payout at 75% of target, which resulted from company-widetarget), with 3.7% representing payment at 50% of target. For 2012, OSI Adjusted EBITDA was $342.6 million and our
Company-wide comparable sales performance of 5.7%was 3.4%. Accordingly, the total payouts to our named executive officers under the 20112012 Corporate Bonus Plan, as reported in the Summary Compensation Table, were 140.9%99% of their bonus targets.targets (other than for Mr. Deno who received 100% of his target as a guaranteed payment).
For 2011,2012, the annual performance-based cash incentive plan for Mr. Berg,Shlemon, Executive Vice President and President of Outback InternationalCarrabba’s Italian Grill (the “2011 International“2012 Carrabba’s Bonus Plan”), was based 50% on the 20112012 Corporate BusinessBonus Plan, as described above, and 50% on a bonus plan structured much like the 20112012 Corporate Bonus Plan, but based on the results of Carrabba’s Italian Grill (“Carrabba’s”). Under each of these measures, Mr. Shlemon could earn up to 75% of his annual cash incentive target, with the aggregate maximum payout capped at 150% of his annual cash incentive target. The Carrabba’s component was based on two equally weighted measures of Carrabba’s performance: 2012 Adjusted EBITDA for Carrabba’s (“Carrabba’s Adjusted EBITDA”), which was calculated in a manner similar to OSI Adjusted EBITDA, and comparable sales performance for Carrabba’s relative to 2012 comparable sales targets (the “Carrabba’s Comparable Sales”). The bonus based on Carrabba’s Adjusted EBITDA was payable on a sliding scale of Carrabba’s Adjusted EBITDA ranging from $59.3 million (representing payout at 12.5% of target) to a maximum payout at Carrabba’s Adjusted EBITDA of $73.5 million (representing payout at 37.5% of target), with Carrabba’s Adjusted EBITDA of $68 million representing payout at target. The bonus based on Carrabba’s Comparable Sales was payable on a sliding scale of Carrabba’s Comparable Sales ranging from 0.7% (representing payout at 12.5% of target) to a maximum payout at 4.7% (representing payout at 37.5% of target), with 3.4% representing payment at 25% of target. The actual payment to Mr. Shlemon for 2012 was set by the Compensation Committee at $423,938, which was slightly below the 105% of his target bonus payable based on the results of the 2012 Corporate Bonus Plan, Carrabba’s Adjusted EBITDA of $73.2 million and Carrabba’s Comparable Sales of 1.7%.
For 2012, the annual performance-based cash incentive plan for Mr. Smith, Executive Vice President and President of Outback (the “2012 Outback Bonus Plan”), was based 50% on the 2012 Corporate Bonus Plan, as described above, and 50% on a bonus plan structured much like the 2012 Corporate Bonus Plan, but based on the results of Outback International.Steakhouse (“Outback”). Under each of these measures, Mr. BergSmith could earn up to 75% of his annual cash incentive target, with the aggregate maximum payout capped at 150% of his annual cash incentive target. The Outback International component was based on two equally weighted measures of Outback International’sOutback’s performance: 2011 adjusted2012 Adjusted EBITDA for Outback International (“InternationalOutback Adjusted EBITDA”), which was calculated in a manner similar to OSI Adjusted EBITDA, and comparable sales performance for Outback International relative to 20112012 comparable sales targets (the “International“Outback Comparable Sales”). The bonus based on InternationalOutback Adjusted EBITDA was payable on a sliding scale of InternationalOutback Adjusted EBITDA ranging from $53.7$175.5 million (representing payout at 7.5% of target) to a maximum payout at International Adjusted EBITDA of $64.7 million (representing payout at 37.5% of target), with International Adjusted EBITDA of $58.7 million representing payout at target. The bonus based on International Comparable Sales was payable on a sliding scale of International Comparable Sales ranging from 1% (representing payout at 12.5% of target) to a maximum payout at 5%Outback Adjusted EBITDA of $217.4 million (representing payout at 37.5% of target), with 3%Outback Adjusted EBITDA of $201.1 million representing payout at target. The bonus based on Outback Comparable Sales was payable on a sliding scale of Outback Comparable Sales ranging from 0.7% (representing payout at 12.5% of target) to a maximum payout at 4.7% (representing payout at 37.5% of target), with 3.4% representing payment at 25% of target. For 2011, Mr. Berg’s bonus was guaranteed at target pursuant to his employment agreement. The actual payment to Mr. BergSmith for 20112012 was 145.4%$480,250, which was 113% of his target bonus based on the results of the 20112012 Corporate Bonus Plan, InternationalOutback Adjusted EBITDA of $72.0$204.8 million and InternationalOutback Comparable Sales of 14.9%4.4%.
In addition to her participation in the 20112012 Corporate Bonus Plan, Ms. Smith’s 2012 cash bonus compensation includesincluded two separate bonus arrangements: a retention bonus (the “Retention Bonus”)the Retention Bonus and a performance-based bonus (the “Incentive Bonus”).the Incentive Bonus. The Retention Bonus providesprovided for an aggregate bonus opportunity of $12.0 million, which iswas payable to Ms. Smith over a four-year period that began in 2010 in installments of $1.8 million, $3.0 million and two installments of $3.6 million, generally subject to her remaining continuously employed through the applicable payment date.date, or, if sooner to occur, within 60 days of the completion of an initial public offering. The Retention Bonus iswas structured with larger payments scheduled for the later payment dates in order to provide a greater incentive to Ms. Smith to remain employed through the full term of her employment agreement. The Incentive Bonus providesprovided for an aggregate bonus opportunity of up to $15.2 million. The Incentive Bonus willwas generally only to be paid to Ms. Smith if we complete(a) completed an initial public offering or experience(b) experienced a change in control (each a “Qualifying Liquidity Event”) and, in each case, if certain performance targets arewere met relating to the value of our common stock at the time of the
Qualifying Liquidity Event. ThisEvent and, in the case of an initial public offering, a subsequent period of six months (each, a “Qualifying Liquidity Event”). In light of Ms. Smith’s efforts in preparing the Company for the initial public offering, the Retention Bonus and the Incentive Bonus were amended by the Board of Directors in May 2012 to provide that if itwe completed an initial public offering (as defined in the bonus agreements) during 2012 and Ms. Smith was employed as Chief Executive Officer at the time of completion of the initial public offering, then all of the remaining payments under the Retention Bonus and the Incentive Bonus would be paid to her in a lump sum within sixty (60) days of the completion of the initial public offering. We completed the initial public offering in August 2012 and, as a result, a lump sum of $22,425,000 was paid to Ms. Smith at that time.
In recognition of their individual performance and contributions to the initial public offering process and other financing transactions in 2012, our Chief Executive Officer recommended to the Compensation Committee and the Compensation Committee approved the payment of cash bonuses to Mr. Deno, Ms. Bilney and Mr. Smith of $41,000, $20,000 and $51,000 respectively. In May 2012, Mr. Deno received a signing bonus of $425,000, which under the terms of his employment agreement must be repaid to us if he resigns or is completed, will beterminated for cause prior to November 9, 2013. Ms. Bilney received a Qualifying Liquidity Event.
Indexcash payment of $217,450 in 2012 for the vesting of a portion of the restricted stock that was granted to Financial Statements
her at the time of her employment and then converted at the time of the Merger into the right to receive cash on a deferred basis.Performance-based cash incentives earned by the named executive officers are reflected in the “Executive Compensation—Summary Compensation Table” under the heading “Non-Equity Incentive Plan Compensation.” Threshold, target and maximum payments for the 2011 Bonus Plan2012 bonus plans are reflected in “Executive Compensation—Grants of Plan-Based Awards for Fiscal 2011.2012.” The installments paidpayments with respect to Ms. Smith’s Retention Bonus and Incentive Bonus are reflected in “Executive Compensation—Summary Compensation Table” under the heading “Bonus.”
Long-Term Stock Incentives
Long-term stock incentives are designed to align a significant portion of total compensation with our long-term goal of increasing the value of the company.Company. At the time of the Merger, the long-term stock incentive component of the compensation package consisted of restricted stock and stock options.options issued under our 2007 Equity Plan. Since that time, we adopted the 2012 Equity Plan and long-term stock incentive awards have consisted solelyprimarily of stock options and have been primarily granted to newly hired or promoted executive officers.
Stockofficers, and beginning in 2013, our annual awards consist of stock options and performance-based share units. Mr. Shlemon also received a restricted stock grant in 2012. These equity awards are designed to reward longer-term performance, facilitate equity ownership, deter recruitment of our key personnel by competitors and others and further align the interests of our executives with those of our stockholders. Stock optionEquity awards under the 2007 Incentive Plan have generally been limited to our executive officers and other key employees and managers who are in a position to contribute substantially to our growth and success.
Shares acquired upon the exercise of stock options under the 2007 IncentiveEquity Plan arewere generally subject to a stockholder’s agreement that containscontained a management call option that allowsallowed us to repurchase all shares purchased through exercise of stock options upon termination of employment at any time prior to the earlier of an initial public offering or a change in control. If an employee’s termination of employment is a result of death or disability, by us other than for Cause or by the employee for Good Reason (see “Executive Compensation—Potential Payments Upon Termination or Change in Control” for a summary of these definitions), we may repurchase exercised stock under this call option at fair market value. If an employee’s termination of employment is by us for Cause or by the employee without Good Reason, we may repurchase the stock under this call provision for the lesser of the exercise price or fair market value. Additionally, the holder of shares acquired upon the exercise of stock options iswas prohibited from transferring the shares to any person, subject to narrow exceptions, and should a permitted transfer occur,have occurred, the transferred shares remainremained subject to the management call option. As a result of the transfer restrictions and call option, we dodid not record compensation expense for stock options that containsubject to the management call option until completion of the initial public offering, since employees cannotcould not realize monetary benefit from the options or any shares acquired upon the exercise of the options unless the employee iswas employed at the time of an initial public offering or a change in control. Upon completion of the initial public offering, the management call option terminated and we began to record compensation expense with respect to these awards.
In November 2009, Ms. Smith received a stock option grant that vests in equal installments over five years and contained a modified form of the management call option for one quarter of the option shares. In accordance with accounting guidance for stock-basedshare-based compensation, this form of the management call option doesdid not preclude us from recording compensation expense during the vestingservice period. Compensation expense iswas not recorded for the remaining three quarters of the option shares since they arecould not be exercised and, therefore, were not considered vested from an accounting standpoint, until the occurrence of a Qualifying Liquidity Event, as defined in Ms. Smith’s stock option agreement. The initial public offering met the thresholds for a Qualifying Liquidity Event and, in order for vested options to be exercised, a threshold stock price ranging from $5.00 to $10.00 depending on the tranche of the option must be maintained for a six-month period following the initial public offering prior to such exercise, which had been achieved as of February 3, 2013. Upon completion of the initial public offering, the vesting of such options was considered probable from an accounting standpoint and we began to record compensation expense with respect to this portion of the award.
On July 1, 2011, Ms. Smith was granted an option to purchase 550,000 shares of our common stock under the 2007 IncentiveEquity Plan in accordance with the terms of her employment agreement. This option has an exercise price of $10.03 per share and iswas subject to the modified form of the management call option that applied to one quarter of her 2009 grant. In accordance with accounting for stock-basedshare-based compensation, this modified form of the call option doesdid not preclude us from recording compensation expense during the service period. These options will vest and compensation expense will be recorded in equal amounts over a five-year period on each anniversary of the grant date, contingent upon her continued employment with us.
Under the terms of her amended employment agreement, Ms. Smith will be eligible for additional equity award grants beginning in 2014 as determined at the discretion of the Compensation Committee or the Board of Directors.
Index to Financial Statements
Mr. BergDeno was granted an option to purchase 250,000400,000 shares of our common stock under the 2007 IncentiveEquity Plan in connection with his hiring in September 2011.May 2012. This option has an exercise price of $10.03$14.58 per share and the shares are subject to the management call option and transfer restrictions. As a result of these provisions, among other considerations, compensation expense will not be recorded for his grant. The shares subject to the option will vest in equal amounts over a five-year period on each anniversary of his employment start date, contingent upon his continued employment with us, and any unvested portion will be forfeited upon termination of his employment.
On December 9, 2011, Mr. Kadow and Ms. Bilney were granted an This option to purchase 134,250 and 200,800 shares of our common stock, respectively, under the 2007 Incentive Plan as one-time market adjustments based on the recommendation of OSI’s compensation consultant after a review of total compensation of the officers. These options have an exercise price of $10.03 per share, and the shares arewas subject to the management call option and transfer restrictions. Asdescribed above until such call option terminated at the time of the initial public offering.
In April 2012, Mr. Shlemon was granted 50,000 shares of restricted stock under the 2007 Equity Plan as a result of these provisions, among other considerations, compensation expense has not been recorded for these grants.his additional contributions to the Company during the year. The optionsshares will vest in equal amounts over a five-yearfour-year period on each anniversary of the grant date, contingent upon continued employment with us, and any unvested portion will be forfeited upon termination of employment.
See “Executive Compensation—Grants of Plan-Based Awards for Fiscal 2011”2012” for additional information regarding 2011 stock option grants2012 equity awards to the named executive officers.
Other Benefits and Perquisites
Under their employment agreements, the named executive officers are each entitled to receive certain perquisites and personal benefits. We believe these benefits are reasonable and consistent with our overall compensation program and better enable us to attract and retain qualified employees for key positions. Such benefits include complimentary food at our restaurant concepts (limited to $100 per visit and a quarterly maximum of $1,000), automobile allowances, life insurance, medical insurance, annual physical examinations, vacation, personal use of corporate aircraft for our Chief Executive Officer, and reimbursement for income taxes on certain taxable benefits. In connection with Ms. Smith’s commencement of employment and transition and relocation to Florida, we agreed to reimburse her for certain costs related to her relocation, including travel and moving expenses and reimbursement of taxes for these amounts. The compensation committeeCompensation Committee periodically reviews the levels of perquisites and other personal benefits provided to the named executive officers.
We ownOn February 28, 2013, we terminated the split-dollar agreement we had entered into in 2008 with our former Executive Vice President and Chief Value Chain Officer, Dirk A. Montgomery. The split-dollar agreement required us to maintain an endorsement split dollarsplit-dollar life insurance policiespolicy with a death benefit of
approximately $5.0 million for each of Messrs. Montgomery and Kadow, whichMr. Montgomery. We were acquired in 2006. We are the beneficiary of the policiespolicy to the extent of premiums paid or the cash value, whichever iswas greater, with the balance beingremaining death benefit to be paid to a personal beneficiary designated by the executive. The executive’s employment agreements provide that we may not terminate the arrangements regardless of continued employment, except that we may terminateMr. Montgomery. Mr. Montgomery’s agreement priorright to the policy had fully vested on January 1, 2013. We paid Mr. Montgomery $150,000 in exchange for full termination of the split-dollar agreement. As a result of the termination agreement, we became the sole and exclusive owner of the policy and elected to cancel it.
Effective October 1, 2007, we implemented a deferred compensation plan for our highly compensated employees who are not eligible to participate in the OSI Restaurant Partners, LLC Salaried Employees 401(k) Plan and Trust. The deferred compensation plan allows highly compensated employees to contribute from 5% to 90% of their base salary and upfrom 5% to 100% of their cash bonus on a pre-taxpretax basis to an investment account consisting of various investment fund options. The plan permits us to make a discretionary contribution to the plan on behalf of an eligible employee from time to time; however, no suchwe have not made any discretionary contribution has been made to date. In the event of the employee’s termination of employment other than by reason of disability or death, the employee is entitled to receive the full balance in the account in a single lump sum unless the employee has completed either five years of participation or ten years of service as of the date of termination of employment, in which case, the account will be paid as elected by the employee in equal annual installments over a specified period of two to 15 years. If the employee’s employment terminates due to deathemployee dies or disability prior to commencement of benefits,becomes disabled before any deferred amounts are paid out under the plan, we will pay to the employee (or the employee’s beneficiary if applicable) the full balance in the account in a single lump sum.
Index If the employee’s employment terminates due to Financial Statements
death or disability after he or she begins receiving payments, the remaining installment payments will be paid in installment payments as such payments come due.The amounts attributable to perquisites and other personal benefits provided to the named executive officers are reflected in the “Executive Compensation—Summary Compensation Table” under the heading “All Other Compensation.”
Change in Control and Termination Benefits
Each of the named executive officers (other than Mr. Montgomery and Ms. Bilney) is party to an employment agreement and other arrangements with the companyus that may entitle him or her to payments or benefits upon a termination of employment and/or a change in control. For a summary of these agreements and arrangements, see “Executive Compensation—Potential Payments Upon Termination or Change in Control—Summary of Employment Agreements and Other Compensatory Arrangements.”
In anticipation of the initial public offering, the Board of Directors adopted an Executive Severance and Change in Control Plan that would have enabled the Compensation Committee to designate participants that would be entitled to receive certain severance payments and other benefits if they are terminated by us other than for cause or terminate their employment for good reason. In December 2012, the Compensation Committee recommended, and the Board of Directors approved, the termination of the Executive Severance and Change in Control Plan and the adoption of an Executive Change in Control Plan (the “Change in Control Plan”).
The Change in Control Plan entitles executive officers and other key employees to certain severance payments and benefits in the event of a qualifying termination of employment upon or within the 24 months following certain change in control events. The payments and benefits will be reduced by the amount of any severance or similar payments or benefits under an employment agreement or other arrangement with us and are subject to the employee’s compliance with non-competition and other restrictive covenants and the other terms and conditions of the Change in Control Plan. These benefits are described in more detail under “Potential Payments Upon Termination or Change in Control” below.
Compensation Changes for 20122013
In December 2012, the fourth quarterCompensation Committee established the peer group to be used as part of 2011, management engaged the consulting firm Radford, or the compensation consultant, to provide comparativeits review of competitive market data for setting executive officer compensation for 2013. With assistance from
Radford, the Compensation Committee refined the list of companies used in the 2012 peer group to include companies that were more closely aligned to Bloomin’ Brands’ revenue, EBITDA and recommendationsmarket capitalization following the initial public offering and to take into account the guidance from stockholder advisory firms regarding what they view as the appropriate components and size for a comparison group. The 2013 peer group is as follows:
Bob Evans Farms, Inc. | MGM Resorts International | |
Brinker International, Inc. | Panera Bread Company | |
Burger King Wordwide, Inc. | PetSmart, Inc. | |
Chipotle Mexican Grill, Inc. | Ross Stores, Inc. | |
Cracker Barrel Old Country Store, Inc. | Royal Caribbean Cruises Ltd. | |
Darden Restaurants, Inc. | Ruby Tuesday, Inc. | |
DineEquity, Inc. | Starbucks Corporation | |
Foot Locker, Inc. | Starwoods Hotels & Resorts Worldwide, Inc. | |
Hyatt Hotels Corporation | Texas Roadhouse, Inc. | |
Jack in the Box Inc. | The Cheesecake Factory Incorporated | |
Las Vegas Sands Corp. | The Wendy’s Company | |
Limited Brands, Inc. | YUM! Brands, Inc. |
In December 2012, the Compensation Committee also adopted an Equity Award Policy to formalize the general timing, process and delegation authority for grants of equity-based incentive awards. Under the policy, annual grants will generally be made to executive officers and other key employees following the review and evaluation of each executive officer’s performance and the public announcement of our results for the prior fiscal year and will have an exercise price equal to the fair market value on the date of grant. Additional grants (“off-cycle awards”) may be made in connection with our analysisnew hires or promotions during the year by the Board of our cashDirectors, Compensation Committee, the Equity Award Committee of the Board of Directors (currently consisting of Ms. Smith) or, solely in the case of options for employees at the vice president level or below, the Chief Executive Officer. Any off-cycle options will have a grant date and equity compensation practices for executive officers. As a resultexercise price of this analysis, the compensation committee grantedfirst trading day of the calendar month following the off-cycle event.
In February 2013, the Board of Directors approved, based on the recommendation of the Compensation Committee, grants of stock options and performance-based share units to two namedour current executive officers as described aboveother than Mr. Judge, who only received stock options, and made market-based adjustmentsMs. Smith. The performance-based share unit awards establish (a) service dates on which the award recipient must continue to base salariesbe employed by or otherwise providing service to us and bonus targets. For 2012, Ms. Smith’s base salary was reduced(b) adjusted net income targets to be achieved by $75,000us over a performance period to $925,000, Ms. Bilney’s base salary was increased by $50,000 to $450,000 and Mr. Kadow’s base salary was increased by $2,360 to $500,000. In addition, Ms. Smith’s bonus target was increased from 85% to 100% of base salary anddetermine the bonus targets for allvesting of the other namedshares subject to the award. Based on the level of adjusted net income attributed to Bloomin’ Brands achieved during 2013 and if the award recipient provided continuous service to us until the applicable service date (each anniversary of the grant date over a four-year period), a corresponding number of shares will vest (which number may range from zero to 200% of the target number of performance-based share units subject to the award). In April 2013, the Board of Directors approved additional grants of restricted stock and performance-based share units to Mr. Smith, with a performance criteria based on adjusted earnings before interest and taxes for our Outback Steakhouse concept. The use of performance-based share unit awards is intended to further align the interests of executive officers are now 85%with our stockholders in increasing the value of base salary.Bloomin’ Brands.
Our annual performance-based cash incentive plan for 20122013 (the “2012“2013 Bonus Plan”) will continue to be structured in a substantially the samesimilar manner as the 2011 program based on achievement2012 and prior year programs, except that the performance metrics will be the percentage of company-wideCompany-wide or concept total revenue growth and adjusted EBITDAnet income attributed to Bloomin’ Brands or concept earnings before interest and comparable sales targets. However,taxes. In addition, the maximum bonus amount will increase from 150% to 200% of target to align with the percentages used by the mid-point of the peer group that the Compensation Committee established for 2012, executives’2013 benchmarking. Executives’ payout under the 20122013 Bonus Plan will continue to be subject to reduction (but not increase) based on individual performance as determined by the compensation committee.Compensation Committee.
In February 2012, the compensation committee retained Radford as its compensation consultant. Following the offering, the compensation committee expects to obtain comparative market data each year as a basis for making recommendations regarding the various elements of compensation provided to our executive officers.
Tax and Accounting Implications
In making decisions about executive compensation, the compensation committeeCompensation Committee took into account certain tax and accounting considerations, including Sections 409A and 280G of the Internal Revenue Code. As neither OSI’s nor our equity securities were publicly held prior to August 2012, Section 162(m) of the Internal Revenue Code did not apply to the company.us. Additionally, we account for stock-based payments in accordance with the requirements of Accounting Standards Codification No. 718, “Compensation—Stock Compensation.” Following this offering, at such time as we are subject to the deduction limitations of Section 162(m), weWe expect that our compensation committee willCompensation Committee may seek to qualify the variable compensation paid to our named executive officers for an exemption from the deductibility limitations of Section 162(m). when such limitations are applicable. However, our compensation committeeCompensation Committee may, in its judgment, authorize compensation payments that do not comply with the exemptions in Section 162(m) when it believes that such payments are appropriate to attract and retain executive talent.talent or otherwise in our best interests.
Our compensation committeeCompensation Committee regularly considers the accounting implications of significant compensation decisions, especially in connection with decisions that relate to our equity incentive award plans and programs. As accounting standards change, we may revise certain programs to appropriately align accounting expenses of our equity awards with our overall executive compensation philosophy and objectives.
Index to Financial Statements
Compensation Committee Interlocks and Insider Participation
The compensation committeeCompensation Committee consists of AndrewMessrs. Balson, J. Michael Chu and Chris T. Sullivan. Mr. Balson is our director and an officer and a Managing Director of Bain Capital. Affiliates of Bain Capital are our stockholders. Mr. Chu is our director and an officer and a Managing Partner and Co-Founder of Catterton Partners. Catterton Partners and its affiliates are our stockholders.Catterton. Mr. Sullivan is one of our Founders, our former Chief Executive Officer, one of our stockholders and our director.Director. An investor group, which includes Bain Capital, Catterton and Mr. Sullivan, collectively held approximately 77.2% of our outstanding common stock as of May 6, 2013.
Management Agreement
Upon completion of the Merger, we entered into thea management agreement with Kangaroothe Management Company, I, LLC, or the management company, whose members are theour Founders and entities affiliatedassociated with Bain Capital and Catterton.our Sponsors. In accordance with the terms of the management agreement, the management company providesManagement Company was to provide management services to us until the tenth anniversary of the completion of the Merger, with one-year extensions thereafter until terminated. The management company receivesagreement provided that it would terminate automatically immediately prior to our completion of an initial public offering. Under the terms of the agreement, the Management Company received an aggregate annual management fee equal to $9.1 million and reimbursement for out-of-pocket and other reimbursable expenses incurred by it, its members, or their respective affiliates in connection with the provision of services pursuant to the agreement. Management fees, including out-of-pocket and other reimbursable expenses, of $9.4 million for the year ended December 31, 2011 were included in general and administrative expenses in our Consolidated Statement of Operations. Of this amount, $3.2 million was paid to Bain Capital, $0.6 million was paid to Catterton, $2.2 million was paid to Mr. Sullivan and $3.4 million was paid to the other Founders who are not members of the compensation committee. The management agreement includesalso included customary exculpation and indemnification provisions in favor of the management company,Management Company, Bain Capital and Catterton and their respective affiliates.
In May 2012, we amended the management agreement to provide that if the management agreement was terminated due to our completion of an initial public offering in 2012, the Management Company would receive, within 60 days of completion of the initial public offering, but in all events on or before December 31, 2012, a termination fee of $8.0 million. This termination fee was payable in addition to the pro-rated periodic fee as provided in the management agreement. The management agreement may be terminated by us,in connection with our initial public offering in August 2012 and we paid management fees to the Management Company, including the termination fee, out-of-pocket and other reimbursable expenses, of approximately $13.8 million for the year ended December 31, 2012.
Stockholders Agreements
In connection with the Merger, we entered into a stockholders agreement with our Sponsors, Founders and certain other stockholders. In connection with the completion of the initial public offering, all of the provisions of the stockholders agreement terminated in accordance with the terms of the stockholders agreement.
On August 7, 2012, we entered into the Stockholders Agreement with our Sponsors and two of our Founders that became effective upon consummation of the initial public offering. This Stockholders Agreement grants our Sponsors the right, subject to certain conditions, to nominate representatives to our Board of Directors and committees of our Board of Directors. As long as the Sponsors collectively own (directly or indirectly) more than 15% of our outstanding common stock, Bain Capital has the right to designate two nominees and Catterton has the right to designate one nominee for election to our Board of Directors of the Company. However, if Catterton’s ownership level falls below 1% of our outstanding common stock, Catterton will no longer have a right to designate a nominee and Bain Capital will have the right to designate three nominees for election to our Board of Directors. If at any time the Sponsors own more than 3% and less than 15% of our outstanding common stock, Bain Capital will have the right to designate two nominees for election to our Board of Directors. However, if at the time of the nomination, Catterton’s ownership percentage of our outstanding common stock is greater than Bain Capital’s ownership percentage, each of Bain Capital and Catterton will have the right to designate one nominee for election to our Board of Directors. Bain Capital also has certain contractual rights to have one of its nominees serve on each committee of our Board of Directors, other than the Audit Committee, as long as the Sponsors collectively own (directly or indirectly) at any timeleast 35% of our outstanding common stock. In addition, as long as the Sponsors collectively own (directly or indirectly) more than 40% of our outstanding common stock, our Board of Directors must not, and will terminate automatically uponwe are required to take all necessary action to ensure that our Board of Directors does not, exceed nine directors, unless Bain Capital requests that the size of the board of directors be increased up to the maximum permitted under our organizational documents and appoints directors to fill the vacancies.
Registration Rights Agreement
In connection with the Merger, we entered into a registration rights agreement with our Sponsors, Founders and certain other stockholders. The registration rights agreement provided the Sponsors and Founders with certain demand registration rights in respect of the shares of our common stock held by them. The Sponsors, Founders and certain other stockholders exercised their rights under the agreement and sold common stock in our initial public offering.
In connection with the initial public offering, on August 7, 2012, we entered into an amended and restated registration rights agreement to remove provisions that apply to an initial public offering, to facilitate charitable giving in connection with securities offerings and to make other clarifying changes. In addition, in the event that we register additional shares of common stock for sale to the public, we are required to give notice of such registration to the Sponsors, two of our Founders and certain other stockholders of our intention to effect such a registration, and, subject to certain limitations, such stockholders have piggyback registration rights providing them with the right to require us to include in such registration the shares of common stock held by them (excluding any shares that may be disposed of under Rule 144 without a volume limitation). We are required to bear the registration expenses, other than underwriting discounts and commissions and transfer taxes, associated with any registration of shares by the Sponsors, two of our Founders or other holders described above. The registration rights agreement also contains certain restrictions on the sale of shares by the Sponsors and two of our Founders. The registration rights agreement includes customary indemnification provisions in favor of any person who is or might be deemed a changecontrolling person within the meaning of Section 15 of the Securities Act or Section 20 of the Exchange Act, who the Company refer to as controlling persons, and related parties against liabilities under the Securities Act incurred in control.connection with the registration of any of our debt or equity securities. These provisions provide indemnification against certain liabilities arising under the Securities Act and certain liabilities resulting from violations of other applicable laws in connection with any filing or other disclosure made by us under the securities laws relating to any such registration. We have agreed to reimburse such persons for any legal or other expenses incurred in connection with investigating or defending any such liability, action or proceeding, except that we are not required to indemnify any such person or reimburse related legal or other expenses if such loss or expense arises out of or is based on any untrue statement or omission made in reliance upon and in conformity with written information provided by such person.
Restaurant Leases
In 2012, MVP LRS, LLC (“MVP”), an entity owned primarily by our Founders (one of whom is also our Director) paid us a total of approximately $0.6 million in lease payments for two restaurants in its Lee Roy Selmon’s concept, which was purchased from us in 2008. We also guarantee lease payments by MVP under two leases.
Compensation-Related Risk
As part of its oversight and administration of our compensation programs, the compensation committeeCompensation Committee considered the impact of our compensation policies and programs for our employees, including our executive officers, to determine whether they present a significant risk to the companyCompany or encourage excessive risk taking by our employees.executive officers. Based on its review, the compensation committeeCompensation Committee concluded that our compensation programs do not encourage excessive risk taking and are not reasonably likely to have a material adverse effect on the company.us.
Index to Financial Statements
Summary Compensation Table
The following table summarizes compensation for the three-year period ending December 31, 2011 earned by our principal executive officer, our principal financial officer and our three other most highly compensated executive officers. These individuals are referred to as our named executive officers.officers for 2012.
| Named Executive Officer | Year | Salary | Bonus (1) | Stock Awards (2) | Option Awards (2) | Non-Equity Incentive Plan Compensation (3) | All Other Compensation (4) | Total | ||||||||||||||||||||||||
Elizabeth A. Smith | 2011 | $ | 1,000,000 | $ | 3,000,000 | — | $ | 3,041,066 | $ | 1,197,650 | $ | 308,523 | $ | 8,547,239 | ||||||||||||||||||
Chief Executive Officer | 2010 | 1,000,000 | 1,800,000 | — | — | 1,275,000 | 793,998 | 4,868,998 | ||||||||||||||||||||||||
(Principal Executive Officer) | 2009 | 115,385 | 107,123 | — | 4,447,875 | (5) | — | 150,235 | 4,820,618 | |||||||||||||||||||||||
Dirk A. Montgomery | 2011 | 472,000 | — | — | — | 997,572 | 3,552 | 1,473,124 | ||||||||||||||||||||||||
Chief Financial Officer | 2010 | 472,000 | — | — | 122,546 | (6) | 1,062,000 | 3,349 | 1,659,895 | |||||||||||||||||||||||
(Principal Financial and | 2009 | 472,000 | 212,400 | — | — | 1,188,024 | 3,100 | 1,875,524 | ||||||||||||||||||||||||
Accounting Officer) | ||||||||||||||||||||||||||||||||
David P. Berg (7) | 2011 | 135,616 | 550,000 | — | 1,382,303 | 556,155 | 23,104 | 2,647,178 | ||||||||||||||||||||||||
President of Outback Steakhouse | ||||||||||||||||||||||||||||||||
International, LP | ||||||||||||||||||||||||||||||||
Jody L. Bilney | 2011 | 400,000 | 217,451 | — | 1,094,064 | 563,600 | 4,200 | 2,279,315 | ||||||||||||||||||||||||
Executive Vice President | 2010 | 400,000 | 214,203 | — | 32,023 | (6) | 600,000 | 4,200 | 1,250,426 | |||||||||||||||||||||||
and Chief Brand Officer | 2009 | 400,000 | 336,536 | — | — | 671,200 | 4,200 | 1,411,936 | ||||||||||||||||||||||||
Joseph J. Kadow | 2011 | 497,640 | — | — | 731,465 | 701,175 | 9,620 | 1,939,900 | ||||||||||||||||||||||||
Executive Vice President | 2010 | 497,640 | — | — | 256,035 | (6) | 746,460 | 9,315 | 1,509,450 | |||||||||||||||||||||||
and Chief Legal Officer | 2009 | 497,640 | 149,292 | — | — | 835,040 | 9,188 | 1,491,160 | ||||||||||||||||||||||||
Named Executive Officer | Year | Salary | Bonus (1) | Stock Awards (2) | Option Awards (2) | Non-Equity Incentive Plan Compensation (3) | All Other Compensation (4) | Total | ||||||||||||||||||||||||
Elizabeth A. Smith | 2012 | $ | 941,552 | $ | 22,425,000 | $ | — | $ | — | $ | 932,137 | $ | 151,544 | $ | 24,450,233 | |||||||||||||||||
Chief Executive Officer | 2011 | 1,000,000 | 3,000,000 | — | 3,041,066 | 1,197,650 | 308,523 | 8,547,239 | ||||||||||||||||||||||||
and Chairman of the Board | 2010 | 1,000,000 | 1,800,000 | — | — | 1,275,000 | 793,998 | 4,868,998 | ||||||||||||||||||||||||
David J. Deno (5) | 2012 | 380,769 | 466,000 | — | 2,824,000 | 510,000 | 4,175 | 4,184,944 | ||||||||||||||||||||||||
Executive Vice President | ||||||||||||||||||||||||||||||||
and Chief Financial Officer | ||||||||||||||||||||||||||||||||
Dirk A. Montgomery (6) | 2012 | 472,000 | — | — | — | 397,188 | 32,364 | 901,552 | ||||||||||||||||||||||||
Former Executive Vice | 2011 | 472,000 | — | — | — | 997,572 | 3,552 | 1,473,124 | ||||||||||||||||||||||||
President and Chief Value | 2010 | 472,000 | — | — | 122,546 | (7) | 1,062,000 | 3,349 | 1,659,895 | |||||||||||||||||||||||
Chain Officer | ||||||||||||||||||||||||||||||||
Steven T. Shlemon | 2012 | 500,000 | — | 729,000 | — | 423,938 | 5,352 | 1,658,290 | ||||||||||||||||||||||||
Executive Vice President | 2011 | 500,000 | — | — | — | 579,275 | 4,800 | 1,084,075 | ||||||||||||||||||||||||
and President of Carrabba’s | 2010 | 500,000 | — | — | 203,349 | (7) | 637,500 | 4,800 | 1,345,649 | |||||||||||||||||||||||
Jody L. Bilney (8) | 2012 | 449,039 | 237,450 | — | — | 377,866 | 4,752 | 1,069,107 | ||||||||||||||||||||||||
Former Executive Vice President | 2011 | 400,000 | 217,451 | — | 1,094,064 | 563,600 | 4,200 | 2,279,315 | ||||||||||||||||||||||||
and Chief Brand Officer | 2010 | 400,000 | 214,203 | — | 32,023 | (7) | 600,000 | 4,200 | 1,250,426 | |||||||||||||||||||||||
Jeffrey S. Smith | 2012 | 500,000 | 51,000 | — | — | 480,250 | 5,352 | 1,036,602 | ||||||||||||||||||||||||
Executive Vice President | 2011 | 500,000 | — | — | — | 548,800 | 4,800 | 1,053,600 | ||||||||||||||||||||||||
and President of Outback | 2010 | 500,000 | — | — | 239,375 | (7) | 563,043 | 4,800 | 1,307,218 | |||||||||||||||||||||||
| (1) | Bonus amounts |
| (2) |
| (3) | Non-equity incentive plan compensation represents amounts earned under the |
| cash incentive award at the target amount. See “Compensation Discussion and Analysis—Performance-Based Cash Incentives” for a description of the plans for 2012. |
| (4) | The table below sets forth the |
Index to Financial Statements
All Other Compensation
Named Executive Officer | Year | Life | Auto | Airplane (1) | Reimbursable | Total | Life Insurance (a) | Auto | Relocation | Airplane (b) | Reimburseable Other Expenses (c) | Total | ||||||||||||||||||||||||||||||||||||
Elizabeth A. Smith | 2011 | $ | — | $ | — | $ | 293,789 | $ | 14,734 | $ | 308,523 | $ | 360 | $ | — | $ | — | $ | 80,077 | $ | 71,107 | $ | 151,544 | |||||||||||||||||||||||||
David J. Deno | 675 | — | 3,500 | — | — | 4,175 | ||||||||||||||||||||||||||||||||||||||||||
Dirk A. Montgomery | 2011 | 3,552 | — | — | — | 3,552 | 32,364 | — | — | — | — | 32,364 | ||||||||||||||||||||||||||||||||||||
David P. Berg | 2011 | — | — | — | 23,104 | 23,104 | ||||||||||||||||||||||||||||||||||||||||||
Steven T. Shlemon | 552 | 4,800 | — | — | — | 5,352 | ||||||||||||||||||||||||||||||||||||||||||
Jody L. Bilney | 2011 | — | 4,200 | — | — | 4,200 | 552 | 4,200 | — | — | — | 4,752 | ||||||||||||||||||||||||||||||||||||
Joseph J. Kadow | 2011 | 4,820 | 4,800 | — | — | 9,620 | ||||||||||||||||||||||||||||||||||||||||||
Jeffrey S. Smith | 552 | 4,800 | — | — | — | 5,352 | ||||||||||||||||||||||||||||||||||||||||||
| (a) | The amount in this column for Mr. Montgomery reflects premiums paid by us for an endorsement split-dollar life insurance policy with a death benefit of approximately $5.0 million for Mr. Montgomery, which was purchased in 2006. We were the beneficiary of the policy to the extent of premiums paid or the cash value, whichever is greater, with the balance to be paid to a personal beneficiary designated by the executive. We terminated the agreement obligating us to maintain the policy on February 28, 2013 after Mr. Montgomery’s departure from the Company in January 2013. Amounts for the other named executive officers reflect the cost of group term life insurance provided to our executive officers. |
| (b) | The amount in this column reflects the aggregate incremental cost to |
| (c) | The |
Grants of Plan-Based Awards for Fiscal 2011
Stock Options and Non-Equity Incentives
The following table summarizes for fiscal 2011 the non-equity incentive plan awards under the 2011 Bonus Plan as well as long-term stock incentive awards in the form of stock options:
| Estimated Future Payouts | Estimated Future Payouts Plan Awards | All Other | Exercise | Grant | |||||||||||||||||||||||||||||||||||
Named Executive Officer | Grant | Threshold | Target | Maximum | Threshold | Target | Maximum | |||||||||||||||||||||||||||||||||
Elizabeth A. Smith | ||||||||||||||||||||||||||||||||||||||||
Annual Bonus Plan (1) | — | $ | 340,000 | $ | 850,000 | $ | 1,275,000 | — | — | — | — | $ | — | $ | — | |||||||||||||||||||||||||
Stock Options (2) | 7/1/2011 | — | — | — | — | — | — | 550,000 | 10.03 | 3,041,066 | ||||||||||||||||||||||||||||||
Dirk A. Montgomery | ||||||||||||||||||||||||||||||||||||||||
Annual Bonus Plan (1) | — | 283,200 | 708,000 | 1,062,000 | — | — | — | — | — | — | ||||||||||||||||||||||||||||||
David P. Berg | ||||||||||||||||||||||||||||||||||||||||
Annual Bonus Plan (1) | — | 153,000 | 382,500 | 573,750 | — | — | — | — | — | — | ||||||||||||||||||||||||||||||
Stock Options (2) | 7/1/2011 | — | — | — | — | — | — | 250,000 | 10.03 | 1,382,303 | ||||||||||||||||||||||||||||||
Jody L. Bilney | ||||||||||||||||||||||||||||||||||||||||
Annual Bonus Plan (1) | — | 160,000 | 400,000 | 600,000 | — | — | — | — | — | — | ||||||||||||||||||||||||||||||
Stock Options (2) | 12/9/2011 | — | — | — | — | — | — | 200,800 | 10.03 | 1,094,064 | ||||||||||||||||||||||||||||||
Joseph J. Kadow | ||||||||||||||||||||||||||||||||||||||||
Annual Bonus Plan (1) | — | 199,056 | 497,640 | 746,460 | — | — | — | — | — | — | ||||||||||||||||||||||||||||||
Stock Options (2) | 12/9/2011 | — | — | — | — | — | — | 134,250 | 10.03 | 731,465 | ||||||||||||||||||||||||||||||
Index to Financial Statements
| (7) | Represents the aggregate exchange date incremental fair value of restricted stock and stock option |
| (8) | Ms. Bilney |
Outstanding Equity Awards at Fiscal2012 Year-End
The following table summarizes outstanding stock options and unvested restricted stock awards for each named executive officer as of December 31, 2011.2012. The holder of restricted stock has the right to vote and receive dividends with respect to the shares, but may not transfer or otherwise dispose of the unvested shares. The unvested portion of each restricted stock award is subject to forfeiture if the holder’s employment terminates prior to vesting.
| Options Awards | Stock Awards | Option Awards | Stock Awards | |||||||||||||||||||||||||||||||||||||||||||||||||||||
| Number of Securities Underlying Unexercised Options (#) | Equity Incentive Plan Awards: Number of Securities Underlying Unexercised Unearned Options (#) | Option Exercise Price Per Share (2) | Option Expiration Date | Shares of Restricted Stock Awards That Have Not Vested | Number of Securities Underlying Unexercised Options (#) | Equity Incentive Plan Awards: Number of Securities Underlying Unexercised Unearned Options (#) | Option Exercise Price Per Share (2) | Option Expiration Date | Shares of Restricted Stock Awards That Have Not Vested | |||||||||||||||||||||||||||||||||||||||||||||||
Named Executive Officer | Exercisable | Unexercisable (1) | Number | Market | Exercisable | Unexercisable (1) | Number of Shares (#)(1) | Market Value (3) | ||||||||||||||||||||||||||||||||||||||||||||||||
Elizabeth A. Smith | ||||||||||||||||||||||||||||||||||||||||||||||||||||||||
Stock Options - Grant A - Tranche A (4)(5) | 435,000 | 652,500 | — | $ | 6.50 | 11/16/2019 | — | $ | — | 652,500 | 435,000 | — | $ | 6.50 | 11/16/2019 | — | $ | — | ||||||||||||||||||||||||||||||||||||||
Stock Options - Grant A - Tranche B, C, D (4)(6) | — | — | 3,262,500 | 6.50 | 11/16/2019 | — | — | — | — | 3,262,500 | 6.50 | 11/16/2019 | — | — | ||||||||||||||||||||||||||||||||||||||||||
Stock Options - Grant B | — | 550,000 | — | 10.03 | 7/1/2021 | — | — | 110,000 | 440,000 | — | 10.03 | 7/1/2021 | — | — | ||||||||||||||||||||||||||||||||||||||||||
David J. Deno | — | 400,000 | — | 14.58 | 5/7/2022 | — | — | |||||||||||||||||||||||||||||||||||||||||||||||||
Dirk A. Montgomery | 107,148 | 45,923 | — | 6.50 | 6/14/2017 | 82,300 | 989,246 | 130,108 | 22,963 | — | 6.50 | 6/14/2017 | — | — | ||||||||||||||||||||||||||||||||||||||||||
David P. Berg | — | 250,000 | — | 10.03 | 7/1/2021 | — | — | |||||||||||||||||||||||||||||||||||||||||||||||||
Steven T. Shlemon | 215,900 | 38,100 | — | 6.50 | 10/25/2017 | 50,000 | 782,000 | |||||||||||||||||||||||||||||||||||||||||||||||||
Jody L. Bilney | — | — | — | — | — | 20,575 | 247,312 | |||||||||||||||||||||||||||||||||||||||||||||||||
Stock Options - Grant A | 22,000 | 18,000 | — | 6.50 | 2/11/2018 | — | — | 23,000 | 12,000 | — | 6.50 | 2/11/2018 | — | — | ||||||||||||||||||||||||||||||||||||||||||
Stock Options - Grant B | — | 200,800 | — | 10.03 | 12/9/2021 | — | — | 40,160 | 160,640 | — | 10.03 | 12/9/2021 | — | — | ||||||||||||||||||||||||||||||||||||||||||
Joseph J. Kadow | ||||||||||||||||||||||||||||||||||||||||||||||||||||||||
Stock Options - Grant A | 223,866 | 95,944 | — | 6.50 | 6/14/2017 | — | — | |||||||||||||||||||||||||||||||||||||||||||||||||
Stock Options - Grant B | — | 134,250 | — | 10.03 | 12/9/2021 | — | — | |||||||||||||||||||||||||||||||||||||||||||||||||
Jeffrey S. Smith | 254,150 | 44,850 | — | 6.50 | 10/25/2017 | — | — | |||||||||||||||||||||||||||||||||||||||||||||||||
| (1) | Stock option |
| (2) | In March 2010, we offered all then active executive officers, other than Ms. Smith (since her stock options already had an exercise price of $6.50 per share), and all of our other |
Index to Financial Statements
| stock options were exchanged for unvested replacement stock options that vest and become exercisable over a period of time that is equal to the remaining vesting period of the exchanged stock options, plus one year, subject to the participant’s continued employment through the new vesting date. All eligible stock options were exchanged pursuant to the exchange program. The original stock options were |
| (3) | Market value is calculated by multiplying |
| (4) | On November 16, 2009, we granted Ms. Smith an option to purchase an aggregate of 4,350,000 shares of our common stock under the 2007 |
| without cause or for good reason, each as defined in Ms. Smith’s employment agreement (50% in the event of a termination of employment other than after a |
| (5) | Tranche A stock options vest and become exercisable in equal installments on each of November 16, 2010, 2011, 2012, 2013 and 2014, generally subject to Ms. Smith remaining continuously employed on each vesting date. |
| (6) | Tranches B, C and D stock options vest in equal installments on each of November 16, 2010, 2011, 2012, 2013 and 2014, generally subject to Ms. Smith remaining continuously employed through each vesting date, and will only become exercisable (to the extent then vested) |
Option Exercises and Restricted Stock Vested for Fiscal 20112012
The following table summarizes the exercise of stock options and vesting of restricted stock held by the named executive officers during fiscal 2011. No stock options were exercised during fiscal 2011.2012.
| Option Awards | Restricted Stock Awards | Option Awards | Restricted Stock Awards | |||||||||||||||||||||||||||||
Named Executive Officer | Number of | Value | Number of (#) | Value ($) (1) | Number of | Value | Number of | Value | ||||||||||||||||||||||||
Elizabeth A. Smith | — | $ | — | — | $ | — | — | $ | — | — | $ | — | ||||||||||||||||||||
David J. Deno | — | — | — | — | ||||||||||||||||||||||||||||
Dirk A. Montgomery | — | — | 82,300 | 785,965 | — | — | 82,300 | 1,091,298 | ||||||||||||||||||||||||
David P. Berg | — | — | — | — | ||||||||||||||||||||||||||||
Jody L. Bilney | — | — | 20,575 | 196,491 | ||||||||||||||||||||||||||||
Joseph J. Kadow | — | — | — | — | ||||||||||||||||||||||||||||
Steven T. Shlemon | — | — | — | — | ||||||||||||||||||||||||||||
Jody L. Bilney (2) | 5,000 | 19,200 | 20,575 | 272,825 | ||||||||||||||||||||||||||||
Jeffrey S. Smith | — | — | — | — | ||||||||||||||||||||||||||||
| (1) | Value realized on vesting of restricted stock awards is calculated by multiplying the estimated fair market value of our common stock on June 14, |
On June 14, 2011, 82,300 and 20,575 shares of restricted stock issued to Mr. Montgomery and Ms. Bilney, respectively, vested. In accordance with the terms of the Employee Rollover Agreements and the Restricted Stock Agreements entered into with the executives at the time of the Merger, we loaned approximately $0.3 million and $0.1 million to these individuals, respectively, in June 2011 for their personal income tax and associated interest obligations that resulted from vesting. The loans are full recourse and are collateralized by the
Index to Financial Statements
vested shares of restricted stock. The total outstanding balances of restricted stock loans for the named executive officers as of December 31, 2011 were as follows: Mr. Montgomery, $0.8 million; Mr. Kadow, $0.4 million; and Ms. Bilney, $0.2 million. During the first quarter of 2012, these officers repaid their entire loan balances.
Pension Benefits
The company does not sponsor any defined benefit pension plans.
| (2) | Ms. Bilney exercised options and sold 5,000 shares in the initial public offering. |
Nonqualified Defined Contribution and Other Nonqualified Deferred Compensation Plans
We have a Deferred Compensation Plan for our highly compensated employees who are not eligible to participate in the OSI Restaurant Partners, LLC Salaried Employees 401(k) Plan and Trust, as described in “Compensation Discussion and Analysis—Compensation Elements—Other Benefits and Perquisites.” We do not sponsor any defined benefit pension plans.
The following table summarizes current year contributions during 2012 to our Deferred Compensation Plan by the only named executive officer who participated along with aggregate gains for the year and the aggregate balance as of December 31, 2011.2012. We did not make any contributions to the Deferred Compensation Plan during 2011.2012. Named executive officers are fully vested in all contributions to the plan. The amounts listed as executive contributions are included as “Salary” in the “Summary Compensation Table.” Aggregate earnings of the Deferred Compensation Plan are not included in the “Summary Compensation Table.”
Named Executive Officer | Executive | Aggregate | Withdrawals/ | Aggregate | Executive Contributions in 2012 | Aggregate Earnings in 2012 | Aggregate Withdrawals/ Distributions in 2012 | Aggregate Balance at December 31, 2012 | ||||||||||||||||||||||||
Dirk A. Montgomery | $ | 47,200 | $ | (3,277 | ) | $ | — | $ | 384,031 | $ | 47,200 | $ | 31,637 | $ | — | $ | 462,868 | |||||||||||||||
| (1) | All amounts due to Mr. Montgomery under the Deferred Compensation Plan will be paid in January 2014 as a result of his resignation in January 2013. |
Grants of Plan-Based Awards for 2012
The following table summarizes the performance-based cash incentive awards and long-term stock incentive awards made during 2012.
Named Executive Officer | Grant Date | Estimated Future Payouts Under Non-Equity Incentive Plan Awards (1) | All Other Stock Awards: Number of Shares (#) | All Other Option Awards Number of Securities Underlying Options (#) | Exercise Price of Option Awards ($/Sh) | Grant Date Fair Value of Stock & Option Awards ($) | ||||||||||||||||||||||||||
| Threshold ($) | Target ($) | Maximum ($) | ||||||||||||||||||||||||||||||
Elizabeth A. Smith | ||||||||||||||||||||||||||||||||
Annual Bonus Plan | 470,776 | 941,552 | 1,412,328 | — | — | — | — | |||||||||||||||||||||||||
David J. Deno | ||||||||||||||||||||||||||||||||
Annual Bonus Plan | 255,000 | 510,000 | 765,000 | — | — | — | — | |||||||||||||||||||||||||
Stock Options | 5/7/2012 | — | — | — | — | 400,000 | (2) | 14.58 | 2,824,000 | |||||||||||||||||||||||
Dirk A. Montgomery | ||||||||||||||||||||||||||||||||
Annual Bonus Plan | 200,600 | 401,200 | 601,800 | — | — | — | — | |||||||||||||||||||||||||
Steven T. Shlemon | ||||||||||||||||||||||||||||||||
Annual Bonus Plan | 212,500 | 425,000 | 637,500 | — | — | — | — | |||||||||||||||||||||||||
Restricted Stock | 4/13/2012 | — | — | — | 50,000 | (3) | — | — | 729,000 | |||||||||||||||||||||||
Jody L. Bilney | ||||||||||||||||||||||||||||||||
Annual Bonus Plan | 190,841 | 381,683 | 572,524 | — | — | — | — | |||||||||||||||||||||||||
Jeffrey S. Smith | ||||||||||||||||||||||||||||||||
Annual Bonus Plan | 212,500 | 425,000 | 637,500 | — | — | — | — | |||||||||||||||||||||||||
| (1) | Amounts represent performance-based cash incentive awards under the 2012 Corporate Bonus Plan for Ms. Smith, Ms. Bilney and Messrs. Deno and Montgomery, under the 2012 Carrabba’s Bonus Plan for Mr. Shlemon and under the 2012 Outback Bonus Plan for Mr. Smith. See “Compensation Discussion & Analysis—Performance-Based Cash Incentives.” |
| (2) | This option was granted to Mr. Deno under the 2007 Equity Plan and was subject to the management call option and transfer restrictions until completion of the initial public offering. The option vests as to 20% of the shares on each anniversary of his employment start date, contingent upon his continued employment with us. He forfeits any portion of an option that is unvested upon his termination date. |
| (3) | This award was granted to Mr. Shlemon under the 2007 Equity Plan. The shares vests as to 25% of the shares on each anniversary of the grant date, contingent upon his continued employment with us. He forfeits any shares that are unvested upon his termination date. |
Potential Payments Upon Termination or Change in Control
SummaryEach of Employment Agreements and Other Compensatory Arrangements
We have entered intothe named executive officers is party to an employment agreementsagreement and other arrangements with each of our named executive officersus, which are summarized below, that provide certain rights andmay entitle him or her to payments or benefits upon a termination of employment and/or a change in control. See the table included under “—Executive Benefits and Payments Upon Separation” below for the amount of compensation payable under the employmentthese agreements and other arrangements described below to the individuals serving as named executive officers as of the end of fiscal 2011.2012.
Change in Control Plan
In December 2012, the Compensation Committee recommended, and the Board of Directors approved, the Change in Control Plan, which entitles executive officers and other key employees to certain severance payments and benefits in the event of a qualifying termination of employment upon or within the 24 months following certain change in control events. A qualifying termination is a termination by us for any reason other than cause, or by the employee for good reason, in each case as defined in the Change in Control Plan.
Under the Change in Control Plan, in the event of a qualifying termination within the 24 months following a change in control, the named executive officers are each entitled to receive the following benefits:
a severance payment, payable in a lump sum 60 days after the termination, equal to (a) with respect to Ms. Smith, two times the sum of her base salary and her target annual cash bonus and (b) with respect to the other named executive officers, one and one-half times the sum of base salary and target annual cash bonus;
accelerated vesting of all outstanding equity awards;
continued eligibility to participate in group health benefits for 18 months following the termination;
outplacement services for six months following the termination; and
certain other accrued benefits.
The severance payments and other benefits described above will be reduced by the amount of any similar payments and benefits under any employment agreement or other arrangement with us and are subject to the employee’s compliance with non-competition and other restrictive covenants and the other terms and conditions of the Change in Control Plan.
Rights and Potential Payments Upon Termination or Change in Control: Ms. Smith
Effective November 16, 2009, we entered into an employment agreement with Ms. Smith in connection with the commencement of her employment with us. Her employment agreement is for a period of five years commencing on November 16, 2009,was amended and restated in September 2012 to extend its term to August 13, 2017, subject to earlier termination under certain circumstances described below. The term of her employment is automatically renewed for successive renewal terms of one year unless either party elects not to renew by giving written notice to the other party not less than 60 days prior to the start of any renewal term.
Ms. Smith’s employment may be terminated as follows:
upon her death or Disability (as such term is defined in the agreement);
by us for Cause. For purposes of her employment agreement, “Cause” is defined to include: her (i) willful failure to perform, or gross negligence in the performance of, her duties and responsibilities to us or our affiliates (other than any such failure from incapacity due to physical or mental illness), subject to notice and cure periods, (ii) indictment or conviction of or plea of guilty
Index to Financial Statements
responsibilities to us or our affiliates (other than any such failure from incapacity due to physical or mental illness), subject to notice and cure periods, (ii) indictment or conviction of or plea of guilty or nolo contendere to a felony or other crime involving moral turpitude, (iii) engaging in illegal misconduct or gross misconduct that is intentionally harmful to us or our affiliates or (iv) any material and knowing violation by her of any covenant or restriction contained in her employment agreement or any other agreement entered into with us or our affiliates; |
by us other than for Cause;
by Ms. Smith for Good Reason. For purposes of her employment agreement, “Good Reason” is defined to include: (i) a material diminution in the nature or scope of the executive’s duties, authority or responsibilities, including, without limitation, loss of membership on our or certain of our subsidiaries’ board of directors (with certain listed exceptions), (ii) a reduction of her annual base salary or annual target cash bonus, (iii) requiring her to be based at a location in excess of 50 miles from the location of our principal executive offices in Tampa, Florida as of the effective date of her employment agreement, or (iv) a material breach by us of our obligations under her employment agreement or the Retention Bonus agreement; or
by Ms. Smith other than for Good Reason.
Under Ms. Smith’s employment agreement, she will be entitled to receive severance benefits if her employment is terminated by us other than for Cause or if she terminates employment for Good Reason. If her employment is terminated under these circumstances, she will be entitled to receive severance benefits as follows:
earned but unpaid base salary as of the date of termination, any annual bonus earned in the fiscal year preceding that in which termination occurs that remains unpaid, and unreimbursed expenses, including certain tax gross-up payments through the date of termination; and
severance equal to two times the sum of her base salary at the rate in effect on the date of termination plus her target annual cash bonus for the year of termination, payable in 24 equal monthly installments from the effective date of such termination.
In the event Ms. Smith’s employment is terminated due to her death or Disability, she will receive any earned but unpaid amounts described above as of the date of her employment termination. She will also be entitled to receive a pro rata annual target bonus calculated based on the number of days during the year that she was employed.
A change in control of the companyCompany does not trigger any severance payments to her under the employment agreement.
In addition to the rights and potential payments due Ms. Smith upon termination under her employment agreement, Ms. Smith, upon termination of employment or a change in control, also has certain rights and potential payments due her under the Retention and Incentive Bonus agreements, as described below.
Retention Bonus
On a termination of Ms. Smith’s employment by us without Cause or by her for Good Reason, she will be entitled to receive any then unpaid amounts of the Retention Bonus, whether vested or unvested, and this amount will be reduced (but not below zero) by the severance amount provided under her employment agreement as described above.
Incentive Bonus
Ms. Smith’s Incentive Bonus is divided into four tranches (A-D) of $3.8 million each. Tranche A vests 20% over five years and is paid on the earlier of a Qualifying Liquidity Event or the tenth anniversary of the Incentive Bonus agreement. The other tranches also vest 20% per year over five years, but are generally only
Index to Financial Statements
payable However, in the event of a Qualifying Liquidity Event meeting applicable performance targets for each tranche. If Ms. Smith’s employment is terminated by us other than for Cause or by her for Good Reason prior toqualifying termination within the occurrence of a Qualifying Liquidity Event, the vested portion and 50% of the unvested portion of the tranche A Incentive Bonus will be payable to Ms. Smith upon such termination. In addition, after such a termination, the vested portion and 50% of the unvested portions of the other tranches of the Incentive Bonus (or a percentage thereof) may become payable upon a subsequent Qualifying Liquidity Event meeting applicable performance targets for each tranche. If any such termination occurs24 months following a change in control, all of the tranche A Incentive Bonus will be payable to Ms. Smith, and, if any such change in control meets applicable performance targets for each tranche, the other tranches of the Incentive Bonus will be payable to Ms. Smith to the extent earned. If Ms. Smith is employed by us on the first anniversary of a change in control (or a change in control that meets the relevant performance targets, as applicable), to the extent earned, the then unpaid portion of the Incentive Bonus will be paid to her.
If Ms. Smith’s employment is terminated by reason of her death or Disability, Ms. Smith (or her estate) will be entitled to receive the vested portion of the tranche A Incentive Bonus as of the date of such termination. If a Qualifying Liquidity Event occurs within one year following such a termination, Ms. Smith (or her estate) may also be entitled to receive the vested portions of the other tranches of the Incentive Bonus to the extent such Qualifying Liquidity Event meets applicable performance targets for each tranche.
Upon a voluntary termination of employment, Ms. Smith will not receive any of the Incentive Bonus unless and until a subsequent Qualifying Liquidity Event occurs. Upon such an occurrence, Ms. Smith would be entitled to receive the vested portion of the tranche A Incentive Bonus (as of the date of her termination) and the vested portions of the other tranches of the Incentive Bonus (as of the date of her termination) to the extent the Qualifying Liquidity Event meets applicable performance targets for each tranche.
If Ms. Smith’s employment terminates following an initial public offering that does not meet the applicable share price performance targets, Ms. Smith (or her estate) will be entitled to receive the then time-vested portion of this bonus if the relevant share price targets are subsequently metbenefits described above under “—Change in the one-year period following her termination in the case of termination due to death or Disability or the 90-day period following any other termination of employment.
In the case of a termination for Cause, any unpaid portion of the Incentive Bonus will be forfeited in its entirety.Control Plan.”
Rights and Potential Payments Upon Termination or Change in Control: Messrs. Montgomery and KadowMr. Deno
Mr. Montgomery and Mr. KadowDeno entered into an employment agreementsagreement with us as of June 14, 2007, the Merger closing date. The employment agreements have been amended since that time. Their employment agreements, as amended, wereeffective May 7, 2012 for an original term of five years, commencing on June 14, 2007 and expiring on the fifth anniversary thereof. The terms of their employment agreements are automatically renewed for successive renewal terms of one year unless either party elects not to renew by giving written notice to the other party not less than 60 days prior to the start of any renewal term.
The employment of each executive may be terminated as follows:
upon the executive’s death or Disability (as such term is defined in the agreement); or
by us for Cause. For Mr. Montgomery, “Cause” is defined to include: his (i) gross neglect of duty or prolonged absence from duty (other than any such failure resulting from incapacity due to physical or mental illness), subject to notice and cure periods; (ii) conviction or a plea of guilty or nolo contendere with respect to commission of a felony under federal law or in the last of the stage in which such action occurred; (iii) the willful engaging in illegal misconduct or gross misconduct that
Index to Financial Statements
|
at our election, at any time and including in the event of a determination by us to cease business operations;
by the executive for Good Reason. For purposes of their agreements, “Good Reason” is defined to include: (i) the assignment to the executive of any duties inconsistent in any respect with the executive’s position, duties or responsibilities as in effect immediately prior to the effective date, or any diminution in such position, duties or responsibilities, excluding for this purpose an isolated, insubstantial and inadvertent action not taken in bad faith and that is promptly remedied by us; (ii) a reduction in the executive’s base salary or benefits as in effect immediately prior to the effective date; (iii) requiring the executive to be based at or generally work from any location more than 50 miles from the location at which the executive was based or generally worked immediately prior to the effective date or (iv) the failure by us to provide the fringe benefits provided for in their agreements; or
by the executive without Good Reason.
For all purposes of their agreements, termination for Cause shall be deemed to have occurred on the date of the executive’s resignation when, because of existing facts and circumstances, subsequent termination for Cause can be reasonably foreseen.
Under each executive’s employment agreement, the executive will be entitled to receive severance benefits if his employment is terminated by us other than for Cause or if he terminates employment for Good Reason. If the executive’s employment is terminated under these circumstances, he will be entitled to receive severance benefits as follows:
severance equal to the base salary then in effect and the average of the three most recent annual bonuses paid to the executive, payable in 12 equal monthly installments from the effective date of such termination;
any accrued but unpaid bonus in respect to the fiscal year preceding the year in which such termination of employment occurred;
continuation for one year of medical, dental and vision benefits generally available to executive officers; and
full vesting of life insurance benefits if not already vested.
Their employment agreements provide that they will only receive, upon termination of employment for death or Disability, any accrued but unpaid bonus in respect to the fiscal year preceding that in which termination occurs. The executives must deliver a separation agreement to us within 30 days of their termination dates or their severance will be forfeited. A change in control does not trigger any severance payments to the executive under his employment agreement.
Index to Financial Statements
Rights and Potential Payments Upon Termination or Change in Control: Ms. Bilney
Ms. Bilney entered into an employment agreement with us effective October 1, 2006 and amended effective February 5, 2008. Her employment agreement was for an original term of five years, commencing on October 1, 2006May 7, 2012 and expiring on the fifth anniversary thereof. The term of herhis employment agreement is automatically renewed for successive renewal terms of one year unless either party elects not to renew by giving written notice to the other party not less than 60 days prior to the start of any renewal term.
Ms. Bilney’s
Mr. Deno’s employment may be terminated as follows:
upon herhis death or Disability (as such term is defined in the agreement);
by us for Cause. For purposes of herhis agreement, “Cause” is defined to include: (i) herhis failure to perform the duties assigned to herrequired of him in a manner satisfactory to us, in our sole discretion; (ii) any dishonesty in herhis dealing with us or our affiliates, the commission of fraud by her,him, negligence in the performance of herhis duties, insubordination, willful misconduct, or herhis indictment, charge or conviction (or plea of guilty or nolo contendere) of any felony or any other crime involving dishonesty or moral turpitude; (iii) any violation of any covenant or restriction contained in specified sections of herhis employment agreement; or (iv) any violation of any of our or our affiliates’ material published policies; or
at our election, including upon the sale of majority ownership interest in us or substantially all of our assets or in the event of a determination by us to cease business operations.operations; or
by Mr. Deno for Good Reason. For purposes of his employment agreement, “Good Reason” is defined to include: (i) the assignment to him of any duties inconsistent with his position (including status, offices, titles, and reporting requirements), authority, duties or responsibilities as Executive Vice President and Chief Financial Officer, any diminution in his position, authority, duties or responsibilities (excluding isolated, insubstantial and inadvertent action not taken in bad faith), (ii) a reduction of his base salary or benefits, as in effect on the date of his employment agreement, unless a similar reduction is made in salary and benefits of all of our other executive officers, or (iii) requiring him to be based at a location in excess of 50 miles from the location of our principal executive offices in Tampa, Florida as of the effective date of his employment agreement.
For all purposes of herhis agreement, termination for Cause shall be deemed to have occurred on the date of the executive’s resignation when, because of existing facts and circumstances, subsequent termination for Cause can be reasonably foreseen.
Ms. Bilney’sMr. Deno’s employment agreement provides that shehe will receive severance benefits in the event of a termination of employment by us without Cause.Cause or by him with Good Reason. Under these circumstances, shehe will be entitled to receive an amount equal to the sum of the base salary then in effect payable bi-weekly for one year.
A change in control does not trigger any severance payments to herMr. Deno under herhis employment agreement. However, in the event of a qualifying termination within the 24 months following a change in control, Mr. Deno would be entitled to receive the benefits described above under “—Change in Control Plan.”
Rights and Potential Payments Upon Termination or Change in Control: Mr. BergShlemon
Mr. BergShlemon entered into an employment agreement with Carrabba’s Italian Grill, LLC (“Carrabba’s”), our wholly-owned subsidiary, effective April 27, 2000, which was amended on January 1, 2012. The initial term of his employment agreement was for a period of seven years commencing on April 27, 2000 and expiring on the seventh anniversary thereof subject to earlier termination as described in the termination section of the agreement as explained below. The term of his employment agreement is automatically renewed for successive renewal terms of one year unless either party elects not to renew by giving written notice to the other party not less than 60 days prior to the start of any renewal term.
Mr. Shlemon’s employment may be terminated as follows:
upon his death or Disability (as such term is defined in the agreement);
by Carrabba’s for Cause. For purposes of his agreement, “Cause” is defined to include: (i) any dishonesty in the executive’s dealing with Carrabba’s, the commission of fraud by the executive, negligence in the performance of the duties of the executive, insubordination, willful misconduct, or the conviction (or plea of guilty or nolo contendere) of the executive of any felony or any other crime involving dishonesty or moral turpitude; (ii) any violation of any covenant or restriction contained in specified sections of his employment agreement; or (iii) any violation of any material published policy of Carrabba’s or its affiliates;
at the election of Carrabba’s, including upon the sale of a majority ownership interest in Carrabba’s or substantially all of Carrabba’s assets or in the event of a determination by Carrabba’s to cease business operations; or
by Carrabba’s in its sole discretion, for any reason or no reason.
For all purposes of his agreement, termination for Cause shall be deemed to have occurred on the date of the executive’s resignation when, because of existing facts and circumstances, subsequent termination for Cause can be reasonably foreseen.
Mr. Shlemon’s employment agreement provides that he will only receive severance benefits in the event of a termination of employment if his employment is terminated under the circumstances described in the last bullet above. In this case, he will be entitled to receive as full and complete severance compensation an amount equal to the sum of his base salary then in effect payable bi-weekly for one year.
A change in control does not trigger any severance payments to Mr. Shlemon under his employment agreement. However, in the event of a qualifying termination within the 24 months following a change in control, Mr. Shlemon would be entitled to receive the benefits described above under “—Change in Control Plan.”
Resignation of Mr. Montgomery
Mr. Montgomery resigned from his employment with us effective January 14, 2013. He was not entitled to any payments under his employment agreement or any other arrangements as a result of his resignation. On February 28, 2013, we entered into an agreement with Mr. Montgomery to terminate our obligation to maintain his endorsement split-dollar life insurance policy, which was fully vested at the time of his resignation, in exchange for a $150,000 payment. We also extended the expiration date of his vested options until May 27, 2013.
Resignation of Ms. Bilney
Ms. Bilney resigned from her employment with us effective March 29, 2013. She was not entitled to any payments under her employment agreement or any other arrangements as a result of her resignation.
Rights and Potential Payments Upon Termination or Change in Control: Mr. Smith
Mr. Smith entered into an employment agreement with Outback International,Steakhouse of Florida, LLC (“Outback Steakhouse”), our wholly-owned subsidiary, effective SeptemberApril 12, 20112007 and amended effective November 4, 2011.on January 1, 2009 and January 1, 2012. The initial term of his employment agreement is for a period of five years commencing on SeptemberApril 12, 20112007 and expiring on the fifth anniversary thereof subject to earlier termination as described in the termination section of the agreement as explained below. The term of his employment agreement is automatically renewed for successive renewal terms of one year unless either party elects not to renew by giving written notice to the other party not less than 60 days prior to the start of any renewal term.
Mr. Berg’sSmith’s employment may be terminated as follows:
upon his death or Disability (as such term is defined in the agreement);
by Outback InternationalSteakhouse for Cause. For purposes of his agreement, “Cause” is defined to include: (i) any dishonesty in his dealing with Outback International,Steakhouse, the commission of fraud by the executive,him, negligence in the performance of his duties, insubordination, willful misconduct, or his conviction (or plea of guilty or nolo contendere) of any felony or any other crime involving dishonesty or moral turpitude; (ii) any violation of any covenant or restriction contained in specified sections of his employment agreement; or (iii) any violation of any material published policy of Outback International or its affiliates;
Index to Financial Statements
at the election of Outback International,Steakhouse, including upon the sale of a majority ownership interest in the companyOutback Steakhouse or substantially all the assets of the companyOutback Steakhouse or in the event of a determination by the companyOutback Steakhouse to cease business operations; or
by Outback InternationalSteakhouse in its sole discretion, for any reason or no reason.
For all purposes of his agreement, termination for Cause shall be deemed to have occurred on the date of the executive’s resignation when, because of existing facts and circumstances, subsequent termination for Cause can be reasonably foreseen.
Mr. Berg’sSmith’s employment agreement provides that he will only receive severance benefits in the event of a termination of employment if his employment is terminated by Outback Internationalunder the circumstances described in its sole discretion, for any reason or no reason.the last bullet above. In this case, he will be entitled to receive as full and complete severance compensation an amount equal to the sum of his base salary then in effect payable bi-weekly for one year.
A change in control does not trigger any severance payments to himMr. Smith under his employment agreement. However, in the event of a qualifying termination within the 24 months following a change in control, Mr. Smith would be entitled to receive the benefits described above under “—Change in Control Plan.”
Stock Options and Restricted Stock
Under the 2012 Equity Plan, unless otherwise provided in an individual’s award agreement, upon a termination of employment or service all unvested options and stock appreciation rights will terminate. Unless otherwise provided, vested options and stock appreciation rights must be exercised within certain limited time periods after the date of termination, depending on the reason for termination; provided, however, that if the individual’s employment or service is terminated for cause (as defined in the award agreement), all options and stock appreciation rights, whether vested or unvested, will terminate immediately. The treatmentCompensation Committee may provide for accelerated vesting of equityan award upon, or as a result of events following, a change of control. This may be done in the award agreement or in connection with the change of control. In the event of a change of control, the Compensation Committee may also cause an award to be canceled in exchange for a cash payment to the participant or cause an award to be assumed by a successor corporation.
In December 2012, the Compensation Committee approved forms of award agreements to be used under the 2012 Equity Plan, which supplement the terms of the 2012 Equity Plan applicable to the awards thereunder, including as follows:
The form of option agreement includes a definition of termination for “Cause” (if no definition is otherwise applicable to the award recipient under an employment agreement or arrangement with the Company) upon which all options, whether vested or unvested will be forfeited.
The form of restricted stock award agreement for our directors provides that upon a change of control, the restricted stock will become fully vested.
The form of restricted stock award agreement for our employees and consultants provides that upon a change of control, restricted stock that remains outstanding or is exchanged or converted into securities of the acquiring or successor entity will continue to vest in accordance with the terms set forth in the award agreement. If upon a change of control the restricted stock will be canceled in exchange for cash consideration, in the case of awards held by our executive officers at the time of such change of control, the restricted stock will instead be converted into a right to receive such cash consideration upon satisfaction of the vesting and other terms and conditions of the award agreement in effect immediately prior to the change of control.
The form of performance unit award agreement provides for the establishment of (a) vesting dates on which the award recipient must continue to be employed or otherwise providing service to us and (b) performance criteria to be achieved by us over a performance period and, based on the extent to which the performance criteria are achieved and if the award recipient provided continuous service to us until the vesting date, a corresponding number of performance units subject to the award will vest (which number may range from zero percent to a specified maximum percent of the target number of performance units eligible for vesting based on such criteria). If the award recipient’s employment or other service status with us terminates, the award will terminate as to any units that are unvested at the time of such termination, unless (x) such termination is due to death or disability, in which case a pro rata portion of the award shall vest based on the portion of the performance period for which service was provided, or (y) the termination occurs before the vesting date but after the end of the performance period and is other than for cause (as defined in the agreement), in which case the applicable number of units will vest for that performance period as if such termination had not occurred. The agreement also provides that upon a change of control, if the vesting of the units is accelerated pursuant to the 2012 Equity Plan or the Change in Control Plan, then unless the Compensation Committee determines otherwise, the number of units that will vest for any incomplete performance period as of the change of control will be the target amount.
The terms of outstanding awards held by the named executive officers uponunder the 2007 Equity Plan are described below.
In addition, as described above under “—Change in Control Plan,” in the event of a qualifying termination of employment and/orwith the 24 months following a change in control, is described below.each of our named executive officers will be entitled to accelerated vesting of all outstanding equity awards.
Stock Options: Ms. Smith
Pursuant to the terms of Ms. Smith’s option agreement, upon a termination of Ms. Smith’s employment with us by her for Good Reason or by us other than for Cause, Ms. Smith will be entitled to receive accelerated vesting of her outstanding options (50% in the event of a termination of employment other than after a qualifying change in control and 100% in the event of a termination of employment following a qualifying change in control). A portion of Ms. Smith’s outstanding stock options will become exercisable only following an initial public offering or a change in controlQualifying Liquidity Event in which the value of our common stock exceeds certain minimum thresholds. Thisthresholds at the time of the event and, in the case of an initial public offering, if it is completed, will exceedfor a subsequent six-month period. Our initial public offering met the minimum thresholds.thresholds for a Qualifying Liquidity Event at the time of the offering and the options became exercisable (o the extent the applicable service periods have been met) because the volume-weighted average trading price of our common stock, as defined in the agreement, was equal to or greater than the specified performance targets over a rolling six-month period as of February 3, 2013. The options, to the extent vested, will remain outstanding for a period ranging from 90 days to three years in the case of a termination of Ms. Smith’s employment, depending on the type of option and the nature of the termination, except that all options, whether or not then vested, will be forfeited on a termination for Cause.
Stock OptionsOptions: Messrs. Deno, Shlemon and Restricted Stock: Mr. Montgomery, Mr. Kadow, Ms. Bilney and Mr. BergSmith
Pursuant to agreements with Mr. Montgomery, Mr. Kadow, Ms. BilneyMessrs. Deno, Shlemon and Mr. Berg,Smith, any then outstanding unvested stock options will terminate upon any termination of employment (in connection with a change in control or otherwise).
To the extent the stock option is vested and exercisable prior to the cessation of employment, the stock option will remain exercisable (i)(a) for one year in the case of a termination of employment resulting from death or Disability or (ii)(b) for 90 days following the termination of employment for any other reason.
Restricted Stock: Mr. Shlemon
Pursuant to an agreement with Mr. Montgomery and Ms. Bilney,Shlemon, unvested restricted stock will vest immediately upon (i)(a) a change in control; (ii)(b) termination of the executive by us without Cause; (iii)(c) termination by the executive for Good Reason or (iv)(d) death or Disability. Unvested restricted stock will immediately be forfeited if the executive is terminated by us for Cause.
All of Mr. Kadow’s restricted stock awards are vested. Mr. Berg does not have any outstanding restricted stock awards.
Index to Financial Statements
Restrictive Covenants
Each of the named executive officers is subject to non-competition and other restrictive covenants under his or her employment agreement. Based on the terms of their agreements, each named executive officer has agreed not to compete with us during his or her employment and for a specified period of time following a termination of employment for any reason (Ms. Smith, Ms. Bilney, Mr. Deno, Mr. Shlemon and Mr. BergSmith for a period of 24 months and Messrs.Mr. Montgomery and Kadow for a period of 12 months). Each named executive officer’s continued compliance with this non-competition covenant is a condition to our obligation to pay the severance amounts due under his or her employment agreement, and in the case of Ms. Smith, any amounts due under her Retention Bonus agreement.
Tax Gross-UpAdjustment
If the benefits payable under the Change in Control Plan and other benefits that the executive is entitled to receive from us upon a “changechange in control”control would constitute a “parachute payment” within the meaning of Section 280G of the Code, we will reduce the executive officer’s payments and benefits payable under Treasury Regulations 1.280G-1 occurs, we and our executives, other than Ms. Smith, have agreedthe Change in Control Plan to use commercially reasonable best effortsthe extent necessary so that no portion of the benefits are subject to take such actions as may be necessary to avoid the imposition of any excise tax imposed by Section 4999 of the Code, onbut only if there is a net after-tax benefit to the executive including seeking to obtain stockholder approval in accordance with the terms of Section 280G(b)(5) of the Code. In the case of Ms. Smith, if she does not requestby making that we seek the stockholder approval referenced in the preceding sentence, we will provide her with a gross-up for 50% of any excise taxes imposed under Section 4999 of the Code.reduction.
Life Insurance
We maintainmaintained an endorsement split dollarsplit-dollar life insurance policiespolicy with a $5.0 million death benefit for each of Messrs. Montgomery and Kadow.Mr. Montgomery. We arewere the beneficiary of the policiespolicy to the extent of premiums paid or the cash value, whichever is greater, with the balance being paid to a personal beneficiary designated by the named executive officer. We have agreedMr. Montgomery. Replacing a previous agreement not to terminate the arrangements regardless of continued employment, except that we may terminate Mr. Montgomery’s agreement prior to his completion of seven years of employment with us commencing January 1, 2006.
In the event of termination by us without Cause orentered into a termination byagreement with Mr. Montgomery providing for a termination of our obligation to provide such coverage, which was fully vested at the executivetime of his resignation, in exchange for Good Reason, we will pay the remaining premiums under the policy terms and the named executive officer will become fully vested.a $150,000 payment.
Index to Financial Statements
Executive Benefits and Payments Upon Separation
The table below reflects the amount of compensation payable under the employment agreements and arrangements described above to the individuals serving as named executive officers other than Mr. Montgomery and Ms. Bilney, following a termination of employment (i)(a) by us without Cause or by the executive for Good Reason without a change in control, (ii)(b) by us without Cause or by the executive for Good Reason, following a change in control (iii)assuming that such termination constitutes a qualifying termination under the Change in Control Plan, (c) by the executive voluntarily, (iv)(d) as a result of Disability or (v)(e) as a result of death, in each case, assuming that such termination of employment occurred on December 31, 2011. 2012.
Mr. Montgomery resigned from his employment with us effective January 14, 2013 and was not entitled to any payments under his employment agreement or other arrangements with us. We agreed on February 28, 2013 to terminate our obligation to provide the endorsement split-dollar life insurance policy, which was fully vested at the time of his resignation, in exchange for a $150,000 payment and extended the expiration date of his vested options until May 27, 2013.
Ms. Bilney resigned from her employment with us effective March 29, 2013 and was not entitled to any payments under her employment agreement or other arrangements with us. We did not make any severance or other payments to Ms. Bilney in connection with her resignation.
No payments or benefits are due to the named executive officers following a termination of employment for Cause. The table assumes that the change in control transaction resulted in per share consideration of $12.02,$15.64, which was the fair market valueclosing price per share of a share ofour common stock on the Nasdaq Global Select Market on December 31, 2011, as determined by an independent stock valuation.2012. The actual amounts to be paid upon a termination of employment or a change in control can only be determined at the time of such executive’s separation from us, or upon the occurrence of a change in control (if any).
Named Executive Officer | Executive Payments and | Involuntary | Involuntary | Voluntary | Disability ($) | Death ($) | ||||||||||||||||
Elizabeth A. Smith (2) | Severance | $ | 3,700,000 | $ | 3,700,000 | $ | — | $ | — | $ | — | |||||||||||
Stock Options (3) | 4,202,100 | 21,045,000 | — | 2,401,200 | 2,401,200 | |||||||||||||||||
Incentive Bonus | 2,664,375 | 15,225,000 | — | 1,522,500 | 1,522,500 | |||||||||||||||||
Retention Bonus | 3,500,000 | 3,500,000 | — | — | — | |||||||||||||||||
|
|
|
|
|
|
|
|
|
| |||||||||||||
Total | $ | 14,066,475 | $ | 43,470,000 | $ | — | $ | 3,923,700 | $ | 3,923,700 | ||||||||||||
|
|
|
|
|
|
|
|
|
| |||||||||||||
Dirk A. Montgomery | Severance | $ | 1,625,332 | $ | 1,625,332 | $ | — | $ | — | $ | — | |||||||||||
Stock Options (3) | 591,457 | 591,457 | 591,457 | 591,457 | 591,457 | |||||||||||||||||
Health and Welfare Benefits | 7,940 | 7,940 | — | — | — | |||||||||||||||||
Split Dollar Life Insurance (4) | — | — | — | — | 5,000,000 | |||||||||||||||||
Restricted Stock (5) | 989,246 | 989,246 | — | 989,246 | 989,246 | |||||||||||||||||
|
|
|
|
|
|
|
|
|
| |||||||||||||
Total | $ | 3,213,975 | $ | 3,213,975 | $ | 591,457 | $ | 1,580,703 | $ | 6,580,703 | ||||||||||||
|
|
|
|
|
|
|
|
|
| |||||||||||||
David P. Berg | Severance (7) | $ | 450,000 | $ | — | $ | — | $ | — | $ | — | |||||||||||
Stock Options (3) | — | — | — | — | — | |||||||||||||||||
|
|
|
|
|
|
|
|
|
| |||||||||||||
Total | $ | 450,000 | $ | — | $ | — | $ | — | $ | — | ||||||||||||
|
|
|
|
|
|
|
|
|
| |||||||||||||
Jody L. Bilney | Severance (6) | $ | 400,000 | $ | — | $ | — | $ | — | $ | — | |||||||||||
Stock Options (3) | 121,440 | 121,440 | 121,440 | 121,440 | 121,440 | |||||||||||||||||
Restricted Stock (5) | 247,312 | 247,312 | — | 247,312 | 247,312 | |||||||||||||||||
|
|
|
|
|
|
|
|
|
| |||||||||||||
Total | $ | 768,752 | $ | 368,752 | $ | 121,440 | $ | 368,752 | $ | 368,752 | ||||||||||||
|
|
|
|
|
|
|
|
|
| |||||||||||||
Joseph J. Kadow | Severance | $ | 1,308,296 | $ | 1,308,296 | $ | — | $ | — | $ | — | |||||||||||
Stock Options (3) | 1,235,740 | 1,235,740 | 1,235,740 | 1,235,740 | 1,235,740 | |||||||||||||||||
Health and Welfare Benefits | 14,442 | 14,442 | — | — | — | |||||||||||||||||
Split Dollar Life Insurance (4) | — | — | — | — | 5,000,000 | |||||||||||||||||
|
|
|
|
|
|
|
|
|
| |||||||||||||
Total | $ | 2,558,478 | $ | 2,558,478 | $ | 1,235,740 | $ | 1,235,740 | $ | 6,235,740 | ||||||||||||
|
|
|
|
|
|
|
|
|
| |||||||||||||
Named Executive Officer | Executive Payments and | Involuntary | Involuntary | Voluntary | Disability | Death ($) | ||||||||||||||||
Elizabeth A. Smith (2) | Severance | $ | 2,891,552 | $ | 3,766,209 | $ | — | $ | — | $ | — | |||||||||||
Stock Options (3) | 7,574,925 | 42,844,500 | 617,100 | 4,593,000 | 4,593,000 | |||||||||||||||||
Health and Welfare Benefits | — | 17,574 | — | — | — | |||||||||||||||||
|
|
|
|
|
|
|
|
|
| |||||||||||||
Total | $ | 10,466,477 | $ | 46,628,283 | $ | 617,100 | $ | 4,593,000 | $ | 4,593,000 | ||||||||||||
|
|
|
|
|
|
|
|
|
| |||||||||||||
David J. Deno | Severance | $ | 600,000 | $ | 1,665,000 | $ | — | $ | — | $ | — | |||||||||||
Stock Options (3) | — | 424,000 | — | — | — | |||||||||||||||||
Health and Welfare Benefits | — | 20,476 | — | — | — | |||||||||||||||||
|
|
|
|
|
|
|
|
|
| |||||||||||||
Total | $ | 600,000 | $ | 2,109,476 | $ | — | $ | — | $ | — | ||||||||||||
|
|
|
|
|
|
|
|
|
| |||||||||||||
Steven T. Shlemon | Severance | $ | 500,000 | $ | 1,387,500 | $ | — | $ | — | $ | — | |||||||||||
Stock Options (3) | 1,973,326 | 2,321,560 | 1,973,326 | 1,973,326 | 1,973,326 | |||||||||||||||||
Restricted Stock | 782,000 | 782,000 | — | 782,000 | 782,000 | |||||||||||||||||
Health and Welfare Benefits | — | 17,861 | — | — | — | |||||||||||||||||
|
|
|
|
|
|
|
|
|
| |||||||||||||
Total | $ | 3,255,326 | $ | 4,508,921 | $ | 1,973,326 | $ | 2,755,326 | $ | 2,755,326 | ||||||||||||
|
|
|
|
|
|
|
|
|
| |||||||||||||
Jeffrey S. Smith | Severance (4) | $ | 500,000 | $ | 1,387,500 | $ | — | $ | — | $ | — | |||||||||||
Stock Options (3) | $ | 2,322,931 | $ | 2,732,860 | $ | 2,322,931 | $ | 2,322,931 | $ | 2,322,931 | ||||||||||||
Health and Welfare Benefits | $ | — | $ | 17,861 | $ | — | $ | — | $ | — | ||||||||||||
|
|
|
|
|
|
|
|
|
| |||||||||||||
Total | $ | 2,822,931 | $ | 4,138,221 | $ | 2,322,931 | $ | 2,322,931 | $ | 2,322,931 | ||||||||||||
|
|
|
|
|
|
|
|
|
| |||||||||||||
| (1) | Amounts in the table do not include amounts for accrued but unpaid base salary, annual bonus or other |
| (2) | This table |
Index to Financial Statements
| (3) | Amounts represent intrinsic value of vested stock options since the fair market value of a share of our common stock, as of December 31, |
| (4) |
Director Compensation
The Compensation Committee has determined that directors who are not our employees, Founders or associated with our Sponsors receive the following compensation for their service on our Board of Directors:
An annual retainer of $90,000;
An additional annual retainer of $20,000 for serving as chair and $10,000 for serving as a member (other than the chair) of the Audit Committee;
An additional annual retainer of $15,000 for serving as chair and $7,500 for serving as a member (other than the chair) of the Compensation Committee;
An additional annual retainer of $10,000 for serving as chair and $5,000 for serving as a member (other than the chair) of the Nominating and Corporate Governance Committee; and
An annual grant of restricted stock having a fair market value of $100,000 vesting as to one-third of the shares subject to the grant on each anniversary of the grant date, granted under our 2012 Equity Plan.
The following table summarizes the amounts earned and paid to members of our board ofnon-employee directors for 2011:during 2012:
Name | Fees | Stock | Option | Non-Equity | Change in | All Other | Total ($) | |||||||||||||||||||||
A. William Allen III (1) | $ | 200,000 | $ | — | $ | — | $ | — | $ | — | $ | 4,200 | $ | 204,200 | ||||||||||||||
Andrew Balson (2) | — | — | — | — | — | — | — | |||||||||||||||||||||
Robert D. Basham (3) | — | — | — | — | — | 325,300 | 325,300 | |||||||||||||||||||||
J. Michael Chu (2) | — | — | — | — | — | — | — | |||||||||||||||||||||
Philip Loughlin (2) | — | — | — | — | — | — | — | |||||||||||||||||||||
Mark Nunnelly (2) | — | — | — | — | — | — | — | |||||||||||||||||||||
Elizabeth A. Smith | * | * | * | * | * | * | * | |||||||||||||||||||||
Chris T. Sullivan (3) | — | — | — | — | — | 323,100 | 323,100 | |||||||||||||||||||||
Mark Verdi (2) | — | — | — | — | — | — | — | |||||||||||||||||||||
Name | Fees | Stock | Option | Non-Equity | Change in | All Other | Total ($) | |||||||||||||||||||||
Andrew B. Balson (2) | $ | — | $ | — | $ | — | $ | — | $ | — | $ | — | $ | — | ||||||||||||||
Robert D. Basham (3)(4) | — | — | — | — | — | 464,769 | 464,769 | |||||||||||||||||||||
J. Michael Chu (2) | — | — | — | — | — | — | — | |||||||||||||||||||||
Mindy Grossman | 50,000 | 100,000 | — | — | — | — | 150,000 | |||||||||||||||||||||
David Humphrey (2)(5) | — | — | — | — | — | — | — | |||||||||||||||||||||
Philip H. Loughlin (2)(5) | — | — | — | — | — | — | — | |||||||||||||||||||||
John J. Mahoney | 82,500 | 100,000 | — | — | — | — | 182,500 | |||||||||||||||||||||
Mark E. Nunnelly (2) | — | — | — | — | — | — | — | |||||||||||||||||||||
Chris T. Sullivan (3) | — | — | — | — | — | 464,769 | 464,769 | |||||||||||||||||||||
Mark Verdi (2)(6) | — | — | — | — | — | — | — | |||||||||||||||||||||
| (1) |
| (2) | Directors are associated with |
| (3) | Mr. Basham and Mr. Sullivan are two of our Founders, |
Index to Financial Statements
| (4) | Mr. Basham’s term as a Director ended at our annual meeting on April 24, 2013. |
| (5) | Mr. Loughlin resigned from and Mr. Humphrey was appointed to the Board of Directors effective September 2012. |
| (6) | Mr. Verdi resigned from the Board of Directors effective May 2012. |
Equity Incentive Plans
2012 Incentive Award Plan
In connection with thisour initial public offering, our boardBoard of directors plans to adoptDirectors adopted the Bloomin’ Brands, Inc. 2012 Incentive Award Plan (the “2012 Incentive Plan”).Equity Plan. The 2012 IncentiveEquity Plan will replacereplaced our 2007 IncentiveEquity Plan (described below). The following summary describes the material terms of the 2012 IncentiveEquity Plan. This summary is not a complete description of all provisions of the 2012 IncentiveEquity Plan and is qualified in its entirety by reference to the 2012 IncentiveEquity Plan, a copy of which will behas been filed with the SEC.
PurposePurpose.. The purposes of the 2012 IncentiveEquity Plan are to motivate and reward employees and other individuals who are expected to contribute significantly to our success to perform at the highest level and to further our best interests.
AdministrationAdministration.. The 2012 IncentiveEquity Plan will beis administered by our compensation committee.Compensation Committee. The compensation committee will haveCompensation Committee has the authority to, among other things, designate recipients, determine the types, amounts and terms and conditions of awards, and to take other actions necessary or desirable for the administration of the 2012 IncentiveEquity Plan. The compensation committee willCompensation Committee also havehas authority to implement certain clawback policies and procedures, and may provide for clawbacks as a result of financial restatements in an award agreement.
Authorized SharesShares.. Subject to adjustment as described in the 2012 IncentiveEquity Plan, the maximum number of shares of our common stock available for issuanceissuable pursuant to the 2012 IncentiveEquity Plan is initiallycurrently 5,422,469 shares. As of the first business day of each fiscal year, commencing on January 1, 2013, the aggregate number of shares that may be issued pursuant to the 2012 IncentiveEquity Plan will automatically increase by a number equal to %2% of the total number of our shares then issued and outstanding. Shares underlying awards that are expired, forfeited, or otherwise terminated without the delivery of shares, or are settled in cash, will again be available for issuance under the 2012 IncentiveEquity Plan.
EligibilityEligibility.. Awards may be granted to employees, consultants and directors.Directors. In certain circumstances, we may also grant substitute awards to holders of equity-based awards of a company that we acquire or combine with (a “substitute award”).
Types of AwardsAwards.. The 2012 IncentiveEquity Plan provides for grants of stock options, stock appreciation rights, restricted stock and restricted stock units, performance awards and other stock-based awards determined by the compensation committee.Compensation Committee.
��
| • | Stock Options. The exercise price of an option is not permitted to be less than the fair market value of a share of our common stock on the date of grant, other than in the case of a substitute award. The |
of an option may not exceed ten years from the grant date. However, the committee may provide for an extension of such ten-year term in an award agreement if exercise at expiration would be prohibited by law or our insider trading policy. Options may be granted as incentive stock options that meet the requirements of Section 422 of the Internal Revenue Code. |
| • | Stock Appreciation Rights. A stock appreciation right is an award that entitles the participant to receive stock or cash upon exercise or settlement that is equal to the excess of the value of the shares subject to the right over the exercise or hurdle price of the right. The exercise or hurdle price is not permitted to be less than the fair market value of a share of our common stock on the date of |
Index to Financial Statements
grant, other than in the case of a substitute award. The |
| • | Restricted Stock and Restricted Stock Units. A restricted stock award is an award of our common stock subject to vesting restrictions. A restricted stock unit is a contractual right to receive cash, shares or a combination of both based on the value of a share of our common stock. The |
| • | Performance Awards. A performance award is an award, which may be stock-based or cash-based, that |
| • | Other Stock-Based Awards. The |
Termination of Employment or ServiceService.. The compensation committee will determineCompensation Committee determines the effect of a termination of employment or service on an award. However, unless otherwise provided in the award agreement or thereafter, upon a termination of employment or service all unvested options and stock appreciation rights will terminate. Unless otherwise provided, vested options and stock appreciation rights must be exercised within certain limited time periods after the date of termination, depending on the reason for termination; provided, however,except that if a participant’s employment or service is terminated for cause (as will be defined in the award agreement), all options and stock appreciation rights, whether vested or unvested, will terminate immediately.
Performance Measures. The 2012 IncentiveEquity Plan provides that grants of performance awards willare to be made based upon, and subject to achieving, one or more performance measures over a performance period of not less than one year established by the compensation committee.Compensation Committee.
If the compensation committeeCompensation Committee intends that a performance award qualify as performance-based compensation for purposes of Section 162(m) of the Internal Revenue Code, the award agreement will include a pre-established formula, such that payment, retention or vesting of the award is subject to the achievement of one or more performance measures during a performance period. The performance measures must be specified in the award agreement or by the compensation committeeCompensation Committee within the first 90 days of the performance period. Performance measures may be established on an absolute or relative basis, and may be established on a corporate-wide basis or with respect to one or more concepts, business units, divisions, subsidiaries or business segments. Relative performance may be measured against a group of peer companies, a financial market index or other acceptable objective and quantifiable indices.
A performance measure with respect to a performance award intended to qualify as performance-based compensation for purposes of Section 162(m) means one or more of the following measures with respect to the company
Company or our restaurant concepts: sales; revenue; net sales; net revenue; revenue or sales growth or product revenue or sales growth; comparable or same restaurant sales; system-wide sales; operating income (before or after taxes); pre- or after-tax income or loss (before or after allocation of corporate overhead and bonus); net earnings; earnings per share; net income or loss (before or after taxes); return on equity; total shareholderstockholder return; return on assets or net assets; appreciation in and/or maintenance of share price; market share; gross profits; earnings or loss (including earnings or loss before taxes, interest and taxes, or interest, taxes, depreciation and amortization including, in each case, specified adjustments); economic value-added models or equivalent metrics; comparisons with various stock market indices; reductions in costs; cash flow or cash flow per share (before or after dividends); return on
Index to Financial Statements
capital (including return on total capital or return on invested capital); cash flow return on investment; improvement in or attainment of expense levels or working capital levels, including cash, inventory and accounts receivable; operating margin; gross margin; cash margin; year-end cash; debt reduction; shareholderstockholder equity; operating efficiencies; market share; customer satisfaction; customer growth; employee satisfaction; research and development achievements; regulatory achievements (including submitting or filing applications or other documents with regulatory authorities or receiving approval of any such applications or other documents and passing pre-approval inspections); financial ratios, including those measuring liquidity, activity, profitability or leverage; cost of capital or assets under management; financing and other capital raising transactions (including sales of the company’sCompany’s equity or debt securities; sales or licenses of the company’sCompany’s assets, including its intellectual property, whether in a particular jurisdiction or territory or globally; or through partnering transactions); and implementation, completion or attainment of measurable objectives with respect to research, development, commercialization, products or projects, production volume levels, acquisitions and divestitures; and recruiting and maintaining personnel.
With respect to any award intended to qualify as performance-based compensation for purposes of Section 162(m), no participantmore than the following amounts of awards may be awarded to any participant during any calendar year, subject to adjustment as described in the 2012 Incentive Plan, more than the following amounts of awards:Equity Plan: (i) options and stock appreciation rights that relate to 2,000,000 shares of common stock; (ii) performance awards that relate to 1,000,000 shares of common stock and (iii) cash awards that relate to $ .$6.0 million.
TransferabilityTransferability.. Awards under the plan generally may not be transferred except through will or by the laws of descent and distribution. However, if provided in an award agreement (for awards other than incentive stock options), certain additional transfers may be permitted in limited circumstances.
Change of Control.The compensation committeeCompensation Committee may provide for accelerated vesting of an award upon, or as a result of events following, a change of control (as defined in the 2012 IncentiveEquity Plan). This may be done in the award agreement or in connection with the change of control. In the event of a change of control, the compensation committeeCompensation Committee may also cause an award to be canceled in exchange for a cash payment to the participant or cause an award to be assumed by a successor corporation.
No Repricing.Stockholder approval will beis required in order to reduce the exercise or hurdle price of an option or stock appreciation right or to cancel such an award in exchange for a new award when the exercise or hurdle price is below the fair market value of the underlying common stock.
Amendment and TerminationTermination.. The boardBoard of directorsDirectors may amend or terminate the 2012 IncentiveEquity Plan. ShareholderStockholder approval (if required by law or stock exchange rule) or participant consent (if the action would materially adversely affect the participant’s rights) may be required for certain actions. The 2012 IncentiveEquity Plan will terminate on the earliest of: (i) ten years from its effective date and (ii) when the boardBoard of directorsDirectors terminates the 2012 IncentiveEquity Plan.
2007 Equity Incentive Plan
The following is a description of the material terms of our 2007 Equity Incentive Plan, which we refer to as the “2007 Incentive Plan.” This summary is not a complete description of all provisions of the 2007 IncentiveEquity Plan and is qualified in its entirety by reference to the
2007 IncentiveEquity Plan, a copy of which has been filed with the SEC. Following this offering, we willWe no longer makegrant awards under the 2007 IncentiveEquity Plan and will instead makegrant awards under the 2012 IncentiveEquity Plan (described above). However, 2007 IncentiveEquity Plan will continuecontinues to govern outstanding awards madegranted under it.
AdministrationAdministration.. The 2007 IncentiveEquity Plan is administered by our boardBoard of directors,Directors, subject to delegation to a committee or other persons in certain circumstances. The board will delegate administration of the 2007
Index to Financial Statements
Incentive Plan following this offering to the compensation committee. The administrator has the authority to interpret the 2007 IncentiveEquity Plan, to determine eligibility for and grant awards, to determine, modify or waive the terms and conditions of awards, and otherwise to do all things necessary to carry out the purposes of the 2007 IncentiveEquity Plan.
Authorized SharesShares.. As of March 15, 2012,May 6, 2013, options to purchase 11,863,37810,133,551 shares of our common stock at a weighted average exercise price of approximately $7.52$7.67 were outstanding under the 2007 IncentiveEquity Plan. Subject to adjustment, the maximum number of shares of common stock that may be delivered in satisfaction ofAs noted above, we no longer grant awards under the 2007 Incentive Plan is 12,350,000. As noted above, we will no longer make awards under the 2007 Incentive Plan following this offering.
Eligibility. The administrator selected participants from among our key employees, directors, consultants and advisors.
Types of Awards. The 2007 Incentive Plan provides for grants of stock options and restricted stock. The exercise price of an option is not permitted to be less than the fair market value of a share of common stock on the date of grant. Options may not have a term that exceeds ten years from the grant date. Additional requirements may apply to options intended to be incentive stock options under Section 422 of the Internal Revenue Code.Equity Plan.
Termination of EmploymentEmployment.. Unless otherwise provided by the administrator, upon a termination of employment all unvested awards will beare forfeited. Unless otherwise provided, vested options must be exercised within certain limited time periods after the date of termination, depending on the reason for termination; provided, however, that if a participant’s employment is terminated for cause, all options will terminate immediately.
TransferabilityTransferability.. Awards under the 2007 IncentiveEquity Plan may not be transferred except through will or by the laws of descent and distribution.
Corporate TransactionsTransactions.. In the event of certain corporate transactions (including dissolution or liquidation, the sale of substantially all of the assets, or certain mergers or consolidations), unless otherwise provided in connection with a particular award, the administrator may provide for substitution of new awards for outstanding awards or may cancel awards in exchange for a cash payments based on the value of the award, in each case subject to restrictions that the administrator deems appropriate.
Amendment and TerminationTermination.. The administrator may amend or terminate the 2007 IncentiveEquity Plan. ShareholderStockholder approval (if required by law) or participant consent (if the action would materially adversely affect the participant’s rights) may be required for certain actions.
Index to Financial Statements
Review, Approval or Ratification of Transactions with Related Persons
Our Board of Directors has adopted a written Code of Business Conduct and Ethics. The Code of Business Conduct and Ethics requires each member of the Board of Directors and each member of management and the management of our subsidiaries and of each of our significant affiliates to disclose to the Chief Legal Officer and/or Audit Committee, as applicable, the material terms of any related person transaction, including the approximate dollar value of the amount involved in the transaction, and all the material facts as to the related person’s direct or indirect interest in, or relationship to, the related person transaction. The Chief Legal Officer and/or Audit Committee must advise the Board of Directors of the related person transaction and any requirement for disclosure in our applicable filings under the Securities Act or the Exchange Act and related rules, and, to the extent required to be disclosed, management must ensure that the related person transaction is disclosed in accordance with such acts and related rules.
The transactions below were reviewed under our Code of Business Conduct and Ethics or, with respect to transactions prior to our initial public offering, under a similar written code of business conduct and ethics of OSI.
Arrangements With Our InvestorsSponsors and Founders
Management Agreement
Upon completion of the Merger, we entered into a management agreement with Kangaroothe Management Company, I, LLC, as the management company, whose members are theour Founders and entities affiliatedassociated with Bain Capital and Catterton.our Sponsors. In accordance with the management agreement, the management company providesManagement Company was to provide management services to us until the tenth anniversary of the completion of the Merger, with one-year extensions thereafter until terminated. The management company receivesagreement provided that it would terminate automatically immediately prior to our completion of an initial public offering. Under the terms of the agreement, the Management Company received an aggregate annual management fee equal to $9.1 million and reimbursement for out-of-pocket and other reimbursable expenses incurred by it, its members, or their respective affiliates in connection with the provision of services pursuant to the agreement. The management agreement also included customary exculpation and indemnification provisions in favor of the Management Company, Bain Capital and Catterton and their respective affiliates.
In May 2012, we amended the management agreement to provide that if the management agreement was terminated due to our completion of an initial public offering in 2012, the Management Company would receive, within 60 days of completion of the initial public offering, but in all events on or before December 31, 2012, a termination fee of $8.0 million. This termination fee was payable in addition to the pro-rated periodic fee as provided in the management agreement. The management agreement terminated in connection with our initial public offering in August 2012, and we paid management fees to the Management Company, including the termination fee, out-of-pocket and other reimbursable expenses, of approximately $13.8 million for the year ended December 31, 2012. We paid management fees, including out-of-pocket and other reimbursable expenses, of $9.4 million $11.6 million, $10.7 million, $9.9 million and $5.2$11.6 million for the years ended December 31, 2011 and 2010, 2009, 2008 and the period from June 15 to December 31, 2007, respectively, were included in General and administrative expenses in our Consolidated Statement of Operations.
The management agreement includes customary exculpation and indemnification provisions in favor of the management company, Bain Capital and Catterton and their respective affiliates. The management agreement may be terminated by us, Bain Capital and Catterton at any time and will terminate automatically upon the completion of this offering or a change of control.respectively.
Stockholders Agreement
In connection with the Merger, we entered into a stockholders agreement with our Sponsors, Founders and certain other investors, stockholders and executive officers.stockholders. In connection with the completion of thisthe initial public offering, all of the provisions of the stockholders agreement will have been terminated in accordance with the terms of the stockholders agreement.
On August 7, 2012, we entered into the Stockholders Agreement with our Sponsors and two of our Founders that became effective upon consummation of the initial public offering. This Stockholders Agreement
grants our Sponsors the right, subject to certain conditions, to nominate representatives to our Board of Directors and committees of our Board of Directors. As long as the Sponsors collectively own (directly or indirectly) more than 15% of our outstanding common stock, Bain Capital has the right to designate two nominees and Catterton has the right to designate one nominee for election to our Board of Directors. However, if Catterton’s ownership level falls below 1% of our outstanding common stock, Catterton will no longer have a right to designate a nominee and Bain Capital will have the right to designate three nominees for election to our Board of Directors. If at any time the Sponsors own more than 3% and less than 15% of our outstanding common stock, Bain Capital will have the right to designate two nominees for election to our Board of Directors. However, if at the time of the nomination, Catterton’s ownership percentage of our outstanding common stock is greater than Bain Capital’s ownership percentage, each of Bain Capital and Catterton will have the right to designate one nominee for election to our Board of Directors. Bain Capital also has certain contractual rights to have one of its nominees serve on each committee of our Board of Directors, other than the audit committee, as long as the Sponsors collectively own (directly or indirectly) at least 35% of our outstanding common stock. In addition, as long as the Sponsors collectively own (directly or indirectly) more than 40% of our outstanding common stock, our Board of Directors must not, and we are required to take all necessary action to ensure that our Board of Directors does not, exceed nine directors, unless Bain Capital requests that the size of the Board of Directors be increased up to the maximum permitted under our organizational documents and appoints directors to fill the vacancies.
Registration Rights Agreement
In connection with the Merger, we entered into a registration rights agreement with our Sponsors, Founders and certain other stockholders. The registration rights agreement provides ourprovided the Sponsors and Founders with certain demand registration rights following the expiration of the 180-day lock-up period in respect of the shares of our common stock held by them. The Sponsors, Founders and certain other stockholders exercised their rights under the agreement and sold common stock in our initial public offering.
In addition,connection with our initial public offering, on August 7, 2012, we amended and restated the registration rights agreement to remove provisions that apply to an initial public offering, to facilitate charitable giving in connection with securities offerings and to make other clarifying changes. Under the amended and restated agreement, in the event that we register additional shares of common stock for sale to the public, following the completion of this offering, we are required to give notice of such registration to the Sponsors, two of our SponsorsFounders and thecertain other stockholders party to the agreement of our intention to effect such a registration, and, subject to certain limitations, our Sponsors and such holdersstockholders have piggyback registration rights providing them with the right to require us to include in such registration the shares of common stock held by them in such registration.(excluding any shares that may be disposed of under Rule 144 without a volume limitation). We are required to bear the registration expenses, other than underwriting discounts and commissions and transfer taxes, associated with any registration of shares by the Sponsors, two of our SponsorsFounders or other holders described above. The registration rights agreement also contains certain restrictions on the sale of shares by the Sponsors and two of our Sponsors.Founders. The registration rights agreement includes customary indemnification provisions in favor of any person who is or might be deemed a controlling person within the meaning of Section 15 of the Securities Act or Section 20 of the Exchange Act, who wethe Company refer to as controlling persons, and related parties against liabilities under the Securities Act incurred in connection with the registration of any of our debt or equity securities. These provisions provide indemnification against certain liabilities arising under the Securities Act and certain liabilities resulting from violations of other applicable laws in connection with any filing or other disclosure made by us under the securities laws relating to any such registration. We have agreed to reimburse such persons for any legal or other expenses incurred in connection with investigating or defending any such liability, action or proceeding, except that we are not required to indemnify any such person or reimburse related legal or other expenses if such loss or expense arises out of or is based on any untrue statement or omission made in reliance upon and in conformity with written information provided by such person.
Index to Financial Statements
Other Arrangements
Tax Loans
Shares of our restricted stock issued to certain of our current and former executive officers and other members of management vest each June 14 through 2012. In accordance with the terms of their applicable agreements, we loaned an aggregate of $0.9 million, $0.7 million and $3.3 million to these individuals in 2011, 2010 and 2009, respectively, for their personal income tax and associated interest obligations that resulted from vesting of restricted stock. As of December 31, 2011, a total of $7.2 million of loans to current and former executive officers and other members of management were outstanding. The loans are full recourse and are collateralized by the vested shares of our restricted stock. Although these loans are permitted in accordance with the terms of the agreements, we are not required to issue them in the future. The 2011 loan amounts for our board members and/or executive officers were as follows: Jody L. Bilney, $0.1 million and Dirk A. Montgomery, $0.3 million . The 2010 loan amounts for our board members and/or executive officers were as follows: A. William Allen III, $0.1 million; Ms. Bilney, $0.1 million; Joseph J. Kadow, $6,000; Mr. Montgomery, $0.2 million; Richard L. Renninger, $0.1 million; and Irene D. Wenzel, $10,000. The 2009 loan amounts for our board members or executive officers were as follows: Mr. Allen, $1.6 million; Paul E. Avery, $1.1 million; Ms. Bilney, $28,000; Mr. Kadow, $0.3 million; Mr. Montgomery, $0.1 million; and Mr. Renninger, $28,000. The total amounts outstanding for our board members or executive officers as of December 31, 2011 were as follows: Mr. Allen, $2.6 million, Mr. Montgomery, $0.8 million; Mr. Kadow, $0.4 million; and Ms. Bilney $0.2 million, which were the largest amounts outstanding during 2011 for each of these individuals. There were no amounts repaid by any executive officer and/or director during 2011. Ms. Bilney and Messrs. Kadow and Montgomery fully repaid their loans in the first quarter of 2012, and as of March 15, 2012, there were no amounts outstanding for our current board members or executive officers.
MVP LRS, LLCLease Payments
In 2011,the three months ended March 31, 2013, MVP, LRS, LLC, an entity owned primarily by theour Founders (two(one of whom areis also members of our board of directors)Director) paid us a total ofapproximately $0.2 million and in 2012, 2011 and 2010. MVP paid us approximately $0.6 million ofper year in lease payments for two restaurants in its Lee Roy Selmon’s concept, which was purchased from us in 2008. We also guarantee lease payments by MVP under two leases.
Other Arrangements
Tax Loans
Shares of restricted stock issued at the time of the Merger to certain of our current and former executive officers and other members of management vested each June 14 through 2012. In accordance with the terms of their applicable agreements, we made loans to these individuals for their personal income tax and associated interest obligations that resulted from vesting of the restricted stock. The loans were full recourse and are collateralized by the vested shares of restricted stock. During the first quarter of 2012, Mr. Montgomery, Ms. Bilney and Mr. Kadow repaid their loans in full, by payment to us of the following amounts: $0.8 million, $0.2 million and $0.4 million, respectively. The loans had interest rates ranging from 2.25% to 3.46%. After such payment, no further amounts remained outstanding under loans to our current directors or executive officers. In 2011, we made loans to executive officers as follows: Jody L. Bilney, $0.1 million; and Dirk A. Montgomery, $0.3 million. In 2010, we made loans to executive officers as follows: Ms. Bilney, $0.1 million; Joseph J. Kadow, $6,000; and Mr. Montgomery, $0.2 million.
Director and Executive Officer Investments and Employment Arrangements
A. William Allen III, our Chief Executive Officer through November 15, 2009 and Chairman of our board of directors through December 31, 2011, through a revocable trust in which he and his wife are the grantors, trustees and sole beneficiaries, owns all of the equity interests in AWA III Steakhouses, Inc., which owns 2.50% of OSI/Flemings, LLC, a Delaware limited liability company. OSI/Flemings, LLC owns certain Fleming’s Prime Steakhouse and Wine Bar restaurants directly or indirectly by serving as the general partner of limited partnerships. Mr. Allen, through his ownership interest in OSI/Flemings, LLC, received $0.6 million, $0.5 million and $0.2 million in distributions during 2011, 2010 and 2009, respectively and, in 2009, made capital contributions of $0.2 million. In addition, we entered into a consulting services agreement dated August 23, 2011 (the “Consulting Agreement”) with Mr. Allen. In accordance with the Consulting Agreement, Mr. Allen will provide consulting services as an independent contractor to us and identify, evaluate and recommend acquisition and investment opportunities for us in the restaurant business. Beginning in the first quarter of 2012, Mr. Allen will receive a consulting fee at the rate of $50,000 per calendar quarter, payable in advance, until the earlier of the consulting project’s completion or termination. Either party has the right to terminate the Consulting Agreement with ten business days’ notice.
Jeffrey S. Smith, an executive officer,our Executive Vice President and President of Outback Steakhouse, has made investments in the aggregate amount of approximately $0.5 million in eleven Outback Steakhouse restaurants, fourteenthirteen Carrabba’s Italian Grill restaurants and fourteen Bonefish Grill restaurants (five of which are franchise restaurants). This officerMr. Smith received distributions of approximately $39,000 for the three months ended March 31, 2013 and $0.1 million in each of the years ended December 31, 2012, 2011 2010, and 20092010 from these ownership interests.
Index to Financial Statements
Relationships With Family Members of Executive Officers
A sibling of Mr.Steven T. Shlemon, an executive officer,our Executive Vice President and President of Carrabba’s, is employed with one of our subsidiaries as a restaurant managing partner, with an annualand received compensation, including bonus, of approximately $31,000 for the three months ended March 31, 2013 and $0.1 million for each of the years ended December 31, 2012, 2011 2010 and 2009.2010. As a qualified managing partner, the sibling was entitled to make investments in our restaurants, on the same basis as other qualified managing partners, and has made an additional investment of invested $0.4approximately $0.5 million in partnerships that own and operate two Outback Steakhouse restaurants. In 2011, 2010 and 2009, thisThis sibling received distributions of $23,000,approximately $12,000 for the three months ended March 31, 2013 and $36,000, $34,000 and $26,000 in the years ended December 31, 2012, 2011 and $25,000,2010, respectively, related to his investments as a qualified managing partner and approximately $38,000 for the three months ended March 31, 2013 and $0.1 million in each of such annual period related to his additional investments in the partnerships noted above in each of these years.above.
A sibling of Joseph J. Kadow, a named executive officer, isour Executive Vice President and Chief Legal Officer, was employed by one of our subsidiaries as a Vice President of Operations. In 2011, 2010 and 2009, theOperations until his retirement on December 31, 2012. The sibling received total cash compensation of approximately $0.6 million, ,$0.6 million and $0.7 million in the years ended December 31, 2012, 2011 and $0.6 million,2010, respectively, and benefits consistent with other employees in the same capacity. The sibling also received loans of approximately $0.1 million during 2012 for personal income tax and associated interest obligations that resulted from vesting of restricted stock. As of December 31, 2012 an
aggregate of $0.3 million was outstanding on the 2012 loan and loans from prior years, which was repaid full on February 15, 2013. We entered into a severance agreement with the sibling under which the sibling received cash severance in the amount of approximately $0.4 million, $0.2 million under the 2012 annual bonus plan and accelerated vesting of and extended exercise terms for his equity awards, among other things. In addition, the sibling receivesreceived distributions that arewere based on a percentage of a particular restaurant’s annual cash flows for particular restaurants (on the same basis as other similarly situated employees). He has investedemployees/investors) and distributions based on his investment of an aggregate of $0.3$0.4 million in 2526 limited partnerships that own and operate nine Outback Steakhouse restaurants, 11 Bonefish Grill restaurants and fivesix Carrabba’s Italian Grill restaurants. ThisIn 2012, 2011 and 2010, the sibling received a return of his investment and distributions in thean aggregate amount of $0.1 million per year for distributions from these restaurants and in each2012 the sibling received an aggregate of $0.5 million for the years ended December 31, 2011, 2010 and 2009.repurchase of all of his interests in these restaurants.
The wife of John W. Cooper, an executive officer,who was our Executive Vice President and President of Bonefish Grill until he retired in January 2013, is employed by one of our subsidiaries as Senior Vice President, Training. In 2011, 2010 and 2009, sheShe received total cash compensation of approximately and $0.3 million $0.3 millionin each of 2012, 2011 and $0.2 million, respectively2010 and benefits consistent with other employees in the same capacity.
Sale of Lee Roy Selmon’s Concept
Effective December 31, 2008, we sold our interest in our Lee Roy Selmon’s concept, which included six restaurants, to MVP LRS, LLC, an entity owned primarily by our Founders (two of whom are also board members), one of its named executive officers and a former employee, for $4.2 million. In the third quarter of 2009, the named executive officer transferred his ownership interest in Selmon’s to two of the Founders (who are also board members) at his initial investment cost. We continued to provide certain accounting, technology, purchasing and other services to Selmon’s at agreed-upon rates, however, all services, except for purchasing, were transitioned to Selmon’s during the first quarter of 2010. Purchasing services were transitioned to Selmon’s on January 1, 2012. We earned $29,000, $26,000 and $0.2 million for the services described above in 2011, 2010 and 2009, respectively. We also subleased restaurant properties to MVP LRS, LLC, and continue to do so. We received $0.6 million in connection with these subleases in each of the years ended December 31, 2011, 2010 and 2009.
Review, Approval or Ratification of Transactions With Related Persons
OSI adopted a written code of business conduct and ethics in 2004, which was revised in 2007. The above transactions were reviewed under the OSI code of business conduct and ethics. We have adopted a code of business conduct and ethics for the review and approval or ratification of related person transactions following the completion of this offering. Under each of these codes of business conduct and ethics, as applicable, each member of the board of directors and each member of management and the management of our subsidiaries and of each of our significant affiliates must disclose to the Chief Legal Officer and/or audit committee, as applicable, the material terms of the related person transaction, including the approximate dollar value of the amount involved in the transaction, and all the material facts as to the related person’s direct or indirect interest in, or relationship to, the related person transaction. The Chief Legal Officer and/or audit committee must advise the board of the related person transaction and any requirement for disclosure in our applicable filings under the Securities Act of 1933, as amended, or the Securities Exchange Act of 1934, as amended and related rules, and, to the extent required to be disclosed, management must ensure that the related person transaction is disclosed in accordance with such acts and related rules.
Index to Financial Statements
Senior Credit Facility
General
On June 14, 2007, OSI, as borrower, and OSI HoldCo, Inc. (“OSI HoldCo”), OSI’s immediate parent corporation, entered into senior secured credit facilities with a syndicate of institutional lenders and financial institutions. The credit agreement related to the senior secured credit facilities was amended on January 28, 2010. These senior secured credit facilities provide for senior secured financing of up to approximately $1.6 billion, consisting of:
a $1.3 billion term loan facility that matures June 14, 2014;
a $150.0 million working capital revolving credit facility, including letter of credit and swing-line loan sub-facilities, that matures June 14, 2013; and
a $100.0 million pre-funded revolving credit facility that provides financing for capital expenditures only and matures June 14, 2013.
Proceeds of the term loans were used to finance the Merger. Proceeds of loans and letters of credit under the working capital revolving credit facility provide financing for working capital and general corporate purposes and, subject to a rent-adjusted leverage condition, for capital expenditures for new restaurant growth. Proceeds of loans under the pre-funded revolving credit facility are available to provide financing for capital expenditures, subject to OSI’s full utilization of amounts on deposit in a $100 million capital expenditure account initially funded on the closing date of the Merger, which may also be available to repay indebtedness under certain circumstances.
All borrowings under the senior secured credit facilities are subject to the satisfaction of customary conditions, including the absence of a default and the accuracy of certain representations and warranties.
Interest Rate and Fees
Borrowings under the senior secured credit facilities, other than swingline loans, bear interest at a rate per annum equal to, at OSI’s option, either (i) a base rate determined by reference to the higher of (a) the prime rate of Deutsche Bank AG New York Branch and (b) the federal funds effective rate plus 1/2 of 1% or (ii) a eurocurrency rate adjusted for statutory reserve requirements for a 30, 60, 90 or 180 day interest period, or a nine- or twelve-month interest period if agreed upon by the applicable lenders, in each case, plus an applicable margin. Swingline loans bear interest at the interest rate applicable to base rate loans.
The applicable margin for borrowings under the senior secured credit facilities is (i) for term loans and pre-funded revolving credit loans, (a) 1.25% for base rate loans and (b) 2.25% for eurocurrency rate loans, and (ii) for working capital revolving credit loans, (a) 1.00% to 1.50% for base rate loans and (b) 2.00% to 2.50% for eurocurrency rate loans, subject to step downs based upon our total leverage ratio.
With either the base rate or the eurocurrency rate, the interest rate is reduced by 25 basis points if OSI’s Moody’s Applicable Corporate Rating then most recently published is B1 or higher (the rating was Caa1 at December 31, 2011).
On the last day of each calendar quarter, OSI is required to pay a commitment fee ranging from 0.38% to 0.50% per annum in respect of any unused commitments under the working capital revolving credit facility, which is subject to reduction based upon OSI’s total leverage ratio, and a facility fee of 2.43% in respect of the undrawn portion of the pre-funded revolving credit facility. The fee is based on the applicable rate for eurocurrency rate loans under the pre-funded revolving credit facility plus the cost of investing the cash deposit related to the facility. Fees for the letters of credit range from 2.00% to 2.25%. We are also required to pay certain other agency fees.
Index to Financial Statements
Prepayments
OSI is required to prepay outstanding term loans, subject to certain exceptions, with:
50% of OSI’s “annual excess cash flow” (with step-downs to 25% and 0% based upon OSI’s rent-adjusted leverage ratio), as defined in the credit agreement and subject to certain exceptions;
100% of OSI’s “annual minimum free cash flow,” as defined in the credit agreement, not to exceed $75.0 million for each fiscal year, if OSI’s rent-adjusted leverage ratio exceeds a certain threshold;
100% of the net proceeds of certain assets sales and insurance and condemnation events, subject to reinvestment rights and certain other exceptions; and
100% of the net proceeds of any debt incurred, excluding permitted debt issuances.
Additionally, OSI is required, on an annual basis, to (i) first, repay outstanding loans under the pre-funded revolving credit facility and (ii) second, fund the capital expenditure account to the extent amounts on deposit are less than $100.0 million, in both cases with 100% of OSI’s “annual true cash flow,” as defined in the credit agreement.
In addition, commitment reductions of the working capital revolving credit facility and pre-funded revolving credit facility, and voluntary prepayments of the term loans and loans under the working capital revolving credit facility are permitted, in whole or in part, in minimum amounts without premium or penalty, other than customary breakage costs with respect to eurocurrency rate loans. Voluntary prepayments of loans under the pre-funded revolving credit facility may only be made with the proceeds of new cash equity contributions unless such loans are to be repaid in full and all commitments thereunder are terminated.
Amortization of Principal
The senior secured credit facilities require scheduled quarterly payments on the term loans equal to 0.25% of the original principal amount of the term loans for the first six years and three quarters following June 14, 2007. These payments are reduced by the application of any prepayments, and any remaining balance will be paid at maturity.
Guarantees and Collateral
The obligations under the senior secured credit facilities are guaranteed by each of OSI’s current and future domestic wholly-owned restricted subsidiaries in its Outback and Carrabba’s concepts, certain non-restaurant subsidiaries and OSI HoldCo and subject to the next succeeding sentence, are secured by a perfected security interest in substantially all of OSI’s assets and the assets of the guarantors, in each case, now owned or later acquired, including a pledge of all of OSI’s capital stock, the capital stock of substantially all of OSI’s domestic wholly-owned subsidiaries and 65% of the capital stock of certain of OSI’s material foreign subsidiaries that are directly owned by OSI, OSI HoldCo or a guarantor. Additionally, the senior secured credit facilities require OSI to provide additional guarantees of the senior secured credit facilities in the future from other domestic wholly-owned restricted subsidiaries if the consolidated EBITDA (as defined in the credit agreement) attributable to OSI’s non-guarantor domestic wholly-owned restricted subsidiaries (taken together as a group) would exceed 10% of OSI’s consolidated EBITDA as determined on a company-wide basis, at which time guarantees would be required from additional domestic wholly-owned restricted subsidiaries in such number that would be sufficient to lower the aggregate consolidated EBITDA of the non-guarantor domestic wholly-owned restricted subsidiaries (taken together as a group) to an amount not in excess of 10% of OSI’s company-wide consolidated EBITDA.
Restrictive Covenants and Other Matters
The senior secured credit facilities require OSI to comply with certain financial covenants, including a quarterly maximum total leverage ratio test, which financial covenant becomes more restrictive over time, and,
Index to Financial Statements
subject to OSI exceeding a minimum rent-adjusted leverage level, an annual minimum free cash flow test. In addition, the senior secured credit facilities agreement includes negative covenants that, subject to certain exceptions, limit OSI’s ability and the ability of its restricted subsidiaries, to, among other things:
incur liens;
make investments and loans;
make capital expenditures;
incur indebtedness or guarantees;
engage in mergers, acquisitions and asset sales;
declare dividends, make payments or redeem or repurchase equity interests;
alter the business they conduct;
engage in certain transactions with affiliates;
enter into agreements limiting subsidiary distributions; and
prepay, redeem or purchase certain indebtedness.
The senior secured credit facilities contain certain customary representations and warranties, affirmative covenants and events of default. If an event of default occurs, the lenders under the senior secured credit facilities will be entitled to take various actions, including the acceleration of amounts due under the senior secured credit facilities and all actions permitted to be taken by a secured creditor.
This summary describes the material provisions of the senior secured credit facilities, but may not contain all information that is important to you. We urge you to read the provisions of the credit agreement governing the senior secured credit facilities, which has been included as an exhibit to the registration statement of which this prospectus forms a part. See “Where You Can Find More Information.”
Senior Notes
General
On June 14, 2007, OSI and OSI Co-Issuer, Inc. (“Co-Issuer”), as co-issuers, issued the Senior Notes in an original aggregate principal amount of $550.0 million under an indenture among OSI, Co-Issuer, a third-party trustee and certain guarantors. The principal balance of the Senior Notes outstanding at December 31, 2011 and 2010 was $248.1 million. The Senior Notes mature on June 15, 2015. Interest is payable semiannually in arrears, at 10% per annum, in cash on each June 15 and December 15. Interest is computed on the basis of a 360-day year consisting of twelve 30-day months. The notes are guaranteed, jointly and severally, on an unsecured basis by each of OSI’s and Co-Issuer’s restricted subsidiaries that act as a guarantor under the senior secured credit facilities or other indebtedness of OSI.
The Senior Notes are general, unsecured senior obligations of OSI, Co-Issuer and the guarantors and are equal in right of payment to all existing and future senior indebtedness, including the senior secured credit facility. The Senior Notes are effectively subordinated to all of OSI’s, Co-Issuer’s and the guarantors’ secured indebtedness, including the senior secured credit facility, to the extent of the value of the assets securing such indebtedness. The Senior Notes are senior in right of payment to all of OSI’s, Co-Issuer’s and the guarantors’ existing and future subordinated indebtedness.
Index to Financial Statements
Covenants
The indenture governing the outstanding Senior Notes contains a number of covenants that, among other things and subject to certain exceptions, restrict OSI’s ability and the ability of its restricted subsidiaries to:
pay dividends on capital stock or redeem, repurchase or retire capital stock or any subordinated indebtedness;
make investments, loans, advances and acquisitions;
incur additional indebtedness or issue certain types of capital stock;
incur certain liens;
consolidate, merge or transfer all or substantially all of OSI’s assets and the assets of the guarantors;
engage in transactions with affiliates;
prepay, redeem or purchase certain indebtedness;
enter into agreements restricting the restricted subsidiaries’ ability to pay dividends; and
guarantee indebtedness of OSI.
The indenture also prohibits Co-Issuer from holding any material assets, becoming liable for any material obligation, engaging in any material trade or business or conducting any material business activity, subject to certain limited exceptions.
Optional Redemption
OSI and Co-Issuer may redeem the outstanding Senior Notes, in whole or in part, at the redemption prices (expressed as percentages of principal amount of Senior Notes to be redeemed) set forth below, plus accrued and unpaid interest thereon to the redemption date, if redeemed during the twelve-month period beginning on June 15 of each of the years indicated below:
Year | Percentage | |||
2012 | 102.5 | % | ||
2013 and thereafter | 100.0 | % | ||
If OSI experiences certain kinds of changes in control, OSI and Co-Issuer must offer to purchase the outstanding Senior Notes at 101% of their principal amount, plus accrued and unpaid interest.
Asset Sales
If OSI or its restricted subsidiaries engage in certain asset sales, OSI or the restricted subsidiary generally must either invest the net cash proceeds from such sales in its business within a specified period of time or prepay certain debt (which may include open market purchases of the notes or offers to purchase the notes). If net proceeds not invested or applied in accordance with the foregoing exceed $40.0 million, OSI must make an offer to purchase a principal amount of the outstanding Senior Notes equal to those excess net cash proceeds, subject to certain exceptions. The purchase price of the outstanding Senior Notes will be 100% of their principal amount, plus accrued and unpaid interest.
Index to Financial Statements
This summary describes the material provisions of the Senior Notes but may not contain all information that is important to you. We urge you to read the provisions of the indenture governing these Senior Notes, which has been included as an exhibit to the registration statement of which this prospectus forms a part. See “Where You Can Find More Information.”
2012 CMBS Loan
General
The 2012 CMBS Loan is in the amount of $500.0 million and consists of:
a $324.8 million first mortgage loan to New Private Restaurant Properties, LLC (“New PRP”);
an $87.6 million first mezzanine loan to the parent of New PRP, New PRP Mezz 1, LLC (“New PRP 1”); and
an $87.6 million second mezzanine loan to the parent of New PRP 1, New PRP Mezz 2, LLC (“New PRP 2”).
Each of the loans comprising the 2012 CMBS Loan has a scheduled maturity date of April 10, 2017. The proceeds from the 2012 CMBS Loan, together with the proceeds from the Sale-Leaseback Transaction and excess cash, were used to repay our existing CMBS Loan.
Concurrently with the funding of the first mortgage loan, the originating lenders sold it to an affiliate of one of the lenders, who in turn transferred it into a securitization trust. The sale of the interests in such trust closed concurrently with, and were the source of, the funding of the first mortgage loan. In connection with the origination of the first and second mezzanine loans, the originating lenders syndicated all of their respective interests in the first and second mezzanine loans to third-party investors.
Interest Rate
The first mortgage loan has five fixed-rate components and a floating rate component, with original principal amounts and component interest rates as follows:
Mortgage Loan Component | Initial Principal Balance | Rate Description | Component | |||||||||
A-1 | $ | 41,316,000 | Fixed | 2.3666 | % | |||||||
A-2-FX | $ | 143,464,000 | Fixed | 3.3756 | % | |||||||
A-2-FL | $ | 48,720,000 | Floating | LIBOR plus 2.3736 | %(1) | |||||||
B | $ | 29,300,000 | Fixed | 4.8536 | % | |||||||
C | $ | 26,100,000 | Fixed | 5.8336 | % | |||||||
D | $ | 35,900,000 | Fixed | 6.8096 | % | |||||||
In connection with the 2012 CMBS Loan, New PRP entered into an interest rate cap (the “Rate Cap”) as a method to limit the volatility of the floating rate component of the first mortgage loan. Under the Rate Cap, if the 30-day LIBOR market rate exceeds 7% per annum, the counterparty must pay to New PRP such excess on the notional amount of the floating rate component. New PRP paid $4,680 for the Rate Cap and is amortizing the cost of this asset to interest expense. Should it be necessary, New PRP would record any mark-to-market changes in the fair value of its derivative instruments into earnings in the period of change. The Rate Cap has a term of approximately two years from the closing of the 2012 CMBS Loan. Upon the expiration or termination of the Rate Cap or the downgrade of the credit ratings of the counterparty under the Rate Cap below specified thresholds, New PRP is required to replace the Rate Cap with a replacement interest rate cap in a notional amount equal to the outstanding principal balance (if any) of the floating rate component.
Index to Financial Statements
The first mezzanine loan bears interest at a fixed rate of 9% per annum.
The second mezzanine loan bears interest at a fixed rate of 11.25% per annum.
Payments of Principal and Interest
On a monthly basis, each of New PRP, New PRP 1 and New PRP 2 will pay with respect to its loan an amount equal to accrued interest plus principal based on a 25 year amortization schedule; provided that they will pay accrued interest only on the first payment date of April 10, 2012. Scheduled monthly principal payments under the mortgage loan will generally be applied in sequential order (in other words, first to Component A-1, then Components A-2-FX and A-2-FL, then Component B, then Component C and then Component D), as a consequence of which, as the lower-interest rate components are repaid over the course of the term, New PRP’s blended interest rate on the mortgage loan will rise.
Prepayments; Defeasance; Release of Collateral
New PRP will be permitted to prepay the floating rate component of the first mortgage loan, in whole or in part, at any time, subject to the satisfaction of certain conditions. With respect to any prepayment made prior to April 10, 2013 that is not made in connection with the release of a property, New PRP must pay a prepayment premium in an amount equal to 1.0% of the amount prepaid.
Except as described above with respect to the mortgage borrower’s right to prepay the floating rate component, none of the borrowers under the mortgage or mezzanine loans will be permitted to voluntarily prepay its respective loan in whole or in part prior to January 10, 2017. At any time on and after that date, each borrower will be permitted to prepay (in whole but not in part) its loan (plus accrued interest through the next payment date) without payment of any yield maintenance premium, prepayment premium or other prepayment penalty or fee, subject to the satisfaction of certain conditions, including that the first mezzanine loan may not be prepaid unless the first mortgage loan has been or is then being prepaid in full and the second mezzanine loan may not be prepaid unless the first mortgage loan and first mezzanine loan have been or are then being prepaid in full.
In connection with the release of a property, new PRP may defease all or any portion of the fixed-rate components of the mortgage loan, subject to the satisfaction of certain conditions, including that the floating rate component has been paid in full and that a pro rata portion of each mezzanine loan is being concurrently defeased. Components of the mortgage loan will be defeased in sequential order (in other words, first the A-1 Component, then the A-2- Component, and so on through the D Component). Each mezzanine borrower may defease its mezzanine loan, in whole or in part, subject to the satisfaction of certain conditions, including that a pro rata portion of the mortgage loan and the other mezzanine loan are being concurrently defeased.
New PRP will be required to prepay the first mortgage loan in connection with certain casualties and condemnations. No yield maintenance premium, prepayment premium or other prepayment penalty or fee will be due in connection with any such involuntary prepayment.
New PRP has the right to obtain the release of properties from the lien securing the first mortgage loan, and New PRP 1 and New PRP 2 may cause New PRP to effect such release, upon the defeasance of the first mortgage loan (or, if the floating rate component is still outstanding, the prepayment of that component) and if the floating rate component has been fully repaid, the defeasance of the mezzanine loans in the amounts required in the applicable loan agreement and the satisfaction of certain other conditions.
Guarantees and Collateral
The first mortgage loan is secured by mortgages on 261 restaurant properties owned by New PRP. Subject to certain limited exceptions, recourse on the first mortgage loan is limited to New PRP’s interest in such properties, the master lease with Private Restaurant Master Lessee LLC (“Master Lessee”), as described below, and the guaranty of the tenant’s obligations under such master lease issued by OSI.
Index to Financial Statements
The first mezzanine loan is secured by 100% of New PRP 1’s ownership interests in New PRP, The second mezzanine loan is secured by 100% of New PRP 2’s ownership interests in New PRP 1. Subject to certain limited exceptions, recourse on each such loan is limited to its respective collateral.
OSI HoldCo I, Inc. has guaranteed to the lender under each loan the recourse obligations of its respective borrower.
Restrictive Covenants and Other Matters
New PRP’s sole purpose is to own and lease all its real property to Master Lessee, and New PRP is generally not permitted to acquire additional assets or properties under the 2012 CMBS Loan.
The first mortgage loan includes negative covenants that, subject to certain exceptions, limit New PRP’s ability to, among other things:
incur debt;
incur liens;
partition any restaurant property;
transfer any restaurant property;
file for bankruptcy;
incur material liability under ERISA;
modify reciprocal easement agreements;
take actions relating to zoning reclassification of any restaurant property;
change its principal place of business; and
cancel, forgive or release any material claim or debt owed to it.
In addition, the mortgage loan requires that, subsequent to certain initial public offerings of indirect parent entities of the mortgage loan borrower (the “IPO Entity”), such as this offering, either (i) our Sponsors, our Founders and the management stockholders or other permitted holders (collectively, “Permitted Holders”), own no less than 51% of the voting stock of the IPO Entity, and have the right, directly or indirectly, to designate (and do so designate) a majority of the board of directors of the IPO Entity, or (ii) both of the following criteria are satisfied: (a) no “person” or “group” (as such terms are used in Sections 13(d) and 14(d) of the Exchange Act, other than Permitted Holders, is the owner of more than the greater of (1) 35% of the shares outstanding of the IPO Entity, and (2) the percentage of the then outstanding voting stock of the IPO Entity owned by the Permitted Holders, and (b) a majority of the board of directors of the IPO Entity consist of the directors of HoldCo on the closing date of the mortgage loan, and each other director of OSI HoldCo if such other director’s nomination for election to the board of directors of OSI HoldCo is recommended by a majority of the then continuing directors or such other director receives the vote of one or more of the Permitted Holders in his or her election by the stockholders of OSI HoldCo. For purposes of the mortgage loan, management stockholders means members of management of OSI or its subsidiaries (excluding the Founders) who are both (i) actively involved in the management of OSI or its subsidiaries and (ii) investors in OSI HoldCo or any direct or indirect parent thereof.
Index to Financial Statements
The mezzanine loans contain similar negative covenants.
The first mortgage loan and mezzanine loans contain certain customary representations and warranties, affirmative covenants and events of default. Also, the first mezzanine loan is cross-defaulted to the mortgage loan and the second mezzanine loan is cross-defaulted to the first mezzanine loan and the first mortgage loan. In addition, all of the loans are cross-defaulted to the above-described lease with Master Lessee. If an event of default under one or more loans occurs, the applicable lender(s) will be entitled to take various actions, including the acceleration of amounts due under the applicable loan.
This summary describes the material provisions of each of the loan documents for the 2012 CMBS Loan, but may not contain all of the information that is important to you. We urge you to read the 2012 CMBS loan documents, which have been included as exhibits to the registration statement of which this prospectus forms a part. See “Where You Can Find More Information.”
Notes Payable
As of December 31, 2011 and 2010, OSI had approximately $9.1 million and $7.6 million, respectively, of notes payable at interest rates ranging from 0.76% to 7.00% and from 1.07% to 7.00%, respectively. These notes have been primarily issued for buyouts of managing and operating partner interests in the cash flows of their restaurants and generally are payable over two to five years.
Debt Guarantee
OSI is the guarantor of an uncollateralized line of credit that permits borrowing of up to $24.5 million for its joint venture partner, RY-8, in the development of Roy’s restaurants. The line of credit originally expired in December 2004 and was amended for a fourth time on April 1, 2009 to a revised termination date of April 15, 2013. According to the credit agreement, RY-8 may borrow, repay, re-borrow or prepay advances at any time before the termination date of the agreement. On the termination date of the agreement, the entire outstanding principal amount of the loan then outstanding and any accrued interest will be due. At December 31, 2011 and 2010, the outstanding balance on the line of credit was $24.5 million.
RY-8’s obligations under the line of credit are unconditionally guaranteed by OSI and Roy’s Holdings, Inc., RY-8’s parent company (“RHI”). If an event of default occurs, as defined in the agreement, the total outstanding balance, including any accrued interest, is immediately due from the guarantors. At December 31, 2011 and 2010, $24.5 million of the $150.0 million working capital revolving credit facility was committed for the issuance of a letter of credit for this guarantee.
If an event of default occurs and RY-8 is unable to pay the outstanding balance owed, OSI would, as one of the two guarantors, be liable for this balance. However, in conjunction with the credit agreement, RY-8 and RHI have entered into an Indemnity Agreement and a pledge of interest and security agreement in OSI’s favor. These agreements provide that if OSI is required to perform under its obligation as guarantor pursuant to the credit agreement, then RY-8 and RHI will indemnify OSI against all losses, claims, damages or liabilities which arise out of or are based upon OSI’s guarantee of the credit agreement. RY-8’s and RHI’s obligations under these agreements are collateralized by a first priority lien upon and a continuing security interest in any and all of RY-8’s interests in the joint venture.
Index to Financial Statements
PRINCIPAL AND SELLING STOCKHOLDERS
The following table sets forth certain information with respect to the beneficial ownership of our common stock at March 15, 2012on May 6, 2013 for:
each person whom we know beneficially owns more than five percent of our common stock;
each of our directors;Directors;
each of our named executive officers; and
all of our directorscurrent Directors and executive officers as a group.group; and
each selling stockholder.
The number of shares beneficially owned by each stockholder is determined under rules issued by the SEC. Unless otherwise indicated below, the address for each listed director,Director and officer and stockholder is c/o Bloomin’ Brands, Inc., 2202 North West Shore Boulevard, Suite 500, Tampa, Florida 33607. The selling stockholders in this offering may be deemed to be underwriters.
The percentage of common stock beneficially owned by each person before the offering is based on 106,516,725123,165,107 shares of common stock outstanding as of March 15, 2012, and theMay 6, 2013. The percentage beneficially owned after the offering includes 300,000 shares to be issued upon the exercise of options by selling stockholders and is based on 123,465,107 shares of common stock expected to be outstanding following this offering after giving effect to the shares of common stock offered hereby.offering. See “Description of Capital Stock.” Shares of common stock that may be acquired within 60 days following March 15, 2012May 6, 2013 pursuant to the exercise of options are deemed to be outstanding for the purpose of computing the percentage ownership of such holder but are not deemed to be outstanding for computing the percentage ownership of any other person shown in the table.
Upon the completion of this offering, investmentan investor group consisting of funds affiliated withadvised by our Sponsors will own, in the aggregate, approximately %and two of our common stock, assuming the underwriters do not exercise their optionFounders will continue to purchase additional sharesbeneficially own more than 50% of our common stock. As a result, we intendwill continue to be a “controlled company” within the meaning of the corporate governance rules of the .Nasdaq.
| Shares Owned Before the Offering | Shares Owned after the Offering | |||||||||||
Name of Beneficial Owner | Number | Percentage | Number | Percentage | ||||||||
Bain Capital and related funds (1) | 70,075,000 | 65.79 | % | |||||||||
Catterton and related funds (2) | 14,500,000 | 13.61 | % | |||||||||
Andrew B. Balson (3) | — | — | ||||||||||
Robert D. Basham (4) | 8,604,652 | 8.08 | % | |||||||||
David P. Berg (5) | — | — | ||||||||||
Jody L. Bilney (6) | 130,875 | * | ||||||||||
J. Michael Chu (2)(7) | 14,500,000 | 13.61 | % | |||||||||
Joseph J. Kadow (8) | 532,491 | * | ||||||||||
Philip Loughlin (3) | — | — | ||||||||||
Dirk A. Montgomery (9) | 518,648 | * | ||||||||||
Mark Nunnelly (3) | — | — | ||||||||||
Elizabeth A. Smith (10) | 1,740,000 | 1.61 | % | |||||||||
Chris T. Sullivan (11) | 5,929,331 | 5.57 | % | |||||||||
Mark Verdi (3) | — | — | ||||||||||
All directors and executive officers as a group | 18,584,648 | 17.01 | % | |||||||||
| Shares Owned before the Offering | Shares Owned after the Offering | |||||||||||||||||||||||||||||||
Name of Beneficial Owner | Number of Shares Beneficially Owned | Percentage of Shares Beneficially Owned | Number of Shares to be Sold in the Offering | Number of Shares Beneficially Owned | Percentage of Shares Beneficially Owned | Number of Additional Shares to be Sold at Underwriters’ Option | Number of Shares Beneficially Owned if Underwriters’ Option is Exercised in Full | Percentage of Shares Beneficially Owned if Underwriters’ Option is Exercised in Full | ||||||||||||||||||||||||
Beneficial Owners of 5% or More of Our Common Stock: | ||||||||||||||||||||||||||||||||
Bain Capital Entities (1)(2) | 67,527,489 | 54.83 | % | 11,829,058 | 55,698,431 | 45.11 | % | 1,806,234 | 53,892,197 | 43.65 | % | |||||||||||||||||||||
Catterton Partners and Related Funds (2)(3) | 14,010,558 | 11.38 | % | 2,454,285 | 11,556,273 | 9.36 | % | 374,756 | 11,181,517 | 9.06 | % | |||||||||||||||||||||
Robert D. Basham (2)(4) | 8,036,002 | 6.52 | % | 1,201,457 | 6,834,545 | 5.54 | % | 221,636 | 6,612,909 | 5.36 | % | |||||||||||||||||||||
Directors and Named Executive Officers: | ||||||||||||||||||||||||||||||||
Andrew B. Balson (5) | — | — | — | — | — | — | — | — | ||||||||||||||||||||||||
Jody L. Bilney | 875 | * | — | 875 | * | — | 875 | * | ||||||||||||||||||||||||
J. Michael Chu (2)(3)(6) | 14,010,558 | 11.38 | % | 2,454,285 | 11,556,273 | 9.36 | % | 374,756 | 11,181,517 | 9.06 | % | |||||||||||||||||||||
David J. Deno (7) | 82,500 | * | — | 82,500 | * | — | 82,500 | * | ||||||||||||||||||||||||
Mindy Grossman | 6,939 | * | — | 6,939 | * | — | 6,939 | * | ||||||||||||||||||||||||
David Humphrey (5) | — | — | — | — | — | — | — | — | ||||||||||||||||||||||||
John J. Mahoney | 6,859 | * | — | 6,859 | * | — | 6,859 | * | ||||||||||||||||||||||||
Dirk A. Montgomery | 411,500 | * | — | 411,500 | * | — | 411,500 | * | ||||||||||||||||||||||||
Mark E. Nunnelly (5) | — | — | — | — | — | — | — | — | ||||||||||||||||||||||||
Stephen T. Shlemon (8) | 606,691 | * | — | 606,691 | * | — | 606,691 | * | ||||||||||||||||||||||||
Elizabeth A. Smith (9) | 2,830,000 | 2.25 | % | 250,000 | 2,580,000 | 2.05 | % | — | 2,580,000 | 2.05 | % | |||||||||||||||||||||
Jeffrey S. Smith (10) | 324,150 | * | — | 324,150 | * | — | 324,150 | * | ||||||||||||||||||||||||
Chris T. Sullivan (2)(11) | 5,544,753 | 4.50 | % | 1,000,200 | 4,544,553 | 3.68 | % | 147,374 | 4,397,179 | 3.56 | % | |||||||||||||||||||||
All current Directors and executive officers as a group (15 persons) (12) | 24,287,645 | 19.11 | % | 3,754,485 | 20,533,160 | 16.15 | % | 522,130 | 20,011,030 | 15.74 | % | |||||||||||||||||||||
Other Selling Stockholders: | ||||||||||||||||||||||||||||||||
David P. Berg (13) | 52,500 | * | 50,000 | 2,500 | * | — | 2,500 | * | ||||||||||||||||||||||||
Metropolitan Ministries | 50,000 | * | 50,000 | — | — | — | — | — | ||||||||||||||||||||||||
Michael J. Fox Foundation | 165,000 | * | 165,000 | — | — | — | — | — | ||||||||||||||||||||||||
| * | Indicates less than one percent of common stock. |
| (1) | Based on information contained in a Schedule 13G filed on February 14, 2013. The shares included in the table consist of: (i) |
Index to Financial Statements
| common stock held by Bain Capital (OSI) IX Coinvestment, L.P., whose |
| (2) | The Schedule 13G filed by each of the Bain Capital Entities, Catterton Partners and Related Funds, Mr. Basham, Mr. Sullivan and entities affiliated with Mr. Basham and Mr. Sullivan identified in footnotes 5 and 13, respectively, on February 14, 2013 indicate that such stockholders are members of a “group” as defined under Section 13(d) of the Exchange Act and, as a result, they each may be deemed to have beneficial ownership of the aggregate number of shares held by such group. As of May 6, 2013, the group members collectively own 95,118,802 shares, which represents approximately 77.2% of our outstanding shares. Each of the Bain Capital Entities, Catterton Partners and Related Funds, Mr. Basham, Mr. Sullivan and such entities affiliated with Mr. Basham and Mr. Sullivan disclaim beneficial ownership of any of the shares held of record and beneficially owned by each other member of the group (other than as otherwise noted in these footnotes). |
| (3) | Based on information contained in a Schedule 13G filed on February 14, 2013. Represents shares held of record by Catterton Partners |
| (4) | Shares owned by RDB Equities, Limited Partnership, an investment partnership (“RDBLP”). Mr. Basham is a limited partner of RDBLP and the sole member of RDB Equities, LLC, the sole general partner of RDBLP. The address for RDBLP is c/o Bloomin’ Brands, Inc., 2202 North West Shore Boulevard, Suite 500, Tampa Florida 33607. |
| (5) | Does not include |
| (6) |
| The management of CP6 Management is controlled by a managing board. J. Michael Chu and Scott A. Dahnke are the members of the managing board of CP6 Management and as such could be deemed to share voting and dispositive control over the shares held of record and beneficially owned by Catterton Partners and Related Funds. Mr. Chu disclaims beneficial ownership of any shares held of record and beneficially owned by Catterton Partners and Related Funds. The business address of Mr. Chu is c/o Catterton Partners, 599 West Putnam Avenue, Greenwich, Connecticut 06830. |
| Includes |
Index to Financial Statements
| Includes |
| Includes |
| (10) | Includes 254,150 shares subject to stock options with an exercise price of $6.50 per share that Mr. Smith has the right to acquire within 60 days of May 6, 2013. Does not include 88,259 shares subject to stock options that are not exercisable within 60 days of May 6, 2013. |
| (11) | Includes |
| (12) | Includes a total of 3,943,370 shares subject to stock options that our current Directors and executive officers have the right to acquire within 60 days of May 6, 2013, including Mr. Berg, whose employment with us will end on May 17, 2013 and excluding Mr. Montgomery and Ms. Bilney, whose employment with us in January 2013 and March 2013, respectively, and Mr. Basham whose term as a Director ended in April 2013. |
| (13) | Includes 50,000 shares subject to stock options with an exercise price of $10.03 per share that will be exercised and such shares will be sold in this offering. Does not include 227,206 shares subject to stock options that are not exercisable and will be forfeited when his employment terminates on May 17, 2013. |
Index to Financial Statements
General
Upon the closing of this offering, ourOur second amended and restated certificate of incorporation will be amended and restated to provideprovides for authorized capital stock of 475,000,000 shares of common stock, par value $0.01 per share, and 25,000,000 shares of undesignated preferred stock. As of March 15, 2012,May 6, 2013, we had outstanding 106,516,725123,165,107 shares of common stock outstanding held by 6156 stockholders of record, and we had outstanding options to purchase 11,863,37811,630,728 shares of common stock, which options were exercisable athad a weighted average exercise price of $7.52$8.92 per share.
After giving effect to this offering, we will have shares of common stock and no shares of preferred stock outstanding. The following summary describes all material provisions of our capital stock. We urge you to read our certificate of incorporation and our bylaws, which are included as exhibits to the registration statement of which this prospectus forms a part.part and have been filed with the SEC.
Our certificate of incorporation and bylaws will contain provisions that are intended to enhance the likelihood of continuity and stability in the composition of the boardBoard of directorsDirectors and that may have the effect of delaying, deferring or preventing a future takeover or change in control of our companyCompany unless that takeover or change in control is approved by our boardBoard of directors.Directors. These provisions include a classified boardBoard of directors,Directors, elimination of stockholder action by written consents (except in limited circumstances), elimination of the ability of stockholders to call special meetings (except in limited circumstances), advance notice procedures for stockholder proposals, and supermajority vote requirements for amendments to our certificate of incorporation and bylaws.
Common Stock
Dividend Rights. Subject to preferences that may apply to shares of preferred stock outstanding at the time, holders of outstanding shares of common stock will beare entitled to receive dividends out of assets legally available at the times and in the amounts as the boardBoard of directorsDirectors may from time to time determine.
Voting Rights. Each outstanding share of common stock will beis entitled to one vote on all matters submitted to a vote of stockholders. Holders of shares of our common stock willdo not have cumulative voting rights.
Preemptive Rights. Our common stock willis not be entitled to preemptive or other similar subscription rights to purchase any of our securities.
Conversion or Redemption Rights. Our common stock will beis neither convertible nor redeemable.
Liquidation Rights. Upon our liquidation, the holders of our common stock will be entitled to receive pro rata our assets that are legally available for distribution, after payment of all debts and other liabilities and subject to the prior rights of any holders of preferred stock then outstanding.
Listing. We intend to apply to have ourOur shares of common stock are listed on the Nasdaq Global Select Market under the symbol “BLM.“BLMN.”
Preferred Stock
Our boardBoard of directorsDirectors may, without further action by our stockholders, from time to time, direct the issuance of shares of preferred stock in series and may, at the time of issuance, determine the designations, powers, preferences, privileges, and relative participating, optional or special rights as well as the qualifications, limitations or restrictions thereof, including dividend rights, conversion rights, voting rights, terms of redemption
Index to Financial Statements
and liquidation preferences, any or all of which may be greater than the rights of the common stock. Satisfaction of any dividend preferences of outstanding shares of preferred stock would reduce the amount of funds available
for the payment of dividends on shares of our common stock. Holders of shares of preferred stock may be entitled to receive a preference payment in the event of our liquidation before any payment is made to the holders of shares of our common stock. Under specified circumstances, the issuance of shares of preferred stock may render more difficult or tend to discourage a merger, tender offer or proxy contest, the assumption of control by a holder of a large block of our securities or the removal of incumbent management. Upon the affirmative vote of a majority of the total number of directorsDirectors then in office, our boardBoard of directors,Directors, without stockholder approval, may issue shares of preferred stock with voting and conversion rights that could adversely affect the holders of shares of our common stock and the market value of our common stock. Upon completion of this offering, there will beThere are no shares of preferred stock outstanding, and we have no present intention to issue any shares of preferred stock.
Anti-Takeover Effects of Our Certificate of Incorporation and Bylaws
Our certificate of incorporation and bylaws will contain certain provisions that are intended to enhance the likelihood of continuity and stability in the composition of our boardBoard of directorsDirectors and that may have the effect of delaying, deferring or preventing a future takeover or change in control of the companyCompany unless that takeover or change in control is approved by our boardBoard of directors.Directors.
These provisions include:
Classified Board. Our certificate of incorporation will provideprovides that our boardBoard of directors willDirectors be divided into three classes of directors,Directors, with the classes as nearly equal in number as possible. As a result, approximately one-third of our boardBoard of directorsDirectors will be elected each year. The classification of directors will haveDirectors has the effect of making it more difficult for stockholders to change the composition of our board. In addition, because our board will beis classified, under Delaware General Corporation Law, directorsDirectors may only be removed for cause. Our certificate of incorporation will also provideprovides that, subject to any rights of holders of preferred stock to elect additional directorsDirectors under specified circumstances, the number of directors willDirectors is to be fixed exclusively pursuant to a resolution adopted by our boardBoard of directors. Upon completionDirectors. Our Board of this offering,Directors currently has eight members. The Board of Directors decreased the number of Directors from nine to eight effective at the time of our board2013 annual meeting of directors will have nine members.stockholders when Mr. Basham declined to stand for re-election and his term as a Director ended.
Action by Written Consent; Special Meetings of Stockholders. Our certificate of incorporation will provideprovides that stockholder action can be taken only at an annual or special meeting of stockholders and cannot be taken by written consent in lieu of a meeting once investment funds affiliatedassociated with our Sponsors cease to beneficially own more than 50% of our outstanding shares. Our certificate of incorporation and bylaws will also provide that, except as otherwise required by law, special meetings of the stockholders can be called only pursuant to a resolution adopted by a majority of the total number of directorsDirectors that the companyCompany would have if there were no vacancies or, until the date that investment funds affiliatedassociated with our Sponsors cease to beneficially own more than 50% of our outstanding shares, at the request of holders of 50% or more of our outstanding shares. Except as described above, stockholders willare not be permitted to call a special meeting or to require the boardBoard of directorsDirectors to call a special meeting.
Advance Notice Procedures. Our bylaws will establish an advance notice procedure for stockholder proposals to be brought before an annual meeting of our stockholders, including proposed nominations of persons for election to the boardBoard of directors.Directors. Stockholders at an annual meeting willare only be able to consider proposals or nominations specified in the notice of meeting or brought before the meeting by or at the direction of the boardBoard of directorsDirectors or by a stockholder who was a stockholder of record on the record date for the meeting, who is entitled to vote at the meeting and who has given our Secretary timely written notice, in accordance with our bylaws, of the stockholder’s intention to bring that business before the meeting. Although the bylaws willdo not give the boardBoard of directorsDirectors the power to approve or disapprove stockholder nominations of candidates or proposals regarding other business to be conducted at a special or annual meeting, the bylaws may have the effect of precluding the conduct of certain business at a meeting if the proper procedures are not followed or may
Index to Financial Statements
discourage or deter a potential acquiror from conducting a solicitation of proxies to elect its own slate of directorsDirectors or otherwise attempting to obtain control of the company.Company.
Super Majority Approval Requirements. The Delaware General Corporation Law generally provides that the affirmative vote of a majority of the outstanding stock entitled to vote on any matter is required to amend a corporation’s certificate of incorporation or bylaws, unless either a corporation’s certificate of incorporation or bylaws require a greater percentage. Our certificate of incorporation and bylaws will provide that the affirmative vote of holders of at least 75% of the total votes entitled to vote in the election of directors will beDirectors is required to amend, alter, change or repeal our bylaws and specified provisions of our certificate of incorporation once investment funds affiliatedassociated with our Sponsors cease to beneficially own more than 50% of our outstanding shares. This requirement of a supermajority vote to approve amendments to our certificate of incorporation and bylaws could enable a minority of our stockholders to exercise veto power over any such amendments.
Authorized but Unissued Shares. Our authorized but unissued shares of common stock and preferred stock will beare available for future issuance without stockholder approval. These additional shares may be utilized for a variety of corporate purposes, including future public offerings to raise additional capital, corporate acquisitions and employee benefit plans. The existence of authorized but unissued shares of common stock and preferred stock could render more difficult or discourage an attempt to obtain control of a majority of our common stock by means of a proxy contest, tender offer, merger or otherwise.
Business Combinations With Interested Stockholders. We have elected in our certificate of incorporation not to be subject to Section 203 of the Delaware General Corporation Law, which generally prohibits a publicly held Delaware corporation from engaging in a business combination, such as a merger, with a person or group owning 15% or more of the corporation’s voting stock, for a period of three years following the date the person became an interested stockholder, unless (with certain exceptions) the business combination or the transaction in which the person became an interested stockholder is approved in a prescribed manner. Accordingly, we are not subject to any anti-takeover effects of Section 203. However, our certificate of incorporation will containcontains provisions that have the same effect as Section 203, except that they provide that our Sponsors and their respective affiliates will not be deemed to be “interested stockholders,” regardless of the percentage of our voting stock owned by them, and accordingly will not be subject to such restrictions.
Corporate Opportunities
Our restated certificate of incorporation will provideprovides that we renounce any interest or expectancy of the companyCompany in the business opportunities of our Sponsors and of their officers, directors, agents, shareholders,stockholders, members, partners, affiliates and subsidiaries and each such party shall not have any obligation to offer us those opportunities unless presented to a directorDirector or officer of the companyCompany in his or her capacity as a directorDirector or officer of the company.Company.
Limitations on Liability and Indemnification of Officers and Directors
Our restated certificate of incorporation will limitlimits the liability of our directorsDirectors to the fullest extent permitted by the Delaware General Corporation Law, and providesour bylaws provide that we will indemnify them to the fullest extent permitted by such law. We expect to enterhave entered into indemnification agreements with our current directorsDirectors and executive officers prior to the completion of this offering and expect to enter into a similar agreement with any new directorsDirectors or executive officers. We expect to increase ouralso maintain customary directors’ and officers’ liability insurance policies that provide coverage prior to the completionour Directors and officers against loss arising from claims made by reason of this offering.breach of duty or other wrongful act and to us with respect to indemnification payments that we may make to Directors and officers.
Transfer Agent and Registrar
The transfer agent and registrar for our common stock will be .is Computershare Trust Company, N.A. Its telephone number is .877-373-6374 (toll free) or 781-575-2879.
Index to Financial Statements
SHARES ELIGIBLE FOR FUTURE SALE
Prior to this offering, there has been no market for shares of our common stock. We cannot predict the effect, if any, that future sales of shares of our common stock, or the availability for future sale of shares of our common stock, will have on the market price of shares of our common stock prevailing from time to time. The sale of substantial amounts of shares of our common stock in the market, or the perception that such sales could occur, could harm the prevailing market price of shares of our common stock.
Sale of Restricted Shares
Upon completion of this offering, we will have shares of common stock outstanding. Of these shares, the shares sold in this offering, plus any shares sold upon exercise of the underwriters’ option to purchase additional shares, will be freely tradable without restriction under the Securities Act, except for any shares purchased by our “affiliates” as that term is defined in Rule 144 promulgated under the Securities Act. In general, affiliates include our executive officers, directors, and 10% shareholders. Shares purchased by affiliates will remain subject to the resale limitations of Rule 144.
Upon completion of this offering, shares of our common stock will be “restricted securities,” as that term is defined in Rule 144 promulgated under the Securities Act. These restricted securities are eligible for public sale only if they are registered under the Securities Act or if they qualify for an exemption from registration under Rules 144 or 701 promulgated under the Securities Act, which are summarized below.
As a result of the lock-up agreements described below and the provisions of Rules 144 and Rule 701 promulgated under the Securities Act, the shares of our common stock (excluding the shares sold in this offering) will be available for sale in the public market as follows:
shares will be eligible for sale on the date of this prospectus;
shares will be eligible for sale upon the expiration of the lock-up agreements, as more particularly described below, beginning 180 days after the date of this prospectus; and
shares will be eligible for sale, upon the exercise of vested options, upon the expiration of the lock-up agreements, as more particularly described below, beginning 180 days after the date of this prospectus.
Rule 144
Generally, Rule 144 provides that an affiliate who has beneficially owned “restricted” shares of our common stock for at least six months will be entitled to sell on the open market in brokers’ transactions, within any three-month period, a number of shares that does not exceed the greater of:
1% of the number of shares of our common stock then outstanding, which will equal approximately shares immediately after this offering; or
the average weekly trading volume of the common stock during the four calendar weeks preceding the filing of a notice on Form 144 with respect to such sale.
In addition, sales under Rule 144 are subject to requirements with respect to manner of sale, notice, and the availability of current public information about us.
Index to Financial Statements
If any person who is deemed to be our affiliate purchases shares of our common stock in this offering or acquires shares of our common stock pursuant to one of our employee benefits plans, sales under Rule 144 of the shares held by that person will be subject to the volume limitations and other restrictions described in the preceding two paragraphs.
The volume limitation, manner of sale and notice provisions described above will not apply to sales by non-affiliates. For purposes of Rule 144, a non-affiliate is any person or entity who is not our affiliate at the time of sale and has not been our affiliate during the preceding three months. Once we have been a reporting company for 90 days, persons who have beneficially owned restricted shares of our common stock for six months may rely on Rule 144 provided that certain public information regarding us is available. The six-month holding period increases to one year if we have not been a reporting company for at least 90 days. However, a non-affiliate who has beneficially owned the restricted shares proposed to be sold for at least one year will not be subject to any restrictions under Rule 144 regardless of how long we have been a reporting company.
Rule 701
Under Rule 701, each of our employees, officers, directors, consultants or advisors who purchased shares pursuant to a written compensatory plan or contract is eligible to resell these shares 90 days after the effective date of this offering in reliance upon Rule 144, but without compliance with specific restrictions. Rule 701 provides that affiliates may sell their Rule 701 shares under Rule 144 without complying with the holding period requirement and that non-affiliates may sell their shares in reliance on Rule 144 without complying with the holding period, public information, volume limitation, or notice provisions of Rule 144.
Lock-Up Agreements
We, our directors and officers and holders of substantially all of our equity securities have agreed, subject to certain exceptions, not to offer, sell or transfer any common stock or securities convertible into or exchangeable or exercisable for common stock for 180 days after the date of this prospectus without first obtaining the written consent of each of the representatives of the underwriters, subject to a possible extension beyond the end of such 180-day period. See “Underwriting” for a description of these lock-up agreements.
Registration Statements on Form S-8
We intend to file one or more registration statements on Form S-8 under the Securities Act as soon as practicable after the completion of this offering for shares issued upon the exercise of options and shares to be issued under our employee benefit plans. As a result, any such options or shares will be freely tradable in the public market. We have granted options to purchase shares of our common stock that will vest and will be exercisable upon the completion of this offering. However, such shares held by affiliates will still be subject to the volume limitation, manner of sale, notice, and public information requirements of Rule 144 unless otherwise resalable under Rule 701.
Registration Rights
Beginning 180 days after the date of this prospectus, subject to certain exceptions and automatic extensions in certain circumstances, holders of shares of our common stock will be entitled to the registration rights described under “Related Party Transactions—Arrangements With Our Investors.” Registration of these shares under the Securities Act would result in these shares becoming freely tradable without restriction under the Securities Act immediately upon effectiveness of the registration.
Index to Financial Statements
MATERIAL U.S. FEDERAL INCOME AND ESTATE
TAX CONSIDERATIONS FOR NON-U.S. HOLDERS
The following is a summary of the material U.S. federal income and estate tax considerations relating to the purchase, ownership and disposition of our common stock by Non-U.S. Holders (defined below). This summary does not purport to be a complete analysis of all the potential tax considerations relevant to Non-U.S. Holders of our common stock. This summary is based upon the Internal Revenue Code of 1986, as amended (the “Internal Revenue Code”), the Treasury regulations promulgated or proposed thereunder and administrative and judicial interpretations thereof, all as of the date hereof and all of which are subject to change or differing interpretations at any time, possibly with retroactive effect.
This summary assumes that shares of our common stock are held as “capital assets” within the meaning of Section 1221 of the Internal Revenue Code. This summary does not purport to deal with all aspects of U.S. federal income and estate taxation that might be relevant to particular Non-U.S. Holders in light of their particular investment circumstances or status, nor does it address specific tax considerations that may be relevant to particular persons (including, for example, financial institutions, broker-dealers, insurance companies, partnerships or other pass-through entities, certain U.S. expatriates, tax-exempt organizations, pension plans, “controlled foreign corporations,” “passive foreign investment companies,” corporations that accumulate earnings to avoid U.S. federal income tax, persons in special situations, such as those who have elected to mark securities to market or those who hold common stock as part of a straddle, hedge, conversion transaction, synthetic security or other integrated investment, or holders subject to the alternative minimum tax). In addition, except as explicitly addressed herein with respect to estate tax, this summary does not address estate and gift tax considerations or considerations under the tax laws of any state, local or non-U.S. jurisdiction.
For purposes of this summary, a “Non-U.S. Holder” means a beneficial owner of common stock that for U.S. federal income tax purposes is not treated as a partnership and is not:
an individual who is a citizen or resident of the United States;
a corporation or any other organization taxable as a corporation for U.S. federal income tax purposes, created or organized in or under the laws of the United States, any state thereof or the District of Columbia;
an estate, the income of which is included in gross income for U.S. federal income tax purposes regardless of its source; or
a trust, if (i) a U.S. court is able to exercise primary supervision over the trust’s administration and one or more U.S. persons have the authority to control all of the trust’s substantial decisions or (i) the trust has a valid election in effect under applicable U.S. Treasury regulations to be treated as a U.S. person.
If an entity that is classified as a partnership for U.S. federal income tax purposes holds our common stock, the tax treatment of persons treated as its partners for U.S. federal income tax purposes will generally depend upon the status of the partner and the activities of the partnership. Partnerships and other entities that are classified as partnerships for U.S. federal income tax purposes and persons holding our common stock through a partnership or other entity classified as a partnership for U.S. federal income tax purposes are urged to consult their own tax advisors.
There can be no assurance that the Internal Revenue Service (“IRS”) will not challenge one or more of the tax consequences described herein, and we have not obtained, nor do we intend to obtain, a ruling from the IRS with respect to the U.S. federal income or estate tax consequences to a Non-U.S. Holder of the purchase, ownership or disposition of our common stock.
THIS SUMMARY IS NOT INTENDED TO BE TAX ADVICE. NON-U.S. HOLDERS ARE URGED TO CONSULT THEIR TAX ADVISORS CONCERNING THE U.S. FEDERAL INCOME AND ESTATE TAXATION, STATE, LOCAL AND NON-U.S. TAXATION AND OTHER TAX CONSEQUENCES TO THEM OF THE PURCHASE, OWNERSHIP AND DISPOSITION OF OUR COMMON STOCK.
Index to Financial Statements
Distributions on Our Common Stock
As discussed under “Dividend Policy” above, we do not currently expect to pay regularcash dividends on our common stock.stock and do not anticipate paying any dividends on our common stock in the foreseeable future. If we do make a distribution of cash or property with respect to our common stock, any such distributions generally will constitute dividends for U.S. federal income tax purposes to the extent of our current or accumulated earnings and profits, as determined under U.S. federal income tax principles. If a distribution exceeds our current and accumulated earnings and profits, the excess will constitute a return of capital and will first reduce the holder’s basis in our common stock, but not below zero. Any remaining excess will be treated as capital gain, subject to the tax treatment described below in “Gain“—Gain on Sale, Exchange or Other Taxable Disposition of Our Common Stock.” Any such distribution would also be subject to the discussion below in “—Additional Withholding and Information Reporting Requirements.FATCA Withholding.”
Dividends paid to a Non-U.S. Holder generally will be subject to a 30% U.S. federal withholding tax unless such Non-U.S. Holder provides us or our agent, as the case may be, with the appropriate IRS Form W-8, such as:
IRS Form W-8BEN (or successor form) certifying, under penalties of perjury, a reduction in withholding under an applicable income tax treaty, or
IRS Form W-8ECI (or successor form) certifying that a dividend paid on common stock is not subject to withholding tax because it is effectively connected with a trade or business in the United States of the Non-U.S. Holder (in which case such dividend generally will be subject to regular graduated U.S. federal income tax rates as described below).
The certification requirement described above also may require a Non-U.S. Holder that provides an IRS form or that claims treaty benefits to provide its U.S. taxpayer identification number. Special certification and other requirements apply in the case of certain Non-U.S. Holders that are intermediaries or pass-through entities for U.S. federal income tax purposes.
Each Non-U.S. Holder is urged to consult its own tax advisor about the specific methods for satisfying these requirements. A claim for exemption will not be valid if the person receiving the applicable form has actual knowledge or reason to know that the statements on the form are false.
If dividends are effectively connected with a trade or business in the United States of a Non-U.S. Holder (and, if required by an applicable income tax treaty, attributable to a U.S. permanent establishment), the Non-U.S. Holder, although exempt from the withholding tax described above (provided that the certifications described above are satisfied), generally will be subject to U.S. federal income tax on such dividends on a net income basis in the same manner as if it were a resident of the United States. In addition, if a Non-U.S. Holder is treated as a corporation for U.S. federal income tax purposes, the Non-U.S. Holder may be subject to an additional “branch profits tax” equal to 30% (unless reduced by an applicable income treaty) of its earnings and profits in respect of such effectively connected dividend income.
If a Non-U.S. Holder is eligible for a reduced rate of U.S. federal withholding tax pursuant to an income tax treaty, the holder may obtain a refund or credit of any excess amount withheld by timely filing an appropriate claim for refund with the IRS.
Gain on Sale, Exchange or Other Taxable Disposition of Our Common Stock
Subject to the discussion below in “—Additional FATCA Withholding, and Information Reporting Requirements,” in general, a Non-U.S. Holder will not be subject to U.S. federal income tax or withholding tax on gain realized upon such holder’s sale, exchange or other taxable disposition of shares of our common stock unless (i) such Non-U.S. Holder is an individual who is present in the United States for 183 days or more in the
Index to Financial Statements
taxable year of disposition, and certain other conditions are met, (ii) we are or have been a “United States real property holding corporation,” as defined in the Internal Revenue Code (a “USRPHC”), at any time within the shorter of the five-year period preceding the disposition and the Non-U.S. Holder’s holding period in the shares of our common stock, and certain other requirements are met, or (iii) such gain is effectively connected with the conduct by such Non-U.S. Holder of a trade or business in the United States (and, if required by an applicable income tax treaty, is attributable to a permanent establishment maintained by such Non-U.S. Holder in the United States).
If the first exception applies, the Non-U.S. Holder generally will be subject to U.S. federal income tax at a rate of 30% (or at a reduced rate under an applicable income tax treaty) on the amount by which such Non-U.S. Holder’s capital gains allocable to U.S. sources (including gain, if any, realized on a disposition of our common stock) exceed capital losses allocable to U.S. sources during the taxable year of the disposition. If the third exception applies, the Non-U.S. Holder generally will be subject to U.S. federal income tax with respect to such gain on a net income basis in the same manner as if it were a resident of the United States, and a Non-U.S. Holder that is a corporation for U.S. federal income tax purposes may also be subject to a branch profits tax with respect any earnings and profits attributable to such gain at a rate of 30% (or at a reduced rate under an applicable income tax treaty).
Generally, a corporation is a USRPHC only if the fair market value of its U.S. real property interests (as defined in the Internal Revenue Code) equals or exceeds 50% of the sum of the fair market value of its worldwide real property interests plus its other assets used or held for use in a trade or business. Although there can be no assurance in this regard, we believe that we are not, and do not anticipate becoming, a USRPHC. However, because the determination of whether we are a USRPHC depends on the fair market value of our U.S. real property relative to the fair market value of other business assets, there can be no assurance that we will not become a USRPHC in the future. Even if we became a USRPHC, a Non-U.S. Holder would not be subject to U.S. federal income tax on a sale, exchange or other taxable disposition of our common stock by reason of our status as a USRPHC so long as our common stock is regularly traded on an established securities market at any time during the calendar year in which the disposition occurs and such Non-U.S. Holder does not own and is not deemed to own (directly, indirectly or constructively) more than 5% of our common stock at any time during the shorter of the five-year period ending on the date of disposition and the holder’s holding period. However, no assurance can be provided that our common stock will be regularly traded on an established securities market for purposes of the rules described above. Prospective investors are encouraged to consult their own tax advisors regarding the possible consequences to them if we are, or were to become, a USRPHC.
Additional FATCA Withholding
Under Sections 1471 through 1474 of the Code and Information Reporting Requirements
Legislation enacted in March 2010 (commonly referred to as “FATCA”related Treasury guidance (“FATCA”) generally will impose, a U.S. federal withholding tax of 30% will be imposed in certain circumstances on payments to certain non-U.S. entities (including certain intermediaries), includingof (a) dividends on our common stock on or after January 1, 2014, and the(b) gross proceeds from athe sale or other disposition of our common stock on or after January 1, 2017. In the case of payments made to a ‘‘foreign financial institution’’ as defined under FATCA (including, among other entities, an investment fund), as a beneficial owner or as an intermediary, the tax generally will be imposed, subject to certain exceptions, unless such persons complyinstitution (i) enters into (or is otherwise subject to) and complies with an agreement with the U.S. government (a “FATCA Agreement”) or (ii) complies with applicable foreign law enacted in connection with an intergovernmental agreement between the United States and a complicated U.S. information reporting, disclosure and certification regime. This new regime requires,foreign jurisdiction (an “IGA”), in either case to, among other things, a broad class of persons to enter into agreements with the IRS to obtain, disclosecollect and report information about their investors and account holders. This new regime and its requirements are different from and in additionprovide to the certification requirements described elsewhere in this discussion. As currently proposed,U.S. or other relevant tax authorities certain information regarding U.S. account holders of such institution. In the FATCA withholding rules would applycase of payments made to a foreign entity that is not a foreign financial institution (as a beneficial owner), the tax generally will be imposed, subject to certain payments, including dividend payments onexceptions, unless such foreign entity provides the withholding agent with a certification that it
does not have any “substantial U.S. owner” (generally, any specified U.S. person that directly or indirectly owns more than a specified percentage of such entity) or that identifies its substantial U.S. owners. If our common stock if any, paid after December 31, 2013, andis held through a foreign financial institution that enters into (or is otherwise subject to) a FATCA Agreement, such foreign financial institution (or, in certain cases, a person paying amounts to such foreign financial institution) generally will be required, subject to certain exceptions, to withhold such tax on payments of grossdividends and proceeds fromdescribed above made to (x) a person (including an individual) that fails to comply with certain information requests or (y) a foreign financial institution that has not entered into (and is not otherwise subject to) a FATCA Agreement and is not required to comply with FATCA pursuant to applicable foreign law enacted in connection with an IGA. Each Non-U.S. Holder should consult its own tax advisor regarding the sale or other dispositionsapplication of FATCA to the ownership and disposition of our common stock, paid after December 31, 2014.
Although administrative guidance and proposed regulations have been issued, regulations implementing the new FATCA regime have not yet been finalized and the exact scope of these rules remains unclear and potentially subject to material changes. Prospective investors should consult their own tax advisors regarding the possible impact of these rules on their investment in our common stock, and the entitiesincluding through which they hold our common stock, including, without limitation, the process and deadlines for meeting the applicable requirements to prevent the imposition of this 30% withholding tax under FATCA.an intermediary.
Index to Financial Statements
Backup Withholding and Information Reporting
We must report annually to the IRS and to each Non-U.S. Holder the gross amount of the distributions on our common stock paid to the holder and the tax withheld, if any, with respect to the distributions.
Non-U.S. Holders may have to comply with specific certification procedures to establish that the holder is not a United States person (as defined in the Internal Revenue Code) in order to avoid backup withholding at the applicablea rate currentlyof 28% and scheduled to increase to 31% for taxable years 2013 and thereafter, with respect to dividends on our common stock. Dividends paid to Non-U.S. Holders subject to the U.S. withholding tax, as described above in “—Distributions on Our Common Stock,” generally will be exempt from U.S. backup withholding.
Information reporting and backup withholding will generally apply to the proceeds of a disposition of our common stock by a Non-U.S. Holder effected by or through the U.S. office of any broker, U.S. or foreign, unless the holder certifies its status as a Non-U.S. Holder and satisfies certain other requirements, or otherwise establishes an exemption. Dispositions effected through a non-U.S. office of a U.S. broker or a non-U.S. broker with substantial U.S. ownership or operations generally will be treated in a manner similar to dispositions effected through a U.S. office of a broker. Prospective investors should consult their own tax advisors regarding the application of the information reporting and backup withholding rules to them.
Copies of information returns may be made available to the tax authorities of the country in which the Non-U.S. Holder resides or in which the Non-U.S. Holder is incorporated under the provisions of a specific treaty or agreement.
Backup withholding is not an additional tax. Any amounts withheld under the backup withholding rules from a payment to a Non-U.S. Holder can be refunded or credited against the Non-U.S. Holder’s U.S. federal income tax liability, if any, provided that an appropriate claim is timely filed with the IRS.
Federal Estate Tax
Common stock owned (or treated as owned) by an individual who is not a citizen or a resident of the United States (as defined for U.S. federal estate tax purposes) at the time of death will be included in the individual’s gross estate for U.S. federal estate tax purposes, unless an applicable estate or other tax treaty provides otherwise, and, therefore, may be subject to U.S. federal estate tax.
Medicare Contributions Tax
For taxable years beginning after December 31, 2012, a 3.8% tax is imposed on the net investment income (which includes dividends and gains recognized upon of a disposition of stock) of certain individuals, trusts, and estates with adjusted gross income in excess of certain thresholds. This tax is imposed on individuals, estates, and trusts that are U.S. Holders. The tax is expressly not imposed on nonresident aliens; however,aliens, and proposed guidance suggests estates and trusts thatwhich are not U.S. Holders and have no U.S. beneficiaries are not expressly exempted from the tax. Therefore, non-U.S. Holders of our common shares should consult their tax advisors regarding application of this Medicare contribution tax in their particular situations.
Index to Financial Statements
Merrill Lynch, Pierce, Fenner & Smith Incorporated, Morgan Stanley & Co. LLC and J.P. Morgan Securities LLC are acting as representatives of each of the underwriters named below. Subject to the terms and conditions set forth in an underwriting agreement among us, the selling stockholders and the underwriters, wethe selling stockholders have agreed to sell to the underwriters, and each of the underwriters has agreed, severally and not jointly, to purchase from us,the selling stockholders, the number of shares of common stock set forth opposite its name below.
Underwriter | Number of Shares | |||
Merrill Lynch, Pierce, Fenner & Smith | ||||
Morgan Stanley & Co. LLC | ||||
J.P. Morgan Securities LLC | ||||
Deutsche Bank Securities | ||||
Goldman, Sachs & | ||||
Jefferies LLC | ||||
William Blair & Company, L.L.C | ||||
Raymond James & Associates, Inc | ||||
Wells Fargo Securities, LLC | ||||
The Williams Capital Group, L.P | ||||
| ||||
Total | 17,000,000 | |||
| ||||
Subject to the terms and conditions set forth in the underwriting agreement, the underwriters have agreed, severally and not jointly, to purchase all of the shares sold under the underwriting agreement if any of these shares are purchased. If an underwriter defaults, the underwriting agreement provides that the purchase commitments of the nondefaulting underwriters may be increased or the underwriting agreement may be terminated.
We and the selling stockholders have agreed to indemnify the several underwriters against certain liabilities, including liabilities under the Securities Act, or to contribute to payments the underwriters may be required to make in respect of those liabilities.
The underwriters are offering the shares, subject to prior sale, when, as and if issued to and accepted by them, subject to approval of legal matters by their counsel, including the validity of the shares, and other conditions contained in the underwriting agreement, such as the receipt by the underwriters of officer’s certificates and legal opinions. The underwriters reserve the right to withdraw, cancel or modify offers to the public and to reject orders in whole or in part.
Commissions and Discounts
The representatives have advised us and the selling stockholders that the underwriters propose initially to offer the shares to the public at the public offering price set forth on the cover page of this prospectus and to dealers at that price less a concession not in excess of $ per share. After the initial offering, the public offering price, concession or any other term of the offering may be changed.
The following table shows the public offering price, underwriting discount and proceeds before expenses to us.the selling stockholders. The information assumes either no exercise or full exercise by the underwriters of their option to purchase additional shares.
Per Share | Without Option | With Option | ||||||||||
Public offering price | $ | $ | $ | |||||||||
Underwriting discount | $ | $ | $ | |||||||||
Proceeds, before expenses, to | $ | $ | $ | |||||||||
Index to Financial Statements
TheWe estimate our share of the total expenses of the offering, not including theexcluding underwriting discount, are estimated at $discounts and are payable by us.commissions, will be approximately $1.0 million. The underwriters have agreed to reimburse us for certain documented expenses incurred in connection with this offering.
Option to Purchase Additional Shares
WeCertain of the selling stockholders have granted an option to the underwriters, exercisable for 30 days after the date of this prospectus, to purchase up to 2,550,000 additional shares at the public offering price, less the underwriting discount. If the underwriters exercise this option, each will be obligated, subject to conditions contained in the underwriting agreement, to purchase a number of additional shares proportionate to that underwriter’s initial amount reflected in the above table.
Reserved Shares
At our request, the underwriters have reserved for sale, at the initial public offering price, up to % of the shares offered by this prospectus for sale to some of our directors, officers, employees and certain other persons who are associated with us. If these persons purchase reserved shares, this will reduce the number of shares available for sale to the general public. Any reserved shares that are not so purchased will be offered by the underwriters to the general public on the same terms as the other shares offered by this prospectus.
No Sales of Similar Securities
We, our executive officers and directorsDirectors and our other existing security holderscertain stockholders, including the Founders and Sponsors, have agreed, subject to certain exceptions, not to sell or transfer any of our common stock or securities convertible into, exchangeable for, exercisable for, or repayable with our common stock, for 18090 days after the date of this prospectus without first obtaining the written consent of the representatives. Specifically, we and these other persons have agreed, with certain limited exceptions, not to directly or indirectly:
offer, pledge, sell or contract to sell any of our common stock;
sell any option or contract to purchase any of our common stock;
purchase any option or contract to sell any of our common stock;
grant any option, right or warrant for the sale of any of our common stock;
lend or otherwise dispose of or transfer any of our common stock;
request or demand that we file a registration statement related to our common stock; or
enter into any swap or other agreement that transfers, in whole or in part, the economic consequence of ownership of any of our common stock whether any such swap or transaction is to be settled by delivery of shares or other securities, in cash or otherwise.
This lock-up provision applies to our common stock and to securities convertible into or exchangeable or exercisable for or repayable with our common stock. It also applies to our common stock owned now or acquired later by the person executing the agreement or for which the person executing the agreement later acquires the power of disposition. In the event that either (x) during the last 17 days of the lock-up period referred to above, we issue an earnings release or material news or a material event relating to us occurs or (y) prior to the expiration of the lock-up period, we announce that we will release earnings results or become aware that material news or a material event will occur during the 16-day period beginning on the last day of the lock-up period, the restrictions described above shall continue to apply until the expiration of the 18-day period beginning on the issuance of the earnings release or the occurrence of the material news or material event.
Index to Financial Statements
Listing
We expectOur shares are listed on the shares to be approved for listing on theNasdaq Global Select Market under the symbol “BLM.“BLMN.”
Before this offering, there has been no public market for our common stock. The initial public offering price will be determined through negotiations among us and the representatives. In addition to prevailing market conditions, the factors to be considered in determining the initial public offering price are:
the valuation multiples of publicly traded companies that the representatives believe to be comparable to us;
our financial information;
the history of, and the prospects for, our company and the industry in which we compete;
an assessment of our management, its past and present operations, and the prospects for, and timing of, our future revenues;
the present state of our development; and
the above factors in relation to market values and various valuation measures of other companies engaged in activities similar to ours.
An active trading market for the shares may not develop. It is also possible that after the offering the shares will not trade in the public market at or above the initial public offering price.
The underwriters do not expect to sell more than 5% of the shares in the aggregate to accounts over which they exercise discretionary authority.
Price Stabilization and Short Positions and Penalty Bids
Until the distribution of the shares is completed, SEC rules may limit underwriters and selling group members from bidding for and purchasing our common stock. However, the representatives may engage in transactions that stabilize the price of the common stock, such as bids or purchases to peg, fix or maintain that price.
In connection with the offering, the underwriters may purchase and sell our common stock in the open market. These transactions may include short sales, purchases on the open market to cover positions created by short sales and stabilizing transactions. Short sales involve the sale by the underwriters of a greater number of shares than they are required to purchase in the offering. “Covered” short sales are sales made in an amount not greater than the underwriters’ option to purchase additional shares described above. The underwriters may close out any covered short position by either exercising their option to purchase additional shares or purchasing shares in the open market. In determining the source of shares to close out the covered short position, the underwriters will consider, among other things, the price of shares available for purchase in the open market as compared to the price at which they may purchase shares through the option granted to them. “Naked” short sales are sales in excess of such option. The underwriters must close out any naked short position by purchasing shares in the open market. A naked short position is more likely to be created if the underwriters are concerned that there may be downward pressure on the price of our common stock in the open market after pricing that could adversely affect investors who purchase in the offering. Stabilizing transactions consist of various bids for or purchases of shares of common stock made by the underwriters in the open market prior to the completion of the offering.
The underwriters may also impose a penalty bid. This occurs when a particular underwriter repays to the underwriters a portion of the underwriting discount received by it because the representatives have repurchased shares sold by or for the account of such underwriter in stabilizing or short covering transactions.
Index to Financial Statements
Similar to other purchase transactions, the underwriters’ purchases to cover the syndicate short sales may have the effect of raising or maintaining the market price of our common stock or preventing or retarding a decline in the market price of our common stock. As a result, the price of our common stock may be higher than the price that might otherwise exist in the open market. The underwriters may conduct these transactions on ,the Nasdaq Global Select Market, in the over-the-counter market or otherwise.
Neither we nor any of the underwriters make any representation or prediction as to the direction or magnitude of any effect that the transactions described above may have on the price of our common stock. In addition, neither we nor any of the underwriters make any representation that the representatives will engage in these transactions or that these transactions, once commenced, will not be discontinued without notice.
Passive Market Making
In connection with this offering, underwriters and selling group members may engage in passive market making transactions in our common stock on the Nasdaq Global Select Market in accordance with Rule 103 of Regulation M under the Exchange Act during a period before the commencement of offers or sales of common stock and extending through the completion of distribution. A passive market maker must display its bid at a price not in excess of the highest independent bid of that security. However, if all independent bids are lowered below the passive market maker’s bid, that bid must then be lowered when specified purchase limits are exceeded. Passive market making may cause the price of our common stock to be higher than the price that otherwise would exist in the open market in the absence of those transactions. The underwriters and dealers are not required to engage in passive market making and may end passive market making activities at any time.
Electronic Distribution
In connection with the offering, certain of the underwriters or securities dealers may distribute prospectuses by electronic means, such as e-mail.
Other Relationships
The underwriters and their respective affiliates are full-servicefull service financial institutions engaged in various activities, which may include securitiessales and trading, commercial and investment banking, financial advisory, investment management, investment research, principal investment, hedging, financingmarket making and brokerage, activities. Someand other financial and non-financial activities and services. Certain of the underwriters and their respective affiliates have engaged in,provided, and may in the future engage in, investment bankingprovide, a variety of those services to us and other commercial dealings in the ordinary course of businessto persons and entities with relationships with us, or our affiliates. They havefor which they received or may in the futurewill receive customary fees and commissions for these transactions.expenses.
Merrill Lynch, Pierce, Fenner & Smith Incorporated and Deutsche Bank Securities Inc. acted as initial purchasers in connection with the offering of our Senior Notes.senior notes. In addition, affiliates of certain underwriters act in various capacities under our senior credit facility.New Facilities. Bank of America, N.A., an affiliate of Merrill Lynch, Pierce, Fenner & Smith Incorporated, acts as syndication agent and Deutsche Bank AG New York Branch,Trust Companies Americas, an affiliate of Deutsche Bank Securities Inc., acts as administrative agent, pre-funded revolving credit facility deposit bank, swing line lender and a letter of credit issuer. Deutsche Bank Securities Inc. and Merrill Lynch, Pierce, Fenner & Smith Incorporated, also acted as joint lead arrangers and joint lead bookrunners, and JP Morgan Securities LLC and affiliates of Morgan Stanley & Co. LLC and Goldman Sachs & Co. acted as joint lead bookrunners and co-documentation agents. Affiliates of Merrill Lynch, Pierce, Fenner & Smith Incorporated, and Deutsche Bank Securities Inc., JP Morgan Securities LLC, Morgan Stanley & Co. LLC, Goldman, Sachs & Co. and Wells Fargo Securities, LLC also act as lenders under our senior credit facility.New Facilities. With regard to the repricing of the New Term Loan B, Deutsche Bank Securities Inc. and Merrill Lynch, Pierce, Fenner & Smith Incorporated acted as Joint Lead Arrangers, and each of Deutsche Bank Securities Inc, Merrill Lynch, Pierce, Fenner & Smith Incorporated, Goldman Sachs USA, J.P. Morgan Securities LLC, and Morgan Stanley Senior Funding, Inc, acted as Joint Lead Bookrunners. In addition, Bank of America, N.A., an affiliate of Merrill Lynch, Pierce, Fenner & Smith Incorporated, and German American Capital Corporation, an affiliate of Deutsche Bank Securities Inc., co-originated our 2012 CMBS Loan. Banc of America Merrill Lynch Large Loan Inc., an affiliate of Merrill Lynch, Pierce, Fenner & Smith Incorporated, acted as depositor in connection with the securitization of the mortgage loan portion of the 2012 CMBS Loan. Merrill Lynch, Pierce, Fenner & Smith Incorporated and Deutsche Bank Securities Inc. also acted as co-lead manager, bookrunner and placement agent, and JP Morgan Securities LLC acted as co-manager and placement agent for the 2012 CMBS Loan. Bank of America, N.A., is also acting as servicer for the 2012 CMBS Loan. Each of the underwriters in this offering acted as underwriters in connection with our initial public offering.
The underwriters may have ongoing relationships with, render services to, and engage in transactions with us and our affiliates, which relationships and transactions may create conflicts of interest between the underwriters, on the one hand, and the investors in this offering, on the other hand. For example, Merrill Lynch, Pierce, Fenner & Smith Incorporated and Deutsche Bank Securities Inc. acted as the placement agents for the mezzanine portion of the 2012 CMBS Loans, and may have ongoing relationships with these lenders. The underwriters also assisted us in arranging the Sale-Leaseback Transaction. TheseTransaction and New Facilities. The restaurant properties involved in the Sale-Leaseback Transaction do not secure the 2012 CMBS Loan but include restaurants of the same brand and/or concept as those that do secure the 2012 CMBS Loan. In light of such activities and the ongoing relationships of the underwriters with us, for purposes of your assessment of potential conflicts of interest involving the underwriters as it relates to their placement of these securities, you should assume that the underwriters will be, or would like to become, involved as arrangers, placement agents, underwriters or in other roles in other transactions for such parties.
IndexSolebury Capital LLC, or Solebury, a FINRA member, is acting as our financial advisor in connection with the offering. We expect to Financial Statements
pay Solebury, upon the successful completion of this offering, a fee of $300,000 for its services. We have also agreed to reimburse Solebury for certain expenses incurred in connection with the engagement of up to $15,000, and, in our sole discretion, may pay Solebury an additional incentive fee of up to $50,000. Solebury is not acting as an underwriter and will not sell or offer to sell any securities and will not identify, solicit or engage directly with potential investors. In addition, Solebury will not underwrite or purchase any of the offered securities or otherwise participate in any such undertaking.
We estimate our share of the total expenses of the offering, excluding underwriting discounts and commissions, will be approximately $1.0 million. We have agreed to pay the filing fees incident to, and the fees and disbursements of counsel for the underwriters in connection with, any required review by FINRA in connection with this offering, in an amount not to exceed $25,000. The underwriters have agreed to reimburse us for certain documented expenses in connection with the offering.
In the ordinary course of their various business activities, the underwriters and their respective affiliates, officers, Directors and employees may makepurchase, sell or hold a broad array of investments and actively trade debtsecurities, derivatives, loans, commodities, currencies, credit default swaps and equity securities (or related derivative securities) andother financial instruments (including bank loans) for their own account and for the accounts of their customers. Such investmentscustomers, and securitiessuch investment and trading activities may involve or relate to securities and/or instruments of ours (directly, as collateral securing other obligations or our affiliates.otherwise) and/or person and entities with relationships with us. The underwriters and their respective affiliates may also make
communicate independent investment recommendations, market color or trading ideas and/or publish or express independent research views in respect of such assets, securities or financial instruments and may at any time hold, or recommend to clients that they should acquire, long and/or short positions in such assets, securities and instruments.
Notice to Prospective Investors in the European Economic Area
In relation to each Member State of the European Economic Area which has implemented the Prospectus Directive (each, a “Relevant Member State”), with effect from and including the date on which the Prospectus Directive is implemented in that Relevant Member State (the “Relevant Implementation Date”), no offer of shares may be made to the public in that Relevant Member State other than:
to any legal entity which is a qualified investor as defined in the Prospectus Directive;
to fewer than 100 or, if the Relevant Member State has implemented the relevant provision of the 2010 PD Amending Directive, 150, natural or legal persons (other than qualified investors as defined in the Prospectus Directive), as permitted under the Prospectus Directive, subject to obtaining the prior consent of the representatives; or
in any other circumstances falling within Article 3(2) of the Prospectus Directive, provided that no such offer of shares shall require the companyCompany or the representatives to publish a prospectus pursuant to Article 3 of the Prospectus Directive or supplement a prospectus pursuant to Article 16 of the Prospectus Directive.
Each person in a Relevant Member State (other than a Relevant Member State where there is a Permitted Public Offer) who initially acquires any shares or to whom any offer is made will be deemed to have represented, acknowledged and agreed that (i) it is a “qualified investor” within the meaning of the law in that Relevant Member State implementing Article 2(1)(e) of the Prospectus Directive, and (ii) in the case of any shares acquired by it as a financial intermediary, as that term is used in Article 3(2) of the Prospectus Directive, the shares acquired by it in the offering have not been acquired on behalf of, nor have they been acquired with a view to their offer or resale to, persons in any Relevant Member State other than “qualified investors” as defined in the Prospectus Directive, or in circumstances in which the prior consent of the representatives has been given to the offer or resale. In the case of any shares being offered to a financial intermediary as that term is used in Article 3(2) of the Prospectus Directive, each such financial intermediary will be deemed to have represented, acknowledged and agreed that the shares acquired by it in the offer have not been acquired on a non-discretionary basis on behalf of, nor have they been acquired with a view to their offer or resale to, persons in circumstances which may give rise to an offer of any shares to the public other than their offer or resale in a Relevant Member State to qualified investors as so defined or in circumstances in which the prior consent of the representatives has been obtained to each such proposed offer or resale.
The company,Company, the representatives and their affiliates will rely upon the truth and accuracy of the foregoing representation, acknowledgement and agreement.
This prospectus has been prepared on the basis that any offer of shares in any Relevant Member State will be made pursuant to an exemption under the Prospectus Directive from the requirement to publish a prospectus for offers of shares. Accordingly, any person making or intending to make an offer in that Relevant Member State of shares which are the subject of the offering contemplated in this prospectus may only do so in circumstances in which no obligation arises for the companyCompany or any of the underwriters to publish a prospectus pursuant to Article 3 of the Prospectus Directive in relation to such offer. Neither the companyCompany nor the
Index to Financial Statements
underwriters have authorized, nor do they authorize, the making of any offer of shares in circumstances in which an obligation arises for the companyCompany or the underwriters to publish a prospectus for such offer.
For the purpose of the above provisions, the expression “an offer to the public” in relation to any shares in any Relevant Member State means the communication in any form and by any means of sufficient information on the terms of the offer and the shares to be offered so as to enable an investor to decide to purchase or subscribe the shares, as the same may be varied in the Relevant Member State by any measure implementing the Prospectus Directive in the Relevant Member State, and the expression “Prospectus Directive” means Directive 2003/71/EC (including the 2010 PD Amending Directive, to the extent implemented in the Relevant Member States) and includes any relevant implementing measure in the Relevant Member State, and the expression “2010 PD Amending Directive” means Directive 2010/73/EU.
Notice to Prospective Investors in the United Kingdom
In addition, in the United Kingdom, this document is being distributed only to, and is directed only at, and any offer subsequently made may only be directed at persons who are “qualified investors” (as defined in the Prospectus Directive) (i) who have professional experience in matters relating to investments falling within Article 19 (5) of the Financial Services and Markets Act 2000 (Financial Promotion) Order 2005, as amended (the “Order”) and/or (ii) who are high net worth companies (or persons to whom it may otherwise be lawfully communicated) falling within Article 49(2)(a) to (d) of the Order (all such persons together being referred to as “relevant persons”). This document must not be acted on or relied on in the United Kingdom by persons who are not relevant persons. In the United Kingdom, any investment or investment activity to which this document relates is only available to, and will be engaged in with, relevant persons.
Notice to Prospective Investors in Switzerland
The shares may not be publicly offered in Switzerland and will not be listed on the SIX Swiss Exchange (“SIX”) or on any other stock exchange or regulated trading facility in Switzerland. This document has been prepared without regard to the disclosure standards for issuance prospectuses under art. 652a or art. 1156 of the Swiss Code of Obligations or the disclosure standards for listing prospectuses under art. 27 ff. of the SIX Listing Rules or the listing rules of any other stock exchange or regulated trading facility in Switzerland. Neither this document nor any other offering or marketing material relating to the shares or the offering may be publicly distributed or otherwise made publicly available in Switzerland.
Neither this document nor any other offering or marketing material relating to the offering, the company,Company, or the shares has been or will be filed with or approved by any Swiss regulatory authority. In particular, this document will not be filed with, and the offer of shares will not be supervised by, the Swiss Financial Market Supervisory Authority FINMA (FINMA), and the offer of shares has not been and will not be authorized under the Swiss Federal Act on Collective Investment Schemes (“CISA”). The investor protection afforded to acquirers of interests in collective investment schemes under the CISA does not extend to acquirers of shares.
Notice to Prospective Investors in the Dubai International Financial Centre
This prospectus relates to an Exempt Offer in accordance with the Offered Securities Rules of the Dubai Financial Services Authority (“DFSA”). This prospectus is intended for distribution only to persons of a type specified in the Offered Securities Rules of the DFSA. It must not be delivered to, or relied on by, any other person. The DFSA has no responsibility for reviewing or verifying any documents in connection with Exempt Offers. The DFSA has not approved this prospectus nor taken steps to verify the information set forth herein and has no responsibility for the prospectus. The shares to which this prospectus relates may be illiquid and/or subject to restrictions on their resale. Prospective purchasers of the shares offered should conduct their own due diligence on the shares. If you do not understand the contents of this prospectus you should consult an authorized financial advisor.
Index to Financial Statements
Notice to Prospective Investors in Hong Kong
The shares may not be offered or sold by means of any document other than (i) in circumstances which do not constitute an offer to the public within the meaning of the Companies Ordinance (Cap.32, Laws of Hong Kong), or (ii) to “professional investors” within the meaning of the Securities and Futures Ordinance (Cap.571, Laws of Hong Kong) and any rules made thereunder, or (iii) in other circumstances which do not result in the document being a “prospectus” within the meaning of the Companies Ordinance (Cap.32, Laws of Hong Kong), and no advertisement, invitation or document relating to the shares may be issued or may be in the possession of any person for the purpose of issue (in each case whether in Hong Kong or elsewhere), which is directed at, or the contents of which are likely to be accessed or read by, the public in Hong Kong (except if permitted to do so under the laws of Hong Kong) other than with respect to shares which are or are intended to be disposed of only to persons outside Hong Kong or only to “professional investors” within the meaning of the Securities and Futures Ordinance (Cap.571, Laws of Hong Kong) and any rules made thereunder.
Notice to Prospective Investors in Singapore
This prospectus has not been registered as a prospectus with the Monetary Authority of Singapore. Accordingly, this prospectus and any other document or material in connection with the offer or sale, or invitation for subscription or purchase, of the shares may not be circulated or distributed, nor may the shares be offered or sold, or be made the subject of an invitation for subscription or purchase, whether directly or indirectly, to persons in Singapore other than (i) to an institutional investor under Section 274 of the Securities and Futures Act, Chapter 289 of Singapore (the “SFA”), (ii) to a relevant person, or any person pursuant to Section 275(1A), and in accordance with the conditions, specified in Section 275 of the SFA or (iii) otherwise pursuant to, and in accordance with the conditions of, any other applicable provision of the SFA.
Where the shares are subscribed or purchased under Section 275 by a relevant person which is: (i) a corporation (which is not an accredited investor) the sole business of which is to hold investments and the entire share capital of which is owned by one or more individuals, each of whom is an accredited investor; or (ii) a trust (where the trustee is not an accredited investor) whose sole purpose is to hold investments and each beneficiary is an accredited investor, shares, debentures and units of shares and debentures of that corporation or the beneficiaries’ rights and interest in that trust shall not be transferable for six months after that corporation or that trust has acquired the shares under Section 275 except: (i) to an institutional investor under Section 274 of the SFA or to a relevant person, or any person pursuant to Section 275(1A), and in accordance with the conditions, specified in Section 275 of the SFA; (ii) where no consideration is given for the transfer; or (iii) by operation of law.
Notice to Prospective Investors in Japan
The securities have not been and will not be registered under the Financial Instruments and Exchange Law of Japan (the Financial Instruments and Exchange Law) and each underwriter has agreed that it will not offer or sell any securities, directly or indirectly, in Japan or to, or for the benefit of, any resident of Japan (which term as used herein means any person resident in Japan, including any corporation or other entity organized under the laws of Japan), or to others for re-offering or resale, directly or indirectly, in Japan or to a resident of Japan, except pursuant to an exemption from the registration requirements of, and otherwise in compliance with, the Financial Instruments and Exchange Law and any other applicable laws, regulations and ministerial guidelines of Japan.
Index to Financial Statements
Baker & Hostetler LLP, Cleveland, Ohio, has passed upon the validity of the common stock offered hereby on our behalf. The underwriters are being represented by Ropes & Gray LLP, Boston, Massachusetts.
The financial statements as of December 31, 20112012 and 20102011 and for each of the three years in the period ended December 31, 20112012 included in this prospectus have been so included in reliance on the report of PricewaterhouseCoopers LLP, an independent registered certified public accounting firm, given on the authority of said firm as experts in auditing and accounting.
The consolidated financial statements of PGS Consultoria e Serviços Ltda. at December 31, 2010, and for the year then ended, appearing in this Prospectus and Registration Statement have been audited by Ernst & Young Terco Auditores Independentes S.S., independent auditors, as set forth in their report thereon appearing elsewhere herein, and are included in reliance upon such report given on the authority of such firm as experts in accounting and auditing.
WHERE YOU CAN FIND MORE INFORMATION
We have filed with the SEC a registration statement on Form S-1 under the Securities Act that registers the shares of our common stock to be sold in this offering. This prospectus does not contain all of the information set forth in the registration statement and the exhibits and schedules thereto. For further information with respect to us and our common stock, you should refer to the registration statement and the exhibits and schedules filed as a part of the registration statement. Statements contained in this prospectus concerning the contents of any contract or any other document are not necessarily complete. If a contract or document has been filed as an exhibit to the registration statement, we refer you to the copy of the contract or document that has been filed. Each statement in this prospectus relating to a contract or document filed as an exhibit is qualified in all respects by the filed exhibit.
We are not currently subject to the informational requirements of the Securities Exchange Act of 1934. As a result of this offering, we will become subject to the informational requirements of the Exchange Act1934, as amended, and, in accordance therewith, will file reports and other information with the SEC. The registration statement, reports and other information we file with the SEC can be read and copied at the SEC’s Public Reference Room at 100 F Street, N.E., Washington D.C. 20549. You may obtain information regarding the operation of the public reference room by calling 1-800-SEC-0330. The SEC also maintains a website (http://www.sec.gov) that contains reports, proxy and information statements and other information that we file electronically with the SEC. We also maintain a website at www.bloominbrands.com. Our website, and the information contained on or accessible through our website, is not part of this prospectus.
Index to Financial Statements
INDEX TO CONSOLIDATED FINANCIAL STATEMENTS
| |||||
Page | |||||
Audited financial statements for the years ended December 31, 2012, 2011 | |||||
Report of Independent Registered Certified Public Accounting Firm | F-2 | ||||
Consolidated Balance Sheets as of December 31, | F-3 | ||||
| F-4 | |||||
| F-5 | |||||
Consolidated Statements of Cash Flows for the years ended December 31, 2012, 2011 | F-6 | ||||
| F-8 | |||||
| |||||
Page | |||||
| |||||
| F-55 | |||||
| F-56 | |||||
| F-57 | |||||
| F-58 | |||||
Index to Financial Statements
Report of Independent Registered Certified Public Accounting Firm
To the Board of Directors and ShareholdersStockholders of
Bloomin’ Brands, Inc.
In our opinion, the accompanying consolidated balance sheets and the related consolidated statements of operations and comprehensive income, changes in shareholders’stockholders’ equity (deficit), and cash flows present fairly, in all material respects, the financial position of Bloomin’ Brands, Inc. and its subsidiaries at December 31, 20112012 and 2010,2011, and the results of theirits operations and theirits cash flows for each of the three years in the period ended December 31, 20112012 in conformity with accounting principles generally accepted in the United States of America. In addition, in our opinion, the financial statement schedule listed in the index appearing under Item 16(b) presents fairly, in all material respects, the information set forth therein when read in conjunction with the related consolidated financial statements. These consolidated financial statements and the financial statement schedule are the responsibility of the Company’s management. Our responsibility is to express an opinion on these consolidated financial statements and the financial statement schedule based on our audits. We conducted our audits of these statements and the financial statement schedule in accordance with the standards of the Public Company Accounting Oversight Board (United States). Those standards require that we plan and perform the audit to obtain reasonable assurance about whether the consolidated financial statements and the financial statement schedule are free of material misstatement. An audit includes examining, on a test basis, evidence supporting the amounts and disclosures in the consolidated financial statements, and the financial statement schedule, assessing the accounting principles used and significant estimates made by management, and evaluating the overall financial statement presentation. We believe that our audits provide a reasonable basis for our opinion.
/s/ PricewaterhouseCoopers LLP
PricewaterhouseCoopers LLP
Tampa, FloridaFL
April 6, 2012March 4, 2013
Index to Financial Statements
BLOOMIN’ BRANDS, INC.
(In Thousands, Except Share and Per Share Data)
| December 31, | December 31, | |||||||||||||||
| 2011 | 2010 | 2012 | 2011 | |||||||||||||
ASSETS | ||||||||||||||||
Current Assets | ||||||||||||||||
Cash and cash equivalents | $ | 482,084 | $ | 365,536 | $ | 261,690 | $ | 482,084 | ||||||||
Current portion of restricted cash | 20,640 | 8,145 | 4,846 | 20,640 | ||||||||||||
Inventories | 69,223 | 58,974 | 78,181 | 69,223 | ||||||||||||
Deferred income tax assets | 31,959 | 26,418 | 39,774 | 31,959 | ||||||||||||
Other current assets, net | 104,373 | 71,820 | 103,321 | 104,373 | ||||||||||||
|
|
|
| |||||||||||||
Total current assets | 708,279 | 530,893 | 487,812 | 708,279 | ||||||||||||
Restricted cash | 3,641 | 19,527 | 15,243 | 3,641 | ||||||||||||
Property, fixtures and equipment, net | 1,635,898 | 1,673,281 | 1,506,035 | 1,635,898 | ||||||||||||
Investments in and advances to unconsolidated affiliates, net | 35,033 | 31,673 | 36,748 | 35,033 | ||||||||||||
Goodwill | 268,772 | 269,901 | 270,972 | 268,772 | ||||||||||||
Intangible assets, net | 566,148 | 572,066 | 551,779 | 566,148 | ||||||||||||
Deferred income tax assets | 2,532 | — | ||||||||||||||
Other assets, net | 136,165 | 146,070 | 145,432 | 136,165 | ||||||||||||
|
|
|
| |||||||||||||
Total assets | $ | 3,353,936 | $ | 3,243,411 | $ | 3,016,553 | $ | 3,353,936 | ||||||||
|
|
|
| |||||||||||||
LIABILITIES AND SHAREHOLDERS’ EQUITY (DEFICIT) | ||||||||||||||||
LIABILITIES AND STOCKHOLDERS’ EQUITY | ||||||||||||||||
Current Liabilities | ||||||||||||||||
Accounts payable | $ | 97,393 | $ | 78,254 | $ | 131,814 | $ | 97,393 | ||||||||
Accrued and other current liabilities | 211,486 | 194,431 | 192,284 | 211,486 | ||||||||||||
Current portion of partner deposits and accrued partner obligations | 15,044 | 14,001 | 14,771 | 15,044 | ||||||||||||
Unearned revenue | 299,596 | 269,058 | 329,518 | 299,596 | ||||||||||||
Current portion of long-term debt | 332,905 | 95,284 | 22,991 | 332,905 | ||||||||||||
|
|
|
| |||||||||||||
Total current liabilities | 956,424 | 651,028 | 691,378 | 956,424 | ||||||||||||
Partner deposits and accrued partner obligations | 98,681 | 109,906 | 85,762 | 98,681 | ||||||||||||
Deferred rent | 70,135 | 57,743 | 87,641 | 70,135 | ||||||||||||
Deferred income tax liabilities | 193,262 | 187,843 | 195,874 | 193,262 | ||||||||||||
Long-term debt, net | 1,751,885 | 2,051,740 | ||||||||||||||
Long-term debt | 1,471,449 | 1,751,885 | ||||||||||||||
Guaranteed debt | 24,500 | 24,500 | — | 24,500 | ||||||||||||
Other long-term liabilities, net | 218,752 | 216,562 | 264,244 | 218,752 | ||||||||||||
|
|
|
| |||||||||||||
Total liabilities | 3,313,639 | 3,299,322 | 2,796,348 | 3,313,639 | ||||||||||||
|
|
|
| |||||||||||||
Commitments and contingencies (see Note 16) | ||||||||||||||||
Shareholders’ Equity (Deficit) | ||||||||||||||||
Bloomin’ Brands, Inc. Shareholders’ Equity (Deficit) | ||||||||||||||||
Common stock, $.01 par value, 120,000,000 shares authorized; 106,573,193 shares issued and outstanding at December 31, 2011; and 120,000,000 shares authorized; 106,573,193 shares issued and outstanding at December 31, 2010 | 1,066 | 1,066 | ||||||||||||||
Commitments and contingencies (see Note 18) | ||||||||||||||||
Stockholders’ Equity | ||||||||||||||||
Bloomin’ Brands, Inc. Stockholders’ Equity | ||||||||||||||||
Preferred stock, $0.01 par value, 25,000,000 shares authorized; no shares issued and outstanding at December 31, 2012; and no shares authorized, issued and outstanding at December 31, 2011 | — | — | ||||||||||||||
Common stock, $0.01 par value, 475,000,000 shares authorized; 121,148,451 shares issued and outstanding at December 31, 2012; and 120,000,000 shares authorized; 106,573,193 shares issued and outstanding at December 31, 2011 | 1,211 | 1,066 | ||||||||||||||
Additional paid-in capital | 874,753 | 871,963 | 1,000,963 | 874,753 | ||||||||||||
Accumulated deficit | (822,625 | ) | (922,630 | ) | (773,085 | ) | (822,625 | ) | ||||||||
Accumulated other comprehensive loss | (22,344 | ) | (19,633 | ) | (14,801 | ) | (22,344 | ) | ||||||||
|
|
|
| |||||||||||||
Total Bloomin’ Brands, Inc. shareholders’ equity (deficit) | 30,850 | (69,234 | ) | |||||||||||||
Total Bloomin’ Brands, Inc. stockholders’ equity | 214,288 | 30,850 | ||||||||||||||
Noncontrolling interests | 9,447 | 13,323 | 5,917 | 9,447 | ||||||||||||
|
|
|
| |||||||||||||
Total shareholders’ equity (deficit) | 40,297 | (55,911 | ) | |||||||||||||
Total stockholders’ equity | 220,205 | 40,297 | ||||||||||||||
|
|
|
| |||||||||||||
Total liabilities and shareholders’ equity (deficit) | $ | 3,353,936 | $ | 3,243,411 | ||||||||||||
Total liabilities and stockholders’ equity | $ | 3,016,553 | $ | 3,353,936 | ||||||||||||
|
|
|
| |||||||||||||
The accompanying notes are an integral part of these Consolidated Financial Statements.consolidated financial statements.
Index to Financial Statements
BLOOMIN’ BRANDS, INC.
CONSOLIDATED STATEMENTS OF OPERATIONS AND COMPREHENSIVE INCOME
(In Thousands, Except Per Share Data)
| Years Ended December 31, | Years Ended December 31, | |||||||||||||||||||||||
| 2011 | 2010 | 2009 | 2012 | 2011 | 2010 | |||||||||||||||||||
Revenues | ||||||||||||||||||||||||
Restaurant sales | $ | 3,803,252 | $ | 3,594,681 | $ | 3,573,760 | $ | 3,946,116 | $ | 3,803,252 | $ | 3,594,681 | ||||||||||||
Other revenues | 38,012 | 33,606 | 27,896 | 41,679 | 38,012 | 33,606 | ||||||||||||||||||
|
|
|
|
|
| |||||||||||||||||||
Total revenues | 3,841,264 | 3,628,287 | 3,601,656 | 3,987,795 | 3,841,264 | 3,628,287 | ||||||||||||||||||
|
|
|
|
|
| |||||||||||||||||||
Costs and expenses | ||||||||||||||||||||||||
Cost of sales | 1,226,098 | 1,152,028 | 1,184,074 | 1,281,002 | 1,226,098 | 1,152,028 | ||||||||||||||||||
Labor and other related | 1,094,117 | 1,034,393 | 1,024,063 | 1,117,624 | 1,094,117 | 1,034,393 | ||||||||||||||||||
Other restaurant operating | 890,004 | 864,183 | 849,696 | 918,522 | 890,004 | 864,183 | ||||||||||||||||||
Depreciation and amortization | 153,689 | 156,267 | 186,074 | 155,482 | 153,689 | 156,267 | ||||||||||||||||||
General and administrative | 291,124 | 252,793 | 252,298 | 326,473 | 291,124 | 252,793 | ||||||||||||||||||
Recovery of note receivable from affiliated entity | (33,150 | ) | — | — | — | (33,150 | ) | — | ||||||||||||||||
Loss on contingent debt guarantee | — | — | 24,500 | |||||||||||||||||||||
Goodwill impairment | — | — | 58,149 | |||||||||||||||||||||
Provision for impaired assets and restaurant closings | 14,039 | 5,204 | 134,285 | 13,005 | 14,039 | 5,204 | ||||||||||||||||||
Income from operations of unconsolidated affiliates | (8,109 | ) | (5,492 | ) | (2,196 | ) | (5,450 | ) | (8,109 | ) | (5,492 | ) | ||||||||||||
|
|
|
|
|
| |||||||||||||||||||
Total costs and expenses | 3,627,812 | 3,459,376 | 3,710,943 | 3,806,658 | 3,627,812 | 3,459,376 | ||||||||||||||||||
|
|
|
|
|
| |||||||||||||||||||
Income (loss) from operations | 213,452 | 168,911 | (109,287 | ) | ||||||||||||||||||||
Gain on extinguishment of debt | — | — | 158,061 | |||||||||||||||||||||
Other income (expense), net | 830 | 2,993 | (199 | ) | ||||||||||||||||||||
Income from operations | 181,137 | 213,452 | 168,911 | |||||||||||||||||||||
Loss on extinguishment and modification of debt | (20,957 | ) | — | — | ||||||||||||||||||||
Other (expense) income, net | (128 | ) | 830 | 2,993 | ||||||||||||||||||||
Interest expense, net | (83,387 | ) | (91,428 | ) | (115,880 | ) | (86,642 | ) | (83,387 | ) | (91,428 | ) | ||||||||||||
|
|
|
|
|
| |||||||||||||||||||
Income (loss) before provision (benefit) for income taxes | 130,895 | 80,476 | (67,305 | ) | ||||||||||||||||||||
Provision (benefit) for income taxes | 21,716 | 21,300 | (2,462 | ) | ||||||||||||||||||||
Income before provision for income taxes | 73,410 | 130,895 | 80,476 | |||||||||||||||||||||
Provision for income taxes | 12,106 | 21,716 | 21,300 | |||||||||||||||||||||
|
|
|
|
|
| |||||||||||||||||||
Net income (loss) | 109,179 | 59,176 | (64,843 | ) | ||||||||||||||||||||
Less: net income (loss) attributable to noncontrolling interests | 9,174 | 6,208 | (380 | ) | ||||||||||||||||||||
Net income | 61,304 | 109,179 | 59,176 | |||||||||||||||||||||
Less: net income attributable to noncontrolling interests | 11,333 | 9,174 | 6,208 | |||||||||||||||||||||
|
|
|
|
|
| |||||||||||||||||||
Net income (loss) attributable to Bloomin’ Brands, Inc. | $ | 100,005 | $ | 52,968 | $ | (64,463 | ) | |||||||||||||||||
Net income attributable to Bloomin’ Brands, Inc. | $ | 49,971 | $ | 100,005 | $ | 52,968 | ||||||||||||||||||
|
|
|
|
|
| |||||||||||||||||||
Net income (loss) per common share: | ||||||||||||||||||||||||
Net income | 61,304 | 109,179 | 59,176 | |||||||||||||||||||||
Other comprehensive income: | ||||||||||||||||||||||||
Foreign currency translation adjustment | 7,543 | (2,711 | ) | 4,556 | ||||||||||||||||||||
|
|
| ||||||||||||||||||||||
Comprehensive income | 68,847 | 106,468 | 63,732 | |||||||||||||||||||||
Less: comprehensive income attributable to noncontrolling interests | 11,333 | 9,174 | 6,208 | |||||||||||||||||||||
|
|
| ||||||||||||||||||||||
Comprehensive income attributable to Bloomin’ Brands, Inc. | $ | 57,514 | $ | 97,294 | $ | 57,524 | ||||||||||||||||||
|
|
| ||||||||||||||||||||||
Net income attributable to Bloomin’ Brands, Inc. per common share: | ||||||||||||||||||||||||
Basic | $ | 0.94 | $ | 0.50 | $ | (0.62 | ) | $ | 0.45 | $ | 0.94 | $ | 0.50 | |||||||||||
|
|
|
|
|
| |||||||||||||||||||
Diluted |
$ |
0.94 |
|
$ |
0.50 |
|
$ |
(0.62 |
) | $ | 0.44 | $ | 0.94 | $ | 0.50 | |||||||||
|
|
|
|
|
| |||||||||||||||||||
Weighted average common shares outstanding: | ||||||||||||||||||||||||
Basic | 106,224 | 105,968 | 104,442 | 111,999 | 106,224 | 105,968 | ||||||||||||||||||
|
|
|
|
|
| |||||||||||||||||||
Diluted | 106,689 | 105,968 | 104,442 | 114,821 | 106,689 | 105,968 | ||||||||||||||||||
|
|
|
|
|
| |||||||||||||||||||
The accompanying notes are an integral part of these Consolidated Financial Statements.consolidated financial statements.
Index to Financial Statements
BLOOMIN’ BRANDS, INC.
CONSOLIDATED STATEMENTS OF CHANGES IN SHAREHOLDERS'STOCKHOLDERS’ EQUITY (DEFICIT)
(In Thousands)
| Bloomin’ Brands, Inc. | Bloomin’ Brands, Inc. | |||||||||||||||||||||||||||||||||||||||||||||||||||||||
| Common Stock | Common Stock Amount | Additional Paid-in Capital | Accum- ulated Deficit | Accumulated Other Comprehensive Loss | Noncontrolling Interests | Total | Common | Common | Additional | Accum- | Accumulated | Non- Controlling Interests | Total | |||||||||||||||||||||||||||||||||||||||||||
Balance, December 31, 2008 | 106,573 | $ | 1,066 | $ | 857,088 | $ | (917,213 | ) | $ | (34,462 | ) | $ | 26,707 | $ | (66,814 | ) | ||||||||||||||||||||||||||||||||||||||||
Net loss | — | — | — | (64,463 | ) | — | (380 | ) | (64,843 | ) | ||||||||||||||||||||||||||||||||||||||||||||||
Foreign currency translation adjustment | — | — | — | — | 10,273 | (19 | ) | 10,254 | ||||||||||||||||||||||||||||||||||||||||||||||||
|
| |||||||||||||||||||||||||||||||||||||||||||||||||||||||
Total comprehensive loss | — | — | — | — | — | (399 | ) | (54,589 | ) | |||||||||||||||||||||||||||||||||||||||||||||||
Stock-based compensation | — | — | 15,503 | — | — | — | 15,503 | |||||||||||||||||||||||||||||||||||||||||||||||||
Issuance of notes receivable due from shareholders | — | — | (3,389 | ) | — | — | — | (3,389 | ) | |||||||||||||||||||||||||||||||||||||||||||||||
Distributions to noncontrolling interests | — | — | — | — | — | (9,083 | ) | (9,083 | ) | |||||||||||||||||||||||||||||||||||||||||||||||
Contributions from noncontrolling interests | — | — | — | — | — | 1,747 | 1,747 | |||||||||||||||||||||||||||||||||||||||||||||||||
|
|
|
|
|
|
| ||||||||||||||||||||||||||||||||||||||||||||||||||
Balance, December 31, 2009 | 106,573 | $ | 1,066 | $ | 869,202 | $ | (981,676 | ) | $ | (24,189 | ) | $ | 18,972 | $ | (116,625 | ) | 106,573 | $ | 1,066 | $ | 869,202 | $ | (981,676 | ) | $ | (24,189 | ) | $ | 18,972 | $ | (116,625 | ) | ||||||||||||||||||||||||
|
|
|
|
|
|
| ||||||||||||||||||||||||||||||||||||||||||||||||||
Net income | — | — | — | 52,968 | — | 6,208 | 59,176 | — | — | — | 52,968 | — | 6,208 | 59,176 | ||||||||||||||||||||||||||||||||||||||||||
Foreign currency translation adjustment | — | — | — | — | 4,556 | — | 4,556 | — | — | — | — | 4,556 | — | 4,556 | ||||||||||||||||||||||||||||||||||||||||||
|
| |||||||||||||||||||||||||||||||||||||||||||||||||||||||
Total comprehensive income | — | — | — | — | — | 6,208 | 63,732 | |||||||||||||||||||||||||||||||||||||||||||||||||
Cumulative effect from adoption of variable interest entity guidance | — | — | — | 6,078 | — | (386 | ) | 5,692 | — | — | — | 6,078 | — | (386 | ) | 5,692 | ||||||||||||||||||||||||||||||||||||||||
Stock-based compensation | — | — | 3,411 | — | — | — | 3,411 | — | — | 3,411 | — | — | — | 3,411 | ||||||||||||||||||||||||||||||||||||||||||
Issuance of notes receivable due from shareholders | — | — | (747 | ) | — | — | — | (747 | ) | |||||||||||||||||||||||||||||||||||||||||||||||
Repayments of notes receivable due from shareholders | — | — | 97 | — | — | — | 97 | |||||||||||||||||||||||||||||||||||||||||||||||||
Issuance of notes receivable due from stockholders | — | — | (747 | ) | — | — | — | (747 | ) | |||||||||||||||||||||||||||||||||||||||||||||||
Repayments of notes receivable due from stockholders | — | — | 97 | — | — | — | 97 | |||||||||||||||||||||||||||||||||||||||||||||||||
Distributions to noncontrolling interests | — | — | — | — | — | (11,596 | ) | (11,596 | ) | — | — | — | — | — | (11,596 | ) | (11,596 | ) | ||||||||||||||||||||||||||||||||||||||
Contributions from noncontrolling interests | — | — | — | — | — | 125 | 125 | — | — | — | — | — | 125 | 125 | ||||||||||||||||||||||||||||||||||||||||||
|
|
|
|
|
|
|
|
|
|
|
|
|
| |||||||||||||||||||||||||||||||||||||||||||
Balance, December 31, 2010 | 106,573 | $ | 1,066 | $ | 871,963 | $ | (922,630 | ) | $ | (19,633 | ) | $ | 13,323 | $ | (55,911 | ) | 106,573 | $ | 1,066 | $ | 871,963 | $ | (922,630 | ) | $ | (19,633 | ) | $ | 13,323 | $ | (55,911 | ) | ||||||||||||||||||||||||
|
|
|
|
|
|
|
|
|
|
|
|
|
| |||||||||||||||||||||||||||||||||||||||||||
Net income | — | — | — | 100,005 | — | 9,174 | 109,179 | — | — | — | 100,005 | — | 9,174 | 109,179 | ||||||||||||||||||||||||||||||||||||||||||
Foreign currency translation adjustment | — | — | — | — | (2,711 | ) | — | (2,711 | ) | — | — | — | — | (2,711 | ) | — | (2,711 | ) | ||||||||||||||||||||||||||||||||||||||
|
| |||||||||||||||||||||||||||||||||||||||||||||||||||||||
Total comprehensive income | — | — | — | — | — | 9,174 | 106,468 | |||||||||||||||||||||||||||||||||||||||||||||||||
Stock-based compensation | — | — | 3,907 | — | — | — | 3,907 | — | — | 3,907 | — | — | — | 3,907 | ||||||||||||||||||||||||||||||||||||||||||
Issuance of notes receivable due from shareholders | — | — | (1,082 | ) | — | — | — | (1,082 | ) | |||||||||||||||||||||||||||||||||||||||||||||||
Repayments of notes receivable due from shareholders | — | — | 3 | — | — | — | 3 | |||||||||||||||||||||||||||||||||||||||||||||||||
Issuance of notes receivable due from stockholders | — | — | (1,082 | ) | — | — | — | (1,082 | ) | |||||||||||||||||||||||||||||||||||||||||||||||
Repayments of notes receivable due from stockholders | — | — | 3 | — | — | — | 3 | |||||||||||||||||||||||||||||||||||||||||||||||||
Distributions to noncontrolling interests | — | — | (38 | ) | — | — | (13,472 | ) | (13,510 | ) | — | — | (38 | ) | — | — | (13,472 | ) | (13,510 | ) | ||||||||||||||||||||||||||||||||||||
Contributions from noncontrolling interests | — | — | — | — | — | 422 | 422 | — | — | — | — | — | 422 | 422 | ||||||||||||||||||||||||||||||||||||||||||
|
|
|
|
|
|
|
|
|
|
|
|
|
| |||||||||||||||||||||||||||||||||||||||||||
Balance, December 31, 2011 | 106,573 | $ | 1,066 | $ | 874,753 | $ | (822,625 | ) | $ | (22,344 | ) | $ | 9,447 | $ | 40,297 | 106,573 | $ | 1,066 | $ | 874,753 | $ | (822,625 | ) | $ | (22,344 | ) | $ | 9,447 | $ | 40,297 | ||||||||||||||||||||||||||
|
|
|
|
|
|
|
|
|
|
|
|
|
| |||||||||||||||||||||||||||||||||||||||||||
Net income | — | — | — | 49,971 | — | 11,333 | 61,304 | |||||||||||||||||||||||||||||||||||||||||||||||||
Foreign currency translation adjustment | — | — | — | — | 7,543 | — | 7,543 | |||||||||||||||||||||||||||||||||||||||||||||||||
Issuance of common stock in connection with initial public offering | 14,197 | 142 | 142,100 | — | — | — | 142,242 | |||||||||||||||||||||||||||||||||||||||||||||||||
Exercises of stock options | 136 | 1 | 883 | — | — | — | 884 | |||||||||||||||||||||||||||||||||||||||||||||||||
Stock-based compensation | — | — | 21,025 | — | — | — | 21,025 | |||||||||||||||||||||||||||||||||||||||||||||||||
Repurchase of common stock | (36 | ) | (1 | ) | 316 | (431 | ) | — | — | (116 | ) | |||||||||||||||||||||||||||||||||||||||||||||
Issuance of restricted stock | 314 | 3 | 646 | — | — | — | 649 | |||||||||||||||||||||||||||||||||||||||||||||||||
Forfeiture of restricted stock | (36 | ) | — | (138 | ) | — | — | — | (138 | ) | ||||||||||||||||||||||||||||||||||||||||||||||
Issuance of notes receivable due from stockholders | — | — | (587 | ) | — | — | — | (587 | ) | |||||||||||||||||||||||||||||||||||||||||||||||
Repayments of notes receivable due from stockholders | — | — | 1,661 | — | — | — | 1,661 | |||||||||||||||||||||||||||||||||||||||||||||||||
Purchase of limited partnership and joint venture interests | — | — | (39,696 | ) | — | — | (886 | ) | (40,582 | ) | ||||||||||||||||||||||||||||||||||||||||||||||
Distributions to noncontrolling interests | — | — | — | — | — | (14,367 | ) | (14,367 | ) | |||||||||||||||||||||||||||||||||||||||||||||||
Contributions from noncontrolling interests | — | — | — | — | — | 390 | 390 | |||||||||||||||||||||||||||||||||||||||||||||||||
|
|
|
|
|
|
| ||||||||||||||||||||||||||||||||||||||||||||||||||
Balance, December 31, 2012 | 121,148 | $ | 1,211 | $ | 1,000,963 | $ | (773,085 | ) | $ | (14,801 | ) | $ | 5,917 | $ | 220,205 | |||||||||||||||||||||||||||||||||||||||||
|
|
|
|
|
|
| ||||||||||||||||||||||||||||||||||||||||||||||||||
The accompanying notes are an integral part of these Consolidated Financial Statements.consolidated financial statements.
Index to Financial Statements
BLOOMIN’ BRANDS, INC.
CONSOLIDATED STATEMENTS OF CASH FLOWS
(In Thousands)
| Years Ended December 31, | Years Ended December 31, | |||||||||||||||||||||||
| 2011 | 2010 | 2009 | 2012 | 2011 | 2010 | |||||||||||||||||||
Cash flows provided by operating activities: | ||||||||||||||||||||||||
Net income (loss) | $ | 109,179 | $ | 59,176 | $ | (64,843 | ) | |||||||||||||||||
Adjustments to reconcile net income (loss) to cash provided by operating activities: | ||||||||||||||||||||||||
Net income | $ | 61,304 | $ | 109,179 | $ | 59,176 | ||||||||||||||||||
Adjustments to reconcile net income to cash provided by operating activities: | ||||||||||||||||||||||||
Depreciation and amortization | 153,689 | 156,267 | 186,074 | 155,482 | 153,689 | 156,267 | ||||||||||||||||||
Amortization of deferred financing fees | 12,297 | 13,435 | 14,315 | 8,222 | 12,297 | 13,435 | ||||||||||||||||||
Amortization of capitalized gift card sales commissions | 18,058 | 15,046 | 10,884 | 21,136 | 18,058 | 15,046 | ||||||||||||||||||
Goodwill impairment | — | — | 58,149 | |||||||||||||||||||||
Provision for impaired assets and restaurant closings | 14,039 | 5,204 | 134,285 | 13,005 | 14,039 | 5,204 | ||||||||||||||||||
Accretion on debt discounts | 663 | 616 | 566 | 880 | 663 | 616 | ||||||||||||||||||
Stock-based and other non-cash compensation expense | 39,228 | 39,512 | 47,604 | 44,778 | 39,228 | 39,512 | ||||||||||||||||||
Income from operations of unconsolidated affiliates | (8,109 | ) | (5,492 | ) | (2,196 | ) | (5,450 | ) | (8,109 | ) | (5,492 | ) | ||||||||||||
Change in deferred income taxes | (189 | ) | 5,149 | (15,145 | ) | |||||||||||||||||||
Deferred income tax (benefit) expense | (7,442 | ) | (175 | ) | 5,182 | |||||||||||||||||||
Loss on disposal of property, fixtures and equipment | 1,987 | 4,050 | 5,575 | 2,141 | 1,987 | 4,050 | ||||||||||||||||||
Unrealized loss (gain) on derivative financial instruments | 723 | (18,267 | ) | (6,998 | ) | |||||||||||||||||||
Unrealized (gain) loss on derivative financial instruments | (519 | ) | 723 | (18,267 | ) | |||||||||||||||||||
Gain on life insurance and restricted cash investments | (126 | ) | (2,821 | ) | (8,550 | ) | (5,150 | ) | (126 | ) | (2,821 | ) | ||||||||||||
Loss on contingent debt guarantee | — | — | 24,500 | |||||||||||||||||||||
Gain on extinguishment of debt | — | — | (158,061 | ) | ||||||||||||||||||||
Loss (gain) on disposal of business | 4,331 | — | (2,491 | ) | ||||||||||||||||||||
Provision for bad debt expense | 117 | 768 | 1,870 | |||||||||||||||||||||
Loss on extinguishment and modification of debt | 20,957 | — | — | |||||||||||||||||||||
(Gain) loss on disposal of business | (3,500 | ) | 4,331 | — | ||||||||||||||||||||
Recovery of note receivable from affiliated entity | (33,150 | ) | — | — | — | (33,150 | ) | — | ||||||||||||||||
Recognition of deferred gain on sale-leaseback transaction | (1,610 | ) | — | — | ||||||||||||||||||||
Change in assets and liabilities: | ||||||||||||||||||||||||
(Increase) decrease in inventories | (10,525 | ) | (2,599 | ) | 27,471 | |||||||||||||||||||
Increase in inventories | (8,577 | ) | (10,525 | ) | (2,599 | ) | ||||||||||||||||||
Increase in other current assets | (59,570 | ) | (13,891 | ) | (11,409 | ) | (13,746 | ) | (60,858 | ) | (13,292 | ) | ||||||||||||
Decrease in other assets | 8,209 | 10,721 | 8,305 | 4,034 | 8,209 | 10,721 | ||||||||||||||||||
Decrease in accrued interest payable | (27 | ) | (181 | ) | (2,227 | ) | ||||||||||||||||||
Increase (decrease) in accounts payable and accrued and other current liabilities | 32,179 | (28,420 | ) | (66,175 | ) | 5,206 | 32,152 | (28,601 | ) | |||||||||||||||
Increase in deferred rent | 12,510 | 10,677 | 14,193 | 17,064 | 12,510 | 10,677 | ||||||||||||||||||
Increase in unearned revenue | 30,623 | 31,964 | 24,847 | 29,621 | 30,623 | 31,964 | ||||||||||||||||||
Decrease in other long-term liabilities | (3,686 | ) | (5,760 | ) | (25,006 | ) | ||||||||||||||||||
Increase (decrease) in other long-term liabilities | 2,255 | (2,295 | ) | (5,624 | ) | |||||||||||||||||||
|
|
|
|
|
| |||||||||||||||||||
Net cash provided by operating activities | 322,450 | 275,154 | 195,537 | 340,091 | 322,450 | 275,154 | ||||||||||||||||||
|
|
|
|
|
| |||||||||||||||||||
Cash flows used in investing activities: | ||||||||||||||||||||||||
Cash flows provided by (used in) investing activities: | ||||||||||||||||||||||||
Purchases of Company-owned life insurance | (2,027 | ) | (2,405 | ) | (6,571 | ) | (6,451 | ) | (2,027 | ) | (2,405 | ) | ||||||||||||
Proceeds from sale of Company-owned life insurance | 2,638 | 6,411 | 16,886 | — | 2,638 | 6,411 | ||||||||||||||||||
Proceeds from sale of property, fixtures and equipment | 1,190 | 462 | 3,070 | 3,971 | 1,190 | 462 | ||||||||||||||||||
Proceeds from sale-leaseback transaction | 192,886 | — | — | |||||||||||||||||||||
De-consolidation of subsidiary | — | (4,398 | ) | — | — | — | (4,398 | ) | ||||||||||||||||
Acquisition of business | — | — | (450 | ) | ||||||||||||||||||||
Proceeds from sale of a business | 10,119 | — | 1,653 | 3,500 | 10,119 | — | ||||||||||||||||||
Capital expenditures | (120,906 | ) | (60,476 | ) | (57,528 | ) | (178,720 | ) | (120,906 | ) | (60,476 | ) | ||||||||||||
Restricted cash received for capital expenditures, property taxes and certain deferred compensation plans | 86,579 | 18,545 | 27,386 | |||||||||||||||||||||
Decrease in restricted cash | 84,270 | 86,579 | 18,545 | |||||||||||||||||||||
Increase in restricted cash | (80,070 | ) | (83,148 | ) | (29,860 | ) | ||||||||||||||||||
Royalty termination fee | — | (8,547 | ) | — | ||||||||||||||||||||
Return on investment from unconsolidated affiliates | 558 | 960 | — | |||||||||||||||||||||
|
|
| ||||||||||||||||||||||
Net cash provided by (used in) investing activities | $ | 19,944 | $ | (113,142 | ) | $ | (71,721 | ) | ||||||||||||||||
|
|
| ||||||||||||||||||||||
Index to Financial Statements
BLOOMIN’ BRANDS, INC.
CONSOLIDATED STATEMENTS OF CASH FLOWS—(Continued)
(In Thousands)
| Years Ended December 31, | Years Ended December 31, | |||||||||||||||||||||||
| 2011 | 2010 | 2009 | 2012 | 2011 | 2010 | |||||||||||||||||||
Restricted cash used to fund capital expenditures, property taxes and certain deferred compensation plans | (83,148 | ) | (29,860 | ) | (23,782 | ) | ||||||||||||||||||
Royalty termination fee | (8,547 | ) | — | — | ||||||||||||||||||||
Payments from unconsolidated affiliates | 960 | — | 165 | |||||||||||||||||||||
|
|
| ||||||||||||||||||||||
Net cash used in investing activities | (113,142 | ) | (71,721 | ) | (39,171 | ) | ||||||||||||||||||
|
|
| ||||||||||||||||||||||
Cash flows used in financing activities: | ||||||||||||||||||||||||
Proceeds from issuance of senior secured term loan B | $ | 990,000 | $ | — | $ | — | ||||||||||||||||||
Extinguishment and modification of senior secured term loan | (1,004,575 | ) | — | — | ||||||||||||||||||||
Proceeds from issuance of 2012 CMBS Loan | 495,186 | — | — | |||||||||||||||||||||
Repayments of long-term debt | (25,189 | ) | (140,853 | ) | (24,506 | ) | (46,868 | ) | (25,189 | ) | (140,853 | ) | ||||||||||||
Extinguishment of CMBS loan | (777,563 | ) | — | — | ||||||||||||||||||||
Extinguishment of senior notes | (254,660 | ) | — | — | ||||||||||||||||||||
Proceeds from borrowings on revolving credit facilities | 33,000 | 61,000 | 23,700 | 111,000 | 33,000 | 61,000 | ||||||||||||||||||
Repayments of borrowings on revolving credit facilities | (78,072 | ) | (55,928 | ) | (12,700 | ) | (144,000 | ) | (78,072 | ) | (55,928 | ) | ||||||||||||
Collection of note receivable from affiliated entity | 33,300 | — | — | — | 33,300 | — | ||||||||||||||||||
Extinguishment of senior notes | — | — | (75,967 | ) | ||||||||||||||||||||
Deferred financing fees | (2,222 | ) | (1,391 | ) | (183 | ) | ||||||||||||||||||
Purchase of note related to guaranteed debt of affiliated entity | — | — | (33,283 | ) | ||||||||||||||||||||
Financing fees | (18,983 | ) | (2,222 | ) | (1,391 | ) | ||||||||||||||||||
Proceeds from the issuance of common stock in connection with initial public offering | 142,242 | — | — | |||||||||||||||||||||
Proceeds from the exercise of stock options | 884 | — | — | |||||||||||||||||||||
Contributions from noncontrolling interests | 422 | 125 | 1,747 | 390 | 422 | 125 | ||||||||||||||||||
Distributions to noncontrolling interests | (13,510 | ) | (11,596 | ) | (9,083 | ) | (14,367 | ) | (13,510 | ) | (11,596 | ) | ||||||||||||
Purchase of limited partnership and joint venture interests | (40,582 | ) | — | — | ||||||||||||||||||||
Repayments of partner deposits and accrued partner obligations | (37,286 | ) | (20,936 | ) | (7,124 | ) | (25,397 | ) | (35,950 | ) | (18,022 | ) | ||||||||||||
Receipts of partner deposits and other contributions | 1,336 | 2,914 | 3,391 | |||||||||||||||||||||
Issuance of notes receivable due from shareholders | (1,082 | ) | (747 | ) | (3,389 | ) | ||||||||||||||||||
Repayments of notes receivable due from shareholders | 3 | 97 | — | |||||||||||||||||||||
Issuance of notes receivable due from stockholders | (587 | ) | (1,082 | ) | (747 | ) | ||||||||||||||||||
Repayments of notes receivable due from stockholders | 1,661 | 3 | 97 | |||||||||||||||||||||
|
|
|
|
|
| |||||||||||||||||||
Net cash used in financing activities | (89,300 | ) | (167,315 | ) | (137,397 | ) | (586,219 | ) | (89,300 | ) | (167,315 | ) | ||||||||||||
|
|
|
|
|
| |||||||||||||||||||
Effect of exchange rate changes on cash and cash equivalents | (3,460 | ) | (1,539 | ) | 870 | 5,790 | (3,460 | ) | (1,539 | ) | ||||||||||||||
|
|
|
|
|
| |||||||||||||||||||
Net increase in cash and cash equivalents | 116,548 | 34,579 | 19,839 | |||||||||||||||||||||
Net (decrease) increase in cash and cash equivalents | (220,394 | ) | 116,548 | 34,579 | ||||||||||||||||||||
Cash and cash equivalents at the beginning of the period | 365,536 | 330,957 | 311,118 | 482,084 | 365,536 | 330,957 | ||||||||||||||||||
|
|
|
|
|
| |||||||||||||||||||
Cash and cash equivalents at the end of the period | $ | 482,084 | $ | 365,536 | $ | 330,957 | $ | 261,690 | $ | 482,084 | $ | 365,536 | ||||||||||||
|
|
|
|
|
| |||||||||||||||||||
Supplemental disclosures of cash flow information: | ||||||||||||||||||||||||
Cash paid for interest | $ | 72,099 | $ | 96,718 | $ | 109,023 | $ | 78,216 | $ | 72,099 | $ | 96,718 | ||||||||||||
Cash paid for income taxes, net of refunds | 27,699 | 10,779 | 21,342 | 24,276 | 27,699 | 10,779 | ||||||||||||||||||
Supplemental disclosures of non-cash investing and financing activities: | ||||||||||||||||||||||||
Conversion of partner deposits and accrued partner obligations to notes payable | $ | 5,764 | $ | 5,685 | $ | 1,204 | $ | 6,434 | $ | 5,764 | $ | 5,685 | ||||||||||||
Decrease in guaranteed debt | — | — | (24,500 | ) | ||||||||||||||||||||
Acquisitions of property, fixtures and equipment through accounts payable or capital lease liabilities | 8,683 | 2,506 | 5,021 | 8,006 | 8,683 | 2,506 | ||||||||||||||||||
The accompanying notes are an integral part of these Consolidated Financial Statements.consolidated financial statements.
Index to Financial Statements
BLOOMIN’ BRANDS, INC.
NOTES TO CONSOLIDATED FINANCIAL STATEMENTS
1. Basis of Presentation
Basis of Presentation
Bloomin’ Brands, Inc. (“Bloomin’ Brands” or the “Company”), formerly known as Kangaroo Holdings, Inc., was formed by an investor group comprised of funds advised by Bain Capital Partners, LLC (“Bain Capital”), Catterton Management Company, LLC (“Catterton”), Chris T. Sullivan, Robert D. Basham and J. Timothy Gannon (the “Founders”) and certain members of our management. On June 14, 2007, Bloomin’ Brands acquired OSI Restaurant Partners, Inc. by means of a merger and related transactions (the “Merger”). At the time of the Merger, OSI Restaurant Partners, Inc. was converted into a Delaware limited liability company named OSI Restaurant Partners, LLC (“OSI”). In connection with the Merger, Bloomin’ Brands implemented a new ownership and financing arrangement for some of ourits restaurant properties, pursuant to which Private Restaurant Properties, LLC (“PRP”), a wholly-owned subsidiary of Bloomin’ Brands, acquired 343 restaurant properties from OSI and leased them back to subsidiaries of OSI. OSI remains ourthe Company’s primary operating entity and aNew Private Restaurant Properties, LLC, another indirect wholly-owned subsidiary of Bloomin’ Brandsthe Company, continues to lease certain of our ownedthe Company-owned restaurant properties to OSI’s subsidiaries.
The total purchase price for On August 13, 2012, the Merger was approximately $3.1 billion, and it was financed by borrowings under senior secured credit facilities and a commercial mortgage-backed securities loanCompany completed an initial public offering of its common stock (see Note 11), proceeds from the issuance of senior notes (see Note 11), an investment made by Bain Capital and Catterton, rollover equity from the Founders and investments made by certain members of management.3).
The Company owns and operates casual, upscalepolished casual and fine dining restaurants primarily in the United States. The Company’s restaurant portfolio has five concepts: Outback Steakhouse, Carrabba’s Italian Grill, Bonefish Grill, Fleming’s Prime Steakhouse and Wine Bar and Roy’s. Additional Outback Steakhouse, Carrabba’s Italian Grill and Bonefish Grill restaurants in which the Company has no direct investment are operated under franchise agreements.
In the opinion of the Company, all adjustments necessary for the fair presentation of the Company’s results of operations, financial position and cash flows for the periods presented have been included.
2. Summary of Significant Accounting Policies
Principles of Consolidation
The Company’s consolidated financial statements include the accounts and operations of Bloomin’ Brands Inc. and its wholly-owned subsidiaries, including OSI, PRP and New PRP. All intercompany accounts and transactions have been eliminated in consolidation. The Company consolidates variable interest entities in which the Company is deemed to have a controlling financial interest as a result of the Company having: (1) the power to direct the activities that most significantly impact the entity’s economic performance and (2) the obligation to absorb the losses or the right to receive the benefits that could potentially be significant to the variable interest entity. If the Company has a controlling financial interest in a variable interest entity, the assets, liabilities, and results of the operations of the variable interest entity are included in the consolidated financial statements (see Note 18)13).
The Company is a franchisor of 161162 restaurants as of December 31, 2011,2012, but does not possess any ownership interests in its franchisees and generally does not provide financial support to franchisees in its typical franchise relationship. These franchise relationships are not deemed variable interest entities and are not consolidated.
The equity method of accounting is used for investments in affiliated companies in which the Company is not in control, the Company’s interest is generally between 20% and 50% and the Company has the ability to
BLOOMIN’ BRANDS, INC.
NOTES TO CONSOLIDATED FINANCIAL STATEMENTS—(Continued)
exercise significant influence over the entity. The Company’s share of earnings or losses of affiliated companies
Index to Financial Statements
BLOOMIN’ BRANDS, INC.
NOTES TO CONSOLIDATED FINANCIAL STATEMENTS—(Continued)
accounted for under the equity method is recorded in “IncomeIncome from operations of unconsolidated affiliates”affiliates in its Consolidated Statements of Operations.Operations and Comprehensive Income. Through a joint venture arrangement with PGS Participacoes Ltda., the Company holds a 50% ownership interest in PGS Consultoria e Serviços Ltda. (the “Brazilian Joint Venture”). The Brazilian Joint Venture was formed in 1998 for the purpose of operating Outback Steakhouse franchise restaurants in Brazil. The Company accounts for the Brazilian Joint Venture under the equity method of accounting (see Note 17)7).
Use of Estimates
The preparation of the accompanying consolidated financial statements in conformity with generally accepted accounting principles requires management to make estimates and assumptions that affect the reported amounts of assets and liabilities and disclosure of contingent assets and liabilities at the date of the financial statements and the reported amounts of revenues and expenses during the reporting period. Actual results could differ from those estimated.
Cash and Cash Equivalents
Cash equivalents consist of investments that are readily convertible to cash with an original maturity date of three months or less. Cash and cash equivalents include $44.3$56.4 million and $31.5$44.3 million as of December 31, 20112012 and 2010,2011, respectively, for amounts in transit from credit card companies since settlement is reasonably assured.
Concentrations of Credit Risk
Financial instruments that potentially subject the Company to concentrations of credit risk are cash and cash equivalents and restricted cash. The Company attempts to limit its credit risk by utilizing outside investment managers with major financial institutions that, in turn, invest in United States treasury security funds, certificates of deposit, money market funds, noninterest-bearing accounts and other highly rated investments and marketable securities. At times, cash balances may be in excess of FDIC insurance limits.
Financial Instruments
Disclosure of fair value information about financial instruments, whether or not recognized in the Consolidated Balance Sheets, is required for those instruments for which it is practical to estimate that value. Fair value is a market-based measurement.
The Company’s non-derivative financial instruments at December 31, 20112012 and 20102011 consist of cash equivalents, restricted cash, accounts receivable, accounts payable and current and long-term debt. The fair values of cash equivalents, restricted cash, accounts receivable and accounts payable approximate their carrying amounts reported in the Consolidated Balance Sheets due to their short duration. The carrying amounts of restricted cash, PRP’s commercial mortgage-backed securities loan and OSI’s other notes payable, sale-leaseback obligations and guaranteed debt approximate fair value. The fair value of OSI’s senior secured credit facilities and senior notesdebt is determined based on quoted market prices. The following table includesprices in inactive markets and discounted cash flows of debt instruments, as well as assumptions derived from current conditions in the carrying valuereal estate and fair valuecredit environments, changes in the underlying collateral and expectations of OSI’s senior secured credit facilitiesmanagement. These inputs represent assumptions impacted by economic conditions and senior notes at December 31, 2011management expectations and 2010 (in thousands):may change in the future based on period-specific facts and circumstances (see Note 14).
| December 31, | ||||||||||||||||
| 2011 | 2010 | |||||||||||||||
| Carrying Value | Fair Value | Carrying Value | Fair Value | |||||||||||||
Senior secured term loan facility | $ | 1,014,400 | $ | 953,536 | $ | 1,035,000 | $ | 985,838 | ||||||||
Senior secured pre-funded revolving credit facility | 33,000 | 31,020 | 78,072 | 74,364 | ||||||||||||
Senior notes | 248,075 | 254,277 | 248,075 | 257,998 | ||||||||||||
Index to Financial Statements
BLOOMIN’ BRANDS, INC.
NOTES TO CONSOLIDATED FINANCIAL STATEMENTS—(Continued)
Derivatives
The Company is highly leveraged and exposed to interest rate risk to the extent of its variable-rate debt. The Company manages its interest rate risk by offsetting some of its variable-rate debt with fixed-rate debt, through normal operating and financing activities and, when deemed appropriate, through the use of derivative financial instruments. The Company uses an interest rate cap as a method to limit the volatility of PRP’s variable-rate commercial mortgage-backed securities loan. Under this interest rate cap, which renews annually, interest rate payments have a ceiling of 6.31%. If the market rate exceeds the ceiling, the counterparty must pay the Company an amount sufficient to reduce the interest payment to 6.31%. The interest rate cap did not have any market value at December 31, 2011 and 2010. From September 2007 to September 2010, the Company used an interest rate collar as part of its interest rate risk management strategy to manage its exposure to interest rate movements related to OSI’s senior secured credit facilities. Given the interest rate environment, the Company did not enter into another derivative financial instrument upon the maturity of its interest rate collar on September 30, 2010.
The Company’s restaurants are dependent upon energy to operate and are impacted by changes in energy prices, including natural gas. The Company uses derivative instruments to mitigate some of its overall exposure to material increases in natural gas prices. The Company records mark-to-market changes in the fair value of derivative instruments in earnings in the period of change. The Company does not enter into financial instruments for trading or speculative purposes.
Inventories
Inventories consist of food and beverages, and are stated at the lower of cost (first-in, first-out) or market. The Company periodically makes advance purchases of various inventory items to ensure adequate supply or to obtain favorable pricing. At December 31, 20112012 and 2010,2011, inventories included advance purchases of approximately $23.4$31.7 million and $10.7$23.4 million, respectively.
Consideration Received from Vendors
The Company receives consideration for a variety of vendor-sponsored programs, such as volume rebates, promotions and advertising allowances. Advertising allowances are intended to offset the Company’s costs of promoting and selling menu items in its restaurants. Vendor consideration is recorded as a reduction of Cost of sales or Other restaurant operating expenses when recognized in the Company’s Consolidated Statements of Operations. Advertising allowances are intended to offset the Company’s costs of promotingOperations and selling menu items in its restaurants and are recorded as a reduction to Other restaurant operating expenses when earned.Comprehensive Income.
Restricted Cash
At December 31, 20112012, the current portion of restricted cash of $4.8 million was restricted for the fulfillment of certain provisions in New PRP’s commercial mortgage-backed securities loans, the payment of property taxes and 2010,settlement of obligations in a rabbi trust for deferred compensation plans. At December 31, 2011, the current portion of restricted cash of $20.6 million and $8.1 million, respectively, was restricted for the fulfillment of certain provisions in PRP’s commercial mortgage-backed securities loans, the payment of property taxes, the settlement of obligations in a rabbi trust for the Partner Equity Plan (the “PEP”)deferred compensation plans and the settlement of other deferred compensation plans and bonus arrangements. The current portion of restricted cash at December 31, 2011 also included the fulfillment of certain provisions in PRP’s commercial mortgage-backed securities loan. Long-term restricted cash at December 31, 2011 and 2010 of $3.6 million and $19.5 million, respectively, was restricted for the settlement of other deferred compensation plans and bonus arrangements. Long-term restricted cash at December 31, 2010 also included amounts2012 of $15.2 million was restricted for the fulfillment of certain provisions in New PRP’s commercial mortgage-backed securities loan.loans. Long-term restricted cash at December 31, 2011 of $3.6 million was restricted for the bonus arrangements.
Property, Fixtures and Equipment
Property, fixtures and equipment are stated at cost, net of accumulated depreciation. At the time property, fixtures and equipment are retired, or otherwise disposed of, the asset and accumulated depreciation are
Index to Financial Statements
BLOOMIN’ BRANDS, INC.
NOTES TO CONSOLIDATED FINANCIAL STATEMENTS—(Continued)
removed from the accounts and any resulting gain or loss is included in earnings. The Company expenses repair and maintenance costs that maintain the appearance and functionality of the restaurant but do not extend the useful life of any restaurant asset. Improvements to leased properties are depreciated over the shorter of their
BLOOMIN’ BRANDS, INC.
NOTES TO CONSOLIDATED FINANCIAL STATEMENTS—(Continued)
useful life or the lease term, which includes renewal periods that are reasonably assured. Depreciation is computed on the straight-line method over the following estimated useful lives:
Buildings and building improvements | 20 to 30 years | |||
Furniture and fixtures | 5 to 7 years | |||
Equipment | 2 to 7 years | |||
Leasehold improvements | 5 to 20 years | |||
Capitalized software | 3 to 5 years |
The Company’s accounting policies regarding property, fixtures and equipment include certain management judgments and projections regarding the estimated useful lives of these assets, the residual values to which the assets are depreciated or amortized, the determination of expected lease terms and the determination of what constitutes increasing the value and useful life of existing assets. These estimates, judgments and projections may produce materially different amounts of depreciation and amortization expense than would be reported if different assumptions were used.
Operating Leases
Rent expense for the Company’s operating leases, which generally have escalating rentals over the term of the lease and may include potential rent holidays, is recorded on a straight-line basis over the initial lease term and those renewal periods that are reasonably assured. The initial lease term includes the “build-out” period of the Company’s leases, which is typically before rent payments are due under the terms of the lease. The difference between rent expense and rent paid is recorded as deferred rent and is included in the Consolidated Balance Sheets. Payments received from landlords as incentives for leasehold improvements are recorded as deferred rent and are amortized on a straight-line basis over the term of the lease as a reduction of rent expense. Lease termination fees, if any, and future obligated lease payments for closed locations are recorded as an expense in the period that they are incurred. Exit-related lease obligations of $0.8 million and $1.1 million are recorded in “Accrued and other current liabilities” and $0.4 million and $0.4 million are recorded in “Other long-term liabilities, net” in the Company’s Consolidated Balance Sheets as of December 31, 2011 and 2010, respectively. Assets and liabilities resulting from the Merger relating to favorable and unfavorable lease amounts are amortized on a straight-line basis to rent expense over the remaining lease term.
Pre-Opening Expenses
Non-capital expenditures associated with opening new restaurants are expensed as incurred.incurred and are included in Other restaurant operating expenses in the Company’s Consolidated Statements of Operations and Comprehensive Income.
Impairment or Disposal of Long-Lived Assets
The Company assesses the potential impairment of amortizable intangibles, including trademarks, franchise agreements and net favorable leases, and other long-lived assets whenever events or changes in circumstances indicate that the carrying value may not be recoverable. In evaluating long-lived restaurant assets for impairment, the Company considers a number of factors such as:
A significant change in market price;
A significant adverse change in the manner in which a long-lived asset is being used;
Index to Financial Statements
BLOOMIN’ BRANDS, INC.
NOTES TO CONSOLIDATED FINANCIAL STATEMENTS—(Continued)
New laws and government regulations or a significant adverse change in business climate that adversely affect the value of a long-lived asset;
A current expectation that, more likely than not, a long-lived asset will be sold or otherwise disposed of significantly before the end of its previously estimated useful life; and
A current period operating or cash flow loss combined with a history of operating or cash flow losses or a projection that demonstrates continuing losses associated with the use of the underlying long-lived asset.
BLOOMIN’ BRANDS, INC.
NOTES TO CONSOLIDATED FINANCIAL STATEMENTS—(Continued)
If the aforementioned factors indicate that the Company should review the carrying value of the restaurant’s long-lived assets, the Company performs a two-step impairment analysis. Each Company-owned restaurant is evaluated individually for impairment since that is the lowest level at which identifiable cash flows can be measured independently from cash flows of other asset groups. If the total future undiscounted cash flows expected to be generated by the assets are less than its carrying amount, as prescribed by step one testing, recoverability is measured in step two by comparing the fair value of the assets to its carrying amount. Should the carrying amount exceed the asset’s estimated fair value, an impairment loss is charged to earnings. Restaurant fair value is determined based on estimates of discounted future cash flows; and impairment charges primarily occur as a result of the carrying value of a restaurant’s assets exceeding its estimated fair market value, primarily due to anticipated closures or declining future cash flows from lower projected future sales at existing locations.
The Company incurred total long-lived asset impairment charges and restaurant closing expense of $13.0 million, $14.0 million $5.2 million and $95.4$5.2 million for the years ended December 31, 2012, 2011 2010 and 2009,2010, respectively (see Note 7)14). All impairment charges are recorded in the line item “ProvisionProvision for impaired assets and restaurant closings”closings in the Company’s Consolidated Statements of Operations.Operations and Comprehensive Income.
The Company’s judgments and estimates related to the expected useful lives of long-lived assets are affected by factors such as changes in economic conditions and changes in operating performance and expected use. As the Company assesses the ongoing expected cash flows and carrying amounts of its long-lived assets, these factors could cause it to realize a material impairment charge. The Company uses the straight-line method to amortize definite-lived intangible assets.
Restaurant sites and certain other assets to be sold are included in assets held for sale when certain criteria are met, including the requirement that the likelihood of selling the assets within one year is probable. For assets that meet the held for sale criteria, the Company separately evaluates whether the assets also meet the requirements to be reported as discontinued operations. If the Company no longer had any significant continuing involvement with respect to the operations of the assets and cash flows were discontinued, it would classify the assets and related results of operations as discontinued. Assets whose sale is not probable within one year remain in property,Property, fixtures and equipment until their sale is probable within one year. The Company had $2.4 million and $1.3 million of assets held for sale as of December 31, 2012 and 2011, and did not have anyrespectively, recorded in Other current assets, classified as held for sale as of December 31, 2010.net.
Generally, restaurant closure costs are expensed as incurred. When it is probable that the Company will cease using the property rights under a non-cancelable operating lease, it records a liability for the net present value of any remaining lease obligations net of estimated sublease income that can reasonably be obtained for the property. The associated expense is recorded in “ProvisionProvision for impaired assets and restaurant closings.”closings in the Company’s Consolidated Statements of Operations and Comprehensive Income. Any subsequent adjustments to the liability from changes in estimates are recorded in the period incurred.
Index to Financial Statements
BLOOMIN’ BRANDS, INC.
NOTES TO CONSOLIDATED FINANCIAL STATEMENTS—(Continued)
Goodwill and Indefinite-Lived Intangible Assets
The Company’s indefinite-lived intangible assets consist only of goodwill and trade names. Goodwill represents the residual after allocation of the purchase price to the individual fair values and carryover basis of assets acquired. On an annual basis (during the second quarter of the fiscal year) or whenever events or changes in circumstances indicate that the carrying amounts may not be recoverable, the Company reviews the recoverability of goodwill and indefinite-lived intangible assets. The impairment test for goodwill involves comparing the fair value of the reporting units to their carrying amounts. If the carrying amount of a reporting unit exceeds its fair value, a second step is required to measure a goodwill impairment loss, if any. This step
BLOOMIN’ BRANDS, INC.
NOTES TO CONSOLIDATED FINANCIAL STATEMENTS—(Continued)
revalues all assets and liabilities of the reporting unit to their current fair values and then compares the implied fair value of the reporting unit’s goodwill to the carrying amount of that goodwill. If the carrying amount of the reporting unit’s goodwill exceeds the implied fair value of the goodwill, an impairment loss is recognized in an amount equal to the excess. The impairment test for trade names involves comparing the fair value of the trade name, as determined through a discounted cash flow approach,relief from royalty method, to its carrying value.
Impairment indicators that may necessitate goodwill impairment testing in between the Company’s annual impairment tests include the following:
Aa significant decline in the Company’s expected future cash flows;
a significant adverse change in legal factors or in the business climate;
An adverse action or assessment by a regulator;
Unanticipatedunanticipated competition;
A loss of key personnel;
A more-likely-than-not expectation that a reporting unit or a significant portion of a reporting unit will be sold or otherwise disposed of; and
Thethe testing for recoverability of a significant asset group within a reporting unit.unit; and
slower growth rates.
Impairment indicators that may necessitate indefinite-lived intangible asset impairment testing in between the Company’s annual impairment tests are consistent with those of its long-lived assets.
The Company performed its annual impairment test in the second quarter of 20112012 and determined at that time that none of its fourfive reporting units with remaining goodwill were at risk for material goodwill impairment since the fair value of each reporting unit was substantially in excess of its carrying amount. The Company did not record any goodwill or indefinite-lived intangible asset impairment charges during the years ended December 31, 2012, 2011 and 2010. As a result of the Company’s annual impairment test in the second quarter of 2009, it recorded goodwill and indefinite-lived intangible asset impairment charges of $58.1 million and $36.0 million, respectively (see Note 8).
Sales declines at the Company’s restaurants, unplanned increases in health insurance, commodity or labor costs, deterioration in overall economic conditions and challenges in the restaurant industry may result in future impairment charges. It is possible that changes in circumstances or changes in management’s judgments, assumptions and estimates could result in an impairment charge of a portion or all of its goodwill or other intangible assets.
Construction in Progress
The Company capitalizes all direct and indirect internal costs clearly associated with the acquisition, development, design and construction of Company-owned restaurant construction costs.locations as these costs have a future benefit to the Company. Upon restaurant opening, these costs are depreciated and charged to expense based upon their classification within property,Property, fixtures and equipment. Internal costs of $2.4 million were capitalized during the year ended December 31, 2012. Internal costs incurred for the years ended December 31, 2011 and 2010 were not material to the Company’s consolidated financial statements. The amount of interest capitalized in connection with restaurant construction was immaterial in all periods.
Index to Financial Statements
BLOOMIN’ BRANDS, INC.
NOTES TO CONSOLIDATED FINANCIAL STATEMENTS—(Continued)
Deferred Financing Fees
The Company capitalizes deferred financing fees related to the issuance of debt obligations. The Company amortizes deferred financing fees to interest expense over the terms of the respective financing arrangements using the effective interest method or the straight-line method.
BLOOMIN’ BRANDS, INC.
NOTES TO CONSOLIDATED FINANCIAL STATEMENTS—(Continued)
Liquor Licenses
The costs of obtaining non-transferable liquor licenses directly issued by local government agencies for nominal fees are expensed as incurred. The costs of purchasing transferable liquor licenses through open markets in jurisdictions with a limited number of authorized liquor licenses are capitalized as indefinite-lived intangible assets and included in “OtherOther assets, net.” Annual liquor license renewal fees are expensed over the renewal term.
Revenue Recognition
The Company records food and beverage revenues upon sale. Initial and developmental franchise fees are recognized as income once the Company has substantially performed all of its material obligations under the franchise agreement, which is generally upon the opening of the franchised restaurant. Continuing royalties, which are a percentage of net sales of the franchisee, are recognized as income when earned. Franchise-related revenues are included in the line “Other revenues”Other revenues in the Consolidated Statements of Operations.Operations and Comprehensive Income.
The Company defers revenue for gift cards, which do not have expiration dates, until redemption by the customer. The Company also recognizes gift card “breakage” revenue for gift cards when the likelihood of redemption by the customer is remote, which the Company determined are those gift cards issued on or before three years prior to the balance sheet date. The Company recorded breakage revenue of $13.3 million, $11.1 million $11.0 million and $9.3$11.0 million for the years ended December 31, 2012, 2011 2010 and 2009,2010, respectively. Breakage revenue is recorded as a component of “Restaurant sales”Restaurant sales in the Consolidated Statements of Operations.Operations and Comprehensive Income.
Gift cards sold at a discount are recorded as revenue upon redemption of the associated gift cards at an amount net of the related discount. Gift card sales commissions paid to third-party providers are initially capitalized and subsequently recognized as “OtherOther restaurant operating”operating expenses upon redemption of the associated gift card. Deferred expenses are $9.7were $10.9 million and $8.1$9.7 million as of December 31, 20112012 and 2010,2011, respectively, and arewere reflected in “OtherOther current assets, net”net in the Company’s Consolidated Balance Sheets. Gift card sales that are accompanied by a bonus gift card to be used by the customer at a future visit result in a separate deferral of a portion of the original gift card sale. Revenue is recorded when the bonus card is redeemed at a value based on the estimated fair market value of the bonus card.
The Company collects and remits sales, food and beverage, alcoholic beverage and hospitality taxes on transactions with customers and reports such amounts under the net method in its Consolidated Statements of Operations.Operations and Comprehensive Income. Accordingly, these taxes are not included in gross revenue.
Advertising Costs
Advertising production costs are expensed in the period when the advertising first occurs. All other advertising costs are expensed in the period in which the costs are incurred. The total amounts charged to advertising expense were $170.6 million, $161.4 million $146.1 million and $140.0$146.1 million, for the years ended December 31, 2012, 2011 2010 and 2009,2010, respectively, and were recorded in “OtherOther restaurant operating”operating expenses in the Consolidated Statements of Operations.Operations and Comprehensive Income.
Index to FinancialResearch and Development ExpensesResearch and development expenses, are expensed as incurred and are reported in General and administrative expense in the Consolidated Statements
of Operations and Comprehensive Income. The CompanyBLOOMIN’ BRANDS, INC.
NOTES TO CONSOLIDATED FINANCIAL STATEMENTS—(Continued)
recorded research and development expenses of $7.3 million, $6.6 million and $5.7 million for the years ended December 31, 2012, 2011 and 2010, respectively. These costs consist primarily of payroll and payroll related tax and benefit costs that are incurred in connection with the development of restaurant designs and menu offerings.
Foreign Currency Translation and Comprehensive Income (Loss)Transactions
For all significant non-U.S. operations, the functional currency is the local currency. Assets and liabilities of those operations are translated into U.S. dollars using the exchange rates in effect at the balance sheet date. Results of operations are translated using the average exchange rates for the reporting period. TranslationThe effect of gains and losses(losses) from translation adjustments of approximately $7.5 million, ($2.7) million and $4.6 million are reportedincluded as a separate component of Accumulated other comprehensive loss in shareholders’ equity (deficit).the Consolidated Statements of Changes in Stockholders’ Equity (Deficit) for the years ended December 31, 2012, 2011 and 2010, respectively. Accumulated other comprehensive loss contained only foreign currency translation adjustments as of December 31, 2012 and 2011.
Foreign currency transactions may produce receivables or payables that are fixed in terms of the amount of foreign currency that will be received or paid. A change in exchange rates between the U.S dollar and the currency in which a transaction is denominated increases or decreases the expected amount of cash flows in U.S. dollars upon settlement of the transaction. This increase or decrease is a foreign currency transaction gain or loss that generally will be included in determining net income (loss) for the period in which the exchange rate changes. Similarly, a transaction gain or loss, measured from the transaction date or the most recent intervening balance sheet date, whichever is later, realized upon settlement of a foreign currency transaction generally will be included in determining net income (loss) for the period in which the transaction is settled.
Foreign currency transaction losses and gains are recorded in Other (expense) income, net in the Company’s Consolidated Statements of Operations and Comprehensive Income and were a net (loss) gain of $(0.1) million, $0.8 million and $3.0 million for the years ended December 31, 2012, 2011 and 2010, respectively.
Income Taxes
Deferred income tax assets and liabilities are recognized for the future tax consequences attributable to differences between the financial statement carrying amounts of existing assets and liabilities and their respective tax basis. Deferred income tax assets and liabilities are measured using enacted tax rates expected to apply to taxable income in the years in which those temporary differences are expected to be recovered or settled. The effect on deferred income tax assets and liabilities of a change in the tax rate is recognized in income in the period that includes the enactment date of the rate change.
The Company recordedmaintains a valuation allowance to reduce its deferred income tax assets to the amount that is more likely than not to be realized. The Company has considered future taxable income and ongoing feasible tax planning strategies in assessing the need for the valuation allowance. Judgments made regarding future taxable income may change due to changes in market conditions, changes in tax laws or other factors. If the assumptions and estimates change in the future, the valuation allowance established may be increasedincrease or decreased,decrease, resulting in a respective increase or decrease in income tax expense.
The noncontrolling interest in domestic affiliated entities includes noNoncontrolling interests do not include a provision or liability for income taxes for affiliated entities that are subject to domestic tax jurisdictions, as any tax liability related thereto is the responsibility of the holder of the noncontrolling interest.
BLOOMIN’ BRANDS, INC.
NOTES TO CONSOLIDATED FINANCIAL STATEMENTS—(Continued)
Employee Partner Payments and Buyouts
The managing partner of each Company-owned domestic restaurant and the chef partner of each Fleming’s Prime Steakhouse and Wine Bar and Roy’s Company-owned domestic restaurant, as well as area operating partners, generally receive distributions or payments for providing management and supervisory services to their restaurants based on a percentage of their associated restaurants’ monthly cash flows. The expense associated with the monthly payments for managing and chef partners is included in “LaborLabor and other related”related expenses, and the expense associated with the monthly payments for area operating partners is included in “GeneralGeneral and administrative”administrative expenses in the Consolidated Statements of Operations.Operations and Comprehensive Income.
Managing and chef partners that are eligible to participate in a deferred compensation program receive an unsecured promise of a cash contribution (see Note 3)4). An area operating partner’s interest in the partnership (the “Management Partnership”) that provides management and supervisory services to his or her restaurant may
Index to Financial Statements
BLOOMIN’ BRANDS, INC.
NOTES TO CONSOLIDATED FINANCIAL STATEMENTS—(Continued)
be purchased, at the Company’s option, after the restaurant has been open for a five-year period based on the terms specified in the agreement. For those area operating partners with restaurants that opened on or after January 1, 2012, a bonus will be paid after the restaurant has been open for a five-year period based on the terms specified in the agreement. The Company estimates future bonuses and purchases of area operating partners’ interests, as well as deferred compensation obligations to managing and chef partners, using current and historical information on restaurant performance and records the partner obligations in the line item “PartnerPartner deposits and accrued partner obligations”obligations in its Consolidated Balance Sheets. In the period the Company pays an area operating partner bonus or purchases the area operating partner’s interests, an adjustment is recorded to recognize any remaining expense associated with the bonus or purchase and reduce the related accrued buyout liability. Deferred compensation expenses for managing and chef partners are included in “LaborLabor and other related”related expenses and bonus and buyout expenses for area operating partners are included in “GeneralGeneral and administrative”administrative expenses in the Consolidated Statements of Operations.Operations and Comprehensive Income.
Stock-based Compensation
TheUpon completion of the Company’s initial public offering, the Bloomin’ Brands, Inc. 2012 Incentive Award Plan (the “2012 Equity Plan”) was adopted, and no further awards will be made under the Company’s 2007 Equity Incentive Plan (the “Equity“2007 Equity Plan”). The 2012 Equity Plan permits the grant of stock options, andstock appreciation rights, restricted stock, restricted stock units, performance awards and other stock-based awards to Company management and other key employees. The Company accounts for its stock-based employee compensation using a fair value basedvalue-based method of accounting.
Generally, stock options vest and become nominally exercisable in 20% increments over a period of five years contingent on continued employee service. Shares acquired upon the exercise of stock options under the Equity Plan are generally subject to a stockholder’s agreement that contains a management call option that allows the Company to repurchase all shares purchased through exercise of stock options upon termination of employment at any time prior to the earlier of an initial public offering or a change of control. If an employee’s termination of employment is a result of death or disability, by the Company other than for cause or by the employee for good reason, the Company may repurchase exercised stock under this call option at fair market value. If an employee’s termination of employment is by the Company for cause or by the employee without good reason, the Company may repurchase the stock under this call provision for the lesser of the exercise price or fair market value. Additionally, the holder of shares acquired upon the exercise of stock options is prohibited from transferring the shares to any person, subject to narrow exceptions, and should a permitted transfer occur, the transferred shares remain subject to the management call option. As a result of the transfer restrictions and call option, the Company does not record compensation expense for stock options that contain the call option since employees cannot realize monetary benefit from the options or any shares acquired upon the exercise of the options unless the employee is employed at the time of an initial public offering or change of control. There have not been any exercises of stock options by any employee to date, and all stock options of terminated employees with a call provision have been forfeited.
The Company uses the Black-Scholes option pricing model to estimate the weighted-average grant date fair value of stock options granted. Expected volatilities are based on historical volatilities of the stock of comparable companies. The expected term of options granted represents the period of time that options granted are expected to be outstanding. The risk-free rate for periods within the contractual life of the option is based on the U.S. Treasury yield curve in effect at the time of grant. Results may vary depending on the assumptions applied within the model. Restricted stock awards are issued and measured at market value on the date of grant. The benefits of tax deductions in excess of recognized compensation cost, if any, are reported as a financing cash flow.
Net Income (Loss) perAttributable to Bloomin’ Brands, Inc. Per Common Share
Basic net income (loss) per common share is computed on the basis of the weighted average number of common shares that were outstanding during the period. Diluted net income (loss) per share includes the dilutive effect
BLOOMIN’ BRANDS, INC.
NOTES TO CONSOLIDATED FINANCIAL STATEMENTS—(Continued)
of common stock equivalents consisting of restricted stock and stock options, using the treasury stock method. Performance-based restricted stock and stock options are considered dilutive when the related performance criterion has been met.
IndexSegment ReportingThe Company operates restaurants under five brands that have similar economic characteristics, nature of products and services, class of customer and distribution methods, and the Company believes it meets the criteria for aggregating its six operating segments, which are the five brands and the Company’s international Outback Steakhouse operations, into a single reporting segment in accordance with the applicable accounting guidance. Approximately 8%, 9% and 8% of the Company’s total revenues for the years ended December 31, 2012, 2011 and 2010, respectively, were attributable to operations in foreign countries and Guam. Approximately 3% and 2% of the Company’s total long-lived assets, excluding goodwill and intangible assets, were located in foreign countries where the Company holds assets as of December 31, 2012 and 2011, respectively.
Reclassifications
The Company has reclassified certain items in the accompanying consolidated financial statements for prior periods to be comparable with the classification for the fiscal year ended December 31, 2012. These reclassifications had no effect on previously reported net income.
Recently Adopted Financial Statements
Accounting StandardsIn May 2011, the Financial Accounting Standards Board (the “FASB”) issued Accounting Standards Update (“ASU”) No. 2011-04, “Fair Value Measurement (Topic 820): Amendments to Achieve Common Fair Value Measurement and Disclosure Requirements in U.S. GAAP and IFRSs” (“ASU No. 2011-04”), that establishes a number of new requirements for fair value measurements. These include: (i) a prohibition on grouping financial instruments for purposes of determining fair value, except when an entity manages market and credit risks on the basis of the entity’s net exposure to the group; (ii) an extension of the prohibition against the use of a blockage factor to all fair value measurements (that prohibition currently applies only to financial instruments with quoted prices in active markets); and (iii) a requirement that for recurring Level 3 fair value measurements, entities disclose quantitative information about unobservable inputs, a description of the valuation process used and qualitative details about the sensitivity of the measurements. Additionally, for items not carried at fair value but for which fair value is disclosed, entities will be required to disclose the level within the fair value hierarchy that applies to the fair value measurement disclosed. ASU No. 2011-04 is effective for interim and annual periods beginning after December 15, 2011. The adoption of ASU No. 2011-04 on January 1, 2012 increased the Company’s fair value disclosure requirements but did not have an impact on the Company’s financial position, results of operations or cash flows.
In June 2011, the FASB issued ASU No. 2011-05, “Comprehensive Income (Topic 220): Presentation of Comprehensive Income” (“ASU No. 2011-05”), that eliminates the option to report other comprehensive income and its components in the statement of changes in equity. Instead, the new guidance requires the Company to present the components of net income and other comprehensive income in one continuous statement, referred to as the statement of comprehensive income, or in two separate but consecutive statements. While the new guidance changes the presentation of comprehensive income, there are no changes to the components that are recognized in net income or other comprehensive income under current accounting guidance. ASU No. 2011-05 must be applied retrospectively and is effective for public companies during the interim and annual periods beginning after December 15, 2011. Additionally, in December 2011, the FASB
BLOOMIN’ BRANDS, INC.
NOTES TO CONSOLIDATED FINANCIAL STATEMENTS—(Continued)
issued ASU No. 2011-12, “Comprehensive Income (Topic 220): Deferral of the Effective Date for Amendments to the Presentation of Reclassifications of Items Out of Accumulated Other Comprehensive Income in Accounting Standards Update No. 2011-05” (“ASU No. 2011-12”), which indefinitely defers the requirement in ASU No. 2011-05 to present reclassification adjustments out of accumulated other comprehensive income by component in both the statement in which net income is presented and the statement in which other comprehensive income is presented. The deferral of the presentation requirements does not impact the effective date of the other requirements in ASU No. 2011-05. During the deferral period, the existing requirements in generally accepted accounting principles in the United States for the presentation of reclassification adjustments must continue to be followed. ASU No. 2011-12 is effective for public companies during the interim and annual periods beginning after December 15, 2011. The adoption of ASU No. 2011-05 and ASU No. 2011-12 on January 1, 2012 did not have an impact on the Company’s financial position, results of operations or cash flows as the guidance only requires a presentation change to comprehensive income.
In September 2011, the FASB issued ASU No. 2011-08, “Intangibles—Goodwill and Other (Topic 350): Testing Goodwill for Impairment” (“ASU No. 2011-08”), which permits an entity to make a qualitative assessment of whether it is more likely than not that a reporting unit’s fair value is less than its carrying value before applying the two-step quantitative goodwill impairment test. If it is determined through the qualitative assessment that a reporting unit’s fair value is more likely than not greater than its carrying value, the remaining impairment steps would be unnecessary. The qualitative assessment is optional, allowing entities to go directly to the quantitative assessment. ASU No. 2011-08 is effective for annual and interim goodwill impairment tests performed in fiscal years beginning after December 15, 2011. The adoption of this guidance on January 1, 2012 did not have an impact on the Company’s financial position, results of operations or cash flows.
In December 2011, the FASB issued ASU No. 2011-10, “Property, Plant, and Equipment (Topic 360): Derecognition of in Substance Real Estate—a Scope Clarification” (“ASU No. 2011-10”), which applies to a parent company that ceases to have a controlling financial interest in a subsidiary, that is in substance real estate, as a result of a default on the subsidiary’s nonrecourse debt. The new guidance emphasizes that the parent should only deconsolidate the real estate subsidiary when legal title to the real estate is transferred to the lender and the related nonrecourse debt has been extinguished. If the reporting entity ceases to have a controlling financial interest under subtopic 810-10, the reporting entity would continue to include the real estate, debt, and the results of the subsidiary’s operations in its consolidated financial statements until legal title to the real estate is transferred to legally satisfy the debt. This standard is effective for public companies during the annual and interim periods beginning on or after June 15, 2012. The adoption of this guidance on July 1, 2012 did not have an impact on the Company’s financial statements.
3. Stockholders’ Equity
Initial Public Offering
On August 13, 2012, the Company completed an initial public offering of its common stock. On September 11, 2012, the underwriters in the Company’s initial public offering completed the exercise of their option to purchase up to 2,400,000 additional shares of common stock from the Company and certain of the selling stockholders. In the offering, (i) the Company issued and sold an aggregate of 14,196,845 shares of common stock (including 1,196,845 shares sold pursuant to the underwriters’ option to purchase additional shares) at a price to the public of $11.00 per share for aggregate gross offering proceeds of $156.2 million and (ii) certain of the Company’s stockholders sold 4,196,845 shares of the Company’s common stock (including 1,196,845 shares pursuant to the underwriters’ option to purchase additional shares) at a price to the public of $11.00 per share for aggregate gross offering proceeds of $46.2 million. The Company did not receive any proceeds from the sale of shares of common stock by the selling stockholders.
BLOOMIN’ BRANDS, INC.
NOTES TO CONSOLIDATED FINANCIAL STATEMENTS—(Continued)
The Company received net proceeds in the offering of approximately $142.2 million after deducting underwriting discounts and commissions of approximately $9.4 million and offering related expenses of $4.6 million. All of the net proceeds, together with cash on hand, was applied to retire OSI’s 10% senior notes due 2015.
Upon completion of the initial public offering, the Company’s certificate of incorporation was amended and restated to provide for authorized capital stock of 475,000,000 shares of common stock, par value $0.01 per share, and 25,000,000 shares of undesignated preferred stock.
On May 10, 2012, the retention bonus and the incentive bonus agreements with the Company’s Chief Executive Officer (“CEO”) were amended. Under the terms of the amendments, the remaining payments under each agreement were accelerated to a single lump sum payment of $22.4 million as a result of the completion of the Company’s initial public offering, which was paid in the third quarter of 2012. The Company recorded $18.1 million for the accelerated bonus expense in General and administrative in its Consolidated Statement of Operations and Comprehensive Income for the year ended December 31, 2012.
Upon completion of the Company’s initial public offering, the Company recorded approximately $16.0 million of aggregate non-cash compensation expense with respect to (i) certain stock options held by its CEO that become exercisable (to the extent then vested) if following the offering, the volume-weighted average trading price of the Company’s common stock is equal to or greater than specified performance targets over a six-month period and (ii) the time vested portion of outstanding stock options containing a management call option due to the automatic termination of the call option upon completion of the offering.
Net Income Attributable to Bloomin’ Brands, Inc. Per Common Share
The computation of basic and diluted net income (loss) per common share is as follows (in thousands, except share and per share amounts):
| Years Ended December 31, | Years Ended December 31, | |||||||||||||||||||||||
| 2011 | 2010 | 2009 | 2012 | 2011 | 2010 | |||||||||||||||||||
Net income (loss) attributable to Bloomin’ Brands, Inc. | $ | 100,005 | $ | 52,968 | $ | (64,463 | ) | |||||||||||||||||
Net income attributable to Bloomin’ Brands, Inc. | $ | 49,971 | $ | 100,005 | $ | 52,968 | ||||||||||||||||||
Basic weighted average common shares outstanding | 106,224,241 | 105,968,069 | 104,441,533 | 111,999 | 106,224 | 105,968 | ||||||||||||||||||
Effect of diluted securities: | ||||||||||||||||||||||||
Employee stock options | 399,103 | — | — | |||||||||||||||||||||
Stock options | 2,738 | 399 | — | |||||||||||||||||||||
Unvested restricted stock | 66,003 | — | — | 84 | 66 | — | ||||||||||||||||||
|
|
|
|
|
| |||||||||||||||||||
Diluted weighted average common shares outstanding | 106,689,347 | 105,968,069 | 104,441,533 | 114,821 | 106,689 | 105,968 | ||||||||||||||||||
|
|
|
|
|
| |||||||||||||||||||
Basic net income (loss) per common share | $ | 0.94 | $ | 0.50 | $ | (0.62 | ) | |||||||||||||||||
Diluted net income (loss) per common share | $ | 0.94 | $ | 0.50 | $ | (0.62 | ) | |||||||||||||||||
Basic net income attributable to Bloomin’ Brands, Inc. per common share | $ | 0.45 | $ | 0.94 | $ | 0.50 | ||||||||||||||||||
Diluted net income attributable to Bloomin’ Brands, Inc. per common share | $ | 0.44 | $ | 0.94 | $ | 0.50 | ||||||||||||||||||
AsDilutive securities outstanding not included in the computation of net income attributable to Bloomin’ Brands, Inc. per common share because their effect was antidilutive were as follows (in thousands):
Years Ended December 31, | ||||||||||||
| 2012 | 2011 | 2010 | ||||||||||
Stock options | 1,092 | 550 | 2,576 | |||||||||
BLOOMIN’ BRANDS, INC.
NOTES TO CONSOLIDATED FINANCIAL STATEMENTS—(Continued)
Purchase of Limited Partnership and Joint Venture Interests
During the third and fourth quarters of 2012, the Company purchased the remaining partnership interests in certain of the year endedCompany’s limited partnerships that either owned or had a contractual right to varying percentages of cash flows in 44 Bonefish Grill restaurants and 17 Carrabba’s Italian Grill restaurants for an aggregate purchase price of $39.5 million. The purchase price for each of the transactions was paid in cash by December 31, 2012. These transactions resulted in a $39.0 million reduction in Additional paid-in capital in the Company’s Consolidated Balance Sheet at December 31, 2012.
Effective October 1, 2012, the Company purchased the remaining interests in the Roy’s joint venture from its joint venture partner, RY-8, Inc. (“RY-8”), for $27.4 million. This purchase price consisted of the assumption of RY-8’s $24.5 million line of credit guaranteed by OSI that had been recorded in Guaranteed debt in the Company’s Consolidated Balance Sheet at December 31, 2011, forgiveness of $1.8 million in loans due from RY-8 to OSI and 2010,a $1.1 million cash payment. This transaction resulted in a $0.7 million reduction in Additional paid-in capital in the Company’s Consolidated Balance Sheet at December 31, 2012. In December 2012, the Company excluded 550,000paid the $24.5 million outstanding balance on the line of credit assumed from RY-8 and 2,575,500 outstanding stock options, respectively, in the diluted net income per share calculation becauseline of credit was terminated.
The following table sets forth the options were out of the money and to do so would have been antidilutive. As of the year ended December 31, 2009, the Company excluded 2,888,476 and 775,266 outstanding stock options and unvested restricted stock, respectively, in the diluted net loss per share calculation because the inclusioneffect of these share based awards would have been antidilutive.transactions on stockholders’ equity attributable to Bloomin’ Brands, Inc. (in thousands):
| Net Income Attributable to Bloomin’ Brands, Inc. and Transfers to Noncontrolling Interests | ||||||||||||
| Years Ended December 31, | ||||||||||||
| 2012 | 2011 | 2010 | ||||||||||
Net income attributable to Bloomin’ Brands, Inc. | $ | 49,971 | $ | 100,005 | $ | 52,968 | ||||||
|
|
|
|
|
| |||||||
Transfers to noncontrolling interests: | ||||||||||||
Decrease in Bloomin’ Brands, Inc. additional paid-in capital for purchase of joint venture and limited partnership interests | (39,696 | ) | — | — | ||||||||
|
|
|
|
|
| |||||||
Change from net income attributable to Bloomin’ Brands, Inc. and transfers to noncontrolling interests | $ | 10,275 | $ | 100,005 | $ | 52,968 | ||||||
|
|
|
|
|
| |||||||
3.4. Stock-based and Deferred Compensation Plans
Stock-based and Deferred Compensation Plans
Managing and Chef Partners
Historically, the managing partner of each Company-owned domestic restaurant and the chef partner of each Fleming’s Prime Steakhouse and Wine Bar and Roy’s restaurant were required, as a condition of employment, to sign a five-year employment agreement and to purchase a non-transferable ownership interest in the Management Partnership that provided management and supervisory services to his or her restaurant. The purchase price for a managing partner’s ownership interest was fixed at $25,000, and the purchase price for a chef partner’s ownership interest ranged from $10,000 to $15,000. Managing and chef partners had the right to receive monthly distributions from the Management Partnership based on a percentage of their restaurant’s monthly cash flows for the duration of the agreement, which varied by concept from 6% to 10% for managing
BLOOMIN’ BRANDS, INC.
NOTES TO CONSOLIDATED FINANCIAL STATEMENTS—(Continued)
partners and 2% to 5% for chef partners. Further, managing and chef partners were eligible to participate in the Partner Equity Plan (“PEP”), a deferred compensation program, upon completion of their five-year employment agreement. Amounts credited to partners’ PEP accounts are fully vested at all times and participants have no discretion with respect to the form of benefit payments under the PEP.
In April 2011, the Company implemented modifications tomodified its managing and chef partner compensation structure to provide greater incentives for sales and profit growth. Under the revised program, managing and chef partners continue to sign five-year employment agreements and receive monthly distributions of the same percentage of their restaurant’s cash flow as under the prior program. However, under the revised program, in lieu of participation in the PEP, managing partners and chef partners are eligible to receive deferred compensation payments under a newthe Partner Ownership Account Plan (the “POA”). The POA places greater
Index to Financial Statements
BLOOMIN’ BRANDS, INC.
NOTES TO CONSOLIDATED FINANCIAL STATEMENTS—(Continued)
emphasis on year-over-year growth in cash flow than the PEP. Managing and chef partners will receive a greater value under the POA than they would have received under the PEP if certain levels of year-over-year cash flow growth are achieved and a lesser value than under the PEP if these levels are not achieved.
The POA requires managing and chef partners to make an initial deposit of up to $10,000 into their “Partner Investment Account,” and the Company will make a bookkeeping contribution to each partner’s “Company Contributions Account” no later than the end of February of each year following the completion of each year (or partial year where applicable) under the partner’s employment agreement. The value of each Company contribution will beis equal to a percentage of the partner’s restaurant’s positive distributable cash flow plus, if the restaurant has been open at least 18 calendar months, a percentage of the year-over-year increase in the restaurant’s positive distributable cash flow in accordance withflow.
In addition to the terms described in the partner’s employment agreement.
The revised programPOA, our managing and chef partners are also provideseligible for an annual bonus known as the President’s Club, paid in addition to the monthly distributions of cash flow, designed to reward increases in theira restaurant’s annual sales above the concept sales plan with a required flow-through percentage of the incremental sales to cash flow.flow as defined in the plan. Managing and chef partners whose restaurants achieve certain annual sales targets above the concept’s sales plan (and the required flow throughflow-through percentage) receive a bonus equal to a percentage of the incremental sales, such percentage determined by the sales target achieved.
Amounts credited to each partner’s account under the POA may be allocated by the partner among benchmark funds offered under the POA, and the account balances of the partner will increase or decrease based on the performance of the benchmark funds. Upon termination of employment, all remaining balances in the Company Contributions Account in the POA are forfeited unless the partner has been with the Company for twenty years or more. Unless previously forfeited under the terms of the POA, 50% of the partner’s total account balances generally will be distributed in the March following the completion of the initial five-year contract term with subsequent distributions varying based on the length of continued employment as a partner. The deferred compensation obligations under the POA are unsecured obligations of the Company.
All managing and chef partners who execute new employment agreements after May 1, 2011 are required to participate in the newrevised partner program, including the POA. Managing and chef partners with a current employment agreement scheduled to expire December 1, 2011 or later had the opportunity (from April 27, 2011 through July 27, 2011) to amend their employment agreements to convert their existing partner program to participation in the new partner program, including the POA, effective June 1, 2011. As a result of this conversion, $2.7 million of the Company’s total partner deposit liability was accelerated for the return of partners’ capital that was required under the old program. As of December 31, 2012 and 2011, the Company’s POA liability was $15.3 million and $8.0 million, respectively, which was recorded in the line item “PartnerPartner deposits and accrued partner obligations”obligations in its Consolidated Balance Sheet.Sheets.
Upon the closing of the Merger, certain stock options that had been granted to managing and chef partners under a pre-merger managing partner stock plan (the “MP Stock Plan”) upon completion of a previous employment contract were converted into the right to receive cash in the form of a “Supplemental PEP” contribution. Additionally, all outstanding, unvested partner employment grants of restricted stock under the MP Stock Plan were converted into the right to receive cash on a deferred basis. Additionally, certain members of management were given the option to either convert some or all of their restricted stock granted under the pre-merger stock plan in the same manner as managing partners or convert some or all of it into restricted stock of Kangaroo Holdings, Inc., now known as Bloomin’ Brands, Inc. In accordance with the terms of the Employee Rollover Agreement adopted by the Company on June 14, 2007, those shares converted into restricted stock, now Bloomin’ Brands restricted stock, vest 20% annually over five years, and grants are fully vested upon an
Index to Financial Statements
BLOOMIN’ BRANDS, INC.
NOTES TO CONSOLIDATED FINANCIAL STATEMENTS—(Continued)
initial public offering or a changeAs of control. Grants of restricted stockDecember 31, 2012, the Company’s total vested liability with respect to obligations primarily under the pre-merger stock plan that converted into the right to receive cash are referred to as “Restricted Stock Contributions.”
PEP and Supplemental PEP was approximately $122.6 million, of which $17.8 million and $104.8 million was included in Accrued and other current liabilities and Other long-term liabilities, net, respectively, in its Consolidated Balance Sheet. As of December 31, 2011, the Company’s total vested liability with respect to obligations primarily under the PEP and Supplemental PEP and Restricted Stock Contributions was approximately $107.8 million, of which $11.8 million and $96.0 million was included in the line items “AccruedAccrued and other current liabilities”liabilities and “OtherOther long-term liabilities, net,” respectively, in its Consolidated Balance Sheet. As of December 31, 2010, the Company’s total vested liability with respect to obligations primarily under the PEP, Supplemental PEP and Restricted Stock Contributions was approximately $101.4 million, of which $14.0 million and $87.5 million was included in the line items “Accrued and other current liabilities” and “Other long-term liabilities, net,” respectively, in its Consolidated Balance Sheet. Partners and management may allocate the contributions into benchmark investment funds, and these amounts due to participants will fluctuate according to the performance of their allocated investments and may differ materially from the initial contribution and current obligation.
Prior to the Merger, certain partners participating in the PEP were to receive common stock (“Partner Shares”) upon completion of their employment contract. Upon closing of the Merger, these partners are entitled to receive a deferred payment of cash instead of common stock upon completion of their current employment term. Partners will not receive the deferred cash payment if they resign or are terminated for cause prior to completing their current employment terms. There will not be any future earnings or losses on these amounts prior to payment to the partners. The amount accrued for the Partner Shares obligation was approximately $0.7 million as of December 31, 2011 and was included in the line item “Accrued and other current liabilities” in the Company’s Consolidated Balance Sheet. The amount accrued for the Partner Shares obligation was approximately $6.6 million as of December 31, 2010, of which $6.5 million and $0.1 million was included in the line items “Accrued and other current liabilities” and “Other long-term liabilities, net,” respectively, in the Company’s Consolidated Balance Sheet.
As of December 31, 20112012 and 2010,2011, the Company had approximately $56.9$67.8 million and $58.0$56.9 million, respectively, in various corporate ownedcorporate-owned life insurance policies and at December 31, 2011, another $0.3 million and $1.0 million, respectively, of restricted cash, both of which are held within an irrevocable grantor or “rabbi” trust account for settlement of the Company’s obligations primarily under the PEP, Supplemental PEP Restricted Stock Contributions and POA. The Company is the sole owner of any assets within the rabbi trust and participants are considered general creditors of the Company with respect to assets within the rabbi trust.
As of December 31, 20112012 and 2010,2011, there were $55.6$65.1 million and $49.0$55.6 million, respectively, of unfunded obligations primarily related to the PEP, Supplemental PEP Restricted Stock Contributions, Partner Shares liabilities and POA, excluding amounts not yet contributed to the partners’ investment funds, which may require the use of cash resources in the future.
Amounts credited to partners’ PEP accounts are fully vested at all times and participants have no discretion with respect to the form of benefit payments under the PEP. Effective January 1, 2009, the Company accelerated the distribution of PEP and Supplemental PEP benefits to certain active participants. Active managing and chef partners who complete an employment contract on or after January 1, 2009 and remain employed with the Company until their PEP accounts are fully distributed will receive their PEP distributions at certain payment dates throughout a seven-year period after completion of their employment contracts (previously each account was generally distributed to the participant over a ten-year period). Managing and chef partners who complete an employment contract on or after January 1, 2009 and do not remain employed with the Company until their PEP accounts are fully distributed will receive their entire PEP account balance in the seventh year after completion of their employment contract. Their PEP account balance will be determined as of
Index to Financial Statements
BLOOMIN’ BRANDS, INC.
NOTES TO CONSOLIDATED FINANCIAL STATEMENTS—(Continued)
the date of termination of employment, subject to any subsequent increases or decreases based on the performance of their investment elections.
Managing and chef partners whose PEP accounts relate to an employment contract completed before January 1, 2009 and those with Supplemental PEP accounts from the Merger, who in either case were employed with the Company through December 31, 2008, were permitted to keep the original ten-year distribution schedule or elect a new distribution schedule. Approximately 75% of participants elected the new distribution schedule, which results in distribution of their account balance at certain payment dates throughout a seven-year period.
If participants do not remain employed by the Company through 2015, then their remaining PEP account balance will be distributed in one payment in 2015. Their account balance will be determined as of the date of termination of employment, subject to any subsequent increases or decreases based on the performance of their investment choices.
Participants with PEP or Supplemental PEP accounts who were not employed with the Company through December 31, 2008 were required to keep the original ten-year distribution schedule.
Area Operating Partners
AreaHistorically, an area operating partners arepartner was required, as a condition of employment and within 30 days of the opening of his or her first restaurant, to make an initial investment of $50,000 in the Management Partnership that provides supervisory services to the restaurants that the area operating partner oversees within 30 days of the opening of his or her first restaurant.oversees. This interest givesgave the area operating partner the right to distributions from the Management Partnership based on a percentage of his or her restaurants’ monthly cash flows for the duration of the agreement, typically ranging from 4% to 9%. The Company has the option to purchase an area operating partner’s interest in the Management Partnership after the restaurant has been open for a five-year period on the terms specified in the agreement.
For restaurants opened on or afterbetween January 1, 2007 and December 31, 2011, the area operating partner’s percentage of cash distributions and buyout percentage is calculated based on the associated restaurant’s return on investment compared to the Company’s targeted return on investment and may rangeranges from 3.0% to 12.0%. depending on the concept. This percentage is determined after the first five full calendar quarters from the date of the associated restaurant’s opening and is adjusted each quarter thereafter based on a trailing 12-month restaurant return on investment. The buy-outbuyout percentage is the area operating partner’s average distribution percentage for the 24 months immediately preceding the buy-out.buyout. Buyouts are paid in cash within 90 days or paid over a two-year period.
In 2011, the Company also began a version of the President’s Club annual bonus described above under “Managing and Chef Partners” for area operating partners to provide additional rewards for achieving sales targets with a required flow-through of the incremental sales to cash flow as defined in the plan.
In April 2012, the Company revised its area operating partner program for restaurants opened on or after January 1, 2012. For these restaurants, an area operating partner is required, as a condition of employment, to make a deposit of $10,000 within 30 days of the opening of each new restaurant that he or she oversees, up to a maximum deposit of $50,000 (taking into account investments under prior programs). This deposit gives the area operating partner the right to monthly payments based on a percentage of his or her restaurants’ monthly cash
BLOOMIN’ BRANDS, INC.
NOTES TO CONSOLIDATED FINANCIAL STATEMENTS—(Continued)
flows for the time period that the area operating parter oversees the restaurant, typically ranging from 4.0% to 4.5%. After the restaurant has been open for a five-year period, the area operating partner will receive a bonus equal to a multiple of the area operating partner’s average monthly payments for the 24 months immediately preceding the bonus date. The bonus will be paid within 90 days or over a two-year period, depending on the bonus amount.
Management and Other Key Employees
During the years ended December 31, 2012 and 2011, the Board of Directors authorized an additional 850,000 and 2009, 1,350,000 and 4,727,680 additional shares, respectively, were approved for issuances of stock optionoptions and restricted stock grants under the Company’s 2007 Equity Plan by the Board of Directors.Plan. During the year ended December 31, 2010, no additional shares were approved. A total of 12,350,00013,200,000 shares were approved for stock options and restricted stock grants under the 2007 Equity Plan by the Board of Directors as of December 31, 2011.2012. The maximum term of stock options and restricted stock granted under the 2007 Equity Plan is ten years. Upon completion of the Company’s initial public offering, the 2012 Equity Plan was adopted, and no further awards will be made under the 2007 Equity Plan.
The 2012 Equity Plan provides for grants of stock options, stock appreciation rights, restricted stock and restricted stock units, performance awards and other stock-based awards determined by the Compensation Committee of the Board of Directors. The maximum number of shares of common stock available for issuance pursuant to the 2012 Equity Plan was initially 3,000,000 shares. As of the first business day of each fiscal year, commencing on January 1, 2013, the aggregate number of shares that may be issued pursuant to the 2012 Equity Plan automatically increases by a number equal to 2% of the total number of shares then issued and outstanding. The 2012 Equity Plan provides that grants of performance awards will be made based upon, and subject to achieving, one or more performance measures over a performance period of not less than one year as established by the Compensation Committee of the Board of Directors. Unless terminated earlier, the 2012 Equity Plan will terminate ten years from its effective date.
Other Benefit Plans
The Company has a qualified defined contribution 401(k) plan (the OSI Restaurant Partners, LLC Salaried Employees 401(k) Plan and Trust, or the “401(k) Plan”) covering substantially all full-time employees
Index to Financial Statements
BLOOMIN’ BRANDS, INC.
NOTES TO CONSOLIDATED FINANCIAL STATEMENTS—(Continued)
eligible for salaried benefits, except officers and certain highly compensated employees. Assets of the 401(k) Plan are held in trust for the sole benefit of the employees. Participants in the 401(k) Plan may make pretax elective deferrals to the 401(k) Plan of between 1% and 20% of their compensation, subject to Internal Revenue Service (“IRS”) limitations. The Company also may make matching and/or profit-sharing contributions to the 401(k) Plan. The Company contributed $2.0 million, $1.9$2.0 million, and $2.0$1.9 million to the 401(k) Plan for the plan years ended December 31, 2012, 2011 2010 and 2009,2010, respectively.
The Company provides a deferred compensation plan for its highly compensated employees who are not eligible to participate in the 401(k) Plan. The deferred compensation plan allows these employees to contribute from 5% to 90% of their base salary and up5% to 100% of their cash bonus on a pre-taxpretax basis to an investment account consisting of various investment fund options. The Company does not currently intend to provide any matching or profit-sharing contributions, and participants are fully vested in their deferrals and their related returns. Participants are considered unsecured general creditors in the event of Company bankruptcy or insolvency.
BLOOMIN’ BRANDS, INC.
NOTES TO CONSOLIDATED FINANCIAL STATEMENTS—(Continued)
Stock Options
The following table presents a summary of the Company’s stock option activity for the year ended December 31, 20112012 (in thousands, except exercise price and contractual life):
| Options | Weighted- Average Exercise Price | Weighted- Average Remaining Contractual Life (years) | Aggregate Intrinsic Value | |||||||||||||
Outstanding at December 31, 2010 | 10,338 | $ | 7.00 | 8.1 | $ | 29,011 | ||||||||||
Granted | 2,037 | 9.80 | ||||||||||||||
Forfeited | (432 | ) | 6.50 | |||||||||||||
|
| |||||||||||||||
Outstanding at December 31, 2011 | 11,943 | $ | 7.50 | 7.5 | $ | 53,989 | ||||||||||
|
| |||||||||||||||
Exercisable at December 31, 2011 | 5,704 | $ | 7.42 | 6.7 | $ | 26,222 | ||||||||||
|
| |||||||||||||||
| Options | Weighted- Average Exercise Price | Weighted- Average Remaining Contractual Life (years) | Aggregate Intrinsic Value | |||||||||||||
Outstanding at December 31, 2011 | 11,943 | $ | 7.50 | 7.5 | $ | 53,989 | ||||||||||
Granted | 872 | 14.23 | ||||||||||||||
Exercised | (136 | ) | 6.50 | |||||||||||||
Forfeited or expired | (300 | ) | 7.20 | |||||||||||||
|
| |||||||||||||||
Outstanding at December 31, 2012 | 12,379 | $ | 7.99 | 6.7 | $ | 94,710 | ||||||||||
|
| |||||||||||||||
Exercisable at December 31, 2012 | 7,293 | $ | 7.41 | 6.0 | $ | 60,026 | ||||||||||
|
| |||||||||||||||
The total intrinsic value of stock options exercised during the year ended December 31, 2012 was $0.5 million. The Company received $0.9 million in cash and did not realize any tax benefits from the exercise of stock options in the year ended December 31, 2012. The Company did not have any stock options exercised in the years ended December 31, 2011 and 2010. The Company settles stock option exercises with authorized but unissued shares of the Company’s common stock.
The weighted-average grant date fair value of stock options granted during the years ended December 31, 2012, 2011 and 2010 was $6.93, $6.02, and 2009 was $6.02, $3.18, and $3.65, respectively, and was estimated using the Black-Scholes option pricing model. The following assumptions were used to calculate the fair value of options granted duringfor the years ended December 31, 2011, 2010 and 2009: (1) weighted-average risk-free interest rates of 2.09%, 1.95%, and 2.27%, respectively; (2) dividend yield of 0.0%; (3) expected term of six and a half years, six and a half years, and five years, respectively; and (4) weighted-average volatilities of 54.8%, 73.9% and 65.3%, respectively. The Company did not have anyperiods indicated:
| Years Ended December 31, | ||||||||||||
| 2012 | 2011 | 2010 | ||||||||||
Weighted-average risk-free interest rate | 1.11 | % | 2.09 | % | 1.95 | % | ||||||
Dividend yield | — | % | — | % | — | % | ||||||
Expected term | 6.5 years | 6.5 years | 6.5 years | |||||||||
Weighted-average volatility | 48.6 | % | 54.8 | % | 73.9 | % | ||||||
Under the 2007 Equity Plan, stock options exercised in the years ended December 31, 2011, 2010 and 2009 and therefore did not have any tax benefits realized from the exercise of stock options in these periods.
Generally, stock optionsgenerally vest and become nominally exercisable in 20% increments over a period of five years contingent on continued employee service. Shares acquired upon the exercise of stock options under the 2007 Equity Plan arewere generally subject to a stockholder’s agreement that containscontained a management call option that allowsallowed the Company to repurchase all shares purchased through exercise of stock options upon termination of employment at any time prior to the earlier of an initial public offering or a change of control. If an employee’s termination of employment iswas a result of death or disability, by the Company other than for cause or by the employee for good reason, the Company maywas able to repurchase exercised stock under this call option at fair market value. If an employee’s termination of employment iswas by the Company for cause or by the employee without good reason, the Company maywas able to repurchase the stock under this call provision for the lesser of the exercise price or fair market value. Additionally, the holder of shares acquired upon the exercise of stock options iswas prohibited from transferring the shares to any person, subject to narrow exceptions, and shouldif a permitted transfer occur,
Index to Financial Statements
BLOOMIN’ BRANDS, INC.
NOTES TO CONSOLIDATED FINANCIAL STATEMENTS—(Continued)
occurred, the transferred shares remainremained subject to the management call option. As a result of the transfer restrictions and call option, the Company doesdid not record compensation expense for stock
BLOOMIN’ BRANDS, INC.
NOTES TO CONSOLIDATED FINANCIAL STATEMENTS—(Continued)
options that containcontained the call option since employees cannotwere not able to realize monetary benefit from the options or any shares acquired upon the exercise of the options unless the employee iswas employed at the time of an initial public offering or change of control. There havePrior to the Company’s initial public offering in August 2012, there had not been any exercises of stock options by any employee, to date, and generally all stock options of terminated employees with a call provision have beeneither expired or were forfeited.
During the second quarter of 2009, the stock option agreements between the Company and certainUpon completion of the Company’s initial public offering, the Company recorded approximately $16.0 million of aggregate non-cash compensation expense with respect to (i) certain stock options held by its CEO that become exercisable (to the extent then named executive officers were amendedvested) if following the offering, the volume-weighted average trading price of the Company’s common stock is equal to eliminateor greater than specified performance targets over a six-month period and (ii) the time vested portion of outstanding stock options containing the management call option resulting indue to the recording of stock option compensation expense. Their amended stock option agreements also contain provisions that extend the stock option exercise period for each of these officers under certain circumstances. Further, the amendments add a provision that upon retirement, the number of options to be fully vested and exercisable shall be the greater of (i) the amount of options that are vested and exercisable as of the officer’s separation date or (ii) 40% or 100% of the officer’s options, depending on the officer.
In November 2009, the Company’s chief executive officer (“CEO”) received a stock option grant that contained a modified form of the call option. In accordance with accounting for stock-based compensation, this modified formautomatic termination of the call option does not precludeupon completion of the Company from recording compensation expense during the service period for one quarter of her option shares. Compensation expense is not recorded for the remaining three quarters of her option shares since they are not considered vested from an accounting standpoint until the occurrence of a Qualifying Liquidity Event, as defined in the CEO’s stock option agreement. offering.
On July 1, 2011, the CEO was granted an option to purchase 550,000 shares of common stock under the 2007 Equity Plan in accordance with the terms of her employment agreement. This option has an exercise price of $10.03 per share and iswas subject to thea modified form of the management call option that applied to one quarterdid not preclude the Company from recording compensation expense during the service period. This modified form of her 2009 grant described above.the management call option terminated upon completion of the Company’s initial public offering. These options will vest and compensation expense will beis recorded equally over a five-year period on each anniversary of the grant date, contingent upon her continued employment with the Company.
In March 2010, the Company offered all then active employees the opportunity to exchange outstanding stock options with an exercise price of $10.00 per share for the same number of replacement stock options with an exercise price of $6.50 per share. Under the exchange program, the vested portion of the eligible stock options as of the grant date of the replacement stock options were exchanged for stock options that were fully vested. The unvested portion of the exchanged stock options were exchanged for unvested replacement stock options that vest and become exercisable over a period of time that is equal to the remaining vesting period of the exchanged stock options plus one year, subject to the participant’s continued employment through the new vesting date. For exchanged stock options that contained both performance-based and time-based vesting conditions, the replacement stock options contain only time-based vesting conditions and vest in accordance with the above terms. All eligible stock options were exchanged pursuant to the exchange program. The original stock options were cancelled, and the issuance of the replacement stock options occurred on April 6, 2010. As a result of the management call option, the stock options exchange did not have a material effect on the Company’s consolidated financial statements.
Under the 2012 Equity Plan, stock options generally vest and become exercisable in 25% increments over a period of four years on the grant anniversary date contingent on continued employee service. Stock options have an exercisable life of no more than ten years from the date of grant.
The Company recorded compensation expense of $20.1 million, $2.2 million $1.1 million and $0.6 million and total recognized tax benefit of $0.8 million, $0.4 million and $0.2$1.1 million during the years ended December 31, 2012, 2011 2010, and 20092010 respectively, for vested stock options. The Company did not recognize any tax benefits for vested stock options in any of the years ended December 31, 2012, 2011 and 2010 due to a valuation allowance and other tax credits available. The total fair value of stock options that vested during the years ended December 31, 2012, 2011 and 2010 was $66.5 million (of which $39.3 million relates to stock options that would have vested in prior years without the management call option), $3.7 million and $2.2 million, respectively. The Company did not capitalize any stock-based compensation costs during any periods presented. As of December 31, 2011,2012, there is $5.7was $22.6 million of total unrecognized compensation expense related to non-vested stock options, which is expected to be recognized over a weighted-average period of approximately 3.72.8 years.
Index to Financial Statements
BLOOMIN’ BRANDS, INC.
NOTES TO CONSOLIDATED FINANCIAL STATEMENTS—(Continued)
Restricted Stock
| Number of Restricted Share Awards (in thousands) | Weighted- Average Grant Date Fair Value Per Award | |||||||
Restricted stock outstanding at December 31, 2010 | 481 | $ | 10.00 | |||||
Vested | 242 | 10.00 | ||||||
|
| |||||||
Restricted stock outstanding at December 31, 2011 | 239 | $ | 10.00 | |||||
|
| |||||||
During the second quarter of 2009, the restricted stock agreements between the Company and certain of the Company’s then named executive officers were amended. These amendments accelerated the vesting of these officers’ shares of restricted stock such that they were fully vested on June 14, 2009. Of the total compensation expense recorded for the vesting of restricted stock during the year ended December 31, 2009, $10.3 million (2,036,925 shares) related to the accelerated vesting of the restricted stock held by these officers.
Number of | Weighted- | |||||||
Restricted stock outstanding at December 31, 2011 | 239 | $ | 10.00 | |||||
Granted | 314 | 14.69 | ||||||
Vested | (218 | ) | 10.00 | |||||
Forfeited | (36 | ) | 11.93 | |||||
|
| |||||||
Restricted stock outstanding at December 31, 2012 | 299 | $ | 14.69 | |||||
|
| |||||||
Compensation expense recognized in net income (loss) for the years ended December 31, 2012, 2011 and 2010 and 2009 was $1.4 million, $1.7 million $2.0 million and $14.6$2.0 million, respectively, for restricted stock awards. The totalCompany did not recognize any tax benefit recognizedbenefits related to the compensation expense recorded for restricted stock awards was $0.7 million, $0.8 million and $5.7 million for the years ended December 31, 2012, 2011 and 2010 due to a valuation allowance and 2009, respectively.other tax credits available. As measured on the vesting date, the total fair value of restricted stock that vested during the years ended December 31, 2012, 2011 and 2010 and 2009 was $2.8 million, $2.3 million $1.8 million and $8.9$1.8 million, respectively. Unrecognized pre-taxpretax compensation expense related to non-vested restricted stock awards was approximately $0.8$3.7 million at December 31, 20112012 and will be recognized over a weighted-average period of 0.53.4 years.
Shares of restricted stock issued in 2007 to certain of the Company’s current and former executive officers and other members of management vestunder the 2007 Equity Plan vested each June 14 through 2012. In accordance with the terms of their applicable agreements, the Company loaned an aggregate of $0.4 million, $0.9 million $0.7 million and $3.3$0.7 million to these individuals in June and July of2012, 2011 and 2010, and 2009, respectively, for their personal income tax obligations that resulted from vesting. During the first quarter of 2012, the three executive officers of the Company having outstanding loans and certain other former members of management repaid their entire loan balances to the Company. As of December 31, 2012 and 2011, a total of $5.8 million and $7.2 million of loans and associated interest obligations to current and former executive officers and other members of management was outstanding and was recorded in the line item “AdditionalAdditional paid-in capital”capital in the Company’s Consolidated Balance Sheet.Sheets. The loans are full recourse and are collateralized by the vested shares of restricted stock. AlthoughOn May 10, 2012, the Company approved an amendment to the loans to extend the timing for mandatory prepayment in connection with an initial public offering to require full repayment by the last trading day in the first trading window subsequent to the expiration of contractual lock-up restrictions imposed in connection with the offering.
Restricted stock shares vest on the grant anniversary date at a rate of approximately 33.3% per year for those issued to directors and 25% per year for all other issuances. Restricted stock vesting is dependent upon continued service with forfeiture of all unvested restricted stock shares upon termination, unless in the case of death or disability, in which case all restricted stock shares are immediately vested.
BLOOMIN’ BRANDS, INC.
NOTES TO CONSOLIDATED FINANCIAL STATEMENTS—(Continued)
5. Other Current Assets, Net
Other current assets, net, consisted of the following (in thousands):
| December 31, | ||||||||
| 2012 | 2011 | |||||||
Prepaid expenses | $ | 23,186 | $ | 18,113 | ||||
Accounts receivable—vendors, net | 38,459 | 48,568 | ||||||
Accounts receivable—franchisees, net | 2,019 | 2,396 | ||||||
Accounts receivable—other, net | 7,498 | 11,869 | ||||||
Other current assets, net | 32,159 | 23,427 | ||||||
|
|
|
| |||||
| $ | 103,321 | $ | 104,373 | |||||
|
|
|
| |||||
6. Property, Fixtures and Equipment, Net
Property, fixtures and equipment, net, consisted of the following (in thousands):
| December 31, | ||||||||
| 2012 | 2011 | |||||||
Land | $ | 262,378 | $ | 329,143 | ||||
Buildings and building improvements | 917,243 | 1,013,618 | ||||||
Furniture and fixtures | 303,304 | 263,266 | ||||||
Equipment | 422,069 | 362,649 | ||||||
Leasehold improvements | 396,101 | 369,726 | ||||||
Construction in progress | 32,646 | 22,011 | ||||||
Less: accumulated depreciation | (827,706 | ) | (724,515 | ) | ||||
|
|
|
| |||||
| $ | 1,506,035 | $ | 1,635,898 | |||||
|
|
|
| |||||
Effective March 14, 2012, the Company entered into a sale-leaseback transaction (the “Sale-Leaseback Transaction”) with two third-party real estate institutional investors in which the Company sold 67 restaurant properties at fair market value for net proceeds of $192.9 million. The Company then simultaneously leased these loansproperties under nine master leases (collectively, the “REIT Master Leases”). The initial terms of the REIT Master Leases are permitted20 years with four five-year renewal options. One renewal period is at a fixed rental amount and the last three renewal periods are generally based at then-current fair market values. The sale at fair market value and subsequent leaseback qualified for sale-leaseback accounting treatment, and the REIT Master Leases are classified as operating leases. In accordance with the applicable accounting guidance, the 67 restaurant properties are not classified as held for sale at December 31, 2011 since the Company leased the properties. The Company recorded a deferred gain on the sale of certain of the properties of $42.9 million primarily in Other long-term liabilities, net in its Consolidated Balance Sheet at the time of the transaction, which is amortized over the initial term of the lease.
As of December 31, 2012, the Company had certain land and buildings with historical cost amounts of $14.1 million and $20.3 million, respectively, that have been leased to third parties under operating leases. Accumulated depreciation related to the leased building assets of $4.1 million is included in Property, fixtures and equipment at December 31, 2012.
BLOOMIN’ BRANDS, INC.
NOTES TO CONSOLIDATED FINANCIAL STATEMENTS—(Continued)
The Company expensed repair and maintenance costs of approximately $98.0 million, $97.3 million and $94.3 million for the years ended December 31, 2012, 2011 and 2010, respectively. Depreciation expense for the years ended December 31, 2012, 2011 and 2010 was $147.8 million, $147.4 million and $150.4 million, respectively.
During the years ended December 31, 2012, 2011 and 2010, the Company recorded property, fixtures and equipment impairment charges of $10.6 million, $11.6 million and $2.2 million, respectively, for certain of the Company’s restaurants in Provision for impaired assets and restaurant closings in its Consolidated Statements of Operations and Comprehensive Income (see Note 14).
The fixed asset impairment charges described above primarily occurred as a result of the carrying value of a restaurant’s assets exceeding its estimated fair market value, primarily due to anticipated closures or declining future cash flows from lower projected future sales at existing locations.
7. Investment in Equity Method Investee
Through a joint venture arrangement with PGS Participacoes Ltda., the Company holds a 50% ownership interest in the Brazilian Joint Venture, which operates Outback Steakhouse restaurants in Brazil. The Company accounts for the Brazilian Joint Venture under the equity method of accounting. At December 31, 2012 and 2011, the Company’s net investment of $36.0 million and $34.0 million, respectively, was recorded in Investments in and advances to unconsolidated affiliates, net, and a foreign currency translation adjustment of ($3.1) million and ($3.8) million was recorded in Accumulated other comprehensive loss in the Company’s Consolidated Balance Sheets during the years ended December 31, 2012 and 2011, respectively. The Company’s share of earnings of $5.1 million, $6.8 million and $5.5 million for the years ended December 31, 2012, 2011 and 2010, respectively, was recorded in Income from operations of unconsolidated affiliates in the Company’s Consolidated Statements of Operations and Comprehensive Income.
The following tables present summarized financial information for 100% of the Brazilian Joint Venture for the periods ending as indicated (in thousands):
| December 31, | ||||||||
| 2012 | 2011 | |||||||
Current assets | $ | 33,269 | $ | 26,882 | ||||
Noncurrent assets | 72,214 | 63,458 | ||||||
Current liabilities | 24,546 | 20,516 | ||||||
Noncurrent liabilities | 16,997 | 10,694 | ||||||
| Years Ended December 31, | ||||||||||||
| 2012 | 2011 | 2010 | ||||||||||
Net revenue from sales | $ | 246,819 | $ | 225,720 | $ | 161,860 | ||||||
Gross profit | 172,011 | 153,377 | 112,647 | |||||||||
Income from continuing operations | 24,268 | 24,507 | 18,980 | |||||||||
Net income | 11,151 | 13,547 | 11,300 | |||||||||
BLOOMIN’ BRANDS, INC.
NOTES TO CONSOLIDATED FINANCIAL STATEMENTS—(Continued)
8. Goodwill and Intangible Assets, Net
The change in goodwill for the years ended December 31, 2012 and 2011 is as follows (in thousands):
| 2012 | 2011 | |||||||
Balance as of January 1: | ||||||||
Goodwill | $ | 1,059,051 | $ | 1,059,051 | ||||
Accumulated purchase accounting adjustments | 3,604 | 3,604 | ||||||
Accumulated impairment losses | (784,636 | ) | (784,636 | ) | ||||
Cumulative translation adjustments | (8,197 | ) | (8,118 | ) | ||||
Accumulated disposal adjustments | (1,050 | ) | — | |||||
|
|
|
| |||||
| 268,772 | 269,901 | |||||||
Translation adjustments | 2,200 | (79 | ) | |||||
Disposal adjustment | — | (1,050 | ) | |||||
Balance as of December 31: | ||||||||
Goodwill | 1,059,051 | 1,059,051 | ||||||
Accumulated purchase accounting adjustments | 3,604 | 3,604 | ||||||
Accumulated impairment losses | (784,636 | ) | (784,636 | ) | ||||
Cumulative translation adjustments | (5,997 | ) | (8,197 | ) | ||||
Accumulated disposal adjustments | (1,050 | ) | (1,050 | ) | ||||
|
|
|
| |||||
| $ | 270,972 | $ | 268,772 | |||||
|
|
|
| |||||
The Company performs its annual assessment for impairment of goodwill and other indefinite-lived intangible assets each year during the second quarter. The Company’s review of the recoverability of goodwill is based primarily upon an analysis of the discounted cash flows of the related reporting units as compared to their carrying values (see Note 14). The Company also uses the discounted cash flow method to determine the fair value of its intangible assets.
The Company did not record any goodwill or indefinite-lived intangible asset impairment charges or any material definite-lived intangible asset impairment charges during 2012, 2011 or 2010. In October 2011, the Company sold its nine Company-owned Outback Steakhouse restaurants in Japan to a subsidiary of S Foods, Inc., one of the Company’s beef suppliers in Japan, for $9.4 million. The buyer will have the right for future development of Outback Steakhouse franchise restaurants in Japan and will pay the Company a royalty in the range of 2.75% to 4.00% based on sales volumes. The Company used the net cash proceeds from this sale to pay down $7.5 million of OSI’s then outstanding term loans in accordance with the terms of the credit agreement amended in January 2010. The Company recorded a $1.1 million adjustment to reduce goodwill related to the disposal of these assets and recorded a loss of $4.3 million from this sale in General and administrative expenses in its Consolidated Statement of Operations and Comprehensive Income for the year ended December 31, 2011.
The accumulated purchase accounting adjustments to Goodwill of $3.6 million were the result of adjustments to appraised fair values of acquired tangible assets.
BLOOMIN’ BRANDS, INC.
NOTES TO CONSOLIDATED FINANCIAL STATEMENTS—(Continued)
Intangible assets, net, consisted of the following (in thousands):
| Weighted Average Amortization Period (years) | December 31, | |||||||||||
| 2012 | 2011 | |||||||||||
Trade names (gross) | Indefinite | $ | 413,000 | $ | 413,000 | |||||||
|
|
|
| |||||||||
Trademarks (gross) | 16 | 87,831 | 87,531 | |||||||||
Less: accumulated amortization | (22,529 | ) | (18,454 | ) | ||||||||
|
|
|
| |||||||||
Net trademarks | 65,302 | 69,077 | ||||||||||
|
|
|
| |||||||||
Favorable leases (gross, lives ranging from 0.8 to 25 years) | 11 | 95,514 | 99,391 | |||||||||
Less: accumulated amortization | (38,934 | ) | (34,752 | ) | ||||||||
|
|
|
| |||||||||
Net favorable leases | 56,580 | 64,639 | ||||||||||
|
|
|
| |||||||||
Franchise agreements (gross) | 8 | 17,385 | 17,385 | |||||||||
Less: accumulated amortization | (7,410 | ) | (6,073 | ) | ||||||||
|
|
|
| |||||||||
Net franchise agreements | 9,975 | 11,312 | ||||||||||
|
|
|
| |||||||||
Other intangibles (gross) | 4 | 9,099 | 8,547 | |||||||||
Less: accumulated amortization | (2,177 | ) | (427 | ) | ||||||||
|
|
|
| |||||||||
Net other intangibles | 6,922 | 8,120 | ||||||||||
|
|
|
| |||||||||
Intangible assets, less total accumulated amortization of $71,051 and $59,706 at December 31, 2012 and 2011, respectively | $ | 551,779 | $ | 566,148 | ||||||||
|
|
|
| |||||||||
Definite-lived intangible assets are amortized on a straight-line basis. The aggregate expense related to the amortization of the Company’s trademarks, favorable leases, franchise agreements and other intangibles was $14.6 million, $13.9 million and $14.0 million for the years ended December 31, 2012, 2011 and 2010, respectively. Annual expense related to the amortization of intangible assets is anticipated to be approximately $13.9 million in 2013, $13.2 million in 2014, $12.8 million in 2015, $11.8 million in 2016 and $9.9 million in 2017.
In accordance with the terms of an asset purchase agreement that was amended in December 2004, the Company was obligated to pay a royalty to its Bonefish Grill founder and joint venture partner during his employment term with the Company. The Company had the option to terminate this royalty within 45 days of his termination of employment by making an aggregate payment equal to five times the amount of the royalty payable during the twelve full calendar months immediately preceding the month of his termination. As his employment terminated on October 1, 2011, the Company paid the approximately $8.5 million royalty termination fee in October 2011 and recorded this payment as an intangible asset in its Consolidated Balance Sheet in the fourth quarter of 2011. The intangible asset is notamortized over a five-year useful life.
BLOOMIN’ BRANDS, INC.
NOTES TO CONSOLIDATED FINANCIAL STATEMENTS—(Continued)
9. Other Assets, Net
Other assets, net, consisted of the following (in thousands):
| December 31, | ||||||||
| 2012 | 2011 | |||||||
Company-owned life insurance | $ | 59,787 | $ | 51,955 | ||||
Deferred financing fees, net of accumulated amortization of $8,890 and $66,275 at December 31, 2012 and 2011, respectively | 15,097 | 19,988 | ||||||
Liquor licenses | 26,002 | 25,545 | ||||||
Other assets | 44,546 | 38,677 | ||||||
|
|
|
| |||||
| $ | 145,432 | $ | 136,165 | |||||
|
|
|
| |||||
The Company amortized deferred financing fees to interest expense of $8.2 million, $12.3 million and $13.4 million for the years ended December 31, 2012, 2011 and 2010, respectively.
10. Accrued and Other Current Liabilities
Accrued and other current liabilities consisted of the following (in thousands):
| December 31, | ||||||||
| 2012 | 2011 | |||||||
Accrued payroll and other compensation | $ | 108,612 | $ | 117,013 | ||||
Accrued insurance | 22,235 | 19,284 | ||||||
Other current liabilities | 61,437 | 75,189 | ||||||
|
|
|
| |||||
| $ | 192,284 | $ | 211,486 | |||||
|
|
|
| |||||
BLOOMIN’ BRANDS, INC.
NOTES TO CONSOLIDATED FINANCIAL STATEMENTS—(Continued)
11. Long-term Debt, Net
Long-term debt, net consisted of the following (in thousands):
| December 31, | ||||||||
| 2012 | 2011 | |||||||
Senior secured term loan B facility, interest rate of 4.75% at December 31, 2012 (1)(2) | $ | 1,000,000 | $ | — | ||||
Senior secured term loan facility, interest rate of 2.63% at December 31, 2011 (1)(3) | — | 1,014,400 | ||||||
Senior secured pre-funded revolving credit facility, interest rate of 2.63% at December 31, 2011 (1) | — | 33,000 | ||||||
Mortgage loan, weighted average interest rate of 3.98% at December 31, 2012 (4) | 319,574 | — | ||||||
First mezzanine loan, interest rate of 9.00% at December 31, 2012 (4) | 87,048 | — | ||||||
Second mezzanine loan, interest rate of 11.25% at December 31, 2012 (4) | 87,273 | — | ||||||
Note payable, weighted average interest rate of 0.98% at December 31, 2011 (4) | — | 466,319 | ||||||
First mezzanine note, interest rate of 3.28% at December 31, 2011 (4) | — | 88,900 | ||||||
Second mezzanine note, interest rate of 3.53% at December 31, 2011 (4) | — | 123,190 | ||||||
Third mezzanine note, interest rate of 3.54% at December 31, 2011 (4) | — | 49,095 | ||||||
Fourth mezzanine note, interest rate of 4.53% at December 31, 2011 (4) | — | 48,113 | ||||||
Senior notes, interest rate of 10.00% at December 31, 2011 (1) | — | 248,075 | ||||||
Other notes payable, uncollateralized, interest rates ranging from 0.63% to 7.00% and from 0.76% to 7.00% at December 31, 2012 and 2011, respectively (1) | 9,848 | 9,094 | ||||||
Sale-leaseback obligations (1) | 2,375 | 2,375 | ||||||
Capital lease obligations (1) | 2,112 | 2,520 | ||||||
Guaranteed debt, interest rate of 2.65% at December 31, 2011 (1) | — | 24,500 | ||||||
|
|
|
| |||||
| 1,508,230 | 2,109,581 | |||||||
Less: current portion of long-term debt | (22,991 | ) | (332,905 | ) | ||||
Less: guaranteed debt | — | (24,500 | ) | |||||
Less: debt discount | (13,790 | ) | (291 | ) | ||||
|
|
|
| |||||
Long-term debt, net | $ | 1,471,449 | $ | 1,751,885 | ||||
|
|
|
| |||||
| (1) | Represents obligations of OSI. |
| (2) | At December 31, 2012, $50.0 million of OSI’s outstanding senior secured term loan B facility was at 5.75%. |
| (3) | At December 31, 2011, $61.9 million of OSI’s outstanding senior secured term loan facility was at 4.50%. |
| (4) | Represents obligations of New PRP as of December 31, 2012 and obligations of PRP as of December 31, 2011. |
Bloomin’ Brands, Inc. is a holding company and conducts its operations through its subsidiaries, certain of which have incurred their own indebtedness as described below.
On October 26, 2012, OSI completed a refinancing of its outstanding senior secured credit facilities from 2007 (the “2007 Credit Facilities”) and entered into a credit agreement (“Credit Agreement”) with a syndicate of institutional lenders and financial institutions. The new senior secured credit facilities provide for senior secured financing of up to $1.225 billion, consisting of a $1.0 billion term loan B and a $225.0 million revolving credit facility, including letter of credit and swing-line loan sub-facilities (the “New Facilities”). The
BLOOMIN’ BRANDS, INC.
NOTES TO CONSOLIDATED FINANCIAL STATEMENTS—(Continued)
term loan B was issued with an original issue discount of $10.0 million. In the fourth quarter of 2012, the Company incurred $13.9 million of third-party financing costs to complete this transaction of which $11.0 million has been capitalized. These deferred financing costs are primarily included in Other assets, net in the Company’s Consolidated Balance Sheet. The remaining $2.9 million of third-party financing costs were expensed as they related to debt held by lenders that participated in both the original and refinanced debt and therefore, the debt was treated as modified rather than extinguished. An additional $6.2 million of loss was recorded for the write-off of deferred financing fees associated with the 2007 Credit Facilities treated as extinguished. The Company recorded the total $9.1 million loss related to the modification and extinguishment of the 2007 Credit Facilities in Loss on extinguishment and modification of debt in the Company’s Consolidated Statement of Operations and Comprehensive Income during the fourth quarter of 2012.
The new senior secured term loan B matures October 26, 2019. The borrowings under this facility bear interest at rates ranging from 225 to 250 basis points over the Base Rate or 325 to 350 basis points over the Eurocurrency Rate as defined in the Credit Agreement. The Base Rate option is the highest of (i) the prime rate of Deutsche Bank Trust Company Americas, (ii) the federal funds effective rate plus 0.5 of 1.0% or (iii) the Eurocurrency Rate with a one-month interest period plus 1.0% (“Base Rate”) (3.25% at December 31, 2012). The Eurocurrency Rate option is the 30, 60, 90 or 180-day Eurocurrency Rate (“Eurocurrency Rate”) (ranging from 0.21% to 0.51% at December 31, 2012). The Eurocurrency Rate may have a nine- or twelve-month interest period if agreed upon by the applicable lenders. With respect to the new senior secured term loan B, the Base Rate is subject to an interest rate floor of 2.25%, and the Eurocurrency Rate is subject to an interest rate floor of 1.25%.
OSI is required to issue themprepay outstanding term loans, subject to certain exceptions, with:
50% of its “annual excess cash flow” (with step-downs to 25% and 0% based upon its consolidated first lien net leverage ratio), as defined in the future.Credit Agreement, beginning with the fiscal year ending December 31, 2013 and subject to certain exceptions;
100% of the net proceeds of certain assets sales and insurance and condemnation events, subject to reinvestment rights and certain other exceptions; and
100% of the net proceeds of any debt incurred, excluding permitted debt issuances.
The New Facilities require scheduled quarterly payments on the term loan B equal to 0.25% of the original principal amount of the term loans for the first six years and three quarters commencing with the quarter ending March 31, 2013. These payments are reduced by the application of any prepayments, and any remaining balance will be paid at maturity. The outstanding balance on the term loan B was $1.0 billion at December 31, 2012 of which $10.0 million was classified as current due to OSI’s required quarterly payments. Subsequent to December 31, 2012, OSI voluntarily made aggregate prepayments on its term loan B of $25.0 million.
The revolving credit facility matures October 26, 2017 and provides for swing-line loans and letters of credit of up to $225.0 million for working capital and general corporate purposes. The revolving credit facility bears interest at rates ranging from 200 to 250 basis points over the Base Rate or 300 to 350 basis points over the Eurocurrency Rate. There were no loans outstanding under the revolving credit facility at December 31, 2012, however, $41.2 million of the credit facility was not available for borrowing as: (i) $34.5 million of the credit facility was committed for the issuance of letters of credit as required by insurance companies that underwrite the Company’s workers’ compensation insurance and also, where required, for construction of new restaurants, (ii) $6.1 million of the credit facility was committed for the issuance of a letter of credit to the insurance
BLOOMIN’ BRANDS, INC.
NOTES TO CONSOLIDATED FINANCIAL STATEMENTS—(Continued)
company that underwrites the Company’s bonds for liquor licenses, utilities, liens and construction and (iii) $0.6 million of the credit facility was committed for the issuance of other letters of credit. Total outstanding letters of credit issued under OSI’s new revolving credit facility may not exceed $100.0 million. Fees for the letters of credit were 3.63% and the commitment fees for unused revolving credit commitments were 0.50%.
The New Facilities require OSI to comply with certain covenants, including, in the case of the revolving credit facility, a covenant to maintain a specified quarterly Total Net Leverage Ratio (“TNLR”) test. The TNLR is the ratio of Consolidated Total Debt to Consolidated EBITDA (earnings before interest, taxes, depreciation and amortization and certain other adjustments as defined in the Credit Agreement) and may not exceed a level set at 6.00 to 1.00 for the last day of any fiscal quarter in 2012 or 2013, with step-downs over a four-year period to a maximum level of 5.00 to 1.00 in 2017. The other negative covenants limit, but provide exceptions for, OSI’s ability and the ability of its restricted subsidiaries to take various actions relating to indebtedness, significant payments, mergers and similar transactions. The Credit Agreement also contains customary representations and warranties, affirmative covenants and events of default. At December 31, 2012, OSI was in compliance with its debt covenants under the New Facilities.
The New Facilities are guaranteed by each of OSI’s current and future domestic 100% owned restricted subsidiaries in the Outback Steakhouse and Carrabba’s Italian Grill concepts and certain other subsidiaries (the “Guarantors”) and by OSI HoldCo, Inc., OSI’s direct owner and the Company’s indirect, wholly-owned subsidiary (“OSI HoldCo”).
OSI’s obligations are secured by substantially all of its assets and assets of the Guarantors and OSI HoldCo, in each case, now owned or later acquired, including a pledge of all of OSI’s capital stock, the capital stock of substantially all of OSI’s domestic subsidiaries and 65% of the capital stock of foreign subsidiaries that are directly owned by OSI, OSI HoldCo, or a Guarantor. OSI is also required to provide additional guarantees of the New Facilities in the future from other domestic wholly-owned restricted subsidiaries if the Consolidated EBITDA attributable to OSI’s non-guarantor domestic wholly-owned restricted subsidiaries as a group exceeds 10% of the Consolidated EBITDA of OSI and its restricted subsidiaries. If this occurs, guarantees would be required from additional domestic wholly-owned restricted subsidiaries in such number that would be sufficient to lower the aggregate Consolidated EBITDA of the non-guarantor domestic wholly-owned restricted subsidiaries as a group to an amount not in excess of 10% of the Consolidated EBITDA of OSI and its restricted subsidiaries.
Prior to the New Facilities, OSI was party to the 2007 Credit Facilities with a syndicate of institutional lenders and financial institutions, which were entered into on June 14, 2007. These senior secured credit facilities provided for senior secured financing of up to $1.6 billion, consisting of a $1.3 billion term loan facility, a $150.0 million working capital revolving credit facility, including letter of credit and swing-line loan sub-facilities, and a $100.0 million pre-funded revolving credit facility that provided financing for capital expenditures only.
At each rate adjustment, OSI had the option to select an Original Base Rate plus 125 basis points or an Original Eurocurrency Rate plus 225 basis points for the borrowings under this facility. The base rate option was the higher of the prime rate of Deutsche Bank AG New York Branch and the federal funds effective rate plus 0.5 of 1% (“Original Base Rate”) (3.25% at December 31, 2011). The eurocurrency rate option was the 30, 60, 90 or 180-day eurocurrency rate (“Original Eurocurrency Rate”) (ranging from 0.38% to 0.88% at December 31, 2011). The Original Eurocurrency Rate may have had a nine- or twelve-month interest period if agreed upon by the applicable lenders. With either the Original Base Rate or the Original Eurocurrency Rate, the interest rate would have been reduced by 25 basis points if the associated Moody’s Applicable Corporate Rating then most recently published was B1 or higher (the rating was Caa1 at December 31, 2011).
BLOOMIN’ BRANDS, INC.
NOTES TO CONSOLIDATED FINANCIAL STATEMENTS—(Continued)
OSI was required to prepay outstanding term loans, subject to certain exceptions, with:
50% of its “annual excess cash flow” (with step-downs to 25% and 0% based upon its rent-adjusted leverage ratio), as defined in the credit agreement and subject to certain exceptions;
100% of its “annual minimum free cash flow,” as defined in the credit agreement, not to exceed $75.0 million for each fiscal year, if its rent-adjusted leverage ratio exceeded a certain minimum threshold;
100% of the net proceeds of certain assets sales and insurance and condemnation events, subject to reinvestment rights and certain other exceptions; and
100% of the net proceeds of any debt incurred, excluding permitted debt issuances.
Additionally, OSI was required, on an annual basis, to first, repay outstanding loans under the pre-funded revolving credit facility and second, fund a capital expenditure account to the extent amounts on deposit were less than $100.0 million, in both cases with 100% of OSI’s “annual true cash flow,” as defined in the credit agreement. In accordance with these requirements, in April 2012, OSI repaid its pre-funded revolving credit facility outstanding loan balance of $33.0 million and funded $37.6 million to its capital expenditure account using its “annual true cash flow.”
OSI’s 2007 Credit Facilities required scheduled quarterly payments on the term loans equal to 0.25% of the original principal amount of the term loans for the first six years and three quarters following June 14, 2007. These payments were reduced by the application of any prepayments. The outstanding balance on the term loans was $1.0 billion at December 31, 2011. The Company classified $13.1 million of OSI’s term loans as current at December 31, 2011 due to OSI’s required quarterly payments and the results of its covenant calculations, which indicated the additional term loan prepayments, as described above, were not required. In October 2011, the Company sold its nine Company-owned Outback Steakhouse restaurants in Japan to a subsidiary of S Foods, Inc. and used the net cash proceeds from this sale to pay down $7.5 million of OSI’s outstanding term loans in accordance with the terms of the OSI credit agreement amended in January 2010 (see Note 8).
Proceeds of loans and letters of credit under OSI’s $150.0 million working capital revolving credit facility provided financing for working capital and general corporate purposes and, subject to a rent-adjusted leverage condition, for capital expenditures for new restaurant growth. This revolving credit facility bore interest at rates ranging from 100 to 150 basis points over the Original Base Rate or 200 to 250 basis points over the Original Eurocurrency Rate. There were no loans outstanding under the revolving credit facility at December 31, 2011, however, $67.6 million of the credit facility was committed for the issuance of letters of credit and not available for borrowing. OSI’s total outstanding letters of credit issued under its working capital revolving credit facility was not permitted to exceed $75.0 million. Fees for the letters of credit ranged from 2.00% to 2.25% and the commitment fees for unused working capital revolving credit commitments ranged from 0.38% to 0.50%.
Proceeds of loans under OSI’s $100.0 million pre-funded revolving credit facility were available to provide financing for capital expenditures, if the capital expenditure account described above had a zero balance. As of December 31, 2011, OSI had $33.0 million outstanding on its pre-funded revolving credit facility. This borrowing was recorded in Current portion of long-term debt in the Company’s Consolidated Balance Sheet, as OSI was required to repay any outstanding borrowings in April following each fiscal year using its “annual true cash flow,” as defined in the credit agreement. At each rate adjustment, OSI had the option to select the Original Base Rate plus 125 basis points or an Original Eurocurrency Rate plus 225 basis points for
BLOOMIN’ BRANDS, INC.
NOTES TO CONSOLIDATED FINANCIAL STATEMENTS—(Continued)
the borrowings under this facility. In either case, the interest rate was reduced by 25 basis points if the associated Moody’s Applicable Corporate Rating then most recently published was B1 or higher. Fees for the unused portion of the pre-funded revolving credit facility were 2.43%.
At December 31, 2011, OSI was in compliance with its debt covenants under the 2007 Credit Facilities.
Effective March 27, 2012, New Private Restaurant Properties, LLC and two of the Company’s other indirect wholly-owned subsidiaries (collectively, “New PRP”) entered into a new commercial mortgage-backed securities loan (the “2012 CMBS Loan”) with German American Capital Corporation and Bank of America, N.A. The 2012 CMBS Loan totaled $500.0 million at origination and was comprised of a first mortgage loan in the amount of $324.8 million, collateralized by 261 of the Company’s properties, and two mezzanine loans totaling $175.2 million. The loans have a maturity date of April 10, 2017. The first mortgage loan has five fixed rate components and a floating rate component. The fixed rate components bear interest at rates ranging from 2.37% to 6.81% per annum. The floating rate component bears interest at a rate per annum equal to the 30-day London Interbank Offered Rate (“LIBOR”) (with a floor of 1%) plus 2.37%. The first mezzanine loan bears interest at a rate of 9.00% per annum, and the second mezzanine loan bears interest at a rate of 11.25% per annum. In connection with the 2012 CMBS Loan, New PRP entered into an interest rate cap (the “Rate Cap”) as a method to limit the volatility of the floating rate component of the first mortgage loan (see Note 15).
The proceeds from the 2012 CMBS Loan, together with the proceeds from the Sale-Leaseback Transaction and excess cash held in PRP, were used to repay PRP’s original first mortgage and mezzanine notes (together, the commercial mortgage-backed securities loan, or the “CMBS Loan”). As a result of the 2012 CMBS Loan refinancing, the net amount repaid along with scheduled maturities within one year, $281.3 million was classified as current at December 31, 2011. During the first quarter of 2012, the Company recorded a $2.9 million loss related to the extinguishment in Loss on extinguishment and modification of debt in its Consolidated Statement of Operations and Comprehensive Income. The Company deferred $7.6 million of financing costs incurred to complete this transaction of which $2.2 million had been capitalized as of December 31, 2011 and the remainder was capitalized in the first quarter of 2012. These deferred financing costs are primarily included in Other assets, net in the Company’s current executive officers repaid their entire loan balances.Consolidated Balance Sheets. At December 31, 2012, the outstanding balance, excluding the debt discount, on the 2012 CMBS Loan was $493.9 million.
Prior to the 2012 CMBS Loan, PRP had a CMBS Loan totaling $790.0 million, which was entered into on June 14, 2007. As part of the CMBS Loan, German American Capital Corporation and Bank of America, N.A. et al (the “Lenders”) had a security interest in the acquired real estate and related improvements, and direct and indirect equity interests of certain of the Company’s subsidiaries. The CMBS Loan comprised a note payable and four mezzanine notes. All notes bore interest at the one-month LIBOR which was 0.28% at December 31, 2011, plus an applicable spread which ranged from 0.51% to 4.25%. Interest-only payments were made on the ninth calendar day of each month and interest accrued beginning on the fifteenth calendar day of the preceding month. At December 31, 2011, the outstanding balance on PRP’s CMBS Loan was $775.3 million. The Company used an interest rate cap with a notional amount of $775.7 million as a method to limit the volatility of PRP’s variable-rate CMBS Loan. During the first quarter of 2012, this interest rate cap was terminated.
On June 14, 2007, OSI issued senior notes in an original aggregate principal amount of $550.0 million under an indenture among OSI, as issuer, OSI Co-Issuer, Inc., as co-issuer (“Co-Issuer”), a third-party trustee and the Guarantors. The senior notes were scheduled to mature on June 15, 2015. Interest was payable semiannually in arrears, at 10% per annum, in cash on each June 15 and December 15. Interest payments to the holders of record of the senior notes occurred on the immediately preceding June 1 and December 1. Interest was computed on the basis of a 360-day year consisting of twelve 30-day months. The principal balance of senior notes outstanding at December 31, 2011 was $248.1 million.
BLOOMIN’ BRANDS, INC.
4.NOTES TO CONSOLIDATED FINANCIAL STATEMENTS—(Continued)
During the third quarter of 2012, OSI retired the aggregate outstanding principal amount of its 10% senior notes through a combination of a tender offer and early redemption call. The senior notes retirement was funded using a portion of the net proceeds from the Company’s initial public offering together with cash on hand. OSI paid an aggregate of $259.8 million to retire the senior notes, which included $248.1 million in aggregate outstanding principal, $6.5 million of prepayment premium and early tender incentive fees and $5.2 million of accrued interest. The senior notes were satisfied and discharged on August 13, 2012. As a result of these transactions, the Company recorded a loss from the extinguishment of debt of $9.0 million in the third quarter of 2012 in Loss on extinguishment and modification of debt in its Consolidated Statement of Operations and Comprehensive Income. This loss included $2.4 million for the write-off of unamortized deferred financing fees that related to the extinguished senior notes.
As of December 31, 2012 and 2011, OSI had approximately $9.8 million and $9.1 million, respectively, of notes payable at interest rates ranging from 0.63% to 7.00% and from 0.76% to 7.00%, respectively. These notes have been primarily issued for buyouts of managing and area operating partner interests in the cash flows of their restaurants and generally are payable over a period of two through five years.
Debt Guarantees
Effective October 1, 2012, the Company purchased the remaining interests in the Roy’s joint venture from RY-8 for $27.4 million. This purchase price consisted of the assumption of RY-8’s $24.5 million line of credit by OSI that had been recorded in Guaranteed debt in the Company’s Consolidated Balance Sheet at December 31, 2011, forgiveness of $1.8 million in loans due from RY-8 to OSI and a $1.1 million cash payment. In December 2012, the Company paid the $24.5 million outstanding balance on the line of credit assumed from RY-8.
Prior to this acquisition, OSI was the guarantor of an uncollateralized line of credit that permitted borrowing of up to $24.5 million for RY-8 in the development of Roy’s restaurants. The line of credit was set to expire on April 15, 2013. According to the terms of the line of credit agreement, RY-8 had the ability to borrow, repay, re-borrow or prepay advances at any time before the termination date of the agreement. On the termination date of the agreement, the entire outstanding principal amount of the loan then outstanding and any accrued interest would have been due. At December 31, 2011, the outstanding balance on the line of credit was $24.5 million.
RY-8’s obligations under the line of credit were unconditionally guaranteed by OSI and Roy’s Holdings, Inc. If an event of default had occurred, as defined in the agreement, the total outstanding balance, including any accrued interest, would have been immediately due from the guarantors. At December 31, 2011, $24.5 million of OSI’s $150.0 million working capital revolving credit facility was committed for the issuance of a letter of credit for this guarantee.
The aggregate mandatory principal payments of total consolidated debt outstanding at December 31, 2012, for the next five years, are summarized as follows (in thousands):
2013 | $ | 25,604 | ||
2014 | 23,694 | |||
2015 | 21,547 | |||
2016 | 21,709 | |||
2017 | 463,301 | |||
Thereafter | 952,375 | |||
|
| |||
Total | $ | 1,508,230 | ||
|
|
BLOOMIN’ BRANDS, INC.
NOTES TO CONSOLIDATED FINANCIAL STATEMENTS—(Continued)
12. Other Long-term Liabilities, Net
Other long-term liabilities, net, consisted of the following (in thousands):
| December 31, | ||||||||
| 2012 | 2011 | |||||||
Accrued insurance liability | $ | 42,401 | $ | 39,575 | ||||
Unfavorable leases, net of accumulated amortization of $21,625 and $18,891 at December 31, 2012 and 2011, respectively | 57,359 | 62,012 | ||||||
PEP and Supplemental PEP obligations | 102,206 | 93,877 | ||||||
Deferred gain on Sale-Leaseback Transaction, net of accumulated amortization of $1,610 at December 31, 2012 | 39,149 | — | ||||||
Other long-term liabilities | 23,129 | 23,288 | ||||||
|
|
|
| |||||
| $ | 264,244 | $ | 218,752 | |||||
|
|
|
| |||||
The Company maintains endorsement split-dollar insurance policies with a death benefit ranging from $5.0 million to $10.0 million for certain of its current and former executive officers. The Company is the beneficiary of the policies to the extent of premiums paid or the cash value, whichever is greater, with the death benefit being paid to personal beneficiaries designated by the executive officers. The Company has agreed not to terminate the policies regardless of continued employment. As of December 31, 2012 and 2011, the Company has $14.3 million and $13.4 million, respectively, recorded in Other long-term liabilities, net in its Consolidated Balance Sheets for the endorsement split-dollar insurance policies.
13. Variable Interest Entities
Roy’s and RY-8, Inc.
Historically, the Company’s consolidated financial statements included the accounts and operations of its Roy’s joint venture although it had less than majority ownership. The Company determined it was the primary beneficiary of the joint venture since the Company had the power to direct or cause the direction of the activities that most significantly impacted the entity on a day-to-day basis such as decisions regarding menu development, purchasing, restaurant expansion and closings and the management of employee-related processes. Additionally, the Company had the obligation to absorb losses or the right to receive benefits of the Roy’s joint venture that could have potentially been significant to the Roy’s joint venture. The majority of capital contributions made by the Company’s partner in the Roy’s joint venture, RY-8, were funded by loans to RY-8 from a third party where OSI provided a guarantee (see Note 11). The guarantee was secured by a collateral interest in RY-8’s membership interest in the joint venture. The carrying amounts of consolidated assets and liabilities included within the Company’s Consolidated Balance Sheet for the Roy’s joint venture were $26.2 million and $9.6 million, respectively, at December 31, 2011.
The Company was also the primary beneficiary of RY-8 because its implicit variable interest in that entity, which was considered a de facto related party, indirectly received the variability of the entity through absorption of RY-8’s expected losses, and therefore the Company also consolidated RY-8. Since RY-8’s $24.5 million line of credit became fully extended in 2007, the Company had made interest payments, paid line of credit renewal fees and made capital expenditures for additional restaurant development on behalf of RY-8. The Company was obligated to provide financing, either through OSI’s guarantee with a third-party institution or loans, for all required capital contributions and interest payments. Therefore, any additional RY-8 capital requirements in connection with the joint venture were likely to be the Company’s responsibility. RY-8’s line of
BLOOMIN’ BRANDS, INC.
NOTES TO CONSOLIDATED FINANCIAL STATEMENTS—(Continued)
credit was set to expire on April 15, 2013. The Company classified OSI’s $24.5 million contingent obligation as guaranteed debt at December 31, 2011 and the portion of income or loss attributable to RY-8 was eliminated in Net income attributable to noncontrolling interests in the Consolidated Statements of Operations and Comprehensive Income for the years ended December 31, 2012, 2011 and 2010. All material intercompany balances and transactions have been eliminated.
Effective October 1, 2012, the Company purchased the remaining interests in the Roy’s joint venture from RY-8 for $27.4 million (see Note 3). Subsequent to the purchase, Roy’s is a wholly-owned subsidiary of the Company and RY-8 is no longer a variable interest entity.
Paradise Restaurant Group, LLC
In September 2009, the Company sold its Cheeseburger in Paradise concept, which included 34 restaurants, for $2.0 million to Paradise Restaurant Group, LLC (“PRG”), an entity formed and controlled by the president of the concept. Based on the terms of the purchase and sale agreement, the Company determined at that time that it was the primary beneficiary and continued to consolidate PRG after the sale transaction. Upon adoption of new accounting guidance for variable interest entities on January 1, 2010, the Company determined that it was no longer the primary beneficiary of PRG and deconsolidated PRG on January 1, 2010. At the time of sale, the Company received a promissory note for the full sale price, which subsequently became fully reserved upon deconsolidation. In the fourth quarter of 2012, the Company recorded a gain of $3.5 million for the collection of the promissory note and other amounts due to the Company in connection with the sale of the Cheeseburger in Paradise concept. The gain was recorded in General and administrative expenses in the Consolidated Statement of Operations and Comprehensive Income for the year ended December 31, 2012.
14. Fair Value Measurements
Fair value is the price that would be received upon sale of an asset or paid upon transfer of a liability in an orderly transaction between market participants at the measurement date (exit price) and is a market-based measurement, not an entity-specific measurement. To measure fair value, the Company incorporates assumptions that market participants would use in pricing the asset or liability, and utilizes market data to the maximum extent possible. Measurement of fair value incorporates nonperformance risk (i.e., the risk that an obligation will not be fulfilled). In measuring fair value, the Company reflects the impact of its own credit risk on its liabilities, as well as any collateral. The Company also considers the credit standing of its counterparties in measuring the fair value of its assets.
Index to Financial Statements
BLOOMIN’ BRANDS, INC.
NOTES TO CONSOLIDATED FINANCIAL STATEMENTS—(Continued)
As a basis for considering market participant assumptions in fair value measurements, a three-tier fair value hierarchy prioritizes the inputs used in measuring fair value as follows:
Level 1—Observable inputs such as quoted prices (unadjusted) in active markets for identical assets or liabilities that the Company has the ability to access;
Level 2—Inputs, other than the quoted market prices included in Level 1, which are observable for the asset or liability, either directly or indirectly; and
Level 3—Unobservable inputs for the asset or liability, which are typically based on an entity’s own assumptions, as there is little, if any, related market data available.
In instances where the determination of the fair value measurement is based on inputs from different levels of the fair value hierarchy, the level in the fair value hierarchy within which the entire fair value measurement falls is based on the lowest level input that is significant to the fair value measurement in its
BLOOMIN’ BRANDS, INC.
NOTES TO CONSOLIDATED FINANCIAL STATEMENTS—(Continued)
entirety. The Company’s assessment of the significance of a particular input to the fair value measurement in its entirety requires judgment and considers factors specific to the asset or liability.
Fair Value Measurements on a Recurring Basis
The Company invested $37.7 million and $51.4 million of its excess cash in money market funds classified as Cash and cash equivalents or restricted cash in its Consolidated Balance Sheet as of December 31, 2011, and 2010, at a net value of 1:1 for each dollar invested. The fair value of the investment in the money market funds is determined by using quoted prices for identical assets in an active market. As a result, the Company has determined that the inputs used to value this investment fall within Level 1 of the fair value hierarchy. The amount of excess cash invested in money market funds at December 31, 2012 was immaterial to the Company’s consolidated financial statements.
The Company is highly leveraged and exposed toIn connection with the 2012 CMBS Loan, New PRP entered into an interest rate riskcap with a notional amount of $48.7 million as a method to limit the extentvolatility of its variable-rate debt. Thethe floating rate component of the first mortgage loan. Additionally, the Company usesused an interest rate cap with a notional amount of $775.7 million as a method to limit the volatility of PRP’s variable-rate commercial mortgage-backed securities loan. As thisCMBS Loan, which was terminated in June 2012 (see Note 15). The interest rate cap did not have anycaps had nominal fair market value at December 31, 2012 or 2011, respectively, and 2010, it has beentherefore were excluded from the applicable tables within this footnote.
The following tables presenttable presents the Company’s money market funds measured at fair value on a recurring basis as of December 31, 2011 and 2010, aggregated by the level in the fair value hierarchy within which those measurements fall (in thousands):
| Total December 31, 2011 | Level 1 | Level 2 | Level 3 | |||||||||||||
Assets: | ||||||||||||||||
Money market funds | $ | 37,707 | $ | 37,707 | $ | — | $ | — | ||||||||
| Total December 31, 2010 | Level 1 | Level 2 | Level 3 | |||||||||||||
Assets: | ||||||||||||||||
Money market funds | $ | 51,441 | $ | 51,441 | $ | — | $ | — | ||||||||
Fair Value Measurements on a Nonrecurring Basis
The Company performs its annual goodwill and other indefinite-lived intangible assets impairment test during the second quarter. During the year ended December 31, 2011, the Company did not have any goodwill
Index to Financial Statements
BLOOMIN’ BRANDS, INC.
NOTES TO CONSOLIDATED FINANCIAL STATEMENTS—(Continued)
and other indefinite-lived intangible asset impairment charges, but it did incur impairment charges on long-lived assets held and used as a result of fair value measurements on a nonrecurring basis.
The following table presents losses related to the Company’s assets and liabilities that were measured at fair value on a nonrecurring basis during the year ended December 31, 2011, aggregated by the level in the fair value hierarchy within which those measurements fall (in thousands):
| Year Ended December 31, 2011 | Level 1 | Level 2 | Level 3 | Total Losses | ||||||||||||||||
Long-lived assets held and used | $ | 30,840 | $ | 29,455 | $ | — | $ | 1,385 | $ | 11,593 | ||||||||||
Total | Level 1 | Level 2 | Level 3 | |||||||||||||
Assets: | ||||||||||||||||
Money market funds - cash equivalents | $ | 30,208 | $ | 30,208 | $ | — | $ | — | ||||||||
Money market funds - restricted cash | 7,499 | 7,499 | — | — | ||||||||||||
|
|
|
|
|
|
|
| |||||||||
Total recurring fair value measurements | $ | 37,707 | $ | 37,707 | $ | — | $ | — | ||||||||
|
|
|
|
|
|
|
| |||||||||
Fair Value Measurements on a Nonrecurring Basis
The Company periodically evaluates long-lived assets held for use whenever events or changes in circumstances indicate that the carrying amount of those assets may not be recoverable. The Company analyzes historical and expected future cash flows of operating locations as well as lease terms, condition of the assets and related need for repairs and maintenance. Impairment loss is recognized to the extent that the fair value of the assets is less than the carrying value.
The following tables present losses related to the Company’s assets and liabilities that were measured at fair value on a nonrecurring basis during the years ended December 31, 2012 and 2011, aggregated by the level in the fair value hierarchy within which those measurements fall (in thousands):
Year Ended | Level 1 | Level 2 | Level 3 | Total | ||||||||||||||||
Long-lived assets held and used | $ | 6,178 | $ | — | $ | 3,585 | $ | 2,593 | $ | 10,584 | ||||||||||
Year Ended | Level 1 | Level 2 | Level 3 | Total | ||||||||||||||||
Long-lived assets held and used | $ | 30,840 | $ | 29,455 | $ | — | $ | 1,385 | $ | 11,593 | ||||||||||
BLOOMIN’ BRANDS, INC.
NOTES TO CONSOLIDATED FINANCIAL STATEMENTS—(Continued)
The Company recorded $10.6 million, $11.6 million and $2.2 million of impairment charges as a result of the fair value measurement on a nonrecurring basis of its long-lived assets held and used during the yearyears ended December 31, 2011.2012, 2011 and 2010, respectively, primarily related to certain specifically identified restaurant locations that have, or are scheduled to be, closed, relocated or renovated or are under-performing. The impaired long-lived assets had $6.2 million and $30.8 million of remaining fair value at December 31, 2011. 2012 and 2011, respectively. Restaurant closure and related expenses of $2.4 million, $2.4 million and $3.0 million were recognized for the years ended December 31, 2012, 2011 and 2010, respectively. Impairment losses for long-lived assets held and used and restaurant closure and related expenses were recognized in Provision for impaired assets and restaurant closings in the Consolidated Statement of Operations and Comprehensive Income.
The Company used a discounted cash flow model (Level 3) and quoted prices from brokers (Level 1), third-party market appraisals (Level 2) and discounted cash flow models (Level 3) to estimate the fair value of the long-lived assets included in the tabletables above. DiscountProjected future cash flows, including discount rate and growth rate assumptions, are derived from current economic conditions, expectations of management and projected trends of current operating results.
During the year ended December 31, 2010, the Company did not incur any goodwill and other indefinite-lived intangible asset impairment charges or any other material impairment charges as a result of fair value measurements on a nonrecurring basis.
During the year ended December 31, 2009, the Company incurred goodwill and other indefinite-lived intangible asset impairment charges as well as other impairment charges as a result of fair value measurements on a nonrecurring basis. The following table presents losses related to the Company’s assets and liabilities that were measured at fair value on a nonrecurring basis during the year ended December 31, 2009 aggregated by the level in the fair value hierarchy within which those measurements fall (in thousands):
| Year Ended December 31, 2009 | Level 1 | Level 2 | Level 3 | Total Losses | ||||||||||||||||
Long-lived assets held and used | $ | 9,277 | $ | — | $ | 3,500 | $ | 5,777 | $ | 91,388 | ||||||||||
Investments in and advances to unconsolidated affiliates | — | — | — | — | 2,876 | |||||||||||||||
Goodwill(1) | 124,440 | — | — | 124,440 | 58,149 | |||||||||||||||
Indefinite-lived intangible assets(1) | 356,000 | — | — | 356,000 | 36,000 | |||||||||||||||
Index to Financial Statements
BLOOMIN’ BRANDS, INC.
NOTES TO CONSOLIDATED FINANCIAL STATEMENTS—(Continued)
The Company recorded $91.4 million of impairment charges as a result of the fair value measurement on a nonrecurring basis of its long-lived assets held and used during the year ended December 31, 2009. The impaired long-lived assets had $9.3 million of remaining fair value at December 31, 2009.
The Company performed a separate valuation for five of its closed restaurant sites that collateralize PRP’s commercial mortgage-backed securities loan using quoted prices from brokers for similar properties. The restaurant sites were written down to fair value resulting in impairment charges of $7.3 million (included in the total above) during the year ended December 31, 2009. The Company determined that the majority of these inputs are observable inputs that fall within Level 2 of the fair value hierarchy.
Due to the third quarter of 2009 sale of its Cheeseburger in Paradise concept, the Company recorded a $46.0 million impairment charge (included in the total above) during the second quarter of 2009 to reduce the carrying value of this concept’s long-lived assets to their estimated fair market value. The Company used a weighted-average probability analysis and estimates of expected future cash flows to determine the fair value of this concept. The Company has determined that the majority of the inputs used to value this concept are unobservable inputs that fall within Level 3 of the fair value hierarchy.
The Company used a discounted cash flow model to estimate the fair value of the remaining long-lived assets held and used in the table above. Discount rate and growth rate assumptions are derived from current economic conditions, expectations of management and projected trends of current operating results. The Company has determined that the majority of these inputs are unobservable inputs that fall within Level 3 of the fair value hierarchy. The long-lived assets were written down to fair value, resulting in impairment charges of $38.1 million (included in the total above) during the year ended December 31, 2009.
The Company recorded goodwill impairment charges of $58.1 million and indefinite-lived intangible asset impairment charges of $36.0 million during the year ended December 31, 2009 as a result of its annual impairment test. The Company tests both its goodwill and its indefinite-lived intangible assets, which are trade names, for impairment by utilizing discounted cash flow models to estimate their fair values. These cash flow models involve several assumptions. Changes in the Company’s assumptions could materially impact its fair value estimates. Assumptions critical to its fair value estimates are: (i) weighted-average cost of capital rates used to derive the present value factors used in determining the fair value of the reporting units and trade names; (ii) projected annual revenue growth rates used in the reporting unit and trade name models; and (iii) projected long-term growth rates used in the derivation of terminal year values. Other assumptions include estimates of projected capital expenditures and working capital requirements. These and other assumptions are impacted by economic conditions and expectations of management and will change in the future based on period-specific facts and circumstances. As a result, the Company has determined that the majority of the inputs used to value its goodwilllong-lived assets held and indefinite-lived intangible assetsused are unobservable inputs that fall within Level 3 of the fair value hierarchy.
The following table presents quantitative information related to the range of assumptionsunobservable inputs used in the Company’s Level 3 fair value measurements for the impairment loss incurred in the year ended December 31, 2012:
Unobservable Input | Range | |
Weighted-average cost of capital (1) | 9.5% - 11.2% | |
Long-term growth rates | 3.0% | |
Annual revenue growth rates (2) | (8.7)% - 4.3% |
| (1) | Weighted average of the costs of capital unobservable input range for the year ended December 31, 2012 was 10.8%. |
| (2) | Weighted average of the annual revenue growth rate unobservable input range for the year ended December 31, 2012 was 2.6%. |
During the years ended December 31, 2012, 2011 and 2010 the Company used to derive itsdid not incur any goodwill and other indefinite-lived intangible asset impairment charges as a result of fair value estimates among its reporting units, which vary between goodwill and trade names, during the annual impairment test conductedmeasurements on a nonrecurring basis.
Fair Value of Financial Instruments
Disclosure of fair value information about financial instruments, whether or not recognized in the second quarterConsolidated Balance Sheets, is required for those instruments for which it is practical to estimate that value. Fair value is a market-based measurement.
The Company’s non-derivative financial instruments at December 31, 2012 and 2011 consist of 2009:cash equivalents, restricted cash, accounts receivable, accounts payable and current and long-term debt. The fair values of cash equivalents, restricted cash, accounts receivable and accounts payable approximate their carrying amounts reported in the Consolidated Balance Sheets due to their short duration.
The fair value of OSI’s senior secured term loan B facility is determined based on quoted market prices in inactive markets. The fair value of New PRP’s commercial mortgage-backed securities is based on assumptions derived from current conditions in the real estate and credit environments, changes in the underlying
| Assumptions | ||||
| Goodwill | Trade Names | |||
Weighted-average cost of capital | 12.5% - 15.0% | 13.0% - 14.0% | ||
Long-term growth rates | 3% | 3% | ||
Annual revenue growth rates | (6.9)% - 12.0% | (3.9)% - 5.0% | ||
Index to Financial Statements
BLOOMIN’ BRANDS, INC.
NOTES TO CONSOLIDATED FINANCIAL STATEMENTS—(Continued)
collateral and expectations of management. Fair value estimates for other notes payable are derived using a discounted cash flow approach. Discounted cash flow inputs primarily include cost of debt rates which are used to derive the present value factors for the determination of fair value. These inputs represent assumptions impacted by economic conditions and management expectations and may change in the future based on period-specific facts and circumstances.
The following table includes the carrying value and fair value of the Company’s financial instruments at December 31, 2012 aggregated by the level in the fair value hierarchy in which those measurements fall (in thousands):
| December 31, 2012 | ||||||||||||||||
| Carrying Value | Fair Value | |||||||||||||||
| Level 1 | Level 2 | Level 3 | ||||||||||||||
Senior secured term loan B facility (1) | $ | 1,000,000 | $ | — | $ | 1,010,000 | $ | — | ||||||||
Mortgage loan (2) | 319,574 | — | — | 334,678 | ||||||||||||
First mezzanine loan (2) | 87,048 | — | — | 90,371 | ||||||||||||
Second mezzanine loan (2) | 87,273 | — | — | 91,423 | ||||||||||||
Other notes payable (1) | 9,848 | — | — | 9,230 | ||||||||||||
| (1) | Represents obligations of OSI. |
| (2) | Represents obligations of New PRP. |
The carrying amounts of PRP’s commercial mortgage-backed securities loan and OSI’s Other notes payable and Guaranteed debt approximated fair value at December 31, 2011. The fair value of OSI’s senior secured credit facilities and senior notes was determined based on quoted market prices in inactive markets. The following table includes the carrying value and fair value of OSI’s senior secured credit facilities and senior notes at December 31, 2011 (in thousands):
| December 31, 2011 | ||||||||
| Carrying Value | Fair Value | |||||||
Senior secured term loan facility | $ | 1,014,400 | $ | 953,536 | ||||
Senior secured pre-funded revolving credit facility | 33,000 | 31,020 | ||||||
Senior notes | 248,075 | 254,277 | ||||||
5.15. Derivative Instruments and Hedging Activities
The Company is exposed to market risk from changes in interest rates on debt, changes in commodity prices and changes in foreign currency exchange rates.
Interest rate changes associated with the Company’s variable-rate debt generally impact its earnings and cash flows, assuming other factors are held constant. The Company’s current exposure to interest rate fluctuations includes OSI’s borrowings under its senior secured credit facilitiesNew Facilities and the floating rate component of the first mortgage loan in New PRP’s commercial mortgage-backed securities loan2012 CMBS Loan that bear interest at floating rates based on the Eurocurrency Rate or the Base Rate and the one-month London Interbank Offered Rate (“LIBOR”),LIBOR, respectively, plus an applicable borrowing margin (see Note 11). The Company manages its interest rate risk by offsetting some of its variable-rate debt with fixed-rate debt, through normal operating and financing activities and, when deemed appropriate, through the use of derivative financial instruments.
The Company uses
BLOOMIN’ BRANDS, INC.
NOTES TO CONSOLIDATED FINANCIAL STATEMENTS—(Continued)
In connection with the 2012 CMBS Loan, New PRP entered into an interest rate cap (the “Rate Cap”) with a notional amount of $48.7 million as a method to limit the volatility of PRP’s variable-rate commercial mortgage-backed securitiesthe floating rate component of the first mortgage loan. Under the $775.7 million notional interest rate cap that terminates on June 15, 2012, interest rate payments have a ceiling of 6.31%. IfRate Cap, if the 30-day LIBOR market rate exceeds the ceiling,7.00% per annum, the counterparty must pay the Company an amount sufficient to reduceNew PRP such excess on the interest payment to 6.31%. The interest rate cap did not have any fair market value at December 31, 2011 and 2010. In connection with the refinancing of PRP’s commercial mortgage-backed securities loan, the Company entered into a replacement interest rate cap effective March 27, 2012 with a notional amount of $48.7 million, a capthe floating rate of 7.00% and a termination date of April 13, 2014.component. If necessary, the Company would record mark-to-market changes in the fair value of this derivative instrument in earnings in the period of change. The effectsRate Cap has a term of thisapproximately two years from the closing of the 2012 CMBS Loan. Upon the expiration or termination of the Rate Cap or the downgrade of the credit ratings of the counterparty under the Rate Cap’s specified thresholds, New PRP is required to replace the Rate Cap with a replacement interest rate cap in a notional amount equal to the outstanding principal balance (if any) of the floating rate component. The Rate Cap had nominal fair market value at December 31, 2012. Previously, the Company used an interest rate cap as a method to limit the volatility of PRP’s variable-rate CMBS Loan. Under the $775.7 million notional interest rate cap that terminated on June 15, 2012, interest rate payments had a ceiling of 6.31%. If the market rate exceeded the ceiling, the counterparty had to pay the Company an amount sufficient to reduce the interest payment to 6.31%. The interest rate cap had nominal fair market value at December 31, 2011. The effects of both of these interest rate caps were immaterial to the Company’s consolidated financial statements for all periods presented and have been excluded from any tables within this footnote.
From September 2007 to September 2010, the Company used an interest rate collar as part of its interest rate risk management strategy to manage its exposure to interest rate movements related to OSI’s senior secured credit facilities. Given the interest rate environment, the Company did not enter into another derivative financial instrument upon the maturity of this interest rate collar on September 30, 2010. The Company does not enter into financial instruments for trading or speculative purposes.
Many of the ingredients used in the products sold in the Company’s restaurants are commodities that are subject to unpredictable price volatility. Although the Company attempts to minimize the effect of price volatility by negotiating fixed price contracts for the supply of key ingredients, there are no established fixed price markets for certain commodities such as produce and wild fish, and the Company is subject to prevailing market conditions when purchasing those types of commodities. Other commodities are purchased based upon negotiated price ranges established with vendors with reference to the fluctuating market prices. The Company attempts to offset the impact of fluctuating commodity prices with other strategic purchasing initiatives. The Company does not use derivative financial instruments to manage its commodity price risk, except for natural gas as described below.
The Company’s restaurants are dependent upon energy to operate and are impacted by changes in energy prices, including natural gas. The Company utilizes derivative instruments to mitigate some of its overall exposure to material increases in natural gas prices. The Company records mark-to-market changes in the fair value of these derivative instruments in earnings in the period of change. The effects of these natural gas swaps were immaterial to the Company’s consolidated financial statements for all periods presented and have been excluded from any tables within this footnote.
Index to Financial Statements
BLOOMIN’ BRANDS, INC.
NOTES TO CONSOLIDATED FINANCIAL STATEMENTS—(Continued)
The Company’s exposure to foreign currency exchange fluctuations relates primarily to its direct investment in restaurants in South Korea, Hong Kong and Brazil and to its royalties from international franchisees. The Company has not used financial instruments to hedge foreign currency exchange rate changes.
In addition to the market risks identified above, the Company is subject to business risk as its U.S. beef supply is highly dependent upon a limited number of vendors. In 2011,2012, the Company purchased more than 90%75% of its domestic beef raw materials from four beef suppliers who represent approximately 75%85% of the total beef marketplace in the United States.U.S.
BLOOMIN’ BRANDS, INC.
NOTES TO CONSOLIDATED FINANCIAL STATEMENTS—(Continued)
Non-designated Hedges of Interest Rate Risk
In September 2007, the Company entered into an interest rate collar with a notional amount of $1.0 billion as a method to limit the variability of OSI’s senior secured credit facilities.2007 Credit Facilities. The collar consisted of a LIBOR cap of 5.75% and a LIBOR floor of 2.99%. The collar’s first variable-rate set date was December 31, 2007, and the option pairs expired at the end of each calendar quarter beginning March 31, 2008 and ending September 30, 2010, which was the maturity date of the collar. The quarterly expiration dates corresponded to the scheduled amortization payments of OSI’s term loan.loan then in effect. The Company expensed $19.9 million of interest for the year ended December 31, 2010 as a result of the quarterly expiration of the collar’s option pairs. The Company recorded mark-to-market changes in the fair value of the derivative instrument in earnings in the period of change. Net interest income of $18.5 million for the year ended December 31, 2010 was recorded in Interest expense, net in the Company’s Consolidated Statement of Operations and Comprehensive Income for the mark-to-market effects of this derivative instrument.
The Company’s interest rate collar was a non-designated hedge of the Company’s exposure to interest rate risk. The Company recorded mark-to-market changes in the fair value of the derivative instrument in earnings in the period of change.
The following table presents the location and effect of the Company’s interest rate collar on its Consolidated Statement of Operations and Comprehensive Income for the years ended December 31, 2012, 2011 2010, and 20092010 (in thousands):
Derivatives Not Designated as Hedging Instruments | Location of Loss | Amount of Loss Recognized In Income on Derivative | Location of Loss | Amount of Loss Recognized In Income on Derivative | ||||||||||||||||||||||||
| Years Ended December 31, | Years Ended December 31, | |||||||||||||||||||||||||||
| 2011 | 2010 | 2009 | 2012 | 2011 | 2010 | |||||||||||||||||||||||
Interest rate collar | Interest expense, net | $ | — | $ | (1,436 | ) | $ | (15,568 | ) | Interest expense, net | $ | — | $ | — | $ | (1,436 | ) | |||||||||||
6. Other Current Assets, Net16. Income Taxes
Other current assets, net, consistedThe following table presents the domestic and foreign components of the followingincome before provision for income taxes (in thousands):
| December 31, | ||||||||
| 2011 | 2010 | |||||||
Prepaid expenses | $ | 18,113 | $ | 17,495 | ||||
Accounts receivable—vendors, net | 48,568 | 13,432 | ||||||
Accounts receivable—franchisees, net | 2,396 | 6,137 | ||||||
Accounts receivable—other, net | 11,869 | 10,109 | ||||||
Other current assets, net | 23,427 | 24,647 | ||||||
|
|
|
| |||||
| $ | 104,373 | $ | 71,820 | |||||
|
|
|
| |||||
| Years Ended December 31, | ||||||||||||
| 2012 | 2011 | 2010 | ||||||||||
Domestic | $ | 43,744 | $ | 105,620 | $ | 58,346 | ||||||
Foreign | 29,666 | 25,275 | 22,130 | |||||||||
|
|
|
|
|
| |||||||
| $ | 73,410 | $ | 130,895 | $ | 80,476 | |||||||
|
|
|
|
|
| |||||||
Index to Financial Statements
BLOOMIN’ BRANDS, INC.
NOTES TO CONSOLIDATED FINANCIAL STATEMENTS—(Continued)
7. Property, Fixtures and Equipment, Net
Property, fixtures and equipment, net, consisted of the following (in thousands):
| December 31, | ||||||||
| 2011 | 2010 | |||||||
Land | $ | 329,143 | $ | 333,599 | ||||
Buildings and building improvements | 1,013,618 | 1,005,466 | ||||||
Furniture and fixtures | 263,266 | 232,255 | ||||||
Equipment | 362,649 | 336,175 | ||||||
Leasehold improvements | 369,726 | 365,970 | ||||||
Construction in progress | 22,011 | 5,459 | ||||||
Less: accumulated depreciation | (724,515 | ) | (605,643 | ) | ||||
|
|
|
| |||||
| $ | 1,635,898 | $ | 1,673,281 | |||||
|
|
|
| |||||
As of December 31, 2011, the Company had certain land and buildings, with carrying amounts of $14.1 million and $20.3 million, respectively, that have been leased to third parties under operating leases. Accumulated depreciation related to these leased assets of $3.4 million is included in Property, fixtures and equipment at December 31, 2011.
The Company expensed repair and maintenance costs of approximately $97.3 million, $94.3 million and $93.8 million for the years ended December 31, 2011, 2010 and 2009, respectively. Depreciation expense for the years ended December 31, 2011, 2010 and 2009 was $147.4 million, $150.4 million and $180.2 million, respectively.
During the years ended December 31, 2011 and 2010 and 2009, the Company recorded property, fixtures and equipment impairment charges of $11.5 million, $2.0 million and $82.9 million, respectively, for certain of the Company’s restaurants in the line item “Provision for impaired assets and restaurant closings” in its Consolidated Statements of Operations (see Note 4).
Due to the third quarter of 2009 sale of the Company’s Cheeseburger in Paradise concept, the Company recorded a $46.0 million impairment charge ($39.2 million of which is included in the 2009 total above) during the second quarter of 2009 to reduce the carrying value of this concept’s long-lived assets to their estimated fair market value. This impairment included $39.2 million of charges to property, fixtures and equipment, $5.9 million of charges to intangible assets and $0.9 million of charges to other assets.
The fixed asset impairment charges described above primarily occurred as a result of the carrying value of a restaurant’s assets exceeding its estimated fair market value, primarily due to anticipated closures or declining future cash flows from lower projected future sales at existing locations.
Index to Financial Statements
BLOOMIN’ BRANDS, INC.
NOTES TO CONSOLIDATED FINANCIAL STATEMENTS—(Continued)
8. Goodwill and Intangible Assets, Net
The change in goodwill for the years ended December 31, 2011 and 2010 is as follows (in thousands):
| 2011 | 2010 | |||||||
Balance as of January 1: | ||||||||
Goodwill | $ | 1,059,051 | $ | 1,059,051 | ||||
Accumulated purchase accounting adjustments | 3,604 | 3,604 | ||||||
Accumulated impairment losses | (784,636 | ) | (784,636 | ) | ||||
Cumulative translation adjustments | (8,118 | ) | (9,560 | ) | ||||
|
|
|
| |||||
| 269,901 | 268,459 | |||||||
Translation adjustments | (79 | ) | 1,442 | |||||
Disposal adjustment | (1,050 | ) | — | |||||
Balance as of December 31: | ||||||||
Goodwill | 1,059,051 | 1,059,051 | ||||||
Accumulated purchase accounting adjustments | 3,604 | 3,604 | ||||||
Accumulated impairment losses | (784,636 | ) | (784,636 | ) | ||||
Cumulative translation adjustments | (8,197 | ) | (8,118 | ) | ||||
Accumulated disposal adjustments | (1,050 | ) | — | |||||
|
|
|
| |||||
| $ | 268,772 | $ | 269,901 | |||||
|
|
|
| |||||
The Company performs its annual assessment for impairment of goodwill and other indefinite-lived intangible assets each year during the second quarter. The Company’s review of the recoverability of goodwill is based primarily upon an analysis of the discounted cash flows of the related reporting units as compared to their carrying values (see Note 4). The Company also uses the discounted cash flow method to determine the fair value of its intangible assets.
The Company did not record any goodwill or indefinite-lived intangible asset impairment charges or any material definite-lived intangible asset impairment charges during 2011 and 2010. In October 2011, the Company sold its nine Company-owned Outback Steakhouse restaurants in Japan to a subsidiary of S Foods, Inc., one of the Company’s beef supplier’s in Japan, for $9.4 million. The buyer will have the right for future development of Outback Steakhouse franchise restaurants in Japan and will pay the Company a royalty in the range of 2.75% to 4.0% based on sales volumes. The Company used the net cash proceeds from this sale to pay down $7.5 million of OSI’s outstanding term loans in accordance with the terms of the credit agreement amended in January 2010. The Company recorded a $1.1 million adjustment to reduce goodwill related to the disposal of these assets and recorded a loss of $4.3 million from this sale in General and administrative expenses in its Consolidated Statement of Operations for the year ended December 31, 2011.
Due to poor overall economic conditions, declining sales at Company-owned restaurants, reductions in the Company’s projected results for future periods and a challenging environment for the restaurant industry, the Company recorded a goodwill impairment loss of $58.1 million for the domestic Outback Steakhouse concept and impairment charges of $36.0 million for the domestic Outback Steakhouse and Carrabba’s Italian Grill trade names during the year ended December 31, 2009. The Company also recorded impairment charges of $7.7 million for other intangible assets for the year ended December 31, 2009.
Index to Financial Statements
BLOOMIN’ BRANDS, INC.
NOTES TO CONSOLIDATED FINANCIAL STATEMENTS—(Continued)
The accumulated purchase accounting adjustments to goodwill of $3.6 million were the result of adjustments to appraised fair values of acquired tangible assets.
Goodwill impairment charges are included in the line item “Goodwill impairment” and intangible asset impairment charges are included in the line item “Provision for impaired assets and restaurant closings” in the Company’s Consolidated Statements of Operations.
Intangible assets, net, consisted of the following (in thousands):
| Weighted Average Remaining Amortization Period (years) | December 31, | |||||||||||
| 2011 | 2010 | |||||||||||
Trade names (gross) | Indefinite | $ | 413,000 | $ | 413,000 | |||||||
|
|
|
| |||||||||
Trademarks (gross) | 19 | 87,531 | 87,531 | |||||||||
Less: accumulated amortization | (18,454 | ) | (14,392 | ) | ||||||||
|
|
|
| |||||||||
Net trademarks | 69,077 | 73,139 | ||||||||||
|
|
|
| |||||||||
Favorable leases (gross, lives ranging from 0.8 to 25 years) | 15 | 99,391 | 102,460 | |||||||||
Less: accumulated amortization | (34,752 | ) | (29,182 | ) | ||||||||
|
|
|
| |||||||||
Net favorable leases | 64,639 | 73,278 | ||||||||||
|
|
|
| |||||||||
Franchise agreements (gross) | 9 | 17,385 | 17,385 | |||||||||
Less: accumulated amortization | (6,073 | ) | (4,736 | ) | ||||||||
|
|
|
| |||||||||
Net franchise agreements | 11,312 | 12,649 | ||||||||||
|
|
|
| |||||||||
Other intangibles (gross) | 5 | 8,547 | — | |||||||||
Less: accumulated amortization | (427 | ) | — | |||||||||
|
|
|
| |||||||||
Net other intangibles | 8,120 | — | ||||||||||
|
|
|
| |||||||||
Intangible assets, less total accumulated amortization of $59,706 and $48,310 at December 31, 2011 and 2010, respectively | 16 | $ | 566,148 | $ | 572,066 | |||||||
|
|
|
| |||||||||
Definite-lived intangible assets are amortized on a straight-line basis. The aggregate expense related to the amortization of the Company’s trademarks, favorable leases, franchise agreements and other intangibles was $13.9 million, $14.0 million and $14.6 million for the years ended December 31, 2011, 2010 and 2009, respectively. Annual expense related to the amortization of intangible assets is anticipated to be approximately $14.4 million in 2012, $13.8 million in 2013, $13.2 million in 2014, $12.7 million in 2015 and $11.8 million in 2016.
In accordance with the terms of an asset purchase agreement that was amended in December 2004, the Company was obligated to pay a royalty to its Bonefish Grill founder and joint venture partner during his employment term with the Company. The Company had the option to terminate this royalty within 45 days of his termination of employment by making an aggregate payment equal to five times the amount of the royalty payable during the twelve full calendar months immediately preceding the month of his termination. As his employment terminated on October 1, 2011, the Company paid the approximately $8.5 million royalty termination fee in October 2011 and recorded this payment as an intangible asset in its Consolidated Balance Sheet in the fourth quarter of 2011. The intangible asset will be amortized over a five-year useful life.
Index to Financial Statements
BLOOMIN’ BRANDS, INC.
NOTES TO CONSOLIDATED FINANCIAL STATEMENTS—(Continued)
9. Other Assets, Net
Other assets, net, consisted of the following (in thousands):
| December 31, | ||||||||
| 2011 | 2010 | |||||||
Company-owned life insurance | $ | 51,955 | $ | 48,538 | ||||
Deferred financing fees, net of accumulated amortization of $66,275 and $54,052 at December 31, 2011 and 2010, respectively | 19,988 | 30,063 | ||||||
Liquor licenses | 25,545 | 25,387 | ||||||
Other assets | 38,677 | 42,082 | ||||||
|
|
|
| |||||
| $ | 136,165 | $ | 146,070 | |||||
|
|
|
| |||||
The Company amortizes deferred financing fees to interest expense over the terms of the respective financing arrangements using the effective interest method or the straight-line method, and it amortized $12.3 million, $13.4 million and $14.3 million for the years ended December 31, 2011, 2010 and 2009, respectively.
10. Accrued and Other Current Liabilities
Accrued and other current liabilities consisted of the following (in thousands):
| December 31, | ||||||||
| 2011 | 2010 | |||||||
Accrued payroll and other compensation | $ | 117,013 | $ | 109,443 | ||||
Accrued insurance | 19,284 | 20,541 | ||||||
Other | 75,189 | 64,447 | ||||||
|
|
|
| |||||
| $ | 211,486 | $ | 194,431 | |||||
|
|
|
| |||||
Index to Financial Statements
BLOOMIN’ BRANDS, INC.
NOTES TO CONSOLIDATED FINANCIAL STATEMENTS—(Continued)
11. Long-term Debt, net
Long-term debt, net consisted of the following (in thousands):
| December 31, | ||||||||
| 2011 | 2010 | |||||||
Senior secured term loan facility, interest rate of 2.63% at December 31, 2011 and 2010(1)(2) | $ | 1,014,400 | $ | 1,035,000 | ||||
Senior secured pre-funded revolving credit facility, interest rates of 2.63% and 2.56% at December 31, 2011 and 2010, respectively(2) | 33,000 | 78,072 | ||||||
Note payable, weighted average interest rates of 0.98% and 0.97% at December 31, 2011 and 2010, respectively(3) | 466,319 | 466,353 | ||||||
First mezzanine note, interest rates of 3.28% and 3.27% at December 31, 2011 and 2010, respectively(3) | 88,900 | 88,900 | ||||||
Second mezzanine note, interest rates of 3.53% and 3.52% at December 31, 2011 and 2010, respectively(3) | 123,190 | 123,190 | ||||||
Third mezzanine note, interest rates of 3.54% and 3.53% at December 31, 2011 and 2010, respectively(3) | 49,095 | 49,095 | ||||||
Fourth mezzanine note, interest rates of 4.53% and 4.52% at December 31, 2011 and 2010, respectively(3) | 48,113 | 48,113 | ||||||
Senior notes, interest rate of 10.00% at December 31, 2011 and 2010(2) | 248,075 | 248,075 | ||||||
Other notes payable, uncollateralized, interest rates ranging from 0.76% to 7.00% and from 1.07% to 7.00% at December 31, 2011 and 2010, respectively(2) | 9,094 | 7,628 | ||||||
Sale-leaseback obligations(2) | 2,375 | 2,375 | ||||||
Capital lease obligations(2) | 2,520 | 1,177 | ||||||
Guaranteed debt, interest rates of 2.65% and 2.75% at December 31, 2011 and 2010, respectively(2) | 24,500 | 24,500 | ||||||
|
|
|
| |||||
| 2,109,581 | 2,172,478 | |||||||
Less: current portion of long-term debt | (332,905 | ) | (95,284 | ) | ||||
Less: guaranteed debt | (24,500 | ) | (24,500 | ) | ||||
Less: debt discount | (291 | ) | (954 | ) | ||||
|
|
|
| |||||
Long-term debt, net | $ | 1,751,885 | $ | 2,051,740 | ||||
|
|
|
| |||||
Bloomin’ Brands, Inc. is a holding company and conducts its operations through its subsidiaries, certain of which have incurred their own indebtedness as described below.
On June 14, 2007, in connection with the Merger, OSI entered into senior secured credit facilities with a syndicate of institutional lenders and financial institutions. These senior secured credit facilities provide for senior secured financing of up to $1.6 billion, consisting of a $1.3 billion term loan facility, a $150.0 million working capital revolving credit facility, including letter of credit and swing-line loan sub-facilities, and a $100.0 million pre-funded revolving credit facility that provides financing for capital expenditures only.
The senior secured term loan facility matures June 14, 2014. At each rate adjustment, OSI has the option to select a Base Rate plus 125 basis points or a Eurocurrency Rate plus 225 basis points for the borrowings under
Index to Financial Statements
BLOOMIN’ BRANDS, INC.
NOTES TO CONSOLIDATED FINANCIAL STATEMENTS—(Continued)
this facility. The Base Rate option is the higher of the prime rate of Deutsche Bank AG New York Branch and the federal funds effective rate plus 0.5 of 1% (“Base Rate”) (3.25% at December 31, 2011 and 2010). The Eurocurrency Rate option is the 30, 60, 90 or 180-day Eurocurrency Rate (“Eurocurrency Rate”) (ranging from 0.38% to 0.88% and from 0.31% to 0.50% at December 31, 2011 and 2010, respectively). The Eurocurrency Rate may have a nine- or twelve-month interest period if agreed upon by the applicable lenders. With either the Base Rate or the Eurocurrency Rate, the interest rate is reduced by 25 basis points if the associated Moody’s Applicable Corporate Rating then most recently published is B1 or higher (the rating was Caa1 at December 31, 2011 and 2010).
OSI is required to prepay outstanding term loans, subject to certain exceptions, with:
50% of its “annual excess cash flow” (with step-downs to 25% and 0% based upon its rent-adjusted leverage ratio), as defined in the credit agreement and subject to certain exceptions;
100% of its “annual minimum free cash flow,” as defined in the credit agreement, not to exceed $75.0 million for each fiscal year, if its rent-adjusted leverage ratio exceeds a certain minimum threshold;
100% of the net proceeds of certain assets sales and insurance and condemnation events, subject to reinvestment rights and certain other exceptions; and
100% of the net proceeds of any debt incurred, excluding permitted debt issuances.
Additionally, OSI is required, on an annual basis, to first, repay outstanding loans under the pre-funded revolving credit facility and second, fund a capital expenditure account to the extent amounts on deposit are less than $100.0 million, in both cases with 100% of OSI’s “annual true cash flow,” as defined in the credit agreement. In accordance with these requirements, in April 2012, OSI is required to repay its pre-funded revolving credit facility outstanding loan balance of $33.0 million and fund $37.6 million to its capital expenditure account using its “annual true cash flow.” In April 2011, OSI repaid its pre-funded revolving credit facility outstanding loan balance of $78.1 million and funded $60.5 million to its capital expenditure account.
OSI’s senior secured credit facilities require scheduled quarterly payments on the term loans equal to 0.25% of the original principal amount of the term loans for the first six years and three quarters following June 14, 2007. These payments are reduced by the application of any prepayments, and any remaining balance will be paid at maturity. The outstanding balance on the term loans was $1.0 billion at December 31, 2011 and 2010. OSI has classified $13.1 million of its term loans as current at December 31, 2011 and 2010 due to its required quarterly payments and the results of its covenant calculations, which indicate the additional term loan prepayments, as described above, will not be required. In October 2011, the Company sold its nine Company-owned Outback Steakhouse restaurants in Japan to a subsidiary of S Foods, Inc. and used the net cash proceeds from this sale to pay down $7.5 million of OSI’s outstanding term loans in accordance with the terms of the OSI credit agreement amended in January 2010 (see Note 8).
Proceeds of loans and letters of credit under OSI’s $150.0 million working capital revolving credit facility, which matures June 14, 2013, provide financing for working capital and general corporate purposes and, subject to a rent-adjusted leverage condition, for capital expenditures for new restaurant growth. This revolving credit facility bears interest at rates ranging from 100 to 150 basis points over the Base Rate or 200 to 250 basis points over the Eurocurrency Rate. There were no loans outstanding under the revolving credit facility at December 31, 2011 and 2010; however, $67.6 million and $70.3 million, respectively, of the credit facility was
Index to Financial Statements
BLOOMIN’ BRANDS, INC.
NOTES TO CONSOLIDATED FINANCIAL STATEMENTS—(Continued)
not available for borrowing as: (i) $35.1 million and $36.5 million, respectively, of the credit facility was committed for the issuance of letters of credit as required by insurance companies that underwrite the Company’s workers’ compensation insurance and also, where required, for construction of new restaurants, (ii) $24.5 million of the credit facility was committed for the issuance of a letter of credit for OSI’s guarantee of an uncollateralized line of credit for its joint venture partner, RY-8, Inc. (“RY-8”), in the development of Roy’s restaurants, (iii) $6.0 million of the credit facility was committed for the issuance of a letter of credit to the insurance company that underwrites the Company’s bonds for liquor licenses, utilities, liens and construction and (iv) $2.0 million and $3.2 million, respectively, of the credit facility was committed for the issuance of other letters of credit. OSI’s total outstanding letters of credit issued under its working capital revolving credit facility may not exceed $75.0 million. Fees for the letters of credit range from 2.00% to 2.25% and the commitment fees for unused working capital revolving credit commitments range from 0.38% to 0.50%.
Proceeds of loans under OSI’s $100.0 million pre-funded revolving credit facility, which expires June 14, 2013, are available to provide financing for capital expenditures, if the capital expenditure account described above has a zero balance. As of December 31, 2011 and 2010, OSI had $33.0 million and $78.1 million, respectively, outstanding on its pre-funded revolving credit facility. These borrowings were recorded in “Current portion of long-term debt” in the Company’s Consolidated Balance Sheets, as OSI is required to repay any outstanding borrowings in April following each fiscal year using its “annual true cash flow,” as defined in the credit agreement. At each rate adjustment, OSI has the option to select the Base Rate plus 125 basis points or a Eurocurrency Rate plus 225 basis points for the borrowings under this facility. In either case, the interest rate is reduced by 25 basis points if the associated Moody’s Applicable Corporate Rating then most recently published is B1 or higher. Fees for the unused portion of the pre-funded revolving credit facility are 2.43%.
OSI’s senior secured credit facilities require it to comply with certain financial covenants, including a quarterly Total Leverage Ratio (“TLR”) test and an annual Minimum Free Cash Flow (“MFCF”) test. The TLR is the ratio of OSI’s Consolidated Total Debt to OSI’s Consolidated EBITDA (earnings before interest, taxes, depreciation and amortization and certain other adjustments as defined in the senior secured credit facilities) and may not exceed 6.00 to 1.00. On an annual basis, if the Rent Adjusted Leverage Ratio (“RALR”), as defined, is greater than or equal to 5.25 to 1.00, OSI’s MFCF cannot be less than $75.0 million. MFCF is calculated as OSI’s Consolidated EBITDA plus decreases in OSI’s Consolidated Working Capital less OSI’s Consolidated Interest Expense, OSI’s Capital Expenditures (except for that funded by OSI’s senior secured pre-funded revolving credit facility), increases in OSI’s Consolidated Working Capital and OSI’s cash paid for taxes. (All of the above capitalized terms are as defined in the credit agreement). The credit agreement governing OSI’s senior secured credit facilities, as amended on January 28, 2010, also includes negative covenants that, subject to significant exceptions, limit its ability and the ability of its restricted subsidiaries to: incur liens, make investments and loans, make capital expenditures (as described below), incur indebtedness or guarantees, engage in mergers, acquisitions and assets sales, declare dividends, make payments or redeem or repurchase equity interests, alter its business, engage in certain transactions with affiliates, enter into agreements limiting subsidiary distributions and prepay, redeem or purchase certain indebtedness. OSI’s senior secured credit facilities contain customary representations and warranties, affirmative covenants and events of default. At December 31, 2011 and 2010, OSI was in compliance with its debt covenants.
OSI’s capital expenditures are limited by the credit agreement. The annual capital expenditure limits range from $200.0 million to $250.0 million with various carry-forward and carry-back allowances. OSI’s annual expenditure limits may increase after an acquisition. However, if (i) the RALR at the end of a fiscal year is greater than 5.25 to 1.00, (ii) OSI’s “annual true cash flow” is insufficient to repay fully its pre-funded revolving credit facility and (iii) the capital expenditure account has a zero balance, its capital expenditures will be limited to $100.0 million for the succeeding fiscal year. This limitation will remain until there are no pre-funded
Index to Financial Statements
BLOOMIN’ BRANDS, INC.
NOTES TO CONSOLIDATED FINANCIAL STATEMENTS—(Continued)
revolving credit facility loans outstanding and the amount on deposit in the capital expenditures account is greater than zero or until the RALR is less than 5.25 to 1.00. In 2010, OSI’s capital expenditures were limited to $100.0 million as a result of the conditions described above. In 2011, OSI was not subject to this limitation and will not be subject to it in 2012.
The obligations under OSI’s senior secured credit facilities are guaranteed by each of its current and future domestic 100% owned restricted subsidiaries in its Outback Steakhouse and Carrabba’s Italian Grill concepts and certain non-restaurant subsidiaries (the “Guarantors”) and by OSI HoldCo, Inc. (“OSI HoldCo”), the Company’s indirect, wholly-owned subsidiary and OSI’s direct owner. Subject to the conditions described below, the obligations are secured by a perfected security interest in substantially all of OSI’s assets and the assets of the Guarantors and OSI HoldCo, in each case, now owned or later acquired, including a pledge of all of OSI’s capital stock, the capital stock of substantially all of OSI’s domestic wholly-owned subsidiaries and 65% of the capital stock of certain of OSI’s material foreign subsidiaries that are directly owned by OSI, OSI HoldCo, or a Guarantor. Also, OSI is required to provide additional guarantees of the senior secured credit facilities in the future from other domestic wholly-owned restricted subsidiaries if the Consolidated EBITDA attributable to OSI’s non-guarantor domestic wholly-owned restricted subsidiaries as a group exceeds 10% of OSI’s Consolidated EBITDA as determined on an OSI company-wide basis. If this occurs, guarantees would be required from additional domestic wholly-owned restricted subsidiaries in such number that would be sufficient to lower the aggregate Consolidated EBITDA of the non-guarantor domestic wholly-owned restricted subsidiaries as a group to an amount not in excess of 10% of the OSI company-wide Consolidated EBITDA.
On June 14, 2007, PRP entered into first mortgage and mezzanine loans (together, the commercial mortgage-backed securities loan, or the “CMBS Loan”) totaling $790.0 million. As part of the CMBS Loan, the lenders, German American Capital Corporation and Bank of America, N.A., have a security interest in PRP’s properties and related improvements located throughout the United States and direct and indirect equity interests in PRP.
The CMBS Loan comprised a note payable and four mezzanine notes. The CMBS Loan had a maturity date of June 9, 2011, subject to one additional one-year extension by PRP to a maximum maturity date of June 9, 2012. During 2011, PRP elected to exercise the one-year extension.
All notes bore interest at the one-month LIBOR which was 0.28% and 0.27% at December 31, 2011 and 2010, respectively, plus an applicable spread which ranged from 0.51% to 4.25%. Interest-only payments were made on the ninth calendar day of each month and interest accrues beginning on the fifteenth calendar day of the preceding month.
The CMBS Loan required PRP to comply with certain financial covenants, including a lease coverage ratio and a loan to value ratio as defined in the CMBS Loan agreement. The CMBS Loan also contained customary representations, warranties, affirmative covenants and events of default. Upon disposal of any location that collateralized the CMBS Loan, PRP was required to pay the portion of the CMBS Loan principal that related to each disposed location. During the years ended December 31, 2011 and 2010, PRP did not dispose of any locations and therefore did not pay any principal on the CMBS loan for disposed location.
Subsequent to December 31, 2011, PRP repaid its CMBS Loan and New Private Restaurant Properties, LLC (“New PRP”), the Company’s wholly-owned, indirect subsidiary, entered into a new commercial mortgage-backed securities loan (the “2012 CMBS Loan”). As a result of the 2012 CMBS Loan refinancing, the net amount repaid along with scheduled maturities within one year, $281.3 million, was classified as current at December 31, 2011 (see Note 20).
Index to Financial Statements
BLOOMIN’ BRANDS, INC.
NOTES TO CONSOLIDATED FINANCIAL STATEMENTS—(Continued)
On June 14, 2007, OSI issued senior notes in an original aggregate principal amount of $550.0 million under an indenture among OSI, as issuer, OSI Co-Issuer, Inc., as co-issuer (“Co-Issuer”), a third-party trustee and the Guarantors. The senior notes mature on June 15, 2015. Interest is payable semiannually in arrears, at 10% per annum, in cash on each June 15 and December 15. Interest payments to the holders of record of the senior notes occur on the immediately preceding June 1 and December 1. Interest is computed on the basis of a 360-day year consisting of twelve 30-day months. The principal balance of senior notes outstanding at December 31, 2011 and 2010 was $248.1 million.
The senior notes are guaranteed on a senior unsecured basis by each restricted subsidiary that guarantees the senior secured credit facility. Under the terms of the indenture, the restricted subsidiaries shall be automatically and unconditionally released and discharged as guarantors of the senior notes if: (i) the subsidiary is sold or sells all of its fixed assets; (ii) the subsidiary is declared “unrestricted” for covenant purposes; (iii) the subsidiary’s guarantee of other indebtedness is terminated or released; or (iv) the requirement for legal defeasance or covenant defeasance or to discharge the indenture have been satisfied.
The senior notes are general, unsecured senior obligations of OSI, Co-Issuer and the Guarantors and are equal in right of payment to all existing and future senior indebtedness, including the senior secured credit facility. The senior notes are effectively subordinated to all of OSI’s, Co-Issuer’s and the Guarantors’ secured indebtedness, including the senior secured credit facility, to the extent of the value of the assets securing such indebtedness. The senior notes are senior in right of payment to all of OSI’s, Co-Issuer’s and the Guarantors’ existing and future subordinated indebtedness.
The indenture governing the senior notes limits, under certain circumstances, OSI’s ability and the ability of Co-Issuer and OSI’s restricted subsidiaries to: incur liens, make investments and loans, incur indebtedness or guarantees, engage in mergers, acquisitions and assets sales, declare dividends, make payments or redeem or repurchase equity interests, alter its business, engage in certain transactions with affiliates, enter into agreements limiting subsidiary distributions and prepay, redeem or purchase certain indebtedness.
In accordance with the terms of the senior notes and the senior secured credit facility, OSI’s restricted subsidiaries are also subject to restrictive covenants. Under certain circumstances, OSI is permitted to designate subsidiaries as unrestricted subsidiaries, which would cause them not to be subject to the restrictive covenants of the indenture or the credit agreement. As of December 31, 2011 and 2010, all but one of OSI’s consolidated subsidiaries were restricted subsidiaries, as a subsidiary that operated six restaurants in Canada was designated as an unrestricted subsidiary in April 2009.
Additional senior notes may be issued under the indenture from time to time, subject to certain limitations. Initial and additional senior notes issued under the indenture will be treated as a single class for all purposes under the indenture, including waivers, amendments, redemptions and offers to purchase.
OSI may redeem some or all of the senior notes at the redemption prices (expressed as percentages of principal amount of the senior notes to be redeemed) listed below, plus accrued and unpaid interest thereon and additional interest, if any, to the applicable redemption date. The redemption prices are effective for a twelve-month period beginning on June 15 of each of the years indicated below.
After June 15th | Percentage | |||
2011 | 105.0 | % | ||
2012 | 102.5 | % | ||
2013 and thereafter | 100.0 | % | ||
Index to Financial Statements
BLOOMIN’ BRANDS, INC.
NOTES TO CONSOLIDATED FINANCIAL STATEMENTS—(Continued)
Upon a change in control as defined in the indenture, OSI would be required to make an offer to purchase all of the senior notes at a price in cash equal to 101% of the aggregate principal amount thereof plus accrued interest and unpaid interest and additional interest, if any, to the date of purchase.
During the first quarter of 2009, OSI purchased $240.1 million in aggregate principal amount of its senior notes in a cash tender offer. OSI paid $73.0 million for the senior notes purchased and $6.7 million of accrued interest. The Company recorded a gain from the extinguishment of debt of $158.1 million in the line item “Gain on extinguishment of debt” in its Consolidated Statement of Operations for the year ended December 31, 2009. The gain was reduced by $6.1 million for the pro rata portion of unamortized deferred financing fees that related to the extinguished senior notes and by $3.0 million for fees related to the tender offer. The purpose of the tender offer was to reduce the principal amount of debt outstanding, reduce the related debt service obligations and improve OSI’s financial covenant position under its senior secured credit facilities.
As of December 31, 2011 and 2010, OSI had approximately $9.1 million and $7.6 million, respectively, of notes payable at interest rates ranging from 0.76% to 7.00% and from 1.07% to 7.00%, respectively. These notes have been primarily issued for buyouts of managing and area operating partner interests in the cash flows of their restaurants and generally are payable over a period of two through five years.
Debt Guarantees
OSI is the guarantor of an uncollateralized line of credit that permits borrowing of up to a maximum of $24.5 million for its joint venture partner, RY-8, in the development of Roy’s restaurants. The line of credit originally expired in December 2004 and was amended for a fourth time on April 1, 2009 to a revised termination date of April 15, 2013. According to the terms of the credit agreement, RY-8 may borrow, repay, re-borrow or prepay advances at any time before the termination date of the agreement. On the termination date of the agreement, the entire outstanding principal amount of the loan then outstanding and any accrued interest is due. At December 31, 2011 and 2010, the outstanding balance on the line of credit was $24.5 million.
RY-8’s obligations under the line of credit are unconditionally guaranteed by OSI and Roy’s Holdings, Inc. (“RHI”). If an event of default occurs, as defined in the agreement, the total outstanding balance, including any accrued interest, is immediately due from the guarantors. At December 31, 2011 and 2010, $24.5 million of OSI’s $150.0 million working capital revolving credit facility was committed for the issuance of a letter of credit for this guarantee.
If an event of default occurs and RY-8 is unable to pay the outstanding balance owed, OSI would, as one of the two guarantors, be liable for this balance. However, in conjunction with the credit agreement, RY-8 and RHI have entered into an Indemnity Agreement and a Pledge of Interest and Security Agreement in OSI’s favor. These agreements provide that if OSI is required to perform under its obligation as guarantor pursuant to the credit agreement, then RY-8 and RHI will indemnify OSI against all losses, claims, damages or liabilities which arise out of or are based upon its guarantee of the credit agreement. RY-8’s and RHI’s obligations under these agreements are collateralized by a first priority lien upon and a continuing security interest in any and all of RY-8’s interests in the joint venture.
Index to Financial Statements
BLOOMIN’ BRANDS, INC.
NOTES TO CONSOLIDATED FINANCIAL STATEMENTS—(Continued)
The aggregate mandatory principal payments of total consolidated debt outstanding at December 31, 2011 (excluding guaranteed debt), for the next five years, are summarized as follows (in thousands):
2012 | $ | 332,905 | ||
2013 | 87,695 | |||
2014 | 937,662 | |||
2015 | 259,300 | |||
2016 | 11,446 | |||
Thereafter | 455,782 | |||
|
| |||
Total | $ | 2,084,790 | ||
|
|
The following table includes the maturity of the Company’s debt and debt guarantees (in thousands):
| Total | Payable During 2012 | Payable During 2013-2016 | Payable After 2016 | |||||||||||||
Debt | $ | 2,084,790 | $ | 332,905 | $ | 1,296,103 | $ | 455,782 | ||||||||
Debt guarantees: | ||||||||||||||||
Maximum availability of debt guarantees | $ | 25,957 | $ | — | $ | 24,500 | $ | 1,457 | ||||||||
Amount outstanding under debt guarantees | 25,957 | — | 24,500 | 1,457 | ||||||||||||
Carrying amount of liabilities | 24,500 | — | 24,500 | — | ||||||||||||
12. Other Long-term Liabilities, Net
Other long-term liabilities, net, consisted of the following (in thousands):
| December 31, | ||||||||
| 2011 | 2010 | |||||||
Accrued insurance liability | $ | 39,575 | $ | 40,181 | ||||
Unfavorable leases, net of accumulated amortization of $18,891 and $15,034 at December 31, 2011 and 2010, respectively | 62,012 | 66,660 | ||||||
PEP obligation | 77,642 | 65,880 | ||||||
Supplemental PEP obligation | 16,235 | 20,055 | ||||||
Other liabilities | 23,288 | 23,786 | ||||||
|
|
|
| |||||
| $ | 218,752 | $ | 216,562 | |||||
|
|
|
| |||||
The Company maintains endorsement split dollar insurance policies with a death benefit ranging from $5.0 million to $10.0 million for certain of its current and former executive officers. The Company is the beneficiary of the policies to the extent of premiums paid or the cash value, whichever is greater, with the balance being paid to personal beneficiaries designated by the executive officers. The Company has agreed not to terminate the policies regardless of continued employment except that the Company may terminate one executive officer’s policy prior to his completion of seven years of employment with the Company commencing January 1, 2006. As of December 31, 2011 and 2010, the Company has $13.4 million and $12.4 million recorded in Other long-term liabilities for the endorsement split dollar insurance policies.
Index to Financial Statements
BLOOMIN’ BRANDS, INC.
NOTES TO CONSOLIDATED FINANCIAL STATEMENTS—(Continued)
13. Comprehensive Income (Loss) and Foreign Currency Translation and Transactions
Comprehensive income (loss) includes net income (loss) and foreign currency translation adjustments. Total comprehensive income (loss) for the years ended December 31, 2011, 2010 and 2009 was $106.5 million, $63.7 million and ($54.6) million, respectively, which included the effect of (losses) and gains from translation adjustments of approximately ($2.7) million, $4.6 million and $10.3 million, respectively.
Accumulated other comprehensive loss contained only foreign currency translation adjustments as of December 31, 2011 and 2010.
Foreign currency transaction gains and losses are recorded in “Other income (expense), net” in the Company’s Consolidated Statements of Operations and was a net gain (loss) of $0.8 million, $3.0 million and $(0.2) million for the years ended December 31, 2011, 2010 and 2009, respectively.
14. Income Taxes
The following table presents the domestic and foreign components of income (loss) before provision (benefit) for income taxes (in thousands):
| Years Ended December 31, | ||||||||||||
| 2011 | 2010 | 2009 | ||||||||||
Domestic | $ | 105,620 | $ | 58,346 | $ | (80,202 | ) | |||||
Foreign | 25,275 | 22,130 | 12,897 | |||||||||
|
|
|
|
|
| |||||||
| $ | 130,895 | $ | 80,476 | $ | (67,305 | ) | ||||||
|
|
|
|
|
| |||||||
Provision (benefit) for income taxes consisted of the following (in thousands):
| Years Ended December 31, | ||||||||||||
| 2011 | 2010 | 2009 | ||||||||||
Current provision (benefit): | ||||||||||||
Federal | $ | 382 | $ | (4,324 | ) | $ | (75 | ) | ||||
State | 10,556 | 12,430 | 6,794 | |||||||||
Foreign | 10,953 | 8,012 | 6,858 | |||||||||
|
|
|
|
|
| |||||||
| 21,891 | 16,118 | 13,577 | ||||||||||
|
|
|
|
|
| |||||||
Deferred (benefit) provision: | ||||||||||||
Federal | (127 | ) | 1,215 | (12,345 | ) | |||||||
State | (179 | ) | 10 | (2,467 | ) | |||||||
Foreign | 131 | 3,957 | (1,227 | ) | ||||||||
|
|
|
|
|
| |||||||
| (175 | ) | 5,182 | (16,039 | ) | ||||||||
|
|
|
|
|
| |||||||
Provision (benefit) for income taxes | $ | 21,716 | $ | 21,300 | $ | (2,462 | ) | |||||
|
|
|
|
|
| |||||||
Index to Financial Statements
BLOOMIN’ BRANDS, INC.
NOTES TO CONSOLIDATED FINANCIAL STATEMENTS—(Continued)
| Years Ended December 31, | ||||||||||||
| 2012 | 2011 | 2010 | ||||||||||
Current provision (benefit): | ||||||||||||
Federal | $ | 15 | $ | 382 | $ | (4,324 | ) | |||||
State | 10,896 | 10,556 | 12,430 | |||||||||
Foreign | 8,637 | 10,953 | 8,012 | |||||||||
|
|
|
|
|
| |||||||
| 19,548 | 21,891 | 16,118 | ||||||||||
|
|
|
|
|
| |||||||
Deferred (benefit) provision: | ||||||||||||
Federal | 397 | (127 | ) | 1,215 | ||||||||
State | (8,118 | ) | (179 | ) | 10 | |||||||
Foreign | 279 | 131 | 3,957 | |||||||||
|
|
|
|
|
| |||||||
| (7,442 | ) | (175 | ) | 5,182 | ||||||||
|
|
|
|
|
| |||||||
Provision for income taxes | $ | 12,106 | $ | 21,716 | $ | 21,300 | ||||||
|
|
|
|
|
| |||||||
The reconciliation of income taxes calculated at the United States federal tax statutory rate to the Company’s effective income tax rate is as follows:
| Years Ended December 31, | Years Ended December 31, | |||||||||||||||||||||||
| 2011 | 2010 | 2009 | 2012 | 2011 | 2010 | |||||||||||||||||||
Income taxes at federal statutory rate | 35.0 | % | 35.0 | % | 35.0 | % | 35.0 | % | 35.0 | % | 35.0 | % | ||||||||||||
State and local income taxes, net of federal benefit | 4.1 | 4.8 | (3.8 | ) | 2.2 | 4.1 | 4.8 | |||||||||||||||||
Provision for goodwill impairment | — | — | (30.3 | ) | ||||||||||||||||||||
Valuation allowance on deferred income tax assets | 7.6 | 13.2 | (15.0 | ) | 24.2 | 7.6 | 13.2 | |||||||||||||||||
Employment related credits, net | (19.1 | ) | (22.4 | ) | 26.9 | (31.0 | ) | (19.1 | ) | (22.4 | ) | |||||||||||||
Net officers life insurance expense | 0.9 | (1.3 | ) | 3.7 | ||||||||||||||||||||
Net officers’ life insurance expense | (1.3 | ) | 0.9 | (1.3 | ) | |||||||||||||||||||
Noncontrolling interests | (4.3 | ) | (5.1 | ) | 1.0 | (7.8 | ) | (4.3 | ) | (5.1 | ) | |||||||||||||
Tax settlements and related adjustments | 1.3 | 3.8 | (7.2 | ) | (1.0 | ) | 1.3 | 3.8 | ||||||||||||||||
Excess tax benefits from stock-based compensation arrangements | — | — | (9.0 | ) | ||||||||||||||||||||
Loss on investments | (5.6 | ) | — | — | — | (5.6 | ) | — | ||||||||||||||||
Foreign rate differential | (2.4 | ) | (2.1 | ) | 1.9 | (4.5 | ) | (2.4 | ) | (2.1 | ) | |||||||||||||
Other, net | (0.9 | ) | 0.6 | 0.5 | 0.7 | (0.9 | ) | 0.6 | ||||||||||||||||
|
|
|
|
|
| |||||||||||||||||||
Total | 16.6 | % | 26.5 | % | 3.7 | % | 16.5 | % | 16.6 | % | 26.5 | % | ||||||||||||
|
|
|
|
|
| |||||||||||||||||||
The effective income tax rate for the year ended December 31, 2012 was 16.5% compared to 16.6% for the year ended December 31, 2011. The effective income tax rate in 2012 was consistent with the prior year. The effective income tax rate for the year ended December 31, 2011 was 16.6% compared to 26.5% for the year ended December 31, 2010. The net decrease in the effective income tax rate in 2011 as compared to the previous year was primarily due to the increase in the domestic pretax book income in which the deferred income tax assets are subject to a valuation allowance and the state and foreign income tax provision being a lower percentage of consolidated pretax income as compared to the prior year.
The effective income tax rate for the year ended December 31, 20102012 was 26.5% compared to 3.7% forlower than the year ended December 31, 2009. The net increase in the effective income taxblended federal and state statutory rate in 2010 as compared to the previous year wasof 38.6% primarily due to the effectbenefit of the change intax credit for excess FICA tax on employee-reported tips, elimination of noncontrolling interests and foreign rate differential together being such a large
BLOOMIN’ BRANDS, INC.
NOTES TO CONSOLIDATED FINANCIAL STATEMENTS—(Continued)
percentage of pretax income, which was partially offset by the valuation allowance against deferred income tax assets.
allowance. The effective income tax rate for the year ended December 31, 2011 was lower than the combinedblended federal and state statutory rate of 38.7% primarily due to the benefit of the tax credit for excess FICA tax on employee-reported tips and loss on investments as a result of the sale of assets in Japan together being such a large percentage of pretax income. The effective income tax rate for the year ended December 31, 2010 was lower than the combinedblended federal and state statutory rate of 38.9% primarily due to the benefit of the tax credit for excess FICA tax on employee-reported tips, which was partially offset by the valuation allowance and income taxes in states that only have limited deductions in computing the state current income tax provision. The effective income tax rate for the year ended December 31, 2009 was significantly lower than the combined federal and state statutory rate of 38.9% primarily due to an increase in the valuation allowance on deferred income tax assets, which was partially offset by the benefit of the tax credit for excess FICA tax on employee-reported tips being such a large percentage of pretax loss.
Index to Financial Statements
BLOOMIN’ BRANDS, INC.
NOTES TO CONSOLIDATED FINANCIAL STATEMENTS—(Continued)
The income tax effects of temporary differences that give rise to significant portions of deferred income tax assets and liabilities are as follows (in thousands):
| December 31, | December 31, | |||||||||||||||
| 2011 | 2010 | 2012 | 2011 | |||||||||||||
Deferred income tax assets: | ||||||||||||||||
Deferred rent | $ | 26,421 | $ | 21,879 | $ | 33,050 | $ | 26,421 | ||||||||
Insurance reserves | 21,740 | 22,849 | 23,714 | 21,740 | ||||||||||||
Unearned revenue | 9,375 | 8,716 | 11,155 | 9,375 | ||||||||||||
Deferred compensation | 78,351 | 67,710 | 60,977 | 53,487 | ||||||||||||
Allowance for receivables | 762 | 13,696 | ||||||||||||||
Net operating loss carryforward | 19,397 | 35,356 | ||||||||||||||
Federal tax credit carryforward | 146,991 | 105,802 | ||||||||||||||
Net operating loss carryforwards | 6,716 | 19,397 | ||||||||||||||
Federal tax credit carryforwards | 133,122 | 146,991 | ||||||||||||||
Deferred loss on contingent debt guarantee | 9,493 | 9,538 | — | 9,493 | ||||||||||||
Partner deposits and accrued partner obligations | 29,376 | 31,858 | ||||||||||||||
Other, net | 105 | 5,348 | 686 | 1,075 | ||||||||||||
|
|
|
| |||||||||||||
Gross deferred income tax assets | 312,635 | 290,894 | 298,796 | 319,837 | ||||||||||||
Less: valuation allowance | (35,837 | ) | (25,886 | ) | (72,515 | ) | (35,837 | ) | ||||||||
|
|
|
| |||||||||||||
Net deferred income tax assets | 276,798 | 265,008 | 226,281 | 284,000 | ||||||||||||
|
|
|
| |||||||||||||
Deferred income tax liabilities: | ||||||||||||||||
Less: property, fixtures and equipment basis differences | (232,604 | ) | (225,631 | ) | (189,289 | ) | (239,806 | ) | ||||||||
Less: intangible asset basis differences | (148,433 | ) | (143,702 | ) | (133,496 | ) | (148,433 | ) | ||||||||
Less: deferred gain on extinguishment of debt | (57,064 | ) | (57,100 | ) | (57,064 | ) | (57,064 | ) | ||||||||
|
|
|
| |||||||||||||
Net deferred income tax liabilities | $ | (161,303 | ) | $ | (161,425 | ) | $ | (153,568 | ) | $ | (161,303 | ) | ||||
|
|
|
| |||||||||||||
The changes in the valuation allowance account for the deferred income tax assets are as follows (in thousands):
Balance at January 1, 2009 | $ | 4,992 | ||||||
Change in assessments about the realization of deferred income tax assets | 16,985 | |||||||
| ||||||||
Balance at December 31, 2009 | 21,977 | |||||||
| ||||||||
Balance at January 1, 2010 | $ | 21,977 | ||||||
Change in assessments about the realization of deferred income tax assets | 3,909 | 3,909 | ||||||
|
| |||||||
Balance at December 31, 2010 | 25,886 | 25,886 | ||||||
| ||||||||
Change in assessments about the realization of deferred income tax assets | 9,951 | 9,951 | ||||||
|
| |||||||
Balance at December 31, 2011 | $ | 35,837 | 35,837 | |||||
Change in assessments about the realization of deferred income tax assets | 36,678 | |||||||
|
| |||||||
Balance at December 31, 2012 | $ | 72,515 | ||||||
| ||||||||
Index to Financial Statements
BLOOMIN’ BRANDS, INC.
NOTES TO CONSOLIDATED FINANCIAL STATEMENTS—(Continued)
A valuation allowance reduces the deferred income tax assets reported if, based on the weight of the evidence, it is more likely than not that some portion or all of the deferred income tax assets will not be realized. After consideration of all of the evidence, the Company has determined that a valuation allowance of $35.8$72.5 million and $25.9$35.8 million is necessary at December 31, 20112012 and 2010,2011, respectively.
A provision (benefit) for income taxes has not been recorded for any United States or additional foreign taxes on undistributed earnings related to the Company’s foreign affiliates as these earnings were and are expected to continue to be permanently reinvested. If the Company identifies an exception to its general reinvestment policy of undistributed earnings, additional taxes will be posted.recorded. It is not practical to determine the amount of unrecognized deferred income tax liabilities on the undistributed earnings.
The Company has autilized all of its available federal net operating loss carryforwardand foreign tax credit carryforwards for tax purposes of approximately $49.4 million. This loss can be carried forward for 20 years from the tax year in which it is was generated and will expire in the years 2027 and 2029.2012. The Company has state net operating loss carryforwards of approximately $46.2$41.3 million. These state net operating loss carryforwards will expire between 20122013 and 2029.2031. The Company has foreign net operating loss carryforwards of approximately $5.5$11.8 million. These foreign net operating loss carryforwards will expire between 2015 and 2018.2019.
The Company has general business tax credits of approximately $138.8$144.9 million. These credits can be carried forward for 20 years and will expire between 2027 and 2031. The Company has foreign2032.
Deferred income tax assets relating to tax benefits of stock-based compensation have been reduced by approximately $1.1 million to reflect exercises of stock options and vesting of restricted stock during the year ended December 31, 2012. Certain stock option exercises and restricted stock vesting resulted in tax deductions in excess of previously recorded tax benefits based on the value of such stock-based compensation at the time of grant (“windfalls”). Although the additional tax benefit for the windfalls is reflected in the general business tax credits available to utilize against federaland state net operating loss carryforwards, the additional tax benefit associated with the windfalls is not recognized for financial statement purposes until the deduction reduces income taxes payable. Accordingly, windfall tax benefits of approximately $15.6 million. These credits can be carried forward for ten years and will expire between 2017 and 2021.$0.2 million are not reflected in the deferred tax assets as of December 31, 2012. When realized, these windfalls are recognized directly to Additional paid-in capital.
As of December 31, 2012 and 2011, and December 31, 2010,respectively, the Company had $14.0$13.6 million and $16.4$14.0 million, respectively, of unrecognized tax benefits ($1.51.0 million and $1.3$1.5 million, respectively, in “OtherOther long-term liabilities, net,” $2.5 $0.9 million and $6.3$2.5 million, respectively, in “AccruedAccrued and other current liabilities”liabilities and $11.7 million and $10.0 million, and $8.8 million, respectively, in “DeferredDeferred income tax liabilities”)liabilities). Additionally, the Company accrued $4.1$2.4 million and $6.1$4.1 million of interest and penalties related to uncertain tax positions as of December 31, 20112012 and December 31, 2010,2011, respectively. Of the total amount of unrecognized tax benefits, including accrued interest and penalties, $15.2$13.8 million and $18.0$15.2 million, respectively, if recognized, would impact the Company’s effective tax rate. The difference between the total amount of unrecognized tax benefits and the amount that would impact the effective tax rate consists of items that are offset by deferred income tax assets and the federal tax benefit of state income tax items.
Index to Financial Statements
BLOOMIN’ BRANDS, INC.
NOTES TO CONSOLIDATED FINANCIAL STATEMENTS—(Continued)
The following table summarizes the activity related to the Company’s unrecognized tax benefits (in thousands):
Balance at January 1, 2009 | $ | 16,537 | ||||||
Increases for tax positions taken during a prior period | 2,920 | |||||||
Increases for tax positions taken during the current period | 2,536 | |||||||
Settlements with taxing authorities | (5,189 | ) | ||||||
Lapses in the applicable statutes of limitations | (2,393 | ) | ||||||
| ||||||||
Balance at December 31, 2009 | $ | 14,411 | ||||||
| ||||||||
Balance at January 1, 2010 | $ | 14,411 | ||||||
Increases for tax positions taken during a prior period | 1,889 | 1,889 | ||||||
Decreases for tax positions taken during a prior period | (676 | ) | (676 | ) | ||||
Increases for tax positions taken during the current period | 3,801 | 3,801 | ||||||
Settlements with taxing authorities | 58 | 58 | ||||||
Lapses in the applicable statutes of limitations | (3,096 | ) | (3,096 | ) | ||||
|
| |||||||
Balance at December 31, 2010 | $ | 16,387 | $ | 16,387 | ||||
|
| |||||||
Increases for tax positions taken during a prior period | 472 | 472 | ||||||
Decreases for tax positions taken during a prior period | (708 | ) | (708 | ) | ||||
Increases for tax positions taken during the current period | 2,136 | 2,136 | ||||||
Settlements with taxing authorities | (4,190 | ) | (4,190 | ) | ||||
Lapses in the applicable statutes of limitations | (58 | ) | (58 | ) | ||||
|
| |||||||
Balance at December 31, 2011 | $ | 14,039 | $ | 14,039 | ||||
|
| |||||||
Increases for tax positions taken during a prior period | 416 | |||||||
Decreases for tax positions taken during a prior period | (291 | ) | ||||||
Increases for tax positions taken during the current period | 2,153 | |||||||
Settlements with taxing authorities | (1,788 | ) | ||||||
Lapses in the applicable statutes of limitations | (938 | ) | ||||||
| ||||||||
Balance at December 31, 2012 | $ | 13,591 | ||||||
| ||||||||
In many cases, the Company’s uncertain tax positions are related to tax years that remain subject to examination by relevant taxable authorities. Based on the outcome of these examinations, or as a result of the expiration of the statute of limitations for specific jurisdictions, it is reasonably possible that the related recorded unrecognized tax benefits for tax positions taken on previously filed tax returns will decrease by approximately $5.0$0.4 million to $6.0$0.5 million within the next twelve months after December 31, 2011.2012.
The Company is currently open to audit under the statute of limitations by the Internal Revenue Service for the years ended December 31, 2007 through 2010.2011. The Company and its subsidiaries’ state and foreign income tax returns are also open to audit under the statute of limitations for the years ended December 31, 2000 through 2011. The Company is currently under examination by the IRS for the years ended December 31, 2009 through 2010. At this time, the Company does not believe that the outcome of any examination will have a material impact on the Company’s results of operations or financial position.
The Company accounts for interest and penalties related to uncertain tax positions as part of its Provision for income taxes and recognized (benefit) expense of ($0.6) million, $0.9 million $2.1 million and $1.3$2.1 million for the years ended December 31, 2012, 2011 2010 and 2009, respectively.
Index to Financial Statements
BLOOMIN’ BRANDS, INC.2010.
NOTES TO CONSOLIDATED FINANCIAL STATEMENTS—(Continued)
15.17. Recently Issued Financial Accounting Standards
In May 2011, the Financial Accounting Standards Board (the “FASB”) issued Accounting Standards Update (“ASU”) No. 2011-04, “Fair Value Measurement (Topic 820): Amendments to Achieve Common Fair Value Measurement and Disclosure Requirements in U.S. GAAP and IFRSs,” (“ASU No. 2011-04”) that establishes a number of new requirements for fair value measurements. These include: (i) a prohibition on grouping financial instruments for purposes of determining fair value, except when an entity manages market and credit risks on the basis of the entity’s net exposure to the group; (ii) an extension of the prohibition against the use of a blockage factor to all fair value measurements (that prohibition currently applies only to financial instruments with quoted prices in active markets); and (iii) a requirement that for recurring Level 3 fair value measurements, entities disclose quantitative information about unobservable inputs, a description of the valuation process used and qualitative details about the sensitivity of the measurements. Additionally, for items not carried at fair value but for which fair value is disclosed, entities will be required to disclose the level within the fair value hierarchy that applies to the fair value measurement disclosed. ASU No. 2011-04 is effective for interim and annual periods beginning after December 15, 2011. While the provisions of ASU No. 2011-04 will increase the Company’s fair value disclosures, this guidance will not have an impact on the Company’s financial position, results of operations or cash flows.
In June 2011, the FASB issued ASU No. 2011-05, “Comprehensive Income (Topic 220): Presentation of Comprehensive Income,” (“ASU No. 2011-05”) that eliminates the option to report other comprehensive income and its components in the statement of changes in equity. Instead, the new guidance requires the Company to present the components of net income and other comprehensive income in one continuous statement, referred to as the statement of comprehensive income, or in two separate, but consecutive statements. While the new guidance changes the presentation of comprehensive income, there are no changes to the components that are recognized in net income or other comprehensive income under current accounting guidance. ASU No. 2011-05 must be applied retrospectively and is effective for public companies during the interim and annual periods beginning after December 15, 2011, with early adoption permitted. Additionally, in December 2011, the FASB issued ASU No. 2011-12, “Comprehensive Income (Topic 220): Deferral of the Effective Date for Amendments to the Presentation of Reclassifications of Items Out of Accumulated Other Comprehensive Income in Accounting Standards Update No. 2011-05” (“ASU No. 2011-12”), which indefinitely defers the requirement in ASU No. 2011-05 to present reclassification adjustments out of accumulated other comprehensive income by component in both the statement in which net income is presented and the statement in which other comprehensive income is presented. The deferral of the presentation requirements does not impact the effective date of the other requirements in ASU 2011-05. During the deferral period, the existing requirements in generally accepted accounting principles in the United States (“U.S. GAAP”) for the presentation of reclassification adjustments must continue to be followed. ASU No. 2011-12 is effective for public companies during the interim and annual periods beginning after December 15, 2011. ASU No. 2011-05 and ASU No. 2011-12 will not have an impact on the Company’s financial position, results of operations or cash flows as the guidance only requires a presentation change to comprehensive income.
In September 2011, the FASB issued ASU No. 2011-08, “Intangibles—Goodwill and Other (Topic 350)—Testing Goodwill for Impairment,” (“ASU No. 2011-08”) which permits an entity to make a qualitative assessment of whether it is more likely than not that a reporting unit’s fair value is less than its carrying value before applying the two-step quantitative goodwill impairment test. If it is determined through the qualitative assessment that a reporting unit’s fair value is more likely than not greater than its carrying value, the remaining impairment steps would be unnecessary. The qualitative assessment is optional, allowing entities to go directly to the quantitative assessment. ASU No. 2011-08 is effective for annual and interim goodwill impairment tests performed in fiscal years beginning after December 15, 2011, with early adoption permitted. This guidance will not have a material impact on the Company’s financial position, results of operations or cash flows.
Index to Financial Statements
BLOOMIN’ BRANDS, INC.
NOTES TO CONSOLIDATED FINANCIAL STATEMENTS—(Continued)
In December 2011, the FASB issued ASU No. 2011-10, “Property, Plant, and Equipment (Topic 360): Derecognition of in Substance Real Estate—a Scope Clarification,” (“ASU No. 2011-10”) which applies to a parent company that ceases to have a controlling financial interest in a subsidiary, that is in substance real estate, as a result of a default on the subsidiary’s nonrecourse debt. The new guidance emphasizes that the parent should only deconsolidate the real estate subsidiary when legal title to the real estate is transferred to the lender and the related nonrecourse debt has been extinguished. If the reporting entity ceases to have a controlling financial interest under subtopic 810-10, the reporting entity would continue to include the real estate, debt, and the results of the subsidiary’s operations in its consolidated financial statements until legal title to the real estate is transferred to legally satisfy the debt. This standard takes effect for public companies during the annual and interim periods beginning on or after June 15, 2012. The adoption of this guidance is not expected to have a material impact on the Company’s financial statements.
In December 2011, the FASB issued ASU No. 2011-11, “Balance Sheet (Topic 210) -Disclosures: Disclosures about Offsetting Assets and Liabilities,”Liabilities” (“ASU No. 2011-11”), which enhances current disclosures about financial instruments and derivative instruments that are either offset on the statement of financial position or subject to an enforceable master netting arrangement or similar agreement, irrespective of whether they are offset on the
BLOOMIN’ BRANDS, INC.
NOTES TO CONSOLIDATED FINANCIAL STATEMENTS—(Continued)
statement of financial position. The guidance requires the Company to provide both net and gross information for these assets and liabilities. In January 2013, the FASB issued ASU No. 2013-01, “Balance Sheet (Topic 210): Clarifying the Scope of Disclosures about Offsetting Assets and Liabilities” (“ASU No. 2013-01”), to limit the scope of the new balance sheet offsetting disclosure requirements to derivatives (including bifurcated embedded derivatives), repurchase agreements and reverse repurchase agreements, and securities borrowing and lending transactions. Both ASU No. 2011-11 isand ASU No. 2013-01 are effective for annual reporting periods beginning on or after January 1, 2013, and interim periods within those annual periods with retrospective application required. The Company will adopt ASU No. 2011-11 and ASU No. 2013-01 effective January 1, 2013. This guidance will not have an impact on the Company’s financial position, results of operations or cash flows.
In July 2012, the FASB issued ASU No. 2012-02, “Intangibles-Goodwill and Other (Topic 350): Testing Indefinite-Lived Intangible Assets for Impairment” (“ASU No. 2012-02”), which permits an entity to make a qualitative assessment of whether it is more likely than not that an indefinite-lived intangible asset’s fair value is less than its carrying value before applying the two-step quantitative impairment test. If it is determined through the qualitative assessment that an indefinite-lived intangible asset’s fair value is more likely than not greater than its carrying value, the remaining impairment steps would be unnecessary. The qualitative assessment is optional, allowing entities to go directly to the quantitative assessment. ASU No. 2012-02 is effective for annual and interim impairment tests performed for fiscal years beginning after September 15, 2012, with early adoption permitted. The Company will adopt ASU No. 2012-02 effective January 1, 2013. This guidance will not have an impact on the Company’s financial position, results of operations or cash flows.
In January 2013, the Emerging Issues Task Force (“EITF”) reached a final consensus on EITF Issue No. 11-A “Parent’s Accounting for the Cumulative Translation Adjustment upon Derecognition of Certain Subsidiaries or Groups of Assets within a Foreign Entity or of an Investment in a Foreign Entity” (“EITF 11-A”). Under the final consensus, an entity would recognize cumulative translation adjustments in earnings when it ceases to have a controlling financial interest in a subsidiary or group of assets within a consolidated foreign entity and the sale or transfer results in the complete or substantially complete liquidation of the foreign entity in which the subsidiary or group of assets resided. However, when an entity sells either a part or all of its investment in a consolidated foreign entity, an entity would recognize cumulative translation adjustments in earnings only if the parent no longer has a controlling financial interest in the foreign entity as a result of the sale. In the case of sales of an equity method investment that is a foreign entity, a pro rata portion of cumulative translation adjustments attributable to the equity method investment would be recognized in earnings upon sale of the equity method investment. In addition, cumulative translation adjustments would be recognized in earnings upon a business combination achieved in stages such as a step acquisition. EITF 11-A is effective for public companies for fiscal years beginning on or after December 15, 2013 and interim periods within those fiscal years, with early adoption permitted. The Company will adopt EITF 11-A effective January 1, 2014 with prospective application to the derecognition of any foreign entity subsidiaries, groups of assets or investments in foreign entities completed on or after January 1, 2014. The impact of EITF 11-A on the Company’s financial position, results of operations and cash flows as itis dependent on future transactions resulting in derecognition of the Company’s foreign assets, subsidiaries or investments in foreign entities completed on or after adoption.
In February 2013, the FASB issued ASU No. 2013-02, “Comprehensive Income (Topic 220): Reporting of Amounts Reclassified Out of Accumulated Other Comprehensive Income” (“ASU No. 2013-02”), which requires an entity to provide information about the amounts reclassified out of accumulated other comprehensive income by component. The guidance requires an entity to present, either on the face of the statement where net income is presented or in the notes, significant amounts reclassified out of accumulated other comprehensive income by the respective line items of net income but only requires a presentation changeif the amount reclassified is required to offsetting (netting) assets and liabilities.be reclassified to net income in its entirety in the same reporting period. For amounts that are not required to be reclassified in
BLOOMIN’ BRANDS, INC.
16.NOTES TO CONSOLIDATED FINANCIAL STATEMENTS—(Continued)
their entirety to net income, an entity is required to cross-reference to other required disclosures that provide additional detail about those amounts. ASU No. 2013-02 is effective for the Company prospectively for reporting periods beginning after December 15, 2012, with early adoption permitted. The Company will adopt ASU No. 2013-02 effective January 1, 2013. This guidance will not have an impact on the Company’s financial position, results of operations or cash flows.
18. Commitments and Contingencies
Operating Leases
The Company leases restaurant and office facilities and certain equipment under operating leases having initial terms expiring between 20122013 and 2024.2032. The restaurant facility leases have renewal clauses primarily from five to 30 years exercisable at the option of the Company. Rent expense for the Company’s operating leases, which generally have escalating rentals over the term of the lease and may include potential rent holidays, is recorded on a straight-line basis over the initial lease term and those renewal periods that are reasonably assured. Certain of these leases require the payment of contingent rentals leased on a percentage of gross revenues, as defined by the terms of the applicable lease agreement. Total rental expense for the years ended December 31, 2012, 2011 2010 and 20092010 was approximately $140.9 million, $132.9 million $128.1 million and $132.0$128.1 million, respectively, and included contingent rentals of approximately $6.1 million, $5.6 million $4.5 million and $3.8$4.5 million, respectively.
As of December 31, 2011,2012, future minimum rental payments under non-cancelable operating leases (including executed leases for restaurants scheduled to open in 2012)2013) are as follows (in thousands):
2012 | $ | 106,258 | ||||||
2013 | 98,174 | $ | 128,855 | |||||
2014 | 81,771 | 115,287 | ||||||
2015 | 64,053 | 98,041 | ||||||
2016 | 45,993 | 79,364 | ||||||
2017 | 61,602 | |||||||
Thereafter | 107,130 | 390,466 | ||||||
|
| |||||||
Total minimum lease payments(1) | $ | 503,379 | ||||||
Total minimum lease payments (1) | $ | 873,615 | ||||||
|
| |||||||
| (1) | Total minimum lease payments have not been reduced by minimum sublease rentals of |
Index to Financial Statements
Purchase Obligations
The Company has minimum purchase commitments with various vendors through June 2016.November 2017. Outstanding commitments consist primarily of minimum purchase commitments of beef, cheese, potatoespork, cooking oil, butter and other food and beverage products related to normal business operations and contracts for advertising, marketing, technology, insurance, and sports sponsorships, printing and technology.sponsorships. In 2011,2012, the Company purchased more than 90%75% of its beef raw materials from four beef suppliers who represented approximately 75%85% of the total beef marketplace in the United States.
Litigation and Other Matters
The Company is subject to legal proceedings, claims and liabilities, such as liquor liability, sexual harassment and slip and fall cases, which arise in the ordinary course of business and are generally covered by insurance.insurance if they exceed specified retention or deductible amounts. In the opinion of management, the amount of ultimate liability with respect to those actions will not have a material adverse impact on the Company’s financial position or results of operations and cash flows. The Company accrues for loss contingencies that are
BLOOMIN’ BRANDS, INC.
NOTES TO CONSOLIDATED FINANCIAL STATEMENTS—(Continued)
probable and reasonably estimable. Legal costs are reported in General and administrative expense in the Consolidated Statements of Operations and Comprehensive Income. The Company generally does not accrue for legal costs expected to be incurred with a loss contingency until those services are provided.
Guarantees and RY-8, Inc.
OSI guarantees debt owed to banks by one of its joint venture partners and by landlords of one of its Outback Steakhouse restaurants in South Korea. The maximum amount guaranteed and the outstanding guaranteed amount were each approximately $26.0 million at December 31, 2011. OSI would have to perform under the guarantees if the borrowers default under their respective loan agreements. A default would cause OSI to exercise all available rights and remedies.
Pursuant to the Company’s joint venture agreement for the development of Roy’s restaurants, RY-8, its joint venture partner, has the right to require the Company to purchase up to 50% of RY-8’s interest in the joint venture at any time after June 17, 2009. The purchase price would be equal to the fair market value of the joint venture as of the date that RY-8 exercised its put option multiplied by the percentage purchased.
As of December 31, 2011, the Company is due $2.8 million from RY-8 for interest and line of credit renewal fees and capital expenditures for additional restaurant development made on behalf of RY-8 because the joint venture partner’s $24.5 million line of credit was fully extended. This amount is eliminated in consolidation (see Note 18). Additional payments on behalf of RY-8 may be required in the future.
Index to Financial Statements
BLOOMIN’ BRANDS, INC.
NOTES TO CONSOLIDATED FINANCIAL STATEMENTS—(Continued)
Insurance
The Company purchased insurance for individual claims that exceed the amounts listed in the following table:
| 2011 | 2010 | 2009 | ||||||||||
Workers’ Compensation | $ | 1,500,000 | $ | 1,500,000 | $ | 1,500,000 | ||||||
General Liability(1) | 1,500,000 | 1,500,000 | 1,500,000 | |||||||||
Health(2) | 400,000 | 300,000 | 300,000 | |||||||||
Property Coverage(3) | 2,500,000 / 500,000 | 2,500,000 / 500,000 | 2,500,000 /500,000 | |||||||||
Employment Practices Liability | 2,000,000 | 2,000,000 | 2,000,000 | |||||||||
Directors’ and Officers’ Liability | 250,000 | 250,000 | 250,000 | |||||||||
Fiduciary Liability | 25,000 | 25,000 | 25,000 | |||||||||
| 2012 | 2011 | 2010 | ||||||||||
Workers’ compensation | $ | 1,500,000 | $ | 1,500,000 | $ | 1,500,000 | ||||||
General liability (1) | 1,500,000 | 1,500,000 | 1,500,000 | |||||||||
Health (2) | 400,000 | 400,000 | 300,000 | |||||||||
Property coverage (3) | 500,000 / 2,500,000 | 500,000 / 2,500,000 | 500,000 / 2,500,000 | |||||||||
Employment practices liability | 2,000,000 | 2,000,000 | 2,000,000 | |||||||||
Directors’ and officers’ liability (4) | 1,000,000 | 250,000 | 250,000 | |||||||||
Fiduciary liability | 25,000 | 25,000 | 25,000 | |||||||||
| (1) | In 2012 and 2011, claims arising from liquor liability had the same self-insured retention as general liability. For claims in 2010, |
| (2) | The Company is self-insured for all |
| (3) | The Company has a $0.5 million deductible per occurrence for those properties that collateralize New PRP’s 2012 CMBS Loan and a $2.5 million deductible per occurrence for all other locations. The deductibles for named storms and earthquakes are 5.0% of the total insurable value at the time of the loss per unit of insurance at each location involved in the loss, subject to a minimum of $0.5 million for those properties that collateralize New PRP’s 2012 CMBS Loan and $2.5 million for all other locations. Property limits are $60.0 million each occurrence, and the Company does not quota share in any loss above either deductible level. |
| (4) | Retention increase in 2012 was effective with the Company’s initial public offering on August 8, 2012. |
The Company records a liability for all unresolved claims and for an estimate of incurred but not reported claims at the anticipated cost to the Company. In establishing reserves, the Company considers certain actuarial assumptions and judgments regarding economic conditions, the frequency and severity of claims and claim development history and settlement practices. Unanticipated changes in these factors or future adjustments to these estimates may produce materially different amounts of expense that would be reported under these programs. Reserves recorded for worker’sworkers’ compensation and general liability claims are discounted using the average of the 1-year and 5-year risk free rate of monetary assets that have comparable maturities. When recovery from an insurance policy is considered probable, a receivable is recorded.
17. Related Parties
Paradise Restaurant Group, LLC
In September 2009, the Company sold its Cheeseburger in Paradise concept, which included 34 restaurants, to Paradise Restaurant Group, LLC (“PRG”), an entity formed and controlled by the president of the concept. Other investors in PRG include a current development partner in certain Carrabba’s Italian Grill restaurants and former Company employees. Based on the terms of the purchase and sale agreement, the Company continued to consolidate PRG after the sale transaction since the Company was considered the primary beneficiary of the entity under the then applicable accounting guidance. However, upon adoption of new accounting guidance for variable interest entities on January 1, 2010, the Company is no longer the primary beneficiary of PRG, and as a result, PRG is no longer considered a related party as of January 1, 2010 (see Note 18).
Index to Financial Statements
BLOOMIN’ BRANDS, INC.
NOTES TO CONSOLIDATED FINANCIAL STATEMENTS—(Continued)
The payments the Company provided the financingexpects to make as of December 31, 2012 for the saleeach of the Cheeseburger in Paradise conceptfive succeeding years and the aggregate amount thereafter are as follows:
2013 | $ | 22,235 | ||
2014 | 11,905 | |||
2015 | 7,781 | |||
2016 | 5,141 | |||
2017 | 3,068 | |||
Thereafter | 14,506 | |||
|
| |||
| $ | 64,636 | |||
|
|
Increased liability balances at December 31, 2012 as compared to December 31, 2011 are due to higher insurance claim severity and frequency primarily within the Company’s general liability insurance. A reconciliation of the expected aggregate undiscounted amount to the amount recognized in the formConsolidated Balance Sheets is as follows:
| December 31, | ||||||||
| 2012 | 2011 | |||||||
Undiscounted liability | $ | 65,594 | $ | 54,010 | ||||
Less: discount | (958 | ) | (862 | ) | ||||
|
|
|
| |||||
Liability balance | $ | 64,636 | $ | 53,148 | ||||
|
|
|
| |||||
Discount rates of a $2.0 million promissory note that bears interest at a rate of 600 basis points over the 90-day LIBOR.0.40% and 0.48% were used for December 31, 2012 and 2011, respectively. The promissory note must be repaid in five annual installments that commence one year from the September 15, 2009 closing date. In accordance with the terms of the promissory note, the annual principal and interest payment amountsdiscounted liabilities are based on the cash flow of PRG, subject to certain maximum payment limits. The promissory note and the payment of the purchase price are secured by a first priority purchase money security interestpresented in the membership interests and assets of PRG. The loan agreement for the promissory note also contains certain protective covenants suchCompany’s Consolidated Balance Sheets as but not limited to: (i) PRG must obtain the Company’s prior written approval before incurring any additional indebtedness or new lease obligations or before extending or renewing any existing obligations, (ii) the Company retains the right to approve PRG’s financial capital and development plans, (iii) PRG cannot make any distributions, dividends or other payment of funds other than approved in an annual capital and financial plan and (iv) PRG cannot make any substantial change to its executive or management personnel or change its general character of business without the Company’s prior written consent.follows:
The Company also provided PRG a $2.0 million revolving line of credit (reduced to $1.0 million in September 2010) to assist with seasonal cash flow shortages. The revolving line of credit matured on September 15, 2011 and there were no draws on the revolving line of credit prior to maturity.
| December 31, | ||||||||
| 2012 | 2011 | |||||||
Accrued and other current liabilities | $ | 22,235 | $ | 13,573 | ||||
Other long-term liabilities, net | 42,401 | 39,575 | ||||||
The Company assigned PRG all restaurant property leases under their current terms, except for three locations that are leased under modified terms as provided in the purchase and sale agreement. For certain of the assigned third-party leases, the Company remains contingently liable. The buyer is responsible for paying common area maintenance, real estate taxes and other expenses on these restaurant properties.19. Related Parties
T-Bird Nevada, LLC
On February 19, 2009, the Company filed an action in Florida against T-Bird Nevada, LLC (“T-Bird”) and certain of its affiliates (collectively, the “T-Bird Parties”). T-Bird is a limited liability company affiliated with the Company’s California franchisees of Outback Steakhouse restaurants. The action sought payment on a promissory note made by T-Bird that the Company purchased from T-Bird’s former lender, among other remedies. The principal balance on the promissory note, plus accrued and unpaid interest, was approximately $33.3 million at the time it was purchased. On September 11, 2009, the T-Bird Parties filed an answer and counterclaims against the Company and certain of its officers and affiliates. The answer generally denied T-Bird’s liability on the loan, and the counterclaims restated the same claims made by the T-Bird Parties in their California action (as described below).
On February 20, 2009, the T-Bird Parties filed suit against the Company and certain of its officers and affiliates in the Superior Court of the State of California, County of Los Angeles. After certain legal proceedings, the T-Bird Parties filed an amended complaint on November 29, 2010. Like the original complaint, the T-Bird Parties’ amended complaint claimed, among other things, that the Company made various misrepresentations and breached certain oral promises allegedly made by the Company and certain of its officers to the T-Bird Parties that the Company would acquire the restaurants owned by the T-Bird Parties and until that time the Company would maintain financing for the restaurants that would be nonrecourse to the T-Bird Parties. The amended complaint sought damages in excess of $100.0 million, exemplary or punitive damages, and other remedies.
On September 26, 2011, the Company entered into a settlement agreement (the “Settlement Agreement”) with the T-Bird Parties to settle all outstanding litigation with T-Bird.Parties. In accordance with the terms of the Settlement Agreement, T-Bird agreed to pay $33.3 million to the Company, which included $33.2 million to satisfy the T-Bird
Index to Financial Statements
BLOOMIN’ BRANDS, INC.
NOTES TO CONSOLIDATED FINANCIAL STATEMENTS—(Continued)
promissory note that the Company purchased from T-Bird’s former lender. This settlement payment was received in November 2011, and $33.2 million was recorded as Recovery of note receivable from affiliated entity in the Company’s Consolidated Statement of Operations and Comprehensive Income for the year ended December 31, 2011.
BLOOMIN’ BRANDS, INC.
NOTES TO CONSOLIDATED FINANCIAL STATEMENTS—(Continued)
Pursuant to the Settlement Agreement, the Company (through its indirect subsidiary, Outback Steakhouse of Florida, LLC) granted to California Steakhouse Developer, LLC, a T-Bird affiliate, for a period of 20 years, the right to develop and operate Outback Steakhouse restaurants as a franchisee in the State of California as set forth in a development agreement dated November 23, 2011 (the “Development Agreement”).
Additionally, the Company has granted certain T-Bird affiliates (the “T-Bird Entities”) the non-transferable right (the “Put Right”) to require the Company to acquire all of the equity interests in the T-Bird Entities that own Outback Steakhouse restaurants and the rights under the Development Agreement for cash. The closing of the Put Right is subject to certain conditions including the negotiation of a transaction agreement reasonably acceptable to the parties, the absence of dissenters rights being exercised by the equity owners above a specified level and compliance with the Company’s debt agreements. The Put Right is exercisable for a one-year period beginning on the date of closing of an initial public offering (an “IPO”) of at least $100 million worth of shares of the Company’s or an affiliate’s common stock or if the Company or OSI has not completed an IPO, for a period of 60 days after execution of a definitive agreement to sell only the Outback Steakhouse brand and all of its Company-owned Outback Steakhouse restaurants.until August 13, 2013.
If the Put Right is exercised, the Company will pay a purchase price equal to a multiple of the T-Bird Entities’ earnings before interest, taxes, depreciation and amortization, subject to certain adjustments (“Adjusted EBITDA”), for the trailing 12 months, net of liabilities of the T-Bird Entities. The multiple is equal to 75% of the multiple of the Company’s or affiliate’s Adjusted EBITDA reflected in its stock price in the case of an IPO or, in a sale of the Outback Steakhouse brand, 75% of the multiple of the Adjusted EBITDA that the Company is receiving in the sale.price. The Company has a one-time right to reject the exercise of the Put Right if the transaction would be dilutive to its consolidated earnings per share. In such event, the Put Right is extended until the first anniversary of the Company’s notice to the T-Bird Entities of such rejection. The Company has agreed to waive all rights of first refusal in its franchise arrangements with the T-Bird Entities in connection with a sale of all, and not less than all, of the assets, or at least 75% of the ownership of the T-Bird Entities.
Bain Capital, Catterton, Founders and Board of Directors
Upon completion of the Merger, the Company entered into a management agreement with Kangaroo Management Company I, LLC (the “Management Company”), whose members are the Founders and entities affiliated with Bain Capital and Catterton. In accordance with the terms of the management agreement, the Management Company provideswas to provide management services to the Company until the tenth anniversary of the consummation of the Merger, with one-year extensions thereafter until terminated. The Management Company receiveswas to receive an aggregate annual management fee equal to $9.1 million and reimbursement for out-of-pocket and other reimbursable expenses incurred by it, its members, or their respective affiliates in connection with the provision of services pursuant to the agreement.
On May 10, 2012, the Company entered into a first amendment to its management agreement with the Management Company. In accordance with the terms of this amendment, the management agreement terminated immediately prior to the completion of the Company’s initial public offering, and a termination fee of $8.0 million was paid to the Management Company in the third quarter of 2012. Management fees of $13.8 million, $9.4 million and $11.6 million, including the 2012 termination fee, out-of-pocket and other reimbursable expenses, of $9.4 million, $11.6 million and $10.7 million for the years ended December 31, 2012, 2011 2010 and 2009,2010, respectively, were included in “GeneralGeneral and administrative”administrative expenses in the Company’s Consolidated Statements of Operations. The management agreement includes customary exculpationOperations and indemnification provisions in favor of the Management Company, Bain Capital and Catterton and their respective affiliates. The management agreement may be terminated by the Company, Bain Capital and Catterton at any time and will terminate automatically upon an initial public offering or a change of control unless the Company and the counterparty(s) determine otherwise.
Index to Financial Statements
BLOOMIN’ BRANDS, INC.
NOTES TO CONSOLIDATED FINANCIAL STATEMENTS—(Continued)
Comprehensive Income.
The Company holds an 89.62% interest in OSI/Fleming’s, LLC and a minority interest holder in the Fleming’s Prime Steakhouse and Wine Bar joint venture holds a 7.88% interest in any Fleming’s Prime Steakhouse and Wine Bar restaurants that opened prior to 2009. The remaining 2.50% is owned by AWA III Steakhouses, Inc., which is wholly-owned by a former Chairman of the Board of Directors (through December 31, 2011) and former named executive officer of the Company, through a revocable trust in which he and his wife are the grantors, trustees and sole beneficiaries. The Company assumed the minority interest holder’s 7.88% ownership interest in any Fleming’s Prime Steakhouse and Wine Bar restaurants that opened in 2009 or later and AWA III Steakhouses, Inc.’s interest remains at 2.50% for these restaurants.
BLOOMIN’ BRANDS, INC.
NOTES TO CONSOLIDATED FINANCIAL STATEMENTS—(Continued)
20. Selected Quarterly Financial Data (Unaudited)
The following tables present selected unaudited quarterly financial data for the periods ending as indicated (in thousands, except per share data):
March 31, | June 30, | September 30, | December 31, | |||||||||||||
Revenues | $ | 1,055,626 | $ | 980,866 | $ | 952,916 | $ | 998,387 | ||||||||
Income (loss) from operations (1)(2)(3) | 90,408 | 48,720 | (11,545 | ) | 53,554 | |||||||||||
Net income (loss) (1)(2)(3)(4) | 53,832 | 20,564 | (33,755 | ) | 20,663 | |||||||||||
Net income (loss) attributable to Bloomin’ Brands, Inc. (1)(2)(3)(4) | 49,999 | 17,440 | (35,866 | ) | 18,398 | |||||||||||
Net income (loss) attributable to Bloomin’ Brands, Inc. per common share: | ||||||||||||||||
Basic | $ | 0.47 | $ | 0.16 | $ | (0.31 | ) | $ | 0.15 | |||||||
Diluted | $ | 0.47 | $ | 0.16 | $ | (0.31 | ) | $ | 0.15 | |||||||
March 31, | June 30, | September 30, | December 31, | |||||||||||||
Revenues | $ | 1,001,849 | $ | 955,502 | $ | 928,275 | $ | 955,638 | ||||||||
Income from operations (5)(6)(7) | 90,693 | 40,754 | 21,042 | 60,963 | ||||||||||||
Net income (5)(6)(7) | 58,115 | 16,443 | 1,368 | 33,253 | ||||||||||||
Net income attributable to Bloomin’ Brands, Inc. (5)(6)(7) | 54,892 | 14,003 | 579 | 30,531 | ||||||||||||
Net income attributable to Bloomin’ Brands, Inc. per common share: | ||||||||||||||||
Basic | $ | 0.52 | $ | 0.13 | $ | 0.01 | $ | 0.28 | ||||||||
Diluted | $ | 0.52 | $ | 0.13 | $ | 0.01 | $ | 0.28 | ||||||||
| (1) | The first quarter of 2012 includes approximately $7.4 million of additional legal and other professional fees mainly resulting from amendment and restatement of a lease between OSI and PRP. |
| (2) | The third quarter of 2012 includes approximately $42.1 million of transaction-related expenses that relate to costs incurred in association with the completion of the initial public offering in August 2012. These expenses primarily include $34.1 million of certain executive compensation costs and non-cash stock compensation charges recorded upon completion of the initial public offering and an $8.0 million management agreement termination fee (see Notes 3 and 19). |
| (3) | The fourth quarter of 2012 includes a gain of $3.5 million from the collection of proceeds and other related amounts from the 2009 sale of the Company’s Cheeseburger in Paradise concept (see Note 13). |
| (4) | During 2012, the Company recorded losses on extinguishment and modification of debt for refinancing transactions of $2.9 million, $9.0 million, and $9.1 million, in the first, third, and fourth quarters, respectively (see Note 11). |
| (5) | The second quarter of 2011 includes $5.8 million of expense related to a settlement of an IRS assessment of employment taxes. |
| (6) | The fourth quarter of 2011 includes $33.2 million of Recovery of note receivable from affiliated entity as a result of a settlement agreement with T-Bird that satisfied all outstanding litigation with T-Bird (see Note 19). |
| (7) | The fourth quarter of 2011 includes a $4.3 million loss from the sale of nine Company-owned Outback Steakhouse restaurants in Japan in October 2011 (see Note 8). |
BLOOMIN’ BRANDS, INC.
OtherCONSOLIDATED BALANCE SHEETS
(In Thousands, Except Share and Per Share Data, Unaudited)
| March 31, 2013 | December 31, 2012 | |||||||
ASSETS | ||||||||
Current Assets | ||||||||
Cash and cash equivalents | $ | 217,469 | $ | 261,690 | ||||
Current portion of restricted cash | 3,671 | 4,846 | ||||||
Inventories | 67,838 | 78,181 | ||||||
Deferred income tax assets | 39,274 | 39,774 | ||||||
Other current assets, net | 99,472 | 103,321 | ||||||
|
|
|
| |||||
Total current assets | 427,724 | 487,812 | ||||||
Restricted cash | 15,332 | 15,243 | ||||||
Property, fixtures and equipment, net | 1,505,468 | 1,506,035 | ||||||
Investments in and advances to unconsolidated affiliates, net | 40,041 | 36,748 | ||||||
Goodwill | 270,058 | 270,972 | ||||||
Intangible assets, net | 548,182 | 551,779 | ||||||
Deferred income tax assets | 2,141 | 2,532 | ||||||
Other assets, net | 145,447 | 145,432 | ||||||
|
|
|
| |||||
Total assets | $ | 2,954,393 | $ | 3,016,553 | ||||
|
|
|
| |||||
LIABILITIES AND STOCKHOLDERS’ EQUITY | ||||||||
Current Liabilities | ||||||||
Accounts payable | $ | 141,030 | $ | 131,814 | ||||
Accrued and other current liabilities | 173,661 | 192,284 | ||||||
Current portion of partner deposits and accrued partner obligations | 14,570 | 14,771 | ||||||
Unearned revenue | 232,134 | 329,518 | ||||||
Current portion of long-term debt | 13,167 | 22,991 | ||||||
|
|
|
| |||||
Total current liabilities | 574,562 | 691,378 | ||||||
Partner deposits and accrued partner obligations | 81,398 | 85,762 | ||||||
Deferred rent | 90,350 | 87,641 | ||||||
Deferred income tax liabilities | 195,695 | 195,874 | ||||||
Long-term debt, net | 1,451,694 | 1,471,449 | ||||||
Other long-term liabilities, net | 261,955 | 264,244 | ||||||
|
|
|
| |||||
Total liabilities | 2,655,654 | 2,796,348 | ||||||
|
|
|
| |||||
Commitments and contingencies | ||||||||
Stockholders’ Equity | ||||||||
Bloomin’ Brands, Inc. Stockholders’ Equity | ||||||||
Preferred stock, $0.01 par value, 25,000,000 shares authorized; no shares issued and outstanding at March 31, 2013 and December 31, 2012 | — | — | ||||||
Common stock, $0.01 par value, 475,000,000 shares authorized; 122,569,475 and 121,148,451 shares issued and outstanding at March 31, 2013 and December 31, 2012, respectively | 1,226 | 1,211 | ||||||
Additional paid-in capital | 1,021,393 | 1,000,963 | ||||||
Accumulated deficit | (709,862 | ) | (773,085 | ) | ||||
Accumulated other comprehensive loss | (19,333 | ) | (14,801 | ) | ||||
|
|
|
| |||||
Total Bloomin’ Brands, Inc. stockholders’ equity | 293,424 | 214,288 | ||||||
Noncontrolling interests | 5,315 | 5,917 | ||||||
|
|
|
| |||||
Total stockholders’ equity | 298,739 | 220,205 | ||||||
|
|
|
| |||||
Total liabilities and stockholders’ equity | $ | 2,954,393 | $ | 3,016,553 | ||||
|
|
|
| |||||
The accompanying notes are an integral part of these consolidated financial statements.
BLOOMIN’ BRANDS, INC.
CONSOLIDATED STATEMENTS OF OPERATIONS AND COMPREHENSIVE INCOME
(In Thousands, Except Per Share Data, Unaudited)
| Three Months Ended March 31, | ||||||||
| 2013 | 2012 | |||||||
Revenues | ||||||||
Restaurant sales | $ | 1,082,356 | $ | 1,045,466 | ||||
Other revenues | 9,894 | 10,160 | ||||||
|
|
|
| |||||
Total revenues | 1,092,250 | 1,055,626 | ||||||
|
|
|
| |||||
Costs and expenses | ||||||||
Cost of sales | 349,989 | 335,859 | ||||||
Labor and other related | 299,867 | 293,501 | ||||||
Other restaurant operating | 233,809 | 218,965 | ||||||
Depreciation and amortization | 40,196 | 38,860 | ||||||
General and administrative | 72,491 | 76,002 | ||||||
Provision for impaired assets and restaurant closings | 1,896 | 4,435 | ||||||
Income from operations of unconsolidated affiliates | (2,858 | ) | (2,404 | ) | ||||
|
|
|
| |||||
Total costs and expenses | 995,390 | 965,218 | ||||||
|
|
|
| |||||
Income from operations | 96,860 | 90,408 | ||||||
Loss on extinguishment of debt | — | (2,851 | ) | |||||
Other (expense) income, net | (217 | ) | 54 | |||||
Interest expense, net | (20,880 | ) | (20,974 | ) | ||||
|
|
|
| |||||
Income before provision for income taxes | 75,763 | 66,637 | ||||||
Provision for income taxes | 10,707 | 12,805 | ||||||
|
|
|
| |||||
Net income | 65,056 | 53,832 | ||||||
Less: net income attributable to noncontrolling interests | 1,833 | 3,833 | ||||||
|
|
|
| |||||
Net income attributable to Bloomin’ Brands, Inc. | $ | 63,223 | $ | 49,999 | ||||
|
|
|
| |||||
Net income | $ | 65,056 | $ | 53,832 | ||||
Other comprehensive income: | ||||||||
Foreign currency translation adjustment | (4,532 | ) | 3,149 | |||||
|
|
|
| |||||
Comprehensive income | 60,524 | 56,981 | ||||||
Less: comprehensive income attributable to noncontrolling interests | 1,833 | 3,833 | ||||||
|
|
|
| |||||
Comprehensive income attributable to Bloomin’ Brands, Inc. | $ | 58,691 | $ | 53,148 | ||||
|
|
|
| |||||
Earnings per share: | ||||||||
Basic | $ | 0.52 | $ | 0.47 | ||||
|
|
|
| |||||
Diluted | $ | 0.50 | $ | 0.47 | ||||
|
|
|
| |||||
Weighted average common shares outstanding: | ||||||||
Basic | 121,238 | 106,332 | ||||||
|
|
|
| |||||
Diluted | 126,507 | 107,058 | ||||||
|
|
|
| |||||
The accompanying notes are an integral part of these consolidated financial statements.
BLOOMIN’ BRANDS, INC.
CONSOLIDATED STATEMENTS OF CHANGES IN STOCKHOLDERS’ EQUITY
(In Thousands, Unaudited)
| Bloomin’ Brands, Inc. | ||||||||||||||||||||||||||||
| Common Stock | Common Stock Amount | Additional Paid-in Capital | Accumulated Deficit | Accumulated Other Comprehensive Loss | Non- Controlling Interests | Total | ||||||||||||||||||||||
Balance, December 31, 2012 | 121,148 | $ | 1,211 | $ | 1,000,963 | $ | (773,085 | ) | $ | (14,801 | ) | $ | 5,917 | $ | 220,205 | |||||||||||||
Net income | — | — | — | 63,223 | — | 1,833 | 65,056 | |||||||||||||||||||||
Foreign currency translation adjustment | — | — | — | — | (4,532 | ) | — | (4,532 | ) | |||||||||||||||||||
Stock-based compensation | — | — | 4,494 | — | — | — | 4,494 | |||||||||||||||||||||
Exercises of stock options | 1,212 | 12 | 10,627 | — | — | — | 10,639 | |||||||||||||||||||||
Issuance of restricted stock | 219 | 3 | — | — | — | — | 3 | |||||||||||||||||||||
Forfeiture of restricted stock | (10 | ) | — | (3 | ) | — | — | — | (3 | ) | ||||||||||||||||||
Repayments of notes receivable due from stockholders | — | — | 5,312 | — | — | — | 5,312 | |||||||||||||||||||||
Distributions to noncontrolling interests | — | — | — | — | — | (2,435 | ) | (2,435 | ) | |||||||||||||||||||
|
|
|
|
|
|
|
|
|
|
|
|
|
| |||||||||||||||
Balance, March 31, 2013 | 122,569 | $ | 1,226 | $ | 1,021,393 | $ | (709,862 | ) | $ | (19,333 | ) | $ | 5,315 | $ | 298,739 | |||||||||||||
|
|
|
|
|
|
|
|
|
|
|
|
|
| |||||||||||||||
| Bloomin’ Brands, Inc. | ||||||||||||||||||||||||||||
| Common Stock | Common Stock Amount | Additional Paid-in Capital | Accumulated Deficit | Accumulated Other Comprehensive Loss | Non- Controlling Interests | Total | ||||||||||||||||||||||
Balance, December 31, 2011 | 106,573 | $ | 1,066 | $ | 874,753 | $ | (822,625 | ) | $ | (22,344 | ) | $ | 9,447 | $ | 40,297 | |||||||||||||
Net income | — | — | — | 49,999 | — | 3,833 | 53,832 | |||||||||||||||||||||
Foreign currency translation adjustment | — | — | — | — | 3,149 | — | 3,149 | |||||||||||||||||||||
Stock-based compensation | — | — | 833 | — | — | — | 833 | |||||||||||||||||||||
Repurchase of common stock | (36 | ) | (1 | ) | 316 | (431 | ) | — | — | (116 | ) | |||||||||||||||||
Forfeiture of restricted stock | (20 | ) | — | (127 | ) | — | — | — | (127 | ) | ||||||||||||||||||
Issuance of notes receivable due from stockholders | — | — | (47 | ) | — | — | — | (47 | ) | |||||||||||||||||||
Repayments of notes receivable due from stockholders | — | — | 1,463 | — | — | — | 1,463 | |||||||||||||||||||||
Distributions to noncontrolling interests | — | — | — | — | — | (4,160 | ) | (4,160 | ) | |||||||||||||||||||
|
|
|
|
|
|
|
|
|
|
|
|
|
| |||||||||||||||
Balance, March 31, 2012 | 106,517 | $ | 1,065 | $ | 877,191 | $ | (773,057 | ) | $ | (19,195 | ) | $ | 9,120 | $ | 95,124 | |||||||||||||
|
|
|
|
|
|
|
|
|
|
|
|
|
| |||||||||||||||
The accompanying notes are an integral part of these consolidated financial statements.
BLOOMIN’ BRANDS, INC.
CONSOLIDATED STATEMENTS OF CASH FLOWS
(In Thousands, Unaudited)
| Three Months Ended March 31, | ||||||||
| 2013 | 2012 | |||||||
Cash flows provided by operating activities: | ||||||||
Net income | $ | 65,056 | $ | 53,832 | ||||
Adjustments to reconcile net income to cash provided by operating activities: | ||||||||
Depreciation and amortization | 40,196 | 38,860 | ||||||
Amortization of deferred financing fees | 923 | 2,924 | ||||||
Amortization of capitalized gift card sales commissions | 7,604 | 6,690 | ||||||
Provision for impaired assets and restaurant closings | 1,896 | 4,435 | ||||||
Accretion on debt discounts | 653 | 173 | ||||||
Stock-based and other non-cash compensation expense | 6,195 | 12,543 | ||||||
Income from operations of unconsolidated affiliates | (2,858 | ) | (2,404 | ) | ||||
Deferred income tax benefit | — | (333 | ) | |||||
(Gain) loss on disposal of property, fixtures and equipment | (318 | ) | 484 | |||||
Unrealized (gain) loss on derivative financial instruments | (263 | ) | 194 | |||||
Gain on life insurance and restricted cash investments | (1,944 | ) | (3,156 | ) | ||||
Loss on extinguishment of debt | — | 2,851 | ||||||
Recognition of deferred gain on sale-leaseback transaction | (485 | ) | — | |||||
Change in assets and liabilities: | ||||||||
Decrease in inventories | 10,201 | 886 | ||||||
(Increase) decrease in other current assets | (5,167 | ) | 12,763 | |||||
Decrease in other assets | 2,530 | 2,447 | ||||||
Decrease in accounts payable and accrued and other current liabilities | (12,827 | ) | (36,363 | ) | ||||
Increase in deferred rent | 2,836 | 2,834 | ||||||
Decrease in unearned revenue | (97,245 | ) | (97,751 | ) | ||||
Increase in other long-term liabilities | 1,117 | 187 | ||||||
|
|
|
| |||||
Net cash provided by operating activities | 18,100 | 2,096 | ||||||
|
|
|
| |||||
Cash flows (used in) provided by investing activities: | ||||||||
Purchases of Company-owned life insurance | (372 | ) | (350 | ) | ||||
Proceeds from sale of Company-owned life insurance | 38 | — | ||||||
Proceeds from disposal of property, fixtures and equipment | 1,799 | 1,255 | ||||||
Proceeds from sale-leaseback transaction | — | 192,886 | ||||||
Capital expenditures | (40,950 | ) | (34,019 | ) | ||||
Decrease in restricted cash | 6,184 | 16,816 | ||||||
Increase in restricted cash | (5,093 | ) | (21,100 | ) | ||||
Return on investment from unconsolidated affiliates | — | 332 | ||||||
|
|
|
| |||||
Net cash (used in) provided by investing activities | $ | (38,394 | ) | $ | 155,820 | |||
|
|
|
| |||||
BLOOMIN’ BRANDS, INC.
CONSOLIDATED STATEMENTS OF CASH FLOWS—(Continued)
(In Thousands, Unaudited)
| Three Months Ended March 31, | ||||||||
| 2013 | 2012 | |||||||
Cash flows used in financing activities: | ||||||||
Proceeds from issuance of 2012 CMBS Loan | $ | — | $ | 495,186 | ||||
Repayments of long-term debt | (30,558 | ) | (6,642 | ) | ||||
Extinguishment of CMBS loan | — | (777,563 | ) | |||||
Financing fees | — | (5,399 | ) | |||||
Proceeds from the exercise of stock options | 10,639 | — | ||||||
Distributions to noncontrolling interests | (2,435 | ) | (4,160 | ) | ||||
Repayments of partner deposits and accrued partner obligations | (4,184 | ) | (9,242 | ) | ||||
Issuance of notes receivable due from stockholders | — | (47 | ) | |||||
Repayments of notes receivable due from stockholders | 5,312 | 1,463 | ||||||
|
|
|
| |||||
Net cash used in financing activities | (21,226 | ) | (306,404 | ) | ||||
|
|
|
| |||||
Effect of exchange rate changes on cash and cash equivalents | (2,701 | ) | 1,463 | |||||
|
|
|
| |||||
Net decrease in cash and cash equivalents | (44,221 | ) | (147,025 | ) | ||||
Cash and cash equivalents at the beginning of the period | 261,690 | 482,084 | ||||||
|
|
|
| |||||
Cash and cash equivalents at the end of the period | $ | 217,469 | $ | 335,059 | ||||
|
|
|
| |||||
Supplemental disclosures of cash flow information: | ||||||||
Cash paid for interest | $ | 19,975 | $ | 13,420 | ||||
Cash paid for income taxes, net of refunds | 2,217 | 4,992 | ||||||
Supplemental disclosures of non-cash investing and financing activities: | ||||||||
Conversion of partner deposits and accrued partner obligations to notes payable | $ | 325 | $ | 2,646 | ||||
Acquisition of property, fixtures and equipment through accounts payable or capital lease liabilities | 1,199 | 3,423 | ||||||
The accompanying notes are an integral part of these consolidated financial statements.
BLOOMIN’ BRANDS, INC.
NOTES TO CONSOLIDATED FINANCIAL STATEMENTS (UNAUDITED)
1. Basis of Presentation
Bloomin’ Brands, Inc. (“Bloomin’ Brands” or the “Company”) was formed by an investor group comprised of funds advised by Bain Capital Partners, LLC and Catterton Management Company, LLC (the “Sponsors”) and Chris T. Sullivan, Robert D. Basham and J. Timothy Gannon (the “Founders”) and certain members of management. Bloomin’ Brands is a holding company and conducts its operations through OSI Restaurant Partners, LLC (“OSI”), the Company’s primary operating entity, and New Private Restaurant Properties, LLC, an indirect wholly-owned subsidiary of the Company that leases certain Company-owned restaurant properties to a subsidiary of OSI. In August 2012, the Company completed an initial public offering of its common stock.
The Company owns and operates casual, polished casual and fine dining restaurants primarily in the United States. The Company’s restaurant portfolio has five concepts: Outback Steakhouse, Carrabba’s Italian Grill, Bonefish Grill, Fleming’s Prime Steakhouse and Wine Bar and Roy’s. Additional Outback Steakhouse, Carrabba’s Italian Grill and Bonefish Grill restaurants in which the Company has no direct investment are operated under franchise agreements.
The Company has reclassified certain items in the accompanying consolidated financial statements for prior periods to be comparable with the classification for the three months ended March 31, 2013. These reclassifications had no effect on previously reported net income.
The accompanying interim unaudited consolidated financial statements have been prepared by the Company pursuant to the rules and regulations of the Securities and Exchange Commission. Accordingly, they do not include all the information and footnotes required by generally accepted accounting principles in the United States (“U.S. GAAP”) for complete financial statements. In the opinion of the Company, all adjustments necessary for the fair presentation of the Company’s results of operations, financial position and cash flows for the periods presented have been included and are of a normal, recurring nature. The results of operations for interim periods are not necessarily indicative of the results to be expected for the full-year. These financial statements should be read in conjunction with the audited financial statements and notes thereto for the year ended December 31, 2012 included in this prospectus.
2. Recently Issued Financial Accounting Standards
In December 2011, the FASB issued ASU No. 2011-11, “Balance Sheet (Topic 210): Disclosures about Offsetting Assets and Liabilities” (“ASU No. 2011-11”), which enhances current disclosures about financial instruments and derivative instruments that are either offset on the statement of financial position or subject to an enforceable master netting arrangement or similar agreement, irrespective of whether they are offset on the statement of financial position. The guidance requires the Company to provide both net and gross information for these assets and liabilities. In January 2013, the FASB issued ASU No. 2013-01, “Balance Sheet (Topic 210): Clarifying the Scope of Disclosures about Offsetting Assets and Liabilities” (“ASU No. 2013-01”), to limit the scope of the new balance sheet offsetting disclosure requirements to derivatives (including bifurcated embedded derivatives), repurchase agreements and reverse repurchase agreements, and securities borrowing and lending transactions. Both ASU No. 2011-11 and ASU No. 2013-01 are effective for annual reporting periods beginning on or after January 1, 2013, and interim periods within those annual periods with retrospective application required. The adoption of ASU No. 2011-11 and ASU No. 2013-01 on January 1, 2013 did not have an impact on the Company’s financial position, results of operations or cash flows.
BLOOMIN’ BRANDS, INC.
NOTES TO CONSOLIDATED FINANCIAL STATEMENTS (UNAUDITED)—(Continued)
In July 2012, the FASB issued ASU No. 2012-02, “Intangibles-Goodwill and Other (Topic 350): Testing Indefinite-Lived Intangible Assets for Impairment” (“ASU No. 2012-02”), which permits an entity to make a qualitative assessment of whether it is more likely than not that an indefinite-lived intangible asset’s fair value is less than its carrying value before applying the two-step quantitative impairment test. If it is determined through the qualitative assessment that an indefinite-lived intangible asset’s fair value is more likely than not greater than its carrying value, the remaining impairment steps would be unnecessary. The qualitative assessment is optional, allowing entities to go directly to the quantitative assessment. ASU No. 2012-02 is effective for annual and interim impairment tests performed for fiscal years beginning after September 15, 2012. The adoption of ASU No. 2012-02 on January 1, 2013 did not have an impact on the Company’s financial position, results of operations or cash flows.
In February 2013, the FASB issued ASU No. 2013-02, “Comprehensive Income (Topic 220): Reporting of Amounts Reclassified Out of Accumulated Other Comprehensive Income” (“ASU No. 2013-02”), which requires an entity to provide information about the amounts reclassified out of accumulated other comprehensive income by component. The guidance requires an entity to present, either on the face of the statement where net income is presented or in the notes, significant amounts reclassified out of accumulated other comprehensive income by the respective line items of net income but only if the amount reclassified is required to be reclassified to net income in its entirety in the same reporting period. For amounts that are not required to be reclassified in their entirety to net income, an entity is required to cross-reference to other required disclosures that provide additional detail about those amounts. ASU No. 2013-02 is effective for the Company prospectively for reporting periods beginning after December 15, 2012. The adoption of ASU No. 2013-02 on January 1, 2013 did not have an impact on the Company’s financial position, results of operations or cash flows.
In March 2013, the FASB issued ASU No. 2013-05, “Foreign Currency Matters (Topic 830): Parent’s Accounting for the Cumulative Translation Adjustment upon Derecognition of Certain Subsidiaries or Groups of Assets within a Foreign Entity or of an Investment in a Foreign Entity (a consensus of the FASB Emerging Issues Task Force)” (“ASU No. 2013-05”). Under ASU No. 2013-05, an entity would recognize cumulative translation adjustments in earnings when it ceases to have a controlling financial interest in a subsidiary or group of assets within a consolidated foreign entity and the sale or transfer results in the complete or substantially complete liquidation of the foreign entity in which the subsidiary or group of assets resided. However, when an entity sells either a part or all of its investment in a consolidated foreign entity, an entity would recognize cumulative translation adjustments in earnings only if the parent no longer has a controlling financial interest in the foreign entity as a result of the sale. In the case of sales of an equity method investment that is a foreign entity, a pro rata portion of cumulative translation adjustments attributable to the equity method investment would be recognized in earnings upon sale of the equity method investment. In addition, cumulative translation adjustments would be recognized in earnings upon a business combination achieved in stages such as a step acquisition. ASU No. 2013-05 is effective for public companies for fiscal years beginning on or after December 15, 2013 and interim periods within those fiscal years, with early adoption permitted. The Company will adopt ASU No. 2013-05 effective January 1, 2014 with prospective application to the derecognition of any foreign entity subsidiaries, groups of assets or investments in foreign entities completed on or after January 1, 2014. The impact of ASU No. 2013-05 on the Company’s financial position, results of operations and cash flows is dependent on future transactions resulting in derecognition of the Company’s foreign assets, subsidiaries or investments in foreign entities completed on or after adoption.
BLOOMIN’ BRANDS, INC.
NOTES TO CONSOLIDATED FINANCIAL STATEMENTS (UNAUDITED)—(Continued)
3. Earnings Per Share
The computation of basic and diluted earnings per common share is as follows (in thousands, except per share amounts):
| Three Months Ended March 31, | ||||||||
| 2013 | 2012 | |||||||
Net income attributable to Bloomin’ Brands, Inc. | $ | 63,223 | $ | 49,999 | ||||
|
|
|
| |||||
Basic weighted average common shares outstanding | 121,238 | 106,332 | ||||||
Effect of diluted securities: | ||||||||
Stock options | 5,064 | 591 | ||||||
Unvested restricted stock | 205 | 135 | ||||||
|
|
|
| |||||
Diluted weighted average common shares outstanding | 126,507 | 107,058 | ||||||
|
|
|
| |||||
Basic earnings per share | $ | 0.52 | $ | 0.47 | ||||
Diluted earnings per share | $ | 0.50 | $ | 0.47 | ||||
Dilutive securities outstanding not included in the computation of earnings per share because their effect was antidilutive were as follows (in thousands):
| Three Months Ended March 31, | ||||||||
| 2013 | 2012 | |||||||
Stock options | 2,071 | 550 | ||||||
4. Stock-based Compensation
During the first quarter of 2013, the Company granted performance-based share units (“PSUs”) to executives and key members of management. There were no PSUs awarded in periods prior to 2013. The PSUs vest over a period of four years following the date of grant, and 25% of the grant is earned or forfeited on each grant anniversary date, subject to certification of the performance criteria by the Compensation Committee of the Board of Directors. The number of units that actually vest will be determined for each year based on the achievement of certain Company performance criteria set forth in the award agreement and may range from zero to 200% of the annual target grant. PSUs that do not vest based on failure to satisfy the stated performance criteria for any annual period are forfeited. In addition to the satisfaction of the performance criteria for the PSUs, vesting is dependent upon continued service with forfeiture of all unvested PSUs upon termination, unless in the case of death or disability, in which case a pro rata portion of the target number of PSUs are eligible to immediately vest based on actual performance during the performance period. The PSUs are settled in shares of common stock. Holders will receive one share of common stock for each performance-based share unit that vests. The fair value of PSUs is based on the closing price of the Company’s common stock on the grant date. Compensation expense for PSUs is recognized over the vesting period when it is probable the performance criteria will be achieved. During the three months ended March 31, 2013, a nominal amount of compensation expense was recorded for the PSUs.
BLOOMIN’ BRANDS, INC.
NOTES TO CONSOLIDATED FINANCIAL STATEMENTS (UNAUDITED)—(Continued)
The following table presents a summary of the Company’s stock-based compensation activity for the three months ended March 31, 2013 (in thousands):
| Stock Options | Restricted Stock Awards | Performance-Based Share Units (1) | ||||||||||
Outstanding at December 31, 2012 | 12,379 | 299 | — | |||||||||
Granted | 1,282 | 219 | 52 | |||||||||
Exercised or vested | (1,212 | ) | (3 | ) | — | |||||||
Forfeited or expired | (243 | ) | (10 | ) | (4 | ) | ||||||
|
|
|
|
|
| |||||||
Outstanding at March 31, 2013 | 12,206 | 505 | 48 | |||||||||
|
|
|
|
|
| |||||||
| (1) | Share unit amounts represent the target number of PSUs considered granted for accounting recognition based on the establishment of performance targets for future years. The actual number of shares that will be earned upon vesting is dependent upon actual performance and may range from zero to 200% of the target number of shares. |
At March 31, 2013 and December 31, 2012, approximately 6.2 million and 7.3 million, respectively, of outstanding stock options were exercisable.
The weighted-average grant date fair value of stock options granted during the three months ended March 31, 2013 and 2012 was $8.47 and $6.87, respectively, and was estimated using the Black-Scholes option pricing model. The following assumptions were used to calculate the fair value of options granted for the periods indicated:
| Three Months Ended March 31, | ||||||||
| 2013 | 2012 | |||||||
Weighted-average risk-free interest rate | 1.09 | % | 1.15 | % | ||||
Dividend yield | — | % | — | % | ||||
Expected term | 6.3 years | 6.5 years | ||||||
Weighted-average volatility | 48.6 | % | 55.5 | % | ||||
During the three months ended March 31, 2013 and 2012, the Company recognized aggregate stock-based compensation expense of $4.4 million and $0.7 million, respectively.
5. Investment in Equity Method Investee
Through a joint venture arrangement with PGS Participacoes Ltda., the Company holds a 50% ownership interest in the BrazilianPGS Consultoria e Serviços Ltda. (the “Brazilian Joint Venture,Venture”), which was formed in 1998 for the purpose of operatingoperates Outback Steakhouse franchise restaurants in Brazil. The Company accounts for the Brazilian Joint Venture under the equity method of accounting. At March 31, 2013 and December 31, 2011 and 2010,2012, the Company’s net investment of $34.0$39.3 million and $31.0$36.0 million, respectively, was recorded in “InvestmentsInvestments in and advances to unconsolidated affiliates, net,” and a foreign currency translation adjustment of ($3.8)$0.4 million and $3.5 million, respectively, was recorded in “Accumulated other comprehensive loss” in the Consolidated Balance Sheets and the Company’s share of earnings of $6.8 million, $5.5 million and $2.7$0.6 million was recorded in “Income from operations of unconsolidated affiliates”Accumulated other comprehensive loss in the Consolidated Statements of Operations for the years ended December 31, 2011, 2010 and 2009, respectively.
One of the current and one of the former owners of the Company’s primary domestic beef cutting operation have a greater than 50% combined ownership interest in SEA Restaurants, LLC, the Company’s franchisee of six Outback Steakhouse restaurants in Southeast Asia. These individuals have not received any distributions related to this ownership interest.
18. Variable Interest Entities
The Company consolidates variable interest entities in which the Company is deemed to have a controlling financial interest as a result of the Company having (1) the power to direct the activities that most significantly impact the entity’s economic performance and (2) the obligation to absorb the losses or the right to receive the benefits that could potentially be significant to the variable interest entity. If the Company has a controlling financial interest in a variable interest entity, the assets, liabilities, and results of the operations of the variable interest entity are included in the consolidated financial statements (see Note 2).
Roy’s and RY-8, Inc.
The Company’s consolidated financial statements include the accounts and operations of its Roy’s joint venture although it has less than majority ownership. The Company determined it is the primary beneficiary of the joint venture since the Company has the power to direct or cause the direction of the activities that most significantly impact the entity on a day-to-day basis such as decisions regarding menu development, purchasing, restaurant expansion and closings and the management of employee-related processes. Additionally, the Company has the obligation to absorb losses or the right to receive benefits of the Roy’s joint venture that could potentially be significant to the Roy’s joint venture. The majority of capital contributions made by the Company’s partner in the Roy’s joint venture, RY-8, have been funded by loans to RY-8 from a third party where OSI provides a guarantee (see Note 11). The guarantee is secured by a collateral interest in RY-8’s membership interest in the joint venture. The carrying amounts of consolidated assets and liabilities included within the Company’s Consolidated Balance Sheets for the Roy’s joint venture were $26.2three months ended March 31, 2013 and 2012, respectively. The Company’s share of earnings of $2.9 million and $9.6$2.4 million for the three months ended March 31, 2013 and 2012, respectively, at December 31, 2011was recorded in Income from operations of unconsolidated affiliates in the Company’s Consolidated Statements of Operations and $28.7 million and $10.5 million, respectively, at December 31, 2010.Comprehensive Income.
Index to Financial Statements
BLOOMIN’ BRANDS, INC.
NOTES TO CONSOLIDATED FINANCIAL STATEMENTS—STATEMENTS (UNAUDITED)—(Continued)
The Company is also the primary beneficiary of RY-8 because its implicit variable interest in that entity, which is considered a de facto related party, indirectly receives the variabilityfollowing table presents summarized financial information for 100% of the entity through absorption of RY-8’s expected losses,Brazilian Joint Venture for the periods ending as indicated (in thousands):
| Three Months Ended March 31, | ||||||||
| 2013 | 2012 | |||||||
Net revenue from sales | $ | 65,933 | $ | 58,564 | ||||
Gross profit | 45,323 | 40,824 | ||||||
Income from continuing operations | 7,077 | 8,147 | ||||||
Net income | 4,764 | 4,808 | ||||||
6. Accrued and therefore the Company also consolidates RY-8. Since RY-8’s $24.5 million line of credit became fully extended in 2007, the Company made interest payments, paid line of credit renewal feesOther Current Liabilities
Accrued and made capital expenditures for additional restaurant development on behalf of RY-8. The Company is obligated to provide financing, either through OSI’s guarantee with a third-party institution or loans, for all required capital contributions and interest payments. Therefore, any additional RY-8 capital requirements in connection with the joint venture likely will be the Company’s responsibility. The Company classifies OSI’s $24.5 million contingent obligation as guaranteed debt and the portion of income or loss attributable to RY-8 is eliminated in the line item in the Consolidated Statement of Operations entitled “Net income (loss) attributable to noncontrolling interests.” All material intercompany balances and transactions have been eliminated.
Paradise Restaurant Group, LLC
In September 2009, the Company sold its Cheeseburger in Paradise concept, which included 34 restaurants, for $2.0 million to PRG, an entity formed and controlled by the presidentother current liabilities consisted of the concept. Based on the termsfollowing (in thousands):
| March 31, 2013 | December 31, 2012 | |||||||
Accrued payroll and other compensation | $ | 84,569 | $ | 108,612 | ||||
Accrued insurance | 23,283 | 22,235 | ||||||
Other current liabilities | 65,809 | 61,437 | ||||||
|
|
|
| |||||
| $ | 173,661 | $ | 192,284 | |||||
|
|
|
| |||||
7. Long-term Debt, Net
Long-term debt, net consisted of the purchase and sale agreement, the Company determined at that time that it was the primary beneficiary and continued to consolidate PRG after the sale transaction.following (in thousands):
Upon adoption of new accounting guidance for variable interest entities on January 1, 2010, the Company determined that it is no longer the primary beneficiary of PRG. As a result, the Company deconsolidated PRG on January 1, 2010. The Company determined that certain rights pursuant to a $2.0 million promissory note, which is fully reserved, owed to the Company by PRG are non-substantive participating rights, and as a result, the Company does not have the power to direct the activities that most significantly impact the entity. At December 31, 2011, the maximum undiscounted exposure to loss as a result of the Company’s involvement with PRG is $25.8 million related to lease payments over a period of 11 years in the event that PRG defaults on these leases.
| March 31, 2013 | December 31, 2012 | |||||||
Senior secured term loan B facility, interest rate of 4.75% at March 31, 2013 and December 31, 2012 (1) (2) | $ | 975,000 | $ | 1,000,000 | ||||
Mortgage loan, weighted average interest rates of 3.99% and 3.98% at March 31, 2013 and December 31, 2012, respectively (3) | 317,621 | 319,574 | ||||||
First mezzanine loan, interest rate of 9.00% at March 31, 2013 and December 31, 2012 (3) | 86,800 | 87,048 | ||||||
Second mezzanine loan, interest rate of 11.25% at March 31, 2013 and December 31, 2012 (3) | 87,103 | 87,273 | ||||||
Other notes payable, uncollateralized, interest rates ranging from 0.62% to 7.00% and from 0.63% to 7.00% at March 31, 2013 and December 31, 2012, respectively (2) | 7,213 | 9,848 | ||||||
Sale-leaseback obligations (2) | 2,375 | 2,375 | ||||||
Capital lease obligations (2) | 1,886 | 2,112 | ||||||
|
|
|
| |||||
| 1,477,998 | 1,508,230 | |||||||
Less: current portion of long-term debt | (13,167 | ) | (22,991 | ) | ||||
Less: debt discount | (13,137 | ) | (13,790 | ) | ||||
|
|
|
| |||||
Long-term debt, net | $ | 1,451,694 | $ | 1,471,449 | ||||
|
|
|
| |||||
19. Segment Reporting
| (1) | At December 31, 2012, $50.0 million of OSI’s outstanding senior secured term loan B facility was at an interest rate of 5.75%. |
| (2) | Represents obligations of OSI. |
| (3) | Represents obligations of New PRP (as defined below). |
The Company operates restaurants under five brands that have similar economic characteristics, nature of products and services, class of customer and distribution methods, and the Company believes it meets the criteria for aggregating its six operating segments, which are the five brands and the Company’s international Outback Steakhouse operations, into a single reporting segment in accordance with the applicable accounting guidance. Approximately 9% of the Company’s total revenues for the year ended December 31, 2011 and 8% of the Company’s total revenues for the years ended December 31, 2010 and 2009 were attributable to operations in foreign countries. Approximately 2% and 3% of the Company’s total long-lived assets, excluding goodwill and intangible assets, were located in foreign countries where the Company holds assets as of December 31, 2011 and 2010, respectively.
20. Subsequent Events
We have evaluated subsequent events for potential recognition and/or disclosure through April 6, 2012, which is the date the consolidated financial statements included in this prospectus were filed with the Securities and Exchange Commission.
Effective March 14, 2012, the Company entered into a sale-leaseback transaction with two third party real estate institutional investors in which the Company sold 67 restaurant properties at fair market value for
Index to Financial Statements
BLOOMIN’ BRANDS, INC.
NOTES TO CONSOLIDATED FINANCIAL STATEMENTS—STATEMENTS (UNAUDITED)—(Continued)
$194.9 million.Bloomin’ Brands, Inc. is a holding company and conducts its operations through its subsidiaries, certain of which have incurred their own indebtedness as described below.
On October 26, 2012, OSI entered into a credit agreement (“Credit Agreement”) with a syndicate of institutional lenders and financial institutions. The Company then simultaneously leased these properties under nine master leases (collectively, the “REIT Master Leases”senior secured credit facilities provide for senior secured financing of up to $1.225 billion, consisting of a $1.0 billion term loan B and a $225.0 million revolving credit facility, including letter of credit and swing-line loan sub-facilities (the “Credit Facilities”). The initial term loan B was issued with an original issue discount of $10.0 million.
The senior secured term loan B matures October 26, 2019. The borrowings under this facility bear interest at rates ranging from 225 to 250 basis points over the Base Rate or 325 to 350 basis points over the Eurocurrency Rate as defined in the Credit Agreement. The Base Rate option is the highest of (i) the prime rate of Deutsche Bank Trust Company Americas, (ii) the federal funds effective rate plus 0.5 of 1.0% or (iii) the Eurocurrency Rate with a one-month interest period plus 1.0% (“Base Rate”) (3.25% at March 31, 2013 and December 31, 2012). The Eurocurrency Rate option is the 30, 60, 90 or 180-day Eurocurrency Rate (“Eurocurrency Rate”) (ranging from 0.20% to 0.44% and 0.21% to 0.51% at March 31, 2013 and December 31, 2012, respectively). The Eurocurrency Rate may have a nine- or twelve-month interest period if agreed upon by the applicable lenders. With respect to the senior secured term loan B, the Base Rate is subject to an interest rate floor of 2.25%, and the Eurocurrency Rate is subject to an interest rate floor of 1.25%.
OSI is required to prepay outstanding term loans, subject to certain exceptions, with:
50% of its “annual excess cash flow” (with step-downs to 25% and 0% based upon its consolidated first lien net leverage ratio), as defined in the Credit Agreement, beginning with the fiscal year ending December 31, 2013 and subject to certain exceptions;
100% of the REIT Master Leasesnet proceeds of certain assets sales and insurance and condemnation events, subject to reinvestment rights and certain other exceptions; and
100% of the net proceeds of any debt incurred, excluding permitted debt issuances.
The Credit Facilities require scheduled quarterly payments on the term loan B equal to 0.25% of the original principal amount of the term loans for the first six years and three quarters commencing with the quarter ending March 31, 2013. These payments are 20 years with four five-year renewal options. One renewal period isreduced by the application of any prepayments, and any remaining balance will be paid at a fixed rental amountmaturity. The outstanding balance, excluding the debt discount, on the term loan B was $975.0 million and $1.0 billion at March 31, 2013 and December 31, 2012, respectively. At March 31, 2013, none of the outstanding balance on the term loan B was classified as current due to voluntary prepayments of $25.0 million made by OSI during the first quarter of 2013 and the last three renewal periods are generallyresults of its projected covenant calculations, which indicate the additional term loan prepayments, as described above, will not be required in the next 12 months. The amount of outstanding term loans required to be prepaid in accordance with OSI’s debt covenants may vary based aton year-end results. At December 31, 2012, $10.0 million of the then-current fair market values. The sale at fair market value and subsequent leaseback qualified for sale-leaseback accounting treatment, andoutstanding balance on the REIT Master Leases areterm loan B was classified as operating leases. current due to OSI’s required quarterly payments.
The Company will deferrevolving credit facility matures October 26, 2017 and provides for swing-line loans and letters of credit of up to $225.0 million for working capital and general corporate purposes. The revolving credit facility bears interest at rates ranging from 200 to 250 basis points over the recognitionBase Rate or 300 to 350 basis points over the Eurocurrency Rate. There were no loans outstanding under the revolving credit facility at March 31, 2013 or December 31, 2012, however, $37.6 million and $41.2 million, respectively, of the $42.7 million gain oncredit facility was committed
BLOOMIN’ BRANDS, INC.
NOTES TO CONSOLIDATED FINANCIAL STATEMENTS (UNAUDITED)—(Continued)
for the saleissuance of certainletters of the properties over the initial termcredit and not available for borrowing. Total outstanding letters of the lease. In accordance with the applicable accounting guidance, the 67 restaurant properties arecredit issued under OSI’s revolving credit facility may not classified as held for sale atexceed $100.0 million.
At March 31, 2013 and December 31, 2011 since2012, the Company will be leasing backwas in compliance with its debt covenants. See the properties.Company’s audited financial statements for the year ended December 31, 2012 included within this prospectus for further information about OSI’s debt covenant requirements.
On April 10, 2013, OSI completed a repricing of its senior secured term loan B primarily to reduce its stated interest rate. Additional information related to the repricing transaction is included in Note 11.
Effective March 27, 2012, New PRPPrivate Restaurant Properties, LLC and two of the Company’s other indirect wholly-owned subsidiaries (collectively, “New PRP”) entered into the 2012a commercial mortgage-backed securities loan (the “2012 CMBS LoanLoan”) with German American Capital Corporation and Bank of America, N.A. The 2012 CMBS Loan totalstotaled $500.0 million at origination and iswas comprised of a first mortgage loan in the amount of $324.8 million, collateralized by 261 of the Company’s properties, and two mezzanine loans totaling $175.2 million. The loans have a maturity date of April 10, 2017. The first mortgage loan has five fixed rate components and a floating rate component. The fixed rate components bear interest at a rate ofrates ranging from 2.37% to 6.81% per annum. The floating rate component bears interest at a rate per annum equal to the 30-day LIBOR rateLondon Interbank Offered Rate (“LIBOR”) (with a floor of 1%) plus 2.37%. The first mezzanine loan bears interest at a rate of 9.0%9.00% per annum, and the second mezzanine loan bears interest at a rate of 11.25% per annum.
The proceeds from the 2012 CMBS Loan, together with the proceeds from thea sale-leaseback transaction described above and excess cash held in PRP,Private Restaurant Properties, LLC (“PRP”), a wholly-owned subsidiary, were used to repay PRP’s existing original first mortgage and mezzanine notes (together, the commercial mortgage-backed securities loan) (“CMBS Loan. As a result of the 2012 CMBS Loan refinancing, the net amount repaid along with scheduled maturities within one year, $281.3 million, was classified as current at December 31, 2011.Loan”). During the first quarter of 2012, the Company recorded a $2.9 million loss related to the extinguishment in Loss on extinguishment of debt.debt in its Consolidated Statement of Operations and Comprehensive Income.
Index to Financial Statements
Report of independent auditors
To the ManagementAt March 31, 2013 and Members of
PGS Consultoria e Serviços Ltda.
We have audited the accompanying consolidated balance sheet of PGS Consultoria e Serviços Ltda. as of December 31, 2010,2012, the outstanding balance, excluding the debt discount, on the 2012 CMBS Loan was $491.5 million and $493.9 million, respectively.
8. Other Long-term Liabilities, Net
The Company maintains endorsement split-dollar insurance policies with a death benefit ranging from $5.0 million to $10.0 million for one of its current and certain of its former executive officers. The Company is the beneficiary of the policies to the extent of premiums paid or the cash value, whichever is greater, with the death benefit being paid to personal beneficiaries designated by the executive officers. During the first quarter of 2013, the Company terminated the split-dollar agreements with two of its former executive officers in exchange for $2.2 million in cash. Upon termination, the release of the death benefit and related liabilities and the associated cash termination payment resulted in a net gain of $2.2 million, which was recorded in General and administrative in the Consolidated Statement of Operations and Comprehensive Income. As a result of the terminations, the Company became the sole and exclusive owner of the related consolidated statementsplit-dollar insurance policies and elected to cancel them.
As of income, changesMarch 31, 2013 and December 31, 2012, the Company had $10.1 million and $14.3 million, respectively, recorded in members’ equity and cash flowsOther long-term liabilities, net in its Consolidated Balance Sheets for the year then ended. These financial statements areoutstanding obligations under the responsibility of the Company’s Management. Our responsibility is to express an opinion on these financial statements based on our audit.endorsement split-dollar insurance policies.
We conducted our audit in accordance with auditing standards generally accepted in the United States of America. Those standards require that we plan and perform the audit to obtain reasonable assurance about whether the financial statements are free of material misstatement. We were not engaged to perform an audit of the Company’s internal control over financial reporting. Our audit included consideration of internal control over financial reporting as a basis for designing audit procedures that are appropriate in the circumstances, but not for the purpose of expressing an opinion on the effectiveness of the Company’s internal control over financial reporting. Accordingly, we express no such opinion. An audit also includes examining, on a test basis, evidence supporting the amounts and disclosures in the financial statements, assessing the accounting principles used and significant estimates made by management, and evaluating the overall financial statement presentation. We believe that our audit provides a reasonable basis for our opinion.
In our opinion, the consolidated financial statements referred to above present fairly, in all material respects, the consolidated financial position of PGS Consultoria e Serviços Ltda. as of December 31, 2010, and the consolidated results of its operations and its cash flows for the year then ended in conformity with accounting practices adopted in Brazil.
The accounting practices adopted in Brazil differ, in certain significant respects, from the accounting principles generally accepted in the United States of America. Information relating to the nature and effect of such differences is presented in Note 18 to the consolidated financial statements.
Rio de Janeiro, Brazil, March 25, 2011
ERNST & YOUNG TERCO
Auditores Independentes S.S.
CRC - 2SP 015.199/O-6 - F - RJ
Index to Financial Statements
PGS CONSULTORIA E SERVIÇOS LTDA.BLOOMIN’ BRANDS, INC.
December 31, 2011 (unaudited), 2010 and 2009 (unaudited)
(In thousands of reais)
| 2011 | 2010 | 2009 | ||||||||||
| (unaudited) | (unaudited) | |||||||||||
Assets | ||||||||||||
Current assets | ||||||||||||
Cash and cash equivalents (Note 5) | 21,832 | 11,032 | 3,298 | |||||||||
Trade accounts receivable (Note 6) | 15,553 | 9,856 | 7,409 | |||||||||
Inventories (Note 7) | 10,065 | 10,460 | 9,487 | |||||||||
Recoverable taxes | 226 | 1,004 | 2,294 | |||||||||
Advances from suppliers | 65 | 359 | 370 | |||||||||
Prepaid expenses | 902 | 576 | 272 | |||||||||
Other | 1,357 | 790 | 807 | |||||||||
|
|
|
|
|
| |||||||
Total current assets | 50,000 | 34,077 | 23,937 | |||||||||
|
|
|
|
|
| |||||||
Noncurrent assets | ||||||||||||
Transactions with related parties (Note 10) | 129 | 122 | 537 | |||||||||
Judicial deposits (Note 12) | 4,003 | 2,787 | 1,833 | |||||||||
Deferred income tax and social contribution (Note 13) | 5,776 | 3,129 | 2,219 | |||||||||
|
|
|
|
|
| |||||||
| 9,908 | 6,038 | 4,589 | ||||||||||
|
|
|
|
|
| |||||||
Property, fixtures and equipment (Note 8) | 101,467 | 86,192 | 72,731 | |||||||||
Intangible assets (Note 9) | 6,656 | 3,122 | 3,244 | |||||||||
|
|
|
|
|
| |||||||
| 108,123 | 89,314 | 75,975 | ||||||||||
|
|
|
|
|
| |||||||
Total noncurrent assets | 118,031 | 95,352 | 80,564 | |||||||||
|
|
|
|
|
| |||||||
Total assets | 168,031 | 129,429 | 104,501 | |||||||||
|
|
|
|
|
| |||||||
Liabilities and members’ equity | ||||||||||||
Current liabilities | ||||||||||||
Loans (Note 11) | 762 | 165 | 283 | |||||||||
Transactions with related parties (Note 10) | 577 | 822 | 940 | |||||||||
Trade accounts payable | 9,998 | 8,743 | 6,531 | |||||||||
Rental payable | 2,376 | 2,096 | 1,430 | |||||||||
Payroll, provisions and social charges | 10,866 | 8,078 | 5,560 | |||||||||
Income tax and social contribution payable (Note 11) | 2,557 | 2,171 | 2,041 | |||||||||
Taxes and contributions payable | 4,680 | 3,245 | 3,364 | |||||||||
Royalties payable (Note 10) | 1,867 | 1,604 | 3,865 | |||||||||
Franchise fees payable (Note 10) | 375 | 205 | 79 | |||||||||
Deferred rent | 114 | — | — | |||||||||
Current portion of accrued buyout liability | 332 | 482 | 283 | |||||||||
Accounts payable to minority partners | 1,077 | 1,309 | 1,807 | |||||||||
Other | 2,578 | 1,716 | 1,460 | |||||||||
|
|
|
|
|
| |||||||
Total current liabilities | 38,159 | 30,636 | 27,643 | |||||||||
|
|
|
|
|
| |||||||
Noncurrent liabilities | ||||||||||||
Loans (Note 11) | 1,732 | — | 165 | |||||||||
Accrued buyout liability | 8,224 | 5,271 | 3,023 | |||||||||
Minority partner deposit | 2,591 | 2,216 | 2,009 | |||||||||
Transactions with related parties (Note 10) | 203 | 528 | 1,430 | |||||||||
Provision for contingency (Note 12) | 2,100 | — | — | |||||||||
CIDE payable (Note 12) | 3,538 | 2,389 | 1,582 | |||||||||
Deferred rent | 1,158 | — | — | |||||||||
Other | 345 | 601 | 824 | |||||||||
|
|
|
|
|
| |||||||
Total noncurrent liabilities | 19,891 | 11,005 | 9,033 | |||||||||
|
|
|
|
|
| |||||||
Members’ equity (Note 14) | ||||||||||||
Capital stock | 21,864 | 21,864 | 21,864 | |||||||||
Retained earnings | 88,117 | 65,924 | 45,961 | |||||||||
|
|
|
|
|
| |||||||
| 109,981 | 87,788 | 67,825 | ||||||||||
|
|
|
|
|
| |||||||
Total liabilities and members’ equity | 168,031 | 129,429 | 104,501 | |||||||||
|
|
|
|
|
| |||||||
See accompanying notes.
Index to Financial Statements
PGS CONSULTORIA E SERVIÇOS LTDA.
Consolidated income statements
For the years ended December 31, 2011 (unaudited), 2010 and 2009 (unaudited)
(In thousands of reais)
| 2011 | 2010 | 2009 | ||||||||||
| (unaudited) |
| (unaudited) | ||||||||||
Gross revenue from sales | 406,455 | 313,380 | 248,245 | |||||||||
Gross revenue from services | — | 1,035 | 902 | |||||||||
|
|
|
|
|
| |||||||
| 406,455 | 314,415 | 249,147 | ||||||||||
Taxes and deductions from sales | (36,677 | ) | (28,466 | ) | (22,991 | ) | ||||||
|
|
|
|
|
| |||||||
Net revenue from sales | 369,778 | 285,949 | 226,156 | |||||||||
Cost of sales | (118,513 | ) | (86,942 | ) | (71,933 | ) | ||||||
|
|
|
|
|
| |||||||
Gross profit | 251,265 | 199,007 | 154,223 | |||||||||
|
|
|
|
|
| |||||||
Operating income (expenses) | ||||||||||||
Restaurant payroll expenses | (80,148 | ) | (59,052 | ) | (47,833 | ) | ||||||
Operating stores expenses | (44,445 | ) | (33,638 | ) | (28,793 | ) | ||||||
Royalties expenses (Note 10) | (18,356 | ) | (14,576 | ) | (11,228 | ) | ||||||
Administrative fee—credit cards/tickets | (8,932 | ) | (6,972 | ) | (5,330 | ) | ||||||
Depreciation and amortization | (10,968 | ) | (9,439 | ) | (7,734 | ) | ||||||
Loss on impairment of property, fixture and equipment (Note 5) | (300 | ) | — | — | ||||||||
Pre-opening expenses | (1,683 | ) | (1,597 | ) | (1,430 | ) | ||||||
Corporate payroll expenses | (11,943 | ) | (7,067 | ) | (5,624 | ) | ||||||
General and administrative expenses | (8,375 | ) | (12,662 | ) | (8,252 | ) | ||||||
Financial income | 1,849 | 791 | 2,694 | |||||||||
Financial expense | (1,086 | ) | (1,342 | ) | (611 | ) | ||||||
Other operating expenses, net | (25,967 | ) | (20,473 | ) | (16,281 | ) | ||||||
|
|
|
|
|
| |||||||
| (210,354 | ) | (166,027 | ) | (130,422 | ) | |||||||
|
|
|
|
|
| |||||||
Income before income tax and social contribution | 40,911 | 32,980 | 23,801 | |||||||||
Current income tax and social contribution (Note 13) | (21,365 | ) | (13,927 | ) | (10,653 | ) | ||||||
Deferred income tax and social contribution (Note 13) | 2,647 | 910 | 243 | |||||||||
|
|
|
|
|
| |||||||
Net income for the year | 22,193 | 19,963 | 13,391 | |||||||||
|
|
|
|
|
| |||||||
See accompanying notes.
Index to Financial Statements
PGS CONSULTORIA E SERVIÇOS LTDA.
Consolidated statements of changes in members’ equity
For the years ended December 31, 2011 (unaudited), 2010 and 2009 (unaudited)
(In thousands of reais)
| Capital stock | Retained earnings | Total | ||||||||||
Balances at December 31, 2009 (unaudited) | 21,864 | 45,961 | 67,825 | |||||||||
Net income for the year | — | 19,963 | 19,963 | |||||||||
|
|
|
|
|
| |||||||
Balances at December 31, 2010 | 21,864 | 65,924 | 87,788 | |||||||||
|
|
|
|
|
| |||||||
Net income for the year | — | 22,193 | 22,193 | |||||||||
|
|
|
|
|
| |||||||
Balances at December 31, 2011(unaudited) | 21,864 | 88,117 | 109,981 | |||||||||
|
|
|
|
|
| |||||||
See accompanying notes.
Index to Financial Statements
PGS CONSULTORIA E SERVIÇOS LTDA.
Consolidated statements of cash flows
For the years ended December 31, 2011 (unaudited), 2010 and 2009 (unaudited)
(In thousands of reais)
| 2011 (unaudited) | 2010 | 2009 (unaudited) | ||||||||||
Cash flow from operating activities | ||||||||||||
Income before income tax and social contribution | 40,911 | 32,980 | 23,801 | |||||||||
Adjustments for | ||||||||||||
Depreciation and amortization (Note 8,9) | 10,968 | 9,439 | 8,105 | |||||||||
Provision for contingency (Note 12) | 2,100 | — | — | |||||||||
Provision for CIDE | 1,149 | 807 | 727 | |||||||||
Disposal of property, fixture and equipment and intangibles | 10 | 163 | 40 | |||||||||
Loss on impairment of property, fixture and equipment | 300 | — | — | |||||||||
Interest and monetary variation on loans | — | 150 | (642 | ) | ||||||||
|
|
|
|
|
| |||||||
| 55,438 | 43,539 | 32,031 | ||||||||||
Changes in assets and liabilities | ||||||||||||
(Increase) decrease in assets | ||||||||||||
Trade accounts receivable | (5,697 | ) | (2,447 | ) | (1,501 | ) | ||||||
Inventories | 395 | (973 | ) | (1,552 | ) | |||||||
Recoverable taxes | 778 | 1,290 | (1,794 | ) | ||||||||
Advances from suppliers | 294 | 11 | 1,066 | |||||||||
Prepaid expenses | (326 | ) | (304 | ) | 7 | |||||||
Judicial deposits | (1,216 | ) | (954 | ) | (796 | ) | ||||||
Other assets | (567 | ) | 17 | 355 | ||||||||
Increase (decrease) in liabilities | ||||||||||||
Trade accounts payable | 1,255 | 2,212 | (465 | ) | ||||||||
Rental payable | 280 | 666 | 176 | |||||||||
Payroll, provisions and social charges | 2,788 | 2,518 | 1,368 | |||||||||
Taxes and contributions payable | 1,435 | (119 | ) | 1,474 | ||||||||
Royalties and franchise fees payable | 433 | (2,135 | ) | (2,060 | ) | |||||||
Deferred rent | 1,272 | — | — | |||||||||
Accounts payable to minority partners | (232 | ) | (498 | ) | 360 | |||||||
Other liabilities | 606 | 33 | (240 | ) | ||||||||
Transactions with related parties, net | (577 | ) | 382 | 324 | ||||||||
Income tax and social contribution paid | (20,979 | ) | (13,797 | ) | (9,936 | ) | ||||||
|
|
|
|
|
| |||||||
Net cash provided by operating activities | 35,380 | 29,441 | 18,817 | |||||||||
|
|
|
|
|
| |||||||
Cash flow from investing activities | ||||||||||||
Purchase of property, fixture and equipment (Note 8) | (26,275 | ) | (22,441 | ) | (17,624 | ) | ||||||
Purchase of intangibles (Note 9) | (3,812 | ) | (500 | ) | (792 | ) | ||||||
|
|
|
|
|
| |||||||
Net cash used in investing activities | (30,087 | ) | (22,941 | ) | (18,416 | ) | ||||||
|
|
|
|
|
| |||||||
Cash flows from financing activities | ||||||||||||
Proceeds from loans | 2,494 | — | — | |||||||||
Repayment of loans | (165 | ) | (1,255 | ) | (1,766 | ) | ||||||
Dividends paid to equity holders of the parent | — | — | (749 | ) | ||||||||
Receipt of minority partner deposit and accrued buyouts | 3,178 | 2,654 | 860 | |||||||||
Interest paid | — | (165 | ) | (330 | ) | |||||||
|
|
|
|
|
| |||||||
Net cash provided by (used in) financing activities | 5,507 | 1,234 | (1,985 | ) | ||||||||
|
|
|
|
|
| |||||||
Increase (decrease) in cash and cash equivalents | 10,800 | 7,734 | (1,584 | ) | ||||||||
|
|
|
|
|
| |||||||
Cash and cash equivalents at the end of the year (Note 5) | 21,832 | 11,032 | 3,298 | |||||||||
Cash and cash equivalents at the beginning of the year (Note 5) | 11,032 | 3,298 | 4,882 | |||||||||
|
|
|
|
|
| |||||||
Increase (decrease) in cash and cash equivalents | 10,800 | 7,734 | (1,584 | ) | ||||||||
|
|
|
|
|
| |||||||
See accompanying notes.
Index to Financial Statements
PGS CONSULTORIA E SERVIÇOS LTDA.
Notes to consolidated financial statements
December 31, 2011 (unaudited), 2010 and 2009 (unaudited)
(In thousands of reais, except when mentioned otherwise)
1. Corporate information
PGS Consultoria e Serviços Ltda. (“PGS Consultoria” or the “Parent Company”) was formed in May 1997 and is headquartered at Av. Dr. Chucri Zaidan, 80, 8th floor, in the City and State of São Paulo.
PGS Consultoria is the holding company of the CLS Companies (collectively referred as the “Group”). The main purpose of the CLS Companies (“CLS”), which is comprised of (i) CLS São Paulo Ltda. (“CLS SP”); (ii) CLS Restaurantes Rio de Janeiro Ltda. (“CLS RJ”); (iii) CLS Restaurantes Brasília Ltda. (“CLS BSB”); and (iv) CLS Restaurantes do Sul Ltda. (“CLS do Sul”), is to explore and manage restaurants under the trade mark “Outback Steakhouse” in Brazil.
“Outback Steakhouse” is an Australian steakhouse concept, open for dinner only in the United States of America, but for both lunch and dinner in some areas of the world, such as in Brazil. Although beef and steak items make up a good portion of the menu, the concept offers a variety of chicken, ribs, seafood, and pasta dishes. The Group’s strategy is to differentiate its restaurants by emphasizing consistently high-quality food, concentrated service, generous portions at affordable prices and a casual atmosphere suggestive of the Australian Outback.
CLS operates 34 (thirty four) restaurants altogether, in sixteen different cities, being: (i) 8 (eight) in Rio de Janeiro and 1 (one) in Niterói, State of Rio de Janeiro, and 1 (one) in Vitoria, State of Espirito Santo (CLS RJ); (ii) 10 (ten) in São Paulo, 2 (two) in Campinas, 1(one) in Barueri, 1 (one) in São Bernado do Campo, 1(one) in São Caetano do Sul, 1(one) in São José dos Campos and 1 (one) in Ribeirão Preto, State of São Paulo (CLS SP); (iii) 2 (two) in Brasilia, Federal District, 1 (one) in Belo Horizonte, State of Minas Gerais, 1 (one) in Salvador, State of Bahia, and 1 (one) in Goiânia, State of Goiás (CLS BSB); and (iv) 1 (one) in Porto Alegre, State of Rio Grande do Sul and 1 (one) in Curitiba, State of Paraná (CLS do Sul).
These consolidated financial statements were approved by the Parent Company’s management on March 25, 2011.
2. Basis of preparation
The preparation of the accompanying consolidated financial statements requires management to make certain estimates and assumptions that affect the reported amounts. These estimates were determined based on objective and subjective factors, considering management’s judgment to determine the adequate amounts to be recorded in the consolidated financial statements.
Significant items subject to such estimates and assumptions include selection of useful lives of property, fixtures and equipment and analysis of their recoverability in operations, credit risk assessment to determine the allowance for doubtful accounts, as well as analysis of other risks to determine other provisions, including those set up for contingencies. Settlement of transactions involving these estimates may result in amounts significantly different from those recorded in the consolidated financial statements due to the uncertainties inherent in the estimation process. The Group reviews its estimates and assumptions at least annually.
The consolidated financial statements were prepared and are presented in accordance with the accounting practices adopted in Brazil, which comprise the pronouncements, interpretations and guidance issued by the Brazilian Accounting Pronouncements Committee (Comitê de Pronunciamentos Contábeis (“CPC”)), which are converged to the International Financial Reporting Standards (“IFRS”) issued by the International Accounting Standards Board (“IASB”).
Index to Financial Statements
PGS CONSULTORIA E SERVIÇOS LTDA.
Notes to consolidated financial statements
December 31, 2011 (unaudited), 2010 and 2009 (unaudited)
(In thousands of reais, except when mentioned otherwise)NOTES TO CONSOLIDATED FINANCIAL STATEMENTS (UNAUDITED)—(Continued)
9. Fair Value Measurements
2.Fair Value Measurements on a Recurring Basis
In connection with the 2012 CMBS Loan, the Company entered into an interest rate cap with a notional amount of preparation(Continued)
The consolidated financial statements presented herein do not include$48.7 million as a method to limit the Parent Company’s stand alone financial statements and are not intended to be used for statutory purposes.
Accounting practices adopted in Brazil (“BR GAAP”) differ in significant respects from accounting principles generally accepted in the United States of America (“US GAAP”). A description of certain differences on cash flows from BR GAAP to US GAAP is provided in Note 18.
3. Basis of consolidation
The consolidated financial statements include the operations of PGS Consultoria and the “CLS Companies”. The detailsvolatility of the participation in CLS Companies, comprised of CLS SP, CLS RJ, CLS BSB and CLS do Sul, are summarized as follow:
| 2011 (unaudited) | 2010 | 2009 (unaudited) | ||||||||||||||||||||||
| Capital | Retained | Capital | Retained | Capital | Retained | |||||||||||||||||||
| stock(1) | earnings(2) | stock(1) | earnings(2) | stock(1) | earnings(2) | |||||||||||||||||||
CLS SP | 89.96 | % | 100 | % | 91.60 | % | 100 | % | 90.78 | % | 100 | % | ||||||||||||
CLS RJ | 96.22 | % | 100 | % | 96.08 | % | 100 | % | 96.72 | % | 100 | % | ||||||||||||
CLS BSB | 95.51 | % | 100 | % | 95.63 | % | 100 | % | 95.72 | % | 100 | % | ||||||||||||
CLS do Sul | 97.17 | % | 100 | % | 97.17 | % | 100 | % | 97.17 | % | 100 | % | ||||||||||||
The financial statementsfloating rate component of the CLS Companies are prepared for the same reporting period as the Parent Company. Accounting policies of CLS Companies have been adjusted to ensure consistency with the accounting policies adopted by the Group. All intra-group balances, incomefirst mortgage loan. This interest rate cap had a nominal fair market value at March 31, 2013 and expenses, unrealized gain and losses and dividends resulting from intra-group transactions have been eliminated in consolidation.December 31, 2012.
Fair Value Measurements on a Nonrecurring Basis of consolidation from January 1, 2010
Capital contributions to the CLS Companies received from the minority partners are recorded as long-term liabilities in the line item “minority partner deposit”. Monthly payments made pursuant to the “Protocolo de Entendimentos” (Memorandum of Understanding) are paid as dividends and are recognized as compensation expense in the period earned by the minority partners.
Basis of consolidation prior to January 1, 2010
The above-mentioned requirementsfollowing tables present losses related to the Company’s assets and liabilities that were appliedmeasured at fair value on a retrospective basis.nonrecurring basis during the three months ended March 31, 2013 and 2012 aggregated by the level in the fair value hierarchy within which those measurements fall (in thousands):
| March 31, 2013 | Three Months Ended March 31, 2013 Total Losses | |||||||||||||||||||
| Carrying Value | Remaining Fair Value | |||||||||||||||||||
| Level 1 | Level 2 | Level 3 | ||||||||||||||||||
Long-lived assets held and used | $ | 4,434 | $ | — | $ | 3,383 | $ | 1,051 | $ | 1,082 | ||||||||||
Index March 31, 2012 Three Months
Ended March 31,
2012
Total Losses Carrying
Value Remaining Fair Value Level 1 Level 2 Level 3 Long-lived assets held and used
$ 864 $ — $ 650 $ 214 $ 3,884
The Company recorded $1.1 million and $3.9 million of impairment charges as a result of the fair value measurement on a nonrecurring basis of its long-lived assets held and used during the three months ended March 31, 2013 and 2012, respectively, primarily related to Financialcertain specifically identified restaurant locations that have, or are scheduled to be, relocated or closed or are under-performing. The impaired long-lived assets had $4.4 million and $0.9 million of remaining fair value at March 31, 2013 and 2012, respectively. Restaurant closure and related expenses of $0.8 million and $0.5 million were recognized for the three months ended March 31, 2013 and 2012, respectively. Impairment losses for long-lived assets held and used and restaurant closure and related expenses were recognized in Provision for impaired assets and restaurant closings in the Consolidated Statements
Ended March 31,
2012
Total Losses
Value
Long-lived assets held and used
PGS CONSULTORIA E SERVIÇOS LTDA. of Operations and Comprehensive Income.
NotesThe Company primarily used third-party market appraisals (Level 2) and discounted cash flow models (Level 3) to consolidated financial statements
December 31, 2011 (unaudited), 2010 and 2009 (unaudited)
(In thousands of reais, except when mentioned otherwise)
4. Summary of significant accounting policies
4.1. Revenue recognition
Revenue is recognized to the extent that it is probable that the economic benefits are likely to flow to the Group and the revenue can be reliably measured, regardless of when payment is made.
Revenue is measured atestimate the fair value of the consideration received or receivable, netlong-lived assets included in the tables above. Projected future cash flows, including discount rate and growth rate assumptions, are derived from current economic conditions, expectations of discountsmanagement and taxes.projected trends of current operating results.
Revenue from sale is recognized when the significant risks and rewards have passedThe following table presents quantitative information related to the buyer. No revenue is recognized if there are significant uncertainties regardingrange of unobservable inputs used in the Company’s Level 3 fair value measurements for the impairment losses incurred in the three months ended March 31, 2013 and 2012:
| Three Months Ended March 31, | ||||
Unobservable Input | 2013 | 2012 | ||
Weighted-average cost of capital | 9.5% | 11.2% | ||
Long-term growth rates | 2.0% | 3.0% | ||
Annual revenue growth rates (1) | 2.4% - 3.0% | (8.7)% - 3.0% | ||
| (1) | Weighted averages of the annual revenue growth rates unobservable input range for the three months ended March 31, 2013 and 2012 were 2.6% and 2.4%, respectively. |
BLOOMIN’ BRANDS, INC.
NOTES TO CONSOLIDATED FINANCIAL STATEMENTS (UNAUDITED)—(Continued)
The Company performed its realization.annual goodwill and other indefinite-lived intangible assets impairment test during the second quarter of 2012 and did not have any impairment charges.
4.2. Foreign currency translationInterim Disclosures about Fair Value of Financial Instruments
The consolidatedCompany’s non-derivative financial statements are presented in Brazilian Reais, which is also the Parent Companyinstruments at March 31, 2013 and the CLS Companies’ functional currency.
Foreign currency transactions are initially recorded by the Group entities at the functional currency exchange rate prevailing on the date of the transaction.
Monetary assets and liabilities denominated in foreign currency are translated at the functional currency exchange rate on the reporting date. All differences are recorded to the income statement.
4.3. Financial instruments
Financial instruments are only recognized as of the date when the Group becomes a part of the contract provisions of financial instruments. Once recognized, they are initially recorded at their fair value plus transaction costs that are directly attributable to their acquisition or issuance, except in the case of financial assets and liabilities classified in the category at fair value through profit or loss (“P&L”), when such costs are directly charged to P&L for the period. Subsequent measurement of financial assets and liabilities is determined by their classification at each balance sheet.
The Group’s most significant financial assets are cash and cash equivalents and accounts receivable, whereas the main financial liabilities are comprised of trade accounts payable and loans.
4.4. Cash and cash equivalents
Cash and cash equivalents include bank account balances and short-term investments redeemable within three months or less from the date of acquisition, subject to insignificant risk of change in their market value. The short-term investments included as cash equivalents are mostly classified as “financial assets at fair value through P&L”.
4.5. Trade accounts receivable
Trade accounts receivable are shown at realization amounts, and refer primarily to the amounts to be received from credit cards companies due to the sales in the restaurants. No allowance for doubtful accounts has been recorded due to the remote chances of losses on receivables.
Index to Financial Statements
PGS CONSULTORIA E SERVIÇOS LTDA.
Notes to consolidated financial statements
December 31, 2011 (unaudited), 2010 and 2009 (unaudited)
(In thousands of reais, except when mentioned otherwise)
4. Summary of significant accounting policies (Continued)
4.6. Inventories
Inventories are valued at the lower of cost and net realizable value. Inventories consist of food and beverages and restaurant supplies, and are stated at the average purchase cost.
4.7. Property, fixtures and equipment
Property, fixtures and equipment are stated at acquisition cost, net of accumulated depreciation. Improvements to leased properties are depreciated over the lease term. Depreciation is computed on the straight-line method over the following estimated useful lives:
| ||||
| ||||
| ||||
| ||||
|
The CLS companies capitalize all direct costs incurred to construct its restaurants. Upon restaurant opening, these costs are depreciated and charged to the consolidated statements of income. The amount of interest capitalized in connection with restaurant construction was immaterial in all periods.
An item of property, fixtures and equipment is derecognized upon disposal or when no future economic benefits are expected from its use or disposal. Any gains or losses arising on derecognition of the asset is included in the consolidated statements of income when the asset is derecognized.
The assets’ residual value, useful lives and methods of depreciation are reviewed at each financial year end, and adjusted prospectively, if appropriate.
4.8. Intangible assets
Intangible assets consist primarily of software and franchise fees. Intangible assets acquired separately are measured on initial recognition at cost. After the initial recognition, intangible assets are presented at cost, net of accrued amortization and impairment losses.
The useful lives of intangible assets are assessed as either finite or indefinite. Intangible assets with finite lives are amortized over the useful economic life. Both finite and indefinite intangible assets are assessed for impairment whenever there is an indication that the intangible asset may be impaired.
Gains or losses arising from derecognition of an intangible asset are included in the consolidated statements of income when the asset is derecognized.
4.9. Loans
Loans are recognized initially at fair value, plus directly attributable transaction costs. Following the initial recognition, loans subject to interest are measured at the amortized cost using the effective interest rate method. Gains and losses are recognized in the income statement at the time when the liabilities are written off, as well as during the amortization process according to the effective interest rate method.
Index to Financial Statements
PGS CONSULTORIA E SERVIÇOS LTDA.
Notes to consolidated financial statements
December 31, 2011 (unaudited), 2010 and 2009 (unaudited)
(In thousands of reais, except when mentioned otherwise)
4. Summary of significant accounting policies(Continued)
4.10. Other assets and liabilities
Liabilities are recognized in the balance sheet when the Group has a legal or constructive obligation arising from past events, the settlement of which is expected to result in an outflow of economic benefits. Provisions are recorded reflecting the best estimates of the risk involved. An asset is recognized in the balance sheet when it is likely that its economic benefits will flow to the Group and its cost or value may be safely measured.
Assets and liabilities are classified as current when their realization or settlement is likely to occur within the following twelve months. Otherwise they are stated as noncurrent.
4.11. Taxation
Taxes on sales
Revenues from sales and services are subject to the following taxes and contributions, at the rates shown below:
| ||||
| ||||
| ||||
|
The above charges are presented as deductions from sales in the consolidated statements of income.
Income tax and social contribution—current
Taxation on income includes the income tax and the social contribution. CLS SP, CLS RJ and CLS Brasília record the income tax and social contribution based on taxable income (previously based on the presumed profits method). Income tax is calculated at a rate of 15%, plus a surtax of 10% on taxable profit exceeding R$ 240 over 12 months, whereas social contribution tax is computed at a rate of 9% on taxable profit, both recognized on an accrual basis. Therefore, additions to the book profit of expenses, temporarily nondeductible, or exclusions from revenues, temporarily nontaxable, for computation of current taxable profit generate deferred tax credits or debits.
The computation for income tax and social contribution for the CLS Sul was calculated according with the presumed profits method, which basis and rates are set forth in the tax legislation in force. CLS BSB was included in the presumed profits method until December 31, 2010.
Advances or amounts subject to offset are stated in current or non-current assets, according to the estimate of their realization.
Index to Financial Statements
PGS CONSULTORIA E SERVIÇOS LTDA.
Notes to consolidated financial statements
December 31, 2011 (unaudited), 2010 and 2009 (unaudited)
(In thousands of reais, except when mentioned otherwise)
4. Summary of significant accounting policies(Continued)
4.11. Taxation(Continued)
Income tax and social contribution—deferred
Deferred income tax and social contribution are generated by tax loss carryforwards and by temporary differences on the balance sheet date between the tax basis of assets and liabilities and their book values.
The book value of deferred tax assets is reviewed at each reporting date and reduced to the extent that it is no longer probable that sufficient taxable profit will be available to allow all or part of the deferred tax asset to be utilized. Unrecognized deferred tax assets are reassessed at each reporting date and are recognized to the extent that it has become probable that future taxable profits will allow the deferred tax asset to be recovered.
Deferred income tax and social contribution assets and liabilities are measured at the tax rates that are expected to apply in the year when the asset is realized or the liability is settled, based on tax rates (and tax laws) that have been enacted at the reporting date.
Deferred tax assets and liabilities are offset if a legally enforceable right to offset exists and the deferred taxes relate to the same taxable entity and the same taxation authority.
4.12. Judgments, estimates and significant accounting assumptions
Judgments
The preparation of the consolidated financial statements requires management to make judgments and estimates, and adopt assumptions that affect the amounts stated for revenues, expenses, assets and liabilities, as well as the disclosures of contingent liabilities on the financial statement date.
However, uncertainties regarding these estimates and assumptions might lead to results that require significant adjustments to the book value of an asset or liability affected in future periods.
Estimates and assumptions
Major assumptions related to sources of uncertainty in future estimates and other relevant sources of uncertainty in estimates on the balance sheet date that entail significant risk of material adjustment to the book value of assets and liabilities in the next financial year are discussed as follows.
Impairment loss on nonfinancial assets
Impairment loss exists when the carrying value of an asset or cash-generating unit exceeds its recoverable amount, which is the higher of fair value less sales costs and value in use. The fair value less sales cost is calculated based on available information about similar asset sales transactions or market-observable prices less additional costs to dispose of the asset item. In 2011 the Company recorded impairment loss in the amount of R$300 related to leasehold improvements located in office spaces that the Company plans to vacate. No other evidence indicating that the asset net book values exceeding their recoverable amounts has been identified.
Index to Financial Statements
PGS CONSULTORIA E SERVIÇOS LTDA.
Notes to consolidated financial statements
December 31, 2011 (unaudited), 2010 and 2009 (unaudited)
(In thousands of reais, except when mentioned otherwise)
4. Summary of significant accounting policies(Continued)
4.12. Judgments, estimates and significant accounting assumptions(Continued)
Estimates and assumptions (Continued)
Taxes
Uncertainties exist with respect to the interpretation of complex tax regulations and the amount and timing of future taxable income. The Group establishes provisions, based on reasonable estimates, for possible consequences of audits by the tax authorities. The amount of such provisions is based on several factors, such as experience of previous tax audits and differing interpretations of tax regulations by the taxable entity and the responsible tax authority.
Deferred tax assets are recognized for all unused tax losses to the extent that it is probable that taxable profit will be available against which the losses can be utilized. Significant management judgment is required to determine the amount of deferred tax assets that can be recognized, based upon the likely timing and the level of future taxable profits together with future tax strategies.
The Group has tax loss carryforwards for both income tax and social contribution amounting approximately to R$2,197 at December 31, 2011 (R$2,100 in 2010). These losses, which relate to the Parent Company that has a history of taxable losses, do not expire and may not be used to offset taxable income elsewhere in the Group. Tax-offsettable losses generated in Brazil may be offset against future taxable profit up to 30% of the taxable profit determined in any given year. CLS SP, CLS RJ and CLS Brasília have no tax losses, but taxable temporary differences.
If the Group was able to recognize all unrecognized deferred tax assets, profit would increase by R$1,143 at December 31, 2011 (R$705 in 2010). Further details on deferred taxes are disclosed in Note 13.3.
Provisions
Provisions are recognized when the Group has a present obligation (legal or constructive) as a result of a past event, and it is probable that an outflow of resources embodying economic benefits will be required to settle the obligation and a reliable estimate can be made of the amount of the obligation. The expense relating to any provision is presented in the income statement net of any reimbursement.
Provisions are recorded in an amount considered sufficient by the Group’s management, supported by the opinion of their legal advisors, to cover probable losses on lawsuits. Further details on contingencies are disclosed in Note 12.
4.13. Minority partner distributions and buyouts
The proprietors and the JVs are required to sign a five to seven-year agreement (“Protocolo de Entendimentos”—Memorandum of Understanding) and to purchase an ownership interest in the CLS Companies. This ownership interest gives the proprietor and the JVs the right to receive distributions based on a percentage of the after-tax income results of their respective restaurants for the duration of the agreement.
PGS Consultoria has the option to purchase the minority partners’ interests after a five to seven-year period based on the terms specified in the agreement.
Index to Financial Statements
PGS CONSULTORIA E SERVIÇOS LTDA.
Notes to consolidated financial statements
December 31, 2011 (unaudited), 2010 and 2009 (unaudited)
(In thousands of reais, except when mentioned otherwise)
4. Summary of significant accounting policies (Continued)
4.13. Minority partner distributions and buyouts (Continued)
The Group estimates future purchases of proprietors’ and JVs’ interests using current information on restaurant performance and records the minority partner obligations in the line item “accrued buyout liability” in the consolidated balance sheets. In the period the Group purchases the proprietors’ and JVs’ interests, an adjustment is recorded to recognize any remaining expense associated with the purchase and reduce the related accrued buyout liability.
Distributions made to proprietors and JVs are included in “restaurant payroll expenses” and “general and administrative expenses,” respectively, in the consolidated statements of income.
4.14 Operating Leases
Rent expense for the Company’s operating leases, which generally have escalating rentals over the term of the lease and may include potential rent holidays, is recorded on a straight-line basis over the initial lease term and those renewal periods that are reasonably assured. The initial lease term includes the “build-out” period of the Company’s leases, which is typically before rent payments are due under the terms of the lease. The difference between rent expense and rent paid is recorded as deferred rent and is included in the Consolidated Balance Sheets. Payments received from landlords as incentives for leasehold improvements are recorded as deferred rent and are amortized on a straight-line basis over the term of the lease as a reduction of rent expense. Lease termination fees, if any, and future obligated lease payments for closed locations are recorded as an expense in the period that they are incurred.
4.15. Pre-Opening Expenses
Non-capital expenditures associated with opening new restaurants are expensed as incurred.
5. Cash and cash equivalents
| 2011 | 2009 | |||||||||||
| (unaudited) | 2010 | (unaudited) | ||||||||||
Cash | 60 | 50 | 60 | |||||||||
Bank deposits | 8,228 | 1,917 | 3,236 | |||||||||
Short term investments | 13,544 | 9,065 | 2 | |||||||||
|
|
|
|
|
| |||||||
| 21,832 | 11,032 | 3,298 | ||||||||||
|
|
|
|
|
| |||||||
Cash equivalents consist of investments that are readily convertible to cash with an original maturity date of three months or less.
Index to Financial Statements
PGS CONSULTORIA E SERVIÇOS LTDA.
Notes to consolidated financial statements
December 31, 2011 (unaudited), 2010 and 2009 (unaudited)
(In thousands of reais, except when mentioned otherwise)
6. Trade accounts receivable
Trade accounts receivable consist mainly of amounts receivable from credit card companies, as follows:
| 2011 | 2009 | |||||||||||
| (unaudited) | 2010 | (unaudited) | ||||||||||
Redecard (Mastercard/Diners/Credicard) | 3,884 | 2,604 | 2,012 | |||||||||
Visanet (Visa/Visa electron) | 8,722 | 5,501 | 4,355 | |||||||||
American express | 729 | 366 | 473 | |||||||||
Other | 2,218 | 1,385 | 569 | |||||||||
|
|
|
|
|
| |||||||
| 15,553 | 9,856 | 7,409 | ||||||||||
|
|
|
|
|
| |||||||
7. Inventories
| 2011 | 2009 | |||||||||||
| (unaudited) | 2010 | (unaudited) | ||||||||||
Kitchen utensils | 1,768 | 1,666 | 1,551 | |||||||||
Meat and Chicken | 1,184 | 969 | 736 | |||||||||
Dairy | 251 | 245 | 207 | |||||||||
Pagers | 342 | 252 | 282 | |||||||||
Distilled | 321 | 256 | 240 | |||||||||
Beverage | 324 | 309 | 261 | |||||||||
Vegetables | 149 | 134 | 103 | |||||||||
Wine | 282 | 148 | 177 | |||||||||
Beer | 149 | 122 | 89 | |||||||||
Shrimp | 68 | 40 | 37 | |||||||||
Fish | 111 | 66 | 48 | |||||||||
Inventories held by third-parties | 3,634 | 3,530 | 3,707 | |||||||||
Imports in transit | 298 | 717 | 559 | |||||||||
Other | 1,184 | 2,006 | 1,490 | |||||||||
|
|
|
|
|
| |||||||
| 10,065 | 10,460 | 9,487 | ||||||||||
|
|
|
|
|
| |||||||
Index to Financial Statements
PGS CONSULTORIA E SERVIÇOS LTDA.
Notes to consolidated financial statements
December 31, 2011 (unaudited), 2010 and 2009 (unaudited)
(In thousands of reais, except when mentioned otherwise)
8. Property, fixtures and equipment
| Land | Furniture and fixture | Computers | Equipment and facilities | Buildings | Leasehold improvements | Construction in progress | Total | |||||||||||||||||||||||||
Cost | ||||||||||||||||||||||||||||||||
Balances at December 31, 2008 (unaudited) | 3,363 | 11,142 | 4,224 | 24,568 | 33,408 | 7,729 | 73 | 84,507 | ||||||||||||||||||||||||
Additions | — | 2,168 | 999 | 5,021 | 7,225 | 951 | 1,260 | 17,624 | ||||||||||||||||||||||||
Write-offs | — | (18 | ) | — | — | — | — | (13 | ) | (31 | ) | |||||||||||||||||||||
|
|
|
|
|
|
|
|
|
|
|
|
|
|
|
| |||||||||||||||||
Balances at December 31, 2009 (unaudited) | 3,363 | 13,292 | 5,223 | 29,589 | 40,633 | 8,680 | 1,320 | 102,100 | ||||||||||||||||||||||||
Additions | — | 2,301 | 1,153 | 7,148 | 8,495 | 1,778 | 1,566 | 22,441 | ||||||||||||||||||||||||
Transfer | — | 1,280 | 90 | 804 | — | 712 | (2,886 | ) | — | |||||||||||||||||||||||
|
|
|
|
|
|
|
|
|
|
|
|
|
|
|
| |||||||||||||||||
Balances at December 31, 2010 | 3,363 | 16,873 | 6,466 | 37,541 | 49,128 | 11,170 | — | 124,541 | ||||||||||||||||||||||||
Additions | — | 1,156 | 587 | 5,953 | 2,975 | 8,521 | 7,083 | 26,275 | ||||||||||||||||||||||||
Transfer | — | 3,043 | (41 | ) | 3,193 | 8,265 | (7,377 | ) | (7,083 | ) | — | |||||||||||||||||||||
|
|
|
|
|
|
|
|
|
|
|
|
|
|
|
| |||||||||||||||||
Balances at December 31, 2011 (unaudited) | 3,363 | 21,072 | 7,012 | 46,687 | 60,368 | 12,314 | — | 150,816 | ||||||||||||||||||||||||
|
|
|
|
|
|
|
|
|
|
|
|
|
|
|
| |||||||||||||||||
Depreciation | ||||||||||||||||||||||||||||||||
Balances at December 31, 2008 (unaudited) | — | (3,445 | ) | (2,041 | ) | (7,977 | ) | (5,583 | ) | (2,424 | ) | — | (21,470 | ) | ||||||||||||||||||
Additions | — | (1,207 | ) | (759 | ) | (2,750 | ) | (2,466 | ) | (717 | ) | — | (7,899 | ) | ||||||||||||||||||
|
|
|
|
|
|
|
|
|
|
|
|
|
|
|
| |||||||||||||||||
Balances at December 31, 2009 (unaudited) | — | (4,652 | ) | (2,800 | ) | (10,727 | ) | (8,049 | ) | (3,141 | ) | — | (29,369 | ) | ||||||||||||||||||
Additions | — | (1,283 | ) | (825 | ) | (3,109 | ) | (3,098 | ) | (750 | ) | — | (9,065 | ) | ||||||||||||||||||
Write-offs | — | — | — | — | 85 | — | — | 85 | ||||||||||||||||||||||||
|
|
|
|
|
|
|
|
|
|
|
|
|
|
|
| |||||||||||||||||
Balances at December 31, 2010 | — | (5,935 | ) | (3,625 | ) | (13,836 | ) | (11,062 | ) | (3,891 | ) | — | (38,349 | ) | ||||||||||||||||||
Additions | (1,597 | ) | (831 | ) | (3,592 | ) | (3,763 | ) | (917 | ) | — | (10,700 | ) | |||||||||||||||||||
Impairment | — | — | — | — | — | (300 | ) | — | (300 | ) | ||||||||||||||||||||||
|
|
|
|
|
|
|
|
|
|
|
|
|
|
|
| |||||||||||||||||
Balances at December 31, 2011 (unaudited) | — | (7,532 | ) | (4,456 | ) | (17,428 | ) | (14,825 | ) | (5,108 | ) | — | (49,349 | ) | ||||||||||||||||||
|
|
|
|
|
|
|
|
|
|
|
|
|
|
|
| |||||||||||||||||
Residual value | ||||||||||||||||||||||||||||||||
Balances at December 31, 2009 (unaudited) | 3,363 | 8,640 | 2,423 | 18,862 | 32,584 | 5,539 | 1,320 | 72,731 | ||||||||||||||||||||||||
|
|
|
|
|
|
|
|
|
|
|
|
|
|
|
| |||||||||||||||||
Balances at December 31, 2010 | 3,363 | 10,938 | 2,841 | 23,705 | 38,066 | 7,279 | — | 86,192 | ||||||||||||||||||||||||
|
|
|
|
|
|
|
|
|
|
|
|
|
|
|
| |||||||||||||||||
Balances at December 31, 2011 (unaudited) | 3,363 | 13,540 | 2,556 | 29,259 | 45,543 | 7,206 | — | 101,467 | ||||||||||||||||||||||||
|
|
|
|
|
|
|
|
|
|
|
|
|
|
|
| |||||||||||||||||
Average annual depreciation rate | — | 10% | 20% | 10% | 4% | 6.7% to 10% | — | — | ||||||||||||||||||||||||
|
|
|
|
|
|
|
|
|
|
|
|
|
|
|
| |||||||||||||||||
Index to Financial Statements
PGS CONSULTORIA E SERVIÇOS LTDA.
Notes to consolidated financial statements
December 31, 2011 (unaudited), 2010 and 2009 (unaudited)
(In thousands of reais, except when mentioned otherwise)
8. Property, fixtures and equipment(Continued)
In 2011 the Company recorded impairment loss in the amount of R$300 related to leasehold improvements located in office spaces that the Company plans to vacate. No other evidence indicating that the asset net book values exceeding their recoverable amounts has been identified.
9. Intangible assets
| Software | Franchise fees | Other | Total | |||||||||||||
Cost | ||||||||||||||||
Balances at December 31, 2008 (unaudited) | — | 2,215 | 1,119 | 3,334 | ||||||||||||
Additions | 190 | 493 | 109 | 792 | ||||||||||||
Write-offs | — | — | (9) | (9) | ||||||||||||
|
|
|
|
|
|
|
| |||||||||
Balances at December 31, 2009 (unaudited) | 190 | 2,708 | 1,219 | 4,117 | ||||||||||||
Additions | 93 | 374 | 33 | 500 | ||||||||||||
Write-offs | — | (57) | (191) | (248) | ||||||||||||
|
|
|
|
|
|
|
| |||||||||
Balances at December 31, 2010 | 283 | 3,025 | 1,061 | 4,369 | ||||||||||||
Additions | 2,416 | 431 | 965 | 3,812 | ||||||||||||
Write-offs | — | (6) | (4) | (10) | ||||||||||||
|
|
|
|
|
|
|
| |||||||||
Balances at December 31, 2011 (unaudited) | 2,699 | 3,450 | 2,022 | 8,171 | ||||||||||||
|
|
|
|
|
|
|
| |||||||||
Amortization | ||||||||||||||||
Balances at December 31, 2008 (unaudited) | — | (604) | (63) | (667) | ||||||||||||
Additions | — | (120) | (86) | (206) | ||||||||||||
|
|
|
|
|
|
|
| |||||||||
Balances at December 31, 2009 (unaudited) | — | (724) | (149) | (873) | ||||||||||||
Additions | (148) | (140) | (86) | (374) | ||||||||||||
|
|
|
|
|
|
|
| |||||||||
Balances at December 31, 2010 | (148) | (864) | (235) | (1,247) | ||||||||||||
Additions | — | (154) | (114) | (268) | ||||||||||||
|
|
|
|
|
|
|
| |||||||||
Balances at December 31, 2011 (unaudited) | (148) | (1,018) | (349) | (1,515) | ||||||||||||
|
|
|
|
|
|
|
| |||||||||
Residual value | ||||||||||||||||
Balances at December 31, 2009 (unaudited) | 190 | 1,984 | 1,070 | 3,244 | ||||||||||||
|
|
|
|
|
|
|
| |||||||||
Balances at December 31, 2010 | 135 | 2,161 | 826 | 3,122 | ||||||||||||
|
|
|
|
|
|
|
| |||||||||
Balances at December 31, 2011 (unaudited) | 2,551 | 2,432 | 1,673 | 6,656 | ||||||||||||
|
|
|
|
|
|
|
| |||||||||
Average annual amortization rate | 20% | 5% | 20% | |||||||||||||
|
|
|
|
|
| |||||||||||
Franchise fee
The Group has a franchise agreement with Outback Steakhouse International (“OSI”), which expires generally 20 years after the date restaurant is opened. The Group has the option to renew the agreement for one consecutive term of 20 years, subject to certain conditions. Pursuant to the Agreement, the Group must operate the restaurant in strict conformity with the methods, standards and specifications prescribed by OSI, regarding training, staff, health standards, suppliers and advertising, among others. The Group is contractually bound to pay franchise fees of US$ 40 at the opening of each restaurant, and monthly royalties of 4% to 5% of net sales after the restaurant is opened. Royalties fees are charged to expenses as incurred.
Index to Financial Statements
PGS CONSULTORIA E SERVIÇOS LTDA.
Notes to consolidated financial statements
December 31, 2011 (unaudited), 2010 and 2009 (unaudited)
(In thousands of reais, except when mentioned otherwise)
10. Transactions with related parties
On December 31, 2011 (unaudited), 2010 and 2009 (unaudited) the balance of transactions with related parties can be summarized as follows:
| Assets | Liabilities | |||||||||||||||||||||||
| 2011 | 2009 | 2011 | 2009 | |||||||||||||||||||||
| (unaudited) | 2010 | (unaudited) | (unaudited) | 2010 | (unaudited) | |||||||||||||||||||
Current | ||||||||||||||||||||||||
Loans | ||||||||||||||||||||||||
Outback Steakhouse International | — | — | — | 577 | 822 | 940 | ||||||||||||||||||
Royalties payable | ||||||||||||||||||||||||
Outback Steakhouse International | — | — | — | 1,867 | 1,604 | 3,865 | ||||||||||||||||||
Franchise fees | ||||||||||||||||||||||||
Outback Steakhouse International | — | — | — | 375 | 205 | 79 | ||||||||||||||||||
|
|
|
|
|
|
|
|
|
|
|
| |||||||||||||
Total current | — | — | — | 2,819 | 2,631 | 4,884 | ||||||||||||||||||
|
|
|
|
|
|
|
|
|
|
|
| |||||||||||||
Noncurrent | ||||||||||||||||||||||||
Accounts receivable/payable | ||||||||||||||||||||||||
Outback Steakhouse International | 19 | 18 | 7 | 57 | 11 | 32 | ||||||||||||||||||
Starbucks Brasil Comércio de Cafés Ltda. | 110 | 104 | 530 | — | — | — | ||||||||||||||||||
|
|
|
|
|
|
|
|
|
|
|
| |||||||||||||
| 129 | 122 | 537 | 57 | 11 | 32 | |||||||||||||||||||
Loans | ||||||||||||||||||||||||
Outback Steakhouse International | — | — | — | — | 505 | 1,374 | ||||||||||||||||||
|
|
|
|
|
|
|
|
|
|
|
| |||||||||||||
Other | — | — | — | 146 | 12 | 24 | ||||||||||||||||||
|
|
|
|
|
|
|
|
|
|
|
| |||||||||||||
Total noncurrent | 129 | 122 | 537 | 203 | 528 | 1,430 | ||||||||||||||||||
|
|
|
|
|
|
|
|
|
|
|
| |||||||||||||
Total | 129 | 122 | 537 | 3,022 | 3,159 | 6,314 | ||||||||||||||||||
|
|
|
|
|
|
|
|
|
|
|
| |||||||||||||
Until 2010, PGS Consultoria provided administrative and/or technical services to Starbucks Brasil Comércio de Cafés Ltda., which were billed according to the agreements between the parties. The service revenues were R$ 1,035 in 2010 and R$ 908 in 2009 (unaudited).
| 2011 (unaudited) | 2010 | 2009 (unaudited) | ||||||||||||||||||||||
| Royalties (i) | Financial results (ii) | Royalties (i) | Financial results (ii) | Royalties (i) | Financial results (ii) | |||||||||||||||||||
Outback Steakhouse International | 18,356 | 124 | 14,576 | (118 | ) | 11,228 | 706 | |||||||||||||||||
|
|
|
|
|
|
|
|
|
|
|
| |||||||||||||
| 18,356 | 124 | 14,576 | (118 | ) | 11,228 | 706 | ||||||||||||||||||
|
|
|
|
|
|
|
|
|
|
|
| |||||||||||||
Index to Financial Statements
PGS CONSULTORIA E SERVIÇOS LTDA.
Notes to consolidated financial statements
December 31, 2011 (unaudited), 2010 and 2009 (unaudited)
(In thousands of reais, except when mentioned otherwise)
10. Transactions with related parties(Continued)
Outback Steakhouse International—“OSI”
The transactions between the Group and OSI consist of:
The Group is contractually bound to pay franchise fees of US$ 40 at the opening of each restaurant and monthly royalties of 4% to 5% of net sales after the restaurant is opened. Monthly royalty fees are charged to expenses as incurred.
The original principal balance of loans provided by OSI totaled US$ 3,200. The proceeds were substantially used to build the stores in Moema, Center Norte and Market Place, located in the city of São Paulo; Leblon and Norte Shopping, located in the city of Rio de Janeiro; and Flamboyant, located in the city of Goiania. The outstanding balance as of December 31, 2011 (unaudited), 2010 and 2009 (unaudited) can be summarized as follows:
| 2011 (unaudited) | 2010 | |||||||||||||||||||||||
Description | Current | Noncurrent | Total | Current | Noncurrent | Total | ||||||||||||||||||
Promissory Note—US$ 400—BZ 13 | — | — | — | 80 | 5 | 85 | ||||||||||||||||||
Promissory Note—US$ 400—BZ 14 | 83 | — | 83 | 133 | 67 | 200 | ||||||||||||||||||
Promissory Note—US$ 600—BZ 15 | 146 | — | 146 | 203 | 133 | 336 | ||||||||||||||||||
Promissory Note—US$ 600—BZ 16 | 146 | — | 146 | 203 | 133 | 336 | ||||||||||||||||||
Promissory Note—US$ 600—BZ 18 | 202 | — | 202 | 203 | 167 | 370 | ||||||||||||||||||
|
|
|
|
|
|
|
|
|
|
|
| |||||||||||||
Total | 577 | — | 577 | 822 | 505 | 1,327 | ||||||||||||||||||
|
|
|
|
|
|
|
|
|
|
|
| |||||||||||||
| 2009 (unaudited) | ||||||||||||
Description | Current | Noncurrent | Total | |||||||||
Promissory Note—US$ 600—BZ 11 | 35 | — | 35 | |||||||||
Promissory Note—US$ 400—BZ 13 | 139 | 86 | 225 | |||||||||
Promissory Note—US$ 400—BZ 14 | 139 | 209 | 348 | |||||||||
Promissory Note—US$ 600—BZ 15 | 209 | 348 | 557 | |||||||||
Promissory Note—US$ 600—BZ 16 | 209 | 348 | 557 | |||||||||
Promissory Note—US$ 600—BZ 18 | 209 | 383 | 692 | |||||||||
|
|
|
|
|
| |||||||
Total | 940 | 1,374 | 2,314 | |||||||||
|
|
|
|
|
| |||||||
At December 31, 2011 the main terms of outstanding loans can be summarized as follows:
| ||||||||
| ||||||||
| ||||||||
| ||||||||
|
Index to Financial Statements
PGS CONSULTORIA E SERVIÇOS LTDA.
Notes to consolidated financial statements
December 31, 2011 (unaudited), 2010 and 2009 (unaudited)
(In thousands of reais, except when mentioned otherwise)
10. Transactions with related parties(Continued)
Distribution of Profits—CLS Companies
Dividends paid to proprietors (stores’ managing partners) and to JVs (operating partners who supervise the Rio de Janeiro, São Paulo, Brasília and South Region stores) are distributed according to the criteria stated within each individual partner’s association document referred to as “Protocolo de Entendimento” (Memorandum of Understanding).
Partners are paid dividends according to a percentage of the after-tax income results (“ATI”) of their respective restaurants, as per their P&L statements. It is 7.5% of ATI for managing partners and 3.5% to 6% for operating partners. Members of top management have also received dividends based on certain monthly fixed amounts stipulated in the previous year’s budget submitted to and approved by OSI.
Based on the above and in accordance with local laws allowing actual distributions to be different than the exact amount owed to a partner, based on his/her members’ position, the CLS Companies distributed the following amounts to its partners during 2011 (unaudited), 2010, and 2009 (unaudited):
| 2011 (unaudited) | 2010 | 2009 (unaudited) | ||||||||||
Proprietors (stores’ managing partners) | 2,675 | 1,495 | 1,190 | |||||||||
JVs (operating partners) | 1,950 | 1,782 | 1,296 | |||||||||
Executives | 2,113 | 3,241 | 2,052 | |||||||||
|
|
|
|
|
| |||||||
| 6,738 | 6,518 | 4,538 | ||||||||||
|
|
|
|
|
| |||||||
Dividends paid to the minority partners are recognized as compensation expense in the consolidated statements of income in the period earned.
11. Loans
| 2011 (unaudited) | 2010 | |||||||||||||||||||||||
Description | Current | Noncurrent | Total | Current | Noncurrent | Total | ||||||||||||||||||
Banco do Brasil S.A. (i) | — | — | — | 165 | — | 165 | ||||||||||||||||||
Banco Nordeste Brasil S.A.(ii) | 762 | 1,732 | 2,494 | — | — | — | ||||||||||||||||||
|
|
|
|
|
|
|
|
|
|
|
| |||||||||||||
Total | 762 | 1,732 | 2,494 | 165 | — | 165 | ||||||||||||||||||
|
|
|
|
|
|
|
|
|
|
|
| |||||||||||||
| 2009 (unaudited) | ||||||||||||
Description | Noncurrent | Noncurrent | Total | |||||||||
Banco do Brasil S.A. (i) | 283 | 165 | 448 | |||||||||
Banco Nordeste Brasil S.A. (ii) | — | — | — | |||||||||
|
|
|
|
|
| |||||||
Total | 283 | 165 | 448 | |||||||||
|
|
|
|
|
| |||||||
Index to Financial Statements
PGS CONSULTORIA E SERVIÇOS LTDA.
Notes to consolidated financial statements
December 31, 2011 (unaudited), 2010 and 2009 (unaudited)
(In thousands of reais, except when mentioned otherwise)
12. Contingencies
The Group is involved in tax, civil and labor lawsuits arising in the normal course of operations. These matters are discussed at the administrative and judicial levels. Judicial deposits related to these matters are made, when applicable. The Company accrues for loss contingencies that are probable and reasonably estimable.
The provision amount of R$ 2,100 was recorded as of December 31, 2011 and is related mainly by approximately R$2,000 to uniforms allowance that was not subjected to social contribution and withholding income tax. Such provision covers all CLS companies.
At December 31, 2011 (unaudited), 2010 and 2009 (unaudited), the Group’s external legal advisors estimate the chances of a final unfavorable outcome as “possible” in certain matters, primarily related to labor and tax claims. The total possible contingencies that are uncertain at this time and could have a material adverse effect on the Company’s financial condition are R$11,600 as of December 31, 2011.
The three most significant cases for the CLS Companies involve amounts totaling approximately R$ 4,600 (CLS SP). These suits were filed by Secretaria de Fazenda do Estado de São Paulo seeking additional payments for ICMS under the taxpayer substitution system in addition to fines for noncompliance with other accessory obligations. The most significant case for PGS Consultoria, involves an amount totaling approximately R$ 2,900. In this matter the tax authorities are questioning the payment of income tax and social contribution.
The Group is questioning a matter related to the validity of the social contribution tax for intervention in the economic order (CIDE), established by law, on the remittance of royalties. Management, supported by preliminary injunctions granted in its favor, is judicially paying this tax. The judicial deposit related to this matter amounts to R$ 4,003 at December 31, 2011 (unaudited), (R$ 2,787 in 2010 and R$ 1,833 in 2009 (unaudited)). The Group maintains a provision related to this tax, which is presented in noncurrent liabilities in accordance with the expected date of outcome of these proceedings.
13. Income tax and social contribution
CLS do Sul has elected to calculate income tax and social contribution using the “presumed profits” method. Under the “presumed profits” method, taxable income is calculated as an amount equal to different percentages of gross revenue based on the activities of the taxpayer.
Under current Brazil tax law, the percentages of the CLS Companies’ gross revenues are 8% for calculating income tax, and 12% for social contribution. The Parent Company, CLS SP, CLS RJ, and CLS BSB calculate their income tax and social contribution using the “actual profits” method, which is based on total taxable income.
Index to Financial Statements
PGS CONSULTORIA E SERVIÇOS LTDA.
Notes to consolidated financial statements
December 31, 2011 (unaudited), 2010 and 2009 (unaudited)
(In thousands of reais, except when mentioned otherwise)
13. Income tax and social contribution(Continued)
Tax loss carry forwards through December 31, 2011 (unaudited) and 2010 relating to income tax and social contributions were approximately R$2,764 and R$ 2,100, respectively, comprised entirely of fiscal results of the Parent Company. These tax loss carry forwards can offset future taxable income. Brazilian tax laws restrict the offset of tax losses to 30% of taxable profits on an annual basis. These losses can be used indefinitely and are not impacted by a change in ownership of the Parent Company.
13.1. Components of income tax and social contribution provision
| 2011 (unaudited) | 2010 | 2009 (unaudited) | ||||||||||
Current income tax and social contribution | 21,365 | 13,927 | 10,653 | |||||||||
Deferred income tax and social contribution | (2,647 | ) | (910 | ) | (243 | ) | ||||||
|
|
|
|
|
| |||||||
| 18,718 | 13,017 | 10,410 | ||||||||||
|
|
|
|
|
| |||||||
13.2. Reconciliation income tax and social contribution provision at statutory rate to effective rate
| 2011 (unaudited) | 2010 | 2009 (unaudited) | ||||||||||
Income before income tax and social contribution | 40,911 | 32,980 | 23,801 | |||||||||
|
|
|
|
|
| |||||||
Income tax and social contribution at statutory rate of 34% | 13,910 | 11,213 | 8,092 | |||||||||
Benefits of utilizing presumed profits method of calculating of income tax and social contribution for CLS do Sul (also for CLS BSB in 2010) | (738 | ) | (2,033 | ) | (426 | ) | ||||||
Non-deductible expenses for minority partner distributions and buyouts | 3,398 | 3,354 | 2,200 | |||||||||
Other non-deductible expenses | 1,782 | 487 | 650 | |||||||||
Provisions arising from write-down of tax losses | 438 | 44 | — | |||||||||
Benefit of utilizing previously written-down tax losses | — | — | (58 | ) | ||||||||
Benefits of income excluded from income tax surcharge | (72 | ) | (48 | ) | (48 | ) | ||||||
|
|
|
|
|
| |||||||
Effective income tax and social contribution provision | 18,718 | 13,017 | 10,410 | |||||||||
|
|
|
|
|
| |||||||
Effective rate | 45.8 | % | 39.5 | % | 43.7 | % | ||||||
|
|
|
|
|
| |||||||
Index to Financial Statements
PGS CONSULTORIA E SERVIÇOS LTDA.
Notes to consolidated financial statements
December 31, 2011 (unaudited), 2010 and 2009 (unaudited)
(In thousands of reais, except when mentioned otherwise)
13. Income tax and social contribution(Continued)
13.3 Components of deferred income tax and social contribution
| 2011 (unaudited) | 2010 | 2009 (unaudited) | ||||||||||
Tax loss carry forward | 940 | 705 | 661 | |||||||||
Temporary differences | ||||||||||||
Pre-opening costs | 2,308 | 2,135 | 1,782 | |||||||||
Provision for contingency | 571 | — | — | |||||||||
Lease | 413 | — | — | |||||||||
Provision for CIDE | 1,026 | 667 | 437 | |||||||||
Provision for bonus | 1,112 | 136 | — | |||||||||
Other | 449 | 191 | — | |||||||||
|
|
|
|
|
| |||||||
| 6,819 | 3,834 | 2,880 | ||||||||||
Unrecognized deferred tax assets | (1,043 | ) | (705 | ) | (661 | ) | ||||||
|
|
|
|
|
| |||||||
| 5,776 | 3,129 | 2,219 | ||||||||||
|
|
|
|
|
| |||||||
Deferred income tax and social contribution assets, resulting from tax loss carry forwards and temporary differences, are recorded taking into consideration the probable realization thereof, based on projected future results of operations considering internal assumptions and future economic scenarios that are subject to change. These projections indicate that future operating results will provide taxable income for CLS SP, CLS RJ and CLS BSB. Therefore the Group’s management expects to realize the deferred tax assets. The unused credits reflect the assessment of the likelihood of realizing the deferred tax asset comprised of the tax loss carry forwards attributable to the Parent Company.
14. Members’ equity
14.1. Capital stock
At December 31, 2011 (unaudited), 2010, and 2009 (unaudited) the Parent Company’s subscribed capital amounted to R$ 21,864, divided into 20,244,048 units of interest with par value of R$ 1.08 each, distributed as follows:
| ||||
| ||||
Index to Financial Statements
PGS CONSULTORIA E SERVIÇOS LTDA.
Notes to consolidated financial statements
December 31, 2011 (unaudited), 2010 and 2009 (unaudited)
(In thousands of reais, except when mentioned otherwise)
14. Members’ equity(Continued)
14.2 Distribution of profits
The Parent Company’s management decided to maintain profits for 2011 (unaudited) and 2010 in retained earnings, to be later appropriated in a members meeting. The members approved the distribution of dividends in the amount of R$ 749, relating to profits for 2009, distributed as follow:
| ||||
| ||||
The Parent Company’s management also decided to maintain the remaining profits for 2009 (unaudited) in retained earnings, to be later appropriated in a members meeting.
15. Financial instruments
The Group evaluated its financial assets and liabilities in relation to market value through available information available and appropriate evaluation methodologies. The interpretation of market data and the selection of evaluation methods require extensive judgment and estimates to calculate the most appropriate realization value. Consequently, the estimates presented do not necessarily show the amounts that may be realized in the market. The use of different market assumptions and/or methods may have a material effect on the estimated realization values.
The Group’s main financial instruments consist of cash andequivalents, restricted cash, equivalents, trade accounts receivable, trade accounts payable and current and noncurrent loans.
long-term debt. The fair values of cash equivalents, restricted cash, accounts receivable and accounts payable approximate their carrying amounts reported in the Consolidated Balance Sheets due to their short duration. The fair value of OSI’s senior secured term loan B facility is determined based on quoted market prices in inactive markets. The fair value of New PRP’s commercial mortgage-backed securities is based on assumptions derived from current conditions in the real estate and credit markets, changes in the underlying collateral and expectations of management. Fair value measurementsestimates for other notes payable are derived using a discounted cash flow approach. Discounted cash flow inputs primarily include cost of debt rates which are used to derive the present value factors for the determination of fair value. These inputs represent assumptions impacted by economic conditions and management expectations and may change in the future based on period-specific facts and circumstances.
Fair value isThe following tables include the price that would be received upon sale of an asset or paid upon transfer of a liability in an orderly transaction between market participants at the measurement date and is a market-based measurement. To measure fair value, the Group incorporates assumptions that market participants would use in pricing the asset or liability, and utilizes market data to the maximum extent possible.
Set out below is a comparison by financial statement class of the bookcarrying value and fair value of the Group’sCompany’s financial instruments that are carriedat March 31, 2013 and December 31, 2012 aggregated by the level in the fair value hierarchy in which those measurements fall (in thousands):
| March 31, 2013 | ||||||||||||||||
| Carrying Value | Fair Value | |||||||||||||||
| Level 1 | Level 2 | Level 3 | ||||||||||||||
Senior secured term loan B facility (1) | $ | 975,000 | $ | — | $ | 985,969 | $ | — | ||||||||
Mortgage loan (2) | 317,621 | — | — | 334,927 | ||||||||||||
First mezzanine loan (2) | 86,800 | — | — | 90,133 | ||||||||||||
Second mezzanine loan (2) | 87,103 | — | — | 91,284 | ||||||||||||
Other notes payable (1) | 7,213 | — | — | 6,738 | ||||||||||||
| December 31, 2012 | ||||||||||||||||
| Carrying Value | Fair Value | |||||||||||||||
| Level 1 | Level 2 | Level 3 | ||||||||||||||
Senior secured term loan B facility (1) | $ | 1,000,000 | $ | — | $ | 1,010,000 | $ | — | ||||||||
Mortgage loan (2) | 319,574 | — | — | 334,678 | ||||||||||||
First mezzanine loan (2) | 87,048 | — | — | 90,371 | ||||||||||||
Second mezzanine loan (2) | 87,273 | — | — | 91,423 | ||||||||||||
Other notes payable (1) | 9,848 | — | — | 9,230 | ||||||||||||
| (1) | Represents obligations of OSI. |
| (2) | Represents obligations of New PRP. |
10. Income Taxes
The effective income tax rate for the three months ended March 31, 2013 was 14.1% compared to 19.2% for the same period in 2012. This net decrease in the effective income tax rate as compared to the prior year was primarily due to a decrease in the projected foreign pretax book income and the foreign provision being a smaller percentage of projected consolidated financial statements.pretax annual income.
Index to Financial Statements
PGS CONSULTORIA E SERVIÇOS LTDA.BLOOMIN’ BRANDS, INC.
Notes to consolidated financial statements
December 31, 2011 (unaudited), 2010 and 2009 (unaudited)
(In thousands of reais, except when mentioned otherwise)NOTES TO CONSOLIDATED FINANCIAL STATEMENTS (UNAUDITED)—(Continued)
15. Financial instruments(Continued)
Fair value measurements (Continued)
| Book value | Fair value | |||||||||||||||||||||||
Description | 2011 | 2010 | 2009 | 2011 | 2010 | 2009 | ||||||||||||||||||
Financial assets | ||||||||||||||||||||||||
Cash and cash equivalents | 21,832 | 11,032 | 3,298 | 21,832 | 11,032 | 3,298 | ||||||||||||||||||
Trade accounts receivable | 15,553 | 9,856 | 7,409 | 15,553 | 9,856 | 7,409 | ||||||||||||||||||
Recoverable taxes | 226 | 1,004 | 2,294 | 226 | 1,004 | 2,294 | ||||||||||||||||||
Credits from related parties | 129 | 122 | 537 | 129 | 122 | 537 | ||||||||||||||||||
Other assets | 2,324 | 1,725 | 1,449 | 2,324 | 1,725 | 1,449 | ||||||||||||||||||
|
|
|
|
|
|
|
|
|
|
|
| |||||||||||||
| 40,064 | 23,739 | 14,987 | 40,064 | 23,739 | 14,987 | |||||||||||||||||||
|
|
|
|
|
|
|
|
|
|
|
| |||||||||||||
Financial liabilities | ||||||||||||||||||||||||
Loans, including related party | 3,071 | 1,492 | 2,762 | 3,071 | 1,492 | 2,762 | ||||||||||||||||||
Trade accounts payable | 9,998 | 8,743 | 6,531 | 9,998 | 8,743 | 6,531 | ||||||||||||||||||
Rental payable, including deferred | 3,648 | 2,096 | 1,430 | 3,648 | 2,096 | 1,430 | ||||||||||||||||||
Payroll, provisions and social charges | 10,866 | 8,078 | 5,560 | 10,866 | 8,078 | 5,560 | ||||||||||||||||||
Taxes and contributions | 7,237 | 5,416 | 5,405 | 7,237 | 5,416 | 5,405 | ||||||||||||||||||
Royalties and franchises fee | 2,242 | 1,809 | 3,944 | 2,242 | 1,809 | 3,944 | ||||||||||||||||||
Accounts payable to minority partners | 1,077 | 1,309 | 1,807 | 1,077 | 1,309 | 1,807 | ||||||||||||||||||
Accrued buyout liability | 8,556 | 5,753 | 3,306 | 8,556 | 5,753 | 3,306 | ||||||||||||||||||
Other liabilities | 3,069 | 2,340 | 2,340 | 3,069 | 2,340 | 2,340 | ||||||||||||||||||
|
|
|
|
|
|
|
|
|
|
|
| |||||||||||||
| 49,764 | 37,036 | 33,085 | 49,764 | 37,036 | 33,085 | |||||||||||||||||||
|
|
|
|
|
|
|
|
|
|
|
| |||||||||||||
The fair valueseffective income tax rate for the three months ended March 31, 2013 was lower than the blended federal and state statutory rate of cash and cash equivalents, trade accounts receivable, trade accounts payable and short-term accounts payable approximate their respective book values38.6% primarily due to the their short-term maturity. Loans are recognized initially at fair value, plus directly attributable transaction costs. Followingbenefit of the initial recognition, loans subject toexpected tax credit for excess FICA tax on employee-reported tips, the foreign rate differential, decrease in the valuation allowance and the elimination of noncontrolling interest are measured attogether being such a large percentage of projected annual pretax income. The effective income tax rate for the amortized cost using the effective interest rate method.
As a basis for considering the market participant assumptions in fair value measurements, a three-tier fair value hierarchy prioritizes the inputs used in measuring fair values as follows:
Level 1—observable inputs such as quoted prices (unadjusted) in active markets for identical assets or liabilities that the Group has the ability to access;
Level 2—inputs, otherthree months ended March 31, 2012 was lower than the quoted market prices includedblended federal and state statutory rate of 38.7% due to the benefit of the expected tax credit for excess FICA tax on employee-reported tips and the elimination of noncontrolling interest together being such a large percentage of pretax income. This was partially offset by an increase in Level 1, which are observable for the asset or liability, either directly or indirectly; and
Level 3—unobservable inputs for the asset or liability, which are typically based on an entity’s own assumptions, as there is little, if any, related market data available.
Index to Financial Statements
PGS CONSULTORIA E SERVIÇOS LTDA.valuation allowance.
Notes to consolidated financial statements
At December 31, 2011 (unaudited), 20102012, the Company had a valuation allowance against deferred income tax assets recorded of $72.5 million, of which $67.7 million was for U.S. deferred income tax assets. The Company has reviewed and 2009 (unaudited)
(In thousandswill continue to review its conclusions about the appropriate amount of reais, except when mentioned otherwise)
15. Financial instruments(Continued)
Fair value measurements (Continued)
The fair value measurementits deferred income tax asset valuation allowance in light of short-term investments classified as cash and cash equivalentscircumstances existing in future periods. To the extent the Company continues to generate pretax income in the U.S. in fiscal 2013 at a sufficient level, then, absent other factors indicating a contrary conclusion, the Company will consider a potential reversal of the U.S. related valuation allowance within the next nine to 12 months. Should the Company reverse the valuation allowance, a discrete tax benefit ranging from $40.0 million to $50.0 million related to the valuation allowance recorded at December 31, 2011, 20102012 could be realized. Any release of valuation allowance will be recorded as a tax benefit increasing net income or as an adjustment to paid-in capital. Such reversal will impact the Company’s quarterly and 2009,annual effective income tax rates and could result in an overall income tax benefit in the amountperiod of R$13,544 (unaudited), R$ 8,863, and R$ 2 (unaudited), respectively, uses inputs that fall within Level 2 of the fair value hierarchy.
release. The Group is not engaged in any outstanding hedging instruments, term contracts, swap operations, options, futures, or embedded derivatives operations. Therefore, the Group has no risk relatedCompany expects to derivatives utilization policies.
Significant market risk factors affecting the Group’s business are as follows:
Exchange rate risk
This risk arises from the possibility of the Group incurring losses because of fluctuations in foreign currency exchange rates. The Group presents liabilities denominated in US dollars, mainly in connectioncontinue to generate significant U.S. income tax credits, which combined with the loans from the related party OSI.
The Group does not use hedging instruments to protect against exchange rate fluctuations between the Brazilian realmix of U.S. and the US dollar.
Credit risk
This risk mainly involves the Groups’ cash and cash equivalents and accounts receivable. The Group carries out operations with highly-rated banks, which minimizes risk. Accounts receivable are substantially generated from credit card companies resulting from salesforeign earnings in the restaurants. Management does not anticipate losses in the realization of such receivables.
Liquidity risk
Liquidity risk arises from the possibility that the Group may not have sufficient funds to comply with their financial commitments dueperiods subsequent to the different currenciesreversal will result in an effective income tax rate that is lower than the blended federal and settlement termsstate statutory rate.
As of their rightsMarch 31, 2013 and obligations.
In order to mitigate liquidity risk for the Parent Company and its subsidiaries. the Group’s liquidity and cash flow is monitored on a daily basis by Management, assuring that cash flow from operations and available funding, when necessary, is sufficient to meet its commitment schedule.
Index to Financial Statements
PGS CONSULTORIA E SERVIÇOS LTDA.
Notes to consolidated financial statements
December 31, 2011 (unaudited), 20102012, respectively, the Company had $13.8 million and 2009 (unaudited)
(In thousands$13.6 million, respectively, of reais, except when mentioned otherwise)
15. Financial instruments(Continued)
Liquidity risk(Continued)
The tables below summarizeunrecognized tax benefits ($0.8 million and $1.0 million, respectively, in Other long-term liabilities, net, $0.8 million and $0.9 million, respectively, in Accrued and other current liabilities and $12.2 million and $11.7 million, respectively, in Deferred income tax liabilities). Additionally, the maturity profile of the Group’s financial liabilities on contractualCompany accrued $2.3 million and undiscounted payments.
| Year ended December 31, 2011 (unaudited) | ||||||||||||||||
| Up to 1 year | 1 to 5 years | > 5 years | Total | |||||||||||||
Loans, including related party | 1,339 | 1,732 | — | 3,071 | ||||||||||||
Trade accounts payable | 9,998 | — | — | 9,998 | ||||||||||||
Rental payable, including deferred | 2,490 | 686 | 472 | 3,648 | ||||||||||||
Payroll, provisions and social charges | 10,866 | — | — | 10,866 | ||||||||||||
Taxes and contributions | 7,237 | — | — | 7,237 | ||||||||||||
Royalties and franchises fee | 2,242 | — | — | 2,242 | ||||||||||||
Accrued buyout liability | 332 | 8,224 | — | 8,556 | ||||||||||||
Other liabilities | 3,655 | 491 | — | 4,146 | ||||||||||||
|
|
|
|
|
|
|
| |||||||||
| 38,159 | 11,133 | 472 | 49,764 | |||||||||||||
|
|
|
|
|
|
|
| |||||||||
| Year ended December 31, 2010 | ||||||||||||||||
| Up to 1 year | 1 to 5 years | > 5 years | Total | |||||||||||||
Loans, including related party | 987 | 505 | — | 1,492 | ||||||||||||
Trade accounts payable | 8,743 | — | — | 8,743 | ||||||||||||
Rental payable | 2,096 | — | — | 2,096 | ||||||||||||
Payroll, provisions and social charges | 8,078 | — | — | 8,078 | ||||||||||||
Taxes and contributions | 5,416 | — | — | 5,416 | ||||||||||||
Royalties and franchises fee | 1,809 | — | — | 1,809 | ||||||||||||
Accrued buyout liability | 482 | 5,271 | 5,753 | |||||||||||||
Other liabilities | 3,649 | — | — | 3,649 | ||||||||||||
|
|
|
|
|
|
|
| |||||||||
| 31,260 | 5,776 | — | 37,036 | |||||||||||||
|
|
|
|
|
|
|
| |||||||||
| Year ended December 31, 2009 (unaudited) | ||||||||||||||||
| Up to 1 year | 1 to 5 years | > 5 years | Total | |||||||||||||
Loans, including related party | 1,223 | 1,539 | — | 2,762 | ||||||||||||
Trade accounts payable | 6,531 | — | — | 6,531 | ||||||||||||
Rental payable | 1,430 | — | — | 1,430 | ||||||||||||
Payroll, provisions and social charges | 5,560 | — | — | 5,560 | ||||||||||||
Taxes and contributions | 5,405 | — | — | 5,405 | ||||||||||||
Royalties and franchises fee | 3,944 | — | — | 3,944 | ||||||||||||
Accrued buyout liability | 283 | 3,023 | 3,306 | |||||||||||||
Other liabilities | 4,147 | — | — | 4,147 | ||||||||||||
|
|
|
|
|
|
|
| |||||||||
| 28,523 | 4,562 | — | 33,085 | |||||||||||||
|
|
|
|
|
|
|
| |||||||||
Index to Financial Statements
PGS CONSULTORIA E SERVIÇOS LTDA.
Notes to consolidated financial statements
December 31, 2011 (unaudited), 2010 and 2009 (unaudited)
(In thousands of reais, except when mentioned otherwise)
15. Financial instruments(Continued)
Interest rate risk
Interest rate risk arises from the possibility that the Group incurs losses because of fluctuations in interest rates that could increase certain financial expenses related to loans and financing raised from the market. The Group’s exposure to market risks for changes in interest rates relates primarily to the bank debt and loans with related parties. Considering the Group’s debt profile, management considers the risk of exposure to interest rate variation to be insignificant.
Capital Management
Capital includes units$2.4 million of interest and equity attributablepenalties related to uncertain tax positions as of March 31, 2013 and December 31, 2012, respectively. Of the equity holderstotal amount of unrecognized tax benefits, including accrued interest and penalties, $14.0 million and $13.8 million, respectively, if recognized, would impact the Company’s effective tax rate. The difference between the total amount of unrecognized tax benefits and the amount that would impact the effective tax rate consists of items that are offset by deferred income tax assets and the federal tax benefit of state income tax items.
In many cases, the Company’s uncertain tax positions are related to tax years that remain subject to examination by relevant taxable authorities. Based on the outcome of these examinations, or as a result of the Parent.expiration of the statute of limitations for specific jurisdictions, it is reasonably possible that the related recorded unrecognized tax benefits for tax positions taken on previously filed tax returns will change by approximately $0.5 million to $0.6 million within the next twelve months after March 31, 2013.
The primary objectiveCompany is currently open to audit under the statute of the Group’s capital management is to ensure that it maintains sufficient capital in order to support its business and maximize member value.
The Group manages its capital structure and makes adjustments to it in light of changes in economic conditions. To maintain or adjust the capital structure, the Group may adjust dividend payments to members, return capital to members, take out new loans, or issue new units of interest. No changes were made to the objectives, policies, or processes for managing capital during the years ended December 31, 2011 (unaudited), 2010, and 2009 (unaudited).
Included within net debt are loans, trade accounts payable, less cash and cash equivalents.
| 2011 (unaudited) | 2010 | 2009 (unaudited) | ||||||||||
Loans, including related party | 3,071 | 1,492 | 2,762 | |||||||||
Trade accounts payable | 9,998 | 8,743 | 6,531 | |||||||||
Less: cash and cash equivalents | (21,832 | ) | (11,032 | ) | (3,298 | ) | ||||||
|
|
|
|
|
| |||||||
Net debt | (8,763 | ) | (797 | ) | 5,995 | |||||||
Members’ equity | 109,981 | 87,788 | 67,825 | |||||||||
|
|
|
|
|
| |||||||
Members’ equity and net debt | 101,218 | 86,991 | 73,820 | |||||||||
|
|
|
|
|
| |||||||
16. Operating lease commitments
Minimum rent payments under operating leases are recognized on a straight-line basis over the term of the lease including any periods of free rent. Rental expense for operating leases during 2011 (unaudited), 2010, and 2009 (unaudited) was R$12,255, R$8,448, and R$7,061, respectively.
The Group has entered into operating leases for the restaurants locations. These leases have an average life of between 10 to 15 years. Future minimum rentals payable under non-cancellable operating leases as at December 31 are as follows:
| 2011 | 2009 | |||||||||||
| (unaudited) | 2010 | (unaudited) | ||||||||||
Within one year | 12,802 | 6,513 | 7,660 | |||||||||
After one year but not more than five years | 47,444 | 45,306 | 46,408 | |||||||||
More than five years | 61,940 | 74,862 | 66,100 | |||||||||
|
|
|
|
|
| |||||||
| 122,186 | 126,681 | 120,168 | ||||||||||
|
|
|
|
|
| |||||||
Index to Financial Statements
PGS CONSULTORIA E SERVIÇOS LTDA.
Notes to consolidated financial statements
December 31, 2011 (unaudited), 2010 and 2009 (unaudited)
(In thousands of reais, except when mentioned otherwise)
17. Insurance coverage
The Group maintains insurance coverage primarily for risks of loss relating to property damages, loss of profit, and fixed asset items. Coverage amounts are deemed sufficient by Management to cover any potential losses. At December 31, 2011, the Group had the following main insurance policies contracted with third parties:
|
|
|
|
| ||||||
| ||||||||||
| ||||||||||
| ||||||||||
18. Summary and reconciliation of the differences between the accounting practices adopted in Brazil and accounting principles generally accepted in the United States of America
The consolidated financial statements were prepared and are presented in accordance with BR GAAP, which comprise the pronouncements, interpretations and guidance issuedlimitations by the Brazilian Accounting Pronouncements Committee (“CPC”). Note 4 to the consolidated financial statements summarizes the principal accounting practices adopted by the Group.
BR GAAP differs, in certain significant respects, from US GAAP. No relevant differences between BR GAAP and US GAAP were identified for the Group’s members’ equity and net income as of andIRS for the years ended December 31, 2011 (unaudited), 2010, and 2009 (unaudited).
Classification of statement of cash flows
Under BR GAAP, the classification of certain cash flow items is presented differently from US GAAP. Under BR GAAP, interest paid is recorded in financing activities. For US GAAP purposes, interest paid is classified in operating activities.
Recently Issued Accounting Standards
In December 2011, the FASB issued ASU No. 2011-11, Balance Sheet (Topic 210): Disclosures about Offsetting Assets and Liabilities. ASU 2011-11 requires an entity to disclose information about offsetting and related arrangements to enable users of financial statements to understand the effect of those arrangements on its financial position, and to allow investors to better compare financial statements prepared under U.S. GAAP with financial statements prepared under International Financial Reporting Standards (IFRS). The new standards are effective for annual periods beginning January 1, 2013, and interim periods within those annual periods. Retrospective application is required. The Company will implement the provisions of ASU 2011-11 as of January 1, 2013.
Index to Financial Statements
PGS CONSULTORIA E SERVIÇOS LTDA.
Notes to consolidated financial statements
December 31, 2011 (unaudited), 2010 and 2009 (unaudited)
(In thousands of reais, except when mentioned otherwise)
18. Summary and reconciliation of the differences between the accounting practices adopted in Brazil and accounting principles generally accepted in the United States of America(Continued)
In June 2011, the FASB issued ASU 2011-05, Comprehensive Income (Topic 220): Presentation of Comprehensive Income. Under this ASU, an entity will have the option to present the components of net income and comprehensive income in either one or two consecutive financial statements. The ASU eliminates the option in U.S. GAAP to present other comprehensive income in the statement of changes in equity. An entity should apply the ASU retrospectively. For a nonpublic entity, the ASU is effective for fiscal years ending after December 15, 2012, and interim and annual periods thereafter. Early adoption is permitted. In December 2011, the FASB decided to defer the effective date of those changes in ASU 2011-05 that relate only to the presentation of reclassification adjustments in the statement of income by issuing ASU 2011-12, Comprehensive Income (Topic 220): Deferral of the Effective Date for Amendments to the Presentation of Reclassifications of Items Out of Accumulated Other Comprehensive income in Accounting Standards Update 2011-05. The Company plans to implement the provisions of ASU 2011-05 by presenting a separate statement of other comprehensive income following the statement of income in 2012.
In May 2011, the FASB issued ASU 2011-04, Fair Value Measurement (Topic 820): Amendments to Achieve Common Fair Value Measurement and Disclosure Requirements in U.S. GAAP and IFRSs. The new standards do not extend the use of fair value but, rather, provide guidance about how fair value should be applied where it already is required or permitted under IFRS or U.S. GAAP. For U.S. GAAP, most of the changes are clarifications of existing guidance or wording changes to align with IFRS. A nonpublic entity is required to apply the ASU prospectively for annual periods beginning after December 15,2007 through 2011. The Company expectsand its subsidiaries’ state and foreign income tax returns are also open to audit under the statute of limitations for the years ended December 31, 2000 through 2012. The Company is currently under examination by the Internal Revenue Service for the years ended December 31, 2009 through 2011. At this time, the Company does not believe that the adoptionoutcome of ASU 2011-04 in 2012any examination will not have a material impact on the Company’s results of operations or financial position.
BLOOMIN’ BRANDS, INC.
NOTES TO CONSOLIDATED FINANCIAL STATEMENTS (UNAUDITED)—(Continued)
11. Subsequent Event
On April 10, 2013, OSI completed a repricing of its consolidatedsenior secured term loan B facility pursuant to the First Amendment to Credit Agreement, Guaranty and Security Agreement, among OSI, OSI HoldCo, Inc., the subsidiary guarantors named therein, Deutsche Bank Trust Company Americas, as administrative agent and collateral agent, and a syndicate of institutional lenders and financial statements.institutions (the “Credit Agreement” and, as amended, the “Amended Credit Agreement”).
In October 2009, the FASB issued Accounting Standards Update (ASU) 2009-13, Revenue Recognition (Topic 605): Multiple Deliverable Revenue Arrangements (EITF Issue No. 08-1, “Revenue ArrangementsThe Amended Credit Agreement replaces OSI’s existing senior secured term loan B facility with Multiple Deliverables”a new senior secured term loan B facility (the “New Term Loan B”). ASU 2009-13 amends FASB ASC Subtopic 605-25, Revenue Recognition-Multiple-Element Arrangements,The New Term Loan B has the same principal amount outstanding (as of the repricing date) of $975.0 million, maturity date of October 26, 2019, amortization schedule and financial covenants but a lower applicable interest rate than the existing senior secured term loan B facility. Voluntary prepayments made on the principal amount outstanding since the inception of the Credit Agreement will continue to eliminatebe treated as prepayments for purposes of determining amortization payment and mandatory prepayment requirements under the requirementNew Term Loan B.
The Amended Credit Agreement decreased the interest rate applicable to the New Term Loan B to 150 basis points over the Base Rate or 250 basis points over the Eurocurrency Rate and reduced the interest rate floors applicable to the New Term Loan B to 2.00% for the Base Rate and 1.00% for the Eurocurrency Rate. Prepayments or amendments of the New Term Loan B that all undelivered elements have vendor specific objective evidence of selling price (VSOE) or third party evidence of selling price (TPE) before an entity can recognizeconstitute a “repricing transaction” (as defined in the portion of an overall arrangement fee that is attributable to items that already have been delivered. In the absence of VSOE and TPE for one or more delivered or undelivered elements in a multiple element arrangement, entitiesAmended Credit Agreement) will be subject to a premium of 1.00% of the New Term Loan B if prepaid or amended on or prior to October 10, 2013. Prepayments and repricings made after October 10, 2013 will not be subject to premium or penalty.
Pursuant to the terms of the Credit Agreement, the Company was required to estimatepay a prepayment penalty of approximately $10.0 million at closing in connection with the selling pricesrepricing transaction. Additional professional fees will also be recorded in the second quarter of those elements. The overall arrangement fee will be allocated to each element (both delivered2013 as well as an adjustment of the deferred financing fees and undelivered items)unamortized debt discount based on their relative selling prices, regardless of whether those selling prices are evidenced by VSOE or TPE or are based on the entity’s estimated selling price. Applicationcompletion of the “residual method”Company’s analysis of allocating an overall arrangement fee between delivered and undelivered elements will no longer be permitted upon adoption of ASU 2009-13. Additionally,debt extinguishment or modification treatment for the new guidance will require entities to disclose more information about their multiple element revenue arrangements. ASU 2009-13 is effective prospectively for revenue arrangements entered into or materially modified in fiscal years beginning on or after June 15, 2010. Early adoption is permitted. The adoption of ASU 2009-13 in 2011 did not have an effect on the Company’s consolidated financial statements.repricing.
Index to Financial Statements
SCHEDULE II
VALUATION AND QUALIFYING ACCOUNTS (in thousands):
Balance at | Charged to | Deductions (1) | Balance at | |||||||||||||||||||||||||||||
Year Ended December 31, 2012 | ||||||||||||||||||||||||||||||||
Allowance for doubtful accounts (2) | $ | 2,117 | $ | 280 | $ | (2,397 | ) | $ | — | |||||||||||||||||||||||
Valuation allowance on deferred income tax assets (3) | 35,837 | 44,260 | (7,582 | ) | 72,515 | |||||||||||||||||||||||||||
|
|
|
| |||||||||||||||||||||||||||||
| $ | 37,954 | $ | 44,540 | $ | (9,979 | ) | $ | 72,515 | ||||||||||||||||||||||||
| Balance at the Beginning of the Period | Charged to Costs and Expenses | Deductions(1) | Balance at the End of the Period |
|
|
|
| |||||||||||||||||||||||||
Year Ended December 31, 2011 | ||||||||||||||||||||||||||||||||
Allowance for note receivable for affiliated entity(2) | $ | 33,150 | $ | (33,150 | ) | $ | — | $ | — | |||||||||||||||||||||||
Allowance for note receivable for affiliated entity (4) | $ | 33,150 | $ | (33,150 | ) | $ | — | $ | — | |||||||||||||||||||||||
Allowance for doubtful accounts | 2,454 | 117 | (454 | ) | 2,117 | 2,454 | 117 | (454 | ) | 2,117 | ||||||||||||||||||||||
Valuation allowance on deferred income tax assets | 25,886 | 12,948 | (2,997 | ) | 35,837 | 25,886 | 12,948 | (2,997 | ) | 35,837 | ||||||||||||||||||||||
|
|
|
|
|
|
|
| |||||||||||||||||||||||||
| $ | 61,490 | $ | (20,085 | ) | $ | (3,451 | ) | $ | 37,954 | $ | 61,490 | $ | (20,085 | ) | $ | (3,451 | ) | $ | 37,954 | |||||||||||||
|
|
|
|
|
|
|
| |||||||||||||||||||||||||
Year Ended December 31, 2010 | ||||||||||||||||||||||||||||||||
Allowance for note receivable for affiliated entity | $ | 33,150 | $ | — | $ | — | $ | 33,150 | $ | 33,150 | $ | — | $ | — | $ | 33,150 | ||||||||||||||||
Allowance for doubtful accounts | 1,697 | 2,295 | (1,538 | ) | 2,454 | 1,697 | 2,295 | (1,538 | ) | 2,454 | ||||||||||||||||||||||
Valuation allowance on deferred income tax assets | 21,977 | 3,909 | — | 25,886 | 21,977 | 3,909 | — | 25,886 | ||||||||||||||||||||||||
|
|
|
|
|
|
|
| |||||||||||||||||||||||||
| $ | 56,824 | $ | 6,204 | $ | (1,538 | ) | $ | 61,490 | $ | 56,824 | $ | 6,204 | $ | (1,538 | ) | $ | 61,490 | |||||||||||||||
|
|
|
|
|
|
|
| |||||||||||||||||||||||||
Year Ended December 31, 2009 | ||||||||||||||||||||||||||||||||
Allowance for note receivable for affiliated entity | $ | 33,150 | $ | — | $ | — | $ | 33,150 | ||||||||||||||||||||||||
Allowance for doubtful accounts | 3,011 | 724 | (2,038 | ) | 1,697 | |||||||||||||||||||||||||||
Valuation allowance on deferred income tax assets | 4,992 | 18,743 | (1,758 | ) | 21,977 | |||||||||||||||||||||||||||
|
|
|
| |||||||||||||||||||||||||||||
| $ | 41,153 | $ | 22,701 | $ | (7,030 | ) | $ | 56,824 | ||||||||||||||||||||||||
|
|
|
| |||||||||||||||||||||||||||||
| (1) | Deductions for Allowance for doubtful accounts represent the write off of uncollectible accounts or reductions to allowances previously provided. Deductions for Valuation allowance on deferred income tax assets represent changes in timing differences between periods. |
| (2) | In 2009, the Company received a promissory note for the full sale price of its Cheeseburger in Paradise concept ($2.0 million), which subsequently became fully reserved in 2010. In the fourth quarter of 2012, the Company collected the outstanding amounts under the terms of the promissory note, which included accrued interest charges, and released the Allowance for doubtful accounts balance in full. |
| (3) | The charges to the valuation allowance for the year ended December 31, 2012 were primarily due to the tax benefits associated with tax goodwill related to the joint venture and limited partnership interests purchased and the deferred gain recorded for the Sale-Leaseback Transaction. Of the aggregate charges, $15.8 million was recorded in Additional paid-in capital. |
| (4) | On September 26, 2011, the Company entered into a settlement agreement with the T-Bird Parties to settle all outstanding litigation with T-Bird. In accordance with the terms of the settlement agreement, T-Bird agreed to pay $33.3 million to the Company, which included $33.2 million to satisfy the T-Bird promissory note that the Company purchased from T-Bird’s former lender. The settlement payment was received in November 2011, and $33.2 million was recorded as Recovery of note receivable from affiliated entity in the Company’s Consolidated Statement of Operations and Comprehensive Income for the year ended December 31, 2011. |
Index to Financial Statements

Index to Financial Statements

Index to Financial Statements
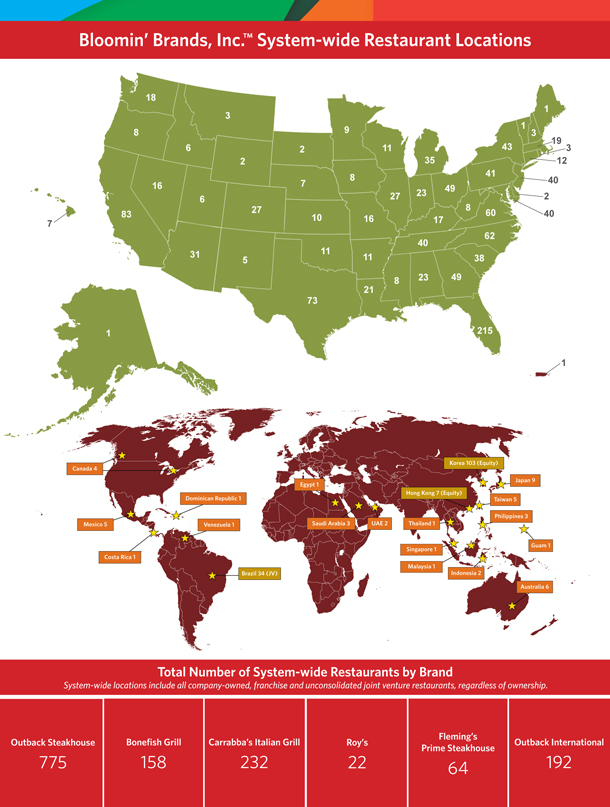
Index to Financial Statements
17,000,000 Shares
Bloomin’ Brands, Inc.
Common stockStock
P R O S P E C T U S
BofA Merrill Lynch
Morgan Stanley
J.P. Morgan
Deutsche Bank Securities
Goldman, Sachs & Co.
Jefferies
William Blair
Raymond James
Wells Fargo Securities
The Williams Capital Group, L.P.
, 20122013
Index to Financial Statements
Part II
Information Not Required in Prospectus
Item 13. Other Expenses of Issuance and Distribution.
The following table sets forth the estimated expenses payable by us in connection with the sale and distribution of the securities registered hereby, other than underwriting discounts or commissions. All amounts are estimates except for the SEC registration fee and the Financial Industry Regulatory Authority filing fee.
SEC Registration Fee | $ | 34,380 | ||
Financial Industry Regulatory Authority, Inc. Filing Fee | 30,500 | |||
Listing Fee | * | |||
Printing and Engraving | * | |||
Legal Fees and Expenses | * | |||
Accounting Fees and Expenses | * | |||
Transfer Agent and Registrar Fees | * | |||
Miscellaneous | * | |||
|
| |||
Total | $ | * | ||
|
|
SEC Registration Fee | $ | 55,280 | ||
Financial Industry Regulatory Authority, Inc. Filing Fee | 61,291 | |||
Blue Sky Fees and Expenses | 5,000 | |||
Printing and Engraving | 125,000 | |||
Legal Fees and Expenses | 438,000 | |||
Accounting Fees and Expenses | 150,000 | |||
Transfer Agent and Registrar Fees | 10,000 | |||
Miscellaneous | 130,000 | |||
|
| |||
Total | $ | 974,571 | ||
|
|
Item 14. Indemnification of Directors and Officers.
The Registrant is governed by the Delaware General Corporation Law, or DGCL. Section 145 of the DGCL provides that a corporation may indemnify any person, including an officer or director, who was or is, or is threatened to be made, a party to any threatened, pending or completed legal action, suit or proceeding, whether civil, criminal, administrative or investigative (other than an action by or in the right of such corporation), by reason of the fact that such person was or is an officer, director, employee or agent of such corporation or is or was serving at the request of such corporation as a director, officer, employee or agent of another corporation or enterprise. The indemnity may include expenses (including attorneys’ fees), judgments, fines and amounts paid in settlement actually and reasonably incurred by such person in connection with such action, suit or proceeding, provided such officer, director, employee or agent acted in good faith and in a manner such person reasonably believed to be in, or not opposed to, the corporation’s best interest and, for criminal proceedings, had no reasonable cause to believe that such person’s conduct was unlawful. A Delaware corporation may indemnify any person, including an officer or director, who was or is, or is threatened to be made, a party to any threatened, pending or contemplated action or suit by or in the right of such corporation, under the same conditions, except that such indemnification is limited to expenses (including attorneys’ fees) actually and reasonably incurred by such person, and except that no indemnification is permitted without judicial approval if such person is adjudged to be liable to such corporation. Where an officer or director of a corporation is successful, on the merits or otherwise, in the defense of any action, suit or proceeding referred to above, or any claim, issue or matter therein, the corporation must indemnify that person against the expenses (including attorneys’ fees) which such officer or director actually and reasonably incurred in connection therewith.
The Registrant’s amended and restated bylaws will authorize the indemnification of its officers and directors, consistent with Section 145 of the Delaware General Corporation Law, as amended. The Registrant intends to enterhas also entered into indemnification agreements with each of its directors and executive officers. These agreements, among other things, will require the Registrant to indemnify each director and executive officer to the fullest extent permitted by Delaware law, including advancement of expenses such as attorneys’ fees, judgments, fines and settlement amounts incurred by the director or executive officer in any action or proceeding, including any action or proceeding by or in right of the Registrant, arising out of the person’s services as a director or executive officer.
II-1
Index to Financial Statements
Reference is madePursuant to Section 102(b)(7) of the DGCL, which enables a corporation in its originalthe Registrant’s certificate of incorporation or an amendment thereto to eliminate or limitcontains a provision eliminating the personal liability of a director for violations of the director’s fiduciary duty, except (i) for any breach of the director’s duty of loyalty to the corporationRegistrant or its stockholders, (ii) for acts or omissions not in good faith or that involve intentional misconduct or a knowing violation of law, (iii) pursuant to Section 174 of the DGCL, which provides for liability of directors for unlawful payments of dividends or unlawful stock purchases or redemptions or (iv) for any transaction from which a director derived an improper personal benefit.
The Registrant expects to maintain standardmaintains customary policies of insurance that provide coverage (i) to its directors and officers against loss arising from claims made by reason of breach of duty or other wrongful act and (ii) to the Registrant with respect to indemnification payments that it may make to such directors and officers.
The proposed form of Underwriting Agreement to be filed as Exhibit 1.1 to this Registration Statement provides for indemnification to the Registrant’s directors and officers by the underwriters against certain liabilities.
Item 15. Recent Sales of Unregistered Securities.
Equity Securities
During the year ended December 31, 2009, we granted to certain eligible participants 4,350,000 options to purchase our common stock with an exercise price of $6.50 and 1,043,124 options to purchase our common stock with an exercise price of $10.00 under our Equity Plan. The options were issued without registration in reliance on2010, the exemption afforded by Section 4(2) of the Securities Act, as a transaction by an issuer not involving a public offering, or Rule 701 promulgated under the Securities Act, as a transaction pursuant to a compensatory benefit plan.
During the year ended December 31, 2010, weRegistrant granted to certain eligible participants 1,026,110 options to purchase ourits common stock with an exercise price of $6.50 and 51,249 options to purchase ourits common stock with an exercise price of $10.00 under ourthe Registrant’s 2007 Equity Plan.Incentive Plan (the “2007 Plan”). The options were issued without registration in reliance on the exemption afforded by Section 4(2) of the Securities Act, as a transaction by an issuer not involving a public offering, or Rule 701 promulgated under the Securities Act, as a transaction pursuant to a compensatory benefit plan.
In March 2010, wethe Registrant offered all active employees the opportunity to exchange outstanding stock options with a $10.00 exercise price for the same number of replacement stock options with a $6.50 exercise price. The replacement stock options were awarded on April 6, 2010 following completion of the exchange offer, have an exercise price of $6.50 per share, and have new vesting provisions. In aggregate there were 3,874,949 stock options eligible for exchange, all of which were tendered and accepted for exchange in the exchange offer. The original options were cancelled following the expiration of the offer. No consideration was paid to usthe Registrant by any recipient. The replacement stock options were issued without registration in reliance on the exemptions afforded by Section 3(a)(9) of the Securities Act, as an exchange by the issuer with its existing security holders without commission.
During the year ended December 31, 2011, wethe Registrant granted to certain eligible participants 131,000 options to purchase ourits common stock with an exercise price of $6.50. These options were later cancelled and reissued with an exercise price of $10.03. In addition, wethe Registrant also granted to such participants 1,775,447 options to purchase ourits common stock with an exercise price of $10.03 under our Equitythe 2007 Plan. The options were issued without registration in reliance on the exemption afforded by Section 4(2) of the Securities Act, as a transaction by an issuer not involving a public offering, or Rule 701 promulgated under the Securities Act, as a transaction pursuant to a compensatory benefit plan.
During the period beginning January 1, 2012 through August 7, 2012, the Registrant granted to certain eligible participants 35,000 options to purchase its common stock with an exercise price of $10.03, 20,000 options to purchase its common stock with an exercise price of $12.02, and 600,000 options to purchase its common stock with an exercise price of $14.58 under the 2007 Plan. In addition, the Registrant granted certain eligible participants 260,859 shares of restricted stock under the 2007 Plan. The options and shares of restricted stock were issued without registration in reliance on the exemption afforded by Section 4(2) of the Securities Act, as a transaction by an issuer not involving a public offering, or Rule 701 promulgated under the Securities Act, as a transaction pursuant to a compensatory benefit plan.
II-2
Index to Financial Statements
During the period beginning January 1, 2012 through March 15, 2012, we granted to certain eligible participants 35,000 options to purchase our common stock with an exercise price of $10.03 under our Equity Plan. The options were issued without registration in reliance on the exemption afforded by Section 4(2) of the Securities Act, as a transaction by an issuer not involving a public offering, or Rule 701 promulgated under the Securities Act, as a transaction pursuant to a compensatory benefit plan.
Item 16. Exhibits and Financial Statement Schedules.
(a) Exhibits
Exhibit Number | Description of Exhibits | |
| Form of Underwriting Agreement | ||
| Form of Common Stock Certificate (included as an exhibit to Amendment No. 4 to Registrant’s Registration Statement on Form S-1, File No. 333-180615 (“Form S-1”), filed on July 18, 2012 and incorporated herein by reference) | ||
| ||
| Opinion of Baker & Hostetler | ||
| 10.1 | ||
| 10.3 | ||
| 10.4 | ||
| 10.5 | ||
| 10.6 | Environmental Indemnity, dated March 27, 2012, by OSI HoldCo I, Inc. for the benefit of German American Capital Corporation and | |
| 10.7 | Environmental Indemnity, dated March 27, 2012, by OSI Restaurant Partners, LLC and Private Restaurant Master Lessee, LLC for the benefit of German American Capital Corporation and Bank of America, N.A. (included as an exhibit to Registrant’s Form S-1 filed on April 6, 2012 and incorporated herein by reference) | |
II-3
Index to Financial Statements
Exhibit Number | Description of Exhibits | |
| Environmental Indemnity, dated March 27, 2012, by PRP Holdings, LLC for the benefit of German American Capital Corporation and Bank of America, N.A. (included as an exhibit to Registrant’s Form S-1 filed on April 6, 2012 and incorporated herein by reference) | ||
| 10.9 | Environmental Indemnity (First Mezzanine), dated March 27, 2012, by OSI HoldCo I, Inc. for the benefit of German American Capital Corporation and Bank of America, N.A. (included as an exhibit to Registrant’s Form S-1 filed on April 6, 2012 and incorporated herein by reference) | |
| 10.10 | Environmental Indemnity (First Mezzanine), dated March 27, 2012, by OSI Restaurant Partners, LLC and Private Restaurant Master Lessee, LLC for the benefit of German American Capital Corporation and Bank of America, N.A. (included as an exhibit to Registrant’s Form S-1 filed on April 6, 2012 and incorporated herein by reference) | |
| 10.11 | Environmental Indemnity (First Mezzanine), dated March 27, 2012, by PRP Holdings, LLC for the benefit of German American Capital Corporation and Bank of America, N.A. (included as an exhibit to Registrant’s Form S-1 filed on April 6, 2012 and incorporated herein by reference) | |
| 10.12 | Environmental Indemnity (Second Mezzanine), dated March 27, 2012, by OSI HoldCo I, Inc. for the benefit of German American Capital Corporation and Bank of America, N.A. (included as an exhibit to Registrant’s Form S-1 filed on April 6, 2012 and incorporated herein by reference) | |
| 10.13 | Environmental Indemnity (Second Mezzanine), dated March 27, 2012, by OSI Restaurant Partners, LLC and Private Restaurant Master Lessee, LLC for the benefit of German American Capital Corporation and Bank of America, N.A. (included as an exhibit to Registrant’s Form S-1 filed on April 6, 2012 and incorporated herein by reference) | |
| 10.14 | Environmental Indemnity (Second Mezzanine), dated March 27, 2012, by PRP Holdings, LLC for the benefit of German American Capital Corporation and Bank of America, N.A. (included as an exhibit to Registrant’s Form S-1 filed on April 6, 2012 and incorporated herein by reference) | |
| 10.15 | Guaranty of Recourse Obligations, dated March 27, 2012, by OSI HoldCo I, Inc. to and for the benefit of German American Capital Corporation and Bank of America, N.A. (included as an exhibit to Registrant’s Form S-1 filed on April 6, 2012 and incorporated herein by reference) | |
| 10.16 | Guaranty of Recourse Obligations (First Mezzanine), dated March 27, 2012, by OSI HoldCo I, Inc. to and for the benefit of German American Capital Corporation and Bank of America, N.A. (included as an exhibit to Registrant’s Form S-1 filed on April 6, 2012 and incorporated herein by reference) | |
| 10.17 | Guaranty of Recourse Obligations (Second Mezzanine), dated March 27, 2012, by OSI HoldCo I, Inc. to and for the benefit of German American Capital Corporation and Bank of America, N.A. (included as an exhibit to Registrant’s Form S-1 filed on April 6, 2012 and incorporated herein by reference) | |
| 10.18 | Amended and Restated Guaranty, dated March 27, 2012, by OSI Restaurant Partners, LLC to and for the benefit of New Private Restaurant Properties, LLC (included as an exhibit to Registrant’s Form S-1 filed on April 6, 2012 and incorporated herein by reference) | |
| 10.19 | Subordination, Non-Disturbance and Attornment Agreement (New Private Restaurant Properties, LLC), dated March 27, 2012, by and between Bank of America, N.A., German American Capital Corporation, Private Restaurant Master Lessee, LLC and New Private Restaurant Properties, LLC, with the acknowledgement, consent and limited agreement of OSI Restaurant Partners, LLC (included as an exhibit to Registrant’s Form S-1 filed on April 6, 2012 and incorporated herein by reference) | |
II-4
Exhibit Number | Description of Exhibits | |
| 10.20 | Royalty Agreement dated April 1995 among Carrabba’s Italian Grill, Inc., Outback Steakhouse, Inc., Mangia Beve, Inc., Carrabba, Inc., Carrabba Woodway, Inc., John C. Carrabba, III, Damian C. Mandola, and John C. Carrabba, Jr., as amended by First Amendment to Royalty Agreement dated January 1997 and Second Amendment to Royalty Agreement made and entered into effective April 7, 2010 by and among Carrabba’s Italian Grill, LLC, OSI Restaurant Partners, LLC, Mangia Beve, Inc., Mangia Beve II, Inc., Original, Inc., Voss, Inc., John C. Carrabba, III, Damian C. Mandola, and John C. Carrabba, Jr. (included as an exhibit to Registrant’s Form S-1 filed on April 6, 2012 and incorporated herein by reference) | |
| Amended and Restated Operating Agreement for OSI/Fleming’s, LLC made as of June 4, 2010 by and among OS Prime, LLC, a wholly-owned subsidiary of OSI Restaurant Partners, LLC, FPSH Limited Partnership and AWA III Steakhouses, Inc. | ||
II-4
Index to Financial Statements
|
| |
| 10.22 | ||
| Amended and Restated Master Lease Agreement, dated March 27, 2012, between New Private Restaurant Properties, LLC, as landlord, and Private Restaurant Master Lessee, LLC, as tenant1 (included as an exhibit to Amendment No. 1 to Registrant’s Form S-1 filed on May 17, 2012 and incorporated herein by reference) | ||
| 10.23 | Lease, dated June 14, 2007, between OS Southern, LLC and Selmon’s/Florida-I, Limited Partnership (predecessor to MVP LRS, LLC) (included as an exhibit to Amendment No. 1 to Registrant’s Form S-1 filed on May 17, 2012 and incorporated herein by reference) | |
| 10.24 | Lease, dated June 14, 2007, between OS Southern, LLC and Selmon’s/Florida-I, Limited Partnership (predecessor to MVP LRS, LLC), as amended May 27, 2010 (included as an exhibit to Amendment No. 1 to Registrant’s Form S-1 filed on May 17, 2012 and incorporated herein by reference) | |
| 10.25 | Employee Rollover Agreement for conversion of OSI Restaurant Partners, Inc. restricted stock to Kangaroo Holdings, Inc. restricted stock entered into by the individuals listed on Schedule 1 thereto (included as an exhibit to Registrant’s Form S-1 filed on April 6, 2012 and incorporated herein by reference) | |
| 10.26 | OSI Restaurant Partners, LLC HCE Deferred Compensation Plan effective October 1, 2007 (included as an exhibit to Registrant’s Form S-1 filed on April 6, 2012 and incorporated herein by reference) | |
| 10.27 | ||
| 10.28 | Form of Option Agreement for Options under the Kangaroo Holdings, Inc. 2007 Equity Incentive Plan (included as an exhibit to Registrant’s Form S-1 filed on April 6, 2012 and incorporated herein by reference) | |
| 10.29 | Bloomin’ Brands, Inc. 2012 Incentive Award Plan (included as an exhibit to Amendment No. 4 to Registrant’s Form S-1 filed on July 18, 2012 and incorporated herein by reference) | |
| 10.30 | Form of Nonqualified Stock Option Award Agreement for options granted under the Bloomin’ Brands, Inc. 2012 Incentive Award Plan (included as an exhibit to Registrant’s Current Report on Form 8-K filed on December 7, 2012, File No. 001-35625, and incorporated herein by reference) | |
| 10.31 | Form of Restricted Stock Award Agreement for restricted stock granted to directors under the Bloomin’ Brands, Inc. 2012 Incentive Award Plan (included as an exhibit to Registrant’s Current Report on Form 8-K filed on December 7, 2012, File No. 001-35625, and incorporated herein by reference) | |
II-5
Exhibit Number | Description of Exhibits | |
| 10.32 | Form of Restricted Stock Award Agreement for restricted stock granted to employees and consultants under the Bloomin’ Brands, Inc. 2012 Incentive Award Plan (included as an exhibit to Registrant’s Current Report on Form 8-K filed on December 7, 2012, File No. 001-35625, and incorporated herein by reference) | |
| 10.33 | Form of Performance Unit Award Agreement for performance units granted under the Bloomin’ Brands, Inc. 2012 Incentive Award Plan (included as an exhibit to Registrant’s Current Report on Form 8-K filed on December 7, 2012, File No. 001-35625, and incorporated herein by reference) | |
| 10.34 | Form of Bloomin’ Brands, Inc. Indemnification Agreement by and between Bloomin’ Brands, Inc. and each member of its Board of Directors and each of its executive officers (included as an exhibit to Amendment No. 4 to Registrant’s Form S-1 filed on July 18, 2012 and incorporated herein by reference) | |
| 10.35 | Bloomin’ Brands, Inc. Executive Change in Control Plan, effective December 6, 2012 (included as an exhibit to Registrant’s Current Report on Form 8-K filed on December 7, 2012, File No. 001-35625, and incorporated herein by reference) | |
| 10.36 | Amended and Restated Employment Agreement made and entered into September 4, 2012 by and between Elizabeth A. Smith and Bloomin’ Brands, Inc. (included as an exhibit to Registrant’s Quarterly Report on Form 10-Q for the quarter ended June 30, 2012, File No. 001-35625, and incorporated herein by reference) | |
| 10.37 | Retention Bonus Agreement, dated November 2, 2009, between Kangaroo Holdings, Inc. and Elizabeth A. Smith (included as an exhibit to Registrant’s Form S-1 filed on April 6, 2012 and incorporated herein by reference) | |
| 10.38 | Bonus Agreement, dated December 31, 2009, between Kangaroo Holdings, Inc. and Elizabeth A. Smith (included as an exhibit to Registrant’s Form S-1 filed on April 6, 2012 and incorporated herein by reference) | |
| 10.39 | Amendment to Bonus Agreements, dated May 10, 2012, by and between Elizabeth A. Smith and Bloomin’ Brands, Inc. (included as an exhibit to Amendment No. 1 to Registrant’s Form S-1 filed on May 17, 2012 and incorporated herein by reference) | |
| 10.40 | Option Agreement, dated November 16, 2009, by and between Kangaroo Holdings, Inc. and Elizabeth A. Smith, as amended December 31, 2009 (included as an exhibit to Registrant’s Form S-1 filed on April 6, 2012 and incorporated herein by reference) | |
| 10.41 | Option Agreement, dated July 1, 2011, by and between Kangaroo Holdings, Inc. and Elizabeth A. Smith (included as an exhibit to Registrant’s Form S-1 filed on April 6, 2012 and incorporated herein by reference) | |
| 10.42 | Officer Employment Agreement, made and entered into effective May 7, 2012, by and among David Deno and OSI Restaurant Partners, LLC (included as an exhibit to Amendment No. 1 to Registrant’s Form S-1 filed on May 17, 2012 and incorporated herein by reference) | |
| 10.43 | Amended and Restated Employment Agreement dated June 14, 2007, between Dirk A. Montgomery and OSI Restaurant Partners, LLC, as amended on January 1, 2009, December 30, 2010, January 1, 2012 and January 10, 2012 (included as an exhibit to Registrant’s Form S-1 filed on April 6, 2012 and incorporated herein by reference) | |
II-6
Exhibit Number | Description of Exhibits | |
| Officer Employment Agreement amended November 1, 2006 and effective April 27, 2000, by and among Steven T. Shlemon and Carrabba’s Italian Grill, Inc., as amended on January 1, 2012 (included as an exhibit to Registrant’s Form S-1 filed on April 6, 2012 and incorporated herein by reference) | ||
| Assignment and Amendment and Restatement of Officer Employment Agreement made and entered into March 26, 2009 and effective as of February 5, 2008, by and among Jody Bilney and Outback Steakhouse of Florida, LLC and OSI Restaurant Partners, LLC, as amended on January 1, 2012 | ||
II-5
Index to Financial Statements
|
| |
| Officer Employment Agreement dated January 23, 2008 and effective April 12, 2007 by and among Jeffrey S. Smith and Outback Steakhouse of Florida, LLC, as amended on January 1, 2009 and | ||
| 10.48 | Amended and Restated Employment Agreement dated June 14, 2007, between | |
| Split-Dollar Agreement dated August 12, 2008 and effective March 30, 2006, by and between OSI Restaurant Partners, LLC (formerly known as Outback Steakhouse, Inc.) and Joseph J. Kadow (included as an exhibit to Registrant’s Form S-1 filed on April 6, 2012 and incorporated herein by reference) | ||
| 10.50 | Officer Employment Agreement made and entered into August 16, 2010 and effective for all purposes as of August 16, 2010 by and among David A. Pace and OSI Restaurant Partners, LLC (included as an exhibit to Registrant’s Form S-1 filed on April 6, 2012 and incorporated herein by reference) | |
| Amended and Restated Officer Employment Agreement, effective September 12, 2011, by and among David Berg, OS Management, Inc. and Outback Steakhouse International, L.P., as amended on January 1, 2012 (included as an exhibit to Registrant’s Form S-1 filed on April 6, 2012 and incorporated herein by reference) | ||
II-7
Exhibit Number | Description of Exhibits | |
| 10.56 | Amended and Restated Registration Rights Agreement among Bloomin’ Brands, Inc. and certain stockholders of Bloomin’ Brands, Inc. (included as an exhibit to Registrant’s Annual Report on Form 10-K for the | |
| 10.57 | Stockholders Agreement among Bloomin’ Brands, Inc. and certain stockholders of Bloomin’ Brands, Inc. (included as an exhibit to Registrant’s Annual Report on Form 10-K for the year ended December 31, 2012, File No. 001-35625, and incorporated herein by reference) | |
| 21.1 | List of Subsidiaries | |
| 23.1 | Consent of PricewaterhouseCoopers LLP | |
| 23.2 |
| |
| Consent of Baker & Hostetler LLP (included in the opinion | ||
| 24.1 | Power of | |
| 101.INS | XBRL Instance Document | |
| 101.SCH | XBRL Taxonomy Extension Schema Document | |
| 101.CAL | XBRL Taxonomy Extension Calculation Linkbase Document | |
| 101.DEF | XBRL Taxonomy Extension Definition Linkbase Document | |
| 101.LAB | XBRL Taxonomy Extension Label Linkbase Document | |
| 101.PRE | XBRL Taxonomy Extension Presentation Linkbase Document | |
| * |
II-6
Index to Financial Statements
| 1 | Confidential treatment has been granted with respect to portions of Exhibits 10.1 and 10.22 and such portions have been filed separately with the Securities and Exchange Commission. |
(b) Financial Statement Schedules
The following financial statement schedule is filed as a part of this registration statement on page S-1 immediately followingof the Exhibit Index:prospectus: Schedule II—Valuation and Qualifying Accounts for the years ended December 31, 2012, 2011, 2010 and 2009.2010. All other schedules are omitted because they are not applicableinapplicable or the required information is includedshown in the consolidated financial statements orand notes thereto.
Item 17. Undertakings.
The undersigned Registrant hereby undertakes to provide to the underwriters at the closing specified in the underwriting agreement, certificates in such denominations and registered in such names as required by the underwriters to permit prompt delivery to each purchaser.
Insofar as indemnification for liabilities arising under the Securities Act may be permitted to directors, officers and controlling persons of the Registrant pursuant to the foregoing provisions, or otherwise, the Registrant has been advised that in the opinion of the SEC such indemnification is against public policy as expressed in the Securities Act and is, therefore, unenforceable. In the event that a claim for indemnification against such liabilities (other than the payment by the Registrant of expenses incurred or paid by a director, officer or controlling person of the Registrant in the successful defense of any action, suit or proceeding) is asserted by such director, officer or controlling person in connection with the securities being registered, the Registrant will, unless in the opinion of its counsel the matter has been settled by controlling precedent, submit to a court of appropriate jurisdiction the question whether such indemnification by it is against public policy as expressed in the Securities Act and will be governed by the final adjudication of such issue.
II-8
The undersigned Registrant hereby undertakes that:
(1) For purposes of determining any liability under the Securities Act, the information omitted from the form of prospectus filed as part of this registration statement in reliance upon Rule 430A and contained in a form of prospectus filed by the Registrant pursuant to Rule 424(b)(1) or (4) or 497(h) under the Securities Act shall be deemed to be part of this registration statement as of the time it was declared effective.
(2) For the purpose of determining any liability under the Securities Act, each post-effective amendment that contains a form of prospectus shall be deemed to be a new registration statement relating to the securities offered therein, and the offering of such securities at that time shall be deemed to be the initial bona fide offering thereof.
II-7II-9
Index to Financial Statements
SIGNATURES
Pursuant to the requirements of the Securities Act of 1933, the registrant has duly caused this registration statement to be signed on its behalf by the undersigned, thereunto duly authorized, in the City of Tampa, State of Florida, on April 6, 2012.May 20, 2013.
Date: May 20, 2013
| BLOOMIN’ BRANDS, INC. | ||
| By: | /s/ Elizabeth A. Smith | |
| Name: | Elizabeth A. Smith | |
| Title: | ||
POWER OF ATTORNEY
We, the undersigned officers and directors of Bloomin’ Brands, Inc., hereby severally constitute and appoint Joseph J. Kadow, Dirk A. Montgomery and Amanda Shaw, and each of them singly (with full power to each of them to act alone), our true and lawful attorneys-in-fact and agents, with full power of substitution and resubstitution in each of them for him and in his name, place and stead, and in any and all capacities, to sign any and all amendments (including post-effective amendments) to this Registration Statement, and any other registration statement for the same offering pursuant to Rule 462(b) under the Securities Act of 1933, as amended, and to file the same, with all exhibits thereto and other documents in connection therewith, with the Securities and Exchange Commission, granting unto said attorneys-in-fact and agents, and each of them, full power and authority to do and perform each and every act and thing requisite or necessary to be done in and about the premises, as full to all intents and purposes as he might or could do in person, hereby ratifying and confirming all that said attorneys-in-fact and agents or any of them, or their or his substitute or substitutes, may lawfully do or cause to be done by virtue hereof.
Pursuant to the requirements of the Securities Act of 1933, this registration statement has been signed by the following persons in the capacities held on the dates indicated.
Signature | Title | Date | ||
/s/ Elizabeth A. Smith Elizabeth A. Smith |
(Principal Executive Officer) | |||
| Executive Vice President and Chief Financial Officer (Principal Financial and Accounting Officer) | |||
| ||||
| ||||
Andrew B. Balson | Director | |||
J. Michael Chu | Director | |||
* Mindy Grossman | Director | May 20, 2013 | ||
II-8II-10
Index to Financial Statements
Signature | Title | Date | ||
| Director | |||
John J. Mahoney | Director | May 20, 2013 | ||
* Mark E. Nunnelly | Director | |||
| Director | |||
| *By: | /s/ Joseph J. Kadow | |
| Joseph J. Kadow, Attorney-in-fact | ||
II-9II-11
Index to Financial Statements
EXHIBIT INDEX
Exhibit Number | Description of Exhibits | |
| Form of Underwriting Agreement | ||
| Form of Common Stock Certificate (included as an exhibit to Amendment No. 4 to Registrant’s Registration Statement on Form S-1, File No. 333-180615 (“Form S-1”), filed on July 18, 2012 and incorporated herein by reference) | ||
| ||
| Opinion of Baker & Hostetler | ||
| 10.1 | ||
| 10.3 | ||
| 10.4 | ||
| 10.5 | ||
| 10.6 | Environmental Indemnity, dated March 27, 2012, by OSI HoldCo I, Inc. for the benefit of German American Capital Corporation and Bank of America, N.A. (included as an exhibit to Registrant’s Form S-1 filed on April 6, 2012 and incorporated herein by reference) | |
| 10.7 | Environmental Indemnity, dated March 27, 2012, by OSI Restaurant Partners, LLC and Private Restaurant Master Lessee, LLC for the benefit of German American Capital Corporation and Bank of America, N.A. (included as an exhibit to Registrant’s Form S-1 filed on April 6, 2012 and incorporated herein by reference) | |
| 10.8 | Environmental Indemnity, dated March 27, 2012, by PRP Holdings, LLC for the benefit of German American Capital Corporation and Bank of America, N.A. (included as an exhibit to Registrant’s Form S-1 filed on April 6, 2012 and incorporated herein by reference) | |
| 10.9 | Environmental Indemnity (First Mezzanine), dated March 27, 2012, by OSI HoldCo I, Inc. for the benefit of German American Capital Corporation and Bank of America, N.A. (included as an exhibit to Registrant’s Form S-1 filed on April 6, 2012 and incorporated herein by reference) | |
Exhibit Number | Description of Exhibits | |
| 10.10 | Environmental Indemnity (First Mezzanine), dated March 27, 2012, by OSI Restaurant Partners, LLC and Private Restaurant Master Lessee, LLC for the benefit of German American Capital Corporation and Bank of America, N.A. (included as an exhibit to Registrant’s Form S-1 filed on April 6, 2012 and incorporated herein by reference) | |
| 10.11 | Environmental Indemnity (First Mezzanine), dated March 27, 2012, by PRP Holdings, LLC for the benefit of German American Capital Corporation and Bank of America, N.A. (included as an exhibit to Registrant’s Form S-1 filed on April 6, 2012 and incorporated herein by reference) | |
| 10.12 | Environmental Indemnity (Second Mezzanine), dated March 27, 2012, by OSI HoldCo I, Inc. for the benefit of German American Capital Corporation and Bank of America, N.A. (included as an exhibit to Registrant’s Form S-1 filed on April 6, 2012 and incorporated herein by reference) | |
| 10.13 | Environmental Indemnity (Second Mezzanine), dated March 27, 2012, by OSI Restaurant Partners, LLC and Private Restaurant Master Lessee, LLC for the benefit of German American Capital Corporation and Bank of America, N.A. (included as an exhibit to Registrant’s Form S-1 filed on April 6, 2012 and incorporated herein by reference) | |
| 10.14 | Environmental Indemnity (Second Mezzanine), dated March 27, 2012, by PRP Holdings, LLC for the benefit of German American Capital Corporation and Bank of America, N.A. (included as an exhibit to Registrant’s Form S-1 filed on April 6, 2012 and incorporated herein by reference) | |
| 10.15 | Guaranty of Recourse Obligations, dated March 27, 2012, by OSI HoldCo I, Inc. to and for the benefit of German American Capital Corporation and Bank of America, N.A. (included as an exhibit to Registrant’s Form S-1 filed on April 6, 2012 and incorporated herein by reference) | |
| 10.16 | Guaranty of Recourse Obligations (First Mezzanine), dated March 27, 2012, by OSI HoldCo I, Inc. to and for the benefit of German American Capital Corporation and Bank of America, N.A. (included as an exhibit to Registrant’s Form S-1 filed on April 6, 2012 and incorporated herein by reference) | |
| 10.17 | Guaranty of Recourse Obligations (Second Mezzanine), dated March 27, 2012, by OSI HoldCo I, Inc. to and for the benefit of German American Capital Corporation and Bank of America, N.A. (included as an exhibit to Registrant’s Form S-1 filed on April 6, 2012 and incorporated herein by reference) | |
| 10.18 | Amended and Restated Guaranty, dated March 27, 2012, by OSI Restaurant Partners, LLC to and for the benefit of New Private Restaurant Properties, LLC (included as an exhibit to Registrant’s Form S-1 filed on April 6, 2012 and incorporated herein by reference) | |
| 10.19 | Subordination, Non-Disturbance and Attornment Agreement (New Private Restaurant Properties, LLC), dated March 27, 2012, by and between Bank of America, N.A., German American Capital Corporation, Private Restaurant Master Lessee, LLC and New Private Restaurant Properties, LLC, with the acknowledgement, consent and limited agreement of OSI Restaurant Partners, LLC (included as an exhibit to Registrant’s Form S-1 filed on April 6, 2012 and incorporated herein by reference) | |
| 10.20 | Royalty Agreement dated April 1995 among Carrabba’s Italian Grill, Inc., Outback Steakhouse, Inc., Mangia Beve, Inc., Carrabba, Inc., Carrabba Woodway, Inc., John C. Carrabba, III, Damian C. Mandola, and John C. Carrabba, Jr., as amended by First Amendment to Royalty Agreement dated January 1997 and Second Amendment to Royalty Agreement made and entered into effective April 7, 2010 by and among Carrabba’s Italian Grill, LLC, OSI Restaurant Partners, LLC, Mangia Beve, Inc., Mangia Beve II, Inc., Original, Inc., Voss, Inc., John C. Carrabba, III, Damian C. Mandola, and John C. Carrabba, Jr. (included as an exhibit to Registrant’s Form S-1 filed on April 6, 2012 and incorporated herein by reference) | |
Exhibit Number | Description of Exhibits | |
| Amended and Restated Operating Agreement for OSI/Fleming’s, LLC made as of June 4, 2010 by and among OS Prime, LLC, a wholly-owned subsidiary of OSI Restaurant Partners, LLC, FPSH Limited Partnership and AWA III Steakhouses, Inc. | ||
Index to Financial Statements
|
| |
| ||
| ||
| ||
| ||
| ||
| ||
| ||
| 10.22 | ||
Index to Financial Statements
|
| |
| Amended and Restated Master Lease Agreement, dated March 27, 2012, between New Private Restaurant Properties, LLC, as landlord, and Private Restaurant Master Lessee, LLC, as tenant1 (included as an exhibit to Amendment No. 1 to Registrant’s Form S-1 filed on May 17, 2012 and incorporated herein by reference) | ||
| 10.23 | Lease, dated June 14, 2007, between OS Southern, LLC and Selmon’s/Florida-I, Limited Partnership (predecessor to MVP LRS, LLC) (included as an exhibit to Amendment No. 1 to Registrant’s Form S-1 filed on May 17, 2012 and incorporated herein by reference) | |
| 10.24 | Lease, dated June 14, 2007, between OS Southern, LLC and Selmon’s/Florida-I, Limited Partnership (predecessor to MVP LRS, LLC), as amended May 27, 2010 (included as an exhibit to Amendment No. 1 to Registrant’s Form S-1 filed on May 17, 2012 and incorporated herein by reference) | |
| 10.25 | Employee Rollover Agreement for conversion of OSI Restaurant Partners, Inc. restricted stock to Kangaroo Holdings, Inc. restricted stock entered into by the individuals listed on Schedule 1 thereto (included as an exhibit to Registrant’s Form S-1 filed on April 6, 2012 and incorporated herein by reference) | |
| 10.26 | OSI Restaurant Partners, LLC HCE Deferred Compensation Plan effective October 1, 2007 (included as an exhibit to Registrant’s Form S-1 filed on April 6, 2012 and incorporated herein by reference) | |
| 10.27 | ||
| 10.28 | Form of Option Agreement for Options under the Kangaroo Holdings, Inc. 2007 Equity Incentive Plan (included as an exhibit to Registrant’s Form S-1 filed on April 6, 2012 and incorporated herein by reference) | |
| 10.29 | Bloomin’ Brands, Inc. 2012 Incentive Award Plan (included as an exhibit to Amendment No. 4 to Registrant’s Form S-1 filed on July 18, 2012 and incorporated herein by reference) | |
| 10.30 | Form of Nonqualified Stock Option Award Agreement for options granted under the Bloomin’ Brands, Inc. 2012 Incentive Award Plan (included as an exhibit to Registrant’s Current Report on Form 8-K filed on December 7, 2012, File No. 001-35625, and incorporated herein by reference) | |
| 10.31 | Form of Restricted Stock Award Agreement for restricted stock granted to directors under the Bloomin’ Brands, Inc. 2012 Incentive Award Plan (included as an exhibit to Registrant’s Current Report on Form 8-K filed on December 7, 2012, File No. 001-35625, and incorporated herein by reference) | |
| 10.32 | Form of Restricted Stock Award Agreement for restricted stock granted to employees and consultants under the Bloomin’ Brands, Inc. 2012 Incentive Award Plan (included as an exhibit to Registrant’s Current Report on Form 8-K filed on December 7, 2012, File No. 001-35625, and incorporated herein by reference) | |
| 10.33 | Form of Performance Unit Award Agreement for performance units granted under the Bloomin’ Brands, Inc. 2012 Incentive Award Plan (included as an exhibit to Registrant’s Current Report on Form 8-K filed on December 7, 2012, File No. 001-35625, and incorporated herein by reference) | |
| 10.34 | Form of Bloomin’ Brands, Inc. Indemnification Agreement by and between Bloomin’ Brands, Inc. and each member of its Board of Directors and each of its executive officers (included as an exhibit to Amendment No. 4 to Registrant’s Form S-1 filed on July 18, 2012 and incorporated herein by reference) | |
Exhibit Number | Description of Exhibits | |
| 10.35 | Bloomin’ Brands, Inc. Executive Change in Control Plan, effective December 6, 2012 (included as an exhibit to Registrant’s Current Report on Form 8-K filed on December 7, 2012, File No. 001-35625, and incorporated herein by reference) | |
| 10.36 | Amended and Restated Employment Agreement made and entered into September 4, 2012 by and between Elizabeth A. Smith and Bloomin’ Brands, Inc. (included as an exhibit to Registrant’s Quarterly Report on Form 10-Q for the quarter ended June 30, 2012, File No. 001-35625, and incorporated herein by reference) | |
| 10.37 | Retention Bonus Agreement, dated November 2, 2009, between Kangaroo Holdings, Inc. and Elizabeth A. Smith (included as an exhibit to Registrant’s Form S-1 filed on April 6, 2012 and incorporated herein by reference) | |
| 10.38 | Bonus Agreement, dated December 31, 2009, between Kangaroo Holdings, Inc. and Elizabeth A. Smith (included as an exhibit to Registrant’s Form S-1 filed on April 6, 2012 and incorporated herein by reference) | |
| 10.39 | Amendment to Bonus Agreements, dated May 10, 2012, by and between Elizabeth A. Smith and Bloomin’ Brands, Inc. (included as an exhibit to Amendment No. 1 to Registrant’s Form S-1 filed on May 17, 2012 and incorporated herein by reference) | |
| 10.40 | Option Agreement, dated November 16, 2009, by and between Kangaroo Holdings, Inc. and Elizabeth A. Smith, as amended December 31, 2009 (included as an exhibit to Registrant’s Form S-1 filed on April 6, 2012 and incorporated herein by reference) | |
| 10.41 | Option Agreement, dated July 1, 2011, by and between Kangaroo Holdings, Inc. and Elizabeth A. Smith (included as an exhibit to Registrant’s Form S-1 filed on April 6, 2012 and incorporated herein by reference) | |
| 10.42 | Officer Employment Agreement, made and entered into effective May 7, 2012, by and among David Deno and OSI Restaurant Partners, LLC (included as an exhibit to Amendment No. 1 to Registrant’s Form S-1 filed on May 17, 2012 and incorporated herein by reference) | |
| 10.43 | Amended and Restated Employment Agreement dated June 14, 2007, between Dirk A. Montgomery and OSI Restaurant Partners, LLC, as amended on January 1, 2009, December 30, 2010, January 1, 2012 and January 10, 2012 (included as an exhibit to Registrant’s Form S-1 filed on April 6, 2012 and incorporated herein by reference) | |
| Officer Employment Agreement amended November 1, 2006 and effective April 27, 2000, by and among Steven T. Shlemon and Carrabba’s Italian Grill, Inc., as amended on January 1, 2012 (included as an exhibit to Registrant’s Form S-1 filed on April 6, 2012 and incorporated herein by reference) | ||
| Assignment and Amendment and Restatement of Officer Employment Agreement made and entered into March 26, 2009 and effective as of February 5, 2008, by and among Jody Bilney and Outback Steakhouse of Florida, LLC and OSI Restaurant Partners, LLC, as amended on January 1, 2012 (included as an exhibit to Registrant’s Form S-1 filed on April 6, 2012 and incorporated herein by reference) | ||
| Officer Employment Agreement dated January 23, 2008 and effective April 12, 2007 by and among Jeffrey S. Smith and Outback Steakhouse of Florida, LLC, as amended on January 1, 2009 and | ||
Exhibit Number | Description of | |
| 10.48 | Amended and Restated Employment Agreement dated June 14, 2007, between | |
| Split-Dollar Agreement dated August 12, 2008 and effective March 30, 2006, by and between OSI Restaurant Partners, LLC (formerly known as Outback Steakhouse, Inc.) and Joseph J. Kadow (included as an exhibit to Registrant’s Form S-1 filed on April 6, 2012 and incorporated herein by reference) | ||
| 10.50 | Officer Employment Agreement made and entered into August 16, 2010 and effective for all purposes as of August 16, 2010 by and among David A. Pace and OSI Restaurant Partners, LLC (included as an exhibit to Registrant’s Form S-1 filed on April 6, 2012 and incorporated herein by reference) | |
| Amended and Restated Officer Employment Agreement, effective September 12, 2011, by and among David Berg, OS Management, Inc. and Outback Steakhouse International, L.P., as amended on January 1, 2012 (included as an exhibit to Registrant’s Form S-1 filed on April 6, 2012 and incorporated herein by reference) | ||
Index to Financial Statements
|
| |
| 10.56 | Amended and Restated Registration Rights Agreement among Bloomin’ Brands, Inc. and certain stockholders of Bloomin’ Brands, Inc. (included as an exhibit to Registrant’s Annual Report on Form 10-K for the | |
| 10.57 | Stockholders Agreement among Bloomin’ Brands, Inc. and certain stockholders of Bloomin’ Brands, Inc. (included as an exhibit to Registrant’s Annual Report on Form 10-K for the year ended December 31, 2012, File No. 001-35625, and incorporated herein by reference) | |
| 21.1 | List of Subsidiaries | |
| 23.1 | Consent of PricewaterhouseCoopers LLP | |
| 23.2 | Consent of | |
| 24.1 | Power of | |
| 101.INS | XBRL Instance Document | |
Exhibit Number | Description of Exhibits | |
| 101.SCH | XBRL Taxonomy Extension Schema Document | |
| 101.CAL | XBRL Taxonomy Extension Calculation Linkbase Document | |
| 101.DEF | XBRL Taxonomy Extension Definition Linkbase Document | |
| 101.LAB | XBRL Taxonomy Extension Label Linkbase Document | |
| 101.PRE | XBRL Taxonomy Extension Presentation Linkbase Document | |
| * |
| 1 | Confidential treatment has been granted with respect to portions of Exhibits 10.1 and 10.22 and such portions have been filed separately with the Securities and Exchange Commission. |