As filed with the Securities and Exchange Commission on July 8,October 7, 2016
Registration No. 333- 333-212449
UNITED STATES
SECURITIES AND EXCHANGE COMMISSION
WASHINGTON, D.C. 20549
Amendment No. 4
to
FORM S-1
REGISTRATION STATEMENT
UNDER
THE SECURITIES ACT OF 1933
Forterra, Inc.
| Delaware | 3272 | 37-1830464 | ||
(State or other jurisdiction of incorporation or organization) | (Primary Standard Industrial Classification Code Number) | (I.R.S. Employer Identification Number) |
511 East John Carpenter Freeway, 6th Floor
Irving, TX 75062
(469) 458-7973
(Address, including zip code, and telephone number, including area code, of registrant’s principal executive offices)
Jeff Bradley
Chief Executive Officer
Forterra, Inc.
511 East John Carpenter Freeway, 6th Floor
Irving, TX 75062
tel: (469) 458-7973
(Name, address, including zip code, and telephone number, including area code, of agent for service)
Copies to:
Jeffrey A. Chapman Peter W. Wardle Gibson, Dunn & Crutcher LLP 2100 McKinney Ave., Suite 1100 Dallas, TX 75201 tel: (214) 698-3100 fax: (214) 571-2900 | Joshua Davidson Samantha H. Crispin Baker Botts L.L.P. One Shell Plaza 910 Louisiana Street Houston, TX 77002 tel: (713) 229-1234 fax: (713) 229-1522 |
Approximate date of commencement of proposed sale to the public:As soon as practicable after this registration statement is declared effective.
If any of the securities being registered on this Form are to be offered on a delayed or continuous basis pursuant to Rule 415 under the Securities Act of 1933, check the following box. ¨
If this Form is filed to register additional securities for an offering pursuant to Rule 462(b) under the Securities Act, please check the following box and list the Securities Act registration statement number of the earlier effective registration statement for the same offering. ¨
If this Form is a post-effective amendment filed pursuant to Rule 462(c) under the Securities Act, check the following box and list the Securities Act registration statement number of the earlier effective registration statement for the same offering. ¨
If this Form is a post-effective amendment filed pursuant to Rule 462(d) under the Securities Act, check the following box and list the Securities Act registration statement number of the earlier effective registration statement for the same offering. ¨
Indicate by check mark whether the registrant is a large accelerated filer, an accelerated filer, a non-accelerated filer, or a smaller reporting company. See the definitions of “large accelerated filer,” “accelerated filer” and “smaller reporting company” in Rule 12b-2 of the Exchange Act.
| Large accelerated filer | ¨ | Accelerated filer | ¨ | |||
| Non-accelerated filer | x (Do not check if a smaller reporting company) | Smaller reporting company | ¨ |
CALCULATION OF REGISTRATION FEE
|
|
| ||||||||||
Title of Each Class of Securities to be Registered | Proposed Maximum Aggregate Offering Price(1)(2) | Amount of Registration Fee | Amount to be Registered(1) | Proposed Maximum Offering Price Per Unit(2) | Proposed Maximum Aggregate Offering Price(1)(2) | Amount of Registration Fee | ||||||
Common Stock, $0.001 par value per share | $100,000,000 | $10,070 | 21,183,000 | $21.00 | $444,843,000 | $50,037.31(3) | ||||||
|
|
| ||||||||||
|
|
| ||||||||||
| (1) | Includes 2,763,000 shares that the underwriters have the option to purchase. See “Underwriting.” |
| (2) | Estimated solely for the purpose of calculating the registration fee under Rule |
| (3) | $10,070 previously paid. |
The Registrant hereby amends this Registration Statement on such date or dates as may be necessary to delay its effective date until the Registrant shall file a further amendment which specifically states that this Registration Statement shall thereafter become effective in accordance with Section 8(a) of the Securities Act of 1933 or until the Registration Statement shall become effective on such date as the Commission, acting pursuant to said Section 8(a), may determine.
The information in this preliminary prospectus is not complete and may be changed. These securities may not be sold until the registration statement filed with the Securities and Exchange Commission is effective. This preliminary prospectus is not an offer to sell nor does it seek an offer to buy these securities in any jurisdiction where the offer or sale is not permitted.
SUBJECT TO COMPLETION, DATED JULY 8,OCTOBER 7, 2016
18,420,000 Shares
Forterra, Inc.
Common Stock
$ per share
This is the initial public offering of our common stock. We are offering shares of our common stock and the selling stockholder identified in this prospectus is offering18,420,000 shares of our common stock. We will not receive any proceeds from the sale of shares by the selling stockholder. Prior to this offering, there has been no public market for our common stock. It is currently estimated that the initial public offering price per share will be between $$19.00 and $ .$21.00.
hasWe and the selling stockholder have each granted to the underwriters an option to purchase up to 1,381,500 additional shares of common stock. We will not receive any proceeds from the sale of shares by the selling stockholder.
We intend to applyhave applied to list our common stock on the NASDAQ Global Select Market under the symbol “ .”“FRTA.”
Investing in our common stock involves risks. See “Risk Factors” beginning on page 2223 to read about factors you should consider before buying shares of our common stock.
Neither the Securities and Exchange Commission nor any other regulatory body has approved or disapproved of these securities or passed upon the accuracy or adequacy of this prospectus. Any representation to the contrary is a criminal offense.
| Per Share | Total | |||||||
Initial public offering price | $ | $ | ||||||
Underwriting discount(1) | $ | $ | ||||||
Proceeds to us (before expenses) | $ | $ | ||||||
| ||||||||
| (1) | See “Underwriting” for a description of all underwriting compensation payable in connection with this offering. |
The underwriters expect to deliver the shares to purchasers on or about �� , 2016 through the book-entry facilities of The Depository Trust Company.
Joint Book-Running Managers
| Goldman, Sachs & Co. | Citigroup | Credit Suisse | ||
| Barclays | Deutsche Bank Securities | RBC Capital Markets | ||
Co-Managers
| Oppenheimer & Co. | Stephens Inc. | SunTrust Robinson Humphrey | ||
Prospectus dated , 2016
FORTERRA
US PIPE
HP LOK
FORTERRA
| Page | ||||
| 1 | ||||
Unaudited Pro Forma Condensed Combined Financial Information | ||||
Management’s Discussion and Analysis of Financial Condition and Results of Operations | ||||
| F-1 | ||||
We are responsible for the information contained in this prospectus, in any amendment or supplement to this prospectus and in any free-writing prospectus we prepare or authorize. We have not authorized anyone to provide you with different information, and we take no responsibility for and cannot provide any assurance as to the reliability of any other information others may give you. We are not, the selling stockholder is not and the underwriters are not, making an offer to sell shares of our common stock in any jurisdiction where the offer or sale is not permitted. You should not assume that the information contained in this prospectus is accurate as of any date other than its date.
i
GENERAL INFORMATION
Industry and Market Data
We use market data and industry forecasts throughout this prospectus and, in particular, in the sections entitled “Prospectus Summary” and “Business.” Unless otherwise indicated, statements in this prospectus concerning our industries and the markets in which we operate, including our general expectations, competitive position, business opportunity and market size, growth and share, are based on publicly available information, periodic industry publications and surveys, government surveys and reports, including from the U.S. Census Bureau and the U.S. Environmental Protection Agency, or EPA, and reports by market research firms.
In this prospectus, when we refer to:
We have not independently verified market data and industry forecasts provided by any of these or any other third-party sources referred to in this prospectus, although we believe such market data and industry forecasts included in this prospectus are reliable. This information cannot always be verified with complete certainty due to the limits on the availability and reliability of raw data, the voluntary nature of the data gathering process and other limitations and uncertainties inherent in surveys of market size.
Management estimates are derived from the information and data referred to above, as well as our internal research, calculations and assumptions made by us based on our analysis of such information and data and our knowledge of our industries and markets, which we believe to be reasonable, although they have not been independently verified. While we believe that the market position information included in this prospectus is generally reliable, such information is inherently imprecise. Assumptions, expectations and estimates of our future performance and the future performance of the industries and markets in which we operate are necessarily subject to a high degree of uncertainty and risk due to a variety of factors, including those described in the sections entitled “Risk Factors” and “Forward-Looking Statements.” These and other factors could cause results to differ materially from those expressed in the estimates made by the independent parties and by us.
ii
Pro Forma Financial Information
In addition to our results presented under U.S. GAAP, or GAAP, in this prospectus we also present certain pro forma financial information that gives effect to the acquisition of our business from HeidelbergCement AG, certain acquisition transactions we have completed following the acquisition of our business from HeidelbergCement AG and certain other transactions, as discussed in greater detail in the section entitled “Unaudited Pro Forma Condensed Combined Financial Information.” As a result of these transactions, our historical financial results do not reflect any impact or the full impact, as applicable, of these transactions, and our management believes it is important to discuss our pro forma financial information because it provides investors with additional context regarding our business. However, our pro forma financial information should not be considered independent of our audited and unaudited combined financial statements and the related notes included elsewhere in this prospectus and the pro forma financial statements included in the section entitled “Unaudited Pro Forma Condensed Combined Financial Information.”
iii
The following is a summary of material information discussed in this prospectus. The summary is not complete and does not contain all of the information that you should consider before investing in our common stock. You should read this entire prospectus carefully, including the risks discussed in the section entitled “Risk Factors” and our audited and unaudited combined Predecessor and Successor financial statements and the related notes, and our unaudited pro forma condensed combined financial information and the related notes, each included elsewhere in this prospectus, before making an investment decision to purchase shares of our common stock. Some of the statements in this summary constitute forward-looking statements. See “Forward-Looking Statements.”
On March 13, 2015, through an indirect wholly owned subsidiary, Lone Star Fund IX (U.S.), L.P. acquired the building products business of HeidelbergCement AG in the United States and Eastern Canada. Unless otherwise specified or where the context otherwise requires, references in this prospectus to “our,” “we,” “us,” the “Company” and “our business” (i) for the Predecessor periods prior to the completion of the acquisition described above, refer to the building products business of HeidelbergCement AG in the United States and Eastern Canada, (ii) for the Successor periods after completion of the acquisition described above, but prior to the internal reorganization transaction described below, the building products business of LSF9 Concrete Holdings Ltd in the United States and Eastern Canada and (iii) for the Successor periods after completion of the internal reorganization transaction in which LSF9 Concrete Holdings Ltd will transfer its building products business in the United States and Eastern Canada to Forterra, Inc., the operations of Forterra, Inc., in each case together with its consolidated subsidiaries. We are a holding company controlled and indirectly owned by Lone Star Fund IX (U.S.), L.P. and have a relatively short operating history as a stand-alone company.
All amounts in this prospectus are expressed in U.S. dollars unless specifically noted otherwise and the financial statements have been prepared in accordance with GAAP.
Our Company
We are a leading manufacturer of pipe and precast products by sales volume in the United States and Eastern Canada for a variety of water-related infrastructure applications, including water transmission, distribution and drainage. We provide critical infrastructure components for a broad spectrum of construction projects across residential, non-residential and infrastructure markets. Our extensive suite of end-to-end products covers “the First Mile to the Last Mile” of the water infrastructure grid, ranging from large diameter pipe that transports water to and from treatment centers and manages drainage along major transportation corridors, to smaller diameter pipe that delivers potable water to, and removes wastewater from, end users in residential and commercial settings. We employ a specialized technical salesforce, including engineers and field service representatives, which enables us to deliver a high degree of customer service, create tailored solutions and ensure our products meet project specifications to maximize applications in the field. We believe that ourOur product breadth, footprint in the United States and Eastern Canada and significant scale help make us a one-stop shop for water-related pipe and products, and a preferred supplier to a wide variety of customers, including contractors, distributors and municipalities.
We are a market leader within eachboth of our three business segments: Drainage Pipe & Products and Water Pipe & Products and Bricks.Products. In 2015, approximatelymore than 75% of our pro forma net sales was generated from our concrete drainage pipe and precast products, ductile iron pipe, or DIP, and concrete pressure pipe products, product categories in which we hold a leading market share position by sales volume in the United States and Eastern Canada.
the United States and Eastern Canada. We are also one of the top manufacturers of bricks in the United States and operate the only commercial brick manufacturing plant in Eastern Canada.
Our manufacturing and distribution network is one of the most extensive in the industry, allowing us to serve most major U.S. and Eastern Canadian markets. We operate 11396 manufacturing facilities and currently have significant additional manufacturing capacity available in eachboth of our segments, providing substantial room to increase production to meet short-cycle demand with minimal incremental investment. These strategically located facilities, which have a significant replacement cost, and our broad distribution network provide us with a local presence and the necessary proximity to our customers to minimize delivery time and distribution costs.
As one of the only companies of scale in our industry that manufactures both water drainage pipe and precast structures (used primarily for stormwater and drainage applications) and water transmission and distribution pipe (used primarily to transport potable water and as a component of wastewater systems), our complementary product portfolio is well positioned to serve both the projected $10.4 billion stormwater and wastewater infrastructure market and the projected $7.9 billion potable water transmission and distribution market, each based on Freedonia projections of 2018 total U.S. market demand. AWWA estimates that nearly $1 trillion will need to be spent from 2010 to 2035 to repair and upgrade aging water infrastructure in the United States. In December 2015, the Fixing America’s Surface Transportation Act, or the FAST Act, was enacted by the U.S. federal government authorizing $305.0 billion of funding over the following five years to upgrade transportation-related infrastructure, more than 70% of which relates to highway spending, which supports a key end market for our Drainage Pipe & Products business due to the stormwater, drainage and related needs associated with highway construction and improvement projects. As “Buy America” provisions become increasingly prevalent under federal law, we believe our domestic manufacturing footprint will be a competitive advantage. Additionally, within the water transmission and distribution markets, Dodge market forecasts suggest that new residential and non-residential construction starts, which remain well below long-term historical averages, are expected to grow from 2015 levels. We believe that our exposure to each of the residential, non-residential and infrastructure end markets will allow us to benefit from both secular and cyclical growth across each of these end markets. The residential, non-residential and infrastructure end markets in the United States and Eastern Canada have different growth drivers and operating dynamics, and the cyclical performance of these markets has historically been staggered during different stages of the broader economic cycle.
For the Predecessor period from January 1, 2015 to March 13, 2015, we generated net sales of $132.6 million, a net loss of $5.8 million and Adjusted EBITDA of $3.3 million, and for the Successor period from March 14, 2015 to December 31, 2015, we generated net sales of $722.7 million, a net loss of $82.8 million and Adjusted EBITDA of $60.2 million. In 2015, we generated pro forma net sales of $1,733.4$1,663.4 million, pro forma net loss from continuing operations of $139.9$76.3 million and pro forma Adjusted EBITDA of $202.5$187.1 million. ProAdjusted EBITDA and pro forma Adjusted EBITDA is aare non-GAAP measure.measures. See the section entitled “Non-GAAP Financial Information” for a description of how we define and calculate Adjusted EBITDA and pro forma Adjusted EBITDA, a reconciliation thereof to pro forma net income (loss) and pro forma income (loss) from continuing operations, respectively, and a description of why we believe this measure isthese measures are important.
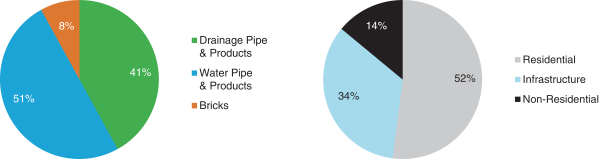
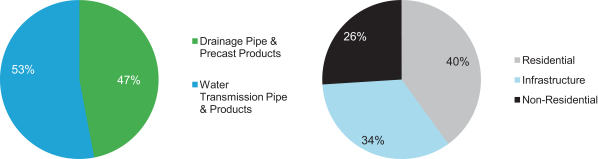
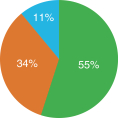
The following charts represent the pro forma net sales contribution by business segment for the 12 months ended December 31, 2015 and an estimated breakdown by end market for the same period. In 2015, excluding our corporate segment, 23% of both our Predecessor and Successor net sales and 53% of our pro forma net sales were generated by our Water Pipe & Products segment; and 61% and 60% of our Predecessor and Successor net sales, respectively, and 47% of our pro forma net sales were generated by our Drainage Pipe & Products segment. In 2015, we estimate that approximately 36% and 39% of our Predecessor and Successor net sales, respectively, and approximately 40% of our pro forma net sales were generated from residential construction activity; approximately 47% and 45% of our
Predecessor and Successor net sales, respectively, and approximately 34% of our pro forma net sales were generated from government-funded infrastructure projects; and approximately 17% and 16% of our Predecessor and Successor net sales, respectively, and approximately 26% of our pro forma net sales were generated from non-residential construction activity.
2015 Pro Forma Net Sales by Segment* and Estimated End Market | ||
| ||
* Excludes Corporate and Other business segment.
Since being acquired from HeidelbergCement AG in 2015, we have undergone a significant transformation to become a leading water infrastructure company throughout the United States and Eastern Canada. As part of this transformation, we have:
Our organic growth strategy is focused on leveraging our low-cost operations, high level of customer service and product innovation capabilities, as well as our product breadth and industry-leading scale, to cross-sell our products to existing customers to increase penetration and project wins and to gain market share through new customers. Operationally, we continue to focus on efficiency and productivity improvements to reduce costs and drive margin improvements.
We have built a strong operating platform and continuously evaluate acquisition opportunities to complement our organic growth and improve our market positions within the markets we serve. Over the past three years, sixseven strategic acquisitions (including three acquisitions completed by U.S. Pipe)
have provided meaningful, ongoing synergy benefits. We believe that our success in acquiring businesses has been the result of our highly disciplined approach, continuous monitoring of potential targets (with a focus on culture and people, among other things), and a market view that Forterra is a strong partner given our scale, culture and recent growth. We believe significant acquisition opportunities at attractive prices are still available given the relatively fragmented landscape in several of the sub-markets in which we operate.
Our Segments
Drainage Pipe & Products. We are the largest producer of concrete drainage pipe and precast products by sales volume in the United States and Eastern Canada. We have 6870 manufacturing facilities across 30 states and two Canadian provinces. We believe our extensive product offering creates a compelling value proposition for our customers as it eliminates the need to engage multiple suppliers of stormwater and wastewater-related products for a single project, thereby maximizing efficiency and allowing our customers to meet more aggressive timetables. We also have the ability to custom-build products to complex specifications and regulations, further enhancing our ability to address customer needs. Our top ten Drainage Pipe & Products customers have an average tenure with us of approximately 17 years. Recently, we acquired concrete pipe and precast and related product manufacturers Cretex and Sherman-Dixie to further enhance our scale, geographic footprint and product portfolio.
Water Pipe & Products. We are the largest producer of DIP and concrete pressure pipe by sales volume in the United States and Eastern Canada. We offer significant product breadth and depth and technical service, addressing our customers’ full range of water transmission and distribution needs. Our 2826 manufacturing facilities are strategically located across the United States and Eastern Canada, with ample swing capacity available to support increased production levels as demand in the construction industry continues to improve. Furthermore, we believe our expansive distribution network allows us to achieve lead times among the shortest in the industry. Our top ten Water Pipe & Products customers have an average tenure with us of approximately 24 years. Recently, we acquired U.S. Pipe, a market leader within DIP, to diversify our product portfolio and enhance our service offering. U.S. Pipe’s recent acquisition history includes the acquisitions of Griffin Pipe Products Co., LLC, or Griffin Pipe, a manufacturer of DIP, the operations of Metalfit S.A de C.V and Metalfit, Inc., collectively Metalfit, a manufacturer of waterworks fittings and industrial castings, and Custom Fab, Inc., or Custom Fab, a fabricator of pipe primarily for the waterworks industry.
Bricks. We are one of the largest manufacturers of bricks by capacity in the United States and Eastern Canada. We operate 17 manufacturing facilities, strategically located near large population centers or major census Metropolitan Statistical Areas, or MSAs, and raw material reserves. We offer more than 300 core styles of bricks to both residential and non-residential end markets. Our facilities are located in Ontario, Quebec, Kentucky, Michigan, North Carolina, South Carolina and Texas.
|
| |||
   |    | |||
|
| |||
|
| |||
|
| |||
|
| |||
 |  | |||
 | ||||
| Key Segments | Drainage Pipe & Products | Water Pipe & Products | ||
| Products |  |  | ||
| Product Applications | Stormwater and wastewater infrastructure | Potable and wastewater transmission and distribution | ||
| 2018 Estimated U.S. Demand1 | $10.4bn | $7.9bn | ||
| Primary Market Channels | • Direct to Contractors • Distributors | • Distributors • Direct to Contractors, Municipalities and Utilities Waterworks | ||
| # of Manufacturing Facilities | 70 | 26 | ||
| 1 |
| Freedonia—Projected 2018 total market demand. |
Drainage Pipe & Products | Water Pipe & Products | |||
| 2015 Pro Forma Net Sales by Product | 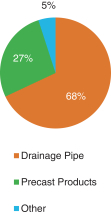 | 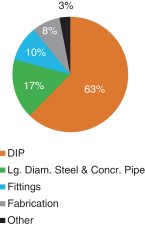 | ||
| Primary Market Channels | • Direct to Contractors • Distributors | • Distributors • Direct to Contractors, Municipalities and Utilities Waterworks | ||
| # of Manufacturing Facilities | 68 | 28 | ||
Our Competitive Strengths
Leading Market Positions with Unmatched Scale and Footprint. We believe we are the largest manufacturer in the over $17.0 billion U.S. drainage and water transmission pipe market, as estimated by Freedonia. We believe we are a leader in the following major product categories: concrete drainage pipe and precast products, DIP and concrete pressure pipe. Our industry is relatively fragmented and local in nature due to the transportation costs associated with our products, particularly in the Drainage Pipe & Products business. Our industry has few participants of scale, and we are one of the only sizeable players with significant presence in both the Drainage Pipe & Products and Water Pipe & Products segments, with an extensive portfolio covering “the First Mile to the Last Mile” and a broad geographic footprint. Further, we believe we have one of the most extensive manufacturing and distribution networks in the water transmission and infrastructure industry. We believe our geographic footprint enables us to win more large business projects than our local or regional competitors, as we can provide services to contractors and distributors across geographies and product categories. Additionally, due to our scale, we have purchasing power with suppliers, which reduces our operating costs and enhances our ability to win business in competitive bidding processes.
Well-positioned to Benefit from Attractive Industry Fundamentals. Our exposure to each of the residential, non-residential and infrastructure end markets enables us to capitalize on the growth in demand and recovery in each of these end markets and diversifies our customer base. The construction industry is recovering, fueled by the continuing rebound in infrastructure, residential and non-residential activity. According to AWWA, water infrastructure in the United States will require nearly $1 trillion of investment for repairs and upgrades from 2010 to 2035. The U.S. and Canadian governments are committed to upgrading their aging infrastructure. The FAST Act allocates $305.0 billion to improving surface transportation infrastructure, and in its budget for 2016, the Canadian federal government proposed $11.9 billion (CAD) in infrastructure spending over the next
five years, with $2.0 billion (CAD) in a clean water and wastewater fund and $2.2 billion (CAD) towards water, wastewater and waste management infrastructure. Additional secular industry trends support further infrastructure construction growth, including the growing demand for precast structure products,
environmental regulations supporting on-site water management and continued urbanization. Furthermore, Dodge market forecasts suggest that both residential and non-residential construction starts will grow from 2015 levels, which remain well below the average of the most recent cyclical troughs, and significantly below the average annual starts since 1970. Lastly, we have a presence in each of the 40 most populous MSAs and ten most populous states, enabling us to benefit from the recovery in residential construction.
Complete Suite of Products to Serve Customers from “the First Mile to the Last Mile.” We believe we offer unmatched product breadth and depth compared to our competitors in the United States and Eastern Canada. In our Water Pipe & Products segment, our complementary product portfolio of concrete and steel pressure pipe and DIP addresses the broad range of our customers’ water transmission and distribution needs. Our comprehensive suite of products incorporates large diameter pipe that transports water to treatment plants as well as smaller diameter pipe for distribution to residential users. In our Drainage Pipe & Products segment, our diversified product offering creates a one-stop shop for water-related pipe and products. Our drainage offering creates a compelling value proposition for customers by eliminating the need to seek multiple bids for a single project, helping maximize efficiency for time sensitive orders. Finally, our extensive product offering also creates cross-selling opportunities for our segments due to our broad and diversified customer base.
Attractive and Expanding Margins and Strong Cash Flow Profile. Due to our increasing scale, cost cutting initiatives and our work toward integrating acquisitions, we have generated attractive and increasing margins, capitalizing on our low-cost operations and operating leverage. Our regional and local sales force, strategically located manufacturing facilities and broad distribution network allow us to serve our customers across the United States and Eastern Canada at a competitive cost with efficient procurement and operations. We expect to further increase our scale through acquisitions and, as a result, we expect to continue to generate purchasing power, operating leverage and cost saving opportunities. Furthermore, we have an ongoing strategy of implementing cost-cutting initiatives at our production plants. In the Water Pipe & Products segment, service, procurement and operational initiatives have reduced year to date operating costs by more than $1.5 million in DIP and $1.5 million in large diameter concrete and steel pipe, each asAs of MayAugust 31, 2016. In the Drainage Pipe & Products segment,2016, we have recognized year to date savings of more than $5.0$10 million, as of May 31, 2016 across three major plants due to purchasing initiatives.$9 million and $1 million from procurement, operational and commercial initiatives, respectively. We continue to roll out cost and productivity improvements at new sites and have identified new cost reduction opportunities in resale items, transportation, logistics and energy. Additionally, we have increased our margins and cash flow through operational improvement of acquired businesses. Our acquisition of Sherman-Dixie and U.S. Pipe’s acquisition of Griffin Pipe, specifically, provided consolidation opportunities with our existing plant network and improved the respective cost positions by reducing personnel and rationalizing older facilities.
Proven Ability to Identify, Close and Improve the Performance of Strategic Acquisitions. Over the last three years, we have acquired twothree businesses in our Drainage Pipe & Products segment and four businesses in our Water Pipe & Products segment (including three acquisitions by U.S. Pipe). Our acquisition strategy has been focusedfocuses on three main pillars: reinforce our position in existing markets, expand our product offeringtargets that meet a stringent set of criteria: leading market positions with attractive margins, high growth geographies, potential for synergies and expand our geographic footprint.consolidation, new products and a focus on people development. Acquisitions enable us to improve our product mix and expand our geographic scope, helping us to win business from new customers, cross-sell additional products to existing customers and optimize pricing through the enhanced value created by our differentiated product offering. We believe that our success in acquiring
businesses has been the result of our highly disciplined acquisition strategy, continuous monitoring of potential targets in an opportunity-rich landscape and focus on culture and people, among other things. We have effectively sourced and closed both smaller strategic transactions, and larger transformative deals. In both instances, we have successfully achieved meaningful cost and revenue synergies through the implementation of best practices and operational improvement initiatives in the acquired businesses.
In the instanceconnection with our acquisitions of Cretex, Sherman-Dixie and U.S. Pipe, and U.S. Pipe’s acquisition of Griffin Pipe and Custom Fab, we have realized in excess of $40$45 million of synergies through cost savings.
Experienced Management Team with Proven Ability to Grow Businesses and IntegrateAcquisitions. Our management team, led by Jeff Bradley, our Chief Executive Officer, has a proven track record of increasing shareholder value and generating profitable growth, attractive margins and cash flow. Mr. Bradley and other key executives, including Matt Brown, the Chief Financial Officer, have relevant history managing public companies, as well as extensive experience in the manufacturing industry. Our management team has proven their ability to execute on our acquisition strategy, leading us in growth from $816.2 million ofthrough three substantive acquisitions that almost doubled our 2015 historical net sales by us and our Predecessor on a combined basis (excluding net sales from Cretex) to $1,733.4 million in 2015on a pro forma net sales through three substantial acquisitions.basis. Further, Mr. Bradley and his team are continuing to execute a comprehensive program to drive commercial, operational and procurement excellence, as well as managing working capital to increase free cash flow.
Our Business Strategy
Our goal is to be our customers’ preferred provider of drainage pipe, water transmission pipe and related products. We intend to drive profitable growth in excess of the growth rates of the end markets in which we operate through the following key strategies:
Capitalize on Favorable, Multi-pronged Industry Growth Dynamics. The multi-pronged cyclical recovery in our construction-related end markets is well underway. We expect to benefit from increased demand generated by growth in both residential and non-residential construction activity. Further, there is a significant need to improve North America’s aging water and highway infrastructure. Operationally, we believe we are well positioned in the water transmission and distribution industry to capitalize on the increased funding allocated to water infrastructure improvement. The FAST Act will be a key underlying driver for our business as it dedicates more than 70% of its total budget to highway spending, supporting our key infrastructure end market. Secular industry trends, including the continued shift in product preference to rigid and zinc-coated pipe, environmental regulations in support of on-site water management and continued urbanization, support further incremental growth. Our reputation, extensive product offering and coast-to-coast distribution network provide us with competitive advantages that we expect will fuel growth in excess of that offered by already attractive market dynamics underlying our businesses.
Increase Market Share by Leveraging Our Scale, “the First Mile to the Last Mile” Suite of Products and Go-to-Market Strategy. Our scale enables us to be among the industry’s lowest cost producers, while our strategically located manufacturing facilities and broad distribution network allowus to meet the particular needs of our customers. Our existing swing capacity enables us to meet customer demand and well positions us to win small and large projects. Moreover, our large and scalable installed asset base will allow us to respond swiftly to growing demand without having to increase capacity.
Our “First Mile to the Last Mile” product portfolio enables us to be a complete solutions provider and to serve as a one-stop shop for water-related pipe and products, increasing our customers’ overall
spend on our products. Our ability to offer both pipe and precast products helps us better serve our infrastructure-related markets and differentiates us from our competitors.
Our go-to-market strategy is based on three main pillars. First, we incentivize our highly specialized technical salesforce to focus on profitable growth while offering our products and value-added services. Second, we target our key customers with a robust cross-selling sales organization,
marketing the benefits of ordering from one supplier. Lastly, we focus on the implementation of systematic pricing strategies across all of our product categories.
Leverage Our Commitment to Product Innovation and Technical Expertise to Optimize Product Mix and Capitalize on Market Opportunities. We continuously explore new applications for our existing product portfolio and develop new products and solutions that allow us to stay at the forefront of the needs of the drainage and water pipe and products markets. Our technical salesforce also proactively reaches out to our customers on a regular basis to ensure that our customers are satisfied and our products adhere to project specifications. We have a long history of developing and seeking out innovative products to bring to market across both water-related segments, which include the recent introductions of Oystercrete, duct bank and metallic zinc coating. We will continue our innovation efforts, optimizing our portfolio through research and development and strategic acquisitions to expand our positions in attractive products and markets. Along with these initiatives, our specialized technical salesforce will continue to promote and support our existing specialty products to drive differentiation and growth.
Enhance Margins, Free Cash Flow and Returns Through Operational and Commercial Excellence. We have successfully launched multiple operational initiatives focused on increasing plant efficiency and productivity. We expect to continue growing our margins through ongoing operational, commercial and cultural initiatives. We are working to leverage our information technology and financial systems to lower costs and implement systematic pricing across our business. We will continue to manage working capital and seek scale-driven procurement efficiency improvements through centralized purchasing and fixed overhead control and reduction. We intend to prioritize opportunities that generate attractive returns on invested capital. Further, our management team has emphasized a strong pay-for-performance culture that cultivates, challenges and compensates employees based on profitability and cash flow generation.
Accelerate Profitable Growth Through Strategic Acquisitions. We believe that the relative fragmentation of some of our sub-markets creates an environment in which we can continue to acquire companies at attractive valuations to increase our scale, product breadth and geographic diversity. Over the past three years, we have acquired sixseven businesses—both tuck-in and transformative in nature—within the water drainage and transmission industry (including three acquisitions by U.S. Pipe). We continuously monitor potential targets to develop and maintain a diversified and actionable acquisition pipeline. Additional acquisitions would enable us to add adjacent products to our portfolio that could help us further penetrate our existing markets and expand our geographic footprint. By integrating these businesses and implementing our culture and operational best practices, we believe we can achieve significant further growth. We are focused on driving synergies, including those achievable as a result of our recent acquisitions, to reduce costs and increase our margins. We are in the process of executing a plan associated with our acquisitions of Cretex, Sherman-Dixie and U.S. Pipe. We believe that we can achieve significant synergies associated with these acquisitions. We expect cost savings synergies to come from procurement, eliminating redundant selling, general and administrative functions, and optimizing our plant network through consolidations to achieve operational efficiencies and freight cost reductions. In addition, we believe the U.S. Pipe Acquisition creates opportunity to increase market share in large diameter DIP by leveraging our geographic scope, cross-selling capabilities and existing contractor relationships.
Our Industry
In the United States and Eastern Canada, we are a market leader in each of the following core product categories: concrete drainage pipe and precast, ductile iron pipe and concrete pressure pipe.
Core Products
Drainage Pipe & Products
Drainage pipe has residential, non-residential and infrastructure applications. It is primarily used for storm water applications such as storm drains for roads and highways and for residential and non-residential site developments. In addition, drainage pipe and concrete precast structures are used for sanitary sewers, low-pressure sewer force mains, tunneled systems, treatment plant piping and utility tunnels. Freedonia estimates U.S. total market demand for sewer and drainage pipe and wastewater concrete precast structures to grow at a compound annual growth rate, or CAGR, of 7.4% from $7.2 billion in 2013 to $10.4 billion in 2018. We serve these markets primarily through our diverse portfolio of concrete drainage pipe, U.S. demand for which is expected to increase at a CAGR of 5.9% from 2013 to 2018, according to Freedonia estimates. Further, we serve the aforementioned markets with various precast structures, the demand for which Freedonia estimates to grow at a CAGR of 6.4% from 2013 to 2018. Rebounding levels of construction activity, replacement of aging stormwater and highway infrastructure and committed government funding programs are expected to support this growth. We typically sell our drainage pipe and precast concrete products to contractors that perform construction work for governments, residential and non-residential building owners and developers in markets across the United States and Eastern Canada.
Water Pipe & Products
Water pipe and products are primarily used for potable and wastewater transmission. Water transmission pipe demand comes from water supply construction, especially within municipalities and residential construction. Among these applications, potable water is expected to maintain the largest portion of U.S. demand, with projected growth at a CAGR of 8.2% from $5.3 billion in 2013 to $7.9 billion in 2018, according to Freedonia estimates. We serve these markets primarily through our diverse offering of DIP, prestressed concrete cylinder pipe and bar-wrapped pipe, as well as fittings and fabricated products.
Ductile iron inhibits corrosion, retains strength and prevents fractures better than cast iron and most other materials. Ductile iron also improves water flow compared to other materials, particularly plastic. U.S. market volume for DIP shipments (less than 24” diameter pipe) is expected to increase at a CAGR of 6.1% from 2013 to 2018, based on the key drivers of housing starts and waterline infrastructure spend, according to Freedonia estimates.
In larger diameters (greater than 24” diameter pipe), steel and concrete pipe are sturdier and more cost effective. Plastic pipe structural integrity is more dependent on firm soil bedding than concrete or steel, which can make engineers reluctant to use plastic in large diameters due to the increased installation cost. U.S. market demand for large diameter steel and concrete pipe is expected to increase at a CAGR of 4.6% from 2013 to 2018, based on increasing government spending on water infrastructure, according to Freedonia estimates.
Bricks
Our Bricks operations primarily serve the residential markets. Recovery in single family housing construction represents the largest driver of overall brick demand growth. The estimated demand for bricks in the United States and Eastern Canada is expected to grow at a CAGR of 11% from $1.3 billion in 2013 to $2.1 billion in 2018, according to Freedonia estimates. We are well-positioned to benefit from expected increases in residential housing starts and attractive market dynamics due to our competitive positioning and broad geographic footprint.
Core End Markets
North American water infrastructure, aging and strained by a growing population, requires substantial, prolonged capital investment totaling nearly $1 trillion across the U.S. according to the AWWA. According to the EPA, the U.S. potable water and waste and storm water infrastructures require a cumulative $682 billion investment in repairs and expansions over the next 20 years, with pipe representing a substantial proportion of the total capital need. In Canada, per the Canadian Infrastructure Report Card, or CIRC, the replacement value for water infrastructure in “fair” to “very poor” condition areas totals $173.0 billion (CAD), where “fair” assets are defined as those with indicated deterioration and deficiencies and require attention and “very poor” assets are defined as near or beyond expected service life and unfit for sustained service, indicating that infrastructure reinvestment lags behind targeted levels.
We serve a range of infrastructure-related end markets. Based on the source of funding, we classify these construction markets into infrastructure, residential and non-residential.
Infrastructure
We estimate that 2015 sales to the infrastructure market represented 31%47% and 45% of our PredecessorandSuccessor net sales, respectively, and 34% of our pro forma net sales in fiscal year 2015.sales. Our main sales drivers in this market include the construction of streets, highways and storm and sanitary sewers. WeThough based on U.S. Census data and information from the CBO annual federal spending on transportation and water infrastructure hit a 30-year low on a per capita basis in 2014, we expect to benefit from several drivers in this market, as U.S. and Canadian federal funding dynamics and public infrastructure requirements support continued growth. At the U.S. federal level, the FAST Act demonstrates the U.S. government’s commitment to improving the country’s transportation infrastructure. More than 70% of the law’s budget is dedicated to highway spending, providing multi-year visibility on federal highway funding. As a U.S.-based company, we are well-positioned to benefit from this new spending, as the legislation steps up federal “Buy America” requirements from 60% in 2015 to 70% in 2020. In its budget for 2016, the Canadian federal government proposed $11.9 billion (CAD) in infrastructure spending over the next five years, with $2.0 billion (CAD) in a clean water and wastewater fund and $2.2 billion (CAD) towards water, wastewater and waste management infrastructure.
Residential Construction
We estimate that 2015 sales to the residential construction market represented 51%36% and 39% of our PredecessorandSuccessor net sales, respectively, and 40% of our pro forma net sales in 2015.sales. These revenues were largely driven by new U.S. residential construction, which is recovering from historic lows reached during the financial crisis. Though new housing starts grew at a CAGR of 14% from 2010 to 2015, according to the U.S. Census Bureau, current levels remain substantially below long-term averages, as outlined in the graph below.
U.S. Residential Housing Starts
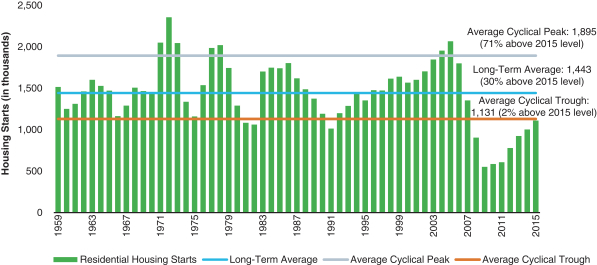
Source: U.S. Census Bureau.
The new residential construction market is expected to continue to grow at a robust pace over the next few years, with Fannie Mae and CMHC forecasting a CAGR of 8% from 2015 to 2017 across the United States and Canada.
Non-residential Construction
We estimate that 2015 sales to the non-residential construction market represented 18%17% and 16% of our PredecessorandSuccessor net sales, respectively, and 26% of our pro forma net sales in 2015.sales. These revenues were driven largely by new U.S. non-residential construction, and we believe we will continue to benefit from this market’s ongoing recovery from historical lows reached during the financial crisis. Though new non-residential construction starts grew, according to Dodge, at a CAGR of 7% from 2010 to 2015, current levels remain substantially below long-term average levels, as outlined in the graph below.
U.S. Non-Residential Starts
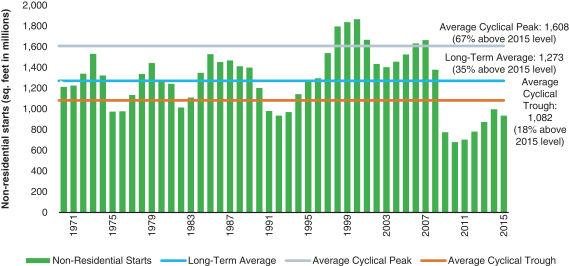
Source: Dodge and CMD Group
The non-residential construction market is expected to continue to grow at a CAGR of 8% from 2015 to 2017 across the United States and Canada, according to data from Dodge and CMD Group.
Recent Developments
Preliminary Financial Results for the Three Months Ending September 30, 2016
The following preliminary financial results for the three months ending September 30, 2016 do not include the results of J&G and Precast Concepts, which the Company entered into definitive agreements to acquire in September 2016, but which acquisitions have not closed; includes only partial results of Bio Clean, which the Company acquired on August 4, 2016; and includes results for the Company’s bricks business, which the Company will distribute to an affiliate prior to the consummation of this offering. See “—Our History—Recent Transactions.”
We estimate that for the three months ended September 30, 2016, we will generate net sales of between $464.0 million and $484.0 million, income from operations, including our corporate segment, of between $45.0 million and $50.0 million and Adjusted EBITDA, including our corporate segment, of between $80.0 million and $85.0 million. Results for the quarter ending September 30, 2016 were negatively affected by significant adverse weather, which caused certain deliveries to be delayed, and other project delays.
In our Drainage Pipe & Products segment, we estimate that for the three months ended September 30, 2016, we will generate net sales of between $211.0 million and $219.0 million, income from operations of between $36.0 million and $38.0 million and Adjusted EBITDA of between $46.0 million and $48.0 million.
In our Water Pipe & Products segment, we estimate that for the three months ended September 30, 2016, we will generate net sales of between $215.0 million and $223.0 million, income from operations of between $23.0 million and $25.0 million and Adjusted EBITDA of between $41.0 million and $43.0 million.
In our Bricks segment, we estimate that for the three months ended September 30, 2016, we will generate net sales of between $38.0 million and $42.0 million, income from operations of between $2.5 million and $3.5 million and Adjusted EBITDA of between $5.0 million and $6.0 million.
In addition to net sales, we have also presented an estimated range for Adjusted EBITDA for the periods referenced above. Adjusted EBITDA is a non-GAAP financial measure and is being presented as a supplemental measure of financial performance that is not required by, or presented in accordance with, GAAP. We calculate Adjusted EBITDA as net income (loss) before interest expense, income tax benefit (expense), depreciation and amortization, and further adjusted for impairment and restructuring charges, gains or losses on the sale of property, plant and equipment, acquisition-related costs and costs associated with disposed sites.
We believe providing an estimated range of Adjusted EBITDA is important to an investor’s understanding of our performance for the reasons described in “Non-GAAP Financial Information,” notwithstanding that we are not yet able to provide any estimate of our net income, the most directly comparable GAAP financial measure, for the relevant periods.
We are not able to provide a reconciliation of Adjusted EBITDA to net income because we cannot quantify certain materially significant amounts that are necessary to calculate net income without unreasonable efforts. Specifically, we are unable to estimate our income tax (expense) benefit for the period ended September 30, 2016 as we have not completed an estimate thereof because we have not completed our evaluation of the impact of recent transactions on income tax (expense) benefit for the period. We expect the variability of our income tax (expense) benefit could have a potentially significant impact on our future GAAP financial results.
We have presented ranges for net sales, income from operations and Adjusted EBITDA above, instead of specific numbers, as our results of operations for such period are not yet available. Our expected results above reflect our current estimates for such period based on information available as of the date of this prospectus, and management prepared such estimated financial information in good faith based upon our internal reporting. However, although we have not identified any unusual or unique events or trends that occurred during the period which might materially affect these estimates, our estimates of results are inherently uncertain and subject to change, and we undertake no obligation to update this information. These estimates are forward-looking statements. Actual results remain subject to the completion of management’s final review, other quarterly financial closing procedures and the completion of the preparation of our interim consolidated financial statements. Our actual consolidated financial statements and related notes as of and for the period ending September 30, 2016 are not expected to be filed with the SEC until after this offering is completed. During the course of the preparation of these actual consolidated financial statements and related notes, additional items that may require adjustments to the preliminary estimated financial results presented above could be identified, and such adjustments could be material. See “Risk Factors—Risks Relating to Our Business and Industry” and “Forward-Looking Statements.”
This preliminary financial data has been prepared by and are the responsibility of our management. Our independent registered public accounting firm, Ernst & Young LLP, has not audited, reviewed or performed any procedures with respect to the preliminary financial data. Accordingly, Ernst & Young LLP does not express an opinion or any other form of assurance with respect thereto.
Our History
The Acquisition
On March 13, 2015, through an indirect wholly owned subsidiary, Lone Star Fund IX (U.S.), L.P. acquired the building products business of HeidelbergCement AG, or HeidelbergCement in the United States and Eastern Canada, or the Acquisition, along with HeidelbergCement’s building products business in the United Kingdom for aggregate consideration of $1.33 billion. The aggregate purchase price is subject to a potential earn outearn-out capped at $100.0 million, which is subject to a dispute with HeidelbergCement as discussed in greater detail in the section entitled “Business—Legal Proceedings.” Following the Acquisition, the acquired businesses were operated by LSF9 Concrete Holdings Ltd, or Concrete Holdings, an indirect wholly owned subsidiary of Lone Star Fund IX (U.S.), L.P.
Recent Transactions
A number of strategic transactions have been completed since the Acquisition. These transactions include:
| • | Cretex Acquisition—On October 1, 2015, the Company acquired Cretex, a manufacturer of concrete pipe, box culverts, concrete precast drainage structures, pre-stressed bridge components and ancillary precast products in the Upper Midwestern United States, for aggregate consideration of $245.1 million, or the Cretex Acquisition. Cretex operates as part of our Drainage Pipe & Products segment. |
| • | Sherman-Dixie Acquisition—On January 29, 2016, the Company acquired Sherman-Dixie, a manufacturer of concrete pipe, box culverts, precast concrete utility products, storm and sanitary civil engineered systems and specialty engineered retainage systems in Kentucky, Tennessee, Alabama and Indiana, for aggregate consideration of $66.8 million, or the Sherman-Dixie Acquisition. Sherman-Dixie operates as part of our Drainage Pipe & Products segment. |
| • | Forterra UK IPO—On April 26, 2016, Concrete Holdings completed an initial public offering of the ordinary shares of Forterra, plc, the operator of HeidelbergCement’s former building products business in the United Kingdom, or Forterra UK. Though we and Forterra UK are both controlled by Lone Star Fund IX (U.S.), L.P., we have no relation to or affiliation with Forterra UK other than certain contractual arrangements regarding third-party IT services and the use of the “Forterra” name. |
| • | U.S. Pipe Acquisition—On April 15, 2016, the Company acquired U.S. Pipe, which manufactures ductile iron pipe products for water distribution and water management applications and distributes its products throughout the United States, for aggregate consideration of $775.1 million, subject to customary working capital adjustments, or the U.S. Pipe Acquisition. U.S. Pipe operates as part of our Water Pipe & Products segment. |
| • | Bio Clean Acquisition—On August 4, 2016, the Company acquired Bio Clean, which designs and sells storm water management systems that meet the requirements of local regulatory bodies regulating storm water quality, for aggregate consideration of $30.0 million, or the Bio Clean Acquisition. Bio Clean also owns or has applied for more than 20 patents for a variety of technologies relating to drainage and storm water management. Bio Clean operates as part of our Drainage Pipe & Products segment. |
| • | Bricks Disposition—On August 23, 2016, LSF9 Concrete Mid-Holdings Ltd, or Mid Holdings, which is wholly owned by Concrete Holdings, entered into an agreement with an unaffiliated third party to contribute our bricks business to a newly formed joint venture with the unaffiliated |
third party, or the Bricks Joint Venture. In exchange for the contribution of our bricks business, Mid Holdings will receive a 50% interest in the Bricks Joint Venture. In connection with this agreement, prior to the consummation of this offering, we will distribute our bricks business to Mid Holdings or its affiliate, or the Bricks Disposition. Though both our business and the 50% equity interest in the Bricks Joint Venture will be held by Mid Holdings or its affiliate, following the Bricks Disposition, we will no longer have any profit or other interest in our then-former bricks business or in the Bricks Joint Venture and we will have no relation to or business affiliation with our then-former bricks business or the Bricks Joint Venture other than contractual arrangements regarding certain limited transition services, the short-term loan described under “Certain Relationships and Related Party Transactions—Loan to Bricks Business” and the temporary use of the “Forterra” name. |
| • | J&G Acquisition—On September 6, 2016, we entered into a definitive agreement to acquire J&G Concrete Operations, LLC, or J&G, a manufacturer of concrete pipe, box culverts and special fittings in North Texas, for aggregate consideration of $32.0 million, subject to customary working capital adjustments, or the J&G Acquisition. The J&G Acquisition is subject to customary closing conditions and is expected to close in the fourth quarter of 2016. J&G will operate as part of our Drainage Pipe & Products segment following completion of the acquisition. |
| • | Precast Concepts Acquisition—On September 7, 2016, we entered into a definitive agreement to acquire the business of Precast Concepts, LLC, or Precast Concepts, a manufacturer of concrete pipe, box culverts, storm detention systems and other precast concrete and related products in Colorado, for aggregate consideration of $97.1 million, subject to customary working capital adjustments, or the Precast Concepts Acquisition. The Precast Concepts Acquisition is subject to regulatory approval and other customary closing conditions and is expected to close in the fourth quarter of 2016. Precast Concepts will operate as part of our Drainage Pipe & Products segment following completion of the acquisition. |
Each of the Company’s recent acquisition and disposition transactions is discussed in greater detail in the section entitled “Business—Our Recent Strategic Transactions.”
Reorganization
Forterra, Inc., the registrant whose name appears on the cover page of this prospectus, does not currently have any operations and was formed in 2016 for the purpose of an internal reorganization transaction. Prior to or concurrent with the consummation of this offering, Concrete Holdings will transfer its building products operations in the United States and Eastern Canada, the business which
is described in this prospectus and the business for which historical and pro forma financial information is included elsewhere in this prospectus, in an internal reorganization transaction, or the Reorganization, to Forterra, Inc. Following the Reorganization, Forterra, Inc. will be a wholly owned subsidiary of LSF9 Concrete Mid-Holdings Ltd, or MidForterra US Holdings, LLC, which is indirectly wholly owned by Concrete Holdings. Each of Concrete Holdings, MidForterra US Holdings, LLC and Forterra, Inc. are affiliates of Lone Star Fund IX (U.S.), L.P. Shares of common stock of Forterra, Inc. are being offered by the prospectus.
Our Sponsor
Lone Star Fund IX (U.S.), L.P., which we refer to in this prospectus, along with its affiliates and associates (including Concrete Holdings, and Mid Holdings and Forterra US Holdings, LLC, but excluding us and other companies that it owns as a result of its investment activity), as Lone Star or our sponsor, is part of a leading private equity firm that, since the establishment of its first fund in 1995, has organized 16 private equity funds with aggregate capital commitments totaling over $65.0 billion. The funds are structured as closed-end, private-equity limited partnerships, the limited partners of which
include corporate and public pension funds, sovereign wealth funds, university endowments, foundations, funds of funds and high net worth individuals. Immediately prior to this offering, Lone Star owned all of our outstanding common stock, and will own approximately %71.1% of our common stock immediately following consummation of this offering (or %67.5% if the underwriters exercise in full their option to purchase additional shares). Therefore, we expect towill be a “controlled company” under the applicable stock exchange corporate governance standards of the NASDAQ Global Select Market, or NASDAQ, and will take advantage of the related corporate governance exceptions for controlled companies.
Risks Affecting Our Business
Our business is subject to numerous risks and uncertainties, including, but not limited to, those arising from:
We are also subject to numerous risks relating to:
You should carefully consider all of the information set forth in this prospectus and, in particular, the information in the section entitled “Risk Factors” beginning on page 2223 of this prospectus prior to making an investment in our common stock. These risks could, among other things, prevent us from successfully executing our strategies and could have a material adverse effect on our business, financial condition and results of operations.
Principal Executive Offices
Our principal executive offices are located at 511 East John Carpenter Freeway, 6th Floor, Irving, TX 75062 and our telephone number is (469) 458-7973. Our website address is forterrabp.com. Information contained on our website or linked therein or otherwise connected thereto does not constitute part of nor is it incorporated by reference into this prospectus or the registration statement of which this prospectus forms a part. Forterra, U.S. Pipe and other trademarks or service marks of ours appearing in this prospectus are our property. Other trademarks and service marks appearing in this prospectus are the property of their respective holders.
THE OFFERING
Common stock offered by us | 18,420,000 shares (or 19,801,500 shares if the underwriters exercise in full their option to purchase additional shares) | |
Common stock offered by the selling stockholder | 1,381,500 shares if the underwriters exercise in full their option to purchase additional shares | |
Common stock to be outstanding immediately after this offering | 63,789,474 shares (or 65,170,974 shares if the underwriters exercise in full their option to purchase additional shares) | |
Use of proceeds | We estimate our proceeds from this offering will be approximately | |
We will not receive any of the proceeds from the sale of shares of common stock by the selling stockholder. See “Use of Proceeds,” “Principal and Selling Stockholders” and “Underwriting.” | ||
Dividend policy | We have no present intention to pay cash dividends on our common stock. Any determination to pay dividends to holders of our common stock will be at the discretion of our board of directors and will depend upon many factors, including our financial condition, results of operations, projections, liquidity, earnings, legal requirements, restrictions in our debt agreements and other factors that our board of directors deems relevant. See “Dividend Policy.” | |
Risk factors | You should carefully read and consider the information set forth in the section entitled “Risk Factors” beginning on page | |
Conflicts of interest | In connection with the repayment of the Junior Term Loan with the net proceeds from this offering, Credit Suisse Securities (USA) LLC, Citigroup Global Markets Inc. and Deutsche Bank Securities Inc., each an underwriter in this offering, or their affiliates, are expected to receive, in the aggregate, payments representing less than 5%, of the net proceeds of this offering. See “Use of Proceeds” and “Underwriting—Conflicts of Interest.” | |
NASDAQ symbol | “ | |
The number of shares of our common stock to be outstanding immediately after this offering as set forth above is based on the number of shares outstanding as of , 2016 and excludes 5,000,000 shares reserved for issuance under our equity incentive plan (under which no equity awards have been granted as of such date). We intend to grant equity awards representing an aggregate of approximately 498,490 shares of common stock to our executive officers and certain director nominees under our equity incentive plan at the time of the pricing of this offering.
Unless otherwise indicated, this prospectus:
SUMMARY HISTORICAL AND UNAUDITED PRO FORMA CONDENSED COMBINED FINANCIAL AND OTHER INFORMATION
The following tables set forth, for the periods and dates indicated certain summary historical and unaudited pro forma condensed combined financial information. The accompanying historical audited financial statements are presented for the “Predecessor,” which are the combined financial statements of HeidelbergCement’s building products business in the United States and Eastern Canada for the period preceding the Acquisition, and the “Successor,” which are the combined audited and unaudited financial statements of the Company and subsidiaries for the period following the Acquisition. The Predecessor’s combined statements of operations data for the years ended December 31, 2013 and 2014 and the period from January 1, 2015 through March 13, 2015 and the Predecessor’s combined balance sheet data as of December 31, 2014 have been derived from the audited combined financial statements of HeidelbergCement’s building products business in the United States and Eastern Canada, which are included elsewhere in this prospectus. The Successor’s combined statements of operations data for the period from March 14, 2015 through December 31, 2015 and balance sheet data as of December 31, 2015 have been derived from our audited financial statements, which are included elsewhere in this prospectus. The Successor’s combined balance sheet data as of March 31,June 30, 2016 and condensed combined statements of operations data for the period from March 14, 2015 through March 31,June 30, 2015 and the threesix months ended March 31,June 30, 2016 are derived from our unaudited condensed combined financial statements, which are included elsewhere in this prospectus.
The Predecessor’s financial statements may not necessarily be indicative of the cost structure or results of operations that would have existed if HeidelbergCement’s building products business in the United States and Eastern Canada operated as a stand-alone, independent business. Accordingly, these historical results should not be relied upon as an indicator of our future performance. The Acquisition was accounted for as a business combination, which resulted in a new basis of accounting. The Predecessor’s and the Successor’s historical financial statements are not comparable as a result of applying a new basis of accounting. See the notes to the audited financial statements for additional information regarding the accounting treatment of the Acquisition. In the opinion of management, the unaudited interim financial statements include all adjustments, consisting of normal recurring adjustments, necessary for a fair presentation of our financial position and operating results for these periods and as of such date. Results from interim periods are not necessarily indicative of results that may be expected for the entire year and historical results are not indicative of the results to be expected in the future. The summary financial and operating data presented below represent portions of our financial statements and are not complete.
The unaudited pro forma condensed combined financial information set forth below presents certain unaudited pro forma condensed combined statements of operations data for the threesix months ended March 31,June 30, 2016 and 2015 and for the year ended December 31, 2015, and certain unaudited pro forma condensed combined balance sheet data as of March 31,June 30, 2016. The unaudited pro forma condensed combined financial information has been derived by aggregating our audited and unaudited historical combined financial statements, and the historical financial statements of U.S. Pipe, each included elsewhere in this prospectus, and making certain pro forma adjustments to such aggregated financial information to give effect to the transactions discussed in greater detail in the section entitled “Unaudited Pro Forma Condensed Combined Financial Information.”
The information presented below should be read in conjunction with the sections entitled “Capitalization,” “Selected Historical Financial Data,” “Unaudited Pro Forma Condensed Combined Financial Information,” “Management’s Discussion and Analysis of Financial Condition and Results of Operations” and our audited and unaudited combined financial statements and related notes included elsewhere in this prospectus.
| (in thousands) | (in thousands) | |||||||||||||||||||||||||||||||||||||||||||||||||||||||||||||||||||||||||||||
| Pro forma Three months ended March 31, 2016 | Pro forma Three months ended March 31, 2015 | Pro forma Year ended December 31, 2015 | Successor | Predecessor | Successor | Predecessor | ||||||||||||||||||||||||||||||||||||||||||||||||||||||||||||||||||||||||
(in thousands) | Three months ended March 31, 2016 | For the period from March 14, 2015 to March 31, 2015 | For the period from March 14, 2015 to December 31, 2015 | For the period from January 1, 2015 to March 13, 2015 | Year ended December 31, 2014 | Year ended December 31, 2013 | Pro forma Six months ended June 30, 2016 | Pro forma Six months ended June 30, 2015 | Pro forma Year ended December 31, 2015 | Six months ended June 30, 2016 | For the period from March 14, 2015 to June 30, 2015 | For the period from March 14, 2015 to December 31, 2015 | For the period from January 1, 2015 to March 13, 2015 | Year ended December 31, 2014 | Year ended December 31, 2013 | |||||||||||||||||||||||||||||||||||||||||||||||||||||||||||||||
Statement of Operations Data: | ||||||||||||||||||||||||||||||||||||||||||||||||||||||||||||||||||||||||||||||
Statement of Operations Data | ||||||||||||||||||||||||||||||||||||||||||||||||||||||||||||||||||||||||||||||
Net sales | $ | 362,083 | $ | 340,654 | $ | 1,733,373 | $ | 217,334 | $ | 38,014 | $ | 722,664 | $ | 132,620 | $ | 736,963 | $ | 697,948 | $ | 783,112 | $ | 764,172 | $ | 1,663,363 | $ | 640,142 | $ | 251,315 | $ | 722,664 | $ | 132,620 | $ | 736,963 | $ | 697,948 | ||||||||||||||||||||||||||||||||||||||||||
Cost of goods sold | (295,772 | ) | (308,288 | ) | (1,474,743 | ) | (179,403 | ) | (35,324 | ) | (626,498 | ) | (117,831 | ) | (631,454 | ) | (611,660 | ) | 628,627 | 654,856 | 1,396,432 | 509,370 | 228,405 | 626,498 | 117,831 | 631,454 | 611,660 | |||||||||||||||||||||||||||||||||||||||||||||||||||
|
|
|
|
|
|
|
|
|
|
|
|
|
|
|
|
|
|
| ||||||||||||||||||||||||||||||||||||||||||||||||||||||||||||
Gross profit | $ | 66,311 | $ | 32,366 | $ | 258,630 | $ | 37,931 | $ | 2,690 | $ | 96,166 | $ | 14,789 | $ | 105,509 | $ | 86,288 | $ | 154,485 | $ | 109,316 | $ | 266,931 | $ | 130,772 | $ | 22,910 | $ | 96,166 | $ | 14,789 | $ | 105,509 | $ | 86,288 | ||||||||||||||||||||||||||||||||||||||||||
Selling, general and administrative expenses | (60,415 | ) | (69,102 | ) | (271,253 | ) | (37,945 | ) | (18,722 | ) | (134,971 | ) | (21,683 | ) | (102,107 | ) | (87,393 | ) | (118,809 | ) | (129,692 | ) | (275,020 | ) | (98,622 | ) | (47,716 | ) | (134,971 | ) | (21,683 | ) | (102,107 | ) | (87,393 | ) | ||||||||||||||||||||||||||||||||||||||||||
Impairment and restructuring charges | — | — | — | — | 8 | (1,185 | ) | (542 | ) | (4,219 | ) | (250,577 | ) | — | — | — | (23 | ) | (343 | ) | (1,185 | ) | (542 | ) | (4,219 | ) | (250,577 | ) | ||||||||||||||||||||||||||||||||||||||||||||||||||
Earnings from equity method investee | — | — | — | 1,303 | 115 | 8,429 | 67 | 4,451 | (216 | ) | — | — | — | 4,868 | 3,772 | 8,429 | 67 | 4,451 | (216 | ) | ||||||||||||||||||||||||||||||||||||||||||||||||||||||||||
Other operating income | 3,081 | 1,455 | 12,200 | 1,778 | 813 | 832 | 994 | 6,965 | 9,232 | 9,244 | 8,878 | 14,455 | 2,533 | 3,930 | 832 | 994 | 6,965 | 9,232 | ||||||||||||||||||||||||||||||||||||||||||||||||||||||||||||
Interest expense | (30,557 | ) | (30,562 | ) | (122,891 | ) | (17,290 | ) | (2,474 | ) | (45,953 | ) | (84 | ) | — | — | (30,413 | ) | (25,934 | ) | (53,305 | ) | (42,129 | ) | (15,551 | ) | (45,953 | ) | (84 | ) | — | — | ||||||||||||||||||||||||||||||||||||||||||||||
Other income (expense), net | 23 | (21 | ) | 981 | (81 | ) | — | (326 | ) | (39 | ) | (594 | ) | 947 | (1,003 | ) | (207 | ) | 1,205 | (1,179 | ) | (140 | ) | (326 | ) | (39 | ) | (594 | ) | 947 | ||||||||||||||||||||||||||||||||||||||||||||||||
Net income (loss) before taxes | (21,557 | ) | (65,864 | ) | (122,333 | ) | (14,304 | ) | (17,570 | ) | (77,008 | ) | (6,498 | ) | 10,005 | (241,719 | ) | |||||||||||||||||||||||||||||||||||||||||||||||||||||||||||||
Income (loss) from continuing operations before taxes | 13,504 | (37,639 | ) | (45,734 | ) | (3,780 | ) | (33,138 | ) | (77,008 | ) | (6,498 | ) | 10,005 | (241,719 | ) | ||||||||||||||||||||||||||||||||||||||||||||||||||||||||||||||
Income tax (expense) benefit | 8,142 | 1,269 | (17,518 | ) | 10,368 | — | (5,778 | ) | 742 | (2,417 | ) | (2,561 | ) | 25,983 | (13,300 | ) | (30,545 | ) | 36,533 | (1,579 | ) | (5,778 | ) | 742 | (2,417 | ) | (2,561 | ) | ||||||||||||||||||||||||||||||||||||||||||||||||||
Income (loss) from continuing operations | (13,415 | ) | (64,595 | ) | (139,851 | ) | (3,936 | ) | (17,570 | ) | (82,786 | ) | (5,756 | ) | 7,588 | (244,280 | ) | 39,487 | (50,939 | ) | (76,279 | ) | 32,753 | (34,717 | ) | (82,786 | ) | (5,756 | ) | 7,588 | (244,280 | ) | ||||||||||||||||||||||||||||||||||||||||||||||
Discontinued operations | — | — | — | — | — | — | — | 1,260 | (3,018 | ) | — | — | — | — | 1,260 | (3,018 | ) | |||||||||||||||||||||||||||||||||||||||||||||||||||||||||||||
Net income (loss) | $ | (13,415 | ) | $ | (64,595 | ) | $ | (139,851 | ) | $ | (3,936 | ) | $ | (17,570 | ) | $ | (82,786 | ) | $ | (5,756 | ) | $ | 8,848 | $ | (247,298 | ) | $ | 32,753 | $ | (34,717 | ) | $ | (82,786 | ) | $ | (5,756 | ) | $ | 8,848 | $ | (247,298 | ) | ||||||||||||||||||||||||||||||||||||
Statements of Cash Flow Data: | ||||||||||||||||||||||||||||||||||||||||||||||||||||||||||||||||||||||||||||||
Net cash provided by (used in): | ||||||||||||||||||||||||||||||||||||||||||||||||||||||||||||||||||||||||||||||
Operating activities | $ | (35,834 | ) | $ | 19,891 | $ | 121,417 | $ | (48,224 | ) | $ | 25,918 | $ | 31,686 | $ | (6,366 | ) | $ | (37 | ) | $ | 121,417 | $ | (48,224 | ) | $ | 25,918 | $ | 31,686 | |||||||||||||||||||||||||||||||||||||||||||||||||
Investing activities | (73,501 | ) | (640,428 | ) | (898,039 | ) | (2,762 | ) | (1,901 | ) | (55 | ) | (858,201 | ) | (643,160 | ) | (898,039 | ) | (2,762 | ) | (1,901 | ) | (55 | ) | ||||||||||||||||||||||||||||||||||||||||||||||||||||||
Financing activities | 77,809 | 660,410 | 822,580 | 60,907 | (23,990 | ) | (31,636 | ) | 861,868 | 665,629 | 822,580 | 60,907 | (23,990 | ) | (31,636 | ) | ||||||||||||||||||||||||||||||||||||||||||||||||||||||||||||||
Balance Sheet Data (as of period end): | ||||||||||||||||||||||||||||||||||||||||||||||||||||||||||||||||||||||||||||||
Cash and cash equivalents | $ | 66,060 | $ | 11,803 | $ | 43,590 | $ | 42 | $ | 5 | $ | 47,871 | $ | 41,817 | $ | 43,590 | $ | 42 | $ | 5 | ||||||||||||||||||||||||||||||||||||||||||||||||||||||||||
Property, plant & equipment, net | 664,740 | 418,499 | 388,924 | 414,073 | 423,826 | 437,231 | 648,621 | 388,924 | 414,073 | 423,826 | ||||||||||||||||||||||||||||||||||||||||||||||||||||||||||||||||||||
Total assets | 2,071,305 | 1,002,883 | 938,875 | �� | 846,168 | 864,842 | 1,916,234 | 2,034,110 | 938,875 | 846,168 | 864,842 | |||||||||||||||||||||||||||||||||||||||||||||||||||||||||||||||||||
Total debt | 1,477,224 | 724,315 | 705,829 | — | — | 1,098,455 | 1,450,711 | 705,829 | — | — | ||||||||||||||||||||||||||||||||||||||||||||||||||||||||||||||||||||
Total parent company net investment | — | — | — | 657,473 | 700,938 | — | — | — | 657,473 | 700,938 | ||||||||||||||||||||||||||||||||||||||||||||||||||||||||||||||||||||
Shareholder’s equity | 161,591 | 104,531 | 52,315 | — | — | 219,303 | 203,467 | 52,315 | — | — | ||||||||||||||||||||||||||||||||||||||||||||||||||||||||||||||||||||
Other financial data: | ||||||||||||||||||||||||||||||||||||||||||||||||||||||||||||||||||||||||||||||
Adjusted EBITDA(a) | $ | 47,808 | $ | 21,208 | $ | 202,470 | $ | 23,997 | $ | 8,947 | $ | 71,954 | $ | 3,278 | $ | 65,812 | $ | 48,193 | $ | 126,503 | $ | 91,763 | $ | 187,100 | $ | 105,790 | $ | 42,252 | $ | 60,198 | $ | 3,278 | $ | 65,812 | $ | 48,194 | ||||||||||||||||||||||||||||||||||||||||||
Adjusted EBITDA margin(a) | 13.2 | % | 6.2 | % | 11.7 | % | 11.0 | % | 23.5 | % | 10.0 | % | 2.5 | % | 8.9 | % | 6.9 | % | 16.2 | % | 12.0 | % | 11.2 | % | 16.5 | % | 16.8 | % | 8.3 | % | 2.5 | % | 8.9 | % | 6.9 | % | ||||||||||||||||||||||||||||||||||||||||||
| (a) | EBITDA, Adjusted EBITDA and Adjusted EBITDA margin are non-GAAP financial measures and have been presented in this prospectus as supplemental measures of financial performance that are not required by, or presented in accordance with, GAAP. We calculate EBITDA as income (loss) from continuing operations before interest expense, income tax (benefit) expense, depreciation and amortization. We calculate Adjusted EBITDA as EBITDA before impairment and restructuring charges, (gains)/losses on the sale of property, plant and equipment and certain other income and expenses, such as transaction costs, carve-out costs related to our separation from HeidelbergCement and costs associated with disposed sites. Adjusted EBITDA margin represents Adjusted EBITDA as a percentage of net sales. We present these measures for the same historical periods covered by our audited combined financial statements and the related notes, and the historical financial statements of U.S. Pipe and the historical financial statements of Cretex, as well as on a pro forma basis for the periods reflected in and the transactions accounted for in the section entitled “Unaudited Pro Forma Condensed Combined Financial Information.” See the section entitled “Non-GAAP Financial Information” for a description of why we believe these measures are important. |
The following table reconciles income (loss) from continuing operations (in the case of pro forma information) or to net income (loss) (in the case of historical information) to EBITDA and Adjusted EBITDA and Adjusted EBITDA margin to operating margin for the Company for the periods presented. See our audited and unaudited combined financial statements and the related notes included elsewhere in this prospectus.
| (in thousands) | (in thousands) | |||||||||||||||||||||||||||||||||||||||||||||||||||||||||||||||||||||||||||||
| Pro forma Three months ended March 31, 2016 | Pro forma Three months ended March 31, 2015 | Pro forma Year ended December 31, 2015 | Successor | Predecessor | Successor | Predecessor | ||||||||||||||||||||||||||||||||||||||||||||||||||||||||||||||||||||||||
(in thousands) | Three months ended March 31, 2016 | For the period from March 14, 2015 to March 31, 2015 | For the period from March 14, 2015 to December 31, 2015 | For the period from January 1, 2015 to March 13, 2015 | Year ended December 31, 2014 | Year ended December 31, 2013 | Pro forma Six months ended June 30, 2016 | Pro forma Six months ended June 30, 2015 | Pro forma Year ended December 31, 2015 | Six months ended June 30, 2016 | For the period from March 14, 2015 to June 30, 2015 | For the period from March 14, 2015 to December 31, 2015 | For the period from January 1, 2015 to March 13, 2015 | Year ended December 31, 2014 | Year ended December 31, 2013 | |||||||||||||||||||||||||||||||||||||||||||||||||||||||||||||||
Net Income (loss) | $ | (13,415 | ) | $ | (64,595 | ) | $ | (139,851 | ) | $ | (3,936 | ) | $ | (17,570 | ) | $ | (82,786 | ) | $ | (5,756 | ) | $ | 8,848 | $ | (247,298 | ) | ||||||||||||||||||||||||||||||||||||||||||||||||||||
Net income (loss) | $ | 32,753 | $ | (34,717 | ) | $ | (82,786 | ) | $ | (5,756 | ) | $ | 8,848 | $ | (247,298 | ) | ||||||||||||||||||||||||||||||||||||||||||||||||||||||||||||||
Less: Gain (loss) on discontinued operations, net of income tax | — | — | — | — | — | — | — | (1,260 | ) | 3,018 | — | — | — | — | 1,260 | (3,018 | ) | |||||||||||||||||||||||||||||||||||||||||||||||||||||||||||||
|
|
|
|
|
|
|
|
|
|
|
|
|
|
| ||||||||||||||||||||||||||||||||||||||||||||||||||||||||||||||||
Income (loss) from continuing operations | (13,415 | ) | (64,595 | ) | (139,851 | ) | (3,936 | ) | (17,570 | ) | (82,786 | ) | (5,756 | ) | 7,588 | (244,280 | ) | 39,487 | (50,939 | ) | (76,279 | ) | 32,753 | (34,717 | ) | (82,786 | ) | (5,756 | ) | 7,588 | (244,280 | ) | ||||||||||||||||||||||||||||||||||||||||||||||
Depreciation and amortization | 30,042 | 30,824 | 126,993 | 13,759 | 1,796 | 32,930 | 6,894 | 36,605 | 38,560 | 57,045 | 54,734 | 115,087 | 40,420 | 11,060 | 32,930 | 6,894 | 36,605 | 38,560 | ||||||||||||||||||||||||||||||||||||||||||||||||||||||||||||
Interest expense | 30,557 | 30,562 | 122,891 | 17,290 | 2,474 | 45,953 | 84 | — | — | 30,413 | 25,934 | 53,305 | 42,129 | 15,551 | 45,953 | 84 | — | — | ||||||||||||||||||||||||||||||||||||||||||||||||||||||||||||
Income tax (benefit) expense | (8,142 | ) | (1,269 | ) | 17,518 | (10,368 | ) | - | 5,778 | (742 | ) | 2,417 | 2,561 | (25,983 | ) | 13,300 | 30,545 | (36,533 | ) | 1,579 | 5,778 | (742 | ) | 2,417 | 2,561 | |||||||||||||||||||||||||||||||||||||||||||||||||||||
|
|
|
|
|
|
|
|
|
|
|
|
|
|
|
|
|
| |||||||||||||||||||||||||||||||||||||||||||||||||||||||||||||
EBITDA | 39,042 | (4,478 | ) | 127,551 | 16,745 | (13,300 | ) | 1,875 | 480 | 46,610 | (203,159 | ) | 100,962 | 43,029 | 122,658 | 78,769 | (6,527 | ) | 1,875 | 480 | 46,610 | (203,159 | ) | |||||||||||||||||||||||||||||||||||||||||||||||||||||||
Impairment and restructuring(1) | — | 534 | 1,727 | — | (8 | ) | 12,941 | 542 | 4,219 | 250,577 | 23 | 885 | 1,568 | 23 | 343 | 1,185 | 542 | 4,219 | 250,577 | |||||||||||||||||||||||||||||||||||||||||||||||||||||||||||
Gain) loss on sale of property, plant & equipment, net(2) | 369 | (106 | ) | 1,767 | (2 | ) | (3 | ) | 618 | (122 | ) | (2,329 | ) | (3,999 | ) | |||||||||||||||||||||||||||||||||||||||||||||||||||||||||||||||
(Gain) loss on sale of property plant & equipment, net(2) | 1,180 | (305 | ) | 1,774 | 1,217 | (201 | ) | 618 | (122 | ) | (2,329 | ) | (3,998 | ) | ||||||||||||||||||||||||||||||||||||||||||||||||||||||||||||||||
Transaction costs(3) | 6,702 | 19,635 | 45,242 | 5,562 | 17,530 | 25,590 | 2,079 | 17,674 | — | 12,147 | 29,094 | 44,241 | 12,323 | 25,263 | 25,590 | 2,079 | 17,674 | — | ||||||||||||||||||||||||||||||||||||||||||||||||||||||||||||
Inventory step-up impacting margin(4) | 1,031 | 4,688 | 29,969 | 1,031 | 4,688 | 29,969 | — | — | — | 12,293 | 18,394 | 23,240 | 12,514 | 22,780 | 29,969 | — | — | — | ||||||||||||||||||||||||||||||||||||||||||||||||||||||||||||
Costs associated with disposed sites(5) | 661 | 340 | 2,673 | 661 | 41 | 2,632 | 299 | (362 | ) | 4,774 | 853 | 893 | 2,673 | 853 | 594 | 2,632 | 299 | (362 | ) | 4,774 | ||||||||||||||||||||||||||||||||||||||||||||||||||||||||||
Other (gains) expenses(6) | 3 | 595 | (6,459 | ) | — | — | (1,671 | ) | — | — | — | |||||||||||||||||||||||||||||||||||||||||||||||||||||||||||||||||||
Amortization of deferred gain on Sale Leaseback(6) | (1,298 | ) | (1,298 | ) | (2,595 | ) | — | — | — | — | — | — | ||||||||||||||||||||||||||||||||||||||||||||||||||||||||||||||||||
Other (gains) expenses(7) | 343 | 1,071 | (6,459 | ) | 91 | — | (1,671 | ) | — | — | — | |||||||||||||||||||||||||||||||||||||||||||||||||||||||||||||||||||
|
|
|
|
|
|
|
|
|
|
|
|
|
|
|
|
|
| |||||||||||||||||||||||||||||||||||||||||||||||||||||||||||||
Adjusted EBITDA | $ | 47,808 | $ | 21,208 | $ | 202,470 | $ | 23,997 | $ | 8,947 | $ | 71,954 | $ | 3,278 | $ | 65,812 | $ | 48,193 | $ | 126,503 | $ | 91,763 | $ | 187,100 | $ | 105,790 | $ | 42,252 | $ | 60,198 | $ | 3,278 | $ | 65,812 | $ | 48,194 | ||||||||||||||||||||||||||||||||||||||||||
|
|
|
|
|
|
|
|
|
|
|
|
|
|
|
|
|
| |||||||||||||||||||||||||||||||||||||||||||||||||||||||||||||
Operating Margin | 2.5 | % | (10.4 | %) | (0.0 | %) | 1.4 | % | (39.7 | %) | (4.3 | %) | (4.8 | %) | 1.4 | % | (34.8 | %) | 5.7 | % | (1.5 | )% | 0.4 | % | 6.2 | % | (6.9 | )% | (4.3 | )% | (4.8 | )% | 1.4 | % | (34.8 | )% | ||||||||||||||||||||||||||||||||||||||||||
Adjusted EBITDA Margin | 13.2 | % | 6.2 | % | 11.7 | % | 11.0 | % | 23.5 | % | 10.0 | % | 2.5 | % | 8.9 | % | 6.9 | % | 16.2 | % | 12.0 | % | 11.2 | % | 16.5 | % | 16.8 | % | 8.3 | % | 2.5 | % | 8.9 | % | 6.9 | % | ||||||||||||||||||||||||||||||||||||||||||
| (1) | Adjusts for impairment of intangible assets and the following charges related to plant closures: (i) impairment charges in respect of abandoned fixed assets that had remaining book value and (ii) restructuring charges in respect of severance and lease and other contract termination costs. |
| (2) | Adjusts for the (gain) loss on sale of property, plant and equipment, primarily related to the disposition of two manufacturing facilities. |
| (3) | Adjusts for Successor and Predecessor legal, valuation, accounting, advisory and other costs related to the Acquisition and Predecessor expenses related to preparation for a public offering that was not ultimately consummated. |
| (4) | Adjusts for the effect of the purchase accounting step-up in the value of inventory to fair value recognized in cost of goods sold as a result of the Acquisition, the Cretex Acquisition and the Sherman-Dixie Acquisition. |
| (5) | Adjusts for the results of operations of our disposed roof tile business and other disposed sites for the periods presented, net of specific items for which adjustments are separately made elsewhere in the calculation of Adjusted EBITDA presented herein. |
| (6) | Adjusts for the amortization of gains on the properties sold as part of the Sale Leaseback that are required to be deferred and recognized on a straight line basis over the life of the related leases. |
| (7) | Adjusts for other (gains) losses, such as gain on insurance proceeds related to the destruction of property. |
Investing in our common stock involves a high degree of risk. You should carefully consider the risks and uncertainties described below, together with all of the other information in this prospectus, including the combined financial statements and the related notes appearing elsewhere in this prospectus, before making an investment decision. If any of the following risks actually occurs, our business, financial condition and results of operations could be materially and adversely affected and the trading price of our common stock could decline, causing you to lose all or part of your investment in our common stock.
Risks Relating to Our Business and Industry
Residential and non-residential construction activity is cyclical and influenced by many factors, and any reduction in the activity in one or both of these markets could have a material adverse effect on us.
Our results of operations can vary materially in response to market conditions and changes in the demand for our products. Historically, demand for our products has been closely tied to residential construction and non-residential construction activity in the United States and Eastern Canada. In 2015, we estimate that approximately 52%36% and 14%39% of our Predecessor and Successor net sales, respectively, and approximately 40% of our pro forma net sales were generated from residential construction activity and approximately 17% and 16% of our Predecessor and Successor net sales, respectively, and approximately 26% of our pro forma net sales were generated from non-residential construction activity, respectively.activity. See “Unaudited Pro Forma Condensed Combined Financial Information.” Our success and future growth prospects depend, to a significant extent, on conditions in these two end markets and the degree to which these markets are strong in the future.
The construction industry and related markets are cyclical and have in the past been, and may in the future be, materially and adversely affected by general economic and global financial market conditions. These factors impact not only our business, but those of our customers and suppliers as well. This influence is true with respect to macroeconomic factors within North America, particularly within our geographic footprint in the United States and Eastern Canada. For example, in 2008, residential construction and non-residential construction activity in the United States dipped to historically low levels during the financial crisis. As a result, demand for many of our products in the United States dropped significantly. The residential and non-residential construction markets in Canada also suffered during this time.
The markets in the construction industry in which we operate are also subject to other more specific factors. Residential construction activity levels are influenced by and sensitive to a number of factors, including mortgage availability, the cost of financing a home (in particular, mortgage terms and interest rates), unemployment levels, household formation rates, gross domestic product, residential vacancy and foreclosure rates, demand for second homes, existing housing prices, rental prices, housing inventory levels, building mix between single- and multi-family homes, consumer confidence, seasonal weather factors, the available labor pool and government policy and incentives. Non-residential construction activity is primarily driven by levels of business investment, availability of credit and interest rates, as well as many of the factors that impact residential construction activity levels.
We cannot control the foregoing factors and, although construction activity and related spending levels have increased in recent years, there is still uncertainty regarding the timing and extent of the recovery and whether it will be sustained, and there can be no assurances that there will not be any future downturns. There can be no assurances regarding whether more recent growth in our markets can be sustained or if demand will ever return to pre-2008 levels or historical averages. If construction
activity in our markets and more generally does not continue to recover, or if there are future downturns, whether locally, regionally or nationally, our business, financial condition and results of operations could be materially and adversely affected.
Our business is based in significant part on government-funded infrastructure projects and building activities, and any reductions or re-allocation of spending or related subsidies in these areas could have a material adverse effect on us.
Our business, particularly our Drainage Pipe & Products and Water Pipe & Products segments, depends heavily on government spending for infrastructure and other similar building activities. In 2015, we estimate approximately 47% and 45% of our Predecessor and Successor net sales, respectively, and approximately 34% of our pro forma net sales were generated by government-funded infrastructure projects. See “Unaudited Pro Forma Condensed Combined Financial Information.” As a result, demand for many of our products is heavily influenced by U.S. federal government fiscal policies and tax incentives and other subsidies, including those incorporated into the economic stimulus plans implemented in connection with the financial crisis and the FAST Act. Projects in which we participate are funded directly by governments and privately-funded, but are otherwise tied to or impacted by government policies and spending measures. Government infrastructure spending and governmental policies with respect thereto depend primarily on the availability of public funds, which is influenced by many factors, including governmental budgets, public debt levels, interest rates, existing and anticipated and actual federal, state, provincial and local tax revenues, government leadership and the general political climate, as well as other general macroeconomic and political factors. In addition, U.S. federal government funds may only be available based on states’ willingness to provide matching funding. Government spending is often approved only on a short-term basis and some of the projects in which our products are used require longer-term funding commitments. If government funding is not approved, or funding is lowered as a result of poor economic conditions, lower than expected revenues, competing spending priorities or other factors, it could limit infrastructure projects available, increase competition for projects, result in excess inventory and decrease sales, all of which could adversely affect the profitability of our business. Additionally, certain regions or states may require or possess the means to finance only a limited number of large infrastructure projects and periods of high demand may be followed by years of little to no activity. There can be no assurances that governments will sustain or increase current infrastructure spending and tax incentive and other subsidy levels, and any reductions thereto or delays therein could have a material adverse effect on our business, financial condition and results of operations.
We engage in a highly competitive business and any failure to effectively compete could have a material adverse effect on us.
The markets in which we sell our products are highly competitive. We face significant competition from, depending on the segment or product, domestic and imported products produced by local, regional, national and international building product manufacturers, as well as privately owned single-site enterprises. Due in part to the costs associated with transporting our products to our customers, many of our sub-markets are relatively fragmented and include a number of regional competitors. Our primary competitors include Rinker Materials (a unit of CEMEX, S.A.B. de C.V.) and Oldcastle, Inc. (a unit of CRH plc) in our Drainage Pipe & Products segment and McWane, Inc. and American Cast Iron Pipe Company in our Water Pipe & Products segment, particularly with respect to DIP, and Boral USA (a unit of Boral Limited), General Shale, Inc. (a unit of Wienerberger AG), Acme Brick Company (a unit of Berkshire Hathaway Inc.), and Glen-Gery Corporation (a unit of Ibstock Building Products) in our Bricks segment.DIP.
Competition among manufacturers in our markets is based on many factors, but we primarily compete on price. Our competitors may sell their products at lower prices because, among other things, they possess the ability to manufacture or supply similar products and services more efficiently or at a lower cost or have built a superior sales or distribution network. Some of our competitors may have access to greater financial or other resources than we do, which may afford them greater
purchasing power, greater production efficiency, increased financial flexibility or more capital resources for expansion and improvement. In addition, some of our competitors are vertically integrated with suppliers or distributors and can leverage this structure to their advantage to offer better pricing to customers. Furthermore, our competitors’ actions, including restoring idled or expanding manufacturing
capacity, competition from newly-designed or imported products or the entry of new competitors into one or more of our markets could cause us to lower prices in an effort to maintain our customer base. Certain of our products, including gravity pipe, and bricks, are volume manufacturing products that are widely available from other manufacturers or distributors, with prices and volumes determined frequently based on participants’ perceptions of short-term supply and demand. Competitive factors, including industry overcapacity, could also lead to pricing pressures. For example, competitors may choose to pursue a volume policy to continue utilizing their manufacturing facilities to the detriment of maintaining prices. Excess product supply can result in significant declines in the market prices for these products, often within a short period of time. As a result, at times, to remain competitive, we may lower the price for any one or more of our products to or below our production costs, requiring us to sacrifice margins or incur losses. Alternatively, we may choose to pass on product sales or cease production at one or more of our manufacturing facilities.
In addition to pricing, we also compete based on service, quality, range of products and product availability. Competition in certain of our product segments, such as the Bricks segment, is also based in part on styles and trends. Our competitors may be positioned to provide better service and thereby establish stronger relationships with customers and suppliers. Our competitors may also sell preferred products, improve the design and performance of their products, develop a more comprehensive product portfolio, be better positioned to influence end-user product specifications or introduce new products with competitive prices and performance characteristics. While the majority of our products are not subject to frequent or rapid stylistic changes, trends do evolve over time, and our competitors may do a better job of predicting market developments or adapt more quickly to new technologies or evolving customer requirements.
We also face competition from substitute building products. For example, storm water pipe can be manufactured from concrete, steel, high-density polyethylene (HDPE), polypropylene (PP) or polyvinyl chloride (PVC) and potable water transmission infrastructure can be manufactured using HDPE or PVC. The market share of HDPE and PP pipe, which compete with gravity pipe and pressure pipe for certain applications, and HDPE and PVC pipe, which compete with DIP for certain applications, have increased in recent years. Additionally, our bricks compete with other materials that can be used for the exterior of a house or non-residential building such as wood, vinyl, fiber cement, stucco and manufactured stone. Governments in the past have, and may continue in the future, to provide incentives that support or encourage, or in certain instances pass regulations that require, the consideration of use of substitute products with which we compete. Additionally, new construction techniques and materials will likely be developed in the future. Increases in customer or market preferences for any of these products could lead to a reduction in demand for our products.
Any failure by us to compete on price, to develop successful products and strategies or to generally maintain and improve our competitive position could have a material adverse effect on our business, financial condition and results of operations.
Increases in energy and related costs could have a material adverse effect on us.
We use significant amounts of energy, including electricity and natural gas, in the manufacturing, distribution and sale of our products, and the related expense is significant. See “Unaudited Pro Forma Condensed Combined Financial Information.” While we have benefited from the relatively low cost of electricity and natural gas in recent years, energy prices have been and may continue to be volatile and these reduced prices may not continue. Proposed or existing government policies, including those to address climate change by reducing greenhouse gas emissions or the effects of hydraulic fracturing, a method of exploring for oil and natural gas, could result in increased energy costs. In addition, factors such as international political and military instability, adverse weather conditions and other natural disasters may disrupt fuel supplies and
increase prices in the future. Although we have hedged energy
positions in the past and we currently hedge a portion of our exposure to electricity and natural gas prices, we may not continue our current strategy or hedge any positions in the future and therefore remain susceptible to energy price increases.Additionally, because we and other manufacturers in our industry are often responsible for delivering products to the customer, we are further exposed to increased energy prices as a component of our transportation costs. While we generally attempt to pass increased costs, including higher energy costs, on to our customers, pricing pressure from our competitors, the market power of our customers or other pricing factors may limit our ability to do so, and any increases in energy prices could have a material adverse effect on our business, financial condition and results of operations.
Decreased availability of or increases in the cost of raw materials could have a material adverse effect on us.
Our ability to offer our products to our customers is dependent upon our ability to obtain adequate supplies of raw materials at reasonable costs, such as cement, aggregate, steel and iron. Raw material prices and availability, including the forms in which they are purchased, such as scrap metal, have been volatile in recent years. Many suppliers decreased capacity during the financial crisis. This decreased capacity, along with strong global demand for certain raw materials, has at times caused and may continue to cause tighter supply and significant price increases. Factors such as adverse weather conditions and other natural disasters, as well as political and other social instability, have and will continue to disrupt raw material supplies and impact prices. Suppliers are also subject to their own viability concerns from economic, market and other pressures.
Although we have agreements with our raw material suppliers, these agreements are generally terminable by either party on limited notice or contain prices that are based upon the volume of our total purchases. For example, we have historically purchased a substantial portion of our cement requirements from a subsidiary of HeidelbergCement and have an existing supply agreement with HeidelbergCement to purchase cement for certain of our facilities as discussed in greater detail in the section entitled “Business—Raw Materials and Inputs.” Though the term of the supply agreement extends to March 2020, beginning on January 1, 2017, HeidelbergCement may, for any reason and upon 180 days’ notice, reduce the amount of cement it supplies thereunder or terminate the supply agreement altogether. To the extent the agreement with HeidelbergCement or any of our other raw material suppliers is terminated or we need to purchase additional cement or other raw materials in the open market, there can be no assurance that we could timely find alternative sources in reasonable quantities or at reasonable prices. In addition, sudden or unanticipated changes in sources for certain raw materials, such as cement, may require us to engage in testing of our products for quality assurance, which may cause delays in our ability to meet production schedule for our customers and timely deliver our products. The inability to obtain any raw materials or unanticipated changes with respect to our suppliers could negatively impact our ability to manufacture or deliver our products and to meet customer demands.
We are susceptible to raw material price fluctuations. Prices of the raw materials we use have at times fluctuated in recent years and may be susceptible to significant price fluctuations in the future. We have hedged our positions with respect to certain raw materials in the past and may do so in the future, but we currently have no hedging in place and are therefore more susceptible to any short-term price fluctuations. We generally attempt to pass increased costs, including higher raw material prices, on to our customers, but pricing pressure from our competitors, the market power of our customers or other pricing factors may limit our ability to pass on such price increases. If we cannot fully-offset increases in the cost of raw materials through other cost reductions, or recover these costs through price increases or otherwise, we could experience lower margins and profitability, which could have a material adverse effect on our business, financial condition and results of operations.
Any inability to successfully implement our growth strategy could have a material adverse effect on us.
Our business plan provides for continued growth through acquisitions and joint ventures. We have grown in large part as a result of our recent acquisitions, including our acquisitions of Cretex, Sherman-Dixie and U.S. Pipe, and we anticipate continuing to grow in this manner. Shortly before it was acquired by us, U.S. Pipe had also completed several acquisition transactions of its own. Although we expect to regularly consider additional strategic transactions in the future, there can be no assurances that we will identify suitable acquisition, joint venture or other investment opportunities or, if we do, that any transaction can be consummated on acceptable terms. Antitrust or other competition laws may also limit our ability to acquire or work collaboratively with certain businesses or to fully realize the benefits of a prospective acquisition. Furthermore, a significant change in our business or the economy, an unexpected decrease in our cash flows or any restrictions imposed by our debt may limit our ability to obtain the necessary capital or otherwise impede our ability to complete a transaction. Regularly considering strategic transactions can also divert management’s attention and lead to significant due diligence and other expenses regardless of whether we pursue or consummate any transaction. Failure to identify suitable transaction partners and to consummate transactions on acceptable terms, as well as the commitment of time and resources in connection with such transactions, could have a material adverse effect on our business, financial condition and results of operations.
The consummation of an acquisition also exposes us to significant risks and additional costs. We may not accurately assess the value, strengths, weaknesses or potential profitability of an acquisition target. Furthermore, we may not be able to fully or successfully integrate an acquired business or realize the expected benefits and synergies following an acquisition. Business and operational overlaps may lead to hidden costs. These costs can include unforeseen pre-acquisition liabilities or the impairment of customer relationships or certain acquired assets such as inventory and goodwill. We may also incur costs and inefficiencies to the extent an acquisition expands the industries, markets or geographies in which we operate due to our limited exposure to and experience in a given industry, market or region. Significant acquisitions may also require that we incur additional debt to finance the transaction, which could be substantial and limit our flexibility in using our cash flow from operations for other purposes. Acquisitions can also involve post-transaction disputes with the counter party regarding a number of matters, including a purchase price or other working capital adjustment or liabilities for which we believe we were indemnified under the relevant transaction agreements such as environmental liabilities or pension obligations retained by the seller, including certain environmental obligations in connection with our U.S. Pipe Acquisition and certain pension obligations we assumed pursuant to the Acquisition and the Cretex Acquisition. For example, as discussed in greater detail in the section entitled “Business—Legal Proceedings,” we are currently engaged in a dispute with HeidelbergCement regarding the earn-out provision in the purchase agreement entered into in connection with the Acquisition. We are also engaged in other indemnification and other post-closing disputes with certain of our transaction counterparties. Our inability to realize the anticipated benefits of an acquisition as well as other transaction-related issues could have a material adverse effect on our business, financial condition and results of operations.
In July 2012, we entered into a joint venture agreement with Americast, Inc. to form Concrete Pipe & Precast LLC. From time to time, we may enter into additional joint ventures as part of our growth strategy. The nature of a joint venture requires us to share control with unaffiliated third parties. If our joint venture partners do not fulfill their contractual and other obligations, the affected joint venture may be unable to operate according to its business plan, and we may be required to increase our level of commitment. Differences in views among joint venture participants could also result in delays in business decisions or otherwise, failures to agree on major issues, operational inefficiencies and impasses, litigation or other issues. Third parties may also seek to hold us liable for the joint
ventures’ liabilities. These issues or any other difficulties that cause a joint venture to deviate from its
original business plan could have a material adverse effect on our business, financial condition and results of operations.
Our dependence on key customers with whom we do not have long-term contracts and consolidation within our customers’ industries could have a material adverse effect on us.
Our business is dependent on certain key customers. OurIn 2015, our largest customer accounted for 9.5%9.9% of our pro forma net sales in 2015.sales. See the section entitled “Unaudited Condensed Combined Financial Information.” As is customary in our industry, we do not enter into long-term contracts with many of our customers. As a result, our customers could stop purchasing our products, reduce their purchase levels or request reduced pricing structures at any time. We may therefore need to adapt our manufacturing, pricing and marketing strategies in response to a customer who may seek concessions in return for its continued or increased business. In addition, following the financial crisis, there was significant consolidation in the U.S. homebuilding industry, with many smaller builders going out of business or being acquired by larger builders, significantly increasing the market share and bargaining power of a limited number of builders. Any further consolidation in the U.S. homebuilding industry or among any of our other customers could give them significant additional leverage to negotiate more favorable terms and place greater demands on us. A loss of one or more customers or a meaningful reduction in their purchases from us or further consolidation within our end markets could have a material adverse effect on our business, financial condition and results of operations.
Changes in construction activity levels in Texas could have a material adverse effect on us.
We currently conduct a significant portion of our business in Texas, which in 2015 we estimate represented approximately 19.7%46% and 37% of our 2015Predecessor and Successor net sales, respectively, and approximately 21% of our pro forma net sales. Residential and non-residential construction activity, as well as government-funded infrastructure spending in Texas has declined from time to time, particularly as a result of slow economic growth, whether in the energy industry or otherwise. Local economic conditions depend on a variety of factors, including national economic conditions, local and state budgets, infrastructure spending and the impact of federal cutbacks. Texas is also an area of the country that is susceptible to severe weather and flooding, which can interrupt, delay or otherwise impact the timing of projects. Any decrease in construction activity in Texas could have a material adverse effect on our business, financial condition and results of operations.
A material disruption at one or more of our manufacturing facilities or in our supply chain could have a material adverse effect on us.
We own and operate manufacturing facilities of various ages and levels of automated control and rely on a number of third parties as part of our supply chain, including for the efficient distribution of products to our customers. Any disruption at one of our manufacturing facilities or within our supply chain could prevent us from meeting demand or require us to incur unplanned capital expenditures. Older facilities are generally less energy-efficient and are at an increased risk of breakdown or equipment failure, resulting in unplanned downtime. Any unplanned downtime at our facilities may cause delays in meeting customer timelines, result in liquidated damages claims or cause us to lose or harm customer relationships. Additionally, we require specialized equipment to manufacture certain of our products, and if any of our manufacturing equipment fails, the time required to repair or replace this equipment could be lengthy, which could result in extended downtime at the affected facility. Any unplanned repair or replacement work can also be very expensive. Moreover, manufacturing facilities can unexpectedly stop operating because of events unrelated to us or beyond our control, including fires and other industrial accidents, floods and other severe weather events, natural disasters, environmental incidents or other catastrophes, utility and transportation infrastructure disruptions,
shortages of raw materials, and acts of war or terrorism. Work stoppages, whether union-organized or not, can also disrupt operations at manufacturing facilities. Furthermore, while we are generally
responsible for delivering products to the customer, we do not maintain our own fleet of delivery vehicles and outsource this function to third parties. Any shortages in trucking capacity, any increase in the cost thereof or any other disruption to the highway systems could limit our ability to deliver our products in a timely manner or at all. Any material disruption at one or more of our facilities or those of our customers or suppliers or otherwise within our supply chain, whether as a result of downtime, facility damage, an inability to deliver our products or otherwise, could prevent us from meeting demand, require us to incur unplanned capital expenditures or cause other material disruption to our operations, any of which could have a material adverse effect on our business, financial condition and results of operations.
Delays in construction projects and any failure to manage our inventory could have a material adverse effect on us.
Many of our products are used in water transmission and distribution projects and other large-scale construction projects which generally require a significant amount of planning and preparation before construction commences. However, construction projects can be delayed and rescheduled for a number of reasons, including unanticipated soil conditions, adverse weather or flooding, changes in project priorities, financing issues, difficulties in complying with environmental and other government regulations or obtaining permits and additional time required to acquire rights-of-way or property rights. These delays or rescheduling may occur with too little notice to allow us to replace those projects in our manufacturing schedules or to adjust production capacity accordingly, creating unplanned downtime, increasing costs and inefficiencies in our operations and increased levels of obsolete inventory. Additionally, we maintain an inventory of brickcertain products that meet standard specifications and are ultimately purchased by a variety of end users. We forecast demand for these brick products to ensure that we keep high inventory levels of certain products that we expect to be in high demand and limit our inventory for which we do not expect much interest. However, our forecasts are not always accurate and unexpected changes in demand for these brick products, whether because of a change in preferences or otherwise, can lead to increased levels of obsolete inventory. Any delays in construction projects and our customers’ orders or any inability to manage our inventory could have a material adverse effect on our business, financial condition and results of operations.
Any inability to successfully integrate our recent acquisitions could have a material adverse effect on us.
We have recently acquired Cretex, Sherman-Dixie, U.S. Pipe and U.S. Pipe.Bio Clean. In addition, U.S. Pipe completed three acquisitions shortly before being acquired by us. The integration of acquired businesses can take significant amount of time and also exposes us to significant risks and additional costs. Integrating these and other acquisitions may strain our resources. Further, we may have difficulty integrating the operations, systems, controls, procedures or products of acquired businesses and may not be able to do so in a timely, efficient and cost-effective manner. These difficulties could include:
We have not fully-integrated Cretex, Sherman-Dixie, or U.S. Pipe or Bio Clean and may encounter one or more of the issues discussed above, or others of which we are not yet aware. In particular, we have not yet integrated the accounting and financial reporting systems of these businesses and are currently evaluating whether and to what extent we will do so in the future. Additionally, U.S. Pipe had recently acquired other businesses prior to their being acquired by us, and the integration of some of those businesses remains on-going. Any of these acquisition or other integration-related issues could divert management’s attention and resources from our day-to-day operations, cause significant disruption to our business and lead to substantial additional costs. Our inability to realize the anticipated benefits of an acquisition or to successfully integrate acquired companies as well as other transaction-related issues could have a material adverse effect on our business, financial condition and results of operations.
Labor disruptions and other union activity could have a material adverse effect us.
ApproximatelyAs of June 30, 2016, approximately 35% of our workforce iswas covered by collective bargaining agreements, and approximately 26%25% of these employees arewere included in a collective bargaining agreement that expired within one year. Assuming the Bricks Disposition had occurred on June 30, 2016, the approximate percentage of our work force as of such date covered by collective bargaining agreements and the collective bargaining agreement that expireexpired within one year.year would not have changed. If negotiations to renew expiring collective bargaining agreements are not successful or become unproductive, the union could take actions such as strikes, work slowdowns or work stoppages. Such actions at any one of our facilities could lead to a plant shut down or a substantial modification to employment terms, thereby causing us to lose net sales or to incur increased costs. Additionally,We have not had any union organized work stoppages in the United States, Canada or Mexico over the last four years; however, we have experienced one union organizing effort directed at our non-union employees in the past ten years. There can be no assurances there will not be additional union organizing efforts, strikes, work slowdowns or work stoppages in the future. Any such disruption, or other issue related to union activity, could have a material adverse effect on our business, financial condition and results of operations.
A tightening of mortgage lending or mortgage financing requirements or other reductions in the availability of consumer credit or increases in its cost could have a material adverse effect on us.
We estimate that in 2015, approximately 52%36% and 39% of our 2015Predecessor and Successor net sales, respectively, and approximately 40% of our pro forma net sales were generated from residential construction activity. Most home sales in the United States and Eastern Canada are financed through mortgage loans, and a significant percentage of renovation and other home repair activity is financed either through mortgage loans or other available credit. The financial crisis affected the financial position of many consumers and caused financial institutions to tighten their lending criteria, each of which contributed to a significant reduction in the availability of consumer credit. The mortgage lending and mortgage finance industries experienced significant instability because of, among other factors, a decline in property values and an increase in delinquencies, defaults and foreclosures. These
developments resulted in a significant reduction in total new housing starts in the United States and consequently, a reduction in demand for our products in the residential sector. Similarly, the rate of interest payable on any mortgage or other form of credit will have an impact on the cost of borrowing. While base rates have remained low in recent years, they may rise in the future. Any increase in interest rates will increase the cost of borrowing and may make the purchase of a home less attractive. Any future tightening of mortgage lending or other reductions in the availability of consumer credit or increases in its cost could have a material adverse effect on our business, financial condition and results of operations.
We are in a dispute with HeidelbergCement related to the payment of an earn outearn-out in connection with the Acquisition and any significant earn outearn-out payment we are required to make could have a material adverse effect on us.
We are currently engaged in a dispute with HeidelbergCement regarding the earn outearn-out provision in the purchase agreement entered into in connection with the Acquisition. As discussed in greater detail in “Business—Legal Proceedings,” we believe that no earn out payment is owed, but HeidelbergCement has asserted (and has filed a lawsuit against us asserting) that a payment should be made in the amount of $100.0 million. Absent agreement of the parties, resolution of the matter will likely be determined by a neutral accountant. If it is determined that we are required to make a significant payment to HeidelbergCement, we may not have sufficient cash to make such payment and may be required to incur additional indebtedness. We cannot be certain that we will be able to borrow any funds for this purpose under the terms of our existing indebtedness or on other terms acceptable to us, if at all. If incurred, additional indebtedness will subject us to additional interest expense, negatively impact our cash flow, increase the risk of a downgrade in our credit rating and could limit our ability to incur other indebtedness or make further acquisitions.
We are subject to increasingly stringent environmental laws and regulations, and any failure to comply with any current or future laws or regulations could have a material adverse effect on us.
We are subject to federal, state, provincial, local and foreign laws and regulations governing the protection of the environment and natural resources, including those governing air emissions, wastewater discharges and the use, storage, discharge, handling, disposal, transport and clean-up of solid and hazardous materials and wastes. We are required to obtain permits from governmental authorities for certain operations, and if we expand or modify our facilities or if environmental laws change, we could be required to obtain new or modified permits. One example of these laws, the National Emission Standards for Hazardous Air Pollutants: Brick and Structural Clay Products Manufacturing; and Clay Ceramics Manufacturing, was finalized in September 2015. This rule requires the installation of “maximum achievable control technology” or “MACT” at affected facilities. Of our brick facilities covered by this rule, six are required to install new MACT-compliant pollution control equipment no later than December 2018. We have budgeted an aggregate of $10.4 million for capital expenditures through 2018 to achieve full compliance with this rule, but we cannot assure you that the work will be completed on time or that our aggregate compliance costs will not be higher. Also, as the owner and operator of surface mines from which we excavate clay for our brick manufacturing, we have certain reclamation obligations under applicable law, which may lead to cash outflows upon complete or partial closure of a pit. As of December 31, 2015, the provision for such measures amounted to a total of $1.8 million. However, the estimated provisions resulting from reclamation obligations may change and the proportion of costs not covered by provisions could increase if the assumptions underlying our estimates are inaccurate or the underlying facts or legal requirements change.
Environmental laws and regulations, including those related to energy use and climate change, tend to become more stringent over time, and any future laws and regulations could have a material impact on our operations or require us to incur material additional expenses to comply with any such future laws and regulations. Future environmental laws and regulations may cause us to modify how we manufacture and price our products or require that we make significant capital investments to comply. For example, our manufacturing processes use a significant amount of energy, and increased regulation of energy use to address the possible emission of greenhouse gases could materially increase our manufacturing costs or require us to install emissions control or other equipment at some or all of our manufacturing facilities.
If we fail to comply with any existing or future environmental laws, regulations or permits, we could incur fines, penalties or other sanctions and suffer reputational harm. In addition, we could be
held responsible for costs and damages arising from claims or liabilities under environmental laws and regulations, including with respect to any exposure to hazardous materials or contamination at our facilities or at third-party waste disposal sites. We could also be subject to third party claims from individuals if any releases from our property were to cause contamination of the air, soil or groundwater
of areas near our facilities. These laws and regulations may also require us to investigate and, in certain instances, remediate contamination. Some of our sites have a history of industrial use, and while we apply strict environmental operating standards and undertake extensive environmental due diligence in relation to our facilities and acquisitions, some soil and groundwater contamination has occurred in the past at a limited number of sites. As of December 31, 2015, we had accrued approximately $1.3$1.8 million for environmental obligations.liabilities. Additionally, we cannot completely eliminate the risk of future contamination. Any costs or other damage related to existing or future environmental laws, regulations or permits or any violations thereof could expose us to significant financial losses as well as civil and criminal liabilities, any of which could have a material adverse effect on our business, financial condition and results of operations.
We are subject to health and safety laws and regulations and any failure to comply with any current or future laws or regulations could have a material adverse effect on us.
Manufacturing and mining sites are inherently dangerous workplaces. Our sites often put our employees and others in close proximity with large pieces of mechanized equipment, moving vehicles, chemical and manufacturing processes, heavy products and items and highly regulated materials. As a result, we are subject to a variety of health and safety laws and regulations dealing with occupational health and safety. Unsafe work sites have the potential to increase employee turnover and raise our operating costs. Our safety record can also impact our reputation. We maintain functional groups whose primary purpose is to ensure we implement effective work procedures throughout our organization and take other steps to ensure the health and safety of our work force, but there can be no assurances these measures will be successful in preventing injuries or violations of health and safety laws and regulations. Any failure to maintain safe work sites or violations of applicable law could expose us to significant financial losses and reputational harm, as well as civil and criminal liabilities, any of which could have a material adverse effect on our business, financial condition and results of operations.
The use of our products is often affected by various laws and regulations in the markets in which we operate, any of which may have a material adverse effect on us.
The use of many of our products is subject to approvals by municipalities, state departments of transportation, engineers and developers. These approvals and specifications, including building codes, may affect the products our customers or their customers (the end users) are allowed or choose to use, and, consequently, failure to obtain or maintain such approvals or changes in building codes may affect the saleability of our products. Changes in applicable regulations governing the sale of some of our products or the failure of any of our products to comply with such requirements could increase our costs of doing business, reduce sales or otherwise have a material adverse effect on our business, financial condition and results of operations.
We depend on the services of key executives and any inability to attract and retain key management personnel could have a material adverse effect on us.
Our key management personnel, including our Chief Executive Officer and Chief Financial Officer, are important to our success because they are instrumental in setting our strategic direction, operating our business and identifying expansion opportunities. Additionally, as our business grows, we may need to attract and hire additional management personnel. We have employment agreements with some members of senior management; however, we cannot prevent our executives from terminating their employment with us, and any replacements we hire may not be as effective. Our
ability to retain our key management personnel or to attract additional management personnel or suitable replacements should any members of our management team leave is dependent on a number of factors, including the competitive nature of the employment market. Any failure to retain key
management personnel or to attract additional or suitable replacement personnel could have a material adverse effect on our business, financial condition and results of operations.
Any failure to retain and attract additional skilled technical or sales personnel could have a material adverse effect on us
Our success depends in part on our ability to retain and attract additional skilled employees, particularly engineering and technical personnel. Without a sufficient number of skilled employees, our operations and manufacturing quality could suffer. The reduction in demand for products in our industry that occurred during the financial crisis led to a number of skilled workers leaving our industry permanently, reducing an already limited pool of available and qualified personnel. Our experienced sales team has also developed a number of meaningful customer relationships that would be difficult to replace. Therefore, competition for qualified technical personnel and operators as well as sales personnel with established customer relationships is intense, both in retaining our existing employees and when replacing or finding additional suitable employees. There can be no assurances the labor pool from which we hire our this personnel will increase or remain stable and any failure to retain our existing technical and sales personnel and other employees or attract additional skilled personnel could have a material adverse effect our business, financial condition and results of operations.
Credit and non-payment risks of our customers, especially during times of economic uncertainty and tight credit markets, could have a material adverse effect on us.
As is customary in our industry, the majority of our sales are to customers on an open credit basis, with standard payment terms of 30 days. While we generally monitor the ability of our customers to pay these open credit arrangements and limit the credit we extend to what we believe is reasonable based on an evaluation of each customer’s financial condition and payment history, we may still experience losses because of a customer’s inability to pay. As a result, while we maintain what we believe to be a reasonable allowance for doubtful receivables for potential credit losses based upon our historical trends and other available information, there is a risk that our estimates may not be accurate, particularly in times of economic uncertainty and tight credit markets. Any inability to collect customer receivables or inadequate provisions for doubtful receivables could have a material adverse effect on our business, financial condition and results of operations.
Warranty and related claims could have a material adverse effect on us.
We generally provide warranties on our products against defects in materials and workmanship, the costs of which could be significant. Many of our products such as gravity pipe are buried underground and incorporated into a larger infrastructure system, such as a city’s or municipality’s water transmission system, or built into the fabric of a building or dwelling. In most cases, it is difficult to access, repair, recall or replace these products. Additionally, some of our products, such as our pressure pipe, which is used in nuclear and coal-fired power generation factories, are used in applications where a product failure or construction defect could result in significant project delay, property damage, personal injury or death or could require significant remediation expenses. Because our products, including discontinued products, are long lasting, claims can also arise many years after their manufacture and sale. Additionally, product failures may also arise due to the quality of the raw materials we purchase from third-party suppliers or the quality of the work performed by our customers, including installation work, matters for which we have little to no control, but which may still subject us to a warranty claim. We may also assume product warranty or other similar obligations in acquisition transactions regarding the products sold by the acquired businesses prior to the transaction date for
which we are not indemnified pursuant to the terms of the relevant transaction documentation. Our quality control systems and procedures and those of our suppliers and customers cannot test for all
possible conditions of use or identify all defects in the design, engineering or specifications of one of our products or the raw materials we use before they are put to their intended purpose. Therefore, there can be no assurances that we will not supply defective or inferior products that cause product or system failure, which could give rise to potentially extensive warranty and other claims for damages, as well as negatively impact our reputation and the perception of our product quality and reliability. While we have established reserves for warranty and related claims that we believe to be reasonable, these claims may exceed our reserves and any such excess and any negative publicity and other issues related to such claims could have a material adverse effect on our business, financial condition and results of operations.
Legal and regulatory claims and proceedings could have a material adverse effect on us.
We are subject to claims, litigation and regulatory proceedings in the normal course of business and could become subject to additional claims in the future, some of which could be material. For example, we have been, and may in the future be, subject to claims for product liability, construction defects, project delay, personal injury and property and other damages. We have also been subject to allegations regarding compliance with mandated product specifications. Claims and proceedings, whether or not they have merit and regardless of the outcome, are typically expensive and can divert the attention of management and other personnel for significant periods of time. Additionally, claims and proceedings can impact customer confidence and the general public’s perception of our company and products, even if the underlying assertions are proven to be false. While we have established reserves we believe to be reasonable under the facts known, the outcomes of litigation and similar disputes are often difficult to reliably predict and may result in decisions or settlements that are contrary to or in excess of our expectations and losses may exceed our reserves. In addition, various factors and developments could lead us to make changes in our current estimates of liabilities and related insurance receivables or make new or modified estimates as a result of a judicial ruling or judgment, a settlement, regulatory developments or changes in applicable law. Any claims or proceedings, particularly those in which we are unsuccessful or for which we did not establish adequate reserves, could have a material adverse effect on our business, financial condition and results of operations.
The seasonality of our business and its susceptibility to severe and prolonged periods of adverse weather and other conditions could have a material adverse effect on us.
Demand for our products in some markets is typically seasonal, with periods of snow or heavy rain negatively affecting construction activity. For example, sales of our products in Canada and the Northeast and Midwest regions of the United States are somewhat higher from spring through autumn when construction activity is greatest. Construction activity declines in these markets during the winter months in particular due to inclement weather, frozen ground and fewer hours of daylight. Construction activity can also be affected in any period by adverse weather conditions such as hurricanes, severe storms, torrential rains and floods, natural disasters such as fires and earthquakes and similar events, any of which could reduce demand for our products, push back existing orders to later dates or lead to cancellations. Furthermore, our ability to deliver products on time or at all to our customers can be significantly impeded by such conditions and events, such as these described above. Public holidays and vacation periods constitute an additional factor that may exacerbate certain seasonality effects, as building projects or industrial manufacturing processes may temporarily cease. These conditions, particularly when unanticipated, can leave both equipment and personnel underutilized. Additionally, the seasonal nature of our business has led to variation in our quarterly results in the past and may continue to do so in the future. This general seasonality of our business and any severe or prolonged adverse weather conditions or other similar events could have a material adverse effect on our business, financial condition and results of operations.
Certain of the contracts in our backlog may be adjusted, cancelled or suspended by our customers and, therefore, our backlog is not necessarily indicative of our future revenues or earnings or, even if performed, a good indicator of our future margins.
As of May 31,June 30, 2016, our backlog totaled approximately $435.8$498.1 million. In accordance with industry practice, many of our contracts are subject to cancellation, reduction, termination or suspension at the discretion of the customer.customer in respect of work that has not yet been performed. In the event of a project cancellation, we would generally have no contractual right to the total revenue reflected in our backlog.backlog, but instead would collect revenues in respect of all work performed at the time of cancellation as well as all other costs and expenses incurred by us through such date. Projects can remain in backlog for extended periods of time because of the nature of the project, delays in execution of the project and the timing of the particular services required by the project. Additionally, the risk of contracts in backlog being cancelled, terminated or suspended generally increases at times, including as a result of periods of wide-spread macroeconomic and industry slowdown, weather, seasonality and many of the other factors impacting our business. Many of the contracts in our backlog are subject to changes in the scope of services to be provided as well as adjustments to the costs relating to the contracts. The revenue for certain contracts included in backlog are based on estimates. Therefore, the timing of performance on our individual contracts can affect greatly our margins and hence, future profitability. There is no assurance that backlog will actually be realized as revenues in the amounts reported or, if realized, will result in any estimated profits.
Our project-based business requires significant liquidity, and any inability to ensure adequate financing or guarantees for large projects in the future could have a material adverse effect on us.
The projects in which we participate, particularly in our pressure pipe business, can be capital-intensive and often require substantial liquidity levels. In line with industry practice, we receive prepayments from our customers as well as milestone payments. However, a change in prepayment patterns or our inability to obtain third-party guarantees in respect of such prepayments could force us to seek alternative financing sources, such as bank debt or in the capital markets, which we may not be able to do on terms acceptable to us or at all, any of which could have a material adverse effect on our business, financial condition and results of operations.
As is customary in some of our sub-markets, we provide our customers with performance guarantees and other guarantee instruments, such as surety bonds, that guarantee the timely completion of a project pursuant to defined contractual specifications. We also enter into contractual obligations to pay liquidated damages to our customers for project delays. We are required to make payments under these contracts, guarantees and instruments if we fail to meet any of the specifications. Some customers require the performance guarantees to be issued by a reputable and creditworthy financial institution in the form of a letter of credit, surety bond or other financial guarantee. Financial institutions consider our credit ratings and financial position in the guarantee approval process. Our credit ratings and financial position could make the process of obtaining guarantees from financial institutions more difficult and expensive. If we cannot obtain such guarantees from reputable and creditworthy financial institutions on reasonable terms or at all, we could face higher financing costs or even be prevented from bidding on or obtaining new projects, and any of these or other related obstacles could have a material adverse effect on our business, financial condition and results of operations.
Delays or outages in our information technology systems and computer networks could have a material adverse effect on us.
Our manufacturing facilities as well as our sales and service activities depend on the efficient and uninterrupted operation of complex and sophisticated information technology systems and computer
networks which are subject to failure and disruption. These and other problems may be caused by
system updates, natural disasters, malicious attacks, accidents, power disruptions, telecommunications failures, acts of terrorism or war, computer viruses, physical or electronic break-ins or other similar events. Additionally, because we have grown through various acquisitions, we have integrated and are integrating a number of disparate information technology systems across our organization, certain of which may be outdated and due for replacement, further increasing the likelihood of problems. We may in the future replace and integrate systems, but these updates may not be successful, they may create new issues we currently do not face or they may significantly exceed our cost estimates.
Furthermore, prior to the Acquisition, we were dependent on HeidelbergCement for a number of corporate and shared services, including its information technology systems and services. Following the Acquisition through February 2016, HeidelbergCement continued to provide us with certain of these services under the terms of a transition services agreement. These information technology systems and services that were previously provided by HeidelbergCement under the transition services agreement are now established internally and, in part, provided by a third-party service provider. Such systems and services may not however be comparable to those provided under the transition services agreement, may be insufficient for our needs and may create new issues that we do not currently face.
Any disruption in our information technology systems could interrupt or damage our operations and our ability to meet customer needs as well as our ability to maintain effective controls. In addition, we could be subject to reputational harm or liability if confidential customer information is misappropriated from our systems. Despite our security measures and business continuity plans, our systems could be vulnerable to disruption and any such disruption and the resulting fall-out could have a material adverse effect on our business, financial condition and results of operations.
We have material weaknesses in our internal control over financial reporting and our inability to remediate these weaknesses or otherwise implement and maintain effective internal control over financial reporting, or the inability of our independent registered public accounting firm to provide an unqualified report thereon, could have a material adverse effect on us.
We are not currently required to comply with rules of the SEC implementing Section 404 of the Sarbanes-Oxley Act of 2002, or the Sarbanes-Oxley Act, regarding internal control over financial reporting and are therefore not required to make a formal assessment of the effectiveness of our internal control over financial reporting for that purpose. However, our independent registered public accounting firm identified two material weaknesses, one regarding inventory and one regarding systems, processes and people, as of December 31, 2015. These material weaknesses could, among other things, adversely impact our ability to provide timely and accurate financial information or result in a misstatement of the account balances or disclosures that would result in a material misstatement to our annual or interim financial statements that would not be prevented or detected. The material weaknesses are described in greater detail in the section entitled “Management’s Discussion and Analysis of Financial Condition and Results of Operations—Material Weaknesses in Internal Control Over Financial Reporting.”
Extensive work still remains to fully-implement and complete our remediation plan with respect to the existing material weaknesses. These matters have required, and will continue to require, a significant amount of management time and resources and a significant commitment of external resources, both of which may lead to substantial costs. Further, starting with our second annual report on Form 10-K that we file with the SEC, our management will be required to report on, and our independent registered public accounting firm will be required to attest to, the effectiveness of our internal control over financial reporting. To comply with these requirements, we may need to undertake various additional actions, such as implementing new controls and procedures and hiring additional
accounting or internal audit staff, and incur substantial costs. If we are unsuccessful in implementing or
following our remediation plan, or fail to update our internal controls as our business evolves, we may not be able to, among other things, accurately report our financial condition, results of operations, or cash flows or maintain effective disclosure controls and procedures.
We may not be able to successfully remediate our existing material weaknesses and we may identify additional material weaknesses that we may not be able to remediate, in each case, in time to meet the Section 404 compliance deadline. If we are unable to comply with the requirements of Section 404 in a timely manner or are unable to assert that our internal control over financial reporting is effective as and when required, whether as a result of any failure to remediate our existing material weaknesses, identification of additional material weaknesses in our internal control over financial reporting or otherwise, or if our independent registered public accounting firm is unable to express an opinion as to the effectiveness of our internal control over financial reporting or issues an adverse opinion, investors may lose confidence in the accuracy and completeness of our financial reports and the market price of our common stock could decline materially.
Our rebranding efforts could have a material adverse effect on us.
Prior to the Acquisition, we operated as a wholly owned business of HeidelbergCement known as Hanson Building Products and the majority of our products were marketed using the “Hanson” brand name and logo. Following completion of the Acquisition, we were required to discontinue the use of “Hanson” and related names. On October 16, 2015, we announced that we were rebranding our business under the “Forterra” name and began using the “Forterra” name and logo.
This rebranding effort requires time and expense, and may impact our future results of operations. We may lose customers if they do not respond favorably to the new brand or fail to recognize the new brand as a continuation of our prior business. This is particularly the case for customers that purchase our products through distributors and have no direct relationship with us. Furthermore, we believe that our association with the “Hanson” name and with HeidelbergCement at times provided us with preferred status with customers, suppliers and other parties due to its recognized brand, perceived high quality products and services and financial strength. We may therefore lose potential new customers who choose not to consider our product offerings since we are no longer branded with the more familiar “Hanson” name. The rebranding may also affect our ability to recruit qualified personnel. Any unforeseen costs, lack of success or loss of current or potential new customers related to the rebranding could have a material adverse effect on our business, financial condition and results of operations.
We also share the “Forterra” brand with Forterra UK, a public company listed on the London FTSE.FTSE, and for a limited time following the Bricks Disposition, with our then-former bricks business and then the Bricks Joint Venture. Forterra UK is currently majority-owned by Lone Star and operates solely in the United Kingdom. Following the Bricks Disposition, our then-former bricks business will be wholly owned by Lone Star and following the closing of the Bricks Joint Venture, the Bricks Joint Venture will be 50% owned by Lone Star. We have no control over Forterra UK’s use of the “Forterra” name and logo, and will not have any control over the use by our then-former bricks business or the Bricks Joint Venture and any actions or negative publicity related to itany of them and itstheir products could have a material adverse effect on our business, financial condition and results of operations.
Any inability to protect our intellectual property or claims that we infringe on the intellectual property rights of others could have a material adverse effect on us.
We rely on a combination of patents, trademarks, trade names, confidentiality and nondisclosure clauses and agreements, and other unregistered rights to define and protect our rights to our brand and the intellectual property used in certain of our products.products, including the innovative technologies
relating to storm water management acquired in the Bio Clean Acquisition. We also rely on product, industry, manufacturing and market “know-how” that cannot be registered and may not be subject to any confidentiality or nondisclosure clauses or agreements. Furthermore, while we have submitted the appropriate applications, we have not yet completed the registration process of the Forterra brand in all relevant jurisdictions and we are still in the process of applying for certain Bio Clean patents and our rights to the intellectual property could be challenged by a third party. We
cannot guarantee that any of our registered or unregistered intellectual property rights or our know-how, or claims thereto, will now or in the future successfully protect what we consider to be the intellectual property underlying our products and business, or that our rights will not be successfully opposed or otherwise challenged. We also cannot guarantee that each application filed with respect to the Forterra name and the Bio Clean technologies will be approved. To the extent that our innovations, products and name are not protected by patents or other intellectual property rights, third parties, including competitors, may be able to commercialize our innovations or products or use our know-how. Additionally, we have faced in the past and may in the future face claims that we are infringing the intellectual property rights of others. If any of our products are found to infringe the patents or other intellectual property rights of others, our manufacture and sale of such products could be significantly restricted or prohibited and we may be required to pay substantial damages or on-going licensing fees. Any inability to protect our intellectual property rights or any misappropriation of the intellectual property of others could have a material adverse effect on our business, financial condition and results of operations.
Our foreign operations could have a material adverse effect on us.
We operate production facilities in Canada and Mexico and we are therefore subject to a number of risks specific to these countries. These risks include social, political and economic instability, unexpected changes in regulatory requirements, tariffs and other trade barriers, currency exchange fluctuations, acts of war or terrorism and import/export requirements. Our financial statements are reported in U.S. dollars with international transactions being translated into U.S. dollars. If the U.S. dollar strengthens in relation to the Canadian dollar, our U.S. dollar reported net sales and income will decrease. Additionally, since we incur costs in foreign currencies, fluctuation in those currencies’ value can negatively impact manufacturing and selling costs. See the section entitled “Management’s Discussion and Analysis of Financial Condition and Results of Operations—Quantitative and Qualitative Disclosures about Market Risk.” There can be no assurances that any of these factors will not materially impact our production cost or otherwise have a material adverse effect on our business, financial condition and results of operations.
Insufficient insurance coverage could have a material adverse effect on us.
We maintain property, business interruption, counterparty and liability insurance coverage that we believe is consistent with industry practice. However, our insurance program does not cover, or may not adequately cover, every potential risk associated with our business and the consequences thereof. In addition, market conditions or any significant claim or a number of claims made by or against us could cause our premiums and deductibles to increase substantially and, in some instances, our coverage may be reduced or become entirely unavailable. In the future, we may not be able to obtain meaningful coverage at reasonable rates for a variety of risks, including certain types of environmental hazards and ongoing regulatory compliance. In addition, we self-insure a portion of our exposure to certain employee benefit matters, including employee health care claims of up to $500,000 per covered individual per year and wage-payment obligations for short-term disability. If our insurance coverage is insufficient, if we are not able to obtain sufficient coverage in the future, or if we are exposed to significant losses as a result of the risks for which we self-insure, any resulting costs or liabilities could have a material adverse effect on our business, financial condition and results of operations.
Our historical financial information as a business of HeidelbergCement and following the Acquisition, after which we have consummated a number of strategic transactions, may not be representative of our results as an independent company.
Certain of the historical financial information included in this prospectus has been derived from the historical financial statements of HeidelbergCement through March 2015 and does not necessarily reflect what our financial position, results of operations or cash flows would have been had we been an
independent entity prior to that date. The historical costs and expenses reflected in our combined predecessor financial statements include an allocation for certain centralized corporate functions historically provided by HeidelbergCement, including executive senior management, financial reporting, financial planning and analysis, accounting, information technology, tax, risk management, treasury, legal and human resources. While we believe that the historical allocations for these functions are reasonable reflections of historical utilization levels in support of our business, such allocations may not be reflective of our cost structure, funding and operations following the Acquisition, including changes in our employee base, changes in our legal structure, potential increased costs associated with reduced economies of scale, migration of our informational technology systems and increased costs associated with being a stand-alone company. Nor do these historical results indicate the levels of expense necessary to operate as a publicly traded company. Furthermore, we have a very limited history of functioning as a stand-alone company and we have acquired a number of businesses since the Acquisition and we do not present any historical financial information in this prospectus for a full fiscal year reflecting our operations as a stand-alone company and inclusive of each of these acquisitions and the other transactions addressed in the section entitled “Unaudited Pro Forma Condensed Combined Financial Information.” As a result of these factors, the historical financial information included in this prospectus is not necessarily representative of what would have been reflected in our financial statements had we been a stand-alone company inclusive of the recent transactions or indicative of our future results of operations, financial position, cash flows or costs and expenses. For additional information, see the sections entitled “Selected Historical Financial Data,” “Management’s Discussion and Analysis of Financial Condition and Results of Operations,” “Unaudited Pro Forma Condensed Combined Financial Information” and our audited combined financial statements and notes thereto included elsewhere in this prospectus.
Risks Relating to our Indebtedness
The terms of our debt could have a material adverse effect on us.
We have substantial debt and may incur additional debt. As of March 31,June 30, 2016, we had approximately $724.3$1,239.8 million of long-term debt outstanding under the Revolver, Senior Term Loan and Junior Term Loan, net of debt issuance costs and original issue discount. Our credit facilities contain a number of significant restrictions and covenants that generally restrict our business and limit our ability to, among other things:
The credit facilities also require us to maintain certain financial ratios. See the section entitled “Description of Certain Indebtedness” for additional information regarding the covenants and other terms of the Revolver, Senior Term Loan and Junior Term Loan.
These and other similar provisions in these and other documents could have adverse consequences on our business and to our investors because they limit our ability to take these actions even if we believe that a specific transaction would contribute to our future growth or improve our operating results. For example, these restrictions could limit our flexibility in planning for or reacting to changes in our business and our industry, thereby inhibiting our ability to react to markets and potentially making us more vulnerable to downturns. These restrictions could also require that, based on our level of indebtedness, a significant portion of our cash flow from operations be used to make interest payments, thereby reducing the cash flow available for working capital, to fund capital expenditures or other corporate purposes and to generally grow our business. Furthermore, these restrictions could prevent us from pursuing a strategic transaction that we believe is in the best interests of our company and our stockholders.
Under the terms of a U.S. master lease, we have leased certain U.S. properties through April 4, 2036 at a cost of approximately $13.4 million per annum, payable monthly, subject to an annual 2.0% increase. Under the terms of a Canadian master lease, we have leased certain Canadian properties through April 4, 2036 at a cost of $3.5 million (CAD) per annum. Each of these master lease agreements contain certain restrictions and covenants that limit, among other things, our use of and ability to sub-lease or discontinue use of the leased properties. See “Description of Certain Indebtedness—Sale Leaseback.”
Our ability to comply with these provisions may be affected by events beyond our control. A breach of any of these provisions or any inability to comply with mandated financial ratios could result in a default, in which case the lenders may have the right to declare all borrowings to be immediately due and payable. If we are unable to repay any borrowings when due, whether at maturity or if declared due and payable following a default, the lenders would have the right to proceed against the pledged collateral securing the indebtedness. Therefore, the restrictions under our credit facilities and any breach of the covenants or failure to otherwise comply with the terms of the credit facilities could have a material adverse effect on our business, financial condition and results of operations.
Our current indebtedness and any future indebtedness we may incur could have a material adverse effect on us.
We expect that we will depend primarily on cash generated by our operations to pay our expenses and any amounts due under our credit facilities and any other indebtedness we may incur. However, our business may not generate sufficient cash flows from operations in the future and our currently anticipated growth in revenues and cash flows may not be realized, either or both of which could result in us being unable to repay indebtedness or our inability to fund other liquidity or strategic needs. Our ability to make these payments depends on our future performance, which will be affected by financial, business, economic and other factors, many of which are beyond our control. If we do not have sufficient liquidity, we may be required to refinance all or part of our then existing debt, sell assets or borrow more money.
If we incur additional indebtedness, the risks related to our indebtedness that we currently face could intensify. In addition to the risk of higher interest rates and fees, the non-economic terms of any
additional indebtedness may contain covenants and other terms restricting our financial, operating and strategic flexibility to an equal or greater extent as those imposed by our current credit facilities. Additional indebtedness may also include cross-default provisions such that, if we breach a restrictive covenant with respect to any of our indebtedness, or an event of default occurs, lenders may be entitled to accelerate all amounts owing under other outstanding indebtedness.
If we are required to refinance our indebtedness or otherwise incur additional indebtedness to fund strategic transactions or otherwise, any additional financing may not be available on terms
favorable to us or at all. If, at such time, market conditions are materially different or our credit profile has deteriorated, the cost of refinancing our debt may be significantly higher than our indebtedness existing at that time, or we may not be able to refinance our debt at all. Any failure to meet any future debt service obligations or any inability to obtain any additional financing on terms acceptable to us or to comply therewith could have a material adverse effect on our business, financial condition and results of operations.
Risks Related to this Offering and Ownership of Our Common Stock
There is currently no public market for shares of our common stock and an active trading market for our common stock may never develop following this offering.
Prior to this offering, there has been no market for shares of our common stock. Although we intend to applyhave applied to list our common stock on NASDAQ under the symbol “ ,”“FRTA,” an active trading market for our common stock may never develop or, if one develops, it may not be sustained following this offering. Accordingly, no assurance can be given as to the following:
If an active market for our common stock with meaningful trading volume does not develop or is not maintained, the market price of our common stock may decline materially below the offering price and you may not be able to sell your shares.
The trading price of our common stock may be volatile and could decline substantially following this offering.
The market price of our common stock following this offering may be highly volatile and subject to wide fluctuations. Some of the factors that could negatively affect the market price of our common stock or result in significant fluctuations in price, regardless of our actual operating performance, include:
Furthermore, in recent years, the stock market has experienced significant price and volume fluctuations. This volatility has had a significant impact on the market price of securities issued by many companies, including companies in our industry, and often occurs without regard to the operating performance of the affected companies. Therefore, factors that have little or nothing to do with us could cause the price of our common stock to fluctuate, and these fluctuations or any fluctuations related to our company could cause the market price of our common stock to decline materially below the public offering price.
The offering price per share of our common stock offered under this prospectus may not accurately reflect the value of your investment.
Prior to this offering, there has been no market for our common stock. The offering price per share of our common stock offered by this prospectus was negotiated among Lone Star, the underwriters and us. Factors considered in determining the price of our common stock include:
The offering price may not accurately reflect the value of our common stock and may not be realized upon any subsequent disposition of the shares.
The coverage of our business or our common stock by securities or industry analysts or the absence thereof could adversely affect our stock price and trading volume.
The trading market for our common stock will be influenced in part by the research and other reports that industry or securities analysts may publish about us or our business or industry. We do not currently have, and may never obtain, research coverage by industry or financial analysts. If no or few analysts commence coverage of us, the trading price and volume of our stock would likely be negatively impacted. If analysts do cover us and one or more of them downgrade our stock, or if they issue other unfavorable commentary about us or our industry or inaccurate research, our stock price would likely decline. Furthermore, if one or more of these analysts cease coverage or fail to regularly publish reports on us, we could lose visibility in the financial markets. Any of the foregoing would likely cause our stock price and trading volume to decline.
Lone Star may have conflicts of interest with other stockholders and may limit your ability to influence corporate matters.
Immediately after this offering, Lone Star will beneficially own approximately %71.1% (or %67.5% if the underwriters’ option to purchase additional shares is exercised in full) of our outstanding common stock. See “Principal and Selling Stockholders” for more information on the beneficial ownership of our common stock. As a result of this concentration of stock ownership, Lone Star acting on its own has
sufficient voting power to effectively control all matters submitted to our stockholders for approval, including director elections and proposed amendments to our bylaws or certificate of incorporation. We currently expect that, as discussed in “Management,” seven of the eleven members of our board of directors following this offering will be employees or affiliates of Lone Star.
In addition, this concentration of ownership may delay or prevent a merger, consolidation or other business combination or change in control of our company and make some transactions that might otherwise give you the opportunity to realize a premium over the then-prevailing market price of our common stock more difficult or impossible without the support of Lone Star. Because we have opted out of Section 203 of the Delaware General Corporation Law regulating certain business combinations with interested stockholders, Lone Star may transfer control of us to a third party, which may limit the price that investors are willing to pay in the future for shares of our common stock. After the lock-up period discussed in “Underwriting” expires, Lone Star will be able to transfer control of us to a third-party by transferring its common stock, which would not require the approval of our board of directors or other stockholders. The interests of Lone Star may not always coincide with our interests as a company or the interests of other stockholders. Accordingly, Lone Star could cause us to enter into transactions or agreements of which you would not approve or make decisions with which you would disagree. This concentration of ownership may also adversely affect our share price.
Lone Star is in the business of making investments in companies and may from time to time acquire and hold interests in businesses that compete directly or indirectly with us. Lone Star may also pursue acquisition opportunities that may be complementary to our business, and as a result, those acquisition opportunities may not be available to us. In recognition that principals, members, directors, managers, partners, stockholders, officers, employees and other representatives of Lone Star and its affiliates and investment funds may serve as our directors or officers, our amended and restated certificate of incorporation will provide, among other things, that none of Lone Star or any principal, member, director, manager, partner, stockholder, officer, employee or other representative of Lone Star has any duty to refrain from engaging directly or indirectly in the same or similar business activities or lines of business that we do. In the event that any of these persons or entities acquires knowledge of a potential transaction or matter which may be a corporate opportunity for itself and us, we will not have any expectancy in such corporate opportunity, and these persons and entities will not have any duty to communicate or offer such corporate opportunity to us and may pursue or acquire such corporate opportunity for themselves or direct such opportunity to another person. These potential conflicts of interest could have a material adverse effect on our business, financial condition and results of operations if, among other things, attractive corporate opportunities are allocated by Lone Star to themselves or their other affiliates. The terms of our amended and restated certificate of incorporation are described in full under “Description of Capital Stock—Corporate Opportunities and Transactions with Lone Star.”
Lone Star may also have conflicts of interest with the Company and other stockholders as a result of its status as a party to the tax receivable agreement. For example, the tax receivable agreement gives us the right to terminate the tax receivable agreement with approval of a majority of our independent directors and with Lone Star’s consent by making a payment equal to the present value of future payments under the tax receivable agreement (based on certain assumptions and deemed events in the agreement, including those relating to our and our subsidiaries’ future taxable income). Lone Star may determine to withhold its consent to terminate the tax receivable agreement at a time
when such a termination would be favorable to us and the other stockholders. Furthermore, the tax receivable agreement prohibits us from settling any tax audit without Lone Star’s consent (not to be unreasonably withheld, conditioned or delayed) if the outcome of the audit is reasonably expected to affect Lone Star’s rights under the tax receivable agreement. Therefore, Lone Star may determine to withhold consent to a settlement that reduces the payments Lone Star will receive under the tax receivable agreement, even though the settlement might be favorable to us and our stockholders. See “Certain Relationships and Related Party Transactions—Tax Receivable Agreement.”
We will be required to pay Lone Star for certain tax benefits, and these amounts are expected to be material.
In connection with this offering,the Reorganization, we will enter into a tax receivable agreement with Lone Star that will provide for the payment by us to Lone Star of %85% of the amount of cash savings, if any, in U.S. federal, state, local and non-U.S. income tax that we and our subsidiaries realize (or in some circumstances are deemed to realize) as a result of the utilization of certain pre-offering tax benefits, together with interest accrued at a rate of LIBOR plus 100 basis points from the date the applicable tax return is due (without extension) until paid. See “Certain Relationships and Related Party Transactions—Tax Receivable Agreement.” These pre-offering tax benefits, which we collectively refer to as the Pre-IPOCovered Tax Benefits, include: (i) all depreciation and amortization deductions, and any offset to taxable income and gain or increase to taxable loss, resulting from the tax attributesbasis that resulted from certain transactions undertaken by us prior towe have in our assets as of the time of the consummation of this offering, and that are attributable to the existing tax basis of our and our subsidiaries’ assets, (ii) the utilization of our and our subsidiaries’ net operating losses and tax credits, if any, attributable to periods prior to this offering, (iii) deductions in respect of payments made, funded or reimbursed by an initial party to the tax receivable agreement (other than us or one of our subsidiaries) or an affiliate thereof to participants under the LSF9 Concrete Holdings Ltd Long Term Incentive Plan, (iv) deductions in respect of transaction expenses attributable to the U.S. Pipe Acquisition and (iii)(v) certain other tax attributesbenefits attributable to periods prior topayments made under the tax receivable agreement. The tax receivable agreement will become binding on us upon the completion of this offering.offering and will remain in effect until all Covered Tax Benefits have been used or expired, unless the agreement is terminated early, as described below.
We expect that the payments we make under the tax receivable agreement could be substantial. Assuming no material changes in the relevant tax law, and that we and our subsidiaries earn sufficient income to realize the full tax benefits subject to the tax receivable agreement, we currently estimate that future payments under the agreement will aggregate to between $$114.0 million and $$124.0 million. This amount, as well as the amount of tax receivable agreement liability reflected in our pro forma financial statements, excludes any payments that may be made to Lone Star under the tax receivable agreement as a result of tax benefits recognized in connection with payments under the LSF9 Concrete Holdings Ltd Long Term Incentive Plan and, thus, the actual payments we ultimately are required to make under the tax receivable agreement could be greater, potentially materially greater, than these amounts. These payment obligations are our obligations and are not obligations of any of our subsidiaries. Furthermore, these payment obligations are not conditioned upon Lone Star maintaining a continued direct or indirect ownership interest in us. The actual utilization of Pre-IPOCovered Tax Benefits as well as the timing of any payments under the tax receivable agreement will vary depending upon a number of factors, including the amount, character and timing of our and our subsidiaries’ taxable income in the future.
We will not be reimbursed for any payments made to Lone Star under the tax receivable agreement in the event that the tax benefits are disallowed.
Lone Star will not reimburse us for any payments previously made under the tax receivable agreement if such benefits are subsequently disallowed upon a successful challenge by the Internal Revenue Service, although future payments under the agreement would be adjusted to the extent
possible to reflect the result of such disallowance. As a result, in certain circumstances, payments could be made under the tax receivable agreement in excess of our cash tax savings if any, from the Pre-IPOCovered Tax Benefits, and we may not be able to recoup those payments, which could adversely affect our liquidity.
In certain cases, payments made by us under the tax receivable agreement may be accelerated and/or significantly exceed the actual benefits we realize in respect of the Pre-IPOCovered Tax Benefits.
The term of the tax receivable agreement will continue until all Pre-IPOCovered Tax Benefits have been utilized or expired, unless we exercise our right to terminate the agreement with Lone Star’s consent, we breach any of our material obligations under the agreement or certain credit events occur with respect to us, in any of which cases we will be required to make aan accelerated payment to Lone Star equal to the present value of future payments under the tax receivable agreement. Such payment would be based on certain assumptions, including, those relating to ouramong others, that we and our subsidiaries’ futuresubsidiaries would generate sufficient taxable income.income and tax liability to fully utilize all Covered Tax Benefits. The tax receivable agreement also provides that upon certain mergers, asset sales, other forms of business combinations or other changes of control, our (or our successor’s) payments under the tax receivable agreement for each taxable year after any such event would be based on certain valuation assumptions, including the assumption that we and our subsidiaries have sufficient taxable income to fully utilize the Pre-IPOCovered Tax Benefits. Accordingly, payments under the tax receivable agreement may be made years in advance of the actual realization, if any, of the anticipated future tax benefits and may be significantly greater than the benefits we realize in respect of the Pre-IPOCovered Tax Benefits.
Even if the payments under the tax receivable agreement are not accelerated as described above, such payments may be significantly greater than the benefits we realize in respect of the Pre-IPOCovered Tax Benefits, due to the manner in which payments are calculated under the tax receivable agreement. For example, for purposes of calculating the payments to be made to Lone Star, Star:
Because of the foregoing, our obligations under the tax receivable agreement could have a substantial negative impact on our liquidity and could have the effect of delaying, deferring or preventing certain mergers, asset sales, other forms of business combinations or other changes of control.
Certain provisions of the tax receivable agreement limit our ability to incur additional indebtedness, which could adversely affect our business and growth strategy.
For so long as the tax receivable agreement remains outstanding, without the prior written consent of Lone Star (not to be unreasonably withheld, conditioned or delayed), (a) we will be prohibited from entering into any agreement that would be materially more restrictive with respect to our ability to make payments under the tax receivable agreement than the terms of our credit agreements to be entered into in connection with the refinancing of our existing indebtedness at the time of this offering and (b) we will be prohibited from incurring any indebtedness for borrowed money if immediately after giving effect to such incurrence and the application of proceeds therefrom, our consolidated net leverage ratio – the ratio of consolidated funded indebtedness for borrowed money less unrestricted cash to consolidated EBITDA – would exceed a certain specified ratio, in each case as calculated pursuant to the tax receivable agreement, unless the incurrence of such indebtedness is permitted by the terms of our credit agreements to be entered into in connection with the refinancing of our existing indebtedness at the time of this offering or any replacement credit agreements to the extent the terms thereof are no less restrictive in this regard than the applicable credit agreement it replaced. These restrictions on the incurrence of debt could adversely affect our business, including by preventing us from pursuing an acquisition or other strategic transaction that we believe is in the best interests of our company and our stockholders, thereby impeding our growth strategy. Lone Star has no fiduciary duties to us when deciding whether to enforce these covenants under the tax receivable agreement. Furthermore, the provision in the tax receivable agreement that requires that we make an accelerated payment to Lone Star equal to the present value of all future payments due under the tax receivable agreement if we breach any of our material obligations under the agreement or certain credit events occur with respect to us, might make it harder for us to obtain financing from third party lenders on favorable terms.
We would be required to make tax gross-up payments to Lone Star if we consummate a corporate inversion or similar transaction that causes payments under the tax receivable agreement to be subject to withholding taxes.
If we were to consummate a change of control transaction that causes us (or our successor) to become a non-U.S. person (e.g., a corporate inversion transaction), and such transaction causes payments under the tax receivable agreement to become subject to withholding taxes, we would be required under the tax receivable agreement to make tax gross-up payments to Lone Star in respect of such withholding taxes in amounts that may exceed the tax savings realized by the Company from the Covered Tax Benefits. Any such tax gross-up payments could have a negative impact on our liquidity and our ability to finance our growth.
Because of Lone Star’s significant ownership and control of us, we could become liable for obligations of Lone Star or its affiliates, including other companies Lone Star owns or controls.
As a result of Lone Star’s current beneficial ownership of 100% of our common stock, a court, applying tests based on common control or otherwise, could determine that Lone Star and its affiliates, including us and other companies Lone Star now or in the future may own or control, constitute a “partnership-in-fact,” a “controlled group” or other similar collective. Such a finding could be used to impose on us and other members of the group joint and several liability for the obligations of any Lone Star affiliate that is part of the group, including in respect of pension liabilities under the Employee Retirement Income Security Act of 1974, as amended, or ERISA, and related laws. These pension liabilities could include an obligation to make ongoing contributions to fund a pension plan for another group member and for any unfunded liabilities that may exist at the time a group member terminates or withdraws from an underfunded single employer or multiemployer pension plan, as well as result in the creation of liens against our assets and the assets of other members of the group. Under this theory,
we could incur significant liabilities for events beyond our control that are not related to or known by us. Additionally, to the extent a group member maintains an underfunded pension plan, ERISA imposes reporting obligations on group members regarding certain events, including if a member ceases to be a member of the controlled group or if it makes certain dividends, distributions or stock repurchases. These reporting obligations could cause us or Lone Star to seek to delay or reconsider pursuing one or more strategic actions with respect to our company or our common stock.
Following this offering, we will be a “controlled company” within the meaning of the applicable stock exchangeNASDAQ rules and, as a result, will qualify for, and intend to rely on, exemptions from certain corporate governance requirements.
Upon completion of this offering, Lone Star will continue to control a majority of the voting power of our outstanding common stock. As a result, we will be a “controlled company” within the meaning of the applicable stock exchangeNASDAQ corporate governance standards. Under the relevant stock exchangeNASDAQ rules, a company of which more than 50% of the voting power is held by a person or group is a “controlled company” and need not comply with certain requirements, including the requirement that a majority of the board of directors consist of independent directors and the requirements that the compensation and nominating and corporate governance committees be composed entirely of independent directors. Following this offering, we intend to utilize these exemptions. As a result, among other things, we may not have a majority of independent directors and our compensation and nominating and corporate governance committees may not consist entirely of independent directors. Accordingly, you will not have the same protections afforded to stockholders of companies that are subject to all of the applicable stock exchangeNASDAQ corporate governance requirements.
Future sales of our common stock in the public market could cause our stock price to fall.
Following completion of this offering, Lone Star will beneficially own approximately 45,369,474 shares or %71.1% of our outstanding shares of common stock (or 43,987,974 shares and %67.5% if the underwriters exercise their option to purchase additional shares in full). We, Lone Star, and our officers and
directors have signed lock-up agreements with the underwriters that will, subject to certain exceptions, restrict the sale of shares of our common stock held by them for 180 days following the date of this prospectus. The underwriters may, without notice except in certain limited circumstances, release all or any portion of the shares of common stock subject to lock-up agreements. See “Underwriting” for a description of these lock-up agreements. The market price of our common stock may decline materially when these restrictions on resale by Lone Star and our other affiliates lapse or if they are waived.
Upon the expiration of the lock-up agreements, all shares held by our affiliates will be eligible for resale in the public market, subject to applicable securities laws, including the Securities Act of 1933, as amended, or the Securities Act. Therefore, unless shares owned by any of our affiliates are registered under the Securities Act, these shares may only be resold into the public markets in accordance with the requirements of an exemption from registration or safe harbor, including Rule 144 and the volume limitations, manner of sale requirements and notice requirements thereof. See “Shares Eligible for Future Sale.” Lone Star will be considered an affiliate of ours after this offering based on their expected share ownership and representation of our board of directors. However, after completion of this offering, pursuant to the terms of a registration rights agreement between Lone Star and us, Lone Star will have the right to demand that we register its shares under the Securities Act as well as the right to include its shares in any registration statement that we file with the Securities and Exchange Commission, or the SEC, subject to certain exceptions. See “Shares Eligible for Future Sale.” Any registration of Lone Star’s shares would enable those shares to be sold in the public market, subject to certain restrictions in the registration rights agreement and the restrictions under the lock-up agreements referred to above. Any sale by Lone Star or other affiliates or any perception in the public markets that such a transaction may occur could cause the market price of our common stock to decline materially.
Following this offering, we intend to file a registration statement on Form S-8 under the Securities Act registering shares under our stock incentive plan. Subject to the terms of the awards pursuant to which these shares may be granted and except for shares held by affiliates who will be subject to the resale restrictions described above, the shares issuable pursuant to our stock incentive plan will be available for sale in the public market immediately after the registration statement is filed. See “Shares Eligible for Future Sale.”
If you purchase shares of common stock sold in this offering, you will experience immediate and substantial dilution and you may suffer additional dilution in the future.
If you purchase shares our common stock in this offering, the value of your shares based on our actual book value will immediately be less than the price you paid. This reduction in the value of your equity is known as dilution. This dilution occurs in large part because Lone Star paid substantially less than the then-equivalent of the initial public offering price when it purchased the Company in the Acquisition. If you purchase shares in this offering, you will suffer, as of ,June 30, 2016, immediate dilution of $$22.07 per share in the net tangible book value after giving effect to the sale of common stock in this offering at an assumed initial public offering price of $$20.00 per share, which is the midpoint of the estimated price range appearing on the cover of this prospectus, less underwriting discounts and commissions and the estimated expenses payable by us, and the application of the net proceeds as described in “Use of Proceeds.” We also expect to grant stock options, restricted stock and other forms of stock-based compensation to our directors, officers and employees and you will experience additional dilution in the future when these equity awards are exercised or vest, as applicable. If we raise funds in the future by issuing additional securities, any newly issued shares or shares issued upon conversion or exercise of such securities will further dilute your ownership.
We have no present intention to pay dividends on our common stock.
We have no present intention to pay dividends on our common stock. Any determination to pay dividends to holders of our common stock will be at the discretion of our board of directors and will depend upon many factors, including our financial condition, results of operations, projections, liquidity, earnings, legal requirements, restrictions in our credit facilities and agreements governing any other indebtedness we may enter into and other factors that our board of directors deems relevant. See “Dividend Policy.” Accordingly, you may need to sell your shares of our common stock to realize a return on your investment, and you may not be able to sell your shares at or above the price you paid for them.
Our ability to raise capital in the future may be limited.
Our business and operations may consume resources faster than we anticipate. In the future, we may need to raise additional funds through the issuance of new equity securities, debt or a combination of both. However, the lapse or waiver of the lock up restrictions discussed above or any sale or perception of a possible sale by Lone Star, and any related decline in the market price of our common stock, could impair our ability to raise capital. Separately, additional financing may not be available on favorable terms, or at all. If adequate funds are not available on acceptable terms, we may be unable to fund our capital requirements. If we issue new debt securities, the debt holders would have rights senior to common stockholders to make claims on our assets, and the terms of any debt could restrict our operations, including our ability to pay dividends on our common stock. If we issue additional equity securities, existing stockholders will experience dilution, and the new equity securities could have rights senior to those of our common stock. Because our decision to issue securities in any future offering will depend on market conditions and other factors beyond our control, we cannot predict or estimate the amount, timing or nature of our future offerings. Thus, our stockholders bear the risk of our future securities offerings reducing the market price of our common stock and diluting their interest.
We are a holding company and depend on the cash flow of our subsidiaries.
We are a holding company with no material assets other than the equity interests of our subsidiaries. Our subsidiaries conduct substantially all of our operations and own substantially all of our assets and intellectual property. Consequently, our cash flow and our ability to meet our obligations and pay any future dividends to our stockholders depends upon the cash flow of our subsidiaries and their ability to make payments, directly or indirectly, to us in the form of dividends, distributions and other payments. Any inability on the part of our subsidiaries to make payments to us could have a material adverse effect on our business, financial condition and results of operations.
Provisions of our amended and restated governing documents, Delaware law and other documents could discourage, delay or prevent a merger or acquisition at a premium price.
Provisions in our amended and restated certificate of incorporation and amended and restated bylaws that we intend to adopt prior to the consummation of this offering may have the effect of delaying or preventing a change of control or changes in our management. For example, our amended and restated certificate of incorporation and amended and restated bylaws will include provisions that:
These provisions may discourage, delay or prevent a merger or acquisition of our company, including a transaction in which the acquirer may offer a premium price for our common stock.
Our amended and restated certificate of incorporation will include an exclusive forum clause, which could limit our stockholders’ ability to obtain a favorable judicial forum for disputes with us.
Our amended and restated certificate of incorporation will provide that, unless we consent in writing to the selection of an alternative forum, the sole and exclusive forum for any stockholder (including any beneficial owner) to bring (i) any derivative action or proceeding brought on our behalf, (ii) any action asserting a claim of breach of a fiduciary duty owed by any of our directors, officers, or employees to us or to our stockholders, (iii) any action asserting a claim arising pursuant to any provision of the Delaware General Corporation Law, or the DGCL, or our certificate of incorporation or bylaws, or (iv) any action asserting a claim governed by the internal affairs doctrine, will be a state court located within the State of Delaware (or, if no state court located within the State of Delaware has jurisdiction, the federal district court for the District of Delaware); in all cases subject to such court having personal jurisdiction over the indispensable parties named as defendants. Any person or entity
purchasing or otherwise acquiring any interest in shares of our capital stock is deemed to have notice of and consented to the foregoing provisions. The exclusive forum clause may limit our stockholders’ ability to obtain a favorable judicial forum for disputes with us. It is also possible that, notwithstanding such exclusive forum clause, a court could rule that such a provision is inapplicable or unenforceable. See “Description of Capital Stock—Exclusive Forum Clause.”
We will incur increased costs and obligations as a result of being a publicly-traded company.
As a company with publicly-traded securities, we will be subject to the requirements of the Securities Exchange Act of 1934, as amended, or the Exchange Act, the Sarbanes-Oxley Act, the Dodd-Frank Wall Street Reform and Consumer Protection Act, theNASDAQ listing requirements of the applicable stock exchange and other applicable securities rules and regulations. These rules and regulations require that we adopt additional controls and procedures and disclosure, corporate governance and other practices thereby significantly increasing our legal, financial and other compliance costs. These new obligations will also make other aspects of our business more difficult, time-consuming or costly and increase demand on our personnel, systems and other resources. For example, to maintain and improve the effectiveness of our disclosure controls and procedures and internal control over financial reporting, we will need to commit significant resources, hire additional staff and provide additional management oversight. Furthermore, as a result of disclosure of information in this prospectus and in our Exchange Act and other filings required of a public company, our business and financial condition will become more visible, which we believe may give some of our competitors who may not be similarly required to disclose this type of information a competitive advantage. In addition to these added costs and burdens, if we are unable to satisfy our obligations as a public company, we could be subject to delisting of our common stock, fines, sanctions, other regulatory actions and civil litigation, any of which could negatively affect the price of our common stock.
This prospectus contains “forward-looking statements.” These forward-looking statements are included throughout this prospectus, including in the sections entitled “Prospectus Summary,” “Risk Factors,” “Use of Proceeds,” “Management’s Discussion and Analysis of Financial Condition and Results of Operations,” “Business” and “Certain Relationships and Related Party Transactions,” and relate to matters such as our industry, business strategy, goals and expectations concerning our market position, future operations, margins, profitability, capital expenditures, liquidity, capital resources and other financial and operating information. We have used the words “approximately,” “anticipate,” “assume,” “believe,” “contemplate,” “continue,” “could,” “estimate,” “expect,” “future,” “intend,” “may,” “plan,” “potential,” “predict,” “project,” “seek,” “should,” “target,” “will” and similar terms and phrases to identify forward-looking statements in this prospectus. All of our forward-looking statements are subject to risks and uncertainties that may cause actual results to differ materially from those that we are expecting, including:
The forward-looking statements contained in this prospectus are based on historical performance and management’s current plans, estimates and expectations in light of information currently available to us and are subject to uncertainty and changes in circumstances. There can be no assurance that future developments affecting us will be those that we have anticipated. Actual results may differ materially from these expectations due to changes in global, regional or local political, economic, business, competitive, market, regulatory and other factors, many of which are beyond our control, as well as the other factors described in the section entitled “Risk Factors.” Additional factors or events that could cause our actual results to differ may also emerge from time to time, and it is not possible for us to predict all of them. Should one or more of these risks or uncertainties materialize, or should any of our assumptions prove to be incorrect, our actual results may vary in material respects from what we may have expressed or implied by these forward-looking statements. We caution that you should not place undue reliance on any of our forward-looking statements. Any forward-looking statement made by us in this prospectus speaks only as of the date on which we make it. We undertake no obligation to publicly update any forward-looking statement, whether as a result of new information, future developments or otherwise, except as may be required by applicable securities laws.
We estimate that our proceeds from this offering will be approximately $$340.0 million, after deducting underwriting discounts and commissions and estimated offering expenses payable by us, based on an assumed offering price of $$20.00 per share, the midpoint of the estimated initial public offering price range set forth on the cover of this prospectus. We intend to use the net proceeds from this offering, including any proceeds received by the Company upon exercise of the underwriters’ option to purchase additional shares, as follows:
The terms of our Junior Term Loan, including the interest rates and maturities thereof, are described in detail in the section entitled “Description of Certain Indebtedness—Junior Term Loan Facility.” Certain of the proceeds of this indebtedness were used to fund some or all of the Cretex Acquisition, the Sherman-Dixie Acquisition, the U.S. Pipe Acquisition and the June 2016 dividend to Lone Star Fund IX (U.S.), L.P. discussed in the section entitled “Dividend Policy.”
Credit Suisse Securities (USA) LLC, Citigroup Global Markets Inc. and Deutsche Bank Securities Inc., each an underwriter in this offering, or their affiliates, are lenders of approximately $0.3 million, $10.5 million and $3.0 million, respectively, under our Junior Term Loan. Such underwriters, or their affiliates, are expected to receive payments in respect of such amounts in connection with the use of the net proceeds we receive in this offering to repay our Junior Term Loan. These amounts represent less than 5%, in the aggregate, of the net proceeds of this offering. See “Underwriting—Conflicts of Interest.”
Pending use of the net proceeds from this offering described above, we may invest the net proceeds in short- and intermediate-term interest-bearing obligations, investment-grade instruments, certificates of deposit or direct or guaranteed obligations of the United States government.
Each $1.00 increase or decrease in the assumed initial public offering price of $$20.00 per share, the midpoint of the estimated initial public offering price range set forth on the cover page of this prospectus, would increase or decrease the net proceeds to us from this offering by approximately $$18.4 million, assuming the number of shares offered, as set forth on the cover page of this prospectus, remains the same, and after deducting underwriting discounts and commissions and estimated offering expenses payable by us.
The selling stockholder will receive approximately $ million (or approximately $$27.6 million if the underwriters exercise in full their option to purchase additional shares)shares in gross proceeds from this offering, based on an assumed offering price of $$20.00 per share, the midpoint of the estimated initial public offering price range set forth on the cover of this prospectus. We will not receive any proceeds from the sale of shares by the selling stockholder.
On June 16,17, 2016, we assumed an incremental borrowing of $345.0 million under the Senior Term Loan that was used to pay a $345.0 million dividend of the same amount to Lone Star Fund IX (U.S.), L.P., or the Debt Recapitalization.
We have no present intention to pay cash dividends on our common stock. Any determination to pay dividends to holders of our common stock will be at the discretion of our board of directors and will depend upon many factors, including our financial condition, results of operations, projections, liquidity, earnings, legal requirements, restrictions in the agreements governing our existing indebtedness and any other indebtedness we may enter into and other factors that our board of directors deems relevant.
The agreements governing our existing indebtedness contain, and debt instruments that we enter into in the future may contain, covenants that place limitations on the amount of dividends we may pay. See the section entitled “Description of Certain Indebtedness.” In addition, under Delaware law, our board of directors may declare dividends only to the extent of our surplus, which is defined as total assets at fair market value minus total liabilities, minus statutory capital, or, if there is no surplus, out of our net profits for the then current and immediately preceding year.
The following table sets forth our cash and cash equivalents and capitalization as of June 30, 2016:
You should read this table together with the information in this prospectus under “Use of Proceeds,” “Selected Historical Financial and Operating Data,” “Unaudited Pro Forma Condensed Combined Financial Information,” “Management’s Discussion and Analysis of Financial Condition and Results of Operations” and “Description of Capital Stock,” and with the combined financial statements and the related notes to those statements included elsewhere in this prospectus.
| As of June 30,2016 | ||||||||||||
| Actual | Pro forma | Pro forma, as adjusted | ||||||||||
| (in thousands, except share data) | ||||||||||||
Cash and cash equivalents | $ | 41,817 | $ | 11,817 | $ | 47,871 | ||||||
|
|
|
|
|
| |||||||
Debt: | ||||||||||||
Revolver(1) | $ | — | $ | 129,050 | $ | 129,050 | ||||||
Junior Term Loan(1) | 238,077 | 238,077 | — | |||||||||
Senior Term Loan(1) | 1,001,700 | 1,001,700 | 965,700 | |||||||||
Financing obligation | 210,934 | — | — | |||||||||
Capital lease liability | — | 3,705 | 3,705 | |||||||||
|
|
|
|
|
| |||||||
Total debt | $ | 1,450,711 | $ | 1,372,532 | $ | 1,098,455 | ||||||
|
|
|
|
|
| |||||||
Stockholders’ equity: | ||||||||||||
Undesignated preferred stock, par value $0.001 per share: no shares authorized, issued or outstanding actual, 10,000,000 shares authorized, no shares issued and outstanding pro forma | — | — | — | |||||||||
Common stock, $0.001 par value per share; 190,000,000 shares authorized, 41,619,472 shares issued and outstanding, actual; 190,000,000 shares authorized, 63,789,474 shares issued and outstanding, pro forma | — | 45 | 64 | |||||||||
Contributed capital | 254,918 | 100,780 | 319,098 | |||||||||
Accumulated other comprehensive loss | (1,418 | ) | (1,418 | ) | (1,418 | ) | ||||||
Retained deficit | (50,033 | ) | (68,718 | ) | (98,441 | ) | ||||||
|
|
|
|
|
| |||||||
Total stockholders’ equity | 203,467 | 30,689 | 219,303 | |||||||||
|
|
|
|
|
| |||||||
Total capitalization | $ | 1,654,178 | $ | 1,403,221 | $ | 1,317,758 | ||||||
|
|
|
|
|
| |||||||
| (1) | ||||||||||||
| As of October 3, 2016, | ||||||||||||
| ||||||||||||
| ||||||||||||
$1,035.7 million of outstanding principal on the Revolver, | ||||||||||||
Junior Term Loan, | ||||||||||||
and Senior Term Loan, | ||||||||||||
| ||||||||||||
| ||||||||||||
| ||||||||||||
| ||||||||||||
| ||||||||||||
| ||||||||||||
| ||||||||||||
| ||||||||||||
| ||||||||||||
| respectively. | ||||||||||||
Dilution represents the difference between the amount per share paid by investors in this offering and the as adjusted net tangible book value per share of our common stock immediately after this offering. The data in this section have been derived from our condensed combined balance sheet as of March 31,June 30, 2016. Net tangible book value per share is equal to our total tangible assets less the amount of our total liabilities, divided by the sum of the number of our shares of common stock outstanding. Our net tangible book value as of March 31,June 30, 2016 was $$(471.9) million, or $$(10.40) per share of common stock.
After giving effect to our receipt of the estimated net proceeds from our sale of common stock in this offering, based on an assumed offering price of $$20.00 per share, the midpoint of the estimated initial public offering price range set forth on the cover page of this prospectus, and after deducting the underwriting discounts and commissions and other estimated offering expenses payable by us and the application of such proceeds as described in the section entitled “Use of Proceeds,” our net tangible book value, pro forma, as of March 31,June 30, 2016 would have been $$(132.1) million, or $$(2.07) per share of common stock. This represents an immediate increase in net tangible book value to our existing stockholders of $$8.33 per share and an immediate dilution to new investors in this offering of $$22.07 per share. The following table illustrates this per share dilution:
| ||||
| ||||
| ||||
| ||||
| ||||
Assumed initial public offering price per share | $ | 20.00 | ||||||
Net tangible book value per share of common stock as of June 30, 2016 | $ | (10.40 | ) | |||||
Pro forma increase in net tangible book value per share attributable to new investors | $ | 8.33 | ||||||
Pro forma net tangible book value per share after the offering | $ | (2.07 | ) | |||||
|
| |||||||
Dilution per share to new investors | $ | 22.07 | ||||||
|
|
The following table shows on a pro forma basis at March 31,June 30, 2016, after giving effect to the stock splitStock Split, which occurred on October 6, 2016, and the Reorganization, which will occur prior to the consummation of this offering, the total cash consideration paid to us and the average price per share paid by Lone Star and by new investors in this offering before deducting underwriting discounts and estimated offering expenses payable by us.
| Shares purchased | Total consideration | Average price per share | Shares purchased | Total consideration | Average price per share | |||||||||||||||||||||||||||||||
(in millions, except share and per share data) | Number | % | Number | % | ||||||||||||||||||||||||||||||||
LSF9 Concrete Mid-Holdings Ltd | % | % | $ | |||||||||||||||||||||||||||||||||
(in thousands, except share and per share data) | Number | % | Number | % | Average price per share | |||||||||||||||||||||||||||||||
Forterra US Holdings, LLC | 45,369,474 | 71.1 | % | $ | 203,467 | 35.6 | % | |||||||||||||||||||||||||||||
New investors | % | % | $ | 18,420,000 | 28.9 | % | $ | 368,400 | 64.4 | % | $ | 20.00 | ||||||||||||||||||||||||
|
|
|
|
|
|
|
|
|
| |||||||||||||||||||||||||||
Total | 100 | % | 100 | % | $ | 63,789,474 | 100 | % | $ | 571,867 | 100 | % | $ | 8.96 | ||||||||||||||||||||||
The information in the preceding table is based on an assumed offering price of $$20.00 per share, the midpoint of the estimated initial public offering price range set forth on the cover page of this prospectus. A $1.00 increase or decrease in the assumed initial public offering price per share would increase or decrease, respectively, the pro forma net tangible book value per share of common stock after this offering by $$17.5 million and increase or decrease the dilution per share of common stock to new investors in this offering by $$0.27 per share, in each case calculated as described above and assuming that the number of shares offered by us, as set forth on the cover page of this prospectus, remains the same.
If the underwriters exercise their option to purchase additional shares in full, Lone Star would own approximately %67.5% and our new investors would own approximately %32.5% of the total number of shares of our common stock outstanding immediately after this offering (or %71.1% and %,28.9%, respectively, if the underwriters do not exercise in full their option to purchase additional shares), based on shares outstanding after this offering.
An aggregate of 5,000,000 additional shares of our common stock will initially be available for future awards under the equity incentive plan that we intend to implement in connection with this offering and are not included in the above discussion and table. To the extent that we grant awards in the future with exercise prices below the initial public offering price in this offering, investors purchasing in this offering will incur additional dilution. See “Shares Eligible for Future Sale.”
SELECTED HISTORICAL FINANCIAL DATA
The following selected combined financial data should be read in conjunction with “Capitalization,” “Unaudited Pro Forma Condensed Combined Financial Information,” “Management’s Discussion and Analysis of Financial Condition and Results of Operations,” “Certain Relationships and Related Party Transactions” and “Description of Certain Indebtedness,” our audited and unaudited condensed combined financial statements and the related notes and the other financial information included elsewhere in this prospectus.
The following tables set forth, for the periods and dates indicated, our selected historical financial data. The accompanying historical financial statements are presented for the “Predecessor,” which are the combined financial statements of HeidelbergCement’s building products business in the United States and Eastern Canada for the period preceding the Acquisition, and the “Successor,” which are the combined financial statements of the Company and subsidiaries for the period following the Acquisition. The Predecessor’s combined statements of operations data for the years ended December 31, 2011 and 2012 and the Predecessor’s combined balance sheet data as of December 31, 2011 and 2012 have been derived from the audited combined financial statements of HeidelbergCement’s building products business in the United States and Eastern Canada, which are not included elsewhere in this prospectus. The Predecessor’s combined statements of operations data for the years ended December 31, 2013 and 2014 and the period from January 1, 2015 through March 13, 2015 and the Predecessor’s combined balance sheet data as of December 31, 2014 have been derived from the audited combined financial statements of HeidelbergCement’s building products business in the United States and Eastern Canada, which are included elsewhere in this prospectus. The Successor’s combined statements of operations data for the period from March 14, 2015 through December 31, 2015 and balance sheet data as of December 31, 2015 have been derived from our audited combined financial statements, which are included elsewhere in this prospectus. The Successor’s combined balance sheet data as of March 31,June 30, 2016 and combined statements of operations data for the period from March 14, 2015 through March 31,June 30, 2015 and the threesix months ended March 31,June 30, 2016 are derived from our unaudited condensed combined financial statements, which are included elsewhere in this prospectus.
The Predecessor’s financial statements may not necessarily be indicative of our cost structure, financial position, results of operations or cash flows that would have existed if HeidelbergCement’s building products business in the United States and Eastern Canada operated as a stand-alone, independent business. Accordingly, the historical results should not be relied upon as an indicator of our future performance. The Acquisition was accounted for as a business combination, which resulted in a new basis of accounting. The Predecessor’s and the Successor’s financial statements are not comparable as a result of applying a new basis of accounting. See the notes to our audited combined financial statements for additional information regarding the accounting treatment of the Acquisition. In the opinion of management, the unaudited interim financial statements include all adjustments, consisting of normal recurring adjustments, necessary for a fair presentation of our financial position and operating results for these periods and as of such date. Results from interim periods are not necessarily indicative of results that may be expected for the entire year and historical results are not indicative of the results to be expected in the future. The selected financial data presented below represent portions of our financial statements and are not complete.
| (in thousands) | (in thousands) | |||||||||||||||||||||||||||||||||||||||||||||||||||||||||||||||||||||
| Successor | Predecessor | Successor | Predecessor | |||||||||||||||||||||||||||||||||||||||||||||||||||||||||||||||||||
(in thousands) | Three months ended March 31, 2016 | For the period from March 14, 2015 to March 31, 2015 | For the period from March 14, 2015 to December 31, 2015 | For the period from January 1, 2015 to March 13, 2015 | Year ended December 31, 2014 | Year ended December 31, 2013 | Year ended December 31, 2012 | Year ended December 31, 2011 | Six months ended June 30, 2016 | For the period from March 14, 2015 to June 30, 2015 | For the period from March 14, 2015 to December 31, 2015 | For the period from January 1, 2015 to March 13, 2015 | Year ended December 31, 2014 | Year ended December 31, 2013 | Year ended December 31, 2012 | Year ended December 31, 2011 | ||||||||||||||||||||||||||||||||||||||||||||||||||||||
Statement of Operations Data: | ||||||||||||||||||||||||||||||||||||||||||||||||||||||||||||||||||||||
Net sales | $ | 217,334 | $ | 38,014 | $ | 722,664 | $ | 132,620 | $ | 736,963 | $ | 697,948 | $ | 760,208 | $ | 796,586 | $ | 640,142 | $ | 251,315 | $ | 722,664 | $ | 132,620 | $ | 736,963 | $ | 697,948 | $ | 760,208 | $ | 796,586 | ||||||||||||||||||||||||||||||||||||||
Cost of goods sold | (179,403 | ) | (35,324 | ) | (626,498 | ) | (117,831 | ) | (631,454 | ) | (611,660 | ) | (688,088 | ) | (712,062 | ) | (509,370 | ) | (228,405 | ) | (626,498 | ) | (117,831 | ) | (631,454 | ) | (611,660 | ) | (688,088 | ) | (712,062 | ) | ||||||||||||||||||||||||||||||||||||||
|
|
|
|
|
|
|
|
|
|
|
|
|
|
|
| |||||||||||||||||||||||||||||||||||||||||||||||||||||||
Gross Profit | 37,931 | 2,690 | 96,166 | 14,789 | 105,509 | 86,288 | 72,120 | 84,524 | 130,772 | 22,910 | 96,166 | 14,789 | 105,509 | 86,288 | 72,120 | 84,524 | ||||||||||||||||||||||||||||||||||||||||||||||||||||||
|
|
|
|
|
|
|
|
|
|
|
|
|
|
|
| |||||||||||||||||||||||||||||||||||||||||||||||||||||||
Selling, general and administrative expenses | (37,945 | ) | (18,722 | ) | (134,971 | ) | (21,683 | ) | (102,107 | ) | (87,393 | ) | (99,939 | ) | (99,603 | ) | (98,622 | ) | (47,716 | ) | (134,971 | ) | (21,683 | ) | (102,107 | ) | (87,393 | ) | (99,939 | ) | (99,603 | ) | ||||||||||||||||||||||||||||||||||||||
Impairment and restructuring charges | — | 8 | (1,185 | ) | (542 | ) | (4,219 | ) | (250,577 | ) | (15,267 | ) | (6,716 | ) | (23 | ) | (343 | ) | (1,185 | ) | (542 | ) | (4,219 | ) | (250,577 | ) | (15,267 | ) | (6,716 | ) | ||||||||||||||||||||||||||||||||||||||||
Earnings from equity method investee | 1,303 | 115 | 8,429 | 67 | 4,451 | (216 | ) | (870 | ) | — | 4,868 | 3,772 | 8,429 | 67 | 4,451 | (216 | ) | (870 | ) | — | ||||||||||||||||||||||||||||||||||||||||||||||||||
Other operating income | 1,778 | 813 | 832 | 994 | 6,965 | 9,232 | (803 | ) | 865 | 2,533 | 3,930 | 832 | 994 | 6,965 | 9,232 | 635 | 91 | |||||||||||||||||||||||||||||||||||||||||||||||||||||
Interest expense | (17,290 | ) | (2,474 | ) | (45,953 | ) | (84 | ) | — | — | — | — | (42,129 | ) | (15,551 | ) | (45,953 | ) | (84 | ) | — | — | — | — | ||||||||||||||||||||||||||||||||||||||||||||||
Other income (expense), net | (81 | ) | — | (326 | ) | (39 | ) | (594 | ) | 947 | 10,087 | 6,946 | (1,179 | ) | (140 | ) | (326 | ) | (39 | ) | (594 | ) | 947 | 8,649 | 7,721 | |||||||||||||||||||||||||||||||||||||||||||||
Net income (loss) before taxes | (14,304 | ) | (17,570 | ) | (77,008 | ) | (6,498 | ) | 10,005 | (241,719 | ) | (34,672 | ) | (13,984 | ) | |||||||||||||||||||||||||||||||||||||||||||||||||||||||
Income (loss) from continuing operations before income taxes | (3,780 | ) | (33,138 | ) | (77,008 | ) | (6,498 | ) | 10,005 | (241,719 | ) | (34,672 | ) | (13,984 | ) | |||||||||||||||||||||||||||||||||||||||||||||||||||||||
Income tax (expense) benefit | 10,368 | — | (5,778 | ) | 742 | (2,417 | ) | (2,561 | ) | (6,843 | ) | (14,794 | ) | 36,533 | (1,579 | ) | (5,778 | ) | 742 | (2,417 | ) | (2,561 | ) | (6,843 | ) | (14,794 | ) | |||||||||||||||||||||||||||||||||||||||||||
Income (loss) from continuing operations | (3,936 | ) | (17,570 | ) | (82,786 | ) | (5,756 | ) | 7,588 | (244,280 | ) | (41,515 | ) | (28,778 | ) | 32,753 | (34,717 | ) | (82,786 | ) | (5,756 | ) | 7,588 | (244,280 | ) | (41,515 | ) | (28,778 | ) | |||||||||||||||||||||||||||||||||||||||||
Discontinued Operations | — | — | — | — | 1,260 | (3,018 | ) | (20,150 | ) | (8,832 | ) | — | — | — | — | 1,260 | (3,018 | ) | (20,150 | ) | (8,832 | ) | ||||||||||||||||||||||||||||||||||||||||||||||||
Net income (loss) | $ | (3,936 | ) | $ | (17,570 | ) | $ | (82,786 | ) | $ | (5,756 | ) | $ | 8,848 | $ | (247,298 | ) | $ | (61,665 | ) | $ | (37,610 | ) | $ | 32,753 | $ | (34,717 | ) | $ | (82,786 | ) | $ | (5,756 | ) | $ | 8,848 | $ | (247,298 | ) | $ | (61,665 | ) | $ | (37,610 | ) | |||||||||||||||||||||||||
Statements of Cash Flows Data: | ||||||||||||||||||||||||||||||||||||||||||||||||||||||||||||||||||||||
Net cash provided by (used in) operating activities | $ | (35,834 | ) | $ | 19,891 | $ | 121,417 | $ | (48,224 | ) | $ | 25,918 | $ | 31,686 | $ | (6,366 | ) | $ | (37 | ) | $ | 121,417 | $ | (48,224 | ) | $ | 25,918 | $ | 31,686 | |||||||||||||||||||||||||||||||||||||||||
Net cash provided by (used in) investing activities | (73,501 | ) | (640,428 | ) | (898,039 | ) | (2,762 | ) | (1,901 | ) | (55 | ) | (858,201 | ) | (643,160 | ) | (898,039 | ) | (2,762 | ) | (1,901 | ) | (55 | ) | ||||||||||||||||||||||||||||||||||||||||||||||
Net cash provided by (used in) financing activities | $ | 77,809 | $ | 660,410 | $ | 822,580 | $ | 60,907 | $ | (23,990 | ) | $ | (31,636 | ) | $ | 861,868 | $ | 665,629 | $ | 822,580 | $ | 60,907 | $ | (23,990 | ) | $ | (31,636 | ) | ||||||||||||||||||||||||||||||||||||||||||
Balance Sheet Data: | ||||||||||||||||||||||||||||||||||||||||||||||||||||||||||||||||||||||
Cash and cash equivalents | $ | 11,803 | $ | 43,590 | $ | 42 | $ | 5 | $ | 10 | $ | 15 | $ | 41,817 | $ | 43,590 | $ | 42 | $ | 5 | $ | 10 | $ | 15 | ||||||||||||||||||||||||||||||||||||||||||||||
Property, plant & equipment, net | 418,499 | 388,924 | 414,073 | 423,826 | 471,161 | 558,251 | 648,621 | 388,924 | 414,073 | 423,826 | 471,161 | 558,251 | ||||||||||||||||||||||||||||||||||||||||||||||||||||||||||
Total assets | 1,002,883 | 938,875 | 846,168 | 864,842 | 1,187,826 | 1,295,666 | 2,034,110 | 938,875 | 846,168 | 864,842 | 1,187,826 | 1,295,666 | ||||||||||||||||||||||||||||||||||||||||||||||||||||||||||
Total debt | 724,315 | 705,829 | — | — | — | — | 1,450,711 | 705,829 | — | — | — | — | ||||||||||||||||||||||||||||||||||||||||||||||||||||||||||
Total parent company net investment | — | — | 657,473 | 700,938 | 984,404 | 1,096,396 | — | — | 657,473 | 700,938 | 984,404 | 1,096,396 | ||||||||||||||||||||||||||||||||||||||||||||||||||||||||||
Shareholder’s equity | 104,531 | 52,315 | — | — | — | — | 203,467 | 52,315 | — | — | — | — | ||||||||||||||||||||||||||||||||||||||||||||||||||||||||||
UNAUDITED PRO FORMA CONDENSED COMBINED FINANCIAL INFORMATION
The following unaudited pro forma condensed combined financial information and the related notes present our unaudited pro forma condensed combined statements of operations for the threesix months ended March 31,June 30, 2016 and 2015 and for the year ended December 31, 2015, and our unaudited pro forma condensed combined balance sheet data as of March 31,June 30, 2016. The unaudited pro forma condensed combined financial information has been derived by aggregating our audited and unaudited historical combined financial statements, and the historical financial statements of U.S. Pipe, each included elsewhere in this prospectus, and making certain pro forma adjustments to such aggregated financial information to give effect to the transactions defined below, collectively the Transactions:
The Transactions, along with the assumptions and estimates underlying the adjustments to the unaudited pro forma condensed combined financial information, are described in more detail in the accompanying notes, which should be read together with the unaudited pro forma condensed combined financial information.
The table below provides the date each Transaction closed, the date and/or periods each Transaction has been reflected in our historical financial statements and the date and/or periods each Transaction is shown in the unaudited pro forma condensed combined financial information giving effect to the Transactions as if they had occurred on the dates shown.
Transaction | Transaction Close | Balance Sheet | Period | Balance Sheet | Pro forma | |||||||||
Acquisition | March 13, 2015 | As of | March 14, 2015 through | January 1, 2015 through March 13, 2015 | January 1, 2015 | |||||||||
Cretex Acquisition | October 1, 2015 | As of | October 1, 2015 through | January 1, 2015 through September 30, 2015 | January 1, 2015 | |||||||||
Sherman-Dixie Acquisition | January 29, 2016 | As of | January 30, 2016 through | January 1, 2015 through January 29, 2016 | January 1, 2015 | |||||||||
U.S. Pipe Acquisition | April 15, 2016 | As of June 30, 2016 | April 15, 2016 through June 30, 2016 | January 1, 2015 through April 14, 2016 | January 1, 2015 | |||||||||
Bio Clean Acquisition | August 4, 2016 | Not included | Not included | As of | January 1, 2015 (Income Statement) and | |||||||||
J&G Acquisition | Prior to December 31, 2016 | Not included | Not included | As of June 30, 2016 and for period January 1, 2015 through June 30, 2016 | January 1, 2015 (Income Statement) and June 30, 2016 (Balance Sheet) | |||||||||
Precast Concepts Acquisition | Prior to December 31, 2016 | Not included | Not included | As of June 30, 2016 and for period January 1, 2015 through June 30, 2016 | January 1, 2015 (Income Statement) and June 30, 2016 (Balance Sheet) | |||||||||
Bricks Disposition | Prior to the offering closing date | Not included | Not included | As of June 30, 2016 and for period January 1, 2015 through June 30, 2016 | January 1, 2015 (Income Statement) and June 30, 2016 (Balance Sheet) | |||||||||
Sale Leaseback | April 5, 2016 and April 14, 2016 | April 5, 2016 through June 30, 2016 | January 1, 2015 | |||||||||||
Debt Recapitalization | June | As of | June 17, 2016 through June 30, 2016 | January 1, 2015 through | January 1, 2015 | |||||||||
Offering | Upon the offering closing date | Not included | Not included | As of | January 1, 2015 (Income Statement) and | |||||||||
The unaudited pro forma condensed combined balance sheet as of March 31,June 30, 2016 and unaudited pro forma condensed combined statements of operations for the threesix months ended March 31,June 30, 2016 and 2015 and for the year ended December 31, 2015 have been prepared in accordance with Article 11 of Regulation S-X, using the assumptions set forth in the notes to the unaudited pro forma condensed combined financial information. The information provided for the threesix month period ended March 31,June 30, 2015 reflects a period for which pro forma information under Article 11 of Regulation S-X is not required to be presented herein. However, the information provided for this period has been included to provide additional information and comparable analysis to our historical and pro forma results of operations for the threesix months ended March 31,June 30, 2016 given the significant impact of these Transactions on our business. Also included in the notes to the unaudited pro forma condensed combined financial information is a note setting forth certain pro forma combined operating results by segment for the comparable periods.
The unaudited pro forma condensed combined financial information has been presented for illustrative purposes only and is based upon available information and reflects estimates and certain assumptions made by our management that we believe are reasonable. Actual adjustments may differ
materially from the information presented herein. The unaudited pro forma condensed combined financial information does not purport to represent what our combined results of operations and financial position would have been had the Transactions occurred on the dates indicated. They are also not intended to project our combined results of operations or financial position for any future period or date.
The unaudited pro forma condensed combined financial information does not reflect any additional costs that may arise from being a public company or the realization of any expected cost savings, operating efficiencies or other synergies that may result from the Transactions as a result of restructuring activities or other planned cost savings initiatives following the completion of the Transactions, unless such costs have been realized in the historical financial statements.
The pro forma financial statements should be read in conjunction with “Capitalization,” “Selected Historical Financial Data,” “Management’s Discussion and Analysis of Financial Condition and Results of Operations,” “Certain Relationships and Related Party Transactions,” “Description of Certain Indebtedness” and our audited and unaudited condensed combined financial statements and the related notes and the other financial information included elsewhere in this prospectus.
We have calculated pro forma earnings per share assuming a total of 63,789,474 shares of common stock outstanding after the consummation of this offering. Since we are a combination of entities under common control and did not have any share capital as of March 31,June 30, 2016, we have not calculated earnings per share on a historical basis.
Forterra, Inc.
Unaudited Pro Forma Condensed Combined Statement of Operations
For the ThreeSix Months Ended March 31,June 30, 2016
(In Thousands, Except Per Share Data)
| Pro Forma Adjustments | Pro Forma Adjustments | |||||||||||||||||||||||||||||||||||||||||||||||||||||||||||||||||||||||||||||||||||||||||||||||
| Forterra Historical | U.S. Pipe Historical | Sherman- Dixie Acquisition (4) | U.S. Pipe Acquisition (5) | Sale Leaseback (6) | Debt Recapitalization (7) | Offering (8) | Pro Forma Combined1 | Forterra Historical | Sherman- Dixie Acquisition (4) | U.S. Pipe Acquisition (5) | Other Acquisitions (6) | Bricks Disposition (7) | �� | Sale Leaseback (8) | Debt Recapitalization (9) | Offering (10) | Pro Forma Combined | |||||||||||||||||||||||||||||||||||||||||||||||||||||||||||||||||||||||||||||||
Net sales | $ | 217,334 | $ | 141,856 | $ | 2,893 | 4(a) | $ | — | $ | — | $ | — | $ | — | $ | 362,083 | $ | 640,142 | $ | 2,893 | 4(a) | $ | 173,418 | 5(a) | $ | 38,083 | 6(a) | $ | (71,424 | ) | 7(a) | $ | — | $ | — | $ | — | $ | 783,112 | ||||||||||||||||||||||||||||||||||||||||||||||||||||||||
Cost of goods sold | 179,403 | 115,956 | 2,503 | 4(a) | (2,181 | ) | 5(e) | — | — | — | 295,772 | 509,370 | 2,503 | 4(a) | 146,103 | 5(a) | 23,813 | 6(a) | (59,432 | ) | 7(a) | 8,188 | 8(a) | — | — | 628,627 | ||||||||||||||||||||||||||||||||||||||||||||||||||||||||||||||||||||||
| 91 | 4(b) | 91 | 4(b) | (2,009 | ) | 5(b) | — | — | ||||||||||||||||||||||||||||||||||||||||||||||||||||||||||||||||||||||||||||||||||||||||
|
|
|
|
|
|
|
|
|
|
|
|
|
|
|
|
| ||||||||||||||||||||||||||||||||||||||||||||||||||||||||||||||||||||||||||||||||
Gross profit | $ | 37,931 | $ | 25,900 | $ | 299 | $ | 2,181 | $ | — | $ | — | $ | — | $ | 66,311 | $ | 130,772 | $ | 299 | $ | 29,324 | $ | 14,270 | $ | (11,992 | ) | $ | (8,188 | ) | $ | — | $ | — | $ | 154,485 | ||||||||||||||||||||||||||||||||||||||||||||||||||||||||||||
Selling, general & administrative expenses | (37,945 | ) | (13,587 | ) | (795 | ) | 4(a) | (7,968 | ) | 5(f) | — | — | — | (60,415 | ) | (98,622 | ) | (795 | ) | 4(a) | (11,340 | ) | 5(a) | (6,561 | ) | 6(a) | 7,904 | 7(a) | — | — | — | (118,809 | ) | |||||||||||||||||||||||||||||||||||||||||||||||||||||||||||||||
| (120 | ) | 4(c) | (120 | ) | 4(c) | (9,275 | ) | 5(c) | ||||||||||||||||||||||||||||||||||||||||||||||||||||||||||||||||||||||||||||||||||||||||
Other operating income (expenses) | 3,081 | — | — | — | — | — | — | 3,081 | ||||||||||||||||||||||||||||||||||||||||||||||||||||||||||||||||||||||||||||||||||||||||
Other operating income (expense), net | 7,378 | — | (8 | ) | — | 812 | 7(a) | 1,062 | 8(a) | — | — | 9,244 | ||||||||||||||||||||||||||||||||||||||||||||||||||||||||||||||||||||||||||||||||||||
|
|
|
|
|
|
|
|
|
|
|
|
|
|
|
|
| ||||||||||||||||||||||||||||||||||||||||||||||||||||||||||||||||||||||||||||||||
Income (loss) from operations | $ | 3,067 | $ | 12,313 | $ | (616 | ) | $ | (5,787 | ) | $ | — | $ | — | $ | — | $ | 8,977 | $ | 39,528 | $ | (616 | ) | $ | 8,701 | $ | 7,709 | $ | (3,276 | ) | $ | (7,126 | ) | $ | — | $ | — | $ | 44,920 | |||||||||||||||||||||||||||||||||||||||||||||||||||||||||
Other income (expenses) | ||||||||||||||||||||||||||||||||||||||||||||||||||||||||||||||||||||||||||||||||||||||||||||||||
Interest expense | (17,290 | ) | (5,649 | ) | (125 | ) | 4(d) | 2,673 | 5(g) | (4,327 | ) | (5,839 | ) | — | (30,557 | ) | (42,129 | ) | 36 | 4(d) | 2,739 | 5(d) | (793 | ) | 6(a) | — | 3,837 | 8(a) | (10,705 | ) | 16,602 | (30,413 | ) | |||||||||||||||||||||||||||||||||||||||||||||||||||||||||||||||
Other income (expenses), net | (81 | ) | 102 | 2 | — | — | — | — | 23 | (1,179 | ) | 2 | 102 | 5(a) | 72 | — | — | — | — | (1,003 | ) | |||||||||||||||||||||||||||||||||||||||||||||||||||||||||||||||||||||||||||
|
|
|
|
|
|
|
|
|
|
|
|
|
|
|
|
| ||||||||||||||||||||||||||||||||||||||||||||||||||||||||||||||||||||||||||||||||
Income (loss) from continuing operations before income taxes | (14,304 | ) | 6,766 | (739 | ) | (3,114 | ) | (4,327 | ) | (5,839 | ) | — | �� | (21,557 | ) | (3,780 | ) | (578 | ) | 11,542 | 6,988 | (3,276 | ) | (3,289 | ) | (10,705 | ) | 16,602 | 13,504 | |||||||||||||||||||||||||||||||||||||||||||||||||||||||||||||||||||
Income tax (expense) benefit | 10,368 | (2,226 | ) | — | 4(e) | — | 5(j) | — | — | — | 8,142 | 36,533 | — | 4(e) | (3,726 | ) | 5(a) | (2,586 | ) | 6(a) | 688 | 7(a) | 1,217 | 8(a) | — | (6,143 | ) | 25,983 | ||||||||||||||||||||||||||||||||||||||||||||||||||||||||||||||||||||
Less: Net income/(loss) from noncontrolling interest | — | 500 | — | (500 | ) | — | — | — | ||||||||||||||||||||||||||||||||||||||||||||||||||||||||||||||||||||||||||||||||||||||||
|
|
|
|
|
|
|
|
|
|
|
|
|
|
|
|
| ||||||||||||||||||||||||||||||||||||||||||||||||||||||||||||||||||||||||||||||||
Net income (loss) | $ | (3,936 | ) | $ | 4,040 | $ | (739 | ) | $ | (2,614 | ) | $ | (4,327 | ) | $ | (5,839 | ) | $ | — | $ | (13,415 | ) | ||||||||||||||||||||||||||||||||||||||||||||||||||||||||||||||||||||||||||
Income (loss) from continuing operations | $ | 32,753 | $ | (578 | ) | $ | 7,816 | $ | 4,402 | $ | (2,588 | ) | $ | (2,072 | ) | $ | (10,705 | ) | $ | 10,459 | $ | 39,487 | ||||||||||||||||||||||||||||||||||||||||||||||||||||||||||||||||||||||||||
|
|
|
|
|
|
|
|
|
|
|
|
|
|
|
|
| ||||||||||||||||||||||||||||||||||||||||||||||||||||||||||||||||||||||||||||||||
Pro forma net loss per share—basic and diluted |
| — | ||||||||||||||||||||||||||||||||||||||||||||||||||||||||||||||||||||||||||||||||||||||||||||||
Pro forma common shares outstanding—basic and diluted |
| — | ||||||||||||||||||||||||||||||||||||||||||||||||||||||||||||||||||||||||||||||||||||||||||||||
Pro forma net income per share: | Pro forma net income per share: |
| ||||||||||||||||||||||||||||||||||||||||||||||||||||||||||||||||||||||||||||||||||||||||||||||
Basic | $ | 0.62 | ||||||||||||||||||||||||||||||||||||||||||||||||||||||||||||||||||||||||||||||||||||||||||||||
Diluted | $ | 0.62 | ||||||||||||||||||||||||||||||||||||||||||||||||||||||||||||||||||||||||||||||||||||||||||||||
Pro forma weighted average shares outstanding: | Pro forma weighted average shares outstanding: |
| ||||||||||||||||||||||||||||||||||||||||||||||||||||||||||||||||||||||||||||||||||||||||||||||
Basic | 63,789,474 | |||||||||||||||||||||||||||||||||||||||||||||||||||||||||||||||||||||||||||||||||||||||||||||||
Diluted | 63,919,754 | |||||||||||||||||||||||||||||||||||||||||||||||||||||||||||||||||||||||||||||||||||||||||||||||
See notes to unaudited pro forma condensed combined financial information.
Forterra, Inc.
Unaudited Pro Forma Condensed Combined Statement of Operations
For the ThreeSix Months Ended March 31,June 30, 2015
(In Thousands, Except Per Share Data)
| Predecessor | Successor | Pro forma adjustments | Predecessor | Successor | Pro forma adjustments |
| ||||||||||||||||||||||||||||||||||||||||||||||||||||||||||||||||||||||||||||||||||||||||||||||||||||||||||||||||||||
| January 1 to March 13, 2015 | March 14 to March 31, 2015 | U.S. Pipe Historical | Acquisition (2) | Cretex Acquisition (3) | Sherman- Dixie Acquisition (4) | U.S. Pipe Acquisition (5) | Sale Leaseback (6) | Debt Recapitalization (7) | Offering (8) | Pro Forma Combined1 | January 1 to March 13, 2015 | March 14 to June 30, 2015 | Acquisition (2) | Cretex Acquisition (3) | Sherman- Dixie Acquisition (4) | U.S. Pipe Acquisition (5) | Other Acquisitions (6) | Bricks Disposition (7) | Sale Leaseback (8) | Debt Recapitalization (9) | Offering (10) | Pro Forma Combined | ||||||||||||||||||||||||||||||||||||||||||||||||||||||||||||||||||||||||||||||||||||||||||||||||||||
Net sales | $ | 132,620 | $ | 38,014 | $ | 126,195 | $ | — | $ | 18,794 | 3(a) | $ | 9,096 | 4(a) | 15,935 | 5(k) | $ | — | $ | — | $ | — | $ | 340,654 | $ | 132,620 | $ | 251,315 | $ | — | $ | 75,002 | 3(a) | $ | 23,973 | 4(a) | $ | 282,921 | 5(a) | $ | 30,243 | 6(a) | $ | (65,535 | ) | 7(a) | $ | — | $ | — | $ | — | $ | 764,172 | ||||||||||||||||||||||||||||||||||||||||||||||||||||||||||||||||||||
| 33,633 | 5(f) | |||||||||||||||||||||||||||||||||||||||||||||||||||||||||||||||||||||||||||||||||||||||||||||||||||||||||||||||||||||||||
Cost of goods sold | 117,831 | 35,324 | 112,334 | (303 | ) | 2(a) | 21,610 | 3(a) | 8,595 | 4(a) | (1,572 | ) | 5(e) | — | — | — | 308,288 | 117,831 | 228,405 | (303 | ) | 2(a) | 63,965 | 3(a) | 20,257 | 4(a) | 238,196 | 5(a) | 17,754 | 6(a) | (66,115 | ) | 7(a) | 8,188 | 8(a) | — | — | 654,856 | ||||||||||||||||||||||||||||||||||||||||||||||||||||||||||||||||||||||||||||||||||||
| 708 | 3(b) | 199 | 4(b) | 13,562 | 5(k) | 28,110 | 5(f) | |||||||||||||||||||||||||||||||||||||||||||||||||||||||||||||||||||||||||||||||||||||||||||||||||||||||||||||||||||
|
|
|
|
|
|
|
|
|
|
| 1,480 | 3(b) | 395 | 4(b) | (3,307 | ) | 5(b) | — | ||||||||||||||||||||||||||||||||||||||||||||||||||||||||||||||||||||||||||||||||||||||||||||||||||||||||
Gross profit (loss) | $ | 14,789 | $ | 2,690 | $ | 13,861 | $ | 303 | $ | (3,524 | ) | $ | 302 | $ | 3,945 | $ | — | $ | — | $ | — | $ | 32,366 | |||||||||||||||||||||||||||||||||||||||||||||||||||||||||||||||||||||||||||||||||||||||||||||||||||
|
|
|
|
|
|
|
|
|
|
|
| |||||||||||||||||||||||||||||||||||||||||||||||||||||||||||||||||||||||||||||||||||||||||||||||||||||||||||||||
Gross profit | $ | 14,789 | $ | 22,910 | $ | 303 | $ | 9,557 | $ | 3,321 | $ | 53,555 | �� | $ | 12,489 | $ | 580 | $ | (8,188 | ) | $ | — | $ | — | $ | 109,316 | ||||||||||||||||||||||||||||||||||||||||||||||||||||||||||||||||||||||||||||||||||||||||||||||||
Selling, general & administrative expenses | (21,683 | ) | (18,722 | ) | (12,735 | ) | (1,084 | ) | 2(b) | (1,589 | ) | 3(a) | (1,539 | ) | 4(a) | (8,731 | ) | 5(f) | — | — | — | (69,102 | ) | (21,683 | ) | (47,716 | ) | (1,084 | ) | 2(b) | (6,777 | ) | 3(a) | (3,577 | ) | 4(a) | (27,533 | ) | 5(a) | (5,934 | ) | 6(a) | 8,544 | 7(a) | — | — | — | (129,692 | ) | |||||||||||||||||||||||||||||||||||||||||||||||||||||||||||||||||||||||||
| (3,153 | ) | 5(f) | ||||||||||||||||||||||||||||||||||||||||||||||||||||||||||||||||||||||||||||||||||||||||||||||||||||||||||||||||||||||||
| (749 | ) | 3(c) | (752 | ) | 4(c) | (1,518 | ) | 5(k) | (3,481 | ) | 3(c) | (1,653 | ) | 4(c) | (15,645 | ) | 5(c) | |||||||||||||||||||||||||||||||||||||||||||||||||||||||||||||||||||||||||||||||||||||||||||||||||||||||||
Other operating income (expense), net | $ | 519 | $ | 936 | — | 1,455 | 519 | 7,359 | — | (23 | ) | 13 | 1,525 | 5(a) | — | (1,517 | ) | 7(a) | 1,002 | 8(a) | — | — | $ | 8,878 | ||||||||||||||||||||||||||||||||||||||||||||||||||||||||||||||||||||||||||||||||||||||||||||||||||
|
|
|
|
|
|
|
|
|
|
|
|
|
|
|
|
|
|
|
|
|
|
| ||||||||||||||||||||||||||||||||||||||||||||||||||||||||||||||||||||||||||||||||||||||||||||||||||||
Loss from operations | $ | (6,375 | ) | $ | (15,096 | ) | $ | 1,126 | $ | (781 | ) | $ | (5,862 | ) | $ | (1,989 | ) | $ | (6,304 | ) | $ | — | $ | — | $ | — | $ | (35,281 | ) | |||||||||||||||||||||||||||||||||||||||||||||||||||||||||||||||||||||||||||||||||||||||||||||
Income (loss) from operations | $ | (6,375 | ) | $ | (17,447 | ) | $ | (781 | ) | $ | (724 | ) | $ | (1,896 | ) | $ | 8,749 | $ | 6,555 | $ | 7,607 | $ | (7,186 | ) | $ | — | $ | — | $ | (11,498 | ) | |||||||||||||||||||||||||||||||||||||||||||||||||||||||||||||||||||||||||||||||||||||||||||
Other income (expenses) | ||||||||||||||||||||||||||||||||||||||||||||||||||||||||||||||||||||||||||||||||||||||||||||||||||||||||||||||||||||||||||
Interest expense | (84 | ) | (2,474 | ) | (4,618 | ) | (10,212 | ) | 2(c) | (4,240 | ) | 3(d) | (388 | ) | 4(d) | 1,535 | 5(g) | (4,242 | ) | (5,839 | ) | — | (30,562 | ) | (84 | ) | (15,551 | ) | (10,212 | ) | 2(c) | (7,881 | ) | 3(d) | (558 | ) | 4(d) | 3,924 | 5(d) | (223 | ) | 6(a) | — | (200 | ) | 8(a) | (11,678 | ) | 16,529 | (25,934 | ) | |||||||||||||||||||||||||||||||||||||||||||||||||||||||||||||||||||||||
Other income (expense), net | (39 | ) | — | 22 | — | — | 12 | (16 | ) | 5(k) | — | — | — | (21 | ) | (163 | ) | 5(a) | — | (207 | ) | |||||||||||||||||||||||||||||||||||||||||||||||||||||||||||||||||||||||||||||||||||||||||||||||||||||
|
|
|
|
|
|
|
|
|
|
| (39 | ) | (140 | ) | — | 105 | 3(a) | 12 | (21 | ) | 5(f) | 39 | — | — | — | |||||||||||||||||||||||||||||||||||||||||||||||||||||||||||||||||||||||||||||||||||||||||||||||||
Loss from continuing operations before income taxes | (6,498 | ) | (17,570 | ) | (3,470 | ) | (10,993 | ) | (10,102 | ) | (2,365 | ) | (4,785 | ) | (4,242 | ) | (5,839 | ) | — | (65,864 | ) | |||||||||||||||||||||||||||||||||||||||||||||||||||||||||||||||||||||||||||||||||||||||||||||||||||||
|
|
|
|
|
|
|
|
|
|
|
| |||||||||||||||||||||||||||||||||||||||||||||||||||||||||||||||||||||||||||||||||||||||||||||||||||||||||||||||
Income (loss) from continuing operations before income taxes | (6,498 | ) | (33,138 | ) | (10,993 | ) | (8,500 | ) | (2,442 | ) | 12,489 | 6,371 | 7,607 | (7,386 | ) | (11,678 | ) | 16,529 | (37,639 | ) | ||||||||||||||||||||||||||||||||||||||||||||||||||||||||||||||||||||||||||||||||||||||||||||||||||||||
Income tax (expense) benefit | 742 | — | 527 | — | 2(d) | — | 3(e) | — | 4(e) | — | 5(j) | — | — | — | 1,269 | 742 | (1,579 | ) | — | 2(d) | — | 3(e) | — | 4(e) | (6,723 | ) | 5(a) | (2,357 | ) | 6(a) | — | 2,733 | 8(a) | — | (6,116 | ) | (13,300 | ) | ||||||||||||||||||||||||||||||||||||||||||||||||||||||||||||||||||||||||||||||||||||
| — | 5(e) | — | ||||||||||||||||||||||||||||||||||||||||||||||||||||||||||||||||||||||||||||||||||||||||||||||||||||||||||||||||||||||||
Less: Net income/(loss) from noncontrolling interest | 380 | — | — | — | (380 | ) | — | — | — | — | — | — | — | — | — | — | — | — | — | — | — | — | ||||||||||||||||||||||||||||||||||||||||||||||||||||||||||||||||||||||||||||||||||||||||||||||||||||
|
|
|
|
|
|
|
|
|
|
|
|
|
|
|
|
|
|
|
|
|
|
| ||||||||||||||||||||||||||||||||||||||||||||||||||||||||||||||||||||||||||||||||||||||||||||||||||||
Net loss | $ | (5,756 | ) | $ | (17,570 | ) | $ | (3,323 | ) | $ | (10,993 | ) | $ | (10,102 | ) | $ | (2,365 | ) | $ | (4,405 | ) | $ | (4,242 | ) | $ | (5,839 | ) | $ | — | $ | (64,595 | ) | ||||||||||||||||||||||||||||||||||||||||||||||||||||||||||||||||||||||||||||||||||||||||||
Income (loss) from continuing operations | $ | (5,756 | ) | $ | (34,717 | ) | $ | (10,993 | ) | $ | (8,500 | ) | $ | (2,442 | ) | $ | 5,766 | $ | 4,014 | $ | 7,607 | $ | (4,653 | ) | $ | (11,678 | ) | $ | 10,413 | $ | (50,939 | ) | ||||||||||||||||||||||||||||||||||||||||||||||||||||||||||||||||||||||||||||||||||||||||||
|
|
|
|
|
|
|
|
|
|
|
|
|
|
|
|
|
|
|
|
|
|
| ||||||||||||||||||||||||||||||||||||||||||||||||||||||||||||||||||||||||||||||||||||||||||||||||||||
Pro forma net loss per share—basic and diluted |
| — | ||||||||||||||||||||||||||||||||||||||||||||||||||||||||||||||||||||||||||||||||||||||||||||||||||||||||||||||||||||||||
Pro forma common shares outstanding—basic and diluted |
| — | ||||||||||||||||||||||||||||||||||||||||||||||||||||||||||||||||||||||||||||||||||||||||||||||||||||||||||||||||||||||||
Pro forma net loss per share: | Pro forma net loss per share: | |||||||||||||||||||||||||||||||||||||||||||||||||||||||||||||||||||||||||||||||||||||||||||||||||||||||||||||||||||||||||
Basic | Basic | $ | (0.80 | ) | ||||||||||||||||||||||||||||||||||||||||||||||||||||||||||||||||||||||||||||||||||||||||||||||||||||||||||||||||||||||
Diluted | Diluted | $ | (0.80 | ) | ||||||||||||||||||||||||||||||||||||||||||||||||||||||||||||||||||||||||||||||||||||||||||||||||||||||||||||||||||||||
Pro forma weighted average shares outstanding: | Pro forma weighted average shares outstanding: | |||||||||||||||||||||||||||||||||||||||||||||||||||||||||||||||||||||||||||||||||||||||||||||||||||||||||||||||||||||||||
Basic | Basic | 63,789,474 | ||||||||||||||||||||||||||||||||||||||||||||||||||||||||||||||||||||||||||||||||||||||||||||||||||||||||||||||||||||||||
Diluted | Diluted | 63,789,474 | ||||||||||||||||||||||||||||||||||||||||||||||||||||||||||||||||||||||||||||||||||||||||||||||||||||||||||||||||||||||||
See notes to unaudited pro forma condensed combined financial information.
Forterra, Inc.
Unaudited Pro Forma Condensed Combined Statement of Operations
For the Year Ended December 31, 2015
(In Thousands, Except Per Share Data)
| Predecessor | Successor | Pro forma adjustments | ||||||||||||||||||||||||||||||||||||||||||||||||||||||||||
| January 1 to March 13, 2015 | March 14 to December 31, 2015 | U.S. Pipe Historical | Acquisition (2) | Cretex Acquisition (3) | Sherman- Dixie Acquisition (4) | U.S. Pipe Acquisition (5) | Sale Leaseback (6) | Debt Recapitalization (7) | Offering (8) | Pro Forma Combined1 | ||||||||||||||||||||||||||||||||||||||||||||||||||
Net sales | $ | 132,620 | $ | 722,664 | $ | 618,119 | $ | — | 150,168 | 3(a) | $ | 53,920 | 4(a) | $ | 55,882 | 5(k) | $ | — | $ | — | $ | — | $ | 1,733,373 | ||||||||||||||||||||||||||||||||||||
Cost of goods sold | 117,831 | 626,498 | 516,561 | (303 | ) | 2(a) | 127,391 | 3(a) | 44,147 | 4(a) | (7,838 | ) | 5(e) | — | — | — | 1,474,743 | |||||||||||||||||||||||||||||||||||||||||||
| 2,263 | 3(b) | 811 | 4(b) | 47,382 | 5(k) | |||||||||||||||||||||||||||||||||||||||||||||||||||||||
|
|
|
|
|
|
|
|
|
|
|
|
|
|
|
|
|
|
|
|
|
| |||||||||||||||||||||||||||||||||||||||
Gross profit | $ | 14,789 | $ | 96,166 | $ | 101,558 | $ | 303 | $ | 20,514 | $ | 8,962 | $ | 16,338 | $ | — | $ | — | $ | — | $ | 258,630 | ||||||||||||||||||||||||||||||||||||||
Selling, general & administrative expenses | (21,683 | ) | (134,971 | ) | (47,573 | ) | (1,084 | ) | 2(b) | (5,854 | ) | 3(a) | (11,033 | ) | 4(a) | (36,196 | ) | 5(f) | — | — | — | (271,253 | ) | |||||||||||||||||||||||||||||||||||||
| (5,122 | ) | 3(c) | (2,408 | ) | 4(c) | (5,329 | ) | 5(k) | ||||||||||||||||||||||||||||||||||||||||||||||||||||
Other operating income (expense), net | 519 | 8,076 | 3,605 | — | 12,200 | |||||||||||||||||||||||||||||||||||||||||||||||||||||||
|
|
|
|
|
|
|
|
|
|
|
|
|
|
|
|
|
|
|
|
|
| |||||||||||||||||||||||||||||||||||||||
Income (loss) from operations | $ | (6,375 | ) | $ | (30,729 | ) | $ | 57,590 | $ | (781 | ) | $ | 9,538 | $ | (4,479 | ) | $ | (25,187 | ) | $ | — | $ | — | $ | — | $ | (423 | ) | ||||||||||||||||||||||||||||||||
Other income (expenses) | ||||||||||||||||||||||||||||||||||||||||||||||||||||||||||||
Interest expense | (84 | ) | (45,953 | ) | (20,175 | ) | (10,212 | ) | 2(c) | (12,720 | ) | 3(d) | (1,552 | ) | 4(d) | 8,130 | 5(g) | (16,969 | ) | (23,356 | ) | — | (122,891 | ) | ||||||||||||||||||||||||||||||||||||
Other income (expenses), net | (39 | ) | (326 | ) | 1,177 | — | — | 125 | 44 | 5(k) | — | — | — | 981 | ||||||||||||||||||||||||||||||||||||||||||||||
|
|
|
|
|
|
|
|
|
|
|
|
|
|
|
|
|
|
|
|
|
| |||||||||||||||||||||||||||||||||||||||
Income (loss) from continuing operations before income taxes | (6,498 | ) | (77,008 | ) | 38,592 | (10,993 | ) | (3,182 | ) | (5,906 | ) | (17,013 | ) | (16,969 | ) | (23,356 | ) | — | (122,333 | ) | ||||||||||||||||||||||||||||||||||||||||
Income tax (expense) benefit | 742 | (5,778 | ) | (13,358 | ) | — | 2(d) | — | 3(e) | 876 | 4(e) | — | 5(j) | — | — | — | (17,518 | ) | ||||||||||||||||||||||||||||||||||||||||||
Less: Net income/(loss) from noncontrolling interest | 3,457 | — | — | — | (3,457 | ) | — | — | — | — | ||||||||||||||||||||||||||||||||||||||||||||||||||
|
|
|
|
|
|
|
|
|
|
|
|
|
|
|
|
|
|
|
|
|
| |||||||||||||||||||||||||||||||||||||||
Net income (loss) | $ | (5,756 | ) | $ | (82,786 | ) | $ | 21,777 | $ | (10,993 | ) | $ | (3,182 | ) | $ | (5,030 | ) | $ | (13,556 | ) | $ | (16,969 | ) | $ | (23,356 | ) | $ | — | $ | (139,851 | ) | |||||||||||||||||||||||||||||
|
|
|
|
|
|
|
|
|
|
|
|
|
|
|
|
|
|
|
|
|
| |||||||||||||||||||||||||||||||||||||||
Pro forma net loss per share—basic and diluted |
| — | ||||||||||||||||||||||||||||||||||||||||||||||||||||||||||
Pro forma common shares outstanding—basic and diluted |
| — | ||||||||||||||||||||||||||||||||||||||||||||||||||||||||||
| Predecessor | Successor | Pro forma adjustments |
| |||||||||||||||||||||||||||||||||||||||||||||||||||||||||||||||||
| January 1 to March 13, 2015 | March 14 to December 31, 2015 | Acquisition (2) | Cretex Acquisition (3) | Sherman- Dixie Acquisition (4) | U.S. Pipe Acquisition (5) | Other Acquisitions (6) | Bricks Disposition (7) | Sale Leaseback (8) | Debt Recapitalization (9) | Offering (10) | Pro Forma Combined | |||||||||||||||||||||||||||||||||||||||||||||||||||||||||
Net sales | $ | 132,620 | $ | 722,664 | $ | — | $ | 149,284 | 3(a) | $ | 53,920 | 4(a) | $ | 618,119 | 5(a) | $ | 69,184 | 6(a) | $ | (138,310 | ) | 7(a) | $ | — | $ | — | $ | — | $ | 1,663,363 | ||||||||||||||||||||||||||||||||||||||
| 55,882 | 5(f) | |||||||||||||||||||||||||||||||||||||||||||||||||||||||||||||||||||
Cost of goods sold | 117,831 | 626,498 | (303 | ) | 2(a) | 121,969 | 3(a) | 44,147 | 4(a) | 516,561 | 5(a) | 41,786 | 6(a) | (132,095 | ) | 7(a) | 16,376 | 8(a) | — | — | 1,396,432 | |||||||||||||||||||||||||||||||||||||||||||||||
| 47,382 | 5(f) | |||||||||||||||||||||||||||||||||||||||||||||||||||||||||||||||||||
| 2,263 | 3(b) | 810 | 4(b) | (6,793 | ) | 5(b) | — | |||||||||||||||||||||||||||||||||||||||||||||||||||||||||||||
|
| |||||||||||||||||||||||||||||||||||||||||||||||||||||||||||||||||||
Gross profit
Selling, general & administrative expenses
Other operating income (expense), net
Income (loss) from operations
Other income (expenses)
Interest expense
Other income (expenses), net
Income (loss) from continuing operations before income taxes
Income tax (expense) benefit
Less: Net income/(loss) from noncontrolling interest
Income (loss) from continuing operations
Pro forma net loss per share:
Basic
Diluted
Pro forma weighted average shares outstanding:
Basic
Diluted
See notes to unaudited pro forma condensed combined financial information.
Forterra, Inc.
Unaudited Pro Forma Condensed Combined Balance Sheet
As of March 31,June 30, 2016
(In Thousands)
| Pro forma adjustments | ||||||||||||||||||||||||||||||||
| Forterra Historical | U.S. Pipe Historical | U.S. Pipe Acquisition (5) | Sale Leaseback (6) | Debt Recapitalization (7) | Offering (8) | Pro Forma Combined1 | ||||||||||||||||||||||||||
ASSETS | ||||||||||||||||||||||||||||||||
Current assets | ||||||||||||||||||||||||||||||||
Cash and cash equivalents | $ | 11,803 | $ | 2,182 | $ | (154,284 | ) | 5(a) | $ | 209,673 | $ | (3,314 | ) | $ | — | $ | 66,060 | |||||||||||||||
Receivables, net | 143,699 | 85,574 | 13,454 | 5(b) | — | — | — | 242,727 | ||||||||||||||||||||||||
Inventories | 231,401 | 95,321 | 7,677 | 5(c) | — | — | — | 334,399 | ||||||||||||||||||||||||
Other current assets | 6,053 | 10,388 | (5,742 | ) | 5(b) | — | — | — | 10,699 | |||||||||||||||||||||||
Deferred income taxes | — | 2,446 | (2,446 | ) | 5(d) | — | — | — | — | |||||||||||||||||||||||
|
|
|
|
|
|
|
|
|
|
|
|
|
| |||||||||||||||||||
Total current assets | 392,956 | 195,911 | (141,341 | ) | 209,673 | (3,314 | ) | — | 653,885 | |||||||||||||||||||||||
|
|
|
|
|
|
|
|
|
|
|
|
|
| |||||||||||||||||||
Non-current assets | ||||||||||||||||||||||||||||||||
Property, plant and equipment, net | 418,499 | 152,629 | 93,612 | 5(e) | — | — | — | 664,740 | ||||||||||||||||||||||||
Goodwill and other intangible assets, net | 134,595 | 63,683 | 483,851 | 5(f) | — | — | — | 682,129 | ||||||||||||||||||||||||
Investment in equity method investees | 56,091 | — | — | — | — | — | 56,091 | |||||||||||||||||||||||||
Deferred tax asset | 742 | — | — | — | — | — | 742 | |||||||||||||||||||||||||
Other long term assets | — | 3,031 | (3,031 | ) | 5(d) | — | — | — | — | |||||||||||||||||||||||
|
|
|
|
|
|
|
|
|
|
|
|
|
| |||||||||||||||||||
Total assets | $ | 1,002,883 | $ | 415,254 | $ | 433,091 | $ | 209,673 | $ | (3,314 | ) | $ | — | $ | 2,057,587 | |||||||||||||||||
|
|
|
|
|
|
|
|
|
|
|
|
|
| |||||||||||||||||||
LIABILITIES AND EQUITY | ||||||||||||||||||||||||||||||||
Current liabilities | ||||||||||||||||||||||||||||||||
Trade payables | $ | 101,709 | $ | 37,061 | $ | 19,812 | 5(b) | — | — | — | $ | 158,582 | ||||||||||||||||||||
Accrued liabilities | 45,546 | 17,659 | 1,183 | 5(b) | — | — | — | 64,388 | ||||||||||||||||||||||||
Note Payable current portion | — | 82,337 | (82,337 | ) | 5(g) | — | — | — | — | |||||||||||||||||||||||
Deferred revenue | 16,443 | — | — | — | — | — | 16,443 | |||||||||||||||||||||||||
Other current liabilities | — | — | — | — | — | — | — | |||||||||||||||||||||||||
|
|
|
|
|
|
|
|
|
|
|
|
|
| |||||||||||||||||||
Total current liabilities | 163,698 | 137,057 | (61,342 | ) | — | — | — | 239,413 | ||||||||||||||||||||||||
|
|
|
|
|
|
|
|
|
|
|
|
|
| |||||||||||||||||||
Non-current liabilities | ||||||||||||||||||||||||||||||||
Deferred tax liability | — | 36,151 | 122,246 | 5(h) | — | — | — | 158,397 | ||||||||||||||||||||||||
Senior Term Loan | 468,027 | 169,273 | 34,127 | 5(g) | — | 338,236 | — | 1,009,663 | ||||||||||||||||||||||||
Junior Term Loan | 237,261 | — | — | — | — | — | 237,261 | |||||||||||||||||||||||||
Revolving credit facility | 19,027 | — | 1,600 | 5(g) | — | — | — | 20,627 | ||||||||||||||||||||||||
Other long term liabilities | 10,339 | 9,048 | 1,575 | 5(b) | 209,673 | — | — | 230,635 | ||||||||||||||||||||||||
|
|
|
|
|
|
|
|
|
|
|
|
|
| |||||||||||||||||||
Total liabilities | $ | 898,352 | $ | 351,529 | $ | 98,206 | $ | 209,673 | $ | 338,236 | — | $ | 1,895,996 | |||||||||||||||||||
|
|
|
|
|
|
|
|
|
|
|
|
|
| |||||||||||||||||||
Equity | ||||||||||||||||||||||||||||||||
Contributed capital | 195,383 | 68,153 | 333,974 | 5(i) | — | (341,550 | ) | — | 255,960 | |||||||||||||||||||||||
Accumulated other comprehensive income (loss) | (4,130 | ) | 652 | (652 | ) | 5(i) | — | — | — | (4,130 | ) | |||||||||||||||||||||
Retained earnings (deficit) | (86,722 | ) | (45,080 | ) | 41,563 | 5(i) | — | — | — | (90,239 | ) | |||||||||||||||||||||
Non-controlling interest | — | 40,000 | (40,000 | ) | 5(i) | — | — | — | — | |||||||||||||||||||||||
|
|
|
|
|
|
|
|
|
|
|
|
|
| |||||||||||||||||||
Total equity | 104,531 | 63,725 | 334,885 | — | (341,550 | ) | — | 161,591 | ||||||||||||||||||||||||
|
|
|
|
|
|
|
|
|
|
|
|
|
| |||||||||||||||||||
Total liabilities and equity | $ | 1,002,883 | $ | 415,254 | $ | 433,091 | $ | 209,673 | $ | (3,314 | ) | $ | — | $ | 2,057,587 | |||||||||||||||||
|
|
|
|
|
|
|
|
|
|
|
|
|
| |||||||||||||||||||
| Pro forma adjustments | ||||||||||||||||||||||||||||||||||||||||
| Forterra Historical | Other Acquisitions (6) | Bricks Disposition (7) | Sale Leaseback (8) | Offering (10) | Pro Forma Combined | |||||||||||||||||||||||||||||||||||
ASSETS | ||||||||||||||||||||||||||||||||||||||||
Current assets | ||||||||||||||||||||||||||||||||||||||||
Cash and cash equivalents | $ | 41,817 | (30,000 | ) | 6(b) | $ | — | $ | — | $ | 36,054 | $ | 47,871 | |||||||||||||||||||||||||||
Receivables, net | 270,088 | 13,237 | 6(b) | (17,995 | ) | 7(b) | — | — | 265,330 | |||||||||||||||||||||||||||||||
Inventories | 322,283 | 9,440 | 6(b) | (44,410 | ) | 7(b) | — | — | 287,313 | |||||||||||||||||||||||||||||||
Other current assets | 16,328 | 73 | (466 | ) | 7(b) | — | (2,517 | ) | 13,418 | |||||||||||||||||||||||||||||||
Deferred income taxes | — | — | — | — | — | — | ||||||||||||||||||||||||||||||||||
|
|
|
|
|
|
|
|
|
|
|
| |||||||||||||||||||||||||||||
Total current assets | 650,516 | (7,250 | ) | (62,871 | ) | — | 33,537 | 613,932 | ||||||||||||||||||||||||||||||||
|
|
|
|
|
|
|
|
|
|
|
| |||||||||||||||||||||||||||||
Non-current assets | ||||||||||||||||||||||||||||||||||||||||
Property, plant and equipment, net | 648,621 | 18,815 | 6(b) | (75,448 | ) | 7(b) | (154,757 | ) | 8(b) | — | 437,231 | |||||||||||||||||||||||||||||
Goodwill and other intangible assets, net | 675,401 | 123,497 | 6(b) | 10 | — | — | 798,908 | |||||||||||||||||||||||||||||||||
Investment in equity method investees | 56,656 | — | — | — | — | 56,656 | ||||||||||||||||||||||||||||||||||
Other long term assets | 2,916 | 91 | — | 6,500 | 8(b) | — | 9,507 | |||||||||||||||||||||||||||||||||
|
|
|
|
|
|
|
|
|
|
|
| |||||||||||||||||||||||||||||
Total assets | $ | 2,034,110 | $ | 135,153 | $ | (138,309 | ) | $ | (148,257 | ) | $ | 33,537 | $ | 1,916,234 | ||||||||||||||||||||||||||
|
|
|
|
|
|
|
|
|
|
|
| |||||||||||||||||||||||||||||
LIABILITIES AND EQUITY | ||||||||||||||||||||||||||||||||||||||||
Current liabilities | ||||||||||||||||||||||||||||||||||||||||
Trade payables | $ | 136,525 | $ | 4,425 | 6(b) | $ | (10,125 | ) | 7(b) | $ | — | $ | — | $ | 130,825 | |||||||||||||||||||||||||
Accrued liabilities | 73,359 | 1,678 | 6(b) | (9,262 | ) | 7(b) | 29,711 | 8(b) | — | 95,486 | ||||||||||||||||||||||||||||||
Deferred revenue | 15,286 | — | (9 | ) | — | — | 15,277 | |||||||||||||||||||||||||||||||||
Tax liability from Bricks Disposition | — | — | 32,300 | 7(b) | — | — | 32,300 | |||||||||||||||||||||||||||||||||
|
|
|
|
|
|
|
|
|
|
|
| |||||||||||||||||||||||||||||
Total current liabilities | 225,170 | 6,103 | 12,904 | 29,711 | — | 273,888 | ||||||||||||||||||||||||||||||||||
|
|
|
|
|
|
|
|
|
|
|
| |||||||||||||||||||||||||||||
Non-current liabilities | ||||||||||||||||||||||||||||||||||||||||
Senior Term Loan | 1,001,700 | — | — | — | (36,000 | ) | 965,700 | |||||||||||||||||||||||||||||||||
Junior Term Loan | 238,077 | — | — | — | (238,077 | ) | — | |||||||||||||||||||||||||||||||||
Revolving Credit Facility | — | 129,050 | 6(b) | — | — | — | 129,050 | |||||||||||||||||||||||||||||||||
Financing Obligation | 210,934 | — | — | (210,934 | ) | 8(b) | — | — | ||||||||||||||||||||||||||||||||
Capital lease liability | — | — | — | 3,705 | 8(b) | — | 3,705 | |||||||||||||||||||||||||||||||||
Deferred tax liability | 132,978 | — | 4,962 | 7(b) | (29,711 | ) | 8(b) | — | 108,229 | |||||||||||||||||||||||||||||||
Tax receivable agreement liability | — | — | — | — | 119,000 | 10(a) | 119,000 | |||||||||||||||||||||||||||||||||
Deferred gain on sale leaseback | — | — | — | 77,657 | 8(b) | — | 77,657 | |||||||||||||||||||||||||||||||||
Derivative liability | 2,875 | — | (1,024 | ) | 7(b) | — | — | 1,851 | ||||||||||||||||||||||||||||||||
Other long term liabilities | 18,909 | — | (1,058 | ) | 7(b) | — | — | 17,851 | ||||||||||||||||||||||||||||||||
|
|
|
|
|
|
|
|
|
|
|
| |||||||||||||||||||||||||||||
Total liabilities | 1,830,643 | 135,153 | 15,784 | (129,572 | ) | (155,077 | ) | 1,696,931 | ||||||||||||||||||||||||||||||||
|
|
|
|
|
|
|
|
|
|
|
| |||||||||||||||||||||||||||||
Equity | ||||||||||||||||||||||||||||||||||||||||
Contributed capital and common stock | 254,918 | — | (154,093 | ) | 7(b) | — | 218,337 | 10(a) | 319,162 | |||||||||||||||||||||||||||||||
Accumulated other comprehensive income (loss) | (1,418 | ) | — | — | — | — | (1,418 | ) | ||||||||||||||||||||||||||||||||
Retained earnings (deficit) | (50,033 | ) | — | — | (18,685 | ) | 8(b) | (29,723 | ) | (98,441 | ) | |||||||||||||||||||||||||||||
Non-controlling interest | — | — | — | — | — | — | ||||||||||||||||||||||||||||||||||
|
|
|
|
|
|
|
|
|
|
|
| |||||||||||||||||||||||||||||
Total equity | 203,467 | $ | — | (154,093 | ) | (18,685 | ) | 188,614 | 219,303 | |||||||||||||||||||||||||||||||
|
|
|
|
|
|
|
|
|
|
|
| |||||||||||||||||||||||||||||
Total liabilities and equity | $ | 2,034,110 | $ | 135,153 | $ | (138,309 | ) | $ | (148,257 | ) | $ | 33,537 | $ | 1,916,234 | ||||||||||||||||||||||||||
|
|
|
|
|
|
|
|
|
|
|
| |||||||||||||||||||||||||||||
See notes to unaudited pro forma condensed combined financial information.
Forterra, Inc.
Notes To Unaudited Pro Forma Condensed Combined Financial Information
(USD in thousands, unless stated otherwise)
1. Basis of presentation
The unaudited pro forma condensed combined financial information is based upon the historical combined financial statements of the Predecessor, the historical financial statements of the Successor and the historical financial statements of U.S. Pipe, as adjusted for the impact of the Transactions on ours and U.S. Pipe’s historical results of operations and financial position, as if the Transactions occurred on the dates reflected in the table in the introductory section above. The historical financial statements have been adjusted to give pro forma effect to events that are (i) directly attributable to the Transactions, (ii) factually supportable and (iii) with respect to the unaudited pro forma condensed combined statements of operations, expected to have a continuing impact on the combined results following the Transactions.
Each of the business combinations were accounted for under the acquisition method of accounting in accordance with Financial Accounting Standards Board Accounting Standards Codification, or ASC, Topic 805, Business Combinations. As the acquirer for accounting purposes, we have estimated the fair value of the Predecessor’s, Cretex’s, Sherman-Dixie’s, and U.S. Pipe’s and Bio Clean’s assets acquired and liabilities assumed and conformed the accounting policies of each acquisition to our own accounting policies. The estimated values of the assets acquired and liabilities assumed for Sherman-Dixie, and U.S. Pipe and Bio Clean presented herein are preliminary and reflect our expectations based on the information currently available. The acquisitions of Sherman-Dixie, and U.S. Pipe and Bio Clean are still in their respective measurement periods as defined by ASC 805 and purchase price allocations may be subject to change upon completion of the determination of the fair values of all acquired assets and liabilities. The Sale Leaseback was accounted for under the guidance set forth in ASC 360, Property, Plant and Equipment, and ASC 840,Leases, for similar transactions.
The unaudited pro forma condensed combined financial statements do not necessarily reflect what the combined company’s financial condition or results of operations would have been had the Transactions occurred on the dates indicated. They also may not be useful in predicting our future financial condition and results of operations. Our actual financial position and results of operations may differ significantly from the pro forma amounts reflected herein due to a variety of factors.
2. Pro Forma Adjustments for Acquisition
The Acquisition was completed on March 13, 2015 and therefore, the fair value of the assets acquired and liabilities assumed is already reflected in our historical condensed combined balance sheet as of March 31,June 30, 2016. Lone Star acquired our business, along with the business of Forterra UK, from HeidelbergCement for aggregate cash consideration of $1.33 billion, subject to a potential earn outearn-out of up to $100.0 million that is currently the subject of dispute. The portion of the total purchase price apportioned by Lone Star to the Acquisition is $640.4 million. Lone Star funded the transactions with an equity investment of $432.3 million and third-party debt in the amount of $940.0 million. The portion of Lone Star’s equity investment apportioned to the Acquisition is $167.5 million and the portion of third party debt allocated to the Acquisition is $515.5 million, inclusive of $20.5 million in debt issuance costs and $22.1 million in original issue discount. Our operating subsidiaries are guarantors of this debt, and therefore, jointly and severally liable obligors. The unaudited pro forma condensed combined financial information reflects the impact of our portion of the Acquisition on our historical operating activity for the period from January 1, 2015 through March 13, 2015, including increased debt financed interest expense and the impact on historical depreciation and amortization expense, as if the Acquisition had occurred on January 1, 2015.
Forterra, Inc.
Notes To Unaudited Pro Forma Condensed Combined Financial Information
(USD in thousands, unless stated otherwise)
if the Acquisition had occurred on January 1, 2015. Capital expenditures on a combined pro forma basis were $27.1 million, $25.6 million and $42.0 million for the six months ended June 30, 2016, six months ended June 30, 2015, and year ended December 31, 2015, respectively.
Transition Services Agreement
The Company is no longer part of HC and its affiliates, but did have a Transition Services Agreement (“TSA”) with HC providing for corporate overhead services. Per the TSA, the services were to be provided to the Successor for a period of up to 18 months. The initial services provided primarily consisted of certain accounting, information technology, human resources, and other general and administrative services associated with the Successor’s transition to a stand-alone company. As of February 2016, the TSA was terminated and the Company replaced the TSA with internal costs. These internal costs are reflected in the historical financial statements, thus, no pro forma adjustments are required.
Hudson Advisors
The Company has an advisory agreement with Hudson Advisors, an affiliate of Lone Star, to provide certain management oversight services to the Company, including assistance and advice on strategic plans, obtaining and maintaining certain legal documents, and communicating and coordinating with service providers. Upon completion of the Offering, this agreement will be terminated. The services provided by this agreement will be replaced internally and the Company does not expect to incur any significant additional incremental costs and, as such, no pro forma adjustments have been made related to the termination of this agreement.
We performed a valuation analysis of the fair market value of the Predecessor’s assets and liabilities, which has been completed as of the date of this prospectus. The following table summarizes the fair values of the assets acquired and liabilities assumed by us as of the Acquisition date:
| Fair Value | ||||
Net working capital | $ | 257,368 | ||
Property, plant and equipment | 311,191 | |||
Investment in equity method investee | 56,400 | |||
Customer backlog intangible | 4,500 | |||
Other assets and other liabilities | (6,495 | ) | ||
|
| |||
Net identifiable assets acquired | $ | 622,964 | ||
Goodwill | 17,464 | |||
|
| |||
Consideration transferred, net of cash acquired | $ | 640,428 | ||
|
| |||
The goodwill recognized was attributable primarily to expected operating efficiencies and expansion opportunities in the business acquired.
Forterra, Inc.
Notes To Unaudited Pro Forma Condensed Combined Financial Information
(USD in thousands, unless stated otherwise)
The following adjustments have been included in the unaudited pro forma condensed combined statements of operations for the threesix months ended March 31,June 30, 2015 and the year ended December 31, 2015 covering the pro forma adjustment period from January 1, 2015 through March 13, 2015 as if the Acquisition had occurred as of January 1, 2015:
| (a) | Cost of goods sold. Reflects the adjustments to eliminate the Predecessor’s historical depreciation expense and record depreciation expense for the assets acquired: |
Asset Category | Fair Value acquired | Weighted Average useful life (in years) | Six months ended June 30, 2015 | Year ended December 31, 2015 | ||||||||||||||||||||
Land and land improvements | $ | 120,591 | 10.2 | $ | 167 | $ | 167 | |||||||||||||||||
Machinery and equipment | 96,428 | 3.5 | 5,546 | 5,546 | ||||||||||||||||||||
Building and improvements | 68,496 | 16.4 | 834 | 834 | ||||||||||||||||||||
Other equipment | 1,193 | 7.5 | 32 | 32 | ||||||||||||||||||||
Construction in process | 24,483 | N/A | — | — | ||||||||||||||||||||
| ||||||||||||||||||||||||
Total property, plant and equipment, net | $ | 311,191 | ||||||||||||||||||||||
| Three Months ended March 31, 2015 | Year ended December 31, 2015 |
|
|
| ||||||||||||||||||||
Depreciation expense for assets acquired | $ | 6,579 | $ | 6,579 | $ | 6,579 | $ | 6,579 | ||||||||||||||||
Elimination of Predecessor’s historical depreciation expense | (6,882 | ) | (6,882 | ) | (6,882 | ) | (6,882 | ) | ||||||||||||||||
|
|
|
| |||||||||||||||||||||
Pro forma adjustment to decrease cost of goods sold | $ | (303 | ) | $ | (303 | ) | $ | (303 | ) | $ | (303 | ) | ||||||||||||
|
|
|
| |||||||||||||||||||||
| (b) | Selling, general and administrative expenses. �� The net pro forma adjustments to selling, general and administrative expenses are comprised of the following items: |
| Three Months ended March 31, 2015 | Year ended December 31, 2015 | |||||||
Amortization expense for intangible assets acquired | $ | 1,096 | $ | 1,096 | ||||
Elimination of Predecessor’s historical amortization expense | (12 | ) | (12 | ) | ||||
|
|
|
| |||||
Pro forma adjustment to increase selling, general and administrative expenses | $ | 1,084 | $ | 1,084 | ||||
|
|
|
| |||||
| Estimated Fair Value | Estimated Useful Life (in Years) | Six months ended June 30, 2015 | Year ended December 31, 2015 | |||||||||||||
Customer backlog | $ | 4,500 | 0.8 | $ | 1,096 | $ | 1,096 | |||||||||
Elimination of Predecessor’s historical amortization expense | (12 | ) | (12 | ) | ||||||||||||
|
|
|
| |||||||||||||
Pro forma adjustment to increase Selling, general and administrative expenses | $ | 1,084 | 1,084 | |||||||||||||
|
|
|
| |||||||||||||
Forterra, Inc.
Notes To Unaudited Pro Forma Condensed Combined Financial Information
(USD in thousands, unless stated otherwise)
The pro forma adjustments to intangible amortization expense are based on the fair value of the Predecessor’s identifiable intangible assets as if the Acquisition had occurred as of January 1, 2015.
| (c) | Interest expense. Reflects an adjustment for interest expense and the amortization of deferred financing costs and debt discounts on our borrowings of approximately $515.5 million, assuming the Acquisition occurred on January 1, 2015. The financing transactions included $254.9 million under the Senior Term Loan ($241.7 million net of $13.2 million of original issue discount and debt issuance costs), $260.0 million under the Junior Term Loan ($233.8 million, net of $26.2 million of original issue discount and debt issuance costs) and a $0.6 million draw on the Revolver. The terms of these financing arrangements |
Forterra, Inc.
Notes To Unaudited Pro Forma Condensed Combined Financial Information
(USD in thousands, unless stated otherwise)
| are described in greater detail in the section entitled “Description of Certain Indebtedness.” The interest rate for both the Senior Term Loan and Junior Term Loan is set at LIBOR (with a 1% floor) plus a margin of 5.5% and 9.5%, respectively. A rise of current interest rate levels to above the 1% floor would be required to increase our interest expense and a reduction in interest rates would have no impact. As of |
| Three Months ended March 31, 2015 | Year ended December 31, 2015 | Principal Amount | Interest Rate | Six months ended June 30, 2015 | Year ended December 31, 2015 | |||||||||||||||||||
Interest expense on new debt used to fund the Acquisition | $ | 9,044 | $ | 9,044 | ||||||||||||||||||||
Senior Term Loan | $ | 254,877 | 6.5% | $ | 3,313 | $ | 3,313 | |||||||||||||||||
Junior Term Loan | 260,000 | 10.5% | 5,460 | 5,460 | ||||||||||||||||||||
Revolver | 619 | Variable | 271 | 271 | ||||||||||||||||||||
|
|
| ||||||||||||||||||||||
Total debt, gross | 515,496 | |||||||||||||||||||||||
Interest expense on new debt used to acquire Predecessor | $ | 9,044 | $ | 9,044 | ||||||||||||||||||||
Amortization of new debt issuance costs and discount | 1,168 | 1,168 | 1,168 | 1,168 | ||||||||||||||||||||
|
|
|
| |||||||||||||||||||||
Proforma adjustment to increase Interest expense | $ | 10,212 | $ | 10,212 | $ | 10,212 | $ | 10,212 | ||||||||||||||||
|
|
|
| |||||||||||||||||||||
| (d) | Income tax (expense) benefit. Due to our limited history and the history of pre-tax losses generated by the Predecessor, deferred tax benefits were not recorded on the pro forma adjustments. |
3. Pro Forma Adjustments for Cretex Acquisition
We acquired Cretex on October 1, 2015 for total cash consideration of approximately $245.1 million including customary working capital adjustments. The Cretex Acquisition was partially funded with new indebtedness under the Senior Term Loan totaling $240.0 million, net of $8.9 million in debt issuance costs and debt discounts.
Forterra, Inc.
Notes To Unaudited Pro Forma Condensed Combined Financial Information
(USD in thousands, unless stated otherwise)
The fair value of Cretex assets acquired and liabilities assumed is reflected in our historical condensed combined balance sheet as of March 31,June 30, 2016. The following table summarizes the fair values of the assets acquired and liabilities assumed by us in the Cretex Acquisition as of the acquisition date:
| Fair Value | ||||
Net working capital | $ | 69,745 | ||
Property, plant and equipment | 97,282 | |||
Customer relationship intangible | 24,700 | |||
Trade name | 600 | |||
Customer backlog intangible | 800 | |||
Other assets and other liabilities | (7,500 | ) | ||
|
| |||
Net identifiable assets acquired | 185,627 | |||
Goodwill | 59,473 | |||
|
| |||
Consideration transferred, net of cash acquired | $ | 245,100 | ||
|
| |||
Forterra, Inc.
Notes To Unaudited Pro Forma Condensed Combined Financial Information
(USD in thousands, unless stated otherwise)
The goodwill recognized was attributable primarily to expected operating efficiencies and expansion opportunities in the business acquired.
The following adjustments have been included in the unaudited pro forma condensed combined statements of operations for the threesix months ended March 31,June 30, 2015 and the year ended December 31, 2015 covering the pro forma adjustment period from January 1, 2015 through September 30, 2015 as if the Cretex Acquisition had occurred as of January 1, 2015:
| (a) | The Cretex Acquisition was completed on October 1, 2015 and the pro forma adjustments reflect the inclusion ofCretex’s historical results of operations as if Cretex had been acquired on January 1, 2015. The pro forma adjustments reflect: |
ThreeSix months ended March 31,June 30, 2015:
| (i) | an increase in net sales of |
| (ii) | an increase in selling, general and administrative expenses of |
| (iii) | an increase in other income of $0.1 million. |
Year ended December 31, 2015:
| (i) | an increase in net sales of |
| (ii) | an increase in selling, general and administrative expenses of |
| (iii) | an increase in other income of $0.2 million. |
| (b) | Cost of goods sold. Reflects the adjustments to eliminate Cretex’s historical depreciation expense and to record depreciation expense based on the fair value of the assets acquired in the Cretex Acquisition: |
Asset Category | Fair Value acquired | Weighted Average useful life (in years) | Six months ended June 30, 2015 | Year ended December 31, 2015 | ||||||||||||||||||||
Land and land improvements | $ | 31,084 | 9.3 | $ | 256 | $ | 387 | |||||||||||||||||
Machinery and equipment | 46,053 | 5.6 | 4,086 | 6,144 | ||||||||||||||||||||
Building and improvements | 17,832 | 25.2 | 353 | 530 | ||||||||||||||||||||
Other equipment | 852 | 3.2 | 133 | 203 | ||||||||||||||||||||
Construction in process | 1,461 | N/A | — | — | ||||||||||||||||||||
| ||||||||||||||||||||||||
Total property, plant and equipment, net | $ | 97,282 | ||||||||||||||||||||||
| Three Months ended March 31, 2015 | Year ended December 31, 2015 |
|
|
| ||||||||||||||||||||
Depreciation expense for assets acquired | $ | 2,404 | $ | 7,264 | $ | 4,828 | $ | 7,264 | ||||||||||||||||
Elimination of Cretex’s historical depreciation expense | (1,696 | ) | (5,001 | ) | (3,348 | ) | (5,001 | ) | ||||||||||||||||
|
|
|
| |||||||||||||||||||||
Pro forma adjustment to increase cost of goods sold | $ | 708 | $ | 2,263 | ||||||||||||||||||||
Pro forma adjustment to decrease cost of goods sold | $ | 1,480 | $ | 2,263 | ||||||||||||||||||||
|
|
|
| |||||||||||||||||||||
Forterra, Inc.
Notes To Unaudited Pro Forma Condensed Combined Financial Information
(USD in thousands, unless stated otherwise)
| (c) | Selling, general and administrative expenses. Reflects the adjustments to eliminate Cretex’s historical amortization expense and to record amortization expense based on the fair value of Cretex’s identifiable intangible assets as if the Cretex Acquisition had occurred as of January 1, 2015: |
| Three Months ended March 31, 2015 | Year ended December 31, 2015 | |||||||
Amortization expense for intangible assets acquired | $ | 849 | $ | 6,115 | ||||
Elimination of Cretex’s historical amortization expense | (100 | ) | (993 | ) | ||||
|
|
|
| |||||
Pro forma adjustment to increase selling, general and administrative expenses | $ | 749 | $ | 5,122 | ||||
|
|
|
| |||||
| Estimated Fair Value | Estimated Useful Life (in Years) | Year ended June 30, 2015 | Year ended December 31, 2015 | |||||||||||||
Customer relationships | $ | 24,700 | 10 | $ | 2,553 | $ | 4,740 | |||||||||
Customer backlog | 800 | 1.3 | 598 | 800 | ||||||||||||
Trade name | 600 | 1.5 | 330 | 575 | ||||||||||||
|
|
|
|
|
| |||||||||||
| $ | 26,100 | $ | 3,481 | $ | 6,115 | |||||||||||
|
|
|
| |||||||||||||
Elimination of Cretex’s historical amortization expense | — | — | ||||||||||||||
|
|
|
| |||||||||||||
Pro forma adjustment to increase Selling, general and administrative expenses | $ | 3,481 | $ | 6,115 | ||||||||||||
|
|
|
| |||||||||||||
| (d) | Interest expense. Reflects an adjustment for interest expense and the amortization of deferred financing costs and debt discounts related to the incremental $240.0 million borrowing under the Senior Term Loan, assuming the incremental borrowing occurred on January 1, 2015. The interest rate for the add-on to the Senior Term Loan is set at LIBOR (with a 1% floor) plus a margin of 5.5%. As with the original issuance, a rise of current interest rate levels to above the 1% floor would be required to increase our interest expense and a reduction in interest rates would have no impact. A hypothetical 1/8 percent change in the rates applicable to our variable rate debt would not have a material impact on our unaudited pro forma condensed combined statements of operations for the |
| Three Months ended March 31, 2015 | Year ended December 31, 2015 | Principal Amount | Interest Rate | Six months ended June 30, 2015 | Year ended December 31, 2015 | |||||||||||||||||||
Interest expense on new debt used to acquire Cretex | $ | 3,900 | $ | 11,700 | $ | 240,000 | 6.5 | % | $ | 7,800 | $ | 11,700 | ||||||||||||
Amortization of new debt issuance costs and discount | 340 | 1,020 | 680 | 1,020 | ||||||||||||||||||||
Elimination of historical interest expense | (599 | ) | (1,029 | ) | ||||||||||||||||||||
|
|
|
| |||||||||||||||||||||
Proforma adjustment to increase interest expense | $ | 4,240 | $ | 12,720 | ||||||||||||||||||||
Proforma adjustment to increase Interest expense | $ | 7,881 | $ | 11,691 | ||||||||||||||||||||
|
|
|
| |||||||||||||||||||||
| (e) | Income tax (expense) benefit. Due to our limited history and the history of pre-tax losses generated by the Predecessor, deferred tax benefits were not recorded on the pro forma adjustments. |
Forterra, Inc.
Notes To Unaudited Pro Forma Condensed Combined Financial Information
(USD in thousands, unless stated otherwise)
4. Pro Forma Adjustments for Sherman-Dixie Acquisition
On January 29, 2016, we acquired Sherman-Dixie for cash consideration of $66.8 million. The Sherman-Dixie Acquisition was fully financed through a draw on the Revolver.
Forterra, Inc.
Notes To Unaudited Pro Forma Condensed Combined Financial Information
(USD in thousands, unless stated otherwise)
We have performed a preliminary valuation analysis of the fair market value of Sherman-Dixie’s assets and liabilities and the preliminary fair value of these assets acquired and liabilities assumed are reflected in our historical condensed combined balance sheet as of March 31,June 30, 2016. The following table summarizes the preliminary allocation of the purchase price as of the date of the Sherman-Dixie Acquisition:
| Fair Value | ||||
Net working capital | $ | 14,293 | ||
Property, plant and equipment | 29,163 | |||
Customer relationships intangible | 5,100 | |||
Non-compete agreement intangible | 2,500 | |||
Other identifiable intangibles | 900 | |||
Deferred tax liabilities | (11,189 | ) | ||
|
| |||
Net identifiable assets acquired | 40,767 | |||
Goodwill | 25,984 | |||
|
| |||
Consideration transferred, net of cash acquired | $ | 66,751 | ||
|
| |||
These preliminary purchase price allocations have been used to prepare pro forma adjustments in the unaudited pro forma condensed combined financial statements. The final purchase price allocations will be determined when we have completed the detailed valuations and necessary calculations. The final allocation could differ materially from the preliminary allocation used in these pro forma adjustments. The final allocation may include (1) changes in fair values of property, plant and equipment, (2) changes in allocations to intangible assets such as trade names, non-compete agreements and customer relationships as well as goodwill and (3) other changes to assets and liabilities.
The following adjustments have been included in the unaudited pro forma condensed combined statements of operations for the threesix months ended March 31,June 30, 2015, the year ended December 31, 2015, and the threesix months ended March 31,June 30, 2016 covering the applicable pro forma adjustment period for the year ended December 31, 2015 and the period from January 1 through January 29, 2016 as if the Sherman-Dixie Acquisition had occurred as of January 1, 2015:
| (a) | The Sherman-Dixie Acquisition closed on January 29, 2016 and the pro forma adjustments reflect the inclusion of Sherman-Dixie’s historical results of operations as if Sherman-Dixie had been acquired on January 1, 2015. The pro forma adjustments reflect: |
ThreeSix months ended March 31,June 30, 2016:
| (i) | an increase in net sales of $2.9 million and the related increase in cost of goods sold of $2.5 million; and |
| (ii) | an increase in selling, general and administrative expenses of $0.8 million. |
ThreeSix months ended March 31,June 30, 2015:
| (i) | an increase in net sales of |
| (ii) | an increase in selling, general and administrative expenses of |
Forterra, Inc.
Notes To Unaudited Pro Forma Condensed Combined Financial Information
(USD in thousands, unless stated otherwise)
Year ended December 31, 2015:
| (i) | an increase in net sales of $53.9 million and the related increase in cost of goods sold of $44.1 million; |
Forterra, Inc.
Notes To Unaudited Pro Forma Condensed Combined Financial Information
(USD in thousands, unless stated otherwise)
| (ii) | an increase in selling, general and administrative expenses of $11.0 million; and |
| (iii) | an increase in other income of $0.1 million. |
| (b) | Cost of goods sold. Reflects the adjustments to eliminate Sherman-Dixie’s historical depreciation expense and record depreciation expense based on the preliminary fair value of the assets acquired in the Sherman-Dixie acquisition: |
| Asset Category | Fair Value acquired | Weighed Average useful life (in years) | Six months ended June 30, 2015 | Year ended December 31, 2015 | Six months ended June 30, 2016 | |||||||||||||||||||||||||||
Land and land improvements | $ | 3,824 | 21.6 | $ | 12 | $ | 25 | $ | 2 | |||||||||||||||||||||||
Machinery and equipment | 22,841 | 6.1 | 1,858 | 3,745 | 316 | |||||||||||||||||||||||||||
Building and improvements | 2,060 | 5.5 | 186 | 372 | 31 | |||||||||||||||||||||||||||
Other equipment | 347 | 2.4 | 75 | 146 | 13 | |||||||||||||||||||||||||||
Construction in process | 91 | N/A | — | — | — | |||||||||||||||||||||||||||
| ||||||||||||||||||||||||||||||||
Total property, plant and equipment, net | $ | 29,163 | ||||||||||||||||||||||||||||||
| Three Months ended March 31, 2015 | Year ended December 31, 2015 | Three Months ended March 31, 2016 |
|
|
|
| ||||||||||||||||||||||||||
Depreciation expense for assets acquired | $ | 1,063 | $ | 4,289 | $ | 362 | $ | 2,131 | $ | 4,288 | $ | 362 | ||||||||||||||||||||
Elimination of Sherman-Dixie’s historical depreciation expense | (864 | ) | (3,478 | ) | (271 | ) | Elimination of Sherman-Dixie’s historical depreciation expense |
| (1,736 | ) | (3,478 | ) | (271 | ) | ||||||||||||||||||
|
|
|
|
|
| |||||||||||||||||||||||||||
Pro forma adjustment to increase cost of goods sold | $ | 199 | $ | 811 | $ | 91 | ||||||||||||||||||||||||||
Pro forma adjustment to decrease cost of goods sold | Pro forma adjustment to decrease cost of goods sold |
| $ | 395 | $ | 810 | $ | 91 | ||||||||||||||||||||||||
|
|
|
|
|
| |||||||||||||||||||||||||||
| (c) | Selling, general and administrative expenses. Reflects the adjustment to eliminate Sherman-Dixie’s historical intangible amortization expense and to record intangible amortization of the acquired intangible assets based on their preliminary fair value. The preliminary fair value of identifiable intangible assets was determined primarily using the “income approach”, which requires a forecast of all of the expected future cash flows. Customer relationships, customer backlog and brand names are amortized over a 10 year, 0.5 year and 0.5 year period, respectively, using the accelerated method that reflects the expected future cash flows. Acquired non-compete agreement assets are amortized on a straight-line basis over the estimated useful lives of 5 years. |
Forterra, Inc.
Notes To Unaudited Pro Forma Condensed Combined Financial Information
(USD in thousands, unless stated otherwise)
The following table summarizes the pro forma adjustments to amortization expense based on the preliminary fair value of Sherman-Dixie’s identifiable intangible assets as if the Sherman-Dixie Acquisition occurred as of January 1, 2015 (in thousands):
| Estimated Fair Value | Estimated Useful Life (in years) | Three Months ended March 31, 2015 | Year ended December 31, 2015 | Three Months ended March 31, 2016 | Estimated Fair Value | Estimated Useful Life (in years) | Six Months ended June 30, 2015 | Year ended December 31, 2015 | Six Months ended June 30, 2016 | |||||||||||||||||||||||||||||||
Customer relationships | $ | 5,100 | 10 | $ | 253 | $ | 1,010 | $ | 78 | $ | 5,100 | 10 | $ | 505 | $ | 1,010 | $ | 78 | ||||||||||||||||||||||
Non-competes | 2,500 | 5 | 125 | 500 | 42 | 2,500 | 5 | 250 | 500 | 42 | ||||||||||||||||||||||||||||||
Other intangibles | 900 | 0.5 | 375 | 900 | 0 | 900 | 0.5 | 900 | 900 | 0 | ||||||||||||||||||||||||||||||
|
|
|
|
|
|
|
| |||||||||||||||||||||||||||||||||
| $ | 8,500 | $ | 753 | $ | 2,410 | $ | 120 | $ | 8,500 | $ | 1,655 | $ | 2,410 | $ | 120 | |||||||||||||||||||||||||
Elimination of historical amortization expense | Elimination of historical amortization expense |
| (1 | ) | (2 | ) | — | Elimination of historical amortization expense |
| (2 | ) | (2 | ) | — | ||||||||||||||||||||||||||
|
|
|
|
|
| |||||||||||||||||||||||||||||||||||
Pro forma adjustment to increase selling, general and administrative expenses | Pro forma adjustment to increase selling, general and administrative expenses |
| $ | 752 | $ | 2,408 | $ | 120 | Pro forma adjustment to increase selling, general and administrative expenses |
| $ | 1,653 | $ | 2,408 | $ | 120 | ||||||||||||||||||||||||
|
|
|
|
|
| |||||||||||||||||||||||||||||||||||
These preliminary estimates of fair value and estimated useful lives will likely differ from final amounts we will calculate after completing a detailed valuation analysis for Sherman-Dixie, and the difference could have a material impact on the accompanying unaudited pro forma condensed combined financial statements. A 10% change in the valuation of intangible assets would cause a corresponding increase or decrease in the balance of goodwill and annual amortization expense of approximately $0.2 million, assuming an overall weighted-average useful life of 7.5 years.
Forterra, Inc.
Notes To Unaudited Pro Forma Condensed Combined Financial Information
(USD in thousands, unless stated otherwise)
| (d) | Interest expense. Reflects the pro forma increase to interest expense from an additional draw of $80.0 million on the Revolver to fund the Sherman-Dixie Acquisition, as if the draw had occurred on January 1, 2015. Interest is floating, based on a reference rate plus an applicable margin. The weighted average annual interest rate on the Revolver was |
| Principal Amount | Weighted avg rate | Six Months Ended June 30, 2015 | Year ended December 31, 2015 | Six Months Ended June 30, 2016 | ||||||||||||||||
Interest expense on draw on Revolver | $ | 80,000 | 2.03 | % | $ | 776 | $ | 1,552 | $ | 125 | ||||||||||
Elimination of historical interest expense | (218 | ) | (450 | ) | (161 | ) | ||||||||||||||
|
|
|
|
|
| |||||||||||||||
Proforma adjustment to increase Interest expense | $ | 558 | $ | 1,102 | (36 | ) | ||||||||||||||
|
|
|
|
|
| |||||||||||||||
| (e) | Income tax (expense) benefit. Due to our limited history and the history of pre-tax losses generated by the Predecessor, deferred tax benefits were not recorded on the pro forma adjustments. The $0.9 million pro forma adjustment for the year ended December 31, 2015 reflects an acquired state tax benefit. |
Forterra, Inc.
Notes To Unaudited Pro Forma Condensed Combined Financial Information
(USD in thousands, unless stated otherwise)
5. Pro Forma Adjustments for U.S. Pipe Acquisition
We completed the acquisition of U.S. Pipe for consideration of approximately $775.1 million, in cash, subject to customary working capital adjustments. The U.S. Pipe Acquisition was funded, in part, with a draw of $205.0 million on the Revolver, of which $203.4 million was repaid during April 2016 by an affiliate in connection with the initial public offering of Forterra UK as described in greater detail in the section entitled “Our History—Recent Transactions.” The $203.4 million repayment of the Revolver by an affiliate resulted in an increase of the same amount to our allocated share of the Senior Term Loan balance. A portion of the U.S. Pipe Acquisition was financed by using $171.5 million in proceeds generated from the Sale Leaseback, and the remainder of the U.S. Pipe Acquisition was funded with a cash contribution from Lone Star. All outstanding stock options of U.S. Pipe were settled by U.S. Pipe with proceeds from the U.S. Pipe Acquisition and were not assumed by the Company. No pro forma adjustment for the historical periods have been made to reflect these options.
We have performed a preliminary valuation analysis of the fair market value of U.S. Pipe’s assets and liabilities. The following table summarizes the preliminary allocation of the purchase price as of the date of the U.S. Pipe Acquisition:
| Fair Value | ||||
Cash and cash equivalents | $ | 19,398 | ||
Receivables, net | 99,028 | |||
Inventories | 102,998 | |||
Other current assets | 4,646 | |||
Property, plant and equipment | 246,241 | |||
Customer backlog intangible | 3,900 | |||
Patents intangible | 13,000 | |||
Trade name intangible | 37,000 | |||
Customer relationship intangible | 179,000 | |||
Non-compete intangible | 3,800 | |||
|
| |||
Total identifiable assets | $ | 709,011 | ||
Trade payables | (56,873 | ) | ||
Accrued liabilities | (18,842 | ) | ||
Deferred tax liabilities | (158,397 | ) | ||
Other long term liabilities | (10,623 | ) | ||
|
| |||
Total liabilities assumed | $ | (244,735 | ) | |
Net identifiable assets acquired | 464,276 | |||
|
| |||
Goodwill | 310,834 | |||
|
| |||
Consideration transferred | $ | 775,110 | ||
|
| |||
Forterra, Inc.
Notes To Unaudited Pro Forma Condensed Combined Financial Information
(USD in thousands, unless stated otherwise)
| Fair Value | ||||
Net working capital | $ | 149,683 | ||
Property, plant and equipment, net | 246,241 | |||
Customer relationship intangible | 179,491 | |||
Trade name intangible | 37,388 | |||
Patent intangible | 13,093 | |||
Other intangibles | 7,659 | |||
Long term liabilities | (10,613 | ) | ||
Deferred tax liabilities | (160,906 | ) | ||
|
| |||
Net identifiable assets acquired | 462,036 | |||
Goodwill | 313,074 | |||
|
| |||
Cash consideration transferred | $ | 775,110 | ||
|
| |||
This preliminary purchase price allocation has been used to prepare pro forma adjustments in the unaudited pro forma condensed combined financial statements. The final purchase price allocation will be determined when we have completed the detailed valuations and necessary purchase price adjustment calculations. The final allocation could differ materially from the preliminary allocation used in the pro forma adjustments. The final allocation may include (1) changes in fair values of property, plant and equipment, (2) changes in allocations to intangible assets such as trade names, non-compete agreements and customer relationships as well as goodwill and (3) other changes to assets and liabilities.
Forterra, Inc.
Notes To Unaudited Pro Forma Condensed Combined Financial Information
(USD in thousands, unless stated otherwise)
The pro forma adjustments are based on our preliminary estimates and assumptions that are subject to change. The following adjustments have been included in the unaudited pro forma condensed combined statements of operations for the threesix months ended March 31,June 30, 2015, the year ended December 31, 2015, and the threesix months ended March 31,June 30, 2016 as if the U.S. Pipe Acquisition had occurred as of January 1, 2015 and in the unaudited pro forma condensed combined balance sheet as if the U.S. Pipe Acquisition had occurred as of March 31, 2016:2015:
| (a) | The |
Six months ended June 30, 2016:
Increase in cash and cash equivalents as of U.S. Pipe Acquisition date | $ | 17,216 | ||
Contributed capital from LSF9 Concrete Ltd | 402,127 | |||
Cash proceeds from draw on the Revolver to fund U.S. Pipe Acquisition | 205,000 | |||
Less: cash consideration to purchase U.S. Pipe | (775,110 | ) | ||
Less: transaction costs paid in connection with the acquisition | (3,517 | ) | ||
|
| |||
Pro forma adjustment to cash and cash equivalents | $ | (154,284 | ) | |
|
|
Six months ended June 30, 2015:
| (i) | an increase in net sales of $282.9 million and the |
| (ii) | an increase in selling, general and administrative expenses of $27.5 million; |
| (iii) | an increase in other |
| (iv) | an increase in other income of $0.2 million; and |
| (v) | an increase in income tax expense of $6.7 million. |
Year ended December 31, 2015:
| (i) | an increase in net sales of $618.1 million and the |
| (ii) | an increase in selling, general and administrative expenses of $47.6 million; |
| (iii) | an increase in other |
| (iv) | an increase in other income of $1.2 million; and |
| (v) | an increase in |
Forterra, Inc.
Notes To Unaudited Pro Forma Condensed Combined Financial Information
(USD in thousands, unless stated otherwise)
| Property, plant and equipment and related depreciation adjustment. Reflects the estimated adjustment of $93.6 million to increase the basis in the acquired property, plant and equipment to an estimated fair value of $246.2 million. The estimated useful lives range from |
Asset Category | Fair Value acquired | Weighted Average useful life (in years) | Six months ended June 30, 2015 | Year ended December 31, 2015 | Six months ended June 30, 2016 | |||||||||||||||||||||||||||
Land and land improvements | $ | 68,438 | 5.0 | $ | 234 | $ | 466 | $ | 136 | |||||||||||||||||||||||
Machinery and equipment | 134,990 | 5.5 | 12,178 | 24,572 | 7,147 | |||||||||||||||||||||||||||
Building and improvements | 29,949 | 12.9 | 1114 | 2328 | 734 | |||||||||||||||||||||||||||
Other equipment | 2,805 | 4.1 | 307 | 680 | 232 | |||||||||||||||||||||||||||
Construction in process | 10,059 | N/A | — | — | — | |||||||||||||||||||||||||||
| ||||||||||||||||||||||||||||||||
Total property, plant and equipment, net | $ | 246,241 | ||||||||||||||||||||||||||||||
| Three Months ended March 31, 2015 | Year ended December 31, 2015 | Three Months ended March 31, 2016 |
|
|
|
| ||||||||||||||||||||||||||
Depreciation expense for assets acquired | $ | 7,012 | $ | 28,046 | $ | 7,064 | $ | 13,833 | $ | 28,046 | $ | 8,249 | ||||||||||||||||||||
Elimination of U.S. Pipe’s historical depreciation expense | (8,584 | ) | (35,884 | ) | (9,245 | ) | (17,140 | ) | (34,839 | ) | (10,258 | ) | ||||||||||||||||||||
|
|
|
|
|
| |||||||||||||||||||||||||||
Pro forma adjustment to decrease cost of goods sold | $ | (1,572 | ) | $ | (7,838 | ) | $ | (2,181 | ) | $ | (3,307 | ) | $ | (6,793 | ) | $ | (2,009 | ) | ||||||||||||||
|
|
|
|
|
| |||||||||||||||||||||||||||
| Other intangible assets, goodwill and related amortization adjustment; selling, general and administrative expenses. |
Forterra, Inc.
Notes To Unaudited Pro Forma Condensed Combined Financial Information
(USD in thousands, unless stated otherwise)
The following table summarizes the preliminary estimated fair values of U.S. Pipe’s identifiable intangible assets, their estimated useful lives and the related amortization changes as if the assets had been acquired as of January 1, 2015:
| Estimated Fair Value | Estimated Useful Life (in years) | Three Months ended March 31, 2015 | Year ended December 31, 2015 | Three Months ended March 31, 2016 | Estimated Fair Value | Estimated Useful Life (in years) | Six Months ended June 30, 2015 | Year ended December 31, 2015 | Six Months ended June 30, 2016 | |||||||||||||||||||||||||||||||
Customer relationships | $ | 179,000 | 10 | $ | 4,872 | $ | 24,080 | $ | 6,671 | $ | 179,000 | 10 | $ | 9,743 | $ | 24,080 | $ | 7,768 | ||||||||||||||||||||||
Customer backlog | 3,900 | 1 | 1,818 | 3,900 | — | 3,900 | 1 | 1,818 | 3,900 | — | ||||||||||||||||||||||||||||||
Non-competes | 3,800 | 5 | 190 | 760 | 190 | 3,800 | 5 | 380 | 760 | 221 | ||||||||||||||||||||||||||||||
Patents | 13,000 | 10 | 595 | 2,605 | 590 | 13,000 | 10 | 1,191 | 2,605 | 687 | ||||||||||||||||||||||||||||||
Brand names | 37,000 | 10 | 1,297 | 5,677 | 1,286 | 37,000 | 10 | 2,595 | 5,677 | 1,497 | ||||||||||||||||||||||||||||||
|
|
|
|
|
|
|
| |||||||||||||||||||||||||||||||||
| $ | 236,700 | $ | 8,772 | $ | 37,022 | $ | 8,737 | $ | 236,700 | $ | 15,727 | $ | 37,022 | $ | 10,173 | |||||||||||||||||||||||||
Elimination of historical amortization expense | Elimination of historical amortization expense |
| (41 | ) | (826 | ) | (769 | ) | Elimination of historical amortization expense |
| (82 | ) | (562 | ) | (898 | ) | ||||||||||||||||||||||||
|
|
|
|
|
| |||||||||||||||||||||||||||||||||||
Pro forma adjustment to increase selling, general and administrative expenses | Pro forma adjustment to increase selling, general and administrative expenses |
| $ | 8,731 | $ | 36,196 | $ | 7,968 | Pro forma adjustment to increase selling, general and administrative expenses |
| $ | 15,645 | $ | 36,460 | $ | 9,275 | ||||||||||||||||||||||||
|
|
|
|
|
| |||||||||||||||||||||||||||||||||||
These preliminary estimates of fair value and estimated useful lives will likely differ from final amounts we will calculate after completing a detailed valuation analysis for U.S. Pipe, and the difference could have a material impact on the accompanying unaudited pro forma condensed combined financial statements. A 10% change in the valuation of intangible assets would cause a corresponding increase or decrease in the balance of goodwill and annual amortization expense of approximately $3.7 million, assuming an overall weighted-average useful life of 9.8 years.
| Debt related adjustments. |
| Removal of Historical Debt | Incurred as part of the U.S. Pipe Acquisition | Pro forma adjustment | ||||||||||
Revolver | $ | — | $ | 1,600 | $ | 1,600 | ||||||
Notes payable current portion | (82,337 | ) | — | (82,337 | ) | |||||||
Long term debt—non-current/Senior Term Loan | (169,273 | ) | 203,400 | 34,127 | ||||||||
|
|
|
|
|
| |||||||
Pro forma adjustment to debt | $ | (251,610 | ) | $ | 205,000 | $ | (46,610 | ) | ||||
|
|
|
|
|
| |||||||
Forterra, Inc.
Notes To Unaudited Pro Forma Condensed Combined Financial Information
(USD in thousands, unless stated otherwise)
The following table summarizes the pro forma decrease to interest expense resulting from the extinguishment of U.S. Pipe’s historical debt obligations and the added obligation under the Senior Term loan to partially fund the U.S. Pipe Acquisition, as if the extinguishment had been made and the increased debt obligation had existed on January 1, 2015:
| Three Months ended March 31, 2015 | Year ended December 31, 2015 | Three Months ended March 31, 2016 | Principal Amount | Interest Rate | Six Months Ended June 30, 2015 | Year ended December 31, 2015 | Six Months Ended June 30, 2016 | |||||||||||||||||||||||||
Interest expense on additional Senior Term Loan | $ | 203,400 | 6.5 | % | $ | 6,610 | $ | 13,221 | $ | 3,856 | ||||||||||||||||||||||
Elimination of amortization of debt issuance costs | (527 | ) | (1,064 | ) | (383 | ) | ||||||||||||||||||||||||||
Elimination of historical interest expense | $ | (4,618 | ) | $ | (20,175 | ) | $ | (5,649 | ) | (10,007 | ) | (19,111 | ) | (6,212 | ) | |||||||||||||||||
Elimination of amortization of debt issuance costs | (222 | ) | (1,176 | ) | (329 | ) | ||||||||||||||||||||||||||
Interest expense on new debt used to acquire U.S. Pipe | 3,305 | 13,221 | 3,305 | |||||||||||||||||||||||||||||
|
|
|
|
|
| |||||||||||||||||||||||||||
Pro forma adjustment to decrease Interest expense | $ | (1,535 | ) | $ | (8,130 | ) | $ | (2,673 | ) | $ | (3,924 | ) | $ | (6,954 | ) | $ | (2,739 | ) | ||||||||||||||
|
|
|
|
|
| |||||||||||||||||||||||||||
| Removal of Historical Equity | U.S. Pipe Acquisition | Pro forma adjustments | ||||||||||
Contributed capital from LSF9 Concrete Ltd | $ | (68,153 | ) | $ | 402,127 | $ | 333,974 | |||||
Accumulated other comprehensive income (loss) | (652 | ) | — | (652 | ) | |||||||
Retained earnings (deficit) | 45,080 | (3,517 | ) | 41,563 | ||||||||
Non-controlling interest | (40,000 | ) | — | (40,000 | ) | |||||||
|
|
|
|
|
| |||||||
Pro forma adjustment to equity | $ | (63,725 | ) | $ | 398,610 | $ | 334,885 | |||||
|
|
|
|
|
| |||||||
| Income tax (expense) benefit. Due to our limited history and the history of pre-tax losses generated by the Predecessor, deferred tax benefits were not recorded on the pro forma adjustments. |
Forterra, Inc.
Notes To Unaudited Pro Forma Condensed Combined Financial Information
(USD in thousands, unless stated otherwise)
| Pro forma effect of U.S. Pipe acquisition of Custom Fab. U.S. Pipe purchased the Custom Fab business in August 2015. This adjusts net sales, cost of goods sold, selling, general & administrative expenses and other income (expense) as if U.S. Pipe had purchased Custom Fab on January 1, 2015. The adjustments for each period are as follows: |
| March 31, 2015 | Year ended December 31, 2015 | Three Months Ended March 31, 2016 | Six Months ended 2015 | Year ended December 31, 2015 | Six Months Ended June 30, 2016 | |||||||||||||||||||
Net sales | $ | 15,935 | $ | 55,882 | $ | — | $ | 33,633 | $ | 55,882 | $ | — | ||||||||||||
Cost of goods sold | 13,562 | 47,382 | — | 28,110 | 47,382 | — | ||||||||||||||||||
|
|
|
|
|
| |||||||||||||||||||
Gross profit | 2,373 | 8,500 | — | 5,523 | 8,500 | — | ||||||||||||||||||
Selling, general and administrative expenses | (1,518 | ) | (5,329 | ) | — | (3,153 | ) | (5,329 | ) | — | ||||||||||||||
|
|
|
|
|
| |||||||||||||||||||
Income from operations | 855 | 3,171 | — | 2,370 | 3,171 | — | ||||||||||||||||||
Other expense | (16 | ) | 44 | — | (21 | ) | 44 | — | ||||||||||||||||
|
|
|
|
|
| |||||||||||||||||||
Income from continuing operations before taxes | 839 | 3,215 | — | 2,349 | 3,215 | — | ||||||||||||||||||
|
|
|
|
|
| |||||||||||||||||||
Income tax expense | — | — | — | — | — | — | ||||||||||||||||||
|
|
|
|
|
| |||||||||||||||||||
Net income | $ | 839 | $ | 3,215 | $ | — | ||||||||||||||||||
Income from continuing operations | $ | 2,349 | $ | 3,215 | $ | — | ||||||||||||||||||
|
|
|
|
|
| |||||||||||||||||||
6. Pro Forma Adjustments for Other Acquisitions
Bio Clean Acquisition
In August 2016, we completed the Bio Clean Acquisition for $30.0 million in cash, subject to customary working capital adjustments.
We performed a preliminary valuation analysis of the fair market value of Bio Clean’s assets and liabilities. The following table summarizes the preliminary allocation of the purchase price as of the date of the Bio Clean Acquisition:
| Fair Value | ||||
Net working capital | $ | 2,495 | ||
Property, plant and equipment | 169 | |||
Other long term assets | 91 | |||
|
| |||
Net identifiable assets acquired | 2,755 | |||
Goodwill | 27,245 | |||
|
| |||
Consideration transferred, net of cash acquired | $ | 30,000 | ||
|
| |||
J&G Acquisition
In September 2016, we entered into an agreement to acquire J&G for $32.0 million in cash, subject to customary working capital adjustments. We expect to complete the J&G Acquisition prior to December 31, 2016 and to fund the J&G Acquisition through a draw on the Revolver.
Forterra, Inc.
Notes To Unaudited Pro Forma Condensed Combined Financial Information
(USD in thousands, unless stated otherwise)
We performed a preliminary valuation analysis of the fair market value of J&G’s assets and liabilities. The following table summarizes the preliminary allocation of the purchase price as of the date of the execution of the definitive agreement to acquire J&G:
| Fair Value | ||||
Net working capital | $ | 2,083 | ||
Property, plant and equipment | 8,377 | |||
Other long term assets | — | |||
|
| |||
Net identifiable assets acquired | 10,460 | |||
Goodwill | 21,540 | |||
|
| |||
Consideration transferred, net of cash acquired | $ | 32,000 | ||
|
| |||
Precast Concepts Acquisition
In September 2016, we entered into an agreement to acquire Precast Concepts for $97.1 million in cash, subject to customary working capital adjustments. We expect to complete the Precast Concepts Acquisition prior to December 31, 2016 and to fund the Precast Concepts Acquisition through a draw on the Revolver.
We performed a preliminary valuation analysis of the fair market value of Precast Concepts’ assets and liabilities. The following table summarizes the preliminary allocation of the purchase price as of the date of the execution of the definitive agreement to acquire Precast Concepts:
| Fair Value | ||||
Net working capital | $ | 12,069 | ||
Property, plant and equipment | 10,269 | |||
Other long term assets | — | |||
|
| |||
Net identifiable assets acquired | 22,338 | |||
Goodwill | 74,712 | |||
|
| |||
Consideration transferred, net of cash acquired | $ | 97,050 | ||
|
| |||
| (a) | The Bio Clean Acquisition closed on August 4, 2016, and the definitive agreements to acquire J&G and Precast Concepts were signed on September 6, 2016 and September 7, 2016, respectively, and the pro forma adjustments reflect the inclusion of the historical results of operations of Bio Clean, J&G and Precast Concepts as if the acquisitions thereof had been completed on January 1, 2015. The pro forma adjustments reflect: |
Six months ended June 30, 2016:
| (i) | an increase in net sales of $38.1 million and the related increase in cost of goods sold of $23.8 million; |
| (ii) | an increase in selling, general and administrative expenses of $6.6 million; |
| (iii) | an increase in interest expense of $0.8 million; and |
Forterra, Inc.
Notes To Unaudited Pro Forma Condensed Combined Financial Information
(USD in thousands, unless stated otherwise)
| (iv) | an increase in income tax expense of $2.6 million: |
| Bio Clean | J&G | Precast Concepts | Total | |||||||||||||
Net sales | $ | 8,839 | $ | 7,798 | $ | 21,446 | $ | 38,083 | ||||||||
Cost of goods sold | 4,762 | 5,532 | 13,519 | 23,813 | ||||||||||||
|
|
|
|
|
|
|
| |||||||||
Gross profit | $ | 4,077 | $ | 2,266 | $ | 7,927 | $ | 14,270 | ||||||||
Selling, general & administrative expenses | (2,084 | ) | (1,559 | ) | (2,918 | ) | (6,561 | ) | ||||||||
Other operating income (expense), net | — | — | — | — | ||||||||||||
|
|
|
|
|
|
|
| |||||||||
Income (loss) from operations | $ | 1,993 | $ | 707 | $ | 5,009 | $ | 7,709 | ||||||||
Other income (expenses) | ||||||||||||||||
Interest expense | — | (793 | ) | — | (793 | ) | ||||||||||
Other income (expenses), net | — | (86 | ) | 158 | 72 | |||||||||||
|
|
|
|
|
|
|
| |||||||||
Income (loss) from continuing operations before income taxes | 1,993 | (172 | ) | 5,167 | 6,988 | |||||||||||
Income tax (expense) benefit | (737 | ) | 63 | (1,912 | ) | (2,586 | ) | |||||||||
|
|
|
|
|
|
|
| |||||||||
Income (loss) from continuing operations | $ | 1,256 | $ | (109 | ) | $ | 3,255 | $ | 4,402 | |||||||
|
|
|
|
|
|
|
| |||||||||
Forterra, Inc.
Notes To Unaudited Pro Forma Condensed Combined Financial Information
(USD in thousands, unless stated otherwise)
Six months ended June 30, 2015:
| (i) | an increase in net sales of $30.2 million and the related increase in cost of goods sold of $17.8 million; |
| (ii) | an increase in selling, general and administrative expenses of $5.9 million; |
| (iii) | an increase in interest expense of $0.2 million; and |
| (iv) | an increase in tax expense of $2.4 million: |
| Bio Clean | J&G | Precast Concepts | Total | |||||||||||||
Net sales | $ | 5,271 | $ | 8,762 | $ | 16,210 | $ | 30,243 | ||||||||
Cost of goods sold | 2,840 | 6,356 | 8,558 | 17,754 | ||||||||||||
|
|
|
|
|
|
|
| |||||||||
Gross profit | $ | 2,431 | $ | 2,406 | $ | 7,652 | $ | 12,489 | ||||||||
Selling, general & administrative expenses | (1,426 | ) | (1,752 | ) | (2,756 | ) | (5,934 | ) | ||||||||
Other operating income (expense), net | — | — | — | — | ||||||||||||
|
|
|
|
|
|
|
| |||||||||
Income (loss) from operations | $ | 1,005 | $ | 654 | $ | 4,896 | $ | 6,555 | ||||||||
Other income (expenses) | ||||||||||||||||
Interest expense | — | (223 | ) | — | (223 | ) | ||||||||||
Other income (expenses), net | — | — | 39 | 39 | ||||||||||||
|
|
|
|
|
|
|
| |||||||||
Income (loss) from continuing operations before income taxes | 1,005 | 431 | 4,935 | 6,371 | ||||||||||||
Income tax (expense) benefit | (372 | ) | (159 | ) | (1,826 | ) | (2,357 | ) | ||||||||
|
|
|
|
|
|
|
| |||||||||
Income (loss) from continuing operations | $ | 633 | $ | 272 | $ | 3,109 | $ | 4,014 | ||||||||
|
|
|
|
|
|
|
| |||||||||
Year ended December 31, 2015:
| (i) | an increase in net sales of $69.2 million and the related increase in cost of goods sold of $41.8 million; |
| (ii) | an increase in selling, general and administrative expenses of $14.7 million; |
| (iii) | an increase in interest expense of $1.0 million; and |
Forterra, Inc.
Notes To Unaudited Pro Forma Condensed Combined Financial Information
(USD in thousands, unless stated otherwise)
| (iv) | an increase in tax expense of $4.3 million: |
| Bio Clean | J&G | Precast Concepts | Total | |||||||||||||
Net sales | $ | 13,417 | $ | 21,589 | $ | 34,178 | $ | 69,184 | ||||||||
Cost of goods sold | 6,388 | 15,496 | 19,902 | 41,786 | ||||||||||||
|
|
|
|
|
|
|
| |||||||||
Gross profit | $ | 7,029 | $ | 6,093 | $ | 14,276 | $ | 27,398 | ||||||||
Selling, general & administrative expenses | (4,286 | ) | (4,006 | ) | (6,415 | ) | (14,707 | ) | ||||||||
Other operating income (expense), net | — | — | — | — | ||||||||||||
|
|
|
|
|
|
|
| |||||||||
Income (loss) from operations | $ | 2,743 | $ | 2,087 | $ | 7,861 | $ | 12,691 | ||||||||
Other income (expenses) | ||||||||||||||||
Interest expense | — | (959 | ) | — | (959 | ) | ||||||||||
Other income (expenses), net | — | — | 14 | 14 | ||||||||||||
|
|
|
|
|
|
|
| |||||||||
Income (loss) from continuing operations before income taxes | 2,743 | 1,128 | 7,875 | 11,746 | ||||||||||||
Income tax (expense) benefit | (1,015 | ) | (417 | ) | (2,914 | ) | (4,346 | ) | ||||||||
|
|
|
|
|
|
|
| |||||||||
Income (loss) from continuing operations | $ | 1,728 | $ | 711 | $ | 4,961 | $ | 7,400 | ||||||||
|
|
|
|
|
|
|
| |||||||||
| (b) | The pro forma adjustments are based on our preliminary estimates and assumptions that are subject to change. The following historical results and adjustments have been included in the unaudited pro forma condensed combined balance sheet as if the Bio Clean Acquisition, J&G Acquisition and Precast Concepts Acquisition had each occurred as of June 30, 2016: |
| (i) | a decrease to cash and cash equivalents to reflect $30.0 million of cash used to fund the Bio Clean Acquisition; |
| (ii) | an increase in receivables, net of $13.2 million; |
| (iii) | an increase in inventories of $9.4 million; |
| (iv) | an increase in property, plant and equipment, net of $18.8 million; |
| (v) | an increase to goodwill of $123.5 million based on the consideration transferred, net of cash acquired and net identifiable assets acquired of Bio Clean, J&G and Precast Concepts; |
| (vi) | an increase in trade payables of $4.4 million; |
| (vii) | an increase in accrued liabilities of $1.7 million; and |
Forterra, Inc.
Notes To Unaudited Pro Forma Condensed Combined Financial Information
(USD in thousands, unless stated otherwise)
| (viii) | an increase in the Revolving Credit Facility of $129.1 million to finance the J&G Acquisition and Precast Concepts Acquisition. |
| Bio Clean | J&G | Precast Concepts | Total | |||||||||||||
ASSETS | ||||||||||||||||
Current assets | ||||||||||||||||
Cash and cash equivalents | $ | (30,000 | ) | $ | — | $ | — | $ | (30,000 | ) | ||||||
Receivables, net | 3,871 | 1,961 | 7,405 | 13,237 | ||||||||||||
Inventories | — | 2,928 | 6,512 | 9,440 | ||||||||||||
Prepaids and other current assets | 25 | — | 48 | 73 | ||||||||||||
|
|
|
|
|
|
|
| |||||||||
Total current assets | (26,104 | ) | 4,889 | 13,965 | (7,250 | ) | ||||||||||
|
|
|
|
|
|
|
| |||||||||
Non-current assets | ||||||||||||||||
Property, plant and equipment, net | 169 | 8,377 | 10,269 | 18,815 | ||||||||||||
Goodwill and other intangible assets, net | 27,245 | 21,540 | 74,712 | 123,497 | ||||||||||||
Other long term assets | 91 | — | — | 91 | ||||||||||||
|
|
|
|
|
|
|
| |||||||||
Total assets | $ | 1,401 | $ | 34,806 | $ | 98,946 | $ | 135,153 | ||||||||
|
|
|
|
|
|
|
| |||||||||
LIABILITIES AND EQUITY | ||||||||||||||||
Current liabilities | ||||||||||||||||
Trade payables | $ | 1,265 | $ | 2,093 | $ | 1,067 | $ | 4,425 | ||||||||
Accrued liabilities | 136 | 713 | 829 | 1,678 | ||||||||||||
|
|
|
|
|
|
|
| |||||||||
Total current liabilities | 1,401 | 2,806 | 1,896 | 6,103 | ||||||||||||
|
|
|
|
|
|
|
| |||||||||
Non-current liabilities | ||||||||||||||||
Revolving Credit Facility | — | 32,000 | 97,050 | 129,050 | ||||||||||||
|
|
|
|
|
|
|
| |||||||||
Total liabilities | 1,401 | 34,806 | 98,946 | 135,153 | ||||||||||||
|
|
|
|
|
|
|
| |||||||||
Equity | ||||||||||||||||
Total equity | — | — | — | — | ||||||||||||
|
|
|
|
|
|
|
| |||||||||
Total liabilities and equity | $ | 1,401 | $ | 34,806 | $ | 98,946 | $ | 135,153 | ||||||||
|
|
|
|
|
|
|
| |||||||||
7. Bricks Disposition
Mid Holdings entered into an agreement, subject to regulatory approval, to dispose of our Bricks segment on August 23, 2016. In connection with this agreement, prior to the consummation of this offering, we will distribute our bricks business to Mid Holdings or its affiliate in the Bricks Disposition.
| (a) | The Bricks Disposition will occur prior to the consummation of this offering and the pro forma adjustments reflect the removal of the historical results of operations of our Bricks segment as if the Bricks Disposition occurred on January 1, 2015. The pro forma adjustments reflect: |
Forterra, Inc.
Notes To Unaudited Pro Forma Condensed Combined Financial Information
(USD in thousands, unless stated otherwise)
Six months ended June 30, 2016:
| (i) | a decrease in net sales of $71.4 million and the related decrease in cost of goods sold of $59.4 million; |
| (ii) | a decrease in selling, general and administrative expenses of $7.9 million; |
| (iii) | an increase in other operating income, net of $0.8 million; and |
| (iv) | an increase in income tax benefit of $0.7 million. |
Six months ended June 30, 2015:
| (i) | a decrease in net sales of $65.5 million and the related decrease in cost of goods sold of $66.1 million; |
| (ii) | a decrease in selling, general and administrative expenses of $8.5 million; and |
| (iii) | a decrease in other operating income, net of $1.5 million. |
Year ended December 31, 2015:
| (i) | a decrease in net sales of $138.3 million and the related decrease in cost of goods sold of $132.1 million; |
| (ii) | a decrease in selling, general and administrative expenses of $18.0 million; |
| (iii) | an increase in other operating income, net of $0.3 million; |
| (iv) | a decrease in interest expense of $0.2 million; and |
| (v) | a decrease in income tax benefit of $1.8 million. |
| b) | The pro forma adjustments are based on our preliminary estimates and assumptions that are subject to change. The following historical results and adjustments have been included in the unaudited pro forma condensed combined balance sheet as if the Bricks Disposition occurred as of June 30, 2016: |
| i) | a decrease in receivables, net of $18.0 million; |
| ii) | a decrease in inventory of $44.4 million; |
| iii) | a decrease in prepaids and other current assets of $0.5 million; |
| iv) | a decrease in property, plant and equipment, net of $75.5 million; |
| v) | a decrease in trade payables of $10.1 million; |
| vi) | a decrease in accrued liabilities of $9.3 million; |
| vii) | an increase in tax liability from the Bricks Disposition of $32.3 million. We anticipate we will incur a tax liability with respect to a taxable gain on the disposal as well as a tax withholding obligation. The amount of the liability cannot be determined, but is currently estimated to be approximately $32.3 million; |
| viii) | an increase in deferred tax liabilities of $5.0 million; |
| ix) | a decrease in derivative liability of $1.0 million; |
Forterra, Inc.
Notes To Unaudited Pro Forma Condensed Combined Financial Information
(USD in thousands, unless stated otherwise)
| x) | a decrease in other long term liabilities of $1.1 million; and |
| xi) | a decrease in contributed capital of $154.1 million, due to the disposition of net assets to a common control affiliate of $121.8 million and tax liability from the Brick Disposition of $32.3 million. |
As described in the section entitled “Prospectus Summary—Our History—Recent Transactions,” we will have no relation to or business affiliation with our then-former bricks business other than a limited transition service agreement, the short-term loan described under “Certain Relationships and Related Party Transactions—Loan to Bricks Business” and the temporary use of the “Forterra” name. We are unable to estimate a probable duration for the transition services agreement, but we do not expect it to extend beyond one year, thus, we have not made a pro forma adjustment to reflect the impact of the agreement.
8. Pro Forma Adjustments for Sale Leaseback
In April 2016, we sold and simultaneously leased back 49 properties in the United States and Eastern Canada in a transaction with two unrelated third parties, Pipe Portfolio Owner (Multi) LP, or the U.S. Property Buyer, and FORT-BEN Holdings (ONQC) LTD., or the Canadian Property Buyer, for an aggregate consideration of $216.2 million. We entered into master land and building agreements with the U.S. Property Buyer governing the properties located in the United States, or the U.S. Master Lease, and with FORT-NOM Holdings (ONQC) LTD., or the Canadian Property Lessor, an affiliate of the Canadian Property Buyer, governing the properties located in Canada, or the Canadian Master Lease, pursuant to which we agreed to lease back each of the properties for an initial 20 year term. We have options to extend each master lease for an additional nine years and 11 months. The terms of the Sale Leaseback are described in greater detail in the section entitled “Description of Certain Indebtedness—Sale Leaseback.”
The Sale Leaseback was assessed under ASC 360 and ASC 840 to determine the proper accounting treatment and classification of the leases. At lease inception, we (as the seller-lessee) arewere considered to have a form of prohibited “continuing involvement” with the properties because we provideConcrete Holdings provided each of the U.S. Property Buyer (as buyer-lessor) with respect to the U.S. Master Lease and the Canadian Property Buyer (each asLessor (as the buyer-lessor)lessor) with respect to the Canadian Master Lease with a guarantee that serves as additional collateral that reduces the buyer-lessor’s or the lessor’s, as applicable, risk of loss. As a result, we arewere precluded from applying sale-leaseback accounting to the Sale Leaseback and the assets subject to the Sale Leaseback remain on the balance sheet and continue to be depreciated over their remaining useful lives as a “failed sale-leaseback.”
The Further aggregate net proceeds of $209.7 million, after payment of transaction costs, is recorded as a receipt of cash and corresponding financing obligation liability on the unaudited pro forma condensed combined balance sheet. We do not report rent expense for the properties which are owned for accounting purposes. Rather, payments under the master land and building agreements arereceived were recognized as a reductionfinancing obligation liability.
On September 22, 2016, we entered into agreements with the Sale Leaseback parties regarding the aforementioned guarantees. Pursuant to these agreements, we and the Sale Leaseback parties have agreed to enter into new guarantees with Forterra, Inc. as the guarantor, with these new guarantees replacing the guarantees originally provided by Concrete Holdings in April 2016. The new guarantees will become effective immediately following completion of the financing obligationReorganization and prior to the consummation of this offering. As a result of the change in guarantor, we (as the seller-lessee) will no longer be considered to have a form of prohibited “continuing involvement” with the properties. As such, upon effectiveness of the replacement guarantees, the Sale Leaseback may be classified as interest expense. The unaudited pro forma condensed combined statement of operations for the three months ended March 31, 2016 andan
Forterra, Inc.
Notes To Unaudited Pro Forma Condensed Combined Financial Information
(USD in thousands, unless stated otherwise)
March 31, 2015operating lease as determined by ASC 360 and the year ended December 31, 2015 include pro forma adjustments which give effect to increased interest expense of $4.3 million, $4.2 million and $17.0 million, respectively, related to the financing obligation as if the Sale Leaseback had occurred on January 1, 2015.ASC 840. For greater detail, see section entitled “Description of Certain Indebtedness-Sale Leaseback.”
7.
| (a) | We did not report rent expense for the properties which were owned for accounting purposes while the Sale Leaseback was classified as a “failed sale-leaseback.” Rather, payments under the U.S. Master Lease and Canadian Master Lease were recognized as a reduction of the financing obligation and as interest expense. Due to the agreed upon change in the guarantor that will become effective immediately following the consummation of the Reorganization and prior to the consummation of this offering, following the effectiveness thereof, we will record increased rent expense and a decrease in depreciation corresponding to the decrease in property, plant and equipment, net, for the properties that qualified as sale under ASC 360. Additionally, when the Sale Leaseback properties qualify as being sold under ASC 360 we will recognize a loss of $18.7 million, which will be recognized immediately, and a gain of $77.7 million, which will be deferred over the life of the lease on a straight line basis. In accordance with Article 11 of Regulation S-X, the initial loss of $18.7 million is not reflected in the unaudited pro forma condensed combined statements of operations and amortization of the $77.7 million deferred gain is reflected in the unaudited pro forma condensed combined statements of operations as if the Sale Leaseback had occurred as of January 1, 2015. The unaudited pro forma condensed combined statements of operations for the six months ended June 30, 2016 and June 30, 2015 and the year ended December 31, 2015 include the following pro forma adjustments which give effect to the Sale Leaseback and agreed upon change in guarantor as if they had occurred on January 1, 2015: |
Six months ended June 30, 2016:
| (i) | an increase in cost of goods sold of $8.2 million to reflect an increase in rent expense and a reduction to depreciation; |
| (ii) | a decrease in other operating expense of $1.1 million to reflect the amortization of the deferred gain; |
| (iii) | a decrease in interest expense of $3.8 million; and |
Forterra, Inc.
Notes To Unaudited Pro Forma Condensed Combined Financial Information
(USD in thousands, unless stated otherwise)
| (iv) | an increase in income tax benefit of $1.2 million. |
| Remove Depreciation Expense of Historical Assets and Failed Sale Leaseback | Record Sale Leaseback | Net Adjustment | ||||||||||
Net sales | $ | — | $ | — | $ | — | ||||||
Cost of goods sold | (2,607 | ) | 10,795 | 8,188 | ||||||||
|
|
|
|
|
| |||||||
Gross profit | $ | 2,607 | $ | (10,795 | ) | $ | (8,188 | ) | ||||
Selling, general & administrative expenses | — | — | — | |||||||||
Other operating income (loss) | — | 1,062 | 1,062 | |||||||||
|
|
|
|
|
| |||||||
Income (loss) from operations | $ | 2,607 | $ | (9,733 | ) | $ | (7,126 | ) | ||||
Other income (expenses) | ||||||||||||
Interest expense | 4,038 | (201 | ) | 3,837 | ||||||||
Income (loss) from continuing operations before income taxes | 6,645 | (9,934 | ) | (3,289 | ) | |||||||
Income tax (expense) benefit | (2,459 | ) | 3,676 | 1,217 | ||||||||
|
|
|
|
|
| |||||||
Income (loss) from continuing operations | $ | 4,186 | $ | (6,258 | ) | $ | (2,072 | ) | ||||
|
|
|
|
|
| |||||||
Forterra, Inc.
Notes To Unaudited Pro Forma Condensed Combined Financial Information
(USD in thousands, unless stated otherwise)
Six months ended June 30, 2015:
| (i) | an increase in cost of goods sold of $8.2 million to reflect an increase in rent expense and a reduction to depreciation; |
| (ii) | a decrease in other operating expense of $1.0 million to reflect the amortization of the deferred gain; |
| (iii) | an increase in interest expense of $0.2 million; and |
| (iv) | an increase in income tax benefit of $2.7 million. |
| Remove Depreciation Expense of Historical Assets | Record Sale Leaseback | Net Adjustment | ||||||||||
Net sales | $ | — | $ | — | $ | — | ||||||
Cost of goods sold | (2,607 | ) | 10,795 | 8,188 | ||||||||
|
|
|
|
|
| |||||||
Gross profit | $ | 2,607 | $ | (10,795 | ) | $ | (8,188 | ) | ||||
Selling, general & administrative expenses | — | — | — | |||||||||
Other operating income (loss) | — | 1,002 | 1,002 | |||||||||
|
|
|
|
|
| |||||||
Income (loss) from operations | $ | 2,607 | $ | (9,793 | ) | $ | (7,186 | ) | ||||
Other income (expenses) | ||||||||||||
Interest expense | — | (200 | ) | $ | (200 | ) | ||||||
Income (loss) from continuing operations before income taxes | 2,607 | (9,993 | ) | (7,386 | ) | |||||||
Income tax (expense) benefit | (965 | ) | 3,698 | 2,733 | ||||||||
|
|
|
|
|
| |||||||
Income (loss) from continuing operations | $ | 1,642 | $ | (6,295 | ) | $ | (4,653 | ) | ||||
|
|
|
|
|
| |||||||
Forterra, Inc.
Notes To Unaudited Pro Forma Condensed Combined Financial Information
(USD in thousands, unless stated otherwise)
Year ended December 31, 2015:
| (i) | an increase in cost of goods sold of $16.4 million to reflect an increase in rent expense and a reduction to depreciation; |
| (ii) | a decrease in other operating expense of $2.0 million to reflect the amortization of the deferred gain; |
| (iii) | an increase in interest expense of $0.4 million; and |
| (iv) | an increase in income tax benefit of $5.5 million. |
| Remove Depreciation Expense of Historical Assets | Record Sale Leaseback | Net Adjustment | ||||||||||
Net sales | $ | — | $ | — | $ | — | ||||||
Cost of goods sold | (5,214 | ) | 21,590 | 16,376 | ||||||||
|
|
|
|
|
| |||||||
Gross profit | $ | 5,214 | $ | (21,590 | ) | $ | (16,376 | ) | ||||
Selling, general & administrative expenses | — | — | — | |||||||||
Other operating income (loss) | 2,004 | $ | 2,004 | |||||||||
|
|
|
|
|
| |||||||
Income (loss) from operations | $ | 5,214 | $ | (19,586 | ) | $ | (14,372 | ) | ||||
Other income (expenses) | ||||||||||||
Interest expense | — | (401 | ) | $ | (401 | ) | ||||||
Income (loss) from continuing operations before income taxes | 5,214 | (19,987 | ) | (14,773 | ) | |||||||
Income tax (expense) benefit | (1,929 | ) | 7,395 | 5,466 | ||||||||
|
|
|
|
|
| |||||||
Income (loss) from continuing operations | $ | 3,285 | $ | (12,592 | ) | $ | (9,307 | ) | ||||
|
|
|
|
|
| |||||||
Forterra, Inc.
Notes To Unaudited Pro Forma Condensed Combined Financial Information
(USD in thousands, unless stated otherwise)
| (b) | The aggregate net proceeds of the Sale Leaseback transaction was $209.7 million, after payment of transaction costs. We have recorded the following adjustments to the unaudited pro forma condensed balance sheet to affect the agreed upon change in guarantor as if it occurred on June 30, 2016: |
| Remove Historical Failed Sale Leaseback | Record Sale Leaseback | Net Adjustment | ||||||||||
Reduction in property plant and equipment, net for assets qualifying as sale | $ | (159,010 | ) | $ | 4,253 | $ | (154,757 | ) | ||||
Increase in other assets due to the reclass of transactions costs, previously netted with the financing obligation | — | 6,500 | 6,500 | |||||||||
|
| |||||||||||
Assets | $ | (148,257 | ) | |||||||||
|
| |||||||||||
Increase in accrued liabilities due to the tax payable associated with the deferred gain on Sale Leaseback | — | 29,711 | 29,711 | |||||||||
Decrease of the financing obligation, previously recorded as a Failed Sale Leaseback | $ | (210,934 | ) | $ | — | $ | (210,934 | ) | ||||
Increase in capital lease liability for assets that met the criteria for a capital lease | — | 3,705 | 3,705 | |||||||||
Increase in Deferred Gain on Sale Leaseback | — | 77,657 | 77,657 | |||||||||
Decrease in deferred tax liability due to the deferred gain on Sale Leaseback | — | (29,711 | ) | (29,711 | ) | |||||||
Decrease in retained earnings to affect the initial loss on sale of certain properties | — | (18,685 | ) | (18,685 | ) | |||||||
|
| |||||||||||
Liabilities and Equity | $ | (148,257 | ) | |||||||||
|
| |||||||||||
9. Pro Forma Adjustments for Debt Recapitalization
On June 16,17, 2016, an incremental $345 million was borrowed on the Senior Term Loan (guaranteed by our operating subsidiaries) and used the proceeds to pay a dividend of the same amount$338 million to its shareholders.shareholders (recorded as a return of contributed capital). Concrete Holdings incurred debt issuance fees and discount of $3.2 million and $3.5 million, respectively, in connection with the issuance of the debt. We will recognize the full amount of the incremental borrowing, net of related issuance costs and discount, as a debt obligation during the second quarter of 2016. The debt issuance fees are reflected as a pro forma adjustment to cash as if the transaction occurred as of March 31, 2016. The incremental borrowing incurs interest at the same rate as the Senior Term Loan and matures in March 2022.
The unaudited pro forma condensed combined statement of operations for the threesix months ended March 31,June 30, 2016 and March 31,June 30, 2015 and the year ended December 31, 2015 include pro forma adjustments which give effect to increased long term debt obligation, interest expense original issue discount and debt issuance costs as if the Debt Recapitalization had occurred on January 1, 2015.
As with the original issuance, the interest rate for the new debt under the Senior Term loan is set at LIBOR (with a 1% floor) plus a margin of 5.5%. A rise of current interest rate levels to above the 1% floor would be required to increase our interest expense and a reduction in interest rates would have no impact. A hypothetical 1/8 percent change in the rates applicable to our variable rate debt would have increased interest expense by $0.1 million for the threesix months ended March 31,June 30, 2016 and March 31, June 30,
Forterra, Inc.
Notes To Unaudited Pro Forma Condensed Combined Financial Information
(USD in thousands, unless stated otherwise)
2015 and would have increased interest expense by $0.4 million for the year ended December 31, 2015.
8.
| Principal Amount | Interest Rate | Six Months Ended June 30, 2015 | Year ended December 31, 2015 | Six Months Ended June 30, 2016 | ||||||||||||||||
Senior Term loan | $ | 345,000 | 6.5 | % | $ | 11,212 | $ | 22,425 | $ | 10,278 | ||||||||||
Amortization of new debt issuance costs and discount | 466 | 931 | 427 | |||||||||||||||||
|
|
|
|
|
| |||||||||||||||
Proforma adjustment to increase Interest expense | $ | 11,678 | $ | 23,356 | $ | 10,705 | ||||||||||||||
|
|
|
|
|
| |||||||||||||||
Adjustment to weighted average shares outstanding
For purposes of presenting pro forma earnings or loss per share data, the denominator in the calculation for weighted average shares outstanding is adjusted to include common shares associated with proceeds from this offering that will be used to repay outstanding indebtedness. Additionally, a dividend declared in the latest year is deemed to be in contemplation of this offering with the intention of repayment out of the offering proceeds to the extent the dividend exceeded earnings during the previous twelve months. As the total of the dividends declared in the latest year and amount we intend to use from the proceeds we receive in the offering to repay indebtedness exceed the total common shares associated with the offering, we have included all of the shares to be offered by the Company in this offering in the calculation of pro forma weighted average shares outstanding.
10. Pro Forma Adjustments for Offering
The Pro Forma Combined amounts to not currently reflect the receipt of or any anticipated application of proceeds from this offering. Upon completion of this offering, we will issue and sell 18,420,000 shares of common stock and receive net proceeds, after deducting estimated offering expenses payable by us and underwriting discounts and commissions of approximately $$340.0 million, assuming an initial offering price of $$20.00 per share (the mid-point of the price range set forth on the cover page of this prospectus) in connection therewith and the use of proceeds as described in greater detail in the section entitled “Use of Proceeds.” We intend to use $ milliona portion of the net proceeds received by us from this offering to repay outstanding indebtedness which, for the three months ended March 31, 2016 and March 31, 2015 and the year ended December 31, 2015 would resultfollowing indebtedness:
| Repayment Amount | Interest Rate |
| Six Months Ended June 30, 2015 | Year ended December 31, 2015 | Six Months Ended June 30, 2016 | |||||||||||||||||
Junior Term Loan | $ | 260,000 | 10.5 | % | Decrease in interest expense | $ | 13,726 | $ | 27,679 | $ | 13,802 | |||||||||||
Junior Term Loan | Decrease in amortization of original issue discount and debt issuance costs | 1,633 | 3,282 | 1,630 | ||||||||||||||||||
Senior Term Loan | 36,000 | 6.5 | % | Decrease in interest expense | 1,170 | 2,340 | 1,170 | |||||||||||||||
|
|
|
|
|
|
|
| |||||||||||||||
Proceeds used for repayment | $ | 296,000 | Total decrease in interest expense | 16,529 | 33,301 | 16,602 | ||||||||||||||||
|
|
|
|
|
|
|
| |||||||||||||||
| Related income tax expense | (6,116 | ) | (12,321 | ) | (6,143 | ) | ||||||||||||||||
|
|
|
|
|
| |||||||||||||||||
| Total income statement effect | $ | 10,413 | $ | 20,980 | $ | 10,459 | ||||||||||||||||
|
|
|
|
|
| |||||||||||||||||
Forterra, Inc.
Notes To Unaudited Pro Forma Condensed Combined Financial Information
(USD in pro forma adjustments to eliminate interest expense of $ , $ and $ , respectively. thousands, unless stated otherwise)
We intend to use the remaining net proceeds for working capital and for general corporate purposes. For more detail, see “Use of Proceeds.” In connection with the repayment of the Junior Term Loan we will incur a prepayment penalty of approximately $7.8 million and a write off of deferred issuance costs and remaining original issue discount of $21.9 million. These are reflected as an increase to retained deficit of $29.7 million on the unaudited pro forma condensed balance sheet.
As described in greater detail in the section entitled “Certain Relationships and Related-Party Transactions — Tax Receivable Agreement,” in connection with this offering, we will enter into a tax receivable agreement with Lone Star that will provide for the payment by us to Lone Star of 85% of the amount of Covered Tax Benefits, which may reduce the actual liability for certain taxes that we might otherwise be required to pay. The anticipated payments under the tax receivable agreement that are related to the Covered Tax Benefits have been reflected in the pro forma adjustments.
For purposes of the tax receivable agreement, the aggregate reduction in income tax payable by us will be computed by comparing our actual income tax liability with our hypothetical liability had we not been able to utilize the Covered Tax Benefits. The agreement will become effective upon completion of this offering and will remain in effect until all such Covered Tax Benefits remain.
| (a) | Reflects the impact of the tax receivable agreement, as described in the section entitled “Certain Relationships and Related-Party Transactions — Tax Receivable Agreement,” which results in an increase of $119.0 million in liability to Lone Star and a decrease of $119.0 million in contributed capital to reflect the distribution to Lone Star. Based upon our preliminary estimates, we estimate that the liability will be between $114.0 million and $124.0 million. We have assumed a liability of $119.0 million for the pro forma adjustment as of the offering date, which is subject to change. Additionally, this adjustment also reflects the increase to common stock and contributed capital related to the offering of $340.0 million less capitalized costs of $2.5 million. The net adjustment to contributed capital is $218.3 million. |
Forterra, Inc.
Notes To Unaudited Pro Forma Condensed Combined Financial Information
(USD in thousands, unless stated otherwise)
9.11. Unaudited Pro Forma Condensed Combined Segment Results
The following tables provide the pro forma combined operating results by segment for each period presented (in thousands):
For the ThreeSix Months Ended March 31,June 30, 2016
| Water Pipe & Products | Drainage Pipe & Products | Bricks | Corporate and Other | Pro Forma Combined | Water Pipe & Products | Drainage Pipe & Products | Bricks | Corporate and Other | Pro Forma Combined | |||||||||||||||||||||||||||||||
Net sales | $ | 182,327 | $ | 147,214 | $ | 30,338 | $ | 2,204 | $ | 362,083 | $ | 403,059 | $ | 377,525 | $ | — | $ | 2,528 | $ | 783,112 | ||||||||||||||||||||
Cost of goods sold | 148,214 | 116,371 | 28,097 | 3,090 | 295,772 | 334,172 | 290,828 | — | 3,627 | 628,627 | ||||||||||||||||||||||||||||||
|
|
|
|
|
|
|
|
|
| |||||||||||||||||||||||||||||||
Gross profit (loss) | $ | 34,113 | $ | 30,843 | $ | 2,241 | $ | (886 | ) | $ | 66,311 | |||||||||||||||||||||||||||||
Gross profit | $ | 68,887 | $ | 86,697 | $ | — | $ | (1,099 | ) | $ | 154,485 | |||||||||||||||||||||||||||||
Selling, general & administrative expenses and other | (24,997 | ) | (12,950 | ) | (3,815 | ) | (15,572 | ) | (57,334 | ) | (41,405 | ) | (29,819 | ) | — | (38,341 | ) | (109,565 | ) | |||||||||||||||||||||
|
|
|
|
|
|
|
|
|
| |||||||||||||||||||||||||||||||
Income (loss) from operations | $ | 9,116 | $ | 17,893 | $ | (1,574 | ) | $ | (16,458 | ) | $ | 8,977 | $ | 27,482 | $ | 56,878 | $ | — | $ | (39,440 | ) | $ | 44,920 | |||||||||||||||||
Other income (expenses) | ||||||||||||||||||||||||||||||||||||||||
Interest expense | (814 | ) | (3,513 | ) | — | (26,230 | ) | (30,557 | ) | (13 | ) | (984 | ) | — | (29,416 | ) | (30,413 | ) | ||||||||||||||||||||||
Other income (expenses), net | 431 | (30 | ) | — | (378 | ) | 23 | 49 | 26 | — | (1,078 | ) | (1,003 | ) | ||||||||||||||||||||||||||
|
|
|
|
|
|
|
|
|
| |||||||||||||||||||||||||||||||
Income (loss) from continuing operations before income taxes | 8,733 | 14,350 | (1,574 | ) | (43,066 | ) | (21,557 | ) | 27,518 | 55,920 | — | (69,934 | ) | 13,504 | ||||||||||||||||||||||||||
Income tax (expense) benefit | (2,669 | ) | 11,011 | (200 | ) | — | 8,142 | (5,088 | ) | 37,214 | — | (6,143 | ) | 25,983 | ||||||||||||||||||||||||||
|
|
|
|
|
|
|
|
|
| |||||||||||||||||||||||||||||||
Net income (loss) | $ | 6,064 | $ | 25,361 | $ | (1,774 | ) | $ | (43,066 | ) | $ | (13,415 | ) | |||||||||||||||||||||||||||
Income (loss) from continuing operations | $ | 22,430 | $ | 93,134 | $ | — | $ | (76,077 | ) | $ | 39,487 | |||||||||||||||||||||||||||||
|
|
|
|
|
|
|
|
|
| |||||||||||||||||||||||||||||||
For the ThreeSix Months Ended March 31,June 30, 2015
| Water Pipe & Products | Drainage Pipe & Products | Bricks | Corporate and Other | Pro Forma Combined | Water Pipe & Products | Drainage Pipe & Products | Bricks | Corporate and Other | Pro Forma Combined | |||||||||||||||||||||||||||||||
Net sales | $ | 181,514 | $ | 129,908 | $ | 25,856 | $ | 3,376 | $ | 340,654 | $ | 408,907 | $ | 349,589 | $ | — | $ | 5,676 | $ | 764,172 | ||||||||||||||||||||
Cost of goods sold | 161,522 | 117,973 | 25,948 | 2,845 | 308,288 | 349,578 | 299,973 | — | 5,305 | 654,856 | ||||||||||||||||||||||||||||||
|
|
|
|
|
|
|
|
|
| |||||||||||||||||||||||||||||||
Gross profit (loss) | $ | 19,992 | $ | 11,935 | $ | (92 | ) | $ | 531 | $ | 32,366 | |||||||||||||||||||||||||||||
Gross profit | $ | 59,329 | $ | 49,616 | $ | — | $ | 371 | $ | 109,316 | ||||||||||||||||||||||||||||||
Selling, general & administrative expenses and other | (26,936 | ) | (8,655 | ) | (3,636 | ) | (28,420 | ) | (67,647 | ) | (52,411 | ) | (27,987 | ) | — | (40,416 | ) | (120,814 | ) | |||||||||||||||||||||
|
|
|
|
|
|
|
|
|
| |||||||||||||||||||||||||||||||
Income (loss) from operations | $ | (6,944 | ) | $ | 3,280 | $ | (3,728 | ) | $ | (27,889 | ) | $ | (35,281 | ) | $ | 6,918 | $ | 21,629 | $ | — | $ | (40,045 | ) | $ | (11,498 | ) | ||||||||||||||
Other income (expenses) | ||||||||||||||||||||||||||||||||||||||||
Interest expense | (798 | ) | (3,444 | ) | — | (26,320 | ) | (30,562 | ) | (12 | ) | (394 | ) | — | (25,528 | ) | (25,934 | ) | ||||||||||||||||||||||
Other income (expenses), net | 228 | 12 | — | (261 | ) | (21 | ) | (185 | ) | 15 | — | (37 | ) | (207 | ) | |||||||||||||||||||||||||
|
|
|
|
|
|
|
|
|
| |||||||||||||||||||||||||||||||
Income (loss) from continuing operations before income taxes | (7,514 | ) | (152 | ) | (3,728 | ) | (54,470 | ) | (65,864 | ) | 6,721 | 21,250 | — | (65,610 | ) | (37,639 | ) | |||||||||||||||||||||||
Income tax (expense) benefit | 898 | 371 | — | — | 1,269 | (7,017 | ) | (167 | ) | — | (6,116 | ) | (13,300 | ) | ||||||||||||||||||||||||||
|
|
|
|
|
|
|
|
|
| |||||||||||||||||||||||||||||||
Net income (loss) | $ | (6,616 | ) | $ | 219 | $ | (3,728 | ) | $ | (54,470 | ) | $ | (64,595 | ) | ||||||||||||||||||||||||||
Income (loss) from continuing operations | $ | (296 | ) | $ | 21,083 | $ | — | $ | (71,726 | ) | $ | (50,939 | ) | |||||||||||||||||||||||||||
|
|
|
|
|
|
|
|
|
| |||||||||||||||||||||||||||||||
Forterra, Inc.
Notes To Unaudited Pro Forma Condensed Combined Financial Information
(USD in thousands, unless stated otherwise)
For the Twelve MonthsYear Ended December 31, 2015
| Water Pipe & Products | Drainage Pipe & Products | Bricks | Corporate and Other | Pro Forma Combined | Water Pipe & Products | Drainage Pipe & Products | Bricks | Corporate and Other | Pro Forma Combined | |||||||||||||||||||||||||||||||
Net sales | $ | 871,882 | $ | 715,152 | $ | 138,310 | $ | 8,029 | $ | 1,733,373 | $ | 871,882 | $ | 783,452 | $ | — | $ | 8,029 | $ | 1,663,363 | ||||||||||||||||||||
Cost of goods sold | 730,505 | 601,773 | 132,099 | 10,366 | 1,474,743 | 734,855 | 651,207 | — | 10,370 | 1,396,432 | ||||||||||||||||||||||||||||||
|
|
|
|
|
|
|
|
|
| |||||||||||||||||||||||||||||||
Gross profit (loss) | $ | 141,377 | $ | 113,379 | $ | 6,211 | $ | (2,337 | ) | $ | 258,630 | |||||||||||||||||||||||||||||
Gross profit | $ | 137,027 | $ | 132,245 | $ | — | $ | (2,341 | ) | $ | 266,931 | |||||||||||||||||||||||||||||
Selling, general & administrative expenses and other | (106,358 | ) | (51,205 | ) | (18,246 | ) | (83,244 | ) | (259,053 | ) | (106,101 | ) | (71,219 | ) | — | (83,245 | ) | (260,565 | ) | |||||||||||||||||||||
|
|
|
|
|
|
|
|
|
| |||||||||||||||||||||||||||||||
Income (loss) from operations | $ | 35,019 | $ | 62,174 | $ | (12,035 | ) | $ | (85,581 | ) | $ | (423 | ) | $ | 30,926 | $ | 61,026 | $ | — | $ | (85,586 | ) | $ | 6,366 | ||||||||||||||||
Other income (expenses) | ||||||||||||||||||||||||||||||||||||||||
Interest expense | (3,194 | ) | (13,775 | ) | — | (105,922 | ) | (122,891 | ) | (22 | ) | (1,337 | ) | — | (51,946 | ) | (53,305 | ) | ||||||||||||||||||||||
Other income (expenses), net | 2,398 | (15 | ) | — | (1,402 | ) | 981 | 2,397 | 208 | — | (1,400 | ) | 1,205 | |||||||||||||||||||||||||||
|
|
|
|
|
|
|
|
|
| |||||||||||||||||||||||||||||||
Income (loss) from continuing operations before income taxes | 34,223 | 48,384 | (12,035 | ) | (192,905 | ) | (122,333 | ) | 33,301 | 59,897 | — | (138,932 | ) | (45,734 | ) | |||||||||||||||||||||||||
Income tax (expense) benefit | (16,357 | ) | (480 | ) | 1,826 | (2,507 | ) | (17,518 | ) | (15,318 | ) | (399 | ) | — | (14,828 | ) | (30,545 | ) | ||||||||||||||||||||||
|
|
|
|
|
|
|
|
|
| |||||||||||||||||||||||||||||||
Net income (loss) | $ | 17,866 | $ | 47,904 | $ | (10,209 | ) | $ | (195,412 | ) | $ | (139,851 | ) | |||||||||||||||||||||||||||
Income (loss) from continuing operations | $ | 17,983 | $ | 59,498 | $ | — | $ | (153,760 | ) | $ | (76,279 | ) | ||||||||||||||||||||||||||||
|
|
|
|
|
|
|
|
|
| |||||||||||||||||||||||||||||||
MANAGEMENT’S DISCUSSION AND ANALYSIS OF FINANCIAL CONDITION
AND RESULTS OF OPERATIONS
The following discussion and analysis should be read in conjunction with our audited and unaudited combined Predecessor and Successor financial statements and the related notes, and our unaudited pro forma combined financial information and the related notes, each included elsewhere in this prospectus.
This discussion and analysis contains forward-looking statements that involve risks, uncertainties and assumptions. See the section entitled “Forward-Looking Statements” for a discussion of the risks, uncertainties and assumptions associated with those statements. Our actual results may differ materially from those discussed herein as a result of various factors, including, but not limited to, those factors discussed in the section entitled “Risk Factors” and in other sections of this prospectus.
Overview
Our Company
We are a leading manufacturer of pipe and precast products by sales volume in the United States and Eastern Canada for a variety of water-related infrastructure applications, including water transmission, distribution and drainage. We provide critical infrastructure components for a broad spectrum of construction projects across residential, non-residential and infrastructure markets. Our extensive suite of end-to-end products covers “the First Mile to the Last Mile” of the water infrastructure grid, ranging from large diameter pipe that transports water to and from treatment centers and manages drainage along major transportation corridors, to smaller diameter pipe that delivers potable water to, and removes wastewater from, end users in residential and commercial settings. We employ a specialized technical salesforce, including engineers and field service representatives, which enables us to deliver a high degree of customer service, create tailored solutions and ensure our products meet project specifications to maximize applications in the field. We believe that ourOur product breadth, footprint in the United States and Eastern Canada and significant scale help make us a one-stop shop for water-related pipe and products, and a preferred supplier to a wide variety of customers, including contractors, distributors and municipalities.
Our Segments
Our historical operations are organized into the following reportable segments, which is the way
management views the business in making operating decisions and assessing performance:
As a result of the Bricks Disposition, beginning with the fourth quarter of 2016, our former Bricks segment will be reclassified as discontinued operations in our financial statements and related discussions.
Basis of Presentation
Predecessor and Successor Historical Results of Operations
Forterra, Inc. is wholly owned by LSF9 Stardust Holdings, L.P., an affiliate of Lone Star, or Stardust Holdings. Lone Star, through a wholly owned subsidiary, acquired our business in the Acquisition, along with the business of Forterra UK, on March 13, 2015 for aggregate cash consideration of $1.33 billion, subject to a $100.0 million earn outearn-out that is currently subject to dispute, as discussed in greater detail in the section entitled “Business—Legal Proceedings.” Prior to the Acquisition, we were HeidelbergCement’s building products operations in the United States and Eastern Canada. Concrete Holdings, which was formed on February 6, 2015 for the purpose of consummating the Acquisition, had no operations prior to the date of Acquisition. Forterra, Inc., which was formed on June 21, 2016 for purposes of the Reorganization, will not have any operations prior to the date of the Reorganization. See the sections entitled “Prospectus Summary—Our History—The Acquisition” and “Prospectus Summary—Our History—The Reorganization.” In the accompanying financial information, “Predecessor” refers to our business prior to the Acquisition and “Successor” refers to our business following the Acquisition. The historical combined Predecessor financial statements were prepared on a stand-alone basis in accordance with GAAP and were derived from HeidelbergCement’s consolidated financial statements and accounting records using the historical results of operations and assets and liabilities attributed to our business and include allocations of expenses from HeidelbergCement.
The historical combined Predecessor statements of operations include expense allocations for certain corporate functions historically provided by HeidelbergCement. Substantially all of the Predecessor’s senior management was employed by HeidelbergCement and certain functions critical to our operations were centralized and managed by HeidelbergCement. Historically, the centralized functions included executive senior management, financial reporting, financial planning and analysis, accounting, information technology, tax, risk management, treasury, legal, human resources, land management and strategy and development.
HeidelbergCement used a centralized approach to cash management and financing of its operations. Historically, the majority of the Predecessor’s cash was transferred to HeidelbergCement or its North American affiliates daily and our company was dependent on HeidelbergCement’s funding of our operating and investing activities. This arrangement was not reflective of the manner in which we would have been able to finance our operations had we been a stand-alone business separate from HeidelbergCement.
The historical combined Predecessor financial statements included elsewhere in this prospectus and the other historical combined Predecessor financial information presented and discussed in this discussion and analysis may not be indicative of what they would actually have been had we been a separate stand-alone entity, nor are they indicative of what our financial position, results of operations and cash flows may be in the future.
See notes 1, 2 and 15 to our audited combined financial statements included elsewhere in this prospectus.
Combined Fiscal Year 2015 and ThreePro Forma Six Months Ended March 31, 2015 Results of Operations
As a result of the Acquisition, a new basis of accounting was created. As such, our historical results are presented separately for (i) the period from January 1, 2015 to March 13, 2015 (Predecessor) and the periods from March 14, 2015 to March 31, 2015 (Successor) in our unaudited condensed combined financial statements for the three months ended March 31, 2016 (Successor) and (ii) the period from January 1, 2015 to March 13, 2015 (Predecessor) and the period from March 14, 2015 to December 31, 2015 (Successor) in our audited combined financial statements for
the year ended December 31, 2015. However, the results of operations of the Predecessor and Successor periods in the year ended December 31, 2015 are not comparable to the Predecessor fiscal years and interim period due to the need to present separate Predecessor and Successor periods within the year ended December 31, 2015 and the three months ended March 31, 2015 as a result of the change in basis of accounting resulting from the Acquisition. Therefore, solely for the purposes of addressing changes in results of operations for periods covered in this discussion and analysis, we have utilized a presentation that combines the Predecessor period from January 1, 2015 to March 13, 2015 and the Successor period from March 14, 2015 to March 31, 2015 to create the three month period ending March 31, 2015, and that combines the Predecessor period from January 1, 2015 to March 13, 2015 and the Successor period from March 14, 2015 to December 31, 2015 to create the year ended December 31, 2015. Management believes these combined periods provide a more meaningful basis of comparison for the discussion and analysis below. The combined results are derived from the historical financial statements included elsewhere in this prospectus and no adjustments were made in generating such combined financial information, except to combine the periods described above. However, the presentation of the combined periods does not comply with GAAP and should not be considered independent of our audited and unaudited combined financial statements and the related notes included elsewhere in this prospectus.
Pro Forma Three Months Ended March 31,June 30, 2016 and 2015 Results of Operations
As a result of our recent acquisitions resulting in significant expansion of our business in both size and scale following the Acquisition, and as discussed in greater detail below under “—Recent Developments,”a result of the Bricks Disposition, our audited and unaudited combined financial statements and the related notes included elsewhere in this prospectus do not present our full business as it currently stands.stands or will stand at the consummation of this offering. In particular, neither the impact of the U.S. Pipe Acquisition, which was completed in April 2016, nor the
impact of the Bricks Disposition, which will be completed prior to the consummation of this offering, is not reflected in any of our audited combined financial statements and related notes included elsewhere in this prospectus. Moreover, the impact of the U.S. Pipe Acquisition is included for only a portion of, and the impact of the Bricks Disposition is not included for any portion of, the results for the six month period ended June 30, 2016 in the unaudited combined financial statements and the related notes included elsewhere in this prospectus. Therefore, management believes it is important to include, in addition to the narrative discussion of our historical results of operations set forth below, a narrative discussion of our pro forma results of operations for the comparable periods set forth in the section entitled “Unaudited Pro Forma Condensed Combined Financial Information” above. Specifically, included in the discussion and analysis below is a comparison of the unaudited pro forma condensed combined results of operations for threesix months ended March 31,June 30, 2016 as compared to the threesix months ended March 31,June 30, 2015, assuming the Transactions had been completed as of the relevant dates set forth in the section entitled “Unaudited Pro Forma Condensed Combined Financial Information.” Management believes this pro forma narrative comparison provides investors with additional context regarding our recent acquisitions and other strategic transactions when considering our historical results of operations. However, our pro forma results of operations for these periods should not be considered independent of our historical results of operations and our unaudited combined financial statements and the related notes included elsewhere in this prospectus and the pro forma financial statements included above in the section entitled “Unaudited Pro Forma Condensed Combined Financial Information.”
Recent Developments
U.S. Pipe Acquisition
The Company acquired substantially all of the stock of U.S. Pipe, a ductile iron pipe producer, on April 15,On September 7, 2016, for an initial purchase price of $775.1 million, which was funded with a $205.0 million borrowing on the Revolver, a portion of the proceeds of the Sale Leaseback and a capital contribution of $402.1 million from Lone Star. U.S. Pipe will operate as part of the Company’s Water Pipe & Products reportable segment.
Sale Leaseback
On April 5, 2016, the Company sold 47 properties in the United States and Canada to the U.S. Property Buyer and the Canadian Property Buyer, respectively, for an aggregate purchase price of approximately $204.3 million. On April 14, 2016, the Company sold two additional properties located in the United States to the U.S. Property Buyer for an aggregate purchase price of approximately $11.9 million. The Company and the U.S. Property Buyer and the Canadian Property Buyer contemporaneouslywe entered into master landa definitive agreement to acquire the Precast Concepts business, which manufactures concrete pipe, box culverts, storm detention systems and building lease agreements under which the Company agreed to lease back eachother precast concrete and related products in Colorado, for aggregate consideration of the properties for an initial term of 20 years, followed by one optional renewal terms of nine years 11 months. Under the terms of the master lease agreements, our rent will escalate annually by 2% during the initial term and based on changes in the Consumer Price Index capped at 4% during the optional renewal period. The net proceeds received from the sale leaseback transactions amounted to approximately $209.7 million, net of taxes and transaction costs.
The Sale Leaseback is considered to have a form of prohibited “continuing involvement” at the inception of the lease which preclude sale-leaseback accounting for transactions involving real estate in the combined financial statements of the Company because a guarantee by LSF9 Concrete Ltd, or LSF9, provides the buyer-lessor with additional collateral that reduces the buyer-lessor’s risk of loss. As a result, the assets subject to the Sale Leaseback will remain on the balance sheet of the Company and continue to be depreciated. The aggregate proceeds received will be recorded as a financing obligation.
Roof Tile Divestiture
On April 12, 2016, the Company sold its roof tile business for a price of $10.5$97.1 million, subject to customary working capital adjustments.
Changes The Precast Concepts Acquisition is subject to Debt Obligationsregulatory approval and Borrowing Capacity
In April 2016,other customary closing conditions and, although no assurances can be given that the acquisition will close, it is expected to close in the fourth quarter of 2016. Precast Concepts will operate as part of our total borrowing capacity underDrainage Pipe & Products segment following completion of the Revolver was increased from $250.0 million to $285.0 million.
In April 2016, LSF9 borrowed $205.0 million on the Revolver in orderacquisition. We expect to finance the U.S.Precast Concepts Acquisition with a draw on the Revolver.
On September 6, 2016, we entered into a definitive agreement to acquire J&G, a manufacturer of concrete pipe, box culverts and special fittings in North Texas, for aggregate consideration of $32.0 million, subject to customary working capital adjustments. The J&G Acquisition is subject to customary closing conditions and, although no assurances can be given that the acquisition will close, it is expected to close in the fourth quarter of 2016. J&G will operate as part of our Drainage Pipe & Products segment following completion of the acquisition. We expect to finance the J&G Acquisition with a draw on the Revolver.
On August 23, 2016, Mid Holdings entered into an agreement with an unaffiliated third party to contribute our bricks business to the Bricks Joint Venture. In exchange for the contribution of which $203.4 million was repaidour bricks business, Mid Holdings will receive a 50% interest in the Bricks Joint Venture. In connection with this agreement, prior to the consummation of this offering, we will distribute our bricks business to Mid Holdings or its affiliate in the Bricks Disposition. Though both our business and the 50% equity interest in the Bricks Joint Venture will be held by Forterra UK during April 2016Mid Holdings or its affiliate, following the Bricks Disposition, we will no longer have any profit or other interest in our then-former bricks business or in the Bricks Joint Venture and we will have no relation to or business affiliation with proceeds from its initial public offering. Forterra UK is an affiliated entity controlled by LSF9, but not included amongour then-former bricks business or the legal entities that comprise our business.Bricks Joint Venture other than contractual arrangements regarding certain limited transition services, the short-term loan described under “Certain Relationships and Related Party Transactions—Loan to Bricks Business” and the temporary use of the “Forterra” name. In connection with the additional proceeds obtained in April 2016 which benefitted us, under Financial Accounting Standards Board, or FASB, Accounting Standards Codification, or ASC, 405-40,Obligations Resulting from Joint and Several Liability Arrangements,Bricks Disposition, we assumed an additional obligation of $203.4 million that was recognized as an increasewill incur a tax liability with respect to our allocated sharetaxable gain on the assets of our then-former bricks business. We will also have a tax withholding obligation in respect of the distribution to Mid
Holdings or its affiliate. Although the amounts of any tax liability cannot be determined at this time and are subject to a number of factors, we estimate these liabilities will be approximately $32.3 million in the aggregate. Beginning with the third quarter of 2016, our former Bricks segment will be reclassified as discontinued operations in our financial statements and the related notes.
On August 4, 2016 we purchased all of the outstanding Senior Term Loan balance.
On June 16, 2016, LSF9 borrowed an incremental $345.0stock of Bio Clean Environmental Services, Inc. and Modular Wetland Systems, Inc., California corporations which design and sell storm water management systems that meet the requirements of local regulatory bodies regulating storm water quality, for cash consideration of $30.0 million subject to customary net working capital and purchase price adjustments. Bio Clean will operate as part of our Drainage Pipe & Products reportable segment. The acquisition was financed through cash on the Senior Term Loan and used the proceeds to pay a dividend of the same amount to the shareholders of LSF9. LSF9 incurred debt issuance fees and discount of $6.1 million in connection with the issuance of the debt. The incremental borrowings incur interest at the same rate as the Senior Term Loan and matures in March 2022. Under ASC 405-40, we will recognize the full amount of the incremental borrowing, net of related issuance costs and discount, as an obligation during the second quarter of 2016.hand.
See the section entitled “Description of Certain Indebtedness” and note 10 to our audited combined financial statements included elsewhere in this prospectus.
Principal Factors Affecting Our Results of Operations
Our financial performance and results of operations are influenced by a variety of factors, including conditions in the residential, and non-residential and infrastructure construction markets, general economic conditions, changes in cost of goods sold, and seasonality and weather conditions. Some of the more important factors are discussed below, as well as in the section entitled “Risk Factors.”
Infrastructure Spending and Residential and Non-Residential Construction Activities
A large proportion of our net sales in our Drainage Pipe & Products and Water Pipe & Products segments are generated through public infrastructure projects. Many of these projects are dependent on government funding, including subsidies and stimulus programs. Government spending on infrastructure projects depends on the availability of public funds, which is influenced by various factors, including fiscal budgets, the level of public debt, interest rates, existing and anticipated tax revenues and the political climate. Increases or reductions in governmental funding for these infrastructure projects can have a material effect on our net sales and results of operations. In the United States, federal and state government funding for infrastructure projects is usually accomplished through multi-year funding and authorization bills known as highway bills, such as the FAST Act, which authorized $305 billion in spending over the next five years. The outlook for future growth and consistent revenue streams for our Drainage Pipe & Products and Water Pipe & Products segments has improved with the passage of the FAST Act.
Historically, demand for many of our products has been closely tied to residential construction and non-residential construction activity in the United States and Eastern Canada. Activity levels in these markets can be materially affected by general economic and global financial market conditions. In addition, residential construction activity levels are influenced by and sensitive to mortgage availability, the cost of financing a home (in particular, mortgage and interest rates), unemployment levels, household formation rates, residential vacancy and foreclosure rates, existing housing prices, rental prices, housing inventory levels, consumer confidence and government policy and incentives. Non-residential construction activity is primarily driven by levels of business investment, availability of credit and interest rates, as well as many of the factors that impact residential construction activity levels. See the section entitled “Business—Our Industry.”
Mix of Products
We derive our sales from both the sale of products manufactured to inventory, such as concrete drainage pipe and bricks, and highly engineered products which are made to order, such as concrete and steel pressure pipe and structural precast products for drainage. These two components of our business differ in their dynamics. Approximately two-thirds of our net sales during 2015 were derived
from the sale of products which are manufactured to inventory and approximately one-third came from highly engineered products which were made to order. This mix of products varies from period to period. We generally recognize revenue in connection with product shipment; however, for some of our highly engineered products, we recognize revenue on a percentage of completion method, which amounted to $40.9 million in 2015. In the second half of 2015, we changed our inventory strategy, shifting away from maintaining products manufactured to inventory in our Drainage Pipe & Products business segment.
Products such as concrete drainage pipe and bricks are typically sold on a one-off basis, with volumes and prices determined frequently based on market participants’ perceptions of short-term supply and demand factors. A shortage of capacity or excess capacity in the industry, or in the regions where we have operations, or the behavior of our competitors, can each result in significant increases or decreases in market prices for these products, often within a short period of time. By contrast, our
project driven business involves highly engineered and customized products with a wide range of contract values. The products for these projects are engineered, manufactured and delivered on the basis of contracts that tend to extend over periods of several months or, in some cases, several years. The timing of the commencement of a project and the progress and completion of work under a contract, therefore, can have a significant effect on our results of operations for a particular period.
Cost of Goods Sold
Costs of raw material and supplies, labor (including contract labor), freight and energy constitute a large portion of our cost of goods sold, and fluctuations in the prices of these materials and inputs affect our results of operations. Our primary raw materials are cement, aggregates, steel and clay. We do not generally hedge our raw material purchases, except that we may increase our inventory of certain materials in the short term in anticipation of future price increases.
In addition, our manufacturing is energy intensive. Our energy costs primarily consist of the cost for the supply of electricity and natural gas used in various manufacturing processes. Prices for energy, including natural gas and electricity, have been volatile in recent years and have been a driver of our raw material and energy costs in the past. We generally purchase natural gas and electricity at spot prices in the open market, however, as opportunities are presented we may enter into natural gas fixed price supply contracts.
We attempt to pass on price increases of raw materials, energy and certain other manufacturing costs to our customers, and typically increase prices as new customer agreements are negotiated throughout the year. In addition, certain of our customer contracts, primarily with respect to our highly engineered product, contain price modification mechanisms pursuant to which we may increase the prices of our products to correspond to increases in raw material costs. As a result, we believe we have been able to manage our exposures to fluctuations in our raw material and energy costs, although there can be no assurance that we will continue to be able to do so in the future.
Seasonality and Weather Conditions
The construction industry, and therefore demand for our products, is typically seasonal and dependent on weather conditions, with periods of snow or heavy rain negatively affecting construction activity. Lower demand for our products tends to occur in periods of cold weather, particularly during winter and periods of excessive rain, and such conditions or other unfavorable weather conditions generally lead to seasonal fluctuations in our quarterly financial results. Historically, our net sales in the second and third quarters have been higher than in the other quarters of the year, particularly the first quarter.
In addition, unfavorable weather conditions, such as hurricanes or severe storms, or public holidays during peak construction periods can result in temporary cessation of projects and a material reduction in demand for our products and consequently have an adverse effect on our net sales. Results of a fiscal quarter may therefore not be a reliable basis for the expectations of a full fiscal year and may not be comparable with the results in the other fiscal quarters in the same year or prior years.
Factors Affecting our Financial Statements
Business Combinations
The Acquisition—Our business was acquired from HeidelbergCement in the Acquisition, along with the business of Forterra UK, for aggregate cash consideration of $1.33 billion, subject to an earn outearn-out capped at $100.0 million. Lone Star funded the transactions with an equity investment of $432.3 million and third-party debt in the amount of $940.0 million. The Acquisition was accounted for as a business combination under ASC 805,Business Combinations.
The Successor combined financial statements include certain assets and liabilities historically held at LSF9, including the portion of the debt incurred to consummate the Acquisition which we are obligated to pay. Our portion of the initial $432.3 million equity investment is $167.5 million. Our portion of the $940.0 million of third party debt used to finance the Acquisition is $515.5 million. The remainder of the debt was allocated to Forterra UK and other affiliates of LSF9 that are not included in these financial statements. We and the other affiliates of LSF9, other thenthan Forterra UK, are co-obligors and jointly and severally liable under the terms of the initial credit agreements. Forterra UK was released as an obligor in connection with its initial public offering and the repayment of its portion of the debt, as discussed above under “—Recent Developments—Changesin note 9 to Debt Obligations and Borrowing Capacity.”our unaudited condensed combined financial statements. As part of the Acquisition, we incurred transaction costs necessary to consummate the Acquisition. Our portion of the costs was $15.8$10.6 million for the period from March 14, 2015 to December 31, 2015 and $2.1 million for the period from January 1, 2015 to March 13, 2015, which was recorded in selling, general and administrative expenses. As a result of the debt used to fund the Acquisition, we incurred additional interest expense of $46.0 million and $17.3$41.7 million in combinedthe period from March 14, 2015 and the three months ended Marchto December 31, 2016, respectively.2015.
Cretex Acquisition—On October 1, 2015, we acquired all of the outstanding stock of Cretex for $245.1 million. Cretex is a manufacturer of concrete pipe, box culverts, precast drainage structures, pre-stressed bridge components and ancillary precast products, and our acquisition of Cretex expanded our market footprint into the Upper Midwestern United States. The Cretex Acquisition was financed with $240.0 million of incremental third-party senior debt and cash on hand. As part of the Cretex Acquisition, we incurred transaction costs recorded in selling, general and administrative expenses of $3.1 million in the combined year endedperiod from March 14, 2015 to December 31, 2015.
Sherman-Dixie Acquisition—On January 29, 2016, we acquired all of the outstanding stock of Sherman-Dixie for $66.8 million. Sherman-Dixie manufactures and sells concrete pipe, box culverts, precast concrete utility products, storm and sanitary civil engineered systems and specialty engineered retainage systems in the Southeastern United States. The acquisition was financed through a draw on the Revolver. As part of the Sherman-Dixie Acquisition, we incurred transaction costs recorded in selling, general and administrative expenses of $0.3$0.5 million in the threesix months ended March 31,June 30, 2016.
See note 3 to our audited combined financial statements and note 3 to our unaudited condensed combined financial statements, each included elsewhere in this prospectus.
U.S. Pipe Acquisition—We acquired substantially all of the stock of U.S. Pipe, a ductile iron pipe manufacturer, on April 15, 2016 for an initial purchase price of $775.1 million, which was funded with a $205.0 million borrowing on the Revolver, a portion of the proceeds of the Sale Leaseback and a capital contribution of $402.1 million from Lone Star. As part of the U.S. Pipe Acquisition, we incurred
transaction costs recorded in selling, general and administrative expenses of $5.4 million in the six months ended June 30, 2016. See note 3 to our unaudited condensed combined financial statements, each included elsewhere in this prospectus.
Sale Leaseback
At lease inception of the Sale Leaseback, we (as the seller-lessee) were considered to have a form of prohibited “continuing involvement” with the properties because we provided the respective purchaser (as the buyer-lessor) with a guarantee that serves as additional collateral that reduces the buyer-lessor’s risk of loss. As a result, we are precluded from applying sale-leaseback accounting to the Sale Leaseback, and we have accounted for the transaction as a financing obligation. The assets subject to the Sale Leaseback remain on the balance sheet and continue to be depreciated over their remaining useful lives as a “failed sale-leaseback”. However, we have entered into agreements to replace the current guarantor, Concrete Holdings, with the Company as the new guarantor, effective immediately following completion of the Reorganization, which will, at that time, allow the Sale Leaseback to qualify for sales recognition and be classified as an operating lease.
Principal Components of Results of Operations
Net Sales
Net sales consist of the consideration received or receivable for the sale of products in the ordinary course of business and include the billable costs of delivery of our products to customers, net of discounts given to the customer. Net sales include any outbound freight charged to the customer. Revenue on long-term engineering and construction contracts for our structural precast and products that are designed and engineered specifically for the customer is recognized under the percentage-of-completionpercentage-of completion method. Certain of our businesses, primarily our concrete and steel pressure pipe businesses, also enter into agreements to provide inventory to customers for long-term construction projects. With respect to these agreements, we recognize revenue upon shipment of the respective goods, whereas billings are based on contract terms and may or may not coincide with shipments, which gives rise to either unbilled or deferred revenue. See note 2 and note 20 to our audited combined financial statements included elsewhere in this prospectus.
Cost of Goods Sold
Cost of goods sold includes raw materials (cement, aggregates, steel and clay) and supplies, labor (including contract labor), freight (including outbound freight for delivery of products to end users and other charges such as inbound freight), energy, depreciation and amortization, repairs and maintenance and other cost of goods sold.
Selling, General and Administrative Expenses
Selling, general and administrative expenses include expenses for sales, marketing, legal, accounting and finance services, human resources, customer support, treasury and other general corporate services. See note 2 to our audited combined financial statements included elsewhere in this prospectus for a description of the expense allocation for certain corporate and other functions historically provided to us by HeidelbergCement during the Predecessor periods. For the period from January 1, 2015 to March 13, 2015 and for the fiscal years ended December 31, 2014 and 2013, we were allocated selling, general and administrative expenses from HeidelbergCement in the amount of $4.1 million, $23.6 million and $29.4 million, respectively. Selling, general and administrative expenses also include transaction costs directly related to the Acquisition, transaction costs related to the Cretex Acquisition and the Sherman-Dixie Acquisition, and other carve-out costs surrounding the separation from HeidelbergCement.
Earnings (Losses) from Equity Method Investee
Earnings (losses) from equity method investee represents our share of the income (loss) of the Concrete Pipe & Precast LLC, or CP&P, joint venture we entered into in July 2012 with Americast, Inc. We contributed plant assets and related inventory from nine plants as part of the agreement to form CP&P in exchange for a 50% ownership interest in the joint venture. CP&P is engaged primarily in the manufacture, marketing, sale and distribution of concrete pipe and precast products in Virginia, West Virginia, Maryland, North Carolina, South Carolina and Georgia with sales to contiguous states. See note 19 to our audited combined financial statements included elsewhere in this prospectus.
Gain on Sale of Property, Plant and Equipment, Net
Gain on sale of property, plant and equipment, net includes the net gain or loss on the sale of assets including property, plant and equipment and sales of businesses that do not otherwise qualify as discontinued operations.
Other Operating Income
The remaining categories of operating income and expenses consist of scrap income (associated with scrap from the manufacturing process or remaining scrap after plants are closed), rental income and income generated from exhausted clay quarries that are used for landfill.
Interest Expense
Interest expense represents interest on the indebtedness incurred in connection with the Acquisition, the Cretex Acquisition and the Sherman-Dixie Acquisition. Prior to the Acquisition, we incurred an insignificant amount of interest expense in connection with our capital leases.
Income Tax Expense
Income tax expense consists of federal, state, provincial, local and foreign taxes based on income in the jurisdictions in which we operate. Historically, our U.S. subsidiaries were included in HeidelbergCement’s U.S. consolidated federal and state income tax returns. In the combined Predecessor financial statements, income tax benefit (expense) is calculated as if our U.S. subsidiaries filed separate tax returns.
Results of Operations
Pro Forma ThreeSix Months ended March 31,June 30, 2016 Compared to Pro Forma ThreeSix Months Ended March 31,June 30, 2015
Pro Forma Total Company
The following table summarizes certain pro forma financial information relating to our pro forma operating results that have been derived from our unaudited pro forma condensed combined financial information for the threesix months ended March 31,June 30, 2016 and 2015 included in the section above entitled “Unaudited Pro Forma Condensed Combined Financial Information.” Also included is certain information relating to the pro forma operating results as a percentage of net sales. The unaudited pro forma condensed combined financial information below is based on our unaudited combined financial statements and the related notes included elsewhere in this prospectus, adjusted to give pro forma effect to the Transactions as of the applicable dates set forth in the section entitled “Unaudited Pro Forma Condensed Combined Financial Information.” The unaudited pro forma financial information
below is presented because management believes it provides a meaningful comparison of operating results. See further discussion related to the pro forma information above in the “—Basis of Presentation.”
Pro Forma | Pro Forma March 31, 2016 | % of pro forma net sales | Pro Forma March 31, 2015 | % of pro forma net sales | % Change | Pro Forma Six Months Ended June 30, 2016 | % of pro forma net sales | Pro Forma Six Months Ended June 30, 2015 | % of pro forma net sales | Change | % Change | |||||||||||||||||||||||||||||||||
Net sales | $ | 362,083 | 100.0 | % | $ | 340,654 | 100.0 | % | 6.3 | % | $ | 783,112 | 100.0 | % | $ | 764,172 | 100.0 | % | 18,940 | 2.5 | % | |||||||||||||||||||||||
Cost of goods sold | 295,772 | 81.7 | % | 308,288 | 90.5 | % | (4.1 | )% | 628,627 | 80.3 | % | 654,856 | 85.7 | % | (26,229 | ) | (4.0 | )% | ||||||||||||||||||||||||||
|
|
|
| |||||||||||||||||||||||||||||||||||||||||
Gross profit | 66,311 | 18.3 | % | 32,366 | 9.5 | % | 104.9 | % | 154,485 | 19.7 | % | 109,316 | 14.3 | % | 45,169 | 41.3 | % | |||||||||||||||||||||||||||
Selling, general & administrative | (57,334 | ) | (15.8 | )% | (67,647 | ) | (19.9 | )% | (15.2 | )% | ||||||||||||||||||||||||||||||||||
Selling, general & administrative expenses and other | (109,565 | ) | (14.0 | )% | (120,814 | ) | (15.8 | )% | 11,249 | (9.3 | )% | |||||||||||||||||||||||||||||||||
|
|
|
| |||||||||||||||||||||||||||||||||||||||||
Income (loss) from operations | 8,977 | 2.5 | % | (35,281 | ) | (10.4 | )% | (125.4 | )% | 44,920 | 5.7 | % | (11,498 | ) | (1.5 | )% | 56,418 | (490.7 | )% | |||||||||||||||||||||||||
Other income (expenses) | ||||||||||||||||||||||||||||||||||||||||||||
Interest expense | (30,557 | ) | (8.4 | )% | (30,562 | ) | (9.0 | )% | 0.3 | % | (30,413 | ) | (3.9 | )% | (25,934 | ) | (3.4 | )% | (4,479 | ) | 17.3 | % | ||||||||||||||||||||||
Other income (expenses), net | 23 | NM | (21 | ) | NM | (75.1 | )% | (1,003 | ) | (0.1 | )% | (207 | ) | NM | (796 | ) | 384.5 | % | ||||||||||||||||||||||||||
|
|
|
| |||||||||||||||||||||||||||||||||||||||||
Income (loss) from continuing operations before income taxes | (21,557 | ) | (6.0 | )% | (65,864 | ) | (19.3 | )% | 67.3 | % | 13,504 | 1.7 | % | (37,639 | ) | (4.9 | )% | 51,143 | (135.9 | )% | ||||||||||||||||||||||||
Income tax (expense) benefit | 8,142 | 2.2 | % | 1,269 | 0.4 | % | (541.6 | )% | 25,983 | 3.3 | % | (13,300 | ) | (1.7 | )% | 39,283 | (295.4 | )% | ||||||||||||||||||||||||||
|
|
|
| |||||||||||||||||||||||||||||||||||||||||
Net income (loss) | $ | (13,415 | ) | (3.7 | )% | $ | (64,595 | ) | (19.0 | )% | 79.2 | % | ||||||||||||||||||||||||||||||||
Income (loss) from continuing operations | $ | 39,487 | 5.0 | % | $ | (50,939 | ) | (6.7 | )% | 90,426 | (177.5 | )% | ||||||||||||||||||||||||||||||||
|
|
|
| |||||||||||||||||||||||||||||||||||||||||
Net sales
Pro forma net sales increased by $21.4$18.9 million, or 6.3%2.5%, to $362.1$783.1 million in the threesix months ended March 31,June 30, 2016 from $340.7$764.2 million in the threesix months ended March 31,June 30, 2015. The increase wasis attributable to an increase in the Drainage Pipe & Products segment due to legacy plant sales volume increases of 5.8% and average sales price increases of 4.6%, which increasedhigher net sales by $5.0for Cretex of $9.8 million, U.S. Pipe of $7.2 million, Precast Concepts of $5.2 million, Bio Clean of $3.6 million, and $5.0Sherman-Dixie of $0.9 million respectively, as a result ofdue to improved market conditions, partially offset by a decrease in Texas and the Southeast United States. Also contributing to the increase was aJ&G net sales increase of $4.5$1.0 million. The legacy Forterra net sales decreased approximately $1.7 million incaused primarily by a reduction of 0.4% of sales volumes during the Bricks segment duesix months ended June 30, 2015 compared to a sales volume increase of 17.5%.June 30, 2016.
Cost of goods sold
Pro forma cost of goods sold decreased by $12.5$26.2 million, or 4.1%4.0%, to $295.8$628.6 million in the threesix months ended March 31,June 30, 2016 from $308.3$654.9 million in the threesix months ended March 31,June 30, 2015. The decrease was attributable to $4.7decline is primarily a result of lower raw material costs of $14.9 million and lower energy of inventory step-up adjustments duecosts of $2.3 million for the six months ended June 30, 2016 compared to the application of purchase accountingsix months ended June 30, 2015 in the three months ended March 31, 2015. The decrease was partially offset by higher sales volumes in the current period that were partially offset by lower raw materials and supplies and labor as a percentage of sales.legacy Forterra business.
Gross profit
Pro forma gross profit increased by $33.9$45.2 million, or 104.9%41.3%, to $66.3$154.5 million in the threesix months ended March 31,June 30, 2016 from $32.4$109.3 million in the threesix months ended March 31,June 30, 2015. Pro forma gross profit increased between periods due to more favorable production costs in the historical Forterra business duesix months ended June 30, 2016 compared to overall higher sales volumes of 6.2% and an overall pricethe six months ended June 30, 2015 as well as the increase of 2.1%, coupled with lower raw materials and supplies costs as a percentage ofin net sales as discussed above. Additionally, pro forma gross profits increased due to the impact of $4.7 million of inventory step-up adjustments due to the application of purchase accounting that were recorded in the three months ended March 31, 2015.
Selling, general and administrative expenses and other
Pro forma selling, general and administrative expenses and other costs decreased by $10.3$11.2 million, or 15.2%9.3%, to $57.3$109.6 million in the threesix months ended March 31,June 30, 2016 from $67.6$120.8 million in the threesix months ended March 31,June 30, 2015. This decrease infrom the threesix months ended March 31,June 30, 2015 was due to higher than normal costs related to the Acquisition as well as additional carve-out costs to separate the Company from HeidelbergCement. Partially offsetting this decrease were transaction costs incurred in connection with the U.S. Pipe Acquisition and Sherman-Dixie Acquisition in March 31,the six months ended June 30, 2016.
Interest expense
Pro forma interest expense remained relatively consistent as the debt balances and interest rates were generally consistent between the periods.
Income tax expense
Our pro forma income tax benefit changed by $6.9$39.3 million to $8.1$26.0 million in the threesix months ended March 31,June 30, 2016 from a tax expense of $1.3$13.3 million in the threesix months ended March 31,June 30, 2015 due to a change in taxable income during the periods in Canada.periods.
Net lossIncome (loss) from continuing operations
Pro forma net loss from continuing operations decreased by $51.1$90.4 million to a net lossan income from continuing operations of $13.4$39.5 million in the threesix months ended March 31,June 30, 2016 from a net loss from continuing operations of $64.6$50.9 million in the threesix months ended March 31,June 30, 2015 due to increased pro forma gross profits resulting from thelower production costs and higher sales volumes and lower pro forma raw materials and supplies costs as a percentage of pro forma net sales and the decrease inlower pro forma selling, general and administrative expenses discussed above.
Pro Forma Segment Results of Operations
The following table summarizes certain pro forma financial information relating to our pro forma operating results by segment that have been derived from our unaudited pro forma condensed combined financial information for the six months ended June 30, 2016 and 2015 included in the section above entitled “Unaudited Pro Forma Condensed Combined Financial Information.” The unaudited pro forma condensed combined financial information below is based on our unaudited combined financial statements and the related notes included elsewhere in this prospectus, adjusted to give pro forma effect to the Transactions as of the applicable dates set forth in the section entitled “Unaudited Pro Forma Condensed Combined Financial Information.” The unaudited pro forma financial information below is presented because management believes it provides a meaningful comparison of operating results. See further discussion related to the pro forma information above in the “—Basis of Presentation.”
| Drainage Pipe & Products | Water Pipe & Products | Bricks | Corporate and Other | Total | ||||||||||||||||
For the three months ended March 31, 2016: | ||||||||||||||||||||
Pro forma net sales | $ | 147,214 | $ | 182,327 | $ | 30,338 | $ | 2,204 | $ | 362,083 | ||||||||||
Pro forma gross profit (loss) | 30,843 | 34,113 | 2,241 | (886 | ) | 66,311 | ||||||||||||||
Pro forma income (loss) from continuing operations before income taxes | 14,350 | 8,733 | (1,574 | ) | (43,066 | ) | (21,557 | ) | ||||||||||||
For the three months ended March 31, 2015: | ||||||||||||||||||||
Pro forma net sales | $ | 129,908 | $ | 181,514 | $ | 25,856 | $ | 3,376 | 340,654 | |||||||||||
Pro forma gross profit (loss) | 11,935 | 19,992 | (92 | ) | 531 | 32,366 | ||||||||||||||
Pro forma income (loss) from continuing operations before income taxes | (152 | ) | (7,514 | ) | (3,728 | ) | (54,470 | ) | (65,864 | ) | ||||||||||
| Drainage Pipe & Products | Water Pipe & Products | Corporate and Other | Total | |||||||||||||
For the six months ended June 30, 2016: | ||||||||||||||||
Pro forma net sales | $ | 377,525 | $ | 403,059 | $ | 2,528 | $ | 783,112 | ||||||||
Pro forma gross profit (loss) | 86,697 | 68,887 | (1,099 | ) | 154,485 | |||||||||||
Pro forma income (loss) from continuing operations before income taxes | 55,920 | 27,518 | (69,934 | ) | 13,504 | |||||||||||
For the six months ended June 30, 2015: | ||||||||||||||||
Pro forma net sales | $ | 349,589 | $ | 408,907 | $ | 5,676 | $ | 764,172 | ||||||||
Pro forma gross profit (loss) | 49,616 | 59,329 | 371 | 109,316 | ||||||||||||
Pro forma income (loss) from continuing operations before income taxes | 21,250 | 6,721 | �� | (65,610 | ) | (37,639) | ||||||||||
For the purposes of evaluating segment profit,performance, the Company’s chief operating decision maker reviews earnings before interest, taxes, depreciation and amortization as a basis for making the decisions to allocate resources and assetassess performance. Our discussion below includes the primary drivers of earnings before interest, taxes, depreciation and amortization.
Drainage Pipe & Products
Net sales
Pro forma net sales increased by $17.3$27.9 million, or 13.3%8.0%, to $147.2$377.5 million in the threesix months ended March 31,June 30, 2016 from $129.9$349.6 million in the threesix months ended March 31,June 30, 2015. Pro forma net sales increased period over period primarily due to incremental volume increasesimproved market conditions for Cretex, Precast Concepts, Bio Clean and Sherman-Dixie, which resulted in increased net sales of 5.8%$9.8 million, $5.2 million, $3.6 million and $0.9 million, respectively, partially offset by a decrease in net sales for J&G of $1.0 million. The average salesselling price increases of 4.6%for the legacy Forterra business improved 1.9%, which increased net sales period over period by $5.0 million and $5.0 million, respectively, as a result$4.2 million. Sales volumes improved in the legacy Forterra business by 1.5% which resulted in higher net sales of improved market conditions in Texas and the Southeast United States. The remaining increase was a result of improved sales contribution from Cretex and Sherman-Dixie.$3.3 million.
Gross profit
Pro forma gross profit increased $18.9$37.1 million, or 158.4%74.7%, in the threesix months ended March 31,June 30, 2016, to $30.8$86.7 million from $11.9$49.6 million in the threesix months ended March 31,June 30, 2015, primarily due to favorable market conditions, which allowed us to increase sales volumes and implement price increases. Additionally, pro forma gross profit as a percentage of pro forma net sales, increased from 9.4% in the three months ended March 31, 2015 to 18.3% in the three months ended March 31, 2016, primarily due to price increases, improved plant efficiencies due to increases in plant production and lower raw material and energy prices.
Water Pipe & Products
Net sales
Pro forma net sales increaseddecreased by $0.8$5.8 million, or 0.4%1.4%, to $182.3$403.1 million in the threesix months ended March 31,June 30, 2016 from $181.5$408.9 million in the threesix months ended March 31,June 30, 2015. The increasedecrease was primarily attributabledue to an average price increase of 14.2% which increaseddecreased net sales by $5.5for the legacy Forterra business which declined $13.0 million, partially offset byprimarily due to a 10.0% reduction inof sales volumevolumes of 19.8% due to delays in shipments relatedthe US. Partially offsetting the decline was an increase in gross sales from U.S. Pipe of $7.2 million due to unfavorable weather in the historical Forterra business which decreased net sales by $4.4 million.more favorable market conditions.
Gross profit
Pro forma gross profit increased by $14.1$9.6 million, or 70.6%16.1%, to $34.1$68.9 million in the threesix months ended March 31,June 30, 2016 from $20.0$59.3 million in the threesix months ended March 31,June 30, 2015, due primarily to athe reduction in pro forma cost of goods soldraw material and energy costs, partially offset by the reduction in net sales as discussed above.
Six Months Ended June 30, 2016
Total Company
The following table summarizes certain financial information relating to our operating results that have been derived from our unaudited condensed combined financial statements for the six months ended June 30, 2016. Also included is certain information relating to the operating results as a percentage of pro forma net sales. The increase
| Six months ended June 30, 2016 | % of Net Sales | |||||||
Combined Statements of Income Data: | ||||||||
Net sales | $ | 640,142 | 100.0 | % | ||||
Cost of goods sold | 509,370 | 79.6 | % | |||||
|
|
|
| |||||
Gross profit | 130,772 | 20.4 | % | |||||
Selling, general and administrative expenses | (98,622 | ) | (15.4 | )% | ||||
Impairment and restructuring charges | (23 | ) | NM | |||||
Earnings from equity method investee | 4,868 | 0.8 | % | |||||
Other operating income | 2,533 | 0.4 | % | |||||
|
|
|
| |||||
| (91,244 | ) | (14.3 | )% | |||||
|
|
|
| |||||
Income from operations | 39,528 | 6.2 | % | |||||
Other income (expenses) | ||||||||
Interest expense | (42,129 | ) | (6.6 | )% | ||||
Other income (expense), net | (1,179 | ) | (0.2 | )% | ||||
|
|
|
| |||||
Income from continuing operations before income taxes | (3,780 | ) | (0.6 | )% | ||||
Income tax benefit | 36,533 | 5.7 | % | |||||
|
|
|
| |||||
Net income | $ | 32,753 | 5.1 | % | ||||
|
|
|
| |||||
Net sales for the six months ended June 30, 2016 were $640.1 million consisting of legacy Forterra net sales of $382.3 million, net sales as a result of the U.S. Pipe Acquisition of $150.3 million, and $106.8 million of net sales from the Cretex Acquisition and the Sherman-Dixie Acquisition. Cost of goods sold were $509.4 million, which included $12.5 million of inventory step-up adjustments due to the impact of business combinations primarily related to the U.S. Pipe Acquisition, which resulted in pro forma gross profit of $130.8 million. Selling, general and administrative expenses were $98.6 million, which includes $17.0 million of costs from acquired businesses and $13.6 million of amortization of intangible assets acquired in business combinations primarily attributable to the U.S. Pipe Acquisition. Interest expense of $42.1 million was also due to price increases andincurred as a lower costresult of steel,the outstanding debt during the period. Net income was $32.8 million driven by positive operating results partially offset by lowerinterest expense.
Segment Results of Operations
| Drainage Pipe & Products | Water Pipe & Products | Bricks | Corporate and Other | Total | ||||||||||||||||
For six months ended June 30, 2016: | ||||||||||||||||||||
Net sales | $ | 336,549 | $ | 229,641 | $ | 71,424 | $ | 2,528 | $ | 640,142 | ||||||||||
Gross profit (loss) | 78,664 | 41,216 | 11,992 | (1,100 | ) | 130,772 | ||||||||||||||
Income (loss) from continuing operations before income taxes | 52,211 | 19,343 | 3,276 | (78,610 | ) | (3,780 | ) | |||||||||||||
For the purposes of evaluating segment performance, the Company’s chief operating decision maker reviews earnings before interest, taxes, depreciation and amortization as a basis for making the
decisions to allocate resources and assess performance. Our discussion below includes the primary drivers of earnings before interest, taxes, depreciation and amortization.
Drainage Pipe & Products
Net sales volumes inwere $336.5 million which included net sales from the historical ForterraCretex and Sherman-Dixie acquisitions of $106.8 million. Gross profit was $78.7 million which included the impact of inventory step-up adjustments of $1.9 million as a result of the business combinations.
Water Pipe & Products
Net sales were $229.6 million which included sales from US Pipe of $150.3 million. Gross profit was $41.2 million which included the impact of inventory step-up adjustments of $10.6 million as discussed above.a result of the U.S. Pipe Acquisition.
Bricks
Net Sales
Pro forma net sales increased by $4.5were $71.4 million or 17.3%, to $30.3which resulted in gross profit of $12.0 million infor the threesix months ended June 30, 2016.
Period from March 31, 201614, 2015 to June 30, 2015
Total Company
The following table summarizes certain financial information relating to our operating results that have been derived from $25.9our combined Successor financial statements for the period from March 14, 2015 to June 30, 2015. Also included is certain information relating to the operating results as a percentage of net sales.
| Successor | ||||||||
| For the period from March 14 to June 30, 2015 | % of Net Sales | |||||||
Combined Statements of Income Data: | ||||||||
Net sales | $ | 251,315 | 100.0 | % | ||||
Cost of goods sold | 228,405 | 90.9 | % | |||||
|
|
|
| |||||
Gross profit | 22,910 | 9.1 | % | |||||
Selling, general and administrative expenses | (47,716 | ) | (19.0 | )% | ||||
Impairment and restructuring charges | (343 | ) | (0.1 | )% | ||||
Earnings from equity method investee | 3,772 | 1.5 | % | |||||
Other operating income | 3,930 | 1.6 | % | |||||
|
|
|
| |||||
| (40,357 | ) | (16.1 | )% | |||||
|
|
|
| |||||
Loss from operations | (17,447 | ) | (6.9 | )% | ||||
Other income (expenses) | ||||||||
Interest expense | (15,551 | ) | (6.2 | )% | ||||
Other income (expense), net | (140 | ) | (0.1 | )% | ||||
|
|
|
| |||||
Income from continuing operations before income taxes | (33,138 | ) | (13.2 | )% | ||||
Income tax benefit | (1,579 | ) | (0.7 | )% | ||||
|
|
|
| |||||
Net loss | $ | (34,717 | ) | (13.8 | )% | |||
|
|
|
| |||||
Net sales for the period from March 14, 2015 to June 30, 2015 were $251.3 million. Cost of goods sold was $228.4 million, in the three months ended March 31, 2015. Pro forma net sales improved across all regionswhich included $10.7 million of inventory step-up adjustments as a result of increased builder activity,the Acquisition, which resulted in a gross profit of $22.9 million. Selling, general and administrative expenses were $47.7 million during the period which included $10.6 million of Acquisition related costs. Interest expense was $15.6 million as a result of debt incurred to fund the Acquisition. The net loss of $34.7 million was primarily driven by a 17.5% increase in sales volume.selling, general and administrative expenses and interest expense.
Segment Results of Operations
| Drainage Pipe & Products | Water Pipe & Products | Bricks | Corporate and Other | Total | ||||||||||||||||
For the period from March 14, 2015 to June 30, 2015: | ||||||||||||||||||||
Net sales | $ | 141,031 | $ | 61,888 | $ | 45,613 | $ | 2,783 | $ | 251,315 | ||||||||||
Gross profit (loss) | 17,152 | 6,945 | (1,182 | ) | (5 | ) | 22,910 | |||||||||||||
Income (loss) from continuing operations before income taxes | 14,460 | 3,767 | (3,779 | ) | (47,586 | ) | (33,138 | ) | ||||||||||||
For the purposes of evaluating segment performance, the Company’s chief operating decision maker reviews earnings before interest, taxes, depreciation and amortization as a basis for making the decisions to allocate resources and assess performance. Our discussion below includes the primary drivers of earnings before interest, taxes, depreciation and amortization.
Drainage Pipe & Products
Net sales were $141.0 million during the period. Gross profit (loss)was $17.2 million which included the impact of inventory step-up adjustments of $6.5 million as a result of the Acquisition.
Pro forma grossWater Pipe & Products
Net sales were $61.9 million during the period. Gross profit increased by $2.3was $6.9 million to $2.2which included the impact of inventory step-up adjustments of $2.1 million inas a result of the three months ended March 31, 2016 fromAcquisition.
Bricks
Net sales were $45.6 million during the period. Gross loss was $1.2 million which included the impact of inventory step-up adjustments of $2.0 million as a lossresult of $0.1 million in the three months ended March 31, 2015. Bricks pro forma gross profit increased primarily due to higher pro forma net sales, partially offset by an increase in pro forma cost of goods sold.Acquisition.
Period from January 1, 2015 to March 13, 2015
Total Company
The following table summarizes certain financial information relating to our operating results that have been derived from our combined Predecessor and Successor financial statements for the three months endedperiod from January 1, 2015 to March 31, 2016 and13, 2015. Also included is certain information relating to the operating results as a percentage of net sales. See “Basis of Presentation—Combined Fiscal Year 2015 and Three Months Ended March 31, 2015 Results of Operations” above for a discussion regarding the combined three months ended March 31, 2015.
| Predecessor | Successor | |||||||||||||||||||||||||||||
| Three months ended March 31, 2016 | % of Net Sales | For the period from January 1 to March 13, 2015 | For the period from March 14 to March 31, 2015 | Combined Three months ended March 31, 2015 | % of Net Sales | % Change | ||||||||||||||||||||||||
(unaudited) (In thousands, | ||||||||||||||||||||||||||||||
Combined Statements of Income Data: | ||||||||||||||||||||||||||||||
Net sales | $ | 217,334 | 100.0 | % | $ | 132,620 | $ | 38,014 | $ | 170,634 | 100.0 | % | 27.4 | % | ||||||||||||||||
Cost of goods sold | 179,403 | 82.5 | % | 117,831 | 35,324 | 153,155 | 89.8 | % | 17.1 | % | ||||||||||||||||||||
|
|
|
|
|
|
|
|
|
|
|
|
|
| |||||||||||||||||
Gross profit | 37,931 | 17.5 | % | 14,789 | 2,690 | 17,479 | 10.2 | % | 117.0 | % | ||||||||||||||||||||
Selling, general and administrative expenses | (37,945 | ) | (17.5 | )% | (21,683 | ) | (18,722 | ) | (40,405 | ) | (23.7 | )% | (6.1 | )% | ||||||||||||||||
Impairment and restructuring charges | — | NM | (542 | ) | 8 | (534 | ) | (0.3 | )% | NM | ||||||||||||||||||||
Earnings from equity method investee | 1,303 | 0.6 | % | 67 | 115 | 182 | 0.1 | % | 615.9 | % | ||||||||||||||||||||
Gain (loss) on sale of property, plant and equipment and business, net | — | — | 122 | — | 122 | NM | NM | |||||||||||||||||||||||
Other operating income | 1,778 | 0.8 | % | 872 | 813 | 1,685 | 1.0 | % | 5.5 | % | ||||||||||||||||||||
|
|
|
|
|
|
|
|
|
|
|
|
|
| |||||||||||||||||
| (34,864 | ) | (16.0 | )% | (21,164 | ) | (17,786 | ) | (38,950 | ) | (22.8 | )% | (10.5 | )% | |||||||||||||||||
|
|
|
|
|
|
|
|
|
|
|
|
|
| |||||||||||||||||
Income (loss) from operations | 3,067 | 1.4 | % | (6,375 | ) | (15,096 | ) | (21,471 | ) | (12.6 | )% | (114.3 | )% | |||||||||||||||||
Other income (expenses) | ||||||||||||||||||||||||||||||
Interest expense | (17,290 | ) | (8.0 | )% | (84 | ) | (2,474 | ) | (2,558 | ) | (1.5 | )% | 575.9 | % | ||||||||||||||||
Other income (expense), net | (81 | ) | — | % | (39 | ) | — | (39 | ) | — | % | 107.7 | % | |||||||||||||||||
|
|
|
|
|
|
|
|
|
|
|
|
|
| |||||||||||||||||
Income (loss) from continuing operations before income taxes | (14,304 | ) | (6.6 | )% | (6,498 | ) | (17,570 | ) | (24,068 | ) | (14.1 | )% | (40.6 | )% | ||||||||||||||||
Income tax (expense) benefit | 10,368 | 4.8 | % | 742 | — | 742 | 0.4 | % | 1,105.5 | % | ||||||||||||||||||||
|
|
|
|
|
|
|
|
|
|
|
|
|
| |||||||||||||||||
Net income (loss) | $ | (3,936 | ) | (1.8 | )% | $ | (5,756 | ) | $ | (17,570 | ) | $ | (23,326 | ) | (13.7 | )% | (83.1 | )% | ||||||||||||
|
|
|
|
|
|
|
|
|
|
|
|
|
| |||||||||||||||||
Net sales
| Predecessor | ||||||||
| For the period from January 1 to March 13, 2015 | % of Net Sales | |||||||
Combined Statements of Income Data: | ||||||||
Net sales | $ | 132,620 | 100.0 | % | ||||
Cost of goods sold | 117,831 | 88.8 | % | |||||
|
|
|
| |||||
Gross profit | 14,789 | 11.2 | % | |||||
|
|
|
| |||||
Selling, general and administrative expenses | (21,683 | ) | (16.3 | )% | ||||
Impairment and restructuring charges | (542 | ) | (0.4 | )% | ||||
Earnings from equity method investee | 67 | 0.1 | % | |||||
Other operating income | 994 | 0.7 | % | |||||
|
|
|
| |||||
| (21,164 | ) | (16.0 | )% | |||||
|
|
|
| |||||
Income (loss) from operations | (6,375 | ) | (4.8 | )% | ||||
Other income (expense) | ||||||||
Interest expense | (84 | ) | (0.1 | )% | ||||
Other income (expense), net | (39 | ) | NM | |||||
|
|
|
| |||||
Income (loss) from continuing operations before income taxes | (6,498 | ) | (4.9 | )% | ||||
Income tax expense | 742 | 0.6 | % | |||||
|
|
|
| |||||
Net income (loss) | $ | (5,756 | ) | (4.3 | )% | |||
|
|
|
| |||||
Net sales increased by $46.7 million, or 27.4%, to $217.3 million infor the three months ended March 31, 2016 from $170.6 million in the combined three months ended March 31, 2015. This increase was primarily attributable to an increase of $42.3 million in net sales in the Drainage Pipe & Products segment due to incremental sales of $32.3 million from the Cretex Acquisition and the
Sherman-Dixie Acquisition. Legacy plant sales volume increases of 5.8% and average sales price increases of 4.6% further increased net sales by $5.0 million and $5.0 million, respectively, as a result of improved market conditions in Texas and the Southeast United States. Also contributing to the increase was a net sales increase of $4.5 million in the Bricks segment due to a sales volume increase of 17.5%.
period were $132.6 million. Cost of goods sold
The following are the key components was $117.8 million resulted in gross profit of cost of goods sold:
| Three months ended March 31, 2016 | Combined Three months ended March 31, 2015 | |||||||||||||||||||||||
| $ | % of Net Sales | $ | % of Net Sales | $ Change | % Change | |||||||||||||||||||
Raw materials and supplies | $ | 59,446 | 27.4 | % | $ | 53,164 | 31.2 | % | $ | 6,282 | 11.8 | % | ||||||||||||
Labor (including contract labor) | 54,615 | 25.1 | % | 47,404 | 27.8 | % | 7,211 | 15.2 | % | |||||||||||||||
Transportation | 17,092 | 7.9 | % | 15,139 | 8.9 | % | 1,953 | 12.9 | % | |||||||||||||||
Energy | 7,556 | 3.5 | % | 8,593 | 5.0 | % | (1,037 | ) | (12.1 | )% | ||||||||||||||
Depreciation | 10,870 | 5.0 | % | 7,975 | 4.7 | % | 2,895 | 36.3 | % | |||||||||||||||
Repairs and maintenance | 10,612 | 4.9 | % | 7,037 | 4.1 | % | 3,575 | 50.8 | % | |||||||||||||||
Other variable and production costs | 19,212 | 8.8 | % | 13,843 | 8.1 | % | 5,369 | 38.8 | % | |||||||||||||||
|
|
|
|
|
|
|
|
|
| |||||||||||||||
Total cost of goods sold | $ | 179,403 | 82.5 | % | $ | 153,155 | 89.8 | % | $ | 26,248 | 17.1 | % | ||||||||||||
|
|
|
|
|
|
|
|
|
| |||||||||||||||
Total cost of goods sold increased by $26.2 million, or 17.1%, to $179.4 million in the three months ended March 31, 2016 from $153.2 million in the combined three months ended March 31, 2015. The increase was primarily driven by the addition of Cretex and Sherman-Dixie operating costs and higher sales volumes in the current period.
Gross profit
Gross profit increased by $20.5 million, or 117.0%, to $37.9 million in the three months ended March 31, 2016 from $17.5 million in the combined three months ended March 31, 2015. Gross profit increased due to higher sales volumes of 6.2% and an overall price increase of 2.1% coupled with lower raw materials and supplies costs as a percentage of net sales as presented above. Gross profit margin increased to 17.5% in the three months ended March 31, 2016 from 10.2% in the combined three months ended March 31, 2015, largely as a result of higher average sales prices along with a lower raw materials and supplies costs.
Selling, general and administrative expenses
$14.8 million. Selling, general and administrative expenses decreasedwere $21.7 million. The net loss of $5.8 million was primarily driven by $2.5 million, or 6.1%, to $37.9 million in the three months ended March 31, 2016 from $40.4 million in the combined three months ended March 31, 2015. This decrease was due to the combined three months ended March 31, 2015 including higher than normal costs related to the Acquisition and carve-out costs to separate the Company from HeidelbergCement. Partially offsetting the decline in selling, general, and administrative expenses were transactions costs related to the Sherman-Dixie Acquisition and other transitional costs.
Earnings from equity method investee
Earnings from equity method investee increased $1.1 million in the three months ended March 31, 2016 to $1.3 million from $0.2 million in the combined three months ended March 31, 2015. The increase was attributable to improved profitability of our investment in CP&P.
Interest expense
Interest expense increased by $14.7 million to $17.3 million in the three months ended March 31, 2016 from $2.6 million in the combined three months ended March 31, 2015. This increase was due to the three months ended March 31, 2016 having significantly higher average debt balances than in the combined three months ended March 31, 2015 and the three months ended March 31, 2016 had a full quarter’s worth of interest expense compared to a partial period of interest expense in the combined three months ended March 31, 2015.
Income tax expense
Our income tax expense changed by $9.6 million to $10.4 million in the three months ended March 31, 2016 from $0.7 million in the combined three months ended March 31, 2015 due to a change in taxable income in Canada for the period. During both periods presented, the U.S. federal taxes were reduced by a corresponding change in the valuation allowance.
Net loss
Net loss decreased by $19.4 million to a net loss of $3.9 million in the three months ended March 31, 2016 from a net loss of $23.3 million in the combined three months ended March 31, 2015 due to increased gross profits from all our operating segments and a decrease in selling, general and administrative expenses, partially offset by increased interest expense, each as discussed above.expenses.
Segment Results of Operations
| Drainage Pipe & Products | Water Pipe & Products | Bricks | Corporate and Other | Total | ||||||||||||||||
For three months ended March 31, 2016: | ||||||||||||||||||||
Net sales | $ | 144,321 | $ | 40,471 | $ | 30,338 | $ | 2,204 | $ | 217,334 | ||||||||||
Gross profit (loss) | 30,545 | 6,032 | 2,241 | (887 | ) | 37,931 | ||||||||||||||
Net income (loss) before income taxes | 18,479 | 2,590 | (1,574 | ) | (33,799 | ) | (14,304 | ) | ||||||||||||
For combined three months ended March 31, 2015: | ||||||||||||||||||||
Net sales | $ | 102,017 | $ | 39,385 | $ | 25,856 | $ | 3,376 | 170,634 | |||||||||||
Gross profit (loss) | 15,017 | 2,118 | (261 | ) | 605 | 17,479 | ||||||||||||||
Net income (loss) before income taxes | 11,064 | (749 | ) | (3,897 | ) | (30,486 | ) | (24,068 | ) | |||||||||||
| Drainage Pipe & Products | Water Pipe & Products | Bricks | Corporate and Other | Total | ||||||||||||||||
For the period from January 1, 2015 to March 13, 2015: | ||||||||||||||||||||
Net sales | $ | 79,341 | $ | 30,464 | $ | 19,922 | $ | 2,893 | $ | 132,620 | ||||||||||
Gross profit | 13,567 | 413 | 429 | 380 | 14,789 | |||||||||||||||
Income (loss) from continuing operations before income taxes | 8,839 | (3,192 | ) | (4,000 | ) | (8,145 | ) | (6,498 | ) | |||||||||||
For the purposes of evaluating segment profit,performance, the Company’s chief operating decision maker reviews earnings before interest, taxes, depreciation and amortization as a basis for making the decisions to allocate resources and assetassess performance. Our discussion below includes the primary drivers of earnings before interest, taxes, depreciation and amortization.
Drainage Pipe & Products
Net sales
Net sales increased by $42.3were $79.3 million or 41.5%, to $144.3 millionduring the period which resulted in the three months ended March 31, 2016 from $102.0 million in the combined three months ended March 31, 2015. Net sales increased period over period due to incremental sales of $32.3 million from the Cretex Acquisition and the Sherman-Dixie Acquisition. Legacy business sales volume increases of 5.8% and average sales price increases of 4.6% also increased net sales period over period by $5.0 million and $5.0 million, respectively, as a result of improved market conditions in Texas and the Southeast United States.
Gross profit
Gross profit increased $15.5 million, or 103.4%, in the three months ended March 31, 2016, to $30.5 million from $15.0 million in the combined three months ended March 31, 2015, primarily due to favorable market conditions, which allowed us to increase sales volumes and implement price increases. Additionally, gross profit margins, as a percentage of net sales, increased from 14.7% in the combined three months ended March 31, 2015 to 21.2% in the three months ended March 31, 2016, primarily due to price increases, improved plant efficiencies due to increased production and lower raw material prices. The acquisitions of Cretex and Sherman-Dixie contributed $0.8 million to gross profit for the three months ended March 31, 2016.$13.6 million.
Water Pipe & Products
Net sales
Net sales increased by $1.1were $30.5 million or 2.8%, to $40.5 millionduring the period which resulted in the three months ended March 31, 2016 from $39.4 million in the combined three months ended March 31, 2015. The increase was primarily attributable to an average price increasegross profit of 14.2% which increased net sales $5.5 million, partially offset by a 10.0% reduction in sales volume due to delays in shipments related to unfavorable weather which reduced net sales by $4.4$0.4 million.
Gross profit
Gross profit increased by $3.9 million, to $6.0 million in the three months ended March 31, 2016 from $2.1 million in the combined three months ended March 31, 2015, primarily due to price increases and a lower cost of steel, partially offset by lower sales volumes.
Bricks
Net Sales
Net sales increased by $4.5were $19.9 million or 17.3%, to $30.3 millionduring the period which resulted in the three months ended March 31, 2016 from $25.9 million in the combined three months ended March 31, 2015. Net sales improved across all regions as a result of increased builder activity, driven by a 17.5% increase in sales volume.
Gross profit (loss)
Gross profit increased by $2.5 million, to $2.2 million in the three months ended March 31, 2016 from a loss of $0.3 million in the combined three months ended March 31, 2015. Bricks gross profit increased primarily dueof $0.4 million.
Period from March 14, 2015 to higher net sales, partially offset by an increase in cost of goods sold.
Combined Year Ended December 31, 2015 Compared to Year Ended December 31, 2014
Total Company
The following table summarizes certain financial information relating to our operating results that have been derived from our combined Successor and Predecessor financial statements for the years endedperiod from March 14, 2015 to December 31, 2015 and 2014.2015. Also included is certain information relating to the operating results as a percentage of net sales. See “Basis of Presentation—Combined Fiscal Year 2015 and Three Months Ended March 31, 2015 Results of Operations” above for a discussion regarding the combined year ended December 31, 2015.
| Predecessor | Successor | |||||||||||||||||||||||||||||
| For the period from January 1 to March 13, 2015 | For the period from March 14 to December 31, 2015 | Combined Year Ended December 31, 2015 | % of Net Sales | Year Ended December 31, 2014 | % of Net Sales | % Change | ||||||||||||||||||||||||
| (In thousands, except percentages) | ||||||||||||||||||||||||||||||
Combined Statements of Income Data: | ||||||||||||||||||||||||||||||
Net sales | $ | 132,620 | $ | 722,664 | $ | 855,284 | 100.0 | % | $ | 736,963 | 100.0 | % | 16.1 | % | ||||||||||||||||
Cost of goods sold | 117,831 | 626,498 | 744,329 | 87.0 | % | 631,454 | 85.7 | % | 17.9 | % | ||||||||||||||||||||
|
|
|
|
|
|
|
|
|
|
|
|
|
| |||||||||||||||||
Gross profit | 14,789 | 96,166 | 110,955 | 13.0 | % | 105,509 | 14.3 | % | 5.2 | % | ||||||||||||||||||||
|
|
|
|
|
|
|
|
|
|
|
|
|
| |||||||||||||||||
Selling, general and administrative expenses |
|
(21,683 |
) |
|
(134,971 |
) | (156,654 | ) | (18.3 | )% | (102,107 | ) | (13.9 | )% | 53.4 | % | ||||||||||||||
Impairment and restructuring charges | (542 | ) |
|
(1,185 |
) | (1,727 | ) | (0.2 | )% | (4,219 | ) | (0.6 | )% | (59.1 | )% | |||||||||||||||
Earnings from equity method investee | 67 |
|
8,429 |
| 8,496 | 1.0 | % | 4,451 | 0.6 | % | 90.9 | % | ||||||||||||||||||
Gain (loss) on sale of property, plant and equipment and business, net | 122 | (618 | ) | (496 | ) | (0.1 | )% | 2,329 | 0.3 | % | (121.3 | )% | ||||||||||||||||||
Other operating income |
|
872 |
|
|
1,450 |
| 2,322 | NA | 4,636 | 0.6 | % | (49.9 | )% | |||||||||||||||||
|
|
|
|
|
|
|
|
|
|
|
|
|
| |||||||||||||||||
|
(21,164 |
) |
|
(126,895 |
) | (148,059 | ) | (17.3 | )% | (94,910 | ) | (12.9 | )% | 56.0 | % | |||||||||||||||
|
|
|
|
|
|
|
|
|
|
|
|
|
| |||||||||||||||||
Income (loss) from operations |
|
(6,375 |
) |
|
(30,729 |
) | (37,104 | ) | (4.3 | )% | 10,599 | 1.4 | % | (450.1 | )% | |||||||||||||||
Other income (expense) | ||||||||||||||||||||||||||||||
Interest expense | (84 | ) | (45,953 | ) | (46,037 | ) | (5.4 | )% | — | 0.0 | % | NA | ||||||||||||||||||
Other income (expense), net |
|
(39 |
) |
|
(326 |
) | (365 | ) | NA | (594 | ) | (0.1 | )% | (38.6 | )% | |||||||||||||||
Income (loss) from continuing operations before income taxes |
| (6,498 | ) |
|
(77,008 |
) | (83,506 | ) | (9.8 | )% | 10,005 | 1.4 | % | (934.6 | )% | |||||||||||||||
Income tax expense | 742 |
|
(5,778 |
) | (5,036 | ) | (0.6 | )% | (2,417 | ) | (0.3 | )% | 108.4 | % | ||||||||||||||||
|
|
|
|
|
|
|
|
|
|
|
|
|
| |||||||||||||||||
Loss from continuing operations |
| (5,756)
|
|
| (82,786)
|
| (88,542 | ) | (10.4 | )% | 7,588 | 1.0 | % | (1,266.9 | )% | |||||||||||||||
|
|
|
|
|
|
|
|
|
|
|
|
|
| |||||||||||||||||
Discontinued operations | ||||||||||||||||||||||||||||||
Income (loss) from discontinued operations | — | — | — | — | % | 1,976 | 0.3 | % | (100.0 | )% | ||||||||||||||||||||
Income tax benefit (expense) from discontinued operations | — | — | — | — | % | (716 | ) | (0.1 | )% | (100.0 | )% | |||||||||||||||||||
|
|
|
|
|
|
|
|
|
|
|
|
|
| |||||||||||||||||
Gain (loss) on discontinued operations, net of income tax | — | — | — | — | % | 1,260 | 0.2 | % | (100.0 | )% | ||||||||||||||||||||
|
|
|
|
|
|
|
|
|
|
|
|
|
| |||||||||||||||||
Net income (loss) | $ | (5,756 | ) | $ | (82,786 | ) | $ | (88,542 | ) | (10.4 | )% | $ | 8,848 | 1.2 | % | (1,100.7 | )% | |||||||||||||
|
|
|
|
|
|
|
|
|
|
|
|
|
| |||||||||||||||||
Total Company
Net sales
| Successor | ||||||||
| For the period from March 14 to December 31, 2015 | % of Net Sales | |||||||
Combined Statements of Income Data: | ||||||||
Net sales | $ | 722,664 | 100.0 | % | ||||
Cost of goods sold | 626,498 | 86.7 | % | |||||
|
|
|
| |||||
Gross profit | 96,166 | 13.3 | % | |||||
|
|
|
| |||||
Selling, general and administrative expenses | (134,971 | ) | (18.7 | )% | ||||
Impairment and restructuring charges | (1,185 | ) | (0.2 | )% | ||||
Earnings from equity method investee | 8,429 | 1.2 | % | |||||
Other operating income | 832 | 0.1 | % | |||||
|
|
|
| |||||
| (126,895 | ) | (17.6 | )% | |||||
|
|
|
| |||||
Income (loss) from operations | (30,729 | ) | (4.3 | )% | ||||
Other income (expense) | ||||||||
Interest expense | (45,953 | ) | (6.4 | )% | ||||
Other income (expense), net | (326 | ) | NM | |||||
|
|
|
| |||||
Income (loss) from continuing operations before income taxes | (77,008 | ) | (10.7 | )% | ||||
Income tax expense | (5,778 | ) | (0.8 | )% | ||||
|
|
|
| |||||
Net income (loss) | $ | (82,786 | ) | (11.5 | )% | |||
|
|
|
| |||||
Net sales increased by $118.3for the period were $722.7 million or 16.1%, to $855.3 million in combined 2015 from $737.0 million in 2014. This increase was attributable to awhich included net sales increase of $74.3 million in the Drainage Pipe & Products segment due to incremental sales of $39.1 million of sales from the Cretex Acquisition, an increase in legacy plant sales of $33.2 million primarily due to an average sales price increase of 7.6%, which increased net sales by approximately $31.9 million. Also contributing to the total company increase in net sales was a 38.1% increase in sales volumes in the Water Pipe & Products segment, primarily due to increased activity in Eastern Canada, which increased net sales by $66.1 million, but were partially offset by a 4.4% decrease in the average selling price, which reduced net sales by approximately $18.1 million.
Cretex. Cost of goods sold
The following are the key components was $626.5 million which resulted in gross profit of cost of goods sold:
| Combined Year ended December 31, 2015 | Year ended December 31, 2014 | |||||||||||||||||||||||
| $ | % of Net Sales | $ | % of Net Sales | $ Change | % Change | |||||||||||||||||||
| (In thousands, except percentages) | ||||||||||||||||||||||||
Raw materials and supplies | $ | 226,464 | 26.5 | % | $ | 198,409 | 26.9 | % | $ | 28,055 | 14.1 | % | ||||||||||||
Labor (including contract labor) | 200,346 | 23.4 | % | 173,697 | 23.6 | % | 26,649 | 15.3 | % | |||||||||||||||
Transportation | 74,570 | 8.7 | % | 68,086 | 9.2 | % | 6,484 | 9.5 | % | |||||||||||||||
Energy | 28,536 | 3.3 | % | 36,328 | 4.9 | % | (7,792 | ) | (21.4 | )% | ||||||||||||||
Depreciation | 34,776 | 4.1 | % | 33,417 | 4.5 | % | 1,359 | 4.1 | % | |||||||||||||||
Repairs and maintenance | 39,321 | 4.6 | % | 28,718 | 3.9 | % | 10,603 | 36.9 | % | |||||||||||||||
Other variable and production costs | 140,316 | 16.4 | % | 92,799 | 12.6 | % | 47,517 | 51.2 | % | |||||||||||||||
|
|
|
|
|
|
|
|
|
| |||||||||||||||
Total cost of goods sold | $ | 744,329 | 87.0 | % | $ | 631,454 | 85.7 | % | $ | 112,875 | 17.9 | % | ||||||||||||
|
|
|
|
|
|
|
|
|
| |||||||||||||||
Total cost of goods sold increased by $112.9$96.2 million. Selling, general and administrative expenses were $135.0 million. Interest expense was $46.0 million or 17.9%, to $744.3 million in combined 2015 from $631.5 million in 2014. Total cost of goods sold as a percentage of net sales increased from 85.7% in 2014 to 87.0% in combined 2015. The increase in cost of goods sold in combined 2015 was related to increased activity as a result of the Cretex Acquisition which resulted in incremental costs of $34.3 million, an increase in sales volume, and the impact of $27.8 million and $2.2 million in inventory adjustments duedebt acquired to the application of purchase accounting in connection withfund the Acquisition and the Cretex acquisition, respectively. Partially offsetting the increaseAcquisition. The net loss of $82.8 million was a reduction in energy costs of $7.8 million.
Gross profit
Gross profit increasedprimarily driven by $5.4 million, or 5.2%, to $111.0 million in combined 2015 from $105.5 million in 2014. The Cretex Acquisition contributed $4.8 million to the increase in gross profit. The remaining increase in gross profit was due to growth in net sales and the changes in cost of goods sold as discussed above. The increase was realized in spite of the expenses of $30.0 million related to inventory adjustments due to the effect of purchase accounting.
Selling,selling, general, and administrative expenses
Selling, general and administrative expenses increased by $54.5 million, or 53.4%, to $156.7 million in combined 2015 from $102.1 million in 2014. The increase is primarily attributable to transactional costs incurred in connection with as well as the Acquisition and carve-out costs incurred to separate the Company from HeidelbergCement of $58.3 million in combined 2015.
Impairment and restructuring charges
Impairment and restructuring charges in combined 2015 was $1.7 million as compared to $4.2 million in 2014. Impairments in 2014 primarily related to obsolete equipment across various operating segments. In combined 2015, impairments were recorded due to the plant closures of Caddo and Hattiesburg.
Earnings from equity method investee
Earnings from equity method investee increased $4.0 million in combined 2015 to $8.5 million from $4.5 million in 2014. The increase was attributable to improved profitability from the operations of our CP&P investment.
Gain (loss) on sale of property, plant and equipment and business, net
Our net gain (loss) on the sale of property, plant and equipment and business changed from a loss of $0.5 million in combined 2015 from the disposal of equipment compared to a gain of $2.3 million in 2014 related primarily to gains from the sale of fixed assets previously held in the Drainage Pipe & Products segment.
Other operating income
Other operating income decreased by $2.3 million, to $2.3 million in combined 2015 from $4.6 million in 2014. The decrease is attributable to the absence of insurance proceeds for a damaged plant in 2015.
Interest expense
Interest expense was $46.0 million in combined 2015 compared to no interest expense recorded in 2014. Prior toduring the Acquisition, the Predecessor was funded by its parent and had no outstanding debt. The Successor’s portion of the debt that funded the Acquisition was $515 million and it incurred additional debt of $240 million for the Cretex Acquisition in combined 2015.
Income tax expense
Our income tax expense increased by $2.6 million, to $5.0 million in combined 2015 from $2.4 million in 2014 primarily as a result of the change in our taxable income in Canada for the period. During both periods presented, the U.S. federal taxes were reduced by a corresponding change in the valuation allowance.
Gain (loss) on discontinued operations, net of income tax
In 2014, we incurred a loss on discontinued operations, net of income tax, of $1.3 million related mainly to the disposal of the Maple Grove business in the United States.
Net income (loss)
Our net income decreased by $97.4 million to a loss of $88.5 million in combined 2015 from net income of $8.8 million in 2014, primarily due to carve-out costs of $58.3 million incurred to separate the Company from HeidelbergCement, the Cretex Acquisition, an increase in interest expense of $46.0 million due our incurrence of debt in combined 2015 in connection with the Acquisition, and the impact to cost of goods sold related to a purchase price fair value adjustment of $27.8 million and $2.2 million in inventory due to the application of purchase accounting in connection with the Acquisition and the Cretex Acquisition, respectively. Partially offsetting the reduction in net income was an increase in gross profit of $35.5 million excluding the purchase price adjustment to inventory due to improved average sales prices and increased sales volumes as discussed above.year.
Segment Results of Operations
| Drainage Pipe & Products | Water Pipe & Products | Bricks | Corporate and Other | Total | Drainage Pipe & Products | Water Pipe & Products | Bricks | Corporate and Other | Total | |||||||||||||||||||||||||||||||
| (In thousands) | ||||||||||||||||||||||||||||||||||||||||
Combined for the Year Ended December 31, 2015: | ||||||||||||||||||||||||||||||||||||||||
For the period from March 13, 2015 to December 31, 2015: | ||||||||||||||||||||||||||||||||||||||||
Net sales | $ | 511,064 | $ | 197,881 | $ | 138,311 | $ | 8,028 | $ | 855,284 | $ | 431,723 | $ | 167,417 | $ | 118,389 | $ | 5,135 | $ | 722,664 | ||||||||||||||||||||
Gross profit (loss) | 83,169 | 23,413 | 6,042 | (1,669 | ) | 110,955 | 69,601 | 23,000 | 5,613 | (2,048 | ) | 96,166 | ||||||||||||||||||||||||||||
Income (loss) from continuing operations before income taxes | 57,055 | 3,632 | (12,401 | ) | (131,792 | ) | (83,506 | ) | 48,216 | 6,824 | (8,401 | ) | (123,647 | ) | (77,008 | ) | ||||||||||||||||||||||||
For the Year Ended December 31, 2014: | ||||||||||||||||||||||||||||||||||||||||
Net sales | $ | 436,754 | $ | 149,864 | $ | 139,537 | $ | 10,808 | $ | 736,963 | ||||||||||||||||||||||||||||||
Gross profit (loss) | 77,943 | 12,054 | 14,770 | 742 | 105,509 | |||||||||||||||||||||||||||||||||||
Income (loss) from continuing operations before income taxes | 64,686 | 6,412 | (2,078 | ) | (59,015 | ) | 10,005 | |||||||||||||||||||||||||||||||||
For the purposes of evaluating segment profit,performance, the Company’s chief operating decision maker reviews earnings before interest, taxes, depreciation and amortization as a basis for making the decisions to allocate resources and assetassess performance. Our discussion below includes the primary drivers of earnings before interest, taxes, depreciation and amortization.
Drainage Pipe & Products
Net sales
Net sales increased by $74.3were $431.7 million or 17.0%, to $511.1 million in combined 2015 from $436.8 million in 2014, primarily related to incremental sales ofduring the period which included $39.1 million fromas a result of the Cretex Acquisition and, an increase in legacy plant sales of $35.2Acquisition. Gross profit was $69.6 million, which was primarily due to an average sales price increase of 7.6% that resulted inincluded a $31.9$30.0 million impact to net sales. Sales volumes remained consistent from period to period.
Gross profit
Gross profit increased by $5.3 million, to $83.2 million in combined 2015 from $77.9 in 2014. The increase was primarily a result of $4.7 million of incremental gross profit generated from the Cretex Acquisition and to $33.2 million in net sales, partially offset by an increase in cost of goods sold related to inventory step-up adjustments due to a purchase price adjustment to inventory of $27.8 million and $2.2 million associated with the Acquisition and the Cretex Acquisition, respectively.accounting.
Water Pipe & Products
Net sales
Net sales increased by $48.0were $167.4 million or 32.0%, to $197.9 million in combined 2015 from $149.9 million in 2014. The increase in segment net sales was due to a sales volume increase of 38.1%, which resulted in a $66.1 million increase in net sales, primarily due to increased activity in Eastern Canada. Partially offsettingduring the increase was a reduction in the average selling price of 4.4%, which reduced net sales by $18.1 million.
period. Gross Profit
We reported segment gross profit of $23.4 million in combined 2015, compared to gross profit of $12.1 million in 2014. The increase in segment gross profit was due to improved sales volumes primarily due to increased activity in Eastern Canada, partially offset by a non-recurring charge to$23.0 million during the period, which included the impact of inventory step-up adjustments due to purchase accounting of $5.9 million associated with the Acquisition.
Bricks
Net sales
Net sales decreased by $1.2were $118.4 million or 0.9%, to $138.3 million in combined 2015 from $139.5 million in 2014. The decline was a result of a 3.5% decrease induring the average sales price, which led to a $4.4 million decrease in net sales, partially offset by a 2.7% increase in sales volume, which increased net sales by $3.2 million.
Gross Profit
period. Gross profit decreased by $8.7was $5.6 million, to $6.0 million in combined 2015 from $14.8 million in 2014. The decrease was primarilywhich included the impact of inventory step-up adjustments due a $1.2 million reduction in net sales as well as an increase in cost of goods sold due to a charge to inventory due to the effects of purchase accounting of $6.7 million related toassociated with the Acquisition.
Year Ended December 31, 2014 Compared to Year Ended December 31, 2013
The following table summarizes certain financial information relating to our operating results that have been derived from our combined Predecessor financial statements for the years ended December 31, 2014 and 2013. Also included is certain information relating to the operating results as a percentage of net sales.
| Year Ended December 31, 2014 | % of Net Sales | Year Ended December 31, 2013 | % of Net Sales | % Change | ||||||||||||||||
| (In thousands, except percentages) | ||||||||||||||||||||
Combined Statements of Income Data: | ||||||||||||||||||||
Net sales | $ | 736,963 | 100.0 | % | $ | 697,948 | 100.0 | % | 5.6 | % | ||||||||||
Cost of goods sold | 631,454 | 85.7 | % | 611,660 | 87.6 | % | 3.2 | % | ||||||||||||
|
|
|
|
|
|
|
|
|
| |||||||||||
Gross profit | 105,509 | 14.3 | % | 86,288 | 12.4 | % | 22.3 | % | ||||||||||||
|
|
|
|
|
|
|
|
|
| |||||||||||
Selling, general and administrative expenses | (102,107 | ) | (13.9 | )% | (87,393 | ) | (12.5 | )% | 16.8 | % | ||||||||||
Impairment and restructuring charges | (4,219 | ) | (0.6 | )% | (250,577 | ) | (35.9 | )% | (98.3 | )% | ||||||||||
Earnings from equity method investee | 4,451 | 0.6 | % | (216 | ) | — | % | (2,160.6 | )% | |||||||||||
Gain on sale of property, plant and equipment and business, net | 2,329 | 0.3 | % | 3,998 | 0.6 | % | (41.7 | )% | ||||||||||||
Other operating income | 4,636 | 0.6 | % | 5,234 | 0.7 | % | (11.4 | )% | ||||||||||||
|
|
|
|
|
|
|
|
|
| |||||||||||
| (94,910 | ) | (12.9 | )% | (328,954 | ) | (47.1 | )% | (71.1 | )% | |||||||||||
|
|
|
|
|
|
|
|
|
| |||||||||||
Income (loss) from operations | 10,599 | 1.4 | % | (242,666 | ) | (34.8 | )% | (104.4 | )% | |||||||||||
Other income (expense) | ||||||||||||||||||||
Other income (expense), net | (594 | ) | (0.1 | )% | 947 | 0.1 | % | (162.7 | )% | |||||||||||
Income (loss) from continuing operations before income taxes | 10,005 | 1.4 | % | (241,719 | ) | (34.6 | )% | (104.1 | )% | |||||||||||
Income tax expense | (2,417 | ) | (0.3 | )% | (2,561 | ) | (0.4 | )% | (5.6 | )% | ||||||||||
|
|
|
|
|
|
|
|
|
| |||||||||||
Loss from continuing operations | 7,588 | 1.0 | % | (244,280 | ) | (35.0 | )% | (103.1 | )% | |||||||||||
|
|
|
|
|
|
|
|
|
| |||||||||||
Discontinued operations | ||||||||||||||||||||
Income (loss) from discontinued operations | 1,976 | 0.3 | % | (3,018 | ) | (0.4 | )% | (165.5 | )% | |||||||||||
Income tax benefit (expense) from discontinued operations | (716 | ) | (0.1 | )% | — | — | % | NM | ||||||||||||
|
|
|
|
|
|
|
|
|
| |||||||||||
Gain (loss) on discontinued operations, net of income tax | 1,260 | 0.2 | % | (3,018 | ) | (0.4 | )% | (141.7 | )% | |||||||||||
|
|
|
|
|
|
|
|
|
| |||||||||||
Net income (loss) | $ | 8,848 | 1.2 | % | $ | (247,298 | ) | (35.4 | )% | (103.6 | )% | |||||||||
|
|
|
|
|
|
|
|
|
| |||||||||||
Combined Statements of Income Data: Net sales Cost of goods sold Gross profit Selling, general and administrative expenses Impairment and restructuring charges Earnings from equity method investee Other operating income Income (loss) from operations Other income (expense) Other income (expense), net Income (loss) from continuing operations before income taxes Income tax expense Income (loss) from continuing operations Discontinued operations Income (loss) from discontinued operations Income tax benefit (expense) from discontinued operations Gain (loss) on discontinued operations, net of income tax Net income (loss) Year Ended
December 31,
2014 % of
Net
Sales Year Ended
December 31,
2013 % of
Net
Sales %
Change (In thousands, except percentages) $ 736,963 100.0 % $ 697,948 100.0 % 5.6 % 631,454 85.7 % 611,660 87.6 % 3.2 % 105,509 14.3 % 86,288 12.4 % 22.3 % (102,107 ) (13.9 )% (87,393 ) (12.5 )% 16.8 % (4,219 ) (0.6 )% (250,577 ) (35.9 )% (98.3 )% 4,451 0.6 % (216 ) NM (2,160.6 )% 6,965 0.9 % 9,232 1.3 % (24.6 )% (94,910 ) (12.9 )% (328,954 ) (47.1 )% (71.1 )% 10,599 1.4 % (242,666 ) (34.8 )% (104.4 )% (594 ) (0.1 )% 947 0.1 % (162.7 )% 10,005 1.4 % (241,719 ) (34.6 )% (104.1 )% (2,417 ) (0.3 )% (2,561 ) (0.4 )% (5.6 )% 7,588 1.0 % (244,280 ) (35.0 )% (103.1 )% 1,976 0.3 % (3,018 ) (0.4 )% (165.5 )% (716 ) (0.1 )% — — % NM 1,260 0.2 % (3,018 ) (0.4 )% (141.7 )% $ 8,848 1.2 % $ (247,298 ) (35.4 )% (103.6 )%
Total Company
Net sales
Net sales increased by $39.0 million, or 5.6%, to $737.0 million in 2014 from $697.9 million in 2013. The increase was primarily attributable to increases in net sales in the Drainage Pipe & Products segment of $64.7 million, partially offset by net sales decreases of $21.9 million and $6.0 million in the Water Pipe & Products and Bricks segments, respectively.
Cost of goods sold
The following are the key components of cost of goods sold (in thousands, except percentages):
| Year ended December 31, 2014 | Year ended December 31, 2013 | |||||||||||||||||||||||
| $ | % of Net Sales | $ | % of Net Sales | $ Change | % Change | |||||||||||||||||||
Raw materials and supplies | $ | 198,409 | 26.9 | % | $ | 167,046 | 23.9 | % | $ | 31,363 | 18.8 | % | ||||||||||||
Labor (including contract labor) | 173,697 | 23.6 | % | 176,170 | 25.2 | % | (2,473 | ) | (1.4 | )% | ||||||||||||||
Transportation | 68,086 | 9.2 | % | 52,744 | 7.6 | % | 15,342 | 29.1 | % | |||||||||||||||
Energy | 36,328 | 4.9 | % | 33,537 | 4.8 | % | 2,791 | 8.3 | % | |||||||||||||||
Depreciation | 33,417 | 4.5 | % | 35,319 | 5.1 | % | (1,902 | ) | (5.4 | )% | ||||||||||||||
Repairs and maintenance | 28,718 | 3.9 | % | 28,351 | 4.1 | % | 367 | 1.3 | % | |||||||||||||||
Other variable and production costs | 92,799 | 12.6 | % | 118,493 | 16.9 | % | (25,694 | ) | (21.7 | )% | ||||||||||||||
|
|
|
|
|
|
|
|
|
| |||||||||||||||
Total cost of goods sold | $ | 631,454 | 85.7 | % | $ | 611,660 | 87.6 | % | $ | 19,794 | 3.2 | % | ||||||||||||
|
|
|
|
|
|
|
|
|
| |||||||||||||||
Cost of goods sold increased by $19.8 million, or 3.2%, to $631.5 million in 2014 from $611.7 million in 2013. Cost of goods sold increased primarily due to the net sales increase in the Drainage Pipe & Products segment.
Gross profit
Gross profit increased by $19.2 million, or 22.3%, to $105.5 million in 2014 from $86.3 million in 2013 as a result of the increase in net sales. Gross profit margin improved to 14.3% in 2014 as compared to 12.4% in 2013 due to improvements in plant production efficiencies in our Drainage Pipe & Products segment.
Selling, general and administrative expenses
Selling, general and administrative expenses increased by $14.7 million, or 16.8%, to $102.1 million in 2014 from $87.4 million in 2013. This increase was due to higher professional fees for transaction costs related to legal, accounting and auditing services in connection with the preparation of a public offering in the second half of 2014 that was not ultimately consummated. As a percentage of net sales, selling, general and administrative expenses increased to 13.9% in 2014 from 12.5% in 2013.
Impairment and restructuring charges
Impairment and restructuring charges in 2014 and 2013 were $4.2 million and $250.6 million, respectively. The impairment and restructuring charges recorded in 2014 related to equipment impairments across various segments in 2014. The impairment and restructuring charges in 2013 consist of a goodwill impairment charge of $236.6 million as well as the closure of certain plants resulting in $14.0 million of additional charges. The goodwill impairment charge in 2013 of $236.6 million was the amount by which the carrying value of the reporting unit within our Water Pipe & Products segment exceeded the fair value of the identifiable assets and liabilities of the reporting unit.
Earnings from equity method investee
Earnings from equity method investee increased $4.7 million in 2014 to $4.5 million from a loss of $0.2 million in 2013. The increase was attributable to improved profitability of our investment in CP&P.
Gain (loss) on sale of property, plant and equipment and business, net
Our net gain on sale of property, plant and equipment and business in 2014 of $2.3 million related primarily to fixed asset sales in the United States primarily associated with the sale of two plants within
the Drainage Pipe & Products segment. In 2013, our net gain on sale of property, plant and equipment and business of $4.0 million related mainly to the sale of three plants.
Other operating income
Other operating income remained relatively flat at $4.6 million in 2014 and $5.2 million in 2013.
Income tax expense
Our income tax expense decreased by $0.2 million to $2.4 million in 2014 from $2.6 million in 2013 due to the change in our taxable income in Canada for the period. During both periods presented, the U.S. federal taxes were reduced by a corresponding change in the valuation allowance.
Gain (loss) on discontinued operations, net of income tax
Our gain on discontinued operations, net of income tax, in 2014 of $1.3 million related primarily to the operations of our Maple Grove business in the United States. In 2013, our loss on discontinued operations, net of income tax, of $3.0 million related mainly to our paver business.
Net income (loss)
We recognized net income of $8.8 million in 2014, an increase of $256.1 million as compared to the net loss of $247.3 million in 2013. The improvement was primarily due to an impairment charge of $236.6 million recognized in 2013 described above.
Segment Results of Operations
| Drainage Pipe & Products | Water Pipe & Products | Bricks | Corporate and Other | Total | ||||||||||||||||
| (In thousands) | ||||||||||||||||||||
For year ended December 31, 2014: | ||||||||||||||||||||
Net Sales | $ | 436,754 | $ | 149,864 | $ | 139,537 | $ | 10,808 | $ | 736,963 | ||||||||||
Gross profit | 77,943 | 12,054 | 14,770 | 742 | 105,509 | |||||||||||||||
Income (loss) from continuing operations before income taxes | 64,686 | 6,412 | (2,078 | ) | (59,015 | ) | 10,005 | |||||||||||||
For year ended December 31, 2013: | ||||||||||||||||||||
Net Sales | $ | 372,060 | $ | 171,773 | $ | 145,500 | $ | 8,615 | $ | 697,948 | ||||||||||
Gross profit | 38,476 | 27,773 | 21,451 | (1,412 | ) | 86,288 | ||||||||||||||
Income (loss) from continuing operations before income taxes | 10,937 | (218,555 | ) | 2,594 | (36,695 | ) | (241,719 | ) | ||||||||||||
For the purposes of evaluating segment profit,performance, the Company’s chief operating decision maker reviews earnings before interest, taxes, depreciation and amortization as a basis for making the decisions to allocate resources and assetassess performance. Our discussion below includes the primary drivers of earnings before interest, taxes, depreciation and amortization.
Drainage Pipe & Products
Net sales
Net sales increased by $64.7 million, or 17.4%, to $436.8 million in 2014 from $372.1 million in 2013. Sales volumes increased period over period by 14.0% due to market improvements in the United
States which impacted sales by $56.0 million. Further, the average sales price increased 3.0% due to price increases in late 2013 and early 2014 resulting in a further increase in net sales of $8.7 million.
Gross profit
Gross profit improved by $39.5 million, or 102.6%, to $77.9 million in 2014 from $38.5 million in 2013. The year-over-year improvement was due to favorable market conditions that allowed us to increase sales volumes and implement price increases.
Water Pipe & Products
Net sales
Net sales decreased by $21.9 million, or 12.8%, to $149.9 million in 2014 from $171.8 million in 2013. The decrease was primarily driven by an 11.8% decline in the average selling price due to a shift in product mix from steel pipe to concrete pipe, which led to a net sales decrease of $21.5 million, and several large projects that ended toward the second half of 2013 causing a decline in sales volume of 1.0%, which decreased net sales by $0.4 million.
Gross profit
Gross profit decreased by $15.7 million, or 56.6%, to $12.1 million in 2014 from $27.8 million in 2013. This decrease was primarily driven by an 11.8% decline in the average selling price due to a shift in product mix from steel pipe to concrete pipe and several large projects that ended toward the second half of 2013 that led to a decline in sales volumes.
Bricks
Net sales
Net sales decreased by $6.0 million, or 4.1%, to $139.5 million in 2014 from $145.5 million in 2013, as a result of a 2.4% decline in sales volume, which led to a $4.1 million decrease in net sales, and a lower average sales price of 1.8% which resulted in a $1.9 million reduction in net sales. This decrease in sales volume was primarily due to unfavorable winter weather conditions in Canada that extended beyond the first quarter in 2014, which delayed shipments, job site availability and preparation of residential lots by home-builders.
Gross profit
Gross profit decreased by $6.7 million, or 31.1%, to $14.8 million in 2014 from $21.5 million in 2013. This decrease was due to unfavorable winter weather conditions in Canada that extended beyond the first quarter in 2014.
Quarterly Financial Information
The following tables set forth our unaudited combined Successor quarterly financial information for each of the full period quarters following the Acquisition on March 13, 2015. This unaudited information has been prepared on a basis consistent with our audited combined Successor financial statements and includes all adjustments (consisting only of normal recurring adjustments) necessary for the fair presentation of the unaudited quarterly data. This information should be read together with our Successor combined financial statements and the related notes, included elsewhere in this
prospectus. The results for any quarter are not necessarily indicative of results that we may achieve for any subsequent periods.
| Three Months Ended | ||||||||||||||||||||
| June 30, 2016 | March 31, 2016 | December 31, 2015 | September 30, 2015 | June 30, 2015 | ||||||||||||||||
| (In thousands) | ||||||||||||||||||||
Total net sales | $ | 422,808 | $ | 217,334 | $ | 229,934 | $ | 241,415 | $ | 213,301 | ||||||||||
Depreciation and amortization | 26,661 | 13,759 | 12,590 | 9,277 | 9,267 | |||||||||||||||
Interest expense, net | (24,839 | ) | (17,290 | ) | (17,374 | ) | (13,028 | ) | (13,077 | ) | ||||||||||
Income tax expense (benefit) | (26,165 | ) | (10,368 | ) | 1,468 | 2,730 | 1,579 | |||||||||||||
Net income (loss) | $ | 36,689 | $ | (3,936 | ) | $ | (33,102 | ) | $ | (14,967 | ) | $ | (17,147 | ) | ||||||
Liquidity and Capital Resources
Prior to the Acquisition, our primary source of liquidity was cash from operations and borrowings or advances from HeidelbergCement. The Predecessor used HeidelbergCement’s centralized processes and systems for cash management, payroll and purchasing. As a result, all cash received by our business was deposited with HeidelbergCement’s general corporate funds and was not specifically allocated to our business.
Since the Acquisition, our primary sources of liquidity have been cash on hand, cash from operations and borrowings under our long-term debt. We believe these sources will be sufficient to fund our planned operations and capital expenditures in the next 24 months. See “Description of Certain Indebtedness” for a description of our existing indebtedness.
We are currently engaged in a dispute with HeidelbergCement regarding the earn outearn-out provision in the purchase agreement entered into in connection with the Acquisition. As discussed in greater detail in “Business—Legal Proceedings,” we believe that no earn out payment is owed, but HeidelbergCement has asserted that a payment should be made in the amount of $100.0 million. Resolution may be determined by a neutral accountant. If it is determined that we are required to make a significant payment to HeidelbergCement, we may not have sufficient cash to make such payment and may be required to incur additional indebtedness. See the section entitled “Risk Factors.”
As of June 30, 2016 and December 31, 2015, we had approximately $41.8 million and $43.6 million of cash and cash equivalents, respectively of which $14.6 million and $8.8 million, respectively, was held by foreign subsidiaries. All of the cash and cash equivalents as of June 30, 2016 and December 31, 2015 were readily convertible as of such dates into currencies used in the Company’s operations, including the U.S. dollar. We are not aware of legal or economic restrictions on our ability to repatriate funds in the form of cash dividends, loans or advances. We do not have any present intention to repatriate these funds. However, if these funds are repatriated to the United States, we will be subject to additional taxes including withholdings tax applied by the country of origin and an incremental U.S. income tax, net of allowable foreign tax credits.
Total debt as of June 30, 2016 was $1,450.7 million, and included $1,001.7 million and $238.1 million outstanding on the Senior Term Loan and Junior Term Loan, respectively, and a $210.9 million financing obligation related to the Sale Leaseback discussed in note 10 to our unaudited combined financial statements included elsewhere in this prospectus. At June 30, 2016, we had no outstanding balance on the Revolver, which has total borrowing capacity of $285.0 million.
The following table sets forth a summary of the net cash provided by (used in) operating, investing and financing activities for the three month period ending March 31, 2016, the combined three months ended March 31, 2015, the combined 2015 year and for the years ended December 31, 2014, and 2013. See “Basis of Presentation—Combined Fiscal Year 2015 and Three Months Ended March 31, 2015 Results of Operations” above for a discussion regarding the combined three months ended March 31, 2015 and the combined year ended December 31, 2015.presented.
(In thousands)
| ||||||||||||||||||||||||||||||||||||||||||||||||
| Three Months Ended March 31, | Year Ended December 31, | Successor | Predecessor | |||||||||||||||||||||||||||||||||||||||||||||
| 2016 | 2015 Combined | 2015 Combined | 2014 | 2013 | Year Ended December 31, | |||||||||||||||||||||||||||||||||||||||||||
| (In thousands) | Six month ended June 30, 2016 | March 14, 2015 to June 30, 2015 | March 14, 2015 to December 31, 2015 | January 1, 2015 to March 13, 2015 | 2014 | 2013 | ||||||||||||||||||||||||||||||||||||||||||
Statement of Cash Flows data: | ||||||||||||||||||||||||||||||||||||||||||||||||
Net cash provided by (used in) operating activities | $ | (35,834 | ) | $ | (28,333 | ) | $ | 73,193 | $ | 25,918 | $ | 31,686 | $ | (6,366 | ) | $ | (37 | ) | $ | 121,417 | $ | (48,224 | ) | $ | 25,918 | $ | 31,686 | |||||||||||||||||||||
Net cash used in investing activities | (73,501 | ) | (643,190 | ) | (900,801 | ) | (1,901 | ) | (55 | ) | (858,201 | ) | (643,160 | ) | (898,039 | ) | (2,762 | ) | (1,901 | ) | (55 | ) | ||||||||||||||||||||||||||
Net cash provided by (used in) financing activities | 77,809 | 721,317 | 883,487 | (23,990 | ) | (31,636 | ) | 861,868 | 665,629 | 822,580 | 60,907 | (23,990 | ) | (31,636 | ) | |||||||||||||||||||||||||||||||||
Net Cash Provided by (Used in) Operating Activities
Net cash used in operating activities was $35.8$6.4 million for the threesix months ended March 31,June 30, 2016, compared to net cash used in operating activities of $28.3was $0.0 million for the combined three months endedperiod from March 31, 2015. The change between periods was driven by higher selling, general and administrative expenses in the combined three months ended March 31,14, 2015 including higher than normal transactional and acquisition related costs that are related to the Acquisition and non-recurring costs to establish the Company as a stand-alone business. Due to the seasonality of our segments, we typically use cash in the first quarter to fund our working capital accounts.
NetJune 30, 2015, net cash provided by operating activities was $73.1$121.4 million for combinedthe period from March 14, 2015 compared to $25.9December 31, 2015, and net cash used in operating activities was $48.2 million for 2014. The increase in operating cash flow was driven by higher income before non-cash charges.the period from January 1, 2015 to March 13, 2015.
Net cash provided by operating activities was $25.9 million for 2014 compared to $31.7 million for 2013. The decrease in operating cash flow was driven by a decline in accounts payable due to timing of payments made to vendors.
Net Cash Used in Investing Activities
Net cash used in investing activities was $73.5$858.2 million for the threesix months ended March 31,June 30, 2016 primarily due toas a result of the Sherman-Dixie Acquisition, which represented a net cash investment of $66.8 million. Net cash used in investing activities wasfor the U.S. Pipe Acquisition and Sherman-Dixie Acquisition, $643.2 million for the combined three months endedperiod from March 14, 2015 to June 30, 2015 due to the Acquisition, $898.0 million for the period from March 14, 2015 to December 31, 2015 primarily due to the Acquisition.
Net cash used in investing activities was $900.8 million for combined 2015, primarily due to the Acquisition which represented a net cash investment of $640.4 million, and the Cretex Acquisition, which represented a netand $2.8 million for the period from January 1, 2015 to March 13, 2015 due to cash investment of $245.1 million.used for property, plant, and equipment.
Net cash used in investing activities was $1.9 million for 2014 due to capital expenditures related mainly to fixed asset replacements of $22.8 million, partially offset by $5.9 million of net proceeds from the sale of long-term assets and a $15.0 million distribution from our investment in CP&P.
Net cash used in investing activities was $0.1 million for 2013, primarily due to capital expenditures of $10.5 million, partially offset by $10.4 million of net proceeds from the sale of closed plants.
Net Cash Provided by (Used in) Financing Activities
Net cash provided by financing activities was $77.8 million and $721.3$861.9 million for the three monthssix month period ended March 31,June 30, 2016 primarily as a result of additional debt obligations incurred in connection with the Debt Recapitalization and the combined three months ended March 31, 2015, respectively. Financing activities for the three months ended March 31, 2016 related to net draws on the Revolver of $73.4 million primarily used to fund the Sherman-Dixie Acquisition. Financing activities for the combined three months ended March 31, 2015 related to a $167.5 million capital contribution from Lone Star and aggregate proceeds from Senior Term Loan and Junior Term Loan of $492.8 million to fund the Acquisition.
Net cash provided by financing activities was $883.5 million for combined 2015 and reflected netU.S. Pipe Acquisition as well as capital contributions from Lone Starour parent, partially offset by dividend payments of $167.5$345.0 million and netto our parent, $665.6 million for the period from March 14, 2015 to June 30, 2015 primarily consisting of additional borrowings of long-term debt fundingsincurred in connection with the Acquisition as well as capital contributions from our parent, $822.6
million for the period from March 14, 2015 to December 31, 2015 due to borrowings of $730.4 millionlong-term debt incurred in connection with the Acquisition and capital contributions from HeidelbergCement priorour parent, and $60.9 million for the period January 1, 2015 compared to the Acquisition of $60.9 million. March 13, 2015 due to capital contributions from HeidelbergCement.
Net cash used in financing activities was $24.0 million for 2014 and $31.6 million for 2013, in each case primarily due to net distributions to HeidelbergCement.
Capital Expenditures
Our capital expenditures were $3.0$15.0 million for the threesix months ended June 30, 2016, and $7.0 million for the period from March 14, 2015 to June 30, 2015, $20.0 million for the period from March 14, 2015 to December 31, 20162015, and $2.7 million infor the combined three months endedperiod from January 1, 2015 to March 3113, 2015. We had capital expenditures of $22.8 million, $25.3 million, and $10.6 million in combined 2015 and 2014 and 2013, respectively. Capital expenditures primarily related to equipment, such as plant and mobile equipment, expansion of existing facilities and environmental and permit compliance projects.
Contractual Obligations and Other Long-Term Liabilities
The following table summarizes our significant contractual obligations as of December 31, 2015.June 30, 2016. Some of the amounts included in the table are based on management’s estimates and assumptions about these obligations, including their duration, the possibility of renewal, anticipated actions by third parties and other factors. Because these estimates and assumptions are necessarily subjective, our actual payments may vary from those reflected in the table.
| Payment Due by Period | ||||||||||||||||||||||||||||
| Total | 2016 | 2017 | 2018 | 2019 | 2020 | Thereafter | ||||||||||||||||||||||
| (In thousands) | ||||||||||||||||||||||||||||
Senior Term Loan | 489,512 | 2,191 | — | — | — | — | 487,321 | |||||||||||||||||||||
Junior Term Loan | 260,000 | — | — | — | — | — | 260,000 | |||||||||||||||||||||
Interest on indebtedness | 395,899 | 59,011 | 58,976 | 58,976 | 58,976 | 58,976 | 101,020 | |||||||||||||||||||||
Operating leases | 10,264 | 2,691 | 2,061 | 1,707 | 775 | 526 | 2,504 | |||||||||||||||||||||
|
|
|
|
|
|
|
|
|
|
|
|
|
| |||||||||||||||
Total Commitments | 1,155,675 | 63,893 | 61,037 | 60,683 | 59,751 | 59,502 | 850,845 | |||||||||||||||||||||
|
|
|
|
|
|
|
|
|
|
|
|
|
| |||||||||||||||
Senior Term Loan Junior Term Loan Financing obligation Interest on indebtedness Operating leases Total Commitments Payment Due by Period Total 2016 2017 2018 2019 2020 Thereafter (In thousands) 1,035,721 — — — — — 1,035,721 260,000 — — — — — 260,000 217,404 — — — — — 217,404 1,024,369 73,445 111,856 112,201 112,552 112,911 501,404 38,814 5,874 8,018 6,935 4,832 3,125 10,030 2,576,308 79,319 119,874 119,136 117,384 116,036 2,024,559
In connection with this offering, or shortly thereafter, we expect to enter into a new term loansloan and revolving linesline of credit, or otherwisethe proceeds of which, along with our proceeds from this offering, will be used to refinance our existing long-term indebtedness. See “Description of Certain Indebtedness.”
Additionally, we have accrued $6.8$18.9 million in other long-term liabilities as of December 31, 2015.June 30, 2016. See note 1213 to our auditedunaudited condensed combined financial statements included elsewhere in this prospectus.
Off-Balance Sheet Arrangements
In the ordinary course of our business, we are required to provide surety bonds and standby letters of credit to secure performance commitments, particularly in our Water Pipe & Products and Bricks segments. As of December 31, 2015,June 30, 2016, outstanding surety bonds and standbystand-by letters of credit amounted to $137.1$22.6 million.
Material Weaknesses in Internal Control Over Financial Reporting
Our management is responsible for the design, implementation and maintenance of our internal controls over our financial reporting as defined in Rule 13a-15(e) promulgated under the Exchange Act. In
connection with the audit of our combined financial statements during the period from March 14, 2015 to December 31, 2015, material weaknesses in our internal control over financial reporting were identified. A material weakness is defined as a deficiency, or combination of deficiencies, in internal control over financial reporting, such that there is a reasonable possibility that a material misstatement of our annual or interim financial statements will not be prevented or detected on a timely basis. These material weaknesses resulted in material adjustments to our combined financial statements identified during the audit and corrected in historical periods presented.
The two material weaknesses identified as of December 31, 2015 were:
| • | Systems—The issue regarding our systems related to the fact we did not maintain a general ledger in which transactions were recorded on a basis that is consistent with policies established for purposes of complying with GAAP and consistent with our business practices independent of HeidelbergCement and its affiliates. At various times in 2015 prior to the Acquisition, our accounting records were maintained by affiliates of HeidelbergCement under accounting policies intended to comply with HeidelbergCement’s IFRS group reporting requirements or, following the Acquisition, under those same accounting policies under the terms of a Transition Services Agreement with HeidelbergCement. In order to prepare financial statements as a stand-alone company in compliance with GAAP, we were required to record a significant number of manual adjusting entries and other adjustments necessary to adjust the financial statements to an appropriate degree of precision necessary for our stand-alone reporting to be accurate. |
| • | Processes—Prior to the Acquisition, we were one member of HeidelbergCement’s large multinational group of companies and were therefore not required to produce stand-alone financial reporting. Our routine policies, procedures and practices that existed as of December 31, 2015 were developed to process transactions and produce financial data to meet HeidelbergCement’s financial reporting needs under IFRS. Our accounting policies and practices had not been substantially modified and documented since the Acquisition. As such, we had not established well-defined processes under which we could complete our financial statement close process for stand-alone GAAP financial reporting at that time. |
| • | People (dependence on HeidelbergCement)—In order to produce financial statements in compliance with GAAP, we relied on the resources of HeidelbergCement and its affiliates following the Acquisition. Among other things, at times in 2015, both prior to the Acquisition and following the Acquisition pursuant to a transition services agreement, we were specifically dependent on HeidelbergCement for the provision of legal services, accounting and finance services, human resources, marketing and contract support, customer support, treasury, facility and land management and other corporate and infrastructure services. Additionally, an extensive number of third party service providers were performing routine financial statement close processes, including qualitative activities, for much of 2015. We have largely eliminated our reliance on HeidelbergCement personnel and third-parties; however, the training of personnel hired and establishment of effective policies and procedures will continue to be a significant undertaking. |
Each of these material weaknesses could result in a material error and a misstatement of the account balances or disclosures that could result in a material misstatement to our annual or interim combined financial statements that would not be prevented or detected. See “Risk Factors.”
We are in the process of implementing a remediation plan to specifically address these material weaknesses and to improve the effectiveness of our internal control over financial reporting. The specific aspects of our remediation plan include:
While management has concluded that we have material weaknesses in our internal control over financial reporting, we have devoted a significant amount of time and resources to the analysis of our historical combined financial statements included elsewhere in this prospectus. Accordingly, management believes that our historical combined financial statements included elsewhere in this prospectus fairly present in all material respects, our financial condition, results of operations and cash flows.
It should be noted that any system of controls, however well designed and operated, can provide only reasonable and not absolute assurance that the objectives of the system will be met. In addition, the design of any control system is based in part upon certain assumptions about the likelihood of future events. Because of the inherent limitations in all control systems, no evaluation of controls can provide absolute assurance that all control issues and instances of fraud, if any, have been detected or that judgments in decision-making are not based on faulty input.
Our independent public accounting firm has not yet performed an audit of our internal control over financial reporting and is not required to report on management’s assessment of our internal control over financial reporting until the second annual report on Form 10-K that we file with the SEC.
Quantitative and Qualitative Disclosures about Market Risk
In the normal course of business, we are exposed to financial risks such as changes in interest rates, foreign currency exchange rates and commodity price risk associated with our input costs. We utilize derivative instruments to manage selected foreign exchange and interest rate exposures. See note 9 to our audited combined financial statements included elsewhere in this prospectus.
Interest Rate Risk
Our exposure to market risk for changes in interest rates relates primarily to our long-term debt. The interest expense associated with our long-term debt will vary with market rates. Based upon our
outstanding principal amount of debt of $749.5 million at December 31, 2015, an increase in the current rate levels of 1% would result in an increase in our annual interest expense of $7.5 million.
Foreign Currency Risk
Approximately 11.4%, 18.4%, 19.5%, and 19.9%11.2% of our net sales for the threesix months ended March 31,June 30, 2016 and for the years ended December 31, 2015 (combined), 2014 and 2013, respectively, were in Canada. As a result, we are exposed to movements in foreign exchange rates between the U.S. dollar and the Canadian dollar. Based upon our net sales for the yearsix months ended December 31, 2015,June 30, 2016 we estimate that a 1% change in the exchange rate between the U.S. dollar and the Canadian dollar would affect net sales by approximately $1.6$0.7 million. This may differ from actual results depending on the levels of net sales in Canada.
Commodity Price Risk
We are subject to commodity price risks with respect to price changes mainly in the electricity and natural gas markets and other raw material costs, such as cement, aggregates, steel and clay. Price fluctuations on our key inputs have a significant effect on our financial performance. The markets for most of these commodities are cyclical and are affected by factors such as the global economic conditions, changes in or disruptions to industry production capacity, changes in inventory levels and other factors beyond our control. See “Risk Factors.”
Credit Risk
Financial instruments that potentially subject us to a concentration of credit risk consist principally of accounts receivable. We provide our products to customers based on an evaluation of the financial condition of our customers, generally without requiring collateral. Exposure to losses on receivables is principally dependent on each customer’s financial condition. We monitor the exposure for credit losses and maintain allowances for anticipated losses. Concentrations of credit risk with respect to our accounts receivable are limited due to the large number of customers comprising our customer base and their dispersion among many different geographies.
Critical Accounting Policies
The preparation of our financial statements requires management to make estimates and assumptions that affect the reported amounts of assets and liabilities and the disclosure of contingent assets and liabilities at the date of the financial statements and the reported amounts of revenues and
expenses. Although management bases its estimates on historical experience and various other assumptions that it believes to be reasonable under the circumstances, actual results may differ to some extent from the estimates on which our financial statements have been prepared at any point in time. A summary of our significant accounting policies is included in note 2 to the audited combined financial statements included elsewhere in this prospectus. We believe that the critical accounting policies listed below involve our more significant judgments, assumptions, and estimates and, therefore, could have the greatest potential impact on the financial statements.
Revenue recognition
Revenues are recognized by the Company when the risks and rewards associated with the transaction have been transferred to the purchaser, which is demonstrated when all the following conditions are met: evidence of a binding arrangement exists (generally, purchase orders), products have been delivered or services have been rendered, there is no future performance required, fees are fixed or determinable and amounts are collectable under normal payment terms. Sales represent the net amounts charged or chargeable in respect of services rendered and goods supplied, excluding intercompany sales. Sales are recognized net of any discounts given to the customer.
The Company bills and incurs shipping costs to third parties for the transportation of building products to customers. For the period from March 14, 2015 to December 31, 2015, for the period from January 1, 2015 to March 13, 2015, and for the years ended December 31, 2014 and 2013, the Company recorded freight costs of approximately $59,943, $11,041, $69,862, and $63,301, respectively, on a gross basis within net sales and cost of goods sold in the accompanying combined statements of operations.
The Company’s revenues primarily relate to product shipments. For certain engineering and construction contracts and building contracting arrangements, the Company recognizes revenue using the percentage of completion method, based on total contract costs incurred to date compared to total estimated cost at completion for each contract. Changes to total estimated contract cost or losses, if any, are recognized in the period in which they are determined. Pre-contract costs are expensed as incurred. If estimated total costs on a contract indicate a loss, the entire loss is provided for in the financial statements immediately. To the extent the Company has invoiced and collected from its customers more revenue than has been recognized as revenue using the percentage of completion method, the Company records the excess amount invoiced as deferred revenue. For the period from March 14, 2015 to December 31, 2015, for the period from January 1, 2015 to March 13, 2015, and for the years ended December 31, 2014 and 2013, revenue recognized in continuing operations using the percentage of completion method amounted to 5%, 4%, 3% and 4% of total net sales, respectively.
Business Combinations
Assets acquired and liabilities assumed in business combination transactions, as defined by ASC 805,Business Combination, are recorded at fair value using the acquisition method of accounting. We allocate the purchase price of acquisitions based upon the fair value of each component which may be derived from various observable and unobservable inputs and assumptions. Initial purchase price allocations are preliminary and subject to revision within the measurement period, not to exceed one year from the date of the transaction. The fair value of property, plant and equipment and intangible assets may be based upon the discounted cash flow method that involves inputs that are not observable in the market (Level 3). Goodwill assigned represents the amount of consideration transferred in excess of the fair value assigned to identifiable assets acquired and liabilities assumed.
Impairment or disposal of long-lived assets
The Company evaluates the recoverability of its long-lived assets in accordance with the provisions of ASC 360,Property, Plant and Equipment. ASC 360 requires that long-lived assets and
certain identifiable intangibles be reviewed for impairment whenever events or changes in circumstances indicate that the carrying amount of an asset may not be recoverable. Recoverability of assets is measured by comparing the carrying amount of an asset to future undiscounted net cash flows expected to be generated by the asset. Such evaluations for impairment are significantly impacted by estimates of future prices for the Company’s products, capital needs, economic trends in the construction sector and other factors. If such assets are considered to be impaired, the impairment to be recognized is measured at the amount by which the carrying amount of the assets exceeds their fair value. Assets to be disposed of by sale are reflected at the lower of their carrying amount or fair value less cost to sell.
The Company assesses impairment of long-lived assets at the lowest level for which identifiable cash flows are largely independent of the cash flows of other assets and liabilities. For purposes of evaluating impairment of long-lived assets held in use, the Company has determined this level to be the asset group level, which are defined as geographical market clusters of plants. For assets meeting the criteria for classification as held for sale under ASC 360, the impairment is assessed at the disposal group level, generally the specific plant or plants held for sale.
Goodwill and other intangible assets, net
The goodwill reflected in the combined Successor balance sheets relates to the recognition of goodwill in the Acquisition and in the Cretex Acquisition.
Goodwill represents the excess of costs over the fair value of identifiable assets acquired and liabilities assumed.
The Company evaluates goodwill and intangible assets in accordance with ASC 350,Goodwill and Other Intangible Assets. ASC 350 requires goodwill to be either qualitatively or quantitatively assessed for impairment annually (or more frequently if impairment indicators arise) for each reporting unit. The Company performs its annual impairment testing of goodwill as of October 1 of each year and in interim periods if events occur that would indicate that it is more likely than not goodwill may be impaired.
The Company evaluates its intangible assets with finite lives for indications of impairment whenever events or changes in circumstances indicate that the net book value may not be recoverable. Intangible assets with finite lives consist of customer relationships, customer backlogs, and brand names, and are amortized under a consumption method over the estimated useful lives. Factors that could trigger an impairment review include significant under-performance relative to expected historical or projected future operating results, significant changes in the manner of our use of the acquired assets or the strategy for our overall business or significant negative industry or economic trends.
If this evaluation indicates that the value of the intangible asset may be impaired, the Company makes an assessment of the recoverability of the net book value of the asset over its remaining useful life. If this assessment indicates that the intangible asset is not recoverable, based on the estimated undiscounted future cash flows of the asset over the remaining amortization period, the Company reduces the net book value of the related intangible asset to fair value and may adjust the remaining amortization period.
Inventories
Inventories are valued at the lower of cost or market. The Company’s inventories are valued using the average cost method. Inventories include materials, labor and applicable factory overhead
costs. The value of inventory is adjusted for damaged, obsolete, excess and slow-moving inventory. Market value of inventory is estimated considering the impact of market trends, an evaluation of economic conditions, and the value of current orders relating to the future sales of each respective component of inventory.
Recent Accounting Pronouncements
A summary of recent accounting pronouncements and our assessment of any expected impact of these pronouncements if known is included in note 2 to the unaudited condensed combined financial statements included elsewhere in this prospectus.
NON-GAAP FINANCIAL INFORMATION
In addition to our results under GAAP, in this prospectus we also present EBITDA, Adjusted EBITDA and Adjusted EBITDA margin for historical periods and on a pro forma basis. EBITDA, Adjusted EBITDA and Adjusted EBITDA margin are non-GAAP financial measures and have been presented in this prospectus as supplemental measures of financial performance that are not required by, or presented in accordance with, GAAP. We calculate EBITDA as net income (loss) before interest expense, income tax benefit (expense), depreciation and amortization. We calculate Adjusted EBITDA as EBITDA before impairment and restructuring charges, (gains)/losses on the sale of property, plant and equipment and certain other income and expenses, such as transaction costs, carve-out costs related to our separation from HeidelbergCement and costs associated with disposed sites. Adjusted EBITDA margin represents Adjusted EBITDA as a percentage of net sales. Operating margin represents income (loss) from operations as a percentage of net sales. We present these measures for the historical periods covered by our audited combined financial statements, the historical financial statements of U.S. Pipe and the historical financial statements of Cretex, as well as on a pro forma basis for the periods reflected in and the transactions accounted for in the section entitled “Unaudited Pro Forma Condensed Combined Financial Information.”
EBITDA, Adjusted EBITDA and Adjusted EBITDA margin are presented in this prospectus because they are important metrics used by management as one of the means by which it assesses our financial performance. EBITDA, Adjusted EBITDA and Adjusted EBITDA margin are also frequently used by analysts, investors and other interested parties to evaluate companies in our industry. We use EBITDA, Adjusted EBITDA and Adjusted EBITDA margin as supplements to GAAP measures of performance to evaluate the effectiveness of our business strategies, to make budgeting decisions, to allocate resources and to compare our performance relative to our peers. EBITDA, Adjusted EBITDA and Adjusted EBITDA margin are also important measures for assessing our operating results and evaluating each operating segment’s performance on a consistent basis, by excluding the impacts of depreciation, amortization, income tax expense, interest expense and other items not indicative of ongoing operating performance. Additionally, these measures, when used in conjunction with related GAAP financial measures, provide investors with additional financial analytical framework which management uses, in addition to historical operating results, as the basis for financial, operational and planning decisions and present measurements that third parties have indicated are useful in assessing our company and its results of operations.
EBITDA, Adjusted EBITDA and Adjusted EBITDA margin have certain limitations. EBITDA and Adjusted EBITDA should not be considered as alternatives to net income and Adjusted EBITDA margin should not be considered as an alternative to operating margin, or in the case of any of the non-GAAP measures, as measures of financial performance or any other performance measure derived in accordance with GAAP. These measures also should not be construed as an inference that our future results will be unaffected by unusual or nonrecurring items for which these non-GAAP measures make adjustments. Additionally, EBITDA, Adjusted EBITDA and Adjusted EBITDA margin are not intended to be liquidity measures because of certain limitations such as:
Other companies, including other companies in our industry, may not use such measures or may calculate one or more of the measures differently than as presented in this prospectus, limiting their usefulness as a comparative measure.
In evaluating EBITDA, Adjusted EBITDA and Adjusted EBITDA margin, you should be aware that in the future we will incur expenses that are the same as or similar to some of the adjustments made in our calculations below and our presentation of EBITDA, Adjusted EBITDA and Adjusted EBITDA margin should not be construed to mean that our future results will be unaffected by such adjustments. Management compensates for these limitations by using EBITDA, Adjusted EBITDA and Adjusted EBITDA margin as supplemental financial metrics and in conjunction with our results prepared in accordance with GAAP. The non-GAAP information below and elsewhere in this prospectus should be read in conjunction with our audited and unaudited combined financial statements and the related notes and the historical financial statements of U.S. Pipe and the related notes included elsewhere in this prospectus and the information set forth in the section entitled “Unaudited Pro Forma Condensed Combined Financial Information.”
Our Company
The following table reconciles net income (loss) to EBITDA and Adjusted EBITDA and Adjusted EBITDA margin to operating margin for the Company for the periods presented. See our audited and unaudited combined financial statements and the related notes included elsewhere in this prospectus.
| Successor | �� | Predecessor | Successor | Predecessor | ||||||||||||||||||||||||||||||||||
| For the period from March 14, 2015 to December 31, 2015 | For the period from January 1, 2015 to March 13, 2015 | Year ended December 31, 2014 | Year ended December 31, 2013 | For the period from March 14, 2015 to December 31, 2015 | For the period from January 1, 2015 to March 13, 2015 | Year ended December 31, 2014 | Year ended December 31, 2013 | |||||||||||||||||||||||||||||||
| (in thousands) | (in thousands) | |||||||||||||||||||||||||||||||||||||
Net Income (loss) | $ | (82,786 | ) | $ | (5,756 | ) | $ | 8,848 | $ | (247,298 | ) | $ | (82,786 | ) | $ | (5,756 | ) | $ | 8,848 | $ | (247,298 | ) | ||||||||||||||||
Less: Gain (loss) on discontinued operations, net of income tax | — | — | (1,260 | ) | 3,018 | — | — | (1,260 | ) | 3,018 | ||||||||||||||||||||||||||||
|
|
|
| |||||||||||||||||||||||||||||||||||
Income (loss) from continuing operations | — | — | 7,588 | (244,280 | ) | |||||||||||||||||||||||||||||||||
Depreciation and amortization | 32,930 | 6,894 | 36,605 | 38,560 | 32,930 | 6,894 | 36,605 | 38,560 | ||||||||||||||||||||||||||||||
Interest expense | 45,953 | 84 | — | — | 45,953 | 84 | — | — | ||||||||||||||||||||||||||||||
Income tax (benefit) expense | 5,778 | (742 | ) | 2,417 | 2,561 | 5,778 | (742 | ) | 2,417 | 2,561 | ||||||||||||||||||||||||||||
|
|
|
|
|
|
|
| |||||||||||||||||||||||||||||||
EBITDA | 1,875 | 480 | 46,610 | (203,159 | ) | 1,875 | 480 | 46,610 | (203,159 | ) | ||||||||||||||||||||||||||||
Impairment and restructuring1 | 12,941 | 542 | 4,219 | 250,577 | 1,185 | 542 | 4,219 | 250,577 | ||||||||||||||||||||||||||||||
(Gain) loss on sale of property, plant & equipment, net2 | 618 | (122 | ) | (2,329 | ) | (3,999 | ) | 618 | (122 | ) | (2,329 | ) | (3,998 | ) | ||||||||||||||||||||||||
Transaction costs3 | 25,590 | 2,079 | 17,674 | — | 25,590 | 2,079 | 17,674 | — | ||||||||||||||||||||||||||||||
Inventory step-up impacting margin4 | 29,969 | — | — | — | 29,969 | — | — | — | ||||||||||||||||||||||||||||||
Costs associated with disposed sites5 | 2,632 | 299 | (362 | ) | 4,774 | 2,632 | 299 | (362 | ) | 4,774 | ||||||||||||||||||||||||||||
Other (gains) expenses6 | (1,671 | ) | — | — | — | (1,671 | ) | — | — | — | ||||||||||||||||||||||||||||
|
|
|
|
|
|
|
| |||||||||||||||||||||||||||||||
Adjusted EBITDA | $ | 71,954 | $ | 3,278 | $ | 65,812 | $ | 48,193 | $ | 60,198 | $ | 3,278 | $ | 65,812 | $ | 48,194 | ||||||||||||||||||||||
|
|
|
|
|
|
|
| |||||||||||||||||||||||||||||||
Operating margin | -4.3 | % | -4.8 | % | 1.4 | % | -34.8 | % | -4.3 | % | -4.8 | % | 1.4 | % | -34.8 | % | ||||||||||||||||||||||
Adjusted EBITDA margin | 10.0 | % | 2.5 | % | 8.9 | % | 6.9 | % | 8.3 | % | 2.5 | % | 8.9 | % | 6.9 | % | ||||||||||||||||||||||
| 1 | Adjusts for impairment of intangible assets and the following charges related to plant closures: (i) impairment charges in respect of abandoned fixed assets that had remaining book value and (ii) restructuring charges in respect of severance and lease and other contract termination costs. |
| 2 | Adjusts for the (gain) loss on sale of property, plant and equipment, primarily related to the disposition of two manufacturing facilities. |
| 3 | Adjusts for Successor and Predecessor legal, valuation, accounting, advisory and other costs related to the Acquisition and Predecessor expenses related to preparation for a public offering that was not ultimately consummated. |
| 4 | Adjusts for the effect of the purchase accounting step-up in the value of inventory to fair value recognized in cost of goods sold as a result of the Acquisition, the Cretex Acquisition and the Sherman-Dixie Acquisition. |
| 5 | Adjusts for the results of operations of our disposed roof tile business and other disposed sites for the periods presented, net of specific items for which adjustments are separately made elsewhere in the calculation of Adjusted EBITDA presented herein. |
| 6 | Adjusts for other (gains) losses, such as gain on insurance proceeds related to the destruction of property. |
U.S. Pipe
The following table reconciles net income (loss) to EBITDA and Adjusted EBITDA and Adjusted EBITDA margin to operating margin for U.S. Pipe for the periods presented. See the audited and unaudited financial statements and the related notes of U.S. Pipe included elsewhere in this prospectus.
| Year ended September 30, | ||||||||||||
| 2015 | 2014 | 2013 | ||||||||||
| (in thousands) | ||||||||||||
Net income | $ | 25,235 | $ | 697 | $ | (465 | ) | |||||
|
|
|
|
|
| |||||||
Less: Net income (loss)—noncontrolling interest | $ | 3,457 | $ | (1,418 | ) | $ | — | |||||
|
|
|
|
|
| |||||||
Net income (loss)—attributable to U.S. Pipe | $ | 21,777 | $ | 2,115 | $ | (465 | ) | |||||
|
|
|
|
|
| |||||||
Net income | $ | 21,777 | $ | 2,115 | $ | (465 | ) | |||||
Depreciation and amortization | 35,402 | 29,354 | 21,347 | |||||||||
Interest expense | 20,175 | 16,914 | 4,598 | |||||||||
Income tax expense | 13,358 | (2,965 | ) | (1,368 | ) | |||||||
|
|
|
|
|
| |||||||
EBITDA | 90,712 | 45,418 | 24,111 | |||||||||
Impairment and restructuring1 | — | 5,321 | — | |||||||||
Loss on sale of property, plant and equipment, net2 | 1,248 | 1,479 | 1,772 | |||||||||
Acquisition related costs3 | 2,122 | 1,094 | 114 | |||||||||
Other (gains) expense4 | (4,788 | ) | (716 | ) | — | |||||||
|
|
|
|
|
| |||||||
Adjusted EBITDA | $ | 89,294 | $ | 52,595 | $ | 25,997 | ||||||
|
|
|
|
|
| |||||||
Operating margin | 9.3 | % | 2.8 | % | 1.2 | % | ||||||
Adjusted EBITDA margin | 14 | % | 9.8 | % | 5.6 | % | ||||||
| 1 | Adjusts for charges related to U.S. Pipe restructuring its operations into three foundry locations and the related temporary closing of one facility. |
| 2 | Adjusts for the loss on sale of property, plant and equipment, primarily related to the disposition of equipment. |
| 3 | Adjusts for legal, valuation, accounting and advisory costs related to acquisition transactions. |
| 4 | Adjusts for insurance proceeds received in connection with a fire at a production facility, net of other non-recurring costs associated with a financing and legal costs associated with an investigation. |
Cretex
The following table reconciles net income to EBITDA and Adjusted EBITDA and Adjusted EBITDA margin to operating margin for Cretex for the periods presented. See the audited and unaudited financial statements and the related notes of Cretex included elsewhere in this prospectus.
| Period ended September 30, | Fiscal year ended | |||||||||||
| December 27, | December 28, | |||||||||||
| 2015 | 2014 | 2013 | ||||||||||
| (in thousands) | ||||||||||||
Net income | $ | 14,634 | $ | 11,776 | $ | 9,358 | ||||||
Depreciation and amortization | 5,342 | 6,524 | 6,066 | |||||||||
Interest expense | 1,029 | 1,226 | 1,551 | |||||||||
Income tax expense | — | — | — | |||||||||
|
|
|
|
|
| |||||||
EBITDA | 21,005 | 19,526 | 16,975 | |||||||||
Impairment and restructuring1 | 267 | 102 | 76 | |||||||||
Gain on sale of property, plant and equipment, net2 | (310 | ) | (227 | ) | (502 | ) | ||||||
Other (gains) expense3 | — | 148 | 325 | |||||||||
|
|
|
|
|
| |||||||
Adjusted EBITDA | $ | 20,962 | $ | 19,549 | $ | 16,874 | ||||||
|
|
|
|
|
| |||||||
Operating margin | 10.5 | % | 7.4 | % | 6.8 | % | ||||||
Adjusted EBITDA margin | 14.0 | % | 11.1 | % | 10.5 | % | ||||||
| 1 | Adjusts for the following charges related to plant closures: (i) impairment charges in respect of abandoned fixed assets that had remaining book value and (ii) restructuring charges in respect of severance and other contract termination costs. |
| 2 | Adjusts for the gain on sale of property, plant and equipment, primarily related to the disposition of manufacturing facilities. |
| 3 | Adjusts for costs incurred primarily in respect of a labor strike and systems updates. |
Pro Forma
The following tables reconcile pro forma net income (loss) from continuing operations to pro forma EBITDA and pro forma Adjusted EBITDA and pro forma Adjusted EBITDA margin to pro forma operating margin for the periods presented. See the section entitled “Unaudited Pro Forma Condensed Combined Financial Information.”
For the ThreeSix Months Ended March 31,June 30, 2016
| Water Pipe & Products | Drainage Pipe & Products | Bricks | Corporate and Other | Pro Forma Combined | Water Pipe & Products | Drainage Pipe & Products | Bricks | Corporate and Other | Pro Forma Combined | |||||||||||||||||||||||||||||||
| (in thousands) | ||||||||||||||||||||||||||||||||||||||||
Net Income (loss) | $ | 6,064 | $ | 25,361 | $ | (1,774 | ) | $ | (43,066 | ) | $ | (13,415 | ) | |||||||||||||||||||||||||||
Income (loss) from continuing operations | $ | 22,430 | $ | 93,134 | $ | — | $ | (76,077 | ) | $ | 39,487 | |||||||||||||||||||||||||||||
Depreciation and amortization | 17,364 | 9,952 | 2,467 | 259 | 30,042 | 34,535 | 22,135 | — | 375 | 57,045 | ||||||||||||||||||||||||||||||
Interest expense | 814 | 3,513 | — | 26,230 | 30,557 | 13 | 984 | — | 29,416 | 30,413 | ||||||||||||||||||||||||||||||
Income tax (benefit) expense | 2,669 | (11,011 | ) | 200 | — | (8,142 | ) | 5,088 | (37,214 | ) | — | 6,143 | (25,983 | ) | ||||||||||||||||||||||||||
|
|
|
|
|
|
|
|
|
| |||||||||||||||||||||||||||||||
EBITDA | $ | 26,911 | $ | 27,815 | $ | 893 | $ | (16,577 | ) | $ | 39,042 | $ | 62,066 | $ | 79,039 | $ | — | $ | (40,143 | ) | $ | 100,962 | ||||||||||||||||||
|
|
|
|
|
|
|
|
|
| |||||||||||||||||||||||||||||||
Impairment and restructuring1 | — | — | — | — | — | 23 | — | — | — | 23 | ||||||||||||||||||||||||||||||
Loss on sale of property, plant, and equipment2 | 120 | 249 | — | — | 369 | |||||||||||||||||||||||||||||||||||
(Gain) loss on sale of property, plant, and equipment2 | 135 | 198 | — | 847 | 1,180 | |||||||||||||||||||||||||||||||||||
Acquisition related costs3 | 1,744 | 852 | 169 | 3,937 | 6,702 | 69 | — | — | 12,078 | 12,147 | ||||||||||||||||||||||||||||||
Inventory step-up4 | — | 1,031 | — | — | 1,031 | |||||||||||||||||||||||||||||||||||
Costs associated with disposed sites5 | — | 89 | — | 572 | 661 | |||||||||||||||||||||||||||||||||||
Other (gains) expenses6 | 3 | — | — | — | 3 | |||||||||||||||||||||||||||||||||||
Inventory step-up impacting margin4 | 10,637 | 1,656 | — | — | 12,293 | |||||||||||||||||||||||||||||||||||
Cost associated with disposed sites5 | — | 188 | — | 665 | 853 | |||||||||||||||||||||||||||||||||||
Amortization of deferred gain on sale leaseback6 | (291 | ) | (1,007 | ) | — | — | (1,298 | ) | ||||||||||||||||||||||||||||||||
Other one-time (gains) expenses7 | 343 | — | — | — | 343 | |||||||||||||||||||||||||||||||||||
|
|
|
|
|
|
|
|
|
| |||||||||||||||||||||||||||||||
Adjusted EBITDA | $ | 28,778 | $ | 30,036 | $ | 1,062 | $ | (12,068 | ) | $ | 47,808 | $ | 72,982 | $ | 80,074 | $ | — | $ | (26,553 | ) | $ | 126,503 | ||||||||||||||||||
|
|
|
|
|
|
|
|
|
| |||||||||||||||||||||||||||||||
Operating Margin | 5.0 | % | 12.2 | % | (5.2 | )% | NM | 2.5 | % | 6.8 | % | 15.1 | % | NM | NM | 5.7 | % | |||||||||||||||||||||||
Adjusted EBITDA Margin | 15.8 | % | 20.4 | % | 3.5 | % | NM | 13.2 | % | 18.1 | % | 21.2 | % | NM | NM | 16.2 | % | |||||||||||||||||||||||
For the ThreeSix Months Ended March 31,June 30, 2015
| Water Pipe & Products | Drainage Pipe & Products | Bricks | Corporate and Other | Pro Forma Combined | Water Pipe & Products | Drainage Pipe & Products | Bricks | Corporate and Other | Pro Forma Combined | |||||||||||||||||||||||||||||||
| (in thousands) | ||||||||||||||||||||||||||||||||||||||||
Net Income (loss) | $ | (6,616 | ) | $ | 219 | $ | (3,728 | ) | $ | (54,470 | ) | $ | (64,595 | ) | ||||||||||||||||||||||||||
Income (loss) from continuing operations | $ | (296 | ) | $ | 21,083 | $ | — | $ | (71,726 | ) | $ | (50,939 | ) | |||||||||||||||||||||||||||
Depreciation and amortization | 18,784 | 8,649 | 3,091 | 300 | 30,824 | 35,195 | 19,204 | — | 335 | 54,734 | ||||||||||||||||||||||||||||||
Interest expense | 798 | 3,444 | — | 26,320 | 30,562 | 12 | 394 | — | 25,528 | 25,934 | ||||||||||||||||||||||||||||||
Income tax (benefit) expense | (898 | ) | (371 | ) | — | — | (1,269 | ) | 7,017 | 167 | — | 6,116 | 13,300 | |||||||||||||||||||||||||||
|
|
|
|
|
|
|
|
|
| |||||||||||||||||||||||||||||||
EBITDA | $ | 12,068 | $ | 11,941 | $ | (637 | ) | $ | (27,850 | ) | $ | (4,478 | ) | $ | 41,928 | $ | 40,848 | $ | — | $ | (39,747 | ) | $ | 43,029 | ||||||||||||||||
|
|
|
|
|
|
|
|
|
| |||||||||||||||||||||||||||||||
Impairment and restructuring1 | 72 | 462 | — | — | 534 | 72 | 813 | — | — | 885 | ||||||||||||||||||||||||||||||
(Gain) loss on sale of property, plant, and equipment2 | 13 | (117 | ) | (2 | ) | — | (106 | ) | 24 | (329 | ) | — | — | (305 | ) | |||||||||||||||||||||||||
Acquisition related costs3 | 26 | — | — | 19,609 | 19,635 | 1,752 | — | — | 27,342 | 29,094 | ||||||||||||||||||||||||||||||
Inventory step-up4 | 829 | 3,024 | 835 | — | 4,688 | |||||||||||||||||||||||||||||||||||
Costs associated with disposed sites5 | — | 415 | — | (75 | ) | 340 | ||||||||||||||||||||||||||||||||||
Other (gains) expenses6 | 595 | — | — | — | 595 | |||||||||||||||||||||||||||||||||||
Inventory step-up impacting margin4 | 4,811 | 13,626 | — | (43 | ) | 18,394 | ||||||||||||||||||||||||||||||||||
Cost associated with disposed sites5 | — | 540 | — | 353 | 893 | |||||||||||||||||||||||||||||||||||
Amortization of deferred gain on sale leaseback6 | (291 | ) | (1,007 | ) | — | — | (1,298 | ) | ||||||||||||||||||||||||||||||||
Other one-time (gains) expenses7 | 1,071 | — | — | — | 1,071 | |||||||||||||||||||||||||||||||||||
|
|
|
|
|
|
|
|
|
| |||||||||||||||||||||||||||||||
Adjusted EBITDA | $ | 13,603 | $ | 15,725 | $ | 196 | $ | (8,316 | ) | $ | 21,208 | $ | 49,367 | $ | 54,491 | $ | — | $ | (12,095 | ) | $ | 91,763 | ||||||||||||||||||
|
|
|
|
|
|
|
|
|
| |||||||||||||||||||||||||||||||
Operating Margin | (3.8 | )% | 2.5 | % | (14.4 | )% | NM | (10.4 | )% | 1.7 | % | 6.2 | % | NM | NM | (1.5 | )% | |||||||||||||||||||||||
Adjusted EBITDA Margin | 7.5 | % | 12.1 | % | 0.8 | % | NM | 6.2 | % | 12.1 | % | 15.6 | % | NM | NM | 12.0 | % | |||||||||||||||||||||||
For the Twelve MonthsYear Ended December 31, 2015
| Water Pipe & Products | Drainage Pipe & Products | Bricks | Corporate and Other | Pro Forma Combined | Water Pipe & Products | Drainage Pipe & Products | Bricks | Corporate and Other | Pro Forma Combined | |||||||||||||||||||||||||||||||
| (in thousands) | ||||||||||||||||||||||||||||||||||||||||
Net Income | $ | 17,866 | $ | 47,904 | $ | (10,209 | ) | $ | (195,412 | ) | $ | (139,851 | ) | |||||||||||||||||||||||||||
Income (loss) from continuing operations | $ | 17,983 | $ | 59,498 | $ | — | $ | (153,760 | ) | $ | (76,279 | ) | ||||||||||||||||||||||||||||
Depreciation and amortization | 76,305 | 39,942 | 10,012 | 734 | 126,993 | 75,547 | 38,806 | — | 734 | 115,087 | ||||||||||||||||||||||||||||||
Interest expense | 3,194 | 13,775 | — | 105,922 | 122,891 | 22 | 1,337 | — | 51,946 | 53,305 | ||||||||||||||||||||||||||||||
Income tax (benefit) expense | 16,357 | 480 | (1,826 | ) | 2,507 | 17,518 | 15,318 | 399 | — | 14,828 | 30,545 | |||||||||||||||||||||||||||||
|
|
|
|
|
|
|
|
|
| |||||||||||||||||||||||||||||||
EBITDA | $ | 113,722 | $ | 102,101 | $ | (2,023 | ) | $ | (86,249 | ) | $ | 127,551 | $ | 108,870 | $ | 100,040 | $ | — | $ | (86,252 | ) | $ | 122,658 | |||||||||||||||||
|
|
|
|
|
|
|
|
|
| |||||||||||||||||||||||||||||||
Impairment and restructuring1 | 988 | 580 | 159 | — | 1,727 | 988 | 580 | — | — | 1,568 | ||||||||||||||||||||||||||||||
(Gain) loss on sale of property, plant, and equipment2 | 1,268 | 504 | (7 | ) | 2 | 1,767 | 1,268 | 504 | — | 2 | 1,774 | |||||||||||||||||||||||||||||
Acquisition related costs3 | 5,606 | 3,720 | 1,001 | 34,915 | 45,242 | 5,606 | 3,720 | — | 34,915 | 44,241 | ||||||||||||||||||||||||||||||
Inventory step-up4 | 5,909 | 17,374 | 6,729 | (43 | ) | 29,969 | ||||||||||||||||||||||||||||||||||
Costs associated with disposed sites5 | — | 654 | — | 2,019 | 2,673 | |||||||||||||||||||||||||||||||||||
Other (gains) expenses6 | (4,788 | ) | (1,671 | ) | — | — | (6,459 | ) | ||||||||||||||||||||||||||||||||
Inventory step-up impacting margin4 | 5,909 | 17,374 | — | (43 | ) | 23,240 | ||||||||||||||||||||||||||||||||||
Cost associated with disposed sites5 | — | 654 | — | 2,019 | 2,673 | |||||||||||||||||||||||||||||||||||
Amortization of deferred gain on Sale Leaseback6 | (582 | ) | (2,013 | ) | — | — | (2,595 | ) | ||||||||||||||||||||||||||||||||
Other one-time (gains) expenses7 | (4,788 | ) | (1,671 | ) | — | — | (6,459 | ) | ||||||||||||||||||||||||||||||||
|
|
|
|
|
|
|
|
|
| |||||||||||||||||||||||||||||||
Adjusted EBITDA | $ | 122,705 | $ | 123,262 | $ | 5,859 | $ | (49,356 | ) | $ | 202,470 | $ | 117,271 | $ | 119,188 | $ | — | $ | (49,359 | ) | $ | 187,100 | ||||||||||||||||||
|
|
|
|
|
|
|
|
|
| |||||||||||||||||||||||||||||||
Operating Margin | 4.0 | % | 8.7 | % | (8.7 | )% | NM | (0.0 | )% | 3.5 | % | 7.8 | % | NM | NM | 0.4 | % | |||||||||||||||||||||||
Adjusted EBITDA Margin | 14.1 | % | 17.2 | % | 4.2 | % | NM | 11.7 | % | 13.5 | % | 15.2 | % | NM | NM | 11.2 | % | |||||||||||||||||||||||
| 1 | Adjusts for the following charges related to plant closures: (i) impairment charges in respect of abandoned fixed assets that had remaining book value and (ii) restructuring charges in respect of severance and lease and other contract termination costs. |
| 2 | Adjusts for the (gain) loss on sale of property, plant and equipment, primarily related to the disposition of two manufacturing facilities. |
| 3 | Adjusts for legal, valuation, accounting and advisory costs related to the Acquisition, the Cretex Acquisition, the Sherman-Dixie Acquisition and the U.S. Pipe Acquisition and costs related to the separation of the Successor from HeidelbergCement subsequent to the Acquisition to establish the entity as a standalone business. |
| 4 | Adjusts for the effect of the purchase accounting step-up in the value of inventory to fair value recognized in cost of goods sold as a result of the Acquisition, the Cretex Acquisition and the Sherman-Dixie Acquisition. |
| 5 | Adjusts for the results of operations of our disposed roof tile business and other disposed sites for the periods presented, net of specific items for which adjustments are separately made elsewhere in the calculation of Adjusted EBITDA presented herein. |
| 6 | Adjusts for the amortization of gains on the properties sold as part of the Sale Leaseback that are required to be deferred and recognized on a straight line basis over the life of the related leases. |
| 7 | Adjusts for other (gains) losses, such as gain on insurance proceeds related to the destruction of property and, with respect to U.S. Pipe, refinancing fees. |
Our Company
We are a leading manufacturer of pipe and precast products by sales volume in the United States and Eastern Canada for a variety of water-related infrastructure applications, including water transmission, distribution and drainage. We provide critical infrastructure components for a broad spectrum of construction projects across residential, non-residential and infrastructure markets. Our extensive suite of end-to-end products covers “the First Mile to the Last Mile” of the water infrastructure grid, ranging from large diameter pipe that transports water to and from treatment centers and manages drainage along major transportation corridors, to smaller diameter pipe that delivers potable water to, and removes wastewater from, end users in residential and commercial settings. We employ a specialized technical salesforce, including engineers and field service representatives, which enables us to deliver a high degree of customer service, create tailored solutions and ensure our products meet project specifications to maximize applications in the field. We believe that our product breadth, footprint in the United States and Eastern Canada and significant scale help make us a one-stop shop for water-related pipe and products, and a preferred supplier to a wide variety of customers, including contractors, distributors and municipalities.
We are a market leader within eachboth of our three business segments: Drainage Pipe & Products and Water Pipe & Products and Bricks.Products. In 2015, approximatelymore than 75% of our pro forma net sales was generated from our concrete drainage pipe and precast products, DIP and concrete pressure pipe products, product categories in which we hold a leading market share position by sales volume in the United States and Eastern Canada. We are also one of the top manufacturers of bricks in the United States and operate the only commercial brick manufacturing plant in Eastern Canada.
Our manufacturing and distribution network is one of the most extensive in the industry, allowing us to serve most major U.S. and Eastern Canadian markets. We operate 11396 manufacturing facilities and currently have significant additional manufacturing capacity available in eachboth of our segments, providing substantial room to increase production to meet short-cycle demand with minimal incremental investment. These strategically located facilities, which have a significant replacement cost, and our broad distribution network provide us with a local presence and the necessary proximity to our customers to minimize delivery time and distribution costs.
As one of the only companies of scale in our industry that manufactures both water drainage pipe and precast structures (used primarily for stormwater and drainage applications) and water transmission and distribution pipe (used primarily to transport potable water and as a component of wastewater systems), our complementary product portfolio is well positioned to serve both the projected $10.4 billion stormwater and wastewater infrastructure market and the projected $7.9 billion potable water transmission and distribution market, each based on Freedonia projections of 2018 total U.S. market demand. AWWA estimates that nearly $1 trillion will need to be spent from 2010 to 2035 to repair and upgrade aging water infrastructure in the United States. In December 2015, the FAST Act was enacted by the U.S. federal government authorizing $305.0 billion of funding over the following five years to upgrade transportation-related infrastructure, more than 70% of which relates to highway spending, which supports a key end market for our Drainage Pipe & Products business due to the stormwater, drainage and related needs associated with highway construction and improvement projects. As “Buy America” provisions become increasingly prevalent under federal law, we believe our domestic manufacturing footprint will be a competitive advantage. Additionally, within the water transmission and distribution markets, Dodge market forecasts suggest that new residential and non-residential construction starts, which remain well below long-term historical averages, are expected to grow from 2015 levels. We believe that our exposure to each of the residential, non-residential and
infrastructure end markets will allow us to benefit from both secular and cyclical growth across each of these end markets. The residential, non-residential and infrastructure end markets in the United States
and Eastern Canada have different growth drivers and operating dynamics, and the cyclical performance of these markets has historically been staggered during different stages of the broader economic cycle.
For the Predecessor period from January 1, 2015 to March 13, 2015, we generated net sales of $132.6 million, a net loss of $5.8 million and Adjusted EBITDA of $3.3 million, and for the Successor period from March 14, 2015 to December 31, 2015, we generated net sales of $722.7 million, a net loss of $82.8 million and Adjusted EBITDA of $60.2 million. In 2015, we generated pro forma net sales of $1,733.4$1,663.4 million, pro forma net loss from continuing operations of $139.9$76.3 million and pro forma Adjusted EBITDA of $202.5$187.1 million. ProAdjusted EBITDA and pro forma Adjusted EBITDA is aare non-GAAP measure.measures. See the section entitled “Non-GAAP Financial Information” for a description of how we define and calculate Adjusted EBITDA and pro forma Adjusted EBITDA, a reconciliation thereof to pro forma net income (loss) and pro forma income (loss) from continuing operations, respectively, and a description of why we believe this measure isthese measures are important.
The following charts represent the pro forma net sales contribution by business segment for the 12 months ended December 31, 2015 and an estimated breakdown by end market for the same period. In 2015, excluding our corporate segment, 23% of both our Predecessor and Successor net sales and 53% of our pro forma net sales were generated by our Water Pipe & Products segment; and 61% and 60% of our Predecessor and Successor net sales, respectively, and 47% of our pro forma net sales were generated by our Drainage Pipe & Products segment. In 2015, we estimate that approximately 36% and 39% of our Predecessor and Successor net sales, respectively, and approximately 40% of our pro forma net sales were generated from residential construction activity; approximately 47% and 45% of our Predecessor and Successor net sales, respectively, and approximately 34% of our pro forma net sales were generated from government-funded infrastructure projects; and approximately 17% and 16% of our Predecessor and Successor net sales, respectively, and approximately 26% of our pro forma net sales were generated from non-residential construction activity.
2015 Pro Forma Net Sales by Segment* and Estimated End Market | ||
| ||
* Excludes Corporate and Other business segment.
Since being acquired from HeidelbergCement in 2015, we have undergone a significant transformation to become a leading water infrastructure company throughout the United States and Eastern Canada. As part of this transformation, we have:
Our organic growth strategy is focused on leveraging our low-cost operations, high level of customer service and product innovation capabilities, as well as our product breadth and industry-
leadingindustry-leading scale, to cross-sell our products to existing customers to increase penetration and project wins and to gain market share through new customers. Operationally, we continue to focus on efficiency and productivity improvements to reduce costs and drive margin improvements.
We have built a strong operating platform and continuously evaluate acquisition opportunities to complement our organic growth and improve our market positions within the markets we serve. Over the past three years, sixseven strategic acquisitions (including three acquisitions completed by U.S. Pipe) have provided meaningful, ongoing synergy benefits. We believe that our success in acquiring businesses has been the result of our highly disciplined approach, continuous monitoring of potential targets (with a focus on culture and people, among other things), and a market view that Forterra is a strong partner given our scale, culture and recent growth. We believe significant acquisition opportunities at attractive prices are still available given the relatively fragmented landscape in several of the sub-markets in which we operate.
Our Segments
Drainage Pipe & Products. We are the largest producer of concrete drainage pipe and precast products by sales volume in the United States and Eastern Canada. We have 6870 manufacturing facilities across 30 states and two Canadian provinces. We believe our extensive product offering creates a compelling value proposition for our customers as it eliminates the need to engage multiple suppliers of stormwater and wastewater-related products for a single project, thereby maximizing efficiency and allowing our customers to meet more aggressive timetables. We also have the ability to custom-build products to complex specifications and regulations, further enhancing our ability to address customer needs. Our top ten Drainage Pipe & Products customers have an average tenure with us of approximately 17 years. Recently, we acquired concrete pipe and precast and related product manufacturers Cretex and Sherman-Dixie to further enhance our scale, geographic footprint and product portfolio.
Water Pipe & Products. We are the largest producer of DIP and concrete pressure pipe by sales volume in the United States and Eastern Canada. We offer significant product breadth and depth and technical service, addressing our customers’ full range of water transmission and distribution needs. Our 2826 manufacturing facilities are strategically located across the United States and Eastern Canada, with ample swing capacity available to support increased production levels as demand in the construction industry continues to improve. Furthermore, we believe our expansive distribution network allows us to achieve lead times among the shortest in the industry. Our top ten Water Pipe & Products customers have an average tenure with us of approximately 24 years. Recently, we acquired U.S. Pipe, market leader within DIP, to diversify our product portfolio and enhance our service offering.U.S. Pipe’s recent acquisition history includes the acquisitions of Griffin Pipe, Metalfit and Custom Fab.
Bricks. We are one of the largest manufacturers of bricks by capacity in the United States and Eastern Canada. We operate 17 manufacturing facilities, strategically located near large population centers or major census MSAs and raw material reserves. We offer more than 300 core styles of bricks to both residential and non-residential end markets. Our facilities are located in Ontario, Quebec, Kentucky, Michigan, North Carolina, South Carolina and Texas.
|
| |||
| | |||
|
| |||
|
| |||
|
| |||
|
| |||
| | |||
| ||||
| Key Segments | Drainage Pipe & Products | Water Pipe & Products | ||
| Products | | | ||
| Product Applications | Stormwater and wastewater infrastructure | Potable and wastewater transmission and distribution | ||
| 2018 Estimated U.S. Demand1 | $10.4bn | $7.9bn | ||
Primary Market Channels | • Direct to Contractors • Distributors | • Distributors • Direct to Contractors, Municipalities and Utilities Waterworks | ||
| # of Manufacturing Facilities | 70 | 26 | ||
| 1 |
| Freedonia—Projected 2018 total market demand. |
Drainage Pipe & Products Water Pipe & Products Primary Market Channels • Direct to Contractors • Distributors • Distributors • Direct to Contractors, Municipalities and Utilities Waterworks 2015 Pro Forma Net Sales by Product # of Manufacturing Facilities 68 28
Our Industry
Across the United States and Eastern Canada, we are a market leader in each of the following core product categories: concrete drainage pipe and precast, ductile iron pipe and concrete pressure pipe.
Core Products
Drainage Pipe & Products
Drainage pipe has residential, non-residential and infrastructure applications. It is primarily used for storm water applications such as storm drains for roads and highways and for residential and non-residential site developments. In addition, drainage pipe and concrete precast structures are used for sanitary sewers, low-pressure sewer force mains, tunneled systems, treatment plant piping and utility tunnels. Freedonia estimates U.S. total market demand for sewer and drainage pipe and wastewater concrete precast structures to grow at a CAGR of 7.4% from $7.2 billion in 2013 to $10.4 billion in 2018. We serve these markets primarily through our diverse portfolio of concrete drainage pipe, U.S. demand for which is expected to increase at a CAGR of 5.9% from 2013 to 2018, according to Freedonia estimates. Further, we serve the aforementioned markets with various precast structures, the demand for which Freedonia estimates to grow at a CAGR of 6.4% from 2013 to 2018. Rebounding levels of construction activity, replacement of aging stormwater and highway infrastructure and committed government funding programs are expected to support this growth. We typically sell our drainage pipe and precast concrete products to contractors that perform construction work for governments, residential and non-residential building owners and developers in markets across the United States and Eastern Canada.
Water Pipe & Products
Water pipe and products are primarily used for potable and wastewater transmission. Water transmission pipe demand comes from water supply construction, especially within municipalities and residential construction. Among these applications, potable water is expected to maintain the largest portion of U.S. demand with projected growth at a CAGR of 8.2% from $5.3 billion in 2013 to $7.9 billion in 2018, according to Freedonia estimates. We serve these markets primarily through our diverse offering of DIP, prestressed concrete cylinder pipe and bar-wrapped pipe, as well as fittings and fabricated products.
Ductile iron inhibits corrosion, retains strength and prevents fractures better than cast iron and most other materials. Ductile iron also improves water flow compared to other materials, particularly plastic. U.S. market volume for DIP shipments (less than 24” diameter pipe) is expected to increase at a CAGR of 6.1% from 2013 to 2018, based on the key drivers of housing starts and waterline infrastructure spend, according to Freedonia estimates.
In larger diameters (greater than 24” diameter pipe), steel and concrete pipe are sturdier and more cost effective. Plastic pipe structural integrity is more dependent on firm soil bedding than concrete or steel, which can make engineers reluctant to use plastic in large diameters due to the increased installation cost. U.S. market demand for large diameter steel and concrete pipe is expected to increase at a CAGR of 4.6% from 2013 to 2018, based on increasing government spending on water infrastructure, according to Freedonia estimates.
Bricks
Our Bricks operations primarily serve the residential markets. Recovery in single family housing construction represents the largest driver of overall brick demand growth. The estimated demand for bricks in the United States and Eastern Canada is expected to grow at a CAGR of 11% from $1.3 billion in 2013 to $2.1 billion in 2018, according to Freedonia estimates. We are well-positioned to benefit from expected increases in residential housing starts and attractive market dynamics due to our competitive positioning and broad geographic footprint.
Core End Markets
North American water infrastructure, aging and strained by a growing population, requires substantial, prolonged capital investment totaling nearly $1 trillion across the U.S. according to the AWWA. According to the EPA, the U.S. potable water and waste and storm water infrastructures require a cumulative $682 billion investment in repairs and expansions over the next 20 years, with pipe representing a substantial proportion of the total capital need. In Canada, per CIRC, the replacement value for water infrastructure in “fair” to “very poor” condition areas totals $173 billion (CAD), where “fair” assets are defined as those with indicated deterioration and deficiencies and require attention and “very poor” assets are defined as near or beyond expected service life and unfit for sustained service, indicating that infrastructure reinvestment lags behind targeted levels.
We serve a range of infrastructure-related end markets. Based on the source of funding, we classify these construction markets into infrastructure, residential and non-residential.
Infrastructure
We estimate that 2015 sales to the infrastructure market represented 31%47% and 45% of our Predecessor and Successor net sales, respectively, and 34% of our pro forma net sales in fiscal year 2015.sales. Our main sales drivers in this market include the construction of streets, highways and storm and sanitary sewers. WeThough based on U.S. census data and information from the CBO annual federal spending on transportation and water infrastructure hit a 30-year low on a per capita basis in 2014, we expect to benefit from several drivers in this market, as U.S. and Canadian federal funding dynamics and public infrastructure requirements support continued growth. At the U.S. federal level, the FAST Act demonstrates the U.S. government’s commitment to improving the country’s transportation infrastructure. More than 70% of the law’s budget is dedicated to highway spending, providing multi-year visibility on federal highway funding. As a U.S.-based company, we are well-positioned to benefit from this new spending, as the legislation steps up federal “Buy America” requirements from 60% in 2015 to 70% in 2020. In its budget for 2016, the Canadian federal government proposed $11.9 billion (CAD) in infrastructure spending over the next five years, with $2.0 billion (CAD) in a clean water and wastewater fund and $2.2 billion (CAD) towards water, wastewater and waste management infrastructure.
Residential Construction
We estimate that 2015 sales to the residential construction market represented 51%36% and 39% of our Predecessor and Successor net sales, respectively, and 40% of our pro forma net sales in 2015.sales. These revenues were largely driven by new U.S. residential construction, which is recovering from historic lows reached during the financial crisis. Though new housing starts grew at a CAGR of 14% from 2010 to 2015, according to the U.S. Census Bureau, current levels remain substantially below long-term averages, as outlined in the graph below.
U.S. Residential Housing Starts
Source: U.S. Census Bureau.
The new residential construction market is expected to continue to grow at a robust pace over the next few years, with Fannie Mae and CMHC forecasting a CAGR of 8% from 2015 to 2017 across the United States and Canada.
Non-residential Construction
We estimate that 2015 sales to the non-residential construction market represented 18%17% and 16% of our Predecessor and Successor net sales, respectively, and 26% of our pro forma net sales in 2015.sales. These revenues were driven largely by new U.S. non-residential construction, and we believe we will continue to benefit from this market’s ongoing recovery from historical lows reached during the financial crisis. Though new non-residential construction starts grew, according to Dodge, at a CAGR of 7% from 2010 to 2015, current levels remain substantially below long-term average levels, as outlined in the graph below.
U.S. Non-Residential Starts
Source: Dodge and CMD Group
The non-residential construction market is expected to continue to grow at a CAGR of 8% from 2015 to 2017 across the United States and Canada, according to data from Dodge and CMD Group.
Our Recent Strategic Transactions
Cretex Acquisition
On October 1, 2015, we acquired all of the outstanding stock of Cretex Concrete Products, Inc. for $245.1 million. Cretex manufactures concrete pipe, box culverts, precast drainage structures, pre-stressed bridge components and ancillary precast products. The Cretex Acquisition expanded our market footprint into the Upper Midwestern United States. Cretex operates as part of our Drainage Pipe & Products segment. The Cretex Acquisition was financed with $240.0 million of incremental borrowings under the Senior Term Loan and cash on hand.
Sherman-Dixie Acquisition
On January 29, 2016, we acquired all of the outstanding stock of Sherman-Dixie Concrete Industries, Inc. for $66.8 million. Sherman-Dixie manufactures concrete pipe, box culverts, precast concrete utility products, storm and sanitary civil engineered systems and specialty engineered retainage systems in Kentucky, Tennessee, Alabama and Indiana. Sherman-Dixie operates as part of our Drainage Pipe & Products segment. The Sherman-Dixie Acquisition was financed with a draw on the Revolver.
U.S. Pipe Acquisition
On April 15, 2016, we acquired all of the outstanding stock of USP Holdings Inc. for $775.1 million, subject to customary working capital adjustments. U.S. Pipe manufactures ductile iron pipe products for water distribution and water management applications and distributes its products throughout the United States. U.S. Pipe operates as part of our Water Pipe & Products segment. The U.S. Pipe Acquisition was financed with a $205.0 million draw on the Revolver and $573.6 million in cash on hand.
Bio Clean Acquisition
On August 4, 2016, we acquired all of the outstanding stock of Bio Clean Environmental Services, Inc. and Modular Wetland Systems, Inc. for aggregate consideration of $30.0 million. Bio Clean designs and sells storm water management systems that meet the requirements of local regulatory bodies regulating storm water quality. Bio Clean owns or has applied for more than 20 patents for a variety of technologies relating to drainage and storm water management. Bio Clean operates as part of our Drainage Pipe & Products segment. The Bio Clean Acquisition was financed with cash on hand.
Bricks Disposition
On August 23, 2016, Mid Holdings entered into an agreement with an unaffiliated third party to contribute our bricks business to the Bricks Joint Venture in exchange for a 50% interest in the Bricks Joint Venture. In connection with this agreement, prior to the consummation of this offering, we will distribute our bricks business to Mid Holdings or its affiliate in the Bricks Disposition. Though both our business and the 50% equity interest in the Bricks Joint Venture will be held by Mid Holdings or its affiliate, following the Bricks Disposition, we will no longer have any profit or other interest in our then-former bricks business or in the Bricks Joint Venture and we will have no relation to or business affiliation with our then-former bricks business or the Bricks Joint Venture other than contractual arrangements regarding certain limited transition services, the short-term loan described under “Certain Relationships and Related Party Transactions—Loan to Bricks Business” and the temporary use of the “Forterra” name. Beginning with the third quarter of 2016, our former Bricks segment will be reclassified as discontinued operations in our financial statements and the related notes.
J&G Acquisition
On September 6, 2016, we entered into a definitive agreement to acquire J&G for aggregate consideration of $32.0 million, subject to customary working capital adjustments. J&G manufactures concrete pipe, box culverts and special fittings in North Texas. The J&G Acquisition is subject to customary closing conditions and, although no assurances can be given that the acquisition will close, it is expected to close in the fourth quarter of 2016. J&G will operate as part of our Drainage Pipe & Products segment following completion of the acquisition. We expect to finance the J&G Acquisition with a draw on the Revolver.
Precast Concepts Acquisition
On September 7, 2016, we entered into a definitive agreement to acquire the business of Precast Concepts for aggregate consideration of $97.1 million, subject to customary working capital adjustments. Precast Concepts manufactures concrete pipe, box culverts, storm detention systems and other precast concrete and related products in Colorado through its three facilities. The Precast Concepts Acquisition is subject to regulatory approval and other customary closing conditions and, although no assurance can be given that the acquisition will close, it is expected to close in the fourth quarter of 2016. Precast Concepts will operate as part of our Drainage Pipe & Products segment following completion of the acquisition. We expect to finance the Precast Concepts Acquisition with a draw on the Revolver.
Roof Tile Disposition
On April 12, 2016, we sold our roof tile business for $10.5 million, subject to customary working capital adjustments.
Our Competitive Strengths
Leading Market Positions with Unmatched Scale and Footprint. We believe we are the largest manufacturer in the over $17.0 billion U.S. drainage and water transmission pipe market, as estimated by Freedonia. We believe we are a leader in the following major product categories: concrete drainage pipe and precast products, DIP and concrete pressure pipe. Our industry is relatively fragmented and local in nature due to the transportation costs associated with our products, particularly in the Drainage Pipe & Products business. Our industry has few participants of scale, and we are one of the only sizeable players with significant presence in both the Drainage Pipe & Products and Water Pipe & Products segments, with an extensive portfolio covering “the First Mile to the Last Mile” and a broad geographic footprint. Further, we believe we have one of the most extensive manufacturing and distribution networks in the water transmission and infrastructure industry. We believe our geographic footprint enables us to win more large business projects than our local or regional competitors, as we can provide services to contractors and distributors across geographies and product categories. Additionally, due to our scale, we have purchasing power with suppliers, which reduces our operating costs and enhances our ability to win business in competitive bidding processes.
Well-positioned to Benefit from Attractive Industry Fundamentals. Our exposure to each of the residential, non-residential and infrastructure end markets enables us to capitalize on the growth in demand and recovery in each of these end markets and diversifies our customer base. The construction industry is recovering, fueled by the continuing rebound in infrastructure, residential and non-residential activity. According to AWWA, water infrastructure in the United States will require nearly $1 trillion of investment for repairs and upgrades from 2010 to 2035. The U.S. and Canadian governments are committed to upgrading their aging infrastructure. The FAST Act allocates $305.0 billion to improving surface transportation infrastructure, and in its budget for 2016, the Canadian federal government proposed $11.9 billion (CAD) in infrastructure spending over the next five years, with $2.0 billion (CAD) in a clean water and wastewater fund and $2.2 billion (CAD) towards water, wastewater and waste management infrastructure. Additional secular industry trends support further infrastructure construction growth, including the growing demand for precast structure products, environmental regulations supporting on-site water management and continued urbanization. Furthermore, Dodge market forecasts suggest that both residential and non-residential construction starts will grow from 2015 levels, which remain well below the average of the most recent cyclical troughs, and significantly below the average annual starts since 1970. Lastly, we have a presence in each of the 40 most populous MSAs and ten most populous states, enabling us to benefit from the recovery in residential construction.
Complete Suite of Products to Serve Customers from “the First Mile to the Last Mile.” We believe we offer unmatched product breadth and depth compared to our competitors in the United States and Eastern Canada. In our Water Pipe & Products segment, our complementary product portfolio of concrete and steel pressure pipe and DIP addresses the broad range of our customers’ water transmission and distribution needs. Our comprehensive suite of products incorporates large diameter pipe that transports water to treatment plants as well as smaller diameter pipe for distribution to residential users. In our Drainage Pipe & Products segment, our diversified product offering creates a one-stop shop for water-related pipe and products. Our drainage offering creates a compelling value proposition for customers by eliminating the need to seek multiple bids for a single project, helping maximize efficiency for time sensitive orders. Finally, our extensive product offering also creates cross-selling opportunities for our segments due to our broad and diversified customer base.
Attractive and Expanding Margins and Strong Cash Flow Profile. Due to our increasing scale, cost cutting initiatives and our work toward integrating acquisitions, we have generated attractive and increasing margins, capitalizing on our low-cost operations and operating leverage. Our regional and local sales force, strategically located manufacturing facilities and broad distribution network allow us to serve our customers across the United States and Eastern Canada at a competitive cost with efficient procurement and operations. We expect to further increase our scale through acquisitions and, as a result, we expect to continue to generate purchasing power, operating leverage and cost saving opportunities. Furthermore, we have an ongoing strategy of implementing cost-cutting initiatives at our production plants. In the Water Pipe & Products segment, service, procurement and operational initiatives have reduced year to date operating costs by more than $1.5 million in DIP and $1.5 million in large diameter concrete and steel pipe, each asAs of MayAugust 31, 2016. In the Drainage Pipe & Products segment,2016, we have recognized year to date savings of more than $5.0$10 million, as of May 31, 2016 across three major plants due to purchasing initiatives.$9 million and $1 million from procurement, operational and commercial initiatives, respectively. We continue to roll out cost and productivity improvements at new sites and have identified new cost reduction opportunities in resale items, transportation, logistics and energy. Additionally, we have increased our margins and cash flow through operational improvement of acquired businesses. The Sherman-Dixie Acquisition and U.S. Pipe’s acquisition of Griffin Pipe, specifically, provided consolidation opportunities with our existing plant network and improved the respective cost positions by reducing personnel and rationalizing older facilities.
Proven Ability to Identify, Close and Improve the Performance of Strategic Acquisitions. Over the last three years, we have acquired twothree businesses in our Drainage Pipe & Products segment and four businesses in our Water Pipe & Products segment (including three acquisitions by U.S. Pipe). Our acquisition strategy has been focusedfocuses on three main pillars: reinforce our position in existing markets, expand our product offeringtargets that meet a stringent set of criteria: leading market positions with attractive margins, high growth geographies, potential for synergies and expand our geographic footprint.consolidation, new products and a focus on people development. Acquisitions enable us to improve our product mix and expand our geographic scope, helping us to win business from new customers, cross-sell additional products to existing customers and optimize pricing through the enhanced value created by our differentiated product offering. We believe that our success in acquiring businesses has been the result of our highly disciplined acquisition strategy, continuous monitoring of potential targets in an opportunity-rich landscape and focus on culture and people, among other things. We have effectively sourced and closed both smaller strategic transactions, and larger transformative deals. In both instances, we have successfully achieved meaningful cost and revenue synergies through the implementation of best practices and operational improvement initiatives in the acquired businesses. In the instanceconnection with our acquisitions of Cretex, Sherman-Dixie and U.S. Pipe, and U.S. Pipe’s acquisition of Griffin Pipe and Custom Fab, we have realized in excess of $40$45 million of synergies through cost savings.
Experienced Management Team with Proven Ability to Grow Businesses and Integrate Acquisitions. Our management team, led by Jeff Bradley, our Chief Executive Officer, has a proven track record of increasing shareholder value and generating profitable growth, attractive margins and cash flow. Mr. Bradley and other key executives, including Matt Brown, the Chief Financial Officer,
have relevant history managing public companies, as well as extensive experience in the manufacturing industry. Our management team has proven their ability to execute on our acquisition strategy, leading us in growth from $816.2 million ofthrough three substantive acquisitions that almost doubled our 2015 historical net sales by us and our Predecessor on a combined basis (excluding net sales from Cretex) to $1,733.4 million in 2015on a pro forma net sales through three substantial acquisitions.basis. Further, Mr. Bradley and his team are continuing to execute a comprehensive program to drive commercial, operational and procurement excellence, as well as managing working capital to increase free cash flow.
Our Business Strategy
Our goal is to be our customers’ preferred provider of drainage pipe, water transmission pipe and related products. We intend to drive profitable growth in excess of the growth rates of the end markets in which we operate through the following key strategies:
Capitalize on Favorable, Multi-pronged Industry Growth Dynamics. The multi-pronged cyclical recovery in our construction-related end markets is well underway. We expect to benefit from increased demand generated by growth in both residential and non-residential construction activity. Further, there is a significant need to improve North America’s aging water and highway infrastructure. Operationally, we believe we are well positioned in the water transmission and distribution industry to capitalize on the increased funding allocated to water infrastructure improvement. The FAST Act will be a key underlying driver for our business as it dedicates more than 70% of its total budget to highway spending, supporting our key infrastructure end market. Secular industry trends, including the continued shift in product preference to rigid and zinc-coated pipe, environmental regulations in support of on-site water management and continued urbanization, support further incremental growth. Our reputation, extensive product offering and coast-to-coast distribution network provide us with competitive advantages that we expect will fuel growth in excess of that offered by already attractive market dynamics underlying our businesses.
Increase Market Share by Leveraging Our Scale, “the First Mile to the Last Mile” Suite of Products and Go-to-Market Strategy. Our scale enables us to be among the industry’s lowest cost producers, while our strategically located manufacturing facilities and broad distribution network allow us to meet the particular needs of our customers. Our existing swing capacity enables us to meet customer demand and well positions us to win small and large projects. Moreover, our large and scalable installed asset base will allow us to respond swiftly to growing demand without having to increase capacity.
Our “First Mile to the Last Mile” product portfolio enables us to be a complete solutions provider and to serve as a one-stop shop for water-related pipe and products, increasing our customers’ overall spend on our products. Our ability to offer both pipe and precast products helps us better serve our infrastructure-related markets and differentiates us from our competitors.
Our go-to-market strategy is based on three main pillars. First, we incentivize our highly specialized technical salesforce to focus on profitable growth while offering our products and value-added services. Second, we target our key customers with a robust cross-selling sales organization, marketing the benefits of ordering from one supplier. Lastly, we focus on the implementation of systematic pricing strategies across all of our product categories.
Leverage Our Commitment to Product Innovation and Technical Expertise to Optimize Product Mix and Capitalize on Market Opportunities. We continuously explore new applications for our existing product portfolio and develop new products and solutions that allow us to stay at the forefront of the needs of the drainage and water pipe and products markets. Our technical salesforce also proactively reaches out to our customers on a regular basis to ensure that our customers are
satisfied and our productsadhere to project specifications. We have a long history of developing and seeking out innovative products to bring to market across both water-related segments, which include the recent introductions of Oystercrete, duct bank and metallic zinc coating. We will continue our innovation efforts, optimizing our portfolio through researchand development and strategic acquisitions to expand our positions in attractive products and markets. Along with these initiatives, our specialized technical salesforce will continue to promote and support our existing specialty products to drive differentiation and growth.
Enhance Margins, Free Cash Flow and Returns Through Operational and Commercial Excellence. We have successfully launched multiple operational initiatives focused on increasing
plant efficiency and productivity. We expect to continue growing our margins through ongoing operational, commercial and cultural initiatives. We are working to leverage our information technology and financial systems to lower costs and implement systematic pricing across our business. We will continue to manage working capital and seek scale-driven procurement efficiency improvements through centralized purchasing and fixed overhead control and reduction. We intend to prioritize opportunities that generate attractive returns on invested capital. Further, our management team has emphasized a strong pay-for-performance culture that cultivates, challenges and compensates employees based on profitability and cash flow generation.
Accelerate Profitable Growth Through Strategic Acquisitions. We believe that the relative fragmentation of some of our sub-markets creates an environment in which we can continue to acquire businesses at attractive valuations to increase our scale, product breadth and geographic diversity. Over the past three years, we have acquired sixseven businesses—both tuck-in and transformative in nature—within the water drainage and transmission industry (including three acquisitions by U.S. Pipe). We continuously monitor potential targets to develop and maintain a diversified and actionable acquisition pipeline. Additional acquisitions would enable us to add adjacent products to our portfolio that could help us further penetrate our existing markets and expand our geographic footprint. By integrating these businesses and implementing our culture and operational best practices, we believe we can achieve significant further growth. We are focused on driving synergies, including those achievable as a result of our recent acquisitions, to reduce costs and increase our margins. We are in the process of executing a plan associated with our acquisitions of Cretex, Sherman-Dixie and U.S. Pipe. We believe that we can achieve significant synergies associated with these acquisitions. We expect cost savings synergies to come from procurement, eliminating redundant selling, general and administrative functions, and optimizing our plant network through consolidations to achieve operational efficiencies and freight cost reductions. In addition, we believe the U.S. Pipe Acquisition creates opportunity to increase market share in large diameter DIP by leveraging our geographic scope, cross-selling capabilities and existing contractor relationships.
Our Products
Drainage Pipe & Products Segment
We manufacture drainage pipe and precast products in the United States and Eastern Canada. Drainage pipe has residential, non-residential and infrastructure applications. It is primarily used for storm water applications, such as storm drains for roads and highways, and for residential and non-residential site developments. In addition, drainage pipe is used for sanitary sewers, low-pressure sewer force mains, tunneled systems, treatment plant piping and utility tunnels.
Drainage pipe consists of concrete reinforced by a steel cage. It is manufactured by producing a steel mesh cage, enclosing it in a form or mold and then pouring concrete around it to produce the pipe. Drainage pipe is manufactured in round, elliptical and arch shapes ranging from 12 inches to 144 inches in diameter and in box sizes ranging from three feet to 15 feet in length and width.
We also manufacture a wide variety of precast concrete products, including box culverts, utility vaults, manholes, drainage inlets and pipe end sections. These precast concrete products are used for
applications such as roadway drainage, airport drainage, storm water management, utility construction and water treatment and filtration systems. Our range of precast concrete products also includes products that fall under the general description of specialty precast products for which we hold patents that make us the exclusive manufacturer or which are manufactured under license agreements with third parties. These specialty products include architectural panels for buildings, modular railroad crossings, retaining wall systems, highway noise barriers, storm water treatment systems and concrete vaults, which are used to house either dry utilities (such as electrical, data or communications equipment) or wet utilities (such as valves, pumps or water meters).
We also manufacture structural precast products in the United States and manufacture a range of precast concrete bridge girders for highway projects in both the United States and Eastern Canada. We manufacture a variety of structural precast products primarily for infrastructure and non-residential applications, including hollow-core planks, prestressed bridge girders, beams, columns, wall panels, stairs, garage floors and architectural cladding. These products are used as structural and architectural elements in building structures such as parking garages and arched and modular bridges.
Precast concrete products are reinforced with steel, similar to pipe, and manufactured using either a dry cast or wet cast concrete mix, depending on the size of the piece and the number of identical pieces to be manufactured. In the dry cast method, a concrete mix with low water content, known as zero-slump concrete, is poured into a mold and then densely compacted around the steel reinforcement using a variety of manufacturing methods. The concrete structure is immediately removed from the mold and allowed to cure in a high humidity environment to ensure proper hydration of the concrete. This method allows multiple pieces to be produced from the same mold each day and is most suitable for high volume, repetitive manufacturing. In the wet cast method, a concrete mix with relatively high water content is poured into a mold and allowed to cure in the mold, which can take from four to 12 hours. Precast concrete products typically range in diameter from four to 12 feet for round products or in length and width from one foot to 12 feet for square or rectangular products.
We also regularly consider ways to innovate internally and expand our drainage pipe and precast product offerings by working to bring other products to market. Some of our recent product offerings include Kenner Chainwall, Oystercrete and Duct Bank. Kenner Chainwall is a precast concrete foundation that provides a structurally sound, on-grade or elevated foundation to support prefabricated shelters or equipment buildings. One use is to elevate electrical equipment in floodzones such as those devastated by Hurricane Katrina. Oystercrete is a product engineered to dissipate wave energy and recapture sediment and we believe could be of great utility in both rebuilding coastlines and fighting future erosion. Duct bank is a precast product that consolidates and protects underground electrical and communication cables and can be used in the construction of large buildings as well as installing cabling underneath roads and areas with existing structures. Each of these products is now commercially available. We also acquired a number of innovative technologies relating to storm water management acquired in the Bio Clean Acquisition.
In addition to our operations, we have a 50% equity interest in CP&P, a joint venture with Americast, Inc. entered into in 2012. CP&P operates 14 plants, nine of which were contributed by us, that serve the Mid-Atlantic and Southeastern United States. CP&P manufactures drainage pipe and precast concrete products and sells those products to similar types of customers as the ones to which we market. See note 19 to our audited combined financial statements included elsewhere in this prospectus for additional information regarding CP&P.
In 2015, we estimate that approximately 40% and 41% of our Predecessor and Successor Drainage Pipe & Products net sales, respectively, and approximately 39% of our pro forma Drainage Pipe & Products net sales were generated from government-funded infrastructure projects; approximately 36% and 41% of our Predecessor and Successor Drainage Pipe & Products net sales, respectively, and approximately 37% of our pro forma Drainage Pipe & Products net sales were generated from residential construction activity; and approximately 24% and 18% of our Predecessor and Successor Drainage Pipe & Products net sales, respectively, and approximately 24% of our pro forma Drainage Pipe & Products net sales were generated from non-residential construction activity.
Water Pipe & Products Segment
Utilizing the U.S. Pipe and Forterra Pressure Pipe Canada brands, we manufacture a number of products used for the transmission of potable water and wastewater, in pipe diameters ranging from three to 174 inches.
We manufacture DIP in pipe diameters ranging from three to 64 inches in the United States. For each diameter of pipe we offer a wide range of thicknesses with both standard and specialized coatings. DIP is used for transmission and distribution of potable water and wastewater and is typically utilized for smaller diameter applications of 24 inches and smaller. DIP has residential and infrastructure repair replacement applications, including potable water distribution systems, small water system grids, major water transmission mains, wastewater collection systems, sewer force mains and water treatment plants. In addition to DIP, in Mexico we also manufacture a full line of complementary joint restraints and fittings, which are utilized for interlocking adjoining segments of pipe and are typically bundled with DIP. We also operate fabrication plants that modify our pipe to meet specific customer design requirements for above ground applications.
DIP is manufactured using a process that consists of introducing molten iron into a rapidly-rotating steel mold and relying on centrifugal force to distribute the molten iron evenly around the inner surface of the mold to produce pipe of uniform size and dimensions.
In addition, for larger diameter applications, we manufacture concrete and steel pressure pipe in the United States and Eastern Canada. Our pressure pipe is used for water transmission and distribution, power plant cooling water lines, sewage force mains for wastewater and storm water and other diverse applications involving the movement of large volumes of water.
We manufacture prestressed concrete pipe, welded steel pipe and bar-wrapped concrete pipe. Concrete-lined pressure pipe ranges from ten to 144 inches in diameter and welded steel pipe ranges from 32 to 124 inches in diameter. We also manufacture joints, fittings and related components to complement our larger diameter pipe.
Prestressed concrete pipe consists of a concrete core, a steel cylinder and a high tensile strength wire that is wrapped, under measured tension and at uniform spacing, around the steel cylinder. This wire wrap places the steel cylinder and concrete core in compression, developing the pipe’s ability to withstand specified hydrostatic pressures and external loads. An outside coating of mortar protects the wires.
Welded steel pipe consists of a steel cylinder that is helically formed and welded from a continuous coil of steel, with a centrifugally placed cement mortar lining and polyurethane or tape coating.
Bar-wrapped concrete cylinder pipe combines the physical strength of steel with the structural and protective properties of high strength cement mortar. In this type of pipe, a round steel bar is helically wound around a welded steel cylinder and all surfaces are encased in cement mortar. This composite pipe reacts as a unit when resisting internal pressure and external loads. The inside of the cylinder is lined with centrifugally cast cement mortar.
Our pressure pipe is highly engineered and is built to order for technically demanding applications requiring various thresholds of working pressure, surge pressure and loads. Our engineers work closely with customers to design components and systems to meet specific regulatory and industrial demands. In particular, we have differentiated ourselves from regional competitors in highly regulated customer sectors such as nuclear, coal and solar power generation and specialty applications.
We also strive to innovate in our Water Pipe & Products segment, in both ductile iron pipe and large diameter steel and concrete pipe. Several of our more successful developments include metallic zinc coating, TR-XTREME pipe and snap ring joints. Metallic zinc coating is active corrosion protection for DIP. TR-XTREME pipe is designed for areas of seismic activity and has joints providing flexible extension capabilities. Snap ring joints are a restrained joint system for bar-wrapped concrete pipe that
allows contractors to install pipelines without welding joints on the job site. Each of these products is commercially available.
Bricks Segment
We operate brick facilities in the United StatesIn 2015, we estimate that none of our Predecessor and Eastern Canada, which are all strategically located near large population centers or major census MSAsSuccessor Water Pipe & Products net sales and raw material reserves. We are recognized inapproximately 42% of our industry forpro forma Water Pipe & Products net sales were generated from residential construction activity; approximately 97% and 85% of our product qualityPredecessor and range, as well asSuccessor Water Pipe & Products net sales, respectively, and approximately 29% of our industry-leading customer service.
Inpro forma Water Pipe & Products net sales were generated from government-funded infrastructure projects; and approximately 3% and 15% of our markets in the United StatesPredecessor and Eastern Canada, bricks are used primarily for decorative claddingSuccessor Water Pipe & Products net sales, respectively, and are selected for their attractive appearance, versatility, low maintenance and durability. Bricks made to more demanding technical specifications are also used in theapproximately 29% of our pro forma Water Pipe & Products net sales were generated from non-residential markets in the United States and Eastern Canada.construction activity.
To manufacture bricks, clay and shale is excavated from the ground and processed, extruded to a required size and shape, cut into individual bricks by means of a wire and finally fired in a kiln. Brick plants are increasingly automated, including through the use of robotics to improve brick handling.
Bricks can be manufactured in a wide variety of colors and textures through the use of different manufacturing methods, various body mixtures of clay and shale, and the addition of dyes and pigments to the body mixture. In order to appeal to different customer tastes in different regions, we manufacture and stock more than 300 core brick styles in four regional brick collections. These regional collections cater to customer preferences and traditional local styles. We work closely with designers, architects and builders to develop brick blends that meet ever-changing consumer demands, including more eco-friendly products.
Customers and Markets
Drainage Pipe & Products Segment
We typically sell our drainage pipe and precast products to contractors that perform construction work for various levels of government, residential and non-residential building owners, and developers in markets across the United States and Eastern Canada. Additionally, although they are not our direct customers, we view the owners and engineers who are customers of the contractors that purchase our products as our customers as well, because these owners and engineers often specify the types of products that our customers are required to use, which can lead to increased sales of our products. We also sell our drainage pipe and precast products to utility companies. Several of our largest manufacturing facilities are strategically located in close proximity to our markets. Our drainage pipe and precast products are typically shipped within a radius of 150 miles, but in some cases up to 350 miles, from our manufacturing facilities.
Water Pipe & Products Segment
Our water transmission pipe products are sold direct to contractors as well as through some of the largest waterworks distributors. We also sell to utility contractors that work on new or replacement pipeline projects, primarily in the East, South and Midwest of the United States and in Eastern Canada. Our pressure pipe is used in projects for regional water authorities and districts, cities, counties,
municipalities, port authorities, private companies and industrial clients, including power plants. Concrete pressure pipe is typically shipped within a radius of 500 miles from our manufacturing facilities and DIP and steel pressure pipe is shipped within a radius of over 1,000 miles.
Bricks Segment
We sell our bricks to a diverse group of customers in the construction industry in the United States and Eastern Canada. Our bricks are typically shipped within a radius of 300 miles from our manufacturing facilities. Our customers, depending on local market customs, include homebuilders, brick distributors and dealers, as well as masonry contractors. Where market size is sufficient to support a sales force and there is reasonable proximity to manufacturing facilities, we have adopted a direct sales model in which we sell bricks directly to the end user. Where distance to market would require setting up depots and additional handling services, we typically utilize third-party distributors.
Competition
Drainage Pipe & Products Segment
Our largest competitors in our Drainage Pipe & Products Segment include Rinker Materials (a unit of CEMEX, S.A.B. de C.V.) and Oldcastle, Inc. (a unit of CRH plc). We also compete with many regional and local manufacturers. Additionally, our drainage pipe products compete with high density polyethylene, or HDPE, and polypropylene pipe products for a limited number of applications.
Water Pipe & Products Segment
Our two largest competitors in DIP manufacturing are McWane, Inc. and American Cast Iron Pipe Company. Our DIP products also compete with polyvinyl chloride, or PVC, and HDPE pipe. Our national network of fabrication products competes with regional and local providers of those products and services.
Due to the highly technical nature of our concrete and steel pressure pipe products, we compete with a small number of national manufacturers. Our concrete-lined pressure pipe also competes with pressure pipe made from other materials such as fiberglass, HDPE and PVC. Our concrete and steel pressure pipe competes with products manufactured by Northwest Pipe Company, which manufactures steel pressure pipe, Ameron (a unit of National Oilwell Varco, Inc.), which manufactures steel and bar-wrapped pressure pipe, and American Cast Iron Pipe Company, which also manufactures steel pressure pipe. Within Canada, our concrete pressure pipe products compete with DECAST (formerly Munro Concrete Products, Ltd.).
Bricks Segment
Our competitors in the brick market in the United States include Boral USA (a unit of Boral Limited), General Shale, Inc. (a unit of Wienerberger AG), Acme Brick Company (a unit of Berkshire Hathaway Inc.), Glen-Gery Corporation (a unit of Ibstock Building Products) and a number of regional manufacturers. In Eastern Canada, we compete with Brampton Brick and, to a lesser extent, smaller companies and imports from the United States. Our brick business also competes with other alternative building materials such as wood, vinyl, fiber cement, stucco and manufactured stone.
Sales, Marketing and Distribution
Our drainage pipe, DIP and related fittings and fabricated products, some of our brick products and certain precast concrete products are generally made to order, while the majoritybut certain of our bricksproducts are made to inventory. We have established target levels of inventory for these itemsthe limited number of products made to inventory that we attempt to keep available at our manufacturing facilities to meet customer demand. Inventories are held at manufacturing facilities and, to a lesser extent, at distribution yards. Because bricks have decorative functions, we attempt to predict customers’ changing tastes and manage our inventory accordingly.
Our concrete and steel pressure pipe, structural precast products and most precast concrete products are customized products that are made to order. Our order backlog for precast concrete products is typically two to six months, while order backlog for concrete and steel pressure pipe is approximately 12 months.
We seek to attract and retain customers through exceptional customer service and technical expertise, leading product quality, broad product and service offerings and competitive pricing. Our market strategy for products with non-residential end users is centered on building and maintaining strong customer relationships rather than traditional advertising. Our market strategy for bricks is centered on providing aesthetically pleasing products for the end user, coupled with providing sales tools and information directly to our channel partners (builders, distributors and masons) to facilitate the end consumer’s choice in selecting our products.
We maintain in-house technical sales, engineering and field service teams which provide customers technical expertise and support to assist them in finding the right product or solution for their specific need. Each of our product groups has its own specialized sales force. Overall, we employ approximately 372more than 350 sales and related support professionals.professionals, 63 of whom work as part of our bricks business. Our sales force and customer service functions are staffed by experienced professionals who have been trained in our product lines, processes and systems, and who maintain touch points with homebuyers, architects, builders masons and distributors. Additionally, we have a staff of more than 30 engineers that we employ to work in concert with our sales force to help develop the best and most useful product solutions for our customers.
We sell our DIP products and our fittings and fabricated products, and some of our brick products through distributors. Our drainage pipe, concrete and steel pressure pipe and precast concrete products and some of our brick products are sold direct to customers who are the end users of such products. Drainage pipe, concrete pressure pipe, and certain precast products are sold through a bidding process in which we seek to place the most competitive bid. We undertake marketing efforts through our participation in trade shows and through our website. We outsource all of our product deliveries by using a combination of dedicated carriers and other third-party carriers.
Raw Materials and Inputs
The primary material for our drainage pipe and precast concrete products and our concrete pressure pipe is concrete, which consists of cement, sand and aggregates. Another key input for our products is steel, which is the main material in our steel pressure pipe and is also used to provide reinforcement within our drainage pipe and precast concrete products. Our DIP is largely made from iron melted from recycled scrap metals. Other key materials for our DIP include foundry coke and certain additives, such as silica. Our bricks business relies on clay and shale as main raw materials, as well as natural gas to fuel the kilns.
Most of our raw materials are widely available commodities. We have not experienced any significant shortages of raw materials. To the extent we do not produce any raw materials, when and
where possible, we try to purchase raw materials from the source, and because of their low value-to-weight ratios, we generally try to source our raw materials in the vicinity of our facilities. We usually purchase the raw materials we need in the spot market, except where we anticipate a significant need of materials for a specific project. Other than the cement supply agreement described below, we generally do not enter into long-term supply contracts with our suppliers that require us to purchase particular quantities or to pay particular prices. In our project-based businesses, we may pass certain raw material costs to end users through step-up mechanisms included in our price quotes tied to the timing of execution.
As part of the Acquisition, we entered into a Cement Supply Agreement with Lehigh Cement Company, LLC, or Lehigh, a subsidiary of HeidelbergCement, which requires us to purchase our cement requirements from Lehigh for 16 of our existing manufacturing facilities in the United States through March of 2020. The Cement Supply Agreement allows us to obtain competing price quotations from other suppliers and gives Lehigh an opportunity to match those prices or release us from our purchase obligation for the facility or facilities in question for the period of the competing price quotation.
We purchase our steel from a number of different suppliers, but most suppliers are based in the United States in order to comply with “Buy America” government contract requirements placed on our customers. We endeavor to purchase these steel supplies from the entity which is as close as possible to the manufacturer. In the case of hot rolled steel coil, this means shifting from buying from a service center to making purchases directly from the steel mill. We purchase most of our welded wire reinforcement steel and bright basic wire directly from the manufacturer.
For the manufacture of our DIP and fittings, we purchase scrap metal directly from all qualified scrap sources near our foundry sites in the United States and Mexico. We utilize certain categories of scrap metal, primarily shredded automobile bodies, plate & structural, and cast iron. We purchase foundry coke from two of the three merchant coke producers in the United States, both located in Birmingham, Alabama. Major alloys and additives are procured from both domestic and foreign sources based on a semi-annual bid process.
We obtain all of the clay and shale for our bricks from open mines on land that we own or lease under long term leases and that are in close proximity to our brick manufacturing operations. Mining operations are performed either by us or subcontracted out to a third party. We purchase the remaining portion of our clay and shale (primarily specialty clays that we use in limited quantities) from various suppliers. The natural gas used in our brickworksoperations is sourced from a number of different gas suppliers. We typically hedge a portion of our exposure to electricity and natural gas prices, we may not continue our current strategy or hedge any positions in the future and therefore remain susceptible to energy price increases.
Seasonality
The construction industry, and therefore demand for our products, is typically seasonal and dependent on weather conditions, with periods of snow or heavy rain negatively affecting construction activity. For a more detailed discussion, see the sections titled “Risk Factors” and “Management’s Discussion and Analysis of Financial Condition and Results of Operations—Principal Factors Affecting our Results of Operations” for a discussion of the seasonality of our business.
Backlog
Backlog represents the total dollar amount of revenues we expect to record in the future as a result of performing work under contracts that have been awarded to us. In accordance with industry practice, substantially all of our contracts are subject to cancellation, termination, or suspension at the
discretion of the client.client in respect of work that has not yet been performed. In addition, the contracts in our backlog are subject to changes in the scope of services to be provided as well as adjustments to the costs relating to the contracts. Accordingly, backlog is not necessarily indicative of our future revenues or earnings. As of May 31,June 30, 2016 and May 31,June 30, 2015, we had approximately $435.8$498.1 million and $353.0$328.4 million of backlog, respectively.
Employees
As of June 14,30, 2016, we had 5,5965,565 employees, 1,1361,148 of which were salaried and 4,4604,417 of which were hourly. Included in those numbers are the 606 employees who work in our bricks business and will no longer be employed by us following the Bricks Disposition, 128 of which are salaried and 478 of which are hourly. Of the total number of employees, 4,7234,698 were located in the United States, 625615 were located in Canada and 248252 were located in Mexico. Of the 606 employees who work in our bricks business, 397 are located in the United States and 209 are located in Canada. The number of hourly workers we employ varies to match our labor needs during periods of fluctuating demand. From time to time, we employ temporary workers to meet increased demand.
ApproximatelyAs of June 30, 2016, approximately 35% of our workforce iswas covered by collective bargaining agreements, and approximately 26%25% of these employees arewere included in a collective bargaining agreement that expiresexpired within one year. Assuming the Bricks Disposition had occurred on June 30, 2016, the approximate percentage of our work force as of such date covered by collective bargaining agreements and the collective bargaining agreement that expired within one year of June 14, 2016.would not have changed. We have not had any union-organized work stoppages in the United States, Canada or Mexico over the last four years.Weyears. We believe that we have good relationships with our employees and with the unions representing our employees.
Manufacturing Facilities and Properties
We have a broad network of 10289 manufacturing facilities in the United States, including 1413 fabrication plants. We also have tensix manufacturing facilities in Canada and one in Mexico. Our headquarters is located in Irving, Texas. We also receive income from the 14 plants associated with CP&P. Please see note 16 to our audited combined financial statements included elsewhere in this prospectus for certain financial information regarding the United States and Canada.
The following tables set forth certain information regarding our manufacturing facilities:
Facility Name | City | State/Province | Ownership | |||
Drainage Pipe & Products | ||||||
Caldwell | Caldwell | Idaho | Owned | |||
Salt Lake City | Salt Lake City | Utah | Owned | |||
Montgomery | Montgomery | Alabama | Owned | |||
Pelham Pipe & Precast | Pelham | Alabama | Owned | |||
El Mirage | El Mirage | Arizona | Owned | |||
Little Rock | Little Rock | Arkansas | Leased | |||
West Memphis | West Memphis | Arkansas | Leased | |||
Florin Road (2 plants) | Sacramento | California | Leased | |||
Deland Precast | Deland | Florida | Leased | |||
Gretna | Gretna | Florida | Leased | |||
Marianna | Marianna | Florida | Leased | |||
Winter Haven Pipe | Winter Haven | Florida | Leased | |||
Athens Precast | Athens | Georgia | Leased | |||
Rome | Rome | Georgia | Leased | |||
La Place | LaPlace | Louisiana | Leased | |||
New Orleans | New Orleans | Louisiana | Leased | |||
St. Martinville | St. Martinville | Louisiana | Leased | |||
Como | Como | Mississippi | Owned | |||
Hattiesburg (2 plants) | Hattiesburg | Mississippi | Leased | |||
Jackson Northside | Jackson | Mississippi | Leased | |||
Columbus | Columbus | Ohio | Owned | |||
Dayton - Dixie | Dayton | Ohio | Owned | |||
Macedonia | Macedonia | Ohio | Leased | |||
Oklahoma City | Oklahoma City | Oklahoma | Leased | |||
Austin Pipe | Austin | Texas | Leased | |||
Cedar Hill Pipe | Cedar Hill | Texas | Leased | |||
Grand Prairie (2 plants) | Grand Prairie | Texas | Leased | |||
Jersey Village (3 plants) | Houston | Texas | Leased | |||
Robstown | Robstown | Texas | Owned | |||
San Antonio (2 plants) | San Antonio | Texas | Leased | |||
Waco | Hewitt | Texas | Leased | |||
Ottawa | Gloucester | Ontario | Leased | |||
Cambridge | Cambridge | Ontario | Leased | |||
Mascouche Pipe & Precast | Mascouche | Quebec | Leased | |||
Franklin | Franklin | Tennessee | Leased | |||
Lexington | Lexington | Kentucky | Leased | |||
Evansville | Evansville | Indiana | Leased | |||
Chattanooga | Chattanooga | Tennessee | Leased | |||
Lenoir City | Lenoir City | Tennessee | Leased | |||
Elizabethtown | Elizabethtown | Kentucky | Leased | |||
Hermitage | Hermitage | Tennessee | Leased | |||
Facility Name | City | State/Province | Ownership | |||
Louisville | Louisville | Kentucky | Leased | |||
Cullman | Cullman | Alabama | Leased | |||
Bar Nunn | Bar Nunn | Wyoming | Leased | |||
Billings | Billings | Montana | Leased | |||
Bonner Springs | Bonner Springs | Kansas | Leased | |||
Cedar Rapids | Cedar Rapids | Iowa | Leased |
|
|
|
| |||
Des Moines | Des Moines | Iowa | Leased | |||
Elk River | Elk River | Minnesota | Leased | |||
Hawley | Hawley | Minnesota | Leased | |||
Helena | Helena | Montana | Leased | |||
Humboldt | Humboldt | Iowa | Owned | |||
Iowa Falls | Iowa Falls | Iowa | Leased | |||
Lawrence | Lawrence | Kansas | Leased | |||
Marshalltown | Marshalltown | Iowa | Leased | |||
Menoken | Menoken | North Dakota | Leased | |||
Mitchell | Mitchell | South Dakota | Owned | |||
Montana City | Montana City | Montana | Owned | |||
Plattsmouth | Plattsmouth | Nebraska | Leased | |||
Rapid City | Rapid City | South Dakota | Leased | |||
Shakopee | Shakopee | Minnesota | Leased | |||
Green Cove Springs | Green Cove Springs | Florida | Owned | |||
Romoland | Romoland | California | Leased | |||
Oceanside | Oceanside | California | Leased | |||
Water Pipe & Products | ||||||
St. Eustache Pressure Pipe | St. Eustache | Quebec | Leased | |||
Stouffville | Stouffville | Ontario | Leased | |||
Uxbridge | Uxbridge | Ontario | Leased | |||
Grand Prairie | Grand Prairie | Texas | Leased | |||
Lubbock Pressure Pipe | Lubbock | Texas | Leased | |||
Palatka | Palatka | Florida | Owned | |||
South Beloit Pressure Pipe | South Beloit | Illinois | Owned | |||
Bakewell Pressure Pipe | Bakewell | Tennessee | Leased | |||
Bessemer (2 plants) | Bessemer | Alabama | Owned | |||
Mini Mill | Bessemer | Alabama | Owned | |||
Union City | Union City | California | Owned | |||
Lynchburg | Lynchburg | Virginia | Owned | |||
Monterrey, Mexico | Monterrey | Mexico | Owned | |||
Rogers | Rogers | Minnesota | Leased | |||
Saginaw | Saginaw | Texas | Leased | |||
Remington | Remington | Virginia | Leased | |||
Ottawa | Ottawa | Kansas | Leased | |||
Indianapolis | Indianapolis | Indiana | Leased | |||
| ||||||
| ||||||
Marysville | Marysville | California | Leased | |||
Warren | Warren | Oregon | Leased | |||
Ephrata | Ephrata | Pennsylvania | Leased | |||
Phoenix | Phoenix | Arizona | Leased | |||
Orlando | Orlando | Florida | Leased | |||
Gainesville | Gainesville | Georgia | Leased | |||
| ||||||
San Antonio | San Antonio | Texas | Leased | |||
| ||||||
| ||||||
| ||||||
| ||||||
| ||||||
| ||||||
|
|
|
| |||
| ||||||
| ||||||
| ||||||
| ||||||
| ||||||
| ||||||
| ||||||
|
Intellectual Property
We own various United States and foreign patents, registered trademarks, trade names and trade secrets and applications for, or licenses in respect of, the same that relate to our various business lines.lines including, as a result of the Bio Clean Acquisition, a number of innovative technologies relating to storm water management. While the name Forterra is new in the industry, we believe our customers have reacted favorably to the new name and rebranding effort that followed the Acquisition. The U.S. Pipe name has been a recognized manufacturer of ductile iron pipe for more than 110 years. We also license intellectual property for use in certain of our products from unaffiliated third parties. We believe that our patents, trademarks, trade names and trade secrets are adequately protected and that any expiration or other loss of one or more of our patents or other intellectual property rights would not have a material adverse effect upon our business, financial condition or results of operations.
Environmental, Health and Safety Matters
We are subject to a broad range of federal, state, provincial, local and foreign laws and regulations governing health and safety or the protection of the environmentalenvironment and natural resources, including, for example:
Environmental pre-construction and operating permits are, or may be, required for certain of the Company’s operations, and such permits are subject to modification, renewal, and revocation. It is likely that we will be subject to increasingly stringent environmental standards in the future, particularly under air quality and water quality laws. It is also likely that we will be required to make additional expenditures, which could be significant, relating to environmental matters such as pollution controls, on an ongoing basis. As our operations involve, and have involved, the handling, transport and
distribution of materials that are, or could be classified as, toxic or hazardous or otherwise as pollutants, there is some risk of contamination and environmental damage inherent in our operations and the materials and products we handle and transport. Consequently, we are subject to environmental laws that impose liability for historical releases of hazardous substances. We are also subject to a variety of health and safety laws and regulations dealing with occupational health and safety, including mine safety. Manufacturing and mining sites can be inherently dangerous workplaces. Our sites often put our employees and others in close proximity with large pieces of mechanized equipment, moving vehicles, and manufacturing processes, and highly regulated materials and there is inherent risk of related liabilities in our operations. See “Risk Factors.”
The Company regularly monitors and reviews its operations, procedures, and policies for compliance with existing laws and regulations, changes in interpretations of existing laws and
enforcement policies, new laws that are adopted, and new laws that the Company anticipates will be adopted that could affect its operations. In September 2015, the EPA finalized a rule-making process establishing limitations for hydrogen fluoride, hydrogen chloride and metals emitted from brick and clay ceramics kilns and from dryers and glazing operations at clay ceramics manufacturing facilities in the United States. The rule requires the installation of “maximum achievable control technology” or “MACT” at affected facilities. Eleven of our facilities will be covered by this rule. Of those, six will have to install new MACT-compliant pollution control equipment. We have currently budgeted $10.4 million for capital expenditures to achieve compliance with the rule.
The Occupational Safety and Health Administration, or OSHA, published a final rule in March 2016 decreasing the levels of crystalline silica dust exposure to which workers can be exposed. This rule must be implemented by March 2018 and may require some of our manufacturing facilities to install new controls to reduce the levels of crystalline silica dust. Excessive, prolonged inhalation of very small-sized particles of crystalline silica has been associated with lung diseases, including silicosis, and several scientific organizations and some states, such as California, have reported that crystalline silica can cause lung cancer. The Mine Safety and Health Administration, MSHA, and the OSHA havehas established occupational thresholds for crystalline silica exposure as respirable dust. The Company monitors occupational exposures at its facilities and implements dust control procedures and/or makes available appropriate respiratory protective equipment to maintain the occupational exposures at or below the appropriate levels.
Despite our compliance efforts, risk of environmental, health and safety liability is inherent in the operation of the Company’s businesses, as it is with other companies engaged in similar businesses, and there can be no assurance that environmental, health and safety liabilities will not have a material adverse effect on the Company in the future.
Our financial statements include estimated liabilities for future costs arising from environmental issues relating to our properties and operations. As of December 31, 2015, the Company had accrued environmental liabilities of approximately $1.8 million. We believe these accruals are adequate to cover our costs for remedial measures that may eventually be required by environmental authorities with respect to known environmental matters. Our liabilities represent our best estimate of our probable future obligations for the investigation and remediation of known contaminated sites. Our actual future expenditures, however, relating to compliance and cleanup of environmental conditions at our properties cannot be conclusively determined. The estimate of our environmental costs is based on currently available facts, present laws and regulations, and current technology and take into consideration our prior experience in site investigation and remediation, the data available for each site and the professional judgment of our environmental specialists and consultants. Although recorded liabilities include our best estimate of all probable costs, our total costs for the final resolution of each site cannot be predicted with certainty due to the variety of factors that make potential costs associated with contaminated sites inherently uncertain, such as the nature and extent of site contamination,
available remediation alternatives, the extent to which remedial actions will be required, the time period over which costs will be incurred, the number and economic viability of other responsible parties and whether we have any opportunity of contribution from third parties, including recovery from insurance policies. Further, sites that are in the early stages of investigation are subject to greater uncertainties than mature sites that are close to completion.
We have been named as a potentially responsible party, or PRP, at sites identified by the EPA andor state regulatory agencies for investigation and remediation under the Comprehensive Environmental Response, Compensation and Liability Act,CERCLA, or CERCLA, and comparable state statutes. Thesestatutes, generally referred to as Superfund sites, are located inincluding Sylacauga, AL;AL, North Birmingham, AL;AL, Portland, OR;OR, and Chattanooga, TN. With respect to these Superfund sites for which we have received PRP notices, we are entitled to contractual indemnity by a third party, subject to the terms of the indemnity provisions contained in the relevant agreement. Our estimates of current liabilities factor in these indemnification rights and our assessment of the likelihood that the indemnitor will fulfill its obligations with respect to liabilities relating to such sites. WeTo date, the indemnifying party has been fulfilling its indemnification obligation with respect to those Superfund sites, and we have no reason to believe it will not continue to do so. However, in the future, we can provide no assurance however, that the indemnifying party will continue to honor its obligations, or that the existing indemnities will be sufficient to cover the liabilities for such matters.
The Company is generally required by state or provincial laws to reclaim our clay and shale mining sites after use. The projected costs for these reclamation obligations are included as a part of our asset retirement obligation and are reviewed and updated on a periodic basis. Asset retirement obligations were $1.4 million at December 31, 2015.
Legal Proceedings
We have been from time to time, and may in the future become, party to litigation or other legal proceedings that we consider to be part of the ordinary course of our business. We are not currently involved in any legal proceedings that we believe could reasonably be expected to have a material adverse effect on our business, financial condition or our results of operations. We may become involved in material legal proceedings in the future. See note 4 to the audited combined financial statements included elsewhere in this prospectus.
The purchase agreement entered into with HeidelbergCement in connection with the Acquisition requires us to make an earn outearn-out payment to HeidelbergCement if and to the extent the financial results of the businesses acquired by Lone Star in the Acquisition, including ours and that of Forterra UK, exceeded a specified adjusted EBITDA target for fiscal year 2015, as calculated pursuant to the terms of the purchase agreement. If such adjusted EBITDA calculation exceeds the specified target, we would be required to pay HeidelbergCement an amount equal to a multiple of such excess adjusted EBITDA, with any payment capped at $100 million. On April 14, 2016, we provided an earn-out statement to HeidelbergCement demonstrating that no payment was required. On June 13, 2016, HeidelbergCement notified us that it is disputing, among other things, our calculation of adjusted EBITDA under the purchase agreement and asserting that a payment should be made in the amount of $100 million. Pursuant to the terms ofresolution process outlined in the purchase agreement, unless otherwise agreed, if wethe parties are not able to resolvein discussions concerning the matter prior to July 14, 2016, we are obligated to refer the matter toengaging of a neutral accounting expert who could issueexpert. On October 5, 2016, affiliates of HeidelbergCement filed a final determination as early aslawsuit in the fourth quarterDelaware Court of 2016.Chancery seeking specific performance and claiming access to our books, records, and personnel; seeking a declaratory judgment concerning the scope of the neutral accounting expert’s authority; and in the alternative, claiming a breach of contract and seeking the $100 million and other damages. We believe our calculation of adjusted EBITDA for fiscal year 2015 under the purchase agreement is correct and do not consider a payment on the earn out to be probable. Therefore, we did not accrue any contingency reserve as of December 31, 2015 or March 31,June 30, 2016 in respect of any earn out.earn-out. See Note 3 to our audited and unaudited combined financial statements included elsewhere in this prospectus. While we intend to vigorously oppose HeidelbergCement’s assertions, as well as the outcomerecently filed lawsuit, the outcomes of this matter isthese matters are uncertain, and no assurances can be given regarding the ultimate outcome of any proceedings.proceedings.See the section entitled “Risk Factors.”
U.S. Pipe received a General Notice Letter and Invitation to Conduct Removal Action dated September 20, 2013 from the EPA with respect to the 35th Avenue superfund site in Birmingham, Alabama. The letter requests that U.S. Pipe participate in an environmental response action in an area proximate to a closed U.S. Pipe facility in North Birmingham, Alabama. The U.S. Pipe North Birmingham facility was closed and, as part of the acquisition of U.S. Pipe by a private equity fund from Mueller Water Products, Inc. and Mueller Group, LLC, or the Sellers, in 2012, the facility was retained by and is currently owned by either the Sellers or one of their affiliates. The notice requested response activities including testing and removing surface soils at area residences alleged to be contaminated by locally-sourced air pollutants. In connection with the disposition, the Sellers agreed to jointly and severally defend and indemnify U.S. Pipe against any losses or environmental liabilities related to sites retained by the Sellers, including the North Birmingham facility. Accordingly, U.S. Pipe tendered the defense of this matter to the Sellers for defense and indemnification. The Sellers accepted the tender and, on behalf of U.S. Pipe, have responded to the EPA’s request to participate in a time-critical removal action by declining, based on the EPA’s failure to establish any nexus between the contamination and any operations at the U.S. Pipe North Birmingham facility. The EPA sent a renewed request addressed to the Sellers, U.S. Pipe and a number of other potentially responsible parties on August 8, 2014 seeking participation in a broader cleanup of soil at approximately 80 homes in North Birmingham. The Sellers again responded on U.S. Pipe’s behalf declining to participate on the same grounds. In September 2014, the EPA proposed that the site be listed on the National Priorities List. The Sellers continue to defend on this matter on behalf of U.S. Pipe. While we cannot provide assurance that such defense will be successful, because of the indemnification described above, we do not believe the ultimate resolution of these matters will have a material adverse effect on our business, financial condition or results of operations.
The following table sets forth certain information regarding our director nominees and executive officers as of the date of this prospectus.
Name | Age | Position | ||||
Jeffrey Bradley | 56 | Chief Executive Officer, Director | ||||
William Matthew Brown | 51 | Executive Vice President and Chief Financial Officer | ||||
Mark Carpenter | President, Drainage Pipe & Products | |||||
William Kerfin | President, Water Pipe & Products | |||||
Ed Sexe | Senior Vice President and General Manager | |||||
| ||||||
Lori M. Browne | Senior Vice President and General Counsel | |||||
Matthew Wayman | 37 | Vice President, Corporate Development | ||||
Kevin Barner | 34 | Director Nominee | ||||
Robert Corcoran | 57 | Director Nominee | ||||
Samuel D. Loughlin | 44 | Director Nominee | ||||
Clint McDonnough | 61 | Director Nominee | ||||
John McPherson | 48 | Director Nominee | ||||
Chris Meyer | 45 | Director Nominee | ||||
Jacques Sarrazin | 66 | Director Nominee | ||||
Chadwick Suss | 39 | Director Nominee | ||||
Kyle Volluz | Director | |||||
Grant Wilbeck | Director Nominee | |||||
Executive Officers
Jeffrey Bradley—Mr. Bradley has served as our Chief Executive Officer since September 2015 and a member of our board of directors since July 2016. Mr. Bradley joined Forterra from Globe Specialty Metals, a publicly-traded producer of silicon metal and silicon based alloys, where he served as Chief Executive Officer from 2008 through 2015. From 2005 to 2008, Mr. Bradley served as Chairman and Chief Executive Officer of Claymont Steel, a U.S. custom steel plate producer. Prior to Claymont Steel, Mr. Bradley held numerous key roles at Worthington Industries. Mr. Bradley holds a Bachelor of Science degree in Business Administration from Loyola University.
As our Chief Executive Officer, Mr. Bradley brings a deep understanding of our business, operations and strategic planning to the Board. Mr. Bradley also has extensive industry and public company experience gained through his prior service as Chief Executive Officer of Globe Specialty Materials and Claymont Steel, where he successfully led each company through its initial public offering and its early stages as a public company. Mr. Bradley’s board service will also provide a direct and open channel of communications between the board and management.
William Matthew Brown—Mr. Brown has served as Executive Vice President and Chief Financial Officer since April 2016 and as our Chief Financial Officer since August 2015. From August 2012 through August 2015, Mr. Brown served as Senior Vice President and Chief Financial Officer of U.S. Concrete, Inc., a publicly-traded producer of ready-mixed concrete and aggregate products. From November 2007 through August 2012, Mr. Brown served as the Treasurer and Executive Assistant to the Chief Executive Officer, and from 2005 through 2007, as the Treasurer of Drummond Company, Inc., an international coal producer. From 1999 through 2005, Mr. Brown served in the investment banking department of Citigroup Global Markets Inc., including as a Vice President in the basic industries coverage group. From 1988 through 1997, Mr. Brown served in the United States Navy as a Naval Special Warfare Officer. Mr. Brown holds a Master of Business Administration degree from The Wharton School of the University of Pennsylvania and a Bachelor of Science degree in Mechanical Engineering from the United States Naval Academy.
Mark Carpenter—Mr. Carpenter has served as President, Drainage Pipe & Products since April 2016. Over the four months prior to his appointment as President, Mr. Carpenter served as Senior Vice President and General Manager, Drainage Pipe & Products since January 2016. From May 2013 to December 2015, Mr. Carpenter served as the Senior Vice President for Hanson Engineered Products and was responsible for the North American pressure pipe, U.S. structural precast and Eastern Canada gravity pipe and precast businesses. Mr. Carpenter joined Hanson in October 2005 and managed a number of gravity pipe and precast businesses in the United States, including serving as Senior Vice President for Hanson Pipe & Precast West US from 2011 to August 2012 and assuming responsibility for all of U.S. Drainage Pipe & Products in August 2012 when he was appointed Senior Vice President Hanson Pipe & Precast US, a position he held through May 2013. Prior to joining Hanson, Mr. Carpenter served as Senior Consultant with Collinson Grant, where he led post-acquisition integration and restructuring assignments for Hanson across North America. His early career was with British American Tobacco in the United Kingdom and Russia. Mr. Carpenter holds a Bachelor of Science degree in Engineering from Brunel University, London and a Masters of Business Administration degree from Henley Business School.
William Kerfin—Mr. Kerfin has served as President, Water Pipe & Products since April 2016. Over the 13 months prior to his appointment as President, Mr. Kerfin served as Vice President of Sales for U.S. Pipe. From October 2010 through February 2015, Mr. Kerfin was the Vice President of Finance for Provisur Technologies, Inc., a leader in the food processing industry recognized for leading technologies and their global reach. From March 2006 through October 2010, Mr. Kerfin was the Vice President of Finance for Griffin Pipe Products Company, a customer-focused ductile iron pipe manufacturer. Prior to joining Griffin Pipe Products, Mr. Kerfin held various positions with Cameo Container, Square D Company, Helene Curtis Industries, Inc., Groupe Schneider, and Illinois Tool Works. Mr. Kerfin holds a Master of Business Administration from The University of Chicago Booth School of Business, Bachelor of Science in accountancy from De Paul University and received his Certified Public Accountant certificate from Illinois. Mr. Kerfin also served in the United States Marine Corps Reserve from 1985 through 1993.
Ed Sexe—Mr. Sexe has served as Senior Vice President and General Manager since January 2016. Mr. Sexe has responsibility for our Structural & Specialty Products line, which is a part of our Water Pipe & Products business segment. Before joining Forterra, Mr. Sexe held a number of positions with Cretex Concrete Products, a producer of precast concrete infrastructure products, most recently serving as Vice President from March 2015 to December 2015 and Director of Sales from September 2009 to March 2015. Prior to joining Cretex Concrete Products in 1997, Mr. Sexe worked for Bartlett & West Engineers and the Kansas Department of Transportation. Mr. Sexe holds a Bachelor of Science degree in Engineering from North Dakota State University.
Charles L. Ward—Mr. Ward has served as Senior Vice President and General Manager, Bricks since October 2010. Mr. Ward joined Hanson Brick & Tile in 2002 and held a number of senior finance and other roles in Hanson’s brick and roof tile businesses, including Chief Financial Officer of Hanson Brick & Tile, Vice President of Sales for Hanson Brick North America and General Manager of Hanson Brick East. Prior to joining Hanson, Mr. Ward was President of Scholl America, Inc., an international textile machinery company. Mr. Ward has a Bachelor of Science degree in accounting from the University of North Carolina at Greensboro and holds a certified public accountant license in the state of North Carolina.
Lori M. Browne—Ms. Browne has served as Senior Vice President and General Counsel since June 2016 and previously served as Vice President and General Counsel from March 2015 to June 2016. From April 2007 through March 2015, Ms. Browne served first as General Counsel for Fairpay Solutions, Inc. through March 2014, and subsequently as Assistant General Counsel for Mitchell International, Inc. after Mitchell’s acquisition of Fairpay Solutions, Inc. Both Fairpay Solutions, Inc. and
Mitchell International, Inc. provide health care technology services to property and casualty insurers. Prior to that, Ms. Browne was an attorney at Weil, Gotshal & Manges, LLP and Fulbright & Jaworski, LLP. Ms. Browne holds a Juris Doctor degree from The University of Texas School of Law and a Bachelor of Arts degree from Texas A&M University. She is admitted to practice in the State of Texas.
Matthew Wayman—Mr. Wayman has served as Vice President, Corporate Development since November 2015. From August 2012 through November 2015, Mr. Wayman served as Vice President of Strategy and Development for Oldcastle Building Products, Inc., an integrated building materials manufacturer and distributor, and a wholly owned subsidiary of Irish-based CRH plc. During his tenure
at Oldcastle, Mr. Wayman also served as Vice President Operations for Oldcastle Precast, Inc. Prior to Oldcastle, Mr. Wayman worked as a turnaround and restructuring advisor with Macquarie Capital (USA), Inc. from April 2008 to September 2012. Prior to Macquarie Capital (USA), Inc., Mr. Wayman held investment banking roles at J.P. Morgan and Barclays Capital as well as a corporate finance position at Fleet Securities, Inc. Mr. Wayman holds a Bachelor of Science degree in Engineering Science and Economics from Vanderbilt University.
Directors and Director Nominees
Kevin Barner—Mr. Barner will become a director upon the listing of our common stock. Mr. Barner is a Director of Lone Star AmericasNorth America Acquisitions LLC, an affiliate of ours and Lone Star, where he focuses on origination and underwriting activities related to corporate private equity and debt investments throughout the Americas region. Prior to his current role, from August 2012 until June 2014, Mr. Barner was a Vice President at Hudson Americas L.P., an affiliate of ours and Lone Star, serving in an origination, underwriting, and asset management role on various operating company investments made by several of Lone Star’s funds. Prior to joining Hudson Americas, from March 2006 until August 2012, Mr. Barner served as a Vice President and Associate at The Halifax Group, a middle-market private equity firm with over $1.0 billion under management. While at Halifax, Mr. Barner was responsible for identifying, evaluating and sourcing private equity investment opportunities and was a board member or board observer for several of Halifax’s portfolio companies, including, Service Champ, Aptiv Solutions, North American Video, and XLA. From July 2004 until March 2006, Mr. Barner was an Analyst with BB&T Capital Markets Investment Banking platform specializing in mergers and acquisitions across a variety of industries. Mr. Barner served as a member of the board of directors of Continental Building Products, Inc. from March 2015 to March 2016 and currently serves as a member of the board of directors of a number of privately held companies.
Mr. Barner brings broad expertise in financial management to the board of directors. His extensive experience in private equity and the financial markets also allows him to make valuable contributions with respect to our capital structure and financing, acquisition and investing activities.
Robert Corcoran—Mr. Corcoran will become a director upon the listing of our common stock. Mr. Corcoran is Senior Advisor – Global Operations for Hudson Advisors LP, an affiliate of ours and Lone Star, a position he has held since January 2016. Mr. Corcoran was formerly President and Chief Operating Officer of Hudson Advisors, a position he held from July 2014 to December 2015, and prior to that served as President and Chief Financial Officer of Hudson Advisors since 1993. Before joining Hudson Advisors, Mr. Corcoran served as the Controller for Brazos Asset Management, Inc. and American Real Estate Group. Mr. Corcoran began his career with the accounting firm of Touche Ross & Co. in San Antonio. He is a CPA and holds a Bachelor of Science degree from the University of Texas at San Antonio.
Mr. Corcoran brings a significant level of management and asset-oversight expertise to the board from his career with Hudson Advisors. His service as an executive also provides the board with valuable insight regarding management’s day-to-day duties and responsibilities. Mr. Corcoran’s service on our advisory board also provides him with a working knowledge of our business and operations.
Samuel D. Loughlin—Mr. Loughlin will become a director and Chairman of the Board upon the listing of our common stock. Mr. Loughlin currently serves as President of Lone Star AmericasNorth America Acquisitions, LLC, an affiliate of ours and Lone Star, where he is responsible for the management and oversight of all originations initiatives in North America. Previously, from 2011 to 2013, he served as Managing Director and Senior Managing Director of Lone Star U.S. Acquisitions, LLC. Mr. Loughlin joined Hudson Americas LP, an affiliate of ours and Lone Star, in 2008 and focused on directing the
management of the corporate assets located in North America. From 2008 to 2011, he served in various capacities at Hudson Americas, with responsibility for its retail and restaurant operating companies, in addition to leading teams in special originations initiatives. Mr. Loughlin has more than 18 years of finance and legal experience, including mergers and acquisitions, financing, private equity investment, originations and asset management transactions. Prior to joining Hudson Americas, Mr. Loughlin was a Partner of a Texas-based private equity firm with real estate, operating company and securities holdings, where he was responsible for legal oversight, deal structuring, asset evaluation, acquisitions and sales. Prior to that, Mr. Loughlin served as an attorney at Vinson & Elkins LLP, where he was a member of the Business and Corporate Securities group, with experience in venture capital and mezzanine financing transactions, private and public securities offerings, mergers and acquisitions, management buyouts and debt financing transactions. Mr. Loughlin also served as chairman of the board of directors of Del Frisco’s Restaurant Group, Inc. from July 2012 through December 2013, and served as chairman of the board of directors of Continental Building Products, Inc. from February 2014 through March 2015 and currently serves as a member of the board of directors of a number of privately held companies.
Mr. Loughlin has significant experience with the strategic, financial and operational requirements facing operating companies in various industries, allowing him to guide the board in analyzing, shaping, and overseeing our execution of important operational and policy issues. His responsibilities for Lone Star’s operating companies in North America, including our company, also provide Mr. Loughlin with a working knowledge of our business and operations that are important to the development of the board.
Clint McDonnough—Mr. McDonnough will become a director upon the listing of our common stock. Mr. McDonnough has been the Managing Partner of McDonnough Consulting LLC, a consulting firm, since May 2016. Before retiring in June 2015, Mr. McDonnough served 38 years for Ernst & Young LLP, most recently serving as the Managing Partner of the firm’s Dallas office. In his role as Managing Partner, Mr. McDonnough was responsible for leading all day-to-day practice operations in one of the firm’s largest markets. Prior to serving as Managing Partner, Mr. McDonnough was the firm’s Managing Partner of Assurance & Advisory Business Services for the southwest area practice. Mr. McDonnough has been a member of the board of directors of UDR, Inc. and ORIX USA Corporation since February 2016 and April 2016, respectively, and has served as a member of our Advisory Board since July 1, 2015. Mr. McDonnough is also active in, and serves on the boards of, several charitable and educational organizations.
Mr. McDonnough brings a significant level of financial and accounting expertise to the board developed during his more than 35 year career with Ernst & Young. This experience, in particular his experience gained working with numerous listed companies, provides valuable insight regarding public company reporting matters, as well as insight into the process of an audit committee’s interactions with the board and management. Mr. McDonnough’s service on our advisory board also provides him with a working knowledge of our business and operations.
John McPherson—Mr. McPherson will become a director upon the listing of our common stock. Mr. McPherson has been Executive Vice President, Chief Financial and Strategy Officer of Vulcan Materials Company, a publicly-traded producer of construction aggregates, asphalt mix and ready-mixed concrete, since July 2014. Prior to assuming his current position, Mr. McPherson served in a number of roles for Vulcan, including Executive Vice President and Chief Financial Officer from
January 2014 to July 2014, Senior Vice President – East Region from November 2012 to December 2013 and Senior Vice President, Strategy and Business Development from October 2011 to November 2012. Before joining Vulcan in October 2011, Mr. McPherson worked at McKinsey & Company, Inc., a global management consulting firm, beginning in 1995, most recently serving as Senior Partner from 2006 to 2011.
Mr. McPherson brings a significant level of financial and accounting expertise to the board developed during his professional career, including through his service as a Chief Financial Officer. Mr. McPherson’s valuable public company experience also provides the board with valuable insight regarding public company reporting matters, as well a first-hand view of management’s day-to-day duties and responsibilities. Mr. McPherson’s service on our advisory board also provides him with a working knowledge of our business and operations.
Chris Meyer—Mr. Meyer will become a director upon the listing of our common stock. Mr. Meyer has been a Managing Director of Hudson Americas L.P., an affiliate of ours and Lone Star, since February 2015. Mr. Meyer has oversight responsibility for a number of Lone Star’s private equity investments, including our company, and also assists with the due diligence and underwriting of potential operating company investments. Prior to joining Hudson Americas, Mr. Meyer held a number of positions with McKinsey & Company, Inc., a global management consulting firm, most recently serving as a Director (Senior Partner). While at McKinsey, Mr. Meyer managed the Dallas office, co-led the Consumer Practice group and co-founded McKinsey’s Consumer Marketing Analytics Center. Mr. Meyer currently serves as a member of the board of directors of a number of privately held companies, including several for which he serves as chairman. Mr. Meyer earned a Bachelor of Science degree in Industrial Engineering from North Carolina State University and a Masters of Business Administration degree from Harvard Business School.
Mr. Meyer’s background, including as a management consultant in a wide range of industries, allows him to assist the board in understanding and addressing a wide variety of the issues it faces. Mr. Meyer also brings significant financial and operational expertise developed through his past and current leadership and oversight roles. His responsibilities for Lone Star’s companies, including our company, also provide Mr. Meyer with a deep working knowledge of our business and operations.
Jacques Sarrazin—Mr. Sarrazin will become a director upon the listing of our common stock. Mr. Sarrazin has also been a Partner at and President of JMH Conseil, a strategy and development consulting firm, since 2015. Mr. Sarrazin has also been an Affiliate Partner at Lindsay Goldberg, a private equity fund, since 2015. Prior to 2015, Mr. Sarrazin held a number of executive positions with Lafarge SA, a French industrial company, over a period of almost 25 years, most recently serving as Group Vice President of Strategy from 2007 to 2014. Prior to Lafarge, Mr. Sarrazin was employed by Pechiney, an aluminum company, and served as a research fellow at Ecole Polytechnique in Paris. Mr. Sarrazin holds a degree in Mining Engineering from Ecole des Mines, Nancy and a PhD from the University of Texas at Austin.
Mr. Sarrazin brings a significant level of industry experience to the board developed during his approximately 25 year career in the industrial and construction industries, including as an executive at Lafarge. His service as an executive also provides the board with valuable insight regarding management’s day-to-day duties and responsibilities. Mr. Sarrazin’s service on our advisory board also provides him with a working knowledge of our business and operations.
Chadwick Suss—Mr. Suss will become a director upon the listing of our common stock. Mr. Suss has been a Director of Hudson Americas L.P., an affiliate of ours and Lone Star, since July 2015 and prior to that, served as a Vice President starting in August 2013. His responsibilities include identifying investment opportunities, managing acquisition processes, driving portfolio company
performance and working on investment exits. Mr. Suss’s asset management responsibilities include the building products and shipping businesses of Lone Star’s operating companies. Prior to joining Hudson Americas, Mr. Suss worked as a turnaround and restructuring advisor with AlixPartners from March 2009 to July 2013. Prior to AlixPartners, Mr. Suss held investment banking roles at J.P. Morgan and A.G. Edwards as well as corporate finance positions at S.C. Johnson. Mr. Suss served as a member of the board of directors of Continental Building Products, Inc. from February 2014 to March 2016.
Mr. Suss brings broad financial and operational expertise to the board of directors developed through roles in management consulting, investment banking and corporate finance across a variety of industries. Mr. Suss’s background and expertise allow him to help the board identify, understand and address a wide variety of issues.
Kyle Volluz—Mr. Volluz has been a member of our board of directors since June 21, 2016. Mr. Volluz has been a Managing Director with Hudson Advisors L.P., an affiliate of ours and Lone Star, since January 2015, and for the five years prior to that, a Director with Hudson Advisors, in each case, with responsibility for the management of the Legal Department. In such capacity, Mr. Volluz oversees all legal issues impacting operating companies that are affiliates of Lone Star within North America, as well as other corporate investments for which Hudson Advisors or its subsidiaries provide asset management services in North America. In particular, Mr. Volluz has been actively involved in the negotiation and closing of numerous lending transactions, acquisitions and asset sales for us and other Lone Star portfolio companies since joining Hudson Advisors in 2009. Previously, Mr. Volluz was Senior Vice President and Director of Legal Services for Goldman Sachs Specialty Lending Group, an affiliate of Goldman, Sachs & Co., a position he held from 2005 to 2009. Prior thereto, Mr. Volluz was an attorney with Baker Botts LLP and Thompson & Knight LLP, where he supported clients in various types of commercial banking transactions, mergers and acquisitions, private and public securities offerings and debt financing transactions. Mr. Volluz served as a member of the board of directors of Continental Building Products, Inc. from February 2014 to March 2016 and currently serves as a member of the board of directors of a number of privately held companies. Mr. Volluz graduated from the University of Texas at Austin in Austin, Texas. He holds a Master of Business Administration degree from the Thunderbird School of Global Management in Glendale, Arizona, and a Juris Doctor degree from the Dedman School of Law at Southern Methodist University in Dallas, Texas.
Mr. Volluz’s knowledge of our company allows him to bring a well-informed perspective to the board of directors regarding our operations and the associated legal risks. His extensive experience with capital market transactions, both involving our company and other affiliates of Lone Star, also allows him to make valuable contributions with respect to our capital structure and financing and investing activities. His legal background also provides valuable insight to the board regarding issues we may face.
Grant Wilbeck—Mr. Wilbeck will become a director upon the listing of our common stock. Mr. Wilbeck has served as Managing Director of Lone Star AmericasNorth America Acquisitions LLC, an affiliate of ours and Lone Star, since 2013, where he focuses on origination and underwriting activities related to corporate private equity and debt investments. Previously, from 2007 to 2013, he served in various capacities at Hudson Americas L.P., an affiliate of ours and Lone Star, with asset management responsibility across all retail and restaurant operating companies focusing on operational performance, capital structure and acquisition opportunities. Prior to joining Hudson Americas, Mr. Wilbeck was at APS Financial Corp. where he was a research analyst focused on distressed debt and special situations. Mr. Wilbeck served as a member of the board of directors of Continental Building Products, Inc. from February 2014 to March 2016 and currently serves as a member of the board of directors of a number of privately held companies.
Mr. Wilbeck brings broad expertise in financial management to the board of directors. His extensive experience in the financial markets also allows him to make valuable contributions with respect to our capital structure and financing and investing activities.
There are no family relationships among any of our directors or executive officers.
Director Compensation
We have not paid any compensation to our non-employee directors for their services as directors. However, we intend to pay compensation to independent directors following the completion of this offering. We expect to pay an annual retainer of $$65,000 per year to each independent director for his or her services, with an additional $$20,000 annual fee for service as the chairmanchair of the board oraudit committee, a $15,000 annual fee for service as chairpersonthe chair of the compensation committee, $10,000 for service as the chair of the nominating and corporate governance committee and $7,500 for service on a committee of the board. In addition, we expect to pay our independent directors a fee of $ for each meeting attended in person and $ for each meeting attended telephonically. We also expect independent directors to receive an annual equity grant.grant valued at approximately $75,000. Such cash fees are expected to be paid quarterly in arrears. We also intend to grant each of our independent directors 1,000 pool units under the LTIP.
Board of Directors
Our amended and restated certificate of incorporation will provide that our board of directors will be divided into three classes of directors, with the classes to be as nearly equal in number as possible. The members of each class will serve for a three-year term. As a result, one-third of our board of directors will be elected each year. Messrs. Barner, Bradley, Corcoran and Suss will be class I directors, up for election in 2017, Messrs. Loughlin, Meyer, Volluz and Wilbeck will be class II directors, up for election in 2018, and Messrs. McDonnough, McPherson and Sarrazin will be class III directors, up for election in 2019. See “Description of our Capital Stock—Provisions of Our Certificate of Incorporation and Bylaws to be Adopted and Delaware Law That May Have an Anti-Takeover Effect—Classified Board of Directors.”
Before the completion of this offering, our board of directors will establish an audit committee, a compensation committee and a nominating and corporate governance committee, each of which will operate pursuant to a charter that will be adopted by our board of directors. Upon the closing of this offering, the composition and functioning of all of our committees will comply with all applicable requirements of the Sarbanes-Oxley Act, SEC rules and regulations and the rules of the stock exchange on which we apply to list.NASDAQ rules.
Following this offering, Lone Star will continue to control more than 50% of the voting power of our common stock in the election of directors. Accordingly, we intend to avail ourselves of the “controlled company” exception available under stock exchangeNASDAQ rules which eliminates certain requirements, such as the requirements that a company have a majority of independent directors on its board of directors, that compensation of executive officers be determined, or recommended to the board of directors for determination, by a majority of the independent directors or a compensation committee composed solely of independent directors, and that director nominees be selected, or recommended for the board of directors’ selection, by a majority of the independent directors or a nominations committee composed solely of independent directors. In the event that we cease to be a controlled company, we will be required to comply with these provisions within the transition periods specified in the applicable rules. These exemptions do not modify the independence requirements for our audit committee, and we intend to comply with the applicable requirements of the SEC and the stock exchange on which we apply to listNASDAQ with respect to our audit committee within the applicable time frame.
Committees of the Board of Directors
Audit Committee
The primary responsibilities of our audit committee will be to oversee the accounting and financial reporting processes of our company as well as our subsidiary companies, and to oversee the internal and external audit processes. The audit committee will also assist the board of directors in fulfilling its oversight responsibilities by reviewing the financial information provided to stockholders and others, and the system of internal controls established by management and the board of directors. The audit
committee will oversee the independent auditors, including their independence and objectivity. However, committee members will not act as professional accountants or auditors, and their functions are not intended to duplicate or substitute for the activities of management and the independent auditors. The audit committee will be empowered to retain independent legal counsel and other advisors as it deems necessary or appropriate to assist it in fulfilling its responsibilities, and to approve the fees and other retention terms of the advisors.
The audit committee will be composed of three members, ,Messrs. McDonnough, McPherson and Suss, with Mr. McDonnough serving as chair. Our board of directors has determined that each of Messrs. McDonnough and McPherson is independent, as defined under and required by the federal securities laws and the applicable stock exchangeNASDAQ rules. Our board of directors has determined that Mr. McDonnough qualifies as an audit committee financial expert under the federal securities laws and that each member of the audit committee has the financial sophistication required under the applicable stock exchangeNASDAQ rules. The rules of the SEC and the applicable exchangeNASDAQ require us to have a fully independent audit committee within one year of the date of the effectiveness of the registration statement of which this prospectus is a part and the listing of our common stock, respectively.
Compensation Committee
The primary responsibilities of our compensation committee will be to periodically review and approve the compensation and other benefits for our employees, officers and independent directors. This will include reviewing and approving corporate goals and objectives relevant to the compensation of our executive officers in light of those goals and objectives, and setting compensation for these officers based on those evaluations. Our compensation committee will also administer and have discretionary authority over the issuance of equity awards under our equity incentive plan.
The compensation committee may delegate authority to review and approve the compensation of our employees to certain of our executive officers, including with respect to awards made under our equity incentive plan. Even where the compensation committee does not delegate authority, our executive officers will typically make recommendations to the compensation committee regarding compensation to be paid to our employees and the size of equity grants under our equity incentive plan.
The compensation committee will be composed of three members, ,Messrs. McPherson, Meyer and Wilbeck, with Mr. Meyer serving as chair. For so long as we are a controlled company, we are not required to have a compensation committee composed entirely of independent directors under the applicable stock exchangeNASDAQ rules. Our board of directors has nonetheless determined that Mr. McPherson is independent under NASDAQ rules.
Nominating and Corporate Governance Committee
Our nominating and corporate governance committee will oversee all aspects of our corporate governance functions. The committee will make recommendations to our board of directors regarding director candidates and assist our board of directors in determining the composition of our board of directors and its committees. The nominating and corporate governance committee will be composed of three members, ,Messrs. Barner, McDonnough and Volluz, with Mr. Volluz serving as chair. For so long as we are a controlled company, we are not required to have a nominating and corporate governance committee composed entirely of independent directors under the applicable stock exchangeNASDAQ rules.
Code of Conduct and Ethics
Our board of directors will adopt a code of conduct and ethics that establishes the standards of ethical conduct applicable to all directors, officers and employees of our company. The code will address, among other things, conflicts of interest, compliance with disclosure controls and procedures
and internal control over financial reporting, corporate opportunities and confidentiality requirements. The audit committee will be responsible for applying and interpreting our code of conduct and ethics in situations where questions are presented to it. We expect that any amendments to the code or any waivers of its requirements applicable to our principal executive, financial or accounting officer, or controller will be disclosed on our website at forterrabp.com. Our website is not part of this prospectus.
Compensation Committee Interlocks and Insider Participation
Our compensation committee will be composed of .Messrs. McPherson, Meyer and Wilbeck. None of our executive officers currently serves, or has served during the last completed fiscal year, as a member of the board of directors, or as a member of the compensation or similar committee, of any entity that has one or more executive officers who served on our board of directors. For a description of the transactions between us and members of the compensation committee, and entities affiliated with such members, see the transactions described under the section entitled “Certain Relationships and Related Party Transactions.”
Compensation Discussion and Analysis
In this section, the Compensation Discussion and Analysis, or CD&A, we provide an overview of our compensation philosophy and each element of our executive compensation program with regard to the compensation awarded to, earned by, or paid to our named executive officers, or NEOs, during our fiscal year ended December 31, 2015. Throughout this section, we also provide information on certain changes we have made to our NEO compensation program since December 31, 2015.
For the fiscal year ended December 31, 2015, our NEOs were:
Named Executive Officer | Title | |
Jeffrey Bradley | Chief Executive Officer | |
William Matthew Brown | Executive Vice President, Chief Financial Officer | |
Mark Carpenter | President, Drainage Pipe & Products | |
Charles L. Ward | Senior Vice President and General Manager, Bricks | |
Plamen Jordanoff | Former Chief Executive Officer | |
Mark Conte | Former Chief Financial Officer | |
Scott Szwejbka | Former Senior Vice President, Pipe & Precast |
During 2015, each of our NEOs, with the exception of Mr. Ward, was employed by Forterra Pipe and Precast, LLC, and Mr. Ward was employed by Forterra Brick, LLC, both of which are wholly owned subsidiaries of ours.References in this CD&A to compensation paid by the Company include compensation paid by these entities.
Mr. Bradley commenced employment with us as Chief Executive Officer on August 31, 2015, succeeding Mr. Jordanoff, who was terminated effective September 1, 2015. Mr. Conte was terminated as Chief Financial Officer on June 5, 2015 and was succeeded by Mr. Brown, who assumed this position on August 26, 2015. Mr. Szwejbka was terminated as Senior Vice President, Pipe & Precast effective December 31, 2015. During fiscal year 2015, Mr. Carpenter served as Senior Vice President, Hanson Engineered Products, and was appointed as Senior Vice President and General Manager, Drainage Pipe & Products on January 1, 2016, following Mr. Szwejbka’s termination. Forterra Brick, LLC will no longer be a subsidiary of ours following the Bricks Disposition and therefore, Mr. Ward’s employment with us will end at that time.
Compensation Philosophy
Our compensation programs are designed to attract, motivate, retain and reward our employees in order to promote our long-term success, growth and profitability. In setting compensation levels and designing program elements, we seek to establish overall compensation levels that are internally equitable and competitive within the industries in which we compete for talent. We regularly review our executive officer compensation program with the goal of motivating our executive team to achieve our strategic goals and aligning them with the interests of our stockholders. In particular, we seek to:
Following the completion of this offering, the compensation committee of our board of directors will be responsible for the implementation and oversight of our compensation program for our non-employee directors and executive officers.
Elements of 2015 Compensation
The principal elements of our 2015 compensation program are described in the table that follows:
Element | Description | Purpose | ||
| Base salary | Fixed level of annual cash compensation, reviewed annually. | Provides a competitive level of base pay designed to attract and retain qualified executives. | ||
| Annual incentive compensation | Annual cash performance bonus payable based upon attainment of short-term objectives. The total target level of annual incentive compensation is set for each individual as a percentage of that individual’s base salary. Annual incentive awards are then earned based on (i) the achievement of financial metrics of the Company and/or one of its segments established by Forterra Pipe and Precast LLC’s and Forterra Brick, LLC’s boards of directors, as applicable, and/or (ii) the achievement by that individual of certain individual goals established by Forterra Pipe and Precast LLC’s board of directors, for Mr. Jordanoff, and established by Mr. Jordanoff for his direct-reports, including all other NEOs. For 2015, Messrs. Bradley and Brown’s annual incentives were based entirely upon the achievement of financial goals. Based on the board’s and CEO’s (for all NEOs other than himself) assessment of the achievement of these financial and/or personal goals, payment of the annual incentive compensation can range from 0% to 200% of the targeted amount. | Motivates executives to drive performance and rewards executives for achievement in key areas of operational and financial performance. | ||
| Long-term incentive compensation | Cash-based long term incentive plan established and maintained by Concrete Holdings entitling participants to potential cash payouts upon designated liquidity events in which our direct and indirect equity holders immediately prior to this offering realize a specified internal rate of return. | Motivates and rewards executives for increasing Company value and serves to directly align executive compensation with our equity holders’ realized returns. | ||
Element | Description | Purpose | ||
| Benefits and perquisites | • Participation in broad-based employee plans offered to our full-time employees generally.
• Relocation benefits for newly hired executives or those who are required to relocate in connection with their employment.
• Use of cars leased by the Company as part of its fleet lease program, together with a fuel card.
• 401(k) plan Company-sponsored contribution of up to 3% of covered compensation and additional Company-sponsored match of up to 3% of covered compensation. | Provides competitive benefits and limited perquisites to attract and retain executives. Most of the benefits offered to our executives are similarly offered to all salaried U.S. employees. |
2015 Compensation-Setting Process
For 2015, we generally retained the same compensation program elements established by HeidelbergCement prior to the Acquisition. Compensation levels in 2015 for key executive employees, including our NEOs, were set by the boards of directors of Forterra Pipe and Precast LLC and Forterra Brick, LLC, as applicable, and reflected certain adjustments commensurate with our NEOs’ expanded roles and responsibilities following the Acquisition. The Company did not utilize the services of a compensation consultant during 2015, but expects to engage a compensation consultant in connection with becoming a public company. As noted above, following the completion of this offering, our compensation committee will be responsible for the implementation and oversight of our compensation program for our executive officers.
Employment Agreements
Jeffrey Bradley
Forterra Pipe and Precast, LLC has entered into an employment agreement with Mr. Bradley dated as of July 8, 2015, under which he assumed the role of Chief Executive Officer as of August 31, 2015. This employment agreement establishes Mr. Bradley’s initial annual base salary at $800,000 per year and a bonus potential of up to 200% of base salary (pro-rated for 2015). Mr. Bradley’s employment agreement also sets forth certain severance provisions that apply in the event that he is terminated without cause (as defined in his employment agreement), resigns for good reason (as defined in his employment agreement), or terminates employment as a result of death or disability. These payments are described in further detail in the section entitled “—Potential Payments Upon Termination or Change in Control” below and are subject to Mr. Bradley’s execution and nonrevocation of a mutual general release of claims and continued compliance with the restrictive covenants contained in his employment agreement. The employment agreement contains a number of restrictive covenants, including a 12-month post termination non-competition covenant, a 12-month post termination employee and business contact non-solicitation provision, and a mutual non-disparagement covenant.
William Matthew Brown
Forterra Pipe and Precast, LLC has entered into an amended and restated employment agreement with Mr. Brown dated as of June 28, 2016, the terms of which are similar, in all material
respects, to those contained in his prior employment agreement. Pursuant to his prior employment agreement, dated July 13, 2015, Mr. Brown assumed the role of Executive Vice President and Chief Financial Officer as of August 26, 2015. This employment agreement established Mr. Brown’s minimum annual base salary at $350,000 per year and a bonus potential of up to 200% of base salary (pro-rated for 2015). Pursuant to this employment agreement, Mr. Brown’s pro-rated annual bonus for 2015 was guaranteed at a minimum of $198,333.33.Mr. Brown’s employment agreement also sets forth certain severance provisions that apply in the event that he is terminated without cause (as defined in his employment agreement), resigns for good reason (as defined in his employment agreement), or terminates employment as a result of death or disability. These payments are described in further detail in the section entitled “—Potential Payments Upon Termination or Change in Control” below and are subject to Mr. Brown’s execution and nonrevocation of a general release of claims and continued compliance with the restrictive covenants contained in his employment agreement. The employment agreement contains a number of restrictive covenants, including a 12-month post termination non-competition covenant, a 12-month post termination employee and business contact non-solicitation provision, and a mutual non-disparagement covenant.
None of the other NEOs is currently subject to an employment agreement with the Company or any of its subsidiaries.
Separation Agreements
Plamen Jordanoff
Forterra Pipe and Precast, LLC entered into a separation agreement with Mr. Jordanoff dated as of July 27, 2015, which provides for the payment of certain severance amounts and the provision of certain benefits. The key terms of this agreement are described below in the section entitled “—Potential Payments Upon Termination or Change in Control.”
Mark Conte
Forterra Pipe and Precast, LLC entered into a confidential separation agreement and full release of claims with Mr. Conte as of June 12, 2015. This agreement provided for the payment of certain severance amounts and the continued provision of medical, dental, and vision benefits through June 30, 2016. In addition, under the policies of Forterra Pipe and Precast, LLC, Mr. Conte was entitled to the payment of a pro-rated 2015 bonus based on the terms of the Annual Incentive Plan. The other key terms of this agreement are described below in the section entitled “—Potential Payments Upon Termination or Change in Control.”
Scott Szwejbka
Forterra Pipe and Precast, LLC entered into a confidential separation agreement and full release of claims with Mr. Szwejbka as of December 31, 2015. This agreement provides for the payment of certain separation benefits and the continued provision of medical, dental, and vision benefits through December 31, 2016, as described below in the section entitled “—Potential Payments Upon Termination or Change in Control.” In addition, Mr. Szwejbka was entitled to payment of his full fiscal year 2015 annual bonus based on the terms of the Annual Incentive Plan.
Detailed Discussion of 2015 Compensation Program
Base Salary
Our NEOs’ base salaries are established based on external market competitiveness, Company performance, individual performance, and internal equity. Pursuant to their respective employment
agreements and based upon arms’ length negotiations, the salaries for Messrs. Bradley and Brown were set at $800,000 and $350,000, respectively, for the 2015 fiscal year. At the start of 2015, the base salaries for Messrs. Carpenter and Ward were $267,800 and $242,098, respectively. Prior to their terminations, Messrs. Jordanoff’s, Conte’s and Szwejbka’s base salaries were $650,000, $302,508 and $300,000 respectively.
Generally, salaries are subject to annual review. However, at the time of the Acquisition, given the new duties relating to operating a stand-alone business, Mr. Jordanoff’s base salary was increased from $430,500 to $650,000. Similarly, based on the additional duties encompassed with operating as a stand-alone business, Mr. Carpenter’s base salary was increased to $280,000, Mr. Ward’s base salary was increased to $250,000, and Mr. Szwejbka’s base salary was increased to $275,000. Mr. Szwejbka’s base salary was again increased in October of 2015 to $300,000 in recognition of his expanded role and responsibilities in connection with the Cretex Acquisition.
As a result of the 2016 annual review process, and in recognition of Mr. Brown’s and Mr. Carpenter’s expanded duties and strong performance, their base salaries were increased to $400,000 and $300,000, respectively, for the 2016 fiscal year.
Annual Incentives
The Company maintains an Annual Incentive Plan in which full-time salaried employees, including each of our NEOs participates. For 2015, each NEO’s target and maximum annual bonus payouts under this plan were as follows:
NEO | Target Bonus (as a percentage of annual base salary) | Maximum Bonus (as a percentage of annual base salary) | ||||||
Jeffrey Bradley(1) | 100 | % | 200 | % | ||||
William Matthew Brown(1) | 100 | %(2) | 200 | % | ||||
Mark Carpenter | 50 | % | 100 | % | ||||
Charles L. Ward | 50 | % | 100 | % | ||||
Plamen Jordanoff | 100 | % | 200 | % | ||||
Mark Conte | 40 | % | 80 | % | ||||
Scott Szwejbka | 50 | % | 100 | % | ||||
| (1) | The bonus potentials for Messrs. Bradley and Brown were based upon their pro-rated base salary for the portion of 2015 during which they were employed by the Company. |
| (2) | As described above in the section entitled “—Employment Agreements,” per the terms of his employment agreement, Mr. Brown was guaranteed a minimum annual bonus of $198,333.33 for 2015. |
The Annual Incentive Plan for our 2016 fiscal year removes the maximum bonus provisions, allowing our NEOs to earn larger bonuses in the event of exceptional Company and individual performance.
For 2015, annual bonuses were earned based on the achievement of certain company-wide or, for NEOs primarily responsible for the oversight of a particular division, division-level financial performance metrics as well as the achievement of individual management by objectives, or MBOs, for all of the NEOs except Messrs. Bradley and Brown. The relative weighting of each performance target for the NEOs was as follows:
NEO | Financial Metric (Company-wide EBITDA(1)) | Financial Metric (North American EBITDA(2) ) | Financial Metric (Division- Specific EBITDA) | Personal MBOs | ||||||||||||
Jeffrey Bradley | 100 | % | — | — | — | |||||||||||
William Matthew Brown | 100 | % | — | — | — | |||||||||||
Mark Carpenter | — | 20 | % | 60 | % | 20 | % | |||||||||
Charles L. Ward | — | 20 | % | 60 | % | 20 | % | |||||||||
Plamen Jordanoff | 80 | % | — | — | 20 | % | ||||||||||
Mark Conte | 40 | % | — | — | 60 | % | ||||||||||
Scott Szwejbka | — | 20 | % | 60 | % | 20 | % | |||||||||
| (1) | Includes U.S., Eastern Canada and Forterra UK operations, which were part of our business during 2015. |
| (2) | Includes U.S. and Eastern Canada operations. |
Individual MBOs varied for each NEO, other than Messrs. Bradley and Brown, whose 2015 annual incentives were based entirely upon the achievement of Company-wide EBITDA targets. Individual MBOs included performance metrics such as achievement of various safety metrics, working capital targets or sales and costs goals and execution on key business projects relevant to the specific NEO’s primary area of responsibility.
Based on the achievement of these financial and individual performance objectives, final payouts under the 2015 Annual Incentive Plan were as follows for each NEO:
NEO | Actual Bonus Payout | |
Jeffrey Bradley | $534,795 | |
William Matthew Brown | $243,562 | |
Mark Carpenter | $268,450 | |
Charles L. Ward | $236,425 | |
Plamen Jordanoff | $1,083,333 (pursuant to separation and release agreement) | |
Mark Conte | $50,417.95 (pro-rated based on period employed) | |
Scott Szwejbka | $271,318 |
Long Term Incentive Plan
Following the Acquisition, Lone Star implemented a new cash-based long term incentive plan, the LSF9 Concrete Holdings Ltd. Long Term Incentive Plan, or the LTIP. Under the LTIP, participants are granted pool units entitling them, subject to the terms of the LTIP, to a potential cash payout upon a designated liquidity event.
Generally, for purposes of the LTIP, a liquidity event occurs when:
Concrete Holdings, an affiliate of ours, maintains, and is obligated for all payments under the LTIP. We are considered a successor entity of Concrete Holdings for purposes of the occurrence of a liquidity event under the LTIP. The LTIP was effective March 13, 2015. As of December 31, 2015, five of our NEOs, Messrs. Bradley, Brown, Carpenter, Jordanoff, and Szwejbka participated in the LTIP. In April of 2016, Mr. Carpenter received a revised award under the LTIP. In connection with the offering, we or one of our subsidiaries will become directly liable for any payment obligations triggered under the LTIP, but Concrete Holdings or one of its affiliates will remain obligated to make payments to us in amounts equal to any payment obligations triggered under the LTIP as and when such payment obligations are triggered under the LTIP.
During fiscal year 2015, Mr. Jordanoff was awarded 400,000 pool units under the LTIP, Mr. Bradley was awarded 350,000 pool units under the LTIP, Mr. Brown was awarded 100,000 pool units under the LTIP, and Mr. Szwejbka was awarded 50,000 units under the LTIP. In April 2016, Mr. Carpenter was awarded 80,000 pool units under the LTIP (superseding a prior June 2015 grant of 50,000 pool units). The total number of pool units authorized under the LTIP is 1,000,000. The LTIP will remain outstanding following this offering. While Concrete Holdings does not expect to increase the total number of pool units authorized under the LTIP, Concrete Holdings has made additional grants to other officers in 2016 and may make future limited grants under the LTIP.
Unless there is a payment owed under the terms of the LTIP on or before August 31, 2016, which is not currently anticipated, all of the pool units granted to Mr. Jordanoff will be forfeited on September 1, 2016 in accordance with the terms of his separation and release agreement. Pursuant to the terms of his award agreement, all of the pool units granted to Mr. Szwejbka were forfeited on June 30, 2016, in connection with his termination of employment in December 2015.
Of the units granted to Mr. Bradley, subject to his continued employment, 35,000 will become vested on each of the first, second and third anniversaries of the August 15, 2015 grant date and the remainder will only become vested upon the occurrence of a liquidity event in which Lone Star Fund IX (U.S.), L.P. and its affiliates have sold, transferred or otherwise disposed of all of their direct or indirect ownership interests in Concrete Holdings to an unrelated third party for cash while Mr. Bradley (or the relevant participant) is still employed by Forterra Pipe and Precast, LLC or an affiliate, such a liquidity event referred to as an Exit Transaction.
Of the units granted to Mr. Brown, subject to his continued employment 10,000 will become vested on the second anniversary of the August 26, 2015 grant date, 5,000 will become vested on each of the third and fourth anniversaries of the grant date, and the remainder will only become vested upon the occurrence of an Exit Transaction.
However, as described in the section entitled “Potential Payments Upon Termination or Change in Control” below, even vested pool units held by an LTIP participant will remain subject to forfeiture in the event of a termination for cause (as defined in their respective employment agreements) or in the event that no Exit Transaction occurs by the sixth anniversary of the grant date (or fifth anniversary of
the grant date for Mr. Brown) and the participant is no longer employed by Forterra Pipe and Precast, LLC or an affiliate.
The units granted to Mr. Carpenter are not subject to vesting provisions, but remain subject to forfeiture in the event of his failure to comply with certain restrictive covenants, including a
non-competition and non-solicitation provision, his termination of employment (although he may retain all pool units for six months following a termination without cause (as determined by the LTIP administrator)), or upon the occurrence of an Exit Transaction.
Under the LTIP, in the event of a Liquidity Event while the participant is still employed, the participant will be entitled to a payment based on the full number of his then outstanding pool units, whether or not vested at the time.
The value of a participant’s pool units is determined as of the closing date of each liquidity event relative to that participant’s interest in the incentive pool, calculated as the number of outstanding pool units (whether vested or unvested) held by the individual participant, divided by the aggregate number of pool units outstanding under the LTIP. The amount of profits credited to the incentive pool under the LTIP in connection with a liquidity event is based upon the cumulative internal rate of return (pursuant to the terms of the LTIP) realized upon a liquidity event by Concrete Holdings, direct and indirect equity holders immediately prior to this offering. In addition, the incentive pool will not be credited with any amounts and no payouts will be made unless such internal rate of return is at least 15%. Payments under the LTIP, if earned pursuant to the LTIP, are made in cash within sixty days after the closing of the applicable liquidity event. This offering is not expected to trigger any payouts under the LTIP.
The amount of profits that are credited to the LTIP incentive pool upon a liquidity event are summarized in the table and narrative below:
Cumulative IRR Achieved from Aggregate LE Cash | Percentage of the Incremental LE Profit Amount to be | |
14.99% or less | 0.0% | |
Over 15% up to 16.49% | 2.50% of excess over 15% | |
Over 16.5% up to 17.99% | 5.50% of excess over 16.5% | |
Over 18% up to 19.99% | 7.00% of excess over 18% | |
Over 20% up to 22.99% | 8.00% of excess over 20% | |
Over 23% up to 25.99% | 9.00% of excess over 23% | |
Over 26% up to 28.99% | 9.75% of excess over 26% | |
Over 29% up to 31.99% | 10.00% of excess over 29% | |
Over 32% up to 34.99% | 10.50% of excess over 32% | |
Over 35% up to 44.99% | 12.25% of excess over 35% | |
Over 45% | 5.00% of excess over 45% |
Upon a liquidity event, the incentive pool will be credited with an amount equal to the “LE Participation Amount,” which is to be a portion of the excess of:
(i) the sum of the net cash proceeds from the event causing the liquidity event actually received by Concrete Holdings’ direct and indirect equity owners net of transaction costs and expenses, or the LE Cash Received, plus all prior LE Cash Received (collectively with the current LE Cash Received, the Aggregate LE Cash Received), over
(ii) the beginning equity value (as defined in the LTIP) (such excess, the LE Profit Amount).
To determine such portion, Concrete Holdings will calculate a cumulative internal rate of return, or IRR (pursuant to the terms of the LTIP) with respect to the Aggregate LE Cash Received, which will be
determined separately as to each component of LE Cash Received so that the time of payment is taken into account in determining the rate of return. The incentive pool will not be credited unless and until the cumulative IRR equals or exceeds 15% but once the cumulative IRR equals or exceeds 15% then, the LE Participation Amount will be a varying percentage of the tranches of the LE Profit Amount that are required to achieve varying levels of Cumulative IRR, determined pursuant to the table above.
In the table above, the percentage in the right-hand column in any particular row is applied only to the portion of the LE Profit Amount attributable to the incremental cumulative IRR reflected in the left-hand column of such row.
Additional Compensation and Benefit Details
We do not provide our executives, including our NEOs, with special or supplemental retirement or health benefits. Our NEOs are eligible for retirement, health and welfare benefits under the same programs and subject to the same eligibility requirements that apply to our employees generally. We believe that all of the benefits made available to our NEOs are reasonable and are intended to help us attract and retain them.
We make automatic 401(k) contributions in the amount of 3% of covered compensation for each of our employees who participates in our 401(k) plan. We will also match any contributions that the employee makes in an amount of up to 3% of the employee’s covered compensation, subject to limitations on contributions set by applicable federal law. In addition, certain former participants in legacy defined benefit plans maintained by an affiliate of HeidelbergCement are entitled to additional Company contributions to our 401(k) plan each year. Prior to his termination, Mr. Conte was entitled to such contributions, and currently, only Mr. Ward is entitled to such contributions. However, Mr. Ward will no longer be entitled to these contributions following the Bricks Disposition. These are included in the “All Other Compensation��Compensation” column of the Summary Compensation Table below.
In Mr. Bradley’s employment agreement, Forterra Pipe and Precast, LLC agreed to pay all reasonable and documented expenses related to relocating Mr. Bradley to the Dallas/Fort Worth area in connection with his employment.
In connection with their employment, Messrs. Carpenter, Ward, and Szwejbka have been granted the use of automobiles leased by Forterra Pipe and Precast, LLC and Forterra Brick, LLC, respectively, as part of their fleet lease program, together with a fuel card that can be used for purchase of fuel for the vehicle. However, Mr. Ward will no longer be entitled to these benefits following the Bricks Disposition.
Summary Compensation Table
The following table summarizes the compensation of our NEOs for our fiscal year ended December 31, 2015.
Name and Principal Position | Year | Salary ($)(1) | Bonus ($)(2) | Non-Equity Incentive Plan Compensation ($)(3) | All Other Compensation ($)(4) | Total ($) | ||||||||||||||||||
Jeffrey Bradley | 2015 | 269,745 | — | 534,795 | — | 804,539 | ||||||||||||||||||
| Chief Executive Officer | ||||||||||||||||||||||||
William Matthew Brown | 2015 | 122,051 | 198,333 | 45,228 | — | 365,613 | ||||||||||||||||||
| Executive Vice President and Chief Financial Officer | ||||||||||||||||||||||||
Mark Carpenter, | 2015 | 276,442 | — | 268,450 | 26,820 | 571,712 | ||||||||||||||||||
| President & General Manager, Drainage Pipe & Products | ||||||||||||||||||||||||
Charles L. Ward, | 2015 | 248,025 | — | 236,425 | 13,554 | 498,003 | ||||||||||||||||||
| Senior Vice President & General Manager, Bricks | ||||||||||||||||||||||||
Plamen Jordanoff | 2015 | 472,805 | — | — | 1,780,116 | 2,252,921 | ||||||||||||||||||
| Former Chief Executive Officer | ||||||||||||||||||||||||
Mark Conte | 2015 | 131,862 | — | 50,418 | 325,635 | 507,915 | ||||||||||||||||||
| Former Chief Financial Officer | ||||||||||||||||||||||||
Scott Szwejbka, | 2015 | 270,750 | — | 271,318 | 342,961 | 885,029 | ||||||||||||||||||
| Former Senior Vice President Pipe & Precast | ||||||||||||||||||||||||
| (1) | Includes elective deferrals into our 401(k) plan. Salaries listed for Messrs. Bradley, Brown, Jordanoff, and Conte reflect the fact that each was only employed for a portion of the 2015 fiscal year. |
| (2) | Reflects guaranteed minimum bonus amount for our 2015 fiscal year per the terms of Mr. Brown’s employment agreement. The additional bonus he earned under the Annual Incentive Plan for fiscal year 2015 is reflected in the “Non-Equity Incentive Plan Compensation” column. |
| (3) | These amounts reflect payments under our Annual Incentive Program. The earned amount for Mr. Conte was pro-rated to reflect his separation from the Company on June 5, 2015. |
| (4) | The “All Other Compensation” column for 2015 includes, as applicable for each NEO: (a) Company contributions made by Forterra Pipe and Precast LLC or Forterra Brick, LLC under our 401(k) plan with respect to such period, (b) amounts paid to lease a Company vehicle under our fleet lease program described above, and (c) severance benefits accrued or paid under the NEO’s respective separation agreements, described further below in the section entitled “—Potential Payments upon Termination or Change-In-Control.” The amounts of each benefit included for each of our NEOs is reported in the table below. |
Name | Company Contributions to 401(k) Plan | Company Vehicle Payments | Severance Payments | |||||||||
Mark Carpenter | $ | 15,900 | $ | 10,920 | — | |||||||
Charles L. Ward | $ | 11,006 | $ | 2,547 | — | |||||||
Plamen Jordanoff | $ | 15,778 | $ | 12,495 | $ | 1,751,843 | ||||||
Mark Conte | $ | 23,127 | — | $ | 302,508 | |||||||
Scott Szwejbka | $ | 15,712 | $ | 9,033 | $ | 318,216 | ||||||
Grants of Plan-Based Awards Table
The following table sets forth information with respect to (1) the annual cash incentive bonuses awarded to each NEO for 2015, and (2) the LTIP awards granted to each NEO for 2015.
Name | Estimated Future Payouts under Non-Equity Incentive Plan Awards | |||||||||||
| Threshold ($) | Target ($) | Maximum ($) | ||||||||||
Jeffrey Bradley | ||||||||||||
Annual Incentive Plan | n/a | 267,397 | (1) | 534,795 | (1) | |||||||
LTIP | n/a | — | (2) | n/a | ||||||||
William Matthew Brown | ||||||||||||
Annual Incentive Plan | n/a | 121,781 | (3) | 243,562 | (3) | |||||||
LTIP | n/a | — | (2) | n/a | ||||||||
Mark Carpenter | ||||||||||||
Annual Incentive Plan | n/a | 150,000 | 300,000 | |||||||||
LTIP | n/a | — | (2) | n/a | ||||||||
Charles L. Ward | ||||||||||||
Annual Incentive Plan | n/a | 125,000 | 250,000 | |||||||||
Plamen Jordanoff | ||||||||||||
Annual Incentive Plan | 650,000 | 1,300,000 | ||||||||||
LTIP | n/a | — | (2) | n/a | ||||||||
Mark Conte | ||||||||||||
Annual Incentive Plan | n/a | 121,003 | 242,006 | |||||||||
Scott Szwejbka | ||||||||||||
Annual Incentive Plan | n/a | 150,000 | 300,000 | |||||||||
LTIP | n/a | — | (2) | n/a | ||||||||
| (1) | Mr. Bradley was entitled to a target bonus amount equal to 100% of his base salary and a maximum bonus amount equal to 200% of his base salary, pro-rated for his period of employment during fiscal year 2015. |
| (2) | Certain NEOs were granted the following number of pool units under the LTIP during fiscal year 2015, the terms of which are described in detail above in the section entitled “Detailed Discussion of 2015 Compensation Program—Long Term Incentive Plan.” The value of such awards cannot be determined at the time of grant. As noted above, Mr. Carpenter’s 2015 grant of 50,000 pool units was replaced with a grant of 80,000 pool units in April of 2016. The pool units granted to Mr. Szwejbka were forfeited on June 30, 2016 in connection with his termination of employment. Unless there is a payment obligation that arises under the terms of the LTIP, all of the pool units granted to Mr. Jordanoff will be forfeited on September 1, 2016 in accordance with the terms of his separation and release agreement. |
Named Executive Officer | Number of Pool Units | |||
Jeffrey Bradley | 350,000 | |||
William Matthew Brown | 100,000 | |||
Mark Carpenter | 50,000 | |||
Scott Szwejbka | 50,000 | |||
Plamen Jordanoff | 400,000 | |||
| (3) | Mr. Brown was entitled to a target bonus amount equal to 100% of his base salary and a maximum bonus amount equal to 200% of his base salary, pro-rated for his period of employment during fiscal year 2015. In addition, he was entitled to a minimum guaranteed bonus of $198,333.33 pursuant to the terms of his employment agreement. |
Potential Payments upon Termination or Change-in-Control
Jeffrey Bradley
Pursuant to his July 8, 2015 employment agreement, subject to execution and nonrevocation of a mutual general release of claims and continued compliance with the restrictive covenants contained in his employment agreement, which are described in the section entitled “—Employment Agreements” above, Mr. Bradley is entitled to the following benefits in the event of a termination of his employment by Forterra Pipe and Precast, LLC without cause (as defined in his employment agreement) or a resignation by Mr. Bradley for good reason (as defined in his employment agreement): (1) continued payment of his base salary for a period of 12 months post-termination; (2) payment of a pro-rated annual bonus for the year of termination, payable at the time bonuses for such year are paid to other executives; (3) payment of 100% of his target annual bonus in a single lump sum as of the date of termination; and (4) payment or reimbursement for the cost of up to 12 months of continuation coverage provided in accordance with the Consolidated Omnibus Budget Reconciliation Act (COBRA). In the event of Mr. Bradley’s death or disability, he, or his estate, as applicable, is entitled to a pro-rated annual bonus for the year of termination, payable at the time bonuses for such year are paid to other executives, and such additional payments, if any as determined by the Forterra Pipe and Precast, LLC board of directors in its sole discretion.
In addition, under his LTIP award agreement, in the event of a termination of employment for any reason other than cause (as defined in his employment agreement), Mr. Bradley is entitled to retain any vested pool units he holds as of his termination of employment for a period through the later of August 15, 2021, or the date of his termination of employment. None of Mr. Bradley’s LTIP pool units are currently vested.
Assuming Mr. Bradley’s employment was terminated as of December 31, 2015, the payments and benefits that would have been provided to him in connection with his separation would have been as follows:
| Base Salary Continuation | Pro-Rated 2015 Annual Bonus | Target Bonus | Health Care Coverage Continuation(1) | LTIP Units | Total | |||||||||||||||||||
Termination Without Cause or Resignation for Good Reason | $ | 800,000 | $ | 534,795 | $ | 800,000 | $ | 23,789 | All forfeit | $ | 2,158,584 | |||||||||||||
Death or Disability | N/A | $ | 534,795 | N/A | N/A | All forfeit | $ | 534,795 | ||||||||||||||||
| (1) | Based on applicable COBRA rates in effect under Forterra Pipe and Precast, LLC’s group health plan as of December 31, 2015. |
William Matthew Brown
Pursuant to his July 13, 2015 employment agreement, subject to execution and nonrevocation of a general release of claims and continued compliance with the restrictive covenants contained in his employment agreement, described in the section entitled “Employment Agreements” above, Mr. Brown is entitled to the following benefits in the event of a termination of his employment by Forterra Pipe and Precast, LLC without cause (as defined in his employment agreement) or a resignation by Mr. Brown for good reason (as defined in his employment agreement): (1) continued payment of his base salary for a period of 12 months post-termination; (2) payment of a pro-rated annual bonus for the year of termination, payable at the time bonuses for such year are paid to other executives; and (3) availability of continuation coverage in accordance with COBRA at the rates applicable to him immediately prior to termination for a period of 12 months post-termination. In the event of Mr. Brown’s death or disability, he, or his estate, as applicable, is entitled to payment of a pro-rated annual bonus for the year of
termination, payable at the time bonuses for such year are paid to other executives, and any other payment, if any, as determined by the Forterra Pipe and Precast, LLC board of directors in its sole discretion.
In addition, under his LTIP award agreement, in the event of a termination of employment for any reason other than cause (as defined in his employment agreement), Mr. Brown is entitled to retain any vested pool units he holds as of his termination of employment for a period through the later of August 26, 2020, or the date of his termination of employment. Moreover, in the event of his termination not for cause (as defined in his employment agreement) or resignation for good reason (as defined in his employment agreement), Mr. Brown will retain both his vested and unvested units for one year. None of Mr. Brown’s LTIP pool units are currently vested.
Assuming Mr. Brown’s employment was terminated as of December 31, 2015, the payments and benefits that would have been provided to him in connection with his separation would have been as follows:
| Base Salary Continuation | Pro-Rated 2015 Annual Bonus | Health Care Coverage Continuation(1) | LTIP Units | Total | ||||||||||||||||
Termination Without Cause or Resignation for Good Reason | $ | 350,000 | $ | 243,562 | $ | 18,255 | | Remain outstanding through December 31, 2016 | | $ | 611,817 | |||||||||
Death or Disability | N/A | $ | 243,562 | N/A | N/A | $ | 243,562 | |||||||||||||
| (1) | Based on applicable COBRA rates in effect under Forterra Pipe and Precast, LLC’s group health plan as of December 31, 2015. |
Mark Carpenter
Pursuant to an agreement dated May 9, 2014, between Mr. Carpenter and Lehigh Hanson, Inc., an affiliate of HeidelbergCement, Mr. Carpenter would have been entitled to continued payment of his base salary for a period of 12 months post-termination in the event of a termination of his employment by Forterra Pipe and Precast, LLC other than for cause prior to March 13, 2016. This agreement expired by its terms on March 13, 2016, and is no longer of any force or effect.
In addition, under the terms of our Annual Incentive Plan, in the event of Mr. Carpenter’s termination of employment as a result of retirement (after attaining age 55 and completing at least ten years of service), death, or disability, Mr. Carpenter, or his estate, as applicable, would have been entitled to payment of a pro-rated annual bonus for the year of termination, payable at the time bonuses for such year are paid to other executives.
Assuming Mr. Carpenter’s employment was terminated without cause as of December 31, 2015, the payments that would have been provided to him in connection with his separation would have been as follows.
| Base Salary Continuation | Pro-Rated 2015 Annual Bonus | LTIP Units(1) | Total | |||||||||||||
Termination Without Cause | $ | 300,000 | $ | 276,442 | | Remain outstanding through June 30, 2016 | | $ | 576,442 | |||||||
Retirement, Death, or Disability | N/A | $ | 276,442 | N/A | $ | 276,442 | ||||||||||
| (1) | Had he been terminated on December 31, 2015, the original 50,000 pool units granted to Mr. Carpenter would have remained outstanding through June 30, 2016. |
Charles L. Ward
Pursuant to an agreement dated May 9, 2014, between Mr. Ward and Lehigh Hanson, Inc., Mr. Ward would have been entitled to continued payment of his base salary for a period of 12 months post-termination in the event of a termination of his employment by Forterra Pipe and Precast, LLC other than for cause prior to March 13, 2016. This agreement expired by its terms on March 13, 2016, and is no longer of any force or effect.
In addition, under the terms of our Annual Incentive Plan, in the event of Mr. Ward’s termination of employment as a result of retirement (after attaining age 55 and completing at least ten years of service), death, or disability, Mr. Ward, or his estate, as applicable, would have been entitled to payment of a pro-rated annual bonus for the year of termination, payable at the time bonuses for such year are paid to other executives.
Assuming Mr. Ward’s employment was terminated without cause as of December 31, 2015, the payments that would have been provided to him in connection with his separation would have been as follows.
| Base Salary Continuation | Pro-Rated 2015 Annual Bonus | Total | ||||||||||
Termination Without Cause | $ | 250,000 | $ | 248,025 | $ | 498,025 | ||||||
Retirement, Death, or Disability | N/A | $ | 248,025 | $ | 248,025 | |||||||
Following the Bricks Disposition, the Company will be obligated to pay a pro-rated portion of Mr. Ward’s annual bonus, if any, based on the number of days in 2016 Mr. Ward was a Company employee. Mr. Ward will not receive any payments from or on behalf of the Company in connection with the Bricks Disposition.
Plamen Jordanoff
Pursuant to a separation and release agreement between Mr. Jordanoff and Forterra Pipe and Precast, LLC dated as of July 27, 2015, Mr. Jordanoff’s employment was terminated on September 1, 2015, and Forterra Pipe and Precast, LLC agreed to provide Mr. Jordanoff with the following severance payments and benefits: (1) continued payment of his annual base salary for a period of 12 months from his separation date; (2) payment of $1,083,333 in lieu of a pro-rated annual bonus for the 2015 fiscal year, payable at the same time 2015 annual bonuses were paid to other Company executives; (3) reimbursement of up to $75,000 in expenses actually incurred by Mr. Jordanoff in relocating outside of the state of Texas on or before March 1, 2017; and (4) continued provision of health care coverage at active employee rates for up to 12 months, which obligations ends on the date Mr. Jordanoff becomes eligible for coverage under a subsequent employer’s group health plan. In addition, the 400,000 pool units previously granted to Mr. Jordanoff under the LTIP are to remain outstanding through August 31, 2016, on which date all such pool units will be immediately forfeited. The continued payment and provision of such severance benefits is conditioned upon Mr. Jordanoff’s continued compliance with the confidentiality, intellectual property ownership, non-competition, non-solicitation, and non-disparagement covenants contained in his March 20, 2015 employment agreement with Forterra Pipe and Precast, LLC.
The aggregate amounts that were actually payable or may become payable to Mr. Jordanoff in connection with his separation are summarized in the table below:
Benefit | Base Salary Continuation | Pro-Rated 2015 Annual Bonus | Relocation Reimbursement | Health Care Coverage Continuation | LTIP Units | Total | ||||||||||||||||
Amount | $ | 650,000 | $ | 1,083,333 | Up to $ | 75,000 | $ | 18,510 | (1) | Remain outstanding through August 31, 2016 | $ | 1,826,843 | ||||||||||
| (1) | Based on applicable COBRA rates in effect under Forterra Pipe and Precast, LLC’s group health plan as of December 31, 2015. |
Mark Conte
Pursuant to a confidential separation agreement and full release of claims between Mr. Conte and Forterra Pipe and Precast, LLC executed as of June 12, 2015, Mr. Conte’s employment was terminated on June 5, 2015 and Forterra Pipe and Precast, LLC agreed to provide Mr. Conte with the following severance payments and benefits: (1) a lump sum payment in the amount of his annual base salary and (2) continued provision of medical, dental and vision coverage at active employee rates through June 30, 2016. Mr. Conte was not provided with continued health coverage in 2015 as he immediately commenced employment with another employer and was provided with coverage under that employer’s group health plan. In addition, under the terms of our Annual Incentive Plan, Mr. Conte was entitled to payment of a pro-rated annual bonus for 2015, payable at the time bonuses for such year were paid to other executives.
The aggregate amounts that were actually paid to Mr. Conte in connection with his separation are summarized in the table below:
Benefit | Base Salary Continuation | Pro-Rated 2015 Annual Bonus | Total | |||||||||
Amount | $ | 302,508 | 50,418 | $ | 352,926 | |||||||
| (1) | Based on applicable COBRA rates in effect under Forterra Pipe and Precast, LLC’s group health plan as of December 31, 2015. |
Scott Szwejbka
Pursuant to a confidential separation agreement and full release of claims between Mr. Szwejbka and Forterra Pipe and Precast, LLC executed as of December 31, 2015, Mr. Szwejbka’s employment was terminated on December 31, 2015 and Forterra Pipe and Precast, LLC agreed to provide Mr. Szwejbka with the following severance payments and benefits: (1) a lump sum payment in the amount of his annual base salary, less applicable taxes; and (2) continued provision of medical, dental and vision coverage at active employee rates through December 31, 2016. In addition, under the terms of our Annual Incentive Plan, Mr. Szwejbka was entitled to payment of his annual bonus for 2015, payable at the time bonuses for such year were paid to other executives.
In addition, the 50,000 pool units previously granted to Mr. Szwejbka under the LTIP were to remain outstanding through June 30, 2016, on which date all such pool units were immediately forfeited.
The aggregate amounts that were actually paid to Mr. Szwejbka in connection with his separation are summarized in the table below:
Benefit | Base Salary Continuation | 2015 Annual Bonus | Health Care Coverage Continuation | LTIP Units | Total | |||||||||||||
Amount | $ | 300,000 | $ | 271,318 | $ | 18,216 | (1) | Remain outstanding until June 30, 2016 | $ | 589,534 | ||||||||
| (1) | Based on applicable COBRA rates in effect under Forterra Pipe and Precast, LLC’s group health plan as of December 31, 2015. |
2016 Stock Incentive Plan
Prior to completion of this offering, we will adopt the Forterra, Inc. 2016 Stock Incentive Plan, or the 2016 Plan. The purpose of the 2016 Plan is to promote and closely align the interests of our
employees, officers, non-employee directors and other service providers and our stockholders by providing stock-based compensation and other performance-based compensation. The objectives of the 2016 Plan are to attract and retain the best available personnel for positions of substantial responsibility and to motivate participants to optimize the profitability and growth of the Company through incentives that are consistent with the Company’s goals and that link the personal interests of participants to those of the Company’s stockholders. The 2016 Plan allows for the grant of stock options, both incentive stock options and “non-qualified” stock options; stock appreciation rights, or SARs, alone or in conjunction with other awards; restricted stock and restricted stock units, or RSUs; and incentive bonuses, which may be paid in cash or stock or a combination thereof.
The following description of the 2016 Plan is not intended to be complete and is qualified in its entirety by the complete text of the 2016 Plan, a copy of which will be filed as an exhibit to the registration statement of which this prospectus forms a part. Stockholders and potential investors are urged to read the 2016 Plan in its entirety. Any capitalized terms which are used in this summary description but not defined here or elsewhere in this registration statement have the meanings assigned to them in the 2016 Plan.
Administration
The 2016 Plan will be administered by the compensation committee of the board of directors, or such other committee designated by the Company’s board of directors to administer the plan. The compensation committee has broad authority, subject to the provisions of the 2016 Plan, to administer and interpret the 2016 Plan. All decisions and actions of the compensation committee are final.
Stock Subject to 2016 Plan
The maximum number of shares that may be issued under the 2016 Plan will not exceed % of the number ofbe 5,000,000 shares, of our common stock outstanding immediately prior to the effectiveness of this registration statement, with the final number issuable to be determined by the board of directors, subject to certain adjustments in the event of a change in the Company’s capitalization. Shares of common stock issued under the 2016 Plan may be either authorized and unissued shares or previously issued shares acquired by the Company. On termination or expiration of an unexercised option, SAR or other stock-based award under the 2016 Plan, in whole or in part, the number of shares of common stock subject to such award will again become available for grant under the 2016 Plan.
Stock Options
All stock options granted under the 2016 Plan will be evidenced by a written agreement with the participant, which provides, among other things, whether the option is intended to be an incentive stock option or a non-qualified stock option, the number of shares subject to the option, the exercise price, exercisability (or vesting), the term of the option, which may not generally exceed ten years, and other terms and conditions. Subject to the express provisions of the 2016 Plan, options generally may be exercised over such period, in installments or otherwise, as the compensation committee may determine. The exercise price for any stock option granted may not generally be less than the fair market value of the common stock subject to that option on the grant date. The exercise price may be paid in cash or such other method as determined by the compensation committee, including an irrevocable commitment by a broker to pay over such amount from a sale of the shares issuable under an option, the delivery of previously owned shares and withholding of shares deliverable upon exercise. Other than in connection with a change in the Company’s capitalization, we will not, without stockholder approval, reduce the exercise price of a previously awarded option, and, at any time when the exercise price of a previously awarded option is above the fair market value of a share of common stock, we will not, without stockholder approval, cancel and re-grant or exchange such option for cash or a new award with a lower (or no) exercise price.
Stock Appreciation Rights
SARs may be granted alone or in conjunction with all or part of a stock option. Upon exercising a SAR, the participant is entitled to receive the amount by which the fair market value of the common stock at the time of exercise exceeds the exercise price of the SAR. This amount is payable in common stock, cash, restricted stock or a combination thereof, at the compensation committee’s discretion.
Restricted Stock and RSUs
The compensation committee may award restricted stock and RSUs. Awards of restricted stock consist of shares of stock that are transferred to the participant subject to restrictions that may result in forfeiture if specified conditions are not satisfied. RSUs result in the transfer of shares of cash or stock to the participant only after specified conditions are satisfied. The compensation committee will determine the restrictions and conditions applicable to each award of restricted stock or RSUs, which may include performance vesting conditions.
Incentive Bonuses
Each incentive bonus will confer upon the participant the opportunity to earn a future payment tied to the level of achievement with respect to one or more performance criteria established for a specified performance period. The compensation committee will establish the performance criteria and level of achievement versus these criteria that will determine the threshold, target and maximum amount payable under an incentive bonus, which criteria may be based on financial performance and/or personal performance evaluations. Payment of the amount due under an incentive bonus may be made in cash or shares, as determined by the compensation committee.
Performance Criteria
The compensation committee may specify certain performance criteria which must be satisfied before stock options, SARs, restricted stock, RSUs, and incentive bonuses will be granted or will vest. The performance goals may vary from participant to participant, group to group, and period to period.
Transferability
Awards generally may not be sold, transferred for value, pledged, assigned, or otherwise alienated or hypothecated by a participant other than by will or the laws of descent and distribution, and each option or SAR may be exercisable only by the participant during his or her lifetime.
Amendment and Termination
The board of directors has the right to amend, alter, suspend or terminate the 2016 Plan at any time, provided certain enumerated material amendments may not be made without stockholder approval. No amendment or alteration to the 2016 Plan or an award or award agreement will be made that would materially impair the rights of the holder, without such holder’s consent, however, no consent will be required if the compensation committee determines in its sole discretion and prior to the date of any change in control that such amendment or alteration either is required or advisable in order for us, the 2016 Plan or the award to satisfy any law or regulation or to meet the requirements of or avoid adverse financial accounting consequences under any accounting standard, or is not reasonably likely to significantly diminish the benefits provided under such award, or that any such diminishment has been adequately compensated. The 2016 Plan will be adopted by the board of directors and the Company’s sole equity holder in connection with this offering and will automatically terminate, unless earlier terminated by the board of directors, ten years after approval by the board of directors.
PRINCIPAL AND SELLING STOCKHOLDERS
The following table presents information concerning the beneficial ownership of the shares of our common stock as of the date of this prospectus by (1) each person known to us to beneficially own more than 5% of the outstanding shares of our common stock, (2) the selling stockholder, (3) each of our directors and named executive officers and (4) all of our directors and executive officers as a group. The table also contains information about beneficial ownership, as adjusted, to reflect the sale of common stock in this offering assuming:
Beneficial ownership is determined under the rules of the SEC and generally includes voting or investment power over securities. Except in cases where community property laws apply or as indicated in the footnotes to this table, we believe that each stockholder identified in the table possesses sole voting and investment power over all shares of common stock shown as beneficially owned by the stockholder. Shares of common stock subject to options and warrants that are exercisable or exercisable within 60 days of the date of this prospectus are considered outstanding and beneficially owned by the person holding the options for the purpose of computing the percentage ownership of that person but are not treated as outstanding for the purpose of computing the percentage ownership of any other person. Unless indicated below, the address of each individual listed below is c/o Forterra, Inc., 511 East John Carpenter Freeway, 6th Floor, Irving, TX 75062.
The selling stockholder may be deemed an underwriter in connection with this offering.
| ||||||||||||||||||||||||||||
| ||||||||||||||||||||||||||||
| ||||||||||||||||||||||||||||
| ||||||||||||||||||||||||||||
| ||||||||||||||||||||||||||||
| ||||||||||||||||||||||||||||
| ||||||||||||||||||||||||||||
| ||||||||||||||||||||||||||||
| ||||||||||||||||||||||||||||
| ||||||||||||||||||||||||||||
| ||||||||||||||||||||||||||||
| ||||||||||||||||||||||||||||
| ||||||||||||||||||||||||||||
| ||||||||||||||||||||||||||||
| ||||||||||||||||||||||||||||
| ||||||||||||||||||||||||||||
| ||||||||||||||||||||||||||||
| ||||||||||||||||||||||||||||
| ||||||||||||||||||||||||||||
| ||||||||||||||||||||||||||||
| ||||||||||||||||||||||||||||
| ||||||||||||||||||||||||||||
| ||||||||||||||||||||||||||||
Name of Beneficial Owner | Shares of common stock beneficially owned prior to this offering | Shares of common stock beneficially owned after this offering assuming no exercise of underwriters’ option | Shares of common stock beneficially owned after this offering assuming full exercise of underwriters’ option | |||||||||||||||||||||||||
| Shares of common stock | Percentage of Total Outstanding Common Stock (%) | Number of Shares Being Sold in this Offering assuming exercise of underwriters’ option | Shares of common stock | Percentage of Total Outstanding Common Stock (%) | Shares of common stock | Percentage of Total Outstanding Common Stock (%) | ||||||||||||||||||||||
5% Stockholder and Selling Stockholder | ||||||||||||||||||||||||||||
Forterra US Holdings, LLC(1) | 45,369,474 | 100 | % | 1,381,500 | 45,369,474 | 71.1 | % | 43,987,974 | 67.5 | % | ||||||||||||||||||
Named Executive Officers | ||||||||||||||||||||||||||||
Jeffrey Bradley(2)(3) | — | — | — | — | — | — | — | |||||||||||||||||||||
William Matthew Brown(3) | — | — | — | — | — | — | — | |||||||||||||||||||||
Mark Carpenter(3) | — | — | — | — | — | — | — | |||||||||||||||||||||
Charles L. Ward | — | — | — | — | — | — | — | |||||||||||||||||||||
Plamen Jordanoff | — | — | — | — | — | — | — | |||||||||||||||||||||
Mark Conte | — | — | — | — | — | — | — | |||||||||||||||||||||
Scott Szwejbka | — | — | — | — | — | — | — | |||||||||||||||||||||
Director andDirector Nominees | ||||||||||||||||||||||||||||
Kevin Barner(3) | — | — | — | — | — | — | — | |||||||||||||||||||||
Robert Corcoran(3) | — | — | — | — | — | — | — | |||||||||||||||||||||
Samuel D. Loughlin(3) | — | — | — | — | — | — | — | |||||||||||||||||||||
Clint McDonnough | — | — | — | — | — | — | — | |||||||||||||||||||||
John McPherson | — | — | — | — | — | — | — | |||||||||||||||||||||
Chris Meyer(3) | — | — | — | — | — | — | — | |||||||||||||||||||||
Jacques Sarrazin | — | — | — | — | — | — | — | |||||||||||||||||||||
Chadwick Suss(3) | ||||||||||||||||||||||||||||
Kyle Volluz(3) | — | — | — | — | — | — | — | |||||||||||||||||||||
Grant Wilbeck(3) | — | — | — | — | — | — | — | |||||||||||||||||||||
All directors, director nominees and executive officers as a group (18 persons) | — | — | — | — | — | — | — | |||||||||||||||||||||
| (1) |
| (2) | Mr. Bradley is also a Director. |
| (3) | Owns interests in entities which own direct or indirect non-controlling interests in |
CERTAIN RELATIONSHIPS AND RELATED PARTY TRANSACTIONS
Relationships with Lone Star and Affiliates
Lone Star currently owns all of our outstanding equity interests. Upon completion of this offering, Lone Star will own %71.1% of our outstanding common stock (or %67.5% if the underwriters exercise in full their option to purchase additional shares).
For as long as Lone Star and its affiliates continue to beneficially own shares of common stock representing more than a majority of the voting power of our common stock, they will be able to direct the election of all of the members of our board of directors and exercise a controlling influence over our business and affairs, including any determinations with respect to mergers or other business combinations, the acquisition or disposition of assets, the incurrence of indebtedness, the issuance of any additional common stock or other equity securities, the repurchase or redemption of common stock and the payment of dividends. Similarly, Lone Star will have the power to determine matters submitted to a vote of our stockholders without the consent of our other stockholders, will have the power to prevent a change in our control and could take other actions that might be favorable to them. See “Risk Factors.”
Lone Star is not subject to any contractual obligations to retain its controlling interest, except that it has agreed, subject to certain exceptions, not to sell or otherwise dispose of any shares of common stock for a period of 180 days after the date of this prospectus without the prior written consent of the representatives. Except for this period, there can be no assurance as to the period of time during which Lone Star will maintain its beneficial ownership of our common stock following this offering. See “Risk Factors.” Following this period, Lone Star will have rights to cause us to register its shares as described under “—Registration Rights Agreement” below.
Asset Advisory Agreement
Effective February 9, 2015, we entered into an Asset Advisory Agreement with Hudson Americas LLC and, for the limited purposes set forth in the agreement, Lone Star Fund IX (U.S.), L.P., both affiliates of our sole equityholder. Pursuant to the Asset Advisory Agreement, Hudson Americas provides us with certain oversight functions in connection with the management of our business and assets, including: (i) communicating and coordinating with our personnel and service providers; (ii) assisting and advising us in the pursuit of our strategic plan and managing our assets in furtherance of our strategic plan; and (iii) obtaining and maintaining all required licenses, permits, certificates, consents and other approvals with respect to our assets. In addition, Hudson Americas may, but is not required to, provide us with certain ancillary services, such as financial accounting and reporting, tax accounting, preparation and reporting, treasury, risk management, legal and compliance, record keeping and operating company oversight. Pursuant to the Asset Advisory Agreement, we pay Hudson Americas an amount equal to 110% of the actual costs of the manager and ancillary services or 110% of the hourly billing rates of the individual billing rates of the individuals performing such services, as applicable. The Asset Advisory Agreement is terminable by any party thereto upon 30 days’ notice from one party to the others for any reason or no reason. We paid an aggregate of $9.2 million and $0.9$3.1 million in fees under the Asset Advisory Agreement for the period from March 14, 2015 to December 31, 2015 and the threesix months ended March 31,June 30, 2016, respectively.
We expect to terminate the Asset Advisory Agreement in connection with the consummation of the offering.
Registration Rights Agreement
We will enter into a registration rights agreement with Lone Star in connection with the consummation of this offering. The terms of the registration rights agreement will include provisions for demand registration rights and piggyback registration rights in favor of Lone Star. The registration rights agreement will not provide for the payment of any consideration by us to Lone Star if a registration statement for the resale of shares of common stock held by Lone Star is not declared effective or if the effectiveness is not maintained. We expect that 45,369,474 shares of our common stock will be entitled to these registration rights following completion of this offering (or 43,987,974 shares if the underwriters exercise in full their option to purchase additional shares). However, the underwriting agreement and lock-up agreements prohibit us from a filing any registration statement for the resale of shares of common stock held by Lone Star for a period of 180 days after the date of this prospectus without the prior consent of the representatives. Shares registered with the SEC pursuant to these registrations rights will be eligible for sale in the public markets, subject to the lock-up agreements described in the section entitled “Underwriting.” See “Shares Eligible for Future Sale—Registration Rights Agreement.”
Tax Receivable Agreement
In connection with this offering,the Reorganization, we will enter into the tax receivable agreement with Lone Star. We and our subsidiaries have generated, or are expected to generate, the Pre-IPOCovered Tax Benefits, which may reduce the actual liability for certain taxes that we might otherwise be required to pay. These Covered Tax Benefits include: (i) all depreciation and amortization deductions, and any offset to taxable income and gain or increase to taxable loss, resulting from the tax basis that we have in our assets as of the time of the consummation of this offering, (ii) the utilization of our and our subsidiaries net operating losses and tax credits, if any, attributable to periods prior to this offering, (iii) deductions in respect of payments made, funded or reimbursed by an initial party to the tax receivable agreement (other than us or one of our subsidiaries) or an affiliate thereof to participants under the LTIP, (iv) deductions in respect of transaction expenses attributable to the U.S. Pipe Acquisition and (v) certain other tax benefits attributable to payments made under the tax receivable agreement. The tax receivable agreement provides for payments to Lone Star in an amount equal to %85% of the aggregate reduction in U.S. federal, state, local and non-U.S. income taxes payable realized by us and our subsidiaries (using an assumed combined state and local income tax rate of 5%) from the utilization of such Pre-IPOCovered Tax Benefits.
The obligations under the tax receivable agreement will be our obligations and not obligations of our subsidiaries and are not conditioned upon Lone Star maintaining a continued direct or indirect ownership interest in us. For purposes of the tax receivable agreement, the aggregate reduction in income tax payable by us will be computed by comparing our actual income tax liability with our hypothetical liability (using an assumed combined state and local income tax rate of 5%) had we not been able to utilize the Pre-IPO Tax Benefits. The agreement will become effective upon the completion of this offering and will remain in effect until all such Pre-IPOCovered Tax Benefits, taking into account several assumptions and adjustments, including, for example, that
The foregoing assumptions and adjustments could cause us to be required to make payments under the tax receivable agreement that are significantly greater than the benefits we realize in respect of the Covered Tax Benefits.
The tax receivable agreement will become effectivebinding upon us upon the completion of this offering and will remain in effect until all such Pre-IPOCovered Tax Benefits have been used or expired, unless the agreement is terminated early, as described below.
We expect that the payments we make under the tax receivable agreement could be substantial. Assuming no material changes in the relevant tax law, and that we and our subsidiaries earn sufficient taxable income to realize the full tax benefits subject to the tax receivable agreement, we expect that future payments under the tax receivable agreement will total between approximately $$114.0 million and $ million.$124.0 million (excluding any payments that may be made to Lone Star under the tax receivable agreement as a result of tax benefits recognized in connection with payments under the LTIP). Depending on the amount and timing of our future earnings (if any) and on other factors, including the effect of any limitations imposed on our ability to use the Pre-IPOCovered Tax Benefits, it is possible that all payments required under the tax receivable agreement could become due within a relatively short period of time. The actual amount and utilization of the Pre-IPOCovered Tax Benefits, as well as the amount and timing of any payments under the tax receivable agreement, will vary depending upon a number of factors, including the amount, character, and timing of our and our subsidiaries’ taxable income in the future.
Payments under the tax receivable agreement are generally due within a specified period of time following the filing of our tax return for the taxable year with respect to which the payment obligation
arises, but interest on such payments will begin to accrue at a rate of LIBOR plus 100 basis points from the due date (without extensions) of such tax return. Late payments will generally accrue interest at a rate of LIBOR plus 500 basis points.
The tax receivable agreement provides that if, at any time, we elect an early termination of the tax receivable agreement with approval of a majority of our independent directors and with Lone Star’s consent, we are in material breach of our obligations under the agreement, or certain credit events described in the tax receivable agreement occur with respect to us (including a breach of the leverage covenant described below), we would be required to make an immediate payment equal to the present value of the anticipated future tax benefits to Lone Star. Such payment would be based on certain valuation assumptions, including the assumption that we and our subsidiaries have sufficient taxable income and tax liabilities to fully utilize such tax benefits. We may elect to completely terminate the tax receivable agreement early only with the written approval of Lone Star. The tax receivable agreement also provides that upon certain mergers, asset sales, other forms of business combinations or other changes of control, our (or our successor’s) payments under the tax receivable agreement for each taxable year after any such event would be based on certain valuation assumptions, including the assumption that we and our subsidiaries have sufficient taxable income to fully utilize the Pre-IPOCovered Tax Benefits. Accordingly, payments under the tax receivable agreement may be made years in advance of the actual realization, if any, of the anticipated future tax benefits and may be significantly greater than the benefits we realize in respect of the tax attributes subject to the tax receivable agreement.
In addition, were the Internal Revenue Service to successfully challenge the availability or amount of any of the Pre-IPOCovered Tax Benefits, Lone Star would not reimburse us for any payments previously made under the tax receivable agreement, but future payments under the tax receivable agreement, if any, would be netted against any unreimbursed payments to reflect the result of any such successful challenge by the Internal Revenue Service. As a result, we could make payments under the tax receivable agreement in excess of our actual cash savings in income tax.
We have full responsibility and sole discretion over all tax matters concerning the Company. However, we will be required to notify Lone Star of any audit by a taxing authority, the outcome of
which is reasonably expected to affect Lone Star’s rights under the tax receivable agreement. We will not have the right to enter into any settlement of such an audit without the consent of Lone Star.Star (not to be unreasonably withheld, conditioned or delayed).
For so long as the tax receivable agreement remains outstanding, we are restricted from entering into any agreement that would be materially more restrictive with respect to our ability to make payments under the tax receivable agreement than the terms of our credit agreements to be entered into in connection with the refinancing of our existing indebtedness at the time of this offering or, unless permitted by the terms of such credit agreements or any replacement credit agreements to the extent the terms thereof are no less restrictive in this regard than the applicable credit agreement it replaced, incurring debt that would cause our consolidated net leverage ratio (the ratio of consolidated funded indebtedness less unrestricted cash to consolidated EBITDA) to exceed a certain specified ratio, in each case without the prior written consent of Lone Star (not to be unreasonably withheld, conditioned or delayed).
Certain risks related to the tax receivable agreement are discussed in greater detail above in the section entitled “Risk Factors.”
Loan to Bricks Business
In connection with the Bricks Disposition, we expect to make a short-term loan to our former bricks business for working capital purposes. We expect that a loan of up to $15 million will be made on or after the time of the Reorganization at an interest rate of 5% per annum. The loan, if made, will be due on December 31, 2016, and may be prepaid without premium or penalty.
Executive Officer and Director Indemnification Agreements
Our amended and restated bylaws will permit us to indemnify our executive officers and directors to the fullest extent permitted by law, subject to limited exceptions. We will enter into indemnification agreements with each of our executive officers and directors prior to the consummation of this offering that will provide, in general, that we will indemnify them to the fullest extent permitted by law in connection with their service to us or on our behalf.
Review and Approval of Related Party Transactions
We will implement a written policy in connection with this offering pursuant to which the audit committee will review and approve transactions with our directors, officers and holders of more than 5% of our voting securities and their affiliates. Prior to approving any transaction with a related party, the audit committee will consider the material facts as to the related party’s relationship with us or interest in the transaction. Related party transactions will not be approved unless the audit committee has approved of the transaction. We did not have a formal review and approval policy for related party transactions at the time of any transaction described above.
The following is a summary of the material provisions of our capital stock, as well as other material terms of our amended and restated certificate of incorporation and our amended and restated bylaws, each of which as will be in effect as of the consummation of this offering. This summary does not purport to be complete and is subject to and qualified in its entirety by our amended and restated certificate of incorporation and our amended and restated bylaws, copies of which will behave been filed as exhibits to the registration statement of which this prospectus is a part.
General
Upon consummation of this offering, ourOur authorized capital stock will consistconsists of 190,000,000 shares of common stock, par value $0.001 per share, and 10,000,000 shares of preferred stock, par value $0.001 per share.
Common Stock
Our amended and restated certificate of incorporation will authorizeauthorizes the issuance of up to 190,000,000 shares of common stock. All outstanding shares of common stock are validly issued, fully paid and nonassessable, and the shares of common stock to be issued in connection with this offering will be validly issued, fully paid and nonassessable.
The holders of our common stock will beare entitled to one vote per share on all matters submitted to a vote of stockholders and our amended and restated certificate of incorporation willdoes not provide for cumulative voting in the election of directors. Subject to preferences that may be applicable to any outstanding series of preferred stock, the holders of our common stock will receive ratably any dividends declared by our board of directors out of funds legally available for the payment of dividends. In the event of our liquidation, dissolution or winding-up, the holders of our common stock will be entitled to share ratably in all assets remaining after payment of or provision for any liabilities, subject to prior distribution rights of preferred stock, if any, then outstanding.
Preferred Stock
Our amended and restated certificate of incorporation will provideprovides that our board of directors has the authority, without further action by the stockholders, to issue up to 10,000,000 shares of preferred stock. Our board of directors will beis able to issue preferred stock in one or more series and determine the rights, preferences, privileges, qualifications and restrictions granted to or imposed upon our preferred stock, including dividend rights, conversion rights, voting rights, rights and terms of redemption, liquidation preferences and sinking fund terms, any or all of which may be greater than the rights of our common stock. Issuances of preferred stock could adversely affect the voting power of holders of our common stock and reduce the likelihood that holders of our common stock will receive dividend payments and payments upon liquidation. Any issuance of preferred stock could also have the effect of decreasing the market price of our common stock and could delay, deter or prevent a change in control of our company. Our board of directors does not presently have any plans to issue shares of preferred stock.
Limitations on Directors’ Liability
Our governing documents will limit the liability of, and require us to indemnify, our directors to the fullest extent permitted by the DGCL. The DGCL permits a corporation to limit or eliminate a director’s
personal liability to the corporation or the holders of its capital stock for breach of fiduciary duty. This limitation is generally unavailable for acts or omissions by a director which (i) were not in good faith, (ii) were the result of intentional misconduct or a knowing violation of law, (iii) the director derived an improper personal benefit from (such as a financial profit or other advantage to which the director was not legally entitled) or (iv) breached the director’s duty of loyalty. The DGCL also prohibits limitations on director liability under Section 174 of the DGCL, which relates to certain unlawful dividend declarations and stock repurchases. The limitation of liability and indemnification provisions in our amended and restated certificate of incorporation and amended and restated bylaws may discourage stockholders from bringing a lawsuit against directors for breach of their fiduciary duties. These provisions may also have the effect of reducing the likelihood of derivative litigation against directors and officers, even though such an action, if successful, might otherwise benefit us and our stockholders. In addition, your investment may be adversely affected to the extent we pay the settlement costs and damage awards against directors and officers pursuant to these indemnification provisions.
We maintain insurance that insures our directors and officers against certain losses and which insures us against our obligations to indemnify the directors and officers. We also intend to enter into indemnification agreements with our directors and executive officers.
Exclusive Forum Clause
Our amended and restated certificate of incorporation will provideprovides that, unless we consent in writing to the selection of an alternative forum, to the fullest extent permitted by law, the sole and exclusive forum for any stockholder (including any beneficial owner) to bring (i) any derivative action or proceeding brought on our behalf, (ii) any action asserting a claim of breach of a fiduciary duty owed by any of our directors, officers or employees to us or to our stockholders, (iii) any action asserting a claim arising pursuant to any provision of the DGCL or our certificate of incorporation or bylaws, or (iv) any action asserting a claim governed by the internal affairs doctrine, will be a state court located within the State of Delaware (or, if no state court located within the State of Delaware has jurisdiction, the federal district court for the District of Delaware); in all cases subject to such court having personal jurisdiction over the indispensable parties named as defendants. Any person or entity purchasing or otherwise acquiring any interest in shares of our capital stock is deemed to have notice of and consented to the foregoing provisions. See “Risk Factors—Our certificate of incorporation includes an exclusive forum clause, which could limit our stockholders’ ability to obtain a favorable judicial forum for disputes with us.”
Delaware Takeover Statute
Under our amended and restated certificate of incorporation, we will opthave opted out of the provisions of Section 203 of the DGCL regulating corporate takeovers. This section prevents certain Delaware corporations, under certain circumstances, from engaging in a “business combination” with a stockholder who owns 15% or more of our outstanding voting stock, or an Interested Stockholder, an affiliate of an Interested Stockholder or an associate of an Interested Stockholder, in each case for three years following the date that the stockholder became an Interested Stockholder.
Provisions of Our Certificate of Incorporation and Bylaws to be Adopted and Delaware Law That May Have an Anti-Takeover Effect
Provisions of the DGCL and our amended and restated certificate of incorporation and amended and restated bylaws could make it more difficult to acquire our company by means of a tender offer, a proxy contest or otherwise, or to remove incumbent officers and directors. These provisions,
summarized below, are intended to discourage coercive takeover practices and inadequate takeover bids and to encourage persons seeking to acquire control of us to first negotiate with our board of directors. We believe that the benefits of these provisions outweigh the disadvantages of discouraging certain takeover or acquisition proposals because, among other things, negotiation of these proposals could result in an improvement of their terms and enhance the ability of our board of directors to maximize stockholder value. However, these provisions may delay, deter or prevent a merger or acquisition of us that a stockholder might consider is in its best interest, including those attempts that might result in a premium over the prevailing market price of our common stock.
Requirements for Advance Notification of Stockholder Meetings, Nominations and Proposals
Our amended and restated bylaws will provide that special meetings of the stockholders may be called only by or at the direction of the board of directors, the chairman of our board or the chief executive officer with the concurrence of a majority of the board of directors. Our amended and restated bylaws will prohibit the conduct of any business at a special meeting other than as specified in the notice for such meeting. These provisions may have the effect of deferring, delaying or discouraging hostile takeovers, or changes in control or management of our company.
Our amended and restated bylaws will establish advance notice procedures with respect to stockholder proposals and the nomination of candidates for election as director. In order for any matter to be “properly brought” before a meeting, a stockholder will have to comply with such advance notice procedures and provide us with certain information. Our amended and restated bylaws will allow the presiding officer at a meeting of stockholders to adopt rules and regulations for the conduct of meetings which may have the effect of precluding the conduct of certain business at a meeting if such rules and regulations are not followed. These provisions may also defer, delay or discourage a potential acquirer from conducting a solicitation of proxies to elect the acquirer’s own slate of directors or otherwise attempting to influence or obtain control of our company.
Supermajority Voting for Amendments to Our Governing Documents
Any amendment to our amended and restated certificate of incorporation will requirerequires the affirmative vote of at least 66 2/3% of the voting power of all shares of our common stock then outstanding. Our amended and restated certificate of incorporation will provideprovides that the board of directors is expressly authorized to adopt, amend or repeal our bylaws and that our stockholders may amend our bylaws only with the approval of at least 66 2/3% of the voting power of all shares of our common stock then outstanding.
No Cumulative Voting
The DGCL provides that a stockholder’s right to vote cumulatively in the election of directors does not exist unless the certificate of incorporation specifically provides otherwise. Our amended and restated certificate of incorporation willdoes not provide for cumulative voting.
Classified Board of Directors
Our amended and restated certificate of incorporation will provideprovides that our board of directors will initially be divided into three classes of directors, with the classes to be as nearly equal in number as possible, designated Class I, Class II and Class III. Class I directors shall initially serve until the first annual meeting of stockholders following the effectiveness of our amended and restated certificate of incorporation; Class II directors shall initially serve until the second annual meeting of stockholders following the effectiveness of our amended and restated certificate of incorporation; and Class III directors shall initially serve until the third annual meeting of stockholders following the effectiveness of
our amended and restated certificate of incorporation. Commencing with the first annual meeting of stockholders following the effectiveness of our amended and restated certificate of incorporation and ending with the third annual meeting of stockholders thereafter, directors of each class the term of which shall then expire shall be elected to hold office for a three-year term. Beginning with the fourth annual meeting of stockholders following the effectiveness of our amended and restated certificate of incorporation, directors of each class the term of which shall then expire shall be elected to hold office for a one-year term. The classification of directors will have the effect of making it more difficult for stockholders to change the composition of our board of directors. Our amended and restated certificate of incorporation will provideprovides that the number of directors will be fixed from time to time exclusively pursuant to a resolution adopted by the board of directors, but must consist of not less than threetwo or more than 15 directors.
Removal of Directors; Vacancies
Our amended and restated certificate of incorporation provides and our amended and restated bylaws will provide that (i) prior to the date on which Lone Star and its affiliates cease to beneficially own, in the aggregate, at least a majority of the voting power of all outstanding shares entitled to vote generally in the election of directors, directors may be removed with or without cause upon the affirmative vote of holders of at least a majority of the voting power of all the then outstanding shares of stock entitled to vote generally in the election of directors, voting together as a single class and (ii) on and after the date Lone Star and its affiliates cease to beneficially own, in the aggregate, at least a majority of the voting power of all outstanding shares entitled to vote generally in the election of directors, directors may be removed only for cause and only upon the affirmative vote of holders of at least 66 2/3% of the voting power of all the then outstanding shares of stock entitled to vote generally in the election of directors, voting together as a single class. In addition, our amended and restated certificate of incorporation provides and our amended and restated bylaws will provide that any newly created directorships and any vacancies on our board of directors will be filled only by the affirmative vote of the majority of remaining directors.
Stockholder Action by Written Consent
The DGCL permits any action required to be taken at any annual or special meeting of the stockholders to be taken without a meeting, without prior notice and without a vote if a consent or consents in writing, setting forth the action so taken, is signed by the holders of outstanding stock having not less than the minimum number of votes that would be necessary to authorize or take such action at a meeting at which all shares of stock entitled to vote thereon were present and voted, unless the certificate of incorporation provides otherwise. Our amended and restated certificate of incorporation precludes and our amended and restated bylaws will preclude stockholder action by written consent after the date on which Lone Star and its affiliates cease to beneficially own, in the aggregate, at least a majority of the voting power of all outstanding shares of our stock entitled to vote generally in the election of directors.
Limitations on Liability and Indemnification of Officers and Directors
The DGCL authorizes corporations to limit or eliminate the personal liability of directors to corporations and their stockholders for monetary damages for breaches of directors’ fiduciary duties as directors. Our amended and restated certificate of incorporation includes and our amended and restated bylaws will include provisions that eliminate, to the extent allowable under the DGCL, the personal liability of directors or officers for monetary damages for actions taken as a director or officer, as the case may be. Our amended and restated certificate of incorporation provides and our amended and restated bylaws will also provide that we must indemnify and advance reasonable expenses to our directors and officers to the fullest extent authorized by the DGCL. We will also be expressly authorized to carry directors’ and officers’ insurance for our directors, officers and certain employees for certain liabilities.
The limitation of liability and indemnification provisions in our amended and restated certificate of incorporation and amended and restated bylaws may discourage stockholders from bringing a lawsuit against directors for breach of their fiduciary duty. These provisions may also have the effect of reducing the likelihood of derivative litigation against directors and officers, even though such an action, if successful, might otherwise benefit our company and our stockholders. In addition, your investment may be adversely affected to the extent that, in a class action or direct suit, we pay the costs of settlement and damage awards against directors and officers pursuant to these indemnification provisions.
There is currently no pending litigation or proceeding involving any of our directors, officers or employees for which indemnification is being sought.
Authorized but Unissued Shares
Our authorized but unissued shares of common stock and preferred stock will be available for future issuance without your approval. The DGCL does not require stockholder approval for any issuance of authorized shares. However, the applicable stock exchange listing requirementsNASDAQ rules require stockholder approval of certain issuances equal to or exceeding 20% of the then-outstanding voting power or the then-outstanding number of shares of common stock. No assurances can be given that our shares will remain so listed. We may use additional shares for a variety of corporate purposes, including future public offerings to raise additional capital, corporate acquisitions and employee benefit plans. As discussed above, our board of directors has the ability to issue preferred stock with voting rights or other preferences, without stockholder approval. The existence of authorized but unissued shares of common stock and preferred stock could render more difficult or discourage an attempt to obtain control of our company by means of a proxy contest, tender offer, merger or otherwise.
Corporate Opportunities and Transactions with Lone Star
In recognition that principals, members, directors, managers, partners, stockholders, officers, employees and other representatives of Lone Star and its affiliates (other than us) and affiliated investment funds, which we refer to as the Lone Star entities, may serve as our directors or officers, and that the Lone Star entities may engage in similar activities or lines of business that we do, our amended and restated certificate of incorporation will provideprovides for the allocation of certain corporate opportunities between us and the Lone Star entities. Specifically, none of the Lone Star entities or any principal, member, director, manager, partner, stockholder, officer, employee or other representative of the Lone Star entities has any duty to refrain from engaging directly or indirectly in the same or similar business activities or lines of business that we do. In the event that any Lone Star entity acquires knowledge of a potential transaction or matter which may be a corporate opportunity for itself and us, we will not have any expectancy in the corporate opportunity, and no Lone Star entity will have any duty to communicate or offer the corporate opportunity to us and may pursue or acquire such corporate opportunity for itself or direct such opportunity to another person. In addition, if one of our directors or officers who is also a principal, member, director, manager, partner, stockholder, officer, employee or other representative of any Lone Star entity acquires knowledge of a potential transaction or matter which may be a corporate opportunity for us and a Lone Star entity, we will not have any expectancy in the corporate opportunity unless the corporate opportunity is expressly offered to the person solely in his or her capacity as one of our directors or officers. See “Risk Factors.”
In recognition that we may engage in material business transactions with the Lone Star entities, from which we are expected to benefit, our amended and restated certificate of incorporation will provideprovides that any of our directors or officers who are also principals, members, directors, managers,
partners, stockholders, officers, employees or other representatives of any Lone Star entity will have fully satisfied and fulfilled his or her fiduciary duty to us and our stockholders with respect to such transaction, if:
By becoming a stockholder in our company, you will be deemed to have received notice of and consented to these provisions of our amended and restated certificate of incorporation.
Transfer Agent and Registrar
The Transfer Agent and Registrar for our common stock is .will be American Stock Transfer & Trust Company, LLC.
Listing
We intend to applyhave applied to list our common stock on NASDAQ under the symbol “ .”“FRTA.”
DESCRIPTION OF CERTAIN INDEBTEDNESS
Set forth below is summary of certain terms of our existing indebtedness. These summaries are not complete and are qualified in their entirety by reference to the complete text of the applicable agreement, copies of which have been filed as exhibits to the registration statement of which this prospectus forms a part.
Revolver
On March 13, 2015, LSF9 and Concrete Holdings, entered into a revolving asset-based credit agreement, or the Initial ABL Credit Agreement, with Stardust Finance Holdings, Inc., or Stardust, as initial borrower, the additional revolving borrowers party thereto, the several banks and other financial institutions party thereto as lenders, Bank of America, N.A., as successor to Credit Suisse AG, as administrative agent, and Bank of America, N.A., as collateral agent. The Initial ABL Credit Agreement was subsequently amended by the First Amendment, dated as of April 1, 2015, the Notice of Additional Revolving Borrower and Assumption Agreement, dated as of October 1, 2015, the Incremental Facility Amendment, dated as of November 10, 2015, the Agreement of Resignation, Appointment and Acceptance, dated as of April 13, 2016, the Second Amendment and Consent, dated as of April 13, 2016, and the Notice of Additional Revolving Borrower and Assumption Agreement, dated as of April 15, 2016. We refer to the Initial ABL Credit Agreement, as amended and supplemented by the foregoing, as the ABL Credit Agreement. Each of LSF9, Concrete Holdings and Stardust are affiliates of ours and of Lone Star.
The ABL Credit Agreement provides for an asset based senior secured revolving loan facility, or the Revolver, for aggregate maximum borrowings (subject to availability under a borrowing base) of up to $285.0 million, with up to $60.0 million thereof available for the issuance of letters of credit. Interest accrues on outstanding borrowings at a rate equal to LIBOR plus a margin ranging from 1.50% to 2.00% per annum, or at an alternate base rate plus a margin ranging from 0.50% to 1.00% per annum, in each case, depending on the average excess availability under the Revolver for the most recently completed calendar quarter. The Revolver also carries an unused facility fee ranging from 0.250% to 0.375% per annum, depending on the average excess availability under the Revolver for the most recently completed calendar quarter. Subject to certain exceptions, the Revolver is subject to mandatory prepayment and/or cash collateralization of letters of credit if outstanding extensions of credit exceed the borrowing base. The amount of the mandatory prepayment is the amount by which outstanding extensions of credit under the Revolver exceed the then-current borrowing base. The Revolver matures in March 2020. As of March 31,June 30, 2016, there was $22.0 million ofwere $0 borrowings and $16.3$22.6 million of letters of credit outstanding under the Revolver, resulting in available capacity under the Revolver of $209.9$262.4 million.
Guarantees; Security
The obligations of Stardust and the additional revolving borrowers under the Revolver are guaranteed by LSF9, Concrete Holdings, Stardust and each of Concrete Holdings’ direct and indirect wholly owned subsidiaries other than immaterial subsidiaries, unrestricted subsidiaries and certain other exceptions. The Revolver and the guarantees thereunder are secured by security interests in all of the capital stock of all direct subsidiaries and substantially all other tangible and intangible assets of Stardust, the additional revolving borrowers and each guarantor thereunder, subject in each case to certain exceptions. The liens securing the Revolver have priority over the liens securing the Senior Term Loan and Junior Term Loan, each as described below, with respect to the “ABL Priority Collateral,” which consists of Stardust’s, the additional revolving borrowers’ and each guarantor’s current assets such as inventory, receivables, deposit and other accounts, cash and certain related assets, but are subordinated to the liens securing the Senior Term Loan and Junior Term Loan with
respect to the “Term Loan Priority Collateral,” which consists of Stardust’s, the additional revolving borrowers’ and each guarantor’s fixed assets such as material real property, intellectual property, equipment and fixtures and general intangibles, including equity interests in subsidiaries, and substantially all of the other assets of Stardust and the guarantors, other than ABL Priority Collateral.
Covenants
The ABL Credit Agreement contains a number of customary covenants, including those that limit or restrict the ability of us and our restricted subsidiaries to, among other things: dispose of certain assets; incur or guarantee additional indebtedness; enter into new lines of business; make investments, intercompany loans or certain payments in respect of indebtedness; incur or maintain liens; modify certain terms of our or their organizational documents, certain agreements or certain debt instruments; declare or pay dividends or make other restricted payments (including redemption of our stock); engage in certain transactions with affiliates; enter into certain sale leaseback transactions; and engage in mergers, consolidations, or the sale or disposition of substantially all of its assets. The ABL Credit Agreement also includes a financial covenant requiring a consolidated fixed charge coverage ratio for the most recent period of four consecutive fiscal quarters to be no less than 1.00:1.00, which financial covenant is only tested if excess availability under the Revolver falls below a certain threshold. At March 31,June 30, 2016, we were in compliance with all covenants set forth in the ABL Credit Agreement.
Events of Default
The ABL Credit Agreement contains a number of events of default related to, among other things, the non-payment of principal, interest or fees; violations of covenants; material inaccuracy of representations or warranties; certain bankruptcy events; certain events under the Employee Retirement Income Security Act of 1974, as amended; invalidity of guarantees or security interests; default in payment under or the acceleration of other indebtedness; material judgments; and certain change of control events.
Senior Term Loan Facility
On March 13, 2015, LSF9 and Concrete Holdings entered into a senior lien term loan credit agreement with Stardust, the several banks and other financial institutions from time to time party thereto as lenders, and Credit Suisse AG as administrative agent and as collateral agent. We refer to this agreement, as amended by the First Incremental Facility Amendment, dated as of October 1, 2015, and the Second Incremental Facility Amendment, dated as of June 17, 2016, as the Senior Lien Credit Agreement.
The Senior Lien Credit Agreement, the First Incremental Facility and the Second Incremental Facility provided for term loans in the maximum principal amounts of $635.0 million, $240.0 million and $345.0 million, respectively, totaling $1.2 billion, collectively, the Senior Term Loan. Interest accrues on outstanding borrowings under the Senior Term Loan at a rate equal to LIBOR (with a floor of 1.0%) plus a margin of 5.50% per annum, or at an alternate base rate plus a margin of 4.50% per annum. Subject to certain exceptions, the Senior Term Loan is subject to mandatory prepayment with the net cash proceeds of asset sales, insurance and condemnation recovery events, excess cash flow and certain incurrences of additional indebtedness and refinancing events. The Senior Term Loan matures in March 2022. As of March 31,June 30, 2016, there was $468.0$1,001.7 million of borrowings outstanding under the Senior Term Loan, though $345.0 million of additional Senior Term Loan was issued on June 17, 2016.Loan.
Guarantees; Security
The obligations under the Senior Term Loan are guaranteed by LSF9, Concrete Holdings, and each of Concrete Holdings’ direct and indirect wholly owned subsidiaries other than immaterial subsidiaries, unrestricted subsidiaries and certain other exceptions. The Senior Term Loan and the guarantees thereunder are secured by security interests in all of the capital stock of all direct subsidiaries and substantially all other tangible and intangible assets of Stardust and the guarantors, subject in each case to certain exceptions and in each case whether then existed or later acquired. The liens securing the Senior Term Loan have priority over the liens securing the Junior Term Loan and the Revolver with respect to Term Loan Priority Collateral, but are subordinated to the liens securing the Revolver with respect to ABL Priority Collateral.
Covenants
The Senior Lien Credit Agreement contains a number of customary covenants, including those that limit or restrict the ability of us and our restricted subsidiaries to, among other things: dispose of certain assets; incur or guarantee additional indebtedness; enter into new lines of business; make investments, intercompany loans or certain payments in respect of indebtedness; incur or maintain liens; modify certain terms of our and their organizational documents, certain agreements or certain debt instruments; declare or pay dividends or make other restricted payments (including redemption of our stock); engage in certain transactions with affiliates; enter into certain sale leaseback transactions; or engage in mergers, consolidations, or the sale or disposition of substantially all of its assets. At March 31,June 30, 2016, we were in compliance with all covenants under the Senior Lien Credit Agreement.
Events of Default
The Senior Lien Credit Agreement contains a number of events of default related to, among other things, the non-payment of principal, interest or fees; violations of certain covenants contained in the Senior Lien Credit Agreement and related loan documents; material inaccuracy of representations or warranties; certain bankruptcy events; certain events under the Employee Retirement Income Security Act of 1974, as amended; invalidity of guarantees or security interests; material judgments; default in payment under or the acceleration of other indebtedness; and certain change of control events
Junior Term Loan Facility
On March 13, 2015, LSF9 and Concrete Holdings entered into a junior lien credit agreement with Stardust, the several banks and other financial institutions from time to time party thereto as lenders, and Credit Suisse AG as administrative agent and as collateral agent, or the Junior Lien Credit Agreement. The Junior Lien Credit Agreement provides for term loans in the aggregate maximum principal amount of $260.0 million, or the Junior Term Loan. Interest accrues on outstanding borrowings under the Junior Term Loan at a rate equal to LIBOR (with a floor of 1.0%) plus a margin of 9.50% per annum, or at an alternate base rate plus a margin of 8.50% per annum. The Junior Term Loan is subject to substantially the same mandatory prepayment requirements as the Senior Term Loan. Prepayments in respect of the Junior Term Loan are subject to a prepayment premium of 3.0% of the aggregate term loans being so prepaid for any prepayments made on or prior to March 13, 2017 and 1.0% of the aggregate term loans being so prepaid for any prepayments made after such date and on or prior to March 13, 2018. Subject to certain exceptions, the Junior Term Loan is subject to mandatory prepayment with the net cash proceeds of asset sales, insurance and condemnation recovery events, excess cash flow and certain incurrences of additional indebtedness and refinancing events. The Junior Term Loan matures in March 2023. As of March 31,June 30, 2016, there was $237.3$238.1 million of borrowings outstanding under the Junior Term Loan.
Guarantees; Security
The obligations under the Junior Term Loan are guaranteed by the same guarantors as under the Senior Term Loan. The Junior Term Loan and the guarantees thereunder are secured by security interests in the same collateral securing Senior Term Loan. The liens securing the Junior Term Loan are subordinated to the liens securing the Senior Term Loan with respect to Term Loan Priority Collateral and subordinated to the liens securing the Revolver and the Senior Term Loan with respect to ABL Priority Collateral.
Covenants
The Junior Lien Credit Agreement contains substantially the same covenants as the Senior Lien Credit Agreement. At March 31,June 30, 2016, we were in compliance with all covenants under the Junior Term Loan.
Events of Default
The Junior Lien Credit Agreement contains substantially the same events of default as the Senior Lien Credit Agreement.
Refinancing
In connection withUpon completion of this offering, we expect to enter into a new asset based revolving credit facility for our working capital, transaction costs and general corporate uses and a new senior term loansloan facility, the proceeds of which, together with a portion of the proceeds of this offering, will be used to repay in full and revolving lines of credit that will replaceterminate the existing Revolver, the Senior Term Loan Facility and Junior Term Loan Facility. We expect to launch the syndication of these new facilities contemporaneously with the launch of this offering and the terms described below may change before the facility agreements are entered into with the new lenders. It is a condition to the consummation of this offering that we either complete the financing under these new facilities or receive consents from our current lenders, as consummation of this offering would otherwise result in events of default under the terms of our existing Revolver, Senior Term Loan Facility and Junior Term Loan.Loan Facility. While we expect that the financing under the new facilities will be completed concurrently with this offering, there can be no assurances that we will be able to consummate the financing in a timely manner or obtain any requested consents from our current lenders under our existing Revolver, Senior Term Loan Facility and Junior Term Loan Facility, in which event we will not be able to complete this offering.
The new revolving credit facility is expected to mature on the date that is five years after the closing date and to provide for asset based revolving loans in an aggregate principal amount of up to $300.0 million, with subfacilities of up to $280.0 million to be made available to the Company and the other U.S. borrowers and up to $20.0 million to be made available to the Canadian borrowers (subject to change under certain circumstances). The facility will also provide for the issuance of letters of credit of up to a sublimit to be agreed. Borrowings under the new revolving credit facility may not exceed a borrowing base equal to the sum of (i) 100% of our eligible cash, (ii) 85% of eligible accounts receivable and (iii) the lesser of (a) 75% of eligible inventory and (b) 85% of the orderly liquidation value of eligible inventory, with the US and Canadian borrowings being subject to separate borrowing base limitations. The advance rates for accounts and inventory are subject to increase by 2.5% during certain periods. Subject to the conditions thereto in the documentation for the new revolving credit facility, we expect that the facility may be increased by up to the greater of $100.0 million and such amount as would not cause the borrowing base under the new revolving credit facility to be exceeded by more than $50.0 million. We expect that interest will accrue on outstanding borrowings at a rate equal to LIBOR or CDOR plus a margin ranging from 1.25% to 1.75% per annum, or at an alternate base rate, Canadian prime rate or Canadian base rate plus a margin ranging from 0.25% to 0.75% per
annum, in each case, based upon the average excess availability under the new revolving credit facility for the most recently completed calendar quarter. The obligations of the borrowers under the new revolving credit facility will be guaranteed by the Company and its direct and indirect wholly-owned restricted subsidiaries other than certain excluded subsidiaries (with such exclusions to be substantially consistent with the existing Revolver); provided that the obligations of the US borrowers will not be guaranteed by the Canadian subsidiaries. Security for the new revolving credit facility will be substantially consistent with the security package provided for the existing Revolver; provided that the obligations of the US borrowers will not be secured by any liens on more than 65% of the voting stock of the Canadian subsidiaries or assets of the Canadian subsidiaries. The facility will otherwise contain representations and warranties, covenants, events of default and other terms consistent with or generally less restrictive than the existing Revolver.
The new senior term loan facility is expected to provide for $1.0 billion in senior secured term loans to be made available to a newly formed direct subsidiary of the Company and to be drawn in full at closing. Subject to the conditions thereto in the documentation for the new senior term loan facility, the facility may be increased by (i) up to the greater of $285.0 million and 1.0x consolidated EBITDA of the Company and its restricted subsidiaries for the four quarters most recently ended prior to such incurrence plus (ii) the aggregate amount of any voluntary prepayments, plus (iii) an additional amount, provided certain financial tests are met. The new senior term loan facility is expected to mature on the date that is seven years after the closing date and to be subject to quarterly amortization equal to 0.25% of the initial principal amount thereof. Interest is expected to accrue on outstanding borrowings thereunder at a rate equal to LIBOR (with a floor of 1.0%) or alternate base rate, in each case plus a margin to be determined in syndication. The new senior term loans may be issued at a price less than par. The obligations of the borrower under the new senior term loan facility will be guaranteed by the Company and each of its direct and indirect material wholly-owned domestic subsidiaries other than certain excluded subsidiaries (with such exclusions expected to be substantially consistent with those of the existing Senior Term Loan Facility). The obligations under the new senior term loan facility will not be guaranteed by the Canadian subsidiaries. Security for the new senior term loan facility is expected to be consistent with the security package provided for the existing Senior Term Loan Facility; provided that the obligations under the new senior term loan facility will not be secured by any liens on more than 65% of the voting stock of the Canadian subsidiaries or assets of the Canadian subsidiaries. The new senior term loan facility is expected to otherwise contain representations and warranties, covenants, events of default and other terms consistent with or generally less restrictive than the existing Senior Term Loan Facility.
Sale Leaseback
On April 5, 2016, we entered into sale leaseback transactions with the U.S. Property Buyer and the Canadian Property Buyer pursuant to which we sold 41 U.S. manufacturing/industrial warehouse properties and a sale leaseback transaction with the Canadian Property Buyer and the Canadian Property Lessor pursuant to which we sold six Canadian manufacturing/industrial warehouse properties respectively, for an aggregate purchase price of approximately $204.3 million. On April 14, 2016, we sold an additional two manufacturing/industrial warehouse properties to the U.S. Property Buyer for an aggregate purchase price of approximately $11.9 million. In connection with the sales, we agreed to lease each property back from the respective purchaserU.S. Property Buyer or the Canadian Property Lessor, as applicable, pursuant to a master lease governing the properties located in the United States, as amended, or the U.S. Master Lease and a master lease governing the properties located in Canada, or the Canadian Master Lease.
Under the terms of the U.S. Master Lease, we lease the U.S. properties through April 4, 2036, unless the U.S. Master Lease is terminated earlier in accordance with its terms. We also have a right to extend the term of the U.S. Master Lease for a period of nine year and 11 months, subject to certain terms and conditions specifically set forth in the US Master Lease. Our initial base rent under the U.S. Master Lease is $13.4 million per annum, payable monthly, subject to an annual 2% increase. If we
elect to extend the term of the U.S. Master Lease, our base rent for the first year of the extension will be the greater of 95% of the fair market rental value of the properties and an amount equal to 102% of the prior year’s base rent, subject to an annual increase based on changes in the Consumer Price Index, but capped at 4%. The U.S. Master Lease restricts our use of the U.S. properties to heavy manufacturing, industrial and other related uses. We are only able to sublease or assign the U.S. properties under the U.S. Master Lease with prior written consent and subject to certain restrictions. The terms of the Canadian Master Lease, pursuant to which we lease the Canadian properties, are similar as those of the U.S. Master Lease described above except that the initial base rent under the Canadian Master Lease is $3.5 million (CAD) per annum.
Our continuing indemnification obligations under the purchase agreements are guaranteed by LSF9Concrete Holdings in favor of each purchaser.the U.S. Property Buyer and the Canadian Property Lessor, as applicable. With the exception of any claims resulting from our fraud, our aggregate liability in connection with our representations, warranties, indemnifications, covenants or other obligations are $5.0 million under the U.S. purchase agreements and $5.0 million (CAD) under the Canadian purchase agreement.
At lease inception of the Sale Leaseback, we (as the seller-lessee) arewere considered to have a form of prohibited “continuing involvement” with the properties because we provideprovided each of the respective purchaserU.S. Property Buyer (as the buyer-lessor) with respect to the U.S. Master Lease and the Canadian Property Lessor (as the lessor) with respect to the Canadian Master Lease with a guarantee that serves as additional collateral that reduces the buyer-lessor’s or the lessor’s, as applicable, risk of loss. As a result, we are precluded from applying sale-leaseback accounting to the Sale Leaseback, and we have accounted for the transaction as a financing obligation. The assets subject to the Sale Leaseback remain on the balance sheet and continue to be depreciated over their remaining useful lives as a “failed sale-leaseback”. However, we expecthave entered into agreements to subsequently replace the current guarantor, LSF9,Concrete Holdings, with the Company as the new guarantor, withineffective immediately following completion of the next 12 monthsReorganization, which would,will, at that time, allow the Sale Leaseback to qualify for sales recognition and be classified as an operating lease.
SHARES ELIGIBLE FOR FUTURE SALE
Prior to this offering, there has been no public market for our common stock. Immediately following the consummation of the offering, we will have an aggregate of 63,789,474 shares of common stock outstanding. Of the outstanding shares, the 18,420,000 shares sold in this offering (or 19,801,500 shares if the underwriters exercise in full their option to purchase additional shares) will be freely tradable without restriction or further registration under the Securities Act, except that any shares held by our affiliates, as that term is defined in Rule 144 of the Securities Act, may generally be sold only in compliance with the limitations described below. The remaining outstanding shares of our common stock will be deemed restricted securities, as defined in Rule 144. We expect that Lone Star will be considered an affiliate of ours after this offering based on its expected share ownership and representation on our board of directors. Certain other of our stockholders may also be considered affiliates at that time.
We cannot predict what effect, if any, sales of shares of our common stock from time to time or the availability of shares of our common stock for future sale may have on the market price of our common stock. Sales of substantial amounts of common stock, or the perception that such sales could occur, could adversely affect prevailing market prices for our common stock and could impair our future ability to raise capital through an offering of equity securities or otherwise. See “Risk Factors.”
Lock-Up Agreements
We, our officers and directors and the holder of all of our outstanding shares of common stock immediately prior to this offering will be subject to lock-up agreements with the underwriters that will restrict the sale of shares of our common stock held by them for 180 days after the date of this prospectus, subject to certain exceptions, as described in the section entitled “Underwriting.”
Sales of Restricted Securities
Other than the shares sold in this offering, all of the remaining shares of our common stock outstanding following the consummation of the offering will be available for sale, subject to the lock-up agreements described above, after the date of this prospectus in registered sales or pursuant to Rule 144 or another exemption from registration. Restricted shares may be sold in the public market only if registered or if they qualify for an exemption from registration, including under Rule 144 promulgated under the Securities Act, which is summarized below.
In general, under Rule 144, a person who is not our affiliate and has not been our affiliate at any time during the preceding three months will be entitled to sell any shares of our common stock beneficially owned thereby for at least one year without regard to the volume limitations summarized below. However, such non-affiliate need only have beneficially owned such shares to be sold for at least six months if we have been subject to the reporting requirements of the Exchange Act for at least 90 days at the time of such sale and there is adequate current public information about us available. In either case, a non-affiliate may include the holding period of any prior owner other than an affiliate of ours.
Beginning 90 days after the date of this prospectus, our affiliates who have beneficially owned shares of our common stock for at least six months, including the holding period of any prior owner other than one of our affiliates, would be entitled to sell within any three-month period a number of shares that does not exceed the greater of: (i) 1% of the number of shares of our common stock then-outstanding, which will equal approximately 637,895 shares immediately after the consummation of this offering; and (ii) the average weekly trading volume in our common stock on NASDAQ during the applicable stock
exchange during the four calendar weeks preceding the date of filing of a Notice of Proposed Sale of Securities Pursuant to Rule 144 with respect to the sale. Sales under Rule 144 by our affiliates are also subject to manner of sale provisions and notice requirements and to the availability of current public information about us.
As a result of the provisions of Rule 144, additional shares will be available for sale in the public market upon the expiration or, if earlier, the waiver of the lock-up period provided for in the lock-up agreements, subject, in some cases, to volume limitations.
Additional Registration Statements
In addition, 5,000,000 shares of common stock may be granted under our stock incentive plan. See “Executive Compensation—2016 Stock Incentive Plan.” We intend to file one or more registration statements under the Securities Act after this offering to register up to 5,000,000 shares of our common stock issued or reserved for issuance under our 2016 Stock Plan and any future equity incentive plans. These registration statements will become effective upon filing, and shares covered by these registration statements will be eligible for sale in the public market immediately after the effective dates of these registration statements, subject to any vesting restrictions and limitations on exercise under the applicable equity incentive plan, the lock-up agreements described in “Underwriting” and, with respect to affiliates, limitations under Rule 144.
Registration Rights Agreement
Prior to the consummation of this offering, we will enter into a registration rights agreement with Lone Star. The terms of the registration rights agreement will include provisions for demand registration rights and piggyback registration rights in favor of Lone Star. Demand registration rights require that, subject to the terms of the registration rights agreement, Lone Star will have the right to require that we register its shares under the Securities Act for sale to the public. Piggyback registration rights allow Lone Star to include its shares in any registration that we effect under the Securities Act, other than a registration effected pursuant to an exercise of demand registration rights, subject to specified exceptions. We must pay all expenses, except for underwriters’ discounts and commissions, incurred in connection with the exercise of these registration rights. The registration rights agreement will not provide however for the payment of any consideration by us to Lone Star if a registration statement for the resale of shares of common stock held by Lone Star is not declared effective or if the effectiveness is not maintained.
Immediately following consummation of this offering, all shares of our common stock held by Lone Star will be entitled to these registration rights. Shares registered with the SEC pursuant to these registration rights will be eligible for sale in the public markets upon effectiveness of the registration statement covering those shares. However, the underwriting agreement and lock-up agreements prohibit us from filing any registration statement for the resale of shares of common stock held by Lone Star for a period of 180 days after the date of this prospectus without the prior consent of the representatives. By exercising its registration rights and causing a large number of shares to be registered and sold in the public market, Lone Star could cause the price of the common stock to fall. In addition, any demand to include these shares in our registration statements could have a material adverse effect on our ability to raise needed capital. See “Risk Factors.”
U.S. FEDERAL TAX CONSIDERATIONS FOR NON-U.S. HOLDERS
The following is a general discussion of certain U.S. federal income tax consequences of the acquisition, ownership, and disposition of our common stock purchased pursuant to this offering by a non-U.S. holder. As used in this prospectus, the term “non-U.S. holder” means a beneficial owner of 5% or less of our common stock that, for U.S. federal income tax purposes, is an individual, corporation, estate or trust and is not any of the following:
An individual who is not a citizen of the United States may, subject to certain restrictions as well as limitations contained in any applicable income tax treaties, be deemed to be a resident of the United States by reason of being present in the United States for at least 31 days in the calendar year and an aggregate of at least 183 days during a three year period ending in the current calendar year (counting for such purposes all of the days present in the current year, one-third of the days present in the immediate preceding calendar year and one sixth of the days present in the second preceding calendar year). U.S. residents are generally taxed for U.S. federal income tax purposes in the same manner as U.S. citizens.
This discussion assumes that you will hold our common stock issued pursuant to this offering as a capital asset within the meaning of the Internal Revenue Code of 1986, as amended, or the Code (i.e., generally, property held for investment). This discussion does not address all aspects of U.S. federal taxation that may be relevant to a particular non-U.S. holder in light of the holder’s individual investment or tax circumstances, or to non-U.S. holders that are subject to special tax rules. In addition, this description of U.S. tax consequences does not address:
If a partnership (or other entity or arrangement treated as a partnership for U.S. federal income tax purposes) is a beneficial owner of our common stock, the treatment of a partner in the partnership generally will depend upon the status of the partner and the activities of the partnership. A beneficial owner of our common stock that is a partnership and partners in such a partnership should consult their tax advisors regarding the U.S. federal income tax consequences of acquiring, owning, and disposing of our common stock.
This discussion is based on current provisions of the Code, final, temporary and proposed U.S. Treasury regulations, judicial opinions, published positions of the U.S. Internal Revenue Service, or IRS, and other applicable authorities, all as in effect on the date hereof and all of which are subject to differing interpretations or change, possibly with retroactive effect. We have not sought, and will not seek, any ruling from the IRS or any opinion of counsel with respect to the tax consequences discussed herein, and there can be no assurance that the IRS will not take a position contrary to the tax consequences discussed below or that any position taken by the IRS would not be sustained.
We strongly urge you to consult your tax advisor regarding the U.S. federal tax consequences of acquiring, owning or disposing our common stock, as well as any tax consequences that may arise under the laws of any foreign, state, local or other taxing jurisdiction or under any applicable tax treaty.
Dividends
We have no present intention to pay dividends on our common stock. However, if distributions of cash or property (other than certain stock distributions) are made to non-U.S. holders on shares of our common stock, such distributions generally will constitute dividends for U.S. federal income tax purposes to the extent paid from our current or accumulated earnings and profits, as determined under U.S. federal income tax principles. Distributions in excess of earnings and profits will constitute a return of capital that is applied against and reduces the non-U.S. holder’s adjusted tax basis in our common stock. Any remaining excess will be treated as gain realized on the sale or other disposition of the common stock and will be treated as described under “—Gain on Sale, Exchange or Other Taxable Disposition of Common Stock” below.
Dividends paid to a non-U.S. holder that are not effectively connected with the non-U.S. holder’s conduct of a trade or business in the United States generally will be subject to withholding of U.S. federal income tax at the rate of 30% or such lower rate as may be specified by an applicable income tax treaty. Non-U.S. holders should consult their tax advisors regarding their entitlement to benefits under an applicable income tax treaty and the requirements for and manner of claiming the benefits of such treaty (including, without limitation, the need to obtain a U.S. taxpayer identification number).
If the non-U.S. holder is engaged in a trade or business in the United States, either directly or through an entity treated as a partnership for U.S. tax purposes, and the dividends are effectively connected with the conduct of such trade or business, and, if provided in an applicable income tax treaty, are dividends attributable to a permanent establishment or fixed base maintained by the non-U.S. holder in the United States, then the dividends are not subject to the U.S. withholding tax, but instead are subject to U.S. federal income tax on a net income basis at applicable graduated U.S. federal income tax rates and in the manner applicable to U.S. persons. Certain certification and disclosure requirements must be complied with for effectively connected income or income attributable to a permanent establishment to be exempt from withholding. Any effectively connected dividends or dividends attributable to a permanent establishment received by a non-U.S. holder that is treated as a foreign corporation for U.S. tax purposes may be subject to an additional “branch profits tax” at a 30% rate, or such lower rate as may be specified by an applicable income tax treaty.
To claim the benefit of a tax treaty or an exemption from withholding because dividends are effectively connected with the conduct of a trade or business in the United States, a non-U.S. holder generally must provide to the withholding agent a properly executed IRS Form W-8BEN or W-8BEN-E, as applicable, (or successor form) for treaty benefits or IRS Form W-8ECI (or successor form) for effectively connected income, before the payment of dividends, and, if claiming the benefit of a tax treaty, generally must certify under penalties of perjury on the appropriate forms that such non-U.S. holder is not a U.S. person and is eligible for treaty benefits. These forms may need to be periodically updated. Non-U.S. holders may obtain a refund of any excess amounts withheld by timely filing an appropriate claim for refund along with the required information. Special certification rules apply to certain partnerships and trusts. Accordingly, a non-U.S. holder that is a foreign partnership or a foreign trust is urged to consult its own tax advisor regarding its status under U.S. tax law and the certification requirements applicable to it.
Gain on Sale, Exchange or Other Taxable Disposition of Common Stock
A non-U.S. holder generally will not be subject to U.S. federal income tax, including by way of withholding, on gain recognized on a sale, exchange or other taxable disposition of our common stock unless any one of the following applies:
| 1. | The non-U.S. holder is a nonresident alien individual who is present in the United States for 183 days or more in the taxable year of the sale, exchange or other taxable disposition and certain other requirements are met; |
| 2. | The gain is effectively connected with the non-U.S. holder’s conduct of a trade or business in the United States, directly or through an entity treated as a partnership for U.S. tax purposes and, if an applicable tax treaty requires, attributable to a U.S. permanent establishment or fixed base of such non-U.S. holder; or |
| 3. | We are or have been, at any time during the five-year period preceding such disposition (or the non-U.S. holder’s holding period, if shorter) a “United States real property holding corporation,” within the meaning of Section 897(c)(2) of the Code, unless our common stock is regularly traded on an established securities market and the non-U.S. holder holds no more than 5% of our outstanding common stock, directly or indirectly, during the relevant period. Generally, a United States corporation is treated as a United States real property holding corporation within the meaning of Section 897(c)(2) of the Code if the fair market value of its United States real property interests equals or exceeds 50% of the sum of the fair market value of its worldwide real property interests plus its other assets used or held for use in a trade or business. |
| We believe that we have not been and are not currently a United States real property holding corporation, and we do not expect to become a United States real property holding corporation. However, no assurances can be made in this regard. Furthermore, no assurances can be provided that our stock will be considered to be regularly traded on an established securities market for this purpose. |
Non-U.S. holders described in clause (1) above are taxed on their gains (including gains from sales of our common stock and net of applicable U.S. losses from sales or exchanges of other capital assets incurred during the year) at a flat rate of 30% or such lower rate as may be specified by an applicable income tax treaty. Non- U.S. holders described in clause (2) or (3) above will be subject to tax on the net gain derived from the sale under regular graduated U.S. federal income tax rates and in the manner applicable to U.S. persons, unless an applicable income tax treaty provides otherwise. If a non-U.S. holder described in clause (2) is a corporation, it may be subject to the additional branch profits tax at a rate equal to 30% of its effectively connected earnings and profits or at such lower rate
as may be specified by an applicable income tax treaty. In addition, if we are determined to be a United
States real property holding corporation and our common stock is not regularly traded on an established securities market, then a purchaser may be required to withhold 15% of the proceeds payable to a non-U.S. holder from a sale or other taxable disposition of our common stock.
Foreign Account Tax Compliance Act
Withholding taxes may be imposed under Sections 1471 to 1474 of the Code, the Treasury Regulations promulgated thereunder and other official guidance (commonly referred to as “FATCA”) on certain types of payments made to non-U.S. financial institutions and certain other non-U.S. entities. Specifically, a 30% withholding tax may be imposed on dividends on, or gross proceeds from the sale or other disposition of, our common stock paid to a “foreign financial institution” or a “non-financial foreign entity” (each as defined in the Code), unless those entities comply with certain requirements under the Code and applicable U.S. Treasury regulations, which requirements may be modified by an “intergovernmental agreement” entered into between the United States and an applicable foreign country. Future Treasury Regulations or other official guidance may modify these requirements.
Under the applicable Treasury Regulations, withholding under FATCA generally applies to payments of dividends on our common stock, and the IRS has announced that FATCA withholding will apply to payments of gross proceeds from the sale or other disposition of such stock on or after January 1, 2019. The FATCA withholding tax will apply to all withholdable payments without regard to whether the beneficial owner of the payment would otherwise be entitled to an exemption from imposition of withholding tax pursuant to an applicable tax treaty with the United States. Under certain circumstances (including, for example, where an applicable tax treaty applies), a holder might be eligible for refunds or credits of such taxes.
Prospective investors should consult their tax advisors regarding the potential application of withholding under FATCA to their investment in our common stock.
Information Reporting and Backup Withholding
We must report annually to the IRS, and to each non-U.S. Holder, the amount of dividends paid to, and the tax withheld with respect to, each non-U.S. Holder. These reporting requirements apply regardless of whether withholding was reduced or eliminated by an applicable tax treaty. Copies of this information reporting may also be made available under the provisions of a specific tax treaty or agreement with the tax authorities in the country in which the non-U.S Holder resides or is established.
A non-U.S. Holder will generally be subject to backup withholding for dividends on our common stock paid to such holder (at the applicable rate), unless such holder certifies under penalties of perjury that, among other things, it is a non-U.S. Holder (and the payor does not have actual knowledge or reason to know that such holder is a U.S. person), and otherwise complies with all applicable legal requirements.
Information reporting and backup withholding generally are not required with respect to the amount of any proceeds from the sale or other disposition of our common stock by a non-U.S. Holder outside the United States through a foreign office of a foreign broker that does not have certain specified connections to the United States. However, if a non-U.S. Holder sells or otherwise disposes its shares of our common stock through a U.S. broker or the U.S. office of a foreign broker, the broker will generally be required to report the amount of proceeds paid to the non-U.S. Holder to the IRS and also backup withhold on that amount, unless such non-U.S. Holder provides appropriate certification to the broker of its status as a non-U.S. person or otherwise establishes an exemption (and the payor
does not have actual knowledge or reason to know that such holder is a U.S. person). Information
reporting will also apply if a non-U.S. Holder sells its shares of our common stock through a foreign broker deriving more than a specified percentage of its income from U.S. sources or having certain other connections to the United States, unless such broker has documentary evidence in its records that such non-U.S. Holder is a non-U.S. person and certain other conditions are met, or such non-U.S. Holder otherwise establishes an exemption (and the payor does not have actual knowledge or reason to know that such holder is a U.S. person).
Backup withholding is not an additional tax. Any amounts withheld under the backup withholding rules from a payment to a non-U.S. Holder can be credited against the non-U.S. Holder’s U.S. federal income tax liability, if any, or refunded, provided that the required information is furnished to the IRS in a timely manner. Non-U.S. Holders should consult their tax advisors regarding the application of the information reporting and backup withholding rules to them.
The foregoing discussion is only a summary of certain U.S. federal income tax consequences of the acquisition, ownership and disposition of our common stock by non-U.S. holders. You are urged to consult your own tax advisor with respect to the particular tax consequences to you of ownership and disposition of our common stock, including the effect of any U.S., state, local, non-U.S. or other tax laws and any applicable income tax treaty.
Goldman, Sachs & Co., Citigroup Global Markets Inc. and Credit Suisse Securities (USA) LLC are acting as joint-book-runningjoint book-running managers of the offering and are acting as representatives of the underwriters named below. Barclays Capital Inc., Deutsche Bank Securities Inc. and RBC Capital Markets, LLC are acting as book-running managers of the offering. Subject to certain terms and conditions stated in the underwriting agreement dated as of the date of this prospectus, each underwriter has severally agreed to purchase, and we and the selling stockholder have agreed to sell to that underwriter, the number of shares set forth opposite the underwriter’s name.
Underwriters | Number of Shares | |||
Goldman, Sachs & Co. | ||||
Citigroup Global Markets Inc. | ||||
Credit Suisse Securities (USA) LLC | ||||
Barclays Capital Inc. | ||||
| ||||
RBC Capital Markets, LLC | ||||
Oppenheimer & Co. Inc. | ||||
Stephens, Inc. | ||||
SunTrust Robinson Humphrey, Inc. | ||||
| ||||
Total | 18,420,000 | |||
The underwriters are committed to take and pay for all of the shares being offered, if any are taken, other than the shares covered by the option described below unless and until this option is exercised.
The underwriters have an option to buy up to an additional 1,381,500 shares from each of the Company and the selling stockholder to cover sales by the underwriters of a greater number of shares than the total number set forth in the table above. They may exercise that option for 30 days. If any shares are purchased pursuant to this option, the underwriters will severally purchase shares in approximately the same proportion as set forth in the table above.
The following table shows the per share and total underwriting discounts and commissions to be paid to the underwriters by the Company and the selling stockholder. Such amounts are shown assuming both no exercise and full exercise of the underwriters’ option to purchase additional shares.
Paid by the Company and the Selling Stockholder
| No Exercise | Full Exercise | |||||||
Per Share | $ | $ | ||||||
Total | $ | $ | ||||||
Shares sold by the underwriters to the public will initially be offered at the initial public offering price set forth on the cover of this prospectus. Any shares sold by the underwriters to securities dealers may be sold at a discount of up to $ per share from the initial public offering price. If all shares are not sold at initial offering price, the representatives may change the offering price and the other selling terms. The offering of the shares by the underwriters is subject to receipt and acceptance and subject to the underwriters’ right to reject any order in whole or in part.
We, our officers and directors and the selling stockholder have agreed with the underwriters, subject to certain exceptions, not to dispose of or hedge any of their common stock or securities convertible into or exchangeable for shares of common stock during the period from the date of this
prospectus continuing through the date 180 days after the date of this prospectus, except with the prior written consent of the representatives. This agreement does not apply to any existing employee benefit plans or the 2016 Stock Plan. See the section entitled “Shares Eligible for Future Sale” for a discussion of certain transfer restrictions.
Prior to the offering, there has been no public market for the shares. Consequently, the initial public offering price for the shares was determined by negotiations among us, the selling stockholder
and the representatives. Among the factors considered in determining the initial public offering price were our results of operations, our current financial condition, our future prospects, our markets, the economic conditions in and future prospects for the industry in which we compete, our management and currently prevailing general conditions in the equity.
An application has been made to list the common stock on theNASDAQ under the symbol “ .”“FRTA.”
In connection with the offering, the underwriters may purchase and sell shares of common stock in the open market. These transactions may include short sales, stabilizing transactions and purchases to cover positions created by short sales. Short sales involve the sale by the underwriters of a greater number of shares than they are required to purchase in the offering, and a short position represents the amount of such sales that have not been covered by subsequent purchases. A “covered short position” is a short position that is not greater than the amount of additional shares for which the underwriters’ option described above may be exercised. The underwriters may cover any covered short position by either exercising their option to purchase additional shares or purchasing shares in the open market. In determining the source of shares to cover the covered short position, the underwriters will consider, among other things, the price of shares available for purchase in the open market as compared to the price at which they may purchase additional shares pursuant to the option described above. “Naked” short sales are any short sales that create a short position greater than the amount of additional shares for which the option described above may be exercised. The underwriters must cover any such naked short position by purchasing shares in the open market. A naked short position is more likely to be created if the underwriters are concerned that there may be downward pressure on the price of the common stock in the open market after pricing that could adversely affect investors who purchase in the offering. Stabilizing transactions consist of various bids for or purchases of common stock made by the underwriters in the open market prior to the completion of the offering.
Purchases to cover a short position and stabilizing transactions, as well as other purchases by the underwriters for their own accounts, may have the effect of preventing or retarding a decline in the market price of our stock, or may stabilize, maintain or otherwise affect the market price of the common stock. As a result, the price of the common stock may be higher than the price that otherwise might exist in the open market. The underwriters are not required to engage in these activities and may end any of these activities at any time. These transactions may be effected on ,NASDAQ, in the over-the-counter market or otherwise.
We estimate that our share of the total expenses of the offering, excluding underwriting discounts and commissions, will be approximately $ .$10.0 million. We have agreed to reimburse the underwriters for certain of their expenses.expenses in an amount up to $25,000.
Conflicts of Interest
The underwriters and their respective affiliates are full service financial institutions engaged in various activities, which may include sales and trading, commercial and investment banking, advisory, investment management, investment research, principal investment, hedging, market making, brokerage and other financial and non-financial activities and services. Certain of the underwriters and their respective affiliates have provided, and may in the future provide, including in connection with the
refinancing described herein, a variety of these services to the Company and to persons and entities with relationships with the issuer, for which they received or will receive customary fees and expenses. An affiliate of Credit Suisse Securities (USA) LLC, is a lender underor its affiliates, will act as lead bookrunner, arranger and agent for the Senior Term Loan and Junior Term Loan.new first lien term loan expected to be entered into in connection with this offering. In addition, Citigroup Global Markets Inc. is party to certain foreign currency hedging arrangements involving the Company. Citigroup Global Markets Inc. and Credit Suisse Securities (USA) LLC are each a lender, joint lead arranger and joint lead bookrunner under, and Goldman, Sachs & Co. is a lender under, the ABL Credit Agreement.
Credit Suisse Securities (USA) LLC, Citigroup Global Markets Inc. and Deutsche Bank Securities Inc., each an underwriter in this offering, or their affiliates, are lenders of approximately $0.3 million, $10.5 million and $3.0 million, respectively, under our Junior Term Loan. Such underwriters, or their affiliates, are expected to receive payments in respect of such amounts in connection with the use of the net proceeds we receive in this offering to repay our Junior Term Loan. These amounts represent less than 5%, in the aggregate, of the net proceeds of this offering.
In the ordinary course of their various business activities, the underwriters and their respective affiliates, officers, directors and employees may purchase, sell or hold a broad array of investments and actively trade securities, derivatives, loans, commodities, currencies, credit default swaps and other financial instruments for their own account and for the accounts of their customers, and such investment and trading activities may involve or relate to assets, securities and/or instruments of the Company (directly, as collateral securing other obligations or otherwise) and/or persons and entities with relationships with the Company. The underwriters and their respective affiliates may also communicate independent investment recommendations, market color or trading ideas and/or publish or express independent research views in respect of such assets, securities or instruments and may at any time hold, or recommend to clients that they should acquire, long and/or short positions in such assets, securities and instruments.
We have agreed to indemnify the several underwriters against certain liabilities, including liabilities under the Securities Act.
European Economic Area
In relation to each Member State of the European Economic Area which has implemented the Prospectus Directive (each, a Relevant Member State), an offer of shares to the public may not be made in that Relevant Member State, except that an offer of shares to the public may be made at any time under the following exemptions under the Prospectus Directive, if they have been implemented in that Relevant Member State:
(a) to any legal entity which is a qualified investor as defined in the Prospectus Directive;
(b) to fewer than 100 or, if the Relevant Member State has implemented the relevant provisions of the 2010 Amending Directive, 150, natural or legal persons (other than qualified investors as defined in the Prospectus Directive) subject to obtaining the prior consent of the representatives for any such offer; or
(c) in any other circumstances falling within Article 3(2) of the Prospectus Directive,
provided that no such offer of shares shall result in a requirement for the publication of a prospectus pursuant to Article 3 of the Prospectus Directive or any measure implementing the Prospectus Directive in a Relevant Member State and each person who initially acquires any shares or to whom an offer is made will be deemed to have represented, warranted and agreed to and with the underwriters that it is a qualified investor within the meaning of the law in that Relevant Member State implementing Article 2(1)(e) of the Prospectus Directive.
For the purposes of this provision, the expression an “offer of shares to the public” in relation to any shares in any Relevant Member State means the communication in any form and by any means of sufficient information on the terms of the offer and the shares to be offered so as to enable an investor to decide to purchase or subscribe the shares, as the same may be varied in that Relevant Member State by any measure implementing the Prospectus Directive in that Relevant Member State, the expression Prospectus Directive means Directive 2003/71/EC (and amendments thereto, including the 2010 PD Amending Directive, to the extent implemented in the Relevant Member State) and includes any relevant implementing measure in each Relevant Member State.
In the case of any shares being offered to a financial intermediary as that term is used in Article 3(2) of the Prospectus Directive, such financial intermediary will also be deemed to have represented, acknowledged and agreed that the shares acquired by it in the offer have not been acquired on a non-discretionary basis on behalf of, nor have they been acquired with a view to their offer or resale to, persons in circumstances which may give rise to an offer of shares to the public other than their offer or resale in a Relevant Member State to qualified investors as so defined or in circumstances in which the prior consent of the underwriters has been obtained to each such proposed offer or resale.
In the United Kingdom, this prospectus is only addressed to and directed as qualified investors who are (i) investment professionals falling within Article 19(5) of the Financial Services and Markets Act 2000 (Financial Promotion) Order 2005 (the Order); or (ii) high net worth entities and other persons to whom it may lawfully be communicated, falling within Article 49(2)(a) to (d) of the Order (all such persons together being referred to as “relevant persons”). Any investment or investment activity to which this prospectus relates is available only to relevant persons and will only be engaged with relevant persons. Any person who is not a relevant person should not act or relay on this prospectus or any of its contents.
Notice to Prospective Investors in the United Kingdom
This prospectus is only being distributed to, and is only directed at, persons in the United Kingdom that are qualified investors within the meaning of Article 2(1)(e) of the Prospectus Directive that are also (i) investment professionals falling within Article 19(5) of the Financial Services and Markets Act 2000 (Financial Promotion) Order 2005 (the “Order”) or (ii) high net worth entities, and other persons to whom it may lawfully be communicated, falling within Article 49(2)(a) to (d) of the Order (each such person being referred to as a “relevant person”). This prospectus and its contents are confidential and should not be distributed, published or reproduced (in whole or in part) or disclosed by recipients to any other persons in the United Kingdom. Any person in the United Kingdom that is not a relevant person should not act or rely on this document or any of its contents.
Notice to Prospective Investors in France
Neither this prospectus nor any other offering material relating to the shares described in this prospectus has been submitted to the clearance procedures of theAutorité des Marchés Financiers or of the competent authority of another member state of the European Economic Area and notified to theAutorité des Marchés Financiers. The shares have not been offered or sold and will not be offered or sold, directly or indirectly, to the public in France. Neither this prospectus nor any other offering material relating to the shares has been or will be:
Such offers, sales and distributions will be made in France only:
| • | to qualified investors (investisseurs qualifiés) and/or to a restricted circle of investors (cercle restreint d’investisseurs), in each case investing for their own account, all as defined in, and in |
accordance with articles L.411-2, D.411-1, D.411-2, D.734-1, D.744-1, D.754-1 and D.764-1 of the FrenchCode monétaire et financier; |
| • | in a transaction that, in accordance with article L.411-2-II-1°-or-2°-or 3° of the FrenchCode monétaire et financierand article 211-2 of the General Regulations (Règlement Général) of theAutorité des Marchés Financiers, does not constitute a public offer (appel public à l’épargne). |
The shares may be resold directly or indirectly, only in compliance with articles L.411-1, L.411-2, L.412-1 and L.621-8 through L.621-8-3 of the FrenchCode monétaire et financier.
Canada
Resale Restrictions
The distribution of the shares in Canada is being made only in the provinces of Ontario, Quebec, Alberta and British Columbia on a private placement basis exempt from the requirement that we and the selling stockholder prepare and file a prospectus with the securities regulatory authorities in each province where trades of these securities are made. Any resale of the shares in Canada must be made under applicable securities laws which may vary depending on the relevant jurisdiction, and which may require resales to be made under available statutory exemptions or under a discretionary exemption granted by the applicable Canadian securities regulatory authority. Purchasers are advised to seek legal advice prior to any resale of the securities.
Representations of Canadian Purchasers
By purchasing the shares in Canada and accepting delivery of a purchase confirmation, a purchaser is representing to us, the selling stockholder and the dealer from whom the purchase confirmation is received that:
| • | the purchaser is entitled under applicable provincial securities laws to purchase the shares without the benefit of a prospectus qualified under those securities laws as it is an “accredited investor” as defined under National Instrument 45-106 –Prospectus Exemptions or subsection 73.3(1) of the Securities Act (Ontario), |
| • | the purchaser is a “permitted client” as defined in National Instrument 31-103 -Registration Requirements, Exemptions and Ongoing Registrant Obligations, |
Conflicts of Interest
Canadian purchasers are hereby notified that each of the underwriters is relying on the exemption set out in section 3A.3 or 3A.4, if applicable, of National Instrument 33-105 –Underwriting Conflictsfrom having to provide certain conflict of interest disclosure in this document.
Statutory Rights of Action
Securities legislation in certain provinces or territories of Canada may provide a purchaser with remedies for rescission or damages if the offering memorandum (including any amendment thereto) such as this document contains a misrepresentation, provided that the remedies for rescission or damages are exercised by the purchaser within the time limit prescribed by the securities legislation of
the purchaser’s province or territory. The purchaser of these securities in Canada should refer to any applicable provisions of the securities legislation of the purchaser’s province or territory for particulars of these rights or consult with a legal advisor.
Enforcement of Legal Rights
All of our directors and officers as well as the experts named herein and the selling stockholder may be located outside of Canada and, as a result, it may not be possible for Canadian purchasers to effect service of process within Canada upon us or those persons. All or a substantial portion of our assets and the assets of those persons may be located outside of Canada and, as a result, it may not be possible to satisfy a judgment against us or those persons in Canada or to enforce a judgment obtained in Canadian courts against us or those persons outside of Canada.
Taxation and Eligibility for Investment
Canadian purchasers of the shares should consult their own legal and tax advisors with respect to the tax consequences of an investment in the shares in their particular circumstances and about the eligibility of the shares for investment by the purchaser under relevant Canadian legislation.
Hong Kong
The shares may not be offered or sold in Hong Kong by means of any document other than (i) in circumstances which do not constitute an offer to the public within the meaning of the Companies (Winding Up and Miscellaneous Provisions) Ordinance (Cap. 32 of the Laws of Hong Kong) (“Companies (Winding Up and Miscellaneous Provisions) Ordinance”) or which do not constitute an invitation to the public within the meaning of the Securities and Futures Ordinance (Cap. 571 of the Laws of Hong Kong) (“Securities and Futures Ordinance”), or (ii) to “professional investors” as defined in the Securities and Futures Ordinance and any rules made thereunder, or (iii) in other circumstances which do not result in the document being a “prospectus” as defined in the Companies (Winding Up and Miscellaneous Provisions) Ordinance, and no advertisement, invitation or document relating to the shares may be issued or may be in the possession of any person for the purpose of issue (in each case whether in Hong Kong or elsewhere), which is directed at, or the contents of which are likely to be accessed or read by, the public in Hong Kong (except if permitted to do so under the securities laws of Hong Kong) other than with respect to shares which are or are intended to be disposed of only to persons outside Hong Kong or only to “professional investors” in Hong Kong as defined in the Securities and Futures Ordinance and any rules made thereunder.
Singapore
This prospectus has not been registered as a prospectus with the Monetary Authority of Singapore. Accordingly, this prospectus and any other document or material in connection with the offer or sale, or invitation for subscription or purchase, of the shares may not be circulated or distributed, nor may the shares be offered or sold, or be made the subject of an invitation for subscription or purchase, whether directly or indirectly, to persons in Singapore other than (i) to an institutional investor (as defined under Section 4A of the Securities and Futures Act, Chapter 289 of Singapore (the “SFA”)) under Section 274 of the SFA, (ii) to a relevant person (as defined in Section 275(2) of the SFA) pursuant to Section 275(1) of the SFA, or any person pursuant to Section 275(1A) of the SFA, and in accordance with the conditions specified in Section 275 of the SFA or (iii) otherwise pursuant to, and in accordance with the conditions of, any other applicable provision of the SFA, in each case subject to conditions set forth in the SFA.
Where the shares are subscribed or purchased under Section 275 of the SFA by a relevant person which is a corporation (which is not an accredited investor (as defined in Section 4A of the SFA)) the sole business of which is to hold investments and the entire share capital of which is owned by one or more individuals, each of whom is an accredited investor, the securities (as defined in Section 239(1) of the SFA) of that corporation shall not be transferable for 6 months after that corporation has acquired the shares under Section 275 of the SFA except: (1) to an institutional investor under Section 274 of the SFA or to a relevant person (as defined in Section 275(2) of the SFA), (2) where such transfer arises from an offer in that corporation’s securities pursuant to Section 275(1A) of the SFA, (3) where no consideration is or will be given for the transfer, (4) where the transfer is by operation of law, (5) as specified in Section 276(7) of the SFA, or (6) as specified in Regulation 32 of the Securities and Futures (Offers of Investments) (Shares and Debentures) Regulations 2005 of Singapore (“Regulation 32”).
Where the shares are subscribed or purchased under Section 275 of the SFA by a relevant person which is a trust (where the trustee is not an accredited investor (as defined in Section 4A of the SFA)) whose sole purpose is to hold investments and each beneficiary of the trust is an accredited investor, the beneficiaries’ rights and interest (howsoever described) in that trust shall not be transferable for 6 months after that trust has acquired the shares under Section 275 of the SFA except: (1) to an institutional investor under Section 274 of the SFA or to a relevant person (as defined in Section 275(2) of the SFA), (2) where such transfer arises from an offer that is made on terms that
such rights or interest are acquired at a consideration of not less than S$200,000 (or its equivalent in a foreign currency) for each transaction (whether such amount is to be paid for in cash or by exchange of securities or other assets), (3) where no consideration is or will be given for the transfer, (4) where the transfer is by operation of law, (5) as specified in Section 276(7) of the SFA, or (6) as specified in Regulation 32.
Japan
The securities have not been and will not be registered under the Financial Instruments and Exchange Act of Japan (Act No. 25 of 1948, as amended), or the FIEA. The securities may not be offered or sold, directly or indirectly, in Japan or to or for the benefit of any resident of Japan (including any person resident in Japan or any corporation or other entity organized under the laws of Japan) or to others for reoffering or resale, directly or indirectly, in Japan or to or for the benefit of any resident of Japan, except pursuant to an exemption from the registration requirements of the FIEA and otherwise in compliance with any relevant laws and regulations of Japan.
Australia
No prospectus or other disclosure document (as defined in the Corporations Act 2001 (Cth) of
Australia (‘‘Corporations Act’’)) in relation to the common stock has been or will be lodged with the Australian Securities & Investments Commission (‘‘ASIC’’). This document has not been lodged with ASIC and is only directed to certain categories of exempt persons. Accordingly, if you receive this document in Australia:
| (a) | you confirm and warrant that you are either: |
| (i) | a ‘‘sophisticated investor’’ under section 708(8)(a) or (b) of the Corporations Act; |
| (ii) | a ‘‘sophisticated investor’’ under section 708(8)(c) or (d) of the Corporations Act and that you have provided an accountant’s certificate to us which complies with the requirements of section 708(8)(c)(i) or (ii) of the Corporations Act and related regulations before the offer has been made; |
| (iii) | a person associated with the company under section 708(12) of the Corporations Act; or |
| (iv) | a ‘‘professional investor’’ within the meaning of section 708(11)(a) or (b) of the Corporations Act, and to the extent that you are unable to confirm or warrant that you are an exempt sophisticated investor, associated person or professional investor under the Corporations Act any offer made to you under this document is void and incapable of acceptance; and |
| (b) | you warrant and agree that you will not offer any of the common stock for resale in Australia within 12 months of that common stock being issued unless any such resale offer is exempt from the requirement to issue a disclosure document under section 708 of the Corporations Act. |
The validity of the shares of common stock offered hereby will be passed upon for us by Gibson, Dunn & Crutcher LLP. Certain legal matters in connection with the shares of common stock offered hereby will be passed upon for the underwriters by Baker Botts L.L.P.
The combined financial statements of Forterra Building Products (Successor) at December 31, 2015 and for the period from March 14, 2015 to December 31, 2015, the combined balance sheet of HeidelbergCement A.G.’s building products business in the United States and Eastern Canada (the Predecessor) at December 31, 2014 and the related combined financial statements for the period from January 1, 2015 to March 13, 2015 and for each of the two years in the period ended December 31, 2014, and the balance sheet of Forterra, Inc. at June 21, 2016, appearing in this Prospectus and Registration Statement have been audited by Ernst & Young LLP, independent registered public accounting firm, as set forth in their reports thereon appearing elsewhere herein, and are included in reliance upon such reports given on the authority of such firm as experts in accounting and auditing.
The audited carve-out financial statements of Cretex Concrete Products, Inc. as of September 30, 2015 and for the fiscal period ended September 30, 2015 and as of December 27, 2014 and for the fiscal years ended December 27, 2014 and December 28, 2013 included in this Prospectus and Registration Statement have been audited by Pricewaterhouse CoopersPricewaterhouseCoopers LLP, independent auditors, given on the authority of such firm as experts in auditing and accounting.
The consolidated financial statements of USP Holdings Inc. as of September 30, 2015 and 2014 and for each of the years in the three-year period ended September 30, 2015 included in this Prospectus and Registration Statement, have been audited by RSM US LLP, an independent registered public accounting firm,auditors, as stated in their report thereon, and have been included in this Prospectus and Registration Statement in reliance upon such report and upon the authority of such firm as experts in accounting and auditing.
WHERE YOU CAN FIND ADDITIONAL INFORMATION
We have filed with the SEC a registration statement on Form S-1, including exhibits, of which this prospectus forms a part, under the Securities Act with respect to the shares of common stock to be sold in this offering. This prospectus does not contain all of the information set forth in the registration statement and exhibits thereto. For further information with respect to our company and the shares of common stock to be sold in this offering, reference is made to the registration statement, including the exhibits thereto. Copies of the registration statement, including the exhibits thereto, may be examined without charge at the public reference room of the SEC, 100 F Street, N.E., Washington, DC 20549. Information about the operation of the public reference room may be obtained by calling the SEC at1-800-SEC-0330. Copies of all or a portion of the registration statement can be obtained from the public reference room of the SEC upon payment of prescribed fees. Our SEC filings, including the registration statement of which this prospectus forms a part, are also available to you for free on the SEC’s website at www.sec.gov. Upon consummation of this offering we will become subject to the informational and reporting requirements of the Exchange Act and will be required to file reports and other information with the SEC. You will be able to inspect and copy these reports and other information at the public reference facilities maintained by the SEC at the address noted above or obtain copies of these materials from the Public Reference Room of the SEC upon payment of prescribed fees at the address noted above or inspect them without charge at the SEC’s website. We intend to make available to our common stockholders annual reports containing consolidated financial statements audited by our independent registered public accounting firm.
| Page # | ||||
| F-3 | ||||
| F-4 | ||||
| F-5 | ||||
| F-6 | ||||
| F-7 | ||||
| F-8 | ||||
Combined Statements of Shareholder’s Equity and Parent Company Net Investment | ||||
USP Holdings Inc. Consolidated Financial Report September 30, 2015 | ||||
| Page # | ||||
Statements of Changes in Stockholders’ Equity on a Carve-out Basis | ||||
Unaudited Condensed Combined Financial Statements
For the threesix months ended March 31,June 30, 2016, and for the period from March 14, 2015 to March 31,June 30, 2015 (Successor), and for the period from January 1, 2015 to March 13, 2015 (Predecessor)
Condensed Combined Statements of Operations
(USD in thousands)
(Unaudited)
| Successor | Predecessor | Successor | Predecessor | |||||||||||||||||||||
| Three months ended March 31, | For the period from March 14 to March 31, | For the period from January 1 to March 13, | Six months ended June 30, | For the period from March 14 to June 30, | For the period from January 1 to March 13 | |||||||||||||||||||
| 2016 | 2015 | 2015 | 2016 (unaudited) | 2015 (unaudited) | 2015 | |||||||||||||||||||
Net sales | $ | 217,334 | $ | 38,014 | $ | 132,620 | $ | 640,142 | $ | 251,315 | $ | 132,620 | ||||||||||||
Cost of goods sold | 179,403 | 35,324 | 117,831 | 509,370 | 228,405 | 117,831 | ||||||||||||||||||
|
|
|
|
|
| |||||||||||||||||||
Gross profit | 37,931 | 2,690 | 14,789 | 130,772 | 22,910 | 14,789 | ||||||||||||||||||
Selling, general & administrative expenses | (37,945 | ) | (18,722 | ) | (21,683 | ) | (98,622 | ) | (47,716 | ) | (21,683 | ) | ||||||||||||
Impairment and restructuring charges | — | 8 | (542 | ) | (23 | ) | (343 | ) | (542 | ) | ||||||||||||||
Earnings from equity method investee | 1,303 | 115 | 67 | 4,868 | 3,772 | 67 | ||||||||||||||||||
Other operating income | 1,778 | 813 | 994 | 2,533 | 3,930 | 994 | ||||||||||||||||||
|
|
|
|
|
| |||||||||||||||||||
| (34,864 | ) | (17,786 | ) | (21,164 | ) | (91,244 | ) | (40,357 | ) | (21,164 | ) | |||||||||||||
|
|
|
|
|
| |||||||||||||||||||
Income (loss) from operations | 3,067 | (15,096 | ) | (6,375 | ) | 39,528 | (17,447 | ) | (6,375 | ) | ||||||||||||||
Other income (expenses) | ||||||||||||||||||||||||
Interest expense | (17,290 | ) | (2,474 | ) | (84 | ) | (42,129 | ) | (15,551 | ) | (84 | ) | ||||||||||||
Other income (expense), net | (81 | ) | — | (39 | ) | (1,179 | ) | (140 | ) | (39 | ) | |||||||||||||
|
|
|
|
|
| |||||||||||||||||||
Loss before income taxes | (14,304 | ) | (17,570 | ) | (6,498 | ) | (3,780 | ) | (33,138 | ) | (6,498 | ) | ||||||||||||
Income tax (expense) benefit | 10,368 | — | 742 | 36,533 | (1,579 | ) | 742 | |||||||||||||||||
|
|
|
|
|
| |||||||||||||||||||
Net loss | $ | (3,936 | ) | $ | (17,570 | ) | $ | (5,756 | ) | |||||||||||||||
Net income (loss) | $ | 32,753 | $ | (34,717 | ) | $ | (5,756 | ) | ||||||||||||||||
|
|
|
|
|
| |||||||||||||||||||
Pro forma basic and diluted earnings per share (Note 20) | $ | 0.51 | ||||||||||||||||||||||
See accompanying notes to the condensed combined financial statements
Condensed Combined Statements of Comprehensive Loss
(USD in thousands)
(Unaudited)
| Successor | Predecessor | Successor | Predecessor | |||||||||||||||||||||
| Three months ended March 31, | For the period from March 14 to March 31, | For the period from January 1 to March 13, | Six months ended June 30, 2016 (unaudited) | For the period from March 14 to June 30, 2015 (unaudited) | For the period from January 1 to March 13, 2015 | |||||||||||||||||||
| 2016 | 2015 | 2015 | ||||||||||||||||||||||
Net loss | $ | (3,936 | ) | $ | (17,570 | ) | $ | (5,756 | ) | |||||||||||||||
Net income (loss) | $ | 32,753 | (34,717 | ) | $ | (5,756 | ) | |||||||||||||||||
Actuarial gains on defined benefit plans, net of tax | — | — | 2,645 | — | — | 2,645 | ||||||||||||||||||
Unrealized loss on derivative activities, net of tax | (1,209 | ) | — | — | (1,427 | ) | 412 | — | ||||||||||||||||
Foreign currency translation adjustment | 1,848 | (119 | ) | (19,751 | ) | 4,783 | (5,326 | ) | (19,751 | ) | ||||||||||||||
|
|
|
|
|
| |||||||||||||||||||
Comprehensive loss | $ | (3,297 | ) | $ | (17,689 | ) | $ | (22,862 | ) | |||||||||||||||
Comprehensive income (loss) | $ | 36,109 | $ | (39,631 | ) | $ | (22,862 | ) | ||||||||||||||||
|
|
|
|
|
| |||||||||||||||||||
See accompanying notes to the condensed combined financial statements
Condensed Combined Balance Sheets
(USD in thousands)
(Unaudited)
| Successor | Successor | Successor | Successor | |||||||||||||
| March 31, 2016 | December 31, 2015 | June 30, 2016 (unaudited) | December 31, 2015 | |||||||||||||
ASSETS | ||||||||||||||||
Current assets | ||||||||||||||||
Cash and cash equivalents | $ | 11,803 | $ | 43,590 | $ | 41,817 | $ | 43,590 | ||||||||
Receivables, net | 143,699 | 118,959 | 270,088 | 118,959 | ||||||||||||
Inventories | 231,401 | 210,615 | 322,283 | 210,615 | ||||||||||||
Other current assets | 6,053 | 2,844 | 16,328 | 2,844 | ||||||||||||
|
|
|
| |||||||||||||
Total current assets | 392,956 | 376,008 | 650,516 | 376,008 | ||||||||||||
|
|
|
| |||||||||||||
Non-current assets | ||||||||||||||||
Property, plant and equipment, net | 418,499 | 388,924 | 648,621 | 388,924 | ||||||||||||
Goodwill | 102,615 | 75,537 | 416,231 | 75,537 | ||||||||||||
Other intangible assets, net | 31,980 | 26,062 | 259,170 | 26,062 | ||||||||||||
Investment in equity method investee | 56,091 | 56,289 | 56,656 | 56,289 | ||||||||||||
Deferred tax asset | 742 | 3,087 | — | 3,087 | ||||||||||||
Derivative assets | — | 9,093 | — | 9,093 | ||||||||||||
Other long term assets | — | 3,875 | 2,916 | 3,875 | ||||||||||||
|
|
|
| |||||||||||||
Total assets | $ | 1,002,883 | $ | 938,875 | $ | 2,034,110 | $ | 938,875 | ||||||||
|
|
|
| |||||||||||||
LIABILITIES AND EQUITY | ||||||||||||||||
Current liabilities | ||||||||||||||||
Trade payables | $ | 101,709 | $ | 96,486 | $ | 136,525 | $ | 96,486 | ||||||||
Accrued liabilities | 45,546 | 55,628 | 73,359 | 55,628 | ||||||||||||
Deferred revenue | 16,443 | 19,498 | 15,286 | 19,498 | ||||||||||||
Current portion of long term debt | — | 2,191 | ||||||||||||||
Current portion of long term-debt | — | 2,191 | ||||||||||||||
|
|
|
| |||||||||||||
Total current liabilities | 163,698 | 173,803 | 225,170 | 173,803 | ||||||||||||
|
|
|
| |||||||||||||
Non-current liabilities | ||||||||||||||||
Deferred tax liability | — | 2,365 | — | 2,365 | ||||||||||||
Senior Term Loan | 468,027 | 467,192 | 1,001,700 | 467,192 | ||||||||||||
Junior Term Loan | 237,261 | 236,446 | 238,077 | 236,446 | ||||||||||||
Revolving credit facility | 19,027 | — | ||||||||||||||
Financing obligation | 210,934 | — | ||||||||||||||
Deferred tax liabilities | 132,978 | — | ||||||||||||||
Other long term liabilities | 7,978 | 6,754 | 18,909 | 6,754 | ||||||||||||
Derivative liability | 2,361 | — | 2,875 | — | ||||||||||||
|
|
|
| |||||||||||||
Total liabilities | 898,352 | 886,560 | 1,830,643 | 886,560 | ||||||||||||
|
|
|
| |||||||||||||
Commitments and Contingencies (Note 12) | ||||||||||||||||
Commitments and Contingencies (Note 13) | ||||||||||||||||
Equity | ||||||||||||||||
Contributed capital | 195,383 | 139,869 | 254,918 | 139,869 | ||||||||||||
Accumulated other comprehensive loss | (4,130 | ) | (4,768 | ) | (1,418 | ) | (4,768 | ) | ||||||||
Retained deficit | (86,722 | ) | (82,786 | ) | (50,033 | ) | (82,786 | ) | ||||||||
|
|
|
| |||||||||||||
Total shareholder’s equity | 104,531 | 52,315 | 203,467 | 52,315 | ||||||||||||
|
|
|
| |||||||||||||
Total liabilities and shareholder’s equity | $ | 1,002,883 | $ | 938,875 | $ | 2,034,110 | $ | 938,875 | ||||||||
|
|
|
| |||||||||||||
See accompanying notes to the condensed combined financial statements
Condensed Combined Statements of Cash Flow
(USD in thousands)
(Unaudited)
| Successor | Predecessor | Successor | Predecessor | |||||||||||||||||||||
| Three months ended March 31, | For the period from March 14 to March 31, | For the period from January 1 to March 13, | Six months June 30, | For the period March 14 to | For the period January 1 to March 13, | |||||||||||||||||||
| 2016 | 2015 | 2015 | 2016 | 2015 | 2015 | |||||||||||||||||||
CASH FLOWS FROM OPERATING ACTIVITIES | ||||||||||||||||||||||||
Net loss | $ | (3,936 | ) | $ | (17,570 | ) | (5,756 | ) | ||||||||||||||||
Adjustments to reconcile net loss to net cash provided by (used in) operating activities: | ||||||||||||||||||||||||
Net income (loss) | $ | 32,753 | $ | (34,717 | ) | (5,756 | ) | |||||||||||||||||
Adjustments to reconcile net income/ (loss) to net cash provided by (used in) operating activities: | ||||||||||||||||||||||||
Depreciation & amortization expense | 13,759 | 1,796 | 6,894 | 40,420 | 11,060 | 6,894 | ||||||||||||||||||
Loss (gain) on disposal of property, plant and equipment | (1,217 | ) | (201 | ) | — | |||||||||||||||||||
Amortization of debt discount and issuance costs | 1,835 | 280 | — | 3,760 | 1,719 | — | ||||||||||||||||||
Earnings from equity method investee | (1,303 | ) | (115 | ) | (67 | ) | (4,868 | ) | (3,772 | ) | (67 | ) | ||||||||||||
Distributions from equity method investee | 1,500 | 500 | — | 4,500 | 2,250 | — | ||||||||||||||||||
Unrealized foreign currency (gains) losses, net | (2,782 | ) | (58 | ) | (26 | ) | 1,026 | (5,125 | ) | (26 | ) | |||||||||||||
Provision (recoveries) for doubtful accounts | 83 | 214 | (31 | ) | 360 | 768 | (31 | ) | ||||||||||||||||
Deferred taxes | (11,189 | ) | — | 2,749 | (38,376 | ) | — | 2,749 | ||||||||||||||||
Other non-cash items | (30 | ) | (1 | ) | (1,831 | ) | 54 | — | (1,831 | ) | ||||||||||||||
Change in assets and liabilities: | ||||||||||||||||||||||||
Receivables, net | (19,102 | ) | (2,109 | ) | (7,520 | ) | (47,321 | ) | (29,325 | ) | (7,520 | ) | ||||||||||||
Inventories | (5,756 | ) | 4,153 | (20,160 | ) | 6,940 | 26,759 | (20,160 | ) | |||||||||||||||
Other assets | (3,020 | ) | 221 | (855 | ) | (10,917 | ) | (1,230 | ) | (855 | ) | |||||||||||||
Accounts payable and accrued liabilities | (4,432 | ) | 30,307 | (20,119 | ) | (1,841 | ) | 24,078 | (20,119 | ) | ||||||||||||||
Deferred revenue | (3,333 | ) | 2,682 | (1,068 | ) | (4,446 | ) | 6,637 | (1,068 | ) | ||||||||||||||
Employee benefit obligations | — | — | (498 | ) | — | — | (498 | ) | ||||||||||||||||
Other long-term assets & liabilities | 1,872 | (409 | ) | 64 | 12,807 | 1,062 | 64 | |||||||||||||||||
|
|
|
|
|
| |||||||||||||||||||
NET CASH PROVIDED BY (USED IN) OPERATING ACTIVITIES | (35,834 | ) | 19,891 | (48,224 | ) | (6,366 | ) | (37 | ) | (48,224 | ) | |||||||||||||
|
|
|
|
|
| |||||||||||||||||||
CASH FLOWS FROM INVESTING ACTIVITIES | ||||||||||||||||||||||||
Purchase of property, plant and equipment | (6,750 | ) | — | (2,762 | ) | (16,340 | ) | (2,732 | ) | (2,762 | ) | |||||||||||||
Assets and liabilities acquired, Sherman Dixie, net | (66,751 | ) | — | — | (66,751 | ) | — | — | ||||||||||||||||
Assets and liabilities acquired, U.S. Pipe, net | (775,110 | ) | — | — | ||||||||||||||||||||
Assets and liabilities acquired from HeidelbergCement, net | — | (640,428 | ) | — | — | (640,428 | ) | — | ||||||||||||||||
|
|
|
|
|
| |||||||||||||||||||
NET CASH USED IN INVESTING ACTIVITIES | (73,501 | ) | (640,428 | ) | (2,762 | ) | (858,201 | ) | (643,160 | ) | (2,762 | ) | ||||||||||||
|
|
|
|
|
| |||||||||||||||||||
CASH FLOWS FROM FINANCING ACTIVITIES | ||||||||||||||||||||||||
Proceeds from failed sale-leaseback | 216,280 | — | — | |||||||||||||||||||||
Deferred transaction costs on failed sale-leaseback | (6,492 | ) | — | — | ||||||||||||||||||||
Payment of debt issuance costs | — | (20,479 | ) | — | (6,896 | ) | (20,479 | ) | — | |||||||||||||||
Proceeds from Senior Term Loan, net of discount | — | 248,505 | — | 548,400 | 248,505 | — | ||||||||||||||||||
Proceeds from Junior Term Loan, net of discount | — | 244,300 | — | — | 244,300 | — | ||||||||||||||||||
Proceeds from Revolver | 80,000 | 20,619 | — | 106,611 | 35,619 | — | ||||||||||||||||||
Payments on Revolver | (6,566 | ) | — | — | (55,173 | ) | (8,210 | ) | — | |||||||||||||||
Payments on Senior Term Loan | (2,191 | ) | — | — | (2,191 | ) | (1,588 | ) | — | |||||||||||||||
Proceeds from settlement of derivatives | 6,566 | — | — | 6,546 | — | — | ||||||||||||||||||
Capital contribution from Predecessor Parent, net | — | — | 60,910 | — | — | 60,910 | ||||||||||||||||||
Capital contribution from parent | — | 167,482 | — | 402,127 | 167,482 | — | ||||||||||||||||||
Payments for return of contributed capital | (347,344 | ) | — | — | ||||||||||||||||||||
Other financing activities | — | (17 | ) | (3 | ) | — | — | (3 | ) | |||||||||||||||
|
|
|
|
|
| |||||||||||||||||||
NET CASH PROVIDED BY FINANCING ACTIVITIES | 77,809 | 660,410 | 60,907 | 861,868 | 665,629 | 60,907 | ||||||||||||||||||
|
|
|
|
|
| |||||||||||||||||||
Effect of exchange rate changes on cash | (261 | ) | (1,941 | ) | (130 | ) | 926 | (5,994 | ) | (130 | ) | |||||||||||||
|
|
|
|
|
| |||||||||||||||||||
Net change in cash and cash equivalents | (31,787 | ) | 37,932 | 9,791 | (1,773 | ) | 16,438 | 9,791 | ||||||||||||||||
Cash and cash equivalents balance, beginning of period | 43,590 | — | 42 | 43,590 | — | 42 | ||||||||||||||||||
Cash and cash equivalents balance, end of period | $ | 11,803 | $ | 37,932 | $ | 9,833 | $ | 41,817 | $ | 16,438 | $ | 9,833 | ||||||||||||
|
|
|
|
|
| |||||||||||||||||||
SUPPLEMENTAL DISCLOSURES: | ||||||||||||||||||||||||
Cash interest paid | $ | 8,231 | — | — | $ | 26,915 | $ | 8,731 | — | |||||||||||||||
|
|
|
|
|
| |||||||||||||||||||
SUPPLEMENTAL NONCASH INVESTING AND FINANCING DISCLOSURES: | ||||||||||||||||||||||||
Payments made on behalf of the Company by affiliates | $ | 4,076 | $ | 8,513 | — | |||||||||||||||||||
Net payments made on behalf of the Company by affiliates | $ | 8,898 | $ | 4,528 | — | |||||||||||||||||||
|
|
|
|
|
| |||||||||||||||||||
Repayments on Revolver by Parent | $ | 51,438 | — | — | $ | 51,438 | — | — | ||||||||||||||||
|
|
|
|
|
| |||||||||||||||||||
Fair value changes of derivative instruments recorded in OCI, net of tax | $ | 1,209 | — | — | $ | (1,427 | ) | $ | 412 | — | ||||||||||||||
|
|
|
|
|
| |||||||||||||||||||
See accompanying notes to the condensed combined financial statements
Notes to Combined Financial Statements
(USD in thousands, unless stated otherwise)
1. Organization and description of the business
Description of the business
Forterra Building Products (“Forterra” or the “Successor”) is involved in the manufacturing, sale and distribution of building materials in the United States (‘‘U.S.’’) and Canada. Forterra’s primary products are concrete drainage pipe, precast concrete structures, water transmission pipe used in drinking and wastewater systems, and bricks. These products are used in the residential, infrastructure and non-residential sectors of the construction industry.
Basis of Presentation - Successor
Forterra includes indirect wholly-owned subsidiaries of LSF9 Concrete Holdings, Ltd. (“LSF9”). Lone Star Funds (“Lone Star”), through its wholly-owned subsidiary LSF9, acquired Forterra on March 13, 2015 (the “Acquisition”). LSF9, which was formed on February 6, 2015 for the purpose of acquiring Forterra, had no operations prior to the date of the Acquisition. The legal entities that comprise Forterra are domiciled in the U.S. and Canada. The U.S. legal entities are Stardust Holdings (USA), LLC and its subsidiaries. The Canadian legal entities are Forterra Pipe & Precast, Ltd. and its subsidiaries and Forterra Brick Ltd.
Prior to the Acquisition, the entities comprising Forterra which were acquired by Lone Star were indirect wholly-owned subsidiaries of HeidelbergCement A.G. (“HC” or “Parent”), a publicly listed company in Germany, encompassing HC’s North American building products operations (“BP NAM” or the “Predecessor”). LSF9 acquired Forterra in a business combination which also included the acquisition of HC’s U.K.-based building products operations for a total initial purchase price of $1.33 billion cash, subject to customary working capital adjustments and a possible earn-out of up to $100.0 million. The acquisition of BP NAM and HC’s UK-based building products was funded with an equity investment of $432.3 million and third-party debt in the amount of $940.0 million.
In the accompanying financial information, Successor refers to Forterra and Predecessor refers to BP NAM. The term “Company” is used throughout the combined financial statements and applies to either the Predecessor or the Successor.
The Successor’s combined financial statements include certain assets and liabilities historically held at LSF9, including the proportionate debt, and related interest expense, incurred by LSF9 to acquire the Company that Forterra is obligated to pay. The Company’s portion of Lone Star’s initial $432.3 million equity investment is $167.5 million. The Company’s allocated portion of the $940.0 million of third party debt used to finance the Acquisition is $515.5 million. The remainderremaining $424.5 million of the debt was allocated to affiliates of LSF9 that are not included in these financial statements.statements based on the amounts affiliates of LSF9 are expected to repay and such amount has been fully repaid by affiliates. The Company and the affiliates of LSF9 were co-obligors and jointly and severally liable under terms of the initial credit agreements. In April of 2016, the Company’s affiliate co-obligors were released from joint and several liability under the credit agreements and the Company is consequently the sole source of repayment for its $515.5 million share for the initial obligation under the credit agreements. See discussion of the joint and several obligations in Note 9, Debt and deferred financing costs.
U.S. Pipe Acquisition
On April 15, 2016, Forterra closed the acquisition of all of the stock of USP Holdings Inc. (“USP”) for a purchase price of $775.1 million, subject to customary working capital adjustments. USP is a
FORTERRA BUILDING PRODUCTS
Notes to Combined Financial Statements
(USD in thousands, unless stated otherwise)
manufacturer of water transmission pipe servicing residential, commercial and infrastructure customers. The USP acquisition was financed with proceeds from a capital contribution and borrowings on LSF9’s revolving credit facility.
Sherman-Dixie Acquisition
On January 29, 2016, Forterra closed the acquisition of substantially all the assets of Sherman-Dixie Concrete Industries (“Sherman-Dixie”) for a purchase price of $66.8 million, including customary working capital adjustments. Sherman-Dixie is a manufacturer of precast concrete structures operating
FORTERRA BUILDING PRODUCTS
Notes to Combined Financial Statements
(USD in thousands, unless stated otherwise)
in Kentucky, Tennessee, Alabama and Indiana. The Sherman Dixie acquisition was financed with proceeds from a draw on the Company’s revolving credit facility.
The financial statements contained herein have been prepared in accordance with accounting principles generally accepted in the United States (“U.S. GAAP”). The combined financial statements include the accounts of the Company and all intercompany transactions among the Successor entities have been eliminated.
2. Summary of significant accounting policies
General
The condensed combined financial statements have been prepared in accordance with U.S. GAAP and on the same basis as our audited combined financial statements as of December 31, 2015. The condensed combined balance sheet as of March 31,June 30, 2016 and the condensed combined statements of operations, comprehensive income (loss) and cash flows for the periods presented herein are not audited but reflect all adjustments that are of a normal recurring nature and are necessary for a fair statement of the results of the periods shown. Certain information and note disclosures normally included in annual financial statements have been omitted pursuant to the rules and regulations of the U.S. Securities and Exchange Commission (“SEC”). Because the condensed combined interim financial statements do not include all of the information and notes required by U.S. GAAP for a complete set of financial statements, they should be read in conjunction with the audited combined financial statements referred to above. The results and trends in these interim financial statements may not be indicative of results for the full year.
Basis of presentation-Predecessor
Description of Business - Predecessor
The legal entities comprising BP NAM were a component of the North American operating segment of HC and consist of U.S. operating entities that were directly owned by Lehigh Hanson, Inc. (‘‘LHI’’), a U.S. holding company, and Canadian operating entities that were directly owned by Hanson America Holdings (4), Ltd., a U.K. holding company.
These financial statements are labeled as predecessor because they reflect the combined predecessor historical results of operations, financial position and cash flows of BP NAM, as they were historically managed under the control of HC, in conformity with U.S. GAAP.
All intracompany transactions occurring between the predecessor entities have been eliminated. Certain transactions between the Company and HC have been included in these combined predecessor financial statements and are considered to be effectively settled at the time the
FORTERRA BUILDING PRODUCTS
Notes to Combined Financial Statements
(USD in thousands, unless stated otherwise)
transaction is recorded. The total net effect of the settlement of these transactions is reflected in the combined predecessor statements of shareholder’s equity and Parent company net investment as net transfers (to)/from Parent, in the combined predecessor statements of cash flows as a financing activity and in the combined predecessor balance sheet as Parent company net investment.
HC used a centralized approach to cash management and financing of its operations. Historically, the majority of the Predecessor’s cash was transferred to HC daily and the Company was dependent
FORTERRA BUILDING PRODUCTS
Notes to Combined Financial Statements
(USD in thousands, unless stated otherwise)
on HC funding of the Company’s operating and investing activities as needed. This arrangement is not reflective of the manner in which the Company would have been able to finance its operations had it been a stand-alone business separate from HC during the periods presented. Cash transfers to and from HC’s cash management accounts are reflected within Parent company net investment.
The combined predecessor financial statements include certain assets and liabilities that have historically been held at the HC corporate level but are specifically identifiable or otherwise allocable to the Company. The cash and cash equivalents held by HC at the corporate level are not specifically identifiable to the Company and therefore were not allocated for any of the periods presented. Cash and cash equivalents in the combined predecessor balance sheets represent cash held locally by operations included in the combined predecessor financial statements. HC third-party debt, and the related interest expense, has not been allocated for any of the periods presented as the Company was not the legal obligor of the debt and HC’s borrowings were not directly attributable to these operations.
The historical costs and expenses reflected in the combined predecessor financial statements include an allocation for certain corporate functions historically provided by HC or its wholly-owned subsidiaries. Substantially all of the Company’s senior management were employed by HC and certain functions critical to the Company’s operations were centralized and managed by HC. Historically, the centralized functions have included executive senior management, financial reporting, financial planning and analysis, accounting, shared services, information technology, tax, risk management, treasury, legal, human resources, land management, and strategy and development. Additionally, the Company resided in office space provided by affiliates of HC. The cost of each of these services has been allocated to the Company on the basis of the Company’s relative net sales or head count as compared to that of HC depending upon which allocation methodology is more meaningful for each service.
The Company and HC believe that these allocations reasonably reflect the utilization of services provided and benefits received. However, they may differ from the cost that would have been incurred had the Company operated as a stand-alone company for the periods presented or will be incurred by the Successor. ActualEstimating actual costs that would have been incurred if the Company had been a stand-alone company is not practicable and would depend on multiple factors, including organizational structure and strategic decisions made in various areas, including legal services, accounting and finance services, human resources, marketing and contract support, customer support, treasury, facility and other corporate and infrastructural services. Income taxes have been accounted for in these financial statements on a separate-return basis.
Recent Accounting Guidance Adopted
In March 2015, the FASB issued ASU 2015-02,Consolidation (Topic 810), Amendments to the Consolidation Analysis, changing the analysis that a reporting entity must perform when deciding to consolidate a legal entity. This amendment changes the evaluation of whether limited partnerships are variable interest entities or voting interest entities and eliminates the presumption that a general
FORTERRA BUILDING PRODUCTS
Notes to Combined Financial Statements
(USD in thousands, unless stated otherwise)
partner should consolidate a limited partnership. All legal entities are subject to reevaluation under the revised consolidation model. The amendment is effective for fiscal years and interim periods beginning after December 15, 2015 and can be applied either retrospectively to each period presented or as a cumulative-effect adjustment as of the beginning of the period of adoption. The Company adopted the guidance in the combined financial statements for the threesix months ended March 31,June 30, 2016.
FORTERRA BUILDING PRODUCTS
Notes to Combined Financial Statements
(USD in thousands, unless stated otherwise)
In August 2014, the FASB issued ASU 2014-15,Presentation of Financial Statements–Going Concern (Subtopic 205-40): Disclosure of Uncertainties about an Entity’s Ability to Continue as a Going Concern,defining when and how companies are requiredto disclose going concern uncertainties, which must be evaluated each interim and annual period. Specifically, it requires management to determine whether substantial doubt exists regarding the entity’s going concern presumption. Substantial doubt about an entity’s ability to continue as a going concern exists when relevant conditions and events, considered in the aggregate, indicate that it is probable that the entity will be unable to meet its obligations as they become due within one year after the date the financial statements are issued. If substantial doubt exists, certain disclosures are required. The provisions of this ASU are effective for annual periods ending after December 15, 2016 and to annual and interim periods thereafter. Early adoption is permitted. The ASU should be applied on a prospective basis. The Company believes the adoption of this ASU will not have a material impact on the Company’s disclosures.
In September 2015, the FASB issued ASU 2015-16,Business Combinations (Topic 805). Topic 805 requires an acquirer to retrospectively adjust provisional amounts recognized in a business combination during the measurement period. To simplify the accounting for adjustments made to provisional amounts, the amendments in this update require that the acquirer recognize adjustments to provisional amounts that are identified during the measurement period in the reporting period in which the adjustment amount is determined. The acquirer is required to also record, in the same period’s financial statements, the effect on earnings of changes in depreciation, amortization or other income effects, if any, as a result of the change to the provisional amounts, calculated as if the accounting had been completed at the acquisition date. In addition, an entity is required to present separately on the face of the income statement or disclose in the notes to the financial statements the portion of the amount recorded in current period earnings by line item that would have been recorded in previous reporting periods if the adjustment to the provisional amounts had been recognized as of the acquisition date. For public business entities, the amendments in this update are effective for fiscal years beginning after December 15, 2015, including interim periods within those fiscal years.
Recent Accounting Guidance Not Yet Adopted
In May 2014, the FASB issued ASU 2014-09,Revenue from Contracts with Customers (Topic 606), which provides accounting guidance for all revenue arising from contracts with customers and affects all entities that enter into contracts to provide goods or services to their customers. The FASB subsequently voted to defer the application of the provisions of this standard for public companies until annual reporting periods beginning after December 15, 2017 in ASU 2015-14Revenue from Contracts withCustomers (Topic 606): Deferral of the Effective Date, including interim periods within that reporting period. The Company iscurrently evaluating whether this ASU will have a material impact on its combined financial statements.
In July 2015, the FASB issued ASU 2015-11,Inventory (Topic 330): Simplifying the Measurement of Inventory, requiring an entity to measure inventory within the scope of the ASU at the lower of cost and net realizable value. For public business entities, the amendments in this update are effective for
FORTERRA BUILDING PRODUCTS
Notes to Combined Financial Statements
(USD in thousands, unless stated otherwise)
financial statements issued for fiscal years beginning after December 15, 2016, and interim periods within those fiscal years. The Company is currently evaluating whether this ASU will have a material impact on its combined financial statements.
In February 2016, the FASB issued ASU 2016-02,Leases (Topic 842), amending the existing accounting standards for lease accounting, including requiring lessees to recognize most leases on
FORTERRA BUILDING PRODUCTS
Notes to Combined Financial Statements
(USD in thousands, unless stated otherwise)
their balance sheets and making targeted changes to lessor accounting. For public business entities, the amendments in this update are effective for annual reporting periods beginning after December 15, 2018, including interim periods within those fiscal years, and early adoption is permitted as of the standard’s issuance date. ASU 2016-02 requires a modified retrospective transition approach for all leases existing at, or entered into after, the date of initial application, with an option to use certain transition relief. The Company believes this ASU will have a material impact on our combined financial statements as it will result in most of the Company’s leases and associated assets being presented on the balance sheet.
3. Business combinations
Transaction Overview – The Acquisition
The Successor’s financial statements reflect the Acquisition of the Predecessor that occurred on March 13, 2015, which was accounted for as a business combination as defined by ASC 805. Certain liabilities of the Predecessor were not assumed by the Successor including, but not limited to pension liabilities, tax and insurance related liabilities and multi-employer pension liabilities. The assets acquired and liabilities assumed are recorded at their respective fair values as of the date of the Acquisition with the excess of the purchase price over those fair values recorded as goodwill. The determination of the fair values of the acquired assets and assumed liabilities required significant judgment, including estimates impacting the determination of estimated lives of tangible and intangible assets, the calculation of the fair value of inventory, property, plant and equipment, and customer related intangibles. The fair values were determined primarily using the income method using level 3 inputs as defined by ASC 820.
The following table summarizes the fair values of the assets acquired and liabilities assumed by the Company at the Acquisition date:
| Fair Value | ||||
Net working capital | $ | 257,368 | ||
Property, plant and equipment | 311,191 | |||
Investment in equity method investee | 56,400 | |||
Customer backlog intangible | 4,500 | |||
Other assets and other liabilities | (6,495 | ) | ||
|
| |||
Net identifiable assets acquired | $ | 622,964 | ||
Goodwill | 17,464 | |||
|
| |||
Consideration transferred, net of cash acquired | $ | 640,428 | ||
|
| |||
The goodwill recognized was attributable primarily to expected operating efficiencies and expansion opportunities in the business acquired. The goodwill is not expected to be deductible for tax purposes.
FORTERRA BUILDING PRODUCTS
Notes to Combined Financial Statements
(USD in thousands, unless stated otherwise)
Financing transactions
Consideration to fund the Acquisition was provided by an equity investment of $167.5 million and proceeds from third-party debt, net of original discount and debt issuance costs, in the amount of $472.9 million. The financing transactions included a senior term loan in the amount of $254.9 million
FORTERRA BUILDING PRODUCTS
Notes to Combined Financial Statements
(USD in thousands, unless stated otherwise)
($ ($241.7 million, net of $13.2 million of original issue discount and debt issuance costs), a junior term loan in the amount of $260.0 million ($233.8 million, net of $26.2 million of original issue discount and debt issuance costs) and a revolving line of credit of up to $150.0 million. Funds of $0.6 million were initially drawn from the revolving line of credit at the closing date of the Acquisition. The Company incurred debt issuance costs related to the revolving line of credit in the amount of $3.2 million.
Contingent Consideration
As discussed in Note 1, the Acquisition included contingent consideration of up to an additional $100.0 million based on the earnings of LSF9 for fiscal year 2015 as adjusted by the purchase agreement (“Earn-out”). The Earn-out is based on the achievement of an amount in excess of a certain minimum threshold of adjusted earnings before interest, taxes, depreciation and amortization (“Adjusted EBITDA”), as defined by the purchase agreement, for the calendar year ended December 31, 2015. The Company determined that achieving the required threshold to trigger a payout to the Seller was not probable and, therefore, the Company did not record a contingent liability related to the Earn-out as of the Acquisition date. Subsequent to year end, the Company concluded the Earn-out was not earned and, accordingly, did not record a liability as of December 31, 2015. See further discussion of the Earn-out contingency in Note 12.13.
Transaction Overview - USP Holdings Inc. (“USP”)
On April 15, 2016, Forterra acquired all of the stock of USP Holdings Inc. for a purchase price of $775.1 million, subject to customary working capital adjustments. All outstanding stock options of USP were settled by USP with proceeds from the acquisition and were not assumed by the Company in the transaction. The acquisition is accounted for as a business combination as defined byASC 805, Business Combinations. The Company allocated the purchase price to the individually identifiable assets acquired and liabilities assumed based on their estimated fair value on the date of acquisition. USP operates as part of the Company’s Water Pipe & Products reportable segment. The excess purchase price over those fair values was recorded as goodwill. The determination of fair values of the acquired assets and assumed liabilities required significant judgment, including estimates related to customer relationships, tradename and other intangibles, calculation of the fair value of property, plant and equipment and inventory. The allocation of the purchase price is preliminary and may be subject to change upon completion of the determination of the fair value of all acquired assets and liabilities. The fair value of assets and liabilities was determined using level 3 inputs as defined by ASC 820.
FORTERRA BUILDING PRODUCTS
Notes to Combined Financial Statements
(USD in thousands, unless stated otherwise)
The respective preliminary fair values of the assets acquired and liabilities assumed at the acquisition date are as follows:
| Fair Value | ||||
Net working capital | $ | 149,683 | ||
Property, plant and equipment, net | 246,241 | |||
Customer relationship intangible | 179,491 | |||
Trade name intangible | 37,388 | |||
Patent intangible | 13,093 | |||
Other intangibles | 7,659 | |||
Long term liabilities | (10,613 | ) | ||
Deferred tax liabilities | (160,906 | ) | ||
|
| |||
Net identifiable assets acquired | 462,036 | |||
Goodwill | 313,074 | |||
|
| |||
Consideration transferred | $ | 775,110 | ||
|
| |||
The goodwill recognized was attributable primarily to expected operating efficiencies and expansion opportunities in the business acquired. The goodwill is not expected to be deductible for tax purposes.
For the six months ended June 30, 2016 revenues and income from operations include $150.3 million and $10.6 million, respectively, attributed to USP after the acquisition date.
Transaction Overview - Sherman Dixie Concrete Industries (“Sherman-Dixie”)
On January 29, 2016, Forterra completed the acquisition of all of the common stock of Sherman-Dixie for a cash purchase price of $66.8 million including customary working capital adjustments. The acquisition is accounted for as a business combination as defined byASC 805, Business Combinations. The Company allocated the purchase price to the individually identifiable assets acquired and liabilities assumed based on their estimated fair value on the date of acquisition. Sherman-Dixie will operate as part of the Company’s Drainage Pipe & Products reportable segment. The excess purchase price over those fair values was recorded as goodwill. The determination of fair values of the acquired assets and assumed liabilities required significant judgment, including estimates related to contract backlog, calculation of the fair value of property, plant and equipment and inventory. The allocation of the purchase price is preliminary and may be subject to change upon completion of the determination of the fair value of all acquired assets and liabilities. The fair value of assets and liabilities was determined using level 3 inputs as defined by ASC 820.
FORTERRA BUILDING PRODUCTS
Notes to Combined Financial Statements
(USD in thousands, unless stated otherwise)
The respective preliminary fair values of the assets acquired and liabilities assumed at the acquisition date are as follows:
| Fair Value | ||||
Net working capital | $ | 14,293 | ||
Property, plant and equipment | 29,163 | |||
Customer relationships intangible | 5,100 | |||
Non-compete agreement intangible | 2,500 | |||
Other identifiable intangibles | 900 | |||
Deferred tax liability | (11,189 | ) | ||
|
| |||
Net identifiable assets acquired | 40,767 | |||
Goodwill | 25,984 | |||
|
| |||
Consideration transferred, net of cash acquired | $ | 66,751 | ||
|
| |||
FORTERRA BUILDING PRODUCTSSupplemental pro-forma information (unaudited)
Notes to Combined Financial Statements
(USD in thousands, unless stated otherwise)
If the Company had acquired USP and Sherman-Dixie on January 1, 2016, the Company’s total net sales and income from continuing operations before taxes, on a pro-forma basis for the six months ended June 30, 2016 would have been approximately $816,453 and $7,184, respectively.
Transaction costs
For the threesix months ended March 31,June 30, 2016, for the period from March 14, 2015 to March 31,June 30, 2015, and for the period from January 1, 2015 to March 13, 2015 the Company recognized aggregate transaction costs specific to the Acquisition, Cretex acquisition, U.S. Pipe acquisition, and Sherman Dixie acquisition of $334, $9,646,$7,582, $10,588, and $2,079, respectively. Transaction costs generally include legal, accounting, valuation, and advisory fees. These costs are recorded in the combined statements of operations within selling, general & administrative expenses.
Roof Tile Divestiture
On April 12, 2016, the Company entered into and closed a Stock Purchase Agreement to sell all of its ownership interest in its roof tile business for an initial purchase price of $10.5 million subject to customary working capital adjustments. The sale of the roof tile business generated a loss of $0.8 million recorded in other income (expense), net.
4. Receivables, net
Receivables consist of the following at March 31,June 30, 2016 and December 31, 2015:
| Successor | Successor | |||||||
| March 31, 2016 | December 31, 2015 | |||||||
Trade receivables | $ | 131,037 | $ | 108,065 | ||||
Amounts billed, but not yet paid under retainage provisions | 2,041 | 2,053 | ||||||
Other receivables | 13,622 | 12,436 | ||||||
|
|
|
| |||||
Total receivables | $ | 146,700 | $ | 122,554 | ||||
Less: Allowance for doubtful accounts | (3,001 | ) | (3,595 | ) | ||||
|
|
|
| |||||
Receivables, net | $ | 143,699 | $ | 118,959 | ||||
|
|
|
| |||||
5. Inventories
Inventories consists of the following at March 31, 2016 and December 31, 2015:
| Successor | Successor | |||||||
| March 31, 2016 | December 31, 2015 | |||||||
Finished goods | $ | 167,434 | $ | 146,635 | ||||
Raw materials | 54,015 | 53,339 | ||||||
Work in process | 9,952 | 10,641 | ||||||
|
|
|
| |||||
Total inventories | $ | 231,401 | $ | 210,615 | ||||
|
|
|
| |||||
6. Property, plant and equipment, net
Property, plant and equipment, net consist of the following at March 31, 2016 and December 31, 2015:
| Successor | Successor | |||||||
| March 31, 2016 | December 31, 2015 | |||||||
Land, buildings and improvements | $ | 254,530 | $ | 243,496 | ||||
Machinery and equipment | 184,994 | 158,349 | ||||||
Other equipment | 1,489 | 1,142 | ||||||
Construction-in-progress | 17,630 | 14,984 | ||||||
|
|
|
| |||||
Total property, plant and equipment | 458,643 | 417,971 | ||||||
Less: accumulated depreciation | (40,144 | ) | (29,047 | ) | ||||
|
|
|
| |||||
Property, plant and equipment, net | $ | 418,499 | $ | 388,924 | ||||
|
|
|
| |||||
| Successor | Successor | |||||||
| June 30, 2016 | December 31, 2015 | |||||||
Trade receivables | $ | 255,645 | $ | 108,065 | ||||
Amounts billed, but not yet paid under retainage provisions | 1,963 | 2,053 | ||||||
Other receivables | 16,598 | 12,436 | ||||||
|
|
|
| |||||
Total receivables | $ | 274,206 | $ | 122,554 | ||||
Less: Allowance for doubtful accounts | (4,118 | ) | (3,595 | ) | ||||
|
|
|
| |||||
Receivables, net | $ | 270,088 | $ | 118,959 | ||||
|
|
|
| |||||
FORTERRA BUILDING PRODUCTS
Notes to Combined Financial Statements
(USD in thousands, unless stated otherwise)
5. Inventories
Inventories consists of the following at June 30, 2016 and December 31, 2015:
| Successor | Successor | |||||||
| June 30, 2016 | December 31, 2015 | |||||||
Finished goods | $ | 214,137 | $ | 146,635 | ||||
Raw materials | 100,933 | 53,339 | ||||||
Work in process | 7,213 | 10,641 | ||||||
|
|
|
| |||||
Total inventories | $ | 322,283 | $ | 210,615 | ||||
|
|
|
| |||||
6. Property, plant and equipment, net
Property, plant and equipment, net consist of the following at June 30, 2016 and December 31, 2015:
| Successor | Successor | |||||||
| June 30, 2016 | December 31, 2015 | |||||||
Machinery and equipment | $ | 388,648 | $ | 158,349 | ||||
Land, buildings and improvements | 284,381 | 243,496 | ||||||
Other equipment | 3,435 | 1,142 | ||||||
Construction-in-progress | 23,788 | 14,984 | ||||||
|
|
|
| |||||
Total property, plant and equipment | 700,252 | 417,971 | ||||||
Less: accumulated depreciation | (51,631 | ) | (29,047 | ) | ||||
|
|
|
| |||||
Property, plant and equipment, net | $ | 648,621 | $ | 388,924 | ||||
|
|
|
| |||||
Depreciation expense, including depreciation of assets subject to a failed sale-leaseback discussed in Note 10 Financing Obligation (Failed sale-leaseback), totaled $11,134, $1,564,$27,349, $9,669, and $6,894, for the threesix months ended March 31,June 30, 2016, for the period March 14, 2015 to March 31,June 30, 2015 and for the period from January 1, 2015 to March 13, 2015, respectively, which is included in cost of goods sold and selling, general and administrative expenses in the combined statements of operations.
7. Goodwill and other intangible assets, net
The table below presents goodwill by operating segment as of March 31,June 30, 2016:
| Successor | Drainage Pipe & Products | Water Pipe & Products | Bricks | Other | Total | Drainage Pipe & Products | Water Pipe & Products | Bricks | Other | Total | ||||||||||||||||||||||||||||||
Balance at December 31, 2015 | $ | 73,442 | $ | 2,050 | $ | 45 | $ | — | $ | 75,537 | $ | 73,442 | $ | 2,050 | $ | 45 | $ | — | $ | 75,537 | ||||||||||||||||||||
Sherman-Dixie acquisition | 25,984 | — | — | — | 25,984 | 25,984 | — | — | — | 25,984 | ||||||||||||||||||||||||||||||
U.S. Pipe acquisition | — | 313,074 | — | — | 313,074 | |||||||||||||||||||||||||||||||||||
Foreign currency | 881 | 213 | — | — | 1,094 | 1,321 | 315 | — | — | 1,636 | ||||||||||||||||||||||||||||||
|
|
|
|
|
|
|
|
|
| |||||||||||||||||||||||||||||||
Balance at March 31, 2016 | $ | 100,307 | $ | 2,263 | $ | 45 | $ | — | $ | 102,615 | ||||||||||||||||||||||||||||||
Balance at June 30, 2016 | $ | 100,747 | $ | 315,439 | $ | 45 | $ | — | $ | 416,231 | ||||||||||||||||||||||||||||||
|
|
|
|
|
|
|
|
|
| |||||||||||||||||||||||||||||||
FORTERRA BUILDING PRODUCTS
Notes to Combined Financial Statements
(USD in thousands, unless stated otherwise)
Intangible assets other than goodwill at March 31,June 30, 2016 and December 31, 2015 included the following:
| Weighted average amortization period (in years) | Gross carrying amount as of March 31, 2016 | Accumulated amortization | Net carrying value as of March 31, 2016 | Weighted average amortization period (in years) | Gross carrying amount as of June 30, 2016 | Accumulated amortization | Net carrying value as of June 30, 2016 | |||||||||||||||||||||||||
Customer relationships | 5 | $ | 29,800 | $ | (2,072 | ) | $ | 27,728 | 10 | $ | 209,291 | $ | (8,157 | ) | $ | 201,134 | ||||||||||||||||
Brand names | 5 | 38,088 | (1,479 | ) | 36,609 | |||||||||||||||||||||||||||
Patents | 7 | 13,093 | (506 | ) | 12,587 | |||||||||||||||||||||||||||
Customer backlog | 1 | 5,982 | (4,615 | ) | 1,367 | 1 | 9,864 | (6,497 | ) | 3,367 | ||||||||||||||||||||||
Non-competes | 5 | 2,500 | (84 | ) | 2,416 | 5 | 6,277 | (804 | ) | 5,473 | ||||||||||||||||||||||
Brand names | 2 | 700 | (231 | ) | 469 | |||||||||||||||||||||||||||
|
|
|
|
|
| |||||||||||||||||||||||||||
Total intangible assets | $ | 38,982 | $ | (7,002 | ) | $ | 31,980 | $ | 276,613 | $ | (17,443 | ) | $ | 259,170 | ||||||||||||||||||
|
|
|
|
|
| |||||||||||||||||||||||||||
| Weighted average amortization period (in years) | Gross carrying amount at December 31, 2015 | Accumulated amortization | Net carrying value as of December 31, 2015 | Weighted average amortization period (in years) | Gross carrying amount at December 31, 2015 | Accumulated amortization | Net carrying value as of December 31, 2015 | |||||||||||||||||||||||||
Customer relationships | 5 | $ | 24,700 | $ | (365 | ) | $ | 24,335 | 5 | $ | 24,700 | $ | (365 | ) | $ | 24,335 | ||||||||||||||||
Customer backlog | 1 | 5,182 | (3,955 | ) | 1,227 | 1 | 5,182 | (3,955 | ) | 1,227 | ||||||||||||||||||||||
Brand names | 2 | 600 | (100 | ) | 500 | 2 | 600 | (100 | ) | 500 | ||||||||||||||||||||||
|
|
|
|
|
| |||||||||||||||||||||||||||
Total intangible assets | $ | 30,482 | $ | (4,420 | ) | $ | 26,062 | $ | 30,482 | $ | (4,420 | ) | $ | 26,062 | ||||||||||||||||||
|
|
|
|
|
| |||||||||||||||||||||||||||
Amortization expense totaled $2,625, $232,$13,071, $1,391, and $0, for the threesix months ended March 31,June 30, 2016, for the period March 14, 2015 to March 31,June 30, 2015, and for the period from January 1, 2015 to March 13, 2015, respectively, which is included in selling, general and administrative expenses in the combined statements of operations.
FORTERRA BUILDING PRODUCTS
Notes to Combined Financial Statements
(USD in thousands, unless stated otherwise)
8. Fair value measurement
The Company’s financial instruments consist primarily of cash and cash equivalents, trade and other receivables, derivative instruments, accounts payable, long-term debt and accrued liabilities. The carrying value of the Company’s trade receivables, trade payables, the asset based revolver and accrued liabilities approximates fair value due to their short-term maturity. The Company may adjust the carrying amount of certain nonfinancial assets to fair value on a non-recurring basis when they are impaired.
FORTERRA BUILDING PRODUCTS
Notes to Combined Financial Statements
(USD in thousands, unless stated otherwise)
The estimated carrying amount and fair value of the Company’s financial instruments and other assets and liabilities measured and recorded at fair value on a recurring basis is as follows for the dates indicated:
| Successor | Fair value measurements at March 31, 2016 using | Fair value measurements at June 30, 2016 using | ||||||||||||||||||||||||||||||
| Quoted Prices in Active Markets for Identical Assets (Level 1) | Significant Other Observable Inputs (Level 2) | Significant Unobservable Inputs (Level 3) | Total Fair Value March 31, 2016 | Quoted Prices in Active Markets for Identical Assets (Level 1) | Significant Other Observable Inputs (Level 2) | Significant Unobservable Inputs (Level 3) | Total Fair Value June 30, 2016 | |||||||||||||||||||||||||
Recurring: | ||||||||||||||||||||||||||||||||
Non-current liabilities | ||||||||||||||||||||||||||||||||
Derivative liability | $ | — | $ | 2,361 | $ | — | $ | 2,361 | $ | — | $ | 2,875 | $ | — | $ | 2,875 | ||||||||||||||||
| Fair value measurements at December 31, 2015 using | Fair value measurements at December 31, 2015 using | |||||||||||||||||||||||||||||||
| Quoted Prices in Active Markets for Identical Assets (Level 1) | Significant Other Observable Inputs (Level 2) | Significant Unobservable Inputs (Level 3) | Total Fair Value December 31, 2015 | Quoted Prices in Active Markets for Identical Assets (Level 1) | Significant Other Observable Inputs (Level 2) | Significant Unobservable Inputs (Level 3) | Total Fair Value December 31, 2015 | |||||||||||||||||||||||||
Recurring: | ||||||||||||||||||||||||||||||||
Non-current assets | ||||||||||||||||||||||||||||||||
Derivative assets | $ | — | $ | 9,093 | $ | — | $ | 9,093 | $ | — | $ | 9,093 | $ | — | $ | 9,093 | ||||||||||||||||
Liabilities and assets classified as level 2 which are recorded at fair value are valued using observable market inputs. The fair values of derivative assets and liabilities are determined using quantitative models that utilize multiple market inputs including interest rates and exchange rates to generate continuous yield or pricing curves and volatility factors to value the position. The majority of market inputs are actively quoted and can be validated through external sources, including brokers, market transactions and third-party pricing services. The fair values of derivative assets and liabilities include adjustments for market liquidity, counterparty credit quality and other instrument-specific factors, where appropriate. In addition, the Company incorporates within its fair value measurements a valuation adjustment to reflect the credit risk associated with the net position. Positions are netted by counterparties, and fair value for net long exposures is adjusted for counterparty credit risk while the fair value for net short exposures is adjusted for the Company’s own credit risk.
FORTERRA BUILDING PRODUCTS
Notes to Combined Financial Statements
(USD in thousands, unless stated otherwise)
The estimated carrying amount and fair value of the Company’s financial instruments and liabilities for which fair value is only disclosed is as follows:
| Successor | Fair value measurements at March 31, 2016 using | Fair value measurements at June 30, 2016 using | ||||||||||||||||||||||||||||||||||||||
| Carrying Amount March 31, 2016 | Quoted Prices in Active Markets for Identical Assets (Level 1) | Significant Other Observable Inputs (Level 2) | Significant Unobservable Inputs (Level 3) | Total Fair Value March 31, 2016 | Carrying Amount June 30, 2016 | Quoted Prices in Active Markets for Identical Assets (Level 1) | Significant Other Observable Inputs (Level 2) | Significant Unobservable Inputs (Level 3) | Total Fair Value June 30, 2016 | |||||||||||||||||||||||||||||||
Non-current liabilities | ||||||||||||||||||||||||||||||||||||||||
Senior Term Loan | $ | 468,027 | — | $ | 481,230 | — | $ | 481,230 | $ | 1,001,700 | — | $ | 1,008,533 | — | $ | 1,008,533 | ||||||||||||||||||||||||
Junior Term Loan | 237,261 | — | 252,200 | — | 252,200 | 238,077 | — | 252,525 | — | 252,525 | ||||||||||||||||||||||||||||||
Financing obligation | 210,934 | — | 217,404 | — | 217,404 | |||||||||||||||||||||||||||||||||||
| Successor | Fair value measurements at December 31, 2015 using | Fair value measurements at December 31, 2015 using | ||||||||||||||||||||||||||||||||||||||
| Carrying Amount December 31, 2015 | Quoted Prices in Active Markets for Identical Assets (Level 1) | Significant Other Observable Inputs (Level 2) | Significant Unobservable Inputs (Level 3) | Total Fair Value December 31, 2015 | Carrying Amount December 31, 2015 | Quoted Prices in Active Markets for Identical Assets (Level 1) | Significant Other Observable Inputs (Level 2) | Significant Unobservable Inputs (Level 3) | Total Fair Value December 31, 2015 | |||||||||||||||||||||||||||||||
Non-current liabilities | ||||||||||||||||||||||||||||||||||||||||
Senior Term Loan | $ | 469,383 | $ | — | $ | 470,543 | $ | — | $ | 470,543 | $ | 469,383 | $ | — | $ | 470,543 | $ | — | $ | 470,543 | ||||||||||||||||||||
Junior Term Loan | 236,446 | — | 259,675 | — | 259,675 | 236,446 | — | 259,675 | — | 259,675 | ||||||||||||||||||||||||||||||
The fair value of debt is the estimated amount LSF9 would have to pay to transfer its debt, including any premium or discount attributable to the difference between the stated interest rate and market rate of interest at the balance sheet date. Fair values are supported by observable market transactions when available.
9. Debt and deferred financing costs
The Company’s debt consisted of the following:
| Successor | Successor | Successor | Successor | |||||||||||||
| March 31, 2016 | December 31, 2015 | June 30, 2016 | December 31, 2015 | |||||||||||||
Senior Term Loan Credit Agreement | $ | 468,027 | $ | 469,383 | ||||||||||||
Junior Term Loan Credit Agreement | 237,261 | 236,446 | ||||||||||||||
Revolver | 19,027 | — | ||||||||||||||
Senior Term Loan Credit Agreement | $ | 1,001,700 | $ | 469,383 | ||||||||||||
Junior Term Loan Credit Agreement | 238,077 | 236,446 | ||||||||||||||
Financing obligation, net of $6,470 of deferred transaction costs (see | 210,934 | — | ||||||||||||||
|
|
|
| |||||||||||||
Total debt | 724,315 | 705,829 | 1,450,711 | 705,829 | ||||||||||||
Less: current portion debt | — | (2,191 | ) | — | (2,191 | ) | ||||||||||
|
|
|
| |||||||||||||
Total long-term debt | $ | 724,315 | $ | 703,638 | $ | 1,450,711 | $ | 703,638 | ||||||||
|
|
|
| |||||||||||||
FORTERRA BUILDING PRODUCTS
Notes to Combined Financial Statements
(USD in thousands, unless stated otherwise)
In connection with the financing of the Acquisition LSF9 entered into a Senior Term Loan Credit Agreement for borrowings of $635.0 million, a Junior Term Loan Credit Agreement for borrowings of $260.0 million, and drew $45.0 million under a $150.0 million revolving credit facility (the “Revolver”). Approximately $515.5 million is the obligation of Forterra as a joint and several obligation underASC 405-40, Obligations Resulting from Joint and Several Liability Arrangements. See also Note 1, Basis of Presentation-Successor.
In connection with the Cretex acquisition Forterra issued additional Senior term notes of $240.0 million. In conjunction with the issuance of this debt, LSF9 incurred $71.6 million of debt issuance costs and debt discounts; of which $51.9 million is attributed to the Company debt obligation.
All of the Company’s debt instruments are unconditionally guaranteed by Company and all its subsidiaries jointly and severally. The credit agreements are secured by substantially all of the assets of the Company.
In April 2016, LSF9 borrowed $205.0 million on the Revolver in order to finance the acquisition of U.S. Pipe of which $203.4 million was repaid during April 2016 with proceeds from an affiliated entity controlled by LSF9 but not included among the legal entities that comprise the Company. In connection with the additional proceeds obtained in April 2016 which benefited the Company, under ASC 405-40, Obligations Resulting from Joint and Several Liability Arrangements, the Company assumed an additional obligation of $203.4 million that was recognized as an increase to the Company’s allocated share of LSF9’s outstanding Senior Term Loan balance with an associated increase in debt issuance fees and discount related to the Senior Term Loan of $8.9 million. The affiliated entity was subsequently released as a co-obligor and its joint and several liability under terms of all of the 3rd party credit agreements.
On June 17, 2016, LSF9 borrowed an incremental $345.0 million on the Senior Term Loan and used the proceeds to pay a dividend of $338.3 million, net of debt issuance costs, to the shareholders of LSF9. The dividend was recorded as a return of contributed capital. LSF9 incurred debt issuance fees and discount of $6.7 million in connection with the issuance of the debt. The incremental borrowings incur interest at the same rate as the Senior Term Loan and matures in March 2022. Under ASC 405-40 Obligations Resulting from Joint and Several Liability Arrangements, the Company recognized the full amount of the incremental borrowing, net of related issuance costs and discount, as an obligation in the combined balance sheet.
The interest rate for both the Senior Term Loan and Junior Term Loan is set at LIBOR (with a 1% floor) plus a margin of 5.50% and 9.50%, respectively. The Senior Term Loan Agreement has a weighted average effective interest rate of 7.2%7.1% for the period ended March 31,June 30, 2016 and matures March 2022. The effective interest rate of the Junior Term Loan Credit Agreement was 11.7% for the period, and the debt matures March 2023. The effective interest rate includes the effects of deferred financing fees and original issue discount and premium amortization calculated using the effective interest method.
At March 31,June 30, 2016, the Company’s Revolver, which matures in March 2020, had total borrowing capacity of $250.0$285.0 million, with $19.0 million outstanding, net of unamortizedno amount outstanding. The Company incurred debt issuance costs of $3.0 million.$3.8 million related to the Revolver. The available credit under the Revolver is limited by a borrowing base which includes a portion of the Company’s current assets. Interest is floating, based on a reference rate plus an applicable margin. The weighted average annual interest rate on the Revolver was 2.06%2.03% for the threesix months ended March 31,June 30, 2016. In addition, Forterra pays a facility fee of between 25.0 and 37.5 basis points per annum based upon the utilization of the total Revolver facility. Availability under the Revolver at March 31,June 30, 2016 based on draws, and outstanding letters of credit and allowable borrowing base was $209.9$262.4 million.
FORTERRA BUILDING PRODUCTS
Notes to Combined Financial Statements
(USD in thousands, unless stated otherwise)
The Company incurred $15.2$33.8 million of cash interest expense for the threesix months ended March 31,June 30, 2016, of which $6.9 million was paid by affiliates of the Company.
As of March 31,June 30, 2016, minimum future principal payments on long-term debt are as follows:
| Total | Senior Term | Junior Term | Revolver | Total | Senior Term | Junior Term | Revolver | Financing Obligation | ||||||||||||||||||||||||||||
2016 | $ | — | $ | — | $ | — | $ | — | $ | — | $ | — | $ | — | $ | — | — | |||||||||||||||||||
2017 | — | — | — | — | — | — | — | — | — | |||||||||||||||||||||||||||
2018 | — | — | — | — | — | — | — | — | — | |||||||||||||||||||||||||||
2019 | — | — | — | — | — | — | — | — | — | |||||||||||||||||||||||||||
2020 | 21,996 | — | — | 21,996 | — | — | — | — | — | |||||||||||||||||||||||||||
Thereafter: | 747,321 | 487,321 | 260,000 | — | 1,513,125 | 1,035,721 | 260,000 | — | 217,404 | |||||||||||||||||||||||||||
|
|
|
|
|
|
|
|
| ||||||||||||||||||||||||||||
| $ | 769,317 | $ | 487,321 | $ | 260,000 | $ | 21,996 | $ | 1,513,125 | $ | 1,035,721 | $ | 260,000 | $ | — | $ | 217,404 | |||||||||||||||||||
|
|
|
|
|
|
|
|
| ||||||||||||||||||||||||||||
Covenants, Events of Default and Provisions
Under the terms of credit agreements above, LSF9 is required to comply with certain customary covenants, including among others, the limitation of indebtedness, limitations on liens, and limitations
FORTERRA BUILDING PRODUCTS
Notes to Combined Financial Statements
(USD in thousands, unless stated otherwise)
on certain cash distributions. The Revolver imposes only financial covenant, which requires LSF9 to maintain a fixed charge coverage ratio of no less than 1.00 to 1.00. The fixed charge coverage ratio is the ratio of consolidated earnings before interest, depreciation, and amortization (“EBITDA”) less cash payments for capital expenditures and income taxes to consolidated fixed charges (interest expense plus scheduled payments of principal on indebtedness). As of March 31,June 30, 2016, and December 31, 2015, LSF9 was in compliance with the debt covenants contained in its credit facilities.
Lines of Credit and Other Debt Facilities
The Company had stand-by letters of credit outstanding of $16.3$22.6 million as of March 31,June 30, 2016 which reduce the borrowings available under the credit facilities.
Joint and several obligations
As discussed above, the Company has recorded debt on its combined balance sheet under ASC 405-40, Obligations Resulting from Joint and Several Liability Arrangements. The Company and the affiliates of LSF9 were co-obligors and jointly and severally liable under terms of the LSF9’s credit agreements. The Company’s allocated portion of the $940.0 million of third party debt used to finance the Acquisition is $515.5 million. The initial obligation of $515.5 million was reflected on the Company’s combined balance sheet at the Acquisition date as $254.9 million of Senior Term Loan, $260 million of Junior Term Loan and $0.6 million of Revolver obligations. The remaining $424.5 million of the debt was allocated to affiliates of LSF9 that are not included in these financial statements based on the amounts affiliates of LSF9 were expected to repay and such amount has been fully repaid by affiliates. In April 2016, the Company’s affiliate co-obligors were released from joint and several liability under the LSF9 credit agreements. The Company is consequently the sole source of repayment for its $515.5 million share for the initial obligation under the credit agreements, as well as other obligations recorded on the balance sheet. In addition to the initial debt obligation of $515.5 million recorded by the company, during October 2015, additional LSF9 Senior Term Loan borrowings of $240 million to finance the Cretex acquisition were allocated in full to the Company.
FORTERRA BUILDING PRODUCTS
Notes to Combined Financial Statements
(USD in thousands, unless stated otherwise)
In April 2016, LSF9 borrowed an additional $205 million on the Revolver to finance the USP acquisition. On April 26, 2016, affiliates of the Company under control of LSF9 but not included in Forterra repaid $203.4 million of the Revolver balance that was drawn in April 2016 and $176.7 million of the Senior Term Loan, after which the other affiliates were released as obligors to the loan and the Company became the sole source of repayment under the LSF9 debt agreement. The Company has reflected the increased obligation as an increase in the Senior Term Loan in order to reflect the change in our obligation as a result of the additional borrowings of LSF9. A proportionate amount of debt issuance costs and discount related to the increased obligation under the Senior Term Loan has also been allocated to the Company at the time of the increased obligation. Additionally in June 2016, LSF9 incurred an additional $345 million of Senior Term Loan debt used to pay a dividend of $338.3 million (recorded as a return of contributed capital) to Lone Star, which was attributed to the Company as an additional obligation under the Senior Term Loan. The amounts recorded in the combined balance sheets represent the portion of LSF9’s outstanding obligation at that balance sheet date the Company was expected to repay. There are no other repayments that will be made by affiliates other than those mentioned above. As of June 30, 2016, the Company has recorded all debt held by LSF9 on its combined balance sheet as of June 30, 2016. The obligations are secured by substantially all of the assets of the Company.
10. Financing Obligation (Failed sale-leaseback)
On April 5, 2016, the Company sold properties in 47 sites throughout the U.S. and Canada to Pipe Portfolio Owner (Multi) LP (the “U.S. Buyer”) and FORT-BEN Holdings (ONQC) Ltd. (the “Canadian Buyer”) for an aggregate purchase price of approximately $204.3 million. On April 14, 2016, the Company sold additional properties in two sites located in the U.S. to the U.S. Buyer for an aggregate purchase price of approximately $11.9 million. In connection with these transactions, the Company and the U.S. Buyer and an affiliate of the Canadian Buyer entered into master land and building lease agreements under which the Company agreed to lease back each of the properties for an initial term of twenty years, followed by one optional renewal terms of 9 years 11 months. Leaseback rental will escalate annually by 2% during the initial term and based on changes in the Consumer Price Index capped at 4% during the optional renewal period. The proceeds received from the sale leaseback transactions net of transaction costs of $6.5 million amounted to $209.7 million.
The sale-leaseback transactions are considered to have one form of prohibited “continuing involvement” at the inception of the lease which preclude sale-leaseback accounting for transactions involving real estate in the combined financial statements of the Company because a guarantee by LSF9 provides the buyer-lessor or the lessor, as applicable, with additional collateral that reduces the buyer-lessor’s or the lessor’s, as applicable, risk of loss. As a result, the assets subject to the sale-leaseback will remain on the balance sheet of the Company and continue to be depreciated. For the six months ended June 30, 2016, the Company recognized $1.3 million of depreciation expense on assets sold under the financing obligation recorded on our combined balance sheet. The aggregate proceeds are recorded as a financing obligation in the combined balance sheet.
The Company has recorded a financing obligation of $210.9 million, net of $6.5 million of deferred transaction costs, in the combined balance sheet at June 30, 2016. During the six months ended June 30, 2016 the Company recognized $4.0 million of interest expense related to payments made under the financing obligation.
FORTERRA BUILDING PRODUCTS
Notes to Combined Financial Statements
(USD in thousands, unless stated otherwise)
The table below shows the minimum lease payments under the failed sale-leasebacks for the years ended:
| Total | ||||
2016 | $ | 8,674 | ||
2017 | 17,695 | |||
2018 | 18,049 | |||
2019 | 18,410 | |||
2020 | 18,779 | |||
Thereafter: | 590,558 | |||
|
| |||
| $ | 672,165 | |||
|
| |||
11. Accrued liabilities
Accrued liabilities consist of the following at March 31,June 30, 2016 and December 31, 2015:
| Successor | Successor | Successor | Successor | |||||||||||||
| March 31, 2016 | December 31, 2015 | June 30, 2016 | December 31, 2015 | |||||||||||||
Accrued payroll and employee benefits | $ | 18,590 | $ | 24,690 | $ | 28,055 | $ | 24,690 | ||||||||
Accrued taxes | 15,673 | 17,073 | 21,986 | 17,073 | ||||||||||||
Accrued rebates | 5,378 | 8,021 | 13,215 | 8,021 | ||||||||||||
Environmental & reclamation obligation | 1,953 | 903 | ||||||||||||||
Warranty | 1,868 | 2,429 | 1,692 | 2,429 | ||||||||||||
Other miscellaneous accrued liabilities | 4,037 | 3,415 | 6,458 | 2,512 | ||||||||||||
|
|
|
| |||||||||||||
| $ | 45,546 | $ | 55,628 | $ | 73,359 | $ | 55,628 | |||||||||
|
|
|
| |||||||||||||
11.12. Derivatives and hedging
The Company uses derivatives to manage selected foreign exchange and interest rate exposures. The Company does not use derivative instruments for speculative trading purposes, and cash flows from derivative instruments are included in net cash provided by (used in) financing activities in the combined statements of cash flows.
In May of 2015, the Company entered into the following derivative instruments: fixed-for-fixed cross currency swaps and fixed-for-float cross currency swaps. The fixed-for-float cross currency swaps are designated as cash flow hedges in accordance with ASC815-20, Derivatives- Hedging,with the effective portion of the changes in the fair value of the derivatives recorded to accumulated other comprehensive income, and any ineffective portion reflected directly in earnings as other operating expense in the combined statements of operations. The fixed-for-fixed cross currency swaps are not designated as hedge instruments; therefore changes in fair value are recognized immediately in earnings as other operating expenses in the combined statements of operations. The fixed-for-fixed cross currency swaps entered into in May 2015 were accelerated in March 2016 for proceeds of $6.6 million. Proceeds from the settlement of the currency swaps were used to make payments on the outstanding balance on the Revolver. The Company entered into new fixed-for-fixed cross currency swaps after the settlement. These fixed-for-fixed cross currency swaps were not designated as hedge instruments and changes in fair value were recognized in earnings as other operating expenses.
FORTERRA BUILDING PRODUCTS
Notes to Combined Financial Statements
(USD in thousands, unless stated otherwise)
A quantitative analysis is utilized to assess hedge effectiveness for cash flow hedges. The Company assesses the hedge effectiveness and measures the amount of ineffectiveness for the hedge relationships based on changes in spot exchange rates. For the threesix months ended March 31,June 30, 2016, the Company recognized a foreign exchange loss of $4.0$4.5 million in other operating income in the combined statement of operations, including a loss on settlement of $1.5 million, and $1.2$1.4 million included in other comprehensive loss related to cash flow hedges.
The Company has elected to present all derivative assets and derivative liabilities, on a net basis on its combined balance sheets when a legally enforceable International Swaps and Derivatives Association, Inc. (“ISDA”) Master Agreement exists. An ISDA Master Agreement is an agreement between two counterparties, which may have multiple derivative transactions with each other governed by such agreement, and such ISDA Master Agreement generally provides for the net settlement of all or a specified group of these derivative transactions, through a single payment, in a single currency, in the event of a default on, or affecting any, one derivative transaction or a termination event affecting all, or a specified group of, derivative transactions. At March 31,June 30, 2016 and December 31, 2015, the Company’s derivative instruments fall under an ISDA master netting agreement.
The following table presents the fair values of derivative assets and liabilities in the combined successor balance sheets:
| Successor | Successor | |||||||||||||||||||||||||||||||
| March 31, 2016 | June 30, 2016 | |||||||||||||||||||||||||||||||
| Derivative Assets | Derivative Liabilities | Derivative Assets | Derivative Liabilities | |||||||||||||||||||||||||||||
| Notional Amount | Fair Value | Notional Amount | Fair Value | Notional Amount | Fair Value | Notional Amount | Fair Value | |||||||||||||||||||||||||
Fixed-for-fixed cross currency swap | $ | — | $ | — | $ | 79,531 | $ | (2,606 | ) | $ | — | $ | — | $ | 79,531 | $ | (2,937 | ) | ||||||||||||||
Fixed-for-float cross currency swap | 81,991 | 245 | — | — | 81,991 | 62 | — | — | ||||||||||||||||||||||||
|
|
|
| |||||||||||||||||||||||||||||
Total derivatives, gross | 245 | (2,606 | ) | 62 | (2,937 | ) | ||||||||||||||||||||||||||
Less: Legally enforceable master netting agreements | — | — | — | — | ||||||||||||||||||||||||||||
|
|
|
| |||||||||||||||||||||||||||||
Total derivatives, net | $ | 245 | $ | (2,606 | ) | $ | 62 | $ | (2,937 | ) | ||||||||||||||||||||||
|
|
|
| |||||||||||||||||||||||||||||
| Successor | Successor | |||||||||||||||||||||||||||||||
| December 31, 2015 | December 31, 2015 | |||||||||||||||||||||||||||||||
| Derivative Assets | Derivative Liabilities | Derivative Assets | Derivative Liabilities | |||||||||||||||||||||||||||||
| Notional Amount | Fair Value | Notional Amount | Fair Value | Notional Amount | Fair Value | Notional Amount | Fair Value | |||||||||||||||||||||||||
Fixed-for-fixed cross currency swap | $ | 79,531 | $ | 7,667 | $ | — | $ | — | $ | 79,531 | $ | 7,667 | $ | — | $ | — | ||||||||||||||||
Fixed-for-float cross currency swap | 81,991 | 1,426 | — | — | 81,991 | 1,426 | — | — | ||||||||||||||||||||||||
|
|
|
| |||||||||||||||||||||||||||||
Total derivatives, gross | 9,093 | — | — | 9,093 | — | — | ||||||||||||||||||||||||||
Less: Legally enforceable master netting agreements | — | — | — | — | ||||||||||||||||||||||||||||
|
|
|
| |||||||||||||||||||||||||||||
Total derivatives, net | $ | 9,093 | $ | — | $ | 9,093 | $ | — | ||||||||||||||||||||||||
|
|
|
| |||||||||||||||||||||||||||||
FORTERRA BUILDING PRODUCTS
Notes to Combined Financial Statements
(USD in thousands, unless stated otherwise)
The following table presents the gain (loss) recognized in the statements of operations and comprehensive income on derivative instruments in cash flow hedging relationships. Losses on hedge instruments were recorded in other operating income in the combined statements of operations:
| Successor | ||||||||||||
| Three months ended, | Successor | Predecessor | ||||||||||
| 2016 | Six months ended, 2016 | For the period from March 14 to June 30, 2015 | ||||||||||
Cash flow hedges | ||||||||||||
Cross currency swaps | ||||||||||||
Loss on derivatives recognized in Accumulated other comprehensive loss | $ | (1,209 | ) | $ | (1,427 | ) | $ | 412 | ||||
Loss on derivatives not designated as hedges | (2,463 | ) | (2,874 | ) | (1,124 | ) | ||||||
12.13. Commitments and contingencies
The Company is involved in legal proceedings and litigation in the ordinary course of business. In the opinion of management, the outcome of such matters will not have a material adverse effect on the Company’s combined financial position, results of operations, or liquidity. Other than routine litigation incidental to the Company business, there are no material legal proceedings to which the Company is a party or to which any of the Company’s properties are subject.
In connection with the Earn-out contingency described in Note 3, the Acquisition included contingent consideration of up to $100$100.0 million if and to the extent the 2015 financial results of the businesses acquired by Lone Star in the Acquisition, including the Company and Forterra UK, exceeded a specified Adjusted EBITDA target for fiscal year 2015, as calculated pursuant to the terms of the purchase agreement. If such Adjusted EBITDA calculation exceeds the specified target, LSF9, and therefore, Forterra would be required to pay HC an amount equal to a multiple of such excess Adjusted EBITDA, with any payment capped at $100.0 million. In April 2016, the Company provided an earn-out statement to HC demonstrating that no payment was required. On June 13, 2016, HC provided notification that it is disputing, among other things, the Company’s calculation of Adjusted EBITDA under the purchase agreement and asserting that a payment should be made in the amount of $100.0 million. The Company does not believe HC’s position has merit and intends to vigorously oppose HC’s assertions. As of March 31,June 30, 2016, and December 31, 2015, no liability for this contingency has been accrued as payment of any earn-out is not considered probable. However, the outcome of this matter is uncertain, and no assurance can be given to the ultimate outcome of the resulting proceedings. If LSF9 is unsuccessful in resolving the dispute, the Company could recognize a material charge to its earnings.
Long-term incentive plan
Following the Acquisition the Company implemented a cash-based long term incentive plan (the “LTIP”), which entitles the participants in the LTIP a potential cash payout upon a monetization event as defined by the LTIP. Potential monetization events include the sale of the Company, an initial public offering where Lone Star reduces its ownership interest in the Company below 50% or at Lone Star’s discretion, or through certain cash distribution as defined in the LTIP. Before the payout of any cash the LTIP requires Lone Star receive a return of their investment plus a specified internal rate of return, which is calculated by comparing the return to Lone Star over the timeline of the investment in the
FORTERRA BUILDING PRODUCTS
Notes to Combined Financial Statements
(USD in thousands, unless stated otherwise)
Company. As of March 31,June 30, 2016, no such monetization events had occurred, and therefore no amounts were accrued in the accompanying combined balance sheets as of March 31,June 30, 2016 and December 31, 2015. The Company is contemplating an initial public offering as early as the third quarter of 2016, but the initial public offering is not expected to bereach the required return on investment to trigger a monetization eventpayout under the LTIP.
FORTERRA BUILDING PRODUCTS
Notes to Combined Financial Statements
(USD in thousands, unless stated otherwise)
13.14. Related party transactions
Successor
Hudson Advisors
The Company has an advisory agreement with Hudson Advisors, an affiliate of Lone Star, to provide certain management oversight services to the Company, including assistance and advice on strategic plans, obtaining and maintaining certain legal documents, and communicating and coordinating with service providers. The Company incurred fees totaling $884$3.1 million and $3.2 million for the threesix months ended June 30, 2016 and for the period from March 31, 201614 to June 30, 2015, respectively, included in Selling, general and administrative expense on the combined Successor statement of operations.
Affiliates receivable
The Company pays for certain services provided for affiliates which the Company bills to its affiliates. At June 30, 2016, the Company recorded a receivable of $0.5 million for services paid on behalf of affiliates in other current assets on the Combined Balance Sheet.
Predecessor
Parent company net investment
During the Predecessor period the combined financial statements for the Company are based on the accounting records of HC. Within these records, each subsidiary of BP NAM has its own equity accounts in the books and records, as well as intercompany balances due (to)/from affiliates and operations within HC. These intercompany balances are considered by HC as part of the capital structure of these entities and are not regularly settled in cash with the affiliate counterparties. Therefore, these intercompany balances act as clearing accounts between the parties and consist of the accumulated net transactions between the Company and other entities and operations of HC and may include both operating items (allocated expenses and purchases of services and materials) and equity items (transfers of assets, cash and dividends). The Company has recorded all such equity and intercompany balances in a single caption, Parent company net investment.
Allocated expenses
The Predecessor was allocated selling, general and administrative expenses from the Parent for certain shared services of $4,112, for the period from January 1, 2015 to March 13, 2015. The allocated costs are included in costs of goods sold or selling, general and administrative expenses in the combined statements of operations. The historical costs and expenses reflected in our combined financial statements include an allocation for certain corporate functions historically provided by HC or its wholly-owned subsidiaries. Substantially all of the Company’s senior management is employed by HC and certain functions critical to the Company’s operations are centralized and managed by HC. Historically, the centralized functions have included executive senior management, financial reporting,
FORTERRA BUILDING PRODUCTS
Notes to Combined Financial Statements
(USD in thousands, unless stated otherwise)
financial planning and analysis, accounting, shared services, information technology, tax, risk management, treasury, legal, human resources, land management and strategy and development. Additionally, the Company temporarily rented office space provided by affiliates of HC. The cost of each of these services has been allocated to the Company on the basis of the Company’s relative net sales or head count as compared to that of HC depending upon which allocation methodology is more meaningful for each service. The Company and HC believe that these allocations reasonably reflect the utilization of services provided and benefits received. However, these amounts are not necessarily representative of the amounts that would have been incurred by the Company as a standalone entity.
14.15. Segment reporting
Segment information is presented in accordance with ASC 280,Segment Reporting (“ASC 280”), which establishes standards for reporting information about operating segments. It also establishes standards for related disclosures about products and geographic areas. Operating segments are
FORTERRA BUILDING PRODUCTS
Notes to Combined Financial Statements
(USD in thousands, unless stated otherwise)
defined as components of an enterprise that engage in business activities that earn revenues, incur expenses and prepare separate financial information that is evaluated regularly by the Company’s chief operating decision maker in order to allocate resources and assess performance. The Corporate and Other segment includes expenses related to certain executive salaries, interest costs related to long-term debt, acquisition related costs, and other corporate costs that are not directly attributable to our operating segments.
Net sales from the major products sold to external customers include drainage pipe and precast products, concrete and steel water transmission pipe, and clay bricks and concrete blocks.
The Company’s two geographic areas consist of the United States and Canada for which it reports net sales, fixed assets and total assets. For purposes of evaluating segment profit, the CODM reviews earnings before interest, taxes, depreciation and amortization (“EBITDA”) as a basis for making the decisions to allocate resources and assess performance.
FORTERRA BUILDING PRODUCTS
Notes to Combined Financial Statements
(USD in thousands, unless stated otherwise)
The following tables set forth reportable segment information with respect to net sales and other financial information attributable to our reportable segments for the periods from January 1, 2016 to March 31,June 30, 2016, for the period from March 14, 2015 to March 31,June 30, 2015, for the period from January 1, 2015 to March 13, 2015:
Successor
| For the three months ended March 31, 2016: | Drainage Pipe & Products | Water Pipe & Products | Bricks | Corporate and Other | Total | |||||||||||||||||||||||||||||||||||
| For the six months ended June 30, 2016: | Drainage Pipe & Products | Water Pipe & Products | Bricks | Corporate and Other | Total | |||||||||||||||||||||||||||||||||||
Net Sales | $ | 144,321 | $ | 40,471 | $ | 30,338 | $ | 2,204 | $ | 217,334 | $ | 336,549 | $ | 229,641 | $ | 71,424 | $ | 2,528 | $ | 640,142 | ||||||||||||||||||||
Income (loss) before income taxes | 18,479 | 2,590 | (1,574 | ) | (33,799 | ) | (14,304 | ) | 52,211 | 19,343 | 3,276 | (78,610 | ) | (3,780 | ) | |||||||||||||||||||||||||
Depreciation and amortization | 9,470 | 1,563 | 2,467 | 259 | 13,759 | 19,551 | 16,502 | 3,992 | 375 | 40,420 | ||||||||||||||||||||||||||||||
Interest (income)/expense | — | — | — | 17,290 | 17,290 | |||||||||||||||||||||||||||||||||||
Interest expense | 3,272 | 772 | — | 38,085 | 42,129 | |||||||||||||||||||||||||||||||||||
|
|
|
|
|
|
|
|
|
| |||||||||||||||||||||||||||||||
EBITDA | $ | 27,949 | $ | 4,153 | $ | 893 | $ | (16,250 | ) | $ | 16,745 | $ | 75,034 | $ | 36,617 | $ | 7,268 | $ | (40,150 | ) | $ | 78,769 | ||||||||||||||||||
|
|
|
|
|
|
|
|
|
| |||||||||||||||||||||||||||||||
Capital expenditures | $ | 1,941 | $ | 599 | $ | 473 | — | $ | 3,013 | $ | 6,270 | $ | 3,403 | $ | 4,708 | 624 | $ | 15,005 | ||||||||||||||||||||||
|
|
|
|
|
|
|
|
|
| |||||||||||||||||||||||||||||||
Total assets at March 31, 2016 | $ | 712,091 | $ | 130,305 | $ | 150,437 | $ | 10,050 | $ | 1,002,883 | ||||||||||||||||||||||||||||||
Total assets at June 30, 2016 | $ | 724,744 | $ | 1,122,392 | $ | 161,143 | $ | 25,831 | $ | 2,034,110 | ||||||||||||||||||||||||||||||
|
|
|
|
|
|
|
|
|
| |||||||||||||||||||||||||||||||
| For the period from March 14 to March 31, 2015: | Drainage Pipe & Products | Water Pipe & Products | Bricks | Corporate and Other | Total | |||||||||||||||||||||||||||||||||||
| For the period from March 14 to June 30, 2015: | Drainage Pipe & Products | Water Pipe & Products | Bricks | Corporate and Other | Total | |||||||||||||||||||||||||||||||||||
Net Sales | $ | 22,676 | $ | 8,921 | $ | 5,934 | $ | 483 | $ | 38,014 | $ | 141,031 | $ | 61,888 | $ | 45,613 | $ | 2,783 | $ | 251,315 | ||||||||||||||||||||
Income (loss) before income taxes | 2,225 | 2,443 | 103 | (22,341 | ) | (17,570 | ) | 14,460 | 3,767 | (3,779 | ) | (47,586 | ) | (33,138 | ) | |||||||||||||||||||||||||
Depreciation and amortization | 716 | 449 | 337 | 294 | 1,796 | 5,094 | 2,938 | 2,821 | 207 | 11,060 | ||||||||||||||||||||||||||||||
Interest (income)/expense | — | — | — | 2,474 | 2,474 | — | — | — | 15,551 | 15,551 | ||||||||||||||||||||||||||||||
|
|
|
|
|
|
|
|
|
| |||||||||||||||||||||||||||||||
EBITDA | $ | 2,941 | $ | 2,892 | $ | 440 | $ | (19,573 | ) | $ | (13,300 | ) | $ | 19,554 | $ | 6,705 | $ | (958 | ) | $ | (31,828 | ) | $ | (6,527 | ) | |||||||||||||||
|
|
|
|
|
|
|
|
|
| |||||||||||||||||||||||||||||||
Capital expenditures | $ | — | $ | — | $ | — | $ | — | $ | — | $ | 2,849 | $ | 2,204 | $ | 1,993 | $ | — | $ | 7,046 | ||||||||||||||||||||
|
|
|
|
|
|
|
|
|
| |||||||||||||||||||||||||||||||
Total assets at December 31, 2015 | $ | 626,477 | $ | 136,909 | $ | 147,699 | $ | 27,790 | $ | 938,875 | $ | 626,477 | $ | 136,909 | $ | 147,699 | $ | 27,790 | $ | 938,875 | ||||||||||||||||||||
|
|
|
|
|
|
|
|
|
| |||||||||||||||||||||||||||||||
Predecessor
| ||||||||||||||||||||||||||||||||||||||||
| For the period from January 1 to March 13, 2015: | Drainage Pipe & Products | Water Pipe & Products | Bricks | Corporate and Other | Total | |||||||||||||||||||||||||||||||||||
Net Sales | $ | 79,341 | $ | 30,464 | $ | 19,922 | $ | 2,893 | 132,620 | |||||||||||||||||||||||||||||||
Income (loss) before income taxes | 8,839 | (3,192 | ) | (4,000 | ) | (8,145 | ) | (6,498 | ) | |||||||||||||||||||||||||||||||
Depreciation and amortization | 3,231 | 1,030 | 2,505 | 128 | 6,894 | |||||||||||||||||||||||||||||||||||
Interest (income)/expense | — | — | 18 | 66 | 84 | |||||||||||||||||||||||||||||||||||
|
|
|
|
| ||||||||||||||||||||||||||||||||||||
EBITDA | $ | 12,070 | $ | (2,162 | ) | $ | (1,477 | ) | $ | (7,951 | ) | $ | 480 | |||||||||||||||||||||||||||
|
|
|
|
| ||||||||||||||||||||||||||||||||||||
Capital expenditures | $ | 621 | $ | 1,851 | $ | 272 | $ | — | $ | 2,744 | ||||||||||||||||||||||||||||||
|
|
|
|
| ||||||||||||||||||||||||||||||||||||
FORTERRA BUILDING PRODUCTS
Notes to Combined Financial Statements
(USD in thousands, unless stated otherwise)
Predecessor
| For the period from January 1 to March 13, 2015: | Drainage Pipe & Products | Water Pipe & Products | Bricks | Corporate and Other | Total | |||||||||||||||
Net Sales | $ | 79,341 | $ | 30,464 | $ | 19,922 | $ | 2,893 | 132,620 | |||||||||||
Income (loss) before income taxes | 8,839 | (3,192 | ) | (4,000 | ) | (8,145 | ) | (6,498 | ) | |||||||||||
Depreciation and amortization | 3,231 | 1,030 | 2,505 | 128 | 6,894 | |||||||||||||||
Interest (income)/expense | — | — | 18 | 66 | 84 | |||||||||||||||
|
|
|
|
|
|
|
|
|
| |||||||||||
EBITDA | $ | 12,070 | $ | (2,162 | ) | $ | (1,477 | ) | $ | (7,951 | ) | $ | 480 | |||||||
|
|
|
|
|
|
|
|
|
| |||||||||||
Capital expenditures | $ | 621 | $ | 1,851 | $ | 272 | $ | — | $ | 2,744 | ||||||||||
|
|
|
|
|
|
|
|
|
| |||||||||||
The Company is also required by ASC 280 to disclose additional information related to geographic location. The Company has operations in the United States and Canada. The Company has both revenues and long-lived assets in each country and those assets and revenues are recorded within geographic location as follows:
| Property, plant and equipment, net | ||||||||||||||||
| Successor | Successor | Successor | Successor | |||||||||||||
| March 31, 2016 | December 31, 2015 | June 30, 2016 | December 31, 2015 | |||||||||||||
United States | $ | 330,552 | $ | 305,843 | $ | 561,668 | $ | 305,843 | ||||||||
Canada | 87,947 | 83,081 | 86,953 | 83,081 | ||||||||||||
|
|
|
| |||||||||||||
| $ | 418,499 | $ | 388,924 | $ | 648,621 | $ | 388,924 | |||||||||
|
|
|
| |||||||||||||
| Net Sales | Successor | Predecessor | Successor | Predecessor | ||||||||||||||||||||
| Three months ended March 31, 2016 | For the period from March 14 to March 31, 2015 | For the period from January 1 to March 13, 2015 | Six months ended June 30, 2016 | For the period from March 14 to June 30, 2015 | For the period from January 1 to March 13, 2015 | |||||||||||||||||||
United States | $ | 192,486 | $ | 33,073 | $ | 112,299 | $ | 568,394 | $ | 208,150 | $ | 112,299 | ||||||||||||
Canada | 24,848 | 4,941 | 20,321 | 71,748 | 43,165 | 20,321 | ||||||||||||||||||
|
|
|
|
|
| |||||||||||||||||||
| $ | 217,334 | $ | 38,014 | $ | 132,620 | $ | 640,142 | $ | 251,315 | $ | 132,620 | |||||||||||||
|
|
|
|
|
| |||||||||||||||||||
15.16. Income Taxes
The Company recorded income tax benefits (expense) of $10,368, $0,$36,553, $(1,579) and $742 for the threesix months ended March 31,June 30, 2016, for the period from March 13,14, 2015 to March 31,June 30, 2015 and for the period from January 1, 2015 to March 31,13, 2015, respectively. The income tax benefit for the threesix months ended March 31,June 30, 2016 is primarily attributable to the reduction of the Company’s valuation allowance and corresponding recognition of a deferred tax benefit after giving consideration to deferred income tax liabilities of $11.1$34.9 million recorded in the acquisition of Sherman-Dixie offset byand USP. The income tax expense of $.8 millionfor the period from March 13, 2015 to June 30, 2015 is primarily attributable to the profitability of foreign operations.
FORTERRA BUILDING PRODUCTS
Notes to Combined Financial Statements
(USD in thousands, unless stated otherwise)
16.17. Employee benefit plans
Defined Contribution Plans - Successor
Subsequent to the Acquisition, the Company’s employees were able to participate in a 401K defined contribution plan. The Company contributes funds into this plan subject to certain limits. For the threesix months ended March 31,June 30, 2016, the Company recorded an expense of $1,999$6,330 for these contributions. From January 1 through March 13, 2015 and for the period from March 14, 20162015 to March 31,June 30, 2016, the Company recorded an expense of $1,724 for the Predecessor’s participation in a similar plan sponsored by HC and $1,672$3,474 for the Successor’s plan.
Defined Benefit Pension Plans and Other Post-Retirement Benefits - Predecessor
Employees of the Predecessor participated in defined benefit plans as described below that were both sponsored by the Predecessor and sponsored by others. The combined Predecessor financial statements have been prepared on a historical basis reflecting the applicable liabilities and financial
FORTERRA BUILDING PRODUCTS
Notes to Combined Financial Statements
(USD in thousands, unless stated otherwise)
statement disclosures related to the defined benefit plans participated in under HC. The defined benefit obligations and disclosures do not necessarily reflect the costs the Predecessor would have incurred as a stand-alone entity. The related pension and post-retirement benefit liabilities were previously allocated to the Predecessor but were retained by HC subsequent to the Acquisition of the Company.
Canadian employee benefit plans
The Canadian companies within the Predecessor sponsored several qualified and nonqualified pension plans and other postretirement benefit plans (“OPEB”) for substantially all of their employees. Such plans are defined benefit plans. The benefits provided under these plans are based primarily on years of credited service and final average pensionable pay as defined under the respective plan provisions. The obligations associated with these benefit plans were not retained by the Successor. The detail of the net period cost for the defined benefit plans for the period from January 1, 2015 to March 13, 2015 is shown below.
| Pension and Other Postretirement Benefits (Predecessor) | ||||
| For the period from January 1 to March 13, 2015 | ||||
Service cost | $ | 676 | ||
Interest cost | (3 | ) | ||
|
| |||
Net Expense | $ | 673 | ||
|
| |||
18. Investment in equity method investee
The Company’s 50% investment in a joint venture that produces concrete pipe and precast concrete is $56,656 at June 30, 2016, which is included within the Drainage Pipe & Products segment. Selected historical financial data for the investee is as follows (unaudited):
| Six months ended June 30, 2016 | ||||
Net sales | $ | 63,004 | ||
Gross profit | 18,014 | |||
Income from operations | 10,097 | |||
Net income | 10,211 | |||
17.19. Subsequent events
Sale-Leaseback Transaction
On April 5,August 4, 2016 the Company through its subsidiaries in North America, sold properties in 47 sites throughoutpurchased all of the U.S.outstanding stock of Bio Clean Environmental Services, Inc. and CanadaModular Wetland Systems, Inc. (together “Modular Wetlands”), California corporations which design, manufacture, distribute and sell of storm water products to Pipe Portfolio Owner (Multi) LPend customers, for cash consideration of $30.0 million subject to customary net working capital and Fort-Ben Holdings (ONQC) Ltd. (collectively the “Buyer”) for an aggregate purchase price adjustments. Modular Wetlands will operate as part of approximately $204.3 million. On April 14, 2016, the Company sold additional properties in two sites located in the U.S. toCompany’s Water Pipe Portfolio Owner (Multi) LP for an aggregate purchase price of approximately $11.9 million. The Company and Buyer contemporaneously entered into master land and building lease agreements& Products reportable segment.
FORTERRA BUILDING PRODUCTS
Notes to Combined Financial Statements
(USD in thousands, unless stated otherwise)
under which20. Pro forma earnings per share
The pro forma earnings per share data for the Company agreedsix months ended June 30, 2016 is based on our historical combined statement of operations after giving effect to lease back eachthe following as if they occurred at the beginning of the properties forperiod: (1) a 41,619.472 to 1 stock split which occurred on October 6, 2016; (2) a reorganization consolidating all entities comprising Forterra under a new parent entity (Forterra, Inc.), which will include Forterra, Inc. issuing an initial termaggregate of twenty years, followed by one optional renewal terms3,750,002 post-stock split shares to Forterra, Inc.’s sole stockholder; and (3) the issuance and sale of 9 years 11 months. Leaseback rental will escalate annually by 2% during the initial term and based on changes18,420,000 shares of common stock to be issued in the Consumer Price Index capped at 4% during the optional renewal period. The net proceeds received from the sale leaseback transactions amounted to approximately $209.7 million, netoffering.
See below for calculation of taxes and transaction costs.pro forma earnings per share:
The sale-leaseback transactions are considered to have a form of prohibited “continuing involvement” at the inception of the lease which preclude sale-leaseback accounting for transactions involving real estate in the combined financial statements of the Company because a guarantee by LSF9 provides the buyer-lessor with additional collateral that reduces the buyer-lessor’s risk of loss. As a result, the assets subject to the sale-leaseback will remain on the balance sheet of the Company and continue to be depreciated. The aggregate proceeds received will be recorded as a financing obligation.
U.S. Pipe Acquisition
The Company acquired substantially all of the stock of USP Holdings Inc., a ductile iron pipe producer, on April 15, 2016 for an initial purchase price of $775.1 million, which was funded with a $205.0 million borrowing by LSF9 on the Revolver, a portion of the proceeds of the above referenced sale-leaseback and a capital contribution of $402.1 million from our parent. USP Holdings Inc. will operate as part of the Company’s Water Pipe & Products reportable segment.
Roof Tile Divestiture
On April 12, 2016, the Company entered into and closed on a Stock Purchase Agreement to sell all of its ownership interest in its roof tile business for an initial price of $10.5 million, subject to customary working capital adjustments.
Changes to debt obligations and borrowing capacity
In April 2016, the Company’s total borrowing capacity under its Revolver was increased from $250.0 million to $285.0 million.
In April 2016, LSF9 borrowed $205.0 million on the Revolver in order to finance the acquisition of U.S. Pipe, as noted above, of which $203.4 million was repaid during April 2016 with proceeds from an affiliated entity controlled by LSF9 but not included among the legal entities that comprise Forterra. In connection with the additional proceeds obtained in April 2016 which benefitted the Company, underASC 405-40, Obligations Resulting from Joint and Several Liability Arrangements,the Company assumed an additional obligation of $203.4 million that was recognized as an increase to the Company’s allocated share of LSF9’s outstanding Senior Term Loan balance.
On June 16, 2016, LSF9 borrowed an incremental $345.0 million on the Senior Term Loan and used the proceeds to pay a dividend of the same amount to the shareholders of LSF9. LSF9 incurred debt issuance fees and discount of $6.7 million in connection with the issuance of the debt. The incremental borrowings incur interest at the same rate as the Senior Term Loan (see Note 10) and matures in March 2022. UnderASC 405-40 Obligations Resulting from Joint and Several Liability Arrangements, Forterra will recognize the full amount of the incremental borrowing, net of related issuance costs and discount, as an obligation during the second quarter of 2016.
| Six months ended June 30, 2016 | ||||
Net income available to common shareholders | $ | 32,753 | ||
Historical outstanding common shares of the combined entity | — | |||
Effect of reorganization, issuance of common shares and stock split | 63,789,474 | |||
Pro forma basic weighted average outstanding common shares | 63,789,474 | |||
Pro forma diluted weighted average outstanding common shares | 63,919,754 | |||
Pro formaEarnings per share | ||||
Basic | $ | 0.51 | ||
Diluted | $ | 0.51 | ||
Combined Financial Statements
As of December 31, 2015 (Successor) and 2014 (Predecessor) and for the period from March 14, 2015 to December 31, 2015 (Successor), for the period from January 1, 2015 to March 13, 2015 and for the years ended December 31, 2014 and 2013 (Predecessor)
Report of Independent Registered Public Accounting Firm
The Board of Directors and Management
LSF9 Concrete Holdings, Ltd.
We have audited the accompanying combined balance sheets of Forterra Building Products (the Successor) as of December 31, 2015, and the related combined statements of operations, comprehensive loss, shareholder’s equity and cash flows for the period from March 14, 2015 to December 31, 2015. We have also audited the accompanying combined balance sheets of the North American building products operations of HeidelbergCement A.G. (the Predecessor) as of December 31, 2014 and the related combined statements of operations, comprehensive loss, parent company net investment and cash flows for the period from January 1, 2015 to March 13, 2015 and for each of the two years in the period ended December 31, 2014. These financial statements are the responsibility of the Company’s management. Our responsibility is to express an opinion on these financial statements based on our audits.
We conducted our audits in accordance with the standards of the Public Company Accounting Oversight Board (United States). Those standards require that we plan and perform the audit to obtain reasonable assurance about whether the financial statements are free of material misstatement. We were not engaged to perform an audit of the Company’s internal control over financial reporting. Our audits included consideration of internal control over financial reporting as a basis for designing audit procedures that are appropriate in the circumstances, but not for the purpose of expressing an opinion on the effectiveness of the Company’s internal control over financial reporting. Accordingly, we express no such opinion. An audit also includes examining, on a test basis, evidence supporting the amounts and disclosures in the financial statements, assessing the accounting principles used and significant estimates made by management, and evaluating the overall financial statement presentation. We believe that our audits provide a reasonable basis for our opinion.
In our opinion, the financial statements referred to above present fairly, in all material respects, the combined financial position of Forterra Building Products at December 31, 2015, and the combined results of its operations and its cash flows for the period from March 14, 2015 to December 31, 2015, in conformity with U.S. generally accepted accounting principles. Also in our opinion, the Predecessor financial statements referred to above present fairly in all material respects, the combined financial position of the Predecessor at December 31, 2014 and the combined results of its operations and cash flows for the period from January 1, 2015 to March 13, 2015 and each of the two years in the period ended December 31, 2014, in conformity with U.S. generally accepted accounting principles.
/s/ Ernst & Young LLP
Dallas, Texas
July 8, 2016
Combined Statements of Operations
(In $US thousands)
| Successor | Predecessor | |||||||||||||||
| For the period from March 14 to December 31, | For the period from January 1 to March 13, | Years ended December 31, | ||||||||||||||
| 2015 | 2015 | 2014 | 2013 | |||||||||||||
Net sales | $ | 722,664 | $ | 132,620 | $ | 736,963 | $ | 697,948 | ||||||||
Cost of goods sold | 626,498 | 117,831 | 631,454 | 611,660 | ||||||||||||
|
|
|
|
|
|
|
| |||||||||
Gross profit | 96,166 | 14,789 | 105,509 | 86,288 | ||||||||||||
Selling, general & administrative expenses | (134,971 | ) | (21,683 | ) | (102,107 | ) | (87,393 | ) | ||||||||
Impairment and restructuring charges | (1,185 | ) | (542 | ) | (4,219 | ) | (250,577 | ) | ||||||||
Earnings from equity method investee | 8,429 | 67 | 4,451 | (216 | ) | |||||||||||
Gain (loss) on sale of property, plant and equipment and business, net | (618 | ) | 122 | 2,329 | 3,998 | |||||||||||
Other operating income | 1,450 | 872 | 4,636 | 5,234 | ||||||||||||
|
|
|
|
|
|
|
| |||||||||
| (126,895 | ) | (21,164 | ) | (94,910 | ) | (328,954 | ) | |||||||||
|
|
|
|
|
|
|
| |||||||||
Income (loss) from operations | (30,729 | ) | (6,375 | ) | 10,599 | (242,666 | ) | |||||||||
Other income (expenses) | ||||||||||||||||
Interest expense | (45,953 | ) | (84 | ) | — | — | ||||||||||
Other income (expense), net | (326 | ) | (39 | ) | (594 | ) | 947 | |||||||||
|
|
|
|
|
|
|
| |||||||||
Income (loss) from continuing operations before income taxes | (77,008 | ) | (6,498 | ) | 10,005 | (241,719 | ) | |||||||||
Income tax (expense) benefit | (5,778 | ) | 742 | (2,417 | ) | (2,561 | ) | |||||||||
|
|
|
|
|
|
|
| |||||||||
Income (loss) from continuing operations | (82,786 | ) | (5,756 | ) | 7,588 | (244,280 | ) | |||||||||
|
|
|
|
|
|
|
| |||||||||
Discontinued operations | ||||||||||||||||
Income (loss) from discontinued operations (including gain (loss) on disposal of $0, and $174, respectively) | — | — | 1,976 | (3,018 | ) | |||||||||||
Income tax benefit (expense) from discontinued operations | — | — | (716 | ) | — | |||||||||||
|
|
|
|
|
|
|
| |||||||||
Gain (loss) on discontinued operations, net of income tax | — | — | 1,260 | (3,018 | ) | |||||||||||
|
|
|
|
|
|
|
| |||||||||
Net income (loss) | $ | (82,786 | ) | $ | (5,756 | ) | $ | 8,848 | $ | (247,298 | ) | |||||
|
|
|
|
|
|
|
| |||||||||
See accompanying notes to the combined financial statements
Combined Statements of Comprehensive Loss
(USD in thousands)
| Successor | Predecessor | |||||||||||||||
| For the period from March 14 to December 31, | For the period from January 1 to March 13, | For the year ended December 31, | ||||||||||||||
| 2015 | 2015 | 2014 | 2013 | |||||||||||||
Net income (loss) | $ | (82,786 | ) | $ | (5,756 | ) | $ | 8,848 | $ | (247,298 | ) | |||||
Gains on derivative transactions, net of tax | 1,549 | — | — | — | ||||||||||||
Actuarial gains on defined benefit plans, net of tax | — | 2,645 | (2,032 | ) | 4,118 | |||||||||||
Foreign currency translation adjustment | (6,317 | ) | (19,751 | ) | (20,127 | ) | (16,717 | ) | ||||||||
|
|
|
|
|
|
|
| |||||||||
Comprehensive loss | $ | (87,554 | ) | $ | (22,862 | ) | $ | (13,311 | ) | $ | (259,897 | ) | ||||
|
|
|
|
|
|
|
| |||||||||
See accompanying notes to the combined financial statements
(USD in thousands)
| Successor | Predecessor | |||||||
| December 31, 2015 | December 31, 2014 | |||||||
ASSETS | ||||||||
Current assets | ||||||||
Cash and cash equivalents | $ | 43,590 | $ | 42 | ||||
Receivables, net | 118,959 | 109,049 | ||||||
Inventories | 210,615 | 190,496 | ||||||
Other current assets | 2,844 | 652 | ||||||
|
|
|
| |||||
Total current assets | 376,008 | 300,239 | ||||||
|
|
|
| |||||
Non-current assets | ||||||||
Property, plant and equipment, net | 388,924 | 414,073 | ||||||
Goodwill | 75,537 | 83,674 | ||||||
Other intangible assets, net | 26,062 | — | ||||||
Investment in equity method investee | 56,289 | 47,452 | ||||||
Deferred tax asset | 3,087 | — | ||||||
Derivative assets | 9,093 | — | ||||||
Other long term assets | 3,875 | 730 | ||||||
|
|
|
| |||||
Total assets | $ | 938,875 | $ | 846,168 | ||||
|
|
|
| |||||
LIABILITIES AND EQUITY | ||||||||
Current liabilities | ||||||||
Trade payables | $ | 96,486 | $ | 73,508 | ||||
Accrued liabilities | 55,628 | 50,412 | ||||||
Deferred revenue | 19,498 | 11,935 | ||||||
Current portion of long term debt | 2,191 | — | ||||||
Employee benefit obligations | — | 309 | ||||||
Capital lease liability | — | 19 | ||||||
|
|
|
| |||||
Total current liabilities | 173,803 | 136,183 | ||||||
|
|
|
| |||||
Non-current liabilities | ||||||||
Employee benefit obligations | — | 13,012 | ||||||
Deferred tax liability | 2,365 | 7,115 | ||||||
Senior Term Loan | 467,192 | — | ||||||
Junior Term Loan | 236,446 | — | ||||||
Other long term liabilities | 6,754 | 32,385 | ||||||
|
|
|
| |||||
Total liabilities | 886,560 | 188,695 | ||||||
Commitments and Contingencies (Note 14) | ||||||||
Equity | ||||||||
Accumulated other comprehensive loss | — | (21,189 | ) | |||||
Accumulated net contributions from parent | — | 678,662 | ||||||
|
|
|
| |||||
Total parent company net investment | — | 657,473 | ||||||
|
|
|
| |||||
Contributed capital | 139,869 | — | ||||||
Accumulated other comprehensive loss | (4,768 | ) | — | |||||
Retained deficit | (82,786 | ) | — | |||||
|
|
|
| |||||
Total shareholder’s equity | 52,315 | — | ||||||
|
|
|
| |||||
Total liabilities and equity | $ | 938,875 | $ | 846,168 | ||||
|
|
|
| |||||
See accompanying notes to the combined financial statements
Combined Statements of Shareholder’s Equity and Parent Company Net Investment
(USD in thousands)
Predecessor | Accumulated Net Contributions from Parent | Accumulated Other Comprehensive Income (Loss) | Total Parent Company Net Investment | |||||||||
Balance at January 1, 2013 | $ | 1,004,636 | $ | 13,569 | $ | 1,018,205 | ||||||
Net loss | (247,298 | ) | — | (247,298 | ) | |||||||
Actuarial gains (losses) on defined benefit plans, net of tax | — | 4,118 | 4,118 | |||||||||
Foreign currency translation adjustment | — | (16,717 | ) | (16,717 | ) | |||||||
Net transfers (to)/from Parent | (31,448 | ) | — | (31,448 | ) | |||||||
|
|
|
|
|
| |||||||
Balance at December 31, 2013 | 725,890 | 970 | 726,860 | |||||||||
|
|
|
|
|
| |||||||
Net income | 8,848 | — | 8,848 | |||||||||
Actuarial gains (losses) on defined benefit plans, net of tax | — | (2,032 | ) | (2,032 | ) | |||||||
Foreign currency translation adjustment | — | (20,127 | ) | (20,127 | ) | |||||||
Net transfers (to)/from Parent | (56,076 | ) | — | (56,076 | ) | |||||||
|
|
|
|
|
| |||||||
Balance at December 31, 2014 | 678,662 | (21,189 | ) | 657,473 | ||||||||
|
|
|
|
|
| |||||||
Net loss | (5,756 | ) | — | (5,756 | ) | |||||||
Actuarial gains (losses) on defined benefit plans, net of tax | — | 2,645 | 2,645 | |||||||||
Foreign currency translation adjustment | — | (19,751 | ) | (19,751 | ) | |||||||
Net transfers (to)/from Parent | 60,910 | — | 60,910 | |||||||||
|
|
|
|
|
| |||||||
Balance at March 13, 2015 | $ | 733,816 | $ | (38,295 | ) | $ | 695,521 | |||||
|
|
|
|
|
| |||||||
Successor | Contributed Capital | Accumulated Other Comprehensive Income (Loss) | Retained Deficit | Total Shareholders’ Equity | ||||||||||||
Balance at March 14, 2015 | $ | — | $ | — | $ | — | $ | — | ||||||||
Initial capital contribution from parent | 167,482 | — | — | 167,482 | ||||||||||||
Return of contributed capital, net | (27,613 | ) | — | — | (27,613 | ) | ||||||||||
Net loss | — | — | (82,786 | ) | (82,786 | ) | ||||||||||
Gains on derivative transactions, net of tax | — | 1,549 | — | 1,549 | ||||||||||||
Foreign currency translation adjustment | — | (6,317 | ) | — | (6,317 | ) | ||||||||||
|
|
|
|
|
|
|
| |||||||||
Balance at December 31, 2015 | $ | 139,869 | $ | (4,768 | ) | $ | (82,786 | ) | $ | 52,315 | ||||||
|
|
|
|
|
|
|
| |||||||||
See accompanying notes to the combined financial statements
Combined Statements of Cash Flows
(USD in thousands)
| Successor | Predecessor | |||||||||||||||
| For the period from March 14 to December 31, | For the period from January 1 to March 13, | For the year ended December 31, | ||||||||||||||
| 2015 | 2015 | 2014 | 2013 | |||||||||||||
CASH FLOWS FROM OPERATING ACTIVITIES | ||||||||||||||||
Net income (loss) | $ | (82,786 | ) | $ | (5,756 | ) | $ | 8,848 | $ | (247,298 | ) | |||||
Reconciliation of net income (loss) to net cash provided by operating activities: | ||||||||||||||||
Depreciation & amortization expense | 32,930 | 6,894 | 36,605 | 38,560 | ||||||||||||
Loss (gain) on disposal of property, plant and equipment | 618 | (122 | ) | (2,329 | ) | (3,832 | ) | |||||||||
Amortization of debt discount and issuance costs | 5,085 | — | — | — | ||||||||||||
Impairment on property, plant, and equipment and goodwill | 1,088 | 27 | 3,977 | 248,650 | ||||||||||||
Earnings from equity method investee | (8,429 | ) | (67 | ) | (4,451 | ) | 216 | |||||||||
Distributions from equity method investee | 8,542 | — | 3,000 | — | ||||||||||||
Unrealized foreign currency gains, net | (1,391 | ) | (26 | ) | — | — | ||||||||||
Provision (recoveries) for doubtful accounts | 1,377 | (31 | ) | (786 | ) | 2,760 | ||||||||||
Deferred taxes | (3,138 | ) | 2,749 | 618 | (2,671 | ) | ||||||||||
Deferred rent | 1,279 | — | — | — | ||||||||||||
Other non-cash items | (13 | ) | (1,736 | ) | 717 | 1,372 | ||||||||||
Change in assets and liabilities: | ||||||||||||||||
Receivables, net | 28,900 | (7,520 | ) | (9,473 | ) | 14,762 | ||||||||||
Related party receivables | — | — | 617 | (504 | ) | |||||||||||
Inventories | 59,506 | (20,160 | ) | (31,395 | ) | 5,961 | ||||||||||
Other current assets | (2,153 | ) | (855 | ) | 512 | 1,685 | ||||||||||
Trade payable and accrued liabilities | 72,422 | (20,119 | ) | 12,822 | (7,288 | ) | ||||||||||
Deferred revenue | 7,420 | (1,068 | ) | 5,911 | (20,142 | ) | ||||||||||
Capital lease liability | — | — | — | (252 | ) | |||||||||||
Employee benefit obligations | — | (498 | ) | 209 | (1,480 | ) | ||||||||||
Other long-term assets & liabilities | 160 | 64 | 516 | 1,187 | ||||||||||||
|
|
|
|
|
|
|
| |||||||||
NET CASH PROVIDED BY (USED IN) OPERATING ACTIVITIES | 121,417 | (48,224 | ) | 25,918 | 31,686 | |||||||||||
|
|
|
|
|
|
|
| |||||||||
CASH FLOWS FROM INVESTING ACTIVITIES | ||||||||||||||||
Purchase of property, plant and equipment | (14,705 | ) | (2,762 | ) | (22,792 | ) | (10,497 | ) | ||||||||
Proceeds from the sale of long-term assets | 2,194 | — | 5,891 | 10,442 | ||||||||||||
Distribution of preferred investment from equity method investee | — | — | 15,000 | — | ||||||||||||
Assets and liabilities acquired, Cretex, net | (245,100 | ) | — | — | — | |||||||||||
Assets and liabilities acquired from HeidelbergCement, net | (640,428 | ) | — | — | — | |||||||||||
|
|
|
|
|
|
|
| |||||||||
NET CASH USED IN INVESTING ACTIVITIES | (898,039 | ) | (2,762 | ) | (1,901 | ) | (55 | ) | ||||||||
|
|
|
|
|
|
|
| |||||||||
CASH FLOWS FROM FINANCING ACTIVITIES | ||||||||||||||||
Payments on notes payable | — | — | — | (153 | ) | |||||||||||
Payments on capital leases | (17 | ) | (3 | ) | (373 | ) | (35 | ) | ||||||||
Payment of debt issuance costs | (27,410 | ) | — | — | — | |||||||||||
Proceeds from Senior Term Loan, net of discount | 486,104 | — | — | — | ||||||||||||
Proceeds from Junior Term Loan, net of discount | 244,300 | — | — | — | ||||||||||||
Proceeds from Revolver, net of discount | 45,619 | — | — | — | ||||||||||||
Payments on Revolver | (45,619 | ) | — | — | — | |||||||||||
Payments on Senior Term Loan | (5,366 | ) | — | — | — | |||||||||||
Capital contribution from (distributions to) Predecessor Parent, net | — | 60,910 | (23,617 | ) | (31,448 | ) | ||||||||||
Capital contribution from parent | 167,482 | — | — | — | ||||||||||||
Payments for return of contributed capital | (42,513 | ) | — | — | — | |||||||||||
|
|
|
|
|
|
|
| |||||||||
NET CASH PROVIDED BY (USED IN) FINANCING ACTIVITIES | 822,580 | 60,907 | (23,990 | ) | (31,636 | ) | ||||||||||
Effect of exchange rate changes on cash | (2,368 | ) | (130 | ) | 10 | |||||||||||
|
|
|
|
|
|
|
| |||||||||
Net change in cash and cash equivalents | 43,590 | 9,791 | 37 | (5 | ) | |||||||||||
Cash and cash equivalents balance, beginning of period | — | 42 | 5 | 10 | ||||||||||||
|
|
|
|
|
|
|
| |||||||||
Cash and cash equivalents balance, end of period | $ | 43,590 | $ | 9,833 | $ | 42 | $ | 5 | ||||||||
|
|
|
|
|
|
|
| |||||||||
SUPPLEMENTAL DISCLOSURES: | ||||||||||||||||
Cash interest paid | $ | 25,379 | $ | — | $ | — | $ | — | ||||||||
SUPPLEMENTAL NONCASH INVESTING AND FINANCING DISCLOSURES: | ||||||||||||||||
Fair value changes of derivative instruments recorded in OCI, net of tax | $ | 1,549 | $ | — | $ | — | $ | — | ||||||||
|
|
|
|
|
|
|
| |||||||||
Payments made on behalf of the Company by affiliates | $ | 14,900 | $ | — | $ | — | $ | — | ||||||||
|
|
|
|
|
|
|
| |||||||||
Transfers of net assets to Parent | $ | — | $ | — | $ | 32,459 | $ | — | ||||||||
|
|
|
|
|
|
|
| |||||||||
See accompanying notes to the combined financial statements
Notes to Combined Financial Statements
(USD in thousands, unless stated otherwise)
1. Organization and description of the business
Description of the business
Forterra Building Products (“Forterra” or the “Successor”) is involved in the manufacturing, sale and distribution of building materials in the United States (‘‘U.S.’’) and Canada. Forterra’s primary products are concrete drainage pipe, precast concrete structures, water transmission pipe used in drinking and wastewater systems, and bricks. These products are used in the residential, infrastructure and non-residential sectors of the construction industry.
Basis of Presentation - Successor
Forterra includes indirect wholly-owned subsidiaries of LSF9 Concrete Holdings, Ltd. (“LSF9”). Lone Star Funds (“Lone Star”), through its wholly-owned subsidiary LSF9, acquired Forterra on March 13, 2015 (the “Acquisition”). LSF9, which was formed on February 6, 2015 for the purpose of acquiring Forterra, had no operations prior to the date of the Acquisition. The legal entities that comprise Forterra are domiciled in the U.S. and Canada. The U.S. legal entities are Stardust Holdings (USA), LLC and its subsidiaries. The Canadian legal entities are Forterra Pipe & Precast, Ltd. and its subsidiaries and Forterra Brick Ltd.
Prior to the Acquisition, the entities comprising Forterra which were acquired by Lone Star were indirect wholly-owned subsidiaries of HeidelbergCement A.G. (“HC” or “Parent”), a publicly listed company in Germany, encompassing HC’s North American building products operations (“BP NAM” or the “Predecessor”). LSF9 acquired Forterra in a business combination which also included the acquisition of HC’s U.K.-based building products operations for a total initial purchase price of $1.33 billion cash, including customary working capital adjustments and a possible earn-out of up to $100.0 million. The acquisition of BP NAM and HC’s UK-based building products was funded with an equity investment of $432.3 million and third-party debt in the amount of $940.0 million.
In the accompanying financial information, Successor refers to Forterra and Predecessor refers to BP NAM. The term “Company” is used throughout the combined financial statements and applies to either the Predecessor or the Successor.
The Successor’s combined financial statements include certain assets and liabilities historically held at LSF9, including the proportionate debt, and related interest expense, incurred by LSF9 to acquire the Company that Forterra is obligated to pay. The Company’s portion of Lone Star’s initial $432.3 million equity investment is $167.5 million. The Company’s allocated portion of the $940.0 million of third party debt used to finance the Acquisition is $515.5 million. The remainderremaining $424.5 million of the debt was allocated to affiliates of LSF9 that are not included in these financial statements.statements based on the amounts affiliates of LSF9 are expected to repay and such amount has been fully repaid by affiliates. The Company and the affiliates of LSF9 were co-obligors and jointly and severally liable under terms of the initial credit agreements. In April of 2016, the Company’s affiliate co-obligors were released from joint and several liability under the credit agreements and the Company is consequently the sole source of repayment for its $515.5 million share for the initial obligation under the credit agreements. See discussion of the joint and several obligations in Note 10, Debt and deferred financing costs.
Cretex Acquisition
On August 20, 2015, Forterra entered into a purchase agreement to acquire all the outstanding shares of Cretex Concrete Products, Inc. (“Cretex”) for a purchase price of $245.1 million, including customary working capital adjustments. The closing of the Cretex acquisition occurred on October 1,
FORTERRA BUILDING PRODUCTS
Notes to Combined Financial Statements
(USD in thousands, unless stated otherwise)
2015. Cretex is a manufacturer of reinforced concrete pipe, box culverts, precast drainage structures, pre-stressed bridge components and ancillary precast products, expanding the Company’s market footprint into the Upper Midwestern United States. The Cretex acquisition was financed with $240.0 million incremental third-party Senior debt.
The financial statements contained herein have been prepared in accordance with accounting principles generally accepted in the United States (“U.S. GAAP”). The combined financial statements include the accounts of the Company and all intercompany transactions among the Successor entities have been eliminated.
2. Summary of significant accounting policies
Basis of presentation - Predecessor
Description of Business - Predecessor
The legal entities comprising BP NAM were a component of the North American operating segment of HC and consist of U.S. operating entities that were directly owned by Lehigh Hanson, Inc. (‘‘LHI’’), a U.S. holding company, and Canadian operating entities that were directly owned by Hanson America Holdings (4), Ltd., a U.K. holding company.
These financial statements are labeled as predecessor because they reflect the combined predecessor historical results of operations, financial position and cash flows of BP NAM, as they were historically managed under the control of HC, in conformity with U.S. GAAP.
All intracompany transactions occurring between the predecessor entities have been eliminated. Certain transactions between the Company and HC have been included in these combined predecessor financial statements and are considered to be effectively settled at the time the transaction is recorded. The total net effect of the settlement of these transactions is reflected in the combined predecessor statements of shareholder’s equity and Parent company net investment as net transfers (to)/from Parent, in the combined predecessor statements of cash flows as a financing activity and in the combined predecessor balance sheet as Parent company net investment.
HC used a centralized approach to cash management and financing of its operations. Historically, the majority of the Predecessor’s cash was transferred to HC daily and the Company was dependent on HC funding of the Company’s operating and investing activities as needed. This arrangement is not reflective of the manner in which the Company would have been able to finance its operations had it been a stand-alone business separate from HC during the periods presented. Cash transfers to and from HC’s cash management accounts are reflected within Parent company net investment.
The combined predecessor financial statements include certain assets and liabilities that have historically been held at the HC corporate level but are specifically identifiable or otherwise allocable to the Company. The cash and cash equivalents held by HC at the corporate level are not specifically identifiable to the Company and therefore were not allocated for any of the periods presented. Cash and cash equivalents in the combined predecessor balance sheets represent cash held locally by operations included in the combined predecessor financial statements. HC third-party debt, and the related interest expense, has not been allocated for any of the periods presented as the Company was not the legal obligor of the debt and HC’s borrowings were not directly attributable to these operations.
FORTERRA BUILDING PRODUCTS
Notes to Combined Financial Statements
(USD in thousands, unless stated otherwise)
The historical costs and expenses reflected in the combined predecessor financial statements include an allocation for certain corporate functions historically provided by HC or its wholly-owned subsidiaries. Substantially all of the Company’s senior management were employed by HC and certain functions critical to the Company’s operations were centralized and managed by HC. Historically, the centralized functions have included executive senior management, financial reporting, financial planning and analysis, accounting, shared services, information technology, tax, risk management, treasury, legal, human resources, land management, and strategy and development. Additionally, the Company resided in office space provided by affiliates of HC. The cost of each of these services has been allocated to the Company on the basis of the Company’s relative net sales or head count as compared to that of HC depending upon which allocation methodology is more meaningful for each service.
The Company and HC believe that these allocations reasonably reflect the utilization of services provided and benefits received. However, they may differ from the cost that would have been incurred had the Company operated as a stand-alone company for the periods presented or will be incurred by the Successor. ActualEstimating actual costs that would have been incurred if the Company had been a stand-alone company is not practicable and would depend on multiple factors, including organizational structure and strategic decisions made in various areas, including legal services, accounting and finance services, human resources, marketing and contract support, customer support, treasury, facility and other corporate and infrastructural services. Income taxes have been accounted for in these financial statements on a separate-return basis.
Business Combinations
Assets acquired and liabilities assumed in business combination transactions, as defined by the Financial Accounting Standards Board (“FASB”) Accounting Standards Codification (“ASC”) 805,Business Combination, are recorded at fair value using the acquisition method of accounting. We allocate the purchase price of acquisitions based upon the fair value of each component which may be derived from various observable and unobservable inputs and assumptions. Initial purchase price allocations are preliminary and subject to revision within the measurement period, not to exceed one year from the date of the transaction. The fair value of property, plant and equipment and intangible assets may be based upon the discounted cash flow method that involves inputs that are not observable in the market (Level 3). Goodwill assigned represents the amount of consideration transferred in excess of the fair value assigned to identifiable assets acquired and liabilities assumed.
Use of estimates
The preparation of the combined financial statements in conformity with U.S. GAAP requires management to make estimates and assumptions that affect the reported amounts of assets and liabilities, the disclosure of contingent assets and liabilities as of the date of the combined financial statements, and the reported amounts of revenues and expenses during the reporting period. Actual results could differ from these estimates. These estimates are based on management’s best knowledge of current events and actions that the Company may undertake in the future. The more significant estimates made by management relate to fair value estimates for assets and liabilities acquired in business combinations; accrued liabilities for environmental cleanup, reclamation, pensions and other employee benefit plans, bodily injury and insurance claims; and estimates for deferred tax assets, inventory reserves, allowance for doubtful accounts and impairment of long-lived assets.
FORTERRA BUILDING PRODUCTS
Notes to Combined Financial Statements
(USD in thousands, unless stated otherwise)
Cash and cash equivalents
Successor cash and cash equivalents include cash on hand and other highly liquid investments having an original maturity of less than three months.
Predecessor treasury activities were centralized by HC such that the net cash collections were automatically distributed to HC and reflected as Parent company net investment. At times, the Company may have had a cash balance due to timing differences.
Receivables, net
Receivables are recorded at net realizable value, which includes allowances for doubtful accounts. The Company reviews the collectability of trade receivables on an ongoing basis. The Company reserves for trade receivables determined to be uncollectible. This determination is based on the delinquency of the account, the financial condition of the customer and the Company’s collection experience.
HC maintained accounts receivable securitization programs in both the United States and Canada to provide additional sources of working capital and long-term financing. Under the program, HC sold, on a revolving basis, selected trade sales invoices to either wholly-owned special purpose subsidiaries (the “SPSs”), which are consolidated in HC consolidated financial statements, or in Canada to an unrelated third-party commercial paper conduit. The SPSs in turn enter into agreements with an unrelated third-party commercial paper conduit to acquire long-term financing, using the accounts receivable as collateral.
Under the terms of the programs for the United States and Canada, the Company maintained effective control over the selected trade sales invoices. In accordance with the Financial Accounting Standards Board (“FASB”) Accounting Standards Codification (“ASC”) 860,Transfers and Servicing (“ASC 860”), the accounts receivable securitization transactions have not been accounted for as sales in the United States and Canada. The related accounts receivable are reflected in the combined predecessor financial statements. The Company was responsible for the collection of invoices sold by the Company under the securitization programs. Cash collected by the Company was remitted to the SPS who then remitted the cash collections to the buyers of the accounts receivable on a contractually agreed basis.
Concentration of credit risk
Financial instruments that potentially subject the Company to concentrations of credit risk are primarily receivables. The Company performs ongoing credit evaluations of its customers’ financial condition and generally requires no collateral from its customers. The allowances for uncollectible receivables are based upon analysis of economic trends in the construction industry, detailed analysis of the expected collectability of accounts receivable that are past due and the expected collectability of overall receivables.
Concentrations of Labor
Approximately 35% of the Company’s employees are represented by collective bargaining agreements, and 25% of these employees are included in collective bargaining agreements that expire within 12 months.
FORTERRA BUILDING PRODUCTS
Notes to Combined Financial Statements
(USD in thousands, unless stated otherwise)
Inventories
Inventories are valued at the lower of cost or market. The Company’s inventories are valued using the average cost method. Inventories include materials, labor and applicable factory overhead costs. The value of inventory is adjusted for damaged, obsolete, excess and slow-moving inventory. Market value of inventory is estimated considering the impact of market trends, an evaluation of economic conditions, and the value of current orders relating to the future sales of each respective component of inventory.
Property, plant and equipment, net
Property, plant and equipment, which includes amounts recorded under capital lease arrangements, is stated at cost less accumulated depreciation. Depreciation of property, plant and equipment is computed using the straight-line method over the estimated useful lives of the assets. These lives range from 20 to 40 years for buildings, 4 to 20 years for machinery and equipment, and 5 to 10 years for other equipment and lower of lease term or useful life on leasehold improvements. Repair and maintenance costs are expensed as incurred. The Company’s depreciation expense is recorded in cost of goods sold and selling, general and administrative expenses in the combined statements of operations. The Company capitalizes interest during the active construction of major projects. Capitalized interest is added to the cost of the underlying assets and is depreciated over the useful lives of those assets. There was no interest capitalized for any of the periods presented in the combined financial statements.
Impairment or disposal of long-lived assets
The Company evaluates the recoverability of its long-lived assets in accordance with the provisions of ASC 360,Property, Plant andEquipment(“ASC 360”). ASC 360 requires that long-lived assets and certain identifiable intangibles be reviewed for impairmentwhenever events or changes in circumstances indicate that the carrying amount of an asset may not be recoverable. Recoverability of assets is measured by comparing the carrying amount of an asset to future undiscounted net cash flows expected to be generated by the asset. Such evaluations for impairment are significantly impacted by estimates of future prices for the Company’s products, capital needs, economic trends in the construction sector and other factors. If such assets are considered to be impaired, the impairment to be recognized is measured at the amount by which the carrying amount of the assets exceeds their fair value. Assets to be disposed of by sale are reflected at the lower of their carrying amount or fair value less cost to sell.
The Company assesses impairment of long-lived assets at the lowest level for which identifiable cash flows are largely independent of the cash flows of other assets and liabilities. For purposes of evaluating impairment of long-lived assets held in use, the Company has determined this level to be the asset group level, which are defined as geographical market clusters of plants. For assets meeting the criteria for classification as held for sale under ASC 360, the impairment is assessed at the disposal group level, generally the specific plant or plants held for sale.
Goodwill and other intangible assets, net
The goodwill reflected in the combined Successor balance sheets relates to the recognition of goodwill in the Acquisition and in the Company’s acquisition of Cretex Concrete Products (“Cretex”).
FORTERRA BUILDING PRODUCTS
Notes to Combined Financial Statements
(USD in thousands, unless stated otherwise)
Goodwill represents the excess of costs over the fair value of identifiable assets acquired and liabilities assumed.
The Company evaluates goodwill and intangible assets in accordance with ASC 350,Goodwill and Other Intangible Assets (“ASC 350”). ASC 350 requires goodwill to be either qualitatively or quantitatively assessed for impairment annually (or more frequently if impairment indicators arise) for each reporting unit. The Company performs its annual impairment testing of goodwill as of October 1 of each year and in interim periods if events occur that would indicate that it is more likely than not goodwill may be impaired.
The Company evaluates its intangible assets with finite lives for indications of impairment whenever events or changes in circumstances indicate that the net book value may not be recoverable. Intangible assets with finite lives consist of customer relationships, customer backlogs, and brand names, and are amortized under a consumption method over the estimated useful lives. Factors that could trigger an impairment review include significant under-performance relative to expected historical or projected future operating results, significant changes in the manner of our use of the acquired assets or the strategy for our overall business or significant negative industry or economic trends.
If this evaluation indicates that the value of the intangible asset may be impaired, the Company makes an assessment of the recoverability of the net book value of the asset over its remaining useful life. If this assessment indicates that the intangible asset is not recoverable, based on the estimated undiscounted future cash flows of the asset over the remaining amortization period, the Company reduces the net book value of the related intangible asset to fair value and may adjust the remaining amortization period.
Investment in equity method investee
The Company has an investment in a joint venture accounted for using the equity method. Under the equity method, carrying value is adjusted for the Company’s share of the investee’s earnings and losses, as well as capital contributions to and distributions from the investee. Distributions in excess of equity method earnings are recognized as a return of investment and recorded as investing cash inflows in the accompanying combined statements of cash flows. The Company classifies its share of income and loss related to its investments in its investee as a component of operating income or loss, as the Company’s investments in the investee is an extension of the Company’s core business operations.
The Company evaluates its investment in the equity method investee for impairment whenever events or changes in circumstances indicate that the carrying value of its investment may have experienced an “other-than-temporary” decline in value. If such conditions exist, the Company compares the estimated fair value of the investment to its carrying value to determine if an impairment is indicated and determines whether the impairment is “other-than-temporary” based on its assessment of all relevant factors, including consideration of the Company’s intent and ability to retain its investment.
Derivatives and Hedge Accounting
The Company has entered into derivative instruments to mitigate interest rate and foreign exchange rate risk. Certain derivative instruments are designated for hedge accounting under ASC
FORTERRA BUILDING PRODUCTS
Notes to Combined Financial Statements
(USD in thousands, unless stated otherwise)
815-20,Derivatives – Hedging. Instruments that meet hedge criteria are formally designated as hedges at the inception of the instrument. Derivatives utilized by the Company include cross currency swaps.
The Company’s derivative assets and liabilities are measured at fair value. Fair value related to the cash flows occurring within one year are classified as current and the fair value related to the cash flows occurring beyond one year are classified as non-current in the combined balance sheets. For those instruments designated as hedges, the Company recognizes the changes in fair value in other comprehensive income (“OCI”), and recognizes any ineffectiveness immediately in earnings.
Valuation of derivative assets and liabilities reflect the value of the instrument including counterparty credit risk. These values also take into account the Company’s own credit standing.
Deferred Financing Costs
In conjunction with its debt, the Company recorded debt discounts and debt issuance costs totaling $51.9 million during the period March 14, 2015 to December 31, 2015. These costs are amortized over the life of the applicable debt instrument to interest expense utilizing the effective interest method. The related amortization expense of these costs was $5.1 million, and is included in interest expense on the combined statements of operations for the Successor period.
Fair value measurement
The Company utilizes valuation techniques that maximize the use of observable inputs and minimize the use of unobservable inputs to the extent possible. The Company determines fair value based on assumptions that market participants would use in pricing an asset or liability in the principal or most advantageous market. When considering market participant assumptions in fair value measurements, the following fair value hierarchy distinguishes between observable and unobservable inputs, which are categorized in one of the following levels:
Level 1 Inputs – Unadjusted quoted prices in active markets for identical assets or liabilities accessible to the reporting entity at the measurement date.
Level 2 Inputs – Other than quoted prices included in Level 1 inputs that are observable for the asset or liability, either directly or indirectly, for substantially the full term of the asset or liability.
Level 3 Inputs – Unobservable inputs for the asset or liability used to measure fair value to the extent that observable inputs are not available, thereby allowing for situations in which there is little, if any, market activity for the asset or liability at measurement date.
The Company’s other financial instruments consist primarily of cash and cash equivalents, trade and other receivables, accounts payable, accrued expenses, derivative financial instruments and long-term debt. The carrying value of the Company’s trade and other receivables, trade payables and accrued expenses approximates fair value due to their highly liquid nature, short-term maturity, or competitive rates assigned to these financial instruments.
The Company adjusts the carrying amount of certain nonfinancial assets to fair value on a non-recurring basis when they are impaired.
FORTERRA BUILDING PRODUCTS
Notes to Combined Financial Statements
(USD in thousands, unless stated otherwise)
Foreign currency translation
The Company uses the U.S. dollar as its functional currency for operations in the U.S. and the Canadian dollar for operations in Canada. The assets, liabilities, revenues and expenses of the Company’s Canadian operations are translated in accordance with ASC 830,Foreign Currency Matters.
Environmental remediation liabilities
The Company accrues for costs associated with environmental remediation obligations when such costs are probable and reasonably estimable; if an estimated amount is likely to fall within a range and no amount within that range can be determined to be the better estimate, the minimum amount of the range is recorded. Claims for recoveries from insurance carriers and other third parties are not recorded until it is probable that the recoveries will be realized. Such accruals are adjusted as further information develops or circumstances change.
Environmental expenditures that relate to current operations or to conditions caused by past operations are expensed. Expenditures that create future benefits are capitalized.
Liabilities are recorded when environmental assessments and/or clean-ups are probable, and the costs can be reasonably estimated. At December 31, 2015 and 2014, the Company had environmental obligations of $1,803 and $1,739, respectively, which are recorded within accrued liabilities and other long-term liabilities in the combined balance sheets. The estimated range of reasonably possible loss beyond the amounts accrued is considered immaterial.
Accounting for asset retirement obligations
The Company incurs reclamation obligations as part of its brick production process. The Company recognizes the fair value of a legally enforceable liability representing an asset retirement obligation in the period in which it is incurred.
The provisions of ASC 410-20,Accounting for Asset Retirement Obligations (“ASC 410”), require the projected estimated reclamation obligation to be stated at fair value using assumptions that reflect the amount an external party would charge for bearing the uncertainty of guaranteeing a fixed price today for performance in the future.
Asset retirement obligations which are recorded within accrued liabilities and other long term liabilities in the combined balance sheets were $1,353 and $1,885 at December 31, 2015 and 2014, respectively.
Defined benefit pension plans and other post-retirement benefits
The Predecessor’s Canadian employees participated in defined benefit pension plans sponsored by the Company. The Company’s U.S. salaried employees and non-union hourly employees participated in defined benefit pension plans sponsored by an affiliate of HC. Approximately 37% of the Predecessor’s labor force were covered by collective bargaining agreements. These plans included other Parent employees of HC affiliates that are not employees of the Company. LHI also provides certain retiree health and life insurance benefits to eligible employees who have retired from the Company. Salaried participants generally became eligible for retiree health care benefits when they retired from active service at age 60 or later. Benefits, eligibility, and cost-sharing provisions for the hourly employees vary by location and/or bargaining unit. Generally, the health care plans pay a stated percentage of most medical and dental expenses reduced for any deductible, co-payment and payments made by government programs and other group coverage. The Predecessor accounted for
FORTERRA BUILDING PRODUCTS
Notes to Combined Financial Statements
(USD in thousands, unless stated otherwise)
its U.S. defined benefit pension plans as multiemployer plans under ASC 715,Compensation–BenefitPlans(“ASC 715”).Liability for the Predecessor defined benefit plans were retained by HC.
Additionally, the Predecessor also had employees that were covered under several union-sponsored, multiemployer pension plans. Such plans are accounted for as defined contribution plans as it is not possible to isolate the components of such plans that would collectively comprise the Company’s liability. Liabilities for the Predecessor plans were retained by HC.
Income Taxes
As of the date of the Acquisition, the Successor financial statements reflect a new tax basis of accounting as the Company includes taxable entities independent of the Predecessor. Deferred tax assets and liabilities are recognized principally for the expected tax consequences of temporary differences between the tax basis of assets and liability and their reported amounts, using currently enacted tax rates. The measurement of a deferred tax asset is reduced, if necessary, by a valuation allowance if it is more likely than not that some portion or all of the deferred tax asset will not be realized.
The Company recognizes a tax benefit for uncertain tax positions if the Company believes it is more likely than not that the position will be upheld on audit based solely on the technical merits of the tax position. The Company evaluates uncertain tax positions after the consideration of all available information.
For the Predecessor periods, income tax expense and related current and deferred income taxes receivable and payable were calculated assuming that the Predecessor files hypothetical stand-alone income tax returns in Canada and hypothetical consolidated income tax returns for the U.S. building products activities. Losses and other tax attributes generated on a hypothetical stand-alone basis and hypothetical consolidated return basis are reflected as deferred tax assets, even though some of those losses or attributes may have been utilized by HC’s filing entities. All hypothetical current taxes payable or receivable are deemed settled through net parent investment. All tax consequences associated with the Predecessor period were retained by HC.
Revenue recognition
Revenues are recognized by the Company when the risks and rewards associated with the transaction have been transferred to the purchaser, which is demonstrated when all the following conditions are met: evidence of a binding arrangement exists (generally, purchase orders), products have been delivered or services have been rendered, there is no future performance required, fees are fixed or determinable and amounts are collectable under normal payment terms. Sales represent the net amounts charged or chargeable in respect of services rendered and goods supplied, excluding intercompany sales. Sales are recognized net of any discounts given to the customer.
The Company bills and incurs shipping costs to third parties for the transportation of building products to customers. For the period from March 14, 2015 to December 31, 2015, for the period from January 1, 2015 to March 13, 2015, and for the years ended December 31, 2014 and 2013, the Company recorded freight costs of approximately $59,943, $11,041, $69,862, and $63,301, respectively, on a gross basis within net sales and cost of goods sold in the accompanying combined statements of operations.
FORTERRA BUILDING PRODUCTS
Notes to Combined Financial Statements
(USD in thousands, unless stated otherwise)
The Company’s revenues primarily relate to product shipments. For certain engineering and construction contracts and building contracting arrangements, the Company recognizes revenue using the percentage of completion method, based on total contract costs incurred to date compared to total estimated cost at completion for each contract. Changes to total estimated contract cost or losses, if any, are recognized in the period in which they are determined. Pre-contract costs are expensed as incurred. If estimated total costs on a contract indicate a loss, the entire loss is provided for in the financial statements immediately. To the extent the Company has invoiced and collected from its customers more revenue than has been recognized as revenue using the percentage of completion method, the Company records the excess amount invoiced as deferred revenue. For the period from March 14, 2015 to December 31, 2015, for the period from January 1, 2015 to March 13, 2015, and for the years ended December 31, 2014 and 2013, revenue recognized in continuing operations using the percentage of completion method amounted to 5%, 4%, 3% and 4% of total net sales, respectively.
The company generally provides limited warranties related to its products which cover manufacturing in accordance with the specifications identified on the face of our quotation or order acknowledgement and to be free of defects in workmanship or materials. The warranty periods typically extend for a limited duration of one year. The Company estimates and accrues for potential warranty exposure related to products which have been delivered.
Cost of goods sold and selling, general and administrative expenses
Cost of goods sold includes costs of production, inbound freight charges for raw materials, outbound freight to customers, purchasing and receiving costs, inspection costs and warehousing at plant distribution facilities. Selling, general and administrative costs include expenses for sales, marketing, legal, accounting and finance services, human resources, customer support, treasury and other general corporate services.
Recent Accounting Guidance Adopted
In April 2014, the FASB issued Accounting Standards Update (“ASU”) 2014-08,Presentation of Financial Statements (Topic 205)and Property, Plant, and Equipment (Topic 360): Reporting Discontinued Operations and Disclosures of Disposals of Components of an Entity. The amendments in this update change the requirements for reporting discontinued operations in Subtopic 205-20. Adisposal of a component of an entity or a group of components of an entity is required to be reported in discontinued operations if the disposal represents a strategic shift that has (or will have) a major effect on an entity’s operations and financial results. The Company adopted this ASU effective January 1, 2015.
In August 2015, the FASB issued ASU 2015-03,Interest – Imputation of Interest (Subtopic835-30): Simplifying the Presentation ofDebt Issuance Cost. This amendment provides guidance for deferring and presenting debt issuance costs as an asset and subsequentlyamortizing the deferred debt issuance costs ratably over the term of the line of credit arrangement, regardless of whether there are any outstanding borrowings on the line of credit arrangement. For term debt obligations, the Company presents debt issuance costs as a direct deduction of the carrying amount of the debt. For public business entities, the amendments in this update are effective for financial statements issued for fiscal years beginning after December 15, 2015, and interim periods within those fiscal years. The Company early adopted this ASU effective March 14, 2015 and has presented its debt issuance costs accordingly in its financial statements.
FORTERRA BUILDING PRODUCTS
Notes to Combined Financial Statements
(USD in thousands, unless stated otherwise)
In November 2015, the FASB issued ASU 2015-17,Income Taxes (Topic 740), Balance Sheet Classification of Deferred Assets intended to simplify the presentation of deferred taxes on the balance sheet and will require an entity to present all deferred tax assets and deferred tax liabilities as non-current on the balance sheet. Under the current guidance, entities are required to separately present deferred taxes as current or non-current. Netting deferred tax assets and deferred tax liabilities by tax jurisdiction will still be required under the new guidance. The new accounting guidance is effective for annual periods beginning after December 15, 2016 with early adoption permitted. The Company early adopted ASU 2015-17 as of March 14, 2015 and applied the new guidance for all periods presented.
Recent Accounting Guidance Not Yet Adopted
In May 2014, the FASB issued ASU 2014-09,Revenue from Contracts with Customers (Topic 606), which provides accounting guidance for all revenue arising from contracts with customers and affects all entities that enter into contracts to provide goods or services to their customers. The FASB subsequently voted to defer the application of the provisions of this standard for public companies until annual reporting periods beginning after December 15, 2017 in ASU 2015-14Revenue from Contracts withCustomers (Topic 606): Deferral of the Effective Date, including interim periods within that reporting period. The Company iscurrently evaluating whether this ASU will have a material impact on its combined financial statements.
In March 2015, the FASB issued ASU 2015-02,Consolidation (Topic 810), Amendments to the Consolidation Analysis, changes the analysis that a reporting entity must perform when deciding to consolidate a legal entity. This amendment changes the evaluation of whether limited partnerships are variable interest entities or voting interest entities and eliminates the presumption that a general partner should consolidate a limited partnership. All legal entities are subject to reevaluation under the revised consolidation model. The amendment is effective for fiscal years and interim periods beginning after December 15, 2015 and can be applied either retrospectively to each period presented or as a cumulative-effect adjustment as of the beginning of the period of adoption. The adoption of ASU 2015-12 is not expected to have a material impact on the Company’s combined financial statements.
In July 2015, the FASB issued ASU 2015-11,Inventory (Topic 330): Simplifying the Measurement of Inventory, requiring an entity to measure inventory within the scope of the ASU at the lower of cost and net realizable value. For public business entities, the amendments in this update are effective for financial statements issued for fiscal years beginning after December 15, 2016, and interim periods within those fiscal years. The Company is currently evaluating whether this ASU will have a material impact on its combined financial statements.
In August 2014, the FASB issued ASU 2014-15,Presentation of Financial Statements–Going Concern (Subtopic 205-40): Disclosure of Uncertainties about an Entity’s Ability to Continue as a Going Concern,defining when and how companies are requiredto disclose going concern uncertainties, which must be evaluated each interim and annual period. Specifically, it requires management to determine whether substantial doubt exists regarding the entity’s going concern presumption. Substantial doubt about an entity’s ability to continue as a going concern exists when relevant conditions and events, considered in the aggregate, indicate that it is probable that the entity will be unable to meet its obligations as they become due within one year after the date the financial statements are issued. If substantial doubt exists, certain disclosures are required. The provisions of this ASU are effective for annual periods ending after December 15, 2016 and to annual and interim periods thereafter. Early adoption is permitted. The ASU should be applied on a prospective basis. The Company believes the adoption of this ASU will not have a material impact on the Company’s disclosures.
FORTERRA BUILDING PRODUCTS
Notes to Combined Financial Statements
(USD in thousands, unless stated otherwise)
In September 2015, the FASB issued ASU 2015-16,Business Combinations (Topic 805). Topic 805 requires an acquirer to retrospectively adjust provisional amounts recognized in a business combination during the measurement period. To simplify the accounting for adjustments made to provisional amounts, the amendments in this update require that the acquirer recognize adjustments to provisional amounts that are identified during the measurement-period in the reporting period in which the adjustment amount is determined. The acquirer is required to also record, in the same period’s financial statements, the effect on earnings of changes in depreciation, amortization or other income effects, if any, as a result of the change to the provisional amounts, calculated as if the accounting had been completed at the acquisition date. In addition, an entity is required to present separately on the face of the income statement or disclose in the notes to the financial statements the portion of the amount recorded in current period earnings by line item that would have been recorded in previous reporting periods if the adjustment to the provisional amounts had been recognized as of the acquisition date. For public business entities, the amendments in this update are effective for fiscal years beginning after December 15, 2015, including interim periods within those fiscal years.
In February 2016, the FASB issued ASU 2016-02, Leases(Topic 842), amending the existing accounting standards for lease accounting, including requiring lessees to recognize most leases on their balance sheets and making targeted changes to lessor accounting. For public business entities, the amendments in this update are effective for annual reporting periods beginning after December 15, 2018, including interim periods within those fiscal years, and early adoption is permitted as of the standard’s issuance date. ASU 2016-02 requires a modified retrospective transition approach for all leases existing at, or entered into after, the date of initial application, with an option to use certain transition relief. The Company believes this ASU will have a material impact on its combined financial statements as it will result in most of the Company’s leases and associated assets being presented on the balance sheet. See also Note 14 for a summary of the Company’s current operating lease commitments and Note 22 for disclosure of a significant sales-leaseback transaction the Company executed subsequent to the balance sheet date during April 2016.
3. Business combinations
Transaction Overview – The Acquisition
The Successor’s financial statements reflect the Acquisition of the Predecessor that occurred on March 13, 2015, which was accounted for as a business combination as defined by ASC 805. Certain liabilities of the Predecessor were not assumed by the Successor including, but not limited to pension liabilities, tax and insurance related liabilities and multi-employer pension liabilities. The assets acquired and liabilities assumed are recorded at their respective fair values as of the date of the Acquisition with the excess of the purchase price over those fair values recorded as goodwill. The determination of the fair values of the acquired assets and assumed liabilities required significant judgment, including estimates impacting the determination of estimated lives of tangible and intangible assets, the calculation of the fair value of inventory, property, plant and equipment, and customer related intangibles. The fair values were determined primarily using the income method using level 3 inputs as defined by ASC 820.
FORTERRA BUILDING PRODUCTS
Notes to Combined Financial Statements
(USD in thousands, unless stated otherwise)
The following table summarizes the fair values of the assets acquired and liabilities assumed by the Company at the Acquisition date:
| Fair Value | ||||
Net working capital | $ | 257,368 | ||
Property, plant and equipment | 311,191 | |||
Investment in equity method investee | 56,400 | |||
Customer backlog intangible | 4,500 | |||
Other assets and other liabilities | (6,495 | ) | ||
|
| |||
Net identifiable assets acquired | $ | 622,964 | ||
Goodwill | 17,464 | |||
|
| |||
Consideration, net of cash acquired | $ | 640,428 | ||
|
| |||
The goodwill recognized was attributable primarily to expected operating efficiencies and expansion opportunities in the business acquired. The goodwill is not expected to be deductible for tax purposes.
Financing transactions
Consideration to fund the Acquisition was provided by an equity investment of $167.5 million and proceeds from third-party debt, net of original discount and debt issuance costs, in the amount of $472.9 million. The financing transactions included a senior term loan in the amount of $254.9 million ($241.7 million, net of $13.2 million of original issue discount and debt issuance costs), a junior term loan in the amount of $260.0 million ($233.8 million, net of $26.2 million of original issue discount and debt issuance costs) and a revolving line of credit of up to $150.0 million. Funds of $0.6 million were initially drawn from the revolving line of credit at the closing date of the Acquisition. The Company incurred debt issuance costs related to the revolving line of credit in the amount of $3.2 million.
Contingent Consideration
As discussed in Note 1, the Acquisition included contingent consideration of up-to an additional $100.0 million based on the earnings of LSF9 for fiscal year 2015 as adjusted by the purchase agreement (“Earn-out”). The Earn-out is based on the achievement of an amount in excess of a certain minimum threshold of adjusted earnings before interest, taxes, depreciation and amortization (“Adjusted EBITDA”), as defined by the purchase agreement, for the calendar year ended December 31, 2015. The Company determined that achieving the required threshold to trigger a payout to the Seller was not probable and, therefore, the Company did not record a contingent liability related to the Earn-out as of the Acquisition date. Subsequent to year end, the Company concluded the Earn-out was not earned and, accordingly, did not record a liability as of December 31, 2015. See further discussion of the Earn-out in Note 14.
Transaction Overview – Cretex Concrete Products (“Cretex”)
On August 20, 2015, Forterra entered into a purchase agreement to acquire all the outstanding shares of Cretex Concrete Products, Inc. (“Cretex”) for a purchase price of $245.1 million including customary working capital adjustments. The closing of the Cretex acquisition occurred on October 1, 2015 and is accounted for as a business combination as defined by ASC 805. The Company allocated
FORTERRA BUILDING PRODUCTS
Notes to Combined Financial Statements
(USD in thousands, unless stated otherwise)
the purchase price to the individually identifiable assets acquired and liabilities assumed basedon their estimated fair value on the date of acquisition. The fair value of assets and liabilities were determined primarily using the income method using level 3 inputs as defined by ASC 820. The excess purchase price over those fair values was recorded as goodwill. The determination of fair values of the acquired assets and assumed liabilities required significant judgment, including estimates related to contract backlog, calculation of the fair value of property, plant and equipment and inventory. The allocation of the purchase price is preliminary and may be subject to change upon completion of the determination of the fair value of all acquired assets and liabilities.
The respective preliminary fair values of the assets acquired and liabilities assumed at the acquisition date are as follows:
| Fair Value | ||||
Net working capital | $ | 69,745 | ||
Property, plant and equipment | 97,282 | |||
Customer relationship intangible | 24,700 | |||
Trade name | 600 | |||
Customer backlog intangible | 800 | |||
Other assets and other liabilities | (7,500 | ) | ||
|
| |||
Net identifiable assets acquired | 185,627 | |||
Goodwill | 59,473 | |||
|
| |||
Consideration transferred, net of cash acquired | $ | 245,100 | ||
|
| |||
The results of operations of Cretex have been included in the Successor’s combined statement of operations subsequent to the date of acquisition on October 1, 2015. The Company recognized $39.1 million in net sales related to Cretex through December 31, 2015.
Financing transactions
The purchase of Cretex was partially funded with proceeds from financing transactions totaling $240.0 million as an add-on to the aforementioned senior term loan.
Supplemental pro-forma information (unaudited)
If the Company had acquired Cretex on January 1, 2015 the Company’s total net sales and loss from continuing operations before taxes, on a pro-forma basis for the year ended December 31, 2015 would have been approximately $1.0 billion and $(91.7) million, respectively, which includes both Predecessor and Successor periods in 2015.
Transaction Costs
For the period from March 14, 2015 to December 31, 2015, for the period from January 1, 2015 to March 13, 2015 and for the year ended December 31, 2014, the Company recognized transaction costs specific to the Acquisition and Cretex acquisition of $13,725, $2,079, and $17,740 respectively. No transaction costs were incurred in the year ended December 31, 2013. Transaction costs generally include legal, accounting, valuation, and advisory fees. These costs are recorded in the combined statements of operations within selling, general & administrative expenses.
FORTERRA BUILDING PRODUCTS
Notes to Combined Financial Statements
(USD in thousands, unless stated otherwise)
4. Receivables, net
Receivables consist of the following:
| Successor | Predecessor | |||||||
| December 31, 2015 | December 31, 2014 | |||||||
Trade receivables | $ | 108,065 | $ | 103,825 | ||||
Amounts billed, but not yet paid under retainage provisions | 2,053 | 2,293 | ||||||
Other receivables | 12,436 | 5,167 | ||||||
|
|
|
| |||||
Total receivables | $ | 122,554 | $ | 111,285 | ||||
Less: Allowance for doubtful accounts | (3,595 | ) | (2,236 | ) | ||||
|
|
|
| |||||
Trade receivables, net | $ | 118,959 | $ | 109,049 | ||||
|
|
|
| |||||
The Company records provisions for doubtful accounts in selling, general and administrative expenses in the combined statements of operations. The table below summarizes the Company’s allowance for doubtful accounts for the periods presented in the combined financial statements:
Predecessor | Allowance for doubtful accounts | |||
Balance at January 1, 2013 | $ | (3,153 | ) | |
Provisions for doubtful accounts | (2,760 | ) | ||
Write-offs and adjustments | 2,216 | |||
|
| |||
Balance at December 31, 2013 | (3,697 | ) | ||
|
| |||
Provisions for doubtful accounts | 786 | |||
Write-offs and adjustments | 675 | |||
|
| |||
Balance at December 31, 2014 | (2,236 | ) | ||
|
| |||
Provisions for doubtful accounts | 31 | |||
Write-offs and adjustments | (63 | ) | ||
|
| |||
Balance at March 13, 2015 | $ | (2,268 | ) | |
|
| |||
Successor | Allowance for doubtful accounts | |||
Balance at March 14, 2015 | $ | (2,268 | ) | |
Provisions for doubtful accounts | (1,377 | ) | ||
Write-offs and adjustments | 50 | |||
|
| |||
Balance at December 31, 2015 | $ | (3,595 | ) | |
|
| |||
FORTERRA BUILDING PRODUCTS
Notes to Combined Financial Statements
(USD in thousands, unless stated otherwise)
5. Inventories
Inventories consist of the following:
| Successor | Predecessor | |||||||
| December 31, 2015 | December 31, 2014 | |||||||
Finished goods | $ | 146,635 | $ | 140,004 | ||||
Raw materials | 53,339 | 46,486 | ||||||
Work in process | 10,641 | 4,006 | ||||||
|
|
|
| |||||
Total inventories | $ | 210,615 | $ | 190,496 | ||||
|
|
|
| |||||
6. Property, plant and equipment, net
Property, plant and equipment, net consist of the following:
| Successor | Predecessor | |||||||
| December 31, 2015 | December 31, 2014 | |||||||
Land, buildings and improvements | $ | 243,496 | $ | 507,214 | ||||
Machinery and equipment | 158,349 | 337,993 | ||||||
Other equipment | 1,142 | 26,433 | ||||||
Construction-in-progress | 14,984 | 21,274 | ||||||
|
|
|
| |||||
Total property, plant and equipment | 417,971 | 892,914 | ||||||
Less: accumulated depreciation | (29,047 | ) | (478,841 | ) | ||||
|
|
|
| |||||
Property, plant and equipment, net | $ | 388,924 | $ | 414,073 | ||||
|
|
|
| |||||
Depreciation expense totaled $28,613, $6,894, $36,605, and $38,560 for the period from March 14, 2015 to December 31, 2015, for the period from January 1, 2015 to March 13, 2015, and for the years ended December 31, 2014 and 2013, respectively, which is included in cost of goods sold and selling, general and administrative expenses in the combined statements of operations.
Impairments
The Company recorded impairment charges primarily in conjunction with plant closings undertaken for purposes of market consolidation and recognized asset impairment charges for its property, plant and equipment of $1,088, $27, $3,977 and $12,011 for the period from March 14, 2015 to December 31, 2015, for the period from January 1, 2015 to March 13, 2015, and for the years ended December 31, 2014 and 2013, respectively. Asset impairments are included in impairment and restructuring charges on the combined statements of operations.
Transfers
During 2014, the Predecessor transferred to HC certain property, plant and equipment of $25,107 related to sites historically included in BP North America because such sites were not included in the Acquisition.
FORTERRA BUILDING PRODUCTS
Notes to Combined Financial Statements
(USD in thousands, unless stated otherwise)
7. Goodwill and other intangible assets, net
In connection with the Acquisition and the Cretex acquisition, the Company recognized goodwill of $17.5 million and $59.5 million, respectively. On an annual basis, the Company performs step one of its goodwill impairment test by comparing the fair value of each reporting unit with its carrying value. Only certain of the Company’s reporting units have goodwill subsequent to the Acquisition of the Company and Cretex acquisition. The Company completed annual assessments as of October 1 of each reporting period. In 2013, one reporting unit, Water Pipe & Products, failed step one and the Company recorded a goodwill impairment charge of $236,639 during the year ended December 31, 2013 based on the amount by which the carrying value of the reporting unit exceeded the fair value of the identifiable assets and liabilities of the reporting unit. There were no other impairments recorded to goodwill during the reporting periods included in the combined financial statements.
Goodwill at December 31, 2014 of $83,674 was eliminated upon consummation of the Acquisition in connection with the Successor’s accounting for the business combination.
The following table presents the changes in the net carrying value of goodwill by reportable segment:
| Successor | Drainage Pipe & Products | Water Pipe & Products | Bricks | Other | Total | |||||||||||||||
March 14, 2015 | $ | 15,139 | $ | 2,280 | $ | 45 | $ | — | $ | 17,464 | ||||||||||
Acquisition of Cretex | 59,473 | — | — | — | 59,473 | |||||||||||||||
Foreign Currency | (1,170 | ) | (230 | ) | — | — | (1,400 | ) | ||||||||||||
|
|
|
|
|
|
|
|
|
| |||||||||||
December 31, 2015 | $ | 73,442 | $ | 2,050 | $ | 45 | $ | — | $ | 75,537 | ||||||||||
|
|
|
|
|
|
|
|
|
| |||||||||||
Intangible assets other than goodwill at December 31, 2015 included the following:
| Weighted average amortization period (in years) | Gross carrying value as of December 31, 2015 | Accumulated amortization | Net carrying value as of December 31, 2015 | |||||||||||||
Customer relationships | 5 | $ | 24,700 | $ | (365 | ) | $ | 24,335 | ||||||||
Customer backlog | 1 | 5,182 | (3,955 | ) | 1,227 | |||||||||||
Brand names | 2 | 600 | (100 | ) | 500 | |||||||||||
|
|
|
|
|
| |||||||||||
Total intangible assets | $ | 30,482 | $ | (4,420 | ) | $ | 26,062 | |||||||||
|
|
|
|
|
| |||||||||||
Amortization expense was $4,317 for the period from March 14, 2015 to December 31, 2015.
FORTERRA BUILDING PRODUCTS
Notes to Combined Financial Statements
(USD in thousands, unless stated otherwise)
In the future the Company expects to incur amortization expense on these intangible assets for the years ended December 31 as follows:
Years ending December 31: | ||||
2016 | $ | 8,575 | ||
2017 | 6,083 | |||
2018 | 4,132 | |||
2019 | 2,910 | |||
2020 | 2,034 | |||
Thereafter | 2,328 | |||
|
| |||
Total future amortization expense | $ | 26,062 | ||
|
|
8. Fair Value Measurement
The Company’s financial instruments consist primarily of cash and cash equivalents, trade and other receivables derivative instruments, accounts payable, long-term debt and accrued liabilities. The carrying value of the Company’s trade receivables, trade payables, the asset based revolver and accrued liabilities approximates fair value due to their short-term maturity. The Company may adjust the carrying amount of certain nonfinancial assets to fair value on a non-recurring basis when they are impaired.
The estimated carrying amount and fair value of the Company’s financial instruments and other assets and liabilities measured and recorded at fair value on a recurring basis is as follows for the dates indicated:
| Successor | Fair value measurements at December 31, 2015 using | |||||||||||||||
| Recurring: | Quoted Prices in Active Markets for Identical Assets (Level 1) | Significant Other Observable Inputs (Level 2) | Significant Unobservable Inputs (Level 3) | Total Fair Value December 31, 2015 | ||||||||||||
Non-current assets | ||||||||||||||||
Derivative assets | $ | — | $ | 9,093 | $ | — | $ | 9,093 | ||||||||
The fair values of derivative assets and liabilities are determined using quantitative models that utilize multiple market inputs including interest rates and exchange rates to generate continuous yield or pricing curves and volatility factors to value the position. The majority of market inputs are actively quoted and can be validated through external sources, including brokers, market transactions and third-party pricing services. The fair values of derivative assets and liabilities include adjustments for market liquidity, counterparty credit quality and other instrument-specific factors, where appropriate. In addition, the Company incorporates within its fair value measurements a valuation adjustment to reflect the credit risk associated with the net position. Positions are netted by counterparties, and fair value for net long exposures is adjusted for counterparty credit risk while the fair value for net short exposures is adjusted for the Company’s own credit risk.
FORTERRA BUILDING PRODUCTS
Notes to Combined Financial Statements
(USD in thousands, unless stated otherwise)
The estimated carrying amount and fair value of the Company’s financial instruments and liabilities for which fair value is only disclosed is as follows:
| Successor | Fair value measurements at December 31, 2015 using | |||||||||||||||||||
| Carrying Amount December 31, 2015 | Quoted Prices in Active Markets for Identical Assets (Level 1) | Significant Other Observable Inputs (Level 2) | Significant Unobservable Inputs (Level 3) | Total Fair Value December 31, 2015 | ||||||||||||||||
Non-current liabilities | ||||||||||||||||||||
Senior Term Loan | $ | 469,383 | $ | — | $ | 470,543 | $ | — | $ | 470,543 | ||||||||||
Junior Term Loan | 236,446 | — | 259,675 | — | 259,675 | |||||||||||||||
The fair value of debt is the estimated amount LSF9 would have to pay to transfer its debt, including any premium or discount attributable to the difference between the stated interest rate and market rate of interest at the balance sheet date. Fair values are supported by observable market transactions when available.
Deferred compensation is valued using cash surrender value of Company-owned life insurance. The fair values of benefit plan assets and the related disclosure are included in Note 21, Employee Benefit Plans.
9. Derivatives and hedging
The Company uses derivatives to manage selected foreign exchange and interest rate exposures. The Company does not use derivative instruments for speculative trading purposes, and cash flows from derivative instruments are included in net cash provided by (used in) financing activities in the combined statements of cash flows.
In May of 2015, the Company entered into the following derivative instruments: fixed-for-fixed cross currency swaps and fixed-for-float cross currency swaps. The fixed-for-float cross currency swaps are designated as cash flow hedges in accordance with ASC 815-20,Derivatives–Hedging, with the effective portion of the changes in the fair value of the derivatives recorded to accumulated other comprehensive income, and any ineffective portion reflected directly in earnings as other operating expense in the combined statements of operations. The fixed-for-fixed cross currency swaps are not designated as hedge instruments; therefore changes in fair value are recognized immediately in earnings as other operating income (expense) in the combined statements of operations.
A quantitative analysis is utilized to assess hedge effectiveness for cash flow hedges. The Company assesses the hedge effectiveness and measures the amount of ineffectiveness for the hedge relationships based on changes in spot exchange rates. For the period from March 14, 2015 to December 31, 2015, the Company recognized foreign exchange gain of $1.9 million in the combined statement of operations, and $1.5 million included in other comprehensive income (loss) related to cash flow hedges, net of taxes of $0 and $0, respectively.
The Company has elected to present all derivative assets and derivative liabilities, on a net basis on its combined balance sheets when a legally enforceable International Swaps and Derivatives Association, Inc. (“ISDA”) Master Agreement exists. An ISDA Master Agreement is an agreement
FORTERRA BUILDING PRODUCTS
Notes to Combined Financial Statements
(USD in thousands, unless stated otherwise)
between two counterparties, which may have multiple derivative transactions with each other governed by such agreement, and such ISDA Master Agreement generally provides for the net settlement of all or a specified group of these derivative transactions, through a single payment, in a single currency, in the event of a default on, or affecting any, one derivative transaction or a termination event affecting all, or a specified group of, derivative transactions. At December 31, 2015, the Company’s derivative instruments fall under an ISDA master netting agreement, however the Company’s derivative instruments included only assets at the balance sheet date, thus no netting of derivatives is included.
The following table presents the fair values of derivative assets and liabilities in the combined successor balance sheet:
| Successor | ||||||||||||||||
| December 31, 2015 | ||||||||||||||||
| Level 2 | ||||||||||||||||
| Derivative Assets | Derivative Liabilities | |||||||||||||||
| Notional Amount | Fair Value | Notional Amount | Fair Value | |||||||||||||
Fixed-for-fixed cross currency swap | $ | 79,531 | $ | 7,667 | — | — | ||||||||||
Fixed-for-float cross currency swap | 81,991 | 1,426 | — | — | ||||||||||||
|
|
|
|
|
|
|
| |||||||||
Total derivatives, gross | 9,093 | — | ||||||||||||||
Less: Legally enforceable master netting agreements | — | |||||||||||||||
|
|
|
| |||||||||||||
Total derivatives, net | $ | 9,093 | $ | — | ||||||||||||
|
|
|
| |||||||||||||
The following table presents the gain (loss) recognized in earnings on derivative instruments in cash flow hedging relationships in the combined statements of operations:
| Successor | ||||
| March 14 - December 31, | ||||
| 2015 | ||||
Cash flow hedges | ||||
Cross currency swaps | ||||
Gain on derivatives recognized in Accumulated other comprehensive income | $ | 1,549 | ||
Gain on derivatives not designated as hedges | 8,331 | |||
The estimated net amount of existing gains at December 31, 2015 expected to be reclassified into earnings within the next 12 months total $0.5 million.
FORTERRA BUILDING PRODUCTS
Notes to Combined Financial Statements
(USD in thousands, unless stated otherwise)
10. Debt and deferred financing costs
The Company’s debt consisted of the following:
| Successor | Predecessor | |||||||
| December 31, 2015 | December 31, 2014 | |||||||
Senior Term Loan Credit Agreement | ||||||||
interest at 6.50%, net of debt issue costs and original issue discount of $20,129 | $ | 469,383 | $ | — | ||||
Junior Term Loan Credit Agreement | ||||||||
interest at 10.50%, net of debt issue costs and original issue discount of $23,554 | 236,446 | — | ||||||
|
|
|
| |||||
Total debt | 705,829 | — | ||||||
Less: current portion debt | (2,191 | ) | — | |||||
|
|
|
| |||||
Total long-term debt | $ | 703,638 | $ | — | ||||
|
|
|
| |||||
In connection with the financing of the Acquisition, LSF9 entered into a Senior Term Loan Credit Agreement for borrowings of $635.0 million, a Junior Term Loan Credit Agreement for borrowings of $260.0 million, and drew $45.0 million under a $150.0 million revolving credit facility (the “Revolver”). Approximately $515.5 million is the obligation of Forterra as a joint and several obligation underASC 405-40, Obligations Resulting from Joint and Several Liability Arrangements.Arrangements. See also Note 1, Basis of Presentation-Successor.
In connection with the Cretex acquisition, Forterrathe Company issued additional Senior term notes of $240.0 million. In conjunction with the issuance of this debt related to the Acquisition and the Cretex acquisition, LSF9 incurred $71.6 million of debt issuance costs and debt discounts; of which $51.9 million is attributed to the Company debt obligation.
The Company early adopted ASU No. 2015-03,Simplifying the Presentation of Debt Issuance Costs, and classified debt issuance costs as contra-liabilities as of December 31, 2015. As the Company had no prior debt balances, the adoption of ASU 2015-03 required no retrospective adjustment or changes to previously reported balances.
All of the Company’s debt instruments are unconditionally guaranteed by the Company and all its subsidiaries jointly and severally. The credit agreements are secured by substantially all of the assets of the Company. On November 10, 2015, the Company modified the Revolver and increased its available borrowing capacity to $250.0 million. The interest rate for both the Senior Term Loan and Junior Term Loan is set at LIBOR (with a 1% floor) plus a margin of 5.50% and 9.50%, respectively. The Senior Term Loan Credit Agreement has a weighted average effective interest rate of 7.2% for the year ended December 31, 2015 and matures March 2022. The effective interest rate of the Junior Term Loan Credit Agreement was 11.7% for the period, and the debt matures March 2023. The effective interest rate includes the effects of deferred financing fees and original issue discount and premium amortization calculated using the effective interest method.
At December 31, 2015, the Company’s Revolver, which matures in March 2020, had total borrowing capacity of $250.0 million, none of which was outstanding. The available credit under the Revolver is limited by a borrowing base which includes a portion of the Company’s current assets.
FORTERRA BUILDING PRODUCTS
Notes to Combined Financial Statements
(USD in thousands, unless stated otherwise)
Interest is floating, based on a reference rate plus an applicable margin. The weighted average annual interest rate on the Revolver was 1.94% for the period March 14, 2015 through December 31, 2015. In addition, Forterra pays a facility fee of between 25.0 and 37.5 basis points per annum based upon the utilization of the total Revolver facility. Availability under the Revolver at December 31, 2015 based on draws, and outstanding letters of credit and allowable borrowing base was $231.0 million.
FORTERRA BUILDING PRODUCTS
Notes to Combined Financial Statements
(USD in thousands, unless stated otherwise)
For the period from March 13, 2015 to December 31, 2015, cash payments for interest totaled $40.3 million, of which $14.9 million was paid by affiliates of the Company.
As of December 31, 2015, minimum future principal payments on long-term debt are as follows:
| Total | Senior Term Loan | Junior Term Loan | ||||||||||
2016 | $ | 2,191 | $ | 2,191 | $ | — | ||||||
2017 | — | — | — | |||||||||
2018 | — | — | — | |||||||||
2019 | — | — | — | |||||||||
2020 | — | — | — | |||||||||
Thereafter: | 747,321 | 487,321 | 260,000 | |||||||||
|
|
|
|
|
| |||||||
| $ | 749,512 | $ | 489,512 | $ | 260,000 | |||||||
Covenants, Events of Default and Provisions
Under the terms of credit agreements above, LSF9 is required to comply with certain customary covenants, including among others, the limitation of indebtedness, limitations on liens, and limitations on certain cash distributions. The Revolver imposes only financial covenant, which requires LSF9 to maintain a fixed charge coverage ratio of no less than 1.00 to 1.00. The fixed charge coverage ratio is the ratio of consolidated earnings before interest, depreciation, and amortization (“EBITDA”) less cash payments for capital expenditures and income taxes to consolidated fixed charges (interest expense plus scheduled payments of principal on indebtedness). As of December 31, 2015, LSF9 was in compliance with the debt covenants contained in its credit facilities.
Lines of Credit and Other Debt Facilities
The Company had stand-by letters of credit outstanding of $15.8 million as of December 31, 2015 which reduce the borrowings available under the credit facilities.
Joint and several obligations
As discussed above, the Company has recorded debt on its combined balance sheet under ASC 405-40, Obligations Resulting from Joint and Several Liability Arrangements. The Company and the affiliates of LSF9 were co-obligors and jointly and severally liable under terms of the LSF9’s credit agreements. The Company’s allocated portion of the $940.0 million of third party debt used to finance the Acquisition is $515.5 million. The initial obligation of $515.5 million was reflected on the Company’s combined balance sheet at the Acquisition date as $254.9 million of Senior Term Loan, $260 million of Junior Term Loan and $0.6 million of Revolver obligations. The remaining $424.5 million of the debt was allocated to affiliates of LSF9 that are not included in these financial statements based on the amounts affiliates of LSF9 were expected to repay and such amount has been fully repaid by affiliates. In April of 2016, the Company’s affiliate co-obligors were released from joint and several liability under
FORTERRA BUILDING PRODUCTS
Notes to Combined Financial Statements
(USD in thousands, unless stated otherwise)
the LSF9 credit agreements. The Company is consequently the sole source of repayment for its $515.5 million share for the initial obligation under the credit agreements, as well as other obligations recorded on the balance sheet. In addition to the initial debt obligation of $515.5 million recorded by the company, during October 2015, additional LSF9 Senior Term Loan borrowings of $240 million to finance the Cretex acquisition were allocated in full to the Company.
The amounts recorded at December 31, 2015 in the combined balance sheets represent the portion of LSF9’s outstanding obligation as of the balance sheet date the Company was expected to repay. The obligations are secured by substantially all of the assets of the Company.
Repayments on the Revolver of $44.4 million made by affiliates during the period ended December 31, 2015 were applied to the initial Revolver balance when determining the amount to allocate to the Company. The Company allocated related debt issuance costs and discount in proportion to the debt instrument recorded. The Company allocated interest expense based on the total amounts allocated by debt instrument.
11. Accrued liabilities
Accrued liabilities consist of the following for the years ended December 31, 2015 and 2014:
| Successor | Predecessor | |||||||
| December 31, 2015 | December 31, 2014 | |||||||
Accrued payroll and employee benefits | $ | 24,690 | $ | 26,058 | ||||
Accrued taxes | 17,073 | 10,597 | ||||||
Accrued rebates | 8,021 | 7,280 | ||||||
Warranty | 2,429 | 1,644 | ||||||
Shut down and restructuring costs | — | 1,474 | ||||||
Other miscellaneous accrued liabilities | 3,415 | 3,359 | ||||||
|
|
|
| |||||
| $ | 55,628 | $ | 50,412 | |||||
|
|
|
| |||||
FORTERRA BUILDING PRODUCTS
Notes to Combined Financial Statements
(USD in thousands, unless stated otherwise)
12. Other long-term liabilities
Other long-term liabilities consist of the following for the years ended December 31, 2015 and 2014:
| Successor | Predecessor | |||||||
| December 31, 2015 | December 31, 2014 | |||||||
Workers compensation | $ | 1,458 | $ | 10,536 | ||||
Deferred rent | 1,386 | — | ||||||
Environmental remediation liability | 1,315 | 1,654 | ||||||
Asset retirement obligations | 938 | 1,637 | ||||||
Legal | 628 | — | ||||||
Insurance | 527 | 3,451 | ||||||
Employee benefits | — | 10,408 | ||||||
Tax related provision | — | 2,216 | ||||||
Other miscellaneous long-term liabilities | 502 | 2,483 | ||||||
|
|
|
| |||||
| $ | 6,754 | $ | 32,385 | |||||
|
|
|
| |||||
FORTERRA BUILDING PRODUCTS
Notes to Combined Financial Statements
(USD in thousands, unless stated otherwise)
13. Income taxes
Successor
As of the date of the Acquisition, the combined Successor financial statements reflect a new tax basis of accounting as the Company includes taxable entities independent of the Predecessor. Deferred tax assets and liability are recognized principally for the expected tax consequences of temporary differences between the tax basis of assets and liability and their reported amounts, using currently enacted tax rates. All tax consequences associated with the Predecessor period were retained by HC.
Predecessor
The Company’s U.S. and non-U.S. operations have been historically included in certain HC consolidated tax returns. The tax provisions have been prepared on a stand-alone basis, as if the business was a separate group of companies under common ownership although the Company was included in the HC entities’ tax returns. The operations have been combined as if they were filing on a consolidated basis for U.S. and state income tax purposes.purposes as they were historically included in the consolidated U.S. Income tax returns and certain consolidated or unitary group state returns of the prior parent entity. The non-U.S. tax provision has been determined on a stand-alone basis for each non-U.S. affiliate.
FORTERRA BUILDING PRODUCTS
Notes to Combined Financial Statements
(USDaffiliate as these entities have historically filed stand-alone returns as required by the jurisdiction in thousands, unless stated otherwise)
which they operate.
The Company’s income (loss) from continuing operations before income taxes for the period March 14, 2015 to December 31, 2015, January 1, 2015 to March 13, 2015 and for the years ended December 31, 2014 and 2013 was as follows:
| Successor | Predecessor | |||||||||||||||
| For the period from March 14 to December 31, | For the period from January 1 to March 13, | Years ended December 31, | ||||||||||||||
| 2015 | 2015 | 2014 | 2013 | |||||||||||||
U.S. companies | $ | (95,417 | ) | $ | (6,265 | ) | $ | (4,382 | ) | $ | (250,128 | ) | ||||
Canadian companies | 18,409 | (233 | ) | 14,387 | 8,409 | |||||||||||
|
|
|
|
|
|
|
| |||||||||
Total income (loss) from continuing operations before income taxes | $ | (77,008 | ) | $ | (6,498 | ) | $ | 10,005 | $ | (241,719 | ) | |||||
|
|
|
|
|
|
|
| |||||||||
FORTERRA BUILDING PRODUCTS
Notes to Combined Financial Statements
(USD in thousands, unless stated otherwise)
The rate reconciliation for continuing operations presented below is based on the U.S. federal statutory tax rate of 35% because the predominant business activity is in the U.S.:
| Successor | Predecessor | |||||||||||||||
| Period Ended December 31, 2015 | Period Ended March 13, 2015 | Year Ended December 31, 2014 | Year Ended December 31, 2013 | |||||||||||||
Income (loss) from continuing operations | $ | (77,008 | ) | $ | (6,498 | ) | $ | 10,005 | $ | (241,719 | ) | |||||
Income tax expense at statutory rate of 35% | $ | 26,953 | $ | 2,274 | $ | (3,502 | ) | $ | 84,602 | |||||||
State income taxes, net of federal benefit | 1,984 | — | (70 | ) | (62 | ) | ||||||||||
Foreign rate differential | 1,784 | (226 | ) | 1,401 | 727 | |||||||||||
Non-deductible expenses | (527 | ) | — | (497 | ) | — | ||||||||||
Change in valuation allowance | (35,738 | ) | (2,223 | ) | (602 | ) | (4,812 | ) | ||||||||
Goodwill impairment | — | — | — | (82,825 | ) | |||||||||||
Non-deductible transaction costs | (558 | ) | — | — | — | |||||||||||
Other | 324 | 917 | 853 | (191 | ) | |||||||||||
|
|
|
|
|
|
|
| |||||||||
Total income tax (expense) benefit | $ | (5,778 | ) | $ | 742 | $ | (2,417 | ) | $ | (2,561 | ) | |||||
|
|
|
|
|
|
|
| |||||||||
FORTERRA BUILDING PRODUCTS
Notes to Combined Financial Statements
(USD in thousands, unless stated otherwise)
The net deferred tax assets (liabilities) balances were comprised of the following components as of December 31, 2015 and 2014:
| Successor | Predecessor | |||||||
| December 31, 2015 | December 31, 2014 | |||||||
Deferred tax assets: | ||||||||
Inventory | $ | 8,952 | $ | 1,110 | ||||
Reserves and accrued liabilities | 11,449 | 19,760 | ||||||
Net operating losses (NOLs) | 18,030 | 106,599 | ||||||
Capitalized transaction costs | 2,271 | — | ||||||
Intangible assets | 2,599 | 14,620 | ||||||
Other assets | 54 | 1,392 | ||||||
|
|
|
| |||||
Total deferred tax assets | 43,355 | 143,481 | ||||||
|
|
|
| |||||
Valuation allowance | (37,988 | ) | (92,507 | ) | ||||
|
|
|
| |||||
Total deferred tax assets, net | $ | 5,367 | $ | 50,974 | ||||
|
|
|
| |||||
Deferred tax liabilities: | ||||||||
Fixed assets | $ | (3,393 | ) | $ | (50,336 | ) | ||
Derivatives | (179 | ) | — | |||||
Other liabilities | (1,073 | ) | (7,753 | ) | ||||
|
|
|
| |||||
Total deferred tax liabilities | (4,645 | ) | (58,089 | ) | ||||
|
|
|
| |||||
Net deferred tax asset (liability) | $ | 722 | $ | (7,115 | ) | |||
|
|
|
| |||||
FORTERRA BUILDING PRODUCTS
Notes to Combined Financial Statements
(USD in thousands, unless stated otherwise)
The income tax benefits (expenses) from continuing operations for the period March 14, 2015 to December 31, 2015, January 1, 2015 to March 13, 2015 and for the years ended December 31, 2014 and 2013 are as follows:
| Successor | Predecessor | |||||||||||||||
| March 14 - December 31 | January 1, 2013 | Years ended December 31, | ||||||||||||||
| 2015 | 2015 | 2014 | 2013 | |||||||||||||
Current income tax | ||||||||||||||||
U.S. companies | $ | (765 | ) | — | $ | 589 | $ | (436 | ) | |||||||
Canadian companies | (8,151 | ) | 3,491 | (2,388 | ) | (4,796 | ) | |||||||||
|
|
|
|
|
|
|
| |||||||||
Total current tax (expense) benefit | (8,916 | ) | 3,491 | (1,799 | ) | (5,232 | ) | |||||||||
|
|
|
|
|
|
|
| |||||||||
Deferred income tax | ||||||||||||||||
U.S. companies | 441 | — | — | — | ||||||||||||
Canadian companies | 2,697 | (2,749 | ) | (618 | ) | 2,671 | ||||||||||
|
|
|
|
|
|
|
| |||||||||
Total deferred tax (expense) benefit | 3,138 | (2,749 | ) | (618 | ) | 2,671 | ||||||||||
|
|
|
|
|
|
|
| |||||||||
|
|
|
|
|
|
|
| |||||||||
Income tax (expense) benefit - continuing operations | $ | (5,778 | ) | $ | 742 | $ | (2,417 | ) | $ | (2,561 | ) | |||||
|
|
|
|
|
|
|
| |||||||||
FORTERRA BUILDING PRODUCTS
Notes to Combined Financial Statements
(USD in thousands, unless stated otherwise)
As of December 31, 2015, the Company has tax loss carryforwards as follows:
| Amount | Expiration Date | |||||
Federal net operating losses | $ | 38,512 | 2035 | |||
State net operating losses | $ | 21,324 | 2030-2035 | |||
Foreign net operating losses | $ | 1,633 | 2033-2035 | |||
Income tax expense and related current and deferred income taxes receivable and payable for the periods ending March 13, 2015 and December 31, 2013 and 2014 are calculated assuming hypothetical stand-alone income tax returns filed in Canada and its provinces and hypothetical consolidated income tax return for the Predecessor’s U.S. and state activities. The related tax provision amounts for the period ending December 31, 2015 were calculated based on the Company’s standalone activity post-acquisition. The Successor has recorded a full valuation allowance against its net deferred tax assets in the amount of $37,988 as management has concluded the deferred tax assets are not more likely than not to be realized at December 31, 2015. In any event, if the valuation allowance was not recorded, deferred tax assets of $5.2 million would be unavailable to benefit the Company because of interest expense that was paid by an affiliate and not by the Company and therefore is not deductible in the Company’s tax return (see Note 15 Related party transactions). In addition, Lone Star intends to enter into a Tax Receivables Agreement and accordingly, even in the event the Company generates taxable income in future periods, the Company may not realize the benefit of a large portion of the NOLs as the majority of the benefit would be paid to Lone Star. Historically, the U.S. companies were included in the consolidated U.S. income tax return and certain consolidated or unitary group state returns of LHI. The Company’s deferred tax assets and liabilities for the period ending December 31, 2014 are determined on the hypothetical basis described above and do not reflect the amount that would be determined for the Company on a standalone basis. The federal and state net operating loss carryover amounts include interest deductions in the Successor period ended December 31, 2015 that are the result of carve-out accounting adjustments, which will
FORTERRA BUILDING PRODUCTS
Notes to Combined Financial Statements
(USD in thousands, unless stated otherwise)
not be included in the actual net operating loss carryover available to reduce future tax liability. All hypothetical current taxes payable or receivable prior to March 13, 2015 are deemed settled through net parent investment. All tax attributers of the predecessor remain with HC under terms of the Acquisition.
Uncertain tax positions
The Company is subject to audit examinations at federal, state, local, and foreign levels by tax authorities in those jurisdictions who may challenge the treatment or reporting of any tax return item. The tax matters challenged by the tax authorities are typically complex; therefore, the ultimate outcomes of these challenges are subject to uncertainty. Taxable years after 2009 are still open for examination for the U.S. and Canada.
Each period the Company assesses uncertain tax positions for recognition, measurement and effective settlement. Benefits from uncertain tax positions are measured at the largest amount of benefit that is greater than 50 percent likely of being realized upon settlement. Where it has been determined that our tax return filing position does not satisfy the more-likely-than-not recognition threshold, no tax benefits are recorded. The Company has uncertain tax positions related to its Canadian operations that are subject to an indemnification from HC.
FORTERRA BUILDING PRODUCTS
Notes to Combined Financial Statements
(USD in thousands, unless stated otherwise)
14. Commitments and contingencies
As of December 31, 2015, the Company had outstanding surety bonds in the amount of $121.3 million to secure performance commitments. The Company also had letters of credit outstanding of $15.8 million with no amounts withdrawn as of December 31, 2015.
The Company is involved in legal proceedings and litigation in the ordinary course of business. In the opinion of management, the outcome of such matters will not have a material adverse effect on the Company’s combined financial position, results of operations, or liquidity. Other than routine litigation incidental to the Company’s business, there are no material legal proceedings to which the Company is a party or to which any of the Company’s properties are subject.
In connection with the Earn-out contingency described in Note 3, the Acquisition included contingent consideration of up to $100.0 million if and to the extent the 2015 financial results of the businesses acquired by Lone Star in the Acquisition, including the Company and Forterra UK, exceeded a specified Adjusted EBITDA target for fiscal year 2015, as calculated pursuant to the terms of the purchase agreement. If such Adjusted EBITDA calculation exceeds the specified target, LSF9, and therefore, Forterra would be required to pay HC an amount equal to a multiple of such excess Adjusted EBITDA, with any payment capped at $100.0 million. In April 2016, the Company provided an earn-out statement to HC demonstrating that no payment was required. On June 13, 2016, HC provided notification that it is disputing, among other things, the Company’s calculation of Adjusted EBITDA under the purchase agreement and asserting that a payment should be made in the amount of $100.0 million. The Company does not believe HC’s position has merit and intends to vigorously oppose HC’s assertions. As of December 31, 2015, no liability for this contingency has been accrued as payment of any earn-out is not considered probable. However, the outcome of this matter is uncertain, and no assurance can be given to the ultimate outcome of the resulting proceedings. If LSF9 is unsuccessful in resolving the dispute, the Company could recognize a material charge to its earnings.
FORTERRA BUILDING PRODUCTS
Notes to Combined Financial Statements
(USD in thousands, unless stated otherwise)
Operating leases
The Company leases certain property and equipment for various periods under non-cancelable operating leases. Future minimum lease payments under such agreements as of December 31, 2015 were approximately:
2016 | $ | 2,691 | ||
2017 | 2,061 | |||
2018 | 1,707 | |||
2019 | 775 | |||
2020 | 526 | |||
Thereafter | 2,504 | |||
|
| |||
| $ | 10,264 | |||
|
|
Long-term incentive plan
Following the Acquisition the Company implemented a cash-based long term incentive plan (the “LTIP”), which entitles the participants in the LTIP a potential cash payout upon a monetization event
FORTERRA BUILDING PRODUCTS
Notes to Combined Financial Statements
(USD in thousands, unless stated otherwise)
as defined by the LTIP. Potential monetization events include the sale of the Company, an initial public offering where Lone Star reduces its ownership interest in the Company below 50% or at Lone Star’s discretion, or through certain cash distribution as defined in the LTIP. Before the payout of any cash the LTIP requires Lone Star receive a return of their investment plus a specified internal rate of return, which is calculated by comparing the return to Lone Star over the timeline of the investment in the Company. As of December 31, 2015, no such monetization events had occurred, and therefore no amounts were accrued in the accompanying combined balance sheet as of December 31, 2015. The Company is contemplating an initial public offering as early as the third quarter of 2016, but the initial public offering is not expected to bereach the required return on investment to trigger a monetization eventpayout under the LTIP.
Asset retirement obligations (ARO)
The Company incurs reclamation obligations as part of its brick production processes. The Company recognizes the present value of the fair value of a legally enforceable liability representing an asset retirement obligation in the period in which it is incurred. Accretion of the liability is recorded in other operating income. It also recognizes an asset representing the anticipated costs of dismantling machinery and equipment (“tear-down” costs) and depreciates the asset over the remaining life of the equipment. The Company recorded the following ARO liabilities as of December 31, 2015 and 2014:
| Successor | Predecessor | |||||||
| December 31, 2015 | December 31, 2014 | |||||||
Beginning balance | $ | 1,885 | $ | 1,515 | ||||
Reclamation adjustment | 24 | 170 | ||||||
FV adjustment | (139 | ) | — | |||||
Locations sold | (248 | ) | — | |||||
Spend | (262 | ) | — | |||||
Accretion | 93 | 200 | ||||||
|
|
|
| |||||
Ending balance | $ | 1,353 | $ | 1,885 | ||||
Current portion | (415 | ) | (248 | ) | ||||
|
|
|
| |||||
Long-term portion | $ | 938 | $ | 1,637 | ||||
|
|
|
| |||||
FORTERRA BUILDING PRODUCTS
Notes to Combined Financial Statements
(USD in thousands, unless stated otherwise)
15. Related party transactions
Predecessor
Parent company net investment
During the Predecessor period the combined Predecessor financial statements for the Company are based on the accounting records of HC. Within these records, each subsidiary of BP has its own equity accounts in the books and records, as well as intercompany balances due (to)/from affiliates and operations within HC. These intercompany balances are considered by HC as part of the capital structure of these entities and are not regularly settled in cash with the affiliate counterparties. Therefore, these intercompany balances act as clearing accounts between the parties and consist of the accumulated net transactions between the Company and other entities and operations of HC and may include both operating items (allocated expenses and purchases of services and materials) and equity items (transfers of assets, cash and dividends). The Company has recorded all such equity and intercompany balances in a single caption, Parent company net investment.
FORTERRA BUILDING PRODUCTS
Notes to Combined Financial Statements
(USD in thousands, unless stated otherwise)
The following table presents the components of net transfers to Parent for the period from January 1, 2015 to March 13, 2015 and for the years ended December 31, 2014 and 2013 were as follows:
Net transfer category | 2015 | 2014 | 2013 | |||||||||
Cash clearing and other financing activities | $ | 64,280 | $ | 3,092 | $ | 486 | ||||||
Corporate allocations | (4,112 | ) | (23,576 | ) | (29,373 | ) | ||||||
Contribution of net assets to Parent | — | (32,459 | ) | — | ||||||||
Current income taxes – federal and state | 742 | (3,133 | ) | (2,561 | ) | |||||||
|
|
|
|
|
| |||||||
| $ | 60,910 | $ | (56,076 | ) | $ | (31,448 | ) | |||||
|
|
|
|
|
| |||||||
Allocated expenses
The Company was allocated selling, general and administrative expenses from the Parent for certain shared services of $4,112, $23,576 and $29,373 for the period from January 1, 2015 to March 13, 2015 and for the years ended December 31, 2014 and 2013, respectively. The allocated costs are included in costs of goods sold or selling, general and administrative expenses in the combined Predecessor statements of operations. The historical costs and expenses reflected in our combined financial statements include an allocation for certain corporate functions historically provided by HC or its wholly-owned subsidiaries. Substantially all of the Predecessor’s senior management was employed by HC and certain functions critical to the Predecessor’s operations were centralized and managed by HC. Historically, the centralized functions have included executive senior management, financial reporting, financial planning and analysis, accounting, shared services, information technology, tax, risk management, treasury, legal, human resources, land management and strategy and development. Additionally, the Company temporarily rented office space provided by affiliates of HC. The cost of each of these services has been allocated to the Predecessor on the basis of the Predecessor’s relative net sales or head count as compared to that of HC depending upon which allocation methodology is more meaningful for each service. The Company and HC believe that these allocations reasonably reflect the utilization of services provided and benefits received by the Predecessor. However, these amounts are not necessarily representative of the amounts that would have been incurred by the Predecessor as a separate entity.
FORTERRA BUILDING PRODUCTS
Notes to Combined Financial Statements
(USD in thousands, unless stated otherwise)
Successor
Contributed capital
The initial contributed capital of LSF9 allocated to the Company was $167.5 million at the date of the Acquisition. During the period from March 14, 2015 to December 31, 2015, the Company paid certain transaction and other costs for affiliates that are recorded as distributions in these financial statements. Likewise, an affiliate not included in these financial statements paid $14.9 million of interest on behalf of the Company. The above activity is recorded net as a return of contributed capital of $27,613 in these financial statements.
Transition Services Agreement (“TSA”)
The Company is no longer part of HC and its affiliates, but did have a Transition Services Agreement with HC providing for corporate overhead services. Per the TSA, the services are to be provided to the Successor for a period of up to 18 months, and may be terminated at will with proper
FORTERRA BUILDING PRODUCTS
Notes to Combined Financial Statements
(USD in thousands, unless stated otherwise)
notice by the Successor. The initial services provided primarily consisted of certain accounting, information technology, human resources, and other general and administrative services associated with the Successor’s transition to a stand-alone company.
Cement Supply Agreement
The Company entered into an agreement with HC and its affiliates for the continued supply of cement, in which the Company agreed to source a minimum percentage of such materials consumed at prevailing market prices as defined in the agreements.
Hudson Advisors
The Company has an advisory agreement with Hudson Advisors, an affiliate of Lone Star, to provide certain management oversight services to the Company, including assistance and advice on strategic plans, obtaining and maintaining certain legal documents, and communicating and coordinating with service providers. The Company incurred fees totaling $9,151 for the period March 14 through December 31, 2015 for these services included in selling, general and administrative costs on the combined Successor statement of operations. For fiscal year 2014 and 2013, no services were provided.
Related party payables and activity
The Predecessor had net payables to affiliates totaling $0.7 million at December 31, 2014 that were net settled in consummation of the Acquisition. At December 31, 2015, the Successor has payables to affiliates totaling $3.2 million that are regularly settled in cash. Purchases of raw materials from affiliates of the Predecessor for the years ended December 31, 2014 and 2013 were $45.4 million and $47.2 million, respectively.
16. Segment reporting
During the Successor period in 2015, the Company realigned its business segment reporting structure as a result of the change in the Chief Operating Decision Maker (“CODM”). The segment data below reflects business segment information as managed by the Successor, and comparative financial data for the historical periods of the Predecessor have been presented to conform to the current segment structure. The accounting policies for our segments follow the Company’s accounting policies.
FORTERRA BUILDING PRODUCTS
Notes to Combined Financial Statements
(USD in thousands, unless stated otherwise)
Segment information is presented in accordance with ASC 280,Segment Reporting (“ASC 280”), which establishes standards for reporting information about operating segments. It also establishes standards for related disclosures about products and geographic areas. Operating segments are defined as components of an enterprise that engage in business activities that earn revenues, incur expenses and prepare separate financial information that is evaluated regularly by the Company’s chief operating decision maker in order to allocate resources and assess performance. The Corporate and Other segment includes expenses related to certain executive salaries, interest costs related to long-term debt, acquisition related costs, and other corporate costs that are not directly attributable to our operating segments.
Net sales from the major products sold to external customers include drainage pipe and precast products, concrete and steel water transmission pipe, and clay bricks and concrete blocks.
FORTERRA BUILDING PRODUCTS
Notes to Combined Financial Statements
(USD in thousands, unless stated otherwise)
The Company’s two geographic areas consist of the United States and Canada for which it reports net sales, fixed assets and total assets. For purposes of evaluating segment profit, the CODM reviews EBITDA as a basis for making the decisions to allocate resources and assess performance.
FORTERRA BUILDING PRODUCTS
Notes to Combined Financial Statements
(USD in thousands, unless stated otherwise)
The following tables set forth reportable segment information of the Company with respect to net sales and other financial information attributable to our reportable segments for the period from March 14, 2015 to December 31, 2015, for the period from January 1, 2015 to March 13, 2015 and for the years ended December 31, 2014 and 2013:
Successor For the period March 14 - December 31, 2015: | Drainage Pipe & Products | Water Pipe & Products | Bricks | Corporate and Other | Total | |||||||||||||||
Net sales | $ | 431,723 | $ | 167,417 | $ | 118,389 | $ | 5,135 | $ | 722,664 | ||||||||||
Income (loss) from continuing operations before income taxes | 48,216 | 6,824 | (8,401 | ) | (123,647 | ) | (77,008 | ) | ||||||||||||
Depreciation and amortization | 16,792 | 7,944 | 7,680 | 514 | 32,930 | |||||||||||||||
Interest (income)/expense | (5 | ) | — | 181 | 45,777 | 45,953 | ||||||||||||||
|
|
|
|
|
|
|
|
|
| |||||||||||
EBITDA | $ | 65,003 | $ | 14,768 | $ | (540 | ) | $ | (77,356 | ) | $ | 1,875 | ||||||||
|
|
|
|
|
|
|
|
|
| |||||||||||
Capital expenditures | $ | 10,648 | $ | 4,719 | $ | 4,677 | $ | — | $ | 20,044 | ||||||||||
|
|
|
|
|
|
|
|
|
| |||||||||||
Total assets as of December 31, 2015 | $ | 626,477 | $ | 136,909 | $ | 147,699 | $ | 27,790 | $ | 938,875 | ||||||||||
|
|
|
|
|
|
|
|
|
| |||||||||||
Predecessor For the period January 1 - March 13, 2015: | Drainage Pipe & Products | Water Pipe & Products | Bricks | Corporate and Other | Total | |||||||||||||||
Net sales | $ | 79,341 | $ | 30,464 | $ | 19,922 | $ | 2,893 | $ | 132,620 | ||||||||||
Income (loss) from continuing operations before income taxes | 8,839 | (3,192 | ) | (4,000 | ) | (8,145 | ) | (6,498 | ) | |||||||||||
Depreciation and amortization | 3,231 | 1,030 | 2,505 | 128 | 6,894 | |||||||||||||||
Interest (income)/expense | — | — | 18 | 66 | 84 | |||||||||||||||
|
|
|
|
|
|
|
|
|
| |||||||||||
EBITDA | $ | 12,070 | $ | (2,162 | ) | $ | (1,477 | ) | $ | (7,951 | ) | $ | 480 | |||||||
|
|
|
|
|
|
|
|
|
| |||||||||||
Capital expenditures | $ | 621 | $ | 1,851 | $ | 272 | $ | — | $ | 2,744 | ||||||||||
|
|
|
|
|
|
|
|
|
| |||||||||||
Successor For the period March 14 - December 31, 2015: | Drainage Pipe & Products | Water Pipe & Products | Bricks | Corporate and Other | Total | |||||||||||||||||||||||||||||||||||
Net sales | $ | 431,723 | $ | 167,417 | $ | 118,389 | $ | 5,135 | $ | 722,664 | ||||||||||||||||||||||||||||||
Income (loss) from continuing operations before income taxes | 48,216 | 6,824 | (8,401 | ) | (123,647 | ) | (77,008 | ) | ||||||||||||||||||||||||||||||||
Depreciation and amortization | 16,792 | 7,944 | 7,680 | 514 | 32,930 | |||||||||||||||||||||||||||||||||||
Interest (income)/expense | (5 | ) | — | 181 | 45,777 | 45,953 | ||||||||||||||||||||||||||||||||||
|
|
|
|
| ||||||||||||||||||||||||||||||||||||
EBITDA | $ | 65,003 | $ | 14,768 | $ | (540 | ) | $ | (77,356 | ) | $ | 1,875 | ||||||||||||||||||||||||||||
|
|
|
|
| ||||||||||||||||||||||||||||||||||||
Capital expenditures | $ | 10,648 | $ | 4,719 | $ | 4,677 | $ | — | $ | 20,044 | ||||||||||||||||||||||||||||||
|
|
|
|
| ||||||||||||||||||||||||||||||||||||
Total assets as of December 31, 2015 | $ | 626,477 | $ | 136,909 | $ | 147,699 | $ | 27,790 | $ | 938,875 | ||||||||||||||||||||||||||||||
|
|
|
|
| ||||||||||||||||||||||||||||||||||||
Predecessor For the period January 1 - March 13, 2015: | Drainage Pipe & Products | Water Pipe & Products | Bricks | Corporate and Other | Total | |||||||||||||||||||||||||||||||||||
Net sales | $ | 79,341 | $ | 30,464 | $ | 19,922 | $ | 2,893 | $ | 132,620 | ||||||||||||||||||||||||||||||
Income (loss) from continuing operations before income taxes | 8,839 | (3,192 | ) | (4,000 | ) | (8,145 | ) | (6,498 | ) | |||||||||||||||||||||||||||||||
Depreciation and amortization | 3,231 | 1,030 | 2,505 | 128 | 6,894 | |||||||||||||||||||||||||||||||||||
Interest (income)/expense | — | — | 18 | 66 | 84 | |||||||||||||||||||||||||||||||||||
|
|
|
|
| ||||||||||||||||||||||||||||||||||||
EBITDA | $ | 12,070 | $ | (2,162 | ) | $ | (1,477 | ) | $ | (7,951 | ) | $ | 480 | |||||||||||||||||||||||||||
|
|
|
|
| ||||||||||||||||||||||||||||||||||||
Capital expenditures | $ | 621 | $ | 1,851 | $ | 272 | $ | — | $ | 2,744 | ||||||||||||||||||||||||||||||
|
|
|
|
| ||||||||||||||||||||||||||||||||||||
| For the year ended December 31, 2014: | Drainage Pipe & Products | Water Pipe & Products | Bricks | Corporate and Other | Total | Drainage Pipe & Products | Water Pipe & Products | Bricks | Corporate and Other | Total | ||||||||||||||||||||||||||||||
Net sales | $ | 436,754 | $ | 149,864 | $ | 139,537 | $ | 10,808 | $ | 736,963 | $ | 436,754 | $ | 149,864 | $ | 139,537 | $ | 10,808 | $ | 736,963 | ||||||||||||||||||||
Income (loss) from continuing operations before income taxes | 64,686 | 6,412 | (2,078 | ) | (59,015 | ) | 10,005 | 64,686 | 6,412 | (2,078 | ) | (59,015 | ) | 10,005 | ||||||||||||||||||||||||||
Depreciation and amortization | 16,011 | 4,968 | 12,981 | 2,645 | 36,605 | 16,011 | 4,968 | 12,981 | 2,645 | 36,605 | ||||||||||||||||||||||||||||||
Interest (income)/expense | — | — | — | — | — | — | — | — | — | — | ||||||||||||||||||||||||||||||
|
|
|
|
|
|
|
|
|
| |||||||||||||||||||||||||||||||
EBITDA | $ | 80,697 | $ | 11,380 | $ | 10,903 | $ | (56,370 | ) | $ | 46,610 | $ | 80,697 | $ | 11,380 | $ | 10,903 | $ | (56,370 | ) | $ | 46,610 | ||||||||||||||||||
|
|
|
|
|
|
|
|
|
| |||||||||||||||||||||||||||||||
Capital expenditures | $ | 7,386 | $ | 13,403 | $ | 4,505 | $ | — | $ | 25,294 | $ | 7,386 | $ | 13,403 | $ | 4,505 | $ | — | $ | 25,294 | ||||||||||||||||||||
|
|
|
|
|
|
|
|
|
| |||||||||||||||||||||||||||||||
Total assets as of December 31, 2014 | $ | 455,050 | $ | 188,889 | $ | 190,591 | $ | 11,638 | $ | 846,168 | $ | 455,050 | $ | 188,889 | $ | 190,591 | $ | 11,638 | $ | 846,168 | ||||||||||||||||||||
|
|
|
|
|
|
|
|
|
| |||||||||||||||||||||||||||||||
FORTERRA BUILDING PRODUCTS
Notes to Combined Financial Statements
(USD in thousands, unless stated otherwise)
| For the year ended December 31, 2013: | Drainage Pipe & Products | Water Pipe & Products | Bricks | Corporate and Other | Total | |||||||||||||||
Net sales | $ | 372,060 | $ | 171,773 | $ | 145,500 | $ | 8,615 | $ | 697,948 | ||||||||||
Income (loss) from continuing operations before income taxes | 10,937 | (218,555 | ) | 2,594 | (36,695 | ) | (241,719 | ) | ||||||||||||
Depreciation and amortization | 17,396 | 4,929 | 14,163 | 2,072 | 38,560 | |||||||||||||||
Interest (income)/expense | — | — | — | — | — | |||||||||||||||
|
|
|
|
|
|
|
|
|
| |||||||||||
EBITDA | $ | 28,333 | $ | (213,626 | ) | $ | 16,757 | $ | (34,623 | ) | $ | (203,159 | ) | |||||||
|
|
|
|
|
|
|
|
|
| |||||||||||
Capital expenditures | $ | 3,263 | $ | 4,279 | $ | 2,889 | $ | 136 | $ | 10,567 | ||||||||||
|
|
|
|
|
|
|
|
|
| |||||||||||
The Water Pipe & Products segment net loss of $218,903 for the year ended December 31, 2013 is inclusive of $248,650 of impairment charges to property, plant and equipment, and goodwill.
In addition, the Company also has an investment in an equity method investee included in the following segment:
| Successor | Predecessor | |||||||
| At December 31, 2015 | At December 31, 2014 | |||||||
Drainage Pipe & Products | $ | 56,289 | $ | 47,452 | ||||
|
|
|
| |||||
The Company is also required by ASC 280 to disclose additional information related to geographic location. The Company has operations in both the United States and Canada. The Company has both property, plant and equipment and net sales in each country and those property, plant and equipment and net sales are recorded within each applicable geographic location as follows:
| Property, plant and equipment | ||||||||||||
| Successor | Predecessor | |||||||||||
| December 31, 2015 | December 31, 2014 | December 31, 2013 | ||||||||||
United States | $ | 305,843 | $ | 289,781 | $ | 308,223 | ||||||
Canada | 83,081 | 124,292 | 140,927 | |||||||||
|
|
|
|
|
| |||||||
| $ | 388,924 | $ | 414,073 | $ | 449,150 | |||||||
|
|
|
|
|
| |||||||
| Net Sales | ||||||||||||||||
| Successor | Predecessor | |||||||||||||||
| For the period from March 14 to December 31, | For the period from January 1 to March 13, | Years ended December 31, | ||||||||||||||
| 2015 | 2015 | 2014 | 2013 | |||||||||||||
United States | $ | 585,809 | $ | 112,299 | $ | 592,959 | $ | 559,169 | ||||||||
Canada | 136,855 | 20,321 | 144,004 | 138,779 | ||||||||||||
|
|
|
|
|
|
|
| |||||||||
| $ | 722,664 | $ | 132,620 | $ | 736,963 | $ | 697,948 | |||||||||
|
|
|
|
|
|
|
| |||||||||
FORTERRA BUILDING PRODUCTS
Notes to Combined Financial Statements
(USD in thousands, unless stated otherwise)
17. Discontinued operations and assets held for sale
In the Predecessor periods, certain plants and facilities were determined to be outside of the scope of the Acquisition, and as such were presented as held for sale on the combined balance sheets and discontinued operations on the combined statements of operations. As of September 30, 2014, the
FORTERRA BUILDING PRODUCTS
Notes to Combined Financial Statements
(USD in thousands, unless stated otherwise)
Company distributed $16,421 representing the net assets of the Maple Grove structural precast manufacturing business (“Maple Grove”) in the United States to HC. HC sold Maple Grove to a third party on October 31, 2014; therefore, the results of Maple Grove operations through September 30, 2014 and for the years ended December 31, 2014 and 2013 are reflected as discontinued operations. Cash flows relating to all plants that met the ASC 360 criteria for held for sale classification as of December 31, 2014 are included in discontinued operations.
The following table shows the components of discontinued operations for the years ended December 31, 2014 and 2013:
| Predecessor | ||||||||
| December 31, | ||||||||
| 2014 | 2013 | |||||||
Revenues | $ | 34,824 | $ | 35,079 | ||||
|
|
|
| |||||
Gain (loss) from operations of discontinued operations before income tax | 1,976 | (2,844 | ) | |||||
Gain (loss) on disposal of discontinued operations | — | (174 | ) | |||||
Income tax benefit (expense) from discontinued operations | (716 | ) | — | |||||
|
|
|
| |||||
Gain (loss) on discontinued operations, net of tax | $ | 1,260 | $ | (3,018 | ) | |||
|
|
|
| |||||
Cash flows relating to all plants that met the ASC 360 criteria for held for sale classification as of December 31, 2013 are included in discontinued operations for all periods presented if those plants were part of a component that was disposed of during the periods presented.
In 2013, the Company sold its roof tile business in the western region of the United States for total proceeds of $1,847, resulting in a loss of $174. The Company no longer operates a roof tile business in the western region of the United States.
18. Impairment and restructuring charges
The Company recorded impairment and restructuring charges for the period from March 1, 2015 to December 31, 2015, for the period from January 1, 2015 to March 13, 2015 and for the years ended December 31, 2014 and 2013 as follows:
| Successor | Predecessor | |||||||||||||||
| For the period from March 14 to December 31, | For the period from January 1 to March 13, | For the years ended December 31, | ||||||||||||||
| 2015 | 2015 | 2014 | 2013 | |||||||||||||
Impairment of property, plant and equipment (Note 6) | $ | 1,088 | $ | 27 | $ | 3,977 | $ | 12,011 | ||||||||
Restructuring charges | 97 | 515 | 242 | 1,927 | ||||||||||||
Impairment of goodwill and other intangibles (Note 7) | — | — | — | 236,639 | ||||||||||||
|
|
|
|
|
|
|
| |||||||||
| $ | 1,185 | $ | 542 | $ | 4,219 | $ | 250,577 | |||||||||
|
|
|
|
|
|
|
| |||||||||
FORTERRA BUILDING PRODUCTS
Notes to Combined Financial Statements
(USD in thousands, unless stated otherwise)
The Company periodically initiates programs to reduce costs and improve operating effectiveness. These programs include the closing of plants and the termination of portions of the workforce. As part of these plans, the Company incurs severance, lease and other contract termination costs.
FORTERRA BUILDING PRODUCTS
Notes to Combined Financial Statements
(USD in thousands, unless stated otherwise)
19. Investments in equity method investee
On July 20, 2012, the Company entered into a joint venture agreement with a company that produces concrete pipe and precast to form Concrete Pipe & Precast LLC (“CP&P”). The Company contributed plant assets and related inventory from nine operating locations as part of the agreement to form CP&P and in return for the contribution the Company obtained a 50% ownership stake in the joint venture through its 500 Common Unit voting shares in CP&P. The Company owns 50% of CP&P voting common stock. The Company also received 150 preferred units redeemable for $100 each, or a $15,000 preferred interest in CP&P, for which the Company received a preferred return of $209 and $437 during 2014 and 2013, respectively, which is included in other income in the combined statements of operations.
The Company has recorded its investment in the Common Unit voting shares in accordance with ASC 323,Investments–EquityMethod
The Board of Directors and Joint Ventures(“ASC 323”),underManagement
LSF9 Concrete Holdings, Ltd.
We have audited the equity methodaccompanying combined balance sheets of accounting. The preferred interest is accounted for by theCompanyForterra Building Products (the Successor) as an interest-bearing receivable. In July 2014, the Company’s 150 preferred units in the amount of $15,000 were redeemed for cash.
As part of the Acquisition the Company determined the fair value of the assets purchased, including its investment in CP&P, in accordance with ASC 805. As part of that process the Company assigned a value of $56,335 to the investment as of the date of Acquisition. As of December 31, 2015, and the related combined statements of operations, comprehensive loss, shareholder’s equity and cash flows for the period from March 14, 2015 to December 31, 2015. We have also audited the accompanying combined balance sheets of the North American building products operations of HeidelbergCement A.G. (the Predecessor) as of December 31, 2014 and the related combined statements of operations, comprehensive loss, parent company net investment and cash flows for the period from January 1, 2015 to March 13, 2015 and for each of the two years in the period ended December 31, 2014. These financial statements are the responsibility of the Company’s investmentmanagement. Our responsibility is to express an opinion on these financial statements based on our audits.
We conducted our audits in CP&P amountedaccordance with the standards of the Public Company Accounting Oversight Board (United States). Those standards require that we plan and perform the audit to $56,289obtain reasonable assurance about whether the financial statements are free of material misstatement. We were not engaged to perform an audit of the Company’s internal control over financial reporting. Our audits included consideration of internal control over financial reporting as a basis for designing audit procedures that are appropriate in the circumstances, but not for the purpose of expressing an opinion on the effectiveness of the Company’s internal control over financial reporting. Accordingly, we express no such opinion. An audit also includes examining, on a test basis, evidence supporting the amounts and $47,452, respectively. Atdisclosures in the financial statements, assessing the accounting principles used and significant estimates made by management, and evaluating the overall financial statement presentation. We believe that our audits provide a reasonable basis for our opinion.
In our opinion, the financial statements referred to above present fairly, in all material respects, the combined financial position of Forterra Building Products at December 31, 2015, and the difference betweencombined results of its operations and its cash flows for the amountperiod from March 14, 2015 to December 31, 2015, in conformity with U.S. generally accepted accounting principles. Also in our opinion, the Predecessor financial statements referred to above present fairly in all material respects, the combined financial position of the Predecessor at December 31, 2014 and the combined results of its operations and cash flows for the period from January 1, 2015 to March 13, 2015 and each of the two years in the period ended December 31, 2014, in conformity with U.S. generally accepted accounting principles.
/s/ Ernst & Young LLP
Dallas, Texas
July 8, 2016
Combined Statements of Operations
(In $US thousands)
| Successor | Predecessor | |||||||||||||||
| For the period from March 14 to December 31, | For the period from January 1 to March 13, | Years ended December 31, | ||||||||||||||
| 2015 | 2015 | 2014 | 2013 | |||||||||||||
Net sales | $ | 722,664 | $ | 132,620 | $ | 736,963 | $ | 697,948 | ||||||||
Cost of goods sold | 626,498 | 117,831 | 631,454 | 611,660 | ||||||||||||
|
|
|
|
|
|
|
| |||||||||
Gross profit | 96,166 | 14,789 | 105,509 | 86,288 | ||||||||||||
Selling, general & administrative expenses | (134,971 | ) | (21,683 | ) | (102,107 | ) | (87,393 | ) | ||||||||
Impairment and restructuring charges | (1,185 | ) | (542 | ) | (4,219 | ) | (250,577 | ) | ||||||||
Earnings from equity method investee | 8,429 | 67 | 4,451 | (216 | ) | |||||||||||
Gain (loss) on sale of property, plant and equipment and business, net | (618 | ) | 122 | 2,329 | 3,998 | |||||||||||
Other operating income | 1,450 | 872 | 4,636 | 5,234 | ||||||||||||
|
|
|
|
|
|
|
| |||||||||
| (126,895 | ) | (21,164 | ) | (94,910 | ) | (328,954 | ) | |||||||||
|
|
|
|
|
|
|
| |||||||||
Income (loss) from operations | (30,729 | ) | (6,375 | ) | 10,599 | (242,666 | ) | |||||||||
Other income (expenses) | ||||||||||||||||
Interest expense | (45,953 | ) | (84 | ) | — | — | ||||||||||
Other income (expense), net | (326 | ) | (39 | ) | (594 | ) | 947 | |||||||||
|
|
|
|
|
|
|
| |||||||||
Income (loss) from continuing operations before income taxes | (77,008 | ) | (6,498 | ) | 10,005 | (241,719 | ) | |||||||||
Income tax (expense) benefit | (5,778 | ) | 742 | (2,417 | ) | (2,561 | ) | |||||||||
|
|
|
|
|
|
|
| |||||||||
Income (loss) from continuing operations | (82,786 | ) | (5,756 | ) | 7,588 | (244,280 | ) | |||||||||
|
|
|
|
|
|
|
| |||||||||
Discontinued operations | ||||||||||||||||
Income (loss) from discontinued operations (including gain (loss) on disposal of $0, and $174, respectively) | — | — | 1,976 | (3,018 | ) | |||||||||||
Income tax benefit (expense) from discontinued operations | — | — | (716 | ) | — | |||||||||||
|
|
|
|
|
|
|
| |||||||||
Gain (loss) on discontinued operations, net of income tax | — | — | 1,260 | (3,018 | ) | |||||||||||
|
|
|
|
|
|
|
| |||||||||
Net income (loss) | $ | (82,786 | ) | $ | (5,756 | ) | $ | 8,848 | $ | (247,298 | ) | |||||
|
|
|
|
|
|
|
| |||||||||
See accompanying notes to the combined financial statements
Combined Statements of Comprehensive Loss
(USD in thousands)
| Successor | Predecessor | |||||||||||||||
| For the period from March 14 to December 31, | For the period from January 1 to March 13, | For the year ended December 31, | ||||||||||||||
| 2015 | 2015 | 2014 | 2013 | |||||||||||||
Net income (loss) | $ | (82,786 | ) | $ | (5,756 | ) | $ | 8,848 | $ | (247,298 | ) | |||||
Gains on derivative transactions, net of tax | 1,549 | — | — | — | ||||||||||||
Actuarial gains on defined benefit plans, net of tax | — | 2,645 | (2,032 | ) | 4,118 | |||||||||||
Foreign currency translation adjustment | (6,317 | ) | (19,751 | ) | (20,127 | ) | (16,717 | ) | ||||||||
|
|
|
|
|
|
|
| |||||||||
Comprehensive loss | $ | (87,554 | ) | $ | (22,862 | ) | $ | (13,311 | ) | $ | (259,897 | ) | ||||
|
|
|
|
|
|
|
| |||||||||
See accompanying notes to the combined financial statements
(USD in thousands)
| Successor | Predecessor | |||||||
| December 31, 2015 | December 31, 2014 | |||||||
ASSETS | ||||||||
Current assets | ||||||||
Cash and cash equivalents | $ | 43,590 | $ | 42 | ||||
Receivables, net | 118,959 | 109,049 | ||||||
Inventories | 210,615 | 190,496 | ||||||
Other current assets | 2,844 | 652 | ||||||
|
|
|
| |||||
Total current assets | 376,008 | 300,239 | ||||||
|
|
|
| |||||
Non-current assets | ||||||||
Property, plant and equipment, net | 388,924 | 414,073 | ||||||
Goodwill | 75,537 | 83,674 | ||||||
Other intangible assets, net | 26,062 | — | ||||||
Investment in equity method investee | 56,289 | 47,452 | ||||||
Deferred tax asset | 3,087 | — | ||||||
Derivative assets | 9,093 | — | ||||||
Other long term assets | 3,875 | 730 | ||||||
|
|
|
| |||||
Total assets | $ | 938,875 | $ | 846,168 | ||||
|
|
|
| |||||
LIABILITIES AND EQUITY | ||||||||
Current liabilities | ||||||||
Trade payables | $ | 96,486 | $ | 73,508 | ||||
Accrued liabilities | 55,628 | 50,412 | ||||||
Deferred revenue | 19,498 | 11,935 | ||||||
Current portion of long term debt | 2,191 | — | ||||||
Employee benefit obligations | — | 309 | ||||||
Capital lease liability | — | 19 | ||||||
|
|
|
| |||||
Total current liabilities | 173,803 | 136,183 | ||||||
|
|
|
| |||||
Non-current liabilities | ||||||||
Employee benefit obligations | — | 13,012 | ||||||
Deferred tax liability | 2,365 | 7,115 | ||||||
Senior Term Loan | 467,192 | — | ||||||
Junior Term Loan | 236,446 | — | ||||||
Other long term liabilities | 6,754 | 32,385 | ||||||
|
|
|
| |||||
Total liabilities | 886,560 | 188,695 | ||||||
Commitments and Contingencies (Note 14) | ||||||||
Equity | ||||||||
Accumulated other comprehensive loss | — | (21,189 | ) | |||||
Accumulated net contributions from parent | — | 678,662 | ||||||
|
|
|
| |||||
Total parent company net investment | — | 657,473 | ||||||
|
|
|
| |||||
Contributed capital | 139,869 | — | ||||||
Accumulated other comprehensive loss | (4,768 | ) | — | |||||
Retained deficit | (82,786 | ) | — | |||||
|
|
|
| |||||
Total shareholder’s equity | 52,315 | — | ||||||
|
|
|
| |||||
Total liabilities and equity | $ | 938,875 | $ | 846,168 | ||||
|
|
|
| |||||
See accompanying notes to the combined financial statements
Combined Statements of Shareholder’s Equity and Parent Company Net Investment
(USD in thousands)
Predecessor | Accumulated Net Contributions from Parent | Accumulated Other Comprehensive Income (Loss) | Total Parent Company Net Investment | |||||||||
Balance at January 1, 2013 | $ | 1,004,636 | $ | 13,569 | $ | 1,018,205 | ||||||
Net loss | (247,298 | ) | — | (247,298 | ) | |||||||
Actuarial gains (losses) on defined benefit plans, net of tax | — | 4,118 | 4,118 | |||||||||
Foreign currency translation adjustment | — | (16,717 | ) | (16,717 | ) | |||||||
Net transfers (to)/from Parent | (31,448 | ) | — | (31,448 | ) | |||||||
|
|
|
|
|
| |||||||
Balance at December 31, 2013 | 725,890 | 970 | 726,860 | |||||||||
|
|
|
|
|
| |||||||
Net income | 8,848 | — | 8,848 | |||||||||
Actuarial gains (losses) on defined benefit plans, net of tax | — | (2,032 | ) | (2,032 | ) | |||||||
Foreign currency translation adjustment | — | (20,127 | ) | (20,127 | ) | |||||||
Net transfers (to)/from Parent | (56,076 | ) | — | (56,076 | ) | |||||||
|
|
|
|
|
| |||||||
Balance at December 31, 2014 | 678,662 | (21,189 | ) | 657,473 | ||||||||
|
|
|
|
|
| |||||||
Net loss | (5,756 | ) | — | (5,756 | ) | |||||||
Actuarial gains (losses) on defined benefit plans, net of tax | — | 2,645 | 2,645 | |||||||||
Foreign currency translation adjustment | — | (19,751 | ) | (19,751 | ) | |||||||
Net transfers (to)/from Parent | 60,910 | — | 60,910 | |||||||||
|
|
|
|
|
| |||||||
Balance at March 13, 2015 | $ | 733,816 | $ | (38,295 | ) | $ | 695,521 | |||||
|
|
|
|
|
| |||||||
Successor | Contributed Capital | Accumulated Other Comprehensive Income (Loss) | Retained Deficit | Total Shareholders’ Equity | ||||||||||||
Balance at March 14, 2015 | $ | — | $ | — | $ | — | $ | — | ||||||||
Initial capital contribution from parent | 167,482 | — | — | 167,482 | ||||||||||||
Return of contributed capital, net | (27,613 | ) | — | — | (27,613 | ) | ||||||||||
Net loss | — | — | (82,786 | ) | (82,786 | ) | ||||||||||
Gains on derivative transactions, net of tax | — | 1,549 | — | 1,549 | ||||||||||||
Foreign currency translation adjustment | — | (6,317 | ) | — | (6,317 | ) | ||||||||||
|
|
|
|
|
|
|
| |||||||||
Balance at December 31, 2015 | $ | 139,869 | $ | (4,768 | ) | $ | (82,786 | ) | $ | 52,315 | ||||||
|
|
|
|
|
|
|
| |||||||||
See accompanying notes to the combined financial statements
Combined Statements of Cash Flows
(USD in thousands)
| Successor | Predecessor | |||||||||||||||
| For the period from March 14 to December 31, | For the period from January 1 to March 13, | For the year ended December 31, | ||||||||||||||
| 2015 | 2015 | 2014 | 2013 | |||||||||||||
CASH FLOWS FROM OPERATING ACTIVITIES | ||||||||||||||||
Net income (loss) | $ | (82,786 | ) | $ | (5,756 | ) | $ | 8,848 | $ | (247,298 | ) | |||||
Reconciliation of net income (loss) to net cash provided by operating activities: | ||||||||||||||||
Depreciation & amortization expense | 32,930 | 6,894 | 36,605 | 38,560 | ||||||||||||
Loss (gain) on disposal of property, plant and equipment | 618 | (122 | ) | (2,329 | ) | (3,832 | ) | |||||||||
Amortization of debt discount and issuance costs | 5,085 | — | — | — | ||||||||||||
Impairment on property, plant, and equipment and goodwill | 1,088 | 27 | 3,977 | 248,650 | ||||||||||||
Earnings from equity method investee | (8,429 | ) | (67 | ) | (4,451 | ) | 216 | |||||||||
Distributions from equity method investee | 8,542 | — | 3,000 | — | ||||||||||||
Unrealized foreign currency gains, net | (1,391 | ) | (26 | ) | — | — | ||||||||||
Provision (recoveries) for doubtful accounts | 1,377 | (31 | ) | (786 | ) | 2,760 | ||||||||||
Deferred taxes | (3,138 | ) | 2,749 | 618 | (2,671 | ) | ||||||||||
Deferred rent | 1,279 | — | — | — | ||||||||||||
Other non-cash items | (13 | ) | (1,736 | ) | 717 | 1,372 | ||||||||||
Change in assets and liabilities: | ||||||||||||||||
Receivables, net | 28,900 | (7,520 | ) | (9,473 | ) | 14,762 | ||||||||||
Related party receivables | — | — | 617 | (504 | ) | |||||||||||
Inventories | 59,506 | (20,160 | ) | (31,395 | ) | 5,961 | ||||||||||
Other current assets | (2,153 | ) | (855 | ) | 512 | 1,685 | ||||||||||
Trade payable and accrued liabilities | 72,422 | (20,119 | ) | 12,822 | (7,288 | ) | ||||||||||
Deferred revenue | 7,420 | (1,068 | ) | 5,911 | (20,142 | ) | ||||||||||
Capital lease liability | — | — | — | (252 | ) | |||||||||||
Employee benefit obligations | — | (498 | ) | 209 | (1,480 | ) | ||||||||||
Other long-term assets & liabilities | 160 | 64 | 516 | 1,187 | ||||||||||||
|
|
|
|
|
|
|
| |||||||||
NET CASH PROVIDED BY (USED IN) OPERATING ACTIVITIES | 121,417 | (48,224 | ) | 25,918 | 31,686 | |||||||||||
|
|
|
|
|
|
|
| |||||||||
CASH FLOWS FROM INVESTING ACTIVITIES | ||||||||||||||||
Purchase of property, plant and equipment | (14,705 | ) | (2,762 | ) | (22,792 | ) | (10,497 | ) | ||||||||
Proceeds from the sale of long-term assets | 2,194 | — | 5,891 | 10,442 | ||||||||||||
Distribution of preferred investment from equity method investee | — | — | 15,000 | — | ||||||||||||
Assets and liabilities acquired, Cretex, net | (245,100 | ) | — | — | — | |||||||||||
Assets and liabilities acquired from HeidelbergCement, net | (640,428 | ) | — | — | — | |||||||||||
|
|
|
|
|
|
|
| |||||||||
NET CASH USED IN INVESTING ACTIVITIES | (898,039 | ) | (2,762 | ) | (1,901 | ) | (55 | ) | ||||||||
|
|
|
|
|
|
|
| |||||||||
CASH FLOWS FROM FINANCING ACTIVITIES | ||||||||||||||||
Payments on notes payable | — | — | — | (153 | ) | |||||||||||
Payments on capital leases | (17 | ) | (3 | ) | (373 | ) | (35 | ) | ||||||||
Payment of debt issuance costs | (27,410 | ) | — | — | — | |||||||||||
Proceeds from Senior Term Loan, net of discount | 486,104 | — | — | — | ||||||||||||
Proceeds from Junior Term Loan, net of discount | 244,300 | — | — | — | ||||||||||||
Proceeds from Revolver, net of discount | 45,619 | — | — | — | ||||||||||||
Payments on Revolver | (45,619 | ) | — | — | — | |||||||||||
Payments on Senior Term Loan | (5,366 | ) | — | — | — | |||||||||||
Capital contribution from (distributions to) Predecessor Parent, net | — | 60,910 | (23,617 | ) | (31,448 | ) | ||||||||||
Capital contribution from parent | 167,482 | — | — | — | ||||||||||||
Payments for return of contributed capital | (42,513 | ) | — | — | — | |||||||||||
|
|
|
|
|
|
|
| |||||||||
NET CASH PROVIDED BY (USED IN) FINANCING ACTIVITIES | 822,580 | 60,907 | (23,990 | ) | (31,636 | ) | ||||||||||
Effect of exchange rate changes on cash | (2,368 | ) | (130 | ) | 10 | |||||||||||
|
|
|
|
|
|
|
| |||||||||
Net change in cash and cash equivalents | 43,590 | 9,791 | 37 | (5 | ) | |||||||||||
Cash and cash equivalents balance, beginning of period | — | 42 | 5 | 10 | ||||||||||||
|
|
|
|
|
|
|
| |||||||||
Cash and cash equivalents balance, end of period | $ | 43,590 | $ | 9,833 | $ | 42 | $ | 5 | ||||||||
|
|
|
|
|
|
|
| |||||||||
SUPPLEMENTAL DISCLOSURES: | ||||||||||||||||
Cash interest paid | $ | 25,379 | $ | — | $ | — | $ | — | ||||||||
SUPPLEMENTAL NONCASH INVESTING AND FINANCING DISCLOSURES: | ||||||||||||||||
Fair value changes of derivative instruments recorded in OCI, net of tax | $ | 1,549 | $ | — | $ | — | $ | — | ||||||||
|
|
|
|
|
|
|
| |||||||||
Payments made on behalf of the Company by affiliates | $ | 14,900 | $ | — | $ | — | $ | — | ||||||||
|
|
|
|
|
|
|
| |||||||||
Transfers of net assets to Parent | $ | — | $ | — | $ | 32,459 | $ | — | ||||||||
|
|
|
|
|
|
|
| |||||||||
See accompanying notes to the combined financial statements
Notes to Combined Financial Statements
(USD in thousands, unless stated otherwise)
1. Organization and description of the business
Description of the business
Forterra Building Products (“Forterra” or the “Successor”) is involved in the manufacturing, sale and distribution of building materials in the United States (‘‘U.S.’’) and Canada. Forterra’s primary products are concrete drainage pipe, precast concrete structures, water transmission pipe used in drinking and wastewater systems, and bricks. These products are used in the residential, infrastructure and non-residential sectors of the construction industry.
Basis of Presentation - Successor
Forterra includes indirect wholly-owned subsidiaries of LSF9 Concrete Holdings, Ltd. (“LSF9”). Lone Star Funds (“Lone Star”), through its wholly-owned subsidiary LSF9, acquired Forterra on March 13, 2015 (the “Acquisition”). LSF9, which was formed on February 6, 2015 for the Company’spurpose of acquiring Forterra, had no operations prior to the date of the Acquisition. The legal entities that comprise Forterra are domiciled in the U.S. and Canada. The U.S. legal entities are Stardust Holdings (USA), LLC and its subsidiaries. The Canadian legal entities are Forterra Pipe & Precast, Ltd. and its subsidiaries and Forterra Brick Ltd.
Prior to the Acquisition, the entities comprising Forterra which were acquired by Lone Star were indirect wholly-owned subsidiaries of HeidelbergCement A.G. (“HC” or “Parent”), a publicly listed company in Germany, encompassing HC’s North American building products operations (“BP NAM” or the “Predecessor”). LSF9 acquired Forterra in a business combination which also included the acquisition of HC’s U.K.-based building products operations for a total initial purchase price of $1.33 billion cash, including customary working capital adjustments and a possible earn-out of up to $100.0 million. The acquisition of BP NAM and HC’s UK-based building products was funded with an equity investment is carriedof $432.3 million and third-party debt in the amount of $940.0 million.
In the accompanying financial information, Successor refers to Forterra and Predecessor refers to BP NAM. The term “Company” is used throughout the combined financial statements and applies to either the Predecessor or the Successor.
The Successor’s combined financial statements include certain assets and liabilities historically held at LSF9, including the proportionate debt, and related interest expense, incurred by LSF9 to acquire the Company that Forterra is obligated to pay. The Company’s portion of Lone Star’s initial $432.3 million equity investment is $167.5 million. The Company’s allocated portion of the $940.0 million of third party debt used to finance the Acquisition is $515.5 million. The remaining $424.5 million of the debt was allocated to affiliates of LSF9 that are not included in these financial statements based on the amounts affiliates of LSF9 are expected to repay and such amount has been fully repaid by affiliates. The Company and the affiliates of LSF9 were co-obligors and jointly and severally liable under terms of the initial credit agreements. In April of 2016, the Company’s affiliate co-obligors were released from joint and several liability under the credit agreements and the Company is consequently the sole source of repayment for its $515.5 million share for the initial obligation under the credit agreements. See discussion of the underlying equityjoint and several obligations in net assetsNote 10, Debt and deferred financing costs.
Cretex Acquisition
On August 20, 2015, Forterra entered into a purchase agreement to acquire all the outstanding shares of CP&P was approximately $13,605. This difference relates to the Company’s fair value assessmentCretex Concrete Products, Inc. (“Cretex”) for a purchase price of $245.1 million, including customary working capital adjustments. The closing of the investment as part of the Acquisition, and this basis difference was primarily attributed to the value of land and equity method goodwill associated with the investment.
Select historical financial data of the investee is as follows (unaudited):
| At December 31, 2015 | At December 31, 2014 | |||||||||||
Current assets | $ | 30,922 | $ | 26,067 | ||||||||
Non-current assets | 72,513 | 75,264 | ||||||||||
Current liabilities | 13,297 | 11,459 | ||||||||||
Non-current liabilities | 20,319 | 18,542 | ||||||||||
| For the years ended December 31, | ||||||||||||
| 2015 | 2014 | 2013 | ||||||||||
Net sales | $ | 123,888 | $ | 111,753 | $ | 100,150 | ||||||
Gross profit | 29,508 | 21,750 | 15,278 | |||||||||
Income from operations | 15,049 | 8,333 | 4,120 | |||||||||
Net income | 16,090 | 8,746 | 259 | |||||||||
20. Contract revenue
Certain of the Company’s businesses recognize contract revenue from their engineering and construction as well as building contracting arrangements using the percentage of completion method.
Revenue recognized in excess of amounts billed is classified as a current asset within receivables, netCretex acquisition occurred on the combined balance sheets. Amounts billed to clients in excess of revenue recognized to date are classified as a current liability within deferred revenue on the combined balanceOctober 1,
FORTERRA BUILDING PRODUCTS
Notes to Combined Financial Statements
(USD in thousands, unless stated otherwise)
sheets. Revenues recognized2015. Cretex is a manufacturer of reinforced concrete pipe, box culverts, precast drainage structures, pre-stressed bridge components and ancillary precast products, expanding the Company’s market footprint into the Upper Midwestern United States. The Cretex acquisition was financed with $240.0 million incremental third-party Senior debt.
The financial statements contained herein have been prepared in excessaccordance with accounting principles generally accepted in the United States (“U.S. GAAP”). The combined financial statements include the accounts of billings were $2,288 and $1,281 as of December 31, 2015 and 2014, respectively. The Company anticipates that substantially all incurred cost associated with contract work in progress as of December 31, 2015 will be billed and collected in 2016. Billings in excess of revenue recognized was $2,457 and $1,423 as of December 31, 2015 and 2014, respectively. Additionally, the Company also records balances billed, but not yet paidand all intercompany transactions among the Successor entities have been eliminated.
2. Summary of significant accounting policies
Basis of presentation - Predecessor
Description of Business - Predecessor
The legal entities comprising BP NAM were a component of the North American operating segment of HC and consist of U.S. operating entities that were directly owned by customers under retainage provisions related to these contractsLehigh Hanson, Inc. (‘‘LHI’’), a U.S. holding company, and Canadian operating entities that were directly owned by Hanson America Holdings (4), Ltd., a U.K. holding company.
These financial statements are labeled as part of receivables, net, withinpredecessor because they reflect the combined balance sheets.predecessor historical results of operations, financial position and cash flows of BP NAM, as they were historically managed under the control of HC, in conformity with U.S. GAAP.
All intracompany transactions occurring between the predecessor entities have been eliminated. Certain transactions between the Company and HC have been included in these combined predecessor financial statements and are considered to be effectively settled at the time the transaction is recorded. The amount of receivables due under retainage provisions as of December 31, 2015 and 2014 was $1,227 and $1,419, respectively.
Certaintotal net effect of the Company’s businesses also enter into agreements to provide inventory to customers for long-term construction projects. Revenue recognitionsettlement of these transactions is based on shipmentsreflected in the combined predecessor statements of shareholder’s equity and Parent company net investment as net transfers (to)/from Parent, in the respective goods ordered by the customer as these shipments represent substantive performance. The billings for these goods manufactured for the customer are based on contract terms and may or may not coincide with shipmentscombined predecessor statements of the goods, which gives rise to either unbilled or deferred revenue. The Company records revenue recognized in excess of amounts billedcash flows as a current asset within receivables, net on the combined balance sheets.
Revenue recognizedfinancing activity and in excess of billings for these contractual arrangements were $7,453 and $3,537 as of December 31, 2015 and 2014, respectively. Amounts billed to clients in excess of revenue recognized to date are classified as a current liability within deferred revenue on the combined predecessor balance sheets. Billingssheet as Parent company net investment.
HC used a centralized approach to cash management and financing of its operations. Historically, the majority of the Predecessor’s cash was transferred to HC daily and the Company was dependent on HC funding of the Company’s operating and investing activities as needed. This arrangement is not reflective of the manner in which the Company would have been able to finance its operations had it been a stand-alone business separate from HC during the periods presented. Cash transfers to and from HC’s cash management accounts are reflected within Parent company net investment.
The combined predecessor financial statements include certain assets and liabilities that have historically been held at the HC corporate level but are specifically identifiable or otherwise allocable to the Company. The cash and cash equivalents held by HC at the corporate level are not specifically identifiable to the Company and therefore were not allocated for any of the periods presented. Cash and cash equivalents in the combined predecessor balance sheets represent cash held locally by operations included in the combined predecessor financial statements. HC third-party debt, and the related interest expense, has not been allocated for any of the periods presented as the Company was not the legal obligor of the debt and HC’s borrowings were not directly attributable to these operations.
FORTERRA BUILDING PRODUCTS
Notes to Combined Financial Statements
(USD in thousands, unless stated otherwise)
The historical costs and expenses reflected in the combined predecessor financial statements include an allocation for certain corporate functions historically provided by HC or its wholly-owned subsidiaries. Substantially all of the Company’s senior management were employed by HC and certain functions critical to the Company’s operations were centralized and managed by HC. Historically, the centralized functions have included executive senior management, financial reporting, financial planning and analysis, accounting, shared services, information technology, tax, risk management, treasury, legal, human resources, land management, and strategy and development. Additionally, the Company resided in office space provided by affiliates of HC. The cost of each of these services has been allocated to the Company on the basis of the Company’s relative net sales or head count as compared to that of HC depending upon which allocation methodology is more meaningful for each service.
The Company and HC believe that these allocations reasonably reflect the utilization of services provided and benefits received. However, they may differ from the cost that would have been incurred had the Company operated as a stand-alone company for the periods presented or will be incurred by the Successor. Estimating actual costs that would have been incurred if the Company had been a stand-alone company is not practicable and would depend on multiple factors, including organizational structure and strategic decisions made in various areas, including legal services, accounting and finance services, human resources, marketing and contract support, customer support, treasury, facility and other corporate and infrastructural services. Income taxes have been accounted for in these financial statements on a separate-return basis.
Business Combinations
Assets acquired and liabilities assumed in business combination transactions, as defined by the Financial Accounting Standards Board (“FASB”) Accounting Standards Codification (“ASC”) 805,Business Combination, are recorded at fair value using the acquisition method of accounting. We allocate the purchase price of acquisitions based upon the fair value of each component which may be derived from various observable and unobservable inputs and assumptions. Initial purchase price allocations are preliminary and subject to revision within the measurement period, not to exceed one year from the date of the transaction. The fair value of property, plant and equipment and intangible assets may be based upon the discounted cash flow method that involves inputs that are not observable in the market (Level 3). Goodwill assigned represents the amount of consideration transferred in excess of revenue recognized for these milestone contracts were $18,186the fair value assigned to identifiable assets acquired and $10,097liabilities assumed.
Use of estimates
The preparation of the combined financial statements in conformity with U.S. GAAP requires management to make estimates and assumptions that affect the reported amounts of assets and liabilities, the disclosure of contingent assets and liabilities as of December 31, 2015the date of the combined financial statements, and 2014, respectively. Additionally,the reported amounts of revenues and expenses during the reporting period. Actual results could differ from these estimates. These estimates are based on management’s best knowledge of current events and actions that the Company also records balances billed, but not yet paidmay undertake in the future. The more significant estimates made by customers under retainage provisionsmanagement relate to fair value estimates for assets and liabilities acquired in business combinations; accrued liabilities for environmental cleanup, reclamation, pensions and other employee benefit plans, bodily injury and insurance claims; and estimates for deferred tax assets, inventory reserves, allowance for doubtful accounts and impairment of long-lived assets.
FORTERRA BUILDING PRODUCTS
Notes to Combined Financial Statements
(USD in thousands, unless stated otherwise)
Cash and cash equivalents
Successor cash and cash equivalents include cash on hand and other highly liquid investments having an original maturity of less than three months.
Predecessor treasury activities were centralized by HC such that the net cash collections were automatically distributed to HC and reflected as partParent company net investment. At times, the Company may have had a cash balance due to timing differences.
Receivables, net
Receivables are recorded at net realizable value, which includes allowances for doubtful accounts. The Company reviews the collectability of trade receivables net, withinon an ongoing basis. The Company reserves for trade receivables determined to be uncollectible. This determination is based on the delinquency of the account, the financial condition of the customer and the Company’s collection experience.
HC maintained accounts receivable securitization programs in both the United States and Canada to provide additional sources of working capital and long-term financing. Under the program, HC sold, on a revolving basis, selected trade sales invoices to either wholly-owned special purpose subsidiaries (the “SPSs”), which are consolidated in HC consolidated financial statements, or in Canada to an unrelated third-party commercial paper conduit. The SPSs in turn enter into agreements with an unrelated third-party commercial paper conduit to acquire long-term financing, using the accounts receivable as collateral.
Under the terms of the programs for the United States and Canada, the Company maintained effective control over the selected trade sales invoices. In accordance with the Financial Accounting Standards Board (“FASB”) Accounting Standards Codification (“ASC”) 860,Transfers and Servicing (“ASC 860”), the accounts receivable securitization transactions have not been accounted for as sales in the United States and Canada. The related accounts receivable are reflected in the combined balance sheets.predecessor financial statements. The amountCompany was responsible for the collection of receivables dueinvoices sold by the Company under retainage provisions asthe securitization programs. Cash collected by the Company was remitted to the SPS who then remitted the cash collections to the buyers of December 31, 2015 and 2014 was $826 and $874, respectively.
21. Employee benefit plansthe accounts receivable on a contractually agreed basis.
Defined Contribution Plans - SuccessorConcentration of credit risk
SubsequentFinancial instruments that potentially subject the Company to concentrations of credit risk are primarily receivables. The Company performs ongoing credit evaluations of its customers’ financial condition and generally requires no collateral from its customers. The allowances for uncollectible receivables are based upon analysis of economic trends in the Acquisition,construction industry, detailed analysis of the expected collectability of accounts receivable that are past due and the expected collectability of overall receivables.
Concentrations of Labor
Approximately 35% of the Company’s employees including employees coveredare represented by collective bargaining agreements, were able to participateand 25% of these employees are included in 401K defined contribution plans. The Company contributes funds into the plans subject to certain limits. For the period March 14, 2015 through December 31, 2015, the Company recorded an expense of $8,244 for these contributions. From January 1 through March 13, 2015, the Company recorded an expense of $1,724 for the Predecessor’s participation in a similar plan sponsored by HC.
The Company’s employees that are covered by collective bargaining agreements were historically participantsthat expire within 12 months.
FORTERRA BUILDING PRODUCTS
Notes to Combined Financial Statements
(USD in several union-sponsored, multi-employer pension plans (union-sponsored plans)thousands, unless stated otherwise)
Inventories
Inventories are valued at the lower of cost or market. The Company’s inventories are valued using the average cost method. Inventories include materials, labor and applicable factory overhead costs. The value of inventory is adjusted for all periods includeddamaged, obsolete, excess and slow-moving inventory. Market value of inventory is estimated considering the impact of market trends, an evaluation of economic conditions, and the value of current orders relating to the future sales of each respective component of inventory.
Property, plant and equipment, net
Property, plant and equipment, which includes amounts recorded under capital lease arrangements, is stated at cost less accumulated depreciation. Depreciation of property, plant and equipment is computed using the straight-line method over the estimated useful lives of the assets. These lives range from 20 to 40 years for buildings, 4 to 20 years for machinery and equipment, and 5 to 10 years for other equipment and lower of lease term or useful life on leasehold improvements. Repair and maintenance costs are expensed as incurred. The Company’s depreciation expense is recorded in cost of goods sold and selling, general and administrative expenses in the Predecessorcombined statements of operations. The Company capitalizes interest during the active construction of major projects. Capitalized interest is added to the cost of the underlying assets and is depreciated over the useful lives of those assets. There was no interest capitalized for any of the periods presented in the combined financial statements. Neither
Impairment or disposal of long-lived assets
The Company evaluates the Company nor HC orrecoverability of its affiliates administered the union-sponsored plans. Contributions to the plans were determinedlong-lived assets in accordance with the provisions of negotiatedASC 360,Property, Plant andEquipment(“ASC 360”). ASC 360 requires that long-lived assets and certain identifiable intangibles be reviewed for impairmentwhenever events or changes in circumstances indicate that the carrying amount of an asset may not be recoverable. Recoverability of assets is measured by comparing the carrying amount of an asset to future undiscounted net cash flows expected to be generated by the asset. Such evaluations for impairment are significantly impacted by estimates of future prices for the Company’s products, capital needs, economic trends in the construction sector and other factors. If such assets are considered to be impaired, the impairment to be recognized is measured at the amount by which the carrying amount of the assets exceeds their fair value. Assets to be disposed of by sale are reflected at the lower of their carrying amount or fair value less cost to sell.
The Company assesses impairment of long-lived assets at the lowest level for which identifiable cash flows are largely independent of the cash flows of other assets and liabilities. For purposes of evaluating impairment of long-lived assets held in use, the Company has determined this level to be the asset group level, which are defined as geographical market clusters of plants. For assets meeting the criteria for classification as held for sale under ASC 360, the impairment is assessed at the disposal group level, generally the specific plant or plants held for sale.
Goodwill and other intangible assets, net
The goodwill reflected in the combined Successor balance sheets relates to the recognition of goodwill in the Acquisition and in the Company’s acquisition of Cretex Concrete Products (“Cretex”).
FORTERRA BUILDING PRODUCTS
Notes to Combined Financial Statements
(USD in thousands, unless stated otherwise)
Goodwill represents the excess of costs over the fair value of identifiable assets acquired and liabilities assumed.
The Company evaluates goodwill and intangible assets in accordance with ASC 350,Goodwill and Other Intangible Assets (“ASC 350”). ASC 350 requires goodwill to be either qualitatively or quantitatively assessed for impairment annually (or more frequently if impairment indicators arise) for each reporting unit. The Company performs its annual impairment testing of goodwill as of October 1 of each year and in interim periods if events occur that would indicate that it is more likely than not goodwill may be impaired.
The Company evaluates its intangible assets with finite lives for indications of impairment whenever events or changes in circumstances indicate that the net book value may not be recoverable. Intangible assets with finite lives consist of customer relationships, customer backlogs, and brand names, and are amortized under a consumption method over the estimated useful lives. Factors that could trigger an impairment review include significant under-performance relative to expected historical or projected future operating results, significant changes in the manner of our use of the acquired assets or the strategy for our overall business or significant negative industry or economic trends.
If this evaluation indicates that the value of the intangible asset may be impaired, the Company makes an assessment of the recoverability of the net book value of the asset over its remaining useful life. If this assessment indicates that the intangible asset is not recoverable, based on the estimated undiscounted future cash flows of the asset over the remaining amortization period, the Company reduces the net book value of the related intangible asset to fair value and may adjust the remaining amortization period.
Investment in equity method investee
The Company has an investment in a joint venture accounted for using the equity method. Under the equity method, carrying value is adjusted for the Company’s share of the investee’s earnings and losses, as well as capital contributions to and distributions from the investee. Distributions in excess of equity method earnings are recognized as a return of investment and recorded as investing cash inflows in the accompanying combined statements of cash flows. The Company classifies its share of income and loss related to its investments in its investee as a component of operating income or loss, as the Company’s investments in the investee is an extension of the Company’s core business operations.
The Company evaluates its investment in the equity method investee for impairment whenever events or changes in circumstances indicate that the carrying value of its investment may have experienced an “other-than-temporary” decline in value. If such conditions exist, the Company compares the estimated fair value of the investment to its carrying value to determine if an impairment is indicated and determines whether the impairment is “other-than-temporary” based on its assessment of all relevant factors, including consideration of the Company’s intent and ability to retain its investment.
Derivatives and Hedge Accounting
The Company has entered into derivative instruments to mitigate interest rate and foreign exchange rate risk. Certain derivative instruments are designated for hedge accounting under ASC
FORTERRA BUILDING PRODUCTS
Notes to Combined Financial Statements
(USD in thousands, unless stated otherwise)
815-20,Derivatives – Hedging. Instruments that meet hedge criteria are formally designated as hedges at the inception of the instrument. Derivatives utilized by the Company include cross currency swaps.
The Company’s derivative assets and liabilities are measured at fair value. Fair value related to the cash flows occurring within one year are classified as current and the fair value related to the cash flows occurring beyond one year are classified as non-current in the combined balance sheets. For those instruments designated as hedges, the Company recognizes the changes in fair value in other comprehensive income (“OCI”), and recognizes any ineffectiveness immediately in earnings.
Valuation of derivative assets and liabilities reflect the value of the instrument including counterparty credit risk. These values also take into account the Company’s own credit standing.
Deferred Financing Costs
In conjunction with its debt, the Company recorded debt discounts and debt issuance costs totaling $51.9 million during the period March 14, 2015 to December 31, 2015. These costs are amortized over the life of the applicable debt instrument to interest expense utilizing the effective interest method. The related amortization expense of these costs was $5.1 million, and is included in interest expense on the combined statements of operations for the Successor period.
Fair value measurement
The Company utilizes valuation techniques that maximize the use of observable inputs and minimize the use of unobservable inputs to the extent possible. The Company determines fair value based on assumptions that market participants would use in pricing an asset or liability in the principal or most advantageous market. When considering market participant assumptions in fair value measurements, the following fair value hierarchy distinguishes between observable and unobservable inputs, which are categorized in one of the following levels:
Level 1 Inputs – Unadjusted quoted prices in active markets for identical assets or liabilities accessible to the reporting entity at the measurement date.
Level 2 Inputs – Other than quoted prices included in Level 1 inputs that are observable for the asset or liability, either directly or indirectly, for substantially the full term of the asset or liability.
Level 3 Inputs – Unobservable inputs for the asset or liability used to measure fair value to the extent that observable inputs are not available, thereby allowing for situations in which there is little, if any, market activity for the asset or liability at measurement date.
The Company’s other financial instruments consist primarily of cash and cash equivalents, trade and other receivables, accounts payable, accrued expenses, derivative financial instruments and long-term debt. The carrying value of the Company’s trade and other receivables, trade payables and accrued expenses approximates fair value due to their highly liquid nature, short-term maturity, or competitive rates assigned to these financial instruments.
The Company adjusts the carrying amount of certain nonfinancial assets to fair value on a non-recurring basis when they are impaired.
FORTERRA BUILDING PRODUCTS
Notes to Combined Financial Statements
(USD in thousands, unless stated otherwise)
Foreign currency translation
The Company uses the U.S. dollar as its functional currency for operations in the U.S. and the Canadian dollar for operations in Canada. The assets, liabilities, revenues and expenses of the Company’s Canadian operations are translated in accordance with ASC 830,Foreign Currency Matters.
Environmental remediation liabilities
The Company accrues for costs associated with environmental remediation obligations when such costs are probable and reasonably estimable; if an estimated amount is likely to fall within a range and no amount within that range can be determined to be the better estimate, the minimum amount of the range is recorded. Claims for recoveries from insurance carriers and other third parties are not recorded until it is probable that the recoveries will be realized. Such accruals are adjusted as further information develops or circumstances change.
Environmental expenditures that relate to current operations or to conditions caused by past operations are expensed. Expenditures that create future benefits are capitalized.
Liabilities are recorded when environmental assessments and/or clean-ups are probable, and the costs can be reasonably estimated. At December 31, 2015 and 2014, the Company had environmental obligations of $1,803 and $1,739, respectively, which are recorded within accrued liabilities and other long-term liabilities in the combined balance sheets. The estimated range of reasonably possible loss beyond the amounts accrued is considered immaterial.
Accounting for asset retirement obligations
The Company incurs reclamation obligations as part of its brick production process. The Company recognizes the fair value of a legally enforceable liability representing an asset retirement obligation in the period in which it is incurred.
The provisions of ASC 410-20,Accounting for Asset Retirement Obligations (“ASC 410”), require the projected estimated reclamation obligation to be stated at fair value using assumptions that reflect the amount an external party would charge for bearing the uncertainty of guaranteeing a fixed price today for performance in the future.
Asset retirement obligations which are recorded within accrued liabilities and other long term liabilities in the combined balance sheets were $1,353 and $1,885 at December 31, 2015 and 2014, respectively.
Defined benefit pension plans and other post-retirement benefits
The Predecessor’s Canadian employees participated in defined benefit pension plans sponsored by the Company. The Company’s U.S. salaried employees and non-union hourly employees participated in defined benefit pension plans sponsored by an affiliate of HC. Approximately 37% of the Predecessor’s labor contracts.force were covered by collective bargaining agreements. These plans included other Parent employees of HC affiliates that are not employees of the Company. LHI also provides certain retiree health and life insurance benefits to eligible employees who have retired from the Company. Salaried participants generally became eligible for retiree health care benefits when they retired from active service at age 60 or later. Benefits, eligibility, and cost-sharing provisions for the hourly employees vary by location and/or bargaining unit. Generally, the health care plans pay a stated percentage of most medical and dental expenses reduced for any deductible, co-payment and payments made by government programs and other group coverage. The Predecessor accounted for
FORTERRA BUILDING PRODUCTS
Notes to Combined Financial Statements
(USD in thousands, unless stated otherwise)
its U.S. defined benefit pension plans as multiemployer plans under ASC 715,Compensation–BenefitPlans(“ASC 715”).Liability for the Predecessor defined benefit plans were retained by HC.
Additionally, the Predecessor also had employees that were covered under several union-sponsored, multiemployer pension plans. Such plans are accounted for as defined contribution plans as it is not possible to isolate the components of such plans that would collectively comprise the Company’s liability. InLiabilities for the eventPredecessor plans were retained by HC.
Income Taxes
As of plan termination or the Company’s withdrawal fromdate of the Acquisition, the Successor financial statements reflect a multi-employer plan,new tax basis of accounting as the Company may be liable for a portionincludes taxable entities independent of the plan’s unfunded vestedPredecessor. Deferred tax assets and liabilities are recognized principally for the expected tax consequences of temporary differences between the tax basis of assets and liability and their reported amounts, using currently enacted tax rates. The measurement of a deferred tax asset is reduced, if necessary, by a valuation allowance if it is more likely than not that some portion or all of the deferred tax asset will not be realized.
The Company recognizes a tax benefit obligation,for uncertain tax positions if any. In connectionthe Company believes it is more likely than not that the position will be upheld on audit based solely on the technical merits of the tax position. The Company evaluates uncertain tax positions after the consideration of all available information.
For the Predecessor periods, income tax expense and related current and deferred income taxes receivable and payable were calculated assuming that the Predecessor files hypothetical stand-alone income tax returns in Canada and hypothetical consolidated income tax returns for the U.S. building products activities. Losses and other tax attributes generated on a hypothetical stand-alone basis and hypothetical consolidated return basis are reflected as deferred tax assets, even though some of those losses or attributes may have been utilized by HC’s filing entities. All hypothetical current taxes payable or receivable are deemed settled through net parent investment. All tax consequences associated with the Acquisition, HC indemnifiedPredecessor period were retained by HC.
Revenue recognition
Revenues are recognized by the Successor against liabilities that might arise asCompany when the risks and rewards associated with the transaction have been transferred to the purchaser, which is demonstrated when all the following conditions are met: evidence of a resultbinding arrangement exists (generally, purchase orders), products have been delivered or services have been rendered, there is no future performance required, fees are fixed or determinable and amounts are collectable under normal payment terms. Sales represent the net amounts charged or chargeable in respect of withdrawal from the plans,services rendered and goods supplied, excluding intercompany sales. Sales are recognized net of any tax benefit that might resultdiscounts given to the customer.
The Company bills and incurs shipping costs to third parties for the transportation of building products to customers. For the period from tax deductible paymentsMarch 14, 2015 to settle the withdrawal liability. As of December 31, 2015, the Company had no remaining employees covered by multi-employer plans. The Company has received one notice of its exit liability from the associated plan. Affiliates of HC have reimbursed the Company for the exit
FORTERRA BUILDING PRODUCTS
Notesperiod from January 1, 2015 to Combined Financial Statements
(USD in thousands, unless stated otherwise)
liability, net of estimated federal income tax subsequent to year end. The remaining plans have not communicated amounts associated with the Company’s exit from the plansMarch 13, 2015, and Company has not recorded an associated liability as the amount of the liability, if any, not estimable.
Defined Benefit Pension Plans and Other Post-Retirement Benefits - Predecessor
Employees of the Predecessor participated in defined benefit plans as described below that were both sponsored by the Predecessor and sponsored by others. The combined Predecessor financial statements have been prepared on a historical basis reflecting the applicable liabilities and financial statement disclosures related to the defined benefit plans participated in under HC. The defined benefit obligations and disclosures do not necessarily reflect the costs the Predecessor would have incurred as a stand-alone entity. The related pension and post-retirement benefit liabilities were previously allocated to the Predecessor but were retained by HC subsequent to the Acquisition of the Company.
Canadian employee benefit plans
The Canadian companies within the Predecessor sponsored several qualified and nonqualified pension plans and other postretirement benefit plans (“OPEB”) for substantially all of their employees. Such plans are defined benefit plans. The benefits provided under these plans are based primarily on years of credited service and final average pensionable pay as defined under the respective plan provisions. Contributions totaled $2,028 for the year ended December 31, 2014.
The Predecessor’s plan assets were accounted for at fair value. The Predecessor’s asset allocations by level within the fair value hierarchy as of December 31, 2014 are presented in the table below for the Predecessor’s defined benefit plans:
| Asset Class: | Level 1 | Level 2 | Total | |||||||||
Equity | $ | — | $ | 14,226 | $ | 14,226 | ||||||
Fixed Income | — | 25,292 | 25,292 | |||||||||
|
|
|
|
|
| |||||||
Fair value of plan assets | $ | — | $ | 39,518 | $ | 39,518 | ||||||
|
|
|
|
|
| |||||||
Fixed income funds include investments in government obligations, corporate bonds, agency obligations and asset-backed securities.
Amounts recognized on the combined Predecessor balance sheet as of December 31, 2014 were:
| Pension Benefits | Other Postretirement Benefits | |||||||||||||||
| Overfunded Plans | Underfunded Plans | Total | ||||||||||||||
Benefit obligation | $ | (4,579 | ) | $ | (38,999 | ) | $ | (9,261 | ) | $ | (52,839 | ) | ||||
Fair value of plan assets | 4,598 | 34,920 | — | 39,518 | ||||||||||||
|
|
|
|
|
|
|
| |||||||||
Funded status | 19 | (4,079 | ) | (9,261 | ) | (13,321 | ) | |||||||||
|
|
|
|
|
|
|
| |||||||||
Balance sheet recognition: | ||||||||||||||||
Non-current benefit asset | 19 | — | — | 19 | ||||||||||||
Non-current benefit liability | — | (4,079 | ) | (8,952 | ) | (13,031 | ) | |||||||||
Current benefit liability | — | — | (309 | ) | (309 | ) | ||||||||||
|
|
|
|
|
|
|
| |||||||||
| $ | 19 | $ | (4,079 | ) | $ | (9,261 | ) | $ | (13,321 | ) | ||||||
|
|
|
|
|
|
|
| |||||||||
FORTERRA BUILDING PRODUCTS
Notes to Combined Financial Statements
(USD in thousands, unless stated otherwise)
Reconciliation of pension obligations and plan assets
The reconciliation of the beginning and ending balances of the pension obligation and the fair value of the plans’ assets for the Canadian defined benefit retirement plans and other postretirement benefits for the year ended December 31, 2014, are as follows:
| Pension Benefits | Other Postretirement Benefits | Total | ||||||||||
Benefit obligation at December 31, 2013 | $ | 42,067 | $ | 8,880 | $ | 50,947 | ||||||
Service cost | 829 | 50 | 879 | |||||||||
Interest cost | 1,867 | 395 | 2,262 | |||||||||
Employee contributions | 66 | — | 66 | |||||||||
Actuarial losses, net | 5,482 | 1,071 | 6,553 | |||||||||
Gross Benefits Paid | (2,811 | ) | (304 | ) | (3,115 | ) | ||||||
Exchange rate changes | (3,922 | ) | (831 | ) | (4,753 | ) | ||||||
|
|
|
|
|
| |||||||
Benefit obligation at December 31, 2014 | $ | 43,578 | $ | 9,261 | $ | 52,839 | ||||||
|
|
|
|
|
| |||||||
| Pension Benefits | Other Postretirement Benefits | Total | ||||||||||
Fair value of plan assets at December 31, 2013 | $ | 38,692 | $ | — | $ | 38,692 | ||||||
Actual return on plan assets | 5,425 | — | 5,425 | |||||||||
Employer contributions | 1,724 | 304 | 2,028 | |||||||||
Employee contributions | 66 | — | 66 | |||||||||
Benefits paid | (2,811 | ) | (304 | ) | (3,115 | ) | ||||||
Exchange rate changes | (3,578 | ) | — | (3,578 | ) | |||||||
|
|
|
|
|
| |||||||
Fair value of plan assets at December 31, 2014 | $ | 39,518 | $ | — | $ | 39,518 | ||||||
|
|
|
|
|
| |||||||
The unrecognized net actuarial loss (gain) recorded in Accumulated other comprehensive loss, pretax, for the year ended December 31, 2014 are $5,482 related to pension benefits and $1,071 related to other postretirement benefits.
The components of net periodic pension costs for retirement benefits for the Canadian pension and other postretirement benefits are summarized below for the years ended December 31, 2014 and 2013:
| Pension Benefits | ||||||||
| 2014 | 2013 | |||||||
Service cost | $ | 829 | $ | 948 | ||||
Interest cost | 1,867 | 1,865 | ||||||
Expected return on plan assets | (1,853 | ) | (1,925 | ) | ||||
Curtailment gain recognized | — | — | ||||||
Past service cost recognized | 19 | 20 | ||||||
Net loss/(gain) amortization | 300 | 616 | ||||||
|
|
|
| |||||
Net Expense | $ | 1,162 | $ | 1,524 | ||||
|
|
|
| |||||
FORTERRA BUILDING PRODUCTS
Notes to Combined Financial Statements
(USD2013, the Company recorded freight costs of approximately $59,943, $11,041, $69,862, and $63,301, respectively, on a gross basis within net sales and cost of goods sold in thousands, unless stated otherwise)
| Other Postretirement Benefits | ||||||||
| 2014 | 2013 | |||||||
Service cost | $ | 50 | $ | 62 | ||||
Interest cost | 395 | 374 | ||||||
Expected return on plan assets | — | — | ||||||
Curtailment gain recognized | — | — | ||||||
Past service cost recognized | (48 | ) | (52 | ) | ||||
Net loss/(gain) amortization | — | 20 | ||||||
|
|
|
| |||||
Net Expense | $ | 397 | $ | 404 | ||||
|
|
|
| |||||
Pretax other changes in plan assets and benefit obligations recognized in other comprehensive income (loss):
| 2014 | 2013 | |||||||
Actuarial (gain) loss, net | $ | 2,981 | $ | (6,087 | ) | |||
Amortization of net actuarial (gains) losses, net | (300 | ) | 636 | |||||
Amortization of prior year service costs | 29 | (32 | ) | |||||
|
|
|
| |||||
Net amount recognized in other comprehensive income (loss) | $ | 2,710 | $ | (5,483 | ) | |||
|
|
|
| |||||
U.S. employee benefit plans
The Predecessor’s U.S.-based employees were covered by defined benefit and defined contribution plans that were sponsored by others, including affiliates. There were no U.S. benefit plans sponsored by the Predecessor.
Plans sponsored by affiliates
Approximately 38%accompanying combined statements of the Predecessor’s active U.S.-based employees were vested in a defined benefit pension plan sponsored by LHI. This defined benefit plan covered other HC employees that are not employees of the Predecessor. LHI froze this defined benefit plan effective December 31, 2013 for all non-union U.S.-based employees, except for those who were within five years of their social security retirement date. LHI provided certain OPEB to eligible salaried and hourly non-union employees who have retired from the Predecessor, including primarily retiree health and life insurance benefits. These OPEB benefits were frozen in 2006 for all U.S.-based non-union employees, except for a small number of ‘‘grandfathered’’ employees who met certain age and employment service criteria. Approximately 8% of the Predecessor’s active employees were ‘‘grandfathered’’ and eligible for retiree life insurance and retiree health care benefits should they retire with LHI at age 60 or later. Benefits, eligibility and cost-sharing provisions for hourly union employees vary by bargaining unit. Generally, the health care plans pay a stated percentage of most medical expenses, reduced for any deductible, copayment and payments made by government programs and other group coverage. In 2013, LHI announced changes to its retiree health care plans that covered retirees age 65 and older. This change did not impact any retirees who had retired under a collective bargaining agreement. Beginning in 2013, LHI stopped providing company-sponsored health care plans to retirees age 65 and older; rather it began providing a subsidy for each eligible retiree to purchase health care coverage best suited for his/her circumstance.operations.
FORTERRA BUILDING PRODUCTS
Notes to Combined Financial Statements
(USD in thousands, unless stated otherwise)
The related pensionCompany’s revenues primarily relate to product shipments. For certain engineering and OPEB have notconstruction contracts and building contracting arrangements, the Company recognizes revenue using the percentage of completion method, based on total contract costs incurred to date compared to total estimated cost at completion for each contract. Changes to total estimated contract cost or losses, if any, are recognized in the period in which they are determined. Pre-contract costs are expensed as incurred. If estimated total costs on a contract indicate a loss, the entire loss is provided for in the financial statements immediately. To the extent the Company has invoiced and collected from its customers more revenue than has been allocatedrecognized as revenue using the percentage of completion method, the Company records the excess amount invoiced as deferred revenue. For the period from March 14, 2015 to the PredecessorDecember 31, 2015, for the U.S. plansperiod from January 1, 2015 to March 13, 2015, and have not been presented in the accompanying balance sheet since the obligation is and will remain a liability of the HC. The Predecessor recorded $1,642 and $1,634 for the years ended December 31, 2014 and 2013, respectively,revenue recognized in pensioncontinuing operations using the percentage of completion method amounted to 5%, 4%, 3% and other post-retirement benefits expense4% of total net sales, respectively.
The company generally provides limited warranties related to its U.S. employees,products which hascover manufacturing in accordance with the specifications identified on the face of our quotation or order acknowledgement and to be free of defects in workmanship or materials. The warranty periods typically extend for a limited duration of one year. The Company estimates and accrues for potential warranty exposure related to products which have been reflected within costsdelivered.
Cost of goods sold and selling, general and administrative expenses
Cost of goods sold includes costs of production, inbound freight charges for raw materials, outbound freight to customers, purchasing and receiving costs, inspection costs and warehousing at plant distribution facilities. Selling, general and administrative costs include expenses for sales, marketing, legal, accounting and finance services, human resources, customer support, treasury and other general corporate services.
Recent Accounting Guidance Adopted
In April 2014, the FASB issued Accounting Standards Update (“ASU”) 2014-08,Presentation of Financial Statements (Topic 205)and Property, Plant, and Equipment (Topic 360): Reporting Discontinued Operations and Disclosures of Disposals of Components of an Entity. The amendments in this update change the requirements for reporting discontinued operations in Subtopic 205-20. Adisposal of a component of an entity or a group of components of an entity is required to be reported in discontinued operations if the disposal represents a strategic shift that has (or will have) a major effect on an entity’s operations and financial results. The Company adopted this ASU effective January 1, 2015.
In August 2015, the FASB issued ASU 2015-03,Interest – Imputation of Interest (Subtopic835-30): Simplifying the Presentation ofDebt Issuance Cost. This amendment provides guidance for deferring and presenting debt issuance costs as an asset and subsequentlyamortizing the deferred debt issuance costs ratably over the term of the line of credit arrangement, regardless of whether there are any outstanding borrowings on the line of credit arrangement. For term debt obligations, the Company presents debt issuance costs as a direct deduction of the carrying amount of the debt. For public business entities, the amendments in this update are effective for financial statements issued for fiscal years beginning after December 15, 2015, and interim periods within those fiscal years. The Company early adopted this ASU effective March 14, 2015 and has presented its debt issuance costs accordingly in its financial statements.
FORTERRA BUILDING PRODUCTS
Notes to Combined Financial Statements
(USD in thousands, unless stated otherwise)
In November 2015, the FASB issued ASU 2015-17,Income Taxes (Topic 740), Balance Sheet Classification of Deferred Assets intended to simplify the presentation of deferred taxes on the balance sheet and will require an entity to present all deferred tax assets and deferred tax liabilities as non-current on the balance sheet. Under the current guidance, entities are required to separately present deferred taxes as current or non-current. Netting deferred tax assets and deferred tax liabilities by tax jurisdiction will still be required under the new guidance. The new accounting guidance is effective for annual periods beginning after December 15, 2016 with early adoption permitted. The Company early adopted ASU 2015-17 as of March 14, 2015 and applied the new guidance for all periods presented.
Recent Accounting Guidance Not Yet Adopted
In May 2014, the FASB issued ASU 2014-09,Revenue from Contracts with Customers (Topic 606), which provides accounting guidance for all revenue arising from contracts with customers and affects all entities that enter into contracts to provide goods or services to their customers. The FASB subsequently voted to defer the application of the provisions of this standard for public companies until annual reporting periods beginning after December 15, 2017 in ASU 2015-14Revenue from Contracts withCustomers (Topic 606): Deferral of the Effective Date, including interim periods within that reporting period. The Company iscurrently evaluating whether this ASU will have a material impact on its combined financial statements.
In March 2015, the FASB issued ASU 2015-02,Consolidation (Topic 810), Amendments to the Consolidation Analysis, changes the analysis that a reporting entity must perform when deciding to consolidate a legal entity. This amendment changes the evaluation of whether limited partnerships are variable interest entities or voting interest entities and eliminates the presumption that a general partner should consolidate a limited partnership. All legal entities are subject to reevaluation under the revised consolidation model. The amendment is effective for fiscal years and interim periods beginning after December 15, 2015 and can be applied either retrospectively to each period presented or as a cumulative-effect adjustment as of the beginning of the period of adoption. The adoption of ASU 2015-12 is not expected to have a material impact on the Company’s combined financial statements.
In July 2015, the FASB issued ASU 2015-11,Inventory (Topic 330): Simplifying the Measurement of Inventory, requiring an entity to measure inventory within the scope of the ASU at the lower of cost and net realizable value. For public business entities, the amendments in this update are effective for financial statements issued for fiscal years beginning after December 15, 2016, and interim periods within those fiscal years. The Company is currently evaluating whether this ASU will have a material impact on its combined financial statements.
In August 2014, the FASB issued ASU 2014-15,Presentation of Financial Statements–Going Concern (Subtopic 205-40): Disclosure of Uncertainties about an Entity’s Ability to Continue as a Going Concern,defining when and how companies are requiredto disclose going concern uncertainties, which must be evaluated each interim and annual period. Specifically, it requires management to determine whether substantial doubt exists regarding the entity’s going concern presumption. Substantial doubt about an entity’s ability to continue as a going concern exists when relevant conditions and events, considered in the accompanyingaggregate, indicate that it is probable that the entity will be unable to meet its obligations as they become due within one year after the date the financial statements are issued. If substantial doubt exists, certain disclosures are required. The provisions of this ASU are effective for annual periods ending after December 15, 2016 and to annual and interim periods thereafter. Early adoption is permitted. The ASU should be applied on a prospective basis. The Company believes the adoption of this ASU will not have a material impact on the Company’s disclosures.
FORTERRA BUILDING PRODUCTS
Notes to Combined Financial Statements
(USD in thousands, unless stated otherwise)
In September 2015, the FASB issued ASU 2015-16,Business Combinations (Topic 805). Topic 805 requires an acquirer to retrospectively adjust provisional amounts recognized in a business combination during the measurement period. To simplify the accounting for adjustments made to provisional amounts, the amendments in this update require that the acquirer recognize adjustments to provisional amounts that are identified during the measurement-period in the reporting period in which the adjustment amount is determined. The acquirer is required to also record, in the same period’s financial statements, the effect on earnings of changes in depreciation, amortization or other income effects, if any, as a result of the change to the provisional amounts, calculated as if the accounting had been completed at the acquisition date. In addition, an entity is required to present separately on the face of the income statement or disclose in the notes to the financial statements the portion of the amount recorded in current period earnings by line item that would have been recorded in previous reporting periods if the adjustment to the provisional amounts had been recognized as of the acquisition date. For public business entities, the amendments in this update are effective for fiscal years beginning after December 15, 2015, including interim periods within those fiscal years.
In February 2016, the FASB issued ASU 2016-02, Leases(Topic 842), amending the existing accounting standards for lease accounting, including requiring lessees to recognize most leases on their balance sheets and making targeted changes to lessor accounting. For public business entities, the amendments in this update are effective for annual reporting periods beginning after December 15, 2018, including interim periods within those fiscal years, and early adoption is permitted as of the standard’s issuance date. ASU 2016-02 requires a modified retrospective transition approach for all leases existing at, or entered into after, the date of initial application, with an option to use certain transition relief. The Company believes this ASU will have a material impact on its combined financial statements as it will result in most of the Company’s leases and associated assets being presented on the balance sheet. See also Note 14 for a summary of the Company’s current operating lease commitments and Note 22 for disclosure of a significant sales-leaseback transaction the Company executed subsequent to the balance sheet date during April 2016.
3. Business combinations
Transaction Overview – The Acquisition
The Successor’s financial statements reflect the Acquisition of the Predecessor that occurred on March 13, 2015, which was accounted for as a business combination as defined by ASC 805. Certain liabilities of the Predecessor were not assumed by the Successor including, but not limited to pension liabilities, tax and insurance related liabilities and multi-employer pension liabilities. The assets acquired and liabilities assumed are recorded at their respective fair values as of the date of the Acquisition with the excess of the purchase price over those fair values recorded as goodwill. The determination of the fair values of the acquired assets and assumed liabilities required significant judgment, including estimates impacting the determination of estimated lives of tangible and intangible assets, the calculation of the fair value of inventory, property, plant and equipment, and customer related intangibles. The fair values were determined primarily using the income method using level 3 inputs as defined by ASC 820.
FORTERRA BUILDING PRODUCTS
Notes to Combined Financial Statements
(USD in thousands, unless stated otherwise)
The following table summarizes the fair values of the assets acquired and liabilities assumed by the Company at the Acquisition date:
| Fair Value | ||||
Net working capital | $ | 257,368 | ||
Property, plant and equipment | 311,191 | |||
Investment in equity method investee | 56,400 | |||
Customer backlog intangible | 4,500 | |||
Other assets and other liabilities | (6,495 | ) | ||
|
| |||
Net identifiable assets acquired | $ | 622,964 | ||
Goodwill | 17,464 | |||
|
| |||
Consideration, net of cash acquired | $ | 640,428 | ||
|
| |||
The goodwill recognized was attributable primarily to expected operating efficiencies and expansion opportunities in the business acquired. The goodwill is not expected to be deductible for tax purposes.
Financing transactions
Consideration to fund the Acquisition was provided by an equity investment of $167.5 million and proceeds from third-party debt, net of original discount and debt issuance costs, in the amount of $472.9 million. The financing transactions included a senior term loan in the amount of $254.9 million ($241.7 million, net of $13.2 million of original issue discount and debt issuance costs), a junior term loan in the amount of $260.0 million ($233.8 million, net of $26.2 million of original issue discount and debt issuance costs) and a revolving line of credit of up to $150.0 million. Funds of $0.6 million were initially drawn from the revolving line of credit at the closing date of the Acquisition. The Company incurred debt issuance costs related to the revolving line of credit in the amount of $3.2 million.
Contingent Consideration
As discussed in Note 1, the Acquisition included contingent consideration of up-to an additional $100.0 million based on the earnings of LSF9 for fiscal year 2015 as adjusted by the purchase agreement (“Earn-out”). The Earn-out is based on the achievement of an amount in excess of a certain minimum threshold of adjusted earnings before interest, taxes, depreciation and amortization (“Adjusted EBITDA”), as defined by the purchase agreement, for the calendar year ended December 31, 2015. The Company determined that achieving the required threshold to trigger a payout to the Seller was not probable and, therefore, the Company did not record a contingent liability related to the Earn-out as of the Acquisition date. Subsequent to year end, the Company concluded the Earn-out was not earned and, accordingly, did not record a liability as of December 31, 2015. See further discussion of the Earn-out in Note 14.
Transaction Overview – Cretex Concrete Products (“Cretex”)
On August 20, 2015, Forterra entered into a purchase agreement to acquire all the outstanding shares of Cretex Concrete Products, Inc. (“Cretex”) for a purchase price of $245.1 million including customary working capital adjustments. The closing of the Cretex acquisition occurred on October 1, 2015 and is accounted for as a business combination as defined by ASC 805. The Company allocated
FORTERRA BUILDING PRODUCTS
Notes to Combined Financial Statements
(USD in thousands, unless stated otherwise)
the purchase price to the individually identifiable assets acquired and liabilities assumed basedon their estimated fair value on the date of acquisition. The fair value of assets and liabilities were determined primarily using the income method using level 3 inputs as defined by ASC 820. The excess purchase price over those fair values was recorded as goodwill. The determination of fair values of the acquired assets and assumed liabilities required significant judgment, including estimates related to contract backlog, calculation of the fair value of property, plant and equipment and inventory. The allocation of the purchase price is preliminary and may be subject to change upon completion of the determination of the fair value of all acquired assets and liabilities.
The respective preliminary fair values of the assets acquired and liabilities assumed at the acquisition date are as follows:
| Fair Value | ||||
Net working capital | $ | 69,745 | ||
Property, plant and equipment | 97,282 | |||
Customer relationship intangible | 24,700 | |||
Trade name | 600 | |||
Customer backlog intangible | 800 | |||
Other assets and other liabilities | (7,500 | ) | ||
|
| |||
Net identifiable assets acquired | 185,627 | |||
Goodwill | 59,473 | |||
|
| |||
Consideration transferred, net of cash acquired | $ | 245,100 | ||
|
| |||
The results of operations of Cretex have been included in the Successor’s combined statement of operations.operations subsequent to the date of acquisition on October 1, 2015. The pensionCompany recognized $39.1 million in net sales related to Cretex through December 31, 2015.
Financing transactions
The purchase of Cretex was partially funded with proceeds from financing transactions totaling $240.0 million as an add-on to the aforementioned senior term loan.
Supplemental pro-forma information (unaudited)
If the Company had acquired Cretex on January 1, 2015 the Company’s total net sales and OPEB expense recorded by the Predecessor for plans sponsored by affiliates includes expenses of $569 and $662,loss from continuing operations before taxes, on a pro-forma basis for the yearsyear ended December 31, 2015 would have been approximately $1.0 billion and $(91.7) million, respectively, which includes both Predecessor and Successor periods in 2015.
Transaction Costs
For the period from March 14, 2015 to December 31, 2015, for the period from January 1, 2015 to March 13, 2015 and for the year ended December 31, 2014, the Company recognized transaction costs specific to the Acquisition and 2013, respectively, which are includedCretex acquisition of $13,725, $2,079, and $17,740 respectively. No transaction costs were incurred in the allocatedyear ended December 31, 2013. Transaction costs generally include legal, accounting, valuation, and advisory fees. These costs are recorded in the combined statements of operations within selling, general & administrative expenses.
FORTERRA BUILDING PRODUCTS
Notes to Combined Financial Statements
(USD in thousands, unless stated otherwise)
4. Receivables, net
Receivables consist of the following:
| Successor | Predecessor | |||||||
| December 31, 2015 | December 31, 2014 | |||||||
Trade receivables | $ | 108,065 | $ | 103,825 | ||||
Amounts billed, but not yet paid under retainage provisions | 2,053 | 2,293 | ||||||
Other receivables | 12,436 | 5,167 | ||||||
|
|
|
| |||||
Total receivables | $ | 122,554 | $ | 111,285 | ||||
Less: Allowance for doubtful accounts | (3,595 | ) | (2,236 | ) | ||||
|
|
|
| |||||
Trade receivables, net | $ | 118,959 | $ | 109,049 | ||||
|
|
|
| |||||
The Company records provisions for doubtful accounts in selling, general and administrative expenses described in Note 15.
LHI made contributions to the planscombined statements of operations. The table below summarizes the Company’s allowance for doubtful accounts for the Predecessor’s employees that participateperiods presented in pension and other post-retirement benefit plans sponsored by LHI. For purposes of thesethe combined Predecessor financial statements the Predecessor accounts for its activities affecting these plans as if these single-employer plans sponsored by LHI were multi-employer plansstatements:
Predecessor | Allowance for doubtful accounts | |||
Balance at January 1, 2013 | $ | (3,153 | ) | |
Provisions for doubtful accounts | (2,760 | ) | ||
Write-offs and adjustments | 2,216 | |||
|
| |||
Balance at December 31, 2013 | (3,697 | ) | ||
|
| |||
Provisions for doubtful accounts | 786 | |||
Write-offs and adjustments | 675 | |||
|
| |||
Balance at December 31, 2014 | (2,236 | ) | ||
|
| |||
Provisions for doubtful accounts | 31 | |||
Write-offs and adjustments | (63 | ) | ||
|
| |||
Balance at March 13, 2015 | $ | (2,268 | ) | |
|
| |||
Successor | Allowance for doubtful accounts | |||
Balance at March 14, 2015 | $ | (2,268 | ) | |
Provisions for doubtful accounts | (1,377 | ) | ||
Write-offs and adjustments | 50 | |||
|
| |||
Balance at December 31, 2015 | $ | (3,595 | ) | |
|
| |||
FORTERRA BUILDING PRODUCTS
Notes to Combined Financial Statements
(USD in accordance with ASC 715.thousands, unless stated otherwise)
LHI also sponsors several defined contribution pension plans covering substantially all
5. Inventories
Inventories consist of the Predecessor’s employees. Eligible employees may contribute a portionfollowing:
| Successor | Predecessor | |||||||
| December 31, 2015 | December 31, 2014 | |||||||
Finished goods | $ | 146,635 | $ | 140,004 | ||||
Raw materials | 53,339 | 46,486 | ||||||
Work in process | 10,641 | 4,006 | ||||||
|
|
|
| |||||
Total inventories | $ | 210,615 | $ | 190,496 | ||||
|
|
|
| |||||
6. Property, plant and equipment, net
Property, plant and equipment, net consist of their base compensationthe following:
| Successor | Predecessor | |||||||
| December 31, 2015 | December 31, 2014 | |||||||
Land, buildings and improvements | $ | 243,496 | $ | 507,214 | ||||
Machinery and equipment | 158,349 | 337,993 | ||||||
Other equipment | 1,142 | 26,433 | ||||||
Construction-in-progress | 14,984 | 21,274 | ||||||
|
|
|
| |||||
Total property, plant and equipment | 417,971 | 892,914 | ||||||
Less: accumulated depreciation | (29,047 | ) | (478,841 | ) | ||||
|
|
|
| |||||
Property, plant and equipment, net | $ | 388,924 | $ | 414,073 | ||||
|
|
|
| |||||
Depreciation expense totaled $28,613, $6,894, $36,605, and $38,560 for the period from March 14, 2015 to the plans, and their contributions are matched by the Predecessor at rates specified in the plans. The Predecessor made contributions to the plans sponsored by LHI for its employees that participate in the plans. These contributions totaled $1,724, $8,936 and $8,683December 31, 2015, for the period from January 1, 2015 to March 13, 2015, and for the years ended December 31, 2014 and 2013, respectively, which are recorded within costsis included in cost of goods sold and selling, general and administrative expenses in the combined Predecessor statement of operations. The recorded expenses related to the defined contribution pension plans are reflected within costs of goods sold and selling, general and administrative expenses in the accompanying combined Predecessor statements of operations. These expenses
Impairments
The Company recorded impairment charges primarily in conjunction with plant closings undertaken for purposes of market consolidation and recognized asset impairment charges for its property, plant and equipment of $1,088, $27, $3,977 and $12,011 for the period from March 14, 2015 to December 31, 2015, for the period from January 1, 2015 to March 13, 2015, and for the years ended December 31, 2014 and 2013, respectively. Asset impairments are included in impairment and restructuring charges on the combined statements of operations.
Transfers
During 2014, the Predecessor transferred to HC certain property, plant and equipment of $25,107 related to sites historically included in BP North America because such sites were not included in the allocated expenses described in Note 15.
22. Subsequent events
Sherman-Dixie Acquisition
On January 29, 2016 the Company purchased all of the outstanding stock of Sherman-Dixie Concrete Industries, Inc., a Tennessee corporation, which manufactures and sells concrete pipe, box culverts, precast concrete utility products, storm and sanitary civil engineered systems and specialty engineered retainage systems in the Southeast market for cash consideration of $66.8 million including customary net working capital adjustments. Sherman-Dixie Concrete Industries, Inc. will operate as part of the Company’s Drainage Pipe & Products reportable segment. The acquisition was financed through a draw on the Company’s existing Revolver.
Sale-Leaseback Transaction
On April 5, 2016, the Company, through its subsidiaries in North America, sold properties in 47 sites throughout the U.S. and Canada to Pipe Portfolio Owner (Multi) LP and Fort-Ben Holdings (ONQC) Ltd. (collectively the “Buyer”) for an aggregate purchase price of approximately $204.3 million. On April 14, 2016, the Company sold additional properties in two sites located in the U.S. to Pipe Portfolio Owner (Multi) LP for an aggregate purchase price of approximately $11.9 million. The Company and Buyer contemporaneously entered into master land and building lease agreements under which the Company agreed to lease back each of the properties for an initial term of twentyAcquisition.
FORTERRA BUILDING PRODUCTS
Notes to Combined Financial Statements
(USD in thousands, unless stated otherwise)
years, followed7. Goodwill and other intangible assets, net
In connection with the Acquisition and the Cretex acquisition, the Company recognized goodwill of $17.5 million and $59.5 million, respectively. On an annual basis, the Company performs step one of its goodwill impairment test by comparing the fair value of each reporting unit with its carrying value. Only certain of the Company’s reporting units have goodwill subsequent to the Acquisition of the Company and Cretex acquisition. The Company completed annual assessments as of October 1 of each reporting period. In 2013, one optional renewal termsreporting unit, Water Pipe & Products, failed step one and the Company recorded a goodwill impairment charge of 9 years 11 months. Leaseback rental will escalate annually by 2%$236,639 during the initial termyear ended December 31, 2013 based on the amount by which the carrying value of the reporting unit exceeded the fair value of the identifiable assets and liabilities of the reporting unit. There were no other impairments recorded to goodwill during the reporting periods included in the combined financial statements.
Goodwill at December 31, 2014 of $83,674 was eliminated upon consummation of the Acquisition in connection with the Successor’s accounting for the business combination.
The following table presents the changes in the net carrying value of goodwill by reportable segment:
| Successor | Drainage Pipe & Products | Water Pipe & Products | Bricks | Other | Total | |||||||||||||||
March 14, 2015 | $ | 15,139 | $ | 2,280 | $ | 45 | $ | — | $ | 17,464 | ||||||||||
Acquisition of Cretex | 59,473 | — | — | — | 59,473 | |||||||||||||||
Foreign Currency | (1,170 | ) | (230 | ) | — | — | (1,400 | ) | ||||||||||||
|
|
|
|
|
|
|
|
|
| |||||||||||
December 31, 2015 | $ | 73,442 | $ | 2,050 | $ | 45 | $ | — | $ | 75,537 | ||||||||||
|
|
|
|
|
|
|
|
|
| |||||||||||
Intangible assets other than goodwill at December 31, 2015 included the following:
| Weighted average amortization period (in years) | Gross carrying value as of December 31, 2015 | Accumulated amortization | Net carrying value as of December 31, 2015 | |||||||||||||
Customer relationships | 5 | $ | 24,700 | $ | (365 | ) | $ | 24,335 | ||||||||
Customer backlog | 1 | 5,182 | (3,955 | ) | 1,227 | |||||||||||
Brand names | 2 | 600 | (100 | ) | 500 | |||||||||||
|
|
|
|
|
| |||||||||||
Total intangible assets | $ | 30,482 | $ | (4,420 | ) | $ | 26,062 | |||||||||
|
|
|
|
|
| |||||||||||
Amortization expense was $4,317 for the period from March 14, 2015 to December 31, 2015.
FORTERRA BUILDING PRODUCTS
Notes to Combined Financial Statements
(USD in thousands, unless stated otherwise)
In the future the Company expects to incur amortization expense on these intangible assets for the years ended December 31 as follows:
Years ending December 31: | ||||
2016 | $ | 8,575 | ||
2017 | 6,083 | |||
2018 | 4,132 | |||
2019 | 2,910 | |||
2020 | 2,034 | |||
Thereafter | 2,328 | |||
|
| |||
Total future amortization expense | $ | 26,062 | ||
|
|
8. Fair Value Measurement
The Company’s financial instruments consist primarily of cash and cash equivalents, trade and other receivables derivative instruments, accounts payable, long-term debt and accrued liabilities. The carrying value of the Company’s trade receivables, trade payables, the asset based revolver and accrued liabilities approximates fair value due to their short-term maturity. The Company may adjust the carrying amount of certain nonfinancial assets to fair value on a non-recurring basis when they are impaired.
The estimated carrying amount and fair value of the Company’s financial instruments and other assets and liabilities measured and recorded at fair value on a recurring basis is as follows for the dates indicated:
| Successor | Fair value measurements at December 31, 2015 using | |||||||||||||||
| Recurring: | Quoted Prices in Active Markets for Identical Assets (Level 1) | Significant Other Observable Inputs (Level 2) | Significant Unobservable Inputs (Level 3) | Total Fair Value December 31, 2015 | ||||||||||||
Non-current assets | ||||||||||||||||
Derivative assets | $ | — | $ | 9,093 | $ | — | $ | 9,093 | ||||||||
The fair values of derivative assets and liabilities are determined using quantitative models that utilize multiple market inputs including interest rates and exchange rates to generate continuous yield or pricing curves and volatility factors to value the position. The majority of market inputs are actively quoted and can be validated through external sources, including brokers, market transactions and third-party pricing services. The fair values of derivative assets and liabilities include adjustments for market liquidity, counterparty credit quality and other instrument-specific factors, where appropriate. In addition, the Company incorporates within its fair value measurements a valuation adjustment to reflect the credit risk associated with the net position. Positions are netted by counterparties, and fair value for net long exposures is adjusted for counterparty credit risk while the fair value for net short exposures is adjusted for the Company’s own credit risk.
FORTERRA BUILDING PRODUCTS
Notes to Combined Financial Statements
(USD in thousands, unless stated otherwise)
The estimated carrying amount and fair value of the Company’s financial instruments and liabilities for which fair value is only disclosed is as follows:
| Successor | Fair value measurements at December 31, 2015 using | |||||||||||||||||||
| Carrying Amount December 31, 2015 | Quoted Prices in Active Markets for Identical Assets (Level 1) | Significant Other Observable Inputs (Level 2) | Significant Unobservable Inputs (Level 3) | Total Fair Value December 31, 2015 | ||||||||||||||||
Non-current liabilities | ||||||||||||||||||||
Senior Term Loan | $ | 469,383 | $ | — | $ | 470,543 | $ | — | $ | 470,543 | ||||||||||
Junior Term Loan | 236,446 | — | 259,675 | — | 259,675 | |||||||||||||||
The fair value of debt is the estimated amount LSF9 would have to pay to transfer its debt, including any premium or discount attributable to the difference between the stated interest rate and market rate of interest at the balance sheet date. Fair values are supported by observable market transactions when available.
Deferred compensation is valued using cash surrender value of Company-owned life insurance. The fair values of benefit plan assets and the related disclosure are included in Note 21, Employee Benefit Plans.
9. Derivatives and hedging
The Company uses derivatives to manage selected foreign exchange and interest rate exposures. The Company does not use derivative instruments for speculative trading purposes, and cash flows from derivative instruments are included in net cash provided by (used in) financing activities in the combined statements of cash flows.
In May of 2015, the Company entered into the following derivative instruments: fixed-for-fixed cross currency swaps and fixed-for-float cross currency swaps. The fixed-for-float cross currency swaps are designated as cash flow hedges in accordance with ASC 815-20,Derivatives–Hedging, with the effective portion of the changes in the fair value of the derivatives recorded to accumulated other comprehensive income, and any ineffective portion reflected directly in earnings as other operating expense in the combined statements of operations. The fixed-for-fixed cross currency swaps are not designated as hedge instruments; therefore changes in fair value are recognized immediately in earnings as other operating income (expense) in the combined statements of operations.
A quantitative analysis is utilized to assess hedge effectiveness for cash flow hedges. The Company assesses the hedge effectiveness and measures the amount of ineffectiveness for the hedge relationships based on changes in spot exchange rates. For the Consumer Price Index capped at 4% duringperiod from March 14, 2015 to December 31, 2015, the optional renewal period. The net proceeds received fromCompany recognized foreign exchange gain of $1.9 million in the sale leaseback transactions amountedcombined statement of operations, and $1.5 million included in other comprehensive income (loss) related to approximately $209.7 million,cash flow hedges, net of taxes of $0 and transaction costs.$0, respectively.
The sale-leasebackCompany has elected to present all derivative assets and derivative liabilities, on a net basis on its combined balance sheets when a legally enforceable International Swaps and Derivatives Association, Inc. (“ISDA”) Master Agreement exists. An ISDA Master Agreement is an agreement
FORTERRA BUILDING PRODUCTS
Notes to Combined Financial Statements
(USD in thousands, unless stated otherwise)
between two counterparties, which may have multiple derivative transactions are considered to havewith each other governed by such agreement, and such ISDA Master Agreement generally provides for the net settlement of all or a formspecified group of prohibited “continuing involvement”these derivative transactions, through a single payment, in a single currency, in the event of a default on, or affecting any, one derivative transaction or a termination event affecting all, or a specified group of, derivative transactions. At December 31, 2015, the Company’s derivative instruments fall under an ISDA master netting agreement, however the Company’s derivative instruments included only assets at the inceptionbalance sheet date, thus no netting of derivatives is included.
The following table presents the lease which preclude sale-leaseback accounting for transactions involving real estatefair values of derivative assets and liabilities in the combined financialsuccessor balance sheet:
| Successor | ||||||||||||||||
| December 31, 2015 | ||||||||||||||||
| Level 2 | ||||||||||||||||
| Derivative Assets | Derivative Liabilities | |||||||||||||||
| Notional Amount | Fair Value | Notional Amount | Fair Value | |||||||||||||
Fixed-for-fixed cross currency swap | $ | 79,531 | $ | 7,667 | — | — | ||||||||||
Fixed-for-float cross currency swap | 81,991 | 1,426 | — | — | ||||||||||||
|
|
|
|
|
|
|
| |||||||||
Total derivatives, gross | 9,093 | — | ||||||||||||||
Less: Legally enforceable master netting agreements | — | |||||||||||||||
|
|
|
| |||||||||||||
Total derivatives, net | $ | 9,093 | $ | — | ||||||||||||
|
|
|
| |||||||||||||
The following table presents the gain (loss) recognized in earnings on derivative instruments in cash flow hedging relationships in the combined statements of operations:
| Successor | ||||
| March 14 - December 31, | ||||
| 2015 | ||||
Cash flow hedges | ||||
Cross currency swaps | ||||
Gain on derivatives recognized in Accumulated other comprehensive income | $ | 1,549 | ||
Gain on derivatives not designated as hedges | 8,331 | |||
The estimated net amount of existing gains at December 31, 2015 expected to be reclassified into earnings within the Company because a guarantee by LSF9 provides the buyer-lessor with additional collateral that reduces the buyer-lessor’s risk of loss. As a result, the assets subjectnext 12 months total $0.5 million.
FORTERRA BUILDING PRODUCTS
Notes to the sale-leaseback will remain on the balance sheetCombined Financial Statements
(USD in thousands, unless stated otherwise)
10. Debt and deferred financing costs
The Company’s debt consisted of the Company and continue to be depreciated. The aggregate proceeds received will be recorded as a financing obligation.following:
U.S. Pipe Acquisition
| Successor | Predecessor | |||||||
| December 31, 2015 | December 31, 2014 | |||||||
Senior Term Loan Credit Agreement | ||||||||
interest at 6.50%, net of debt issue costs and original issue discount of $20,129 | $ | 469,383 | $ | — | ||||
Junior Term Loan Credit Agreement | ||||||||
interest at 10.50%, net of debt issue costs and original issue discount of $23,554 | 236,446 | — | ||||||
|
|
|
| |||||
Total debt | 705,829 | — | ||||||
Less: current portion debt | (2,191 | ) | — | |||||
|
|
|
| |||||
Total long-term debt | $ | 703,638 | $ | — | ||||
|
|
|
| |||||
The Company acquired substantially all of the stock of USP Holdings Inc., a ductile iron pipe producer, on April 15, 2016 for an initial purchase price of $775.1 million, which was funded with a $205.0 million borrowing by LSF9 on the Revolver, a portion of the proceeds of the above referenced sale-leaseback and a capital contribution of $402.1 million from our parent. USP Holdings Inc. will operate as part of the Company’s Water Pipe & Products reportable segment.
Roof Tile Divestiture
On April 12, 2016, the Company entered into and closed a Stock Purchase Agreement to sell all of its ownership interest in its roof tile business for an initial price of $10.5 million, subject to customary working capital adjustments.
Changes to debt obligations and borrowing capacity
In April 2016, the Company’s total borrowing capacity under its Revolver was increased from $250.0 million to $285.0 million.
In April 2016, LSF9 borrowed $205.0 million on the Revolver in order to finance the acquisition of US Pipe, as noted above, of which $203.4 million was repaid during April 2016 with proceeds from an affiliated entity controlled by LSF9 but not included among the legal entities that comprise Forterra. In connection with the additional proceeds obtained in April 2016 which benefittedfinancing of the Company,Acquisition, LSF9 entered into a Senior Term Loan Credit Agreement for borrowings of $635.0 million, a Junior Term Loan Credit Agreement for borrowings of $260.0 million, and drew $45.0 million under a $150.0 million revolving credit facility (the “Revolver”). Approximately $515.5 million is the obligation of Forterra as a joint and several obligation under ASC 405-40, Obligations Resulting from Joint and Several Liability Arrangements,Arrangements. See also Note 1, Basis of Presentation-Successor.
In connection with the Cretex acquisition, the Company assumed anissued additional obligationSenior term notes of $203.4 million that was recognized as an increase$240.0 million. In conjunction with the issuance of debt related to the Acquisition and the Cretex acquisition, LSF9 incurred $71.6 million of debt issuance costs and debt discounts; of which $51.9 million is attributed to the Company debt obligation.
The Company early adopted ASU No. 2015-03,Simplifying the Presentation of Debt Issuance Costs, and classified debt issuance costs as contra-liabilities as of December 31, 2015. As the Company had no prior debt balances, the adoption of ASU 2015-03 required no retrospective adjustment or changes to previously reported balances.
All of the Company’s allocated share of LSF9’s outstanding Senior Term Loan balance.debt instruments are unconditionally guaranteed by the Company and all its subsidiaries jointly and severally. The affiliated entity was subsequently released as a co-obligor and its joint and several liability under terms ofcredit agreements are secured by substantially all of the 3rd party credit agreements.
assets of the Company. On June 16, 2016, LSF9 borrowed an incremental $345.0 million onNovember 10, 2015, the Company modified the Revolver and increased its available borrowing capacity to $250.0 million. The interest rate for both the Senior Term Loan and used the proceeds to payJunior Term Loan is set at LIBOR (with a dividend1% floor) plus a margin of the same amount to the shareholders of LSF9. LSF9 incurred debt issuance fees5.50% and discount of $6.7 million in connection with the issuance of the debt.9.50%, respectively. The incremental borrowings incur interest at the same rate as the Senior Term Loan (see Note 10)Credit Agreement has a weighted average effective interest rate of 7.2% for the year ended December 31, 2015 and matures March 2022. The effective interest rate of the Junior Term Loan Credit Agreement was 11.7% for the period, and the debt matures March 2023. The effective interest rate includes the effects of deferred financing fees and original issue discount and premium amortization calculated using the effective interest method.
At December 31, 2015, the Company’s Revolver, which matures in March 2022. 2020, had total borrowing capacity of $250.0 million, none of which was outstanding. The available credit under the Revolver is limited by a borrowing base which includes a portion of the Company’s current assets.
FORTERRA BUILDING PRODUCTS
Notes to Combined Financial Statements
(USD in thousands, unless stated otherwise)
Interest is floating, based on a reference rate plus an applicable margin. The weighted average annual interest rate on the Revolver was 1.94% for the period March 14, 2015 through December 31, 2015. In addition, Forterra pays a facility fee of between 25.0 and 37.5 basis points per annum based upon the utilization of the total Revolver facility. Availability under the Revolver at December 31, 2015 based on draws, and outstanding letters of credit and allowable borrowing base was $231.0 million.
For the period from March 13, 2015 to December 31, 2015, cash payments for interest totaled $40.3 million, of which $14.9 million was paid by affiliates of the Company.
As of December 31, 2015, minimum future principal payments on long-term debt are as follows:
| Total | Senior Term Loan | Junior Term Loan | ||||||||||
2016 | $ | 2,191 | $ | 2,191 | $ | — | ||||||
2017 | — | — | — | |||||||||
2018 | — | — | — | |||||||||
2019 | — | — | — | |||||||||
2020 | — | — | — | |||||||||
Thereafter: | 747,321 | 487,321 | 260,000 | |||||||||
|
|
|
|
|
| |||||||
| $ | 749,512 | $ | 489,512 | $ | 260,000 | |||||||
Covenants, Events of Default and Provisions
Under the terms of credit agreements above, LSF9 is required to comply with certain customary covenants, including among others, the limitation of indebtedness, limitations on liens, and limitations on certain cash distributions. The Revolver imposes only financial covenant, which requires LSF9 to maintain a fixed charge coverage ratio of no less than 1.00 to 1.00. The fixed charge coverage ratio is the ratio of consolidated earnings before interest, depreciation, and amortization (“EBITDA”) less cash payments for capital expenditures and income taxes to consolidated fixed charges (interest expense plus scheduled payments of principal on indebtedness). As of December 31, 2015, LSF9 was in compliance with the debt covenants contained in its credit facilities.
Lines of Credit and Other Debt Facilities
The Company had stand-by letters of credit outstanding of $15.8 million as of December 31, 2015 which reduce the borrowings available under the credit facilities.
Joint and several obligations
As discussed above, the Company has recorded debt on its combined balance sheet under ASC 405-40, Obligations Resulting from Joint and Several LiabilityArrangements, Forterra will recognize Arrangements. The Company and the full amountaffiliates of LSF9 were co-obligors and jointly and severally liable under terms of the incremental borrowing, netLSF9’s credit agreements. The Company’s allocated portion of the $940.0 million of third party debt used to finance the Acquisition is $515.5 million. The initial obligation of $515.5 million was reflected on the Company’s combined balance sheet at the Acquisition date as $254.9 million of Senior Term Loan, $260 million of Junior Term Loan and $0.6 million of Revolver obligations. The remaining $424.5 million of the debt was allocated to affiliates of LSF9 that are not included in these financial statements based on the amounts affiliates of LSF9 were expected to repay and such amount has been fully repaid by affiliates. In April of 2016, the Company’s affiliate co-obligors were released from joint and several liability under
FORTERRA BUILDING PRODUCTS
Notes to Combined Financial Statements
(USD in thousands, unless stated otherwise)
the LSF9 credit agreements. The Company is consequently the sole source of repayment for its $515.5 million share for the initial obligation under the credit agreements, as well as other obligations recorded on the balance sheet. In addition to the initial debt obligation of $515.5 million recorded by the company, during October 2015, additional LSF9 Senior Term Loan borrowings of $240 million to finance the Cretex acquisition were allocated in full to the Company.
The amounts recorded at December 31, 2015 in the combined balance sheets represent the portion of LSF9’s outstanding obligation as of the balance sheet date the Company was expected to repay. The obligations are secured by substantially all of the assets of the Company.
Repayments on the Revolver of $44.4 million made by affiliates during the period ended December 31, 2015 were applied to the initial Revolver balance when determining the amount to allocate to the Company. The Company allocated related debt issuance costs and discount in proportion to the debt instrument recorded. The Company allocated interest expense based on the total amounts allocated by debt instrument.
11. Accrued liabilities
Accrued liabilities consist of the following for the years ended December 31, 2015 and 2014:
| Successor | Predecessor | |||||||
| December 31, 2015 | December 31, 2014 | |||||||
Accrued payroll and employee benefits | $ | 24,690 | $ | 26,058 | ||||
Accrued taxes | 17,073 | 10,597 | ||||||
Accrued rebates | 8,021 | 7,280 | ||||||
Warranty | 2,429 | 1,644 | ||||||
Shut down and restructuring costs | — | 1,474 | ||||||
Other miscellaneous accrued liabilities | 3,415 | 3,359 | ||||||
|
|
|
| |||||
| $ | 55,628 | $ | 50,412 | |||||
|
|
|
| |||||
12. Other long-term liabilities
Other long-term liabilities consist of the following for the years ended December 31, 2015 and 2014:
| Successor | Predecessor | |||||||
| December 31, 2015 | December 31, 2014 | |||||||
Workers compensation | $ | 1,458 | $ | 10,536 | ||||
Deferred rent | 1,386 | — | ||||||
Environmental remediation liability | 1,315 | 1,654 | ||||||
Asset retirement obligations | 938 | 1,637 | ||||||
Legal | 628 | — | ||||||
Insurance | 527 | 3,451 | ||||||
Employee benefits | — | 10,408 | ||||||
Tax related provision | — | 2,216 | ||||||
Other miscellaneous long-term liabilities | 502 | 2,483 | ||||||
|
|
|
| |||||
| $ | 6,754 | $ | 32,385 | |||||
|
|
|
| |||||
FORTERRA BUILDING PRODUCTS
Notes to Combined Financial Statements
(USD in thousands, unless stated otherwise)
13. Income taxes
Successor
As of the date of the Acquisition, the combined Successor financial statements reflect a new tax basis of accounting as the Company includes taxable entities independent of the Predecessor. Deferred tax assets and liability are recognized principally for the expected tax consequences of temporary differences between the tax basis of assets and liability and their reported amounts, using currently enacted tax rates. All tax consequences associated with the Predecessor period were retained by HC.
Predecessor
The Company’s U.S. and non-U.S. operations have been historically included in certain HC consolidated tax returns. The tax provisions have been prepared on a stand-alone basis, as if the business was a separate group of companies under common ownership although the Company was included in the HC entities’ tax returns. The operations have been combined as if they were filing on a consolidated basis for U.S. and state income tax purposes as they were historically included in the consolidated U.S. Income tax returns and certain consolidated or unitary group state returns of the prior parent entity. The non-U.S. tax provision has been determined on a stand-alone basis for each non-U.S. affiliate as these entities have historically filed stand-alone returns as required by the jurisdiction in which they operate.
The Company’s income (loss) from continuing operations before income taxes for the period March 14, 2015 to December 31, 2015, January 1, 2015 to March 13, 2015 and for the years ended December 31, 2014 and 2013 was as follows:
| Successor | Predecessor | |||||||||||||||
| For the period from March 14 to December 31, | For the period from January 1 to March 13, | Years ended December 31, | ||||||||||||||
| 2015 | 2015 | 2014 | 2013 | |||||||||||||
U.S. companies | $ | (95,417 | ) | $ | (6,265 | ) | $ | (4,382 | ) | $ | (250,128 | ) | ||||
Canadian companies | 18,409 | (233 | ) | 14,387 | 8,409 | |||||||||||
|
|
|
|
|
|
|
| |||||||||
Total income (loss) from continuing operations before income taxes | $ | (77,008 | ) | $ | (6,498 | ) | $ | 10,005 | $ | (241,719 | ) | |||||
|
|
|
|
|
|
|
| |||||||||
FORTERRA BUILDING PRODUCTS
Notes to Combined Financial Statements
(USD in thousands, unless stated otherwise)
The rate reconciliation for continuing operations presented below is based on the U.S. federal statutory tax rate of 35% because the predominant business activity is in the U.S.:
| Successor | Predecessor | |||||||||||||||
| Period Ended December 31, 2015 | Period Ended March 13, 2015 | Year Ended December 31, 2014 | Year Ended December 31, 2013 | |||||||||||||
Income (loss) from continuing operations | $ | (77,008 | ) | $ | (6,498 | ) | $ | 10,005 | $ | (241,719 | ) | |||||
Income tax expense at statutory rate of 35% | $ | 26,953 | $ | 2,274 | $ | (3,502 | ) | $ | 84,602 | |||||||
State income taxes, net of federal benefit | 1,984 | — | (70 | ) | (62 | ) | ||||||||||
Foreign rate differential | 1,784 | (226 | ) | 1,401 | 727 | |||||||||||
Non-deductible expenses | (527 | ) | — | (497 | ) | — | ||||||||||
Change in valuation allowance | (35,738 | ) | (2,223 | ) | (602 | ) | (4,812 | ) | ||||||||
Goodwill impairment | — | — | — | (82,825 | ) | |||||||||||
Non-deductible transaction costs | (558 | ) | — | — | — | |||||||||||
Other | 324 | 917 | 853 | (191 | ) | |||||||||||
|
|
|
|
|
|
|
| |||||||||
Total income tax (expense) benefit | $ | (5,778 | ) | $ | 742 | $ | (2,417 | ) | $ | (2,561 | ) | |||||
|
|
|
|
|
|
|
| |||||||||
The net deferred tax assets (liabilities) balances were comprised of the following components as of December 31, 2015 and 2014:
| Successor | Predecessor | |||||||
| December 31, 2015 | December 31, 2014 | |||||||
Deferred tax assets: | ||||||||
Inventory | $ | 8,952 | $ | 1,110 | ||||
Reserves and accrued liabilities | 11,449 | 19,760 | ||||||
Net operating losses (NOLs) | 18,030 | 106,599 | ||||||
Capitalized transaction costs | 2,271 | — | ||||||
Intangible assets | 2,599 | 14,620 | ||||||
Other assets | 54 | 1,392 | ||||||
|
|
|
| |||||
Total deferred tax assets | 43,355 | 143,481 | ||||||
|
|
|
| |||||
Valuation allowance | (37,988 | ) | (92,507 | ) | ||||
|
|
|
| |||||
Total deferred tax assets, net | $ | 5,367 | $ | 50,974 | ||||
|
|
|
| |||||
Deferred tax liabilities: | ||||||||
Fixed assets | $ | (3,393 | ) | $ | (50,336 | ) | ||
Derivatives | (179 | ) | — | |||||
Other liabilities | (1,073 | ) | (7,753 | ) | ||||
|
|
|
| |||||
Total deferred tax liabilities | (4,645 | ) | (58,089 | ) | ||||
|
|
|
| |||||
Net deferred tax asset (liability) | $ | 722 | $ | (7,115 | ) | |||
|
|
|
| |||||
FORTERRA BUILDING PRODUCTS
Notes to Combined Financial Statements
(USD in thousands, unless stated otherwise)
The income tax benefits (expenses) from continuing operations for the period March 14, 2015 to December 31, 2015, January 1, 2015 to March 13, 2015 and for the years ended December 31, 2014 and 2013 are as follows:
| Successor | Predecessor | |||||||||||||||
| March 14 - December 31 | January 1, 2013 | Years ended December 31, | ||||||||||||||
| 2015 | 2015 | 2014 | 2013 | |||||||||||||
Current income tax | ||||||||||||||||
U.S. companies | $ | (765 | ) | — | $ | 589 | $ | (436 | ) | |||||||
Canadian companies | (8,151 | ) | 3,491 | (2,388 | ) | (4,796 | ) | |||||||||
|
|
|
|
|
|
|
| |||||||||
Total current tax (expense) benefit | (8,916 | ) | 3,491 | (1,799 | ) | (5,232 | ) | |||||||||
|
|
|
|
|
|
|
| |||||||||
Deferred income tax | ||||||||||||||||
U.S. companies | 441 | — | — | — | ||||||||||||
Canadian companies | 2,697 | (2,749 | ) | (618 | ) | 2,671 | ||||||||||
|
|
|
|
|
|
|
| |||||||||
Total deferred tax (expense) benefit | 3,138 | (2,749 | ) | (618 | ) | 2,671 | ||||||||||
|
|
|
|
|
|
|
| |||||||||
|
|
|
|
|
|
|
| |||||||||
Income tax (expense) benefit - continuing operations | $ | (5,778 | ) | $ | 742 | $ | (2,417 | ) | $ | (2,561 | ) | |||||
|
|
|
|
|
|
|
| |||||||||
As of December 31, 2015, the Company has tax loss carryforwards as follows:
| Amount | Expiration Date | |||||
Federal net operating losses | $ | 38,512 | 2035 | |||
State net operating losses | $ | 21,324 | 2030-2035 | |||
Foreign net operating losses | $ | 1,633 | 2033-2035 | |||
Income tax expense and related current and deferred income taxes receivable and payable for the periods ending March 13, 2015 and December 31, 2013 and 2014 are calculated assuming hypothetical stand-alone income tax returns filed in Canada and its provinces and hypothetical consolidated income tax return for the Predecessor’s U.S. and state activities. The related tax provision amounts for the period ending December 31, 2015 were calculated based on the Company’s standalone activity post-acquisition. The Successor has recorded a full valuation allowance against its net deferred tax assets in the amount of $37,988 as management has concluded the deferred tax assets are not more likely than not to be realized at December 31, 2015. In any event, if the valuation allowance was not recorded, deferred tax assets of $5.2 million would be unavailable to benefit the Company because of interest expense that was paid by an affiliate and not by the Company and therefore is not deductible in the Company’s tax return (see Note 15 Related party transactions). In addition, Lone Star intends to enter into a Tax Receivables Agreement and accordingly, even in the event the Company generates taxable income in future periods, the Company may not realize the benefit of a large portion of the NOLs as the majority of the benefit would be paid to Lone Star. Historically, the U.S. companies were included in the consolidated U.S. income tax return and certain consolidated or unitary group state returns of LHI. The Company’s deferred tax assets and liabilities for the period ending December 31, 2014 are determined on the hypothetical basis described above and do not reflect the amount that would be determined for the Company on a standalone basis. The federal and state net operating loss carryover amounts include interest deductions in the Successor period ended December 31, 2015 that are the result of carve-out accounting adjustments, which will
FORTERRA BUILDING PRODUCTS
Notes to Combined Financial Statements
(USD in thousands, unless stated otherwise)
not be included in the actual net operating loss carryover available to reduce future tax liability. All hypothetical current taxes payable or receivable prior to March 13, 2015 are deemed settled through net parent investment. All tax attributers of the predecessor remain with HC under terms of the Acquisition.
Uncertain tax positions
The Company is subject to audit examinations at federal, state, local, and foreign levels by tax authorities in those jurisdictions who may challenge the treatment or reporting of any tax return item. The tax matters challenged by the tax authorities are typically complex; therefore, the ultimate outcomes of these challenges are subject to uncertainty. Taxable years after 2009 are still open for examination for the U.S. and Canada.
Each period the Company assesses uncertain tax positions for recognition, measurement and effective settlement. Benefits from uncertain tax positions are measured at the largest amount of benefit that is greater than 50 percent likely of being realized upon settlement. Where it has been determined that our tax return filing position does not satisfy the more-likely-than-not recognition threshold, no tax benefits are recorded. The Company has uncertain tax positions related to its Canadian operations that are subject to an indemnification from HC.
14. Commitments and contingencies
As of December 31, 2015, the Company had outstanding surety bonds in the amount of $121.3 million to secure performance commitments. The Company also had letters of credit outstanding of $15.8 million with no amounts withdrawn as of December 31, 2015.
The Company is involved in legal proceedings and litigation in the ordinary course of business. In the opinion of management, the outcome of such matters will not have a material adverse effect on the Company’s combined financial position, results of operations, or liquidity. Other than routine litigation incidental to the Company’s business, there are no material legal proceedings to which the Company is a party or to which any of the Company’s properties are subject.
In connection with the Earn-out contingency described in Note 3, the Acquisition included contingent consideration of up to $100.0 million if and to the extent the 2015 financial results of the businesses acquired by Lone Star in the Acquisition, including the Company and Forterra UK, exceeded a specified Adjusted EBITDA target for fiscal year 2015, as calculated pursuant to the terms of the purchase agreement. If such Adjusted EBITDA calculation exceeds the specified target, LSF9, and therefore, Forterra would be required to pay HC an amount equal to a multiple of such excess Adjusted EBITDA, with any payment capped at $100.0 million. In April 2016, the Company provided an earn-out statement to HC demonstrating that no payment was required. On June 13, 2016, HC provided notification that it is disputing, among other things, the Company’s calculation of Adjusted EBITDA under the purchase agreement and asserting that a payment should be made in the amount of $100.0 million. The Company does not believe HC’s position has merit and intends to vigorously oppose HC’s assertions. As of December 31, 2015, no liability for this contingency has been accrued as payment of any earn-out is not considered probable. However, the outcome of this matter is uncertain, and no assurance can be given to the ultimate outcome of the resulting proceedings. If LSF9 is unsuccessful in resolving the dispute, the Company could recognize a material charge to its earnings.
FORTERRA BUILDING PRODUCTS
Notes to Combined Financial Statements
(USD in thousands, unless stated otherwise)
Operating leases
The Company leases certain property and equipment for various periods under non-cancelable operating leases. Future minimum lease payments under such agreements as of December 31, 2015 were approximately:
2016 | $ | 2,691 | ||
2017 | 2,061 | |||
2018 | 1,707 | |||
2019 | 775 | |||
2020 | 526 | |||
Thereafter | 2,504 | |||
|
| |||
| $ | 10,264 | |||
|
|
Long-term incentive plan
Following the Acquisition the Company implemented a cash-based long term incentive plan (the “LTIP”), which entitles the participants in the LTIP a potential cash payout upon a monetization event as defined by the LTIP. Potential monetization events include the sale of the Company, an initial public offering where Lone Star reduces its ownership interest in the Company below 50% or at Lone Star’s discretion, or through certain cash distribution as defined in the LTIP. Before the payout of any cash the LTIP requires Lone Star receive a return of their investment plus a specified internal rate of return, which is calculated by comparing the return to Lone Star over the timeline of the investment in the Company. As of December 31, 2015, no such monetization events had occurred, and therefore no amounts were accrued in the accompanying combined balance sheet as of December 31, 2015. The Company is contemplating an initial public offering as early as the third quarter of 2016, but the initial public offering is not expected to reach the required return on investment to trigger a payout under the LTIP.
Asset retirement obligations (ARO)
The Company incurs reclamation obligations as part of its brick production processes. The Company recognizes the present value of the fair value of a legally enforceable liability representing an asset retirement obligation in the period in which it is incurred. Accretion of the liability is recorded in other operating income. It also recognizes an asset representing the anticipated costs of dismantling machinery and equipment (“tear-down” costs) and depreciates the asset over the remaining life of the equipment. The Company recorded the following ARO liabilities as of December 31, 2015 and 2014:
| Successor | Predecessor | |||||||
| December 31, 2015 | December 31, 2014 | |||||||
Beginning balance | $ | 1,885 | $ | 1,515 | ||||
Reclamation adjustment | 24 | 170 | ||||||
FV adjustment | (139 | ) | — | |||||
Locations sold | (248 | ) | — | |||||
Spend | (262 | ) | — | |||||
Accretion | 93 | 200 | ||||||
|
|
|
| |||||
Ending balance | $ | 1,353 | $ | 1,885 | ||||
Current portion | (415 | ) | (248 | ) | ||||
|
|
|
| |||||
Long-term portion | $ | 938 | $ | 1,637 | ||||
|
|
|
| |||||
FORTERRA BUILDING PRODUCTS
Notes to Combined Financial Statements
(USD in thousands, unless stated otherwise)
15. Related party transactions
Predecessor
Parent company net investment
During the Predecessor period the combined Predecessor financial statements for the Company are based on the accounting records of HC. Within these records, each subsidiary of BP has its own equity accounts in the books and records, as well as intercompany balances due (to)/from affiliates and operations within HC. These intercompany balances are considered by HC as part of the capital structure of these entities and are not regularly settled in cash with the affiliate counterparties. Therefore, these intercompany balances act as clearing accounts between the parties and consist of the accumulated net transactions between the Company and other entities and operations of HC and may include both operating items (allocated expenses and purchases of services and materials) and equity items (transfers of assets, cash and dividends). The Company has recorded all such equity and intercompany balances in a single caption, Parent company net investment.
The following table presents the components of net transfers to Parent for the period from January 1, 2015 to March 13, 2015 and for the years ended December 31, 2014 and 2013 were as follows:
Net transfer category | 2015 | 2014 | 2013 | |||||||||
Cash clearing and other financing activities | $ | 64,280 | $ | 3,092 | $ | 486 | ||||||
Corporate allocations | (4,112 | ) | (23,576 | ) | (29,373 | ) | ||||||
Contribution of net assets to Parent | — | (32,459 | ) | — | ||||||||
Current income taxes – federal and state | 742 | (3,133 | ) | (2,561 | ) | |||||||
|
|
|
|
|
| |||||||
| $ | 60,910 | $ | (56,076 | ) | $ | (31,448 | ) | |||||
|
|
|
|
|
| |||||||
Allocated expenses
The Company was allocated selling, general and administrative expenses from the Parent for certain shared services of $4,112, $23,576 and $29,373 for the period from January 1, 2015 to March 13, 2015 and for the years ended December 31, 2014 and 2013, respectively. The allocated costs are included in costs of goods sold or selling, general and administrative expenses in the combined Predecessor statements of operations. The historical costs and expenses reflected in our combined financial statements include an allocation for certain corporate functions historically provided by HC or its wholly-owned subsidiaries. Substantially all of the Predecessor’s senior management was employed by HC and certain functions critical to the Predecessor’s operations were centralized and managed by HC. Historically, the centralized functions have included executive senior management, financial reporting, financial planning and analysis, accounting, shared services, information technology, tax, risk management, treasury, legal, human resources, land management and strategy and development. Additionally, the Company temporarily rented office space provided by affiliates of HC. The cost of each of these services has been allocated to the Predecessor on the basis of the Predecessor’s relative net sales or head count as compared to that of HC depending upon which allocation methodology is more meaningful for each service. The Company and HC believe that these allocations reasonably reflect the utilization of services provided and benefits received by the Predecessor. However, these amounts are not necessarily representative of the amounts that would have been incurred by the Predecessor as a separate entity.
FORTERRA BUILDING PRODUCTS
Notes to Combined Financial Statements
(USD in thousands, unless stated otherwise)
Successor
Contributed capital
The initial contributed capital of LSF9 allocated to the Company was $167.5 million at the date of the Acquisition. During the period from March 14, 2015 to December 31, 2015, the Company paid certain transaction and other costs for affiliates that are recorded as distributions in these financial statements. Likewise, an affiliate not included in these financial statements paid $14.9 million of interest on behalf of the Company. The above activity is recorded net as a return of contributed capital of $27,613 in these financial statements.
Transition Services Agreement (“TSA”)
The Company is no longer part of HC and its affiliates, but did have a Transition Services Agreement with HC providing for corporate overhead services. Per the TSA, the services are to be provided to the Successor for a period of up to 18 months, and may be terminated at will with proper notice by the Successor. The initial services provided primarily consisted of certain accounting, information technology, human resources, and other general and administrative services associated with the Successor’s transition to a stand-alone company.
Cement Supply Agreement
The Company entered into an agreement with HC and its affiliates for the continued supply of cement, in which the Company agreed to source a minimum percentage of such materials consumed at prevailing market prices as defined in the agreements.
Hudson Advisors
The Company has an advisory agreement with Hudson Advisors, an affiliate of Lone Star, to provide certain management oversight services to the Company, including assistance and advice on strategic plans, obtaining and maintaining certain legal documents, and communicating and coordinating with service providers. The Company incurred fees totaling $9,151 for the period March 14 through December 31, 2015 for these services included in selling, general and administrative costs on the combined Successor statement of operations. For fiscal year 2014 and 2013, no services were provided.
Related party payables and activity
The Predecessor had net payables to affiliates totaling $0.7 million at December 31, 2014 that were net settled in consummation of the Acquisition. At December 31, 2015, the Successor has payables to affiliates totaling $3.2 million that are regularly settled in cash. Purchases of raw materials from affiliates of the Predecessor for the years ended December 31, 2014 and 2013 were $45.4 million and $47.2 million, respectively.
16. Segment reporting
During the Successor period in 2015, the Company realigned its business segment reporting structure as a result of the change in the Chief Operating Decision Maker (“CODM”). The segment data below reflects business segment information as managed by the Successor, and comparative financial data for the historical periods of the Predecessor have been presented to conform to the current segment structure. The accounting policies for our segments follow the Company’s accounting policies.
FORTERRA BUILDING PRODUCTS
Notes to Combined Financial Statements
(USD in thousands, unless stated otherwise)
Segment information is presented in accordance with ASC 280,Segment Reporting (“ASC 280”), which establishes standards for reporting information about operating segments. It also establishes standards for related disclosures about products and geographic areas. Operating segments are defined as components of an enterprise that engage in business activities that earn revenues, incur expenses and prepare separate financial information that is evaluated regularly by the Company’s chief operating decision maker in order to allocate resources and assess performance. The Corporate and Other segment includes expenses related to certain executive salaries, interest costs related to long-term debt, acquisition related costs, and other corporate costs that are not directly attributable to our operating segments.
Net sales from the major products sold to external customers include drainage pipe and precast products, concrete and steel water transmission pipe, and clay bricks and concrete blocks.
The Company’s two geographic areas consist of the United States and Canada for which it reports net sales, fixed assets and total assets. For purposes of evaluating segment profit, the CODM reviews EBITDA as a basis for making the decisions to allocate resources and assess performance.
FORTERRA BUILDING PRODUCTS
Notes to Combined Financial Statements
(USD in thousands, unless stated otherwise)
The following tables set forth reportable segment information of the Company with respect to net sales and other financial information attributable to our reportable segments for the period from March 14, 2015 to December 31, 2015, for the period from January 1, 2015 to March 13, 2015 and for the years ended December 31, 2014 and 2013:
Successor For the period March 14 - December 31, 2015: | Drainage Pipe & Products | Water Pipe & Products | Bricks | Corporate and Other | Total | |||||||||||||||
Net sales | $ | 431,723 | $ | 167,417 | $ | 118,389 | $ | 5,135 | $ | 722,664 | ||||||||||
Income (loss) from continuing operations before income taxes | 48,216 | 6,824 | (8,401 | ) | (123,647 | ) | (77,008 | ) | ||||||||||||
Depreciation and amortization | 16,792 | 7,944 | 7,680 | 514 | 32,930 | |||||||||||||||
Interest (income)/expense | (5 | ) | — | 181 | 45,777 | 45,953 | ||||||||||||||
|
|
|
|
|
|
|
|
|
| |||||||||||
EBITDA | $ | 65,003 | $ | 14,768 | $ | (540 | ) | $ | (77,356 | ) | $ | 1,875 | ||||||||
|
|
|
|
|
|
|
|
|
| |||||||||||
Capital expenditures | $ | 10,648 | $ | 4,719 | $ | 4,677 | $ | — | $ | 20,044 | ||||||||||
|
|
|
|
|
|
|
|
|
| |||||||||||
Total assets as of December 31, 2015 | $ | 626,477 | $ | 136,909 | $ | 147,699 | $ | 27,790 | $ | 938,875 | ||||||||||
|
|
|
|
|
|
|
|
|
| |||||||||||
Predecessor For the period January 1 - March 13, 2015: | Drainage Pipe & Products | Water Pipe & Products | Bricks | Corporate and Other | Total | |||||||||||||||
Net sales | $ | 79,341 | $ | 30,464 | $ | 19,922 | $ | 2,893 | $ | 132,620 | ||||||||||
Income (loss) from continuing operations before income taxes | 8,839 | (3,192 | ) | (4,000 | ) | (8,145 | ) | (6,498 | ) | |||||||||||
Depreciation and amortization | 3,231 | 1,030 | 2,505 | 128 | 6,894 | |||||||||||||||
Interest (income)/expense | — | — | 18 | 66 | 84 | |||||||||||||||
|
|
|
|
|
|
|
|
|
| |||||||||||
EBITDA | $ | 12,070 | $ | (2,162 | ) | $ | (1,477 | ) | $ | (7,951 | ) | $ | 480 | |||||||
|
|
|
|
|
|
|
|
|
| |||||||||||
Capital expenditures | $ | 621 | $ | 1,851 | $ | 272 | $ | — | $ | 2,744 | ||||||||||
|
|
|
|
|
|
|
|
|
| |||||||||||
| For the year ended December 31, 2014: | Drainage Pipe & Products | Water Pipe & Products | Bricks | Corporate and Other | Total | |||||||||||||||
Net sales | $ | 436,754 | $ | 149,864 | $ | 139,537 | $ | 10,808 | $ | 736,963 | ||||||||||
Income (loss) from continuing operations before income taxes | 64,686 | 6,412 | (2,078 | ) | (59,015 | ) | 10,005 | |||||||||||||
Depreciation and amortization | 16,011 | 4,968 | 12,981 | 2,645 | 36,605 | |||||||||||||||
Interest (income)/expense | — | — | — | — | — | |||||||||||||||
|
|
|
|
|
|
|
|
|
| |||||||||||
EBITDA | $ | 80,697 | $ | 11,380 | $ | 10,903 | $ | (56,370 | ) | $ | 46,610 | |||||||||
|
|
|
|
|
|
|
|
|
| |||||||||||
Capital expenditures | $ | 7,386 | $ | 13,403 | $ | 4,505 | $ | — | $ | 25,294 | ||||||||||
|
|
|
|
|
|
|
|
|
| |||||||||||
Total assets as of December 31, 2014 | $ | 455,050 | $ | 188,889 | $ | 190,591 | $ | 11,638 | $ | 846,168 | ||||||||||
|
|
|
|
|
|
|
|
|
| |||||||||||
FORTERRA BUILDING PRODUCTS
Notes to Combined Financial Statements
(USD in thousands, unless stated otherwise)
| For the year ended December 31, 2013: | Drainage Pipe & Products | Water Pipe & Products | Bricks | Corporate and Other | Total | |||||||||||||||
Net sales | $ | 372,060 | $ | 171,773 | $ | 145,500 | $ | 8,615 | $ | 697,948 | ||||||||||
Income (loss) from continuing operations before income taxes | 10,937 | (218,555 | ) | 2,594 | (36,695 | ) | (241,719 | ) | ||||||||||||
Depreciation and amortization | 17,396 | 4,929 | 14,163 | 2,072 | 38,560 | |||||||||||||||
Interest (income)/expense | — | — | — | — | — | |||||||||||||||
|
|
|
|
|
|
|
|
|
| |||||||||||
EBITDA | $ | 28,333 | $ | (213,626 | ) | $ | 16,757 | $ | (34,623 | ) | $ | (203,159 | ) | |||||||
|
|
|
|
|
|
|
|
|
| |||||||||||
Capital expenditures | $ | 3,263 | $ | 4,279 | $ | 2,889 | $ | 136 | $ | 10,567 | ||||||||||
|
|
|
|
|
|
|
|
|
| |||||||||||
The Water Pipe & Products segment net loss of $218,903 for the year ended December 31, 2013 is inclusive of $248,650 of impairment charges to property, plant and equipment, and goodwill.
In addition, the Company also has an investment in an equity method investee included in the following segment:
| Successor | Predecessor | |||||||
| At December 31, 2015 | At December 31, 2014 | |||||||
Drainage Pipe & Products | $ | 56,289 | $ | 47,452 | ||||
|
|
|
| |||||
The Company is also required by ASC 280 to disclose additional information related to geographic location. The Company has operations in both the United States and Canada. The Company has both property, plant and equipment and net sales in each country and those property, plant and equipment and net sales are recorded within each applicable geographic location as follows:
| Property, plant and equipment | ||||||||||||
| Successor | Predecessor | |||||||||||
| December 31, 2015 | December 31, 2014 | December 31, 2013 | ||||||||||
United States | $ | 305,843 | $ | 289,781 | $ | 308,223 | ||||||
Canada | 83,081 | 124,292 | 140,927 | |||||||||
|
|
|
|
|
| |||||||
| $ | 388,924 | $ | 414,073 | $ | 449,150 | |||||||
|
|
|
|
|
| |||||||
| Net Sales | ||||||||||||||||
| Successor | Predecessor | |||||||||||||||
| For the period from March 14 to December 31, | For the period from January 1 to March 13, | Years ended December 31, | ||||||||||||||
| 2015 | 2015 | 2014 | 2013 | |||||||||||||
United States | $ | 585,809 | $ | 112,299 | $ | 592,959 | $ | 559,169 | ||||||||
Canada | 136,855 | 20,321 | 144,004 | 138,779 | ||||||||||||
|
|
|
|
|
|
|
| |||||||||
| $ | 722,664 | $ | 132,620 | $ | 736,963 | $ | 697,948 | |||||||||
|
|
|
|
|
|
|
| |||||||||
FORTERRA BUILDING PRODUCTS
Notes to Combined Financial Statements
(USD in thousands, unless stated otherwise)
17. Discontinued operations and assets held for sale
In the Predecessor periods, certain plants and facilities were determined to be outside of the scope of the Acquisition, and as such were presented as held for sale on the combined balance sheets and discontinued operations on the combined statements of operations. As of September 30, 2014, the Company distributed $16,421 representing the net assets of the Maple Grove structural precast manufacturing business (“Maple Grove”) in the United States to HC. HC sold Maple Grove to a third party on October 31, 2014; therefore, the results of Maple Grove operations through September 30, 2014 and for the years ended December 31, 2014 and 2013 are reflected as discontinued operations. Cash flows relating to all plants that met the ASC 360 criteria for held for sale classification as of December 31, 2014 are included in discontinued operations.
The following table shows the components of discontinued operations for the years ended December 31, 2014 and 2013:
| Predecessor | ||||||||
| December 31, | ||||||||
| 2014 | 2013 | |||||||
Revenues | $ | 34,824 | $ | 35,079 | ||||
|
|
|
| |||||
Gain (loss) from operations of discontinued operations before income tax | 1,976 | (2,844 | ) | |||||
Gain (loss) on disposal of discontinued operations | — | (174 | ) | |||||
Income tax benefit (expense) from discontinued operations | (716 | ) | — | |||||
|
|
|
| |||||
Gain (loss) on discontinued operations, net of tax | $ | 1,260 | $ | (3,018 | ) | |||
|
|
|
| |||||
Cash flows relating to all plants that met the ASC 360 criteria for held for sale classification as of December 31, 2013 are included in discontinued operations for all periods presented if those plants were part of a component that was disposed of during the second quarterperiods presented.
In 2013, the Company sold its roof tile business in the western region of 2016.the United States for total proceeds of $1,847, resulting in a loss of $174. The Company no longer operates a roof tile business in the western region of the United States.
18. Impairment and restructuring charges
Forterra, Inc.The Company recorded impairment and restructuring charges for the period from March 1, 2015 to December 31, 2015, for the period from January 1, 2015 to March 13, 2015 and for the years ended December 31, 2014 and 2013 as follows:
| Successor | Predecessor | |||||||||||||||
| For the period from March 14 to December 31, | For the period from January 1 to March 13, | For the years ended December 31, | ||||||||||||||
| 2015 | 2015 | 2014 | 2013 | |||||||||||||
Impairment of property, plant and equipment (Note 6) | $ | 1,088 | $ | 27 | $ | 3,977 | $ | 12,011 | ||||||||
Restructuring charges | 97 | 515 | 242 | 1,927 | ||||||||||||
Impairment of goodwill and other intangibles (Note 7) | — | — | — | 236,639 | ||||||||||||
|
|
|
|
|
|
|
| |||||||||
| $ | 1,185 | $ | 542 | $ | 4,219 | $ | 250,577 | |||||||||
|
|
|
|
|
|
|
| |||||||||
FORTERRA BUILDING PRODUCTS
Notes to Combined Financial Statements
(USD in thousands, unless stated otherwise)
Balance Sheet at June 21, 2016 (inception)
19. Investments in equity method investee
ReportOn July 20, 2012, the Company entered into a joint venture agreement with a company that produces concrete pipe and precast to form Concrete Pipe & Precast LLC (“CP&P”). The Company contributed plant assets and related inventory from nine operating locations as part of Independent Registered Public Accounting Firmthe agreement to form CP&P and in return for the contribution the Company obtained a 50% ownership stake in the joint venture through its 500 Common Unit voting shares in CP&P. The Company owns 50% of CP&P voting common stock. The Company also received 150 preferred units redeemable for $100 each, or a $15,000 preferred interest in CP&P, for which the Company received a preferred return of $209 and $437 during 2014 and 2013, respectively, which is included in other income in the combined statements of operations.
The Company has recorded its investment in the Common Unit voting shares in accordance with ASC 323,Investments–Equity
The Board of Directors and Management
LSF9 Concrete Holdings, Ltd.
We have audited the accompanying combined balance sheets of Forterra Building Products (the Successor) as of December 31, 2015, and the related combined statements of operations, comprehensive loss, shareholder’s equity and cash flows for the period from March 14, 2015 to December 31, 2015. We have also audited the accompanying combined balance sheets of the North American building products operations of HeidelbergCement A.G. (the Predecessor) as of December 31, 2014 and the related combined statements of operations, comprehensive loss, parent company net investment and cash flows for the period from January 1, 2015 to March 13, 2015 and for each of the two years in the period ended December 31, 2014. These financial statements are the responsibility of the Company’s management. Our responsibility is to express an opinion on these financial statements based on our audits.
We conducted our audits in accordance with the standards of the Public Company Accounting Oversight Board (United States). Those standards require that we plan and perform the audit to obtain reasonable assurance about whether the financial statements are free of material misstatement. We were not engaged to perform an audit of the Company’s internal control over financial reporting. Our audits included consideration of internal control over financial reporting as a basis for designing audit procedures that are appropriate in the circumstances, but not for the purpose of expressing an opinion on the effectiveness of the Company’s internal control over financial reporting. Accordingly, we express no such opinion. An audit also includes examining, on a test basis, evidence supporting the amounts and disclosures in the financial statements, assessing the accounting principles used and significant estimates made by management, and evaluating the overall financial statement presentation. We believe that our audits provide a reasonable basis for our opinion.
In our opinion, the financial statements referred to above present fairly, in all material respects, the combined financial position of Forterra Building Products at December 31, 2015, and the combined results of its operations and its cash flows for the period from March 14, 2015 to December 31, 2015, in conformity with U.S. generally accepted accounting principles. Also in our opinion, the Predecessor financial statements referred to above present fairly in all material respects, the combined financial position of the Predecessor at December 31, 2014 and the combined results of its operations and cash flows for the period from January 1, 2015 to March 13, 2015 and each of the two years in the period ended December 31, 2014, in conformity with U.S. generally accepted accounting principles.
/s/ Ernst & Young LLP
Dallas, Texas
July 8, 2016
Combined Statements of Operations
(In $US thousands)
| Successor | Predecessor | |||||||||||||||
| For the period from March 14 to December 31, | For the period from January 1 to March 13, | Years ended December 31, | ||||||||||||||
| 2015 | 2015 | 2014 | 2013 | |||||||||||||
Net sales | $ | 722,664 | $ | 132,620 | $ | 736,963 | $ | 697,948 | ||||||||
Cost of goods sold | 626,498 | 117,831 | 631,454 | 611,660 | ||||||||||||
|
|
|
|
|
|
|
| |||||||||
Gross profit | 96,166 | 14,789 | 105,509 | 86,288 | ||||||||||||
Selling, general & administrative expenses | (134,971 | ) | (21,683 | ) | (102,107 | ) | (87,393 | ) | ||||||||
Impairment and restructuring charges | (1,185 | ) | (542 | ) | (4,219 | ) | (250,577 | ) | ||||||||
Earnings from equity method investee | 8,429 | 67 | 4,451 | (216 | ) | |||||||||||
Gain (loss) on sale of property, plant and equipment and business, net | (618 | ) | 122 | 2,329 | 3,998 | |||||||||||
Other operating income | 1,450 | 872 | 4,636 | 5,234 | ||||||||||||
|
|
|
|
|
|
|
| |||||||||
| (126,895 | ) | (21,164 | ) | (94,910 | ) | (328,954 | ) | |||||||||
|
|
|
|
|
|
|
| |||||||||
Income (loss) from operations | (30,729 | ) | (6,375 | ) | 10,599 | (242,666 | ) | |||||||||
Other income (expenses) | ||||||||||||||||
Interest expense | (45,953 | ) | (84 | ) | — | — | ||||||||||
Other income (expense), net | (326 | ) | (39 | ) | (594 | ) | 947 | |||||||||
|
|
|
|
|
|
|
| |||||||||
Income (loss) from continuing operations before income taxes | (77,008 | ) | (6,498 | ) | 10,005 | (241,719 | ) | |||||||||
Income tax (expense) benefit | (5,778 | ) | 742 | (2,417 | ) | (2,561 | ) | |||||||||
|
|
|
|
|
|
|
| |||||||||
Income (loss) from continuing operations | (82,786 | ) | (5,756 | ) | 7,588 | (244,280 | ) | |||||||||
|
|
|
|
|
|
|
| |||||||||
Discontinued operations | ||||||||||||||||
Income (loss) from discontinued operations (including gain (loss) on disposal of $0, and $174, respectively) | — | — | 1,976 | (3,018 | ) | |||||||||||
Income tax benefit (expense) from discontinued operations | — | — | (716 | ) | — | |||||||||||
|
|
|
|
|
|
|
| |||||||||
Gain (loss) on discontinued operations, net of income tax | — | — | 1,260 | (3,018 | ) | |||||||||||
|
|
|
|
|
|
|
| |||||||||
Net income (loss) | $ | (82,786 | ) | $ | (5,756 | ) | $ | 8,848 | $ | (247,298 | ) | |||||
|
|
|
|
|
|
|
| |||||||||
See accompanying notes to the combined financial statements
Combined Statements of Comprehensive Loss
(USD in thousands)
| Successor | Predecessor | |||||||||||||||
| For the period from March 14 to December 31, | For the period from January 1 to March 13, | For the year ended December 31, | ||||||||||||||
| 2015 | 2015 | 2014 | 2013 | |||||||||||||
Net income (loss) | $ | (82,786 | ) | $ | (5,756 | ) | $ | 8,848 | $ | (247,298 | ) | |||||
Gains on derivative transactions, net of tax | 1,549 | — | — | — | ||||||||||||
Actuarial gains on defined benefit plans, net of tax | — | 2,645 | (2,032 | ) | 4,118 | |||||||||||
Foreign currency translation adjustment | (6,317 | ) | (19,751 | ) | (20,127 | ) | (16,717 | ) | ||||||||
|
|
|
|
|
|
|
| |||||||||
Comprehensive loss | $ | (87,554 | ) | $ | (22,862 | ) | $ | (13,311 | ) | $ | (259,897 | ) | ||||
|
|
|
|
|
|
|
| |||||||||
See accompanying notes to the combined financial statements
(USD in thousands)
| Successor | Predecessor | |||||||
| December 31, 2015 | December 31, 2014 | |||||||
ASSETS | ||||||||
Current assets | ||||||||
Cash and cash equivalents | $ | 43,590 | $ | 42 | ||||
Receivables, net | 118,959 | 109,049 | ||||||
Inventories | 210,615 | 190,496 | ||||||
Other current assets | 2,844 | 652 | ||||||
|
|
|
| |||||
Total current assets | 376,008 | 300,239 | ||||||
|
|
|
| |||||
Non-current assets | ||||||||
Property, plant and equipment, net | 388,924 | 414,073 | ||||||
Goodwill | 75,537 | 83,674 | ||||||
Other intangible assets, net | 26,062 | — | ||||||
Investment in equity method investee | 56,289 | 47,452 | ||||||
Deferred tax asset | 3,087 | — | ||||||
Derivative assets | 9,093 | — | ||||||
Other long term assets | 3,875 | 730 | ||||||
|
|
|
| |||||
Total assets | $ | 938,875 | $ | 846,168 | ||||
|
|
|
| |||||
LIABILITIES AND EQUITY | ||||||||
Current liabilities | ||||||||
Trade payables | $ | 96,486 | $ | 73,508 | ||||
Accrued liabilities | 55,628 | 50,412 | ||||||
Deferred revenue | 19,498 | 11,935 | ||||||
Current portion of long term debt | 2,191 | — | ||||||
Employee benefit obligations | — | 309 | ||||||
Capital lease liability | — | 19 | ||||||
|
|
|
| |||||
Total current liabilities | 173,803 | 136,183 | ||||||
|
|
|
| |||||
Non-current liabilities | ||||||||
Employee benefit obligations | — | 13,012 | ||||||
Deferred tax liability | 2,365 | 7,115 | ||||||
Senior Term Loan | 467,192 | — | ||||||
Junior Term Loan | 236,446 | — | ||||||
Other long term liabilities | 6,754 | 32,385 | ||||||
|
|
|
| |||||
Total liabilities | 886,560 | 188,695 | ||||||
Commitments and Contingencies (Note 14) | ||||||||
Equity | ||||||||
Accumulated other comprehensive loss | — | (21,189 | ) | |||||
Accumulated net contributions from parent | — | 678,662 | ||||||
|
|
|
| |||||
Total parent company net investment | — | 657,473 | ||||||
|
|
|
| |||||
Contributed capital | 139,869 | — | ||||||
Accumulated other comprehensive loss | (4,768 | ) | — | |||||
Retained deficit | (82,786 | ) | — | |||||
|
|
|
| |||||
Total shareholder’s equity | 52,315 | — | ||||||
|
|
|
| |||||
Total liabilities and equity | $ | 938,875 | $ | 846,168 | ||||
|
|
|
| |||||
See accompanying notes to the combined financial statements
Combined Statements of Shareholder’s Equity and Parent Company Net Investment
(USD in thousands)
Predecessor | Accumulated Net Contributions from Parent | Accumulated Other Comprehensive Income (Loss) | Total Parent Company Net Investment | |||||||||
Balance at January 1, 2013 | $ | 1,004,636 | $ | 13,569 | $ | 1,018,205 | ||||||
Net loss | (247,298 | ) | — | (247,298 | ) | |||||||
Actuarial gains (losses) on defined benefit plans, net of tax | — | 4,118 | 4,118 | |||||||||
Foreign currency translation adjustment | — | (16,717 | ) | (16,717 | ) | |||||||
Net transfers (to)/from Parent | (31,448 | ) | — | (31,448 | ) | |||||||
|
|
|
|
|
| |||||||
Balance at December 31, 2013 | 725,890 | 970 | 726,860 | |||||||||
|
|
|
|
|
| |||||||
Net income | 8,848 | — | 8,848 | |||||||||
Actuarial gains (losses) on defined benefit plans, net of tax | — | (2,032 | ) | (2,032 | ) | |||||||
Foreign currency translation adjustment | — | (20,127 | ) | (20,127 | ) | |||||||
Net transfers (to)/from Parent | (56,076 | ) | — | (56,076 | ) | |||||||
|
|
|
|
|
| |||||||
Balance at December 31, 2014 | 678,662 | (21,189 | ) | 657,473 | ||||||||
|
|
|
|
|
| |||||||
Net loss | (5,756 | ) | — | (5,756 | ) | |||||||
Actuarial gains (losses) on defined benefit plans, net of tax | — | 2,645 | 2,645 | |||||||||
Foreign currency translation adjustment | — | (19,751 | ) | (19,751 | ) | |||||||
Net transfers (to)/from Parent | 60,910 | — | 60,910 | |||||||||
|
|
|
|
|
| |||||||
Balance at March 13, 2015 | $ | 733,816 | $ | (38,295 | ) | $ | 695,521 | |||||
|
|
|
|
|
| |||||||
Successor | Contributed Capital | Accumulated Other Comprehensive Income (Loss) | Retained Deficit | Total Shareholders’ Equity | ||||||||||||
Balance at March 14, 2015 | $ | — | $ | — | $ | — | $ | — | ||||||||
Initial capital contribution from parent | 167,482 | — | — | 167,482 | ||||||||||||
Return of contributed capital, net | (27,613 | ) | — | — | (27,613 | ) | ||||||||||
Net loss | — | — | (82,786 | ) | (82,786 | ) | ||||||||||
Gains on derivative transactions, net of tax | — | 1,549 | — | 1,549 | ||||||||||||
Foreign currency translation adjustment | — | (6,317 | ) | — | (6,317 | ) | ||||||||||
|
|
|
|
|
|
|
| |||||||||
Balance at December 31, 2015 | $ | 139,869 | $ | (4,768 | ) | $ | (82,786 | ) | $ | 52,315 | ||||||
|
|
|
|
|
|
|
| |||||||||
See accompanying notes to the combined financial statements
Combined Statements of Cash Flows
(USD in thousands)
| Successor | Predecessor | |||||||||||||||
| For the period from March 14 to December 31, | For the period from January 1 to March 13, | For the year ended December 31, | ||||||||||||||
| 2015 | 2015 | 2014 | 2013 | |||||||||||||
CASH FLOWS FROM OPERATING ACTIVITIES | ||||||||||||||||
Net income (loss) | $ | (82,786 | ) | $ | (5,756 | ) | $ | 8,848 | $ | (247,298 | ) | |||||
Reconciliation of net income (loss) to net cash provided by operating activities: | ||||||||||||||||
Depreciation & amortization expense | 32,930 | 6,894 | 36,605 | 38,560 | ||||||||||||
Loss (gain) on disposal of property, plant and equipment | 618 | (122 | ) | (2,329 | ) | (3,832 | ) | |||||||||
Amortization of debt discount and issuance costs | 5,085 | — | — | — | ||||||||||||
Impairment on property, plant, and equipment and goodwill | 1,088 | 27 | 3,977 | 248,650 | ||||||||||||
Earnings from equity method investee | (8,429 | ) | (67 | ) | (4,451 | ) | 216 | |||||||||
Distributions from equity method investee | 8,542 | — | 3,000 | — | ||||||||||||
Unrealized foreign currency gains, net | (1,391 | ) | (26 | ) | — | — | ||||||||||
Provision (recoveries) for doubtful accounts | 1,377 | (31 | ) | (786 | ) | 2,760 | ||||||||||
Deferred taxes | (3,138 | ) | 2,749 | 618 | (2,671 | ) | ||||||||||
Deferred rent | 1,279 | — | — | — | ||||||||||||
Other non-cash items | (13 | ) | (1,736 | ) | 717 | 1,372 | ||||||||||
Change in assets and liabilities: | ||||||||||||||||
Receivables, net | 28,900 | (7,520 | ) | (9,473 | ) | 14,762 | ||||||||||
Related party receivables | — | — | 617 | (504 | ) | |||||||||||
Inventories | 59,506 | (20,160 | ) | (31,395 | ) | 5,961 | ||||||||||
Other current assets | (2,153 | ) | (855 | ) | 512 | 1,685 | ||||||||||
Trade payable and accrued liabilities | 72,422 | (20,119 | ) | 12,822 | (7,288 | ) | ||||||||||
Deferred revenue | 7,420 | (1,068 | ) | 5,911 | (20,142 | ) | ||||||||||
Capital lease liability | — | — | — | (252 | ) | |||||||||||
Employee benefit obligations | — | (498 | ) | 209 | (1,480 | ) | ||||||||||
Other long-term assets & liabilities | 160 | 64 | 516 | 1,187 | ||||||||||||
|
|
|
|
|
|
|
| |||||||||
NET CASH PROVIDED BY (USED IN) OPERATING ACTIVITIES | 121,417 | (48,224 | ) | 25,918 | 31,686 | |||||||||||
|
|
|
|
|
|
|
| |||||||||
CASH FLOWS FROM INVESTING ACTIVITIES | ||||||||||||||||
Purchase of property, plant and equipment | (14,705 | ) | (2,762 | ) | (22,792 | ) | (10,497 | ) | ||||||||
Proceeds from the sale of long-term assets | 2,194 | — | 5,891 | 10,442 | ||||||||||||
Distribution of preferred investment from equity method investee | — | — | 15,000 | — | ||||||||||||
Assets and liabilities acquired, Cretex, net | (245,100 | ) | — | — | — | |||||||||||
Assets and liabilities acquired from HeidelbergCement, net | (640,428 | ) | — | — | — | |||||||||||
|
|
|
|
|
|
|
| |||||||||
NET CASH USED IN INVESTING ACTIVITIES | (898,039 | ) | (2,762 | ) | (1,901 | ) | (55 | ) | ||||||||
|
|
|
|
|
|
|
| |||||||||
CASH FLOWS FROM FINANCING ACTIVITIES | ||||||||||||||||
Payments on notes payable | — | — | — | (153 | ) | |||||||||||
Payments on capital leases | (17 | ) | (3 | ) | (373 | ) | (35 | ) | ||||||||
Payment of debt issuance costs | (27,410 | ) | — | — | — | |||||||||||
Proceeds from Senior Term Loan, net of discount | 486,104 | — | — | — | ||||||||||||
Proceeds from Junior Term Loan, net of discount | 244,300 | — | — | — | ||||||||||||
Proceeds from Revolver, net of discount | 45,619 | — | — | — | ||||||||||||
Payments on Revolver | (45,619 | ) | — | — | — | |||||||||||
Payments on Senior Term Loan | (5,366 | ) | — | — | — | |||||||||||
Capital contribution from (distributions to) Predecessor Parent, net | — | 60,910 | (23,617 | ) | (31,448 | ) | ||||||||||
Capital contribution from parent | 167,482 | — | — | — | ||||||||||||
Payments for return of contributed capital | (42,513 | ) | — | — | — | |||||||||||
|
|
|
|
|
|
|
| |||||||||
NET CASH PROVIDED BY (USED IN) FINANCING ACTIVITIES | 822,580 | 60,907 | (23,990 | ) | (31,636 | ) | ||||||||||
Effect of exchange rate changes on cash | (2,368 | ) | (130 | ) | 10 | |||||||||||
|
|
|
|
|
|
|
| |||||||||
Net change in cash and cash equivalents | 43,590 | 9,791 | 37 | (5 | ) | |||||||||||
Cash and cash equivalents balance, beginning of period | — | 42 | 5 | 10 | ||||||||||||
|
|
|
|
|
|
|
| |||||||||
Cash and cash equivalents balance, end of period | $ | 43,590 | $ | 9,833 | $ | 42 | $ | 5 | ||||||||
|
|
|
|
|
|
|
| |||||||||
SUPPLEMENTAL DISCLOSURES: | ||||||||||||||||
Cash interest paid | $ | 25,379 | $ | — | $ | — | $ | — | ||||||||
SUPPLEMENTAL NONCASH INVESTING AND FINANCING DISCLOSURES: | ||||||||||||||||
Fair value changes of derivative instruments recorded in OCI, net of tax | $ | 1,549 | $ | — | $ | — | $ | — | ||||||||
|
|
|
|
|
|
|
| |||||||||
Payments made on behalf of the Company by affiliates | $ | 14,900 | $ | — | $ | — | $ | — | ||||||||
|
|
|
|
|
|
|
| |||||||||
Transfers of net assets to Parent | $ | — | $ | — | $ | 32,459 | $ | — | ||||||||
|
|
|
|
|
|
|
| |||||||||
See accompanying notes to the combined financial statements
Notes to Combined Financial Statements
(USD in thousands, unless stated otherwise)
1. Organization and description of the business
Description of the business
Forterra Building Products (“Forterra” or the “Successor”) is involved in the manufacturing, sale and distribution of building materials in the United States (‘‘U.S.’’) and Canada. Forterra’s primary products are concrete drainage pipe, precast concrete structures, water transmission pipe used in drinking and wastewater systems, and bricks. These products are used in the residential, infrastructure and non-residential sectors of the construction industry.
Basis of Presentation - Successor
Forterra includes indirect wholly-owned subsidiaries of LSF9 Concrete Holdings, Ltd. (“LSF9”). Lone Star Funds (“Lone Star”), through its wholly-owned subsidiary LSF9, acquired Forterra on March 13, 2015 (the “Acquisition”). LSF9, which was formed on February 6, 2015 for the purpose of acquiring Forterra, had no operations prior to the date of the Acquisition. The legal entities that comprise Forterra are domiciled in the U.S. and Canada. The U.S. legal entities are Stardust Holdings (USA), LLC and its subsidiaries. The Canadian legal entities are Forterra Pipe & Precast, Ltd. and its subsidiaries and Forterra Brick Ltd.
Prior to the Acquisition, the entities comprising Forterra which were acquired by Lone Star were indirect wholly-owned subsidiaries of HeidelbergCement A.G. (“HC” or “Parent”), a publicly listed company in Germany, encompassing HC’s North American building products operations (“BP NAM” or the “Predecessor”). LSF9 acquired Forterra in a business combination which also included the acquisition of HC’s U.K.-based building products operations for a total initial purchase price of $1.33 billion cash, including customary working capital adjustments and a possible earn-out of up to $100.0 million. The acquisition of BP NAM and HC’s UK-based building products was funded with an equity investment of $432.3 million and third-party debt in the amount of $940.0 million.
In the accompanying financial information, Successor refers to Forterra and Predecessor refers to BP NAM. The term “Company” is used throughout the combined financial statements and applies to either the Predecessor or the Successor.
The Successor’s combined financial statements include certain assets and liabilities historically held at LSF9, including the proportionate debt, and related interest expense, incurred by LSF9 to acquire the Company that Forterra is obligated to pay. The Company’s portion of Lone Star’s initial $432.3 million equity investment is $167.5 million. The Company’s allocated portion of the $940.0 million of third party debt used to finance the Acquisition is $515.5 million. The remaining $424.5 million of the debt was allocated to affiliates of LSF9 that are not included in these financial statements based on the amounts affiliates of LSF9 are expected to repay and such amount has been fully repaid by affiliates. The Company and the affiliates of LSF9 were co-obligors and jointly and severally liable under terms of the initial credit agreements. In April of 2016, the Company’s affiliate co-obligors were released from joint and several liability under the credit agreements and the Company is consequently the sole source of repayment for its $515.5 million share for the initial obligation under the credit agreements. See discussion of the joint and several obligations in Note 10, Debt and deferred financing costs.
Cretex Acquisition
On August 20, 2015, Forterra entered into a purchase agreement to acquire all the outstanding shares of Cretex Concrete Products, Inc. (“Cretex”) for a purchase price of $245.1 million, including customary working capital adjustments. The closing of the Cretex acquisition occurred on October 1,
FORTERRA BUILDING PRODUCTS
Notes to Combined Financial Statements
(USD in thousands, unless stated otherwise)
2015. Cretex is a manufacturer of reinforced concrete pipe, box culverts, precast drainage structures, pre-stressed bridge components and ancillary precast products, expanding the Company’s market footprint into the Upper Midwestern United States. The Cretex acquisition was financed with $240.0 million incremental third-party Senior debt.
The financial statements contained herein have been prepared in accordance with accounting principles generally accepted in the United States (“U.S. GAAP”). The combined financial statements include the accounts of the Company and all intercompany transactions among the Successor entities have been eliminated.
2. Summary of significant accounting policies
Basis of presentation - Predecessor
Description of Business - Predecessor
The legal entities comprising BP NAM were a component of the North American operating segment of HC and consist of U.S. operating entities that were directly owned by Lehigh Hanson, Inc. (‘‘LHI’’), a U.S. holding company, and Canadian operating entities that were directly owned by Hanson America Holdings (4), Ltd., a U.K. holding company.
These financial statements are labeled as predecessor because they reflect the combined predecessor historical results of operations, financial position and cash flows of BP NAM, as they were historically managed under the control of HC, in conformity with U.S. GAAP.
All intracompany transactions occurring between the predecessor entities have been eliminated. Certain transactions between the Company and HC have been included in these combined predecessor financial statements and are considered to be effectively settled at the time the transaction is recorded. The total net effect of the settlement of these transactions is reflected in the combined predecessor statements of shareholder’s equity and Parent company net investment as net transfers (to)/from Parent, in the combined predecessor statements of cash flows as a financing activity and in the combined predecessor balance sheet as Parent company net investment.
HC used a centralized approach to cash management and financing of its operations. Historically, the majority of the Predecessor’s cash was transferred to HC daily and the Company was dependent on HC funding of the Company’s operating and investing activities as needed. This arrangement is not reflective of the manner in which the Company would have been able to finance its operations had it been a stand-alone business separate from HC during the periods presented. Cash transfers to and from HC’s cash management accounts are reflected within Parent company net investment.
The combined predecessor financial statements include certain assets and liabilities that have historically been held at the HC corporate level but are specifically identifiable or otherwise allocable to the Company. The cash and cash equivalents held by HC at the corporate level are not specifically identifiable to the Company and therefore were not allocated for any of the periods presented. Cash and cash equivalents in the combined predecessor balance sheets represent cash held locally by operations included in the combined predecessor financial statements. HC third-party debt, and the related interest expense, has not been allocated for any of the periods presented as the Company was not the legal obligor of the debt and HC’s borrowings were not directly attributable to these operations.
FORTERRA BUILDING PRODUCTS
Notes to Combined Financial Statements
(USD in thousands, unless stated otherwise)
The historical costs and expenses reflected in the combined predecessor financial statements include an allocation for certain corporate functions historically provided by HC or its wholly-owned subsidiaries. Substantially all of the Company’s senior management were employed by HC and certain functions critical to the Company’s operations were centralized and managed by HC. Historically, the centralized functions have included executive senior management, financial reporting, financial planning and analysis, accounting, shared services, information technology, tax, risk management, treasury, legal, human resources, land management, and strategy and development. Additionally, the Company resided in office space provided by affiliates of HC. The cost of each of these services has been allocated to the Company on the basis of the Company’s relative net sales or head count as compared to that of HC depending upon which allocation methodology is more meaningful for each service.
The Company and HC believe that these allocations reasonably reflect the utilization of services provided and benefits received. However, they may differ from the cost that would have been incurred had the Company operated as a stand-alone company for the periods presented or will be incurred by the Successor. Estimating actual costs that would have been incurred if the Company had been a stand-alone company is not practicable and would depend on multiple factors, including organizational structure and strategic decisions made in various areas, including legal services, accounting and finance services, human resources, marketing and contract support, customer support, treasury, facility and other corporate and infrastructural services. Income taxes have been accounted for in these financial statements on a separate-return basis.
Business Combinations
Assets acquired and liabilities assumed in business combination transactions, as defined by the Financial Accounting Standards Board (“FASB”) Accounting Standards Codification (“ASC”) 805,Business Combination, are recorded at fair value using the acquisition method of accounting. We allocate the purchase price of acquisitions based upon the fair value of each component which may be derived from various observable and unobservable inputs and assumptions. Initial purchase price allocations are preliminary and subject to revision within the measurement period, not to exceed one year from the date of the transaction. The fair value of property, plant and equipment and intangible assets may be based upon the discounted cash flow method that involves inputs that are not observable in the market (Level 3). Goodwill assigned represents the amount of consideration transferred in excess of the fair value assigned to identifiable assets acquired and liabilities assumed.
Use of estimates
The preparation of the combined financial statements in conformity with U.S. GAAP requires management to make estimates and assumptions that affect the reported amounts of assets and liabilities, the disclosure of contingent assets and liabilities as of the date of the combined financial statements, and the reported amounts of revenues and expenses during the reporting period. Actual results could differ from these estimates. These estimates are based on management’s best knowledge of current events and actions that the Company may undertake in the future. The more significant estimates made by management relate to fair value estimates for assets and liabilities acquired in business combinations; accrued liabilities for environmental cleanup, reclamation, pensions and other employee benefit plans, bodily injury and insurance claims; and estimates for deferred tax assets, inventory reserves, allowance for doubtful accounts and impairment of long-lived assets.
FORTERRA BUILDING PRODUCTS
Notes to Combined Financial Statements
(USD in thousands, unless stated otherwise)
Cash and cash equivalents
Successor cash and cash equivalents include cash on hand and other highly liquid investments having an original maturity of less than three months.
Predecessor treasury activities were centralized by HC such that the net cash collections were automatically distributed to HC and reflected as Parent company net investment. At times, the Company may have had a cash balance due to timing differences.
Receivables, net
Receivables are recorded at net realizable value, which includes allowances for doubtful accounts. The Company reviews the collectability of trade receivables on an ongoing basis. The Company reserves for trade receivables determined to be uncollectible. This determination is based on the delinquency of the account, the financial condition of the customer and the Company’s collection experience.
HC maintained accounts receivable securitization programs in both the United States and Canada to provide additional sources of working capital and long-term financing. Under the program, HC sold, on a revolving basis, selected trade sales invoices to either wholly-owned special purpose subsidiaries (the “SPSs”), which are consolidated in HC consolidated financial statements, or in Canada to an unrelated third-party commercial paper conduit. The SPSs in turn enter into agreements with an unrelated third-party commercial paper conduit to acquire long-term financing, using the accounts receivable as collateral.
Under the terms of the programs for the United States and Canada, the Company maintained effective control over the selected trade sales invoices. In accordance with the Financial Accounting Standards Board (“FASB”) Accounting Standards Codification (“ASC”) 860,Transfers and Servicing (“ASC 860”), the accounts receivable securitization transactions have not been accounted for as sales in the United States and Canada. The related accounts receivable are reflected in the combined predecessor financial statements. The Company was responsible for the collection of invoices sold by the Company under the securitization programs. Cash collected by the Company was remitted to the SPS who then remitted the cash collections to the buyers of the accounts receivable on a contractually agreed basis.
Concentration of credit risk
Financial instruments that potentially subject the Company to concentrations of credit risk are primarily receivables. The Company performs ongoing credit evaluations of its customers’ financial condition and generally requires no collateral from its customers. The allowances for uncollectible receivables are based upon analysis of economic trends in the construction industry, detailed analysis of the expected collectability of accounts receivable that are past due and the expected collectability of overall receivables.
Concentrations of Labor
Approximately 35% of the Company’s employees are represented by collective bargaining agreements, and 25% of these employees are included in collective bargaining agreements that expire within 12 months.
FORTERRA BUILDING PRODUCTS
Notes to Combined Financial Statements
(USD in thousands, unless stated otherwise)
Inventories
Inventories are valued at the lower of cost or market. The Company’s inventories are valued using the average cost method. Inventories include materials, labor and applicable factory overhead costs. The value of inventory is adjusted for damaged, obsolete, excess and slow-moving inventory. Market value of inventory is estimated considering the impact of market trends, an evaluation of economic conditions, and the value of current orders relating to the future sales of each respective component of inventory.
Property, plant and equipment, net
Property, plant and equipment, which includes amounts recorded under capital lease arrangements, is stated at cost less accumulated depreciation. Depreciation of property, plant and equipment is computed using the straight-line method over the estimated useful lives of the assets. These lives range from 20 to 40 years for buildings, 4 to 20 years for machinery and equipment, and 5 to 10 years for other equipment and lower of lease term or useful life on leasehold improvements. Repair and maintenance costs are expensed as incurred. The Company’s depreciation expense is recorded in cost of goods sold and selling, general and administrative expenses in the combined statements of operations. The Company capitalizes interest during the active construction of major projects. Capitalized interest is added to the cost of the underlying assets and is depreciated over the useful lives of those assets. There was no interest capitalized for any of the periods presented in the combined financial statements.
Impairment or disposal of long-lived assets
The Company evaluates the recoverability of its long-lived assets in accordance with the provisions of ASC 360,Property, Plant andEquipment(“ASC 360”). ASC 360 requires that long-lived assets and certain identifiable intangibles be reviewed for impairmentwhenever events or changes in circumstances indicate that the carrying amount of an asset may not be recoverable. Recoverability of assets is measured by comparing the carrying amount of an asset to future undiscounted net cash flows expected to be generated by the asset. Such evaluations for impairment are significantly impacted by estimates of future prices for the Company’s products, capital needs, economic trends in the construction sector and other factors. If such assets are considered to be impaired, the impairment to be recognized is measured at the amount by which the carrying amount of the assets exceeds their fair value. Assets to be disposed of by sale are reflected at the lower of their carrying amount or fair value less cost to sell.
The Company assesses impairment of long-lived assets at the lowest level for which identifiable cash flows are largely independent of the cash flows of other assets and liabilities. For purposes of evaluating impairment of long-lived assets held in use, the Company has determined this level to be the asset group level, which are defined as geographical market clusters of plants. For assets meeting the criteria for classification as held for sale under ASC 360, the impairment is assessed at the disposal group level, generally the specific plant or plants held for sale.
Goodwill and other intangible assets, net
The goodwill reflected in the combined Successor balance sheets relates to the recognition of goodwill in the Acquisition and in the Company’s acquisition of Cretex Concrete Products (“Cretex”).
FORTERRA BUILDING PRODUCTS
Notes to Combined Financial Statements
(USD in thousands, unless stated otherwise)
Goodwill represents the excess of costs over the fair value of identifiable assets acquired and liabilities assumed.
The Company evaluates goodwill and intangible assets in accordance with ASC 350,Goodwill and Other Intangible Assets (“ASC 350”). ASC 350 requires goodwill to be either qualitatively or quantitatively assessed for impairment annually (or more frequently if impairment indicators arise) for each reporting unit. The Company performs its annual impairment testing of goodwill as of October 1 of each year and in interim periods if events occur that would indicate that it is more likely than not goodwill may be impaired.
The Company evaluates its intangible assets with finite lives for indications of impairment whenever events or changes in circumstances indicate that the net book value may not be recoverable. Intangible assets with finite lives consist of customer relationships, customer backlogs, and brand names, and are amortized under a consumption method over the estimated useful lives. Factors that could trigger an impairment review include significant under-performance relative to expected historical or projected future operating results, significant changes in the manner of our use of the acquired assets or the strategy for our overall business or significant negative industry or economic trends.
If this evaluation indicates that the value of the intangible asset may be impaired, the Company makes an assessment of the recoverability of the net book value of the asset over its remaining useful life. If this assessment indicates that the intangible asset is not recoverable, based on the estimated undiscounted future cash flows of the asset over the remaining amortization period, the Company reduces the net book value of the related intangible asset to fair value and may adjust the remaining amortization period.
Investment in equity method investee
The Company has an investment in a joint venture accounted for using the equity method. Under the equity method, carrying value is adjusted for the Company’s share of the investee’s earnings and losses, as well as capital contributions to and distributions from the investee. Distributions in excess of equity method earnings are recognized as a return of investment and recorded as investing cash inflows in the accompanying combined statements of cash flows. The Company classifies its share of income and loss related to its investments in its investee as a component of operating income or loss, as the Company’s investments in the investee is an extension of the Company’s core business operations.
The Company evaluates its investment in the equity method investee for impairment whenever events or changes in circumstances indicate that the carrying value of its investment may have experienced an “other-than-temporary” decline in value. If such conditions exist, the Company compares the estimated fair value of the investment to its carrying value to determine if an impairment is indicated and determines whether the impairment is “other-than-temporary” based on its assessment of all relevant factors, including consideration of the Company’s intent and ability to retain its investment.
Derivatives and Hedge Accounting
The Company has entered into derivative instruments to mitigate interest rate and foreign exchange rate risk. Certain derivative instruments are designated for hedge accounting under ASC
FORTERRA BUILDING PRODUCTS
Notes to Combined Financial Statements
(USD in thousands, unless stated otherwise)
815-20,Derivatives – Hedging. Instruments that meet hedge criteria are formally designated as hedges at the inception of the instrument. Derivatives utilized by the Company include cross currency swaps.
The Company’s derivative assets and liabilities are measured at fair value. Fair value related to the cash flows occurring within one year are classified as current and the fair value related to the cash flows occurring beyond one year are classified as non-current in the combined balance sheets. For those instruments designated as hedges, the Company recognizes the changes in fair value in other comprehensive income (“OCI”), and recognizes any ineffectiveness immediately in earnings.
Valuation of derivative assets and liabilities reflect the value of the instrument including counterparty credit risk. These values also take into account the Company’s own credit standing.
Deferred Financing Costs
In conjunction with its debt, the Company recorded debt discounts and debt issuance costs totaling $51.9 million during the period March 14, 2015 to December 31, 2015. These costs are amortized over the life of the applicable debt instrument to interest expense utilizing the effective interest method. The related amortization expense of these costs was $5.1 million, and is included in interest expense on the combined statements of operations for the Successor period.
Fair value measurement
The Company utilizes valuation techniques that maximize the use of observable inputs and minimize the use of unobservable inputs to the extent possible. The Company determines fair value based on assumptions that market participants would use in pricing an asset or liability in the principal or most advantageous market. When considering market participant assumptions in fair value measurements, the following fair value hierarchy distinguishes between observable and unobservable inputs, which are categorized in one of the following levels:
Level 1 Inputs – Unadjusted quoted prices in active markets for identical assets or liabilities accessible to the reporting entity at the measurement date.
Level 2 Inputs – Other than quoted prices included in Level 1 inputs that are observable for the asset or liability, either directly or indirectly, for substantially the full term of the asset or liability.
Level 3 Inputs – Unobservable inputs for the asset or liability used to measure fair value to the extent that observable inputs are not available, thereby allowing for situations in which there is little, if any, market activity for the asset or liability at measurement date.
The Company’s other financial instruments consist primarily of cash and cash equivalents, trade and other receivables, accounts payable, accrued expenses, derivative financial instruments and long-term debt. The carrying value of the Company’s trade and other receivables, trade payables and accrued expenses approximates fair value due to their highly liquid nature, short-term maturity, or competitive rates assigned to these financial instruments.
The Company adjusts the carrying amount of certain nonfinancial assets to fair value on a non-recurring basis when they are impaired.
FORTERRA BUILDING PRODUCTS
Notes to Combined Financial Statements
(USD in thousands, unless stated otherwise)
Foreign currency translation
The Company uses the U.S. dollar as its functional currency for operations in the U.S. and the Canadian dollar for operations in Canada. The assets, liabilities, revenues and expenses of the Company’s Canadian operations are translated in accordance with ASC 830,Foreign Currency Matters.
Environmental remediation liabilities
The Company accrues for costs associated with environmental remediation obligations when such costs are probable and reasonably estimable; if an estimated amount is likely to fall within a range and no amount within that range can be determined to be the better estimate, the minimum amount of the range is recorded. Claims for recoveries from insurance carriers and other third parties are not recorded until it is probable that the recoveries will be realized. Such accruals are adjusted as further information develops or circumstances change.
Environmental expenditures that relate to current operations or to conditions caused by past operations are expensed. Expenditures that create future benefits are capitalized.
Liabilities are recorded when environmental assessments and/or clean-ups are probable, and the costs can be reasonably estimated. At December 31, 2015 and 2014, the Company had environmental obligations of $1,803 and $1,739, respectively, which are recorded within accrued liabilities and other long-term liabilities in the combined balance sheets. The estimated range of reasonably possible loss beyond the amounts accrued is considered immaterial.
Accounting for asset retirement obligations
The Company incurs reclamation obligations as part of its brick production process. The Company recognizes the fair value of a legally enforceable liability representing an asset retirement obligation in the period in which it is incurred.
The provisions of ASC 410-20,Accounting for Asset Retirement Obligations (“ASC 410”), require the projected estimated reclamation obligation to be stated at fair value using assumptions that reflect the amount an external party would charge for bearing the uncertainty of guaranteeing a fixed price today for performance in the future.
Asset retirement obligations which are recorded within accrued liabilities and other long term liabilities in the combined balance sheets were $1,353 and $1,885 at December 31, 2015 and 2014, respectively.
Defined benefit pension plans and other post-retirement benefits
The Predecessor’s Canadian employees participated in defined benefit pension plans sponsored by the Company. The Company’s U.S. salaried employees and non-union hourly employees participated in defined benefit pension plans sponsored by an affiliate of HC. Approximately 37% of the Predecessor’s labor force were covered by collective bargaining agreements. These plans included other Parent employees of HC affiliates that are not employees of the Company. LHI also provides certain retiree health and life insurance benefits to eligible employees who have retired from the Company. Salaried participants generally became eligible for retiree health care benefits when they retired from active service at age 60 or later. Benefits, eligibility, and cost-sharing provisions for the hourly employees vary by location and/or bargaining unit. Generally, the health care plans pay a stated percentage of most medical and dental expenses reduced for any deductible, co-payment and payments made by government programs and other group coverage. The Predecessor accounted for
FORTERRA BUILDING PRODUCTS
Notes to Combined Financial Statements
(USD in thousands, unless stated otherwise)
its U.S. defined benefit pension plans as multiemployer plans under ASC 715,Compensation–BenefitPlans(“ASC 715”).Liability for the Predecessor defined benefit plans were retained by HC.
Additionally, the Predecessor also had employees that were covered under several union-sponsored, multiemployer pension plans. Such plans are accounted for as defined contribution plans as it is not possible to isolate the components of such plans that would collectively comprise the Company’s liability. Liabilities for the Predecessor plans were retained by HC.
Income Taxes
As of the date of the Acquisition, the Successor financial statements reflect a new tax basis of accounting as the Company includes taxable entities independent of the Predecessor. Deferred tax assets and liabilities are recognized principally for the expected tax consequences of temporary differences between the tax basis of assets and liability and their reported amounts, using currently enacted tax rates. The measurement of a deferred tax asset is reduced, if necessary, by a valuation allowance if it is more likely than not that some portion or all of the deferred tax asset will not be realized.
The Company recognizes a tax benefit for uncertain tax positions if the Company believes it is more likely than not that the position will be upheld on audit based solely on the technical merits of the tax position. The Company evaluates uncertain tax positions after the consideration of all available information.
For the Predecessor periods, income tax expense and related current and deferred income taxes receivable and payable were calculated assuming that the Predecessor files hypothetical stand-alone income tax returns in Canada and hypothetical consolidated income tax returns for the U.S. building products activities. Losses and other tax attributes generated on a hypothetical stand-alone basis and hypothetical consolidated return basis are reflected as deferred tax assets, even though some of those losses or attributes may have been utilized by HC’s filing entities. All hypothetical current taxes payable or receivable are deemed settled through net parent investment. All tax consequences associated with the Predecessor period were retained by HC.
Revenue recognition
Revenues are recognized by the Company when the risks and rewards associated with the transaction have been transferred to the purchaser, which is demonstrated when all the following conditions are met: evidence of a binding arrangement exists (generally, purchase orders), products have been delivered or services have been rendered, there is no future performance required, fees are fixed or determinable and amounts are collectable under normal payment terms. Sales represent the net amounts charged or chargeable in respect of services rendered and goods supplied, excluding intercompany sales. Sales are recognized net of any discounts given to the customer.
The Company bills and incurs shipping costs to third parties for the transportation of building products to customers. For the period from March 14, 2015 to December 31, 2015, for the period from January 1, 2015 to March 13, 2015, and for the years ended December 31, 2014 and 2013, the Company recorded freight costs of approximately $59,943, $11,041, $69,862, and $63,301, respectively, on a gross basis within net sales and cost of goods sold in the accompanying combined statements of operations.
FORTERRA BUILDING PRODUCTS
Notes to Combined Financial Statements
(USD in thousands, unless stated otherwise)
The Company’s revenues primarily relate to product shipments. For certain engineering and construction contracts and building contracting arrangements, the Company recognizes revenue using the percentage of completion method, based on total contract costs incurred to date compared to total estimated cost at completion for each contract. Changes to total estimated contract cost or losses, if any, are recognized in the period in which they are determined. Pre-contract costs are expensed as incurred. If estimated total costs on a contract indicate a loss, the entire loss is provided for in the financial statements immediately. To the extent the Company has invoiced and collected from its customers more revenue than has been recognized as revenue using the percentage of completion method, the Company records the excess amount invoiced as deferred revenue. For the period from March 14, 2015 to December 31, 2015, for the period from January 1, 2015 to March 13, 2015, and for the years ended December 31, 2014 and 2013, revenue recognized in continuing operations using the percentage of completion method amounted to 5%, 4%, 3% and 4% of total net sales, respectively.
The company generally provides limited warranties related to its products which cover manufacturing in accordance with the specifications identified on the face of our quotation or order acknowledgement and to be free of defects in workmanship or materials. The warranty periods typically extend for a limited duration of one year. The Company estimates and accrues for potential warranty exposure related to products which have been delivered.
Cost of goods sold and selling, general and administrative expenses
Cost of goods sold includes costs of production, inbound freight charges for raw materials, outbound freight to customers, purchasing and receiving costs, inspection costs and warehousing at plant distribution facilities. Selling, general and administrative costs include expenses for sales, marketing, legal, accounting and finance services, human resources, customer support, treasury and other general corporate services.
Recent Accounting Guidance Adopted
In April 2014, the FASB issued Accounting Standards Update (“ASU”) 2014-08,Presentation of Financial Statements (Topic 205)and Property, Plant, and Equipment (Topic 360): Reporting Discontinued Operations and Disclosures of Disposals of Components of an Entity. The amendments in this update change the requirements for reporting discontinued operations in Subtopic 205-20. Adisposal of a component of an entity or a group of components of an entity is required to be reported in discontinued operations if the disposal represents a strategic shift that has (or will have) a major effect on an entity’s operations and financial results. The Company adopted this ASU effective January 1, 2015.
In August 2015, the FASB issued ASU 2015-03,Interest – Imputation of Interest (Subtopic835-30): Simplifying the Presentation ofDebt Issuance Cost. This amendment provides guidance for deferring and presenting debt issuance costs as an asset and subsequentlyamortizing the deferred debt issuance costs ratably over the term of the line of credit arrangement, regardless of whether there are any outstanding borrowings on the line of credit arrangement. For term debt obligations, the Company presents debt issuance costs as a direct deduction of the carrying amount of the debt. For public business entities, the amendments in this update are effective for financial statements issued for fiscal years beginning after December 15, 2015, and interim periods within those fiscal years. The Company early adopted this ASU effective March 14, 2015 and has presented its debt issuance costs accordingly in its financial statements.
FORTERRA BUILDING PRODUCTS
Notes to Combined Financial Statements
(USD in thousands, unless stated otherwise)
In November 2015, the FASB issued ASU 2015-17,Income Taxes (Topic 740), Balance Sheet Classification of Deferred Assets intended to simplify the presentation of deferred taxes on the balance sheet and will require an entity to present all deferred tax assets and deferred tax liabilities as non-current on the balance sheet. Under the current guidance, entities are required to separately present deferred taxes as current or non-current. Netting deferred tax assets and deferred tax liabilities by tax jurisdiction will still be required under the new guidance. The new accounting guidance is effective for annual periods beginning after December 15, 2016 with early adoption permitted. The Company early adopted ASU 2015-17 as of March 14, 2015 and applied the new guidance for all periods presented.
Recent Accounting Guidance Not Yet Adopted
In May 2014, the FASB issued ASU 2014-09,Revenue from Contracts with Customers (Topic 606), which provides accounting guidance for all revenue arising from contracts with customers and affects all entities that enter into contracts to provide goods or services to their customers. The FASB subsequently voted to defer the application of the provisions of this standard for public companies until annual reporting periods beginning after December 15, 2017 in ASU 2015-14Revenue from Contracts withCustomers (Topic 606): Deferral of the Effective Date, including interim periods within that reporting period. The Company iscurrently evaluating whether this ASU will have a material impact on its combined financial statements.
In March 2015, the FASB issued ASU 2015-02,Consolidation (Topic 810), Amendments to the Consolidation Analysis, changes the analysis that a reporting entity must perform when deciding to consolidate a legal entity. This amendment changes the evaluation of whether limited partnerships are variable interest entities or voting interest entities and eliminates the presumption that a general partner should consolidate a limited partnership. All legal entities are subject to reevaluation under the revised consolidation model. The amendment is effective for fiscal years and interim periods beginning after December 15, 2015 and can be applied either retrospectively to each period presented or as a cumulative-effect adjustment as of the beginning of the period of adoption. The adoption of ASU 2015-12 is not expected to have a material impact on the Company’s combined financial statements.
In July 2015, the FASB issued ASU 2015-11,Inventory (Topic 330): Simplifying the Measurement of Inventory, requiring an entity to measure inventory within the scope of the ASU at the lower of cost and net realizable value. For public business entities, the amendments in this update are effective for financial statements issued for fiscal years beginning after December 15, 2016, and interim periods within those fiscal years. The Company is currently evaluating whether this ASU will have a material impact on its combined financial statements.
In August 2014, the FASB issued ASU 2014-15,Presentation of Financial Statements–Going Concern (Subtopic 205-40): Disclosure of Uncertainties about an Entity’s Ability to Continue as a Going Concern,defining when and how companies are requiredto disclose going concern uncertainties, which must be evaluated each interim and annual period. Specifically, it requires management to determine whether substantial doubt exists regarding the entity’s going concern presumption. Substantial doubt about an entity’s ability to continue as a going concern exists when relevant conditions and events, considered in the aggregate, indicate that it is probable that the entity will be unable to meet its obligations as they become due within one year after the date the financial statements are issued. If substantial doubt exists, certain disclosures are required. The provisions of this ASU are effective for annual periods ending after December 15, 2016 and to annual and interim periods thereafter. Early adoption is permitted. The ASU should be applied on a prospective basis. The Company believes the adoption of this ASU will not have a material impact on the Company’s disclosures.
FORTERRA BUILDING PRODUCTS
Notes to Combined Financial Statements
(USD in thousands, unless stated otherwise)
In September 2015, the FASB issued ASU 2015-16,Business Combinations (Topic 805). Topic 805 requires an acquirer to retrospectively adjust provisional amounts recognized in a business combination during the measurement period. To simplify the accounting for adjustments made to provisional amounts, the amendments in this update require that the acquirer recognize adjustments to provisional amounts that are identified during the measurement-period in the reporting period in which the adjustment amount is determined. The acquirer is required to also record, in the same period’s financial statements, the effect on earnings of changes in depreciation, amortization or other income effects, if any, as a result of the change to the provisional amounts, calculated as if the accounting had been completed at the acquisition date. In addition, an entity is required to present separately on the face of the income statement or disclose in the notes to the financial statements the portion of the amount recorded in current period earnings by line item that would have been recorded in previous reporting periods if the adjustment to the provisional amounts had been recognized as of the acquisition date. For public business entities, the amendments in this update are effective for fiscal years beginning after December 15, 2015, including interim periods within those fiscal years.
In February 2016, the FASB issued ASU 2016-02, Leases(Topic 842), amending the existing accounting standards for lease accounting, including requiring lessees to recognize most leases on their balance sheets and making targeted changes to lessor accounting. For public business entities, the amendments in this update are effective for annual reporting periods beginning after December 15, 2018, including interim periods within those fiscal years, and early adoption is permitted as of the standard’s issuance date. ASU 2016-02 requires a modified retrospective transition approach for all leases existing at, or entered into after, the date of initial application, with an option to use certain transition relief. The Company believes this ASU will have a material impact on its combined financial statements as it will result in most of the Company’s leases and associated assets being presented on the balance sheet. See also Note 14 for a summary of the Company’s current operating lease commitments and Note 22 for disclosure of a significant sales-leaseback transaction the Company executed subsequent to the balance sheet date during April 2016.
3. Business combinations
Transaction Overview – The Acquisition
The Successor’s financial statements reflect the Acquisition of the Predecessor that occurred on March 13, 2015, which was accounted for as a business combination as defined by ASC 805. Certain liabilities of the Predecessor were not assumed by the Successor including, but not limited to pension liabilities, tax and insurance related liabilities and multi-employer pension liabilities. The assets acquired and liabilities assumed are recorded at their respective fair values as of the date of the Acquisition with the excess of the purchase price over those fair values recorded as goodwill. The determination of the fair values of the acquired assets and assumed liabilities required significant judgment, including estimates impacting the determination of estimated lives of tangible and intangible assets, the calculation of the fair value of inventory, property, plant and equipment, and customer related intangibles. The fair values were determined primarily using the income method using level 3 inputs as defined by ASC 820.
FORTERRA BUILDING PRODUCTS
Notes to Combined Financial Statements
(USD in thousands, unless stated otherwise)
The following table summarizes the fair values of the assets acquired and liabilities assumed by the Company at the Acquisition date:
| Fair Value | ||||
Net working capital | $ | 257,368 | ||
Property, plant and equipment | 311,191 | |||
Investment in equity method investee | 56,400 | |||
Customer backlog intangible | 4,500 | |||
Other assets and other liabilities | (6,495 | ) | ||
|
| |||
Net identifiable assets acquired | $ | 622,964 | ||
Goodwill | 17,464 | |||
|
| |||
Consideration, net of cash acquired | $ | 640,428 | ||
|
| |||
The goodwill recognized was attributable primarily to expected operating efficiencies and expansion opportunities in the business acquired. The goodwill is not expected to be deductible for tax purposes.
Financing transactions
Consideration to fund the Acquisition was provided by an equity investment of $167.5 million and proceeds from third-party debt, net of original discount and debt issuance costs, in the amount of $472.9 million. The financing transactions included a senior term loan in the amount of $254.9 million ($241.7 million, net of $13.2 million of original issue discount and debt issuance costs), a junior term loan in the amount of $260.0 million ($233.8 million, net of $26.2 million of original issue discount and debt issuance costs) and a revolving line of credit of up to $150.0 million. Funds of $0.6 million were initially drawn from the revolving line of credit at the closing date of the Acquisition. The Company incurred debt issuance costs related to the revolving line of credit in the amount of $3.2 million.
Contingent Consideration
As discussed in Note 1, the Acquisition included contingent consideration of up-to an additional $100.0 million based on the earnings of LSF9 for fiscal year 2015 as adjusted by the purchase agreement (“Earn-out”). The Earn-out is based on the achievement of an amount in excess of a certain minimum threshold of adjusted earnings before interest, taxes, depreciation and amortization (“Adjusted EBITDA”), as defined by the purchase agreement, for the calendar year ended December 31, 2015. The Company determined that achieving the required threshold to trigger a payout to the Seller was not probable and, therefore, the Company did not record a contingent liability related to the Earn-out as of the Acquisition date. Subsequent to year end, the Company concluded the Earn-out was not earned and, accordingly, did not record a liability as of December 31, 2015. See further discussion of the Earn-out in Note 14.
Transaction Overview – Cretex Concrete Products (“Cretex”)
On August 20, 2015, Forterra entered into a purchase agreement to acquire all the outstanding shares of Cretex Concrete Products, Inc. (“Cretex”) for a purchase price of $245.1 million including customary working capital adjustments. The closing of the Cretex acquisition occurred on October 1, 2015 and is accounted for as a business combination as defined by ASC 805. The Company allocated
FORTERRA BUILDING PRODUCTS
Notes to Combined Financial Statements
(USD in thousands, unless stated otherwise)
the purchase price to the individually identifiable assets acquired and liabilities assumed basedon their estimated fair value on the date of acquisition. The fair value of assets and liabilities were determined primarily using the income method using level 3 inputs as defined by ASC 820. The excess purchase price over those fair values was recorded as goodwill. The determination of fair values of the acquired assets and assumed liabilities required significant judgment, including estimates related to contract backlog, calculation of the fair value of property, plant and equipment and inventory. The allocation of the purchase price is preliminary and may be subject to change upon completion of the determination of the fair value of all acquired assets and liabilities.
The respective preliminary fair values of the assets acquired and liabilities assumed at the acquisition date are as follows:
| Fair Value | ||||
Net working capital | $ | 69,745 | ||
Property, plant and equipment | 97,282 | |||
Customer relationship intangible | 24,700 | |||
Trade name | 600 | |||
Customer backlog intangible | 800 | |||
Other assets and other liabilities | (7,500 | ) | ||
|
| |||
Net identifiable assets acquired | 185,627 | |||
Goodwill | 59,473 | |||
|
| |||
Consideration transferred, net of cash acquired | $ | 245,100 | ||
|
| |||
The results of operations of Cretex have been included in the Successor’s combined statement of operations subsequent to the date of acquisition on October 1, 2015. The Company recognized $39.1 million in net sales related to Cretex through December 31, 2015.
Financing transactions
The purchase of Cretex was partially funded with proceeds from financing transactions totaling $240.0 million as an add-on to the aforementioned senior term loan.
Supplemental pro-forma information (unaudited)
If the Company had acquired Cretex on January 1, 2015 the Company’s total net sales and loss from continuing operations before taxes, on a pro-forma basis for the year ended December 31, 2015 would have been approximately $1.0 billion and $(91.7) million, respectively, which includes both Predecessor and Successor periods in 2015.
Transaction Costs
For the period from March 14, 2015 to December 31, 2015, for the period from January 1, 2015 to March 13, 2015 and for the year ended December 31, 2014, the Company recognized transaction costs specific to the Acquisition and Cretex acquisition of $13,725, $2,079, and $17,740 respectively. No transaction costs were incurred in the year ended December 31, 2013. Transaction costs generally include legal, accounting, valuation, and advisory fees. These costs are recorded in the combined statements of operations within selling, general & administrative expenses.
FORTERRA BUILDING PRODUCTS
Notes to Combined Financial Statements
(USD in thousands, unless stated otherwise)
4. Receivables, net
Receivables consist of the following:
| Successor | Predecessor | |||||||
| December 31, 2015 | December 31, 2014 | |||||||
Trade receivables | $ | 108,065 | $ | 103,825 | ||||
Amounts billed, but not yet paid under retainage provisions | 2,053 | 2,293 | ||||||
Other receivables | 12,436 | 5,167 | ||||||
|
|
|
| |||||
Total receivables | $ | 122,554 | $ | 111,285 | ||||
Less: Allowance for doubtful accounts | (3,595 | ) | (2,236 | ) | ||||
|
|
|
| |||||
Trade receivables, net | $ | 118,959 | $ | 109,049 | ||||
|
|
|
| |||||
The Company records provisions for doubtful accounts in selling, general and administrative expenses in the combined statements of operations. The table below summarizes the Company’s allowance for doubtful accounts for the periods presented in the combined financial statements:
Predecessor | Allowance for doubtful accounts | |||
Balance at January 1, 2013 | $ | (3,153 | ) | |
Provisions for doubtful accounts | (2,760 | ) | ||
Write-offs and adjustments | 2,216 | |||
|
| |||
Balance at December 31, 2013 | (3,697 | ) | ||
|
| |||
Provisions for doubtful accounts | 786 | |||
Write-offs and adjustments | 675 | |||
|
| |||
Balance at December 31, 2014 | (2,236 | ) | ||
|
| |||
Provisions for doubtful accounts | 31 | |||
Write-offs and adjustments | (63 | ) | ||
|
| |||
Balance at March 13, 2015 | $ | (2,268 | ) | |
|
| |||
Successor | Allowance for doubtful accounts | |||
Balance at March 14, 2015 | $ | (2,268 | ) | |
Provisions for doubtful accounts | (1,377 | ) | ||
Write-offs and adjustments | 50 | |||
|
| |||
Balance at December 31, 2015 | $ | (3,595 | ) | |
|
| |||
FORTERRA BUILDING PRODUCTS
Notes to Combined Financial Statements
(USD in thousands, unless stated otherwise)
5. Inventories
Inventories consist of the following:
| Successor | Predecessor | |||||||
| December 31, 2015 | December 31, 2014 | |||||||
Finished goods | $ | 146,635 | $ | 140,004 | ||||
Raw materials | 53,339 | 46,486 | ||||||
Work in process | 10,641 | 4,006 | ||||||
|
|
|
| |||||
Total inventories | $ | 210,615 | $ | 190,496 | ||||
|
|
|
| |||||
6. Property, plant and equipment, net
Property, plant and equipment, net consist of the following:
| Successor | Predecessor | |||||||
| December 31, 2015 | December 31, 2014 | |||||||
Land, buildings and improvements | $ | 243,496 | $ | 507,214 | ||||
Machinery and equipment | 158,349 | 337,993 | ||||||
Other equipment | 1,142 | 26,433 | ||||||
Construction-in-progress | 14,984 | 21,274 | ||||||
|
|
|
| |||||
Total property, plant and equipment | 417,971 | 892,914 | ||||||
Less: accumulated depreciation | (29,047 | ) | (478,841 | ) | ||||
|
|
|
| |||||
Property, plant and equipment, net | $ | 388,924 | $ | 414,073 | ||||
|
|
|
| |||||
Depreciation expense totaled $28,613, $6,894, $36,605, and $38,560 for the period from March 14, 2015 to December 31, 2015, for the period from January 1, 2015 to March 13, 2015, and for the years ended December 31, 2014 and 2013, respectively, which is included in cost of goods sold and selling, general and administrative expenses in the combined statements of operations.
Impairments
The Company recorded impairment charges primarily in conjunction with plant closings undertaken for purposes of market consolidation and recognized asset impairment charges for its property, plant and equipment of $1,088, $27, $3,977 and $12,011 for the period from March 14, 2015 to December 31, 2015, for the period from January 1, 2015 to March 13, 2015, and for the years ended December 31, 2014 and 2013, respectively. Asset impairments are included in impairment and restructuring charges on the combined statements of operations.
Transfers
During 2014, the Predecessor transferred to HC certain property, plant and equipment of $25,107 related to sites historically included in BP North America because such sites were not included in the Acquisition.
FORTERRA BUILDING PRODUCTS
Notes to Combined Financial Statements
(USD in thousands, unless stated otherwise)
7. Goodwill and other intangible assets, net
In connection with the Acquisition and the Cretex acquisition, the Company recognized goodwill of $17.5 million and $59.5 million, respectively. On an annual basis, the Company performs step one of its goodwill impairment test by comparing the fair value of each reporting unit with its carrying value. Only certain of the Company’s reporting units have goodwill subsequent to the Acquisition of the Company and Cretex acquisition. The Company completed annual assessments as of October 1 of each reporting period. In 2013, one reporting unit, Water Pipe & Products, failed step one and the Company recorded a goodwill impairment charge of $236,639 during the year ended December 31, 2013 based on the amount by which the carrying value of the reporting unit exceeded the fair value of the identifiable assets and liabilities of the reporting unit. There were no other impairments recorded to goodwill during the reporting periods included in the combined financial statements.
Goodwill at December 31, 2014 of $83,674 was eliminated upon consummation of the Acquisition in connection with the Successor’s accounting for the business combination.
The following table presents the changes in the net carrying value of goodwill by reportable segment:
| Successor | Drainage Pipe & Products | Water Pipe & Products | Bricks | Other | Total | |||||||||||||||
March 14, 2015 | $ | 15,139 | $ | 2,280 | $ | 45 | $ | — | $ | 17,464 | ||||||||||
Acquisition of Cretex | 59,473 | — | — | — | 59,473 | |||||||||||||||
Foreign Currency | (1,170 | ) | (230 | ) | — | — | (1,400 | ) | ||||||||||||
|
|
|
|
|
|
|
|
|
| |||||||||||
December 31, 2015 | $ | 73,442 | $ | 2,050 | $ | 45 | $ | — | $ | 75,537 | ||||||||||
|
|
|
|
|
|
|
|
|
| |||||||||||
Intangible assets other than goodwill at December 31, 2015 included the following:
| Weighted average amortization period (in years) | Gross carrying value as of December 31, 2015 | Accumulated amortization | Net carrying value as of December 31, 2015 | |||||||||||||
Customer relationships | 5 | $ | 24,700 | $ | (365 | ) | $ | 24,335 | ||||||||
Customer backlog | 1 | 5,182 | (3,955 | ) | 1,227 | |||||||||||
Brand names | 2 | 600 | (100 | ) | 500 | |||||||||||
|
|
|
|
|
| |||||||||||
Total intangible assets | $ | 30,482 | $ | (4,420 | ) | $ | 26,062 | |||||||||
|
|
|
|
|
| |||||||||||
Amortization expense was $4,317 for the period from March 14, 2015 to December 31, 2015.
FORTERRA BUILDING PRODUCTS
Notes to Combined Financial Statements
(USD in thousands, unless stated otherwise)
In the future the Company expects to incur amortization expense on these intangible assets for the years ended December 31 as follows:
Years ending December 31: | ||||
2016 | $ | 8,575 | ||
2017 | 6,083 | |||
2018 | 4,132 | |||
2019 | 2,910 | |||
2020 | 2,034 | |||
Thereafter | 2,328 | |||
|
| |||
Total future amortization expense | $ | 26,062 | ||
|
|
8. Fair Value Measurement
The Company’s financial instruments consist primarily of cash and cash equivalents, trade and other receivables derivative instruments, accounts payable, long-term debt and accrued liabilities. The carrying value of the Company’s trade receivables, trade payables, the asset based revolver and accrued liabilities approximates fair value due to their short-term maturity. The Company may adjust the carrying amount of certain nonfinancial assets to fair value on a non-recurring basis when they are impaired.
The estimated carrying amount and fair value of the Company’s financial instruments and other assets and liabilities measured and recorded at fair value on a recurring basis is as follows for the dates indicated:
| Successor | Fair value measurements at December 31, 2015 using | |||||||||||||||
| Recurring: | Quoted Prices in Active Markets for Identical Assets (Level 1) | Significant Other Observable Inputs (Level 2) | Significant Unobservable Inputs (Level 3) | Total Fair Value December 31, 2015 | ||||||||||||
Non-current assets | ||||||||||||||||
Derivative assets | $ | — | $ | 9,093 | $ | — | $ | 9,093 | ||||||||
The fair values of derivative assets and liabilities are determined using quantitative models that utilize multiple market inputs including interest rates and exchange rates to generate continuous yield or pricing curves and volatility factors to value the position. The majority of market inputs are actively quoted and can be validated through external sources, including brokers, market transactions and third-party pricing services. The fair values of derivative assets and liabilities include adjustments for market liquidity, counterparty credit quality and other instrument-specific factors, where appropriate. In addition, the Company incorporates within its fair value measurements a valuation adjustment to reflect the credit risk associated with the net position. Positions are netted by counterparties, and fair value for net long exposures is adjusted for counterparty credit risk while the fair value for net short exposures is adjusted for the Company’s own credit risk.
FORTERRA BUILDING PRODUCTS
Notes to Combined Financial Statements
(USD in thousands, unless stated otherwise)
The estimated carrying amount and fair value of the Company’s financial instruments and liabilities for which fair value is only disclosed is as follows:
| Successor | Fair value measurements at December 31, 2015 using | |||||||||||||||||||
| Carrying Amount December 31, 2015 | Quoted Prices in Active Markets for Identical Assets (Level 1) | Significant Other Observable Inputs (Level 2) | Significant Unobservable Inputs (Level 3) | Total Fair Value December 31, 2015 | ||||||||||||||||
Non-current liabilities | ||||||||||||||||||||
Senior Term Loan | $ | 469,383 | $ | — | $ | 470,543 | $ | — | $ | 470,543 | ||||||||||
Junior Term Loan | 236,446 | — | 259,675 | — | 259,675 | |||||||||||||||
The fair value of debt is the estimated amount LSF9 would have to pay to transfer its debt, including any premium or discount attributable to the difference between the stated interest rate and market rate of interest at the balance sheet date. Fair values are supported by observable market transactions when available.
Deferred compensation is valued using cash surrender value of Company-owned life insurance. The fair values of benefit plan assets and the related disclosure are included in Note 21, Employee Benefit Plans.
9. Derivatives and hedging
The Company uses derivatives to manage selected foreign exchange and interest rate exposures. The Company does not use derivative instruments for speculative trading purposes, and cash flows from derivative instruments are included in net cash provided by (used in) financing activities in the combined statements of cash flows.
In May of 2015, the Company entered into the following derivative instruments: fixed-for-fixed cross currency swaps and fixed-for-float cross currency swaps. The fixed-for-float cross currency swaps are designated as cash flow hedges in accordance with ASC 815-20,Derivatives–Hedging, with the effective portion of the changes in the fair value of the derivatives recorded to accumulated other comprehensive income, and any ineffective portion reflected directly in earnings as other operating expense in the combined statements of operations. The fixed-for-fixed cross currency swaps are not designated as hedge instruments; therefore changes in fair value are recognized immediately in earnings as other operating income (expense) in the combined statements of operations.
A quantitative analysis is utilized to assess hedge effectiveness for cash flow hedges. The Company assesses the hedge effectiveness and measures the amount of ineffectiveness for the hedge relationships based on changes in spot exchange rates. For the period from March 14, 2015 to December 31, 2015, the Company recognized foreign exchange gain of $1.9 million in the combined statement of operations, and $1.5 million included in other comprehensive income (loss) related to cash flow hedges, net of taxes of $0 and $0, respectively.
The Company has elected to present all derivative assets and derivative liabilities, on a net basis on its combined balance sheets when a legally enforceable International Swaps and Derivatives Association, Inc. (“ISDA”) Master Agreement exists. An ISDA Master Agreement is an agreement
FORTERRA BUILDING PRODUCTS
Notes to Combined Financial Statements
(USD in thousands, unless stated otherwise)
between two counterparties, which may have multiple derivative transactions with each other governed by such agreement, and such ISDA Master Agreement generally provides for the net settlement of all or a specified group of these derivative transactions, through a single payment, in a single currency, in the event of a default on, or affecting any, one derivative transaction or a termination event affecting all, or a specified group of, derivative transactions. At December 31, 2015, the Company’s derivative instruments fall under an ISDA master netting agreement, however the Company’s derivative instruments included only assets at the balance sheet date, thus no netting of derivatives is included.
The following table presents the fair values of derivative assets and liabilities in the combined successor balance sheet:
| Successor | ||||||||||||||||
| December 31, 2015 | ||||||||||||||||
| Level 2 | ||||||||||||||||
| Derivative Assets | Derivative Liabilities | |||||||||||||||
| Notional Amount | Fair Value | Notional Amount | Fair Value | |||||||||||||
Fixed-for-fixed cross currency swap | $ | 79,531 | $ | 7,667 | — | — | ||||||||||
Fixed-for-float cross currency swap | 81,991 | 1,426 | — | — | ||||||||||||
|
|
|
|
|
|
|
| |||||||||
Total derivatives, gross | 9,093 | — | ||||||||||||||
Less: Legally enforceable master netting agreements | — | |||||||||||||||
|
|
|
| |||||||||||||
Total derivatives, net | $ | 9,093 | $ | — | ||||||||||||
|
|
|
| |||||||||||||
The following table presents the gain (loss) recognized in earnings on derivative instruments in cash flow hedging relationships in the combined statements of operations:
| Successor | ||||
| March 14 - December 31, | ||||
| 2015 | ||||
Cash flow hedges | ||||
Cross currency swaps | ||||
Gain on derivatives recognized in Accumulated other comprehensive income | $ | 1,549 | ||
Gain on derivatives not designated as hedges | 8,331 | |||
The estimated net amount of existing gains at December 31, 2015 expected to be reclassified into earnings within the next 12 months total $0.5 million.
FORTERRA BUILDING PRODUCTS
Notes to Combined Financial Statements
(USD in thousands, unless stated otherwise)
10. Debt and deferred financing costs
The Company’s debt consisted of the following:
| Successor | Predecessor | |||||||
| December 31, 2015 | December 31, 2014 | |||||||
Senior Term Loan Credit Agreement | ||||||||
interest at 6.50%, net of debt issue costs and original issue discount of $20,129 | $ | 469,383 | $ | — | ||||
Junior Term Loan Credit Agreement | ||||||||
interest at 10.50%, net of debt issue costs and original issue discount of $23,554 | 236,446 | — | ||||||
|
|
|
| |||||
Total debt | 705,829 | — | ||||||
Less: current portion debt | (2,191 | ) | — | |||||
|
|
|
| |||||
Total long-term debt | $ | 703,638 | $ | — | ||||
|
|
|
| |||||
In connection with the financing of the Acquisition, LSF9 entered into a Senior Term Loan Credit Agreement for borrowings of $635.0 million, a Junior Term Loan Credit Agreement for borrowings of $260.0 million, and drew $45.0 million under a $150.0 million revolving credit facility (the “Revolver”). Approximately $515.5 million is the obligation of Forterra as a joint and several obligation under ASC 405-40, Obligations Resulting from Joint and Several Liability Arrangements. See also Note 1, Basis of Presentation-Successor.
In connection with the Cretex acquisition, the Company issued additional Senior term notes of $240.0 million. In conjunction with the issuance of debt related to the Acquisition and the Cretex acquisition, LSF9 incurred $71.6 million of debt issuance costs and debt discounts; of which $51.9 million is attributed to the Company debt obligation.
The Company early adopted ASU No. 2015-03,Simplifying the Presentation of Debt Issuance Costs, and classified debt issuance costs as contra-liabilities as of December 31, 2015. As the Company had no prior debt balances, the adoption of ASU 2015-03 required no retrospective adjustment or changes to previously reported balances.
All of the Company’s debt instruments are unconditionally guaranteed by the Company and all its subsidiaries jointly and severally. The credit agreements are secured by substantially all of the assets of the Company. On November 10, 2015, the Company modified the Revolver and increased its available borrowing capacity to $250.0 million. The interest rate for both the Senior Term Loan and Junior Term Loan is set at LIBOR (with a 1% floor) plus a margin of 5.50% and 9.50%, respectively. The Senior Term Loan Credit Agreement has a weighted average effective interest rate of 7.2% for the year ended December 31, 2015 and matures March 2022. The effective interest rate of the Junior Term Loan Credit Agreement was 11.7% for the period, and the debt matures March 2023. The effective interest rate includes the effects of deferred financing fees and original issue discount and premium amortization calculated using the effective interest method.
At December 31, 2015, the Company’s Revolver, which matures in March 2020, had total borrowing capacity of $250.0 million, none of which was outstanding. The available credit under the Revolver is limited by a borrowing base which includes a portion of the Company’s current assets.
FORTERRA BUILDING PRODUCTS
Notes to Combined Financial Statements
(USD in thousands, unless stated otherwise)
Interest is floating, based on a reference rate plus an applicable margin. The weighted average annual interest rate on the Revolver was 1.94% for the period March 14, 2015 through December 31, 2015. In addition, Forterra pays a facility fee of between 25.0 and 37.5 basis points per annum based upon the utilization of the total Revolver facility. Availability under the Revolver at December 31, 2015 based on draws, and outstanding letters of credit and allowable borrowing base was $231.0 million.
For the period from March 13, 2015 to December 31, 2015, cash payments for interest totaled $40.3 million, of which $14.9 million was paid by affiliates of the Company.
As of December 31, 2015, minimum future principal payments on long-term debt are as follows:
| Total | Senior Term Loan | Junior Term Loan | ||||||||||
2016 | $ | 2,191 | $ | 2,191 | $ | — | ||||||
2017 | — | — | — | |||||||||
2018 | — | — | — | |||||||||
2019 | — | — | — | |||||||||
2020 | — | — | — | |||||||||
Thereafter: | 747,321 | 487,321 | 260,000 | |||||||||
|
|
|
|
|
| |||||||
| $ | 749,512 | $ | 489,512 | $ | 260,000 | |||||||
Covenants, Events of Default and Provisions
Under the terms of credit agreements above, LSF9 is required to comply with certain customary covenants, including among others, the limitation of indebtedness, limitations on liens, and limitations on certain cash distributions. The Revolver imposes only financial covenant, which requires LSF9 to maintain a fixed charge coverage ratio of no less than 1.00 to 1.00. The fixed charge coverage ratio is the ratio of consolidated earnings before interest, depreciation, and amortization (“EBITDA”) less cash payments for capital expenditures and income taxes to consolidated fixed charges (interest expense plus scheduled payments of principal on indebtedness). As of December 31, 2015, LSF9 was in compliance with the debt covenants contained in its credit facilities.
Lines of Credit and Other Debt Facilities
The Company had stand-by letters of credit outstanding of $15.8 million as of December 31, 2015 which reduce the borrowings available under the credit facilities.
Joint and several obligations
As discussed above, the Company has recorded debt on its combined balance sheet under ASC 405-40, Obligations Resulting from Joint and Several Liability Arrangements. The Company and the affiliates of LSF9 were co-obligors and jointly and severally liable under terms of the LSF9’s credit agreements. The Company’s allocated portion of the $940.0 million of third party debt used to finance the Acquisition is $515.5 million. The initial obligation of $515.5 million was reflected on the Company’s combined balance sheet at the Acquisition date as $254.9 million of Senior Term Loan, $260 million of Junior Term Loan and $0.6 million of Revolver obligations. The remaining $424.5 million of the debt was allocated to affiliates of LSF9 that are not included in these financial statements based on the amounts affiliates of LSF9 were expected to repay and such amount has been fully repaid by affiliates. In April of 2016, the Company’s affiliate co-obligors were released from joint and several liability under
FORTERRA BUILDING PRODUCTS
Notes to Combined Financial Statements
(USD in thousands, unless stated otherwise)
the LSF9 credit agreements. The Company is consequently the sole source of repayment for its $515.5 million share for the initial obligation under the credit agreements, as well as other obligations recorded on the balance sheet. In addition to the initial debt obligation of $515.5 million recorded by the company, during October 2015, additional LSF9 Senior Term Loan borrowings of $240 million to finance the Cretex acquisition were allocated in full to the Company.
The amounts recorded at December 31, 2015 in the combined balance sheets represent the portion of LSF9’s outstanding obligation as of the balance sheet date the Company was expected to repay. The obligations are secured by substantially all of the assets of the Company.
Repayments on the Revolver of $44.4 million made by affiliates during the period ended December 31, 2015 were applied to the initial Revolver balance when determining the amount to allocate to the Company. The Company allocated related debt issuance costs and discount in proportion to the debt instrument recorded. The Company allocated interest expense based on the total amounts allocated by debt instrument.
11. Accrued liabilities
Accrued liabilities consist of the following for the years ended December 31, 2015 and 2014:
| Successor | Predecessor | |||||||
| December 31, 2015 | December 31, 2014 | |||||||
Accrued payroll and employee benefits | $ | 24,690 | $ | 26,058 | ||||
Accrued taxes | 17,073 | 10,597 | ||||||
Accrued rebates | 8,021 | 7,280 | ||||||
Warranty | 2,429 | 1,644 | ||||||
Shut down and restructuring costs | — | 1,474 | ||||||
Other miscellaneous accrued liabilities | 3,415 | 3,359 | ||||||
|
|
|
| |||||
| $ | 55,628 | $ | 50,412 | |||||
|
|
|
| |||||
12. Other long-term liabilities
Other long-term liabilities consist of the following for the years ended December 31, 2015 and 2014:
| Successor | Predecessor | |||||||
| December 31, 2015 | December 31, 2014 | |||||||
Workers compensation | $ | 1,458 | $ | 10,536 | ||||
Deferred rent | 1,386 | — | ||||||
Environmental remediation liability | 1,315 | 1,654 | ||||||
Asset retirement obligations | 938 | 1,637 | ||||||
Legal | 628 | — | ||||||
Insurance | 527 | 3,451 | ||||||
Employee benefits | — | 10,408 | ||||||
Tax related provision | — | 2,216 | ||||||
Other miscellaneous long-term liabilities | 502 | 2,483 | ||||||
|
|
|
| |||||
| $ | 6,754 | $ | 32,385 | |||||
|
|
|
| |||||
FORTERRA BUILDING PRODUCTS
Notes to Combined Financial Statements
(USD in thousands, unless stated otherwise)
13. Income taxes
Successor
As of the date of the Acquisition, the combined Successor financial statements reflect a new tax basis of accounting as the Company includes taxable entities independent of the Predecessor. Deferred tax assets and liability are recognized principally for the expected tax consequences of temporary differences between the tax basis of assets and liability and their reported amounts, using currently enacted tax rates. All tax consequences associated with the Predecessor period were retained by HC.
Predecessor
The Company’s U.S. and non-U.S. operations have been historically included in certain HC consolidated tax returns. The tax provisions have been prepared on a stand-alone basis, as if the business was a separate group of companies under common ownership although the Company was included in the HC entities’ tax returns. The operations have been combined as if they were filing on a consolidated basis for U.S. and state income tax purposes as they were historically included in the consolidated U.S. Income tax returns and certain consolidated or unitary group state returns of the prior parent entity. The non-U.S. tax provision has been determined on a stand-alone basis for each non-U.S. affiliate as these entities have historically filed stand-alone returns as required by the jurisdiction in which they operate.
The Company’s income (loss) from continuing operations before income taxes for the period March 14, 2015 to December 31, 2015, January 1, 2015 to March 13, 2015 and for the years ended December 31, 2014 and 2013 was as follows:
| Successor | Predecessor | |||||||||||||||
| For the period from March 14 to December 31, | For the period from January 1 to March 13, | Years ended December 31, | ||||||||||||||
| 2015 | 2015 | 2014 | 2013 | |||||||||||||
U.S. companies | $ | (95,417 | ) | $ | (6,265 | ) | $ | (4,382 | ) | $ | (250,128 | ) | ||||
Canadian companies | 18,409 | (233 | ) | 14,387 | 8,409 | |||||||||||
|
|
|
|
|
|
|
| |||||||||
Total income (loss) from continuing operations before income taxes | $ | (77,008 | ) | $ | (6,498 | ) | $ | 10,005 | $ | (241,719 | ) | |||||
|
|
|
|
|
|
|
| |||||||||
FORTERRA BUILDING PRODUCTS
Notes to Combined Financial Statements
(USD in thousands, unless stated otherwise)
The rate reconciliation for continuing operations presented below is based on the U.S. federal statutory tax rate of 35% because the predominant business activity is in the U.S.:
| Successor | Predecessor | |||||||||||||||
| Period Ended December 31, 2015 | Period Ended March 13, 2015 | Year Ended December 31, 2014 | Year Ended December 31, 2013 | |||||||||||||
Income (loss) from continuing operations | $ | (77,008 | ) | $ | (6,498 | ) | $ | 10,005 | $ | (241,719 | ) | |||||
Income tax expense at statutory rate of 35% | $ | 26,953 | $ | 2,274 | $ | (3,502 | ) | $ | 84,602 | |||||||
State income taxes, net of federal benefit | 1,984 | — | (70 | ) | (62 | ) | ||||||||||
Foreign rate differential | 1,784 | (226 | ) | 1,401 | 727 | |||||||||||
Non-deductible expenses | (527 | ) | — | (497 | ) | — | ||||||||||
Change in valuation allowance | (35,738 | ) | (2,223 | ) | (602 | ) | (4,812 | ) | ||||||||
Goodwill impairment | — | — | — | (82,825 | ) | |||||||||||
Non-deductible transaction costs | (558 | ) | — | — | — | |||||||||||
Other | 324 | 917 | 853 | (191 | ) | |||||||||||
|
|
|
|
|
|
|
| |||||||||
Total income tax (expense) benefit | $ | (5,778 | ) | $ | 742 | $ | (2,417 | ) | $ | (2,561 | ) | |||||
|
|
|
|
|
|
|
| |||||||||
The net deferred tax assets (liabilities) balances were comprised of the following components as of December 31, 2015 and 2014:
| Successor | Predecessor | |||||||
| December 31, 2015 | December 31, 2014 | |||||||
Deferred tax assets: | ||||||||
Inventory | $ | 8,952 | $ | 1,110 | ||||
Reserves and accrued liabilities | 11,449 | 19,760 | ||||||
Net operating losses (NOLs) | 18,030 | 106,599 | ||||||
Capitalized transaction costs | 2,271 | — | ||||||
Intangible assets | 2,599 | 14,620 | ||||||
Other assets | 54 | 1,392 | ||||||
|
|
|
| |||||
Total deferred tax assets | 43,355 | 143,481 | ||||||
|
|
|
| |||||
Valuation allowance | (37,988 | ) | (92,507 | ) | ||||
|
|
|
| |||||
Total deferred tax assets, net | $ | 5,367 | $ | 50,974 | ||||
|
|
|
| |||||
Deferred tax liabilities: | ||||||||
Fixed assets | $ | (3,393 | ) | $ | (50,336 | ) | ||
Derivatives | (179 | ) | — | |||||
Other liabilities | (1,073 | ) | (7,753 | ) | ||||
|
|
|
| |||||
Total deferred tax liabilities | (4,645 | ) | (58,089 | ) | ||||
|
|
|
| |||||
Net deferred tax asset (liability) | $ | 722 | $ | (7,115 | ) | |||
|
|
|
| |||||
FORTERRA BUILDING PRODUCTS
Notes to Combined Financial Statements
(USD in thousands, unless stated otherwise)
The income tax benefits (expenses) from continuing operations for the period March 14, 2015 to December 31, 2015, January 1, 2015 to March 13, 2015 and for the years ended December 31, 2014 and 2013 are as follows:
| Successor | Predecessor | |||||||||||||||
| March 14 - December 31 | January 1, 2013 | Years ended December 31, | ||||||||||||||
| 2015 | 2015 | 2014 | 2013 | |||||||||||||
Current income tax | ||||||||||||||||
U.S. companies | $ | (765 | ) | — | $ | 589 | $ | (436 | ) | |||||||
Canadian companies | (8,151 | ) | 3,491 | (2,388 | ) | (4,796 | ) | |||||||||
|
|
|
|
|
|
|
| |||||||||
Total current tax (expense) benefit | (8,916 | ) | 3,491 | (1,799 | ) | (5,232 | ) | |||||||||
|
|
|
|
|
|
|
| |||||||||
Deferred income tax | ||||||||||||||||
U.S. companies | 441 | — | — | — | ||||||||||||
Canadian companies | 2,697 | (2,749 | ) | (618 | ) | 2,671 | ||||||||||
|
|
|
|
|
|
|
| |||||||||
Total deferred tax (expense) benefit | 3,138 | (2,749 | ) | (618 | ) | 2,671 | ||||||||||
|
|
|
|
|
|
|
| |||||||||
|
|
|
|
|
|
|
| |||||||||
Income tax (expense) benefit - continuing operations | $ | (5,778 | ) | $ | 742 | $ | (2,417 | ) | $ | (2,561 | ) | |||||
|
|
|
|
|
|
|
| |||||||||
As of December 31, 2015, the Company has tax loss carryforwards as follows:
| Amount | Expiration Date | |||||
Federal net operating losses | $ | 38,512 | 2035 | |||
State net operating losses | $ | 21,324 | 2030-2035 | |||
Foreign net operating losses | $ | 1,633 | 2033-2035 | |||
Income tax expense and related current and deferred income taxes receivable and payable for the periods ending March 13, 2015 and December 31, 2013 and 2014 are calculated assuming hypothetical stand-alone income tax returns filed in Canada and its provinces and hypothetical consolidated income tax return for the Predecessor’s U.S. and state activities. The related tax provision amounts for the period ending December 31, 2015 were calculated based on the Company’s standalone activity post-acquisition. The Successor has recorded a full valuation allowance against its net deferred tax assets in the amount of $37,988 as management has concluded the deferred tax assets are not more likely than not to be realized at December 31, 2015. In any event, if the valuation allowance was not recorded, deferred tax assets of $5.2 million would be unavailable to benefit the Company because of interest expense that was paid by an affiliate and not by the Company and therefore is not deductible in the Company’s tax return (see Note 15 Related party transactions). In addition, Lone Star intends to enter into a Tax Receivables Agreement and accordingly, even in the event the Company generates taxable income in future periods, the Company may not realize the benefit of a large portion of the NOLs as the majority of the benefit would be paid to Lone Star. Historically, the U.S. companies were included in the consolidated U.S. income tax return and certain consolidated or unitary group state returns of LHI. The Company’s deferred tax assets and liabilities for the period ending December 31, 2014 are determined on the hypothetical basis described above and do not reflect the amount that would be determined for the Company on a standalone basis. The federal and state net operating loss carryover amounts include interest deductions in the Successor period ended December 31, 2015 that are the result of carve-out accounting adjustments, which will
FORTERRA BUILDING PRODUCTS
Notes to Combined Financial Statements
(USD in thousands, unless stated otherwise)
not be included in the actual net operating loss carryover available to reduce future tax liability. All hypothetical current taxes payable or receivable prior to March 13, 2015 are deemed settled through net parent investment. All tax attributers of the predecessor remain with HC under terms of the Acquisition.
Uncertain tax positions
The Company is subject to audit examinations at federal, state, local, and foreign levels by tax authorities in those jurisdictions who may challenge the treatment or reporting of any tax return item. The tax matters challenged by the tax authorities are typically complex; therefore, the ultimate outcomes of these challenges are subject to uncertainty. Taxable years after 2009 are still open for examination for the U.S. and Canada.
Each period the Company assesses uncertain tax positions for recognition, measurement and effective settlement. Benefits from uncertain tax positions are measured at the largest amount of benefit that is greater than 50 percent likely of being realized upon settlement. Where it has been determined that our tax return filing position does not satisfy the more-likely-than-not recognition threshold, no tax benefits are recorded. The Company has uncertain tax positions related to its Canadian operations that are subject to an indemnification from HC.
14. Commitments and contingencies
As of December 31, 2015, the Company had outstanding surety bonds in the amount of $121.3 million to secure performance commitments. The Company also had letters of credit outstanding of $15.8 million with no amounts withdrawn as of December 31, 2015.
The Company is involved in legal proceedings and litigation in the ordinary course of business. In the opinion of management, the outcome of such matters will not have a material adverse effect on the Company’s combined financial position, results of operations, or liquidity. Other than routine litigation incidental to the Company’s business, there are no material legal proceedings to which the Company is a party or to which any of the Company’s properties are subject.
In connection with the Earn-out contingency described in Note 3, the Acquisition included contingent consideration of up to $100.0 million if and to the extent the 2015 financial results of the businesses acquired by Lone Star in the Acquisition, including the Company and Forterra UK, exceeded a specified Adjusted EBITDA target for fiscal year 2015, as calculated pursuant to the terms of the purchase agreement. If such Adjusted EBITDA calculation exceeds the specified target, LSF9, and therefore, Forterra would be required to pay HC an amount equal to a multiple of such excess Adjusted EBITDA, with any payment capped at $100.0 million. In April 2016, the Company provided an earn-out statement to HC demonstrating that no payment was required. On June 13, 2016, HC provided notification that it is disputing, among other things, the Company’s calculation of Adjusted EBITDA under the purchase agreement and asserting that a payment should be made in the amount of $100.0 million. The Company does not believe HC’s position has merit and intends to vigorously oppose HC’s assertions. As of December 31, 2015, no liability for this contingency has been accrued as payment of any earn-out is not considered probable. However, the outcome of this matter is uncertain, and no assurance can be given to the ultimate outcome of the resulting proceedings. If LSF9 is unsuccessful in resolving the dispute, the Company could recognize a material charge to its earnings.
FORTERRA BUILDING PRODUCTS
Notes to Combined Financial Statements
(USD in thousands, unless stated otherwise)
Operating leases
The Company leases certain property and equipment for various periods under non-cancelable operating leases. Future minimum lease payments under such agreements as of December 31, 2015 were approximately:
2016 | $ | 2,691 | ||
2017 | 2,061 | |||
2018 | 1,707 | |||
2019 | 775 | |||
2020 | 526 | |||
Thereafter | 2,504 | |||
|
| |||
| $ | 10,264 | |||
|
|
Long-term incentive plan
Following the Acquisition the Company implemented a cash-based long term incentive plan (the “LTIP”), which entitles the participants in the LTIP a potential cash payout upon a monetization event as defined by the LTIP. Potential monetization events include the sale of the Company, an initial public offering where Lone Star reduces its ownership interest in the Company below 50% or at Lone Star’s discretion, or through certain cash distribution as defined in the LTIP. Before the payout of any cash the LTIP requires Lone Star receive a return of their investment plus a specified internal rate of return, which is calculated by comparing the return to Lone Star over the timeline of the investment in the Company. As of December 31, 2015, no such monetization events had occurred, and therefore no amounts were accrued in the accompanying combined balance sheet as of December 31, 2015. The Company is contemplating an initial public offering as early as the third quarter of 2016, but the initial public offering is not expected to reach the required return on investment to trigger a payout under the LTIP.
Asset retirement obligations (ARO)
The Company incurs reclamation obligations as part of its brick production processes. The Company recognizes the present value of the fair value of a legally enforceable liability representing an asset retirement obligation in the period in which it is incurred. Accretion of the liability is recorded in other operating income. It also recognizes an asset representing the anticipated costs of dismantling machinery and equipment (“tear-down” costs) and depreciates the asset over the remaining life of the equipment. The Company recorded the following ARO liabilities as of December 31, 2015 and 2014:
| Successor | Predecessor | |||||||
| December 31, 2015 | December 31, 2014 | |||||||
Beginning balance | $ | 1,885 | $ | 1,515 | ||||
Reclamation adjustment | 24 | 170 | ||||||
FV adjustment | (139 | ) | — | |||||
Locations sold | (248 | ) | — | |||||
Spend | (262 | ) | — | |||||
Accretion | 93 | 200 | ||||||
|
|
|
| |||||
Ending balance | $ | 1,353 | $ | 1,885 | ||||
Current portion | (415 | ) | (248 | ) | ||||
|
|
|
| |||||
Long-term portion | $ | 938 | $ | 1,637 | ||||
|
|
|
| |||||
FORTERRA BUILDING PRODUCTS
Notes to Combined Financial Statements
(USD in thousands, unless stated otherwise)
15. Related party transactions
Predecessor
Parent company net investment
During the Predecessor period the combined Predecessor financial statements for the Company are based on the accounting records of HC. Within these records, each subsidiary of BP has its own equity accounts in the books and records, as well as intercompany balances due (to)/from affiliates and operations within HC. These intercompany balances are considered by HC as part of the capital structure of these entities and are not regularly settled in cash with the affiliate counterparties. Therefore, these intercompany balances act as clearing accounts between the parties and consist of the accumulated net transactions between the Company and other entities and operations of HC and may include both operating items (allocated expenses and purchases of services and materials) and equity items (transfers of assets, cash and dividends). The Company has recorded all such equity and intercompany balances in a single caption, Parent company net investment.
The following table presents the components of net transfers to Parent for the period from January 1, 2015 to March 13, 2015 and for the years ended December 31, 2014 and 2013 were as follows:
Net transfer category | 2015 | 2014 | 2013 | |||||||||
Cash clearing and other financing activities | $ | 64,280 | $ | 3,092 | $ | 486 | ||||||
Corporate allocations | (4,112 | ) | (23,576 | ) | (29,373 | ) | ||||||
Contribution of net assets to Parent | — | (32,459 | ) | — | ||||||||
Current income taxes – federal and state | 742 | (3,133 | ) | (2,561 | ) | |||||||
|
|
|
|
|
| |||||||
| $ | 60,910 | $ | (56,076 | ) | $ | (31,448 | ) | |||||
|
|
|
|
|
| |||||||
Allocated expenses
The Company was allocated selling, general and administrative expenses from the Parent for certain shared services of $4,112, $23,576 and $29,373 for the period from January 1, 2015 to March 13, 2015 and for the years ended December 31, 2014 and 2013, respectively. The allocated costs are included in costs of goods sold or selling, general and administrative expenses in the combined Predecessor statements of operations. The historical costs and expenses reflected in our combined financial statements include an allocation for certain corporate functions historically provided by HC or its wholly-owned subsidiaries. Substantially all of the Predecessor’s senior management was employed by HC and certain functions critical to the Predecessor’s operations were centralized and managed by HC. Historically, the centralized functions have included executive senior management, financial reporting, financial planning and analysis, accounting, shared services, information technology, tax, risk management, treasury, legal, human resources, land management and strategy and development. Additionally, the Company temporarily rented office space provided by affiliates of HC. The cost of each of these services has been allocated to the Predecessor on the basis of the Predecessor’s relative net sales or head count as compared to that of HC depending upon which allocation methodology is more meaningful for each service. The Company and HC believe that these allocations reasonably reflect the utilization of services provided and benefits received by the Predecessor. However, these amounts are not necessarily representative of the amounts that would have been incurred by the Predecessor as a separate entity.
FORTERRA BUILDING PRODUCTS
Notes to Combined Financial Statements
(USD in thousands, unless stated otherwise)
Successor
Contributed capital
The initial contributed capital of LSF9 allocated to the Company was $167.5 million at the date of the Acquisition. During the period from March 14, 2015 to December 31, 2015, the Company paid certain transaction and other costs for affiliates that are recorded as distributions in these financial statements. Likewise, an affiliate not included in these financial statements paid $14.9 million of interest on behalf of the Company. The above activity is recorded net as a return of contributed capital of $27,613 in these financial statements.
Transition Services Agreement (“TSA”)
The Company is no longer part of HC and its affiliates, but did have a Transition Services Agreement with HC providing for corporate overhead services. Per the TSA, the services are to be provided to the Successor for a period of up to 18 months, and may be terminated at will with proper notice by the Successor. The initial services provided primarily consisted of certain accounting, information technology, human resources, and other general and administrative services associated with the Successor’s transition to a stand-alone company.
Cement Supply Agreement
The Company entered into an agreement with HC and its affiliates for the continued supply of cement, in which the Company agreed to source a minimum percentage of such materials consumed at prevailing market prices as defined in the agreements.
Hudson Advisors
The Company has an advisory agreement with Hudson Advisors, an affiliate of Lone Star, to provide certain management oversight services to the Company, including assistance and advice on strategic plans, obtaining and maintaining certain legal documents, and communicating and coordinating with service providers. The Company incurred fees totaling $9,151 for the period March 14 through December 31, 2015 for these services included in selling, general and administrative costs on the combined Successor statement of operations. For fiscal year 2014 and 2013, no services were provided.
Related party payables and activity
The Predecessor had net payables to affiliates totaling $0.7 million at December 31, 2014 that were net settled in consummation of the Acquisition. At December 31, 2015, the Successor has payables to affiliates totaling $3.2 million that are regularly settled in cash. Purchases of raw materials from affiliates of the Predecessor for the years ended December 31, 2014 and 2013 were $45.4 million and $47.2 million, respectively.
16. Segment reporting
During the Successor period in 2015, the Company realigned its business segment reporting structure as a result of the change in the Chief Operating Decision Maker (“CODM”). The segment data below reflects business segment information as managed by the Successor, and comparative financial data for the historical periods of the Predecessor have been presented to conform to the current segment structure. The accounting policies for our segments follow the Company’s accounting policies.
FORTERRA BUILDING PRODUCTS
Notes to Combined Financial Statements
(USD in thousands, unless stated otherwise)
Segment information is presented in accordance with ASC 280,Segment Reporting (“ASC 280”), which establishes standards for reporting information about operating segments. It also establishes standards for related disclosures about products and geographic areas. Operating segments are defined as components of an enterprise that engage in business activities that earn revenues, incur expenses and prepare separate financial information that is evaluated regularly by the Company’s chief operating decision maker in order to allocate resources and assess performance. The Corporate and Other segment includes expenses related to certain executive salaries, interest costs related to long-term debt, acquisition related costs, and other corporate costs that are not directly attributable to our operating segments.
Net sales from the major products sold to external customers include drainage pipe and precast products, concrete and steel water transmission pipe, and clay bricks and concrete blocks.
The Company’s two geographic areas consist of the United States and Canada for which it reports net sales, fixed assets and total assets. For purposes of evaluating segment profit, the CODM reviews EBITDA as a basis for making the decisions to allocate resources and assess performance.
FORTERRA BUILDING PRODUCTS
Notes to Combined Financial Statements
(USD in thousands, unless stated otherwise)
The following tables set forth reportable segment information of the Company with respect to net sales and other financial information attributable to our reportable segments for the period from March 14, 2015 to December 31, 2015, for the period from January 1, 2015 to March 13, 2015 and for the years ended December 31, 2014 and 2013:
Successor For the period March 14 - December 31, 2015: | Drainage Pipe & Products | Water Pipe & Products | Bricks | Corporate and Other | Total | |||||||||||||||
Net sales | $ | 431,723 | $ | 167,417 | $ | 118,389 | $ | 5,135 | $ | 722,664 | ||||||||||
Income (loss) from continuing operations before income taxes | 48,216 | 6,824 | (8,401 | ) | (123,647 | ) | (77,008 | ) | ||||||||||||
Depreciation and amortization | 16,792 | 7,944 | 7,680 | 514 | 32,930 | |||||||||||||||
Interest (income)/expense | (5 | ) | — | 181 | 45,777 | 45,953 | ||||||||||||||
|
|
|
|
|
|
|
|
|
| |||||||||||
EBITDA | $ | 65,003 | $ | 14,768 | $ | (540 | ) | $ | (77,356 | ) | $ | 1,875 | ||||||||
|
|
|
|
|
|
|
|
|
| |||||||||||
Capital expenditures | $ | 10,648 | $ | 4,719 | $ | 4,677 | $ | — | $ | 20,044 | ||||||||||
|
|
|
|
|
|
|
|
|
| |||||||||||
Total assets as of December 31, 2015 | $ | 626,477 | $ | 136,909 | $ | 147,699 | $ | 27,790 | $ | 938,875 | ||||||||||
|
|
|
|
|
|
|
|
|
| |||||||||||
Predecessor For the period January 1 - March 13, 2015: | Drainage Pipe & Products | Water Pipe & Products | Bricks | Corporate and Other | Total | |||||||||||||||
Net sales | $ | 79,341 | $ | 30,464 | $ | 19,922 | $ | 2,893 | $ | 132,620 | ||||||||||
Income (loss) from continuing operations before income taxes | 8,839 | (3,192 | ) | (4,000 | ) | (8,145 | ) | (6,498 | ) | |||||||||||
Depreciation and amortization | 3,231 | 1,030 | 2,505 | 128 | 6,894 | |||||||||||||||
Interest (income)/expense | — | — | 18 | 66 | 84 | |||||||||||||||
|
|
|
|
|
|
|
|
|
| |||||||||||
EBITDA | $ | 12,070 | $ | (2,162 | ) | $ | (1,477 | ) | $ | (7,951 | ) | $ | 480 | |||||||
|
|
|
|
|
|
|
|
|
| |||||||||||
Capital expenditures | $ | 621 | $ | 1,851 | $ | 272 | $ | — | $ | 2,744 | ||||||||||
|
|
|
|
|
|
|
|
|
| |||||||||||
| For the year ended December 31, 2014: | Drainage Pipe & Products | Water Pipe & Products | Bricks | Corporate and Other | Total | |||||||||||||||
Net sales | $ | 436,754 | $ | 149,864 | $ | 139,537 | $ | 10,808 | $ | 736,963 | ||||||||||
Income (loss) from continuing operations before income taxes | 64,686 | 6,412 | (2,078 | ) | (59,015 | ) | 10,005 | |||||||||||||
Depreciation and amortization | 16,011 | 4,968 | 12,981 | 2,645 | 36,605 | |||||||||||||||
Interest (income)/expense | — | — | — | — | — | |||||||||||||||
|
|
|
|
|
|
|
|
|
| |||||||||||
EBITDA | $ | 80,697 | $ | 11,380 | $ | 10,903 | $ | (56,370 | ) | $ | 46,610 | |||||||||
|
|
|
|
|
|
|
|
|
| |||||||||||
Capital expenditures | $ | 7,386 | $ | 13,403 | $ | 4,505 | $ | — | $ | 25,294 | ||||||||||
|
|
|
|
|
|
|
|
|
| |||||||||||
Total assets as of December 31, 2014 | $ | 455,050 | $ | 188,889 | $ | 190,591 | $ | 11,638 | $ | 846,168 | ||||||||||
|
|
|
|
|
|
|
|
|
| |||||||||||
FORTERRA BUILDING PRODUCTS
Notes to Combined Financial Statements
(USD in thousands, unless stated otherwise)
| For the year ended December 31, 2013: | Drainage Pipe & Products | Water Pipe & Products | Bricks | Corporate and Other | Total | |||||||||||||||
Net sales | $ | 372,060 | $ | 171,773 | $ | 145,500 | $ | 8,615 | $ | 697,948 | ||||||||||
Income (loss) from continuing operations before income taxes | 10,937 | (218,555 | ) | 2,594 | (36,695 | ) | (241,719 | ) | ||||||||||||
Depreciation and amortization | 17,396 | 4,929 | 14,163 | 2,072 | 38,560 | |||||||||||||||
Interest (income)/expense | — | — | — | — | — | |||||||||||||||
|
|
|
|
|
|
|
|
|
| |||||||||||
EBITDA | $ | 28,333 | $ | (213,626 | ) | $ | 16,757 | $ | (34,623 | ) | $ | (203,159 | ) | |||||||
|
|
|
|
|
|
|
|
|
| |||||||||||
Capital expenditures | $ | 3,263 | $ | 4,279 | $ | 2,889 | $ | 136 | $ | 10,567 | ||||||||||
|
|
|
|
|
|
|
|
|
| |||||||||||
The Water Pipe & Products segment net loss of $218,903 for the year ended December 31, 2013 is inclusive of $248,650 of impairment charges to property, plant and equipment, and goodwill.
In addition, the Company also has an investment in an equity method investee included in the following segment:
| Successor | Predecessor | |||||||
| At December 31, 2015 | At December 31, 2014 | |||||||
Drainage Pipe & Products | $ | 56,289 | $ | 47,452 | ||||
|
|
|
| |||||
The Company is also required by ASC 280 to disclose additional information related to geographic location. The Company has operations in both the United States and Canada. The Company has both property, plant and equipment and net sales in each country and those property, plant and equipment and net sales are recorded within each applicable geographic location as follows:
| Property, plant and equipment | ||||||||||||
| Successor | Predecessor | |||||||||||
| December 31, 2015 | December 31, 2014 | December 31, 2013 | ||||||||||
United States | $ | 305,843 | $ | 289,781 | $ | 308,223 | ||||||
Canada | 83,081 | 124,292 | 140,927 | |||||||||
|
|
|
|
|
| |||||||
| $ | 388,924 | $ | 414,073 | $ | 449,150 | |||||||
|
|
|
|
|
| |||||||
| Net Sales | ||||||||||||||||
| Successor | Predecessor | |||||||||||||||
| For the period from March 14 to December 31, | For the period from January 1 to March 13, | Years ended December 31, | ||||||||||||||
| 2015 | 2015 | 2014 | 2013 | |||||||||||||
United States | $ | 585,809 | $ | 112,299 | $ | 592,959 | $ | 559,169 | ||||||||
Canada | 136,855 | 20,321 | 144,004 | 138,779 | ||||||||||||
|
|
|
|
|
|
|
| |||||||||
| $ | 722,664 | $ | 132,620 | $ | 736,963 | $ | 697,948 | |||||||||
|
|
|
|
|
|
|
| |||||||||
FORTERRA BUILDING PRODUCTS
Notes to Combined Financial Statements
(USD in thousands, unless stated otherwise)
17. Discontinued operations and assets held for sale
In the Predecessor periods, certain plants and facilities were determined to be outside of the scope of the Acquisition, and as such were presented as held for sale on the combined balance sheets and discontinued operations on the combined statements of operations. As of September 30, 2014, the Company distributed $16,421 representing the net assets of the Maple Grove structural precast manufacturing business (“Maple Grove”) in the United States to HC. HC sold Maple Grove to a third party on October 31, 2014; therefore, the results of Maple Grove operations through September 30, 2014 and for the years ended December 31, 2014 and 2013 are reflected as discontinued operations. Cash flows relating to all plants that met the ASC 360 criteria for held for sale classification as of December 31, 2014 are included in discontinued operations.
The following table shows the components of discontinued operations for the years ended December 31, 2014 and 2013:
| Predecessor | ||||||||
| December 31, | ||||||||
| 2014 | 2013 | |||||||
Revenues | $ | 34,824 | $ | 35,079 | ||||
|
|
|
| |||||
Gain (loss) from operations of discontinued operations before income tax | 1,976 | (2,844 | ) | |||||
Gain (loss) on disposal of discontinued operations | — | (174 | ) | |||||
Income tax benefit (expense) from discontinued operations | (716 | ) | — | |||||
|
|
|
| |||||
Gain (loss) on discontinued operations, net of tax | $ | 1,260 | $ | (3,018 | ) | |||
|
|
|
| |||||
Cash flows relating to all plants that met the ASC 360 criteria for held for sale classification as of December 31, 2013 are included in discontinued operations for all periods presented if those plants were part of a component that was disposed of during the periods presented.
In 2013, the Company sold its roof tile business in the western region of the United States for total proceeds of $1,847, resulting in a loss of $174. The Company no longer operates a roof tile business in the western region of the United States.
18. Impairment and restructuring charges
The Company recorded impairment and restructuring charges for the period from March 1, 2015 to December 31, 2015, for the period from January 1, 2015 to March 13, 2015 and for the years ended December 31, 2014 and 2013 as follows:
| Successor | Predecessor | |||||||||||||||
| For the period from March 14 to December 31, | For the period from January 1 to March 13, | For the years ended December 31, | ||||||||||||||
| 2015 | 2015 | 2014 | 2013 | |||||||||||||
Impairment of property, plant and equipment (Note 6) | $ | 1,088 | $ | 27 | $ | 3,977 | $ | 12,011 | ||||||||
Restructuring charges | 97 | 515 | 242 | 1,927 | ||||||||||||
Impairment of goodwill and other intangibles (Note 7) | — | — | — | 236,639 | ||||||||||||
|
|
|
|
|
|
|
| |||||||||
| $ | 1,185 | $ | 542 | $ | 4,219 | $ | 250,577 | |||||||||
|
|
|
|
|
|
|
| |||||||||
FORTERRA BUILDING PRODUCTS
Notes to Combined Financial Statements
(USD in thousands, unless stated otherwise)
The Company periodically initiates programs to reduce costs and improve operating effectiveness. These programs include the closing of plants and the termination of portions of the workforce. As part of these plans, the Company incurs severance, lease and other contract termination costs.
19. Investments in equity method investee
On July 20, 2012, the Company entered into a joint venture agreement with a company that produces concrete pipe and precast to form Concrete Pipe & Precast LLC (“CP&P”). The Company contributed plant assets and related inventory from nine operating locations as part of the agreement to form CP&P and in return for the contribution the Company obtained a 50% ownership stake in the joint venture through its 500 Common Unit voting shares in CP&P. The Company owns 50% of CP&P voting common stock. The Company also received 150 preferred units redeemable for $100 each, or a $15,000 preferred interest in CP&P, for which the Company received a preferred return of $209 and $437 during 2014 and 2013, respectively, which is included in other income in the combined statements of operations.
The Company has recorded its investment in the Common Unit voting shares in accordance with ASC 323,Investments–EquityMethod and Joint Ventures(“ASC 323”),under the equity method of accounting. The preferred interest is accounted for by theCompany as an interest-bearing receivable. In July 2014, the Company’s 150 preferred units in the amount of $15,000 were redeemed for cash.
As part of the Acquisition the Company determined the fair value of the assets purchased, including its investment in CP&P, in accordance with ASC 805. As part of that process the Company assigned a value of $56,335 to the investment as of the date of Acquisition. As of December 31, 2015 and 2014, the Company’s investment in CP&P amounted to $56,289 and $47,452, respectively. At December 31, 2015, the difference between the amount at which the Company’s investment is carried and the amount of the Company’s share of the underlying equity in net assets of CP&P was approximately $13,605. This difference relates to the Company’s fair value assessment of the investment as part of the Acquisition, and this basis difference was primarily attributed to the value of land and equity method goodwill associated with the investment.
Select historical financial data of the investee is as follows (unaudited):
| At December 31, 2015 | At December 31, 2014 | |||||||||||
Current assets | $ | 30,922 | $ | 26,067 | ||||||||
Non-current assets | 72,513 | 75,264 | ||||||||||
Current liabilities | 13,297 | 11,459 | ||||||||||
Non-current liabilities | 20,319 | 18,542 | ||||||||||
| For the years ended December 31, | ||||||||||||
| 2015 | 2014 | 2013 | ||||||||||
Net sales | $ | 123,888 | $ | 111,753 | $ | 100,150 | ||||||
Gross profit | 29,508 | 21,750 | 15,278 | |||||||||
Income from operations | 15,049 | 8,333 | 4,120 | |||||||||
Net income | 16,090 | 8,746 | 259 | |||||||||
FORTERRA BUILDING PRODUCTS
Notes to Combined Financial Statements
(USD in thousands, unless stated otherwise)
20. Contract revenue
Certain of the Company’s businesses recognize contract revenue from their engineering and construction as well as building contracting arrangements using the percentage of completion method.
Revenue recognized in excess of amounts billed is classified as a current asset within receivables, net on the combined balance sheets. Amounts billed to clients in excess of revenue recognized to date are classified as a current liability within deferred revenue on the combined balance sheets. Revenues recognized in excess of billings were $2,288 and $1,281 as of December 31, 2015 and 2014, respectively. The Company anticipates that substantially all incurred cost associated with contract work in progress as of December 31, 2015 will be billed and collected in 2016. Billings in excess of revenue recognized was $2,457 and $1,423 as of December 31, 2015 and 2014, respectively. Additionally, the Company also records balances billed, but not yet paid by customers under retainage provisions related to these contracts as part of receivables, net, within the combined balance sheets. The amount of receivables due under retainage provisions as of December 31, 2015 and 2014 was $1,227 and $1,419, respectively.
Certain of the Company’s businesses also enter into agreements to provide inventory to customers for long-term construction projects. Revenue recognition is based on shipments of the respective goods ordered by the customer as these shipments represent substantive performance. The billings for these goods manufactured for the customer are based on contract terms and may or may not coincide with shipments of the goods, which gives rise to either unbilled or deferred revenue. The Company records revenue recognized in excess of amounts billed as a current asset within receivables, net on the combined balance sheets.
Revenue recognized in excess of billings for these contractual arrangements were $7,453 and $3,537 as of December 31, 2015 and 2014, respectively. Amounts billed to clients in excess of revenue recognized to date are classified as a current liability within deferred revenue on the combined predecessor balance sheets. Billings in excess of revenue recognized for these milestone contracts were $18,186 and $10,097 as of December 31, 2015 and 2014, respectively. Additionally, the Company also records balances billed, but not yet paid by customers under retainage provisions as part of trade receivables, net, within the combined balance sheets. The amount of receivables due under retainage provisions as of December 31, 2015 and 2014 was $826 and $874, respectively.
21. Employee benefit plans
Defined Contribution Plans - Successor
Subsequent to the Acquisition, the Company’s employees, including employees covered by collective bargaining agreements were able to participate in 401K defined contribution plans. The Company contributes funds into the plans subject to certain limits. For the period March 14, 2015 through December 31, 2015, the Company recorded an expense of $8,244 for these contributions. From January 1 through March 13, 2015, the Company recorded an expense of $1,724 for the Predecessor’s participation in a similar plan sponsored by HC.
The Company’s employees that are covered by collective bargaining agreements were historically participants in several union-sponsored, multi-employer pension plans (union-sponsored plans) for all periods included in the Predecessor financial statements. Neither the Company nor HC or its affiliates administered the union-sponsored plans. Contributions to the plans were determined in accordance with the provisions of negotiated labor contracts. The plans were accounted for as defined
FORTERRA BUILDING PRODUCTS
Notes to Combined Financial Statements
(USD in thousands, unless stated otherwise)
contribution plans as it is not possible to isolate the components of such plans that would collectively comprise the Company’s liability. In the event of plan termination or the Company’s withdrawal from a multi-employer plan, the Company may be liable for a portion of the plan’s unfunded vested benefit obligation, if any. In connection with the Acquisition, HC indemnified the Successor against liabilities that might arise as a result of withdrawal from the plans, net of any tax benefit that might result from tax deductible payments to settle the withdrawal liability. As of December 31, 2015, the Company had no remaining employees covered by multi-employer plans. The Company has received one notice of its exit liability from the associated plan. Affiliates of HC have reimbursed the Company for the exit liability, net of estimated federal income tax subsequent to year end. The remaining plans have not communicated amounts associated with the Company’s exit from the plans and Company has not recorded an associated liability as the amount of the liability, if any, not estimable.
Defined Benefit Pension Plans and Other Post-Retirement Benefits - Predecessor
Employees of the Predecessor participated in defined benefit plans as described below that were both sponsored by the Predecessor and sponsored by others. The combined Predecessor financial statements have been prepared on a historical basis reflecting the applicable liabilities and financial statement disclosures related to the defined benefit plans participated in under HC. The defined benefit obligations and disclosures do not necessarily reflect the costs the Predecessor would have incurred as a stand-alone entity. The related pension and post-retirement benefit liabilities were previously allocated to the Predecessor but were retained by HC subsequent to the Acquisition of the Company.
Canadian employee benefit plans
The Canadian companies within the Predecessor sponsored several qualified and nonqualified pension plans and other postretirement benefit plans (“OPEB”) for substantially all of their employees. Such plans are defined benefit plans. The benefits provided under these plans are based primarily on years of credited service and final average pensionable pay as defined under the respective plan provisions. Contributions totaled $2,028 for the year ended December 31, 2014.
The Predecessor’s plan assets were accounted for at fair value. The Predecessor’s asset allocations by level within the fair value hierarchy as of December 31, 2014 are presented in the table below for the Predecessor’s defined benefit plans:
| Asset Class: | Level 1 | Level 2 | Total | |||||||||
Equity | $ | — | $ | 14,226 | $ | 14,226 | ||||||
Fixed Income | — | 25,292 | 25,292 | |||||||||
|
|
|
|
|
| |||||||
Fair value of plan assets | $ | — | $ | 39,518 | $ | 39,518 | ||||||
|
|
|
|
|
| |||||||
Fixed income funds include investments in government obligations, corporate bonds, agency obligations and asset-backed securities.
FORTERRA BUILDING PRODUCTS
Notes to Combined Financial Statements
(USD in thousands, unless stated otherwise)
Amounts recognized on the combined Predecessor balance sheet as of December 31, 2014 were:
| Pension Benefits | Other Postretirement Benefits | |||||||||||||||
| Overfunded Plans | Underfunded Plans | Total | ||||||||||||||
Benefit obligation | $ | (4,579 | ) | $ | (38,999 | ) | $ | (9,261 | ) | $ | (52,839 | ) | ||||
Fair value of plan assets | 4,598 | 34,920 | — | 39,518 | ||||||||||||
|
|
|
|
|
|
|
| |||||||||
Funded status | 19 | (4,079 | ) | (9,261 | ) | (13,321 | ) | |||||||||
|
|
|
|
|
|
|
| |||||||||
Balance sheet recognition: | ||||||||||||||||
Non-current benefit asset | 19 | — | — | 19 | ||||||||||||
Non-current benefit liability | — | (4,079 | ) | (8,952 | ) | (13,031 | ) | |||||||||
Current benefit liability | — | — | (309 | ) | (309 | ) | ||||||||||
|
|
|
|
|
|
|
| |||||||||
| $ | 19 | $ | (4,079 | ) | $ | (9,261 | ) | $ | (13,321 | ) | ||||||
|
|
|
|
|
|
|
| |||||||||
Reconciliation of pension obligations and plan assets
The reconciliation of the beginning and ending balances of the pension obligation and the fair value of the plans’ assets for the Canadian defined benefit retirement plans and other postretirement benefits for the year ended December 31, 2014, are as follows:
| Pension Benefits | Other Postretirement Benefits | Total | ||||||||||
Benefit obligation at December 31, 2013 | $ | 42,067 | $ | 8,880 | $ | 50,947 | ||||||
Service cost | 829 | 50 | 879 | |||||||||
Interest cost | 1,867 | 395 | 2,262 | |||||||||
Employee contributions | 66 | — | 66 | |||||||||
Actuarial losses, net | 5,482 | 1,071 | 6,553 | |||||||||
Gross Benefits Paid | (2,811 | ) | (304 | ) | (3,115 | ) | ||||||
Exchange rate changes | (3,922 | ) | (831 | ) | (4,753 | ) | ||||||
|
|
|
|
|
| |||||||
Benefit obligation at December 31, 2014 | $ | 43,578 | $ | 9,261 | $ | 52,839 | ||||||
|
|
|
|
|
| |||||||
| Pension Benefits | Other Postretirement Benefits | Total | ||||||||||
Fair value of plan assets at December 31, 2013 | $ | 38,692 | $ | — | $ | 38,692 | ||||||
Actual return on plan assets | 5,425 | — | 5,425 | |||||||||
Employer contributions | 1,724 | 304 | 2,028 | |||||||||
Employee contributions | 66 | — | 66 | |||||||||
Benefits paid | (2,811 | ) | (304 | ) | (3,115 | ) | ||||||
Exchange rate changes | (3,578 | ) | — | (3,578 | ) | |||||||
|
|
|
|
|
| |||||||
Fair value of plan assets at December 31, 2014 | $ | 39,518 | $ | — | $ | 39,518 | ||||||
|
|
|
|
|
| |||||||
The unrecognized net actuarial loss (gain) recorded in Accumulated other comprehensive loss, pretax, for the year ended December 31, 2014 are $5,482 related to pension benefits and $1,071 related to other postretirement benefits.
FORTERRA BUILDING PRODUCTS
Notes to Combined Financial Statements
(USD in thousands, unless stated otherwise)
The components of net periodic pension costs for retirement benefits for the Canadian pension and other postretirement benefits are summarized below for the years ended December 31, 2014 and 2013:
| Pension Benefits | ||||||||
| 2014 | 2013 | |||||||
Service cost | $ | 829 | $ | 948 | ||||
Interest cost | 1,867 | 1,865 | ||||||
Expected return on plan assets | (1,853 | ) | (1,925 | ) | ||||
Curtailment gain recognized | — | — | ||||||
Past service cost recognized | 19 | 20 | ||||||
Net loss/(gain) amortization | 300 | 616 | ||||||
|
|
|
| |||||
Net Expense | $ | 1,162 | $ | 1,524 | ||||
|
|
|
| |||||
| Other Postretirement Benefits | ||||||||
| 2014 | 2013 | |||||||
Service cost | $ | 50 | $ | 62 | ||||
Interest cost | 395 | 374 | ||||||
Expected return on plan assets | — | — | ||||||
Curtailment gain recognized | — | — | ||||||
Past service cost recognized | (48 | ) | (52 | ) | ||||
Net loss/(gain) amortization | — | 20 | ||||||
|
|
|
| |||||
Net Expense | $ | 397 | $ | 404 | ||||
|
|
|
| |||||
Pretax other changes in plan assets and benefit obligations recognized in other comprehensive income (loss):
| 2014 | 2013 | |||||||
Actuarial (gain) loss, net | $ | 2,981 | $ | (6,087 | ) | |||
Amortization of net actuarial (gains) losses, net | (300 | ) | 636 | |||||
Amortization of prior year service costs | 29 | (32 | ) | |||||
|
|
|
| |||||
Net amount recognized in other comprehensive income (loss) | $ | 2,710 | $ | (5,483 | ) | |||
|
|
|
| |||||
U.S. employee benefit plans
The Predecessor’s U.S.-based employees were covered by defined benefit and defined contribution plans that were sponsored by others, including affiliates. There were no U.S. benefit plans sponsored by the Predecessor.
Plans sponsored by affiliates
Approximately 38% of the Predecessor’s active U.S.-based employees were vested in a defined benefit pension plan sponsored by LHI. This defined benefit plan covered other HC employees that are not employees of the Predecessor. LHI froze this defined benefit plan effective December 31, 2013 for all non-union U.S.-based employees, except for those who were within five years of their social security retirement date. LHI provided certain OPEB to eligible salaried and hourly non-union employees who have retired from the Predecessor, including primarily retiree health and life insurance
FORTERRA BUILDING PRODUCTS
Notes to Combined Financial Statements
(USD in thousands, unless stated otherwise)
benefits. These OPEB benefits were frozen in 2006 for all U.S.-based non-union employees, except for a small number of ‘‘grandfathered’’ employees who met certain age and employment service criteria. Approximately 8% of the Predecessor’s active employees were ‘‘grandfathered’’ and eligible for retiree life insurance and retiree health care benefits should they retire with LHI at age 60 or later. Benefits, eligibility and cost-sharing provisions for hourly union employees vary by bargaining unit. Generally, the health care plans pay a stated percentage of most medical expenses, reduced for any deductible, copayment and payments made by government programs and other group coverage. In 2013, LHI announced changes to its retiree health care plans that covered retirees age 65 and older. This change did not impact any retirees who had retired under a collective bargaining agreement. Beginning in 2013, LHI stopped providing company-sponsored health care plans to retirees age 65 and older; rather it began providing a subsidy for each eligible retiree to purchase health care coverage best suited for his/her circumstance.
The related pension and OPEB have not been allocated to the Predecessor for the U.S. plans and have not been presented in the accompanying balance sheet since the obligation is and will remain a liability of the HC. The Predecessor recorded $1,642 and $1,634 for the years ended December 31, 2014 and 2013, respectively, in pension and other post-retirement benefits expense related to its U.S. employees, which has been reflected within costs of goods sold and selling, general and administrative expenses in the accompanying combined Predecessor statement of operations. The pension and OPEB expense recorded by the Predecessor for plans sponsored by affiliates includes expenses of $569 and $662, for the years ended December 31, 2014 and 2013, respectively, which are included in the allocated expenses described in Note 15.
LHI made contributions to the plans for the Predecessor’s employees that participate in pension and other post-retirement benefit plans sponsored by LHI. For purposes of these combined Predecessor financial statements the Predecessor accounts for its activities affecting these plans as if these single-employer plans sponsored by LHI were multi-employer plans in accordance with ASC 715.
LHI also sponsors several defined contribution pension plans covering substantially all of the Predecessor’s employees. Eligible employees may contribute a portion of their base compensation to the plans, and their contributions are matched by the Predecessor at rates specified in the plans. The Predecessor made contributions to the plans sponsored by LHI for its employees that participate in the plans. These contributions totaled $1,724, $8,936 and $8,683 for the period from January 1, 2015 to March 13, 2015 and for the years ended December 31, 2014 and 2013, respectively, which are recorded within costs of goods sold and selling, general, and administrative expenses in the combined Predecessor statement of operations. The recorded expenses related to the defined contribution pension plans are reflected within costs of goods sold and selling, general and administrative expenses in the accompanying combined Predecessor statements of operations. These expenses are not included in the allocated expenses described in Note 15.
22. Subsequent events
Sherman-Dixie Acquisition
On January 29, 2016 the Company purchased all of the outstanding stock of Sherman-Dixie Concrete Industries, Inc., a Tennessee corporation, which manufactures and sells concrete pipe, box culverts, precast concrete utility products, storm and sanitary civil engineered systems and specialty engineered retainage systems in the Southeast market for cash consideration of $66.8 million including
FORTERRA BUILDING PRODUCTS
Notes to Combined Financial Statements
(USD in thousands, unless stated otherwise)
customary net working capital adjustments. Sherman-Dixie Concrete Industries, Inc. will operate as part of the Company’s Drainage Pipe & Products reportable segment. The acquisition was financed through a draw on the Company’s existing Revolver.
Sale-Leaseback Transaction
On April 5, 2016, the Company, through its subsidiaries in North America, sold properties in 47 sites throughout the U.S. and Canada to Pipe Portfolio Owner (Multi) LP and Fort-Ben Holdings (ONQC) Ltd. (collectively the “Buyer”) for an aggregate purchase price of approximately $204.3 million. On April 14, 2016, the Company sold additional properties in two sites located in the U.S. to Pipe Portfolio Owner (Multi) LP for an aggregate purchase price of approximately $11.9 million. The Company and Buyer contemporaneously entered into master land and building lease agreements under which the Company agreed to lease back each of the properties for an initial term of twenty years, followed by one optional renewal terms of 9 years 11 months. Leaseback rental will escalate annually by 2% during the initial term and based on changes in the Consumer Price Index capped at 4% during the optional renewal period. The net proceeds received from the sale leaseback transactions amounted to approximately $209.7 million, net of taxes and transaction costs.
The sale-leaseback transactions are considered to have one form of prohibited “continuing involvement” at the inception of the lease which preclude sale-leaseback accounting for transactions involving real estate in the combined financial statements of the Company because a guarantee by LSF9 provides the buyer-lessor with additional collateral that reduces the buyer-lessor’s risk of loss. As a result, the assets subject to the sale-leaseback will remain on the balance sheet of the Company and continue to be depreciated. The aggregate proceeds received are recorded as a financing obligation in the combined balance sheet.
U.S. Pipe Acquisition
The Company acquired substantially all of the stock of USP Holdings Inc., a ductile iron pipe producer, on April 15, 2016 for an initial purchase price of $775.1 million, which was funded with a $205.0 million borrowing by LSF9 on the Revolver, a portion of the proceeds of the above referenced sale-leaseback and a capital contribution of $402.1 million from our parent. USP Holdings Inc. will operate as part of the Company’s Water Pipe & Products reportable segment.
Roof Tile Divestiture
On April 12, 2016, the Company entered into and closed a Stock Purchase Agreement to sell all of its ownership interest in its roof tile business for an initial price of $10.5 million, subject to customary working capital adjustments.
Changes to debt obligations and borrowing capacity
In April 2016, the Company’s total borrowing capacity under its Revolver was increased from $250.0 million to $285.0 million.
In April 2016, LSF9 borrowed $205.0 million on the Revolver in order to finance the acquisition of US Pipe, as noted above, of which $203.4 million was repaid during April 2016 with proceeds from an affiliated entity controlled by LSF9 but not included among the legal entities that comprise Forterra. In
FORTERRA BUILDING PRODUCTS
Notes to Combined Financial Statements
(USD in thousands, unless stated otherwise)
connection with the additional proceeds obtained in April 2016 which benefited the Company, underASC 405-40, Obligations Resulting from Joint and Several Liability Arrangements,the Company assumed an additional obligation of $203.4 million that was recognized as an increase to the Company’s allocated share of LSF9’s outstanding Senior Term Loan balance. The affiliated entity was subsequently released as a co-obligor and its joint and several liability under terms of all of the 3rd party credit agreements. The increase in April 2016 in the Senior Term Loan recognizes the allocable amount of LSF9’s outstanding obligation at that time that will be repaid by the Company. There are no further repayments by affiliates of the Company after April 2016.
On June 17, 2016, LSF9 borrowed an incremental $345.0 million on the Senior Term Loan and used the proceeds to pay a dividend of the same amount to the shareholders of LSF9. LSF9 incurred debt issuance fees and discount of $6.7 million in connection with the issuance of the debt. The incremental borrowings incur interest at the same rate as the Senior Term Loan (see Note 10) and matures in March 2022. UnderASC 405-40 Obligations Resulting from Joint and Several LiabilityArrangements, Forterra will recognize the full amount of the incremental borrowing, net of related issuance costs and discount, as an obligation during the second quarter of 2016.
Balance Sheet at June 21, 2016 (inception)
Report of Independent Registered Public Accounting Firm
The Board of Directors and Management
Forterra, Inc.
We have audited the accompanying balance sheet of Forterra, Inc. as of June 21, 2016 (inception). This balance sheet is the responsibility of the Company’s management. Our responsibility is to express an opinion on this balance sheet based on our audit.
We conducted our audit in accordance with the standards of the Public Company Accounting Oversight Board (United States). Those standards require that we plan and perform the audit to obtain reasonable assurance about whether the balance sheet is free of material misstatement. An audit also includes examining, on a test basis, evidence supporting the amounts and disclosures in the balance sheet, assessing the accounting principles used and significant estimates made by management, and evaluating the overall balance sheet presentation. We believe that our audit provides a reasonable basis for our opinion.
In our opinion, the balance sheet referred to above presents fairly, in all material respects, the financial position of Forterra, Inc. at June 21, 2016 (inception), in conformity with U.S. generally accepted accounting principles.
/s/ Ernst & Young LLP
Dallas, Texas
July 8, 2016, except for Note 3,
as to which the date is
October 6, 2016
Balance Sheet
At June 21, 2016 (inception)
| June 21, 2016 | June 21, 2016 | |||||||
| USD | USD | |||||||
Assets | ||||||||
Total assets | $ | — | $ | — | ||||
|
| |||||||
Shareholder’s equity | ||||||||
Common shares, $0.01 par value – 1,000 shares authorized, issued and outstanding | $ | 10 | ||||||
Common shares, $0.001 par value – 190,000,000 shares authorized and 41,619,472 shares issued and outstanding | $ | 10 | ||||||
Due from shareholder | (10 | ) | (10 | ) | ||||
|
| |||||||
Total shareholder’s equity | $ | — | $ | — | ||||
|
| |||||||
The accompanying notes are an integral part of this balance sheet.
Notes to Balance Sheet
As of June 21, 2016 (inception)
1. Organization and Nature of the Business
Forterra, Inc. (“the Company”) was formed on June 21, 2016 (inception). The initial stockholder of the Company is LSF9 Stardust Holdings, L.P., which holds all of the 1,000 common shares authorized, issued and outstanding.
2. Summary of Significant Accounting Policies
Basis of Presentation
The accompanying statement of financial position is prepared in accordance with generally accepted accounting principles in the United States of America (“U.S. GAAP”). The preparation of the financial statements in conformity with U.S. GAAP requires management to make estimates or assumptions that affect the reported amounts and disclosures in the financial statements. Actual future results could differ from these estimates and assumptions.
On the date of incorporation, the sole shareholder, LSF9 Stardust Holdings, L.P. acquired 1,000 common shares of the Company’s authorized common shares for a consideration of $0.01 per share, or total consideration of ten dollars.
3. Subsequent Event
On October 6, 2016, the Company effected a 41,619.472 for one stock split of its issued and outstanding shares of common stock. Prior to the stock split there were 1,000 shares of common stock outstanding and after the stock split there were 41,619,472. All share amounts presented on the Balance Sheet as of June 21, 2016 have been adjusted retrospectively, where applicable, to reflect the stock split. The Company filed an Amended and Restated Certificate of Incorporation which increased the authorized common shares to 190,000,000 shares with a par value of $0.001 per share, effective as of October 6, 2016 and, immediately after which, a 41,619.472 for one stock split previously approved by the Company’s Board of Directors and sole stockholder became effective.
Condensed Unaudited Consolidated Financial
Statements for six month period ended March 31,
2016 and March 31, 2015
Condensed Consolidated Balance Sheets (unaudited)
| March 31, 2016 | September 30, 2015 | |||||||
Assets | ||||||||
Current Assets | ||||||||
Cash and cash equivalents | $ | 2,181,860 | $ | 4,259,576 | ||||
Trade receivables | 85,573,897 | 101,841,294 | ||||||
Inventories | 95,320,884 | 89,213,052 | ||||||
Other current assets | 10,387,766 | 4,234,587 | ||||||
Deferred income taxes | 2,446,158 | 2,597,008 | ||||||
|
|
|
| |||||
Total current assets | 195,910,565 | 202,145,517 | ||||||
|
|
|
| |||||
Noncurrent assets | ||||||||
Property, plant and equipment, net | 152,629,268 | 164,245,140 | ||||||
Intangibles, net | 19,004,764 | 20,075,427 | ||||||
Deferred financing costs, net | 3,030,687 | 3,694,531 | ||||||
Goodwill | 44,678,190 | 44,678,190 | ||||||
|
|
|
| |||||
Total noncurrent assets | 219,342,909 | 232,693,288 | ||||||
|
|
|
| |||||
Total assets | $ | 415,253,474 | $ | 434,838,805 | ||||
|
|
|
| |||||
Liabilities and Stockholders’ Equity | ||||||||
Current Liabilities | ||||||||
Excess of checks over bank balances | $ | 7,177,938 | $ | 3,371,861 | ||||
Trade payables | 29,882,856 | 40,870,530 | ||||||
Accrued expenses: | ||||||||
Compensation and related | 4,092,916 | 6,316,313 | ||||||
Rebates | 3,084,944 | 4,670,093 | ||||||
Backcharges | 1,414,220 | 1,634,781 | ||||||
Property tax | 846,736 | 1,961,139 | ||||||
Current portion workers’ compensation | 1,636,145 | 3,382,316 | ||||||
Other current liabilities | 6,584,113 | 5,569,847 | ||||||
Income taxes payable | — | 4,965,334 | ||||||
Revolver loan | 72,983,909 | 80,661,540 | ||||||
Current portion long-term debt | 9,352,882 | 9,352,882 | ||||||
|
|
|
| |||||
Total current liabilities | 137,056,659 | 162,756,636 | ||||||
|
|
|
| |||||
Noncurrent Liabilities | ||||||||
Long-term debt – net of current portion | 169,273,422 | 173,949,863 | ||||||
Workers’ compensation – net of current portion | 6,524,107 | 5,859,046 | ||||||
Deferred income taxes | 36,151,075 | 38,093,814 | ||||||
Postretirement benefit obligation | 2,523,797 | 2,862,394 | ||||||
|
|
|
| |||||
Total noncurrent liabilities | 214,472,401 | 220,765,117 | ||||||
|
|
|
| |||||
Total liabilities | 351,529,060 | 383,521,753 | ||||||
|
|
|
| |||||
Stockholders’ Equity | ||||||||
Preferred stock; $.001 par value; authorized 150,000 shares | — | — | ||||||
Common stock; $.001 par value; authorized 150,000 shares; | 85 | 85 | ||||||
Additional paid in capital | 68,152,681 | 69,218,667 | ||||||
Accumulated deficit | (45,080,030 | ) | (56,365,673 | ) | ||||
Accumulated other comprehensive income | 651,678 | 567,134 | ||||||
|
|
|
| |||||
Total USP Holdings Inc. stockholders’ equity | 23,724,414 | 13,420,213 | ||||||
|
|
|
| |||||
Noncontrolling interest | 40,000,000 | 37,896,839 | ||||||
|
|
|
| |||||
Total stockholders’ equity | 63,724,414 | 51,317,052 | ||||||
|
|
|
| |||||
Total liabilities and stockholders’ equity | $ | 415,253,474 | $ | 434,838,805 | ||||
|
|
|
| |||||
See Notes to Condensed Consolidated Financial Statements.
USP HOLDINGS INC.
Condensed Consolidated Statements of Operations (unaudited)
For The Six Months Ended March 31,
| 2016 | 2015 | |||||||
Net sales | $ | 292,729,717 | $ | 287,695,483 | ||||
Cost of goods sold | 236,322,417 | 252,295,896 | ||||||
|
|
|
| |||||
Gross profit | 56,407,300 | 35,399,587 | ||||||
|
|
|
| |||||
Expenses: | ||||||||
Selling, general and administrative expenses | 25,652,010 | 23,929,312 | ||||||
Acquisition related costs (Note 2) | — | 958,938 | ||||||
Restructuring (Note 13) | 727,806 | — | ||||||
Impairment of long-lived assets (Note 13) | 376,568 | — | ||||||
Gain on fire related transactions (Note 14) | (250,000 | ) | (3,553,848 | ) | ||||
Amortization of intangibles | 1,070,663 | 140,556 | ||||||
|
|
|
| |||||
| 27,577,047 | 21,474,958 | |||||||
|
|
|
| |||||
Income from operations | 28,830,253 | 13,924,629 | ||||||
|
|
|
| |||||
Other income (expense): | ||||||||
Gain on bargain purchase of a business (Note 2) | — | 277,264 | ||||||
Amortization of deferred financing costs | (663,844 | ) | (444,445 | ) | ||||
Interest income | (422 | ) | 729 | |||||
Interest expense | (10,829,227 | ) | (8,041,188 | ) | ||||
Other income, net | 652,353 | 44,461 | ||||||
|
|
|
| |||||
| (10,841,140 | ) | (8,163,179 | ) | |||||
|
|
|
| |||||
Income before income taxes | 17,989,113 | 5,761,450 | ||||||
Income tax expense | (5,702,528 | ) | (2,595,225 | ) | ||||
|
|
|
| |||||
Net income | 12,286,585 | 3,166,225 | ||||||
Less: Net income – noncontrolling interest | 1,000,942 | 760,097 | ||||||
|
|
|
| |||||
Net income – attributable to USP Holdings Inc. | $ | 11,285,643 | $ | 2,406,128 | ||||
|
|
|
| |||||
See Notes to Condensed Consolidated Financial Statements.
USP HOLDINGS INC.
Condensed Consolidated Statements of Comprehensive Income (unaudited)
For The Six Months Ended March 31,
| 2016 | 2015 | |||||||
Net income | $ | 12,286,585 | $ | 3,166,225 | ||||
Other comprehensive income: | ||||||||
Postretirement changes other than net periodic benefit cost, net of tax | 120,777 | 497,493 | ||||||
|
|
|
| |||||
Comprehensive income | 12,407,362 | 3,663,718 | ||||||
Less: Comprehensive income attributable to noncontrolling interest | 1,037,175 | 909,345 | ||||||
|
|
|
| |||||
Comprehensive income attributable to USP Holdings Inc. | $ | 11,370,187 | $ | 2,754,373 | ||||
|
|
|
| |||||
See Notes to Condensed Consolidated Financial Statements.
USP HOLDINGS INC.
Condensed Consolidated Statements of Cash Flows (unaudited)
For The Six Months Ended March 31,
| 2016 | 2015 | |||||||
Cash Flows from Operating Activities | ||||||||
Net income | $ | 12,286,585 | $ | 3,166,225 | ||||
Adjustments to reconcile net income to net cash provided by operating activities: | ||||||||
Depreciation | 18,961,080 | 17,223,488 | ||||||
Amortization of deferred financing costs | 663,844 | 444,445 | ||||||
Impairment of long-lived assets | 376,568 | — | ||||||
Amortization of intangibles | 1,070,663 | 140,556 | ||||||
Provision for doubtful accounts | 13,000 | (17,276 | ) | |||||
Loss on sale of property and equipment | 256,914 | 85,280 | ||||||
Deferred income taxes | (1,791,889 | ) | 143,167 | |||||
Gain on bargain purchase of a business (Note 2) | — | (277,264 | ) | |||||
Changes in assets and liabilities, net of effect of business acquisitions: | ||||||||
Trade receivables, net | 16,254,397 | 11,736,655 | ||||||
Inventories | (6,107,832 | ) | (3,177,221 | ) | ||||
Other assets | (6,153,179 | ) | (6,034,449 | ) | ||||
Excess of checks over bank balances | 3,806,077 | 713,004 | ||||||
Accounts payable | (11,052,726 | ) | (18,374,485 | ) | ||||
Accrued expenses and other current and long-term liabilities | (5,428,174 | ) | (5,749,325 | ) | ||||
Income taxes payable | (4,965,334 | ) | (1,531,646 | ) | ||||
|
|
|
| |||||
Net cash provided by (used in) operating activities | 18,189,994 | (1,508,846 | ) | |||||
|
|
|
| |||||
Cash Flows from Investing Activities | ||||||||
Acquisition of businesses | — | (10,815,919 | ) | |||||
Purchase of property, plant and equipment | (7,924,100 | ) | (8,644,118 | ) | ||||
Proceeds from sale of long-term assets | 10,462 | 134,599 | ||||||
|
|
|
| |||||
Net cash used in investing activities | (7,913,638 | ) | (19,325,438 | ) | ||||
|
|
|
| |||||
Cash Flows from Financing Activities | ||||||||
Payments of deferred financing costs | — | (845,000 | ) | |||||
Repurchase of stock | — | (21,525,740 | ) | |||||
Distributions | — | (45,768,407 | ) | |||||
Net borrowings under revolver loan | (7,677,631 | ) | 32,702,897 | |||||
Proceeds on long-term debt financing | — | 54,782,714 | ||||||
Principal payments on long-term debt financing | (4,676,441 | ) | (1,279,087 | ) | ||||
|
|
|
| |||||
Net cash (used in) provided by financing activities | (12,354,072 | ) | 18,067,377 | |||||
|
|
|
| |||||
Decrease in cash | (2,077,716 | ) | (2,766,907 | ) | ||||
Cash: | ||||||||
Beginning of period | 4,259,576 | 3,675,087 | ||||||
|
|
|
| |||||
End of period | $ | 2,181,860 | $ | 908,180 | ||||
|
|
|
| |||||
(Continued)
USP HOLDINGS INC.
Condensed Consolidated Statements of Cash Flows (unaudited) (Continued)
For The Six Months Ended March 31,
| 2016 | 2015 | |||||||
Supplemental Disclosures of Cash Flow Information | $ | 10,935,437 | $ | 7,885,721 | ||||
|
|
|
| |||||
Income taxes paid | $ | 18,535,481 | $ | 9,354,373 | ||||
|
|
|
| |||||
Supplemental Disclosure of Noncash Operating Activities | ||||||||
Postretirement changes other than net periodic benefit costs | $ | 120,777 | $ | 497,493 | ||||
|
|
|
| |||||
Supplemental Schedules of Noncash Investing and Financing Activities Acquisition of Businesses (Note 2) | ||||||||
Assets acquired | $ | — | $ | 12,817,587 | ||||
Liabilities assumed | — | (1,724,404 | ) | |||||
|
|
|
| |||||
Net assets acquired | — | 11,093,183 | ||||||
Less gain on bargain purchase of a business (Note 2) | — | (277,264 | ) | |||||
|
|
|
| |||||
| $ | — | $ | 10,815,919 | |||||
|
|
|
| |||||
See Notes to Condensed Consolidated Financial Statements.
USP HOLDINGS INC.
Notes to Condensed Consolidated Financial Statements (unaudited)
Note 1. Nature of Business and Significant Accounting Policies
Nature of business: USP Holdings Inc. (the Company) is a diversified holding company, which owns entities that manufacture a broad line of ductile iron pipe, restraint joint products and other products. These products are sold primarily to waterworks distributors, contractors, municipalities, utilities and other governmental agencies, primarily in the United States, on credit terms approximating 60 days.
Preparation of Interim Financial Statements: Our unaudited condensed consolidated financial statements have been prepared in accordance with accounting principles generally accepted in the United States of America (GAAP).
The condensed consolidated balance sheet at September 30, 2015 has been derived from, but does not include, all the disclosures contained in the audited consolidated financial statements as of and for the year ended September 30, 2015. In management’s opinion, our unaudited condensed consolidated statements include all adjustments and accruals that are necessary for a fair presentation of the results of all interim periods reported herein and all such adjustments are of a normal, recurring nature.
The accompanying condensed consolidated financial statements include our accounts and the accounts of our wholly-owned direct and indirect subsidiaries. All significant intercompany accounts and transactions have been eliminated in consolidation.
The preparation of these condensed consolidated financial statements requires management to make judgments and estimates that affect the amounts reported in our condensed consolidated financial statements and accompanying notes. Actual results may differ from these estimates under different assumptions or conditions.
The interim financial statements contained in this report should be read in conjunction with the audited consolidated financial statements and footnotes thereto included in USP Holdings Inc. Consolidated Financial Report for the year ended September 30, 2015.
Recent accounting pronouncements: In May 2014, the Financial Accounting Standards Board (FASB) issued Accounting Standard Update (ASU) 2014-09 Topic 606,Revenue from Contracts with Customers, and amended its standards related to revenue recognition. This amendment replaces all existing revenue recognition guidance and provides a single, comprehensive revenue recognition model for all contracts with customers. The standard contains principles that will be applied to determine the measurement of revenue and timing of when it is recognized. The underlying principle is that the Company will recognize revenue in a manner that depicts the transfer of goods or services to customers at an amount that the Company expects to be entitled to in exchange for those goods or services. The standard allows either full or modified retrospective adoption. Early adoption is not permitted. The guidance provides a five-step analysis of transactions to determine when and how revenue is recognized. Other major provisions include capitalization of certain contract costs, consideration of time value of money in the transaction price, and allowing estimates of variable consideration to be recognized before contingencies are resolved in certain circumstances. The amendment also requires additional disclosure about the nature, amount, timing and uncertainty of revenue and cash flows arising from customer contracts, including significant judgments and changes in judgments and assets recognized from costs incurred to fulfill a contract. The new rules will become effective for annual reporting periods beginning after December 15, 2018, and interim periods within annual periods beginning after December 15, 2019. The principal-versus-agent implementation
USP HOLDINGS INC.
Notes to Condensed Consolidated Financial Statements (unaudited)
Note 1. Nature of Business and Significant Accounting Policies—(Continued)
guidance in ASC 2014-09 were modified by ASU 2016-08 issued in March 2016 as discussed below. The Company is in the process of evaluating the impact the amendment will have on the condensed consolidated financial statements.
In March 2016, the FASB issued ASU 2016-08, which amends the principal-versus-agent implementation guidance and illustrations in ASU 2014-09. Among other things, ASU 2016-08 clarifies that an entity should evaluate whether it is the principal or the agent for each specified good or service promised in a contract with a customer. As defined in ASU 2016-08, a specified good or service is “a distinct good or service (or a distinct bundle of goods or services) to be provided to the customer.” Therefore, for contracts involving more than one specified good or service, the entity may be the principal for one or more specified goods or services and the agent for others. ASU 2016-08 has the same effective date as ASU 2014-09, as amended by ASU 2015-14. The Company is required to adopt ASU 2016-08 using the same transition method it uses to adopt ASU 2014-09. The Company is currently evaluating the impact the adoption of ASU 2014-09, ASU 2015-14 and ASU 2016-08 will have on its condensed consolidated financial statements.
In July 2015, the FASB issued ASU 2015-11,Inventory (Topic 330): Simplifying the Measurement of Inventory,requiring an entity to measure inventory within the scope of the ASU at the lower of cost and net realizable value. For public business entities, the amendments in this update are effective for financial statements issued for fiscal years beginning after December 15, 2016, and interim periods within those fiscal years. The Company is currently evaluating whether this ASU will have a material impact on its condensed consolidated financial statements.
In August 2014, the FASB issued ASU 2014-15,Presentation of Financial Statements – Going Concern (Subtopic 205-40): Disclosure of Uncertainties about an Entity’s Ability to Continue as a Going Concern,defining when and how companies are required to disclose going concern uncertainties, which must be evaluated each interim and annual period. Specifically, it requires management to determine whether substantial doubt exists regarding the entity’s going concern presumption. Substantial doubt about an entity’s ability to continue as a going concern exists when relevant conditions and events, considered in the aggregate, indicate that it is probable that the entity will be unable to meet its obligations as they become due within one year after the date the financial statements are issued. If substantial doubt exists, certain disclosures are required. The provisions of this ASU are effective for annual periods ending after December 15, 2016 and to annual and interim periods thereafter. Early adoption is permitted. The ASU should be applied on a prospective basis. The Company believes the adoption of this ASU will not have a material impact on the Company’s disclosures.
In February 2015, the FASB issued ASU 2015-02 Topic 810,Amendments to the Consolidation Analysis. ASU 2015-02 amends current consolidation guidance by modifying the evaluation of whether limited partnerships and similar legal entities are variable interest entities or voting interest entities, eliminating the presumption that a general partner should consolidate a limited partnership, and affects the consolidation analysis of reporting entities that are involved with variable interest entities. ASU 2015-02 is effective for interim and annual reporting periods beginning after December 15, 2015, with early adoption permitted. All legal entities are subject to reevaluation under the revised consolidation model. The adoption of ASU 2015-02 is not expected to have a material impact on the Company’s condensed consolidated financial position, results of operations or cash flows.
USP HOLDINGS INC.
Notes to Condensed Consolidated Financial Statements (unaudited)
Note 1. Nature of Business and Significant Accounting Policies—(Continued)
In September 2015, the FASB issued ASU 2015-16,Business Combinations (Topic 805),which requires an acquirer to retrospectively adjust provisional amounts recognized in a business combination during the measurement period. To simplify the accounting for adjustments made to provisional amounts, the amendments in this update require that the acquirer recognize adjustments to provisional amounts that are identified during the measurement-period in the reporting period in which the adjustment amount is determined. The acquirer is required to also record, in the same period’s financial statements, the effect on earnings of changes in depreciation, amortization or other income effects, if any, as a result of the change to the provisional amounts, calculated as if the accounting had been completed at the acquisition date. In addition, an entity is required to present separately on the face of the income statement or disclose in the notes to the financial statements the portion of the amount recorded in current period earnings by line item that would have been recorded in previous reporting periods if the adjustment to the provisional amounts had been recognized as of the acquisition date. For public business entities, the amendments in this update are effective for fiscal years beginning after December 15, 2015, including interim periods within those fiscal years. The Company is still evaluating whether this ASU will have a material impact on its condensed consolidated financial statements.
In November 2015, the FASB issued ASU 2015-17 Topic 740,Balance Sheet Classification of Deferred Taxes, which simplifies the presentation of deferred income taxes. ASU 2015-17 requires that deferred tax assets and liabilities be classified as noncurrent in a classified statement of financial position. ASU 2015-17 is effective for financial statements issued for fiscal years beginning after December 15, 2016 (and interim periods within those fiscal years) with early adoption permitted. ASU 2015-17 may be either applied prospectively to all deferred tax assets and liabilities or retrospectively to all periods presented. The Company is currently evaluating whether this ASU will have a material impact on its condensed consolidated financial statements.
In February 2016, the FASB issued ASU 2016-02,Leases (Topic 842), amending the existing accounting standards for lease accounting, including requiring lessees to recognize most leases on their balance sheets and making targeted changes to lessor accounting. For public business entities, the amendments in this update are effective for annual reporting periods beginning after December 15, 2018, including interim periods within those fiscal years, and early adoption is permitted as of the standard’s issuance date. ASU 2016-02 requires a modified retrospective transition approach for all leases existing at, or entered into after, the date of initial application, with an option to use certain transition relief. The Company believes this ASU will have a material impact on its condensed consolidated financial statements as it will result in most of the Company’s leases and associated assets being presented on the balance sheet.
In August 2015, the FASB issued ASU 2015-15, as ASU 2015-03 did not specifically address presentation or subsequent measurement of debt issuance costs related to line-of-credit arrangements. ASU 2015-15 allows an entity to continue to defer and present debt issuance costs ratably over the term of the line-of-credit arrangement, regardless of whether there are any outstanding borrowings on the line-of-credit arrangement. The guidance in ASU 2015-03 and ASU 2015-15 is effective for financial statements issued for fiscal years beginning after December 15, 2015, and interim periods within those fiscal years. Early adoption is permitted for financial statements that have not been previously issued. Had the Company adopted this guidance early, other assets would have been lower by approximately $3,060,687 and $3,694,531 with corresponding decreases in debt as of March 31, 2016 and September 30, 2015, respectively. The adoption of this standard will have no impact on the Company’s results of operations, cash flows or net assets.
USP HOLDINGS INC.
Notes to Condensed Consolidated Financial Statements (unaudited)
Note 2. Acquisition of Businesses
On December 16, 2014, the Company acquired substantially all of the assets of Metalfit (Metalfit, S.A. de C.V. and Metalfit, Inc.) for total consideration of $10,815,919. This transaction will allow the Company to grow by entering new markets. The assets acquired and liabilities assumed were recorded at their fair value. In connection with the transaction, the Company incurred $958,938 of transaction costs which are included in operating expenses for the six month period ended March 31, 2015.
The following tables summarize the consideration paid and the fair value of the assets acquired and liabilities assumed at the acquisition date.
Consideration: | ||||
Cash | $ | 10,815,919 | ||
|
| |||
Recognized amounts of identifiable assets acquired: | ||||
Accounts receivable | $ | 3,088,846 | ||
Inventory | 3,086,000 | |||
Prepaid expenses and other assets | 152,411 | |||
Property and equipment | 5,750,330 | |||
Intangibles – customer relationships | 660,000 | |||
Intangibles – non-compete | 20,000 | |||
Intangibles – backlog of orders | 25,000 | |||
Intangibles – trademarks | 35,000 | |||
|
| |||
| 12,817,587 | ||||
|
| |||
Recognized amounts of identifiable liabilities assumed: | ||||
Accounts payable and accrued expenses | 1,724,404 | |||
|
| |||
| 1,724,404 | ||||
|
| |||
Total identifiable net assets acquired | 11,093,183 | |||
Gain on bargain purchase of a business | (277,264 | ) | ||
|
| |||
| $ | 10,815,919 | |||
|
|
| Amount | Useful Life | |||||||
Intangibles – customer relationships | $ | 660,000 | 5 | |||||
Intangibles – non-compete | 20,000 | 5 | ||||||
Intangibles – backlog of orders | 25,000 | 1 | ||||||
Intangibles – trademarks | 35,000 | 1 | ||||||
|
| |||||||
| $ | 740,000 | |||||||
|
| |||||||
Weighted average useful life (in years) | 4.7 | |||||||
|
| |||||||
On August 10, 2015, the Company acquired the shares of Custom Fab, LLC for total consideration of $43,884,339. This transaction will allow the Company to realize significant synergy savings and provide better service to the customer base. The assets acquired and liabilities assumed were recorded at their fair value. In connection with the transaction, the Company incurred $1,162,703 of transaction costs which are included in operating expenses for the year ended September 30, 2015. Goodwill of $19,559,759 was recorded as part of the acquisition. Approximately $775,000 of the goodwill is deductible for income tax purposes.
USP HOLDINGS INC.
Notes to Condensed Consolidated Financial Statements (unaudited)
Note 2. Acquisition of Businesses—(Continued)
The following tables summarize the consideration paid and the fair value of the assets acquired and liabilities assumed at the acquisition date.
| ||||
| ||||
| ||||
| ||||
| ||||
| ||||
| ||||
| ||||
| ||||
| ||||
| ||||
| ||||
| ||||
| ||||
| ||||
| ||||
| ||||
| ||||
Consideration: | ||||
Cash | $ | 43,071,848 | ||
Due to seller | 812,491 | |||
|
| |||
| $ | 43,884,339 | |||
|
| |||
Recognized amounts of identifiable assets acquired: | ||||
Accounts receivable | $ | 7,103,841 | ||
Inventory | 7,547,000 | |||
Prepaid expenses and other assets | 670,731 | |||
Property and equipment | 13,315,932 | |||
Intangibles – customer relationships | 8,170,000 | |||
Intangibles – non-compete | 460,000 | |||
Intangibles – backlog of orders | 90,000 | |||
Intangibles – trademarks | 2,550,000 | |||
|
| |||
| 39,907,504 | ||||
|
| |||
Recognized amounts of identifiable liabilities assumed: | ||||
Excess of checks over bank balances | 282,158 | |||
Accounts payable and accrued expenses | 8,051,240 | |||
Deferred income taxes | 7,249,526 | |||
|
| |||
| 15,582,924 | ||||
|
| |||
Total identifiable net assets acquired | 24,324,580 | |||
Goodwill | 19,559,759 | |||
|
| |||
| $ | 43,884,339 | |||
|
|
| Amount | Useful Life | |||||||
Intangibles – customer relationships | $ | 8,170,000 | 6 | |||||
Intangibles – non-compete | 460,000 | 5 | ||||||
Intangibles – backlog of orders | 90,000 | 1 | ||||||
Intangibles – trademarks | 2,550,000 | 10 | ||||||
|
| |||||||
| $ | 11,270,000 | |||||||
|
| |||||||
Weighted average useful life (in years) | 6.8 | |||||||
|
| |||||||
USP HOLDINGS INC.
Notes to Condensed Consolidated Financial Statements (unaudited)
Note 3. Inventory
Inventory as of:
| March 31, 2016 | September 30, 2015 | |||||||
Raw materials | $ | 27,548,824 | $ | 28,492,730 | ||||
Work-in-process | 3,258,223 | 1,787,707 | ||||||
Finished goods | 48,614,071 | 45,098,645 | ||||||
Supplies | 16,420,577 | 14,589,761 | ||||||
|
|
|
| |||||
| 95,841,695 | 89,968,843 | |||||||
Less: excess and obsolete reserve | 520,811 | 755,791 | ||||||
|
|
|
| |||||
| $ | 95,320,884 | $ | 89,213,052 | |||||
|
|
|
| |||||
Note 4. Property and Equipment
Property and equipment as of:
| March 31, 2016 | September 30, 2015 | |||||||
Machinery and equipment | $ | 179,906,979 | $ | 176,660,673 | ||||
Land and mineral resources | 31,972,500 | 31,972,500 | ||||||
Buildings | 19,388,974 | 18,998,567 | ||||||
Pipe molds | 13,867,237 | 13,670,932 | ||||||
Construction in progress | 12,150,717 | 10,177,646 | ||||||
Land improvements | 3,543,154 | 3,282,911 | ||||||
Computer software | 1,172,453 | 1,104,867 | ||||||
|
|
|
| |||||
| 262,002,014 | 255,868,096 | |||||||
Less: accumulated depreciation | 109,372,746 | 91,622,956 | ||||||
|
|
|
| |||||
| $ | 152,629,268 | $ | 164,245,140 | |||||
|
|
|
| |||||
Depreciation expense was $18,961,080 and $17,223,488 for the six months ended March 31, 2016 and 2015, respectively.
USP HOLDINGS INC.
Notes to Condensed Consolidated Financial Statements (unaudited)
Note 5. Intangible Assets and Goodwill
The following is a summary of goodwill and intangible assets as of March 31, 2016:
| Gross Carrying Amount | Accumulated Amortization | Carrying Values | Estimated Useful Life | |||||||||||||
Amortizing: | ||||||||||||||||
Trademarks | $ | 3,685,000 | $ | 380,027 | $ | 3,304,973 | 1-14 years | |||||||||
Customer relationships | 9,210,000 | 1,182,141 | 8,027,859 | 5-6 years | ||||||||||||
Backlog of orders | 115,000 | 83,957 | 31,043 | 1 year | ||||||||||||
Non-compete | 535,000 | 97,111 | 437,889 | 5 years | ||||||||||||
|
|
|
|
|
| |||||||||||
| 13,545,000 | 1,743,236 | 11,801,764 | ||||||||||||||
|
|
|
|
|
| |||||||||||
Non-amortizing: | ||||||||||||||||
Trademarks | 7,203,000 | — | 7,203,000 | Indefinite | ||||||||||||
|
|
|
|
|
| |||||||||||
| $ | 20,748,000 | $ | 1,743,236 | $ | 19,004,764 | |||||||||||
|
|
|
|
|
| |||||||||||
Goodwill | $ | 44,678,190 | $ | — | $ | 44,678,190 | Indefinite | |||||||||
|
|
|
|
|
| |||||||||||
The following is a summary of goodwill and intangible assets as of September 30, 2015:
| Gross Carrying Amount | Accumulated Amortization | Carrying Values | Estimated Useful Life | |||||||||||||
Amortizing: | ||||||||||||||||
Trademarks | $ | 3,685,000 | $ | 192,424 | $ | 3,492,576 | 1-14 years | |||||||||
Customer relationships | 9,210,000 | 403,463 | 8,806,537 | 5-6 years | ||||||||||||
Backlog of orders | 115,000 | 31,069 | 83,931 | 1 year | ||||||||||||
Non-compete | 535,000 | 45,617 | 489,383 | 5 years | ||||||||||||
|
|
|
|
|
| |||||||||||
| 13,545,000 | 672,573 | 12,872,427 | ||||||||||||||
|
|
|
|
|
| |||||||||||
Non-amortizing: | ||||||||||||||||
Trademarks | 7,203,000 | — | 7,203,000 | Indefinite | ||||||||||||
|
|
|
|
|
| |||||||||||
| $ | 20,748,000 | $ | 672,573 | $ | 20,075,427 | |||||||||||
|
|
|
|
|
| |||||||||||
Goodwill | $ | 44,678,190 | $ | — | $ | 44,678,190 | Indefinite | |||||||||
|
|
|
|
|
| |||||||||||
Aggregate future annual amortization expense for amortizing intangible assets is as follows:
Years ending September 30, | ||||
2016 | $ | 1,013,290 | ||
2017 | 1,997,571 | |||
2018 | 1,997,571 | |||
2019 | 1,986,536 | |||
2020 | 1,814,250 | |||
Thereafter | 2,992,546 | |||
|
| |||
| $ | 11,801,764 | |||
|
|
USP HOLDINGS INC.
Notes to Condensed Consolidated Financial Statements (unaudited)
Note 5. Intangible Assets and Goodwill (Continued)
Goodwill is not amortized. The Company reviews goodwill for impairment annually, and whenever events or changes in circumstances indicate its carrying amount may not be recoverable. Based on the Company’s review for potential indicators of impairment performed during the six months ended March 31, 2016 and the fiscal year ended September 30, 2015, there were no indicators of impairment.
Note 6. Revolving Credit Facility
On August 10, 2015, the Company amended its credit agreement with a financial institution to increase the revolver loan to a commitment of $112,000,000 secured by inventory and accounts receivable. The revolver is subject to a borrowing base calculation that is derived from a percentage of eligible receivables and inventory. As of March 31, 2016, the revolver had borrowings of $72,983,909 and letters of credit of $3,350,000 outstanding with $25,539,177 remaining available on the commitment. The credit agreement contains a fixed charge ratio covenant and matures on July 23, 2018. As of March 31, 2016, the stated interest rate is prime rate (3.50% at March 31, 2016) plus an applicable margin based on the revolver average excess availability. The effective interest rate is 4.594% as of March 31, 2016. The revolver loan is included in current liabilities in the accompanying condensed consolidated balance sheets due to the fact that the credit agreement has a subjective acceleration clause and requires a traditional lockbox to be in place.
Note 7. Long-Term Debt
Long-term debt consists of:
| March 31, 2016 | September 30, 2015 | |||||||
Term Loan 1 | $ | 10,704,172 | $ | 11,596,186 | ||||
Term Loan 2 | 4,000,000 | 5,000,000 | ||||||
Term Loan 3 | 13,922,132 | 16,706,559 | ||||||
Subordinated Debt | 150,000,000 | 150,000,000 | ||||||
|
|
|
| |||||
Total | 178,626,304 | 183,302,745 | ||||||
Less: Current Portion | 9,352,882 | 9,352,882 | ||||||
|
|
|
| |||||
Total Long-Term Debt | $ | 169,273,422 | $ | 173,949,863 | ||||
|
|
|
| |||||
Annual principal payments on long-term debt for the following years is as follows:
Years ending September 30, | ||||
2016 | $ | 4,676,440 | ||
2017 | 9,352,882 | |||
2018 | 14,596,982 | |||
2019 | 150,000,000 | |||
|
| |||
| $ | 178,626,304 | |||
|
|
Note 8. Commitments and contingencies
Legal Matters
The Company is involved in legal proceedings and litigation in the ordinary course of business. In the opinion of management, the outcome of such matters will not have a material adverse effect on the
USP HOLDINGS INC.
Notes to Condensed Consolidated Financial Statements (unaudited)
Note 8. Commitments and contingencies—(Continued)
Company’s financial position, results of operations, or liquidity. Other than routine litigation incidental to the Company business, there are no material legal proceedings to which the Company is a party or to which any of the Company’s properties are subject.
Note 9. Related-Party Transactions
On April 2, 2012, the Company entered into a management agreement with Comvest Advisors, LLC and Wynnchurch Capital, Ltd, the managers of USP Holdings Inc. The Company has to pay an annual management fee related to services performed on the Company’s operations and development and implementation of strategies for improving the operating, marketing and financial performance. This fee totaled $250,000 for each of the six months ended March 31, 2016 and 2015. As of March 31, 2016, $110,000 remained payable to the related parties and is included in other accrued expenses on the condensed consolidated balance sheet.
Note 10. Employee Benefit Plans
Postretirement Benefits Other than Pensions
The Company provides certain medical and life insurance benefits for certain retirees hired prior to November 21, 2004. The plan covers former union employees of the Griffin Pipe Council Bluffs location hired prior to November 21, 2004, former union employees of the Griffin Pipe Lynchburg location hired prior to November 24, 2002 and salaried and non-union employees of Griffin Pipe hired prior to October 1, 2001. The plan was amended in 2014 to eliminate the postretirement benefits for active employees.
The Company made contributions of $299,348 and $324,602 for the six month periods ended March 31, 2016 and 2015, respectively.
Net postretirement benefit cost for the six months ended March 31, 2016 and 2015 consisted of the following components:
| Six months ended: | ||||||||
| March 31, 2016 | March 31, 2015 | |||||||
Interest costs | $ | 59,476 | $ | 86,302 | ||||
|
|
|
| |||||
Net postretirement benefit cost | $ | 59,476 | $ | 86,302 | ||||
|
|
|
| |||||
Note 11. Stockholders’ Equity
Common Stock
Each share of common stock is entitled to one vote and shall be identical in all respects and shall entitle the holder to the same rights and privileges.
Stock options
On April 1, 2012, the Company created the USP Holdings Inc. 2012 stock option plan. The purpose of the plan is to promote the success and enhance the value of the Company by linking the personal interests of the members of the board of directors and key employees to those of the
USP HOLDINGS INC.
Notes to Condensed Consolidated Financial Statements (unaudited)
Note 11. Stockholders’ Equity—(Continued)
Company’s stockholders and by providing such individuals with an incentive for outstanding performance to generate superior returns for the Company’s stockholders. The stock option plan provides for 7,494 options available to be awarded. The options that are awarded may be redeemed for cash or Company stock only upon the occurrence of a change in control event, as defined in the agreement, based on a prescribed formula, are not transferable and are forfeited upon termination of employment. Because full vesting is not complete until a change in control event is consummated, no compensation expense has been recorded for the six months ended March 31, 2016 and 2015. The plan was vested and settled as a part of the sale to Forterra Building Products on April 15, 2016 as referenced in Note 15 Subsequent Events.
Note 12. Griffin Pipe Products Co., LLC – Council Bluffs Facility
The Council Bluffs, Iowa facility acquired during the Griffin acquisition was idled in April 2014 due to industry demand. The Company has retained maintenance personnel at the facility to “exercise” the equipment in anticipation of an eventual restart. During the 2015 planning process, the Company developed a detailed startup plan for the facility. The Company continuously monitors market demands and production requirements to assess the need for additional capacity and the restart of the facility.
At March 31, 2016, the Company believes there are no events or circumstances that indicate that the carrying amounts of these idle assets are not recoverable or exceed their fair value.
Since the date of acquisition, January 31, 2014, $11,040,089 was recorded in depreciation expense related to these assets. These assets are recorded in the noncurrent section of the Company’s condensed consolidated balance sheet.
The following is a summary of idle assets:
| March 31, 2016 | September 30, 2015 | |||||||
Machinery and equipment | $ | 23,467,808 | $ | 23,419,808 | ||||
Land and mineral resources | 2,080,000 | 2,080,000 | ||||||
Buildings | 1,401,563 | 1,401,563 | ||||||
Pipe molds | 1,891,509 | 1,891,509 | ||||||
Construction in progress | 466,157 | 464,412 | ||||||
Computer software | 134,705 | 134,705 | ||||||
|
|
|
| |||||
| $ | 29,441,742 | $ | 29,391,997 | |||||
Less: accumulated depreciation | 11,040,089 | 8,388,011 | ||||||
|
|
|
| |||||
| $ | 18,401,653 | $ | 21,003,986 | |||||
|
|
|
| |||||
Note 13. Restructuring Costs
During the six months ended March 31, 2016, the Company closed three plants located in Fontana, California, Portland, Oregon and Ocala, Florida. The plants were closed to save costs as production was consolidated into other plants in the geographic regions. The related charges are included in the restructuring, asset impairment and cost of goods sold lines in the Company’s accompanying condensed consolidated statements of operations. The planned actions relating to this
USP HOLDINGS INC.
Notes to Condensed Consolidated Financial Statements (unaudited)
Note 13. Restructuring Costs—(Continued)
restructure were substantially completed at the end of March 31, 2016 with some continuing costs at the Ocala, Florida location expected through the end of October 2016. The total cost expended in closing these plants during the six months ended March 31, 2016 was $1,365,884.
The following is a summary of the plant closure costs incurred during the six months ended March 31, 2016:
Costs charged to restructuring: | ||||
Lease termination | $ | 454,300 | ||
Relocation of equipment and cleanup | 135,494 | |||
Severance | 53,585 | |||
Other costs to wind down operations | 84,427 | |||
|
| |||
Total charged to restructuring | 727,806 | |||
Asset impairment | 376,568 | |||
Inventory write-downs charged to cost of sales | 261,510 | |||
|
| |||
Total costs expended through March 31, 2016 | $ | 1,365,884 | ||
|
|
As of March 31, 2016 the Company had a remaining liability of approximately $17,000 for severance payment obligations.
Note: 14. Significant Event
On April 29, 2014, the Company experienced a fire at its Bessemer, Alabama manufacturing facility that damaged a production line.
The Company maintains insurance for both property damage and business interruption relating to catastrophic events. Business interruption covers lost profits and other costs incurred. Non-refundable insurance recoveries received in excess of the net book value of damaged assets, cleanup and post-event costs are recognized as income in the period received.
The Company received the final insurance recovery of $250,000 during the six months ended March 31, 2016 bringing the total insurance recoveries received related to this event to $9,291,239. No additional amounts are expected to be received related to insurance recoveries and no additional costs are expected to be incurred.
Note: 15. Subsequent Events
On April 15, 2016, the Company was acquired by Forterra Building Products (Forterra) pursuant to an agreement, dated as of February 12, 2016. Under the terms of the agreement, Forterra paid approximately $780.0$775.1 million in cash, subject to certain closing adjustments, for all outstanding shares of the Company, retirement of the existing indebtedness of approximately $253.4 million and retirement of the noncontrolling interest of $40.0 million as of the transaction closing date.
Consolidated Financial Report
September 30, 2015
To the Board of Directors
USP Holdings Inc.
Birmingham, Alabama
Report on the Financial Statements
We have audited the accompanying consolidated financial statements of USP Holdings Inc. which comprise the consolidated balance sheets as of September 30, 2015 and 2014, and the related consolidated statements of operations, comprehensive income (loss), changes in stockholders’ equity, and cash flows for each of the three years in the period ended September 30, 2015, and the related notes to the consolidated financial statements, (collectively financial statements).
Management’s Responsibility for the Financial Statements
Management is responsible for the preparation and fair presentation of these financial statements in accordance with accounting principles generally accepted in the United States of America; this includes the design, implementation, and maintenance of internal control relevant to the preparation and fair presentation of financial statements that are free from material misstatement, whether due to fraud or error.
Auditor’s Responsibility
Our responsibility is to express an opinion on these financial statements based on our audits. We conducted our audits in accordance with auditing standards generally accepted in the United States of America. Those standards require that we plan and perform the audit to obtain reasonable assurance about whether the financial statements are free from material misstatement.
An audit involves performing procedures to obtain audit evidence about the amounts and disclosures in the financial statements. The procedures selected depend on the auditor’s judgment, including the assessment of the risks of material misstatement of the financial statements, whether due to fraud or error. In making those risk assessments, the auditor considers internal control relevant to the entity’s preparation and fair presentation of the financial statements in order to design audit procedures that are appropriate in the circumstances, but not for the purpose of expressing an opinion on the effectiveness of the entity’s internal control. Accordingly, we express no such opinion. An audit also includes evaluating the appropriateness of accounting policies used and the reasonableness of significant accounting estimates made by management, as well as evaluating the overall presentation of the financial statements.
We believe that the audit evidence we have obtained is sufficient and appropriate to provide a basis for our audit opinion.
Opinion
In our opinion, the financial statements referred to above present fairly, in all material respects, the financial position of USP Holdings Inc. as of September 30, 2015 and 2014, and the results of its operations and its cash flows for each of the three years in the period ended September 30, 2015 in accordance with accounting principles generally accepted in the United States of America.
/s/ RSM US LLP
Schaumburg, Illinois
June 30, 2016
September 30,
| 2015 | 2014 | |||||||
Assets | ||||||||
Current Assets | ||||||||
Cash | $ | 4,259,576 | $ | 3,675,087 | ||||
Accounts receivable, less allowance for doubtful accounts of $1,264,000 and $994,000 at September 30, 2015 and 2014, respectively | 101,841,294 | 89,948,780 | ||||||
Inventory, net | 89,213,052 | 79,718,509 | ||||||
Prepaid expenses and other current assets | 4,234,587 | 2,336,047 | ||||||
Deferred income taxes | 2,597,008 | 1,905,421 | ||||||
|
|
|
| |||||
Total current assets | 202,145,517 | 177,583,844 | ||||||
|
|
|
| |||||
Noncurrent assets | ||||||||
Property and equipment, net | 164,245,140 | 159,294,518 | ||||||
Intangibles, net | 20,075,427 | 8,777,091 | ||||||
Deferred financing costs, net | 3,694,531 | 3,553,264 | ||||||
Goodwill | 44,678,190 | 25,118,431 | ||||||
|
|
|
| |||||
Total noncurrent assets | 232,693,288 | 196,743,304 | ||||||
|
|
|
| |||||
Total assets | $ | 434,838,805 | $ | 374,327,148 | ||||
|
|
|
| |||||
Liabilities and Stockholders’ Equity | ||||||||
Current Liabilities | ||||||||
Excess of checks over bank balances | $ | 3,371,861 | $ | 4,688,259 | ||||
Trade accounts payable | 40,870,530 | 52,487,679 | ||||||
Accrued expenses: | ||||||||
Compensation and related | 6,316,313 | 5,388,296 | ||||||
Rebates | 4,670,093 | 4,133,651 | ||||||
Backcharges | 1,634,781 | 701,267 | ||||||
Property tax | 1,961,139 | 2,240,170 | ||||||
Current portion workers’ compensation | 3,382,316 | 3,679,708 | ||||||
Restructuring | ||||||||
Other | 5,569,847 | 4,165,117 | ||||||
Income taxes payable | 4,965,334 | 1,531,646 | ||||||
Revolver loan | 80,661,540 | 41,257,780 | ||||||
Current portion long-term debt | 9,352,882 | 3,069,810 | ||||||
|
|
|
| |||||
Total current liabilities | 162,756,636 | 123,343,383 | ||||||
|
|
|
| |||||
Noncurrent Liabilities | ||||||||
Long-term debt – net of current portion | 173,949,863 | 113,426,563 | ||||||
Workers’ compensation – net of current portion | 5,859,046 | 7,750,730 | ||||||
Deferred income taxes | 38,093,814 | 32,751,062 | ||||||
Postretirement benefit obligation | 2,862,394 | 4,673,702 | ||||||
|
|
|
| |||||
Total noncurrent liabilities | 220,765,117 | 158,602,057 | ||||||
|
|
|
| |||||
Total liabilities | 383,521,753 | 281,945,440 | ||||||
|
|
|
| |||||
Stockholders’ Equity | ||||||||
Preferred stock; $.001 par value; authorized 150,000 shares | — | 21 | ||||||
Common stock; $.001 par value; authorized 150,000 shares; | 85 | 85 | ||||||
Additional paid in capital | 69,218,667 | 97,531,386 | ||||||
Accumulated deficit | (56,365,673 | ) | (32,374,329 | ) | ||||
Accumulated other comprehensive income (loss) | 567,134 | (129,356 | ) | |||||
|
|
|
| |||||
Total USP Holdings Inc. stockholders’ equity | 13,420,213 | 65,027,807 | ||||||
|
|
|
| |||||
Noncontrolling interest | 37,896,839 | 27,353,901 | ||||||
|
|
|
| |||||
Total stockholders’ equity | 51,317,052 | 92,381,708 | ||||||
|
|
|
| |||||
Total liabilities and stockholders’ equity | $ | 434,838,805 | $ | 374,327,148 | ||||
|
|
|
| |||||
See Notes to Consolidated Financial Statements.
Consolidated Statements of Operations
For The Years Ended September 30,
| 2015 | 2014 | 2013 | ||||||||||
Net revenues | $ | 618,119,413 | $ | 521,126,977 | $ | 432,141,581 | ||||||
Cost of goods sold | 516,560,943 | 459,615,075 | 382,449,175 | |||||||||
|
|
|
|
|
| |||||||
Gross profit | 101,558,470 | 61,511,902 | 49,692,406 | |||||||||
|
|
|
|
|
| |||||||
Expenses: | ||||||||||||
Selling, general and administrative expenses | 47,573,349 | 41,050,853 | 44,256,930 | |||||||||
Transaction costs (Note 2) | 2,121,641 | 1,093,714 | 113,875 | |||||||||
Restructuring (Note 18) | — | 5,321,362 | — | |||||||||
Gain on fire related transactions (Note 19) | (6,289,234 | ) | (715,547 | ) | — | |||||||
Amortization of intangibles | 562,441 | 130,909 | — | |||||||||
|
|
|
|
|
| |||||||
| 43,968,197 | 46,881,291 | 44,370,805 | ||||||||||
|
|
|
|
|
| |||||||
Income from operations | 57,590,273 | 14,630,611 | 5,321,601 | |||||||||
|
|
|
|
|
| |||||||
Other income (expense): | ||||||||||||
Gain on bargain purchase of a business (Note 2) | 277,264 | — | — | |||||||||
Loss on contract settlement (Note 2) | — | — | (2,590,000 | ) | ||||||||
Amortization of deferred financing costs | (1,064,033 | ) | (1,332,640 | ) | (313,722 | ) | ||||||
Interest income | 164 | 14,783 | 33,202 | |||||||||
Interest expense | (19,110,828 | ) | (15,581,077 | ) | (4,284,300 | ) | ||||||
Other income, net | 899,882 | — | ||||||||||
|
|
|
|
|
| |||||||
| (18,997,551 | ) | (16,898,934 | ) | (7,154,820 | ) | |||||||
|
|
|
|
|
| |||||||
Income (loss) before income taxes | 38,592,722 | (2,268,323 | ) | (1,833,219 | ) | |||||||
Income taxes | (13,358,216 | ) | 2,965,235 | 1,368,050 | ||||||||
|
|
|
|
|
| |||||||
Net income (loss) | 25,234,506 | 696,912 | (465,169 | ) | ||||||||
Less: Net income (loss) – noncontrolling interest | 3,457,443 | (1,417,661 | ) | — | ||||||||
|
|
|
|
|
| |||||||
Net income (loss) – attributable to USP Holdings Inc. | $ | 21,777,063 | $ | 2,114,573 | $ | (465,169 | ) | |||||
|
|
|
|
|
| |||||||
See Notes to Consolidated Financial Statements.
Consolidated Statements of Comprehensive Income (Loss)
For The Years Ended September 30,
| 2015 | 2014 | 2013 | ||||||||||
Net income (loss) | $ | 25,234,506 | $ | 696,912 | $ | (465,169 | ) | |||||
Other comprehensive income (loss): | ||||||||||||
Postretirement changes other than net periodic benefit cost, net of tax | 994,985 | (184,794 | ) | — | ||||||||
|
|
|
|
|
| |||||||
Comprehensive income (loss) | 26,229,491 | 512,118 | (465,169 | ) | ||||||||
Less: Comprehensive income (loss) attributable to noncontrolling interest | 3,755,938 | (1,473,099 | ) | — | ||||||||
|
|
|
|
|
| |||||||
Comprehensive income (loss) attributable to USP Holdings Inc. | $ | 22,473,553 | $ | 1,985,217 | $ | (465,169 | ) | |||||
|
|
|
|
|
| |||||||
See Notes to Consolidated Financial Statements.
Consolidated Statements of Changes in Stockholders’ Equity
For The Years Ended September 30,
| Preferred Stock | Common Stock | Additional paid in capital | Accumulated Deficit | Accumulated Other Comprehensive (Loss) Income | Noncontrolling Interest | Total Stockholders’ Equity | ||||||||||||||||||||||
Balance, October 1, 2012 | $ | 54 | $ | 61 | $ | 60,634,885 | $ | 84,389,164 | $ | — | $ | — | $ | 145,024,164 | ||||||||||||||
Repurchase of stock(1) | (33 | ) | — | (33,036,475 | ) | — | — | — | (33,036,508 | ) | ||||||||||||||||||
Distributions | — | — | — | (118,412,897 | ) | — | — | (118,412,897 | ) | |||||||||||||||||||
Net loss | — | — | — | (465,169 | ) | — | — | (465,169 | ) | |||||||||||||||||||
|
|
|
|
|
|
|
|
|
|
|
|
|
| |||||||||||||||
Balance, September 30, 2013 | $ | 21 | $ | 61 | $ | 27,598,410 | $ | (34,488,902 | ) | $ | — | $ | — | $ | (6,890,410 | ) | ||||||||||||
Repurchase of stock(1) | — | — | (240,000 | ) | — | — | — | (240,000 | ) | |||||||||||||||||||
Issuance of stock | — | 24 | 74,999,976 | — | — | — | 75,000,000 | |||||||||||||||||||||
Acquisition of noncontrolling interest | — | — | — | — | — | 24,000,000 | 24,000,000 | |||||||||||||||||||||
Accretion of noncontrolling interest | — | — | (4,827,000 | ) | — | — | 4,827,000 | — | ||||||||||||||||||||
Net income | — | — | — | 2,114,573 | — | (1,417,661 | ) | 696,912 | ||||||||||||||||||||
Other comprehensive income, postretirement changes other than net periodic benefit costs, net of tax | — | — | — | — | (129,356 | ) | (55,438 | ) | (184,794 | ) | ||||||||||||||||||
|
|
|
|
|
|
|
|
|
|
|
|
|
| |||||||||||||||
Balance, September 30, 2014 | $ | 21 | $ | 85 | $ | 97,531,386 | $ | (32,374,329 | ) | $ | (129,356 | ) | $ | 27,353,901 | $ | 92,381,708 | ||||||||||||
Repurchase of stock(1) | (21 | ) | — | (21,525,719 | ) | — | — | — | (21,525,740 | ) | ||||||||||||||||||
Distributions | — | — | — | (45,768,407 | ) | — | — | (45,768,407 | ) | |||||||||||||||||||
Accretion of noncontrolling interest | — | — | (6,787,000 | ) | — | — | 6,787,000 | — | ||||||||||||||||||||
Net income | — | — | — | 21,777,063 | — | 3,457,443 | 25,234,506 | |||||||||||||||||||||
Other comprehensive income, postretirement changes other than net periodic benefit costs, net of tax | — | — | — | — | 696,490 | 298,495 | 994,985 | |||||||||||||||||||||
|
|
|
|
|
|
|
|
|
|
|
|
|
| |||||||||||||||
Balance, September 30, 2015 | $ | — | $ | 85 | $ | 69,218,667 | $ | (56,365,673 | ) | $ | 567,134 | $ | 37,896,839 | $ | 51,317,052 | |||||||||||||
|
|
|
|
|
|
|
|
|
|
|
|
|
| |||||||||||||||
| (1) | Purchased for retirement, not re-issuable |
See Notes to Consolidated Financial Statements.
Consolidated Statements of Cash Flows
For The Years Ended September 30,
| 2015 | 2014 | 2013 | ||||||||||
Cash Flows from Operating Activities | ||||||||||||
Net income (loss) | $ | 25,234,506 | $ | 696,912 | $ | (465,169 | ) | |||||
Adjustments to reconcile net income (loss) to net cash provided by operating activities: | ||||||||||||
Depreciation | 34,839,254 | 29,223,226 | 21,346,591 | |||||||||
Amortization of deferred financing costs | 1,064,033 | 1,332,640 | 313,722 | |||||||||
Write-off of intangible trade name and trademarks | — | — | 239,000 | |||||||||
Amortization of intangibles | 562,441 | 130,909 | — | |||||||||
Provision for doubtful accounts | 12,462 | (433,453 | ) | 527,867 | ||||||||
Loss on sale of property and equipment | 1,248,417 | 1,478,886 | 1,771,517 | |||||||||
Deferred income taxes | (3,258,446 | ) | (10,550,963 | ) | (8,705,068 | ) | ||||||
Gain on bargain purchase of a business (Note 2) | (277,264 | ) | — | — | ||||||||
Gain on fire related transactions | — | (715,547 | ) | — | ||||||||
Insurance proceeds from fire | — | 2,000,000 | — | |||||||||
Changes in assets and liabilities, net of effect of business acquisitions: | ||||||||||||
Accounts receivable | (1,832,848 | ) | (7,254,321 | ) | 16,271,214 | |||||||
Inventories | 1,138,458 | 9,421,541 | 1,861,257 | |||||||||
Prepaid expenses and other current and long-term assets | (1,052,773 | ) | 4,215,579 | 1,541,022 | ||||||||
Excess of checks over bank balances | (1,598,556 | ) | (1,063,584 | ) | (7,049,022 | ) | ||||||
Accounts payable | (20,205,919 | ) | 5,561,946 | (11,221,267 | ) | |||||||
Accrued expenses and other current and long-term liabilities | (873,482 | ) | (5,899,006 | ) | (5,828,391 | ) | ||||||
Income taxes payable | 3,434,820 | 3,346,130 | (8,569,300 | ) | ||||||||
|
|
|
|
|
| |||||||
Net cash provided by operating activities | 38,435,103 | 31,490,895 | 2,033,973 | |||||||||
|
|
|
|
|
| |||||||
Cash Flows from Investing Activities | ||||||||||||
Acquisition of businesses | (53,887,767 | ) | (73,542,786 | ) | (4,461,500 | ) | ||||||
Purchase of property and equipment | (21,967,547 | ) | (25,890,553 | ) | (12,604,685 | ) | ||||||
Proceeds from sale of property and equipment | 294,014 | 809,254 | 725,839 | |||||||||
|
|
|
|
|
| |||||||
Net cash used in investing activities | (75,561,300 | ) | (98,624,085 | ) | (16,340,346 | ) | ||||||
|
|
|
|
|
| |||||||
Cash Flows from Financing Activities | ||||||||||||
Payments of deferred financing costs | (1,205,299 | ) | — | (4,425,850 | ) | |||||||
Repurchase of stock | (21,525,740 | ) | (240,000 | ) | (33,036,508 | ) | ||||||
Proceeds from issuance of stock | — | 75,000,000 | — | |||||||||
Distributions | (45,768,407 | ) | — | (118,412,897 | ) | |||||||
Net borrowings under revolver loan | 39,403,760 | (4,987,702 | ) | 46,245,483 | ||||||||
Proceeds on long-term debt financing | 71,489,273 | — | 119,822,000 | |||||||||
Principal payments on long-term debt financing | (4,682,901 | ) | (3,069,809 | ) | (255,818 | ) | ||||||
|
|
|
|
|
| |||||||
Net cash provided by financing activities | 37,710,686 | 66,702,489 | 9,936,410 | |||||||||
|
|
|
|
|
| |||||||
Increase (decrease) in cash | 584,489 | (430,701 | ) | (4,369,963 | ) | |||||||
Cash: | ||||||||||||
Beginning of year | 3,675,087 | 4,105,788 | 8,475,751 | |||||||||
|
|
|
|
|
| |||||||
End of year | $ | 4,259,576 | $ | 3,675,087 | $ | 4,105,788 | ||||||
|
|
|
|
|
| |||||||
(Continued)
USP HOLDINGS INC.
Consolidated Statements of Cash Flows (Continued)
For The Years Ended September 30,
| 2015 | 2014 | 2013 | ||||||||||
Supplemental Disclosures of Cash Flow Information | ||||||||||||
Interest paid | $ | 18,856,995 | $ | 15,591,882 | $ | 4,106,376 | ||||||
|
|
|
|
|
| |||||||
Income taxes paid | $ | 9,350,517 | $ | 4,313,966 | $ | 15,905,318 | ||||||
|
|
|
|
|
| |||||||
Supplemental Disclosure of Noncash Operating Activities | ||||||||||||
Postretirement changes other than net periodic benefit costs | $ | 994,985 | $ | (184,794 | ) | $ | — | |||||
|
|
|
|
|
| |||||||
Supplemental Schedules of Noncash Investing and Financing Activities | ||||||||||||
Acquisition of Businesses (Note 2) | ||||||||||||
Assets acquired | $ | 52,725,091 | $ | 109,846,990 | $ | 1,147,000 | ||||||
Liabilities assumed | (17,307,328 | ) | (34,108,135 | ) | — | |||||||
|
|
|
|
|
| |||||||
Net identifiable assets acquired | 35,417,763 | 75,738,855 | 1,147,000 | |||||||||
Goodwill | 19,559,759 | 21,803,931 | 3,314,500 | |||||||||
|
|
|
|
|
| |||||||
Net assets acquired | 54,977,522 | 97,542,786 | 4,461,500 | |||||||||
Less due to seller | (812,491 | ) | — | — | ||||||||
Less gain on bargain purchase of a business (Note 2) | (277,264 | ) | — | — | ||||||||
Noncontrolling interest | — | (24,000,000 | ) | — | ||||||||
|
|
|
|
|
| |||||||
| $ | 53,887,767 | $ | 73,542,786 | $ | 4,461,500 | |||||||
|
|
|
|
|
| |||||||
See Notes to Consolidated Financial Statements.
Notes to Consolidated Financial Statements
Note 1. Nature of Business and Significant Accounting Policies
Nature of business: USP Holdings Inc. (the Company) is a diversified holding company, which owns entities that manufacture a broad line of ductile iron pipe, restraint joint products and other products. These products are sold primarily to waterworks distributors, contractors, municipalities, utilities and other governmental agencies, primarily in the United States, on credit terms approximating 60 days.
Significant accounting policies are as follows:
Principles of consolidation: The consolidated financial statements include the accounts of the Company’s wholly-owned subsidiaries, including one of its subsidiaries, Griffin Pipe Products Co., LLC, (Griffin) which is 70% owned. All significant intercompany accounts and transactions have been eliminated.
Noncontrolling interest:Noncontrolling interests represent the portion of equity in the subsidiary not attributable directly or indirectly, to USP Holdings Inc. The profit or loss derived from the performance of the subsidiary is allocated to net income attributable to the noncontrolling interest in the consolidated statements of operations.
The former owners of Griffin have an option to put the 30% noncontrolling interest after a holding period of 24 months. The value of the put is either the greater of (a) 5 times EBITDA of Griffin Pipe Products Co., LLC over the previous 12 months or (b) 7.5% of the value of USP Holdings Inc. In no event shall the put value exceed $40,000,000. In the event of a sale of USP Holdings Inc., the put will be automatically exercised. For the year ended September 30, 2015, the value of the put related to the noncontrolling interest was estimated based on the value of USP Holdings Inc. accreted for 20 months of the 24-month holding period. The valuation increased the noncontrolling interest $6,787,000 and $4,827,000 for the years ended September 30, 2015 and 2014, respectively.
Accumulated other comprehensive income (loss): The Company’s accumulated other comprehensive income (loss) is comprised of postretirement changes other than net periodic benefit cost.
Accounting policies: The Company follows accounting standards established by the Financial Accounting Standards Board (the FASB) to ensure consistent reporting of financial condition, results of operations, and cash flows. References to Generally Accepted Accounting Principles (GAAP) in these footnotes are to the FASB Accounting Standards Codification, sometimes referred to as the Codification or ASC.
Accounting estimates: The preparation of financial statements in conformity with accounting principles generally accepted in the United States of America requires management to make estimates and assumptions that affect the reported amounts of assets and liabilities at the date of the financial statements and the reported amounts of revenues and expenses during the reporting period. Actual results could differ from those estimates.
Foreign operations:The Company’s foreign subsidiary (Metalfit) is located in Monterrey, Mexico and was acquired in the year ending September 30, 2015 as described in Note 2 Acquisition of Businesses. The facility produces ductile iron castings for valves and fittings for the water and wastewater market. Over 90% of Metalfit’s production is shipped to the United States.
USP HOLDINGS INC.
Notes to Consolidated Financial Statements
Note 1. Nature of Business and Significant Accounting Policies (Continued)
The functional currency of the Company’s foreign operation is the U.S. dollar. Assets located outside the U.S. at September 30, 2015 and 2014 are $17,905,314 and $0, respectively. Currency gains and losses are recognized through the settlement of transactions denominated in other than the local currency. The Company recognized currency gains from transactions of $899,882, $0 and $0 for the years ended September 30, 2015, 2014 and 2013, respectively, all of which are included in other income on the Company’s consolidated statements of operations.
Cash: The Company maintains its cash in bank deposit accounts which, at times, exceed federally insured limits.
Accounts receivable: Accounts receivable are carried at original invoice amount less an estimate made for doubtful receivables based on a review of all outstanding amounts on a monthly basis. Management determines the allowance for doubtful accounts by identifying troubled accounts and by using historical experience applied to an aging of accounts. Accounts receivable are written off when deemed uncollectible. Recoveries of accounts receivable previously written off are recorded when received.
Inventory: Inventory is valued at the lower of cost or market, with cost determined using the first-in, first-out method. To minimize risk of excess or obsolete inventory, the Company evaluates inventory levels and expected usage on a periodic basis and records valuation allowances as required. The Company’s work-in-process and finished goods inventory includes capitalized direct labor and overhead expenses.
Property and equipment: Property and equipment is recorded at cost. Depreciation is recognized utilizing the straight-line method over the estimated useful lives of the assets. Building improvements are amortized over the lesser of the useful life of the asset or the lease. Major improvements that extend the useful life are capitalized and charged to expense through depreciation. When equipment is retired or sold, the net carrying amount is eliminated with any gain or loss on disposal recognized in the year of disposal.
Long-lived assets: Long-lived assets are evaluated for impairment whenever events or changes in circumstances indicate the carrying value of an asset group may not be recoverable in accordance with FASB accounting and disclosure guidance on accounting for the impairment or disposal of long-lived assets. This is accomplished by comparing the carrying value of the asset group to the estimated future net undiscounted cash flows expected to result from the use of the assets, including cash flows from disposition. Should the sum of the expected future net cash flows be less than carrying value, the Company would recognize an impairment loss at that date. An impairment loss would be measured by comparing the amount by which the carrying value exceeds fair value (estimated discounted future cash flows or appraisal of assets) of the long-lived asset. To date, management has determined that no impairment of long-lived assets exists.
Intangibles:The Company has recorded intangible assets related to Company trademarks, customer relationships, backlog of orders and non-competition agreements. These costs are being amortized over 1 to 14 years, the estimated useful lives of the assets, using the straight–line method. The Company also has an intangible asset which is not being amortized because it has an indefinite life.
USP HOLDINGS INC.
Notes to Consolidated Financial Statements
Note 1. Nature of Business and Significant Accounting Policies (Continued)
Deferred financing costs: The Company capitalizes costs associated with the issuance of third party borrowing arrangements. These costs are amortized using the effective interest method, over the term of the debt agreement. Accumulated amortization of deferred financing costs was $2,786,619 and $1,722,586 as of September 30, 2015 and 2014, respectively. Deferred financing costs were $1,064,033, $1,332,640 and $313,722 for the years ended September 30, 2015, 2014 and 2013, respectively.
Goodwill: Goodwill relates to the Company’s acquisitions and represents the excess of the purchase price over the fair value of the identifiable net assets acquired. The Company evaluates goodwill and intangible assets in accordance with ASC 350, Goodwill and Other Intangible Assets. ASC 350 requires goodwill to be either qualitatively or quantitatively assessed for impairment annually (or more frequently if impairment indicators arise) for each reporting unit. The Company has three reporting units consisting of US Pipe, US Pipe Fabrication, and US Pipe Mexico. The Company performs its annual impairment testing of goodwill as of the fiscal year-end of each year and in interim periods if events occur that would indicate that the net book value of goodwill may be impaired.
The goodwill impairment test is a two-step process. The first step of the impairment analysis compares the fair value of the reporting unit to the net book value of the reporting unit. In determining fair value of the reporting units, a discounted cash flow model is typically used. If the results of the first step demonstrate that the net book value is greater than the fair value, the Company must proceed to step two of the analysis. Step two of the analysis compares the implied fair value of goodwill to its net book value amount. If the net book value amount of goodwill exceeds its implied fair value, an impairment loss is recognized equal to that excess.
We completed our annual impairment assessments for the years ended September 30, 2015, 2014 and 2013 and concluded that goodwill was not impaired in any of those years.
Postretirement benefits other than pensions:The Company provides certain medical and life insurance benefits for certain retirees. The plan covers former union employees of the Griffin Pipe Council Bluffs location hired prior to November 21, 2004, former union employees of the Griffin Pipe Lynchburg location hired prior to November 24, 2002 and salaried and non-union employees of Griffin Pipe hired prior to October 1, 2001 (Note 13).
Fair value of financial instruments: For assets and liabilities that are measured using quoted prices in active markets (Level 1), total fair value is the published market price per unit multiplied by the number of units held without consideration of transaction costs, discounts or blockage factors. Assets and liabilities that are measured using significant other observable inputs are valued by reference to similar assets or liabilities (Level 2), adjusted for contract restrictions and other terms specific to that asset or liability. For these items, a significant portion of fair value is derived by reference to quoted prices of similar assets or liabilities in active markets. For all remaining assets and liabilities, fair value is derived using other valuation methodologies, including option pricing models, discounted cash flow models and similar techniques (Level 3), and not based on market exchange, dealer, or broker traded transactions. These valuations incorporate certain assumptions and projections in determining the fair value assigned to such assets or liabilities.
The carrying amounts of cash, accounts receivable, accounts payable, and the revolver loan approximate the fair value due to the immediate or short-term maturity of these financial instruments.
USP HOLDINGS INC.
Notes to Consolidated Financial Statements
Note 1. Nature of Business and Significant Accounting Policies (Continued)
The fair value of debt approximates the carrying value based on comparisons of terms (maturity, interest rate, etc.) to comparable debt offerings in the marketplace. There are no other financial instruments for which fair value differs materially from carrying value.
Revenue recognition: Revenues earned through manufactured products are recognized when each of the following conditions has been met: an arrangement exists, title has transferred, there is a fixed price, and collectability is reasonably assured, which is generally upon shipment.
Income taxes: Deferred taxes are provided on a liability method whereby deferred tax assets are recognized for deductible temporary differences and operating loss and tax credit carry forwards and deferred liabilities are recognized for taxable temporary differences. Temporary differences are the differences between the reported amounts of assets and liabilities and their tax bases. Deferred tax assets are reduced by a valuation allowance when, in the opinion of management, it is more likely than not that some portion or all of the deferred tax assets will not be realized. Deferred tax assets and liabilities are adjusted for the effects of changes in tax laws and rates on the date of enactment.
The Company has not recorded a reserve for any tax positions for which the ultimate deductibility is highly certain but for which there is uncertainty about the timing of such deductibility. The Company files tax returns in all appropriate jurisdictions, which include a federal tax return and various state tax returns. The open tax years for these jurisdictions are 2012, 2013, 2014 and 2015, which statutes expire in 2016, 2017, 2018 and 2019, respectively. When and if applicable, potential interest and penalty costs are accrued as incurred, with expenses recognized in selling, general and administrative expenses in the consolidated statements of operations. As of September 30, 2015 and 2014, the Company had no liability for unrecognized tax benefits.
Shipping costs: The Company’s invoices include amounts for shipping and handling costs. The Company recognizes these billings as revenue and includes the associated costs in cost of goods sold.
Recent accounting pronouncement: In May 2014, the FASB issued Accounting Standards Update (ASU) No. 2014-09 Topic 606,Revenue from Contracts with Customers, and amended its standards related to revenue recognition. This amendment replaces all existing revenue recognition guidance and provides a single, comprehensive revenue recognition model for all contracts with customers. The standard contains principles that will be applied to determine the measurement of revenue and timing of when it is recognized. The underlying principle is that the Company will recognize revenue in a manner that depicts the transfer of goods or services to customers at an amount that the Company expects to be entitled to in exchange for those goods or services. The standard allows either full or modified retrospective adoption. Early adoption is not permitted. The guidance provides a five-step analysis of transactions to determine when and how revenue is recognized. Other major provisions include capitalization of certain contract costs, consideration of time value of money in the transaction price, and allowing estimates of variable consideration to be recognized before contingencies are resolved in certain circumstances. The amendment also requires additional disclosure about the nature, amount, timing and uncertainty of revenue and cash flows arising from customer contracts, including significant judgments and changes in judgments and assets recognized from costs incurred to fulfill a contract. The new rules will become effective for annual reporting periods beginning after December 15, 2018, and interim periods within annual periods beginning after December 15, 2019. The Company is in the process of evaluating the impact the amendment will have on the consolidated financial statements.
USP HOLDINGS INC.
Notes to Consolidated Financial Statements
Note 1. Nature of Business and Significant Accounting Policies (Continued)
In March 2016, the FASB issued ASU 2016-08Revenue from Contracts with Customers (Topic 606): Principal versus Agent Considerations (Reporting Revenue Gross versus Net), which amends the principal-versus-agent implementation guidance and illustrations in ASU 2014-09. Among other things, ASU 2016-08 clarifies that an entity should evaluate whether it is the principal or the agent for each specified good or service promised in a contract with a customer. As defined in ASU 2016-08, a specified good or service is “a distinct good or service (or a distinct bundle of goods or services) to be provided to the customer.” Therefore, for contracts involving more than one specified good or service, the entity may be the principal for one or more specified goods or services and the agent for others. ASU 2016-08 has the same effective date as ASU 2014-09, as amended by ASU 2015-14. The Company is required to adopt ASU 2016-08 using the same transition method it uses to adopt ASU 2014-09. The Company is currently evaluating the impact the adoption of ASU 2014-09, ASU 2015-14 and ASU 2016-08 will have on its consolidated financial statements.
In July 2015, the FASB issued ASU 2015-11,Inventory (Topic 330): Simplifying the Measurement of Inventory,requiring an entity to measure inventory within the scope of the ASU at the lower of cost and net realizable value. For public business entities, the amendments in this update are effective for financial statements issued for fiscal years beginning after December 15, 2016, and interim periods within those fiscal years. The Company is currently evaluating whether this ASU will have a material impact on its consolidated financial statements.
In August 2014, the FASB issued ASU 2014-15,Presentation of Financial Statements – Going Concern (Subtopic 205-40): Disclosure of Uncertainties about an Entity’s Ability to Continue as a Going Concern,defining when and how companies are required to disclose going concern uncertainties, which must be evaluated each interim and annual period. Specifically, it requires management to determine whether substantial doubt exists regarding the entity’s going concern presumption. Substantial doubt about an entity’s ability to continue as a going concern exists when relevant conditions and events, considered in the aggregate, indicate that it is probable that the entity will be unable to meet its obligations as they become due within one year after the date the financial statements are issued. If substantial doubt exists, certain disclosures are required. The provisions of this ASU are effective for annual periods ending after December 15, 2016 and to annual and interim periods thereafter. Early adoption is permitted. The ASU should be applied on a prospective basis. The Company believes the adoption of this ASU will not have a material impact on the Company’s disclosures.
In February 2015, the FASB issued ASU 2015-02 Topic 810,Amendments to the Consolidation Analysis. ASU 2015-02 amends current consolidation guidance by modifying the evaluation of whether limited partnerships and similar legal entities are variable interest entities or voting interest entities, eliminating the presumption that a general partner should consolidate a limited partnership, and affects the consolidation analysis of reporting entities that are involved with variable interest entities. ASU 2015-02 is effective for interim and annual reporting periods beginning after December 15, 2015, with early adoption permitted. All legal entities are subject to reevaluation under the revised consolidation model. The adoption of ASU 2015-02 is not expected to have a material impact on the Company’s consolidated financial position, results of operations or cash flows.
In September 2015, the FASB issued ASU 2015-16,Business Combinations(Topic 805), which requires an acquirer to retrospectively adjust provisional amounts recognized in a business combination during the measurement period. To simplify the accounting for adjustments made to provisional amounts, the amendments in this update require that the acquirer recognize adjustments to
USP HOLDINGS INC.
Notes to Consolidated Financial Statements
Note 1. Nature of Business and Significant Accounting Policies (Continued)
provisional amounts that are identified during the measurement-period in the reporting period in which the adjustment amount is determined. The acquirer is required to also record, in the same period’s financial statements, the effect on earnings of changes in depreciation, amortization or other income effects, if any, as a result of the change to the provisional amounts, calculated as if the accounting had been completed at the acquisition date. In addition, an entity is required to present separately on the face of the income statement or disclose in the notes to the financial statements the portion of the amount recorded in current period earnings by line item that would have been recorded in previous reporting periods if the adjustment to the provisional amounts had been recognized as of the acquisition date. For public business entities, the amendments in this update are effective for fiscal years beginning after December 15, 2015, including interim periods within those fiscal years. The Company is still evaluating whether this ASU will have a material impact on its consolidated financial statements.
In November 2015, the FASB issued ASU 2015-17 Topic 740,Balance Sheet Classification of Deferred Taxes, which simplifies the presentation of deferred income taxes. ASU 2015-17 requires that deferred tax assets and liabilities be classified as noncurrent in a classified statement of financial position. ASU 2015-17 is effective for financial statements issued for fiscal years beginning after December 15, 2016 (and interim periods within those fiscal years) with early adoption permitted. ASU 2015-17 may be either applied prospectively to all deferred tax assets and liabilities or retrospectively to all periods presented. The Company is currently evaluating whether this ASU will have a material impact on its consolidated financial statements.
In February 2016, the FASB issued ASU 2016-02,Leases (Topic 842), amending the existing accounting standards for lease accounting, including requiring lessees to recognize most leases on their balance sheets and making targeted changes to lessor accounting. For public business entities, the amendments in this update are effective for annual reporting periods beginning after December 15, 2018, including interim periods within those fiscal years, and early adoption is permitted as of the standard’s issuance date. ASU 2016-02 requires a modified retrospective transition approach for all leases existing at, or entered into after, the date of initial application, with an option to use certain transition relief. The Company believes this ASU will have a material impact on its consolidated financial statements as it will result in most of the Company’s leases and associated assets being presented on the balance sheet.
In August 2015, the FASB issued ASU 2015-15,Simplifying the Presentation of Debt Issuance Costs and the Imputation of Interest, as ASU 2015-03 did not specifically address presentation or subsequent measurement of debt issuance costs related to line-of-credit arrangements. ASU 2015-15 allows an entity to continue to defer and present debt issuance costs ratably over the term of the line-of-credit arrangement, regardless of whether there are any outstanding borrowings on the line-of-credit arrangement. The guidance in ASU 2015-03 and ASU 2015-15 is effective for financial statements issued for fiscal years beginning after December 15, 2015, and interim periods within those fiscal years. Early adoption is permitted for financial statements that have not been previously issued. The adoption of this standard will have no impact on the Company’s results of operations, cash flows or net assets.
Subsequent events: The Company evaluated subsequent events through June 30, 2016, the date the consolidated financial statements were available to be issued.
USP HOLDINGS INC.
Notes to Consolidated Financial Statements
Note 1. Nature of Business and Significant Accounting Policies (Continued)
On April 15, 2016, the Company was acquired by Forterra Building Products (Forterra) pursuant to an agreement, dated as of February 12, 2016. Under the terms of the agreement, Forterra paid approximately $780.0$775.1 million in cash, subject to certain closing adjustments, for all outstanding shares of the Company, retirement of the existing indebtedness of approximately $253.4 million and retirement of the noncontrolling interest of $40.0 million as of the transaction closing date.
Note 2. Acquisition of Businesses
Fiscal Year 2013 Acquisition:
On August 1, 2013, the Company acquired certain assets of Troy Foundry Specialist, LLC (Seller) for total consideration of $7,051,500. This transaction will allow the Company greater control over material handling and purchasing. The assets acquired were recorded at their fair value. In connection with the transaction, the Company incurred $113,875 of transaction costs which are included in operating expenses for the year ended September 30, 2013. Goodwill of $3,314,500 was recorded as part of the acquisition. The goodwill was assigned to the US Pipe reporting unit of the Company, and is deductible for tax purposes. The loss on contract settlement totaling $2,590,000 pertains to the settlement of unfavorable pre-existing contractual relationships with the Seller.
The following table summarizes the consideration paid and the fair value of the assets acquired and liabilities assumed at the acquisition date.
Consideration: | ||||
Cash | $ | 7,051,500 | ||
Less: Loss on contract settlement | 2,590,000 | |||
|
| |||
Cash consideration attributed to business acquisition | $ | 4,461,500 | ||
|
| |||
Recognized amounts of identifiable assets acquired: | ||||
Property and equipment | $ | 1,147,000 | ||
|
| |||
| 1,147,000 | ||||
|
| |||
Recognized amounts of identifiable liabilities assumed: | ||||
Accounts payable and accrued expenses | — | |||
|
| |||
| — | ||||
|
| |||
Total identifiable net assets acquired | 1,147,000 | |||
Goodwill | 3,314,500 | |||
|
| |||
| $ | 4,461,500 | |||
|
|
Fiscal Year 2014 Acquisitions:
On October 31, 2013, the Company acquired certain assets of Fab Pipe LLC (Seller) for total consideration of $3,542,786. This transaction will allow the Company to grow by entering new markets. The assets acquired and liabilities assumed were recorded at their fair value. In connection with the transaction, the Company incurred $157,030 of transaction costs which are included in operating expenses for the year ended September 30, 2014. Goodwill of $292,943 was recorded as part of the acquisition and is deductible for tax purposes.
USP HOLDINGS INC.
Notes to Consolidated Financial Statements
Note 2. Acquisition of Businesses (Continued)
The following table summarizes the consideration paid and the fair value of the assets acquired and liabilities assumed at the acquisition date.
Consideration: | ||||
Cash | $ | 3,542,786 | ||
|
| |||
Recognized amounts of identifiable assets acquired: | ||||
Accounts receivable | $ | 1,208,254 | ||
Inventory | 1,559,696 | |||
Property and equipment | 119,385 | |||
Intangibles – customer relationships | 380,000 | |||
Intangibles – non-compete | 55,000 | |||
Intangibles – trademarks | 170,000 | |||
|
| |||
| 3,492,335 | ||||
|
| |||
Recognized amounts of identifiable liabilities assumed: | ||||
Accounts payable | 224,669 | |||
Accrued salaries and wages | 17,432 | |||
Accrued 401K program | 391 | |||
|
| |||
| 242,492 | ||||
|
| |||
Total identifiable net assets acquired | 3,249,843 | |||
Goodwill | 292,943 | |||
|
| |||
| $ | 3,542,786 | |||
|
|
The fair value of the gross amount of accounts receivable is $1,209,754 of which $1,500 is expected to be uncollectable.
Amounts assigned to acquired intangible assets and their approximate weighted-average useful lives are summarized as follows:
| Amount | Useful Life | |||||||
Trademarks | $ | 170,000 | 15 | |||||
Customer relationships | 380,000 | 6 | ||||||
Non-compete | 55,000 | 5 | ||||||
|
| |||||||
| $ | 605,000 | |||||||
|
| |||||||
Weighted average useful life (in years) | 8.4 | |||||||
|
| |||||||
On January 31, 2014, the Company acquired a 70% interest in Griffin Pipe Products Co., LLC (Seller) for total consideration of $70,000,000. This acquisition was funded by issuance of $75,000,000 of common stock to existing stockholders. This transaction will allow the Company to realize significant synergy savings and provide better service to the customer base. The assets acquired and liabilities assumed were recorded at their fair value. The 30% noncontrolling interest was valued at 30% of the implied enterprise value discounted 20% for lack of liquidity. In connection with the transaction, the Company incurred $936,684 of transaction costs which are included in operating expenses for the year ended September 30, 2014. Goodwill of $21,510,988 was recorded as part of the acquisition and is deductible for tax purposes.
USP HOLDINGS INC.
Notes to Consolidated Financial Statements
Note 2. Acquisition of Businesses (Continued)
The following table summarizes the consideration paid and the fair value of the assets acquired and liabilities assumed at the acquisition date.
Consideration: | ||||
Cash | $ | 70,000,000 | ||
|
| |||
Recognized amounts of identifiable assets acquired: | ||||
Accounts receivable | $ | 16,661,514 | ||
Inventory | 31,909,892 | |||
Prepaid expenses and other assets | 1,934,579 | |||
Property and equipment | 54,748,670 | |||
Intangible – trademarks | 1,100,000 | |||
|
| |||
| 106,354,655 | ||||
|
| |||
Recognized amounts of identifiable liabilities assumed: | ||||
Excess of checks over bank balances | 731,957 | |||
Accounts payable and accrued expenses | 16,935,786 | |||
Compensation and related | 2,153,806 | |||
Rebates | 37,613 | |||
Backcharges | 535,331 | |||
Property tax | 528,060 | |||
Workers’ compensation | 5,300,000 | |||
Postretirements benefits obligation | 6,610,000 | |||
Other | 1,033,090 | |||
|
| |||
| 33,865,643 | ||||
|
| |||
Total identifiable net assets acquired | 72,489,012 | |||
Goodwill | 21,510,988 | |||
Non-controlling interest | (24,000,000 | ) | ||
|
| |||
| $ | 70,000,000 | |||
|
|
The fair value of the gross amount of accounts receivable is $17,100,514 of which $439,000 is expected to be uncollectable.
The fair value of the noncontrolling interest was estimated by applying the income approach and a cost approach. The fair value measurement is based on significant inputs that are not observable in the market and, therefore represents a Level 3 measurement as defined by GAAP. Key assumptions include a discount rate of 16% and a 20% discount for lack of marketability that market participants would consider when estimating the fair value of the noncontrolling interest. As of the close of the transaction the Company estimated the value of the noncontrolling interest at $24,000,000.
As part of the purchase agreement the seller acquired an option to put the 30% noncontrolling interest after a holding period of 24 months. The value of the put is either the greater of (a) 5 times EBITDA of Griffin Pipe Products Co., LLC over the previous 12 months or (b) 7.5% of the value of USP Holdings Inc. In no event shall the put value exceed $40,000,000. In the event of a sale of USP Holdings Inc. the put will be automatically exercised. For the year ended September 30, 2014, the value of the put related to the noncontrolling interest was estimated based on the value of USP Holdings Inc. accreted for 8 months of the 24 month holding period. The valuation increased the noncontrolling interest $4,827,000 for the year ended September 30, 2014.
USP HOLDINGS INC.
Notes to Consolidated Financial Statements
Note 2. Acquisition of Businesses (Continued)
Amounts assigned to acquired intangible assets and their useful lives are summarized as follows:
| Amount | Useful Life | |||||||
Trademarks | $ | 1,100,000 | 14 | |||||
|
| |||||||
Fiscal Year 2015 Acquisitions:
On December 16, 2014, the Company acquired substantially all of the assets of Metalfit (Metalfit, S.A. de C.V. and Metalfit, Inc.) (Seller) for total consideration of $10,815,919. This transaction will allow the Company to grow by entering new markets. The assets acquired and liabilities assumed were recorded at their fair value. In connection with the transaction, the Company incurred $958,938 of transaction costs which are included in operating expenses for the year ended September 30, 2015.
The following tables summarize the consideration paid and the fair value of the assets acquired and liabilities assumed at the acquisition date.
Consideration: | ||||
Cash | $ | 10,815,919 | ||
|
| |||
Recognized amounts of identifiable assets acquired: | ||||
Accounts receivable | $ | 3,088,846 | ||
Inventory | 3,086,000 | |||
Prepaid expenses and other assets | 152,411 | |||
Property and equipment | 5,750,330 | |||
Intangibles – customer relationships | 660,000 | |||
Intangibles – non-compete | 20,000 | |||
Intangibles – backlog of orders | 25,000 | |||
Intangibles – trademarks | 35,000 | |||
|
| |||
| 12,817,587 | ||||
|
| |||
Recognized amounts of identifiable liabilities assumed: | ||||
Accounts payable and accrued expenses | 1,724,404 | |||
|
| |||
| 1,724,404 | ||||
|
| |||
Total identifiable net assets acquired | 11,093,183 | |||
Gain on bargain purchase of a business | (277,264 | ) | ||
|
| |||
| $ | 10,815,919 | |||
|
|
| Amount | Useful Life | |||||||
Intangibles – customer relationships | $ | 660,000 | 5 | |||||
Intangibles – non-compete | 20,000 | 5 | ||||||
Intangibles – backlog of orders | 25,000 | 1 | ||||||
Intangibles – trademarks | 35,000 | 1 | ||||||
|
| |||||||
| $ | 740,000 | |||||||
|
| |||||||
Weighted average useful life (in years) | 4.7 | |||||||
|
| |||||||
USP HOLDINGS INC.
Notes to Consolidated Financial Statements
Note 2. Acquisition of Businesses (Continued)
On August 10, 2015, the Company acquired the shares of Custom Fab, LLC (Custom Fab) for total consideration of $43,884,339. This transaction will allow the Company to realize significant synergy savings and provide better service to the customer base. The assets acquired and liabilities assumed were recorded at their fair value. In connection with the transaction, the Company incurred $1,162,703 of transaction costs which are included in operating expenses for the year ended September 30, 2015. Goodwill of $19,559,759 was recorded as part of the acquisition. Approximately $775,000 of the goodwill is deductible for income tax purposes.
The following tables summarize the consideration paid and the fair value of the assets acquired and liabilities assumed at the acquisition date.
Consideration: | ||||
Cash | $ | 43,071,848 | ||
Due to seller | 812,491 | |||
|
| |||
| $ | 43,884,339 | |||
|
| |||
Recognized amounts of identifiable assets acquired: | ||||
Accounts receivable | $ | 7,103,841 | ||
Inventory | 7,547,000 | |||
Prepaid expenses and other assets | 670,731 | |||
Property and equipment | 13,315,932 | |||
Intangibles – customer relationships | 8,170,000 | |||
Intangibles – non-compete | 460,000 | |||
Intangibles – backlog of orders | 90,000 | |||
Intangibles – trademarks | 2,550,000 | |||
|
| |||
| 39,907,504 | ||||
|
| |||
Recognized amounts of identifiable liabilities assumed: | ||||
Excess of checks over bank balances | 282,158 | |||
Accounts payable and accrued expenses | 8,051,240 | |||
Deferred income taxes | 7,249,526 | |||
|
| |||
| 15,582,924 | ||||
|
| |||
Total identifiable net assets acquired | 24,324,580 | |||
Goodwill | 19,559,759 | |||
|
| |||
| $ | 43,884,339 | |||
|
|
| Amount | Useful Life | |||||||
Intangibles – customer relationships | $ | 8,170,000 | 6 | |||||
Intangibles – non-compete | 460,000 | 5 | ||||||
Intangibles – backlog of orders | 90,000 | 1 | ||||||
Intangibles – trademarks | 2,550,000 | 10 | ||||||
|
| |||||||
| $ | 11,270,000 | |||||||
|
| |||||||
Weighted average useful life (in years) | 6.8 | |||||||
|
| |||||||
USP HOLDINGS INC.
Notes to Consolidated Financial Statements
Note 3. Inventory
Inventory as of September 30, 2015 and 2014 is as follows:
| September 30, | ||||||||
| 2015 | 2014 | |||||||
Raw materials | $ | 28,492,730 | $ | 17,270,935 | ||||
Work-in-process | 1,787,707 | 1,535,288 | ||||||
Finished goods | 45,098,645 | 49,311,337 | ||||||
Supplies | 14,589,761 | 14,753,028 | ||||||
|
|
|
| |||||
| 89,968,843 | 82,870,588 | |||||||
Less: excess and obsolete reserve | 755,791 | 3,152,079 | ||||||
|
|
|
| |||||
| $ | 89,213,052 | $ | 79,718,509 | |||||
|
|
|
| |||||
Note 4. Property and Equipment
Property and equipment as of September 30, 2015 and 2014 is as follows:
| September 30, | ||||||||
| 2015 | 2014 | |||||||
Machinery and equipment | $ | 176,660,673 | $ | 143,938,976 | ||||
Land and mineral resources | 31,972,500 | 31,036,000 | ||||||
Buildings | 18,998,567 | 13,962,317 | ||||||
Pipe molds | 13,670,932 | 12,380,954 | ||||||
Construction in progress | 10,177,646 | 12,629,795 | ||||||
Land improvements | 3,282,911 | 2,538,137 | ||||||
Computer software | 1,104,867 | 951,473 | ||||||
|
|
|
| |||||
| 255,868,096 | 217,437,652 | |||||||
Less: accumulated depreciation | 91,622,956 | 58,143,134 | ||||||
|
|
|
| |||||
| $ | 164,245,140 | $ | 159,294,518 | |||||
|
|
|
| |||||
Depreciation expense was $34,839,254, $29,223,226 and $21,346,591 for the years ended September 30, 2015, 2014 and 2013, respectively.
USP HOLDINGS INC.
Notes to Consolidated Financial Statements
Note 5. Intangible Assets and Goodwill
The following is a summary of goodwill and intangible assets as of September 30, 2015:
| Gross Carrying Amount | Accumulated Amortization | Carrying Values | Estimated Useful Life | |||||||||||||
Amortizing: | ||||||||||||||||
Trademarks | $ | 3,685,000 | $ | 192,424 | $ | 3,492,576 | 1-14 years | |||||||||
Customer relationships | 9,210,000 | 403,463 | 8,806,537 | 5-6 years | ||||||||||||
Backlog of orders | 115,000 | 31,069 | 83,931 | 1 year | ||||||||||||
Non-compete | 535,000 | 45,617 | 489,383 | 5 years | ||||||||||||
|
|
|
|
|
| |||||||||||
| 13,545,000 | 672,573 | 12,872,427 | ||||||||||||||
|
|
|
|
|
| |||||||||||
Non-amortizing: | ||||||||||||||||
Trademarks | 7,203,000 | — | 7,203,000 | Indefinite | ||||||||||||
|
|
|
|
|
| |||||||||||
| $ | 20,748,000 | $ | 672,573 | $ | 20,075,427 | |||||||||||
|
|
|
|
|
| |||||||||||
Goodwill | $ | 44,678,190 | $ | — | $ | 44,678,190 | Indefinite | |||||||||
|
|
|
|
|
| |||||||||||
Aggregate future annual expense for amortizing intangible assets is as follows:
Years ending September 30, | ||||
2016 | $ | 2,087,627 | ||
2017 | 1,997,571 | |||
2018 | 1,997,571 | |||
2019 | 1,987,489 | |||
2020 | 1,815,298 | |||
Thereafter | 2,986,871 | |||
|
| |||
| $ | 12,872,427 | |||
|
|
The following is a summary of goodwill and intangible assets as of September 30, 2014:
| Gross Carrying Amount | Accumulated Amortization | Carrying Values | Estimated Useful Life | |||||||||||||
Amortizing: | ||||||||||||||||
Trademarks | $ | 170,000 | $ | 10,389 | $ | 159,611 | 15 years | |||||||||
Trademarks | 1,100,000 | 52,381 | 1,047,619 | 14 years | ||||||||||||
Customer relationships | 380,000 | 58,055 | 321,945 | 6 years | ||||||||||||
Non-compete | 55,000 | 10,084 | 44,916 | 5 years | ||||||||||||
|
|
|
|
|
| |||||||||||
| 1,705,000 | 130,909 | 1,574,091 | ||||||||||||||
|
|
|
|
|
| |||||||||||
Non-amortizing: | ||||||||||||||||
Trademarks | 7,203,000 | — | 7,203,000 | Indefinite | ||||||||||||
|
|
|
|
|
| |||||||||||
| $ | 8,908,000 | $ | 130,909 | $ | 8,777,091 | |||||||||||
|
|
|
|
|
| |||||||||||
Goodwill | $ | 25,118,431 | $ | — | $ | 25,118,431 | Indefinite | |||||||||
|
|
|
|
|
| |||||||||||
USP HOLDINGS INC.
Notes to Consolidated Financial Statements
Note 5. Intangible Assets and Goodwill (Continued)
The changes in the carrying value of goodwill for the years ended September 30, 2015 and 2014 are as follows:
| Amount | ||||
Balance, September 30, 2013 | $ | 3,314,500 | ||
Goodwill acquired during the year – Fab Pipe LLC | 292,943 | |||
Goodwill acquired during the year – Griffin Pipe Products Co. | 21,510,988 | |||
|
| |||
Balance, September 30, 2014 | 25,118,431 | |||
Goodwill acquired during the year – Custom Fab, LLC | 19,559,759 | |||
|
| |||
Balance, September 30, 2015 | $ | 44,678,190 | ||
|
| |||
Note 6. Revolving Credit Facility
On July 23, 2013, the Company amended its credit agreement with a financial institution to increase the revolver loan to a commitment of $90,000,000 secured by inventory and accounts receivable. The revolver is subject to a borrowing base calculation that is derived from a percentage of eligible receivables and inventory. As of September 30, 2014, the revolver had borrowings of $41,257,780 and letters of credit of $3,580,000 outstanding with $45,162,220 remaining available on the commitment. The credit agreement contains a fixed charge ratio covenant and matures on July 23, 2018. As of September 30, 2014, the stated interest rate is prime rate (3.25%) plus an applicable margin based on the revolver average excess availability. The effective interest rate was 4.45% as of September 30, 2014.
On August 10, 2015, the Company again amended its credit agreement with that financial institution to increase the revolver loan to a commitment of $112,000,000 secured by inventory and accounts receivable. The revolver is subject to a borrowing base calculation that is derived from a percentage of eligible receivables and inventory. As of September 30, 2015, the revolver had borrowings of $80,661,540 and letters of credit of $3,350,000 outstanding with $27,720,460 remaining available on the commitment. The credit agreement contains a fixed charge ratio covenant and matures on July 23, 2018. As of September 30, 2015, the stated interest rate is prime rate (3.25%) plus an applicable margin based on the revolver average excess availability. The effective interest rate is 4.45% as of September 30, 2015 and 2014.
The revolver loan is included in current liabilities in the accompanying consolidated balance sheets for both September 30, 2015 and 2014 due to the fact that the credit agreement has a subjective acceleration clause and requires a traditional lockbox to be in place.
USP HOLDINGS INC.
Notes to Consolidated Financial Statements
Note 7. Long-Term Debt
Long-term debt at September 30, 2015 and 2014, consists of:
| September 30, | ||||||||
| 2015 | 2014 | |||||||
Term Loan 1 | $ | 11,596,186 | $ | 8,301,929 | ||||
Term Loan 2 | 5,000,000 | 3,194,444 | ||||||
Term Loan 3 | 16,706,559 | — | ||||||
Subordinated Debt | 150,000,000 | 105,000,000 | ||||||
|
|
|
| |||||
Total | 183,302,745 | 116,496,373 | ||||||
Less: Current Portion | 9,352,882 | 3,069,810 | ||||||
|
|
|
| |||||
Total Long-Term Debt | $ | 173,949,863 | $ | 113,426,563 | ||||
|
|
|
| |||||
On July 23, 2013, the Company entered into a credit agreement with a financial institution for Term Loan 1 in the amount of $9,822,000. On February 20, 2015, the outstanding principal was $7,717,285 and the Company amended the loan agreement to increase the principal to $12,488,200. The monthly principal payment is $148,669. The stated interest rate is prime rate (3.25% at September 30, 2015 and 2014) plus a margin of 2.25%. The loan matures on July 23, 2018. The loan is secured by the property and equipment of the Company and had an outstanding balance of $11,596,186 and $8,301,929 as of September 30, 2015 and 2014, respectively. The credit agreement contains a fixed charge ratio covenant.
In addition, on July 23, 2013, the Company entered into a credit agreement with a financial institution for Term Loan 2 in the amount of $5,000,000. On February 20, 2015, the outstanding principal was $2,500,000 and the Company amended the loan agreement to increase the principal to $7,511,800. The monthly principal payment is $166,667. The interest rate is prime rate (3.25% at September 30, 2015 and 2014) plus a margin of 3.25%. The loan matures on July 23, 2018. The loan is secured by substantially all the assets of the Company and had an outstanding balance of $5,000,000 and $3,194,444 as of September 30, 2015 and 2014, respectively. The credit agreement contains a fixed charge ratio covenant. In conjunction with the fire proceeds (Note 19) the Company made a permitted prepayment on the term note in the amount of $1,259,833 during 2015.
In addition, on August 10, 2015, the Company entered into a credit agreement with a financial institution for Term Loan 3 in the amount of $16,706,559. The monthly principal payment is $464,071. The interest rate is prime rate (3.25% at September 30, 2015) plus a margin of 4.25%. The loan matures on July 23, 2018. The loan is secured by substantially all the assets of the Company and had an outstanding balance of $16,706,559 as of September 30, 2015. The credit agreement contains a fixed charge ratio covenant.
All of the above noted term loans are with the same financial institution.
Also on July 23, 2013, the Company entered into a credit agreement with a different financial institution for a subordinated term loan in the amount of $105,000,000. On February 20, 2015, the Company amended the loan agreement to increase the principal to $150,000,000. The loan is subordinated to the previous three term loans. The stated interest rate as of September 30, 2015 and 2014 is the higher of LIBOR or 3% plus a margin of 9% and is paid monthly. The maturity date is October 23, 2018. The credit agreement contains a total debt ratio and fixed charge ratio covenant and restrictions on capital spending. This subordinated term loan is secured by the Company’s inventory and property and equipment.
USP HOLDINGS INC.
Notes to Consolidated Financial Statements
Note 7. Long-Term Debt—(Continued)
Annual principal payments on long-term debt for the following years are as follows:
Years ending September 30, | ||||
2016 | $ | 9,352,882 | ||
2017 | 9,352,882 | |||
2018 | 14,596,981 | |||
2019 | 150,000,000 | |||
|
| |||
| $ | 183,302,745 | |||
|
|
Note 8. Stockholders’ Equity
Common Stock
Each share of common stock is entitled to one vote and shall be identical in all respects and shall entitle the holder to the same rights and privileges.
Stock Options
On April 1, 2012, the Company created the USP Holdings Inc. 2012 stock option plan. The purpose of the plan is to promote the success and enhance the value of the Company by linking the personal interests of the members of the board of directors and key employees to those of the Company’s stockholders and by providing such individuals with an incentive for outstanding performance to generate superior returns for the Company’s stockholders. The stock option plan provides for 7,494 options available to be awarded. The options that are awarded may be redeemed for cash or Company stock only upon the occurrence of a change in control event, as defined in the agreement, based on a prescribed formula, are not transferable and are forfeited upon termination of employment. Because full vesting is not complete until a change in control event is consummated, no compensation expense has been recorded for the years ended September 30, 2015, 2014 or 2013.
A summary of option activity under the Plan as of September 30, 2015, and changes during the year then ended is presented below:
| Shares | Weighted Average Exercise Price | Weighted- Average Remaining Contractual Term | ||||||||||
Outstanding at September 30, 2014 | 5,526 | $ | 474 | |||||||||
Granted | — | — | ||||||||||
Forfeited or expired | (170 | ) | 100 | |||||||||
|
| |||||||||||
Outstanding at September 30, 2015 | 5,356 | $ | 486 | 6.64 | ||||||||
|
| |||||||||||
Vested at September 30, 2015 | 3,649 | $ | 357 | 6.59 | ||||||||
|
| |||||||||||
Exercisable at September 30, 2015 | — | |||||||||||
|
| |||||||||||
USP HOLDINGS INC.
Notes to Consolidated Financial Statements
Note 8. Stockholders’ Equity (Continued)
The unrecognized compensation expense at September 30, 2015 is approximately $540,000.
Note 9. Income Taxes
Significant components of the deferred tax assets and liabilities as of September 30, 2015 and 2014, are as follows:
| September 30, | ||||||||
| 2015 | 2014 | |||||||
Deferred tax assets: | ||||||||
Trade accounts receivable | $ | 387,468 | $ | 230,039 | ||||
Inventories | 1,695,300 | 1,268,294 | ||||||
Accrued expenses | 704,054 | 626,585 | ||||||
Investment in Griffin Pipe Products Co., LLC | 672,206 | 845,847 | ||||||
Other assets | 170,414 | 145,040 | ||||||
|
|
|
| |||||
| 3,629,442 | 3,115,805 | |||||||
|
|
|
| |||||
Deferred tax liabilities: | ||||||||
Property and equipment – U.S. | (33,554,524 | ) | (33,406,270 | ) | ||||
Intangibles | (4,596,648 | ) | (335,680 | ) | ||||
Prepaid expenses | (241,888 | ) | (219,496 | ) | ||||
Postretirement benefit obligation | (540,128 | ) | — | |||||
Property and equipment – foreign | (14,462 | ) | — | |||||
Intangible assets – foreign | (178,598 | ) | — | |||||
|
|
|
| |||||
| (39,126,248 | ) | (33,961,446 | ) | |||||
|
|
|
| |||||
| $ | (35,496,806 | ) | $ | (30,845,641 | ) | |||
|
|
|
| |||||
Deferred tax assets and liabilities are presented in the accompanying consolidated balance sheets as follows:
| September 30, | ||||||||
| 2015 | 2014 | |||||||
Current assets | $ | 2,544,934 | $ | 1,905,421 | ||||
Current assets – foreign | 52,074 | — | ||||||
Long-term liabilities | (37,900,754 | ) | (32,751,062 | ) | ||||
Long-term liabilities – foreign | (193,060 | ) | — | |||||
|
|
|
| |||||
| $ | (35,496,806 | ) | $ | (30,845,641 | ) | |||
|
|
|
| |||||
USP HOLDINGS INC.
Notes to Consolidated Financial Statements
Note 9. Income Taxes (Continued)
The provision (benefit) for income taxes consisted of the following for the years ended September 30, 2015, 2014 and 2013:
| September 30, | ||||||||||||
| 2015 | 2014 | 2013 | ||||||||||
Current – U.S. | $ | 16,449,575 | $ | 7,585,728 | $ | 7,337,018 | ||||||
Deferred – U.S. | (3,280,603 | ) | (10,550,963 | ) | (8,705,068 | ) | ||||||
Current – foreign | 167,087 | — | — | |||||||||
Deferred – foreign | 22,157 | — | — | |||||||||
|
|
|
|
|
| |||||||
. | $ | 13,358,216 | $ | (2,965,235 | ) | $ | (1,368,050 | ) | ||||
|
|
|
|
|
| |||||||
The Company’s effective income tax rate differs from the statutory federal income tax rate of 35% primarily as a result of state income taxes, certain non-deductible expenses, tax credits utilized and the effects of the noncontrolling interest. The Company does not have any net operating loss carry forwards as of September 30, 2015.
Note 10. Operating Leases
The Company leases offices, warehouse facilities and equipment under non-cancelable operating leases with unrelated parties expiring at various dates through 2024. Rent expense for the years ended September 30, 2015, 2014 and 2013, was $8,155,045, $6,785,057 and $2,575,121, respectively.
Future minimum annual commitments under operating leases are as follows:
Years ending September 30, | ||||
2016 | $ | 7,801,811 | ||
2017 | 6,453,158 | |||
2018 | 5,692,188 | |||
2019 | 3,820,688 | |||
2020 | 2,622,987 | |||
Thereafter | 7,452,647 | |||
|
| |||
| $ | 33,843,479 | |||
|
|
Note 11. Retirement Plan
The Company sponsors a defined contribution 401(k) plan for substantially all employees. The plan allows all eligible employees to make elective pretax contributions in an amount not to exceed limits established by the Internal Revenue Service. The plan provides for the Company to make a required matching contribution. The plan is subject to the provisions of the Employee Retirement Income Security Act of 1974 and regulations established by the Internal Revenue Service and Department of Labor. The assets and liabilities of the plan are not included in the Company’s consolidated financial statements as they are those of the plan and not the Company. The Company contributions made to the plan and recognized as expense totaled $1,900,184, $1,391,704 and $748,468 for the years ended September 30, 2015, 2014 and 2013, respectively.
USP HOLDINGS INC.
Notes to Consolidated Financial Statements
Note 12. Related-Party Transactions
On April 2, 2012, the Company entered into a management agreement with Comvest Advisors, LLC and Wynnchurch Capital, Ltd, the managers of USP Holdings Inc. The Company has to pay an annual management fee related to services performed on the Company’s operations and development and implementation of strategies for improving the operating, marketing and financial performance. This fee totaled $500,000 for each of the years ended September 30, 2015, 2014 and 2013. As of September 30, 2015 and 2014, $110,000 remained payable to the related parties and is included in other accrued expenses on the consolidated balance sheets.
Note 13. Employee Benefit Plans
Postretirement Benefits Other than Pensions
The Company provides certain medical and life insurance benefits for certain retirees hired prior to November 21, 2004. The plan covers former union employees of the Griffin Pipe Council Bluffs location hired prior to November 21, 2004, former union employees of the Griffin Pipe Lynchburg location hired prior to November 24, 2002 and salaried and non-union employees of Griffin Pipe hired prior to October 1, 2001. The plan was amended in 2014 to eliminate the postretirement benefits for active employees.
The following table sets forth the postretirement benefit plan’s funded status and amounts recognized in the Company’s consolidated financial statements at September 30, 2015 and 2014.
| September 30, | ||||||||
| 2015 | 2014 | |||||||
Change in benefit obligation | ||||||||
Benefit obligation – beginning of year | $ | 5,246,045 | $ | — | ||||
Benefit obligation – acquired as part of Griffin Pipe Products Co., LLC | — | 6,610,000 | ||||||
Curtailment | (1,814,019 | ) | ||||||
Actuarial net gain (loss) | (1,658,309 | ) | 706,576 | |||||
Interest costs | 172,604 | 149,743 | ||||||
Benefits paid | (572,343 | ) | (406,255 | ) | ||||
|
|
|
| |||||
Benefit obligation – end of year | $ | 3,187,997 | $ | 5,246,045 | ||||
|
|
|
| |||||
Change in plan assets | ||||||||
Fair value of plan assets – beginning of year | $ | — | $ | — | ||||
Employer contribution | 572,343 | 406,255 | ||||||
Benefits paid | (572,343 | ) | (406,255 | ) | ||||
|
|
|
| |||||
Fair value of plan assets – end of year | $ | — | $ | — | ||||
|
|
|
| |||||
Funded status | $ | (3,187,997 | ) | $ | (5,246,045 | ) | ||
|
|
|
| |||||
Amounts recognized in the consolidated balance sheets | ||||||||
Current liabilities | $ | 325,603 | $ | 572,343 | ||||
Noncurrent liabilities | 2,862,394 | 4,673,702 | ||||||
|
|
|
| |||||
Net amounts recognized | $ | 3,187,997 | $ | 5,246,045 | ||||
|
|
|
| |||||
Amounts recognized in accumulated other comprehensive income, net of tax | $ | (994,985 | ) | $ | 184,794 | |||
|
|
|
| |||||
USP HOLDINGS INC.
Notes to Consolidated Financial Statements
Note 13. Employee Benefit Plans (Continued)
The current liabilities amount is included in other accruals on the consolidated balance sheets.
The plan is unfunded with annual benefit obligations paid from current operating funds.
The economic assumptions used in determining the actuarial present value of the projected benefit obligations of the plan as of September 30, 2015 and 2014, were as follows:
| September 30, | ||||||||||||||||
| 2015 | 2014 | |||||||||||||||
Projected benefit obligations: | ||||||||||||||||
Weighted average discount rate | 3.93 | % | 3.48 | % | ||||||||||||
Health care trend rate | ||||||||||||||||
Current rate | 7.00 | % | 6.50 | % | ||||||||||||
Ultimate rate/year reached | 4.50 | % | /2025 | 4.00 | % | /2032 | ||||||||||
The assumed health care and contribution trend rates as of September 30, 2015 ranged from 7% in 2015 trending downward to 4.5% in 2032.
The following postretirement benefits payments, which reflect expected future service, as appropriate are expected to be paid as follows:
Years ending September 30, | ||||
2016 | $ | 325,603 | ||
2017 | 301,389 | |||
2018 | 286,995 | |||
2019 | 279,301 | |||
2020 | 264,846 | |||
2021 – 2025 | 994,074 |
Net postretirement benefit cost for the years ended September 30, 2015 and 2014 consisted of the following components:
| September 30, | ||||||||
| 2015 | 2014 | |||||||
Interest costs | $ | 172,604 | $ | 149,743 | ||||
|
|
|
| |||||
Net postretirement benefit cost | $ | 172,604 | $ | 149,743 | ||||
|
|
|
| |||||
The effect of a 1% increase and a 1% decrease in the health care trend rate on the benefit obligation and aggregate of service cost plus interest cost is $12,459 and ($12,055), respectively, at September 30, 2015.
Note 14. Major Customers
Major customers are those customers who account for 10% or more of the Company’s total net sales or customers with an accounts receivable balance in excess of 10% of current assets. The Company had net sales to one customer totaling $178,630,206, $150,341,210 and $107,249,805 for the years ended September 30, 2015, 2014 and 2013, respectively. Outstanding receivables with this customer were 16.3% and 18.9% of total current assets at September 30, 2015 and 2014, respectively.
USP HOLDINGS INC.
Notes to Consolidated Financial Statements
Note 15. Self-Insurance
The Company is partially self-insured for employee health and dental programs as well as workers’ compensation. The Company pays medical expenses up to a maximum of $350,000 per employee per year. For workers’ compensation, the Company pays claims up to a maximum of $500,000. Costs in excess of these amounts are covered by insurance. Costs resulting from self-insured claims are charged to income when incurred.
Note 16. General Litigation
The Company is subject to various claims and legal proceedings that arise in the ordinary course of its business activities. While the results of litigation and claims cannot be predicted with certainty, in the opinion of management, none of these actions is expected to have a material adverse effect on the Company, its results of operations or its financial position.
Note 17. Griffin Pipe Products Co., LLC – Council Bluffs Facility
The Council Bluffs, Iowa facility acquired during the Griffin acquisition was idled in April 2014 due to industry demand. The Company has retained maintenance personnel at the facility to “exercise” the equipment in anticipation of an eventual restart. During the 2015 planning process, the Company developed a detailed startup plan for the facility. The Company continuously monitors market demands and production requirements to assess the need for additional capacity and the restart of the facility.
At September 30, 2015, the Company believes there are no events or circumstances that indicate that the carrying amounts of these idle assets are not recoverable or exceed their fair value.
Since the date of acquisition, January 31, 2014, $8,388,011 was recorded in depreciation expense related to these assets. These assets are recorded in the noncurrent section of the Company’s consolidated balance sheet.
The following is a summary of idle assets as of September 30, 2015 and 2014:
| September 30, | ||||||||
| 2015 | 2014 | |||||||
Machinery and equipment | $ | 23,419,808 | $ | 23,060,389 | ||||
Land and mineral resources | 2,080,000 | 2,080,000 | ||||||
Buildings | 1,401,563 | 1,405,834 | ||||||
Pipe molds | 1,891,509 | 1,935,085 | ||||||
Construction in progress | 464,412 | 408,815 | ||||||
Computer software | 134,705 | 134,705 | ||||||
|
|
|
| |||||
| 29,391,997 | 29,024,828 | |||||||
Less: accumulated depreciation | 8,388,011 | 3,132,688 | ||||||
|
|
|
| |||||
| $ | 21,003,986 | $ | 25,892,140 | |||||
|
|
|
| |||||
Note 18. Restructuring Costs
On March 1, 2014, the Company announced plans to restructure its operations into three foundry locations. The Company believes this plan will enhance the profit potential of the business. This action resulted in the temporary closure of operations at the Council Bluffs, Iowa facility. The related charges
USP HOLDINGS INC.
Notes to Consolidated Financial Statements
Note 18. Restructuring Costs (Continued)
are included in the restructuring line in the Company’s accompanying consolidated statements of operations. The planned actions relating to this restructure were completed at the end of September 30, 2014. The cost of this restructuring was $5,321,362.
The following is a summary of restructuring costs incurred:
Severance benefits | $ | 2,546,077 | ||
Inventory – disposal, return and transfer costs | 2,258,476 | |||
Contract cancellations | 485,579 | |||
Other | 31,230 | |||
|
| |||
| $ | 5,321,362 | |||
|
|
The changes in the liabilities related to restructuring for the year ended September 30, 2014 are as follows:
| Amount | ||||
Balance, September 30, 2013 | $ | — | ||
Charges to expense | 5,321,362 | |||
Cash payments | (5,289,976 | ) | ||
|
| |||
Balance, September 30, 2014 | $ | 31,386 | ||
|
| |||
The restructuring liability of $31,386 represents severance payment obligations. This liability was paid in fiscal year 2015, as such no restructuring liability exists at September 30, 2015.
Note 19. Significant Event
On April 29, 2014, the Company experienced a fire at its Bessemer, Alabama manufacturing facility that damaged a production line.
The Company maintains insurance for both property damage and business interruption relating to catastrophic events. Business interruption covers lost profits and other costs incurred. Non-refundable insurance recoveries received in excess of the net book value of damaged assets, cleanup and post-event costs are recognized as income in the period received.
The Company incurred costs related to the clean-up and repair of the facility and equipment repairs totaling $203,646 and $10,300,000 for the years ended September 30, 2015 and 2014, respectively. In the years ended September 30, 2015 and 2014, the Company received $7,041,239 and $2,000,000, respectively, of insurance reimbursements associated with these costs. In the year ended September 30, 2015, the Company recorded expenses of $548,359 related to proceeds under the Company’s property loss insurance coverage. In the year ended September 30, 2014, the Company recorded a gain of $715,547 related to proceeds received to replace fixed assets under the Company’s property loss insurance coverage.
The total amount of insurance recoveries related to this event as of September 30, 2015 is $9,041,239. No additional amounts are expected to be received related to insurance recoveries and no additional costs are expected to be incurred.
Cretex Concrete Products, Inc.
Carve-out Financial Statements
For the period ended September 30, 2015 and the fiscal years ended December 27, 2014 and December 28, 2013

To the Management
of Forterra Building Products, Inc.
We have audited the accompanying financial statements of Cretex Concrete Products, Inc., a wholly owned subsidiary of Forterra Building Products, Inc., which comprise thebalance sheetsas of September 30, 2015and December 27, 2014, and the related statements of operations, changes in stockholders’ equity [on a carve-out basis], and of cash flows for the fiscal period ended September 30, 2015, December 27, 2014, and December 28, 2013.
Management’s Responsibility for the Financial Statements
Management is responsible for the preparation and fair presentation of the financial statements in accordance with accounting principles generally accepted in the United States of America; this includes the design, implementation, and maintenance of internal control relevant to the preparation and fair presentation of financial statements that are free from material misstatement, whether due to fraud or error.
Auditor’s Responsibility
Our responsibility is to express an opinion on the financial statements based on our audits. We conducted our audits in accordance with auditing standards generally accepted in the United States of America. Those standards require that we plan and perform the audit to obtain reasonable assurance about whether the financial statements are free from material misstatement.
An audit involves performing procedures to obtain audit evidence about the amounts and disclosures in the financial statements. The procedures selected depend on our judgment, including the assessment of the risks of material misstatement of the financial statements, whether due to fraud or error. In making those risk assessments, we consider internal control relevant to the Company’s preparation and fair presentation of the financial statements in order to design audit procedures that are appropriate in the circumstances, but not for the purpose of expressing an opinion on the effectiveness of the Company’s internal control. Accordingly, we express no such opinion. An audit also includes evaluating the appropriateness of accounting policies used and the reasonableness of significant accounting estimates made by management, as well as evaluating the overall presentation of the financial statements. We believe that the audit evidence we have obtained is sufficient and appropriate to provide a basis for our audit opinion.
Opinion
In our opinion, the financial statements referred to above present fairly, in all material respects, the financial position of Cretex Concrete Products, Inc. as of September 30, 2015and December 27, 2014, and the results of its operations and its cash flows for the fiscal period ended September 30, 2015, December 27, 2014, and December 28, 2013 in accordance with accounting principles generally accepted in the United States of America.
/s/ PricewaterhouseCoopers, LLP
Minneapolis, Minnesota
July 8, 2016
CRETEX CONCRETE PRODUCTS, INC.
CARVE-OUT STATEMENTS OF OPERATIONS
(In $US thousands)
| Period ended September 30, | Fiscal year ended December 27, | Fiscal year ended December 28, | ||||||||||
| 2015 | 2014 | 2013 | ||||||||||
Net sales | $ | 149,284 | $ | 175,470 | $ | 160,267 | ||||||
Cost of goods sold | 121,969 | 147,613 | 135,608 | |||||||||
|
|
|
|
|
| |||||||
Gross profit | 27,315 | 27,857 | 24,659 | |||||||||
Selling, general and administrative expenses | (11,962 | ) | (15,082 | ) | (14,252 | ) | ||||||
Gain on sale of property, plant and equipment, net | 310 | 227 | 502 | |||||||||
|
|
|
|
|
| |||||||
| (11,652 | ) | (14,855 | ) | (13,750 | ) | |||||||
|
|
|
|
|
| |||||||
Income from operations | 15,663 | 13,002 | 10,909 | |||||||||
Other expenses | ||||||||||||
Interest expense | (1,029 | ) | (1,226 | ) | (1,551 | ) | ||||||
|
|
|
|
|
| |||||||
Net income | $ | 14,634 | $ | 11,776 | $ | 9,358 | ||||||
|
|
|
|
|
| |||||||
See accompanying notes to the carve-out financial statements
CRETEX CONCRETE PRODUCTS, INC.
(in $US thousands)
| September 30, 2015 | December 27, 2014 | |||||||
ASSETS | ||||||||
Current assets | ||||||||
Trade receivables | 36,878 | 13,006 | ||||||
Inventories | 38,383 | 34,627 | ||||||
Other current assets | 1,234 | 862 | ||||||
|
|
|
| |||||
Total current assets | 76,495 | 48,495 | ||||||
|
|
|
| |||||
Non-current assets | ||||||||
Property, plant and equipment, net | 55,956 | 58,482 | ||||||
Other long-term assets | 59 | 179 | ||||||
|
|
|
| |||||
Total assets | $ | 132,510 | $ | 107,156 | ||||
|
|
|
| |||||
LIABILITIES AND STOCKHOLDERS’ EQUITY | ||||||||
Current liabilities | ||||||||
Trade payables | $ | 8,670 | $ | 4,894 | ||||
Advances from customers | 1,983 | 3,124 | ||||||
Accrued liabilities | 4,319 | 4,032 | ||||||
Employee benefit obligations | 1,016 | 4,451 | ||||||
Taxes other than income taxes | 2,177 | 1,607 | ||||||
Current maturities - long term debt | — | 500 | ||||||
Accounts payable to related parties | 144 | 138 | ||||||
|
|
|
| |||||
Total current liabilities | 18,309 | 18,746 | ||||||
|
|
|
| |||||
Non-current liabilities | ||||||||
Note payable to parent company | 35,400 | 15,243 | ||||||
Long-term debt, less current maturities | — | 9,000 | ||||||
Incentive compensation | 525 | 525 | ||||||
|
|
|
| |||||
Total liabilities | 54,234 | 43,514 | ||||||
|
|
|
| |||||
Commitments and contingencies (Note 8) | ||||||||
Stockholders’ equity | ||||||||
Common stock, $10.00 par value - 3,000 shares authorized; | ||||||||
1,829 shares issued and outstanding | 18 | 18 | ||||||
Additional paid in capital | 23,669 | 23,669 | ||||||
Retained earnings | 54,589 | 39,955 | ||||||
|
|
|
| |||||
Total stockholders’ equity | 78,276 | 63,642 | ||||||
|
|
|
| |||||
Total liabilities and stockholders’ equity | $ | 132,510 | $ | 107,156 | ||||
|
|
|
| |||||
See accompanying notes to the carve-out financial statements
CRETEX CONCRETE PRODUCTS, INC.
Statements of Changes in Stockholders’ Equity on a Carve-out Basis
(in $US thousands)
| Common stock | Additional paid in capital | Retained earnings | Total stockholders’ equity | |||||||||||||
Period ended September 30, 2015 | ||||||||||||||||
Balance, December 28, 2014 | $ | 18 | $ | 23,669 | $ | 39,955 | $ | 63,642 | ||||||||
Net Income | — | — | 14,634 | 14,634 | ||||||||||||
|
|
|
|
|
|
|
| |||||||||
Balance, September 30, 2015 | 18 | 23,669 | 54,589 | 78,276 | ||||||||||||
|
|
|
|
|
|
|
| |||||||||
Fiscal year ended December 27, 2014 | ||||||||||||||||
Balance, December 29, 2013 | $ | 18 | $ | 23,669 | $ | 33,666 | $ | 57,353 | ||||||||
Net Income | — | — | 11,776 | 11,776 | ||||||||||||
Distributions to parent | — | — | (5,487 | ) | (5,487 | ) | ||||||||||
|
|
|
|
|
|
|
| |||||||||
Balance, December 27, 2014 | 18 | 23,669 | 39,955 | 63,642 | ||||||||||||
|
|
|
|
|
|
|
| |||||||||
Fiscal year ended December 28, 2013 | ||||||||||||||||
Balance, December 30, 2012 | $ | 18 | $ | 23,669 | $ | 24,308 | $ | 47,995 | ||||||||
Net Income | — | — | 9,358 | 9,358 | ||||||||||||
|
|
|
|
|
|
|
| |||||||||
Balance, December 28, 2013 | 18 | 23,669 | 33,666 | 57,353 | ||||||||||||
|
|
|
|
|
|
|
| |||||||||
See accompanying notes to the carve-out financial statements
CRETEX CONCRETE PRODUCTS, INC.
Carve-out Statements of Cash Flows
(in $US thousands)
| Period ended September 30, | Fiscal year ended December 27, | Fiscal year ended December 28, | ||||||||||
| 2015 | 2014 | 2013 | ||||||||||
CASH FLOWS FROM OPERATING ACTIVITIES | ||||||||||||
Net income | $ | 14,634 | $ | 11,776 | $ | 9,358 | ||||||
Adjustments to reconcile net income to net cash (used in) provided by operating activities: | ||||||||||||
Depreciation and amortization expense | 5,342 | 6,524 | 6,066 | |||||||||
Bad debts | — | 6 | 43 | |||||||||
Amortization of deferred financing fees | 161 | 19 | 1 | |||||||||
(Gain) on disposal of property, plant and equipment | (310 | ) | (227 | ) | (502 | ) | ||||||
Change in assets and liabilities: | ||||||||||||
Trade receivables, net | (23,872 | ) | 2,601 | (1,568 | ) | |||||||
Inventories | (3,755 | ) | (5,975 | ) | (4,253 | ) | ||||||
Other assets | (415 | ) | (49 | ) | 470 | |||||||
Trade payables | 4,038 | (756 | ) | 836 | ||||||||
Other current liabilities | (3,711 | ) | 2,872 | 512 | ||||||||
Other long-term liabilities | — | 39 | (19 | ) | ||||||||
|
|
|
|
|
| |||||||
NET CASH (USED IN) PROVIDED BY OPERATING ACTIVITIES | (7,888 | ) | 16,830 | 10,944 | ||||||||
|
|
|
|
|
| |||||||
CASH FLOWS FROM INVESTING ACTIVITIES | ||||||||||||
Proceeds from the sale of plant, property, and equipment, net | 324 | 509 | 522 | |||||||||
Purchases of property, plant and equipment | (3,093 | ) | (9,066 | ) | (12,651 | ) | ||||||
|
|
|
|
|
| |||||||
NET CASH USED IN INVESTING ACTIVITIES | (2,769 | ) | (8,557 | ) | (12,129 | ) | ||||||
|
|
|
|
|
| |||||||
CASH FLOWS FROM FINANCING ACTIVITIES | ||||||||||||
Proceeds from long-term debt | — | 2,670 | 7,330 | |||||||||
Principal payments on long-term debt | (9,500 | ) | (500 | ) | — | |||||||
Repayments of parent company note | (132,092 | ) | (186,918 | ) | (167,539 | ) | ||||||
Borrowings on parent company note | 152,249 | 181,962 | 161,575 | |||||||||
Payments of deferred financing fees | — | — | (181 | ) | ||||||||
Distributions to parent company | — | (5,487 | ) | — | ||||||||
|
|
|
|
|
| |||||||
NET CASH PROVIDED BY (USED IN) FINANCING ACTIVITIES | 10,657 | (8,273 | ) | 1,185 | ||||||||
|
|
|
|
|
| |||||||
Net change in cash and cash equivalents | — | — | — | |||||||||
Cash and cash equivalents balance, beginning of period | — | — | — | |||||||||
|
|
|
|
|
| |||||||
Cash and cash equivalents balance, end of period | — | — | — | |||||||||
|
|
|
|
|
| |||||||
SUPPLEMENTAL DISCLOSURES: | ||||||||||||
Cash paid for interest | 106 | 132 | — | |||||||||
Non cash investing and financing activity | ||||||||||||
Purchase of property, plant and equipment in accounts payable | 230 | 492 | 54 | |||||||||
Transfers of property, plant and equipment to (from) related parties | — | 876 | (45 | ) | ||||||||
See accompanying notes to the carve-out financial statements
CRETEX CONCRETE PRODUCTS, INC.
Notes to Carve-out Financial Statements
(In $US thousands)
1. Organization and description of the business
Cretex Concrete Products, Inc. (“CCP or “the Company”) carve-out financial statements (the “CCP Carve-out Financial Statements”) present the historical carve-out results of operations, changes in stockholders’ equity and cash flows as of and for the period ended September 30, 2015, December 27, 2014 and December 28, 2013, and present the historical carve-out financial position as of September 30, 2015 and December 27, 2014. The Company is a division of Cretex Companies, Inc (“Cretex” or “the Parent company”). The CCP Carve-out Financial Statements have been derived from the accounting records of Cretex on a carve-out basis. The CCP Carve-out Financial Statements results do not necessarily reflect what the financial position, results of operations, changes in stockholders’ equity or cash flows would have been if CCP had been a separate entity.
On October 1, 2015 HBP Pipe & Precast, LLC (subsequently renamed Forterra Pipe & Precast, LLC, hereinafter, “Forterra”) acquired 100% of the outstanding common stock of CCP. CCP is a manufacturer of reinforced concrete pipe, box culverts, precast drainage structure, prestressed bridge components and ancillary precast products in the Midwestern section of the United States (the “Midwest”).
The CCP Carve-out Financial Statements were prepared in accordance with accounting principles generally accepted in the United States of America (“U.S. GAAP”). These principles are established by the Financial Accounting Standards Board. The preparation of the CCP Carve-out Financial Statements in accordance with U.S. GAAP requires that management make estimates and assumptions and use judgment regarding the reported amounts of assets, liabilities, revenues and expenses and disclosures of contingent assets and liabilities for the periods presented herein.
Amounts presented herein are in thousands of U.S. dollars unless otherwise noted.
2. Significant accounting policies
Basis of presentation
These financial statements were prepared from the accounting records of Cretex on a carve-out basis. Preparation of the carve-out basis financial statements included making certain adjustments to present the historical records on a basis as if CCP had been a separate entity. These adjustments include adjustments of corporate allocations to amounts representative of full allocations reflective of the benefits CCP received.
Cretex uses a centralized approach to cash management and financing of its operations. CCP does not maintain cash accounts at the entity level and all cash receipts are remitted into a bank account of the Parent company and disbursements are drawn off of a bank account of the Parent company for the benefit of CCP. This arrangement is not reflective of the manner in which the Company would have been able to finance and provide for working capital for its operations had it been a stand-alone business separate from Cretex during the periods presented. Cash transfers to and from the Parent company’s accounts are reflected within the note payable to parent company.
The carve-out financial statements include certain assets and liabilities that have historically been held at the Parent company corporate level but are specifically identifiable or otherwise allocable to the Company. The cash and cash equivalents held by Cretex at the corporate level are not specifically identifiable to the Company and therefore were not allocated for any of the periods presented. Cretex
CRETEX CONCRETE PRODUCTS, INC.
Notes to Carve-out Financial Statements
(In $US thousands)
2. Significant accounting policies (Continued)
management allocated a proportion of the corporate third-party debt to the Company through the note payable to parent company (“Parent note”). The Parent note functioned as a form of permanent financing for the Company with changes during the period representing excess net receipts used to pay down the balance or excess net payments which increased the draw on the Parent note. The Parent company charged CCP interest on the Parent note at a rate reflective of the third party interest rates paid by the Parent company. The Company was a joint and severally liable guarantor of the corporate third party debt, along with the other subsidiaries of the Parent company. Proceeds from the sale of CCP to Forterra were used to extinguish certain existing debt of Cretex.
The historical costs and expenses reflected in the carve-out financial statements include an allocation for certain corporate functions historically provided by the Parent company. Historically, the centralized functions have included executive senior management, financial reporting, financial planning and analysis, information technology, tax, risk management, treasury, legal, human resources, safety and strategy and development. The cost of each of these services has been allocated to the Company on the basis of the Company’s relative head count and for general and administrative expenses on the basis of revenues relative to overall Cretex revenues. The Company believes that these allocations reasonably reflect the utilization of services provided and benefits received. However, they may differ from the cost that would have been incurred had the Company operated as a stand-alone company for the periods presented. Actual costs that would have been incurred if the Company had been a stand-alone company would depend on multiple factors, including organizational structure and strategic decisions made in various areas, including legal services, accounting and finance services, human resources, marketing and contract support, customer support, treasury, facility and other corporate and infrastructural services.
Use of estimates
The preparation of the financial statements in conformity with U.S. GAAP requires management to make estimates and assumptions that affect the reported amounts of assets and liabilities, the disclosure of contingent assets and liabilities as of the date of the financial statements and the reported amounts of revenues and expenses during the reporting period. Actual results could differ from these estimates. These estimates are based on management’s best knowledge of current events and actions that the Company may undertake in the future. The more significant estimates made by management relate to bodily injury and insurance claims which were determined by the Parent company based on the number and severity of claims historically and the estimated costs going forward, as well as estimates for inventory reserves, allowance for doubtful accounts, allocation of corporate expenses, profit sharing, bonuses and other compensation related items and impairment of long-lived assets.
Accounting periods
The Company’s fiscal year ends on the last Saturday in December. Accordingly, each fiscal year normally consists of 13 four-week periods, or accounting periods, accounting for 364 days in the aggregate. The period ended September 30, 2015 consists of 39 weeks and 4 days, or 277 days. Fiscal 2014 and 2013 both contained 52 weeks.
CRETEX CONCRETE PRODUCTS, INC.
Notes to Carve-out Financial Statements
(In $US thousands)
2. Significant accounting policies (Continued)
Cash and cash equivalents
The Company does not hold any cash or cash equivalents. Treasury activities, including activities related to the Company, are centralized by Cretex such that the net cash collections are automatically distributed to Cretex and reflected in the Parent note.
Concentration of credit risk
Financial instruments that potentially subject the Company to concentrations of credit risk are primarily receivables. The Company performs ongoing credit evaluations of its customers’ financial condition and generally requires no collateral other than partial advance payments or deposits from its customers on major projects. The allowances for uncollectible receivables are based upon analysis of economic trends in the construction industry, detailed analysis of the expected collectability of accounts receivable that are past due and the expected collectability of overall receivables.
Trade receivables, net
Trade receivables are recorded at net realizable value, which includes allowances for doubtful accounts. The Company reviews the collectability of trade receivables on an ongoing basis. The Company reserves for trade receivables determined to be uncollectible. This determination is based on the delinquency of the account, the financial condition of the customer and the Company’s collection experience.
Inventories
Inventories are valued at the lower of cost or market. The Company’s inventories are valued using the average cost method which approximates first in first out (“FIFO”) inventory costing. Inventories include materials, labor and applicable factory overhead costs. The value of inventory is adjusted for damaged, obsolete, excess and slow-moving inventory. Market value of inventory is estimated considering the impact of market trends, an evaluation of economic conditions and the value of current orders relating to the future sales of each respective component of inventory.
Property, plant and equipment, net
Property, plant and equipment is stated at cost less accumulated depreciation. Depreciation of property, plant and equipment is computed using the straight-line method over the estimated useful lives of the assets. These lives range from 15 to 33 years for buildings, 5 to 15 years for machinery and equipment, 5 to 10 years for molds and rings, 5 to 15 years for automobiles and trucks, and lower of lease term or useful life on leasehold improvements. Repair and maintenance costs are expensed as incurred. The Company’s depreciation expenses are recorded in cost of goods sold and selling, general and administrative expenses in the carve-out statements of operations.
Impairment or disposal of long-lived assets
The Company evaluates the recoverability of its long-lived assets in accordance with the provisions of ASC 360,Property, Plant and Equipment(“ASC 360”). ASC 360 requires that long-lived
CRETEX CONCRETE PRODUCTS, INC.
Notes to Carve-out Financial Statements
(In $US thousands)
2. Significant accounting policies (Continued)
assets and certain identifiable intangibles be reviewed for impairment whenever events or changes in circumstances indicate that the carrying amount of an asset may not be recoverable. Recoverability of assets is measured by comparing the carrying amount of an asset to future undiscounted net cash flows expected to be generated by the asset. Such evaluations for impairment are significantly impacted by estimates of future prices for the Company’s products, capital needs, economic trends in the construction sector and other factors. If such assets are considered to be impaired, the impairment to be recognized is measured at the amount by which the carrying amount of the assets exceeds their fair value. Assets to be disposed of by sale are reflected at the lower of their carrying amount or fair value less cost to sell.
The Company assesses impairment of long-lived assets at the lowest level for which identifiable cash flows are largely independent of the cash flows of other assets and liabilities. For purposes of evaluating impairment of long-lived assets held in use, the Company has determined this level to be the asset group level, which is defined as the individual CCP plants. For assets meeting the criteria for classification as held for sale under ASC 360, the impairment is assessed at the disposal group level, generally the specific plant or plants held for sale.
Defined benefit pension plans and other post-retirement benefits
The Company’s employees participate in defined benefit pension plans that are sponsored by Cretex. The pension plans are the Cretex Salaried Pension Plan that was frozen in 2008 and the Cretex Hourly Pension Plan that was frozen during the period 2008 to 2011. These plans include other Cretex employees that are not employees of the Company. Cretex also provides certain retiree health and life insurance benefits to eligible employees who have retired from the Company. Due to their separation from Cretex on October 1, 2015, participating CCP employees were offered the choice of annuity or lump sum settlement payout options. Both plans were terminated by Cretex effective December 31, 2015.
The Company also has employees covered by collective bargaining agreements that provide for defined benefit pension plans. These plans include the Central States Southeast and Southwest Areas Pension Plan that the Company withdrew from effective April 28, 2013, Construction Industry Laborers Pension Fund and Minnesota Laborers Pension Fund that the Company withdrew from effective January 31, 2015 and the Central Pension Fund of International Union of Operating Engineers’ which is under a collective bargaining agreement that expires on May 31, 2018.
The Company accounts for its defined benefit pension plans as multiemployer plans under ASC 715,Compensation – Benefit Plans (“ASC 715”). In the sale of CCP to Forterra, Cretex assumed responsibility for all future liabilities and payments for the defined benefit pensions plans.
Fair value measurement
The Company utilizes valuation techniques that maximize the use of observable inputs and minimize the use of unobservable inputs to the extent possible. The Company determines fair value based on assumptions that market participants would use in pricing an asset or liability in the principal or most advantageous market. When considering market participant assumptions in fair value
CRETEX CONCRETE PRODUCTS, INC.
Notes to Carve-out Financial Statements
(In $US thousands)
2. Significant accounting policies (Continued)
measurements, the following fair value hierarchy distinguishes between observable and unobservable inputs, which are categorized in one of the following levels:
Level 1 Inputs – Unadjusted quoted prices in active markets for identical assets or liabilities accessible to the reporting entity at the measurement date.
Level 2 Inputs – Other than quoted prices included in Level 1 inputs that are observable for the asset or liability, either directly or indirectly, for substantially the full term of the asset or liability.
Level 3 Inputs – Unobservable inputs for the asset or liability used to measure fair value to the extent that observable inputs are not available, thereby allowing for situations in which there is little, if any, market activity for the asset or liability at measurement date.
The Company’s other financial instruments consist primarily of trade and other receivables, accounts payable, accrued expenses and long-term debt. The carrying value of the Company’s trade and other receivables, trade payables and accrued expenses approximates fair value due to their highly liquid nature, short term maturity, or competitive rates assigned to these financial instruments.
The Company may adjust the carrying amount of certain nonfinancial assets to fair value on a non-recurring basis when they are impaired.
Revenue recognition
Revenues are recognized by the Company when the risks and rewards associated with the transaction have been transferred to the purchaser, which is demonstrated when all the following conditions are met: evidence of a binding arrangement exists (generally, purchase orders), products have been delivered or services have been rendered, there is no future performance required, fees are fixed or determinable and amounts are collectable under normal payment terms. Sales represent the net amounts charged or chargeable in respect of services rendered and goods supplied. Sales are recognized net of any discounts given to the customer and sales or use taxes.
The Company incurs shipping costs to third parties for the transportation of products to customers and builds the cost of freight into the prices charged to customers for the delivered product. For the period ended September 30, 2015 and the fiscal years ended December 27, 2014 and December 28, 2013, the Company recorded freight costs of $17,498, $21,621, and $18,212, respectively, on a gross basis within cost of products sold in the accompanying carve-out statements of operations.
The Company recognizes revenue at the time the final delivery reaches the customer. In most case final delivery to the customers is within the same day that the shipment is picked up by a third party hauler. The Company also ships lighting pole bases monthly under a consignment arrangement. The consignment sales are not recognized as revenue until the customer reports that the product has been sold.
Cost of goods sold and selling, general and administrative expenses
Cost of goods sold includes costs of production, inbound freight charges for raw materials, outbound freight to customers, purchasing and receiving costs, inspection costs, warehousing at plant
CRETEX CONCRETE PRODUCTS, INC.
Notes to Carve-out Financial Statements
(In $US thousands)
2. Significant accounting policies (Continued)
facilities and pension expenses. Selling, general and administrative costs also include expenses for sales, marketing, legal, accounting and finance services, human resources, customer support, treasury and other general corporate services. Advertising expense totaled $120, $131, and $209 for the period ended September 30, 2015 and the fiscal years ended December 27, 2014 and December 28, 2013, respectively, which is included in selling, general and administrative expenses in the carve-out statements of operations.
Income taxes
Income taxes on operating results have not been accounted for in these financial statements as Cretex has elected “S” Corporation status providing for the pass through of the assessment of income taxes to the owners of Cretex stock and CCP has made a valid qualified subchapter S subsidiary income tax election (“QSub”) under internal revenue code (“IRC”) section 1361. The election of QSub status was approved with an effective date of January 3, 2007.
The Company has not engaged in, nor is a party to, any tax-sharing arrangements with the Parent company or any other related or non-related parties.
Recent accounting pronouncements
In March 2016, the FASB issued ASU 2016-08, which amends the principal-versus-agent implementation guidance and illustrations in ASU 2014-09. Among other things, ASU 2016-08 clarifies that an entity should evaluate whether it is the principal or the agent for each specified good or service promised in a contract with a customer. As defined in ASU 2016-08, a specified good or service is “a distinct good or service (or a distinct bundle of goods or services) to be provided to the customer.” Therefore, for contracts involving more than one specified good or service, the entity may be the principal for one or more specified goods or services and the agent for others. ASU 2016-08 has the same effective date as ASU 2014-09, as amended by ASU 2015-14. The Company is required to adopt ASU 2016-08 using the same transition method it uses to adopt ASU 2014-09. The Company is currently evaluating the impact the adoption of ASU 2014-09, ASU 2015-14 and ASU 2016-08 will have on our financial statements.
In February 2016, the FASB issued ASU 2016-02, which requires a lessee to recognize assets and liabilities on the balance sheet for leases with lease terms greater than 12 months. ASU 2016-02 is effective for fiscal years, and interim periods within those years, beginning after December 15, 2018, and early adoption is permitted. Accordingly, the standard is effective for us on January 1, 2019 using a modified retrospective approach. We are currently evaluating the impact that the standard will have on our financial statements.
In August 2015, The FASB issued ASU 2015-15, as ASU 2015-03 did not specifically address presentation or subsequent measurement of debt issuance costs related to line-of-credit arrangements. ASU 2015-15 allows an entity to continue to defer and present debt issuance costs ratably over the term of the line-of-credit arrangement, regardless of whether there are any outstanding borrowings on the line-of-credit arrangement. The guidance in ASU 2015-03 and ASU 2015-15 is effective for financial statements issued for fiscal years beginning after December 15, 2015, and interim periods within those fiscal years. Early adoption is permitted for financial statements that have
CRETEX CONCRETE PRODUCTS, INC.
Notes to Carve-out Financial Statements
(In $US thousands)
2. Significant accounting policies (Continued)
not been previously issued. Had the Company adopted this guidance early, other assets would have been lower by approximately $0 and $161 with corresponding decreases in debt as of September 30, 2015 and December 27, 2014, respectively. The adoption of this standard will have no impact on the Company’s results of operations, cash flows or net assets.
In July 2015, the FASB issued ASU 2015-11, which simplifies the accounting for the valuation of all inventory not accounted for using the last-in first-out (“LIFO”) method by prescribing that inventory be valued at the lower of cost and net realizable value. ASU 2015-11 is effective for financial statements issued for fiscal years beginning after December 15, 2016, and for interim periods beginning after December 15, 2017 for private entities on a prospective basis. We are currently evaluating the impact that the standard will have on our financial statements.
3. Trade receivables, net
Receivables consist of the following:
| September 30, 2015 | December 27, 2014 | |||||||
Trade receivables | $ | 36,988 | $ | 13,116 | ||||
Less: Allowance for doubtful accounts | (110 | ) | (110 | ) | ||||
|
|
|
| |||||
Total trade receivables | $ | 36,878 | $ | 13,006 | ||||
|
|
|
| |||||
The Company recorded provisions for doubtful accounts of approximately $0, $6 and $43 for the period ended September 30, 2015 and the fiscal years ended December 27, 2014 and December 28, 2013, respectively, which is included in selling, general and administrative expenses in the carve-out statements of operations.
4. Inventories
Inventory consists of the following:
| September 30, 2015 | December 27, 2014 | |||||||
Finished goods | $ | 33,185 | $ | 30,120 | ||||
Raw materials | 6,090 | 4,772 | ||||||
Reserve for excess and slow moving | (892 | ) | (265 | ) | ||||
|
|
|
| |||||
Total inventory | $ | 38,383 | $ | 34,627 | ||||
|
|
|
| |||||
As of each period end all projects were complete and the Company had no work in process inventory.
CRETEX CONCRETE PRODUCTS, INC.
Notes to Carve-out Financial Statements
(In $US thousands)
5. Property, plant and equipment, net
Property, plant and equipment, net consist of the following:
| September 30, 2015 | December 27, 2014 | |||||||
Land | $ | 5,895 | $ | 5,895 | ||||
Land improvements | 7,722 | 6,757 | ||||||
Buildings | 21,740 | 20,955 | ||||||
Machinery and equipment | 99,079 | 99,356 | ||||||
Molds and rings | 18,753 | 18,708 | ||||||
Autos and trucks | 6,491 | 6,824 | ||||||
Construction-in-progress | 1,481 | 2,557 | ||||||
|
|
|
| |||||
Total property, plant and equipment | 161,161 | 161,052 | ||||||
Less: accumulated depreciation | (105,205 | ) | (102,570 | ) | ||||
|
|
|
| |||||
Property, plant and equipment, net | $ | 55,956 | $ | 58,482 | ||||
|
|
|
| |||||
The company did not have any equipment classified as capital leases as of September 30, 2015 and December 27, 2014, respectively.
Depreciation expense totaled $5,342, $6,524, and $6,066 for the period ended September 30, 2015 and the fiscal years ended December 27, 2014 and December 28, 2013, respectively, which is included in cost of goods sold and selling, general and administrative expenses in the carve-out statements of operations.
Permanently idled facility
At the end of 2010, the Company closed and permanently idled the facility in Prairie City, Iowa and wrote the value down to $93. The facility was transferred to a related party, Cretex Properties, Inc., at the end of 2014 (see note 9 – Related party transactions).
The property had not been sold during the carve-out financial statement period and did not meet the criteria to be presented as held for sale prior to the transfer to Cretex Properties, Inc. As such, the net book value of the Prairie City land has been segregated from property, plant and equipment, net as it is not a part of long-term operating assets and is reflected in the Other long-term assets section of the carve-out financial statements. The Company is leasing out the site and received rental payments for the property of $15, $20 and $25 for the period ended September 30, 2015 and the fiscal years ended December 27, 2014 and December 28, 2013, respectively.
Plant closures
At the end of 2014 the Company closed down 5 plants located in Duluth, Minnesota, Grand Forks and Fargo, North Dakota, and Riverton and Casper, Wyoming. The production at these plants was transferred to, and replaced by, new and existing plants with newer facilities, higher capacities and improved production capabilities. The Grand Forks, Fargo and Riverton locations were transferred to a related party, Cretex Properties, Inc., at the end of 2014 (see note 9 – Related party transactions). The Duluth location is being retained by the Company as a storage and shipping yard. The lease on the
CRETEX CONCRETE PRODUCTS, INC.
Notes to Carve-out Financial Statements
(In $US thousands)
5. Property, plant and equipment, net (Continued)
Casper location expired at the end of 2014 and was not renewed by the Company. In connection with the plant closures and the Prairie City plant that was closed in 2010, the Company recognized $258, $19 and $76 in shutdown costs on the plant locations for the period ended September 30, 2015 and the fiscal years ended December 27, 2014 and December 28, 2013, respectively, which is included in cost of goods sold in the carve-out statements of operations.
Plant openings
A new plant was opened in Hawley, Minnesota (“Hawley plant”) in the fall of 2014 after construction began in 2013. Construction of the plant began in 2013 and was financed through a loan supported by industrial development revenue bonds (“Revenue bonds”) of the city of Hawley, Minnesota (“Hawley”). During the construction period, the Company capitalized $139 and $47 in interest costs during construction for the fiscal years ended December 27, 2014 and December 28, 2013, respectively. The Hawley plant replaced production at the Grand Forks and Fargo, North Dakota and the Duluth, Minnesota plants.
In February 2015 the Company opened a new plant in Bar Nunn, Wyoming (“Bar Nunn plant”) replacing the Casper, Wyoming plant that was closed at the end of 2014. In connection with the openings of the Hawley plant and the Barr Nunn plant the company incurred $375, $334 and $19 in start up costs for the period ended September 30, 2015 and the fiscal years ended December 27, 2014 and December 28, 2013, respectively, which is included in cost of goods sold in the carve-out statements of operations.
6. Other long-term assets
Other long-term assets consisted of the following:
| September 30, 2015 | December 27, 2014 | |||||||
Deferred financing fees | $ | — | $ | 161 | ||||
Other long-term assets | 59 | 18 | ||||||
|
|
|
| |||||
Total other long-term assets | $ | 59 | $ | 179 | ||||
|
|
|
| |||||
7. Accrued liabilities
Accrued liabilities consisted of the following:
| September 30, 2015 | December 27, 2014 | |||||||
Salaries, wages and other compensation | $ | 4,023 | $ | 3,826 | ||||
Other liabilities | 296 | 206 | ||||||
|
|
|
| |||||
Total accrued liabilities | $ | 4,319 | $ | 4,032 | ||||
|
|
|
| |||||
CRETEX CONCRETE PRODUCTS, INC.
Notes to Carve-out Financial Statements
(In $US thousands)
8. Commitments and contingencies
As of September 30, 2015, the Company had outstanding surety bonds in the amount of $11,359 to secure performance commitments.
Operating leases
The Company leases certain property and equipment for various periods under noncancelable operating leases. Rent expense, net of applicable rental income, totaled $944, $1,101, and $924 for the period ended September 30, 2015 and the fiscal years ended December 27, 2014 and December 28, 2013, respectively, which is included in cost of goods sold and selling, general and administrative expenses in the carve-out statements of operations. The Company’s future minimum lease payments under such agreements at September 30, 2015 were approximately:
Fiscal years ending: | ||||
December 26, 2015 | $ | 228 | ||
December 31, 2016 | 820 | |||
December 30, 2017 | 653 | |||
December 29, 2018 | 618 | |||
December 28, 2019 | 266 | |||
Thereafter | 84 | |||
|
| |||
| $ | 2,669 | |||
|
|
Capital leases
The Company had no capital lease obligations under any of the periods reported.
Legal matters
The Company is involved in legal proceedings and litigation in the ordinary course of business. In the opinion of management, the outcome of such matters will not have a material adverse effect either individually or in the aggregate on the Company’s carve-out financial position, results of operations, or liquidity. Other than routine litigation incidental to the Company business, there are no material legal proceedings to which the Company is a party or to which any of the Company’s properties are subject. In the sale of CCP to Forterra, Cretex assumed responsibility for all future liabilities and payments for legal matters.
The Company is a joint and several guarantor, along with substantially all of the Cretex subsidiaries, of the Parent company third party debt covered by credit agreements for revolver and term loans with total credit lines of $160 million. In addition, the Company is a joint and several guarantor, along with substantially all of the Cretex subsidiaries, of the Parent company senior secured notes and private shelf facility with total credit lines of approximately $50 million.
9. Related party transactions
Note payable parent company
The carve-out financial statements for the Company are based on the accounting records of Cretex. Treasury functions are centralized by the Parent company and all cash receipts and
CRETEX CONCRETE PRODUCTS, INC.
Notes to Carve-out Financial Statements
(In $US thousands)
9. Related party transactions (Continued)
disbursements on behalf of CCP are comingled in the cash balances of the Parent company. These cash transaction are settled into the note payable parent company (“Parent note”). Adjustments made from the accounting records of Cretex for the purposes of these carve-out financial statements, have been settled into the Parent note as they would have been had they been reflected in the ongoing accounting records of Cretex.
Through the Parent note Cretex management has allocated a proportion of the corporate third-party debt to the Company. The Parent note functions as a form of permanent financing for the Company with changes during the period representing excess net receipts used to pay down the balance or excess net payments which increase the draw on the Parent note. Interest expense is charged on the Parent note at a rate reflective of the third party interest rates paid by Cretex. During the periods included in the carve-out financial statements the contractual rate was 4.0% per annum. The Company was a joint and severally liable guarantor of the corporate third party debt, along with the other subsidiaries of the Parent company.
During the fiscal year ended December 27, 2014 the Company made a non-operating cash distribution to the Parent company of $5,487 that increased the Parent note.
Allocated expenses
The Company was allocated selling, general and administrative expenses from the Parent company for certain shared services of $2,782, $3,487 and $2,712 for the period ended September 30, 2015 and the fiscal years ended December 27, 2014 and December 28, 2013, respectively. The allocated costs are included in selling, general and administrative expenses in the carve-out statements of operations. The historical costs and expenses reflected in our carve-out financial statements include an allocation for certain corporate functions historically provided by Cretex. The Parent company’s senior management oversees the operations of CCP and is employed by the Parent company and certain functions critical to the Company’s operations are centralized and managed by Cretex. Historically, the centralized functions have included executive senior management, financial reporting, financial planning and analysis, accounting, shared services, information technology, tax, risk management, treasury, legal, human resources, land management and strategy and development. The cost of each of these services has been allocated to the Company on the basis of revenue as compared to that of the Parent company for corporate general and administrative expenses and head count as compared to that of the Parent company for human resources, safety and information technology related support costs. The Company and Cretex believe that these allocations reasonably reflect the utilization of services provided and benefits received. However, these amounts are not necessarily representative of the amounts that would have been incurred by the company as a separate entity.
Related party payables and activity
The Company has primarily operated independently of the other Cretex subsidiaries with the exception of Elk River Machine Company (“Elk River”) from which CCP purchased jackets, forms, rings, liners and repairs. CCP purchased approximately $742, $1,337 and $488 of goods and services from Elk River for the period ended September 30, 2015 and the fiscal years ended December 27, 2014 and December 28, 2013, respectively. Payment for the goods and services is settled in the month
CRETEX CONCRETE PRODUCTS, INC.
Notes to Carve-out Financial Statements
(In $US thousands)
9. Related party transactions (Continued)
following the receipt of the goods and services through the Parent note. The Company had $144 and $138 in outstanding related party payables to Elk River as of September 30, 2015 and December 27, 2014.
Transfers of property, plant and equipment
The Company has transferred various property, plant and equipment to, and received from, various Cretex subsidiaries during the periods covered by the carve-out financial statements. Transfers of property, plant and equipment are reflected at net book value with reductions recorded to the Parent note for property transferred out and additions to the note for Properties transferred in. During the period ended December 27, 2014, the Company transferred out $876 net book value of property, plant and equipment with no additional consideration received. Additionally, during the period ended December 28, 2013 the Company received in $45 net book value of property, plant and equipment with no additional consideration paid.
10. Long term debt
In addition to the Parent note described in note 9, the Company also had a loan agreement (“Hawley loan”) supported by industrial development revenue bonds (“Revenue bonds”) of the city of Hawley, Minnesota (“Hawley”). The loan agreement and Revenue bonds were issued to finance the construction of a CCP manufacturing facility located in Hawley (“Hawley plant”). The total amount of the loan was for $10.0 million with amounts held in escrow until requisitions were approved for the reimbursement of expenses on the Hawley plant. The company requisitioned and received approximately $7.3 million in December 2013 with the remaining $2.7 million requisitioned in early 2014.
The principal amount of the Hawley loan amortizes in equal monthly installments over the term of the loan until the maturity date of December 1, 2038. Monthly principal payments are being made on the loan based on a 20 year amortization at the rate of $500 per year. The Hawley loan contains customary provisions relating to prepayments, affirmative covenants, negative covenants and events of default. The interest rate per annum applicable to the Hawley loan is based on a fluctuating rate of interest determined by reference to a LIBOR Index Rate plus the applicable spread of approximately 80 basis points.
The outstanding principal balance of the Hawley loan was $9,500 at December 27, 2014. The Hawley loan was paid in full on September 22, 2015 by the Parent company.
11. Employee benefit plans
The Company’s employees participate in defined benefit pension plans that are sponsored by Cretex. The pension plans are the Cretex Salaried Pension Plan (“Salaried Plan”) that was frozen in 2008 and the Cretex Hourly Pension Plan (“Hourly Plan”) that was frozen during the period 2008 to 2011. These plans include other Cretex employees that are not employees of the Company. Cretex also provides certain retiree health and life insurance benefits to eligible employees who have retired from the Company. Due to their separation from Cretex on October 1, 2015, participating CCP employees were offered the choice of annuity or lump sum settlement payout options. Both plans were terminated by Cretex effective December 31, 2015.
CRETEX CONCRETE PRODUCTS, INC.
Notes to Carve-out Financial Statements
(In $US thousands)
11. Employee benefit plans (Continued)
The Salaried Plan and Hourly Plan are accounted for as multiemployer plans. During the year ended December 28, 2013 the required minimum payments attributable to CCP for the plans were $544 and $477 for the Salaried Plan and the Hourly Plan, respectively. There were no minimum payments required for the period ended September 30, 2015 or the fiscal year ended December 27, 2014. Due to the sale of CCP to Forterra, the withdrawal of the CCP employees from the plans may trigger a withdrawal liability. This liability has not been determined and is not included in the carve-out financial statements. In the sale of CCP to Forterra, Cretex assumed responsibility for all future liabilities and payments for these defined benefit pensions plans.
In addition, the Company has participated in a number of multiemployer defined benefit pension plans under collective bargaining agreement (CBA) terms that cover the Company’s union-represented employees. Cretex, on behalf of the Company, contributes to these plans. The risks of participating in these multiemployer plans differ from those of single-employer plans in the following aspects:
The Company’s participation in these plans is outlined in the below table. The “EIN/Pension Plan Number” column provides the Employee Identification Number (EIN) and the three-digit plan number. The most recent Pension Protection Act (PPA) zone status available is for the plan years ended December 31, 2015, 2014 and 2013 (unless otherwise noted). The zone status information was determined from the plans annual funding notices. Among other contributing factors, plans in the red zone are generally less than 65 percent funded, plans in the yellow zone are between 65 and 80 percent funded, and plans in the green zone are at least 80 percent funded. The “FIP/RP Status” column indicates plans for which a financial improvement plan (FIP) or a rehabilitation plan (RP) is either pending or has been implemented. The last column lists the expiration date of the collective-bargaining agreements. For the period ended September 30, 2015 and the fiscal years ended December 27, 2014 and December 28, 2013, none of the Company’s plan contributions, excluding withdrawal payments, represented 5% or greater of the total plan contributions. The Company did not pay any surcharge payments during 2015, 2014 or 2013.
CRETEX CONCRETE PRODUCTS, INC.
Notes to Carve-out Financial Statements
(In $US thousands)
11. Employee benefit plans (Continued)
Pension Fund | EIN Pension Plan Number | PPA Zone Status | FIP/RP Status | Contributions Made | Expiration Date of CBA | – Funded % – | ||||||||||||||||||||||||||||||||||||||||||
| 2015 | 2014 | 2013 | 2015 | 2014 | 2013 | 2015 | 2014 | 2013 | ||||||||||||||||||||||||||||||||||||||||
Central States SE & SW Areas Pension Plan | 36-6044243001 | Red | Red | Red | Yes | $ | — | $ | 2,061 | $ | — | Withdrawn | 47.9 | % | 48.4 | % | 47.6 | % | ||||||||||||||||||||||||||||||
Construction Industry Laborers Pension Fund | 43-6060737001 | Green | Green | Green | No | — | 187 | 210 | | Withdrawn in 1/31/2015 | | 91.7 | % | 90.3 | % | 88.1 | % | |||||||||||||||||||||||||||||||
Minnesota Laborers Pension Fund | 41-6159599001 | Green | Green | Green | No | 3,563 | — | 116 | Withdrawn | |||||||||||||||||||||||||||||||||||||||
Central Pension Fund of International Union of Operating Engineers | 36-6052390001 | Green | Green | Green | No | — | 101 | 151 | | CBA expires 5/31/2018 | | 93.7 | % | 90.3 | % | 87.8 | % | |||||||||||||||||||||||||||||||
|
|
|
|
|
| |||||||||||||||||||||||||||||||||||||||||||
| $ | 3,563 | $ | 2,349 | $ | 477 | |||||||||||||||||||||||||||||||||||||||||||
|
|
|
|
|
| |||||||||||||||||||||||||||||||||||||||||||
On July 16, 2014, the Parent company executed a Settlement Agreement and Release with the Central States SE and SW Areas Pension Plan (“Central States plan”) resulting in a final withdrawal settlement payment. CCP participated in the Central States plan through various collective bargaining agreements along with other subsidiaries of the Parent company. The portion of the final withdrawal settlement payment attributable to the Company is $2,061 and is reflected as a liability in the carve-out financial statements as of December 29, 2012.
During February 2015, the Company negotiated the replacement of the Construction Industry Laborers Pension Fund with a Company (single-employer) sponsored 401(k) plan at its last contributing plant, triggering the complete withdrawal liability assessment from the fund. On December 4, 2015, the Parent company executed a settlement agreement and release resulting in a final withdrawal settlement payment of $253.
During 2014, the Parent company negotiated the replacement of the Minnesota Laborers Pension Fund with a Company (single-employer) sponsored 401(k) plan at its last contributing plant, triggering the complete withdrawal liability assessment from the fund. On February 9, 2015, the Parent company received notice from the fund of its complete withdrawal liability assessment of $3,915. The Parent company filed a Request for Review, as provided under ERISA, appealing the methodology used by the fund. Under the withdrawal assessment, the Parent company was required to make quarterly payments of $113 commencing on April 10, 2015. On June 10, 2015, the Parent company executed a settlement agreement and release resulting in a final withdrawal settlement payment of $3,450. The plan also retained the quarterly withdrawal installment of $113 paid in 2015.
Replacement of multiemployer pension plans with Company (single-employer) sponsored retirement plans may require the Parent company to pay withdrawal liabilities if the plans are
CRETEX CONCRETE PRODUCTS, INC.
Notes to Carve-out Financial Statements
(In $US thousands)
11. Employee benefit plans (Continued)
underfunded at the time of the withdrawal. As described above, the information available pertaining to the plans is at minimum two years preceding September 30, 2015, therefore the estimate of the Company’s withdrawal liability is as if it was assessed during, or preceding, September 30, 2015. Factors that impact funded status of plans include, but not limited to, investment performance, changes in participant demographics, funding improvement and rehabilitation plans, adjustments to benefits, changes in the number of contributing employers, changes in actuarial assumptions and utilization of extended amortization provisions.
Due to uncertainty regarding future factors that could trigger withdrawal liability, as well as the absence of specific information regarding the plan’s current financial situation, the Company was unable to determine the specific amount and timing of the future withdrawal liabilities for the Central Pension Fund of International Union of Operating Engineers’ and therefore did not record a withdrawal liability for the period ended September 30, 2015 and the fiscal years ended December 27, 2014 and December 28, 2013.
In the sale of CCP to Forterra, Cretex assumed responsibility for all future liabilities and payments for all of the defined benefit pensions plans.
12. Subsequent events
In accordance with ASC 855 subsequent Events, the Company has reviewed and updated its subsequent events through June 27,July 8, 2016, the date the financial statements were issued.
On October 1, 2015 Forterra acquired 100% of the outstanding common stock of CCP as discussed in footnote 1. The operations of CCP have been integrated into Forterra operations effective on October 1, 2015. As a part of the purchase agreement for the acquisition by Forterra, certain current and future liabilities of CCP were assumed by the Parent company including pension obligations, accrued profit sharing, accrued bonuses and deferred compensation.
In addition, a transition services agreement (“TSA”) was signed between Forterra and the Parent company specifying the provision of certain services including data provision and access to historical records, assistance in contract assignment, human resources assistance, general administrative services, training, information technology and other support services. These services run from a period of 6 to 24 months depending upon the service. Provision of certain services over a 6 month period are provided by the Parent company at a cost to Forterra estimated at approximately $30 per month.
On April 5, 2016 Forterra sold properties throughout its portfolio, including the properties acquired with CCP, to two unrelated third parties, Pipe Portfolio Owner (Multi) LP. and Fort-Ben Holdings (ONQC) Ltd. (collectively the “Buyer”). Forterra and Buyer contemporaneously entered into master land and building agreements under which Forterra agreed to lease back each of the properties for an initial twenty year term. Forterra is responsible for all real property taxes and specified insurance and maintenance costs. Forterra has options to extend each lease for an additional 9 years and 11 months.
18,420,000 Shares
Forterra, Inc.
Common Stock
PROSPECTUS
, 2016
Goldman, Sachs & Co.
Citigroup
Credit Suisse
Barclays
Deutsche Bank Securities
RBC Capital Markets
Oppenheimer & Co.
Stephens Inc.
SunTrust Robinson Humphrey
Until , 2016 (25 days after the date of this prospectus), all dealers that buy, sell or trade shares of our common stock, whether or not participating in this offering, may be required to deliver a prospectus. This delivery requirement is in addition to the dealers’ obligation to deliver a prospectus when acting as an underwriter and with respect to their unsold allotments or subscriptions.
PART II
INFORMATION NOT REQUIRED IN PROSPECTUS
Item 13. Other Expenses of Issuance and Distribution.
The following table shows the costs and expenses, other than underwriting discounts and commissions, payable in connection with the sale and distribution of the securities being registered. Except as otherwise noted, we will pay all of these amounts. All amounts except the SEC registration fee, the FINRA fee and the stock exchangeNASDAQ listing fee are estimated.
SEC Registration Fee | $ | 10,070 | $ | 51,557.31 | ||||
FINRA Filing Fee | 15,500 | 67,226.45 | ||||||
Stock Exchange Listing Fee | * | |||||||
NASDAQ Listing Fee | 200,000.00 | |||||||
Printing and Engraving Costs | * | * | ||||||
Legal Fees and Expenses | * | * | ||||||
Accounting Fees and Expenses | * | * | ||||||
Transfer Agent and Registrar Fees and Expenses | * | 4,500.00 | ||||||
Miscellaneous Expenses | * | * | ||||||
|
| |||||||
Total | $ | * | $ | 10,000,000.00 | ||||
|
| |||||||
| * | To be provided by amendment. |
Item 14. Indemnification of Directors and Officers.
Our amended and restated certificate of incorporation will provide that, to the fullest extent permitted by the Delaware General Corporate Law, or the DGCL, no director shall be personally liable to our company or its stockholders for monetary damages for breach of fiduciary duty as a director. Our amended and restated bylaws will provide that each person who was or is party or is threatened to be made a party to, or was or is otherwise involved in, any threatened, pending or completed proceeding by reason of the fact that he or she is or was a director or officer of our company or was serving at the request of our company as a director, officer, employee, agent or trustee of another entity shall be indemnified and held harmless by us to the full extent authorized by the DGCL against all expense, liability and loss actually and reasonably incurred in connection therewith, subject to certain limitations.
Section 145(a) of the DGCL authorizes a corporation to indemnify any person who was or is a party, or is threatened to be made a party, to a threatened, pending or completed action, suit or proceeding, whether civil, criminal, administrative or investigative (other than an action by or in the right of the corporation), by reason of the fact that the person is or was a director, officer, employee or agent of the corporation, or is or was serving at the request of the corporation as a director, officer, employee or agent of another corporation, partnership, joint venture, trust or other enterprise, against expenses (including attorneys’ fees), judgments, fines and amounts paid in settlement actually and reasonably incurred by the person in connection with such action, suit or proceeding, if the person acted in good faith and in a manner the person reasonably believed to be in, or not opposed to, the best interests of the corporation and, with respect to any criminal action or proceeding, had no reasonable cause to believe the person’s conduct was unlawful.
Section 145(b) of the DGCL provides in relevant part that a corporation may indemnify any person who was or is a party or is threatened to be made a party to any threatened, pending or completed action or suit by or in the right of the corporation to procure a judgment in its favor by reason of the fact that the person is or was a director, officer, employee or agent of the corporation, or is or was serving at the request of the corporation as a director, officer, employee or agent of another
II-1
corporation, partnership, joint venture, trust or other enterprise against expenses (including attorneys’ fees) actually and reasonably incurred by the person in connection with the defense or settlement of such action or suit if the person acted in good faith and in a manner the person reasonably believed to be in or not opposed to the best interests of the corporation and except that no indemnification shall be made in respect of any claim, issue or matter as to which such person shall have been adjudged to be liable to the corporation unless and only to the extent that the Court of Chancery or the court in which such action or suit was brought shall determine upon application that, despite the adjudication of liability but in view of all the circumstances of the case, such person is fairly and reasonably entitled to indemnity for such expenses which the Court of Chancery or such other court shall deem proper.
The DGCL also provides that indemnification under Sections 145(a) and (b) can only be made upon a determination that indemnification of the present or former director, officer or employee or agent is proper in the circumstances because such person has met the applicable standard of conduct set forth in Sections 145(a) and (b). Such determination shall be made, with respect to a person who is a director or officer at the time of such determination, (1) by a majority vote of directors who are not a party to the action at issue (even though less than a quorum), (2) by a majority vote of a designated committee of these directors (even though less than a quorum), (3) if there are no such directors, or these directors authorize, by the written opinion of independent legal counsel, or (4) by the stockholders.
Section 145(g) of the DGCL also empowers a corporation to purchase and maintain insurance on behalf of any person who is or was a director, officer, employee or agent of the corporation, or is or was serving at the request of the corporation as a director, officer, employee or agent of another corporation, partnership, joint venture, trust or other enterprise against any liability asserted against such person and incurred by such person in any such capacity, or arising out of such person’s status as such, whether or not the corporation would have the power to indemnify such person against such liability under Section 145 of the DGCL.
Section 102(b)(7) of the DGCL permits a corporation to provide for eliminating or limiting the personal liability of one of its directors for any monetary damages related to a breach of fiduciary duty as a director, as long as the corporation does not eliminate or limit the liability of a director for acts or omissions which (1) were in bad faith, (2) were the result of active and deliberate dishonesty and were material to the cause of action so adjudicated, (3) the director derived an improper personal benefit from (such as a financial profit or other advantage to which such director was not legally entitled) or (4) breached the director’s duty of loyalty.
We will enter into indemnification agreements with each of our executive officers and directors that provide, in general, that we will indemnify them to the fullest extent permitted by law in connection with their service to us or on our behalf.
The proposed form of Underwriting Agreement to be filed as Exhibit 1.1 to this Registration Statement will provide for indemnification of our directors and officers by the underwriters against certain liabilities.
Item 15. Recent Sale of Unregistered Securities.
We have not sold any securities, registered or otherwise, within the past three years, except for the common stock of Forterra, Inc. issued upon incorporation on June 21, 2016 to our sole stockholder, LSF9 Stardust Holdings, L.P. The issuance of the common stock was exempt from the registration requirements of the Securities Act pursuant to Section 4(a)(2) thereof as a transaction by an issuer not involving any public offering.
II-2
Item 16. Exhibits and Financial Data Schedules.
(a) Exhibit Index
See the Exhibit Index following the signature page.
(b) Financial Statement Schedule
None. Financial statement schedules have been omitted because the information is included in our consolidatedcombined financial statements included elsewhere in this Registration Statement.
Item 17. Undertakings.
(a) The undersigned registrant hereby undertakes to provide to the underwriter at the closing specified in the underwriting agreements, certificates in such denominations and registered in such names as required by the underwriter to permit prompt delivery to each purchaser.
(b) Insofar as indemnification for liabilities arising under the Securities Act of 1933 may be permitted to directors, officers and controlling persons of the registrant pursuant to the foregoing provisions, or otherwise, the registrant has been advised that in the opinion of the Securities and Exchange Commission such indemnification is against public policy as expressed in the Act and is, therefore, unenforceable. In the event that a claim for indemnification against such liabilities (other than the payment by the registrant of expenses incurred or paid by a director, officer or controlling person of the registrant in the successful defense of any action, suit or proceeding) is asserted by such director, officer or controlling person in connection with the securities being registered, the registrant will, unless in the opinion of its counsel the matter has been settled by controlling precedent, submit to a court of appropriate jurisdiction the question whether such indemnification by it is against public policy as expressed in the Act and will be governed by the final adjudication of such issue.
(c) The undersigned registrant hereby undertakes that:
(i) For purposes of determining any liability under the Securities Act of 1933, the information omitted from the form of prospectus filed as part of this registration statement in reliance upon Rule 430A and contained in a form of prospectus filed by the registrant pursuant to Rule 424(b)(1) or (4) or 497(h) under the Securities Act of 1933 shall be deemed to be part of this registration statement as of the time it was declared effective.
(ii) For the purpose of determining any liability under the Securities Act of 1933, each post-effective amendment that contains a form of prospectus shall be deemed to be a new registration statement relating to the securities offered therein, and the offering of such securities at that time shall be deemed to be the initial bona fide offering thereof.
II-3
SIGNATURES
Pursuant to the requirements of the Securities Act of 1933, as amended, the registrant has duly caused this registration statement to be signed on its behalf by the undersigned, thereunto duly authorized, in the city of Irving, state of Texas, on July 8,October 7, 2016.
Forterra, Inc. | ||
| By: | /s/ | |
| Name: | ||
Title: Executive Vice President and Chief | ||
POWER OF ATTORNEY
KNOW ALL MEN BY THESE PRESENTS, that each person whose signature appears below constitutes and appoints Jeffrey Bradley, William Matthew Brown and Lori Browne, and each of them, his true and lawful attorneys-in-fact and agents, each with full power of substitution and resubstitution, for him and in his name, place and stead, in any and all capacities, to sign any and all amendments, including post-effective amendments, to this Registration Statement, and any registration statement relating to the offering covered by this Registration Statement and filed pursuant to Rule 462 under the Securities Act of 1933, as amended, and to file the same, with exhibits thereto and other documents in connection therewith, with the Securities and Exchange Commission, granting unto said attorneys-in-fact and agents, and each of them, full power and authority to do and perform each and every act and thing requisite and necessary to be done, as fully to all intents and purposes as he might or could do in person, hereby ratifying and confirming all that each of said attorneys-in-fact and agents or their substitute or substitutes may lawfully so or cause to be done by virtue hereof.
Pursuant to the requirements of the Securities Act of 1933, as amended, the following persons have signed this Registration Statement in the capacities and on the date indicated.
Jeffrey Bradley | Chief Executive Officer (Principal Executive Officer), Director | |||
/s/ William Matthew Brown William Matthew Brown | Executive Vice President and Chief Financial Officer (Principal Financial Officer, Principal Accounting Officer) | |||
Kyle S. Volluz | Director | |||
* By: | /s/ William Matthew Brown | |
| Name: William Matthew Brown | ||
| Title: Attorney-in-Fact | ||
II-4
EXHIBIT INDEX
Exhibit | Description of Exhibit | |
| 1.1* | Form of Underwriting Agreement. | |
| | Purchase Agreement, dated as of December 23, 2014, by and between HBMA Holdings LLC, Structherm Holdings Limited, Hanson America Holdings (4) Limited, Hanson Packed Products Limited and LSF9 Stardust Holdings LLC, and, solely for the purposes of Section 9.08 and Article IX thereto, HeidelbergCement AG. | |
| | Amendment No. 1 to the Purchase Agreement, dated as of January 21, 2015, by and between HBMA Holdings LLC, Structherm Holdings Limited, Hanson America Holdings (4) Limited, Hanson Packed Products Limited and LSF9 Stardust Holdings LLC. | |
| | Assignment and Amendment to the Purchase Agreement, dated as of March 13, 2015, by and between LSF9 Stardust Holdings LLC and LSF9 Concrete Ltd, and solely for the purposes of Article III thereto, HBMA Holdings LLC, Structherm Holdings Limited, Hanson America Holdings (4) Limited, Hanson Packed Products Limited, Stardust Acquisition I Company, LLC, Stardust Acquisition II Company, LLC, LSF9 Concrete UK Ltd, Stardust Canada Acquisition I Ltd And Stardust Canada Acquisition II Ltd. | |
| | Stock Purchase Agreement, dated as of August 20, 2015, by and among HBP Pipe & Precast LLC, Cretex Companies, Inc. and Cretex Concrete Products, Inc. | |
| | Purchase Agreement, dated as of January 29, 2016, by and among Forterra Pipe & Precast, LLC, Sherman-Dixie Concrete Industries, Inc., the shareholders named therein, and PKD Partnership. | |
| | Stock Purchase Agreement, dated as of February 12, 2016, by and among Forterra Pipe & Precast, LLC, USP Holdings Inc., the stockholders and optionholders of USP Holdings Inc. named therein, and Alabama Seller Rep Inc. | |
| | Amended and Restated Certificate of Incorporation of the | |
| 3.2** | Amended and Restated Bylaws of the Registrant to be adopted. | |
| 4.1** | Form of Registration Rights Agreement between Forterra, Inc. and LSF9 | |
| 4.2* | Form of Certificate of Common Stock of the Registrant. | |
| 5.1* | Form of Opinion of Gibson, Dunn & Crutcher LLP. | |
| Senior Lien Term Loan Credit Agreement dated as of March 13, 2015, by and among LSF9 Concrete Ltd, LSF9 Concrete Holdings Ltd, Stardust Finance Holdings, Inc., as borrower, the lenders party thereto, and Credit Suisse AG as administrative agent. | ||
| First Incremental Facility Amendment to the Senior Lien Term Loan Credit Agreement, dated as of October 1, 2015, by and among LSF9 Concrete Ltd, LSF9 Concrete Holdings Ltd, Stardust Finance Holdings, Inc., the guarantors party thereto, the lenders party thereto, and Credit Suisse AG as administrative agent. | ||
| Second Incremental Facility Amendment to the Senior Lien Term Loan Credit Agreement, dated as of June 17, 2016, by and among LSF9 Concrete Ltd, LSF9 Concrete Holdings Ltd, Stardust Finance Holdings, Inc., the guarantors party thereto, the lenders party thereto, and Credit Suisse AG as administrative agent. | ||
| Junior Lien Term Loan Credit Agreement dated as of March 13, 2015, by and among LSF9 Concrete Ltd, LSF9 Concrete Holdings Ltd, Stardust Finance Holdings, Inc., as borrower, the lenders party thereto, and Credit Suisse AG as administrative agent. | ||
Exhibit | Description of Exhibit | |
| ABL Credit Agreement dated as of March 13, 2015, by and among LSF9 Concrete Ltd, LSF9 Concrete Holdings Ltd, Stardust Finance Holdings, Inc., as initial borrower, the additional revolving borrowers party thereto, the lenders party thereto, Credit Suisse AG as administrative agent, and Bank of America, N.A. as collateral agent. | ||
| First Amendment to ABL Credit Agreement, dated as of April 1, 2015, by and among LSF9 Concrete Holdings Ltd, Stardust Finance Holdings, Inc., the additional revolving borrowers party thereto, the guarantors party thereto, the lenders party thereto and Credit Suisse AG as administrative agent. | ||
| Incremental Facility Amendment to ABL Credit Agreement, dated as of November 10, 2015, by and among LSF9 Concrete Ltd, LSF9 Concrete Holdings Ltd, Stardust Finance Holdings, Inc., the additional revolving borrowers party thereto, the guarantors party thereto, the lenders party thereto, Credit Suisse AG, Cayman Islands Branch, as administrative agent, and Bank of America, N.A. as collateral agent. | ||
| Second Amendment and Consent to ABL Credit Agreement, dated as of April 13, 2016, by and among LSF9 Concrete Ltd, LSF9 Concrete Holdings Ltd, Stardust Finance Holdings, Inc., the additional revolving borrowers party thereto, the guarantors party thereto, the lenders party thereto, and Bank of America, N.A. as collateral agent and administrative agent. | ||
| 10.9** | Master Land and Building Lease, dated April 5, 2016, by and among Forterra Pipe & Precast, LLC, Forterra Pressure Pipe, Inc., Forterra Concrete Products, Inc. and Forterra Concrete Industries, Inc., as Tenant, and Pipe Portfolio Owner (MULTI) LP, as Landlord. | |
| 10.10** | First Amendment to Master Land and Building Lease, dated April 14, 2016 by and among Forterra Pipe & Precast, LLC, Forterra Pressure Pipe, Inc., Forterra Concrete Products, Inc., Forterra Concrete Industries, Inc. and Pipe Portfolio Owner (MULTI) LP. | |
| 10.11** | Master Land and Building Lease, dated April 5, 2016, by and among, Forterra Pipe & Precast, Ltd., Forterra Pressure Pipe, Inc., and Forterra Pipe & Precast Quebec, Ltd., as Tenant, and | |
| Amended and Restated Limited Liability Company Agreement of Concrete Pipe & Precast, LLC, dated as of August 3, 2012, by and among Concrete Pipe & Precast, LLC, Americast, Inc. and Hanson Pipe & Precast LLC. | ||
| Asset Advisory Agreement, dated as of February 9, 2015, by and between Hudson Americas LLC, LSF9 Stardust Holdings, L.P., and Lone Star Fund IX (U.S.), L.P. for purposes of Section 7(a). | ||
| 10.14* | Form of Tax Receivable Agreement. | |
| 10.15** | Form of Indemnification Agreement for executive officers and directors. | |
| Employment Agreement between HBP Pipe and Precast LLC and Jeff Bradley dated as of July 8, 2015. | ||
| Amended and Restated Employment Agreement between Forterra Pipe & Precast, LLC and William Matthew Brown dated as of June 28, 2016. | ||
| Separation and Release Agreement between Plamen Jordanoff and HBP Pipe and Precast LLC dated as of July 27, 2015 | ||
| Confidential Separation Agreement and Full Release of Claims between Mark Conte and Forterra Pipe and Precast, LLC executed as of June 12, 2015. | ||
| Confidential Separation Agreement and Full Release of Claims between Scott Szwejbka and Forterra Pipe and Precast, LLC executed as of December 31, 2015. | ||
| LSF9 Concrete Holdings Ltd. Long Term Incentive Plan (with form of award agreement). | ||
| Forterra, Inc. 2016 Stock Incentive Plan. | ||
Exhibit | Description of Exhibit | |
| Form of Grant Notice for 2016 Stock Incentive Plan Nonqualified Stock Options Award. | ||
| Form of Grant Notice for 2016 Stock Incentive Plan Incentive Stock Options Award. | ||
| Form of Grant Notice for 2016 Stock Incentive Plan Restricted Stock Award. | ||
| Form of Grant Notice for 2016 Stock Incentive Plan Restricted Stock Unit Award. | ||
| Form of Grant Notice for 2016 Stock Incentive Plan Performance Restricted Stock Unit Award. | ||
| 21.1** | Subsidiaries of the Registrant. | |
| 23.1 | Consent of Ernst & Young LLP. | |
| 23.2 | Consent of PricewaterhouseCoopers LLP. | |
| 23.3 | Consent of RSM US LLP. | |
| 23.4* | Consent of Gibson, Dunn & Crutcher LLP | |
| Consent of Freedonia Custom Research, Inc. | ||
| Consent of Freedonia Group, Inc. | ||
| Powers of | ||
| Consent to be Named of Kevin Barner. | ||
| Consent to be Named of Robert Corcoran. | ||
| Consent to be Named of Samuel D. Loughlin. | ||
| Consent to be Named of Clint McDonnough. | ||
| Consent to be Named of John McPherson. | ||
| Consent to be Named of Chris Meyer. | ||
| Consent to be Named of Jacques Sarrazin. | ||
| Consent to be Named of Chadwick Suss. | ||
| Consent to be Named of Grant Wilbeck. | ||
| * | To be filed by amendment. |
| ** | Previously filed. |
| # | Denotes management compensatory plan or arrangement |
| + | Certain schedules to this agreement have been omitted in accordance with Item 601(b)(2) of Regulation S-K. A copy of any omitted schedules will be furnished supplementally to the SEC upon request. |