Washington, D.C. 20549
________________________
FORM
S-1
REGISTRATION STATEMENT
UNDER
THE SECURITIES ACT OF 1933
________________________
incorporation or organization) | Classification Code No.) | Identification No.) |
Title of Each Class of Securities Being Registered | Amount Being Registered (1) | Proposed Maximum Offering Price Per Security | Proposed Maximum Aggregate Offering Price | Amount of Registration Fee (2) | ||||
Primary Offering: | ||||||||
Ordinary Shares, nominal value $.000004026575398 per share, issuable upon the exercise of options | 721,070 (3) | $3.7407 (4) | $2,697,307 | $294.28 | ||||
Secondary Offering: | ||||||||
Ordinary Shares, nominal value $.000004026575398 per share | 46,598,361 (5) | $9.50 (6) | $442,684,429.50 | $48,296.87 | ||||
Warrants | 5,450,000 (7) | — (8) | — (8) | — | ||||
Ordinary Shares, nominal value $.000004026575398 per share, issuable upon the exercise of warrants | 5,450,000 9) | $9.50 (6) | $51,775,000 | $5,648.65 | ||||
Total | $54,239.80 (10) | |||||||

Rockley Photonics Holdings Limited
(Exact name of registrant as specified in its charter)
________________________
| Cayman Islands | 3674 | 98-1644526 | ||||||||||||
| (State or other jurisdiction of incorporation or organization) | (Primary Standard Industrial Classification Code Number) | (I.R.S. Employer Identification Number) | ||||||||||||
3rd Floor, 1 Ashley Road
Altrincham, Cheshire, United Kingdom, WA14 2DT
+44 (0) 1865 292017
(Address, including zip code, and telephone number, including area code, of registrant’s principal executive offices)
________________________
Tom Adams, Esq.
General Counsel
Rockley Photonics Holdings Limited
3rd Floor, 1 Ashley Road
Altrincham, Cheshire, United Kingdom, WA14 2DT
+44 (0) 1865 292017
(Name, address, including zip code, and telephone number, including area code, of agent for service)
________________________
Copies to:
James J. Masetti, Esq.
Davina K. Kaile, Esq.
Pillsbury Winthrop Shaw Pittman LLP
2550 Hanover Street
Palo Alto, CA 94304
Tel: (650)233-4500
Fax: (650)233-4545
________________________
Approximate date of commencement of proposed sale to the public: From time to time after the effective date of this registration statement, as determined by the selling shareholders.
If any of the securities being registered on this Form are to be offered on a delayed or continuous basis pursuant to Rule 415 under the Securities Act of 1933, please check the following box. ☒
If this Form is filed to register additional securities for an offering pursuant to Rule 462(b) under the Securities Act, please check the following box and list the Securities Act registration statement number of the earlier effective registration statement for the same offering. ☐
If this Form is a post-effective amendment filed pursuant to Rule 462(c) under the Securities Act, check the following box and list the Securities Act registration statement number of the earlier effective registration statement for the same offering. ☐
If this Form is a post-effective amendment filed pursuant to Rule 462(d) under the Securities Act, check the following box and list the Securities Act registration statement number of the earlier effective registration statement for the same offering. ☐
Indicate by check mark whether the registrant is a large accelerated filer, an accelerated filer, a non-accelerated filer, a smaller reporting company, or an emerging growth company. See the definitions of “large accelerated filer,” “accelerated filer,” “smaller reporting company” and “emerging growth company” in Rule 12b-2 of the Exchange Act.
| Large accelerated filer | ☐ | Accelerated filer | ☐ | ||||||||
| Non-accelerated filer | ☒ | Smaller reporting company | ☒ | ||||||||
| Emerging growth company | ☒ | ||||||||||
If an emerging growth company, indicate by check mark if the registrant has elected not to use the extended transition period for complying with any new or revised financial accounting standards provided pursuant to Section 7(a)(2)(B) of the Securities Act. ☐
The Registrant hereby amends this registration statement on such date or dates as may be necessary to delay its effective date until the Registrant shall file a further amendment which specifically states that this registration statement shall thereafter become effective in accordance with Section 8(a) of the Securities Act of 1933, as amended, or until the registration statement shall become effective on such date as the Securities and Exchange Commission, acting pursuant to said Section 8(a), may determine.
SUBJECT TO COMPLETION, DATED JULY 11, 2022
PROSPECTUS

Rockley Photonics Holdings Limited
Up to 52,769,43187,567,895 Ordinary Shares
This prospectus relates to the issuanceoffer and sale from time to time byof up to 87,567,895 ordinary shares, nominal value $0.000004026575398 per share, (the “ordinary shares”) of Rockley Photonics Holdings Limited, a Cayman Islands exempted company (“HoldCo,Rockley,” the “Company,” “Rockley,” “we,” or “us”) of up to 721,070 Ordinary Shares exercisable upon the exercise of options to acquire Ordinary Shares.
non-sale
related transfer (the “selling The Notes and the 144A Warrants are more fully described in the section entitled “Prospectus Summary – The Private Placement Financing” We are registering the offer and sale of certain securitiesordinary shares covered by this prospectus to satisfy certain registration rights we have granted includingpursuant to a Registration Rights andLock-UpAgreement between us and certain securityholders, which, in addition to providing for registration rights also provides for certain transferagreement among Rockley andlock-uprestrictions on such shares. Our registration of the securities covered by this prospectus does not mean that the selling securityholders will offer or sell any of the shares. shareholders.
The selling securityholdersshareholders may sell the Ordinary Sharesordinary shares covered by this prospectus in a number of different ways and at varying prices. We provide more information about how the selling securityholdersshareholders may sell the ordinary shares in the section entitled “Plan of Distribution.”
We will not receive any proceeds from the sale of ordinary shares by the selling shareholders pursuant to this prospectus. We will pay certain expenses associated with the registration of the securities covered by this prospectus, as described in the section entitled “Plan of Distribution.” In connection with any sales of securities offered hereunder, the selling shareholders, and any underwriters, agents, brokers or dealers participating in such sales may be deemed to be “underwriters” within the meaning of the Securities Act of 1933, as amended (the “Securities Act”). Our registration of the securities covered by this prospectus does not mean that the selling shareholders will offer or sell any of the ordinary shares.Our ordinary shares are listed on the New York Stock Exchange under the symbol “RKLY.” On July 5, 2022, the closing price of our ordinary shares was $2.41 per share.
Investing in our securities involves a high degree of risk. See the section entitled “Risk Factors” beginning on page 7 of this prospectus and under similar headings in any amendments or supplements to this prospectus to read about factors you should consider before buying our securities.
Neither the Securities and Exchange Commission nor any state securities commission has approved or disapproved of these securities or determined if this prospectus is truthful or complete. Any representation to the contrary is a criminal offense.
The date of this prospectus is September , 2021.2022.
TABLE OF CONTENTS
| Page | |||||||||||
ABOUT THIS PROSPECTUS
This prospectus is part of a registration statement on Form S-1 that we filed with the U.S. Securities and Exchange Commission (the “SEC”), which includes exhibits and provides more detail of the matters discussed in this prospectus. You should read this prospectus and the related exhibits filed with the SEC, together with the additional information described under the heading “Where You Can Find More Information” before making your investment decision. The selling shareholders may, from time to time, sell the securities offered by them described in this prospectus. We will not receive any proceeds from the sale by such selling shareholders of the securities offered by them described in this prospectus.
This prospectus contains summaries of certain provisions contained in some of the documents described herein, but reference is made to the actual documents for complete information. All of the summaries are qualified in their entirely by the actual documents. Copies of some of the documents referred to herein have been filed as exhibits to the registration statement of which this prospectus is a part, and you may access those documents as described under the heading “Where You Can Find More Information.” You should not assume that the information in this prospectus or any prospectus supplement is accurate as of any date other than the date of each document.
Neither we nor the selling securityholdersshareholders have authorized anyone to provide you with any information or to make any representations other than those contained in this prospectus or any applicable prospectus supplement or any free writing prospectuses prepared by or on behalf of us or to which we have referred you. Neither we nor the selling securityholdersshareholders take responsibility for, and can provide no assurance as to the reliability of, any other information that others may give you. Neither we nor the selling securityholdersshareholders will make an offer to sell these securities in any jurisdiction where the offer or sale is not permitted.
Except as otherwise set forth in this prospectus, neither we nor the selling shareholders have taken any action to permit a public offering of these securities outside the United States or to permit the possession or distribution of this prospectus outside the United States. Persons outside the United States who come into possession of this prospectus must inform themselves about and observe any restrictions relating to the offering of these securities and the distribution of this prospectus outside the United States.
We may also provide a prospectus supplement or post-effective amendment to the registration statement to add information to, or update or change information contained in, this prospectus. You should read both this prospectus and any applicable prospectus supplement or post-effective amendment to the registration statement together with the additional information to which we refer you in the sections of this prospectus entitled “Where You Can Find More Information.”
On August 11, 2021, Rockley Photonics Holdings Limited, an exempted company incorporated in the Cayman Islands with limited liability, Rockley Photonics Limited, a company organized under the laws of England and Wales (“Rockley UK” or “Legacy Rockley”), and SC Health Corporation, an exempted company incorporated in the Cayman Islands with limited liability (“SC Health”), consummated the previously announced business combination (the “Business Combination”) contemplated by the Business Combination Agreement and Plan of Merger, dated March 19, 2021 (the “Business Combination Agreement”), by and among HoldCo,Rockley, Rockley UK, SC Health, and Rockley Mergersub Limited, an exempted company incorporated in the Cayman Islands with limited liability and a direct wholly owned subsidiary of HoldCoRockley (“Merger Sub”). In connection with the closing of the Business Combination, (the “Closing”), Rockley UK became a direct wholly owned subsidiary of HoldCoRockley and Merger Sub was merged with and into SC Health, with SC Health surviving the merger and becoming a direct wholly owned subsidiary of HoldCo.
Rockley.Unless the context indicates otherwise, references in this prospectus to “HoldCo,“Rockley,” the “Company,” “Rockley,” “we,” “us,” “our” and similar terms refer to Rockley Photonics Holdings Limited, and, as the context requires, its consolidated subsidiaries (including Rockley UK and SC Health).
i
CAUTIONARY STATEMENT REGARDING FORWARD-LOOKING STATEMENT
All statements in this prospectus that are not historical in nature constitute forward-looking statements within the meaning of the Private Securities Litigation Reform Act of 1995. These forward-looking statements include, without limitation, statements regarding the financial position, business strategy, and the plans and objectives of management, andas well as Rockley’s product development plans and timeline and anticipated customer and strategic relationships, and are not guarantees of performance. When used in this prospectus, Thethe words “anticipate,” “believe,” “can,” “continue,” “could,” “developing,” “enable,” “estimate,” “eventual,” “expand, “expect,” “focus,” “future,” “goal,” “intend,” “may,” “might,” “opportunity,” “outlook,” “plan,” “possible,” “position,” “potential,” “predict,” “project,” “revolutionize,” “seem,” “should,” “trend,” “will,” “would” or other terms that predict or indicate future events, trends, or expectations, and similar expressions or the negative of such expressions may identify forward-looking statements, but the absence of these words or terms does not mean that a statement is not forward-looking. Forward-looking statements in this prospectus include, but are not limited to, statements regarding the following:
•Rockley’s financial and business performance, following the Business Combination, including anticipated financial outlook or information and business metrics;
•Rockley’s strategy, future operations, financial position, estimated revenue and losses, projected costs, prospects and plans;
•the implementation, market acceptance, and success of Rockley’s business model;
•developments and expectations relating to Rockley’s competitors, target markets, and industry;
•Rockley’s future capital requirements and sources and uses of cash;
•Rockley’s ability to obtain funding for its product development plans, execution of its business strategy, and its operations;
•Rockley’s business, product development plans, and opportunities;
•the outcome of any known and unknown litigation and regulatory proceedings;
•Rockley’s anticipated financial outlook or information, anticipated growth rate, and market opportunities;
•Rockley’s plans to commercialize its products and services, and anticipated timing thereof;
•Rockley’s expectations as to when it may generate additional revenue and/ or sufficient revenue from the sale of its products and services to cover expansion plans, operating expenses, working capital, and capital expenditures;
•the development status and anticipated timeline for commercial production of Rockley’s products;
•Rockley’s plans for products under development and future products and anticipated features and benefits thereof;
•the status and expectations regarding Rockley’s customer and strategic partner, and potential customer and strategic partner, relationships;
•the total addressable markets for Rockley’s products and technology;
•the ability of Rockley to increase market share in its existing markets or any new markets it may enter;
•Rockley’s ability to obtain any required regulatory approvals, including any required FDAFood and Drug Administration (“FDA”) approvals, in connection with its anticipated products and technology;
•Rockley’s ability to maintain an effective system of internal control over financial reporting;
•Rockley’s ability to maintain and protect its intellectual property;
•Rockley’s success in retaining or recruiting, or changes required in,managing any transitions among, officers, key employees, or directors;
•the ability of Rockley to manage its growth effectively;
•the ability of Rockley to achieve and maintain profitability in the future;
•the impact of the regulatory environment and complexities with compliance related to such environment; and
•the impact of thepandemic.
pandemic; andCOVID-19
•Rockley’s ability to comply with the affirmative and restrictive covenants in its debt agreements and the potential dilutive impact of any such debt agreements.
The forward-looking statements contained in this prospectus are based on various assumptions, whether or not identified in this prospectus, and on Rockley’s current expectations, beliefs, and assumptions and are not predictions of actual performance. These forward-looking statements involve a number of risks, uncertainties (many of which are beyond Rockley’s control), or other assumptions that may cause actual results or performance to differ materially from those expressed or implied by these forward-looking statements. We discuss many of these risks and uncertainties in greater detail under the section entitled “Risk Factors” contained in this prospectus and in our SEC filings. If any of these risks or uncertainties materialize, or should any of these assumptions prove incorrect, actual results may differ materially from those discussed in or implied by these forward-looking statements. There can be no assurance that future developments affecting Rockley will be those that have been anticipated.
Given these risks and uncertainties, you should not place undue reliance on these forward-looking statements. Additional cautionary statements or discussions of risks and uncertainties that could affect our results or the achievement of the expectations described in forward-looking statements may also be contained in any accompanying prospectus supplement.
These forward-looking statements made by us in this prospectus and any accompanying prospectus supplement speak only as of the date of this prospectus and any accompanying prospectus supplement. Except as required under the federal securities laws and rules and regulations of the SEC, we expressly disclaim any obligation or undertaking to release publicly any updates or revisions to any forward-looking statements contained herein to reflect any change in our expectations with regard thereto or any change in events, conditions or circumstances on which any such statement is based. You should, however, review additional disclosures we make in our Annual Report on Form
10-K,
Quarterly Reports on Form10-Q,
and Current Reports on Form8-K
filed with the SEC.ii
You should read this prospectus and any accompanying prospectus supplement completely and with the understanding that our actual future results, levels of activity and performance as well as other events and circumstances may be materially different from what we expect. We qualify all of our forward-looking statements by these cautionary statements.
INDUSTRY AND MARKET DATA
In this prospectus, we rely on and refer to industry data, information, and statistics regarding the markets in which we compete from research as well as from publicly available information, industry and general publications and research and studies conducted by third parties. We have supplemented this information where necessary with our own internal estimates, considering publicly available information about other industry participants and our management’s best view as to information that is not publicly available. This information appears in “Management’s Discussion and Analysis of Financial Condition and Results of Operations,” “Business” and other sections of this prospectus. We have taken such care as we consider reasonable in the extraction and reproduction of information from such data from third party sources.
Industry publications, research, studies, and forecasts generally state that the information they contain has been obtained from sources believed to be reliable, but that the accuracy and completeness of such information is not guaranteed. Forecasts and other forward-looking information obtained from these sources are subject to the same qualifications and uncertainties as the other forward-looking statements in this prospectus. These forecasts and forward-looking information are subject to uncertainty and risk due to a variety of factors, including those described under “Risk Factors.” These and other factors could cause results to differ materially from those expressed in the forecasts or estimates from independent third parties and us.
SUMMARY
This summary highlights selected information appearing elsewhere in this prospectus. Because it is a summary, it may not contain all of the information that may be important to you. To understand this offering fully, you should read this entire prospectus carefully, including the information set forth under the heading “Risk Factors” and our financial statements.
The Company
On August 11, 2021, Rockley, Rockley UK, and SC Health consummated the Business Combination pursuant to the Business Combination Agreement dated as of March 19, 2021 among HoldersRockley, SC Health, Rockley UK and Merger Sub. Rockley was deemed to be the accounting acquirer in the Merger based on an analysis of the criteria outlined in Accounting Standards Codification 805. Accordingly, the historical financial statements of Rockley UK became the historical financial statements of the combined company, upon the consummation of the Merger.
Pursuant to the Business Combination Agreement, each of the following transactions occurred in the following order: (i) pursuant to a scheme of arrangement approved by the UK courts (the “Scheme”), all of Rockley UK’s Ordinary Shares,ordinary shares, including shares issued immediately prior to the Scheme becoming effective as a result of the conversion of then-outstanding convertible loan notes and the exercise of warrants, were transferred by Rockley UK shareholders in exchange for an equivalent number of shares in HoldCo;Rockley; (ii) the holders of options to purchase shares in Rockley UK rolled over their options into new options to purchase shares in HoldCo;Rockley; (iii) warrants to purchase shares in Rockley UK (other than one warrant instrument that by its terms was replicated at HoldCo)Rockley) not exercised for shares in Rockley UK prior to the effectiveness of the Scheme described above were cancelled, such that immediately following the Scheme, Rockley UK became a direct wholly-ownedwholly owned subsidiary of HoldCo;Rockley; (iv) HoldCoRockley completed a stock split to prepare its share capital for Merger Sub’s merger into SC Health; (v) certain investors (including entities affiliated with the Sponsor) purchased 15,000,000 Ordinary Sharesan aggregate of $150,000,000 of ordinary shares in Rockley pursuant to subscription agreements by and among such investors, HoldCo and SC Health for a purchase price of $10.00 per share, or an aggregate purchase price of $150,000,000 (the “PIPE Financing”);the PIPE financing that was completed in connection with the Business Combination; (vi) on August 11, 2021, Merger Sub was merged with and into SC Health, with SC Health surviving the merger and becoming a direct wholly-ownedwholly owned subsidiary of HoldCo;Rockley; and (vii) the Ordinary Sharesordinary shares and warrants in SC Health were exchanged for Ordinary Sharesordinary shares and warrants in HoldCo.
Rockley.Our Ordinary Sharesordinary shares and Public Warrantspublicly traded warrants (the “Public Warrants”) are currently listed on the New York Stock Exchange (the “NYSE”(“NYSE”) under the symbols “RKLY” and “RKLY.WS,” respectively.
The rights of holders of our Ordinary Shares, Public Warrants, and private warrants to purchase Ordinary Shares (the “Private Warrants” and, collectively with the Public Warrants, the “Warrants”)ordinary shares are governed by our Second Amended and Restated Memorandum and Articles of Association (the “Articles of Association”), and the laws of the Cayman Islands, and, in the case of the Warrants, the assignment, assumption, and amendment agreement dated August 11, 2021 (the “HoldCo Warrant Agreement”), by and among SC Health, HoldCo, and Computershare Trust Company, N.A. (“Computershare”), as warrant agent, which replaced and superseded the warrant agreement, dated July 11, 2019, between SC Health, the Sponsor, and American Stock Transfer & Trust Company (the “SC Health Warrant Agreement”).Islands. See the sections entitled “Description of Our Securities” and “Selling Securityholders—Certain Relationships with Selling Securityholders.Securities.”
Corporate Information
Implications of Being an Emerging Growth Company and a Smaller Reporting Company
We qualify as an “emerging growth company” as defined in the Jumpstart Our Business Startups Act of 2012 (the “JOBS Act”). As an emerging growth company, we intend to take advantage of certain exemptions from specified disclosure and other requirements that are otherwise generally applicable to public companies. These exemptions include:
•not being required to comply with the auditor attestation requirements for the assessment of our internal control over financial reporting provided by Section 404 of the Sarbanes-Oxley Act of 2002;
•reduced disclosure obligations regarding executive compensation; and
•not being required to hold a nonbinding advisory vote on executive compensation or seek shareholder approval of any golden parachute payments not previously approved.
We intend to take advantage of these provisions for up to five years or such earlier time that we are no longer an emerging growth company. We would cease to be an emerging growth company upon the earliest to occur of (1) the last day of the fiscal year (a) following the fifth anniversary of the date of the first sale of common equity securities pursuant to an effective registration statement, (b) in which we have total annual gross revenue of at least $1.07 billion, or (c) in which we are deemed to be a large accelerated filer, which means the market
1
value of our Ordinary Sharesordinary shares that is held by30th,30th, and (2) the date on which we have issued more than $1.0 billion in
non-affiliates
exceeds $700 million as of the prior June non-convertible
debt during the prior three-year period.We are also deemed to be a “smaller reporting company” as defined in Rule
12b-2
under the Securities Exchange Act of 1934, as amended (the “Exchange Act”), and are thus allowed to provide simplified executive compensation disclosures in our SEC filings, will be exempt from the provisions of Section 404(b) of Sarbanes-Oxley requiring that an independent registered public accounting firm provide an attestation report on the effectiveness of internal control over financial reporting and will have certain other reduced disclosure obligations with respect to our SEC filings. We may choose to take advantage of some or all of these accommodations. We have taken advantage of reduced reporting requirements in this prospectus. Accordingly, the information contained herein may be different from the information you receive from U.S. public companies that do not qualify as an emerging growth company or a smaller reporting company.For additional details see “Risk Factors — We qualify as an “emerging growth company” within the meaning of the Securities Act, and if we take advantage of certain exemptions from disclosure requirements available to emerging growth companies, it could make our securities less attractive to investors and may make it more difficult to compare our performance to the performance of other public companies.”
Rockley’s business and its ability to execute its strategy, and any investment in its securities are subject to risks and uncertainties, many of which are beyond Rockley’s control. You should carefully consider and evaluate all of the risks and uncertainties with respect to any investment in the securities of Rockley, including, but not limited to, the following and those discussed under “Risk Factors.” References below to Rockley shall be deemed to also refer to Rockley and its subsidiaries, as the context requires or as appropriate.
Risks Related to Rockley’s Business and Industry
•If Rockley does not fully develop or commercialize its products and services, or if such products and services experience significant delays, Rockley’s business, financial condition, and results of operation will be materially and adversely affected.
•Rockley has a history of recurring losses and a significant accumulated deficit, which raises substantial doubt about its ability to continue as a “going concern.” Rockley expects to incur significant research and development expenses and devote substantial resources to commercializing new products, which could increase its losses and negatively impact its ability to achieve or maintain profitability.
•If the end products into which Rockley’s products are incorporated are not fully developed and commercialized or do not achieve widespread market acceptance, or if such products experience delays, cancellations, or reductions, or if Rockley’s products are not selected for inclusion in its customers’ end products, are not adopted in other industry verticals or use cases, or are not adopted by leading consumer and medical device companies, Rockley’s business will be materially and adversely affected.
•Rockley’s estimates and expectations as to its financial performance are based upon assumptions, analyses, and internal estimates developed by Rockley’s management. If these assumptions, analyses, or estimates prove to be incorrect or inaccurate, Rockley’s actual operating results may differ materially from any such estimates and expectations.
•Rockley expects its results of operations to fluctuate on a quarterly and annual basis, which could cause Rockley’s stock price to fluctuate or decline.
•If Rockley is unable to manage its growth or scale its operations, its business and operating results could be materially and adversely affected.
•Market opportunity estimates and growth forecasts are subject to significant uncertainty and are based on assumptions and estimates that may not prove to be accurate.
•Rockley’s international operations expose it to operational, financial, and regulatory risks, which could harm Rockley’s business.
•Rockley is susceptible to supply shortages, long lead times for components, and supply changes, any of which could disrupt its supply chain and could delay deliveries of its products to customers, which in turn could adversely affect Rockley’s business, results of operations, and financial condition.
•Rockley’s business depends substantially on the efforts of its executive officers, including its Chief Executive Officer and founder, Dr. Andrew Rickman.
Customer-Related Risks
• If Rockley is unable to sell its products to its target customers, including large corporations with substantial negotiating power, or is unable to enter into agreements with customers and suppliers on satisfactory terms, its prospects and results of operations will be adversely affected.
• Rockley currently depends on a few large customers for a substantial portion of its revenue. The loss of, or a significant reduction in, orders from Rockley’s customers, or Rockley’s failure to diversify its customer base, could significantly reduce its revenue and adversely impact Rockley’s operating results.
• Because Rockley does not anticipate long-term purchase commitments with its customers, orders may be cancelled, reduced, or rescheduled with little or no notice, which in turn exposes Rockley to inventory risk, and may cause its business and results of operations to suffer.
Risks Related to Rockley’s Debt Financing
•Rockley is subject to restrictive debt covenants that may limit its ability to finance its future operations and capital needs and to pursue business opportunities and activities.
•We have a significant number of securities outstanding that can be converted into, or exercised for, ordinary shares and certain of our outstanding warrants contain anti-dilution protection, all which may cause significant dilution to our shareholders, have a material adverse impact on the market price of our ordinary shares and make it more difficult for us to raise funds through future equity offerings.
2
•Our existing and future indebtedness, including the Notes, restricts our ability to raise additional capital to fund our operations and repay our debt including the Notes and limits our ability to react to changes in the economy or the technology industry.
Regulatory, Intellectual Property, Infrastructure, Cybersecurity and Privacy Risks
•Rockley’s failure to comply with applicable governmental export and import control laws and regulations, including those related to the use, distribution, and sale of its products, FDA clearance or approval requirements, or privacy, data protection, and information security requirements in the jurisdictions in which Rockley operates could materially harm its business and operating results.
•Rockley may not be able to adequately protect or enforce its intellectual property rights or prevent unauthorized parties from copying or reverse engineering its products or technology. Further, Rockley’s intellectual property applications, including patent applications, may not be approved or granted.
•A network or data security incident or disruption or performance issues with Rockley’s network infrastructure could harm its brand, reputation, and business, as well as its operating results.
Risks Related to Financial and Accounting Matters
•Rockley’s failure to raise additional capital or generate the significant capital necessary to expand its operations could reduce its ability to compete and could harm its business.
•In preparing Rockley’s consolidated financial statements, Rockley makes good faith estimates and judgments that may change or turn out to be erroneous, which could adversely affect Rockley’s operating results.
Risks Related to Being a Public Company, Rockley’s Ordinary Shares, and General Risks
•Rockley’s ordinary shares may not remain eligible for listing on the NYSE.
•Rockley may be required to take write downs or write offs, or may be subject to restructuring, impairment or other charges that could have a significant negative effect on Rockley’s financial condition, results of operations and the market price of Rockley’s ordinary shares.
•Rockley’s share price may be volatile and sales of substantial volumes of our ordinary shares into the public market or the perception that such sales may occur could cause our share price to decline, including substantially.
•If analysts do not publish or cease publishing research or reports about Rockley or if they change their recommendations regarding Rockley’s securities, the price and trading volume of Rockley’s securities could decline.
•The requirements of being a public company may strain Rockley’s resources, divert management’s attention, and affect its ability to attract and retain qualified board members.
•The global COVID-19 pandemic could harm Rockley’s business, financial condition, results of operations, and prospects.
Investing in our securities entails a high degree of risk as more fully described in the “Risk Factors” section of this prospectus beginning on page 7. You should carefully consider such risks before deciding to invest in our securities.
THE PRIVATE PLACEMENT FINANCING
$81.5 million aggregate principal amount of Convertible Senior Secured Notes due 2026 (the “Notes”) and the 144A Warrants to purchase 26,461,038 ordinary shares at an exercise price of $5.00 per share, subject to certain anti-dilution adjustments. The Notes are convertible at an initial conversion price equal to $3.08 per ordinary share and subject to certain customary anti-dilution adjustments. The Company has also granted the selling shareholders an overallotment option (the “Overallotment Option”) to purchase up to an additional $81.5 million aggregate principal amount of Notes (the “Additional Notes”) and additional 144A Warrants to purchase up to 26,461,038 ordinary shares (the “Additional 144A Warrants”), subject to certain anti-dilution adjustments, from such date until the date that is 12 months following the date that a registration statement covering the ordinary shares issuable upon conversion of the Notes and upon exercise of the 144A Warrants becomes effective. The Notes and the 144A Warrants were issued on May 27, 2022 pursuant to an exemption under Section 4(a)(2) of the Securities Act. This prospectus relates to the issuanceresale from time to time by Rockley of up to 721,070 Ordinary Shares87,567,895 ordinary shares, including (i) up to 40,316,038 ordinary shares issuable upon conversion of the Notes (assuming that the Notes were converted on the date they were issued and the interest make-whole payment (as defined in the Indenture) that would become due in connection therewith was paid by the Company in ordinary shares on that date) and (ii) up to 47,251,857 ordinary shares issuable upon the exercise of options. This prospectus also relates to the offer and sale from time to time by the selling securityholders of up to 52,048,361 Ordinary Shares and 5,450,000 warrants, which includes: (a) 5,487,500 Ordinary Shares held by the Sponsor-Related Holders; (b) 5,450,000 Ordinary Shares144A Warrants (assuming that an additional 20,790,819 ordinary shares would be issuable upon the exercise of warrants held by the Sponsor-Related Holders; and (c) 41,110,861 Ordinary Shares held by certain current and former affiliatesall of the Company.
The Company also requiredentered into a Registration Rights Agreement (the “Registration Rights Agreement”), dated May 27, 2022, with the selling shareholders, which provides, subject to use our best efforts to causecertain limitations, the selling shareholders with certain registration statement to become effective and to maintainrights for the effectiveness of such registration statement until the expirationordinary shares issuable upon conversion of the warrants.Notes (including ordinary shares issuable if the Company elects, and is permitted thereunder, to pay the interest make-whole payment (as defined in the Indenture) that may become due in connection therewith in ordinary shares) and exercise of the 144A Warrants. The registration statement of which this prospectus forms a part is being filed to comply with this requirement. For further details see the sections titled “Certain Relationships and Related Party Transactions — Amendment to Warrant Agreement” and “Description of Securities — Registration Rights — Warrant Amendment.”
3
covered by such registration statement (i) have demand, “piggy-back”been resold or (ii) may be resold without volume or manner-of-sale restrictions pursuant to Rule 144 under the Securities Act (“Rule 144”) and FormS-3without the requirement for the Company to be in compliance with the current public information requirement under Rule 144. If the Company fails to meet certain obligations under the Registration Rights Agreement, including timely filing and effectiveness of such resale registration rights,statement or a failure to maintain continuous effectiveness of such resale registration statement for more than 10 calendar days, it will be obligated to pay liquidated damages to each selling shareholder in an amount of cash equal to the product of 2.0% multiplied by the aggregate purchase price paid by such selling shareholder under the Subscription Agreement monthly until such breach is cured. If the Company fails to pay any liquidated damages pursuant to the Registration Rights Agreements in full within seven days after the date payable, the Company will pay interest thereon at a rate of 18% per annum.
The Notes
The Notes were issued pursuant to an indenture (the “Indenture”), dated as of May 27, 2022, among the Company, certain of its subsidiaries, as guarantors (the “Guarantor Subsidiaries”), and Wilmington Savings Fund Society, FSB, as trustee (the “Trustee”) and as collateral agent (the “Collateral Agent”). The Notes are senior secured obligations of the Company and the Guarantor Subsidiaries secured by substantially all assets of the Company and each Guarantor Subsidiary. Interest on the Notes will be payable quarterly in arrears at a rate of 9.5% per annum if paid in cash or, subject to the satisfaction of certain conditions, at a rate of 12.0% per annum payable at a rate of 5.75% per annum in cash and 6.25% per annum through the issuance of additional Notes (“PIK Interest”), which will also bear interest. Interest on the Notes will be payable quarterly in arrears on February 15, May 15, August 15 and November 15, commencing on August 15, 2022, and unless the context otherwise requires, references herein to the Notes include any interest paid as PIK Interest. The Notes will mature on May 15, 2026 (the “Maturity Date”) unless redeemed, repurchased or converted in accordance with their terms prior to such date.
The Notes are convertible at an initial conversion price equal to $3.08 per ordinary share (the “Conversion Price”) and subject to certain minimum requirements and customary conditions. For further details seeanti-dilution adjustments. Holders of the section titled “Certain Relationships and Related Person Transactions — Transactions RelatedNotes have the right to convert all or a portion of their Notes at any time prior to the Business Combination — Registration Rightsclose of business on the second scheduled trading day immediately preceding the Maturity Date andLock-UpAgreement.” the right to receive additional ordinary shares if the Company elects, and is permitted thereunder, to pay the interest make-whole payment (as defined in the Indenture) that may become due in connection therewith in ordinary shares. Upon conversion, holders of the Notes will receive ordinary shares and cash for fractional interests and except in connection with certain events, an interest make-whole payment for interest that would have accrued from the date of conversion until the Maturity Date, which interest make-whole payment shall be paid in cash or subject to the satisfaction of certain conditions, in ordinary shares at the Company’s election.
The Company may redeem the Notes in whole, and not in part, at its option, at any time prior to the Maturity Date, for a cash purchase price equal to the aggregate principal amount of this offering, weany Notes to be redeemed plus accrued and unpaid interest thereon plus a make-whole premium as provided in the Indenture. At any time prior to the Maturity Date, the Company may also redeem the Notes in whole, or from time to time in part, if the last reported sale price of the ordinary shares exceeds 250% of the conversion price then in effect and if the daily trading volume for ordinary shares on the NYSE exceeds 1,000,000 shares, in each case, for at least 20 trading days (which need not be consecutive), including at least one of the five trading days preceding the date on which the Company provides a notice for such redemption, during any 30 consecutive trading day period ending on, and including, the trading day preceding such notice date, for a cash purchase price equal to the aggregate principal amount of any Notes to be redeemed plus accrued and unpaid interest thereon. The Notes are registeringalso subject to redemption at the option of the Company in the event of certain changes in tax law or listing status of the Notes or the status of the relevant stock exchange on which the Notes may be listed as a “recognised stock exchange” for resale our Ordinary Shares ownedpurposes of certain tax laws related to withholding on payments of interest.
In addition, following certain corporate events that occur prior to the Maturity Date or following issuance by the Sponsor-Related Holders andCompany of a notice of redemption, in each case as provided in the RockleyUK-RelatedHolders,Indenture, in certain circumstances, the Company will increase the conversion rate for a holder who elects to convert its Notes in connection with such a corporate event or who elects to convert any Notes called for redemption during the related redemption period. Additionally, in the event of a fundamental change (such term as well asdefined in the shares issuable upon the exerciseIndenture), holders of the 5,450,000 warrants ownedNotes will have the right to require the Company to repurchase all or a portion of their Notes at a price equal to the aggregate principal amount of any Notes to be repurchased plus accrued and unpaid interest thereon plus a make-whole premium.
The Indenture includes restrictive covenants that, subject to specified exceptions, limit the ability of the Company and its subsidiaries to, among other things, (a) incur debt or issue preferred shares or disqualified stock; (b) make (i) dividends and distributions, (ii) redemptions and repurchases of equity, (iii) investments and (iv) prepayments, redemptions and repurchases of subordinated debt; (c) incur liens; (d) make asset sales; (e) enter into transactions with affiliates, (f) issue or sell any ordinary shares, or any securities convertible into or exercisable for ordinary shares, at a price, or having a conversion or exercise price, that is less than the conversion price (as defined in the Indenture) on the Notes and (g) enter into agreements limiting subsidiary distributions. In addition, the Company is required to maintain minimum unrestricted cash and cash equivalents of $20.0 million. The Indenture also includes customary events of default after which the Trustee or the holders of 25% in aggregate principal amount of the Notes then outstanding may accelerate the maturity of the Notes to become due and payable immediately; provided, however, that the Notes will be automatically accelerated upon certain events of bankruptcy, insolvency and reorganization involving the Company or any of its subsidiaries. Such events of default include: (i) certain payment defaults on the Notes (which, in the case of a default in the payment of interest and liquidated damages on the Notes, will be subject to a 30-day cure period); (ii) the Company’s failure in its obligation to convert a Note, if such default is not cured within three business days; (iii) the Company’s failure to send certain notices under the Indenture within specified periods of time, if such failure is not cured within three business days; (iv) the Company’s failure to comply with certain covenants in the Indenture restricting the Company’s ability to consolidate with or merge with or into, or sell, lease or otherwise transfer, in one transaction or a series of transactions, all or substantially all of the assets of the Company and its subsidiaries, taken as a whole, to another person; (v) a default by the Sponsor-Related Holders. We are also registering for resale 5,450,000 warrants ownedCompany in its other obligations or agreements under the Indenture or the other note documents (as defined in the Indenture) if such default is not cured or waived within 30 days after written notice is given by the Sponsor-Related Holders.
Trustee or the holders of 25% in aggregate principal amount of the Notes then outstanding; (vi) certain defaults by the Company or any of its subsidiaries with respect to indebtedness for borrowed money of at least $3,500,000; (vii) final judgments of at least $3,500,000 (excluding amounts not covered by insurance) rendered against the Company or any of its subsidiaries, which judgments are not discharged or stayed within 60 days; (viii) certain events of bankruptcy, insolvency or reorganization involving the Company or any of its4
The Notes and the RockleyUK-RelatedHolders are subject144A Warrants were purchased by the selling shareholders for a collective purchase price of 99% of the original principal amount of the Notes. In addition, in connection with the issuance of the Notes, the Company is required to certain transfer restrictions ending one year followingpay an annual facility fee in advance on the date of such issuance and each anniversary thereof from the date of the Closing (the “Closing Date”), withissuance thereof through the Maturity Date in an amount equal to 1% of the original principal amount of the Notes on the date of such restrictions on sales and transfersissuance; provided that upon the earliest to terminate early if followingoccur of (i) the 150thday afterfirst date upon which all of the Closing Date,then-outstanding Notes have been converted to ordinary shares, (ii) the closing trading pricefirst date upon which all of our Ordinary Shares equals or is greater than $12.50 for any 20 out of any 30 consecutive trading days. For further details see the sections titled “Description of Our Securities — Share Capital — Authorized Capitalization — Transfer Restrictions.” and “Selling Securityholders — Certain Relationships with Selling Securityholders — Registration Rights andLock-UpAgreement.”
The 144A Warrants
The 144A Warrants have a ten-year term and a $5.00 per share exercise price, and include customary anti-dilution adjustments as well as a ratchet anti-dilution adjustment in the event any ordinary shares or other terms and conditions depending onequity or equity equivalent securities payable in ordinary shares are granted, issued or sold (or the Company enters into any agreement to grant, issue or sell), in each case, at a price less than the exercise price then in effect. Upon the occurrence of such an event, the exercise price of the HoldCo Ordinary Shares. Equity awards granted144A Warrants will be decreased to the lower price (subject to a floor of $2.80 per ordinary share) and the number of ordinary shares issuable upon exercise of the 144A Warrants will be increased, such securityholdersthat the aggregate exercise price of all 144A Warrants remains the same before and after any such event. This will result in additional ordinary shares that may be issuable upon exercise of the 144A Warrants and may result in dilution to the existing shareholders. Upon the occurrence of a Fundamental Transaction (as defined in the 144A Warrants), the 144A Warrants provide each holder a put right in respect of the 144A Warrants. Upon the exercise of a put right by a holder, the Company will be obligated to repurchase the 144A Warrants for the fair market value of the 144A Warrants repurchased, as calculated by a third-party valuation firm selected by the Company and reasonably acceptable to the holder. The 144A Warrants also include cashless exercise rights.
The summaries of the Subscription Agreement, the Indenture, the Notes, the 144A Warrants and the Registration Rights Agreement do not purport to be complete and are generally subjectqualified in their entirety by reference to vestingthe full text of, as described inapplicable, the Indenture (including the form of Note attached thereto), the form of Warrant, the Subscription Agreement and the Registration Rights Agreement, which are attached as Exhibits 4.5, 4.6, 10.14 and 10.15, respectively, to the registration statement of which this prospectus. For additional details, see the sections titled “Description of Our Securities — Rule 144,” “Description of Our Securities —Share Capital — Authorized Capitalization — Transfer Restrictions” and “Executive Compensation.”prospectus forms a part, which is incorporated herein by reference.
5
THE OFFERING
| Ordinary shares outstanding prior to this offering | ||||||
| Use of | We will not receive any proceeds from the sale of | |||||
| Dividend policy | ||||||
| We have not paid any cash dividends on our | ||||||
| NYSE Symbol | “RKLY” | |||||
| risk. See “Risk Factors” | ||||||
6
RISK FACTORS
Investing in our securities involves risks. Before you make a decision to buy our securities, in addition to the risks and uncertainties discussed above under “Forward-Looking Statements,” you should carefully consider the specific risks set forth herein. If any of these risks actually occur, it may materially harm our business, financial condition, liquidity, results of operations, and prospects. As a result, the market price of our securities could decline, and you could lose all or part of your investment. Additionally, the risks and uncertainties described in this prospectus or any prospectus supplement are not the only risks and uncertainties that we face. Additional risks and uncertainties not presently known to us or that we currently believe to be immaterial may become material and adversely affect our business. If any of the following risks or other risks not specified below materialize, our business financial condition and results of operations could be materially and adversely affected. In that case, the trading price of our Ordinary Sharesordinary shares could decline.
Risks Related to Rockley’s Business and Industry
Rockley has incurred net losses since inception and expects to continue to incur losses for the foreseeable future. If Rockley does not fully develop or commercialize its products and services, including its silicon photonics chipsets, or if such products and services experience significant delays, Rockley’s business, financial condition, and results of operation will be materially and adversely affected and Rockley may never achieve or sustain profitability.
Rockley has to date generated revenue primarily from$30.6$168.0 million and $95.3$80.3 million for the threeyears ended December 31, 2021 and six months2020, respectively. For the years ended June 30,December 31, 2021 respectively. As of June 30, 2021,and 2020, Rockley had an accumulated deficit of $328.2 million.$400.9 million and $232.9 million, respectively. Rockley believes that it will continue to incur operating and net losses for the foreseeable future, including for a period of time after commercialization of its silicon photonics chipsets, which is not currently expected to begin until the second half of 2022; provided that any such commercialization may occur later than the second half of 2022 or not at all. Even if Rockley is able to successfully develop and sell its products, there can be no guarantee that it will do so within its anticipated timeframe or that its products will be commercially successful. Rockley’s potential future profitability is dependent upon the successful development, commercial introduction, and acceptance of its products and services, including its silicon photonics chipsets for the consumer wearables market and its module applications with biomarker detection capabilities for advanced health metrics. Because Rockley will incur costs to develop and commercialize its products and services, including its chipsets and module applications, before it receives any significant revenue from any sales of such products or services, Rockley’s losses in future periods may continue. Rockley may never achieve or sustain profitability.
non-recurring
engineering (“NRE”) and development services for customer-specific designs of silicon photonics chipsets for incorporation into its customers’ end products. Rockley incurred a net loss of Rockley expects to continue to incur operating losses for the foreseeable future as it:
•continues to invest in its technology and its silicon photonics chipsets and modules, as well as its cloud-based analytics subscription service;
•continues to develop innovative solutions and applications for its technology;
•commercializes its silicon photonics solutions;
•continues to invest in its sales and marketing activities and distribution channels;
•invests and improves its operational, financial, and management information systems;
•increases its headcount;
•expands its intellectual property portfolio; and
•enhances internal functions, systems, and infrastructure to support its anticipated transition to a public company.
Rockley has a history of recurring losses and negative cash flows from operations, and a significant accumulated deficit, which raises substantial doubt about its ability to continue as a “going concern.”
Since inception, Rockley has financed its operations primarily through the issuance and sale of convertible loan notes, Ordinary Sharesdebt, ordinary shares and revenue received from agreed-upon projects. As of June 30,December 31, 2021 and March 31, 2022, Rockley’s cash and cash equivalents balance was $35.4$36.8 million and $11.9 million, respectively, and it had an accumulated deficit of $328.2 million.$400.9 million and $442.7 million, respectively. Due to Rockley’s history of recurring losses from operations, negative cash flows from operations, and a significant accumulated deficit, its management concluded that there is substantial doubt about Rockley’s ability to continue as a going concern. There have been no adjustments to the accompanying financial statements of Rockley to reflect this uncertainty. Rockley’s ability to continue as a going concern is dependent upon it becoming profitable in the future or obtaining the necessary capital to meet its obligations. Rockley’s determination of substantial doubt about its ability to continue as a going concern could materially limit its ability to raise additional funds through the issuance of equity securities, debt financing or otherwise. There can be no assurance that any such issuance of equity securities, debt financing or other means of financing will be available in the future, or the terms of any such financing will be acceptable to Rockley. Further, there can be no assurance that Rockley will ever become profitable or continue as a going concern.
If the end products into which Rockley’s products are incorporated are not fully developed and commercialized or do not achieve widespread market acceptance, or if such products experience delays, cancellations, or reductions, Rockley’s business, financial condition, and results of operations will be materially and adversely affected.
Rockley’s success in developing and commercializing its products depends in large part on its customers’ success in developing, commercializing, and achieving widespread market acceptance of their end products that incorporate Rockley’s products. Rockley’s customers may be unable to fully develop and commercialize, or achieve widespread market acceptance of, their end products that incorporate Rockley’s products. Further, these customers may not continue to incorporate Rockley’s products into their end products either in the short or long term. If such customers’ end products are not fully developed and commercialized, fail to achieve or maintain widespread market
7
acceptance, experience delays, or if Rockley’s customers otherwise choose not incorporate Rockley’s products into their end products, Rockley’s business, financial condition, and results of operations will be materially and adversely affected.
If Rockley’s products are not selected for inclusion in its customers’ end products, including products for the consumer
health and wellness market, or adopted in other industry verticals or use cases or are not adopted by leading consumer and
medical device companies, life sciences companies, or their respective suppliers, Rockley’s business will be materially and
adversely affected.
Rockley is currently developing products for use in its customers’ end products, which are in varying stages of development. Many of these products, including products for consumer device, medical device, and life sciences companies, require extensive testing or qualification processes, which involve testing of Rockley’s products in the customers’ end products and systems, as well as testing for reliability. These qualification processes may continue for several months or longer. However, qualification of any of Rockley’s products by a customer does not assure any sales of such product by Rockley to that customer. Even after successful qualification and sales by Rockley of a product to a customer, a subsequent revision in Rockley’s third-party contractors’ manufacturing process or Rockley’s selection of a new supplier may require a new qualification process with Rockley’s customers, which may result in delays in the sale of such product and could also result in Rockley holding excess or obsolete inventory. After Rockley’s products are qualified, it can take several months before the customer commences production of end products that incorporate Rockley’s products. Rockley spends significant time and resources to have its products selected for incorporation into these end products, which is known as a “design win.” If Rockley fails to win a significant number of design wins in its target markets, its business, results of operations, and financial condition will be materially and adversely affected.
Rockley is targeting the deployment of its products in the consumer health and wellness and medical device sectors and forecastsany estimates of Rockley’s future results contained in this prospectus assume that Rockley will successfully commercialize its products and achieve significant market penetration in these sectors. As a result, if Rockley’s products are not selected for inclusion by consumer device and medical device companies or life sciences companies, or their suppliers, Rockley’s actual results may differ materially from its forecastsestimates included in this prospectus and Rockley’s business would be materially and adversely affected.
Rockley’s limited operating history makes it difficult to evaluate its future prospects and the risks and challenges which may impact its business.
Rockley was founded in 2013, completed development of its advanced sensing platform in 2019, launched its healthcare module offering in 2020, and has not yet fully developed and commercialized any of its products. This relatively limited operating history makes it difficult to evaluate Rockley’s future prospects and the risks and challenges it may encounter. The risks and challenges which may impact
Rockley’s future prospects and business include, but are not limited to, its ability to:
•successfully commercialize its products and services, including its silicon photonics chipsets, module applications, and analytics subscription service;
•develop innovative applications for its silicon photonics and sensing technology;
•expand its sales and marketing activities and distribution channels;
•improve its operational, financial, and management information systems;
•attract, hire, integrate, and retain qualified talent to support the growth of its business. This includesbusiness, including increasing headcount to appropriately staff to projected growth;
•protect its intellectual property portfolio;
•enhance internal, systems, functions, and infrastructure to support its anticipated transition to a public company;
•comply with existing and new or modified laws and regulations applicable to its business;
•manage capital expenditures for its current and future products, as well as its supply chain and supplier relationships;
•anticipate and respond to macroeconomic changes and changes in the markets in which it operates;
•effectively manage its growth and business operations, including the impacts of thebusiness; and
business.COVID-19
pandemic on its If Rockley fails to successfully manage the risks and difficulties that it faces, including those associated with the challenges listed above and those described elsewhere in this “Risk Factors“Risks Related to Rockley’s Business and Industry”Industry” section, its business, financial condition, and results of operations could be materially and adversely affected. Further, because Rockley has a limited operating history and has not yet commercialized its products, it is difficult to accurately assess its future prospects or financial performance. Rockley has encountered in the past, and will encounter in the future, risks and uncertainties frequently experienced by growing companies with limited operating histories in rapidly changing industries. If Rockley’s assumptions regarding these risks and uncertainties, which it uses to plan and operate its business, are incorrect or change, or if it does not address these risks successfully, its results of operations could differ materially from its expectations and its business, financial condition, and results of operations could be materially and adversely affected.
Rockley’s forecastsestimates and projectionsexpectations as to its financial performance are based upon assumptions, analyses, and internal estimates developed by Rockley’s management. If these assumptions, analyses, or estimates prove to be incorrect or inaccurate, Rockley’s actual operating results may differ materially from those forecasted or projected.
Rockley’s forecastsestimates and projectionsexpectations as to its future financial performance are subject to uncertainty and are based on assumptions, analyses, and internal estimates developed by Rockley’s management, all or some of which may not prove to be correct or accurate. If these assumptions, analyses, or estimates including, but not limited to, those related to estimated revenue, production costs, operating expenses, and cash utilization, prove to be incorrect or inaccurate, Rockley’s actual operating results may differ materially from those forecastedany such estimates or projected.expectations. We have in the past experienced actual results which varied from our estimates. These assumptions, analyses, or estimates are subject to risks and uncertainties, some of which are outside of Rockley’s control. These risks and uncertainties include, but are
8
not limited to, risks discussed elsewhere in this “Risk Factors“Risks Related to Rockley’s Business and Industry”Industry” section and in this prospectus, as well as those discussed below:
•Revenue-related assumptions:
▪Customer contracts and design wins: Rockley’s existing memoranda of understanding (“MOUs”) and development contracts may not ultimately convert into production contracts. In addition, Rockley may be unable to secure design wins from additional customers in a timely manner;
▪Form of customer arrangement: It is possible that instead of entering into agreements with customers for the purchase of a significant amount of Rockley’s products, Rockley may be required to enter into license arrangements with certain customers, any of which would have a significant impact on the revenue Rockley has currently forecastedexpects to achieve;
▪Timing of launch and delivery: Rockley or Rockley’s customers may encounter delays in the launch or delivery of Rockley’s product or the customer’s end product incorporating Rockley’s product, including due to a customer’s decision to delay the launch of a product, Rockley’s ability to deliver its product in a timely manner to a customer, which in turn may result in the customer canceling a contract, technical challenges, or customer-related delays in its development program;
▪Pricing and volume fluctuation: Rockley may experience pricing and volume fluctuations due to price negotiations, lower than anticipated unit volumes, delays in volume ramp, decreases in average selling prices due to competition or market dynamics, or other factors; and
▪Timing and execution of customer agreements: Rockley may face difficulties in meeting customer milestones in a timely manner or achieving required technical specifications. In addition, Rockley may experience execution delays under its NRE programs, including with its largest customer, due to resource constraints or customer delay. Further, to the extent Rockley were to enter into licensing arrangements in lieu of a product sale with a customer, including its largest customer, it could have a significant negative impact on Rockley’s anticipated revenue.
▪Commercialization of products and services: Rockley must successfully commercialize its products and services, including its silicon photonics chipsets, module applications, and analytics subscription service.
•Production cost-related assumptions:
▪Production volume and ramp: Rockley has in the past, and may in the future experience delays in contract execution, lower than expected manufacturing yields, manufacturing delays, and technical challenges, including if and when Rockley commences commercial production of its products, any of which could negatively impact forecasted production volume and ramp;
▪Production cost: Rockley may be unable to secure the volume pricing or yield cost levels underlying its assumptions and indirect materials and production overhead costs may exceed forecasted amounts; and
▪Inventory and obsolescence: Rockley’s quality, warranty, return merchandise authorization, and inventory obsolescence may exceed forecasted amounts. Rockley may also experience product recalls which are not included in Rockley’s assumptions. Further, Rockley may incur greater than expected costs in connection with its NRE programs.
•Operating expenses and cash utilization-related assumptions: Rockley’s cash utilization may exceed currently anticipated rates due to a variety of factors, including lower than expected revenue, revenue delays, higher than anticipated production and manufacturing costs, operating expenses, and capital expenditures, lower than anticipated average selling prices, greater than anticipated cash needs for internal resources and organic growth, and potential strategic investments and acquisitions not currently anticipated.
Rockley’s forecastsestimates and projectionsexpectations may also include forecasts and estimates relating tobe based in part on the expected size and growth of the markets in which Rockley operates or intends to enter, including the consumer wearables, mobile device, and medical device markets. Such markets may not develop or grow, or may develop and grow at a lower rate than expected, and even if these markets experience the forecasted growth described in this prospectus, Rockley may not grow its business at similar rates, or at all. Accordingly, the forecasts and estimates of market size and growth described in this prospectus should not be taken as a guarantee or other indication of Rockley’s future growth or results of operations. In addition, these forecasts may be materially and adversely affected by a number of factors outside of Rockley’s control, including, but limited to, factors associated with the ongoing
COVID-19
pandemic.The strategic initiatives Rockley has undertaken or may undertake in the future may be more costly than currently anticipated and Rockley may not generate sufficient revenue to offset the costs of these initiatives, which in turn would negatively impact Rockley’s ability to achieve and maintain profitability.
9
Rockley continues to invest in initiatives designed to grow its business, including:
•partnering with customers and potential customers to develop and commercialize Rockley’s products;
•investing in research and development;
•investing in its workforce, including its engineering talent;
•expanding its sales, marketing, and distribution efforts;
•investing in new applications and markets for its products;
•partnering with third partiesthird-parties to develop manufacturing processes; and
•investing in legal, accounting, and other administrative and internal functions necessary to support its operations as a public company.
These initiatives may be more costly than anticipated and Rockley may not generate sufficient revenue to offset the costs of these initiatives. Certain of Rockley’s market opportunities, such as healthcare monitoring devices incorporating sensing capabilities for disease detection and management, are at an early stage of development, and it may be years before these end markets generate demand for Rockley’s products at scale, if at all. Rockley’s revenue may be adversely affected for a number of reasons, including the rate and degree of development or market acceptance of new technology that competes with its products, failure of Rockley’s customers to develop and commercialize their end products that incorporate Rockley’s products, Rockley’s inability to effectively manage production of its products to scale, Rockley’s inability to enter new markets or help its customers adopt Rockley’s products for new applications, and Rockley’s failure to attract new customers or expand orders from existing customers. Further, it is difficult to predict the size and growth rate of Rockley’s target markets, customer demand for its products, commercialization timelines, developments in silicon photonics technology, the entry of competitive products, or the success of existing competitive products and services. As a result, Rockley doesmay not expect to achieve profitability until 2023 at the earliest.profitability. If Rockley’s revenue does not grow over the short or long term, its ability to achieve and maintain profitability will be adversely affected, and the value of its business may significantly decrease.
Rockley expects its results of operations to fluctuate on a quarterly and annual basis, which could cause the Company’s sharestock price of Rockley to fluctuate or decline.
Rockley’s revenue and operating results have fluctuated in the past and may vary significantly in the future. Historical comparisons of its operating results may not be relevant, or indicative of future results. In particular, because Rockley’s revenue to date has been generated from NRE and development services for customer-specific designs of silicon photonics chipsets for testing in the customers’ end products, revenue in any given quarter or period can fluctuate based on the timing and success of its customers’ development projects. Accordingly, the results of any one quarter should not be relied upon as an indication of future performance. Rockley’s quarterly and annual financial results may fluctuate as a result of a variety of factors, many of which are outside of its control and may not fully reflect the underlying performance of Rockley’s business. These fluctuations could adversely affect
Rockley’s ability to meet its expectations or those of securities analysts, ratings agencies, or investors. If Rockley does not meet these expectations for any reporting period, the value of its business and its securities, could decline significantly. Factors that may cause these quarterly and annual fluctuations include, but are not limited to, those listed below:
•the timing and magnitude of NRE services revenue in any quarter;
•the timing and magnitude of operating expenses incurred, including research and development expenses;
•Rockley’s ability to meet product development roadmaps and timelines, which in turn may be impacted by resource constraints and must meet certain technical standards;
•the timing and degree of success of commercialization of Rockley’s products;
•Rockley’s ability to attract and retain customers and successfully transition customers with which it is engaged in discussions to contracted customers with whom it has MOUs or development and supply agreements and to attract new customers;
•changes in terms of customer agreements;
•the ability of Rockley’s customers to commercialize and achieve widespread market adoption of products incorporating Rockley’s products;
•the timing and magnitude of orders and shipments of Rockley’s products in any quarter;
•the mix of product sales and licensing arrangements in lieu of product sales;
•the actual timing and magnitude of sales returns and warranty claims of Rockley’s products in any quarter may differ from estimate;
•Rockley’s ability to develop, introduce, commercialize, manufacture, and ship in a timely manner products that meet customer requirements;
•disruptions in Rockley’s sales channels or termination of its relationships with key channel partners;
•customer demand and product life cycles;
•the receipt, reduction, or cancellation of, or changes in the forecasts or timing of, orders by customers;
•fluctuations in the levels of inventories held by distributors or end customers;
•the gain or loss of significant customers, including Rockley’s largest customer;
10
•fluctuations in sales by customers who incorporate Rockley’s products into their end products;
•cyclicality, seasonality, and the competitive landscape in Rockley’s target markets;
•fluctuations in manufacturing yields;
•changes in pricing, product cost, product volume, and product mix;
•sales of subscriptions to Rockley’s cloud-based analytics subscription service, if and when commercially launched, and in the future, the rate of renewal of subscriptions by existing customers, the extent the use of subscription offerings and related services is expanded under such subscriptions, and timing and magnitude of any such subscriptions which are not renewed;
•the mix of customers licensing the service on a subscription basis as compared to a perpetual license;
•the size, timing, and terms of its subscription agreements with new customers;
•supply chain disruptions, delays, shortages, and capacity limitations as a result of the
COVID-19
pandemic or other reasons;•the impact and duration of the global
COVID-19
pandemic;•the timing and rate of broader market adoption of consumer and medical devices utilizing Rockley’s products or technology across the consumer wearables, mobile device, and medical device sectors;
•changes in the competitive landscape in Rockley’s target markets, including industry consolidation, regulatory developments, and new market entrants;
•Rockley’s ability to effectively manage its third-party suppliers and manufacturing partners;
•changes in the source, cost, and availability of materials and components incorporated in Rockley’s products;
•adverse litigation, judgments, settlements or other litigation-related costs, or claims that may give rise to such costs;
•general economic, industry, and market conditions, including trade disputes; and
•Rockley’s forecastsestimates of potential or future market growth in this prospectus may not be accurate.
Rockley expects to incur significant research and development expenses and devote substantial resources to commercializing new products, which could increase its losses and negatively impact its ability to achieve or maintain profitability.
Rockley’s future growth depends on developing and commercializing its products, achieving widespread market adoption of its products, adapting existing products to new applications and customer requirements, and introducing new products to address changing customer and market demands. Rockley plans to incur substantial research and development expenses as part of its efforts to design, develop, manufacture, and commercialize new products and enhance existing products. Rockley’s research and development expenditures could increase its losses and adversely affect its results of operations in the future.
Further, Rockley’s research and development efforts may not be successful or result in additional revenue. This in turn would negatively impact Rockley’s ability to achieve or maintain profitability.
If Rockley is unable to manage its growth or expansion of operations, including in a cost-efficient manner, its business, operations, and financial condition, as well as its ability to scale its operations, could be materially and adversely affected.
Rockley’s ability to effectively manage its anticipated growth and expansion of operations and manage its transition to operating as a public company has and will alsocontinue to require itRockley to enhance its operational, financial, and management controls and infrastructure, human resources policies, and reporting systems. These enhancements and improvements will require significant capital expenditures, investments in additional headcount and other operating expenditures, and allocation of valuable management and employee resources. Rockley’s future financial performance and ability to execute on its business plan will depend, in part, on its ability to effectively manage any future growth and expansion. Rockley may be unable to effectively manage any future growth or
expansion in an efficient or timely manner. Further, Rockley may not be able to implement improvements in an efficient or timely manner and may discover deficiencies in existing controls, programs, systems, and procedures, which could have an adverse effect on its business, reputation, and financial results.
Market opportunity estimates and growth forecasts included in this prospectus are subject to significant uncertainty and are based on assumptions and estimates that may not prove to be accurate.
The forecasts and estimates in this prospectus relating to the expected size and growth of the markets for consumer wearables, mobile devices, and medical devices may prove to be inaccurate. Even if these markets experience the forecasted growth described in this prospectus Rockley may not grow its business at similar rates, or at all. Rockley’s future growth is subject to many factors, including market adoption of its products, which is subject to many risks and uncertainties. Accordingly, the forecasts and estimates of market size and growth described in this prospectus, including Rockley’s estimates that the consumer wearables, mobile device, and medical devices markets will represent, in the aggregate, an approximately over $48 billion of total addressable market for healthcare monitoring devices incorporating additional sensing capabilities by 2025, should not be taken as indicative of Rockley’s future growth. In addition, these forecasts may be materially and adversely affected as a result of thepandemic.
COVID-19 pandemic.
If Rockley is unable to accurately forecast long-term
end-customer
adoption rates and demand for Rockley’s products, it could materially and adversely affect its current and future financial results of operations.Rockley is pursuing opportunities in markets that are undergoing rapid changes, including technological and regulatory changes, and it is difficult to predict the timing and size of the opportunities. For example, consumer health and wellness applications and healthcare monitoring devices require complex technology. Because these products may incorporate technology from other companies, commercialization of these products could be delayed or impaired on account of certain technological components of Rockley or others not
11
being ready to be deployed. Although Rockley currently has MOUs or development and supply agreements with various consumer and medical device companies, these companies may not be able to commercialize products incorporating Rockley’s products immediately, or at all. Regulatory developments, many of which are outside of Rockley’s control, could also cause delays or otherwise impair commercial adoption of these products. Rockley’s future financial performance will depend on its ability to make timely investments in the correct market opportunities. Given the evolving nature of the markets in which Rockley operates in, it is difficult to predict customer demand or adoption rates for its products or the future growth of the markets in which it operates. As a result, the Company’s anticipated financial resultsRockley’s estimates included in this prospectus may not necessarily reflect various estimates and assumptions that may not prove accurate and these anticipated resultsany such estimates could differ materially from actual results due to the risks included in this “Risk FactorsRisks Related to Rockley’s Business and Industry” section, among others. If demand does not develop or if Rockley cannot accurately forecast customer demand, the size of its markets, inventory requirements, or its future financial results, its business, results of operations, and financial condition will be adversely affected.
Rockley’s target customer and product markets may not grow or develop as Rockley currently expects, and if Rockley fails to penetrate new markets and scale successfully within those markets, Rockley’s revenue and financial condition would be harmed.
Rockley’s future revenue growth, if any, will depend in part on Rockley’s ability to penetrate Rockley’s current target markets, and to enter emerging markets, such as the market for consumer healthcare monitoring devices and predictive analytics. Meeting the technical requirements and securing design wins in any of these new markets will require a substantial investment of Rockley’s time and resources. Rockley may not secure design wins from these or other new markets, or achieve meaningful revenue from sales in these markets. If any of these markets do not develop as Rockley currently anticipates or if Rockley is unable to penetrate and scale them successfully, it may adversely affect Rockley’s ability to grow its business.
Rockley’s target markets are characterized by rapid technological change, which requires Rockley to continue to develop new products and technology innovations and could adversely affect market adoption of its products.
Rapid technological changes in the markets for sensing technology, including the consumer wearables, mobile device, and medical device markets, could adversely affect adoption of Rockley’s products, either generally or for particular applications. Rockley’s future success will depend upon its ability to develop and introduce a variety of new capabilities and innovations to its products, as well as introduce new products, to address the changing needs of its target markets. Delays in delivering new products that meet customers’ requirements could damage Rockley’s relationships with its customers and lead them to seek alternative sources of supply. Further, the introduction of new products by Rockley’s competitors, the delay or cancellation of any of Rockley’s customers’ end products into which Rockley’s products are designed, the market acceptance of products based on new or alternative technologies, or the emergence of new industry standards could render Rockley’s existing or future products uncompetitive, obsolete, and/or otherwise unmarketable.
In addition, Rockley’s success to date has been based on the delivery of prototypes and services to research and development programs in which customers are investing substantial capital to develop new products. Delays in introducing products and innovations, the failure to choose correctly among technical alternatives, or the failure to offer innovative products at competitive prices may cause existing and potential customers to purchase Rockley’s competitors’ products or turn to alternative sensing technology. If Rockley is unable to successfully develop products that meet changing customer or market requirements on a timely basis or that remain competitive with technological alternatives, its products may fail to achieve commercial adoption, its revenue will decline, it may experience operating losses, and its business and prospects will be adversely affected.
Rockley may be unable to make the substantial investments that are required to remain competitive.
The silicon photonics industry requires substantial and continuous investment in research and development in order to bring to market new and enhanced solutions. Rockley expects its research and development expenditures to increase in the future as part of its strategy to increase demand for Rockley’s solutions in Rockley’s current target markets and to expand into additional markets. Rockley may not have sufficient resources to maintain the level of investment in research and development required to remain competitive. In addition, Rockley cannot assure you that the technologies that are the focus of its research and development expenditures will become commercially successful or generate any revenue.
If Rockley fails to compete effectively, it may lose or fail to gain market share, which could negatively impact Rockley’s operating results and Rockley’s business.
The global optical components market in general, and the consumer sensor, healthcare, and data communications markets in particular, are highly competitive. Rockley expects competition to increase and intensify as additional companies enter Rockley’s target markets. Increased competition could result in price pressure, reduced gross margins, and difficulty achieving market penetration, any of which could harm Rockley’s business, financial condition, and results of operations. Rockley’s competitors range from large, international companies offering a wide range of services and optical components, such as LEDs, lasers, detectors, or photonic integrated circuit (“PICs”), to smaller companies specializing in narrow market verticals. Some of Rockley’s key
competitors across various verticals include: ams AG, (“AMS”), Analog Devices, Inc. (“ADI”), Broadcom Inc. (“Broadcom”), Brolis Semiconductors (“Brolis”), Cisco Systems,DexCom, Inc. (“Cisco”), GlobalFoundries Inc. (“GlobalFoundries”), Intel Corporation, (“Intel”),Lightwave Logic, Inc. Lumentum Holdings Inc. (“Lumentum”), Maxim Integrated Products Inc. (“Maxim”),Masimo Corporation, Osram Licht AG, (“OSRAM”), Taiwan Semiconductor Manufacturing Company, Limited (“TSMC”), and Tower Semiconductor Ltd. (“Tower Jazz”). Rockley expects competition in its target markets to increase in the future as existing competitors improve or expand their product offerings and as new competitors enter these markets.
12
Rockley’s ability to compete successfully depends, in part, on factors that are outside of its control, including industry and general economic trends. Rockley’s ability to compete successfully will depend on a number of factors, including its ability to:
•define, design, and regularly introduce new products that anticipate the functionality and integration needs of Rockley’s customers’ next- generationnext-generation products and applications;
•build strong and long-lasting relationships with Rockley’s customers and other industry participants;
•cost-effectively develop and commercialize products which compete favorably with competitors’ products;
•achieve design wins;
•accurately estimate the effectiveness and success of Rockley’s customers’ end products incorporating Rockley’s products in their competitive end markets;
•expand its research and development capabilities to provide innovative solutions and maintain Rockley’s product roadmap;
•strengthen its sales and marketing efforts, brand awareness and reputation;
•deliver products in volume on a timely basis at competitive prices;
•withstand or respond to significant price competition;
•build and expand international operations in a cost-effective manner;
•obtain, maintain, protect, and enforce Rockley’s intellectual property rights;
•defend potential patent infringement claims arising from third parties;
•promote and support Rockley’s customers’ incorporation of Rockley’s products into their end products; and
•attract, hire, and retain high-level talent, including Rockley’s management team and engineers.
Rockley’s competitors may also establish cooperative relationships among themselves or with third parties or may acquire companies that provide similar products to Rockley’s. As a result, new competitors or alliances may emerge that could capture significant market share. Any of these factors, alone or in combination with others, could harm Rockley’s business, financial condition, and results of operations and result in a loss of market share and an increase in pricing pressure.
Rockley may pursue strategic investments or acquisitions in the future. If Rockley fails to successfully select, execute, or integrate its acquisitions, then its business, results of operations, and financial condition could be materially and adversely affected, and the Company’ s sharestock price could decline.
From time to time, Rockley may pursue investments or acquisitions to add new products and technologies, acquire talent, gain new sales channels, or enter into new markets or sales territories. In addition to possible shareholder approval, Rockley may need approvals and licenses from relevant government authorities for the acquisitions and to comply with any applicable laws and regulations, which could result in increased delay and costs. Furthermore, acquisitions and the subsequent integration of new assets, businesses, key talent, customers,
vendors, and suppliers require significant attention from Rockley’s management and could result in a diversion of resources from Rockley’s existing business, which in turn could have an adverse effect on Rockley’s operations. Acquired assets or businesses may not generate the financial results Rockley expects. Acquisitions could result in the use of substantial amounts of cash, potentially dilutive issuances of equity securities, the occurrence of significant goodwill impairment charges, amortization expenses for other intangible assets, and exposure to potential unknown liabilities of the acquired business. Moreover, the costs of identifying and consummating acquisitions may be significant.
Failure to successfully identify, complete, manage, and integrate acquisitions could materially and adversely affect its business, financial condition, and results of operations and could cause the Company’s shareRockley’s stock price to decline.
Rockley’s international operations expose it to operational, financial, and regulatory risks, including possible unfavorable regulatory, political, tax, and labor conditions, which could harm Rockley’s business.
Rockley is committed to growing its international sales, and while it has committed resources to expanding its international operations and sales channels, these efforts may not be successful. InternationalWe have significant international operations that are denominated in foreign currencies, primarily the British Pound and Euro, subjecting us to foreign currency exchange risk that may adversely impact our financial results. In addition, our international operations are subject to a number of other risks, including:
•foreign currency fluctuations, which could result in increased operating expenses and reduced revenue;
•political and economic instability, international terrorism, and anti-American or British sentiment, particularly in emerging markets;
•disadvantages of competing against companies from countries that are not subject to U.S. and U.K. laws and regulations, including the Foreign Corrupt Practices Act, Office of Foreign Assets Control regulations, and U.S. anti-money laundering regulations, as well as exposure of Rockley’s foreign operations to liability under these regulatory regimes;
•preference for locally branded products, and laws and business practices favoring local competition;
•potential consequences of, and uncertainty related to, the “Brexit” process in the United Kingdom, which could lead to additional expense and complexity in doing business there;
•less effective protection of intellectual property;
•stringent regulation of the end products incorporating Rockley’s products and stringent consumer protection and product compliance regulations, including but not limited to General Data Protection Regulation in the European Union, European
13
competition law, the Restriction of Hazardous Substances Directive, the Waste Electrical and Electronic Equipment Directive, and the European Ecodesign Directive that are costly to comply with and may vary from country to country;
•difficulties and costs of staffing and managing foreign operations;
•foreign taxes, including withholding of payroll taxes; and
•the U.S. government’s and U.K. government’s restrictions on certain technology transfer to certain countries of concern.
The average selling prices of Rockley’s products could decrease rapidly over the life of the product, which may negatively affect Rockley’s revenue and margins. In addition, the selling prices Rockley is able to ultimately charge in the future for the products it is currently developing or commercializing may be less than what Rockley currently anticipates, which may cause Rockley’s actual operating results to differ materially from its expectations.
The prices that Rockley is able to ultimately charge in the future for the products it is currently developing or commercializing may experience declines for a variety of reasons, many of which are outside of Rockley’s control. In order to sell products that have a falling average unit selling price and maintain margins at the same time, Rockley will need to continually reduce product and manufacturing costs. To manage manufacturing costs, Rockley must engineer the most cost-effective design for its products and collaborate with its manufacturing counterparties to reduce manufacturing costs. Rockley also needs to continually introduce new products with higher sales prices and gross margin in order to maintain its overall gross margin. If Rockley is unable to manage the cost of older products or successfully introduce new products with higher gross margin, its revenue and overall gross margin would likely decline. In addition, the selling prices Rockley is able to ultimately charge in the future for the products it is currently developing or commercializing may be less than what Rockley currently projects, which may cause Rockley’s actual operating results to differ materially from its expectations.
estimates.Rockley’s gross margins may fluctuate due to a variety of factors, which could negatively impact Rockley’s results of operations and Rockley’s financial condition.
Rockley’s gross margins may fluctuate due to a number of factors, including customer and product mix, market acceptance of Rockley’s new products, yield, wafer pricing, packaging and testing costs, competitive pricing dynamics, the impact of the
COVID-19
pandemic, and geographic and market pricing strategies. To the extent Rockley may offer certain customers favorable prices, it would decrease Rockley’s average selling prices and likely impact gross margins. Further, Rockley may in the future offer pricing incentives to Rockley’s customers on earlier generations of products that inherently have a higher cost structure, which would negatively affect Rockley’s gross margins. In addition, in the event Rockley’s customers, including Rockley’s larger customers, exert more pressure with respect to pricing and other terms, it could put downward pressure on Rockley’s margins.Because Rockley does not operate its own manufacturing, assembly, or testing facilities, it may not be able to reduce its costs as rapidly as companies that operate their own facilities, and Rockley’s costs may even increase, which could further reduce Rockley’s gross margins. Rockley relies primarily on obtaining yield improvements and volume-based cost reductions to drive cost reductions. To the extent that such cost reductions do not occur at a sufficient level and in a timely manner, Rockley’s business, financial condition, and results of operations could be adversely affected and may vary from Rockley’s estimates.
In addition, Rockley may in the future maintain an inventory of Rockley’s products at various stages of production and in finished goods inventory. Rockley will hold these inventories in anticipation of customer orders. If those customer orders do not materialize in a timely manner, Rockley may have excess or obsolete inventory which Rockley would have to reserve or write-down, and Rockley’s gross margins would be adversely affected.
Because some of the raw materials and key components in its products come from limited or single source suppliers, Rockley is susceptible to supply shortages, long lead times for components, and supply changes, including as a result of industry consolidation, any of which could disrupt its supply chain and could delay deliveries of its products to customers, which could adversely affect Rockley’s business, results of operations, and financial condition.
Some of the components used in the manufacturing of Rockley’s products are sourced from third-party suppliers. To date, Rockley has produced its products in relatively limited quantities for use in products.products of Rockley’s customers. Rockley
does not have extensive experience in managing its supply chain to manufacture and deliver its products at scale. Some of the key components used to manufacture Rockley’s products come from limited or single source suppliers. Rockley is therefore subject to the risk of shortages and long lead times in the supply of these components and the risk that its suppliers discontinue or modify components used in its products. Rockley has a global supply chain and thecost effectivecost-effective manner from its third-party suppliers due to, among other things, work stoppages or interruptions. For example, Rockley relies on third-party foundries to manufacture its silicon photonic integrated circuits and for wafer scale integration. Any disruptions to those foundries could materially and adversely affect Rockley’s ability to manufacture its products. In addition, the lead times associated with certain components are lengthy and preclude rapid changes in quantities and delivery schedules. Rockley has in the past experienced and may in the future experience component shortages and price fluctuations of certain key components and materials, and the predictability of the availability and pricing of these components may be limited. In the event of a component shortage, supply interruption or material pricing change from suppliers of these components, Rockley may not be able to develop alternate sources in a timely manner or at all in the case of sole or limited sources. These risks may be exacerbated if any of Rockley’s suppliers were to cease operations or be acquired by a third party. If this were to occur, Rockley may need to
COVID-19
pandemic and other health epidemics and outbreaks may adversely affect its ability to source components in a timely or re-qualify
the supplier and/or otherwise confirm that such an event would not cause concerns with Rockley’s end customers or otherwise negatively impact Rockley’s relationships with its end customers. Developing alternate sources of supply for these components may be time-consuming, difficult, and costly and Rockley may not be able to source these components on terms14
that are acceptable to it, or at all, which may undermine Rockley’s ability to meet its requirements or to fill customer orders in a timely manner. Any interruption or delay in the supply of any of these parts or components, or the inability to obtain these parts or components from alternate sources at acceptable prices and within a reasonable amount of time, would adversely affect Rockley’s ability to meet its scheduled product deliveries to its customers. This could adversely affect Rockley’s relationships with its customers and channel partners and could cause delays in shipment of its products and adversely affect its operating results. In addition, increased component costs could result in lower gross margins. Even where Rockley is able to pass increased component costs along to its customers, there may be a lapse of time before it is able to do so such that Rockley must absorb the increased cost. If Rockley is unable to buy these components in quantities sufficient to meet its requirements on a timely basis, it will not be able to deliver products to its customers. This in turn could materially and adversely affect Rockley’s business, financial condition, and results of operations.
If the foundries with which Rockley contracts do not achieve satisfactory yields or quality, Rockley’s reputation and customer relationships could be harmed.
Rockley depends on satisfactory wafer foundry manufacturing capacity, wafer prices, and production yields, as well as timely wafer delivery, to meet customer demand and enable it to maintain gross margins. The fabrication of Rockley’s products is a complex and technically demanding process. Minor deviations in the manufacturing process can cause substantial decreases in yields and, in some cases, cause production to be suspended. Rockley’s foundry vendors may experience manufacturing defects and reduced manufacturing yields from time to time. Further, any new foundry vendors Rockley employs, whether due to industry consolidation, customer requirements, or otherwise, may present additional and unexpected manufacturing challenges that could require significant management time and focus. Changes in manufacturing processes or the inadvertent use of defective or contaminated materials by the foundries that Rockley employs could result in lower than anticipated production yields or unacceptable performance of Rockley’s products. Many of these problems are difficult to detect at an early stage of the manufacturing process and may be time-consuming and expensive to correct. Poor production yields from the foundries that Rockley employs, or defects, integration issues, or other performance problems in Rockley’s products could significantly harm Rockley’s customer relationships and financial results, and give rise to financial or other damages to Rockley’s customers. Any product liability claim brought against Rockley, even if unsuccessful, would likely be time-consuming and costly to defend.
Manufacturing yields for new products initially tend to be lower as Rockley completes product development and commence volume manufacturing, and typically increase as Rockley brings the product to full production. While Rockley’s business model includes this assumption of improving manufacturing yields its assumptions may be incorrect and, as a result, material variances between projected and actual manufacturing yields will have a direct effect on Rockley’s gross margin and profitability. The difficulty of accurately forecasting manufacturing yields and maintaining cost competitiveness through improving manufacturing yields will continue to be magnified by the increasing process complexity of manufacturing silicon photonics products.
Raw material price fluctuations can increase the cost of Rockley’s products, impact Rockley’s ability to meet customer commitments, and may adversely affect its results of operations.
The cost of raw materials is a key element in the cost of Rockley’s products. Rockley’s inability to offset material price inflation through increased prices to customers, suppliers, productivity actions, or through commodity hedges could adversely affect Rockley’s results of operations. Many major components, product equipment items, and raw materials are procured or subcontracted on a single or sole-source basis. Although Rockley maintains a qualification and performance surveillance process and Rockley believes that sources of supply for raw materials and components are generally adequate, it is difficult to predict what effects shortages or price increases may have in the future. Rockley’s inability to fill its supply needs would jeopardize its ability to fulfill its contractual obligations, which could, in turn, result in reduced revenue, contract penalties or terminations, and damage to Rockley’s customer relationships.
Furthermore, increases in the price of wafers, testing costs, and commodities, which may result in increased production costs, mainly assembly and packaging costs, may result in a decrease in Rockley’s gross margins. Moreover, Rockley’s suppliers may pass the increase in raw materials and commodity costs onto it which would further reduce the gross margin of Rockley’s products. In addition, as Rockley is a fabless company, global market trends such as a shortage of capacity to fulfill Rockley’s fabrication needs also may increase Rockley’s raw material costs and thus decrease its gross margin.
Rockley is subject to the cyclical nature of the semiconductor industry.
The semiconductor industry is highly cyclical and is characterized by constant and rapid technological change, rapid product obsolescence, price erosion, evolving standards, short product life cycles, industry consolidation, and wide fluctuations in product supply and demand. The industry experienced significant downturns during past global recessions. These downturns have been characterized by diminished product demand, production overcapacity, high inventory levels, and accelerated erosion of average selling prices. While these downturns have not directly impacted Rockley’s business to date, any prolonged or significant downturn in the semiconductor industry could adversely affect Rockley’s business and reduce demand for Rockley’s products. Any future downturns in the semiconductor industry could also harm Rockley’s business, financial condition, and results of operations. Furthermore, any significant upturn in the semiconductor industry could result in increased competition for access to third-party foundry and assembly capacity. Rockley is dependent on the availability of this capacity to manufacture and assemble Rockley’s products and Rockley can provide no assurance that adequate capacity will be available to it in the future.
If Rockley or its suppliers do not maintain sufficient inventory or if they do not adequately manage their respective inventory, Rockley could lose sales or incur higher inventory-related expenses, which could negatively affect Rockley’s operating results.
To ensure adequate inventory supply, Rockley and its suppliers must forecast inventory needs and expenses, place orders sufficiently in advance with their respective suppliers and manufacturing counterparties, and manufacture products based on its estimates of future demand for particular products. Changes in customer purchasing patterns may affect Rockley’s ability to forecast its future operating results, including revenue, gross margins, cash flows, and profitability. Rockley’s ability to accurately forecast demand for its products could be
15
be affected by many factors, including the growth rate, if any, in Rockley’s target markets or the market adoption of the end products into which Rockley’s products are incorporated, the emergence of new markets, an increase or decrease in customer demand for Rockley’s products or for products and services of its competitors, product introductions by competitors, the
COVID-19
pandemic, other health epidemics and outbreaks, and any associated work stoppages or interruptions, unanticipated changes in general market conditions, and the weakening of economic conditions or consumer confidence in future economic conditions. If Rockley’s products are commercialized in markets that are quickly growing, including the consumer wearables, mobile device, and medical device markets, Rockley may face challenges acquiring adequate supplies to manufacture its products and/or Rockley and its manufacturing counterparties may not be able to manufacture its products at a rate necessary to satisfy the levels of demand, which would negatively affect Rockley’s revenue. This risk may be exacerbated by the fact that Rockley may not carry or be able to obtain for its manufacturers a significant amount of inventory to satisfy short-term demand increases. If it fails to accurately forecast customer demand, Rockley may experience excess inventory levels or a shortage of products available for sale.Inventory levels in excess of customer demand may result in inventory write-downs or write-offs and the sale of excess inventory at discounted prices, which would adversely affect Rockley’s financial results, including its gross margin, and have a negative effect on its brand. Conversely, if Rockley underestimates customer demand for its products, Rockley, or its manufacturing counterparties, may not be able to deliver products to meet its requirements, and this could result in damage to Rockley’s brand and customer relationships and adversely affect its revenue and operating results.
If Rockley’s products do not conform to, or are not compatible with, existing or emerging industry standards, demand for Rockley’s products may decrease, which in turn would harm Rockley’s business and operating results.
Rockley’s ability to compete in the future will depend on its ability to identify and ensure compliance with evolving industry standards in its target markets, as well as in the silicon photonics and sensing technology industry generally. The emergence of new industry standards could render Rockley’s products incompatible with products developed by third-party suppliers or make it difficult for Rockley’s products to meet the requirements of certain device manufacturers and their suppliers. If Rockley’s customers or Rockley’s third-party suppliers adopt new or competing industry standards with which Rockley’s solutions are not compatible, or if industry groups fail to adopt standards with which Rockley’s products are compatible, Rockley’s products would become less desirable to its current or prospective customers. As a result, Rockley’s sales would suffer and it could be required to make significant expenditures to develop new products. Although Rockley designs its products to be compliant with applicable industry standards, proprietary enhancements may not in the future result in conformance with existing industry standards under all circumstances. If Rockley’s products do not conform to, or are not compatible with, existing or emerging standards, it would harm its business, financial condition, and results of operations.
Rockley may be subject to warranty or product liability claims, which could result in unexpected expenses and loss of market share.
Rockley may be subject to warranty or product liability claims. These claims may require Rockley to make significant expenditures to defend those claims, replace Rockley’s solutions, refund payments, or pay damage awards. Rockley has not yet commercialized its products. Accordingly, the operation of Rockley’s products and technology has not been validated over longer periods. If a customer’s end product fails in use, the customer may incur significant monetary damages, including a product recall or associated replacement expenses as well as lost revenue. The customer may claim that a defect in Rockley’s product caused the product failure and assert a claim against Rockley to recover monetary damages. The cost of defending these claims and satisfying any arbitration award or judgment with respect to these claims would result in unexpected expenses, which could be substantial, and could harm Rockley’s business, financial condition, and results of operations. Although Rockley carries product liability insurance, this insurance is subject to significant deductibles and may not adequately cover Rockley’s costs arising from defects in its products or otherwise.
The complexity of Rockley’s products and its anticipated future product and service offerings could result in unforeseen delays or expenses from undetected defects, errors, or reliability issues in hardware or software that could reduce the market adoption of its new products, damage its reputation with current or prospective customers, and adversely affect its operating costs.
Rockley’s current and future products and service offerings are or are expected to be highly technical and very complex and require high standards to manufacture or distribute and have in the past and will likely in the future experience defects, errors, or reliability issues at various stages of development. Rockley may be unable to timely release new products, product updates, manufacture existing products, correct problems that have arisen, or correct such problems to its customers’ satisfaction. Additionally, undetected errors, defects, or security vulnerabilities, especially as new products or updates are introduced or as new versions are released, could result in inaccurate data to the end users of products incorporating Rockley’s products. Any of the foregoing could negatively impact Rockley’s ability to commercialize a product or service offering, result in litigation against Rockley, and damage Rockley’s credibility. These risks may be heightened in the medical device industry, one of Rockley’s target markets, where the end user may act in reliance upon inaccurate data as a result of errors or defects, or where there may be a privacy or data breach of an end user’s personal health information. Some errors or defects in Rockley’s products and service offerings may only be discovered after they have been tested, commercialized, and deployed by customers. In these cases, Rockley may incur significant additional development costs and product recall, repair, or replacement costs. These problems may also result in claims, including class actions, against Rockley by its customers or others. Rockley’s reputation or brand may be damaged as a result of these problems and customers may be reluctant to buy its products, which could adversely affect its ability to retain existing customers and attract new customers and could adversely affect its financial results.
In addition to product liability claims, Rockley could face material legal claims for breach of contract, fraud, tort, or breach of warranty as a result of these problems. Defending a lawsuit, regardless of its merit, could be costly and may divert management’s attention and adversely affect the market’s perception of Rockley and its products. In addition, Rockley’s business liability insurance coverage could prove inadequate with respect to a claim and future coverage may be unavailable on acceptable terms or at all. These product-related issues could result in claims against Rockley and its business could be adversely affected.
16
Rockley currently expects to recognize subscription revenue from its future cloud-based analytics subscription offering ratably over the term of these subscriptions and, to a lesser extent, perpetual licenses ratably over an expected period of benefit and, as a result, downturns in sales may not be immediately reflected in its operating results.
If Rockley is able to commercially launch its cloud-based analytics subscription service, which is currently expected to occur as early as 2023, it expects to recognize revenue ratably over the terms of its subscriptions with customers. As a result, a substantial portion of the revenue that it will report in each period will be derived from the recognition of deferred revenue relating to agreements entered into during previous periods. Consequently, a decline in new sales or renewals in any one period may not be immediately reflected in its revenue results for that period. This decline, however, will negatively affect its revenue in future periods. Accordingly, the effect of significant downturns in sales and market acceptance of its subscription service and potential changes in the rate of renewals may not be fully reflected in its results of operations until future periods. This will also make it difficult for Rockley to rapidly increase revenue growth through additional sales in any period, as revenue from new customers generally will be recognized over the term of the applicable agreement. Rockley may be unable to commercially launch its subscription service offering in a timely manner or at all and such subscription offering may not achieve widespread customer adoption.
Any decline in customer renewals, terminations, or failure to convince customers to use Rockley’s cloud-based analytics subscription service would harm its business, results of operations, and financial condition.
The rate at which Rockley’s customers purchase subscriptions to its cloud-based analytics service will depend on a number of factors, including the perceived value of the service. Rockley anticipates that its subscription offerings for enterprise customers will range from one to two years subject to renewal terms. Rockley’s ability to grow revenue from its cloud-based analytics subscription offering, if and when commercially launched, will depend on a significant percentage of customer renewals when the then-existing subscription terms expire, as well as renewals on the same or more favorable terms. Customers will have no obligation to renew their subscriptions, and Rockley may not be able to accurately predict customer renewal rates. The growth of Rockley’s business will depend in part on its customers adopting and expanding their use of Rockley’s cloud-based analytics subscription offering and related services. If Rockley’s customers do not maintain or renew their subscriptions or renew on less favorable terms, Rockley’s future business prospects and growth opportunities may suffer.
If Rockley’s future platform offerings do not interoperate with its customers’ network and security infrastructure or with third-party products, websites, or services, it would negatively impact its business and results of operations.
Rockley’s cloud-based analytics subscription offering, which is under development and is currently expected to be commercially launched as early as 2023, is expected to allow for the deployment of Rockley’s technology through a cloud-basedmodel. As a result, it must interoperate with Rockley’s customers’ existing network and security infrastructure. The components of Rockley’s customers’ infrastructure have different specifications, rapidly evolve, utilize multiple protocol standards, include multiple versions and generations of products, and may be highly customized. Rockley must be able to interoperate and provide its software service to customers with highly complex and customized networks, which requires careful planning and execution between its customers, its customer support teams, and its channel partners. Further, whenever there are new or updated elements of the customers’ infrastructure or new industry standards or protocols, Rockley may have to update or enhance its cloud platform to continue to provide service to customers. Rockley’s competitors or other vendors may refuse to work with Rockley to allow their products to interoperate with Rockley’s, which could make it difficult for Rockley’s cloud-based analytics subscription service to function properly in customer networks that include these third-party products.
software-as-a-service
Rockley may not deliver or maintain interoperability quickly or cost-effectively, or at all. If Rockley fails to maintain compatibility of its cloud- basedcloud-based analytics subscription service with its customers’ network and security infrastructures, its customers may not be able to fully utilize the service, and Rockley may, among other consequences, fail to achieve widespread customer adoption of this subscription service and experience reduced demand for its products and services, which would materially harm its business, operating results, and financial condition.
Rockley licenses technology from third parties, and its inability to maintain those licenses could harm its business.
Rockley incorporates technology that it licenses from third parties, including software, into its software subscriptions. Rockley cannot be certain that its licensors are not infringing the intellectual property rights of third parties or that its licensors have sufficient rights to the licensed intellectual property in all jurisdictions in which Rockley may sell its software subscriptions. In addition, some licenses may be
non-exclusive,
and therefore its competitors may have access to the same technology licensed to Rockley. Some of Rockley’s license agreements may be terminated for convenience by the licensors. Rockley may also be subject to additional fees or be required to obtain new licenses if any of its licensors allege that Rockley has not properly paid for such licenses or that it has improperly used the technologies under such licenses, and such licenses may not be available on terms acceptable to Rockley or at all. If Rockley is unable to continue to license any of thistechnology because of intellectual property infringement claims brought by third parties against its licensors or against it, or claims against Rockley by its licensors, or if Rockley is unable to continue its license agreements or enter into new licenses on commercially reasonable terms, its ability to develop and sell software subscriptions containing such technology would be severely limited, and its business could be harmed. Additionally, if Rockley is unable to license necessary technology from third parties, it may be forced to acquire or develop alternative technology, which it may be unable to do in a commercially feasible manner or at all, and Rockley may be required to use alternative technology of lower quality or performance standards. This would limit and delay its ability to offer new or competitive software subscriptions and increase its costs of production. As a result, Rockley’s margins, market share, and operating results could be significantly harmed.
Portions of Rockley’s cloud-based analytics subscription offering utilize open-source software, and any failure to comply with the terms of one or more of these open source licenses could negatively affect its business.
17
Rockley’s cloud-based analytics subscription offering contains software made available by third parties under“open “open source” licenses. From time to time, there have been claims against companies that distribute or use open-sourceopen source software in their products and services, asserting that such open source software infringes the claimants’ intellectual property rights. Rockley could be subject to suits by parties claiming that what Rockley believes to be licensed open-sourceopen source software infringes their intellectual property rights. Use and distribution of open-sourceopen source software may entail greater risks than use of third-party commercial software, as open source licensors generally do not provide warranties or other contractual protections regarding infringement claims or the quality of the code. In addition, certain open-sourceopen source licenses require that source code for software programs that are subject to the license be made available to the public and that any modifications or derivative works to such open source software continue to be licensed under the same terms. Further, certain open-sourceopen source licenses also include a provision that if Rockley enforces any patents against the software programs that are subject to the license, it will lose the license to such software. If Rockley were to fail to comply with the terms of such open-sourceopen source software licenses, such failures could result in costly litigation, lead to negative public relations, or require that it quickly find replacement software which may be difficult to accomplish in a timely manner.
so-called
Although Rockley monitors its use of open source software in an effort both to comply with the terms of the applicable open source licenses and to avoid subjecting its software to conditions it does not intend, the terms of many open source licenses have not been interpreted by U.S. or international courts, and there is a risk that these licenses could be construed in a way that could impose unanticipated conditions or restrictions on its ability to commercialize its product or operate its business. By the terms of certain open-sourceopen source licenses, Rockley could be required to release the source code of its software and to make its proprietary software available under open source licenses, if Rockley combines or distributes its software with open source software in a certain manner. In the event that portions of its software are determined to be subject to an open-sourceopen source license, Rockley could be required to publicly release the affected portions of its source code,open-sourceopen source software cannot be eliminated, and could negatively affect its business, results of operations, and financial condition.
re-engineer
all, or a portion of, that software or otherwise be limited in the licensing of its software, each of which could reduce or eliminate the value of its product. Many of the risks associated with usage of Risks Related to Rockley’s Debt Financings
Rockley is subject to restrictive debt covenants that may limit its ability to finance its future operations and capital needs and to pursue business opportunities and activities.
The Indenture imposes significant operating and financial restrictions on us and our subsidiaries. These restrictions limit us and our subsidiaries’ ability, among other things, to:
◦issue ordinary shares or other securities convertible or exercisable into ordinary shares;
◦incur additional indebtedness or issue certain disqualified stock and preferred stock;
◦place restrictions on the ability of us to make dividends and our subsidiaries to pay dividends or make other payments to us;
◦enter into agreements limiting subsidiary distributions;
◦redeem or repurchase equity securities;
◦prepay subordinated indebtedness;
◦make certain investments, including acquisitions;
◦engage in transactions with affiliates;
◦sell certain assets or merge with or into other companies;
◦guarantee indebtedness; and
◦create liens.
In addition, the Indenture requires us to pledge at all times at least $20.0 million of cash and cash equivalents to secure the Notes, which requirement further limits our liquidity position.
As a result of these covenants and restrictions, we may be limited in how we conduct our business and we may be unable to raise additional debt or equity financing to pursue our business plan or otherwise compete effectively or to take advantage of new business opportunities. The terms of any future indebtedness we may incur could include more restrictive covenants, including on us and/or our subsidiaries. There is no assurance that we will be able to maintain compliance with these covenants in the future and, if we fail to do so, that we will be able to obtain waivers from the holders of the Notes and/or amend the covenants.
These restrictions may significantly limit Rockley’s ability to operate its businesses and may prohibit or limit its activity to enhance its operations or take advantage of potential business opportunities as they arise. All of these limitations are subject to significant exceptions and qualifications. These covenants could limit Rockley’s ability to finance its future operations and capital needs and its ability to pursue business opportunities and activities that may be in its interest. If Rockley breaches any of these covenants, it would be in default under its indebtedness, which may then become immediately due and payable. In addition, Rockley will become subject to significant penalties if it fails to meet its obligations under the financing documents relating to the Notes and the 144A Warrants, including the Registration Rights Agreement. Rockley may not have, or be able to obtain, sufficient funds to make these accelerated or penalty payments. Rockley’s ability to comply with the provisions of its financing arrangements may be affected by changes in economic or business conditions or other events beyond its control. These restrictions and covenants, or our failure to maintain compliance with them, would materially and adversely affect our business, results of operations, financial condition, and our growth prospects.
We have a significant number of securities outstanding that can be converted into, or exercised for, ordinary shares and certain of our outstanding warrants contain anti-dilution protection, all which may cause significant dilution to our shareholders, have a material adverse impact on the market price of our ordinary shares and make it more difficult for us to raise funds through future equity offerings.
18
As of June 30, 2022, we had outstanding 129,910,925 ordinary shares. As of that date, we had outstanding Notes convertible into 26,461,038 ordinary shares (excluding any ordinary shares which may be issued in connection with interest make-whole payment, to the extent we issue such ordinary shares, it will result in additional dilution and could cause our stock price to decline) and 144A Warrants exercisable into an aggregate of 26,461,038 ordinary shares, and we have granted the selling shareholders the Overallotment Option to purchase Additional Notes and Additional 144A Warrants convertible or exercisable into ordinary shares in connection with the private placement financing. The issuance of ordinary shares upon the conversion or exercise of these securities would dilute the percentage ownership interest of all shareholders, might dilute the book value per share of our ordinary shares and would increase the number of our publicly traded shares, which could depress the market price of our ordinary shares. Our 144A Warrants contain a ratchet anti-dilution provision which, subject to limited exceptions, would reduce the exercise price of such securities (and increase the number of shares issuable) in the event that we in the future issue ordinary shares, or securities convertible into or exercisable to purchase ordinary shares, at price per share lower than the exercise price then in effect, to such lower price. Our outstanding 144A Warrants are currently exercisable to acquire an aggregate of 26,461,038 ordinary shares at an exercise price of $5.00 per share. This ratchet anti-dilution provision would be triggered by the future issuance by us of ordinary shares or ordinary share equivalents at a price per share below the then applicable exercise price of the 144A Warrants, subject to limited exceptions. If issued, the Additional 144A Warrants will contain similar terms.
In addition to the dilutive effects described above, the perceived risk of dilution as a result of the significant number of increased outstanding ordinary shares due to the conversion of the Notes and the exercise of the 144A Warrants as well as the Additional Notes and Additional 144A Warrants that may be issued if the Overallotment Option were exercised may cause our ordinary shareholders to be more inclined to sell their shares, which would contribute to a downward movement in the price of our ordinary shares. Moreover, the perceived risk of dilution and the resulting downward pressure on our ordinary share price could encourage investors to engage in short sales of our ordinary shares, which could further contribute to price declines in our ordinary shares. The fact that our shareholders, note holders and warrant holders can sell substantial amounts of our ordinary shares in the public market, whether or not sales have occurred or are occurring, as well as the existence of the ratchet anti-dilution provision in the 144A Warrants and, if issued, the Additional 144A Warrants, could make it more difficult for us to raise additional funds through the sale of equity or equity-related securities in the future at a time and price that we deem reasonable or appropriate, or at all. Any of the foregoing would likely cause our stock price to decline.
Our existing and future indebtedness, including the Notes, restricts our ability to raise additional capital to fund our operations and repay our debt including the Notes and limits our ability to react to changes in the economy or our industry.
Our indebtedness could:
•limit our ability to issue ordinary shares or other securities convertible or exercisable into ordinary shares;
•limit our ability to borrow, or increase our cost of borrowing, additional funds;
•make it difficult for us to satisfy our obligations under the Notes and our other indebtedness and contractual and commercial commitments;
•require us to dedicate a substantial portion of our cash flow from operations to payments of principal, interest on, and other fees related to such indebtedness, thereby reducing the availability of our cash flow to fund working capital and capital expenditures, and for other general corporate purposes;
•increase our vulnerability to general adverse economic and technology industry conditions; and
•limit our flexibility in exercising our business plan or planning for, or reacting to, changes in our business and our industry, which may place us at a competitive disadvantage compared to our competitors that are better capitalized.
Our ability to make scheduled payments of the principal of, to pay interest on or to refinance our indebtedness, depends on our ability to raise capital in the future as well as our future financial performance, which is subject to several factors including economic, financial, competitive and other factors beyond our control. Our business may not generate cash flow from operations in the future sufficient to satisfy our obligations under our indebtedness or any future indebtedness we may incur as well as our ability to make necessary capital expenditures. If we are unable to raise capital on terms acceptable to us or generate such cash flow, we may be required to adopt one or more alternatives, such as reducing or delaying investments or capital expenditures, selling assets, refinancing or obtaining additional capital on terms that may be onerous or highly dilutive. Our ability to refinance our existing or future indebtedness will depend on the conditions in the capital markets and our financial condition prior to maturity of the Notes or such other indebtedness.
In addition, we may incur significant additional indebtedness that could increase the risks associated with our indebtedness. While the Indenture generally limits our ability to incur additional indebtedness, there are certain exceptions available to us to incur additional indebtedness, including if the Overallotment Option is exercised by the selling shareholders and Additional Notes are issued under the Indenture in an aggregate principal amount of up to $81.5 million. To the extent we incur any additional indebtedness, the capital required to service such indebtedness would negatively impact our business, financial condition, and results of operations and impose a further strain on the Company and could result in additional dilution.
Rockley’s business depends substantially on the efforts of its executive officers, including its Chief Executive Officer and founder, Dr. Andrew Rickman, OBE, and other highly skilled talent, and its operations may be severely disrupted if it lost their services.
Rockley is highly dependent on its founder, Dr. Andrew Rickman, OBE as well its other executive officers, and the loss of his services would adversely affect Rockley’s business because his loss could make it more difficult to, among other things, compete with other market participants, manage Rockley’s research and development activities, and retain existing customers or cultivate new ones. Competition for highly-skilled talent is often intense and Rockley may incur significant costs to attract highly-skilled talent. Rockley may not be successful in attracting, integrating, or retaining qualified talent to fulfill its current or future needs. Rockley has, from time to time, experienced, and it
19
expects to continue to experience, difficulty in hiring and retaining highly skilled employees with appropriate qualifications. In addition, Rockley has experienced, and may in the future experience, changes in its senior management. For example, Dr. Amit Nagra, our former Chief Operating Officer, left the Company in April 2022 and in June 2022, Chad Becker was appointed as our Interim Chief Financial Officer to succeed Mahesh Karanth, who resigned from his position as Chief Financial Officer in June 2022.
In addition, job candidates and existing employees often consider the value of the equity awards they receive in connection with their employment. If the perceived value of Rockley’s equity or equity awards declines, it may adversely affect Rockley’s ability to retain highly skilled employees. If Rockley fails to attract new talent or fails to retain and motivate its current talent, or if it fails to effectively manage any transitions among its senior management, its business, operations, and future growth prospects could be adversely affected.
Customer-Related Risks
Rockley currently has, and intends to target, customers and suppliers that are large corporations with substantial negotiating power, exacting product, quality, and warranty standards, and potentially competitive internal solutions. If Rockley is unable to sell its products to these customers or is unable to enter into agreements with customers and suppliers on satisfactory terms, its prospects and results of operations will be adversely affected.
Many of Rockley’s customers and suppliers, and potential customers, are large corporations with substantial negotiating power relative to it and, in some instances, may have internal solutions that are competitive to
Rockley’s products. Many of these large corporations that are customers or potential customers also have significant development resources, which may allow them to acquire or develop independently, or in partnership with others, competitive technologies. Meeting the technical requirements and securing design wins with any of these companies will require a substantial investment of Rockley’s time and resources. Rockley cannot assure you that its products or technology will secure design wins from these or other companies or that it will generate meaningful revenue from the sales of its products to these key customers and potential customers. If Rockley’s products are not selected by these large corporations or if these corporations develop or acquire competitive technology, it will have an adverse effect on Rockley’s business.
Rockley currently depends on a few large customers for a substantial portion of its revenue. The loss of, or a significant reduction in, orders from Rockley’s customers, including its largest customer, could significantly reduce its revenue and adversely impact Rockley’s operating results.
Rockley believes that its operating results for the foreseeable future will continue to depend to a significant extent on revenue attributable to a few large customers, including Apple Inc., Rockley’s largest customer, and Hengtong Rockley Technology Co., Ltd. (“HRT”), its second largest customer. Rockley’s two largest customers collectively accounted for 100%82% and 99.6%100% of Rockley’s revenue in 20202021 and 2019,2020, respectively. Revenue attributable to Rockley’s largest customer accounted for the majority of its revenue in 20202021 and 2019,2020, respectively. Rockley anticipates revenue attributable to this customer will fluctuate from period to period, although it expects to remain dependent on this customer for a significant portion of its revenue for the foreseeable future. Rockley has a master supply and development agreement with this customer, which provides a general framework for Rockley’s transactions with it. This agreement continues until either party terminates for material breach. Under this agreement, Rockley has agreed to develop and deliver new products to this customer at its request, provided it also meets Rockley’s business purposes, and has agreed to indemnify it for intellectual property infringement or any injury or damages caused by Rockley’s products. This customer does not have any minimum or binding purchase obligations to Rockley under this agreement and could elect to discontinue or reduce making purchases from Rockley with little or no notice.
HRT is a joint venture (the “JV”) formed by Rockley with Jiangsu Hengtong Optic-Electric Co., Ltd. (“Hengtong”), a subsidiary of Hengtong Group, Co., Ltd., in 2017. Under the Sino-Foreign Equity Joint Venture Contract dated December 19, 2017 by and between Hengtong and Rockley Photonics Ltd, a wholly-owned subsidiary of Rockley (the “JV Agreement”) and the related technology development agreement and license agreement, HRT must procure chipsets from Rockley for use in finished products and HRT owns the copyright in the final designs. HRT has a license to the underlying intellectual property in the reference designs and Rockley has certain20202021 and 2019,2020, Rockley made sales to HRT of $5.3$0.3 million and $6.7$5.3 million, respectively. See notes 3“Certain Relationships and 11Related Party Transactions – Rockley – Hengtong JV” and Notes 4 and 13 to the notes to Rockley’s consolidated financial statements included elsewhere in this prospectus.
non-compete
obligations under the JV Agreement. During the years ended December 31, In addition, customers may seek to enter into licensing arrangements in lieu of product purchases, which could negatively impact Rockley’s revenue, and, to a lesser extent, Rockley’s gross margins. If Rockley’s customers were to choose to work with other manufacturers or its relationships with its customers is disrupted for any reason, it could have a significant negative impact on Rockley’s business. Any reduction in sales attributable to Rockley’s larger customers would have a significant and disproportionate impact on Rockley’s business, financial condition, and results of operations.
Rockley’s customers, or the distributors through which it sells to these customers, may choose to use products in addition to Rockley’s, use a different product altogether, or develop an
in-house
solution. Any of these events could significantly harm its business, financial condition, and results of operations. In addition, if Rockley’s distributors’ relationships with Rockley’s end customers, including its larger end customers, are disrupted for inability to deliver sufficient products or for any other reason, it could have a significant negative impact on Rockley’s business, financial condition, and results of operations.Rockley is dependent in part upon its relationships and alliances with industry participants to generate revenue, which involves risks and uncertainties.
Rockley has, and in the future may, acquire interests in joint ventures, which may subject Rockley to risk because, among other things, Rockley cannot exercise sole decision-making power and its partners may have different economic interests than Rockley has. For example, Rockley currently holds a 24.9% share in a strategic joint venture with another industry participant
and is currently in discussions
20
regarding potential licensing of technology to the joint venture in return for future payments. Rockley is therefore dependent on the successful execution of a licensing agreement with this joint venture partner to generate additional revenue. Rockley may also acquire interests in other joint ventures with third parties. There are additional risks involved in joint venture transactions. For example, as a
co-investor
in a joint venture, Rockley may not be in a position to exercise sole decision-making authority relating to the joint venture or other entity. As a result, the operations of any joint venture are subject to the risk that third parties may make business, financial, or management decisions with which Rockley does not agree, or the management of the joint venture may take risks or otherwise act in a manner that does not serve Rockley’s interests. Further, there may be a potential risk of impasse in some business decisions because Rockley may not be in a position to exercise sole decision-making authority. In such situations, it is possible that Rockley may not be able to exit the relationship because it may not have the funds necessary to complete abuy-out
of the other partner or it may be difficult to locate a third-party purchaser for its interest. Because Rockley may not have the ability to exercise control over such operations, it may not be able to realize some or all of the benefits that it believes will be created from its involvement. In addition, there is the potential that a joint venture partner may become bankrupt or have divergent, conflicting, or inconsistent economic or business interests from Rockley. This could result in, among other things, exposing Rockley to liabilities of the joint venture in excess of its proportionate share of these liabilities. If any of the foregoing were to occur, Rockley’s business, financial condition, and results of operations could suffer.If Rockley is unable to expand or further diversify its customer base, its business, financial condition, and results of operations could suffer.
Rockley currently expects the composition of its largest customers to vary over time, and that revenue attributable to its largest customers in any given period may decline over time. Rockley’s relationships with existing customers may deter potential customers who compete with these customers from buying Rockley’s products. If Rockley is unable to expand or further diversify its customer base, it could harm its business, financial condition, and results of operations.
Rockley does not currently have any products in commercial production. Accordingly, Rockley views its current customer relationships in the following stages: (a) customers with whom it is “engaged,”“engaged”, or in discussions with, regarding potential product features for incorporation into such customer’s end products or (b) customers with whom it is “contracted” where Rockley has
non-binding
MOUs or development and supply agreements. Thesenon-binding
MOUs and development and supply agreements provide a general framework for Rockley’s transactions with the customer and typically provide that Rockley will develop and deliver new products meeting the customer’s specifications. These agreements do not contain any minimum or binding purchase obligations. If Rockley is unable to transition customers with whom it is engaged in discussions to contracted customers or if Rockley fails to otherwise attract new customers, it would negatively impact Rockley’s ability to grow its business and gain market share, which in turn would harm Rockley’s financial condition and results of operations.Because Rockley does not anticipate long-term purchase commitments with its customers, orders may be cancelled, reduced, or rescheduled with little or no notice, which in turn exposes Rockley to inventory risk, and may cause its business and results of operations to suffer.
Rockley anticipates that its products will be sold directly to customers as well as through distributors and resellers, with, in certain cases, no long- termlong-term or minimum purchase commitments from them or their end
customers. Rockley expects that sales of its products will be primarily made pursuant to standard purchase orders, which orders may be cancelled, reduced, changed, or rescheduled with little or no notice or penalty. Cancellations of orders could result in the loss of anticipated sales without allowing Rockley sufficient time to reduce its inventory and operating expenses. In addition, changes in forecasts or the timing of orders from its customers expose Rockley to the risks of inventory shortages or excess inventory. As a result, Rockley’s revenue and operating results could fluctuate materially and could be materially and disproportionately impacted by purchasing decisions of Rockley’s customers, including Rockley’s larger customers. In the future, Rockley’s customers or its distributors or their end customers may decide to purchase fewer units than expected, may alter their purchasing patterns at any time with limited or no notice, or may decide not to continue to purchase Rockley’s products at all, any of which could cause Rockley’s revenue to decline materially and materially harm Rockley’s business, financial condition, and results of operations.
Cancellations of, reductions in, or rescheduling of customer orders could also result in the loss of anticipated sales without allowing Rockley sufficient time to reduce its inventory and operating expenses, as a substantial portion of Rockley’s expenses are fixed at least in the short term. In addition, changes in forecasts or the timing of orders expose Rockley to the risks of inventory shortages or excess inventory. Any of the foregoing events could materially and adversely affect Rockley’s business, financial condition, and results of operations.
If Rockley is unable to establish and maintain confidence in its long-term business prospects among customers and analysts and within its industry or is subject to negative publicity, then Rockley’s financial condition, operating results, business prospects, and access to capital may suffer materially.
Rockley has not yet fully developed or commercialized its products or services and the successful commercialization of Rockley’s products depends in part on Rockley’s customers and potential customers committing to use Rockley’s products in their own products. Customers may be less likely to purchase Rockley’s products if they are not convinced that Rockley’s business will succeed or that its service and support and other operations will continue in the long term. Similarly, suppliers and other third parties will be less likely to invest time and resources in developing business relationships with Rockley if they are not convinced that Rockley’s business will succeed. If Rockley is unable to establish and maintain confidence in its long-term business prospects among customers, suppliers, analysts, ratings agencies, and within its industry or is subject to negative publicity, then Rockley’s financial condition, operating results, business prospects, and access to capital may suffer materially.
Rockley’s investments in educating its customers and potential customers about the advantages of Rockley’s silicon photonics and sensing technology and its applications will require significant financial and talent resources and may not result in sales of Rockley’s products.
21
Educating Rockley’s prospective customers, and to a lesser extent, its existing customers, about Rockley’s silicon photonics and sensing technology and its applications in health monitoring devices, its advantages over competitive technologies, and the potential application of Rockley’s products in different industries and use cases is an integral part of Rockley’s strategy to expand into additional markets. Rockley’s efforts to educate potential customers and the market generally will require significant financial and talent resources. These educational efforts may not be successful and Rockley may not offset the costs of such efforts with revenue from the new customers. If Rockley is unable to acquire new customers to offset these expenses, its financial condition will be adversely affected.
Legal and Regulatory Risks Related to Rockley’s Business
Rockley is subject to governmental export and import control laws and regulations. Rockley’s failure to comply with these laws and regulations could have an adverse effect on its business, prospects, financial condition, and results of operations.
Certain of Rockley’s products and services are subject to export control and import laws and regulations, including the U.S. Export Administration Regulations, U.S. Customs regulations, and various economic and trade sanctions regulations administered by the U.S. Treasury Department’s Office of Foreign Assets Controls. U.S. export control laws and regulations and economic sanctions prohibit the shipment of certain products and services to U.S. embargoed or sanctioned countries, governments and persons. In addition, complying with export control and sanctions regulations for a particular sale may be time-consuming and result in the delay or loss of sales opportunities. Exports of Rockley’s products and technology must be made in compliance with these laws and regulations. If Rockley fails to comply with these laws and regulations, Rockley and certain of its employees could be subject to substantial civil or criminal penalties, including the possible loss of export or import privileges, fines, which may be imposed on Rockley and responsible employees or managers, and, in extreme cases, the incarceration of responsible employees or managers.
Changes to trade policy, tariffs, and import/export regulations may have a material adverse effect on Rockley’s business, financial condition, and results of operations.
Changes in global political, regulatory, and economic conditions, or in laws and policies governing foreign trade, manufacturing, development, and investment in the territories or countries where Rockley may purchase its components, sell its products, or conduct its business, could adversely affect Rockley’s business. The United States has in the past instituted or proposed changes in trade policies that included the negotiation or termination of trade agreements, the imposition of higher tariffs on imports into the United States, economic sanctions on individuals, corporations, or countries, and other government regulations affecting trade between the United States and other countries where Rockley conducts its business. For instance, effective December 17, 2021, the U.S. Bureau of Industry and Security ("BIS”) of the U.S. Department of Commerce placed Hengtong and certain of its affiliates on the BIS “Entity List,” meaning that the U.S. Export Administration Regulations prohibit companies from providing products and technologies to organizations on the “Entity List” without prior authorization. In response to this decision, Rockley terminated a planned technology license to the JV. A number of other nations have proposed or instituted similar measures directed at trade with the United States in response. As a result of these developments or any future similar developments, there may be greater restrictions and economic disincentives on international trade and economic cooperation that could adversely affect Rockley’s business. It may be time-consuming and expensive for Rockley to alter its business operations to adapt to or comply with any such changes, and any failure to do so could have a material adverse effect on its business, financial condition, and results of operations.
Rockley may become involved in legal and regulatory proceedings and commercial or contractual disputes, which could have an adverse effect on its profitability and financial position.
Rockley may be, from time to time, involved in litigation, regulatory proceedings, and commercial or contractual disputes that may be significant. These matters may include, without limitation, disputes with
Rockley’s suppliers and customers, intellectual property claims, shareholder litigation, government investigations, class action lawsuits, personal injury claims, environmental issues, customs and value-added tax disputes, and employment and tax issues. In addition, Rockley could face in the future a variety of labor and employment claims against it, which could include but is not limited to general discrimination, wage and hour, privacy, ERISA, or disability claims. In such matters, government agencies or private parties may seek to recover from Rockley indeterminate amounts in penalties or monetary damages (including, in some cases, treble or punitive damages) or seek to limit Rockley’s operations in some way. These types of lawsuits could require significant management time and attention or could involve substantial legal liability, adverse regulatory outcomes, and/or substantial expenses to defend. Often these cases raise complex factual and legal issues and create risks and uncertainties. No assurances can be given that any proceedings and claims will not have a material adverse impact on Rockley’s operating results and financial position or that its established reserves or its available insurance will mitigate this impact.
Rockley is subject to, and must remain in compliance with, numerous laws and governmental regulations across various jurisdictions concerning the use, distribution, and sale of its products. Some of Rockley’s customers also require that it comply with their own unique requirements relating to these matters.
Rockley sells products that contain electronic components, and such components may contain materials that are subject to government regulation in locations where Rockley sells its products. For example, certain regulations limit the use of lead in electronic components. Since Rockley operates on a global basis, compliance with regulations is a complex process which requires continual monitoring of regulations and an ongoing compliance process to ensure that Rockley and its suppliers are in compliance with existing regulations in each market where it operates. If there is an unanticipated new regulation that significantly impacts Rockley’s use and sourcing of various components or requires more expensive components, that regulation could materially and adversely affect its business, results of operations, and financial condition. Rockley’s products may also be used in healthcare monitoring and other medical devices, which are subject to additional regulation. If Rockley fails to adhere to these new regulations or fails to continually monitor the updates, it may be subject to litigation, loss of customers, or negative publicity and its business, results of operations, and financial condition will be adversely affected.
22
Rockley may in the future become subject to additional regulations, including U.S. Food and Drug Administration (the “FDA”) clearance or approval, for health monitoring products in which Rockley’s products are incorporated. Achieving and maintaining compliance and approval under applicable regulations may be difficult to achieve.
Rockley’s products may be incorporated into end products in the health monitoring sector, including products which collect clinical data. Accordingly, it is possible that certain of Rockley’s products, or the end products which incorporate Rockley’s products will be subject to current and future regulation by the FDA, as well as by other federal, state, and local agencies. As Rockley’s target market is consumer wellness rather than medical, Rockley currently anticipates that FDA clearance will be unnecessary for its products targeting the consumer wearables market; however, Rockley intends to monitor and comply with regulations to the extent they become applicable to Rockley.
Manufacturers of medical devices are required to comply with applicable laws and regulations governing development, testing, manufacturing, labeling, marketing, and distribution of medical devices. Devices are generally subject to varying levels of regulatory control, based on the risk level of the device. Governmental regulations specific to medical devices are wide-ranging and govern, among other things:
•product design, development, and manufacture;
•laboratory,
pre-clinical
and clinical testing, labeling, packaging, storage, and distribution;•premarketing clearance or approval;
•record-keeping;
•product marketing, promotion and advertising, sales, and distribution; and
•post-marketing surveillance, including reporting of deaths or serious injuries and recalls and correction and removals.
Rockley or its customers may not be able to obtain the necessary clearances or approvals for their products or may be unduly delayed in doing so, which could harm Rockley’s business. Furthermore, even if Rockley is granted regulatory clearances or approvals, they may include significant limitations on the permitted uses for the product, which may limit the market potential for the product. Delays in obtaining clearance or approval could increase Rockley’s costs and harm Rockley’s revenue and growth.
Additionally, Rockley’s products may be subject to regulation by similar agencies in other states and foreign countries. While Rockley believes that it has complied with all applicable laws and regulations, continued compliance with such laws or regulations, including any new laws or regulations, might impose additional costs on Rockley which could adversely affect its financial performance and results of operations.
Rockley is subject to various environmental laws and regulations that could impose substantial costs upon Rockley.
Concerns over environmental pollution and climate change have produced significant legislative and regulatory efforts on a global basis, and Rockley believes this will continue both in scope and in the number of countries participating. In addition, as climate change issues become more prevalent, foreign, federal, state, and local governments and Rockley’s customers have been responding to these issues. The increased focus on environmental sustainability may result in new regulations and customer requirements, or changes in current regulations and customer requirements, which could materially and adversely impact Rockley’s business, results of operations, and financial condition. If Rockley is unable to effectively manage real or perceived issues, including concerns about environmental impacts or similar matters, sentiments toward Rockley or its products could be negatively impacted, and its business, results of operations, or financial condition could suffer.
Rockley’s operations are and will be subject to foreign, federal, state, and local environmental laws and regulations, and such laws and regulations could directly increase the cost of energy, which may have an effect on the way Rockley manufactures products or utilizes energy to produce its products. In addition, any new regulations or laws in the environmental area might increase the cost of raw materials or key components Rockley uses in its products. Environmental regulations require Rockley to reduce product energy usage, monitor and exclude an expanding list of restricted substances, and to participate in required recovery and recycling of its products. Environmental and health and safety laws and regulations can be complex, and Rockley has limited experience complying with them. Capital and operating expenses needed to comply with environmental laws and regulations can be significant, and violations may result in substantial fines and penalties, third-party damages, suspension of production, or a cessation of Rockley’s operations.
The costs of complying with environmental laws and regulations and any claims concerning noncompliance, or liability with respect to contamination in the future, could have a material adverse effect on Rockley’s financial condition or operating results. Rockley may face unexpected delays in obtaining the required permits and approvals in connection with its planned production facilities that could require significant time and financial resources and delay its ability to operate these facilities, which would adversely impact Rockley’s business, prospects, financial condition, and operating results.
Rockley is subject to U.S. and foreign anti-corruption and anti-money laundering laws and regulations. Rockley can face criminal liability and other serious consequences for violations, which can harm its business.
Rockley is subject to the U.S. Foreign Corrupt Practices Act of 1977, as amended, the U.S. domestic bribery statute contained in 18 U.S.C. § 201, the U.S. Travel Act, the USA PATRIOT Act, the U.K. Bribery Act of 2010,
and possibly other anti-bribery and anti-money laundering laws in countries in which Rockley conducts activities. Anti-corruption laws are interpreted broadly and prohibit companies and their employees, agents, contractors, and other collaborators from authorizing, promising, offering, or providing, directly or indirectly, improper payments or anything else of value to recipients in the public or private sector. Rockley can be held liable for the corrupt or other illegal activities of its employees, agents, contractors, and other collaborators, even if Rockley does not explicitly authorize or have actual knowledge of such activities. Any violations of the laws and regulations described above may result in substantial civil and criminal fines and
23
penalties, imprisonment, the loss of export or import privileges, debarment, tax reassessments, breach of contract and fraud litigation, reputational harm, and other consequences.
Failures, or perceived failures, to comply with privacy, data protection, and information security requirements in the variety of jurisdictions in which Rockley operates may adversely impact its business, and such legal requirements are evolving, uncertain, and may require improvements in, or changes to, Rockley’s policies and operations.
Rockley’s current and potential future operations and sales are subject to laws and regulations addressing privacy and the collection, use, storage, disclosure, transfer, and protection of a variety of types of data. For example, the European Commission has adopted the General Data Protection Regulation and California recently enacted the California Consumer Privacy Act of 2018, both of which provide for potentially material penalties for
non-compliance.
These regimes may, among other things, impose data security requirements, disclosure requirements, and restrictions on data collection, uses, and sharing that may impact Rockley’s operations and the development of its business. Rockley has limited access to collect, store, process, or share certain information collected by its products, and Rockley’s products may evolve to collect additional information. Therefore, the full impact of these privacy regimes on Rockley’s business is rapidly evolving across jurisdictions and remains uncertain at this time.Rockley may also be affected by cyber-attacks and other means of gaining unauthorized access to its products, systems, and data. For instance, cyber criminals or insiders may target Rockley or third parties with which it has business relationships to obtain data, or in a manner that disrupts Rockley’s operations or compromises its products or the systems into which its products are integrated.
Due to the political uncertainty involving Russia and Ukraine, there is an increased likelihood that escalation of tensions could result in cyber-attacks that could either directly or indirectly impact our operations.Rockley is assessing the continually evolving privacy and data security regimes and measures it believes are appropriate in response. Since these data security regimes are evolving, uncertain, and complex, especially for a global business such as Rockley’s,like Rockley, Rockley may need to update or enhance its compliance measures and these updates or enhancements may require implementation costs. In addition, Rockley may not be able to monitor and react to all developments in a timely manner. The compliance measures Rockley does adopt may prove ineffective. Any failure, or perceived failure, by Rockley to comply with current and future regulatory or customer-driven privacy, data protection, and information security requirements, or to prevent or mitigate security breaches, cyber-attacks, or improper access to, use of, or disclosure of data, or any security issues or cyber-attacks affecting Rockley, could result in significant liability, costs (including the costs of mitigation and recovery), and a material loss of revenue resulting from the adverse impact on its reputation and brand, loss of proprietary information and data, disruption to its business and relationships, and diminished ability to retain or attract customers and business partners. Such events may result in governmental enforcement actions and prosecutions, private litigation, fines, and penalties or adverse publicity, and could cause customers and business partners to lose trust in Rockley, which could have an adverse effect on its reputation and business.
Further, in the event Rockley’s products, or the end products into which Rockley’s products are incorporated, involve the collection of personal medical or clinical data, Rockley would be subject to additional privacy regulations. For example, the Health Insurance Portability and Accountability Act of 1996 (“HIPAA”) regulations apply U.S. national standards for some types of electronic health information transactions and the data elements used in those transactions to ensure the integrity, security, and confidentiality of health information and standards to protect the privacy of individually identifiable health information businesses receive, maintain
or transmit. The Health Information Technology for Economic and Clinical Health Act of 2009 (“HITECH Act”) expanded the scope of the privacy and security requirements under HIPAA and increased penalties for violations. In addition, the HITECH Act enacted federal breach notification rules requiring notification to affected individuals and the Department of Health and Human Services (and in some cases, relevant media outlets) whenever a breach of protected health information occurs. Rockley’s failure to maintain confidentiality of sensitive protected health information or other personal information in accordance with the applicable regulatory requirements could damage its reputation and expose Rockley to claims, fines, and penalties. Rockley’s business, operating results, and financial condition could also be negatively impacted by a violation of the HIPAA privacy or security rules or any other applicable privacy or data security law.
Many U.S. states and international jurisdictions in which Rockley operates also have laws and regulations that protect the privacy and security of confidential, protected health information, or other personal information and have similar or even more protection than U.S. federal regulations. Furthermore, state data breach notification laws continue to expand the type of protected health information and other personal information they encompass, and in many cases are more burdensome than the HIPAA/HITECH breach reporting requirements.
Regulations related to conflict minerals may cause Rockley to incur additional expenses and could limit the supply and increase the costs of certain metals used in the manufacturing of its products.
As a public company, Rockley will becomeis subject to the requirements under the Dodd-Frank Wall Street Reform and Consumer Protection Act of 2010, (the “Dodd-Frank Act”),or the Dodd-Frank Act, that will require it to determine, disclose, and report whether its products contain conflict minerals. The implementation of these requirements could adversely affect the sourcing, availability, and pricing of the materials used in the manufacture of components used in Rockley’s products. In addition, Rockley will incur additional costs to comply with the disclosure requirements, including costs related to conducting diligence procedures to determine the sources of conflict minerals that may be used in or necessary to the production of its products and, if applicable, potential changes to products, processes, or sources of supply as a consequence of such verification activities. It is also possible that its reputation may be adversely affected if Rockley determines that certain of its products contain minerals not determined to be conflict-free or if Rockley is unable to alter its products, processes, or sources of supply to avoid use of such materials.
Risks Related to Rockley’s Intellectual Property
Despite the actions Rockley is taking to defend and protect its intellectual property, Rockley may not be able to adequately protect or enforce its intellectual property rights or prevent unauthorized parties from copying or reverse engineering its products or technology. Rockley’s efforts to protect and enforce its intellectual property rights and prevent third parties from violating its rights may be costly.
24
The success of Rockley’s products and its business depend in part on Rockley’s ability to obtain patents and other intellectual property rights and maintain adequate legal protection for its products in the United States and other international jurisdictions. Rockley relies on a combination of patent, trademark, and trade secret laws, as well as confidentiality procedures and contractual restrictions, to establish and protect its proprietary rights, all of which provide only limited protection.
As of June 30,December 31, 2021, Rockley had 85192 issued and allowed patents and 8590 other patent applications pending in the United States and 5981 patents in foreign jurisdictions. The 85192 issued and allowed patents in the United States expire in the years beginning in 20212022 through 2040. The 5981 patents in foreign jurisdictions include 3351 in the United Kingdom, 2326 in China, 1 in Europe, and 3 in Japan, and they expire in the years beginning 2027 through 2039. Many of Rockley’s issued patents and pending patent applications relate to sensors and sensor chips.
Rockley cannot assure you that any patents will be issued with respect to its currently pending patent applications or that any trademarks will be registered with respect to its currently pending applications in a
manner that gives Rockley adequate defensive protection or competitive advantages, if at all, or that any patents issued to Rockley or any trademarks registered by it will not be challenged, invalidated, or circumvented. Rockley may file for patents and trademarks in the United States and in certain international jurisdictions, but such protections may not be available in all countries in which it operates or in which Rockley seeks to enforce its intellectual property rights, or may be difficult to enforce in practice. For example, the legal environment relating to intellectual property protection in certain emerging market countries where Rockley may operate in the future is relatively weaker, often making it difficult to create and enforce such rights. Rockley’s currently registered trademarks and any patents and trademarks that may be issued or registered, as applicable, in the future with respect to pending or future applications may not provide sufficiently broad protection or may not prove to be enforceable in actions against alleged infringers. Rockley cannot be certain that the steps it has taken will prevent unauthorized use of its technology or the reverse engineering of its technology. Moreover, others may independently develop technologies that are competitive to Rockley or infringe Rockley’s intellectual property.
Protecting against the unauthorized use of Rockley’s intellectual property, products, and other proprietary rights is expensive and difficult, particularly internationally. Unauthorized parties may attempt to copy or reverse engineer Rockley’s sensing technology or certain aspects of Rockley’s products or manufacturing processes that it considers proprietary. Litigation may be necessary in the future to enforce or defend Rockley’s intellectual property rights, to prevent unauthorized parties from copying or reverse engineering its products, or technology to determine the validity and scope of the proprietary rights of others or to block the importation of infringing products into the United States.
Any such litigation, whether initiated by Rockley or a third party, could result in substantial costs and diversion of management resources, either of which could adversely affect Rockley’s business, operating results, and financial condition. Even if it obtains favorable outcomes in litigation, Rockley may not be able to obtain adequate remedies, especially in the context of unauthorized parties copying or reverse engineering its products or technology.
Further, many of Rockley’s current and potential competitors have the ability to dedicate substantially greater resources to defending intellectual property infringement claims and to enforcing their intellectual property rights than Rockley has. Attempts to enforce its rights against third parties could also provoke these third parties to assert their own intellectual property or other rights against Rockley or result in a holding that invalidates or narrows the scope of Rockley’s rights, in whole or in part. Effective patent, trademark, service mark, copyright, and trade secret protection may not be available in every country in which Rockley’s products are available and competitors based in other countries may sell infringing products in one or more markets. Failure to adequately protect Rockley’s intellectual property rights could result in Rockley’s competitors offering similar products, potentially resulting in the loss of some of Rockley’s competitive advantage and a decrease in its revenue, which would adversely affect Rockley’s business, operating results, financial condition, and prospects.
Third-party claims that Rockley is infringing intellectual property, whether successful or not, could subject Rockley to costly and time-consuming litigation or expensive licenses, and its business could be adversely affected.
Although Rockley has applied for patents related to its products and technology, a number of companies hold patents covering aspects of sensing and photonic chip technologies. In addition to these patents, participants in this industry typically also protect their technology, especially embedded software, through copyrights and trade secrets. As a result, there is frequent litigation based on allegations of infringement, misappropriation, or other violations of intellectual property rights. Rockley may in the future receive inquiries from other intellectual property holders and may become subject to claims that it infringes their intellectual property rights, particularly as Rockley expands its presence in the market, expands to new use cases, and faces increasing competition. In addition, parties may claim that the names and branding of Rockley’s products infringe their trademark rights in
certain countries or territories. If such a claim were to prevail, Rockley may have to change the names and branding of its products in the affected territories and it could incur other costs.
Rockley currently has a number of agreements in effect pursuant to which it has agreed to defend, indemnify, and hold harmless its customers, suppliers, and channel partners and other counterparties from damages and costs which may arise from the infringement by Rockley’s products of third- partythird-party patents or other intellectual property rights. The scope of these indemnity obligations varies, and, in some instances, include indemnification for damages and expenses, including attorneys’ fees. Rockley’s insurance may not cover all intellectual property infringement claims. A claim that its products infringe a third party’s intellectual property rights, even if untrue, could adversely affect Rockley’s relationships with its customers, may deter future customers from purchasing its products, and could expose Rockley to costly litigation and settlement expenses. Even if Rockley is not a party to any litigation between a customer and a third party relating to infringement by its products, an adverse outcome in any such litigation could make it more difficult for Rockley to defend its products against intellectual property infringement claims in any subsequent litigation in which it is a named party. Any of these results could adversely affect Rockley’s brand and operating results.
Rockley may in the future need to initiate infringement claims or litigation to try to protect its intellectual property rights. In addition to litigation where Rockley is a plaintiff, Rockley’s defense of intellectual property rights claims brought against it or its customers,
25
suppliers, and channel partners, with or without merit, could be time-consuming, expensive to litigate or settle, divert management resources and attention, and force Rockley to acquire intellectual property rights and licenses, which may involve substantial royalty or other payments and may not be available on acceptable terms or at all. Further, a party making such a claim, if successful, could secure a judgment that requires Rockley to pay substantial damages or obtain an injunction and also Rockley may lose the opportunity to license its technology to others or to collect royalty payments. An adverse determination also could invalidate or narrow Rockley’s intellectual property rights and adversely affect its ability to offer its products to its customers and may require that Rockley procure or develop substitute products that do not infringe, which could require significant effort and expense. Any of these events could adversely affect Rockley’s business, reputation, operating results, financial condition, and prospects.
Rockley’s intellectual property applications, including patent applications, may not be approved or granted or may take longer than expected to result in approval or grant, which may have a material adverse effect on Rockley’s ability to prevent others from commercially exploiting products similar to Rockley’s.
Rockley cannot be certain that it is the first inventor of the subject matter to which it has filed a particular patent application, or if it is the first party to file such a patent application. If another party has filed a patent application to the same subject matter as Rockley has, Rockley may not be entitled to the protection sought by the patent application. Rockley also cannot be certain whether the claims included in a patent application will ultimately be allowed in the applicable issued patent or the timing of any approval or grant of a patent application. Further, the scope of protection of issued patent claims is often difficult to determine. As a result, Rockley cannot be certain that the patent applications that it files will issue, or that its issued patents will afford protection against competitors with similar technology. In addition, Rockley’s competitors may design around Rockley’s registered or issued intellectual property, which may adversely affect Rockley’s business, prospects, financial condition, and operating results.
In addition to patented technology, Rockley relies on its unpatented proprietary technology, trade secrets, designs, experiences, workflows, data, processes, software, and
know-how.
Rockley relies on proprietary information (such as trade secrets, designs, experiences, workflows, data,
know-how,
and confidential information) to protect intellectual property that may not be patentable or subject to copyright, trademark, trade dress, or service mark protection, or that Rockley believes is best protected by means that do not require public disclosure. Rockley generally seeks to protect this proprietary information by entering into confidentiality agreements, or consulting, services, or employment agreements that containnon-disclosure
and
non-use
provisions with its employees, consultants, contractors, and third parties. However, these agreements may be breached or may otherwise fail to prevent disclosure, third-party infringement, or misappropriation of its proprietary information, may be limited as to their term, and may not provide an adequate remedy in the event of unauthorized disclosure or use of proprietary information. Rockley has limited control over the protection of trade secrets used by its current or future manufacturing counterparties and suppliers and could lose future trade secret protection if any unauthorized disclosure of such information occurs. In addition, Rockley’s proprietary information may otherwise become known or be independently developed by its competitors or other third parties. To the extent that its employees, consultants, contractors, advisors, and other third parties use intellectual property owned by others in their work for Rockley, disputes may arise as to the rights in related or resultingknow-how
and inventions. Costly and time-consuming litigation could be necessary to enforce and determine the scope of Rockley’s proprietary rights, and failure to obtain or maintain protection for its proprietary information could adversely affect its competitive business position. Furthermore, laws regarding trade secret rights in certain markets where Rockley operates may afford little or no protection to its trade secrets.Rockley also relies on physical and electronic security measures to protect its proprietary information, but it cannot provide assurance that these security measures will not be breached or provide adequate protection for its property. There is a risk that third parties may obtain and improperly utilize Rockley’s proprietary information to its competitive disadvantage. Rockley may not be able to detect or prevent the unauthorized use of such information or take appropriate and timely steps to enforce its intellectual property rights.
Rockley may be subject to damages resulting from claims that it or its current or former employees have wrongfully used or disclosed alleged trade secrets of its current or former employees’ former employers. Rockley may be subject to damages if its current or former employees wrongfully use or disclose Rockley’s trade secrets.
Rockley may be subject to claims that it or its current or former employees have inadvertently or otherwise used or disclosed trade secrets or other proprietary information of a current or former employee’s former employers. Litigation may be necessary to defend against these claims. If Rockley fails to defend against such claims, in addition to paying monetary damages, it may lose valuable intellectual property rights or talent. A loss of key talent or their work product could hamper or prevent Rockley’s ability to commercialize its products, which could severely harm its business. Even if Rockley is successful in defending against these claims, litigation could result in substantial costs and demand on management resources.
Risks Related to Infrastructure, Cybersecurity and Privacy
A network or data security incident may allow unauthorized access to Rockley’s network or data, harm its reputation, create additional liability, and adversely impact its financial results.
Rockley and its third-party service providers may face security threats and attacks from a variety of sources. In addition to traditional computer “hackers,” malicious code (such as viruses and worms), phishing attempts, employee theft or misuse, and denial of service attacks, sophisticated nation- statenation-state and nation-state supported actors engage in attacks (including advanced persistent threat intrusions) and increase the risks to Rockley’s internal networks and customer facing environments and the information they store and process. These risks may increase due to
COVID-19.
A breach in Rockley’s data or an attack against its service availability, or that of its third-party service providers, could impact Rockley’s networks, creating system disruptions or slowdowns and exploiting security vulnerabilities of Rockley’s26
products, and the information stored on Rockley’s networks or those of its third-party service providers could be accessed, publicly disclosed, altered, lost, or stolen, which could subject Rockley to liability and cause it financial harm.
Unauthorized access by a third party to Rockley’s internal network, any actual or perceived breach of network security in its systems or networks, or any other actual or perceived data security incident Rockley or its third-party service providers suffer, could result in damage to its reputation, negative publicity, loss of channel
partners,
end-customers
and sales, loss of competitive advantages over its competitors, increased costs to remedy any problems and otherwise respond to any incident, regulatory investigations and enforcement actions, costly litigation, and other liability. In addition, Rockley may incur significant costs to investigate and remediate any security breaches and other security incidents. Rockley’s data, corporate systems, third-party systems, and security measures may be breached due to the actions of outside parties, employee error, malfeasance, a combination of these, or otherwise, and, as a result, an unauthorized party may obtain access to its data. For example, in late 2020, Rockley was subject to phishing attacks, one involving a spoofed email whereby certain vendor account information was charged and payment was made to a fraudulent account and a second closely timed incident where a “forwarding” rule was applied to the spoofed email’s recipient. While no personal data was accessed and the issue was addressed, the incident resulted in a net loss of approximately $66,345, which loss has been accounted for in Rockley’s 2020 financial statements (which amount has been offset by a payout under our cybersecurity insurance policy in March 2021). While Rockley maintains cybersecurity insurance, such insurance may be insufficient to cover all liabilities incurred by these incidents, and any incidents may result in loss or increased costs of its cybersecurity insurance. Any of these negative outcomes could adversely impact the market perception of, and investor confidence in, Rockley.Any disruption or performance issues with Rockley’s network infrastructure could harm its brand, reputation, and business.
Rockley has experienced, and may in the future experience, disruptions, outages, and other performance problems due to a variety of factors, including infrastructure changes, human or software errors, capacity constraints, and fraud. Any disruptions or other performance problems with Rockley’s products or reliability or security of Rockley’s systems could harm its reputation, brand, and Rockley’s business and operating results. In addition, Rockley must continually improve its computer network and infrastructure to avoid service interruptions or slower system performance. Rockley will need to devote additional resources to improving its platform architecture and its infrastructure. Any failure or delays in Rockley’s computer systems could cause service interruptions or slower system performance. These performance issues could harm Rockley’s business operations and financial condition.
Rockley relies on third parties to maintain and operate certain elements of its network infrastructure.
Rockley relies on third parties to operate and maintain certain elements of its network infrastructure. Interruptions in Rockley’s systems or the third-party systems on which it relies, whether due to system failures, computer viruses, physical or electronic
break-ins,
or other factors, could affect the security or availability of Rockley’s network infrastructure and website. Rockley’s existing data center facilities and third-party hosting providers have no obligations to renew their agreements with Rockley on commercially reasonable terms or at all, and certain of the agreements governing these relationships may be terminated by either party at any time, with no or limited notice. If any of these arrangements with third parties are terminated, Rockley could experience interruptions, as well as downtime, delays, and additional expenses in arranging alternative cloud infrastructure services. Rockley may incur significant liability from those customers and from third parties with respect to any breach of security affecting third parties’ infrastructure.Risks Related to Financial and Accounting Matters
Rockley’s failure to raise additional capital or generate the significant capital necessary to expand its operations could reduce its ability to compete and could harm its business.
Rockley intends to continue to make investments to support its product development efforts and overall business growth and may require additional funds to respond to business challenges, including the need to develop new features to enhance its products or acquire complementary businesses and technologies. Accordingly, Rockley may in the long-term need to engage in equity or debt financings to secure additional funds. If Rockley raises additional equity or equity-linked financing, shareholders may experience dilution of
their ownership interests. Current and future indebtedness may also contain terms that, among other things, restrict Rockley’s ability to incur additional indebtedness.indebtedness or issue or sell any ordinary shares, or any securities convertible into or exercisable for ordinary shares, at a price, or having a conversion or exercise price, that is less than the conversion price (as defined in the Indenture) on the Notes. Rockley may also be required to take other actions that would otherwise be in the interests of the debt holders and would require it to maintain specified liquidity or other ratios, any of which could harm Rockley’s business, operating results, and financial condition. For instance, the Indenture contains an affirmative covenant that requires Rockley to maintain minimum unrestricted cash and cash equivalents of $20.0 million. Rockley may not be able to obtain additional financing on terms favorable to it, if at all. If Rockley is unable to obtain adequate financing or financing on satisfactory terms when required, Rockley’s ability to continue to support its business growth and to respond to business challenges could be significantly impaired, and its business may be adversely affected.
The nature of Rockley’s business requires the application of complex revenue recognition rules. Significant changes in current principles will affect its consolidated financial statements and changes in financial accounting standards or practices may cause adverse, unexpected financial reporting fluctuations and harm its results of operations.
The accounting rules and regulations with which Rockley must comply with are complex and subject to interpretation by the Financial Accounting Standards Board (“FASB”), the U.S. Securities and Exchange Commission (the “SEC”),SEC, and various bodies formed to promulgate and interpret appropriate accounting principles. In addition, many companies’ accounting disclosures are being subjected to heightened scrutiny by regulators and the public. Further, the accounting rules and regulations are continually changing in ways that could impact Rockley’s financial statements.
27
In preparing Rockley’s consolidated financial statements, Rockley makes good faith estimates and judgments that may change or turn out to be erroneous, which could adversely affect Rockley’s operating results.
In preparing Rockley’s consolidated financial statements in conformity with GAAP, Rockley must make estimates and judgments in applying Rockley’s most critical accounting policies. Those estimates and judgments have a significant impact on the results Rockley reports in its consolidated financial statements. The most difficult estimates and subjective judgments that Rockley makes relate to (i) revenue recognition including variable consideration, (ii) useful lives and recoverability of property and equipment and long-lived assets, (iii) incremental borrowing rates on the Company’sRockley’s finance and operating leases, (iv) valuation of our convertible loan notes, (v) valuation allowances for income taxes, (vi) stock-based compensation including the valuation of Ordinary Shares,ordinary shares, (vii) valuation of warrants and (viii) contingencies. Rockley bases its estimates on historical experience, input from outside experts, and on various other assumptions that Rockley believe to be reasonable under the circumstances, the results of which form the basis for making judgments about the carrying values of assets and liabilities that are not readily apparent from other sources. Rockley also has other key accounting policies that are not as subjective, and therefore, their application would not require Rockley to make estimates or judgments that are as difficult, but which nevertheless could significantly affect its financial reporting. Actual results may differ materially from these estimates. In general, if Rockley’s estimates, judgments, or assumptions relating to its critical accounting policies are inaccurate or change or if actual circumstances differ from its estimates, judgments, or assumptions, including uncertainty in the current economic environment due to
COVID-19,
its operating results may be adversely affected and could fall below Rockley’s publicly announced projections or the expectations of securities analysts and investors.Additionally, Rockley regularly monitors its compliance with applicable financial reporting standards and review new pronouncements and drafts thereof that are relevant to it. As a result of new standards, changes to existing standards, and changes in their interpretation, Rockley might be required to change its accounting policies, alter its operational policies, and implement new or enhance existing systems so that they reflect new or amended financial reporting standards, or Rockley may be required to restate its published financial statements. Such changes to existing standards or changes in their interpretation may have an adverse effect on Rockley’s reputation, business, financial position, and profit, or cause an adverse deviation from Rockley’s revenue and operating profit target, which may negatively impact Rockley’s financial results. For more information, refer to the section entitled “Critical Accounting Estimates” in “Management’sManagement’s Discussion and Analysis of Financial Condition and Results of Operations”Operations—Critical Accounting Policies and Estimates” in this prospectus.
Rockley’s ability to use its net operating loss carryforwards and certain other tax attributes may be limited.
As of December 31, 2020,2021, Rockley had $79.3$132.3 million of U.K. net operating loss carryforwards available to reduce future taxable income and will be carried forward indefinitely. To the extent Rockley is not able to offset future taxable income with its net operating losses, Rockley’s cash flows may be adversely affected.
Risks Related to Being a Public Company
Rockley’s management team has varying degrees of experience managing and operating a public company.
Members of Rockley’s management team have varying degrees of experience managing and operating a publicly traded company, interacting with public company investors, and complying with the increasingly complex laws pertaining to public companies. Additionally, some members of Rockley’s management team were recently hired, including its Senior Director of Sensing Application Algorithm Development, Controller, Senior Director of Sensing Product Module Development, and VP of Sensing Cloud, and AI Product. Rockley’s management team may not successfully or efficiently manage their new roles and responsibilities. Rockley’s transition to beingAs a public company, subjects itRockley is subject to significant regulatory oversight and reporting obligations under the U.S. securities laws and the continuous scrutiny of securities analysts and investors. These new obligations and constituents will require significant attention from Rockley’s senior management and could divert their attention away from themanagement of Rockley’s business. Rockley may not have adequate key talent with the appropriate level of knowledge, experience, and training in the accounting policies, practices, or internal controls over financial reporting required of public companies. The development and implementation of the standards and controls necessary for Rockley to achieve the level of accounting standards required of a public company may require costs greater than expected. It is possible that Rockley will be required to expand its employee base and hire additional employees to support its operations as a public company which will increase its operating costs in future periods. These factors could adversely affect Rockley’s business, financial condition, and operating results.
day-to-day
If Rockley fails to maintain an effective system of internal controls, its ability to produce timely and accurate financial statements or comply with applicable regulations could be adversely affected.
The Sarbanes-Oxley Act requires, among other things, that Rockley maintain effective disclosure controls and procedures and internal control over financial reporting. Rockley is continuing to develop and refine its disclosure controls, internal control over financial reporting, and other procedures that are designed to ensure that information required to be disclosed by it in the reports that it will file with the SEC is recorded, processed, summarized, and reported within the time periods specified in SEC rules and forms, and that information required to be disclosed in reports under the Exchange Act is accumulated and communicated to Rockley’s principal executive and financial officers.
Rockley’s current controls and any new controls that it develops may be inadequate because of changes in conditions in its business. Further, additional weaknesses in Rockley’s internal controls may be discovered in the future. Any failure to develop or maintain effective controls, or any difficulties encountered in their implementation or improvement, could adversely affect Rockley’s operating results or cause it to fail to meet its reporting obligations and may result in a restatement of Rockley’s financial statements for prior periods. Any failure to implement and maintain effective internal controls also could adversely affect the results of periodic management evaluations and annual
28
independent registered public accounting firm attestation reports regarding the effectiveness of Rockley’s internal control over financial reporting that it is required to include in its periodic
reports Rockley will file with the SEC under Section 404 of the Sarbanes-Oxley Act. Ineffective disclosure controls and procedures and internal control over financial reporting could also cause investors to lose confidence in Rockley’s reported financial and other information.
In order to maintain and improve the effectiveness of its disclosure controls and procedures and internal control over financial reporting, Rockley has expended and anticipates that it will continue to expend significant resources, including accounting-related costs, and provide significant management oversight. Any failure to maintain the adequacy of its internal controls, or consequent inability to produce accurate financial statements on a timely basis, could increase Rockley’s operating costs and could materially and adversely affect its ability to operate its business. If Rockley’s internal controls are perceived as inadequate or thatif it is unable to produce timely or accurate financial statements, investors may lose confidence in Rockley’s operating results and Rockley’s sharethe stock price could decline.
Rockley’s independent registered public accounting firm is not required to formally attest to the effectiveness of its internal control over financial reporting until after Rockley is no longer an emerging growth company. At such time, Rockley’s independent registered public accounting firm may issue a report that is adverse in the event it is not satisfied with the level at which Rockley’s controls are documented, designed, or operating. Any failure to maintain effective disclosure controls and internal control over financial reporting could have a material and adverse effect on the Rockley’s business and operating results.
In addition to Rockley’s results determined in accordance with GAAP, Rockley believes certainOrdinary Shares.ordinary shares.
non-GAAP
measures may be useful in evaluating its operating performance. Rockley presents certainnon-GAAP
financial measures in this prospectus and intends to continue to present certainnon-GAAP
financial measures in future filings with the SEC and other public statements. Any failure to accurately report and present itsnon-GAAP
financial measures could cause investors to lose confidence in its reported financial and other information, which would likely have a negative effect on the trading price of its The requirements of being a public company may strain Rockley’s resources, divert management’s attention, and affect its ability to attract and retain qualified board members.
In addition, changing laws, regulations, and standards related to corporate governance and public disclosure are creating uncertainty for public companies, increasing legal and financial compliance costs, and making some activities more time-consuming. These laws, regulations, and standards are subject to varying interpretations, in many cases due to their lack of specificity, and, as a result, their application in practice may evolve over time as new guidance is provided by regulatory and governing bodies. This could result in continuing uncertainty regarding compliance matters and higher costs necessitated by ongoing revisions to disclosure and governance
practices. Rockley intends to invest resources to comply with evolving laws, regulations, and standards, and this investment may result in increased general and administrative expense and a diversion of management’s time and attention from revenue-generating activities to compliance activities. If Rockley’s efforts to comply with new laws, regulations, and standards differ from the activities intended by regulatory or governing bodies, regulatory authorities may initiate legal proceedings against Rockley and its business may be harmed.
Risks Related to Ownership of Our Ordinary Shares
Concentration of ownership among our existing executive officers, directors and their affiliates may prevent new investors from influencing significant corporate decisions.
As of August 11, 2021, after giving effect to the Closing,June 30, 2022, our executive officers and directors collectively beneficially own approximately 15.9%13.7% of our outstanding Ordinary Shares,ordinary shares, with Dr. Andrew Rickman, our Chief Executive Officer, beneficially owning approximately 13.8%13.5% of our outstanding Ordinary Shares.ordinary shares. As a result, these stockholdersshareholders will be able to exercise a significant level of control over all matters requiring stockholdershareholder approval, including the election of directors, any amendment of the Articles of Association, and approval of significant corporate transactions. This control could have the effect of delaying or preventing a change of control or changes in management and will make the approval of certain transactions difficult or impossible without the support of these stockholders.
shareholders.Sales of a substantial number of our Ordinary Sharesordinary shares in the public market or the perception that such sales may occur could cause the price of our Ordinary Sharesordinary shares to fall.
Sales of a substantial number of our Ordinary Sharesordinary shares in the public market or the perception that these sales might occur could depress the market price of our Ordinary Sharesordinary shares and could impair our ability to raise capital through the sale of additional equity securities. We are unable to predict the effect that sales may have on the prevailing market price of our Ordinary Shares.ordinary shares. In addition, the sale of substantial amounts of our Ordinary Sharesordinary shares could adversely impact its price.
29
In addition to the selling securityholders representshares being registered for resale hereunder, we have registered for resale approximately 36.3%61.9 million of our outstanding Ordinary Shares,ordinary shares, not including the Ordinary Sharesordinary shares underlying any of our outstanding Public Warrants. OutstandingThe Public Warrants to purchase an aggregate of 8,625,000 Ordinary Shares, which we refer to as the “Public Warrants,” became exercisable on the effectiveness of the registration statement that we filed with the SEC to register the shares underlying the Public Warrants. The exercise price of the Public Warrants is currently $11.50 per share. To the extent the Public Warrants are exercised, additional Ordinary Sharesordinary shares will be issued, which will result in dilution to the holders of our Ordinary Sharesordinary shares and increase the number of shares eligible for resale in the public market. Sales, or the potential sales, of substantial numbers of shares in the public market by the selling securityholdersshareholders upon termination of applicable contractualOrdinary Sharesordinary shares or adversely affect the market price of our Ordinary Shares.ordinary shares.
lock-up
agreements or by holders of the Public Warrants, could increase the volatility of the market price of our As of August 11,December 31, 2021, after the completion of the Business Combination, we had outstanding approximately 126.3127.9 million Ordinary Shares,ordinary shares, and Public Warrants to purchase approximately 14,204,266 Ordinary Shares.14.1 million ordinary shares. In addition, we intend to registerhave registered for sale our Ordinary Sharesordinary shares issuable under our equity compensation plans, including 15,326,274 Ordinary Sharesapproximately 15.4 million ordinary shares available for future issuance under our 2021 Stock Incentive Plan, (the “2021 Plan”), 1,526,239 Ordinary Sharesapproximately 1.5 million ordinary shares available for future issuance under our 2021 Employee Stock Purchase Plan (the “ESPP”),ESPP, and approximately 16.616.5 million Ordinary Sharesordinary shares issuable upon the exercise of outstanding options under our 2013 Stock Option Plan. We also intend to register additional shares under our 2021 Plan and ESPP pursuant to the evergreen provisions under such plans. The sale or the availability for sale of a large number of our Ordinary Sharesordinary shares in the public market could cause the price of our Ordinary Sharesordinary shares to decline.
We may sell additional ordinary shares, as well as securities convertible into or exercisable for ordinary shares, in subsequent public or private offerings. We may also issue additional ordinary shares, as well as securities convertible into or exercisable for ordinary shares, for strategic or other purposes. We may also need to raise additional capital in order to commercially develop our products, and this may require us to issue additional securities (including ordinary shares as well as securities convertible into or exercisable for ordinary shares). There can be no assurance that our capital raising efforts will be able to attract the capital needed to execute on our business plan and sustain our operations. Moreover, we cannot predict the size of future issuances of our ordinary shares, as well as securities convertible into or exercisable for ordinary shares, or the effect, if any, that future issuances and sales of our securities will have on the market price of our ordinary shares. Sales of substantial amounts of our ordinary shares, as well as securities convertible into or exercisable for ordinary shares, or the perception that such sales could occur, may result in substantial dilution and may adversely affect prevailing market prices for our ordinary shares. See “Risk Factors — Risks Related to Rockley’s Business and Industry — We have a significant number of securities outstanding that can be converted into, or exercised for, ordinary shares and certain of our outstanding warrants contain anti-dilution protection, all which may cause significant dilution to our shareholders, have a material adverse impact on the market price of our ordinary shares and make it more difficult for us to raise funds through future equity offerings.”
We have never paid dividends on our capital stock, and we do not anticipate paying dividends in the foreseeable future.
We have never paid dividends on any of our capital stock and currently intend to retain any future earnings to fund the growth of our business. In addition, the terms of the Indenture restrict our ability to pay dividends so long as the Notes are outstanding. Any determination to pay dividends in the future will be at the discretion of our board of directors (the “Board”) and will depend on our financial condition, operating results, capital requirements, general business conditions and other factors that the Board may deem relevant. As a result, capital appreciation, if any, of our Ordinary Sharesordinary shares will be the sole source of gain for the foreseeable future.
Our stock price is volatile, and you may not be able to sell our Ordinary Sharesordinary shares at or above the price you paid.
The trading price of our Ordinary Sharesordinary shares is volatile and could be subject to wide fluctuations in response to various factors, some of which are beyond our control. These factors include:
•actual or anticipated fluctuations in operating results;
•failure to meet or exceed financial estimates and projections of the investment community or that we may provide to the public;
•issuance of new or updated research or reports by securities analysts or changed recommendations for our stockordinary shares or the transportationsemiconductor industry in general;
•announcements by us or our competitors of significant acquisitions, strategic partnerships, joint ventures, collaborations or capital commitments;
•operating and share price performance of other companies that investors deem comparable to us;
•our focus on long-term goals over short-term results;
•the timing and magnitude of our investments in the growth of our business;
•actual or anticipated changes in laws and regulations affecting our business;
•additions or departures of key management or other personnel;
•disputes or other developments related to our intellectual property or other proprietary rights, including litigation;
•our ability to market new and enhanced products and technologies on a timely basis;
•sales of substantial amounts of the Ordinary Sharesordinary shares by the Board, executive officers or significant stockholdersshareholders or the perception that such sales could occur;
30
•changes in our capital structure, including future issuances of securities or the incurrence of debt; and
•general economic, political, and market conditions.
In addition, the stock market in general, and the NYSE in particular, has experienced extreme price and volume fluctuations that have often been unrelated or disproportionate to the operating performance of those companies. Broad market and industry factors may seriously affect the market price of our Ordinary Shares,ordinary shares, regardless of our actual operating performance. In addition, in the past, following periods of volatility in the overall market and the market price of a particular company’s securities, securities class action litigation has often been instituted against these companies. This litigation, if instituted against us, could result in substantial costs and a diversion of our management’s attention and resources.
If securities or industry analysts issue an adverse opinion regarding our stockordinary shares or do not publish research or reports about our company, our stockshare price and trading volume could decline.
The trading market for our Ordinary Sharesordinary shares will depend in part on the research and reports that equity research analysts publish about us and our business. We do not control these analysts or the content and opinions included in their reports. Securities analysts may elect not to provide research coverage of our company and such lack of research coverage may adversely affect the market price of our Ordinary Shares.ordinary shares. The price of our Ordinary Sharesordinary shares could also decline if one or more equity research analysts downgrade our Ordinary Shares,ordinary shares, change their price targets, issue other unfavorable commentary or cease publishing reports about us or our business. If one or more equity research analysts cease coverage of our company, we could lose visibility in the market, which in turn could cause our stockshare price to decline.
General Risk Factors
The global
COVID-19
pandemic could harm Rockley’s business and results of operations.On March 11, 2020, the World Health Organization characterized the outbreak of“stay-at-home” “stay-at-home” orders, and similar mandates and guidelines for many individuals to substantially restrict daily activities and for many businesses to curtail or cease normal operations.
COVID-19
as a global pandemic and recommended containment and mitigation measures. Since then, extraordinary actions have been taken by international, federal, state, and local public health and governmental authorities and organizations to contain and combat the outbreak and spread ofCOVID-19
in regions throughout the world. These actions include travel bans, quarantines,The Specifically, these measures include transitioning its employee population to work remotely from home, which is planned to continue through June 30, 2021 with the anticipated roll out of a phased return to office plan in through September 30, 2021 in accordance with government guidance and, in accordance with applicable government directives, reducingon-siteoperations at its facilities. Certain key laboratory employees and facilities were designated as Essential Critical Infrastructure and Rockley was able to continue internal testing and laboratory work to the extent necessary to service customer commitments. To facilitate
COVID-19
pandemic, including the impact of new variants, has negatively impacted, and will likely continue to have a negative impact on, worldwide economic activity and financial markets and has impacted, and will further impact, Rockley’s workforce and operations, the operations of its customers, and those of their respective channel partners, vendors, and suppliers. In light of the uncertain and evolving situation and various international and government restrictions and guidelines, Rockley has taken measures intended to mitigate the spread of the virus and minimize the risk to its employees, channel partners,end-customers,
and the communities in which it operates.on-site
operations, revised operational and manufacturing plans were implemented that conform toCOVID-19
pandemic, including the emergence, spread, and severity of any new variants, precautionary health guidelines, including universal requirement of facial coverings, rearranging facilities to follow social distancing protocols, conducting active daily temperature checks, regular and thorough disinfecting of surfaces and tools, and regular testing of its employees forCOVID-19.
The remainingnon-essential
workforce was required to perform their duties from home.Rockley intends to continue to monitor the situation and may adjust its current policies as more information and public health guidance become available. Any precautionary measures that Rockley has adopted or may
adopt could negatively affect Rockley’s sales and marketing efforts, delay and lengthen its sales cycles, and create operational or other challenges, any of which could harm its business and results of operations. In addition,
the COVID-19
may disrupt the operations of Rockley’s customers and channel partners for an indefinite period of time, including as a result of travel restrictions and/or business shutdowns, all of which could negatively impact Rockley’s business and results of operations, including cash flows.The ongoing impact will depend on the duration of the pandemic, which is being mitigated by advances in the treatment of the disease, prevention efforts including vaccines, broad government measures to contain the spread of the virus, and related government stimulus measures. However, should Rockley experience sustained impact from the pandemic, additional actions such as cost reduction measures may need to be implemented. The impact of
COVID-19
is fluid and uncertain, but it has caused and may continue to cause various negative effects, including an inability to meet with actual or potential customers; customers deciding to delay or abandon their planned product development programs and product commercialization timelines; increased requests for delayed payment terms by customers and channel partners; changes in the demand of Rockley’s products, which may cause it to reprioritize its engineering and research and development efforts; and delays or possible disruptions in its supply chain. Until theCOVID-19
pandemic is contained and global economic activity stabilizes, it will continue to be more difficult for Rockley to forecast its operating results.The recurrence or continued effects of a global economic downturn as a result of the
COVID-19
pandemic, political instability, and geopolitical conflicts could have an adverse effect on Rockley’s business and operating results.Rockley operates globally and as a result its business and revenue are impacted by global macroeconomic conditions. The multinational efforts to contain the spread of
COVID-19
had a significant adverse effect on the global macroeconomic environment. In addition, the instability in the global credit markets, uncertainties regarding the effects of Brexit, uncertainties related to the timing of the lifting of governmental restrictions, or the reinstatement of restrictions, to mitigate the spread ofCOVID-19,
uncertainties related to changes in public policies such as domestic and international regulations, taxes, or international trade agreements, international trade disputes,31
government shutdowns, geopolitical turmoil such as the conflict between Russian and Ukraine, and other disruptions to global and regional economies and markets could continue to add uncertainty to global economic conditions.
These adverse conditions could result in longer sales, development, and production cycles, slower adoption of new technologies, and increased price competition. As a result, any continued or further uncertainty, weakness, or deterioration in global macroeconomic and market conditions may cause Rockley’s customers to modify spending priorities or delay purchasing decisions, and result in lengthened sales, development, and production cycles, any of which could harm its business and operating results.
Rockley is an “emerging growth company” within the meaning of the Securities Act, and if it takes advantage of certain exemptions from disclosure requirements available to emerging growth companies, this could make Rockley’s securities less attractive to investors and may make it more difficult to compare Rockley’s performance to the performance of other public companies.
Rockley is an “emerging growth company” as defined in Section 2(a)(19) of the Securities Act, as modified by the Jumpstart Our Business Startups, or JOBS Act. As such, Rockley is eligible for and intends to take advantage of certain exemptions from various reporting requirements applicable to other public companies that are not emerging growth companies for as long as it continues to be an emerging growth company, including (i) the exemption from the auditor attestation requirements with respect to internal control over financial reporting under Section 404(b) of the Sarbanes-Oxley Act, (ii) the exemptions from say-on-pay, say-on-frequency and say-on-golden parachute voting requirements and (iii) reduced disclosure obligations regarding executive compensation in its periodic reports and proxy statements. Rockley will remain an emerging growth company until the earliest of (i) the last day of the fiscal year in which the market value of Company ordinary shares that are held by non-affiliates exceeds $700 million as of June 30 of that fiscal year, (ii) the last day of the fiscal year in which it has total annual gross revenue of $1.07 billion or more during such fiscal year (as indexed for inflation), (iii) the date on which it has issued more than $1 billion in non-convertible debt in the prior three-year period or (iv) the last day of the fiscal year following the fifth anniversary of the date of the first sale of ordinary shares pursuant to an effective registration statement. In addition, Section 107 of the JOBS Act also provides that an emerging growth company can take advantage of the exemption from complying with new or revised accounting standards provided in Section 7(a)(2)(B) of the Securities Act as long as Rockley is an emerging growth company. An emerging growth company can therefore delay the adoption of certain accounting standards until those standards would otherwise apply to private companies. Rockley has elected not to opt out of such extended transition period and, therefore, Rockley may not be subject to the same new or revised accounting standards as other public companies that are not emerging growth companies. Investors may find Rockley’s ordinary shares less attractive because Rockley will rely on these exemptions, which may result in a less active trading market for Rockley’s ordinary shares and their price may be more volatile.
Several of Rockley’s directors and officers live outside the United States and certain assets of Rockley are located outside the United States; therefore, investors may not be able to enforce federal securities laws or their other legal rights.
Several of Rockley’s directors and officers reside outside of the United States and certain assets of Rockley are located outside of the United States. As a result, it may be difficult, or in some cases not possible, for investors in the United States to enforce their legal rights, to effect service of process upon Rockley or any of its directors or officers or to enforce judgments of U.S. courts predicated upon civil liabilities and criminal penalties on its directors and officers under U.S. laws, including federal securities laws.
If securities or industry analysts do not publish or cease publishing research or reports about Rockley, its business, or its market, or if they change their recommendations regarding Rockley’s securities adversely, the price and trading volume of Rockley’s securities could decline.
The trading market for Rockley’s securities will be influenced by the research and reports that industry or securities analysts may publish about Rockley, its business, market or competitors. If any of the analysts who cover Rockley change their recommendation regarding Rockley’s shares adversely, or provide more favorable relative recommendations about Rockley’s competitors, the price of Rockley’s shares would likely decline. If any analyst who covers Rockley were to cease coverage of Rockley or fail to regularly publish reports on it, Rockley could lose visibility in the financial markets, which in turn could cause its share price or trading volume to decline.
USE OF PROCEEDS
All of the Ordinary Shares and warrantsordinary shares offered by the selling securityholdersshareholders pursuant to this prospectus will be sold by the selling securityholdersshareholders for their respective accounts. We will not receive any of the proceeds from these sales. We will receive up to an aggregate of approximately $65.4 million from the exercise of the warrants and the options, assuming the exercise in full of all the warrants and options for cash. If the warrants or options are exercised pursuant to a cashless exercise feature, we will not receive any cash from these exercises. We expect to use the net proceeds from the exercise of the warrants and options, if any, for general corporate purposes.
DETERMINATION OF OFFERING PRICE
We cannot currently determine the price or prices at which our Ordinary Sharesordinary shares may be sold by the selling securityholdersshareholders under this prospectus.
MARKET INFORMATION FOR ORDINARY SHARES AND DIVIDEND POLICY
Market Information
Our Ordinary Sharesordinary shares and Public Warrants began trading on the NYSE under the symbols “RKLY” and “RKLY.WS,” respectively, on August 12, 2021. As of August 12, 2021, following the Closing,June 30, 2022, there were approximately 384128 registered holders of our Ordinary Shares, one registered holder of our convertible loan notes,ordinary shares and three10 registered holders of our Warrants. We currently do not intend to list the Private Warrants on any stock exchange or stock market.
warrants.Dividend Policy
We have not paid any cash dividends on the Ordinary Sharesour ordinary shares to date. We may retain future earnings, if any, for future operations, expansion and debt repayment and hashave no current plans to pay cash dividends for the foreseeable future. Any decision to declare and pay dividends in the future will be made at the discretion of the Board and will depend on, among other things, our results of operations, financial condition, cash requirements, contractual restrictions and other factors that the Board may deem relevant. In addition, our ability to pay dividends may beis limited by covenants of any existing outstanding indebtedness and may continue to be limited by the terms of future outstanding indebtedness we or our subsidiaries incur. We do not anticipate declaring any cash dividends to holders of the Ordinary Sharesour ordinary shares in the foreseeable future.
Securities Authorized for Issuance under Equity Compensation Plans
As of June 30, 2021,2022, we did not have any securitieshad 39,810,622 ordinary shares authorized for issuance under equity compensation plans. In connection with the Business Combination, our shareholders approved the 2021 Plan and the ESPP.other equity compensation plans.
We intend tohave filed and may in the future file one or more registration statements on FormOrdinary Sharesordinary shares issued or issuable under the 2021 Plan, the 2021 ESPP and the assumed Rockley UK Options (as defined herein). Any such Form
S-8
under the Securities Act to register the S-8
registration statement will become effective automatically upon filing. Once these shares are registered, they can be sold in the public market upon issuance, subject to applicable restrictions.34
UNAUDITED PRO FORMA CONDENSED COMBINED FINANCIAL INFORMATION
Introduction
As noted in the Consolidated Financial Statements as of and for the year ended December 31, 2021 and the related notes that are included elsewhere in this prospectus, we accounted for the Business Combination as a forward recapitalization in accordance with GAAP (the “Forward Recapitalization”). Under this method of accounting, SC Health was treated as the acquired company and Legacy Rockley was deemed to be the accounting acquirer for financial reporting purposes. Accordingly, for accounting purposes, the Forward Recapitalization was treated as the equivalent of Legacy Rockley issuing stock for the net assets of SC Health, accompanied by a recapitalization. SC Health was terminated as a registrant, and Rockley became the new SEC registrant, as such the pro forma outlined below illustrates the capital infusion (issuing stock for the net assets of SC Health, including the outstanding warrants) but do not reflect the historical financial statements of SC Health as they are not the SEC registrant in this prospectus and it is not considered an acquired business under SEC Rule3-05.
We are providing the following unaudited pro forma condensed combined financial information to aid you in your analysis of the financial aspects of the recently completedrecently-completed Business Combination. The unaudited pro forma condensed combined financial information below should be read in conjunction with the accompanying notes.
The unaudited pro forma condensed combined financial information is presented for illustrative purposes only and is not necessarily indicative of what our actual financial position or results of operations would have been had the Business Combination been completed on the dates indicated.
The unaudited pro forma condensed combined balance sheet as of June 30, 2021 combines the historical unaudited balance sheet of SC Health as of June 30, 2021 withillustrated the historical unaudited consolidated balance sheet of Rockley as of June 30, 2021 with capital infusion and the outstanding private and public warrants from the forward recapitalization, giving effect to the Business Combination as if it had been consummated on that date.
The unaudited pro forma condensed combined statement of operations for the six months ended June 30, 2021 combines the historical unaudited statement of operations of SC HealthRockley for the six months ended June 30, 2021 with the historical unaudited consolidated statementadditional expense related to the private and public warrants and other additional costs as a result of operations of Rockley for the six months ended June 30, 2021.
Business Combination.The unaudited pro forma condensed combined statement of operations for the fiscal year ended December 31, 2020 combines the historical audited statement of operations of SC HealthRockley for the fiscal year ended December 31, 2020 with the historical audited consolidated statementadditional expense related to the private and public warrants and other additional costs as a result of operations of Rockley for the fiscal year ended December 31, 2020,Business Combination, giving effect to the Business Combination as if it had been consummated on January 1, 2020.
The unaudited pro forma condensed combined financial information was derived from and should be read in conjunction with the following historical financial statements and the accompanying notes, which are included elsewhere in this prospectus:
•The historical unaudited financial statementsadditional expense related to the private and public warrants and other additional costs as a result of SC Healththe Business Combination as and for the six months ended June 30, 2021 and audited financial statements of SC Health as of and for the fiscal year ended December 31, 2020; and
•The historical unaudited consolidated financial statements of Rockley as of and for the six months ended June 30, 2021 and the historical audited consolidated financial statements of Rockley as of and for the fiscal year ended December 31, 2020.
The foregoing historical financial statements have been prepared in accordance with GAAP.
The unaudited pro forma condensed combined financial information should also be read together with “Rockley’s Management’s Discussion and Analysis of Financial Condition and Results of Operations,” and other financial information included elsewhere in this prospectus.
Description of the Business Combination
Pursuant to the Business Combination Agreement, Rockley shareholders, which includes shares issued to convert Rockley’s convertible loan notes and warrants to equity, transferred their shares in Rockley to HoldCo,Rockley, a newly formed entity. HoldCoRockley further undertook a stock split based upon an exchange ratio to align the valuation of Rockley’s shares with the valuation of the SC Health’s shares. Rockley MergerSubMerger Sub Limited (“MergerSub”Merger Sub”), another newly formed entity and a wholly owned subsidiary of HoldCo,Rockley, merged with SC Health, with SC Health surviving the merger. All SC Health’s Ordinary Sharesordinary shares outstanding immediately after the merger with Merger Sub were exchanged with HoldCoRockley for the right to receive HoldCo Ordinary SharesRockley ordinary shares and HoldCoRockley became a public company.
The aggregate merger consideration for Rockley was 114,811,411 HoldCo Ordinary SharesRockley ordinary shares at a deemed value of $10 per share for an aggregate merger consideration of $1,148.1 million.
Accounting for the Business Combination
The Business Combination is accounted for as a forward recapitalization in accordance with GAAP. Under this method of accounting, SC Health has been treated as the “acquired” company for financial reporting purposes. This determination was primarily based on current shareholders of Rockley having a relative majority of the voting power of the combined entity, and as such, having the power to appoint a majority of the member of HoldCo’sRockley’s board of directors, the operations of Rockley prior to the acquisition comprising the only ongoing operations of the combined entity and senior management of Rockley comprising the majority of the senior management of the combined entity. Accordingly, for accounting purposes, the financial statements of the combined entity represent a continuation of the financial statements of Rockley with the acquisition being treated as the equivalent of Rockley issuing stock for the net assets of SC Health, accompanied by a recapitalization. The net assets of SC Health are stated at historical cost, with no goodwill or other intangible assets recorded.
35
Other Events in Connection with the Business Combination
•The board of directors of HoldCoRockley approved and implemented a director compensation program for HoldCo’sHoldCo expectsRockley expected to grant (i) an “Initial RSU Award” to eachHoldCo’sRockley’s shareholders commencing with the 2022 annual meeting, to eachHoldCo’sRockley’s board of directors. In addition, each eligibleHoldCo’sRockley’s board of directors and respective committees. For additional information, including size of any cash retainers, and the size and vesting terms of the Initial RSU Award and Annual RSU Award, see “Management —Non-Employee—Non-Employee Director Compensation Policy.”
Rockley’s non-employee
directors (the “Director Compensation Program”). Under the Director Compensation Program, and following the filing of a registration statement on FormS-8
with respect to the 2021 Plan, non-employee
director in connection with the closing of the Business Combination and (ii) an “Annual RSU Award” following the conclusion of each regular annual meeting of non-employee
director who continues serving as a member of non-employee
director will receive an annual cash retainer in connection with their service on •Following the filing of a registration statement on FormHoldCoRockley is also expected to approve grants of stock options and RSU awards to select members of the management team. For additional information, including the size and vesting terms application to these awards, see “Executive Compensation — Equity Compensation.”
S-8
with respect to the 2021 Plan, the board of directors of •In addition, HoldCoRockley entered into new employment agreements with its executive officers, including its named executive officers. Accordingly, the effect of the new employment arrangements with HoldCo’sRockley’s executive officers has been included in the unaudited pro forma condensed combined financial information. For additional information, see “Executive Compensation —Employment— Employment Agreements.”
•All of the Rockley issued and outstanding convertible loan notes (other than certain convertible notes issued in connection with Rockley’s term facility with Argentum Securities Ireland plc), inclusive of interest accrued thereon, converted into Ordinary Sharesordinary shares of HoldCoRockley at a conversion price of $10.00 per share, and outstanding options exercisable for Rockley Ordinary Sharesordinary shares converted into options exercisable for HoldCo Ordinary SharesRockley ordinary shares (“Rockley UK Options”). On May 25, 2021, Rockley entered into an agreement in principle to amend the payment and maturity terms of the Argentum term facility such that 30% of the outstanding principal balance was converted to Ordinary Sharesordinary shares of HoldCoRockley at the time of the Business Combination and 70% which would otherwise be redeemable after the closing of the Business Combination iswas expected to mature on August 31, 2022. For additional information, see “Management’s Discussion and Analysis of Financial Condition and Results of Operations — Business Combination and Public Company Costs” and Note 167 to the notes to the condensed consolidated financial statements of Rockley Photonics Limited.
The adjustments in the unaudited pro forma condensed combined financial information have been identified and presented to provide relevant information necessary for an accurate understanding of the combined entity at closing of the Business Combination.
The unaudited pro forma condensed combined financial information is for illustrative purposes only. The financial results may have been different had the companies always been combined. You should not rely on the unaudited pro forma condensed combined financial information as being indicative of the historical results that would have been achieved had the companies always been combined or the future results that the combined entity will experience. SC Health and Rockley have not had any historical relationship prior to the transactions. Accordingly, no pro forma adjustments were required to eliminate activities between the companies.
Unaudited Pro Forma Condensed Combined Balance Sheet
As of June 30, 2021
(in thousands, except share and per share amounts)
SC Health | Rockley | Transaction Accounting Adjustments | Ref | Pro Forma Combined | Capital Infusion | Rockley | Transaction Accounting Adjustments | Ref | Pro Forma Combined | |||||||||||||||||||||||||||||||||||||||||||||||||||||||||||||
Assets | Assets | |||||||||||||||||||||||||||||||||||||||||||||||||||||||||||||||||||||
Current assets | Current assets | |||||||||||||||||||||||||||||||||||||||||||||||||||||||||||||||||||||
Cash and cash equivalents | 35 | $ | 35,395 | $ | 126,565 | A | $ | 161,995 | Cash and cash equivalents | — | $ | 35,395 | $ | 126,565 | A | $ | 161,960 | |||||||||||||||||||||||||||||||||||||||||||||||||||||
Accounts receivable | — | 2,411 | — | 2,411 | Accounts receivable | — | 2,411 | — | 2,411 | |||||||||||||||||||||||||||||||||||||||||||||||||||||||||||||
Other receivable | — | 23,037 | — | 23,037 | Other receivable | — | 23,037 | — | 23,037 | |||||||||||||||||||||||||||||||||||||||||||||||||||||||||||||
Prepaid expenses | 48 | 7,724 | — | 7,772 | Prepaid expenses | — | 7,724 | — | 7,724 | |||||||||||||||||||||||||||||||||||||||||||||||||||||||||||||
Other current assets | — | 258 | — | 258 | Other current assets | — | 258 | — | 258 | |||||||||||||||||||||||||||||||||||||||||||||||||||||||||||||
Total current assets | 83 | 68,825 | 126,565 | 195,473 | Total current assets | — | 68,825 | 126,565 | 195,390 | |||||||||||||||||||||||||||||||||||||||||||||||||||||||||||||
Property, equipment and finance lease right-of-use | — | 8,170 | — | 8,170 | Property, equipment and finance lease right-of-use assets, net | — | 8,170 | — | 8,170 | |||||||||||||||||||||||||||||||||||||||||||||||||||||||||||||
Equity method investments | — | 4,711 | — | 4,711 | Equity method investments | — | 4,711 | — | 4,711 | |||||||||||||||||||||||||||||||||||||||||||||||||||||||||||||
Intangible assets | — | 3,048 | — | 3,048 | Intangible assets | — | 3,048 | — | 3,048 | |||||||||||||||||||||||||||||||||||||||||||||||||||||||||||||
Cash and marketable securities held in trust account | 93,839 | — | (93,839 | ) | C | — | Cash and marketable securities held in trust account | 93,839 | — | (93,839 | ) | C | — | |||||||||||||||||||||||||||||||||||||||||||||||||||||||||
Other non-current assets | — | 11,715 | (8,427 | ) | E | 3,288 | Other non-current assets | — | 11,715 | (8,427 | ) | D | 3,288 | |||||||||||||||||||||||||||||||||||||||||||||||||||||||||
Total assets | 93,922 | $ | 96,469 | $ | 24,299 | $ | 214,690 | Total assets | 93,839 | $ | 96,469 | $ | 24,299 | $ | 214,607 | |||||||||||||||||||||||||||||||||||||||||||||||||||||||
Liabilities | Liabilities | |||||||||||||||||||||||||||||||||||||||||||||||||||||||||||||||||||||
Accounts payable and accrued expenses | 1,005 | $ | 20,796 | $ | (4,875 | ) | F | $ | 16,926 | Accounts payable and accrued expenses | 922 | $ | 20,796 | $ | (4,875 | ) | E | $ | 16,843 | |||||||||||||||||||||||||||||||||||||||||||||||||||
Long-term debt, current portion | — | — | 12,500 | J | 12,500 | Long-term debt, current portion | — | — | 12,500 | I | 12,500 | |||||||||||||||||||||||||||||||||||||||||||||||||||||||||||
Other current liabilities | 1,035 | 1,020 | (1,035 | ) | K | 1,020 | Other current liabilities | 1,035 | 1,020 | (1,035 | ) | J | 1,020 | |||||||||||||||||||||||||||||||||||||||||||||||||||||||||
Total current liabilities | 2,040 | 21,816 | 6,590 | 30,446 | Total current liabilities | 1,957 | 21,816 | 6,590 | 30,363 | |||||||||||||||||||||||||||||||||||||||||||||||||||||||||||||
Long-term debt, net of current portion | — | 194,328 | (183,064 | ) | L | 11,264 | Long-term debt, net of current portion | — | 194,328 | (183,064 | ) | K | 11,264 | |||||||||||||||||||||||||||||||||||||||||||||||||||||||||
Deferred underwriting fee payable | 6,038 | — | (6,038 | ) | F | — | Deferred underwriting fee payable | 6,038 | — | (6,038 | ) | E | — | |||||||||||||||||||||||||||||||||||||||||||||||||||||||||
Warrant liabilities | 32,502 | — | — | 32,502 | Warrant liabilities | 32,502 | — | — | 32,502 | |||||||||||||||||||||||||||||||||||||||||||||||||||||||||||||
Other long-term liabilities | — | 2,719 | — | 2,719 | Other long-term liabilities | — | 2,719 | — | 2,719 | |||||||||||||||||||||||||||||||||||||||||||||||||||||||||||||
Total liabilities | 40,580 | 218,863 | (182,512 | ) | 76,931 | Total liabilities | 40,497 | 218,863 | (182,512 | ) | 76,848 | |||||||||||||||||||||||||||||||||||||||||||||||||||||||||||
Class A Ordinary Shares subject to redemption | 48,342 | — | (48,342 | ) | M | — | Class A Ordinary Shares subject to redemption | 48,342 | — | (48,342 | ) | L | — | |||||||||||||||||||||||||||||||||||||||||||||||||||||||||
Shareholders’ Equity | Shareholders’ Equity | |||||||||||||||||||||||||||||||||||||||||||||||||||||||||||||||||||||
Ordinary Shares | — | — | — | N | — | Ordinary Shares | — | — | — | M | — | |||||||||||||||||||||||||||||||||||||||||||||||||||||||||||
Class A Ordinary Shares | — | — | — | N | — | Class A Ordinary Shares | — | — | — | M | — | |||||||||||||||||||||||||||||||||||||||||||||||||||||||||||
Class B Ordinary Shares | — | — | — | N | — | Class B Ordinary Shares | — | — | — | M | — | |||||||||||||||||||||||||||||||||||||||||||||||||||||||||||
Additional paid-in capital | 30,382 | 205,823 | 229,771 | N | 465,976 | Additional paid-in capital | 30,382 | 205,823 | 229,771 | M | 465,976 | |||||||||||||||||||||||||||||||||||||||||||||||||||||||||||
Accumulated deficit | (25,382 | ) | (328,217 | ) | 25,382 | O | (328,217 | ) | Accumulated deficit | (25,382 | ) | (328,217 | ) | 25,382 | N | (328,217 | ) | |||||||||||||||||||||||||||||||||||||||||||||||||||||
Total shareholders’ equity | 5,000 | $ | (122,394 | ) | $ | 255,153 | $ | 137,759 | Total shareholders’ equity | 5,000 | $ | (122,394 | ) | $ | 255,153 | $ | 137,759 | |||||||||||||||||||||||||||||||||||||||||||||||||||||
Total liabilities and shareholders’ equity | 93,922 | $ | 96,469 | $ | 24,299 | $ | 214,690 | Total liabilities and shareholders’ equity | 93,839 | $ | 96,469 | $ | 24,299 | $ | 214,607 | |||||||||||||||||||||||||||||||||||||||||||||||||||||||
See the accompanying notes to the unaudited pro forma condensed combined financial statements.
37
Unaudited Pro Forma Condensed Combined Statement of Operations
For the Six Months Ended June 30, 2021
(in thousands, except share and per share amounts)
SC Health | Rockley | Transaction Accounting Adjustments | Ref | Pro Forma Combined | Ref | Expenses Related to Capital Infusion | Rockley | Transaction Accounting Adjustments | Ref | Pro Forma Combined | Ref | ||||||||||||||||||||||||||||||||||||||||||||||||||||||||||||||
Revenue | $ | — | $ | 3,966 | $ | — | 3,966 | Revenue | $ | — | $ | 3,966 | $ | — | 3,966 | ||||||||||||||||||||||||||||||||||||||||||||||||||||||||||
Cost of revenue | — | 8,283 | — | 8,283 | Cost of revenue | — | 8,283 | — | 8,283 | ||||||||||||||||||||||||||||||||||||||||||||||||||||||||||||||||
Gross profit | — | (4,317 | ) | — | (4,317 | ) | Gross profit | — | (4,317 | ) | — | (4,317 | ) | ||||||||||||||||||||||||||||||||||||||||||||||||||||||||||||
Selling, general and administrative expenses | 1,066 | 14,020 | 198 | a | Selling, general and administrative expenses | — | 14,020 | 198 | a | ||||||||||||||||||||||||||||||||||||||||||||||||||||||||||||||||
| 1,256 | b | 1,256 | b | ||||||||||||||||||||||||||||||||||||||||||||||||||||||||||||||||||||||
| 754 | c | 17,294 | 754 | c | 16,228 | ||||||||||||||||||||||||||||||||||||||||||||||||||||||||||||||||||||
Research and development | — | 33,531 | 331 | b | 33,862 | Research and development | — | 33,531 | 331 | b | 33,862 | ||||||||||||||||||||||||||||||||||||||||||||||||||||||||||||||
Operating loss | (1,066 | ) | (51,868 | ) | (2,539 | ) | (55,473 | ) | Operating loss | — | (51,868 | ) | (2,539 | ) | (54,407 | ) | |||||||||||||||||||||||||||||||||||||||||||||||||||||||||
Interest income (expense), net | 9 | (326 | ) | (9 | ) | d | (326 | ) | Interest income (expense), net | — | (326 | ) | — | (326 | ) | ||||||||||||||||||||||||||||||||||||||||||||||||||||||||||
Other income | — | 2,860 | — | 2,860 | Other income | — | 2,860 | — | 2,860 | ||||||||||||||||||||||||||||||||||||||||||||||||||||||||||||||||
Equity method investment loss | — | (760 | ) | — | (760 | ) | Equity method investment loss | — | (760 | ) | — | (760 | ) | ||||||||||||||||||||||||||||||||||||||||||||||||||||||||||||
Change in fair value of debt instruments | — | (45,661 | ) | 45,661 | h | — | Change in fair value of debt instruments | — | (45,661 | ) | 45,661 | f | — | ||||||||||||||||||||||||||||||||||||||||||||||||||||||||||||
Realized and unrealized gain/loss on foreign currency | — | 631 | — | 631 | |||||||||||||||||||||||||||||||||||||||||||||||||||||||||||||||||||||
| Realized and unrealized gain (loss) on foreign currency | Realized and unrealized gain (loss) on foreign currency | — | 631 | — | 631 | ||||||||||||||||||||||||||||||||||||||||||||||||||||||||||||||||||||
Change in fair value of warrant liabilities | (13,447 | ) | — | — | (13,447 | ) | Change in fair value of warrant liabilities | (13,447 | ) | — | — | (13,447 | ) | ||||||||||||||||||||||||||||||||||||||||||||||||||||||||||||
Gain from termination of forward purchase agreement | 2,951 | — | (2,951 | ) | e | — | |||||||||||||||||||||||||||||||||||||||||||||||||||||||||||||||||||
Income (loss) before income taxes | (11,553 | ) | (95,124 | ) | 40,162 | (66,515 | ) | ||||||||||||||||||||||||||||||||||||||||||||||||||||||||||||||||||
| Loss before income taxes | Loss before income taxes | (13,447 | ) | (95,124 | ) | 40,162 | (65,449 | ) | |||||||||||||||||||||||||||||||||||||||||||||||||||||||||||||||||
Income tax expense | — | 210 | — | 210 | Income tax expense | — | 210 | — | 210 | ||||||||||||||||||||||||||||||||||||||||||||||||||||||||||||||||
Net income (loss) | $ | (11,553 | ) | $ | (95,334 | ) | $ | 40,162 | $ | (66,725 | ) | ||||||||||||||||||||||||||||||||||||||||||||||||||||||||||||||
| Net loss | Net loss | $ | (13,447 | ) | $ | (95,334 | ) | $ | 40,162 | $ | (65,659 | ) | |||||||||||||||||||||||||||||||||||||||||||||||||||||||||||||
Net loss per share | Net loss per share | ||||||||||||||||||||||||||||||||||||||||||||||||||||||||||||||||||||||||
Basic and diluted | $ | (0.53 | ) | f | Basic and diluted | $ | (0.52 | ) | d | ||||||||||||||||||||||||||||||||||||||||||||||||||||||||||||||||
Weighted average shares outstanding | Weighted average shares outstanding | ||||||||||||||||||||||||||||||||||||||||||||||||||||||||||||||||||||||||
Basic and diluted | 126,575,257 | g | Basic and diluted | 126,575,257 | e | ||||||||||||||||||||||||||||||||||||||||||||||||||||||||||||||||||||
See the accompanying notes to the unaudited pro forma condensed combined financial statements.
38
Unaudited Pro Forma Condensed Combined Statement of Operations
For the Fiscal year Ended December 31, 2020
(in thousands, except share and per share amounts)
SC Health (As Restated) | Rockley | Transaction Accounting Adjustments | Ref | Pro Forma Combined | Ref | Expenses related to Capital Infusion | Rockley | Transaction Accounting Adjustments | Ref | Pro Forma Combined | Ref | |||||||||||||||||||||||||||||||||||||||||||||||||||||||||||||||
Revenue | $ | — | $ | 22,343 | $ | — | 22,343 | Revenue | $ | — | $ | 22,343 | $ | — | 22,343 | |||||||||||||||||||||||||||||||||||||||||||||||||||||||||||
Cost of revenue | — | 24,240 | — | 24,240 | Cost of revenue | — | 24,240 | — | 24,240 | |||||||||||||||||||||||||||||||||||||||||||||||||||||||||||||||||
Gross profit | — | (1,897 | ) | — | (1,897 | ) | Gross profit | — | (1,897 | ) | — | (1,897 | ) | |||||||||||||||||||||||||||||||||||||||||||||||||||||||||||||
Selling, general and administrative expenses | 1,736 | 20,260 | 198 | a | Selling, general and administrative expenses | — | 20,260 | 198 | a | |||||||||||||||||||||||||||||||||||||||||||||||||||||||||||||||||
| 389 | b | 389 | b | |||||||||||||||||||||||||||||||||||||||||||||||||||||||||||||||||||||||
| 754 | c | 23,337 | 754 | c | 21,601 | |||||||||||||||||||||||||||||||||||||||||||||||||||||||||||||||||||||
Research and development | — | 35,900 | 542 | b | 36,442 | Research and development | — | 35,900 | 542 | b | 36,442 | |||||||||||||||||||||||||||||||||||||||||||||||||||||||||||||||
Operating loss | (1,736 | ) | (58,057 | ) | (1,883 | ) | (61,676 | ) | Operating loss | — | (58,057 | ) | (1,883 | ) | (59,940 | ) | ||||||||||||||||||||||||||||||||||||||||||||||||||||||||||
Interest income (expense), net | 644 | (189 | ) | (644 | ) | d | (189 | ) | Interest income (expense), net | (189 | ) | (189 | ) | |||||||||||||||||||||||||||||||||||||||||||||||||||||||||||||
Equity method investment loss | — | (1,274 | ) | — | (1,274 | ) | Equity method investment loss | — | (1,274 | ) | — | (1,274 | ) | |||||||||||||||||||||||||||||||||||||||||||||||||||||||||||||
Change in fair value of debt instruments | — | (20,163 | ) | 20,163 | h | — | Change in fair value of debt instruments | — | (20,163 | ) | 20,163 | f | — | |||||||||||||||||||||||||||||||||||||||||||||||||||||||||||||
Realized and unrealized gain/loss on foreign currency | — | (25 | ) | — | (25 | ) | ||||||||||||||||||||||||||||||||||||||||||||||||||||||||||||||||||||
| Realized and unrealized gain (loss) on foreign currency | Realized and unrealized gain (loss) on foreign currency | — | (25 | ) | — | (25 | ) | |||||||||||||||||||||||||||||||||||||||||||||||||||||||||||||||||||
Change in fair value of warrant liabilities | (5,489 | ) | — | — | (5,489 | ) | Change in fair value of warrant liabilities | (5,489 | ) | — | — | (5,489 | ) | |||||||||||||||||||||||||||||||||||||||||||||||||||||||||||||
Gain from termination of forward purchase agreement | (1,641 | ) | — | (1,641 | ) | e | — | |||||||||||||||||||||||||||||||||||||||||||||||||||||||||||||||||||
Income (loss) before income taxes | (8,222 | ) | (79,708 | ) | 19,277 | (68,653 | ) | |||||||||||||||||||||||||||||||||||||||||||||||||||||||||||||||||||
| Loss before income taxes | Loss before income taxes | (5,489 | ) | (79,708 | ) | 19,277 | (66,917 | ) | ||||||||||||||||||||||||||||||||||||||||||||||||||||||||||||||||||
Income tax expense | — | 569 | — | 569 | Income tax expense | — | 569 | — | 569 | |||||||||||||||||||||||||||||||||||||||||||||||||||||||||||||||||
Net income (loss) | $ | (8,222 | ) | $ | (80,277 | ) | $ | 19,277 | $ | (69,222 | ) | |||||||||||||||||||||||||||||||||||||||||||||||||||||||||||||||
| Net loss | Net loss | $ | (5,489 | ) | $ | (80,277 | ) | $ | 19,277 | $ | (67,486 | ) | ||||||||||||||||||||||||||||||||||||||||||||||||||||||||||||||
Net loss per share | Net loss per share | |||||||||||||||||||||||||||||||||||||||||||||||||||||||||||||||||||||||||
Basic and diluted | $ | (0.55 | ) | f | Basic and diluted | $ | (0.53 | ) | d | |||||||||||||||||||||||||||||||||||||||||||||||||||||||||||||||||
Weighted average shares outstanding | Weighted average shares outstanding | |||||||||||||||||||||||||||||||||||||||||||||||||||||||||||||||||||||||||
Basic and diluted | 126,575,257 | g | Basic and diluted | 126,575,257 | e | |||||||||||||||||||||||||||||||||||||||||||||||||||||||||||||||||||||
See the accompanying notes to the unaudited pro forma condensed combined financial statements.
39
NOTES TO UNAUDITED PRO FORMA CONDENSED COMBINED FINANCIAL INFORMATION
The pro forma adjustments have been prepared as if the Business Combination had been consummated on June 30, 2021 in the case of the unaudited pro forma condensed combined balance sheet and on January 1, 2020, the beginning of the earliest period presented in the unaudited pro forma condensed combined statement of operations.
The unaudited pro forma condensed combined financial information has been prepared assuming the following methods of accounting in accordance with GAAP.
The Business Combination is accounted for as a forward recapitalization in accordance with GAAP. Accordingly, for accounting purposes, the financial statements of the combined entity represent a continuation of the financial statements of Rockley with the acquisition being treated as the equivalent of Rockley issuing stock for the net assets of SC Health, accompanied by a recapitalization. The net assets of SC Health are stated at historical cost, with no goodwill or other intangible assets recorded.
The pro forma adjustments represent management’s estimates based on information available as of the date of this prospectus and are subject to change as additional information becomes available and additional analyses are performed. Management considers this basis of presentation to be reasonable under the circumstances.
One-time
direct and incremental transaction costs anticipated to be incurred prior to, or concurrent with, the closing of the Business Combination are reflected in the unaudited pro forma condensed combined balance sheet as a direct reduction to the combined entity’s additionalpaid-in
capital (“APIC”) and are assumed to be cash settled.The pro forma condensed combined provision for income taxes does not necessarily reflect the amounts that would have resulted had the post-combination company filed consolidated income tax returns during the periods presented.
1.Adjustments and Assumptions to the Unaudited Pro Forma Condensed Combined Balance Sheet as of June 30, 2021.
The unaudited pro forma condensed combined balance sheet as of June 30, 2021 reflects the following adjustments:
Amount | Ref | |||||
(In thousands) | ||||||
Cash inflow from PIPE Financing | $ | 100,000 | B | |||
Cash inflow from SC Health’s trust account | 17,966 | C | ||||
Cash inflow from SC Health Sponsor | 50,000 | D | ||||
Payment from SC Health’s deferred IPO fees and SC Health’s accrued transaction-related liabilities | (4,392 | ) | F | |||
Payments of estimated financing fees | (25,820 | ) | G | |||
Payments of estimated transaction fees incurred by Rockley | (5,185 | ) | H | |||
Payments of estimated transaction fees incurred by SC Health | (5,569 | ) | I | |||
Settlement of SC Health promissory note | (435 | ) | J | |||
Net Pro Forma adjustment to cash | 126,565 | A | ||||
| Amount | Ref | |||||||||||||
| (In thousands) | ||||||||||||||
| Cash inflow from PIPE financing | $ | 150,000 | B | |||||||||||
| Cash inflow from trust account | 17,966 | C | ||||||||||||
| Payment from deferred IPO fees and accrued transaction-related liabilities | (4,392 | ) | E | |||||||||||
| Payments of estimated financing fees | (25,820 | ) | F | |||||||||||
| Payments of estimated transaction fees incurred by Rockley | (5,185 | ) | G | |||||||||||
| Payments of estimated transaction fees incurred by acquiree | (5,569 | ) | H | |||||||||||
| Settlement of acquiree promissory note | (435 | ) | I | |||||||||||
| Net Pro Forma adjustment to cash | 126,565 | A | ||||||||||||
B
C
de-recognized
as a reduction to additionalpaid-in
capital at the close of the Business Combination. Refer to balance sheet adjustmentsA
N
paid-in
capital reported for the combined company.SC Health’s deferred IPO underwriting commissions | $ | 6,038 | ||
Less: IPO underwriting discount | (1,510 | ) | ||
SC Health’s deferred IPO underwriting commission paid | 4,528 | |||
SC Health’s deferred transaction fees | 1,005 | |||
Rockley’s deferred transaction fees | 5,201 | |||
Total deferred costs and accrued expenses paid at or after Business Combination close | $ | 10,734 | ||
| Deferred IPO underwriting commissions | $ | 6,038 | |||||||||
| Less: IPO underwriting discount | (1,510 | ) | |||||||||
| Deferred IPO underwriting commission paid | 4,528 | ||||||||||
| Acquiree’s deferred transaction fees | 1,005 | ||||||||||
| Rockley’s deferred transaction fees | 5,201 | ||||||||||
| Total deferred costs and accrued expenses paid at or after Business Combination close | $ | 10,734 | |||||||||
F– Represents financing fees for which payments were made upon consummation of a Business Combination.
paid-in
capital. Refer to balance sheet adjustmentspaid-in
capital reported for the combined company.paid-in
capital. Refer to balance sheet adjustmentspaid-in
capital reported for the combined company.paid-in
capital reported for the combined company.paid-in
capital of the combined company.M– Represents the net impact of the following pro forma adjustments related to (1) the Business Combination, inclusive of the issuance of HoldCoRockley Ordinary Shares for Rockley’s issued and Outstanding Ordinary Shares, stock split effected, immediately prior to the Business Combination, (2) SC Health’s issued and outstanding Class A Ordinary Shares prior to the Business Combination, (3) the PIPE Financing,financing, (4) transaction costs, and (5) certain other transactions triggered by the Business Combination on the capital accounts of the combined company:
Rockley Par Value | Acquiree Par Value | Rockley Par Value | |||||||||||||||||||||||||||||||||||||||||||||||||||||||||||
| Ordinary Shares | Class A Ordinary Shares | Class B Ordinary Shares | Ordinary Shares | Additional Paid-in Capital | Capital | ||||||||||||||||||||||||||||||||||||||||||||||||||||||||
Redemption of | — | — | — | — | (27,532 | ) | |||||||||||||||||||||||||||||||||||||||||||||||||||||||
Conversion of | — | — | — | — | — | ||||||||||||||||||||||||||||||||||||||||||||||||||||||||
PIPE financing | — | — | — | — | 150,000 | ||||||||||||||||||||||||||||||||||||||||||||||||||||||||
Conversion of Rockley’s convertible loan notes to Ordinary Shares | — | — | — | — | 170,564 | ||||||||||||||||||||||||||||||||||||||||||||||||||||||||
| Adjustment for share issuance and conversion transaction | — | — | — | — | 293,032 | ||||||||||||||||||||||||||||||||||||||||||||||||||||||||
Estimated | — | — | — | — | (4,298 | ) | |||||||||||||||||||||||||||||||||||||||||||||||||||||||
Estimated Rockley’s transaction costs | — | — | — | — | (9,741 | ) | |||||||||||||||||||||||||||||||||||||||||||||||||||||||
Estimated financing transaction costs | — | — | — | — | (25,820 | ) | |||||||||||||||||||||||||||||||||||||||||||||||||||||||
Elimination of | — | — | — | — | (23,402 | ) | |||||||||||||||||||||||||||||||||||||||||||||||||||||||
| Total adjustments to par value and additional paid-in capital | — | — | — | — | 229,771 | ||||||||||||||||||||||||||||||||||||||||||||||||||||||||
paid-in
capital.2. Adjustments to the Unaudited Pro Forma Condensed Combined Statement of Operations for the six months ended June 30, 2021 and for the Fiscal year Ended December 31, 2020
The unaudited pro forma condensed combined statement of operations for the six months ended June 30, 2021 and for the fiscal year ended December 31, 2020 reflects the following adjustments:
a
b
c
42
Six Months Ended June 30, 2021 | Year Ended December 31, 2020 | |||||||
Numerator | ||||||||
Pro forma net loss | $ | (66,725 | ) | $ | (69,222 | ) | ||
Denominator | ||||||||
Current Rockley Shareholders | 103,916,607 | 103,916,607 | ||||||
SC Health Shareholders | 1,777,150 | 1,777,150 | ||||||
Sponsor Shareholders | 10,562,500 | 10,562,500 | ||||||
PIPE Investors | 10,000,000 | 10,000,000 | ||||||
Other Shareholders (1) | 319,000 | 319,000 | ||||||
Total | $ | 126,575,257 | $ | 126,575,257 | ||||
Net loss per share | ||||||||
Basic and diluted | $ | (0.53 | ) | $ | (0.55 | ) | ||
| Six Months Ended June 30, 2021 | Year Ended December 31, 2020 | |||||||||||||||||||
| Numerator | ||||||||||||||||||||
| Pro forma net loss | $ | (65,659 | ) | $ | (67,486 | ) | ||||||||||||||
| Denominator | ||||||||||||||||||||
| Current Rockley Shareholders | 103,916,607 | 103,916,607 | ||||||||||||||||||
| Acquiree Shareholders | 1,777,150 | 1,777,150 | ||||||||||||||||||
| Sponsor Shareholders | 10,562,500 | 10,562,500 | ||||||||||||||||||
| PIPE Investors | 10,000,000 | 10,000,000 | ||||||||||||||||||
| Other Shareholders(1) | 319,000 | 319,000 | ||||||||||||||||||
| Total | $ | 126,575,257 | $ | 126,575,257 | ||||||||||||||||
| Net loss per share | ||||||||||||||||||||
| Basic and diluted | $ | (0.52 | ) | $ | (0.53 | ) | ||||||||||||||
| (1) | On September 27, 2021, the Company | ||||
MANAGEMENT’S DISCUSSION AND ANALYSIS OF FINANCIAL CONDITION AND RESULTS OF OPERATIONS
The following discussion and analysis provides information whichthat Rockley’s management believes is relevant to an assessment and understanding of Rockley’s consolidated results of operations and financial condition. The discussion should be read together with the unaudited consolidated financial statements as of and for the three months ended March 31, 2022 and 2021, the audited annual consolidated financial statements as of and for the years ended December 31, 2021 and 2020, and the related notes that arethereto, included elsewhere in this prospectus. The discussion and analysis should also be read together with our pro forma financial information for the
Emerging Growth Company Status
We are an emerging growth company (“EGC”), as defined in the JOBS Act. The JOBS Act permits companies with EGC status to take advantage of an extended transition period to comply with new or revised accounting standards, delaying the adoption of these accounting standards until they would apply to private companies. We have elected to use this extended transition period to enable us to comply with new or revised accounting standards that have different effective dates for public and private companies until the earlier of the date we (i) are no longer an emerging growth company or (ii) affirmatively and irrevocably opt out of the extended transition period provided in the JOBS Act. As a result, our financial statements may not be comparable to companies that comply with the new or revised accounting standards as of public company effective dates.
In addition, we intend to rely on the other exemptions and reduced reporting requirements provided by the JOBS Act. Subject to certain conditions set forth in the JOBS Act, if, as an EGC, we intend to rely on such exemptions, we are not required to, among other things: (i) provide an auditor’s attestation report on our system of internal controls over financial reporting pursuant to Section 404(b) of the Sarbanes-Oxley Act; (ii) provide all of the compensation disclosure that may be required of
non-emerging
growth public companies under the Dodd-Frank Wall Street Reform and Consumer Protection Act; (iii) comply with any requirement that may be adopted by the PCAOB regarding mandatory audit firm rotation or a supplement to the auditor’s report providing additional information about the audit and the financial statements (auditor discussion and analysis); and (iv) disclose certain executive compensation-related items such as the correlation between executive compensation and performance and comparisons of the Chief Executive Officer’s compensation to median employee compensation.We will remain an EGC under the JOBS Act untilfor up to five years or such time upon the earliest to occur of (i) the last day of our first fiscal year (a) following the fifth anniversary of the first sale of our Ordinary Shares in our initial public offering, (ii) the last date of our fiscal yearcommon equity securities pursuant to an effective registration statement, in which we have total annual gross revenue of at least $1.07 billion, (iii) the date onor (c) in which we are deemed to be a “largelarge accelerated filer” underfiler, which means the rulesmarket value of our ordinary shares that is held by non-affiliates exceeds $700 million as of the SEC with at least $700.0 million of outstanding securities held bynon-affiliates,or (iv)prior June 30th, and (2) the date on which we have issued more than $1.0 billion in securities during the previous three years. We expect this to occur during fiscal 2020.prior three-year period.
non-convertible
debtOverview
We have developed a unique sensing platform that we believe can reshape the wellness and healthcare industries through multiple applications in
non-invasive,
multi-modal biomarker monitoring. We believe products based on our technology platform could have the potential to unlock and accelerate advancements in areas such as early disease detection, nutrition management, and preventative healthcare delivery through continuous health and wellness monitoring.To date, we have been engaged in developing customer-specific designs of our silicon photonics chipsets for incorporation into our customers’ end products. Accordingly, all of our products are presently in the development stage and we do not currently have any of our own end products in commercial production and have not yet shipped any products commercially. Our unique sensing platform has been built upon our silicon photonics technology, which enables compelling sensor performance, power, resolution, and density. This technology has the potential to allow monitoring devices, currently the size of clinical machines, to be condensed to the size of a wearable device. We believe this in turn has the potential to unlock additional uses in consumer electronics and medical devices. The resulting combination of technologies and manufacturing
know-how
is the “full-stack Rockley Platform” which is made up of PICs in silicon with integratedIII-V
devices (devices incorporating certain conductor elements that offer superior electronic properties, such as lasers), ASICs, photonic and electronicco-packaging,
together with biosensing algorithms and AI cloud analytics, firmware/software, system architecture, and hardware design.As testament to the relevance of our product development, we have captured the attention of several consumer electronics companies and, as of the date of this prospectus, we are engaged or in contracthave established strategic relationships with entities which collectively account for over 55% market sharesix of wearable devices (of the 55%, we have an agreement with an entity that represents 42%, an MOU with an entity that represents 5%world’s top-ten largest manufacturers of smart watches and we are in discussions with entities which represent at least 8%) and over 50% market share of smartphone devices, based on a combination of data sourced from the Yole Report, the IDtechEx Report and the TrendForce Report, as well as our internal volume forecasts for smartphone, smart watch, and smart earbuds through 2025wristbands (based on customer data)volume as reported by IDC). We plan to leverage this attention to develop new capabilities in consumer wearables in the near term, and to expand over time into medical devices and other industry applications.
Our vision is to address many pressing healthcare concerns using our technology and we believe that there exists a large market opportunity for our platform. We estimate that the TAM for the consumer wearables, mobile device, and medical device markets is projected to be over $48 billion by 2025, based on data sourced from the Yole Report, the IDtexEx Report, the TrendForce Report, and our internal volume forecasts for smartphone, smart watch, and smart earbuds through 2025 (based on customer data), as the universe of healthcare and consumer wearable devices incorporating additional sensing capabilities emerges. Our target biomarkers for consumer healthcare include lactate, alcohol, glucose (indicator), carbon monoxide, blood pressure, blood oxygen, and core body temperature, among others. Our high-performance lasers have up to 1,000,000 times higher resolution, 1,000 times higher accuracy and 100 times broader range in wavelengths compared with existing LED offerings in wearable solutions (based on product analysis undertaken by Rockley comparing the Rockley silicon photonics-based spectrometer chip to existing solutions). We believe our platform will also be able to address existing applications in consumer wearable devices with significantly higher resolution, accuracy, and range. Further, we believe there are multiple additional markets
44
and concrete opportunities for our technology platform in areas such as data center connectivity (optical transceivers), machine vision (robotic and automotive LiDAR), and compute connectivity(co-packaged (co-packaged optics, or CPO).
To date, we have generated revenue primarily from NREnon-recurring engineering (“NRE”) and development services for customer-specific designs of silicon photonics chipsets for incorporation into their customers’ end products and we have financed our operations primarily through the Business Combination, issuance of convertible loan notes, as well as private placements of Ordinary Shares.ordinary shares. From the date of our formation through June 30,December 31, 2021. we have raised aggregate gross proceeds of approximately $290.0 million from the issuance of convertible loan notes and Ordinary Shares.ordinary shares. For the six
We expect both our capital and operating expenditures will increase significantly in connection with our ongoing activities, as we:
•continue to invest in our technology and our silicon photonics solutions;
•continue to develop innovative solutions and applications for our technology;
•commercialize our silicon photonics solutions;
•continue to invest in our sales and marketing activities and distribution channels;
•invest and improve our operational, financial, and management information systems;
•retain key talent and increase our headcount;
•maintain and expand our intellectual property portfolio; and
•enhance internal functions to support our operations as a public company.
Impact of
COVID-19
Thecontrolcontain and combat the spread of most or all regions throughout the world. These actions have includedinclude travel bans, quarantines, “stay-at-home” orders, and similar mandates for many individuals to substantially restrict normaldaily activities and for many businesses to curtail or cease normal operations.
COVID-19
global pandemic has prompted extraordinary measures by governments and businesses to COVID-19
inThe COVID–COVID–19 pandemic has adversely impacted our operational efficiency and caused delays in operational activities. DuringFor the second quarter ofyear ended December 31, 2021, we continue to take cautious steps to protect our workforce, support community efforts, and follow local government guidelines. Certain key laboratory employees and facilities have continued internal testing and laboratory work to the extent necessary to service customer commitments. The remaining
non-essential
workforce were recommended to continue performing their duties from home. The ongoing impact will depend on the duration of the pandemic which is being mitigated by the vaccination of the general population and gradual easing of restrictions. For more information on risks associated with theCOVID-19
pandemic and regulatory actions, see “Risk Factors — General Risks.”Comparability of Financial Information
company. As a consequence of the Business Combination, HoldCowe became anSEC-registeredand NYSE-listeda NYSE listed company, which will require itus to hire additional talentpersonnel and implement procedures and processes to address public company regulatory requirements and customary practices. HoldCo expectsWe expect to incur additional annual expenses as a public company for, among other things, directors’ and officers’ liability insurance, director fees and additional internal and external accounting, and legal and administrative resources, including increased audit, compliance, and legal fees.
Business Combination and Public Company Costs
As described in “Note 1 – Description of Business and Significant Accounting Policies” and “Note 2 – Note 2 – Business Combination” of the notes to the consolidated financial statements, we completed the Business Combination on August 11, 2021, with Legacy Rockley surviving the Business Combination as a wholly owned subsidiary of the Company.
Prior to the Business Combination, Legacy Rockley financed its operations primarily from the issuance of convertible loan notes and private placements of ordinary shares. From the date Legacy Rockley was incorporated in 2013 through August 11, 2021, the date of the consummation of the Business Combination, Legacy Rockley raised aggregate gross proceeds of approximately $290.0 million from the issuance of convertible loan notes and ordinary shares.
Upon the consummation of the Business Combination, we issued 104.0 million shares of ordinary shares for all the issued and outstanding equity interests of Legacy Rockley inclusive of ordinary shares issued the Company’s ordinary shares immediately prior to the Business Combination. In addition, certain accredited investors (including entities affiliated with the SC Health Sponsor) purchased an aggregate of 15.0 million ordinary shares for a purchase price of $10.00 per share, or an aggregate purchase price of $150.0 million. The net cash received from the Business Combination after underwriter and transaction costs was $122.5 million.
The Business Combination was accounted for as a forward recapitalization, with no goodwill or other intangible assets recorded, in accordance with GAAP. Under this method of accounting, SC Health was treated as the acquired company and Rockley was deemed to be the accounting acquirer for financial reporting purposes. This determination was primarily based on the evaluation of the following facts and circumstances:
•Legacy Rockley’s existing shareholders hold a majority voting interest in the combined company, and as such, have the power to appoint a majority of the members of the Company’s Board;
•Legacy Rockley’s senior management team comprise the majority of the senior management of the combined company;
•Legacy Rockley is the larger of the companies based on historical operating activity and employee base; and
45
•Legacy Rockley’s operations comprise the ongoing operations of the combined entity.
Accordingly, for accounting purposes, the financial statements of the Company represent a continuation of the financial statements of Legacy Rockley with the acquisition being treated as the equivalent of Rockley issuing stock for the net assets of SC Health, accompanied by a recapitalization.
As a consequence of the Business Combination, the Company became an SEC-registered and NYSE-listed company, which requires us to hire additional talent and implement procedures and processes to address public company regulatory requirements and customary practices. We expect to incur incremental annual expenses as a public company for, among other things, increased directors’ and officers’ liability insurance; director fees; and additional internal and external accounting, legal, and administrative resources.
Key Factors Affecting Operating Results
We believe that our performance and future success depend on several factors that present significant opportunities for us but also pose risks and challenges, including, without limitation, the following:
Resource Constraints
Our products are currently under development and we do not have any products in commercial production. Our ability to achieve our product roadmaps and development timelines, including our ability to commence commercial production of our products, may be impacted by resource constraints, including the need for additional capital. We have a history of losses and our determination of substantial doubt as a going concern could materially limit our ability to raise additional funds through the issuance of equity securities or otherwise. Further, our products must also meet certain technical standards and customer requirements, which in turn require additional funds and other resources. Additional financing and resources may not be available to us when needed or on commercially reasonable terms.
Ability to Achieve Design Wins or Long-Term Production Contracts
We may engage in discussions with customers and
co-develop
products but we may not be able to convert the relationship into a design win or a long-term production contract due to resource constraints, delays, or technical challenges. We work closely with our customers and potential customers to understand their product roadmaps and strategies. Our customers also continuously develop new products in existing and new application areas. We believe achieving design wins and the ability to secure long-term production contracts will be critical to our future success. The selection process is typically lengthy and may require us to incur significant design and development expenditures in pursuit of a design win with no assurance that our products will be selected. The failure to secure a design win or long-term production contract could adversely affect our business.Customer Orders and Forecasts
We currently anticipate that sales of our future products will be made pursuant to standard purchase orders, which may be cancelled, reduced, or rescheduled with little or no notice and without penalty. Cancellations of orders could result in the loss of anticipated sales without allowing us sufficient time to reduce our inventory and operating expenses. In addition, changes in forecasts or the timing of orders from customers, including if and when we commence commercial production of our products, could expose us to the risks of inventory shortages or excess inventory.
Pricing and Customer Demand
We expect our operating results, including if and when we commence commercial production of our products, will be impacted by the pricing of our products, our average selling prices, and fluctuations in customer purchasing volumes. If and when we begin commercial production of our products, we may not be able to fulfill customer demand in a timely manner or at all. We monitor and work to reduce our product manufacturing costs and improve the potential value our products can provide to our customers’ end products. The cost of raw materials and components critical for the manufacture of our anticipated products is largely out of our control and may fluctuate significantly. Since we rely on third-party wafer foundries and assembly and test contractors to manufacture, assemble, and test our products, we maintain a close relationship with our suppliers to improve quality, increase yields, and lower manufacturing costs.
New Markets and Applications
As we evaluate potential markets and applications for the products we are developing, we analyze forecasts by industry analysts, the adoption curve of technology, and potential competing forces that could hinder such adoption. If we fail to anticipate or respond to technological shifts or market demands, or to timely develop products or technologies in response to the same, it could result in our inability to achieve revenue growth and could harm our business and operations.
Cyclical Nature of the Semiconductor Industry
The semiconductor industry is highly cyclical and is characterized by constant and rapid technological change, rapid product obsolescence, price erosion, evolving standards, short product life cycles, and wide fluctuations in product supply and demand. Downturns in the semiconductor industry have been characterized by diminished product demand, production overcapacity, high inventory levels, and accelerated erosion of average selling prices. Any prolonged or significant downturn in the semiconductor industry generally could adversely affect our business and reduce demand for our products and otherwise harm our financial condition and results of operations.
See the “Risk“Risk Factors” section of this prospectus for additional discussion of the risks and challenges facing our business.
Basis of Presentation
46
Currently, we conduct business through one operating and reportable segment. All long-lived assets are maintained in, and all losses are attributable to the one segment.
See Note 1 in our accompanying audited consolidated financial statements for more information about our operating segment.Components of Results of Operations
The following discusses certain line items in Rockley’s condensedour consolidated statements of operations.
operations and comprehensive loss.Revenue
To date, we have primarily generated revenue from development services, which entail developing customer-specific designs of silicon photonics chipsets. Our contracts with customers include specific achievement of agreed-upon projects and a substantive acceptance criteria for each agreed-upon project. In the event an agreed-upon project is successful and the customer provides acceptance, we allocate the contract consideration related to the performance obligations that are satisfied during the period and recognize the revenue at that point in time.
Following the completion of our product development phase and introduction of our spectra-sense chipsets to the wearable devices market, we expect the majority of our revenue to be derived from sales of high-volume consumer wearable products. In addition, we plan to offer advanced module applications with biomarker detection capabilities for advanced health metrics that can detect, classify, and potentially prevent disease. We also expect to offer a cloud analytics platform to provide a full range of subscription services, including the deployment of our technology through a subscription and cloud-based software as a service.
Cost of Revenue
To date, our cost of revenue has included cost related to our development services, which include cost of materials, cost associated with packaging and assembly, testing and shipping, cost of talent, including stock-based compensation, and equipment associated with manufacturing support, logistics, and quality assurance, overhead, and occupancy costs. Once we commence commercial production of our silicon photonics chipsets, cost of revenues will include direct parts, material, and labor costs, manufacturing overhead, including amortized tooling costs, shipping and logistics costs, and reserves for estimated warranty expenses.
Gross Profit and Gross Margin
Gross profit is calculated based on the difference between our revenue and cost of revenue. Gross margin is the percentage obtained by dividing gross profit by our revenue. As we approach commercial production of spectra-sense chipsets, advanced module applications, and Rockley Photonics Cloud Analytics technology, we expect our gross profit and gross margin to vary.
Selling, General, and Administrative Expense
Selling, general, and administrative expenses consist of human capital related expenses for employees involved in general corporate functions, including executive management and administration, accounting, finance, tax, legal, information technology, marketing, and human resources; depreciation expense and rent relating to facilities; travel costs; professional fees; and other general corporate costs. Human capital expenses primarily include salaries, benefits, bonuses, and stock-based compensation. We expect our selling, general and administrative expense to increase in absolute dollars for the foreseeable future as we increase our headcount to support the growth of our business, and as a result of operating as a public company, including compliance with the rules and regulations of the SEC, legal, audit, additional general and director and officer insurance expenses, investor relations activities, and other administrative and professional services.
Research and Development Expense
Research and development expense consists primarily of talent costs for engineers and third parties engaged in the design and development of products, software, and technologies, including salary, bonus, and stock-based compensation expense, project material costs, services, and depreciation of our research and development facilities and equipment. We expense research and development costs as they are incurred. Research and development expense also includes the research and development tax credits that we are able to claim in accordance with the relevant U.K. tax legislation. These tax credits are payable to us in cash and are carried on the consolidated balance sheets at the amount claimed and expected to be received from the U.K. government within the next 12 months. We expect research and development expense to increase in absolute dollars as we continue to invest in the development of our products and technology.
Other incomeIncome (Expense)
Other income consists of miscellaneous
non-operating
items, such as forgiveness of debt and related accrued interest.Interest Income (Expense)
Interest income consists primarily of interest received or earned on our cash, cash equivalents, and investment balances held in interest-bearing deposit accounts. Interest expense consists of interest paid on our convertible loan notes and capital lease obligations.
Equity Method Investment
47
Equity method investments consist of entities over which we have significant influence but not control or joint control. Under the equity method of accounting, all of our investments are initially recognized at cost and adjusted thereafter to recognize our share of the post-acquisition profits or losses of the investee in our consolidated statements of operations.
Change in Fair Value of Debt Instruments
Gains or losses from the change in fair value of debt instruments are recorded from the remeasurement of the fair value of our convertible loan notes using a discounted cash flow and binomial lattice methodologiesmethodology based upon certain valuation assumptions.
Change in Fair Value of Warrant Liabilities
Gain (Loss) on Foreign Currency
We have significant international operations that are denominated in foreign currencies, primarily the British Pound and Euro, subjecting us to foreign currency exchange risk that may adversely impact our financial results. We calculate the year-over-year impact of foreign currency movement on our business using foreign currency exchange rates that are applied to transactional currency amounts.
Provision for Income Tax
We are subject to income taxes in the United Kingdom, the United States, Finland, Ireland, and Switzerland. Our income tax provision consists of an estimate of federal, state, and foreign income taxes based on enacted federal, state, and foreign tax rates, as adjusted for allowable credits, deductions, uncertain tax positions, changes in the valuation of our deferred tax assets and liabilities, and changes in tax laws. Due to cumulative losses, we maintain a valuation allowance against our U.S. federal and foreign deferred tax assets.
48
Results of Operations for the Three and Six Months Ended June 30, 2021March 31, 2022 Compared to the Three and Six Months Ended June 30, 2020March 31, 2021
The following table sets forth our historical operating results for the periods indicated (in thousands):
| Three Months Ended March 31, | |||||||||||
| 2022 | 2021 | ||||||||||
| Revenue | $ | 962 | $ | 1,771 | |||||||
| Cost of revenue | 3,395 | 3,734 | |||||||||
| Gross profit | (2,433) | (1,963) | |||||||||
| Operating expenses: | |||||||||||
| Selling, general, and administrative expenses | 10,938 | 7,305 | |||||||||
| Research and development expenses | 24,802 | 15,980 | |||||||||
| Total operating expenses | 35,740 | 23,285 | |||||||||
| Loss from operations | (38,173) | (25,248) | |||||||||
| Other income (expense): | |||||||||||
| Other expense | (14) | — | |||||||||
| Interest expense, net | (2,653) | (147) | |||||||||
| Gain (loss) on equity method investment | 207 | (163) | |||||||||
| Change in fair value of debt instruments | — | (39,653) | |||||||||
| Change in fair value of warrant liabilities | 211 | — | |||||||||
| (Loss) gain on foreign currency | (1,228) | 534 | |||||||||
| Total other expense | (3,477) | (39,429) | |||||||||
| Loss before income taxes | (41,650) | (64,677) | |||||||||
| Provision for income tax | 131 | 100 | |||||||||
| Net loss | $ | (41,781) | $ | (64,777) | |||||||
49
Three Months Ended June 30, | Six Months Ended June 30, | |||||||||||||||
2021 | 2020 | 2021 | 2020 | |||||||||||||
Revenue | $ | 2,195 | $ | 7,881 | $ | 3,966 | $ | 14,544 | ||||||||
Cost of revenue | 4,549 | 6,522 | 8,283 | 13,085 | ||||||||||||
Gross profit | (2,354 | ) | 1,359 | (4,317 | ) | 1,459 | ||||||||||
Operating expenses: | ||||||||||||||||
Selling, general and administrative expenses | 6,715 | 3,604 | 14,020 | 7,249 | ||||||||||||
Research and development expenses | 17,551 | 7,746 | 33,531 | 16,217 | ||||||||||||
Total operating expenses | 24,266 | 11,350 | 47,551 | 23,466 | ||||||||||||
Loss from operations | (26,620 | ) | (9,991 | ) | (51,868 | ) | (22,007 | ) | ||||||||
Other income (expense): | ||||||||||||||||
Other income, net | 2,860 | — | 2,860 | — | ||||||||||||
Interest expense, net | (179 | ) | (34 | ) | (326 | ) | (74 | ) | ||||||||
Equity method investment loss | (597 | ) | (102 | ) | (760 | ) | (252 | ) | ||||||||
Change in fair value of debt instruments | (6,008 | ) | 312 | (45,661 | ) | (2,222 | ) | |||||||||
Gain (loss) on foreign currency | 97 | (108 | ) | 631 | (1,654 | ) | ||||||||||
Total other income (expense) | (3,827 | ) | 68 | (43,256 | ) | (4,202 | ) | |||||||||
Loss before income taxes | (30,447 | ) | (9,923 | ) | (95,124 | ) | (26,209 | ) | ||||||||
Provision for income tax | 110 | 80 | 210 | 220 | ||||||||||||
Net loss and comprehensive loss | $ | (30,557 | ) | $ | (10,003 | ) | $ | (95,334 | ) | $ | (26,429 | ) | ||||
Discussion and Analysis of Results of Operations
Revenue (in thousands, except for percentages)
| Three Months Ended March 31, | Change | ||||||||||||||||||||||
| 2022 | 2021 | $ | % | ||||||||||||||||||||
| Revenue | $ | 962 | $ | 1,771 | $ | (809) | (46) | % | |||||||||||||||
Three Months Ended June 30, | Change | Six Months Ended June 30, | Change | |||||||||||||||||||||||||||||
2021 | 2020 | $ | % | 2021 | 2020 | $ | % | |||||||||||||||||||||||||
Revenue | $ | 2,195 | $ | 7,881 | $ | (5,686 | ) | (72 | )% | $ | 3,966 | $ | 14,544 | $ | (10,578 | ) | (73 | )% | ||||||||||||||
Revenue decreased by $5.7$0.8 million, or 72%46%, to $2.2$1.0 million for the three months ended June 30, 2021March 31, 2022 from $7.9$1.8 million for the three months ended June 30, 2020. Revenue decreased by $10.6 million, or 73%, to $4.0 million for the six months ended June 30, 2021 from $14.5 million for the six months ended June 30, 2020.March 31, 2021. This decrease is primarily driven by an ongoing backlog of project deliverables in fiscal 2021March 31, 2022 when compared to fiscal 2020March 31, 2021 where we completed and delivered on project milestones for our significant customers.
To date, we have primarily generated revenue from development services, which entail developing customer-specific designs of silicon photonics chipsets. Our contracts with customers include specific achievement of agreed-upon projects and a substantive acceptance criteria for each agreed-upon project. In the event an agreed-upon project is successful and the customer provides acceptance, we allocate the contract consideration related to the performance obligations that are satisfied during the period and recognize the revenue at that point in time.
Cost of Revenue and Gross Profit (in thousands, except for percentages)
| Three Months Ended March 31, | Change | ||||||||||||||||||||||
| 2022 | 2021 | $ | % | ||||||||||||||||||||
| Cost of revenue | $ | 3,395 | $ | 3,734 | $ | (339) | (9) | % | |||||||||||||||
| Gross Profit | (2,433) | (1,963) | (470) | 24 | % | ||||||||||||||||||
| Gross Margin | (253) | % | (111) | % | NM | NM | |||||||||||||||||
Three Months Ended June 30, | Change | Six Months Ended June 30, | Change | |||||||||||||||||||||||||||||
2021 | 2020 | $ | % | 2021 | 2020 | $ | % | |||||||||||||||||||||||||
Cost of revenue | $ | 4,549 | $ | 6,522 | $ | (1,973 | ) | (30 | )% | $ | 8,283 | $ | 13,085 | $ | (4,802 | ) | (37 | )% | ||||||||||||||
Gross Profit | $ | (2,354 | ) | $ | 1,359 | $ | (3,713 | ) | (273 | )% | $ | (4,317 | ) | $ | 1,459 | $ | (5,776 | ) | (396 | )% | ||||||||||||
Gross Margin | (107 | )% | 17 | % | NM | NM | (109 | )% | 10 | % | NM | NM | ||||||||||||||||||||
NM – Not meaningful
Cost of revenue decreased by $2.0$0.3 million, or 30%9%, to $4.5$3.4 million for the three months ended June 30, 2021March 31, 2022 from $6.5$3.7 million for the three months ended June 30, 2020.March 31, 2021. This decrease in cost of revenue was primarily driven by a decrease of $2.5 million from engineering, fab partner, and stock-based compensation costs. The decrease was partially offset by $1.0$0.2 million in research and development tax credits and grants we received in 2021 comparedhuman capital due to the prior period due to lower claims for ourallocation of headcount into products that are considered part of research and development activities. Gross profit decreased by $3.7$0.5 million, or 273%24% to $(2.4)$2.4 million for the three months ended June 30, 2021March 31, 2022 from $1.4$(2.0) million for the three months ended June 30, 2020.March 31, 2021. The decrease in gross profit was primarily driven by an overall decrease in revenue for the three months ended June 30, 2021 and higher costs incurred on product development activities.March 31, 2022.
Our gross margin has fluctuated and may fluctuate from period to period based on a number of factors, including the timing of completion of project milestones with each project requiring differing levels of time and costs. The projects we undertake are determined by our customer commitments and our long-term strategy goals.
To date, our cost of revenue has included cost related to our development services, which include cost of materials, cost associated with packaging and assembly, testing and shipping, cost of talent, including stock-based compensation, and equipment associated with manufacturing support, logistics, and quality assurance, overhead, and occupancy costs. Once we commence commercial production of our silicon photonics chipsets, cost of revenues will include direct parts, material, and labor costs, manufacturing overhead, including amortized tooling costs, shipping and logistics costs, and reserves for estimated warranty expenses.
Gross profit is calculated based on the difference between our revenue and cost of revenue. Gross margin is the percentage obtained by dividing gross profit by our revenue. As we approach commercial production of spectra-sense chipsets, advanced module applications, and Rockley Photonics Cloud Analytics technology, we expect our gross profit and gross margin to vary.
Selling, General and Administrative Expenses (in thousands, except for percentages)
Three Months Ended June 30, | Change | Six Months Ended June 30, | Change | |||||||||||||||||||||||||||||
2021 | 2020 | $ | % | 2021 | 2020 | $ | % | |||||||||||||||||||||||||
Selling, general and administrative expenses | $ | 6,715 | $ | 3,604 | $ | 3,111 | 86 | % | $ | 14,020 | $ | 7,249 | $ | 6,771 | 93 | % | ||||||||||||||||
| Three Months Ended March 31, | Change | ||||||||||||||||||||||
| 2022 | 2021 | $ | % | ||||||||||||||||||||
| Selling, general, and administrative expenses | $ | 10,938 | $ | 7,305 | $ | 3,633 | 50 | % | |||||||||||||||
Selling, general and administrative expenses increased by $3.1$3.6 million, or 86%50%, to $6.7$10.9 million for the three months ended June 30, 2021March 31, 2022 from $3.6$7.3 million for the three months ended June 30, 2020.March 31, 2021. The increase was
primarily due to general corporate growth, of which $0.7$1.8 million was from additional professional fees relateddue to accounting, legal and audit matters, and $1.5increase of insurance expense, $1.7 million and $0.1$0.4 million were due to increased human capital and stock-based compensation costs, respectively.
Selling, general, and administrative expenses increased by $6.8 million, or 93%,consist of human capital related expenses for employees involved in general corporate functions, including executive management and administration, accounting, finance, tax, legal, information technology, marketing, and
50
human resources; depreciation expense and rent relating to $14.0 millionfacilities; travel costs; professional fees; and other general corporate costs. Human capital expenses primarily include salaries, benefits, bonuses, and stock-based compensation. We expect our selling, general and administrative expense to increase in absolute dollars for the six months ended June 30, 2021 from $7.2 million forforeseeable future as we increase our headcount to support the six months ended June 30, 2020. The increase was primarily due to general corporate growth of which $2.9 million was fromour business, and as a result of operating as a public company, including compliance with the rules and regulations of the SEC, legal, audit, additional general and director and officer insurance expenses, investor relations activities, and other administrative and professional fees related to accounting, legal and audit matters, and $2.2 million and $0.1 million were due to increased human capital and stock-based compensation costs, respectively.
services.Research and Development Expenses (in thousands, except for percentages)
| Three Months Ended March 31, | Change | ||||||||||||||||||||||
| 2022 | 2021 | $ | % | ||||||||||||||||||||
| Research and development expenses | $ | 24,802 | $ | 15,980 | $ | 8,822 | 55 | % | |||||||||||||||
Three Months Ended June 30, | Change | Six Months Ended June 30, | Change | |||||||||||||||||||||||||||||
2021 | 2020 | $ | % | 2021 | 2020 | $ | % | |||||||||||||||||||||||||
Research and development expenses | $ | 17,551 | $ | 7,746 | $ | 9,805 | 127 | % | $ | 33,531 | $ | 16,217 | $ | 17,314 | 107 | % | ||||||||||||||||
Research and development expenses increased by $9.8$8.8 million, or 127%55%, to $17.6$24.8 million for the three months ended June 30, 2021March 31, 2022 from $7.7$16.0 million for the three months ended June 30, 2020.March 31, 2021. The increase was primarily attributable to growth of $3.6$0.5 million from engineering, fab partner,partners, and engineering research and development headcount. This also led to an increase in human capital and stock-based compensation expenses of $4.4$5.0 million and $0.2$1.9 million, respectively. TheIn addition, the increase was partially offsetis also driven by a decrease of $0.9$1.0 million in research and development tax credits and grants we received in 2021 compared to the prior period due to lowerhigher claims for our research and development activities.activities in 2022.
Research and development expenses increased by $17.3 million, or 107%, to $33.5 millionexpense consists primarily of talent costs for engineers and third parties engaged in the six months ended June 30, 2021 from $16.2 million for the six months ended June 30, 2020. The increase was primarily attributable to growthdesign and development of $8.6 million from engineering, fab partner,products, software, and engineeringtechnologies, including salary, bonus, and stock-based compensation expense, project material costs, services, and depreciation of our research and development headcount. Thisfacilities and equipment. We expense research and development costs as they are incurred. Research and development expense also led to an increase in human capital and stock-based compensation expenses of $6.6 million and $0.8 million, respectively. The increase was partially offset by a decrease of $1.4 million inincludes the research and development tax credits that we are able to claim in accordance with the relevant U.K. tax legislation. These tax credits are payable to us in cash and grants weare carried on the consolidated balance sheets at the amount claimed and expected to be received in 2021 compared tofrom the prior period due to lower claims for ourU.K. government within the next 12 months. We expect research and development activities.expense to increase in absolute dollars as we continue to invest in the development of our products and technology.
Other income, net (in thousands, except for percentages)
| Three Months Ended March 31, | Change | ||||||||||||||||||||||
| 2022 | 2021 | $ | % | ||||||||||||||||||||
| Other income, net | $ | (14) | $ | — | $ | (14) | 100 | % | |||||||||||||||
Three Months Ended June 30, | Change | Six Months Ended June 30, | Change | |||||||||||||||||||||||||||||
2021 | 2020 | $ | % | 2021 | 2020 | $ | % | |||||||||||||||||||||||||
Other income, net | $ | 2,860 | — | $ | 2,860 | 100 | % | $ | 2,860 | $ | — | $ | 2,860 | 100 | % | |||||||||||||||||
Other income, net for the three months ended March 31, 2022 includes a loss we realized on the sale of available-for-sale debt securities during the three and six months ended June 30, 2021 consistedperiod.
Other income consists of debtmiscellaneous non-operating items, such as realized gain/(losses) on investments, forgiveness of the $2.9 million PPP Loandebt and related accrued interest.
Interest Expense, net (in thousands, except for percentages)
| Three Months Ended March 31, | Change | ||||||||||||||||||||||
| 2022 | 2021 | $ | % | ||||||||||||||||||||
| Interest expense, net | $ | (2,653) | $ | (147) | $ | (2,506) | 1,705 | % | |||||||||||||||
Three Months Ended June 30, | Change | Six Months Ended June 30, | Change | |||||||||||||||||||||||||||||
2021 | 2020 | $ | % | 2021 | 2020 | $ | % | |||||||||||||||||||||||||
Interest expense, net | $ | (179 | ) | $ | (34 | ) | $ | (145 | ) | 426 | % | $ | (326 | ) | $ | (74 | ) | $ | (252 | ) | 341 | % | ||||||||||
Interest income consists primarily of interest received or earned on our cash, cash equivalents, and 2020.
investment balances held in interest-bearing deposit accounts. Interest expense net increased by $0.1 millionconsists of interest paid on our Term Facility Loan and $0.3 million, or 426% and 341%, for the three and six months ended June 30, 2021, respectively, when compared to the same periods of fiscal 2020. The increase was primarily driven by an increase in our outstanding convertible loan balance in 2021.
capital lease obligations.Gain/(Loss) on Equity Method Investment Loss (in thousands, except for percentages)
| Three Months Ended March 31, | Change | ||||||||||||||||||||||
| 2022 | 2021 | $ | % | ||||||||||||||||||||
| Equity method investment loss | $ | 207 | $ | (163) | $ | 370 | (227) | % | |||||||||||||||
Three Months Ended June 30, | Change | Six Months Ended June 30, | Change | |||||||||||||||||||||||||||||
2021 | 2020 | $ | % | 2021 | 2020 | $ | % | |||||||||||||||||||||||||
Equity method investment loss | $ | (597 | ) | $ | (102 | ) | $ | (495 | ) | 485 | % | $ | (760 | ) | $ | (252 | ) | $ | (508 | ) | 202 | % | ||||||||||
Change in equity method investment captures our share of lossesgains/(losses) of the investment in Hengtong Rockley Technology Co., Ltd (“HRT”)HRT according to our percentage of ownership.
51
Equity method investments consist of entities over which we have significant influence but not control or joint control. Under the equity method of accounting, all of our investments are initially recognized at cost and adjusted thereafter to recognize our share of the post-acquisition profits or losses of the investee in our consolidated statements of operations.
Change in Fair Value of Debt Instruments (in thousands, except for percentages)
| Three Months Ended March 31, | Change | ||||||||||||||||||||||
| 2022 | 2021 | $ | % | ||||||||||||||||||||
| Change in fair value of debt instruments | $ | — | $ | (39,653) | $ | 39,653 | (100) | % | |||||||||||||||
Three Months Ended June 30, | Change | Six Months Ended June 30, | Change | |||||||||||||||||||||||||||||
2021 | 2020 | $ | % | 2021 | 2020 | $ | % | |||||||||||||||||||||||||
Change in fair value of debt instruments | $ | (6,008 | ) | $ | 312 | $ | (6,320 | ) | (2,026 | )% | $ | (45,661 | ) | $ | (2,222 | ) | $ | (43,439 | ) | 1,955 | % | |||||||||||
Change in fair value of debt instruments captures losses from a change in fair value estimates using discounted cash flow and binomial lattice methodologies that are based upon a set of valuation assumptions. The key assumptions usedAs of March 31, 2022, there were no debt instruments requiring fair value adjustments. All convertible debt instruments previously held by the Company were converted to ordinary shares in valuation include default rates from historical performance, risk-free rates, expected volatility rates, and discount rates that reflect estimatesthe Company as part of the ratesBusiness Combination, completed in August 2021.
Change in Fair Value of return that investors would require when investingWarrant Liabilities (in thousands, except for percentages)
| Three months ended March 31, | Change | ||||||||||||||||||||||
| 2022 | 2021 | $ | % | ||||||||||||||||||||
| Change in fair value of warrants | $ | 211 | $ | — | $ | 211 | 100 | % | |||||||||||||||
Change in other convertible debt with similar characteristics. Thefair value of warrant liabilities captures activity from a change in fair value estimates based upon a set of debt instruments is a resultvaluation assumptions. The Private Placement Warrants were assumed from SC Health and recorded as part of the difference in value between the initial issuanceBusiness Combination and subsequent fair value measurements.therefore there was no prior year balance.
Gain (Loss) on Foreign Currency (in thousands, except for percentages)
Three Months Ended June 30, | Change | Six Months Ended June 30, | Change | |||||||||||||||||||||||||||||
2021 | 2020 | $ | % | 2021 | 2020 | $ | % | |||||||||||||||||||||||||
Gain (loss) on foreign currency | $ | 97 | $ | (108 | ) | $ | 205 | (190 | )% | $ | 631 | $ | (1,654 | ) | $ | 2,285 | (138 | )% | ||||||||||||||
| Three Months Ended March 31, | Change | ||||||||||||||||||||||
| 2022 | 2021 | $ | % | ||||||||||||||||||||
| Gain/(loss) on foreign currency | $ | (1,228) | $ | 534 | $ | (1,762) | (330) | % | |||||||||||||||
Change in gain (loss) on foreign currency captures lossesactivity from the impact of foreign currency exchange rates as a result of the translation of foreign functional currencies into our reporting currency and theand six months ended June 30,March 31, 2022 and 2021, and 2020, most of our balances are held in the reporting currency, which decrease the impact of foreign currency fluctuations on the results of our operations.
re-measurement
of foreign currency transactions and balances. During the three We have significant international operations that are denominated in foreign currencies, primarily the British Pound and Euro, subjecting us to foreign currency exchange risk that may adversely impact our financial results. We calculate the year-over-year impact of foreign currency movement on our business using foreign currency exchange rates that are applied to transactional currency amounts.
Provision for Income Tax (in thousands, except for percentages)
| Three Months Ended March 31, | Change | ||||||||||||||||||||||
| 2022 | 2021 | $ | % | ||||||||||||||||||||
| Provision for income tax | $ | 131 | $ | 100 | $ | 31 | 31 | % | |||||||||||||||
Three Months Ended June 30, | Change | Six Months Ended June 30, | Change | |||||||||||||||||||||||||||||
2021 | 2020 | $ | % | 2021 | 2020 | $ | % | |||||||||||||||||||||||||
Provision for income tax | $ | 110 | $ | 80 | $ | 30 | 38 | % | $ | 210 | $ | 220 | $ | (10 | ) | (5 | )% | |||||||||||||||
Change in provision for income tax expense was immaterial for the three and six months ended June 30, 2021 and 2020.March 31, 2022 is due to an overall increase in expenditures. The effective income tax rate was less than 1.0% for the three and six months ended June 30,
We are subject to income taxes in the United Kingdom, the United States, Finland, Ireland, and Switzerland. Our income tax provision consists of an estimate of federal, state, and foreign income taxes based on enacted federal, state, and foreign tax rates, as adjusted for allowable credits, deductions, uncertain tax positions, changes in the valuation of our deferred tax assets and liabilities, and changes in tax laws. Due to cumulative losses, we maintain a valuation allowance against our U.S. federal and foreign deferred tax assets.
52
Results of Operations for the Years Ended December 31, 20202021 and 20192020
The following table sets forth our historical operating results for the periods indicated (in thousands):
| Years Ended December 31, | |||||||||||
| 2021 | 2020 | ||||||||||
| Revenue | $ | 8,213 | $ | 22,343 | |||||||
| Cost of revenue | 11,416 | 24,240 | |||||||||
| Gross profit | (3,203) | (1,897) | |||||||||
| Operating expenses: | |||||||||||
| Selling, general, and administrative expenses | 39,976 | 20,260 | |||||||||
| Research and development expenses | 72,573 | 35,900 | |||||||||
| Total operating expenses | 112,549 | 56,160 | |||||||||
| Loss from operations | (115,752) | (58,057) | |||||||||
| Other income (expense): | |||||||||||
| Forgiveness of PPP loan | 2,860 | — | |||||||||
| Interest expense, net | (4,781) | (189) | |||||||||
| Equity method investment loss | (703) | (1,274) | |||||||||
| Change in fair value of debt instruments | (59,916) | (20,163) | |||||||||
| Change in fair value of warrant liabilities | 10,827 | — | |||||||||
| Gain (loss) on foreign currency | 119 | (25) | |||||||||
| Total other income (expense) | (51,594) | (21,651) | |||||||||
| Loss before income taxes | (167,346) | (79,708) | |||||||||
| Provision for income tax | 667 | 569 | |||||||||
| Net loss and comprehensive loss | $ | (168,013) | $ | (80,277) | |||||||
53
Years Ended December 31, | ||||||||
2020 | 2019 | |||||||
Consolidated Statements of Operations and Loss Data: | ||||||||
Revenue | $ | 22,343 | $ | 20,492 | ||||
Cost of revenue | 24,240 | 30,705 | ||||||
Gross Profit | (1,897 | ) | (10,213 | ) | ||||
Operating expenses: | ||||||||
Selling, general and administrative expenses | 20,260 | 13,306 | ||||||
Research and development expenses | 35,900 | 22,303 | ||||||
Operating loss | (58,057 | ) | (45,822 | ) | ||||
Other income (expense): | ||||||||
Interest income (expense), net | (189 | ) | (747 | ) | ||||
Equity method investment loss | (1,274 | ) | (1,281 | ) | ||||
Change in fair value of debt instruments | (20,163 | ) | 2,969 | ) | ||||
Gain (loss) on foreign currency | (25 | ) | 280 | |||||
Loss before provision for income tax | (79,708 | ) | (50,539 | ) | ||||
Provision for income tax | 569 | 311 | ||||||
Net loss and comprehensive loss | $ | (80,277 | ) | $ | (50,850 | ) | ||
Discussion and Analysis of Results of Operations
Revenue (in thousands, except for percentages)
| Years Ended December 31, | Change | ||||||||||||||||||||||
| 2021 | 2020 | $ | % | ||||||||||||||||||||
| Revenue | $ | 8,213 | $ | 22,343 | $ | (14,130) | (63) | % | |||||||||||||||
Years Ended December 31, | Change | |||||||||||||||
2020 | 2019 | $ | % | |||||||||||||
Revenue | $ | 22,343 | $ | 20,492 | $ | 1,851 | 9 | % | ||||||||
Revenue increaseddecreased by $1.9$14.1 million, or 9%,63% to $8.2 million for the year ended December 31, 2021 from $22.3 million for the year ended December 31, 2020 from $20.5 million for the year ended December 31, 2019. 2020. This decrease is primarily due todriven by an increase of development activities provided to customers underlong-termcontracts, as well as related fulfillment costs incurred for material and subcontractor costs to satisfy performance obligations. The increase in revenue was partially offset by a decrease in development activities with smaller scale customers, primarily due to the completionongoing backlog of project milestones with those customersdeliverables in fiscal 2019.2021 when compared to fiscal 2020 where we completed and delivered on project milestones for our significant customers.
Cost of Revenue and Gross Profit (in thousands, except for percentages)
| Years Ended December 31, | Change | ||||||||||||||||||||||
| 2021 | 2020 | $ | % | ||||||||||||||||||||
| Cost of revenue | $ | 11,416 | $ | 24,240 | $ | (12,824) | (53) | % | |||||||||||||||
| Gross Profit | $ | (3,203) | $ | (1,897) | $ | (1,306) | NM | ||||||||||||||||
| Gross Margin | (28) | % | (8) | % | NM | NM | |||||||||||||||||
Years Ended December 31, | Change | |||||||||||||||
2020 | 2019 | $ | % | |||||||||||||
Cost of Revenue | $ | 24,240 | $ | 30,705 | $ | (6,465 | ) | (21 | )% | |||||||
Gross Profit | $ | (1,897 | ) | $ | (10,213 | ) | $ | 8,316 | 81 | % | ||||||
Gross Margin | (8 | )% | (50 | )% | NM | NM | ||||||||||
NM – Not meaningful
Cost of revenue decreased by $6.5$12.8 million, or 21%53%, to $11.4 million for the year ended December 31, 2021 from $24.2 million for the year ended December 31, 2020 from $30.7 million for the year ended December 31, 2019. 2020. This decrease in cost of revenue was primarily driven by a decrease of $8.3$9.9 million from engineering, fab, partner and stock-based compensation costs. The decrease was partially offset by $1.7an increase of $1.6 million in fulfillment costsresearch and development tax credits and grants we received in 2021 compared to satisfy performance obligations with customers.the prior period due to higher claims for our research and development activities. Gross profit increaseddecreased by $8.3$1.3 million or 81 % to ($1.9)$(3.2) million for the year ended December 31, 20202021 from ($10.2)$(1.9) million for the year ended December 31, 2019.2020. The increasedecrease in gross profit was primarily driven by increased revenue from development services and a substantial decrease in engineering level of effort, fab partner, and human capital costs related to cost of revenue. Revenuerevenue for the year ended December 31, 2021. Our revenue is recognized at the achievement of milestones and is not necessarily aligned with the timing of costs incurred.
we incur. In general, our marginsthe quarter ended December 31, 2021, we revised the rate of accrual of a certain R&D tax credit based on new information received from Her Majesty’s Revenue and Customs. The one-time revision of the accrual resulted in an offset to cost of revenue variesand R&D expense in the quarter ended December 31, 2021.
Our gross margin has fluctuated and may fluctuate from period to period based on a number of factors, including the timing of completion of project to project,milestones, with each project requiring differing levels of time and costs. The projects we undertake are determined by our customer commitments and our long-term strategy goals.
Selling, General and Administrative Expenses (in thousands, except for percentages)
| Years Ended December 31, | Change | ||||||||||||||||||||||
| 2021 | 2020 | $ | % | ||||||||||||||||||||
| Selling, general and administrative expenses | $ | 39,976 | $ | 20,260 | $ | 19,716 | 97 | % | |||||||||||||||
Years Ended December 31, | Change | |||||||||||||||
2020 | 2019 | $ | % | |||||||||||||
Selling, general and administrative expenses | $ | 20,260 | $ | 13,306 | $ | 6,954 | 52 | % | ||||||||
Selling, general and administrative expenses increased by $7.0$19.7 million, or 52%97%, to $40.0 million for the year ended December 31, 2021 from $20.3 million for the year ended December 31, 2020 from $13.3 million for the year ended December 31, 2019. 2020. The $7.0 million increase was primarily due to general corporate growth, of which $4.8$6.0 million was from additional professional fees related to accounting, legal and audit matters, and $1.1$6.0 million and $0.3$1.5 million were due to increased human capital and stock-based compensation costs, respectively.
Research and Development Expenses (in thousands, except for percentages)
| Years Ended December 31, | Change | ||||||||||||||||||||||
| 2021 | 2020 | $ | % | ||||||||||||||||||||
| Research and development expenses | $ | 72,573 | $ | 35,900 | $ | 36,673 | 102 | % | |||||||||||||||
Years Ended December 31, | Change | |||||||||||||||
2020 | 2019 | $ | % | |||||||||||||
Research and development expenses | $ | 35,900 | $ | 22,303 | $ | 13,597 | 61 | % | ||||||||
Research and development expenses increased by $13.6$36.7 million, or 61 %,102%, to $72.6 million for the year December 31, 2021 from $35.9 million for the year ended December 31, 2020 from $22.3 million for the year ended December 31, 2019. 2020. The increase was primarily attributable to growth of $16.5$17.8 million from engineering, fab partner,partners, and engineering research and development headcount due to the allocation of resources into products that are considered part of research and development activities.headcount. This also led to an increase in human capital and stock-based compensation
54
expenses of $1.5 million. The$22.0 million and $4.7 million, respectively. In addition, the increase was mainly offsetis also driven by $3.7$11.0 million in research and development tax credits and grants we received in 2020 supporting2021 compared to the prior period due to higher claims for our research and development activities.
activities and grants.| Years Ended December 31, | Change | ||||||||||||||||||||||
| 2021 | 2020 | $ | % | ||||||||||||||||||||
| Other income, net | $ | 2,860 | $ | — | $ | 2,860 | 100 | % | |||||||||||||||
Years Ended December 31, | Change | |||||||||||||||
2020 | 2019 | $ | % | |||||||||||||
Interest income | $ | 30 | $ | 281 | $ | (251 | ) | (89 | )% | |||||||
Interest expense | $ | (219 | ) | $ | (1,028 | ) | $ | 809 | (79 | )% | ||||||
Interest Expense, net (in thousands, except for percentages)
| Years Ended December 31, | Change | ||||||||||||||||||||||
| 2021 | 2020 | $ | % | ||||||||||||||||||||
| Interest expense, net | $ | (4,781) | $ | (189) | $ | (4,592) | 2,430 | % | |||||||||||||||
The change in interest expense, net by $4.6 million, or 2,430%, for the years ended December 31, 2021 and December 31, 2020, respectively was primarily due to a decreasethe interest expense recorded in 2021 related to the 2020 Term Facility Loan using the effective interest rates and our investment deposit balances. Interest expense decreased by $0.8 million, or 79%, to $0.2 million for the year ended December 31, 2020 from $1.0 million for year ended December 31, 2019, primarily due to new convertible loan notes issued in fiscal 2020. Interest expense relating to convertible loan notes is recorded as part of the change in fair value of the notes.rate method.
Equity Method Investment Loss
Years Ended December 31, | Change | |||||||||||||||
2020 | 2019 | $ | % | |||||||||||||
Change in fair value of debt instruments | $ | 20,163 | $ | 2,969 | $ | 17,194 | 579 | % | ||||||||
| Years Ended December 31, | Change | ||||||||||||||||||||||
| 2021 | 2020 | $ | % | ||||||||||||||||||||
| Equity method investment loss | $ | (703) | $ | (1,274) | $ | 571 | (45) | % | |||||||||||||||
Change in equity method investment captures our share of losses of the investment in HRT according to our percentage of ownership.
Change in Fair Value of Debt Instruments (in thousands, except for percentages)
| Years Ended December 31, | Change | ||||||||||||||||||||||
| 2021 | 2020 | $ | % | ||||||||||||||||||||
| Change in fair value of debt instruments | $ | (59,916) | $ | (20,163) | $ | (39,753) | 197 | % | |||||||||||||||
Change in fair value of debt instruments captures losses from a change in fair value estimates using discounted cash flow and binominalbinomial lattice methodologies that are based upon a set of valuation assumptions. The key assumptions usedAs of December 31, 2021, there were no debt instruments requiring fair value adjustments. All convertible debt instruments previously held by the Company were converted to ordinary shares in valuation include default rates from historical performance, risk-free rates, expected volatility rates, and discount rates that reflect estimatesthe Company as part of the ratesBusiness Combination, completed in August 2021.
Change in Fair Value of return that investors would require when investingWarrant Liabilities (in thousands, except for percentages)
| Years Ended December 31, | Change | ||||||||||||||||||||||
| 2021 | 2020 | $ | % | ||||||||||||||||||||
| Change in fair value of warrant liabilities | 10,827 | $ | — | $ | 10,827 | NM | |||||||||||||||||
Change in other convertible debt with similar characteristics. Thefair value of warrant liabilities captures activity from a change in fair value estimates based upon a set of debt instruments is a resultvaluation assumptions. The Private Placement Warrants were assumed from SC Health and recorded as part of the differenceBusiness Combination in value between the initial issuance and subsequent fair value measurements.August 2021.
Gain (Loss) on Foreign Currency (in thousands)thousands, except for percentages)
55
56
Years Ended December 31, | Change | |||||||||||||||
2020 | 2019 | $ | % | |||||||||||||
Gain (loss) on foreign currency | $ | 25 | $ | (280 | ) | $ | 305 | NM | ||||||||
| Years Ended December 31, | Change | ||||||||||||||||||||||
| 2021 | 2020 | $ | % | ||||||||||||||||||||
| Gain (loss) on foreign currency | $ | 119 | $ | (25) | $ | 144 | (576) | % | |||||||||||||||
Provision for Income Tax (in thousands, except for percentages)
| Years Ended December 31, | Change | ||||||||||||||||||||||
| 2021 | 2020 | $ | % | ||||||||||||||||||||
| Provision for income tax | $ | 667 | $ | 569 | $ | 98 | 17 | % | |||||||||||||||
Years Ended December 31, | Change | |||||||||||||||
2020 | 2019 | $ | % | |||||||||||||
Provision for income tax | $ | 569 | $ | 311 | $ | 258 | 83 | % | ||||||||
Non-GAAP
Financial MeasuresIn addition to our results determined in accordance with GAAP, we believe the following
non-GAAP
measures are useful in evaluating our operational performance. We use the followingnon-GAAP
financial information to evaluate our ongoing operations and for internal planning and forecasting purposes. We believe thatnon-GAAP
financial information, when taken collectively and in context, may be helpful to investors in assessing our operating performance and trends and in comparing our financial measures with those of comparable companies which may present similarnon-GAAP
financial measures.Limitations of
Non-GAAP
MeasuresThese
non-GAAP
financial measures are not prepared in accordance with GAAP, are supplemental in nature, and are not intended, and should not be construed, as the sole measure of our performance, and should not be considered in isolation from or as a substitute for comparable financial measures prepared in accordance with GAAP. There are a number of limitations related to EBITDA and Adjusted EBITDA, including the following:•EBITDA and Adjusted EBITDA exclude certain recurring,
non-cash
charges, such as depreciation of property and equipment and/or amortization of intangible assets. While these arenon-cash
charges, we may need to replace the assets being depreciated and amortized in the future and Adjusted EBITDA and Adjusted EBITDA Margin do not reflect cash requirements for these replacements or new capital expenditure requirements.•EBITDA and Adjusted EBITDA do not reflect interest expense, net, which may constitute a significant recurring expense in the future.
•Adjusted EBITDA excludes stock-based compensation, which may constitute a significant recurring expense in the future, as equity awards are expected to continue to be an important component of our compensation strategy.
•Future expenses may be similar to the
non-recurring
special items that are excluded from Adjusted EBITDA.Because of these limitations, you should consider EBITDA and Adjusted EBITDA alongside other financial performance measures, including net loss and our other GAAP results.
EBITDA and Adjusted EBITDA
We define “EBITDA” as net loss before interest expense, net, income tax expense, and depreciation and amortization. We define “Adjusted EBITDA” as EBITDA adjusted for stock-based compensation,
non-capitalized
transaction costs, and othernon-recurring
special items determined by management that are not considered representative of our underlying operating performance. Adjusted EBITDA is intended as a supplemental measure of our performance that is neither required by, nor presented in accordance with, GAAP. Our presentation of these measures should not be construed as an inference that our future results will be unaffected by unusual or non-recurring items. Our computation of EBITDA and Adjusted EBITDA may not be comparable to other similarly titled measures computed by other companies, because all companies may not calculate EBITDA or Adjusted EBITDA in the same fashion.Because of these limitations, EBITDA and Adjusted EBITDA should not be considered in isolation or as a substitute for performance measures calculated in accordance with GAAP. We compensate for these limitations by relying primarily on our GAAP results and using EBITDA and Adjusted EBITDA on a supplemental basis. You should review the reconciliation of our net loss to EBITDA and Adjusted EBITDA below and not rely on any single financial measure to evaluate our business.
57
Reconciliation
| Three Months Ended March 31, | ||||||||||||||
| 2022 | 2021 | |||||||||||||
| Net Loss | $ | (41,781) | $ | (64,777) | ||||||||||
| Interest expense, net | 2,653 | 147 | ||||||||||||
| Provision for income tax | 131 | 100 | ||||||||||||
| Depreciation and amortization | 1,504 | 930 | ||||||||||||
| EBITDA | (37,493) | (63,600) | ||||||||||||
| Non-capitalized transaction costs* | — | 961 | ||||||||||||
| Stock-based compensation | 4,029 | 1,725 | ||||||||||||
| Change in equity-method investment | (334) | (113) | ||||||||||||
| Change in fair value of debt instruments | — | 39,653 | ||||||||||||
| Change in fair value of warrants | (211) | — | ||||||||||||
| Adjusted EBITDA | $ | (34,009) | $ | (21,374) | ||||||||||
* Non-capitalized transaction costs include non-recurring expense related to the issuance of Contentsconvertible loan notes in 2021 and the Business Combination.
The following table reconciles our net loss (the most directly comparable GAAP measure to EBITDA and Adjusted EBITDA) to EBITDA and Adjusted EBITDA for the three and six months ended June 30, 2021 and 2020 and for the years ended December 31, 20202021 and 20192020 (in thousands):
Three Months Ended June 30 | Six Months Ended June 30 | Years Ended December 31, | Years Ended December 31, | |||||||||||||||||||||||||||||||||||
2021 | 2020 | 2021 | 2020 | 2020 | 2019 | 2021 | 2020 | |||||||||||||||||||||||||||||||
Net Loss | $ | (30,557 | ) | $ | (10,003 | ) | $ | (95,334 | ) | $ | (26,429 | ) | $ | (80,277 | ) | $ | (50,850 | ) | Net Loss | $ | (168,013) | $ | (80,277) | |||||||||||||||
Interest expense, net | 179 | 34 | 326 | 74 | 189 | 747 | Interest expense, net | 4,781 | 189 | |||||||||||||||||||||||||||||
Provision for income tax | 110 | 80 | 210 | 220 | 569 | 311 | Provision for income tax | 667 | 569 | |||||||||||||||||||||||||||||
Depreciation and amortization | 1,069 | 706 | 1,999 | 1,395 | 2,787 | 1,948 | Depreciation and amortization | 4,640 | 2,787 | |||||||||||||||||||||||||||||
EBITDA | (29,199 | ) | (9,183 | ) | (92,799 | ) | (24,740 | ) | (76,732 | ) | (47,844 | ) | EBITDA | (157,925) | (76,732) | |||||||||||||||||||||||
Non-capitalized transaction costs* | 79 | 30 | 1,040 | 30 | 3,611 | — | Non-capitalized transaction costs* | $ | 4,337 | $ | 3,611 | |||||||||||||||||||||||||||
Stock-based compensation | 1,976 | 2,545 | 3,701 | 4,189 | 8,043 | 6,229 | Stock-based compensation | 12,013 | 8,043 | |||||||||||||||||||||||||||||
Equity-method investment loss | 604 | 102 | 491 | 252 | 1,274 | 1,281 | Equity-method investment loss | 323 | 1,274 | |||||||||||||||||||||||||||||
Change in fair value of debt instruments | 6,008 | (312 | ) | 45,661 | 2,222 | 20,163 | 2,969 | Change in fair value of debt instruments | 59,916 | 20,163 | ||||||||||||||||||||||||||||
Forgiveness of PPP Loan | (2,860 | ) | — | (2,860 | ) | — | — | — | ||||||||||||||||||||||||||||||
| Change in fair value of warrants liabilities | Change in fair value of warrants liabilities | (10,827) | — | |||||||||||||||||||||||||||||||||||
| Forgiveness of PPP loan | Forgiveness of PPP loan | (2,860) | — | |||||||||||||||||||||||||||||||||||
Adjusted EBITDA | $ | (23,392 | ) | $ | (6,818 | ) | $ | (44,766 | ) | $ | (18,047 | ) | $ | (43,641 | ) | $ | (37,365 | ) | Adjusted EBITDA | $ | (95,023) | $ | (43,641) | |||||||||||||||
* Non-capitalized transaction costs include non-recurring expense related to the issuance of convertible loan notes in 2021 and the Business Combination.
Liquidity and Capital Resources
Due to Rockley’s history of recurring losses from operations, negative cash flows from operations, and a significant accumulated deficit, management concluded that there is substantial doubt about Rockley’s ability to continue as a going concern. In addition, our independent registered public accounting firm has included an explanatory paragraph in their opinion for the year ended December 31, 20202021 as to the substantial doubt about our ability to continue as a going concern. Since inception, Rockley has financed its operations primarily through the issuance and sale of convertible loan notes, Ordinary Sharesordinary shares and agreed-upon projects. As of June 30, 2021March 31, 2022 and December 31, 2020,2021, the cash, and cash equivalents and investments balance was $35.4$36.4 million and $19.2$81.4 million, respectively.
Short-Term Liquidity Requirements
As of the date of this prospectus,March 31, 2022, we have yet to generate any material revenue from our business operations. BasedIn October 2021, the Company entered into an equity line of credit arrangement (“ELOC”) with Lincoln Park Capital Fund, LLC, an Illinois limited liability company ("LPCF"). The ELOC is a private placement with registration rights, providing LPCF the ability to purchase up to 7.8 million of the Company's ordinary shares for $50.0 million over 24 months. Proceeds from the sale of shares will go towards the Company to be used for working capital.
Management continues to explore a range of options to further address the Company’s capitalization and liquidity. If we raise funds by issuing debt securities or incurring loans, this form of financing would have rights, preferences, and privileges senior to those of holders of our Ordinary Shares. The availability and the terms under which we can borrow additional capital could be disadvantageous, and the terms of debt securities or borrowings could impose significant restrictions on current cash on hand, management’s plan to continue as a going concern includes raising additional financing, specificallyour operations. Macroeconomic conditions and credit markets could also impact the availability and cost of potential future debt financing. If we raise capital through the Business Combinationissuance of additional equity, such sales and PIPE Financing to satisfy our minimum cash requirements for at leastissuance would dilute the next 12 months. The funds raised through the Business Combination and PIPE Financing will be used to support our core business operations and overall growth of our business and to execute our current growth strategies. Upon the consummationownership interests of the Business Combination and PIPE Financing, we plan to control the timing and extent of certain discretionary operating and planned capital expenditures. Accordingly, absent the funds to be raised upon completionexisting holders of the Business Combination and PIPE Financing, management has concludedCompany’s Ordinary Shares. There can be no assurances that substantial doubt exists about our abilityany additional debt or equity financing would be available to continue as going concern.
us or if available, that such financing would be on favorable terms to us.As of the date of this prospectus, management believes that the cash that may be generated by the closing of the of the Business Combination and the PIPE Financing will be sufficient to fund bothMarch 31, 2022, our anticipated cash needs forare required to fund the execution of our business strategy, at least the next 12 months, including (1) investing in research and
developments activities, including completion and commercialization of our wearables, smart phone andtechnologies, (2) investing in backend processing, intellectual property protection, quality control and process, (3) expanding sales and marketing activities, and (4) pursuing strategic partnerships. However, our anticipated cash needs could vary materially and negatively as a result of a number of factors, including:
point-of-care
•Timing and the costs involved in bringing our products to market;
•Anticipated customer contracts and design wins may not materialize;
•Delay in launching our products due to technical challenges from our customers or our product development team;
•Pricing and the volume of sales of our products may be different from our forecast;
•Execution delays due to resources constraints;
•Assisting our fab partners with expansion of production capacity;
•The cost of maintaining, expanding and protecting our intellectual property portfolio, including litigation costs and liabilities;
•The cost of additional general and administrative talent, including accounting and finance, legal and human resources, as a result of becoming a public company;
•Rockley’s additional investment requirement needed for Hengtong Rockley Technology Co., Ltd.HRT to be self-sufficient; and
•Other risks discussed in the section entitled “Risk Factors.”
59
Long-Term Liquidity Requirements
If we do not generate sufficient revenue, we will be required to explore various options to fund future cash needs through sale of additional equity, debt financing, and others. There can be no assurance that any such issuance of equity securities, debt financing or other means of financing will be available in the future, or the terms of any such financing will be acceptable to us. If we raise funds by issuing equity securities, there will be dilution to the existing shareholders. Any equity securities issued may also provide for rights, preferences, or privileges senior to those holders of Ordinary Shares. If we raise funds by issuing debt securities, these debt securities would have rights, preferences, and privileges senior to the holders of Ordinary Shares.ordinary shares. The term of debt securities or borrowing could impose significant restriction on our operations. The credit market and financial service industry have in the past, and may in the future, experience periods of upheaval that could impact the availability and cost of equity and debt financing.
If adequate funds are not available, we will need to curb our expansion plans or limit our research and development activities, which would have a material adverse impact on our business prospects and results of operations.
Impact of Private Placement Financing
On May 27, 2022, we issued the Notes in an aggregate principal amount of $81.5 million under the Indenture in the private placement financing described in the section entitled “Prospectus Summary – The Private Placement Financing” and in connection therewith agreed to comply with the affirmative and negative covenants contained in the Indenture, including a covenant that requires us to pledge at all time at least $20.0 million of cash and cash equivalents to secure the Notes. This minimum cash and cash equivalents requirement further limits our liquidity position.
Historical Cash Flows
For the SixThree Months Ended June 30,March 31, 2022 and 2021 and 2020
| Three Months Ended March 31, | |||||||||||
| 2022 | 2021 | ||||||||||
| Net cash used in operating activities | $ | (38,793) | $ | (24,899) | |||||||
| Net cash provided by (used in) investing activities | 18,893 | (713) | |||||||||
| Net cash (used in) provided by financing activities | (5,023) | 75,983 | |||||||||
| Net (decrease) increase in cash and cash equivalents | $ | (24,923) | $ | 50,371 | |||||||
Six Months Ended June 30, | ||||||||
2021 | 2020 | |||||||
(in thousands) | ||||||||
Net cash used in operating activities | $ | (54,457 | ) | $ | (13,106 | ) | ||
Net cash used in investing activities | (3,322 | ) | (3,150 | ) | ||||
Net cash provided by financing activities | 73,946 | 13,915 | ||||||
Net increase (decrease) in cash and cash equivalents | $ | 16,167 | $ | (2,341 | ) | |||
Cash Flows from Operating Activities
During the three months ended March 31, 2022, net cash used in operating activities was $38.8 million, primarily consisting of net losses of $41.8 million, adjusted by non-cash depreciation and amortization of $1.5 million, reversal of bad debt expense of $0.1 million, stock-based compensation of $4.0 million, change in equity-method investment of $0.3 million, and changes in fair value of warrants of $0.2 million. Changes in assets and liabilities for the three months ended March 31, 2022 included the following: increases in other receivables and accrued expenses, offset by decreases in accounts receivable, prepaid expenses, other current assets and trade payables.
During the sixthree months ended June 30,March 31, 2021, net cash used in operating activities was $54.5$24.9 million, primarily consisting of net losses of $95.3$64.8 million, adjusted by$2.0$0.9 million, bad debt expense of $0.4 million, stock-based compensation of $3.7$1.7 million, change in equity-method investment loss of $0.5$0.1 million, and a loss related to the changechanges in fair value of debt instruments of $45.7$39.7 million. Changes in assets and liabilities for the sixthree months ended June 30,March 31, 2021 included the following: decreases in accounts receivable and other current assets, offset by increases in other receivables, prepaid expenses, trade payables and accrued expenses.
non-cash
depreciation and amortization of Cash Flows from Investing Activities
Net cash used inprovided by investing activities was $3.3$18.9 million for the sixthree months ended June 30, 2021,March 31, 2022, primarily related to the proceeds received from the sale of marketable securities of $19.9 million and from the purchases of property and equipment to be used in the ordinary course of business. Net cash used in investing activities was $3.2$0.7 million for the sixthree months ended June 30, 2020,March 31, 2021, primarily related to the investment in our HRT of $2.5 million and the remaining $0.7 million was related to purchases of property and equipment to be used in the ordinary course of business.
Cash Flows from Financing Activities
Net cash used in financing activities was $5.0 million for the three months ended March 31, 2022, primarily related to the principal payments we have made on the 2020 Term Facility Loan.Net cash provided by financing activities was $73.9$76.0 million for the sixthree months ended June 30,March 31, 2021, primarily consisting of proceeds received for convertible loan notes and payments made for debt issuance costs. Net cash provided by financing activities was $13.9 million for the six months ended June 30, 2020, primarily consisting of proceeds received for convertible loan notes and Paycheck Protection Program.notes.
For the Years Ended December 31, 20202021 and 2019
| Years Ended December 31, | |||||||||||
| 2021 | 2020 | ||||||||||
| (in thousands) | |||||||||||
| Net cash used in operating activities | $ | (126,001) | $ | (48,354) | |||||||
| Net cash used in investing activities | (52,842) | (6,656) | |||||||||
| Net cash provided by financing activities | 196,401 | 53,334 | |||||||||
| Net increase (decrease) in cash and cash equivalents | $ | 17,558 | $ | (1,676) | |||||||
Years Ended December 31, | ||||||||
2020 | 2019 | |||||||
Consolidated Statements of Cash Flow Data: | ||||||||
Net cash (used in) provided by: | ||||||||
Operating activities | $ | (48,354 | ) | $ | (36,556 | |||
Investing activities | (6,656 | ) | (2,831 | ) | ||||
Financing activities | 53,334 | 48,933 | ||||||
Net (decrease) increase in cash and cash equivalents | $ | (1,676 | ) | $ | 9,546 | |||
Cash Flows from Operating Activities
During the year ended December 31, 2021, net cash used in operating activities was $126.0 million, primarily consisting of net losses of $168.0 million, adjusted by non-cash depreciation and amortization of $4.6 million, bad debt expense and allowance for doubtful accounts of $0.8 million, stock-based compensation of $12.0 million, equity-method investment loss of $0.3 million, and changes in fair value of debt instruments and warrants of $59.9 million and $(10.8) million, respectively. Changes in assets and liabilities for the year ended December 31, 2021 included the following: decreases in accounts receivable, offset by increases in other receivables, trade payables and accrued expenses.
During the year ended December 31, 2020, net cash used in operating activities was $48.4 million, primarily consisting of net losses of $80.3 million, adjusted byincreaseand change in fair value of debt instruments of $20.2 million, and gain on disposal of assets of $0.1 million. Changes in assets and liabilities for the year ended December 31, 2020 included the following: decreases in accounts receivable, trade payables, prepaid expenses, other current assets, offset by increases in other receivables and accrued expenses.
non-cash
depreciation and amortization of $2.8 million, stock-based compensation of $8.0 million, equity-method investment loss of $1.3 million, Cash Flows from Investing Activities
Net cash used in investing activities was $6.7$52.8 million for the year ended December 31, 2020,2021, primarily consistingrelated to the purchase and the sale of $1.4marketable securities of $54.7 million purchases of property and equipment to be used in$10.0 million, respectively, and also from the ordinary course of business, $0.3 million acquisition of TruTouch assets, and $5.0 million additional investments made inequity method investment. Net cash used in investing activities was $2.9 million for the year ended December 31, 2019, primarily consisting of purchases of property and equipment to be used in the ordinary course of business. Net cash used in investing activities was $6.7 million for the year ended December 31, 2020, primarily related to the investment in our HRT of $5.0 million and the remaining 1.4 million was related to purchases of property and equipment to be used in the ordinary course of business.
Cash Flows from Financing Activities
Net cash provided by financing activities was $196.4 million for the year ended December 31, 2021, primarily related to the proceeds received from the Business Combination and convertible loan notes. Net cash provided by financing activities was $53.3 million for the year ended December 31, 2020, primarily consisting of proceeds received for convertible loan notes and issuance of Ordinary SharesPaycheck Protection Program.
Contractual Obligations and warrants. Net cash provided by financing activities was $49.0 million for the year ended December 31, 2019, primarily consisting of proceeds received for convertible loan notes and issuance of Ordinary Shares and warrants.
CommitmentsPurchase obligations include commitments to third-party suppliers for various research and development activities. As of March 31, 2022, December 31, 2021 and December 31, 2020, we had $13.7 million, $13.6 million and $3.0 million, respectively in contractual obligations for which we have not yet received services.
Off-Balance
Sheet ArrangementsSince the date of our incorporation, we have not engaged in any
off-balance
sheet arrangements, as defined in the rules and regulations of the SEC.Recent Accounting Pronouncements
Please refer to Note 1 - Description of our condensed consolidated financial statementsBusiness and Significant Accounting Policies of the Notes to Consolidated Financial Statements included elsewhere in Item 8 of this prospectus for more information about recent accounting pronouncements, the timing of their adoption, and our assessment, to the extent we have made one, of their potential impact on our financial condition and our results of operations.
Critical Accounting Policies and Estimates
Our financial statements have been prepared in accordance with GAAP as set forth in the Financial Accounting Standards Board’s Accounting Standards Codification, (“ASC”), and we consider the various staff
accounting bulletins and other applicable guidance issued by the SEC. The preparation of our condensed consolidated financial statements requires us to make estimates and assumptions that affect the reported amounts of assets and liabilities and the disclosure of contingent assets and liabilities as of the date of the financial statements, as well as the reported expenses incurred during the reporting periods. Our estimates are based on our historical experience and on various other factors that we believe are reasonable under the circumstances, the results of which form the basis for making judgments about the carrying value of assets
61
and liabilities that are not readily apparent from other sources.
Our actual results may differ from these estimates under different assumptions or conditions. To the extent that there are material differences between these estimates and our actual results, our future financial statements will be affected. We believe that the accounting policies discussed below are critical to understanding our historical and future performance, as these policies relate to the more significant areas involving management’s judgments and estimates.
Revenue Recognition
We generate revenue principally from development services, which entails developing customer-specific designs of photonics chipsets. Our contracts with customers include specific achievement milestones and a substantive acceptance criteria for each milestone. In the event a milestone is achieved and the customer provides acceptance, we allocatethe Company allocates the contract consideration related to the performance obligations that are satisfied during the period and recognizerecognizes the revenue at that point in time.
•Expected Term—This is the period that the options or warrantsawards that have been granted are expected to remain unexercised. The Company employs the average period the stock options and warrantsawards are expected to remain outstanding;
•Volatility—This isOur stock was not publicly traded prior to August 11, 2021. The volatility used in stock grants made prior to that date was based on a measurebenchmark of the amount by which a financial variable, such as a share price, has fluctuated (historical volatility) or is expected to fluctuate (expected volatility) during a period. As the Company does not yet have sufficient history of its own volatility, management has identified several guideline comparable companies and estimates volatilitywithin the silicon photonics industries;
•Risk-Free Interest Rate—The interest rates used are based on the volatility of those companies;
•Dividend Yield—The Company has not and does not expect to paydividend rate used is zero as we have never paid any cash dividends on its Ordinary Sharesour ordinary shares and do not anticipate doing so in the foreseeable future.
Legacy Rockley’s historical financial results and future financial projections;
Warrants
We classify the Private Placement Warrants as long-term liability on the valuation of our Ordinary Shares. During 2020, the estimated fair value of our Ordinary Shares fluctuated between $10.433 and $20.280 per share, the later fair value primarily reflecting our progress towards a business combination. The necessary steps undertaken to prepare for the Business Combination included meeting with SC Health and investment bankers, discussing timing expectations, and negotiating the preliminary Letter of Intent between SC Health and the Company. A Letter of Intent related to the Business Combination was signed by both parties in January 2021 reflecting an increased likelihood of a near-term exit transaction and/or liquidity event. The valuation of the Company’s equityconsolidated balance sheet as of December 31, 2020 took into consideration2021. The Private Placement Warrants were traded on the indicated equityNYSE prior to their redemption and recorded at fair value impliedusing a Black-Scholes option-pricing model. The Private Placement Warrants are re-measured to fair value at each subsequent reporting date. We will continue to adjust the liability for changes in fair value for the Private Placement Warrants until the warrants are exercised, redeemed or cancelled and present the changes in fair value in the signed Letterconsolidated statement of Intent. Whileoperations at each reporting period.
We classify the December 31, 2020 valuation incorporatedPublic Warrants as equity values based upon the traditional income approach consisting of the discounted cash flow method, the valuation also incorporated the equity value implied by the planned Business Combination transaction. Accordingly, the valuation applied the probability-weighted expected return method (PWERM) to weigh the indicated equity value determined under the traditional income approach and the equity value implied bypresent within Additional Paid-In Capital on our planned Business Combination. Based upon management’s determination that there was a high probability that the Business Combination would occur, a higher weighting was assigned to the implied value of the negotiated Business Combination transaction.
Income Taxes
We record income tax expense for the anticipated tax consequences of the reported results of operations using the asset and liability method. Under this method, we recognize deferred tax assets and liabilities for the expected future tax consequences of temporary differences between the financial reporting and tax basis of asset and liabilities, as well as for operating loss and tax credit carryforwards. Deferred tax assets and liabilities are measured using tax rates that are expected to apply to taxable income for the years in which those tax assets and liabilities are expected to be realized or settled. We record valuation allowances to reduce its deferred tax assets to the net amount that it believes is more likely than not to be realized. Its assessment considers the realization of deferred tax assets on a jurisdictional basis. We recognize the income tax benefit from an uncertain tax position only if it is more likely than not that the tax position will be sustained upon examination by taxing authorities, based on the technical merits of the position. The income tax benefits recognized in the financial statements from such a position are measured based on the largest benefit that has a greater than 50% likelihood of being realized upon ultimate settlement.
Quantitative and Qualitative Disclosures about Market Risk
BUSINESS
The following discussion contains forward-looking statements within the meaning of the Private Securities Litigation Reform Act of 1995. When used in this section, the terms “may,” “might,” “will,” “objective,” “intend,” “should,” “could,” “can,” “would,” “expect,” “believe,” “estimate,” “predict,” “potential,” “plan,” “anticipate,” “seek,” “future,” “strategy,” “likely,” or the negative of these terms, and similar expressions are intended to identify forward-looking statements. These forward-looking statements involve known and unknown risks, uncertainties and other factors that may cause our actual results, performance or achievements to be materially different from any future results, performance or achievements expressed or implied by these or any other forward-looking statements. These risks and uncertainties include, but are not limited to, those risks set forth under “Risk Factors.” Readers are cautioned not to place undue reliance on these forward-looking statements, which are based on current expectations and reflect management’s opinions only as of the date hereof. These forward-looking statements speak only as of the date of hereof. Company expressly disclaims any obligation or undertaking to release publicly any updates or revisions to any forward-looking statements contained herein to reflect any change in our expectations with regard thereto or any changes in events, conditions or circumstances on which any such statement is based.
Rockley®, RayDriver™, RPFabric™, RPStack™, Topanga™, LightDriver™, SpectraCloud™, SpectraSense™, VitalSpex™, Bioptx™, and clinic-on-the-wrist™ are among the trademarks, registered trademarks, or service marks owned by Rockley.
Company Overview
We have developed a unique sensing platform that we believe can reshape the wellness and healthcare industries through multiple applications innon-invasive,multi-modal biomarker monitoring. We believe products based on our technology platform could have the potential to unlock and accelerate advancements in areas such as early disease detection, nutrition management, and preventative healthcare delivery through continuous health and wellness monitoring.
dedicated solutions for the healthcare market. As testament to the relevance of our product development, we have captured the attention of several consumer electronics companies and, as of the date of this prospectus, we are engaged in discussions or haveMOUs memoranda of understanding (“MOUs”) or development and supply agreements with entities whichthat collectively account for over 55%60% market share of wearable devices, (ofincluding six of the 55%,top 10 consumer wearables companies. These agreements will help shape our development of our consumer and medical device capabilities.
non-binding
With this unique sensing platform, we arebelieve we can reshape several important markets of the healthcare sector such as consumer wellness, long term health trend monitoring, patient monitoring, early disease detection, nutrition management and the treatment of certain chronic diseases. Our biosensing platform will enable multiple applications using our non-invasive, continuous, multi-modal biomarker monitoring capabilities.
Our end-to-end solutions include hardware with the potential to detect multiple biomarkers, related algorithms, and cloud-based analytics and artificial intelligence (“AI”). We have shipped early engineering samples to some of our customers to support research and development efforts.
Our platform has been built upon our silicon photonics technology, which enables highly advanced sensor performance, power, resolution, and formfactor. This technology has the potential to allow monitoring devices, currently the size of clinical laboratory machines, to be miniaturized to the size of a wearable device. We believe that this miniaturization capability has the potential to unlock additional applications in discussions with entities which represent at least 8%)consumer electronics and medical devices. Our technology is built on over 190 patents, over eight years of product development, and over 50% market shareapproximately $450 million in total funding as of smartphone devices, based on a combinationthe date of data sourced fromthis prospectus, through the Yole Report, the IDtechEx Reportissuance of convertible loan notes and the TrendForce Report, as well as our internal volume forecastsordinary shares.
Our target biomarkers for smartphone, smart watch,consumer healthcare include lactate, alcohol, glucose (indicator), hydration, blood pressure, blood oxygen, and smart earbuds through 2025core body temperature, among others. Our lasers will deliver an extremely high level of performance, supporting up to 1,000,000 times higher resolution, 1,000 times higher accuracy, and 100 times broader range in wavelengths than existing LED offerings in wearable solutions (based on customer data)product analysis undertaken by Rockley comparing the Rockley silicon photonics-based spectrometer chip to existing solutions). We planWith this performance, we believe that Rockley’s platform will be able to leverage this attention to develop new capabilitiesaddress existing applications in consumer wearables in the near term,wearable and to expand over time into medical devices with significantly higher resolution, accuracy, and other industry applications. range.
We have established a manufacturing ecosystem based upon our wholly-owned, proprietary processes in several areas. We believe that this manufacturing ecosystem will support rapid scalability, providing us with a significant competitive advantage.
As we do not currently have any products in commercial production, our current customer relationships are in the following stages: (a) customers with whom we are “engaged,” or in discussions with, regarding potential product features for incorporation into such customer’s end products, or (b) customers with whom we are “contracted,” where we havewhichwith whom we are engaged in discussions only and successfully
non-binding
MOUs or development and supply agreements. These MOUs and development and supply agreements provide a general framework for our transactions with the customer and typically provide that we will develop and deliver new products meeting the customer’s specifications. There are no binding purchase commitments under our MOUs and supply agreements. We currently anticipate that sales of our products will be primarily made pursuant to standard purchase orders, which orders may be cancelled, reduced, changed, or rescheduled with little or no notice or penalty. Our ability to grow our business will depend on our ability to attract and retain customers 63
transition such customers to contracted customers with whom we have MOUs or development and supply agreements, and to otherwise attract new customers.
Our vision is to address many pressing healthcare concerns using our technology, and we believe that there exists a large market opportunity for our platform. We estimate that the total addressable market (“TAM”) for the consumer wearables, mobile device, and medical device markets is projected to be over $48 billion by 2025, based on data sourced from the Yole Report, the IDtechEx Report, the TrendForce Report, and our internal volume forecasts for smartphone, smart watch, and smart earbuds through 2025 (based on customer data),IDC, as the universe of healthcare and consumer wearable devices incorporating additional sensing capabilities emerges.1Our target biomarkersproducts are being designed for consumer healthcare include lactate, alcohol, glucose (indicator), carbon monoxide,utilization in: (a) medical devices, including blood pressure, blood oxygen, and core body temperature, among others. Dueblood glucose, and alcohol monitoring devices, pulse oximetry, and near infra-red (“NIR”) spectrometers, with an aggregate forecasted TAM of $15.1 billion by 2025, according to the high performance of our lasers up to 1,000,000 times higher resolution, 1,000 times higher accuracyYole Report, and 100 times broader range in wavelengths compared with existing LED offerings in wearable solutions (based on product analysis undertaken by Rockley comparing the Rockley silicon photonics-based spectrometer chip to existing solutions), we believe our platform will also be able to address existing applications in consumer wearablemobile cardiac telemetry/general patient monitoring patch devices, with significantly higher resolution, accuracy,an aggregate forecasted TAM of $2.7 billion by 2025, according to the IDtechEx Report; and range. Further, we believe there(b) consumer wearables and mobile devices, including smartwatches, smart earbuds, fitness bands, and mobile phones, which, based on our internal estimates, are expected to have a TAM of $2.7 billion, $3.0 billion, $1.5 billion, and $23.5 billion, respectively, or an aggregate TAM of $30.7 billion, by 2025. We estimated our TAM in the consumer wearables and mobile device sectors by multiplying third-party forecasted total volumes in 2025 for the devices for which our products are being designed, by our currently anticipated and estimated average selling prices for these products. The volume estimate for smartwatches was based on the benchmarked figure forecasted by annual volume for smartwatches for 2022 according to the TrendForce Report. The volume estimate for smart earbuds was based a 20% volume CAGR between 2020-2025, with 2020 annual shipments estimated at 230 million units, according to the TrendForce Report. According to the Yole Report, fitness bands were forecasted to reach 89 million units by 2025. The volume estimates for smartphones were based on multiple additional markets and concrete opportunitiesthird-party forecasted volumes for our technology platform in areas such as data center connectivity (optical transceivers), machine vision (robotic and automotive LiDAR), and compute connectivity(co-packagedoptics, or CPO).mobile phones, multiplied by the average selling price.
Product Applications and Development Status
We believe that our innovative and differentiated silicon photonics platform positions us to make photonics-based solutions increasingly pervasive, while unlocking previously unaddressed applications. Consequently, we
believe that the potential applications for our technology will be wide-ranging. Leveraging the flexibility and power of our innovative silicon photonics platform, we believe that we are positioned to become a leading supplier of end-to-end solutions (including integrated optical components, algorithms, data analytics, and AI) for dynamic, high-growth market sectors, including consumer sensors, healthcare,medtech and data communications. healthcare.
Figure 1: Rockley end-to-end sensing platform

To date, we have been engaged in developing customer-specific designs of our silicon photonics chipsets and modules for incorporation into our consumer electronics customers’ end productsproducts. We are working with leading customers in the medtech market to deliver a standalone wrist-wearable product for targeted use cases. In parallel, we are shaping and currentlydeveloping our own standard offerings that could have different shapes and form factors. Currently, we do not have any of our own end products in commercial production. We expect that our immediate focus over the next two years will be on developinghave started delivering samples to strategic customers, and commercializing our products for incorporation in consumer wearables and mobile applications, followed by medical devices in the healthcare space, and subsequently on developing our AI analytics cloud platform. In respect of consumer wearables and mobile applications, we planintend to start deliveringdeliver final samples to customers in the first half of 2022 withand begin production ramp of these products commencing in the second half of 2022. For medical devices in the healthcare space, we plan to commence data collection trials in 2022 with production of units commencing in the first half of 2023, initially at a low run rate. During 2022, our aim is to build a collaboration model for our AI AI/analytics cloud platform before progressingproceeding to a commercial launch of a subscription platform, planned for the first half of 2023.
64
Figure 2: Product development and commercial roadmap
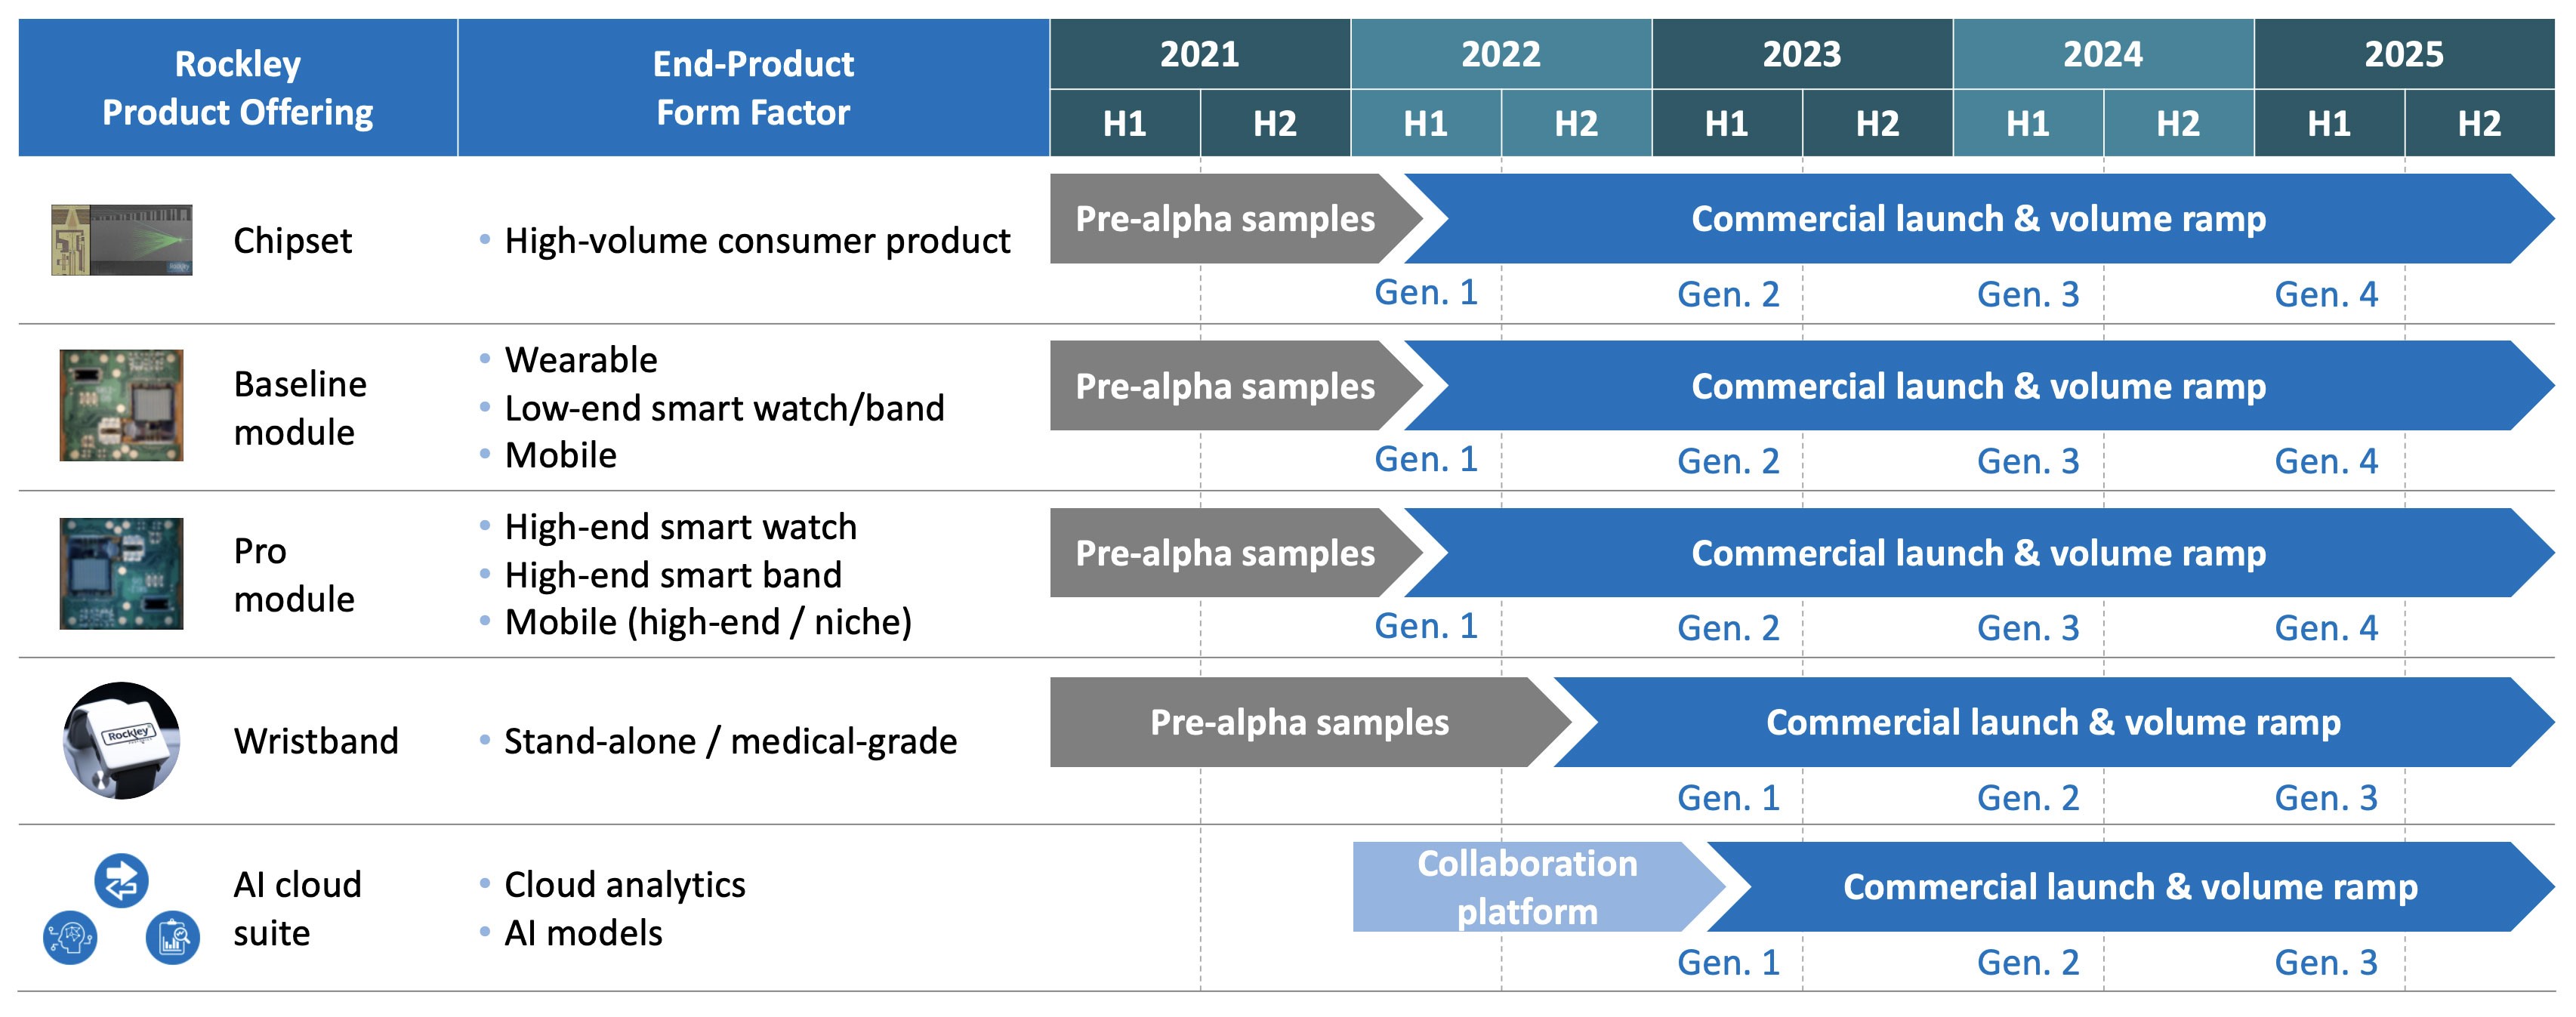
Healthcare: Consumer Wearables
Figure 3: Targeted biomarker sensing capabilities

These products are intended to address the needs of the consumer wellness rather than medical,market and will provide information about general health and wellness. (i.e., they do not require regulatory approval for offered applications and end uses.) As we move forward, we intend to monitor and comply with regulations to the extent they become applicable to us, including any requirements for clearance by the FDA. Our plans for the Rockley Platform include a Basic ModuleU.S. Food and an Advanced Module, which will have a wide array of current and potential applications, as shown in the figure below.
Drug Administration (FDA) and/or other regulatory bodies.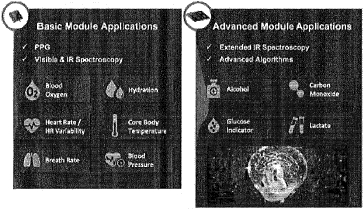
Healthcare: Medical Devices
Our Bioptx™ healthcare sensing platform will address the medical and professional healthcare market. We plan to incorporate our biomarker sensing technology into existing devices such(such as medical patches, wearable bands, and other monitoring devicesdevices) to provide
65
additional biomarkersbiomarker sensing capabilities not currently available to consumers. Also, as part of the Bioptx product offering, we intend to deliver a complete standalone finished product with targeted use cases for healthcare and health monitoring.
We believe thisthat these product offerings will enhanceand remote monitoring solutions thatand will have the potential to ultimately transform and disrupt the delivery of patient monitoring and healthcare. In the medical device space, we currently anticipate that we will develop two types of devices: an advisory device that will not need to seekregulatory clearance and a clinical device that will need regulatory clearance from the FDA clearance for devices that are currently under development based on our technology platform. As theseor other regulatory bodies.
point-of-care
These products are still under development and whiledevelopment. Even though there can be no assurance that we will be successful in these product development efforts will succeed or that, even if developed, that suchthese products will be approved by regulators or achieve
widespread market acceptance, we believe these efforts presentthat there are significant market opportunities in addition to our consumer wearables applications.
Co-Packaged
OpticsData centers, which are the nerve centers of the digital economy, require interconnected communications for which we believe our optical transceiver products offerdatacom chipset technology offers several advantages. Business, entertainment, vital medical research, and other aspects of daily life are in many ways connected to hyperscale data centers, which in tumturn rely on cost-effective, power-efficient optical communication links. Whether incorporated in pluggable optical transceiver modules or inapproach of partnering with a joint venture in ChinaTransceiver manufacturers and Switch/Networking equipment OEM companies has economic benefits over participating directly as a chipset provider in this margin-sensitive market. By selling/licensing our assets/technology, to the joint venture, we offer the joint venturethird party the opportunity to create an economically compelling solution without being required to source elements from multiple suppliers and therefore not incurring higherany margin costs,stacking while Rockley benefitscan keep expenses low/minimal and benefit from license revenueupfront/ongoing fees. Note that given Jiangsu Hengtong Optic-Electric Co., Ltd. (a shareholder in our joint venture partner) was placed on the “Entity List” by the U.S. Bureau of Industry and Security (BIS) of the U.S. Department of Commerce in December 2021, we have widened our equity stake in the joint venture.potential partner network significantly and are evaluating various options for this business.
co-packaged
optics, we believe hyperscale data centers will benefit from the unique advantages that our silicon photonics platform has to offer. Furthermore, we believe ourgo-to-market
Other Applications
We believe that our silicon photonic platform is ideally suited for delivering the sensing solutionscapabilities needed for machine perception and interrogation at depth, which ishas become increasingly requirednecessary in industrial automation, robotic vision including(including surgical applications,applications), safety, and other autonomous applications. Finely tuned light, delivered through a photonic integrated circuit (“PIC”)PIC via a free spacefree-space aperture or fiber optic interconnect with accompanying detection receiver capabilities, enables substantially better capabilities than previously available technology, such as frequency modulated continuous wave (“FMCW”) LiDAR for automotive safety solutions, as well as future autonomous vehicle offerings. Our team has extensive experience in the design of PICs for use in the LiDAR domain, and we have prototyped the key components of the system and demonstrated their superior performance. Although we believe the inflection point for LiDAR and the automotive market may be approaching, we plan to leverage our core technology readiness and economies of scale from our consumer business to position ourselves for this potential market opportunity.
Market Opportunity
Health and Wellness
There is growing demand for miniaturized,non-invasivesensing technology devices with real-time diagnostics wearable solutions that offer an affordable way to provide key insights into a person’s health and analytics that are affordable and accessiblewell-being, outside the clinical environment. Delivering relevant insights will require non-invasive, continuous, real-time sensing and measurement of multiple biomarkers, coupled with advanced analytics to interpret the data. We believe that this demand is driven and will continue to be driven by two major market and secular trends:
• Consumer health and wellbeingwell-being awareness.
COVID-19
has had a profound impact on the way consumers perceive their need forFurthermore, non-invasive
monitoring solutions for chronic conditions have historically been costly and available only in a medical facility. With our potential for delivering individual of healthcare. Non-invasive,
continuous monitoring We believe that existing monitoring and sensing technologies are not capable of taking full advantagedelivering on the needs of the above trends, whichconsumers and healthcare professionals. Meeting these needs require solutions that provide access to a broad range of biomarkers non-invasively; that can be miniaturized and operate with power low enough power to be integrated into consumer wearables, medical patches, and other compact form factors, that can cover a broad range of conditions and biomarkers, factors;
66
and that can scale cost effectively to high volumes. We believe that our unique silicon photonics-based platform is now poised to serve at the confluence of the above two market and secular trends.
Beyond these opportunities, we believe there may be significant potential for us in the field of genomics. As the field of genomics grows, as shown in the development of personalized medicines and treatment, the value and effectiveness are enhanced when genomic information is combined and processed along with continuous biomarker monitoring for the users. We believe this emerging field could play to the strengths of our platform and potentially represents a high valuehigh-value growth opportunity for the future.
Datacenter operators continue to build and upgrade their datacenter infrastructure to meet the continuing growth in public, private, and hybrid cloud capacity. As these datacenters rely heavily on fiber optics to interconnect compute, storage, accelerators and other resources, this trend is reflected with substantial growth in demand in the high-speed Ethernet optics. LightCounting forecasts that the market for Ethernet optics will grow from approximately $3.0 billion in 2018 to approximately $6.0over $8.0 billion in 2025.2026. The market segment that we are primarily targeting comprises 400Gb/s and 800Gb/s modules and their addressable market are expected to grow toat a CAGR of approximately $3.0 billion in 2025,35%, according to LightCounting’s forecasts. We believe our silicon photonics platform is well positioned to address this market with highly integrated Si PICs and class leading III-V technology to implement the optical functionality required for such transceiver modules. We believe that our platform will provide a substantial cost advantage over conventional discrete-optics-based solutions, as well as over competing integrated photonics solutions due to our platform’s volume-scale manufacturing readiness and wafer-level integration and testing capabilities. In addition to the PICs, our silicon photonics-based spectrometer chipset for transceiver modules includes the analog/mixed-signal ICs that implement the interface to the electrical domain.
inherent benefits.Competitive Advantages
We believe our silicon photonics solutions and technology offer the following key healthcare monitoring benefits:
We believe that we have 7 sources of advantage over our competitors in meeting these healthcare needs:• Superior sensing performance.
LED-based
solutions, based on product analysis undertaken by Rockley comparing the Rockley silicon photonics-based spectrometer chip to existingLED-based
solutions. We believe that our unique silicon photonics technology and the entire product ecosystem we are developing will make ourend-to-end
LED-based
sensing (PPG signalsFigure 4: Enabling a new class of sensor by combining visible light and infrared
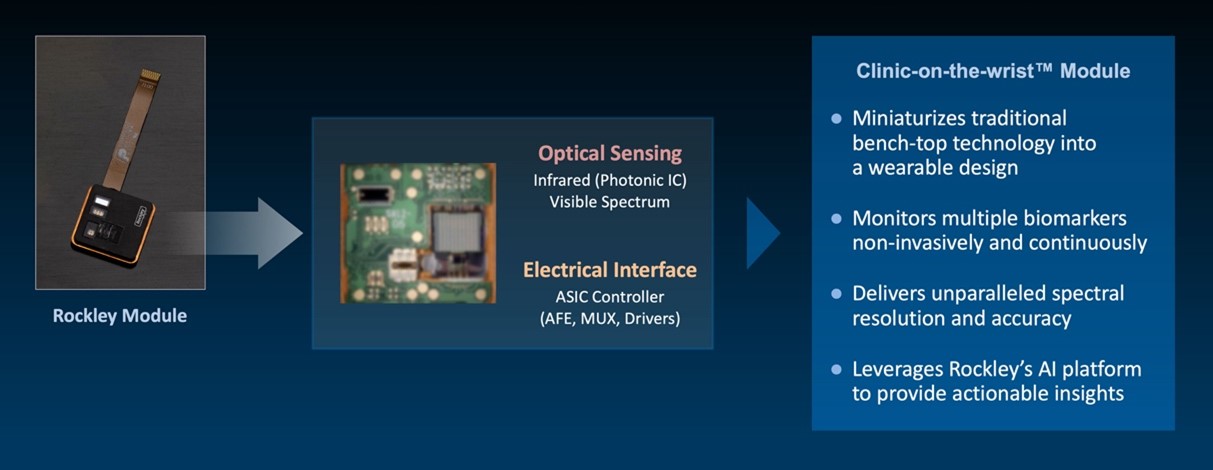
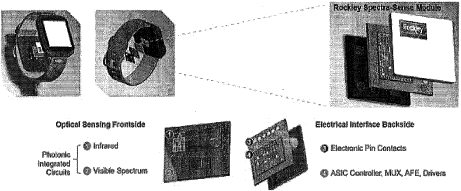
• Flexible platform architecture.
• Differentiated biomarker sensing algorithms and analytics. Our biomarker detection algorithms are optimized for our unique and optimized hardware technology platform. We believe that the data analytics and biomarker processing capabilities of our AI / cloud offering will further expand our ability to offer additional insights into a person’s health.
• Deep understanding of market opportunity and customer priorities.
are developing many applications and systems with our silicon photonics solutions that are driven by industry leaders in the consumer sensors, healthcare, and data communications markets. Through our established relationships with industry leaders, we have consistently demonstrated our ability to address their technological challenges. As a result, we have signed memoranda of understanding and have contracted with several industry leaders
67
in wearable consumer technology to establish product specifications and desirable features. We believe we are well-positioned to develop high-volume optical sensing modules and algorithms for their emerging architectures. We have ongoing, collaborative discussions with consumer wearables, healthcare, and communication companies and original equipment manufacturers (“OEM”) and module and component vendors to address their next generationnext-generation product offering to end users.
• Fabless, scalable business model with manufacturing process expertise and ownership.
• Highly differentiated manufacturing process.
III-V
actives, Integration) are unique and Silicon-On-Insulator
know-how
is based on over 30 years of leadership in the development and commercialization of silicon photonics, and we have established strong and deep technical foundations and expertise for high-volume product delivery that would be difficult for a competitor to replicate.• Established and committed foundry partner network.
Our Strategy
Our strategy is to become the leading global provider of sensing products comprised ofthat incorporate integrated optical modules with supporting electronics, software, application algorithms, and cloud-based AI platforms for high-volume and high-margin applications in dynamic and high-growth market sectors.sectors and for use-case specific opportunities with a focus on medtech and healthcare. Key elements of our strategy include:
• Extend our silicon photonics leadership.
• Identify and promote new and emerging applications for our technologies.
end-product
roadmaps and to demonstrate how our technologies can help them • Develop our product portfolio.
• Continue to attract and acquire new customers.
• Sustain margin through expansion of our products into
higher-end
markets.Our Technology Platform and Product Offerings
Our solutions leverage our deep understandingdeveloped knowledge of silicon photonics, application science, and our innovative platform architecture to address high-volume applications in the consumer sensors, healthcare,medtech and data communications markets.healthcare. We believe our leadership position in developing silicon photonics-based sensing solutions is a result of the following core strengths:
68
• Our custom multi-micron-waveguide photonics-optimized process with integrated
III-V
semiconductor actives brings multiple competitive advantages in terms of performance and manufacturability, offering lower waveguide losses, higher waveguide power handling, polarization independence, ubiquitous integration ofIII-V
actives in their nativeknown-good-die
form, ultra-broad-band performance, and lower sensitivity to manufacturing variations while enabling compact circuitry with high integration densities.Figure 5: Rockley spectrophotometer chip solution, as compared to conventional LED- and spectrometer-based solutions
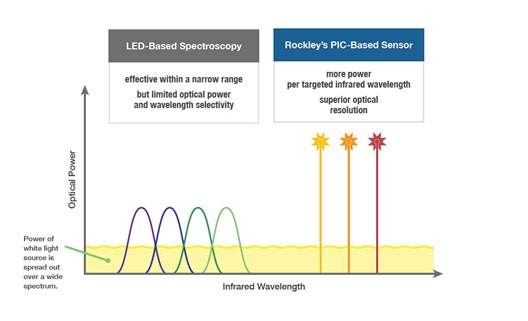

Additional key points concerning the photonics technology include the following:
• The platform provides broadband performance and is suitable for the visible, short-wave, and
Broadband optical performance also enables sensing a large optical spectrum to cover a wide range of measurands;mid-infrared
bands. This is a key enabler for sensing applications that other platforms cannot serve.• The platform is well suited to power-efficient integration of III-V waveguide devices such as lasers and modulators that also have a multi-micron mode size. Low-loss coupling from III-V to Si waveguide drives down power consumption for long battery life;
• A larger waveguide is much less sensitive to manufacturing variations that can affect its shape and hence its refractive index, thusthereby achieving much better center wavelength registration than small waveguides enabling accurate wavelength filters.
compact PICs. Compact PIC layouts result in small chip sizes to fit within consumer device form factors and reduce product cost.
• Accurate wavelength targeting enables using many finely-spaced wavelengths for accurate detection;
• Known-good-die
integration of active elements improved yields, which leads to cost-effective solutions.The figure below illustratesfollowing are the key components of our full stackend-to-end (full-stack) platform model.
model: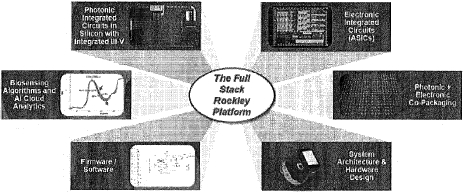
• Photonic integrated circuits in silicon with integrated
III-V:
• Application-specific integrated circuits (“ASICs”):
• Photonic
& electronic
co-packaging:
co-packaging
technologies, including 2.5D and 3D integration. Such dense integration is key and enables us to achieve the energy efficiency and physical size requirements for our core use cases. We partner with specialized packaging houses to provide the capacity required for serving consumer markets;
69
• System architecture
& hardware design:
• Firmware/software:
in-house
expertise to develop the necessary firmware and software to complement our hardware offerings and facilitate system integration, testing, and monitoring by our • Sensing algorithms, AI,
Figure 6: Rockley cloud analytics and AI
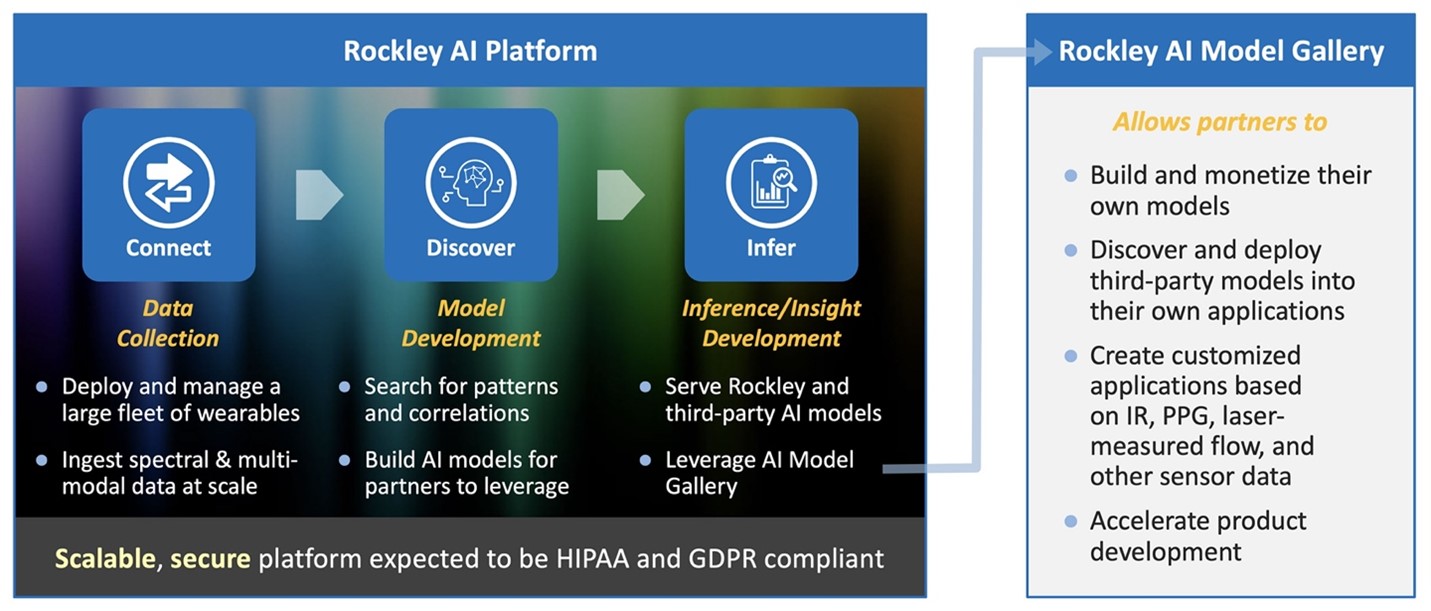
We believe the key benefits that our solutions can provide to our customers are as follows:
• Broad set of biomarkers with data analytics. Leveraging our unique integrated solution, we enable the detection and monitoring of multiple biomarkers. Analyzing the underlying spectral data with our growing base of machine learning and AI models has the potential to provide further insights into a person’s health;
• Low Powerpower and Small Footprint.
• Faster Timetime to Market.
time-to-market
Rockley’s Silicon Photonics Toolbox Elements
Rockley’s proprietary silicon photonics platform covers a uniquesolution, fromincluding generation of the light, into, manipulation of the light (modulation, multiplexing), radiation out of the module, and collection and processing of the returned light. The following provides an overview of the key components of our platform:
end-to-end
• Lasers:
• Modulators and detectors:
• Combiners and splitters:
• Fiber optic coupling:
on-chip
embedded interfaces to the optical fibers. These interfaces allow the fiber to be passively attached directly to the • Free-space optics:
• Photonic integrated circuits:
• Wafer-scale processing:
multi-die
structures forchip-on-wafer
integration;
70
• Interface electronics:
in-house
design expertise for custom analog circuitry to translate high-speed data streams into signals that actuate the • Packaged assembly:
Further application-based expertise is focused on:
on the following:• Tissue optics design:
• Applied data science:
Current Product Offerings
We have developed two separate product offerings to address our target markets: (i) VitalSpex (consume domain); and (ii) Bioptx (healthcare and medtech).
In respect of the VitalSpex biomarker sensing platform:
• We will target applications in the consumer health and wellness industry and expect strong customer engagement in the consumer electronics and wearables market. The VitalSpex platform represents a breakthrough that will empower consumer electronic devices, primarily personal wearables, smartphones and homecare devices, with the capacity for new powerful healthcare and wellness monitoring;
• The VitalSpex line will include a range of hardware and software solutions that enable non-invasive, continuous, and real-time monitoring of multiple biomarkers, from modules and chipsets that can be integrated into a wearable form factor to cloud analytics and artificial intelligence (AI);
• The VitalSpex line will include a Baseline module, which will target the measurement of core body temperature, body, hydration, blood pressure, and more, and a Pro module, which will add the measurement of alcohol, lactate, and glucose trends. Our first health monitoring product offering is expected to launch in the second half of 2022; and
• The VitalSpex Baseline and Pro modules will each combine existing LED-based optical sensing with Rockley’s proprietary infrared optical sensing to expand the range of biomarkers that wearable devices can measure. Our VitalSpex modules will include the hardware and software capabilities to collect information available and relevant to the target biomarkers.
• We also plan to offer additional cloud-based subscription services that enhance the capabilities of the VitalSpex platform.
In respect of the Bioptx healthcare sensing platform:
• The Bioptx platform will target medical institutions, such as hospitals, research clinics, pharmaceutical companies, medical device manufacturers, and other healthcare providers, offering them the ability to monitor the general health and wellness of individuals. The measurement capabilities of the Bioptx platform could potentially transform healthcare by providing real-time insights into a variety of health conditions and by enabling early detection of multiple disease states;
• The Bioptx platform will include a range of hardware and software solutions that enable non-invasive, continuous, and real-time monitoring of multiple biomarkers, from a stand-alone wearable wristband to cloud analytics and artificial intelligence (AI);
• The Bioptx platform will include Baseline products (for core body temperature, body, hydration, blood pressure, and more) and Pro products (which will add the measurement of alcohol, lactate, and glucose trends). Our first health monitoring product offering is expected to ship in the second half of 2022;
• We also plan to offer additional cloud-based subscription services that enhance the capabilities of the Bioptx platform;
• The intended markets for Bioptx products, including our wristband, are markets in the medical professional healthcare domain (i.e., not consumer) that require an optimized and dedicated solution for health monitoring, tracking, and detection; and
• We expect that our customers will initially use the Bioptx platform to monitor the general wellness of individuals under care or in studies. After products in the Bioptx line receive approval from the FDA or other regulatory bodies, we anticipate that customers will expand product use into preventive and diagnostic care, such as remote patient monitoring and diagnosis.
Future Product Capabilities
We plan to incorporate our biomarker sensing technology into a range of existing devices, such as patches, wearable bands, and other monitoring devices, to provide additional biomarker measurement capabilities not currently available. We continuously research, evaluate, and prioritize the addition of new biomarkers into our product offerings, with the objective of providing more valuable information and improving health insights. Our broad range of addressable biomarkers are at various stage of validation and demonstration, from proven science to miniaturization. The chart below illustrates a few examples of biomarkers for which we have validated their addressability using its IR wavelengths.
71
Figure 7: Lab validation of Rockley’s sensing technology

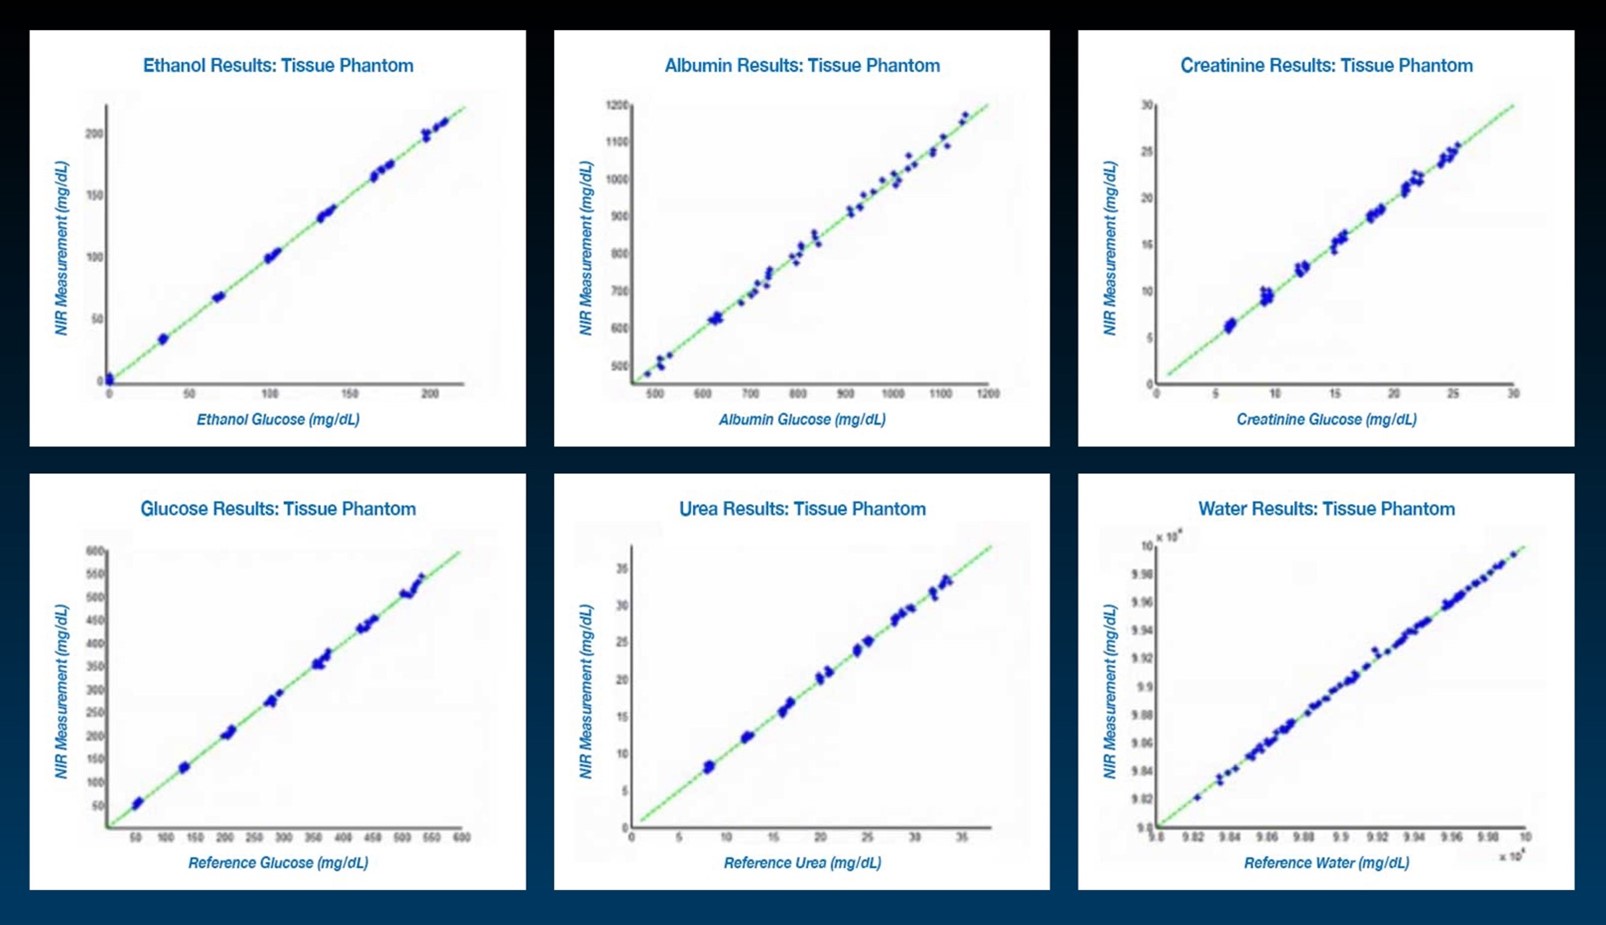
These biomarkers along a few others we are investigating are key in early detection, prevention, and monitoring of major chronic illnesses, as illustrated in the table below:
Figure 8: Disease detection and management potential of Rockley’s biomarker sensing platform

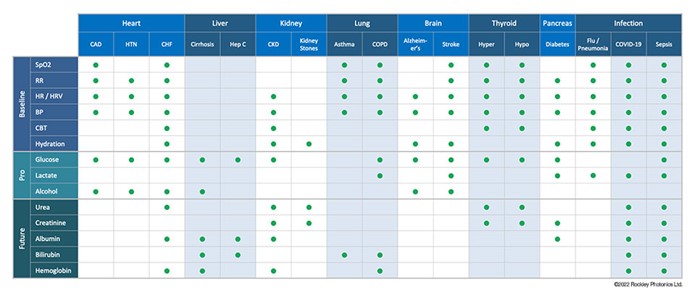
These products are still under development, and there can be no assurance that we will be successful in these product development efforts will succeed or that, even if developed, that suchthese products will achieve widespread market acceptance.
Customers
Our customers’ design cycle from initial engagement to volume shipment typically ranges from three to five years, with product life cycles of two years or more. For many of our products, which are technically complex, we must engage early with our customers’ technical staff. To ensure an adequate level of early engagement, our sales, marketing, and development engineers must work closely with our customers and channel partners to understand, identify, and propose solutions to meet their systems’ challenges. We work closely with our
72
customers to anticipate end customer market needs. In some cases, we work with ecosystem partners to better understand market trends and new requirements that are being placed on our end customers.
We believe that our existing commercial relationships with leading consumer and medtech customers validate our unique technology and the business opportunity at hand. Our near-term commercial focus is on a robust pipeline in consumer devices, medical devices, and life sciences companies. We have a sales funnel of over 100 potential customer targets, of which we have started discussions with 54 and entered into contracts with 17. The customers with which we are contracted represent more than 60% of wearable global volumes, six of the top ten wearables companies, and two of the top ten medtech companies. Although our near-term focus through 2024 is on our consumer wearables and medtech strategy, we believe that other markets also represent upside potential.
To date, we have generated revenue primarily from non-recurring engineering (“NRE”) and development services for customer-specific designs of silicon photonics chipsets for incorporation into customers’ end products. Our two largest customers collectively accounted for 82% and 100% of our revenue in 2021 and 2020, respectively. We anticipate that revenue attributable to these customers will fluctuate from period to period, although we expect to remain dependent on these customers for a significant portion of our revenue for the foreseeable future. See “Risk Factors – Customer-Related Risks.” We anticipate that we may achieve increased revenue beginning in 2023, assuming commercial adoption of our products by consumer device manufacturers in the wearable space.
We work closely with our end customers throughout their design cycles and will develop long-term relationships as our differentiated technology becomes embedded into their products. For example, we currently hold a development and supply agreement with one customer since 2017 and have successfully designed and delivered critical sample chips to them. As a result, we believe we are well-positioned to be designed into their product roadmaps and develop next-generation solutions for their future products. Because many of our target customers or their OEMs are located in North America and Asia Pacific, we anticipate that a majority of our future revenue will come from sales in these regions. Although a large percentage of our sales are made to customers in North America, we believe that a significant number of the systems and devices designed by these customers will incorporate our semiconductor products which are then sold to end-users globally. We expect that once our modules are commercially available, we will enter into standard supply agreements with each of these parties.
Manufacturing
Our Proprietary Production and Manufacturing Ecosystem
We have built, and plan to continue to develop, a global manufacturing ecosystem designed with the ability to scale in a rapid and efficient manner. Several key areas within this manufacturing ecosystem run on our proprietary process and manufacturing technologies and are protected by our intellectual property portfolio. We possesscontrol over design, manufacturing and packaging process,processes, algorithms, and software. Our disciplined and systematic documentation and protection of critical
end-to-end
know-how,
trade secrets, and proprietary information further underpins our manufacturing ecosystem. To the best of our knowledge, there are no other turnkey options with the components and technologies needed to put together our sensing product. In addition to the intellectual property arrangements, we also have commercial exclusivity agreements with some of the key manufacturing ecosystem partners to prevent replication of this capability.In addition to providing what we believe to be unmatched capabilities at the product level, our platform and the associated technology have been designed from bottom up to take into accountconsider the relative ease and cost of manufacturing and scaling. Elements like waveguide dimensions for ease of wafer fabrication and high yields, robust and position tolerant coupling strategies for
III-V
integration, wafer scaleback-end
activities forIII-V
manufacturing, and all known good die integration at the module are integral to the product and the process technology. These elements are covered by the intellectual property which we have licensed to partners in our manufacturing ecosystem.
Manufacturing Model Overview
We plan to operate a fabless business model and use third-party foundries and assembly and testOutsource Assembly & Test (OSAT) contractors to manufacture, assemble and testproduce our products. In several key areas, our third-party partners operate a proprietary process wholly owned by us and protected by our intellectual property portfolio. This outsourced manufacturing approach allows us to focus our resources on the design, sale, and marketing of our products. In addition, we believe that outsourcing many of our manufacturing and assembly activities provides us with the flexibility needed to respond to new market opportunities and scale for customer demand, simplifies our operations, and significantly reduces our capital commitments.
We believe our fabless model will allow us to scale in a capex efficient manner. We have contracted with globaltier-I tier-1 foundries, including Newport Wafer FabSkywater (“NWF”SW”) for silicon PICs and wafer-scaleautodefense applications and has the capacity to manufacture over 400,000 wafers per year. The terms of this agreement provide that Rockley will be a priority customer of NWF with regard to supply of PICs, wafers, and testing facilities. In return, Rockley agrees to give NWF a right of first refusal to supply of such products and services, subject to NWF completing a build out of their capabilities, provided that Rockley is entitled to seek alternative supply where NWF does not satisfy Rockley that NWF is able to meet Rockley’s requirements for price, lead times, or quality of supply. Our agreement with NWF does not include any binding commitments or minimum requirements with respect to order or supply volumes.our production needs. Our high-volume
III-V
device integration and testing. This US based foundry is qualified for health, consumer and III-V
semiconductor foundry is consumer and telecom qualified, supports very high volumes, and runs fully automated processes at one of the largest wafer scale inIII-V
manufacturing globally. Finally, our global IC foundry supplier handles the manufacturing of the electronic integrated circuits for our sensing modules. The foundry is used by most major consumer OEMs and is qualified for the ultra-high volume process node that we have chosen.• Raw Materials and Wafer Supply:
III-V
components, we have arrangements in place with the world’s leading epitaxial wafer supplier. We also have volume ready suppliers for commercialoff-the
shelf-components (“COTS”) that go into the visible sensing and the overall module.• Wafer Fabrication:
For the
III-V
active components, epitaxial materials are processed into finished wafers at a world leading dedicated III-V foundry73
making detectors, lasers and LEDs usingwafer-scale levels of automation. We have adapted the base process technology from this foundry to incorporate the previously discussed elements that allow for ease of integration into our platform and ease of manufacturing. These elements are exclusively for use in Rockley products.
state-of-the-art
Finally, for ASIC manufacturing, we use a standard process node and PDK provided to us by TSMC.Taiwan Semiconductor Manufacturing Company, Limited. While the manufacturing process is widely used in high volume (good for product economics), the design
know-how
belongs to Rockley. The custom ASIC matches our silicon photonics platform optimally for low noise, low power and high level of integration.• Chipset and module integration:
III-V
active components into the silicon PICs is done at wafer scale and using passive alignment techniques that are uniquely enabled in our platform. Furthermore, we have ensured that theIII-V
components are in arrays of devices (reduces amount of alignment and integration activities) and on pretested known good die (“KGD”) which ensures very high compounded yields. The process The integration of the overall module isTier-I Tier-1 consumers in this space and expect to finalize these arrangements for assembly within 2021.within 2022.
in-line
with assemblies used for wearables and mobile devices and there are many global suppliers with this capability. We have engaged with leading suppliers that serveWe have development and supply agreements in place with theour key suppliers. These agreements cover the development program, economic framework, IP licenses, exclusivity terms and other matters. Although we have commenced long-term supply agreement discussions in parallel with the detailed manufacturing ramp discussions, we do not currently have any long-term supply agreements in place and transact business with our third-party suppliers on a purchase-order basis with no minimum supply obligations on their part. We have designed our manufacturing partner network to be resilient by having multiple sources of supply for several key processes/components and we have plans for the appropriate inventory and stocking strategies to mitigate risks to our ramp plans.
Commitment to Quality
We are committed to excellence by creating class-leading silicon photonics-based products and services. We intend to meet or exceed our global customer expectations by:
by executing the following:•Creating long-lasting, trusting, and mutually beneficial relationships with customers and partners;
•Establishing a full understanding of our customers’ requirements and ensuring our products and services meet their expectations;
•Building a team of highly trained, empowered, and accountable employees;
•Innovating in the creation of technology drivingthat drives our products and services; and
•Improving the effectiveness and efficiency of our quality management system through review of results, learning, and enhancement on a continual basis.
in-house
processes, increase yield, lower manufacturing costs, and improve product quality. See “Risk Factors Research and Development
We believe that our future success depends on our ability to develop new products for both existing and new markets, development enhancements to our products once developed or if and when commercially launched, to stay ahead of our competition by being leaders in extending the boundaries of our technologies. As a result, a significant amount of our operating expenses has been allocated towards next-generation platform development. Our research and development efforts are focused primarily on extending the functionality and addressable markets of our integrated photonics platform, as well as continually increasing its performance, efficiency, and volume manufacturing competitiveness. We have assembled a core team of experienced engineers and systems designers with an extremely broad range of skill sets across different disciplines who conduct research and
development activities in the United States and various European locations, and we are supported by partnershipspartnerships with leading research institutions and consumer electronics and medical devices companies. As of June 30,December 31, 2021, we have 250had 302 employees globally with over 75% of our workforce focused on research, product development, and engineering.
Competition
The global optical components and full-stack solution market in general, and the consumer sensor, healthcare, and data communications markets in particular are highly competitive. We expect competition to increase and intensify as additional companies enter our target markets. Our competitors range from large, international companies offering a wide range of services and optical components, such as LEDs, lasers, detectors, or PICs, to smaller companies specializing in narrow market verticals. Some of our key competitors across various verticals include: AMS, ADI, Broadcom, Brolis, Cisco, GlobalFoundries, Intel, Lumentum, Maxim, OSRAM, TSMC, and Tower Jazz.vertical markets. We expect competition in our target markets to increase in the future as existing competitors improve or expand their product offerings and as new competitors enter these markets. However, we believe that we are currently the only provider with the capability to integrate the technologies, and features, and performance required by customers in our target markets. We believe that our unique silicon photonic-basedsilicon-photonic-based platform and the entire product ecosystem whichthat we have developed around it will make ourofferings in the health and wellness domain difficult to replicate and providesprovide us with a
end-to-end
74
significant competitive advantage.moat. We believe this will be particularly true as we incorporate our AI and cloud-based offerings, currently under development.
Intellectual Property
We rely on a combination of intellectual property rights, including patents, trade secrets, copyrights and trademarks, and contractual protections, to protect our core technology and intellectual property. As of June 30, 2021,March 31, 2022, we had 85200 issued and allowed patents and 85292 other patent applications pending in the United States and 59 patents in foreign jurisdictions.worldwide. The 85107 issued and allowed patents in the United States expire in the years beginning in 20212022 through 2040. The 59 patents in foreign jurisdictions include 33 in the United Kingdom, 23 in China, and 3 in Japan, and they expire in the years beginning 2027 through 2039. Many of our issued patents and pending patent applications relate to sensors and sensor chips, and we have extensive geographic coverage over numerous relevant technology domains.
In addition to our own intellectual property, we also use third-party licensors for certain technologies embedded in our silicon photonics solutions. These are typically
non-exclusive
contracts provided underpaid-up
licenses. These licenses are generally perpetual or automatically renewed for as long as we continue to pay any maintenance fees that may be due. To date, maintenance fees have not constituted a significant portion of our annual capital expenditures. We have entered into a number of licensing arrangements pursuant to which we license third-party technologies. We do not believe our business is dependent to any significant degree on any individual third-party license.We generally control access to and use of our confidential information and trade secrets through the use of internal and external controls, including contractual protections with employees, contractors, and customers. We rely in part on the laws of the United States and international laws to protect our work. All employees and consultants are required to execute confidentiality agreements in connection with their employment and consulting relationships with us. We also require them to agree to disclose and assign to us all inventions conceived or made in connection with the employment or consulting relationship. However, we cannot guarantee that we have entered into such agreements with every such party, and we may not have adequate remedies in case of a breach of any such agreements. Our trade secrets could be disclosed to our competitors or others may independently develop substantially equivalent technologies or otherwise gain access to our trade secrets. Trade secrets can be difficult to protect and some courts inside and outside of the United States are less willing or unwilling to protect trade secrets.
Government Regulation
Healthcare-Related Regulation
Our solutions may be incorporated into multi-application, health-related sensing, and monitoring applications, including healthcare consumer wearables. Accordingly, the end products into which our solutions are incorporated may be subject to FDA and similar or related regulations, and demand for these end products or future regulated products could be adversely affected if such end products do not comply with applicable requirements. Although our target market is consumer wellness rather than medical, we intend to monitor and comply with regulations to the extent they become applicable to us, including any requirements for FDA clearance. Certain healthcare-related products may be regulated by the FDA and corresponding state regulatory agencies in the United States and separate governmental authorities outside of the United States. In the United States, the medical device industry is regulated by governmental authorities, principally the FDA and corresponding state regulatory agencies. Before a new regulated product or a significant modification to an existing medical device may be marketed or sold in the United States, it must comply with FDA Quality Management System regulations, and must obtain regulatory clearance or approval from the FDA, unless an exemption from
pre-market
review applies. In addition, certain future software functionality, whether standalone or embedded in existing or future devices, may be regulated as a medical device and requirepre-market
review and clearance or approval by the FDA. The process of obtaining regulatory clearances or approvals to market a medical device can be costly and time consuming, and our end customers may not be able to obtain these clearances or approvals on a timely basis, or at all, for future products. Any delay in, or failure to receive or maintain, clearance or approval for any medical device products under development could prevent us from generating revenue from our solutions incorporated into these products.Medical devices are also subject to numerous ongoing compliance requirements under the regulations of the FDA and corresponding state regulatory agencies, which can be costly and time consuming. For example, under FDA regulations medical device manufacturers are required to, among other things: (i) establish a quality management system to help ensure that their products consistently meet applicable requirements and specifications; (ii) establish and maintain procedures for receiving, reviewing, and evaluating complaints; (iii) establish and maintain a corrective and preventive action procedure; (iv) report certain device-related adverse events and product problems to the FDA; and (v) report to the FDA the removal or correction of a distributed product. If our solutions are incorporated into any medical device products of our end customers and these customers experience any product problems requiring reporting to the FDA or otherwise fail to comply with applicable FDA regulations or the regulations of corresponding state regulatory agencies, it could harm our ability to sell our solutions. In addition, if our end customers in the healthcare market are subject to enforcement actions such as fines, civil penalties, injunctions, recalls of products, delays in the introduction of products into the market, and refusal of the FDA or other regulators to grant future clearances or approvals, it could harm our reputation, business, operating results, and financial condition. In addition, in the United States, the FDA has taken the position that device manufacturers are prohibited from promoting their products other than for the uses and indications set forth in the approved product labeling, and any failure to comply could subject our end customers to significant civil or criminal exposure, administrative obligations and costs, and/or other potential penalties from, and/or agreements with, the federal government.
Government regulations outside the United States have, and may continue to, become increasingly stringent and common. In the European Union, for example, the European Union Medical Device Regulation was published in 2017 and, when it entered into full force in 2020, included significant additional
pre-market
and post-market requirements. Penalties for regulatorynon-compliance
could be severe, including fines and revocation or suspension of a company’s business license, mandatory price reductions, and criminal sanctions. Future laws and regulations may have a material adverse effect on our end customers in the healthcare market, which in turn may negatively impact our ability to sell our solutions and otherwise harm our business and financial results.Export Regulation
75
Our business activities are also subject to various restrictions under U.S. export and similar laws and regulations, as well as various economic and trade sanctions administered by the U.S. Treasury Department’s Office of Foreign Assets Control. Further, various countries regulate the import of certain technology and have enacted or could enact laws that could limit our ability to provide customers with our products in those countries.
We are also subject to various domestic and international anti-competitionanti-corruption laws, such as the U.S. Foreign Corrupt Practices Act and the U.K. Bribery Act, as well as other similar anti-bribery and anti-kickback laws and regulations,regulations. These laws and regulations generally prohibit companies, their employees, and their intermediaries from authorizing, offering, providing, and/or accepting improper payments or other benefits for improper purposes. Although we take precautions to prevent violations of these laws, our exposure for violating these laws increases as our international presence expands and as we increase sales and operations in foreign jurisdictions.
New legislation or regulation, the application of laws from jurisdictions whose laws do not currently apply to our business, or the application of existing laws and regulations to technology in the wearables industry generally could result in significant additional compliance costs and responsibilities for our business.
Privacy
We are or may become subject to a variety of laws and regulations in the United States and abroad regarding privacy, data protection, and data security. These laws and regulations are continuously evolving and developing. The scope and interpretation of the laws that are or may be applicable to us are often uncertain and may be conflicting, particularly with respect to foreign laws.
In particular, there are numerous U.S. federal, state, and local laws and regulations and foreign laws and regulations regarding privacy and the collection, sharing, use, processing, disclosure, and protection of personal data. Such laws and regulations often have changes in scope, may be subject to differing interpretations, and may be inconsistent among different jurisdictions. For example, the General Data Protection Regulation (the “GDPR”), which became effective in May 2018, includes operational requirements for companies that receive or process personal data of residents of the European Union that are broader and more stringent than those previously in place in the European Union. The GDPR includes significant penalties forrevenue,revenue. Additionally, in June 2018, California enacted the California Consumer Privacy Act (the “CCPA”), which became effective in January 2020. The CCPA requires covered companies to provide California consumers with new disclosures and expands the rights afforded consumers regarding their data,data. Fines for noncompliance may be up to $7,500 per violation. We cannot currently estimate the potential impact of the CCPA on our business or operations.
non-compliance,
including fines of up to €20 million or 4% of total worldwide Additionally, we rely on various legal mechanisms for transferring certain personal data outside of the European Economic Area, or EEA, including thepractices,practices. In such cases, we could be required to make potentially expensive changes to
EU-U.S.
Privacy Shield Framework, or Privacy Shield, and EU Standard Contractual Clauses, or SCCs. If we fail or are perceived to fail to meet the Privacy Shield principles or our obligations under the SCCs, or if any of these legal mechanisms for transferring data from the EEA are invalidated by European courts or otherwise become defunct, European Union data protection authorities or the U.S. Federal Trade Commission, or FTC, could bring enforcement actions seeking to prohibit or suspend our data transfers or alleging unfair or deceptive our information technology infrastructure and business operations, and we could face legal liability, fines, negative publicity, and resulting loss of business.
Certain health-related laws and regulations such as the Health Insurance Portability and Accountability Act of 1996, or HIPAA, and the Health Information Technology for Economic and Clinical Health Act, or HITECH, may also have an impact on our business. If we are unable to comply with the applicable privacy and security requirements under HIPAA, HITECH, or PCI DSS, or we fail to
comply with BAAs that we enter into with covered entities, we could be subject to claims, legal liabilities, penalties, fines, and negative publicity, which could harm our operating results.
Governments are continuing to focus on privacy and data security, and it is possible that new privacy or data security laws will be passed, or existing laws will be amended in a way that is material to our business. Any significant change to applicable laws, regulations, or industry practices regarding our users’ data could require us to modify our services and features, possibly in a material manner, and may limit our ability to develop new products, services, and features. Although we have made efforts to design our policies, procedures, and systems to comply with the current requirements of applicable state, federal, and foreign laws, changes to applicable laws and regulations in this area could subject us to additional regulation and oversight, any of which could significantly increase our operating costs.
We strive to comply with all applicable laws, policies, legal obligations, and industry codes of conduct relating to privacy, data security, and data protection. The costs of compliance with, and other burdens imposed by, the GDPR, CCPA, HIPAA, and similar laws may limit the use and adoption of our products and services, and/or require us to incur substantial compliance costs, which could have an adverse impact on our business. In addition, given that the scope, interpretation, and application of these laws and regulations are often uncertain and may be conflicting, it is possible that these obligations may be interpreted and applied in a manner that is inconsistent from one jurisdiction to another and may conflict with other rules or our practices. Any failure or perceived failure by us, our end customers, or third-party service-providers to comply with our privacy or security policies or privacy-related legal obligations, the failure or perceived failure by our end customers to comply with their privacy policiesprivacy-related legal obligations, or any compromise of security that results in the unauthorized release or transfer of personal data, may result in governmental enforcement actions, litigation, damages, penalties, and negative publicity, and could also have an adverse effect on our brand and operating results.
or
Cybersecurity
We have designed and implemented and continue to maintain a security program consisting of policies, procedures, and technology intended to maintain the privacy, security and integrity of our information, systems, and networks. Among other things, the program includes controls designed to limit and monitor access to authorized systems, networks, and data, prevent inappropriate access or modification, and monitor for threats or vulnerability.
Employees and Human Capital Resources
76
Our workforce represents a highly regarded team of silicon photonics and measurement science experts under the same organization. A significant number of our employees have advanced degrees, including a large percentage holding Ph.Ds..PhDs. As of June 30, 2021,March 31, 2022, we had 250 full-time322 employees, a large percentage of those employeeswhom are in technical roles, including engineering.
•The quality of our employees is well recognized in the industry and has a strong and positive impact on our ability to develop and capitalize on our strategic operating model and business plan.
•Our leadership team is recognized for world-leading expertise in silicon photonics design and process, microelectronics design, packaging and test, software and Algorithmsalgorithms including Cloudcloud and AI, and applications in data communications and medical sensing.
•We have strong relationship with our employees and have never experienced a work stoppage.
Despite the significant challenges facing the world economy in light of the
COVID-19
pandemic, we have remained focused on our business plan and priorities. We intend to continue to focus on:• Protecting the wellbeingwell-being of our employees and keeping them healthy and engaged.
• Making our physical workplaces safe and compliant.
• Building out efficient global human resource information systems and processes.
• Recruiting and staff retention for critical skills and competencies.
• Investing in the development of current and future leadership.
• Creating sustainable operations, while building resilience, efficiency and flexibility into everything, from strategy to work design.
Facilities
Our headquarters are currently located in the United Kingdom. We have premises in Pasadena, California under a leasemultiple leases for approximately 16,00018,000 square feet, which leasewith most leases for the majority of thethese premises leased expires inexpiring around June 2023. The premises in Pasadena are predominantly used for engineering, and finance, and general administration services. We also lease a property in San Jose, California toof approximately 4,600 square feet under a lease expiring in 2024, which is predominantly used for sales and marketing, finance, and general administration services. To support headcount growth over the past year, we continue to explore options and timing for improving and expanding our facilities. In the United States, we recently finalized a new office leaseexpanded our premises in Irvine, California to accommodate our sensor application facility and additional office space and have under a leasemultiple leases for approximately 8,00012,000 square feet, which lease expiresall expiring in July 2026.2027. In the United Kingdom, we have expandeda lease on our lab facilities in Wales tofor approximately 1,733 square feet under a lease due to expire in 2024. We also recently entered into a facilities access agreement for new premises at the Tyndall Institute in Cork, Ireland for a new laboratory and office space of approximately 600 square feet. We believe that our current facilities are sufficient to support our operations and growth plans and that additional space, if needed, will be available on commercially reasonably terms.
Legal Proceedings
MANAGEMENT
Executive Officers and Directors
Rockley’s directors and executive officers and their ages as of August 11, 2021June 30, 2022 are as follows:
Name | Age | Position | ||||||||
Executive Officers | ||||||||||
Andrew Rickman, OBE | 62 | Chairman and Chief Executive Officer | ||||||||
| 47 | Interim Chief Financial Officer | |||||||||
| Non-Employee Directors | ||||||||||
| 66 | Lead Independent Director | |||||||||
Brian Blaser(1) | 58 | |||||||||
Caroline Brown, Ph.D.(1) | 60 | Director | ||||||||
| 61 | ||||||||||
| Karim Karti | 53 | Director | ||||||||
Michele Klein(2)(3) | 72 | Director | ||||||||
Pamela Puryear(2)(3) | 58 | |||||||||
________
Member of the audit committee. |
| (2) | Member of the compensation committee. | ||||
| (3) | Member of the nominating and corporation governance committee. | ||||
Executive Officers
Andrew Rickman OBE.
Chad Becker. Chad Becker serves as Rockley’s interim chief financial officer, a position he has held since June 2022. Mr. Becker has 20 years of corporate finance experience and his demonstrated leadership skills make him well-qualified to serve on the HoldCo board of directors.
Directors
William Huyett.
78
its strategy and corporate finance practices, and served on McKinsey’s Shareholder’s Council (its board of directors) from 2005 to 2014, serving as chair of its Finance Committee from 2007 to 2010. Mr. Huyett was, until the company’s merger in August 2020,Tbilisi-basedTbilisi based Georgia Healthcare Group. He serves on the boards of the Rockefeller University, the Marine Biological Laboratory Woods Hole, the University of Virginia Engineering School Foundation, and the National Parks Conservation Association. Mr. Huyett earned his B.S. in electronics in engineering and his MBA from the University of Virginia, where he now serves as a lecturer on corporate finance, corporate strategy and governance. We believe Mr. Huyett’s top executive experience, and his strong governance background, make him well-qualified to serve on the HoldCo board of directors.
non-executive
board chair of the London Stock Exchange listed, Brian Blaser.
15-year
tenure at Abbott Laboratories (NYSE: ABT), a multinational medical devices and healthcare company. Since March 2021, Mr. Blaser has served as an Executive Advisor to Water Street Healthcare Partners, an investment and strategic advisory firm specializing in the healthcare sector. From 2012 to 2019 Mr. Blaser was executive vice president of the Diagnostics Products division at Abbott, and he served in several roles covering global and strategic operations. Prior to joining Abbott in 2004, Mr. Blaser held positions in operations, finance, and engineering at Johnson & Johnson, Eastman Kodak Company, and General Motors Company. Mr. Blaser holds a B.S. in mechanical engineering technology from the University of Dayton and an MBA from the Rochester Institute of Technology Saunders College of Business.Caroline Brown,
Ph.D.
non-executive
director for the IP Group plc (LON: IPO), an intellectual property commercialization company, and Rockley, where she currently chairs the audit non-executive
director of Georgia Capital plc (LON: CGEO) and Luceco plcsub-Committee
of the Partnership Council of Clifford Chance LLP, a privately held international law firm. Dr. Brown has served on public company boards for 20 years and is experienced in managing early-stage companies and divisions of FTSE 100 groups in the energy and technology sectors. Dr. Brown spent her early career in corporate finance with Merrill Lynch (New York), UBS, and HSBC, advising global corporations and governments. Dr. Brown holds a first-class degree and Nicolaus Henke. Nicolaus Henke has served as a member of the Board since February 2022. He has spent 30 years of his career with McKinsey & Company. In 2003, he began serving as a senior partner and led McKinsey’s healthcare practice worldwide. During his career, Dr. Brown’s strong corporate governance experienceHenke has advised top teams in leading health systems, medical device companies and leadershippharmaceutical companies on public company boards makes her well-qualifiedstrategy, operations and organization. In 2015, he founded McKinsey Analytics, to build McKinsey’s global capabilities in machine learning. Additionally, he served on the firm’s shareholder’s council (its board of directors) and on its partner and senior partner personnel review panel. He initiated and oversaw eight acquisitions and partnerships into McKinsey, including QuantumBlack. He built a team of 3,000 technologists and consultants across McKinsey Analytics and QuantumBlack and oversaw McKinsey’s Digital capabilities. Dr. Henke was the founding chair of the McKinsey Technology Council in 2020, on which he continues to serve to this day as a senior partner emeritus. Dr. Henke holds a Master of Public Administration degree from Harvard University (where he was selected a John J. McCloy scholar) and holds a Master’s and a Doctorate in Business Administration from the University of Muenster, Germany. In addition, Dr. Henke serves on Board of Directors of Innovations in Healthcare, a global initiative on innovative healthcare delivery founded by Duke, McKinsey and World Economic Forum, and on the HoldCo boardDean’s Advisory Council for the Harvard Kennedy School. He previously served as a Trustee and Member of directors.the Finance Committee for Nuffield Trust and as a Trustee and Chair of the Strategic Committee for the Guy’s & St. Thomas Foundation (London).
Karim Karti.
Michele Klein. Michele Klein has served as a member of the healthcare industry and his prior leadership positions make him well-qualified to serve on the HoldCo board of directors.
co-founded
to provide science-based tools to improve vision. Ms. Klein currently serves as a board member of Aviat Networks Inc (NASDAQ: AVNW), Intevac (NASDAQ: IVAC), Photon Control (TSX:PHO), and Gridtential Energy Inc. From 2005 to 2010, she was a senior director of Applied Ventures, LLC, the venture capital arm of Applied Materials Inc. (NASDAQ: AMAT) (“Applied”), where she recommended and managed investments in energy storage and solar energy, representing Applied on the boards of seven technology companies. Earlier she founded and led two semiconductor equipment companies. Ms. Klein was chief executive of Boxer Cross Inc. from 1997 to 2003 when it was acquired by Applied, and ran theIn-line
Electrical Metrology team from 2003 to 2005. She led High Yield Technology from 1986 to 1996 when it was acquired by Pacific Scientific (NYSE:DHR). Ms. Klein previously held marketing management positions at Knoll International and Hewlett-Packard Company. Ms. Klein holds a B.S. from the University of Illinois and an MBA from the Stanford Graduate School of Business.Pamela Puryear, Ph.D.
79
concentration in organizational behavior, from Yale University. She serves on the Advisory Board of the Healthcare Businesswomen’s Association and has been recognized by Black Enterprise Magazine as one of the Most Powerful Executives in Corporate America and Top 50 Most Powerful Women in Business. We believe Dr. Puryear’s strong executive expertise and pharmaceutical and medical device background makes her well-qualified to serve on the HoldCo board of directors.
Corporate Governance
Composition of the HoldCoRockley Board of Directors
The business and affairs of HoldCoRockley are managed under the direction of its board of directors (the “Board” or the “HoldCo“Rockley Board”). Dr. Andrew Rickman serves as chairman and William Huyett serves as the lead independent director. Subject to the termsOur Amended and Restated Memorandum and Articles of HoldCo’s governing documents, the numberAssociation (the “Articles”) provide that our Board shall consist of directors is fixednot less than one and no more than nine directors. Our Board currently consists of eight directors. Vacancies on our Board can be filled by theresolution of our Board.
When considering whether directors and director nominees have the experience, qualifications, attributes, and skills, taken as a whole, to enable the Board to satisfy its oversight responsibilities effectively in light of its business and structure, the board of directors expects to focus primarily on each person’s background and experience as reflected in the information discussed in each of the directors’ individual biographies set forth above in order to provide an appropriate mix of experience and skills relevant to the size and nature of its business.
In accordance with the terms of HoldCo’sRockley’s governing documents, the Board is divided into three classes, Class I, Class II, and Class III, with members of each class serving staggered three-year terms. The Board is currently divided into the following classes:
•Class I: Brian Blaser and Pamela Puryear, whose terms will expire at HoldCo’s firstthe 2025 annual meeting of shareholders to be held after the Closing;
•Class II: Nicolaus Henke, Karim Karti and Michele Klein, whose terms will expire at HoldCo’s secondthe 2023 annual meeting of shareholders to be held after the Closing;shareholders; and
•Class III: Andrew Rickman, William Huyett, and Caroline Brown, whose terms will expire at HoldCo’s thirdthe 2024 annual meeting of shareholders to be held after the Closing.
At each annual meeting of shareholders to be held after the initial classification, the successors to directors whose terms then expire will be elected to serve from the time of election and qualification until the third annual meeting following their election and until their successors are duly elected and qualified. This classification of the HoldCoRockley Board may have the effect of delaying or preventing changes in control or management of HoldCo. HoldCo’sRockley. Rockley’s directors may be removed from office at any time, but only for cause and only by the affirmative vote of the holders of at least a majority of all HoldCo Ordinary SharesRockley ordinary shares entitled to vote and who vote at a general meeting of HoldCo.
Rockley.Director Independence
The HoldCoRockley Board determined that each of the directors on the HoldCo board of directors other than Dr. Andrew Rickman, OBE, and Karim Karti, qualifies as an independent director, as defined under the rules of the NYSE Listed Company Manual (the “NYSE listing rules”), and the HoldCoRockley Board consists of a majority of “independent directors,” as defined under the rules of the SEC and the NYSE listing rules relating to director independence requirements. There are no family relationships among any of our directors or executive officers. In addition, HoldCoRockley is subject to the rules of the SEC and NYSE listing rules relating to the membership, qualifications, and operations of the audit committee, nominating and corporate governance committee, and compensation committee, as discussed below.
Role of the Board in Risk Oversight/Risk Committee
One of the key functions of theour Board is informed oversight of Rockley’sour risk management process. TheOur Board does not have a standing risk management committee, but rather administers this oversight function directly through theour Board as a whole, as well as through various standing committees of theour Board that address risks inherent in their respective areas of oversight. In particular, theour Board is responsible for monitoring and assessing strategic risk exposure and the audit committeeour Audit Committee has the responsibility to consider and discuss Rockley’s
our major financial risk exposures and the steps itsour management will takehas taken to monitor and control suchthese exposures, including guidelines and policies to govern the process by which risk assessment and management is undertaken. The audit committeeAudit Committee also monitors compliance with legal and regulatory requirements. Our compensation committee also assessCompensation Committee assesses and monitormonitors whether our compensation plans, policies, and programs comply with applicable legal and regulatory requirements. The Nominating and Corporate Governance Committee also periodically evaluates our risk management process in light of the nature of the material risks we face and the adequacy of our governance policies and procedures designed to address risk.
Environmental, Social and Governance Oversight and Activities
We have made a commitment to prioritize environmental, social and governance matters, including sustainability, environmental protection, community and social responsibility, diversity, equity, inclusion and belonging, together with human rights. The Nominating and Corporate Governance Committee of our Board regularly reviews our ESG policies, programs, practices and reports to ensure that we are meeting our ESG goals. In addition, the Compensation Committee of the Board has responsibility for reviewing the overall adequacy of our policies, programs, practices, and reports concerning diversity, equity, inclusion and belonging, and our employment practices. Our ESG approach focuses on:
•Providing a safe and supportive space that welcomes and values everyone’s unique experiences and authentic self. We provide a diverse environment where our employees, partners, vendors, and customers are treated with respect, dignity and integrity, supporting diversity in thought and culture, growth and development in their individual roles and as a community.
•We seek to promote diversity of ethnicity, sex, sexual orientation, gender identity and expression, age, physical ability, nationality, socio-economic status, religious beliefs, and other characteristics in our workforce, supplier ecosystem and Board.
80
•Advancing environmental practices that reduce the impact of our operations.
•Implementing sound corporate governance and ethical practices, building long-term value for our shareholders and trust with all stakeholders.
Diversity, Equity, Inclusion and Belonging
As a global company, much of our success is rooted in the diversity of our teams and our commitment to inclusion. We intend to continue developing, attracting, and retaining talent and enhancing diversity, equity, inclusion and belonging in our workforce to support our ability to grow our business and fulfill our desired objectives in meeting customer’s goals. To facilitate this objective, we seek to foster a diverse, inclusive, and safe workplace, with opportunities for employees to develop their talents and advance their careers. We actively seek employees from diverse backgrounds, including diversity in thought and experience, who we encourage to leverage their collective talents. As of December 31, 2021, approximately 26% of our employees identify as female/gender diverse. Approximately 50% of our Board is comprised of directors who identify as ethnically or gender diverse. Rockley’s employee-network groups work to promote engagement of women and diverse employees. To further our commitment to global diversity and inclusion efforts, in 2021 and 2022, we have actively targeted diverse candidates for global job openings, including by promoting careers with Rockley through job posting websites that prioritize diverse hiring.
Board Committees
81
Audit Committee
Members: Caroline Brown (Chair) Brian Blaser William Huyett | The functions of this committee •evaluating the performance, independence, and qualifications of our independent auditors and determining whether to retain our existing independent auditors or engage new independent auditors; •reviewing our financial reporting processes and disclosure controls; •reviewing and approving the engagement of our independent auditors to perform audit services and any permissible non-audit services; •reviewing the adequacy and effectiveness of our internal control policies and procedures, including the responsibilities, budget, staffing, and effectiveness of our internal audit function; •reviewing with the independent auditors the annual audit plan, including the scope of audit activities and all critical accounting policies and practices to be used by us; •obtaining and reviewing at least annually a report by our independent auditors describing the independent auditors’ internal quality control procedures and any material issues raised by the most recent internal quality-control review; •monitoring the rotation of partners of our independent auditors on our engagement team as required by law; •prior to engagement of any independent auditors, and at least annually thereafter, reviewing relationships that may reasonably be thought to bear on their independence, and assessing and otherwise taking the appropriate action to oversee the independence of our independent auditors; •reviewing our annual and quarterly financial statements and reports, including the disclosures contained in “Management’s Discussion and Analysis of Financial Condition and Results of Operations,” and discussing the statements and reports with our independent auditors and management; •reviewing with our independent auditors and management significant issues that arise regarding accounting principles and financial statement presentation and matters concerning the scope, adequacy, and effectiveness of our financial controls and critical accounting policies; •reviewing with management and our auditors any earnings announcements and other public announcements regarding material developments; •establishing procedures for the receipt, retention, and treatment of complaints received by us regarding financial controls, accounting, auditing, or other matters; •preparing the report that the SEC requires in our annual proxy statement; •reviewing and providing oversight of any related person transactions in accordance with our related person transaction policy and reviewing and monitoring compliance with legal and regulatory responsibilities, including our code of ethics; •reviewing our major financial risk exposures, including the guidelines and policies to govern the process by which risk assessment and risk management is implemented; and •reviewing and evaluating on an annual basis the performance of the Audit Committee and the Audit Committee Charter. | ||||
| Our Board has determined that each of the members of our Audit Committee satisfies the independence requirements of the NYSE and Rule 10A-3 under the Exchange Act. Each member of our Audit Committee can read and understand fundamental financial statements in accordance with NYSE audit committee requirements. In arriving at this determination, our Board has examined each Audit Committee member’s scope of experience and the nature of their prior and current employment. Our Board has determined that Dr. Brown qualifies as an audit committee financial expert within the meaning of SEC regulations and meets the financial sophistication requirements of the NYSE listing rules. In making this determination, our Board has considered Dr. Brown’s formal education and previous experience in financial roles. Both our independent registered public accounting firm and management periodically meet privately with our Audit Committee. | |||||
Compensation Committee
Members: Pamela Puryear (Chair) William Huyett Michele Klein | The functions of this committee include, among other things: •reviewing and recommending for board approval the corporate objectives that pertain to CEO executive compensation and evaluating performance in light of such goals; •reviewing and approving the corporate objectives that pertain to the determination of non-CEO executive compensation and evaluating performance in light of such goals; •reviewing and approving the compensation levels and other terms of employment of our CEO, including employment, severance and change in control agreements and arrangements; •reviewing and approving the compensation levels and other terms of employment of our non-CEO executive officers, including employment, severance and change in control agreements and arrangements; •approving equity compensation plans and granting equity awards not subject to shareholder approval under applicable listing standards; •reviewing and assessing the independence of compensation consultants, legal counsel, and other advisors as required by Section 10C of the Exchange Act; •administering our equity incentive, ESPP and executive compensation plans; •reviewing and making recommendations to our Board regarding the type and amount of compensation to be paid or awarded to our non-employee board members; •reviewing with management our disclosures under the caption “Compensation Discussion and Analysis” in our periodic reports or proxy statements to be filed with the SEC; •preparing the annual report on executive compensation that the SEC requires in our annual proxy statement; •reviewing and evaluating on an annual basis the performance of the Compensation Committee and its charter and recommending such changes as deemed necessary with our Board; and •oversee the development and implementation of the Company’s human capital management, including those policies and strategies regarding recruiting, retention, career development, opportunity, and advancement, and succession, diversity, equity, inclusion, organization structure updates and employment practices. This includes discussion of any significant trends or regulatory events or risks. | ||||
The charter also provides that the compensation committee may, in its sole discretion, retain or obtain the advice of a compensation consultant, legal counsel, or other adviser and will be directly responsible for the appointment, compensation, and oversight of the work of any such adviser. However, before engaging or receiving advice from a compensation consultant, external legal counsel, or any other adviser, the compensation committee will consider the independence of each such adviser, including the factors required by the NYSE and the SEC. In 2021, the Compensation Committee retained Semler Brossy Consulting Group, LLC (“Semler Brossy”) as its independent compensation consultant. Semler Brossy provided advice to the Committee regarding the compensation of our Chief Executive Officer, Chief Financial Officer and the next three highest-paid executives. The Compensation Committee assessed the independence of Semler Brossy pursuant to SEC and NYSE rules and determined that no conflict of interest exists that would prevent Semler Brossy from independently advising the Committee. In making this assessment, the Committee considered each of the factors set forth by the SEC and the NYSE with respect to Semler Brossy’s independence, including that Semler Brossy provided no services for the Company other than pursuant to its engagement by the Committee. The Committee also determined there were no other factors the Committee should consider in connection with the assessment or that were otherwise relevant to the Committee’s engagement of Semler Brossy. Our Board has determined that each of the members of the Compensation Committee is a non-employee director, as defined in Rule 16b-3 promulgated under the Exchange Act, and satisfies the independence requirements of the NYSE. | |||||
Nominating and Corporate Governance Committee
Members: Michele Klein (Chair) Nicolaus Henke Caroline Brown Pamela Puryear | The functions of this committee include, among other things: •identifying, reviewing, and making recommendations of candidates to serve on our Board; •evaluating the performance of our Board, committees of our Board, and individual directors and determining whether continued service on our board is appropriate; •evaluating nominations by shareholders of candidates for election to our Board; •evaluating the current size, composition, and organization of our Board and its committees and making recommendations to our Board for approvals; •developing a set of corporate governance policies and principles and recommending to our Board any changes to such policies and principles; •reviewing and making recommendations to our Board regarding the stock ownership guidelines applicable to our non-employee board members and officers; •reviewing issues and developments related to corporate governance and identifying and bringing to the attention of our Board’ current and emerging corporate governance trends; •developing and reviewing periodically with the Chairman of the Board and the Chief Executive Officer the succession plan relating to the Chief Executive Officer and make recommendations to the Board with respect to such plan; •reviewing the policies, programs, practices and reports concerning environmental, social and governance (“ESG”), including sustainability, environmental protection, community and social responsibility, diversity, equity and inclusion, and human rights; and •reviewing periodically the Nominating and Corporate Governance Committee Charter, structure, and membership requirements and recommending any proposed changes to our Board, including undertaking an annual review of its own performance. | ||||
| Our Board has determined that each of the members of our Nominating and Corporate Governance Committee satisfies the independence requirements of the NYSE. | |||||
Compensation Committee Interlocks and Insider Participation
None of the members of our compensation committee has ever been an executive officer or employee of Rockley. None of our executive officers currently serve, or has served during the last completed fiscal year, on the compensation committee or board of directors of any other entity that has one or more executive officers that serves as a member of the Board or our compensation committee.
Code of Business Conduct and Ethics and Code of Ethics for Senior Financial Officers
•compliance with laws, rules and regulations;
•confidentiality;
•conflicts of interest;
•corporate opportunities;
•competition and fair dealing;
•payments or gifts from others;
•health and safety;
•insider trading;
•protection and proper use of company assets; and
•record keeping.
Our Board has also adopted a Code of Ethics for Senior Financial Officers (the “Code of Ethics”) applicable to our principal executive officer, principal financial officer, principal accounting officer or controller or person performing similar functions identified by the Board,Chief Executive Officer and Chief Financial Officer as well as other key management employees. The Code of Conduct is available on Rockley’s website at www.rockleyphotonics.com. Information contained on or accessible through Rockley’s website is not a part of this registration statement, and the inclusion of Rockley’s website address in this registration statement is an inactive textual reference only. The audit committee of the Board is responsible for overseeing the Code ofBusiness Conduct and the Code of Ethics and must approve any waivers of the Code of Conduct for employees, executive officers and directors and the Code of Ethics for senior financial officers. We expect that any amendmentsSenior Financial Officers are each posted on our website investors.rockleyphotonics.com. The Code of Business Conduct and Ethics and the Code of Ethics for Senior Financial Officers can only be amended by the approval of a majority of our Board. Any waiver to the Code of Business Conduct and Ethics for an executive officer or director or any waiver of the Code of Ethics for Senior Financial Officers may only be granted by our Board or anyour Nominating and Corporate Governance committee and must be timely disclosed as required by applicable law. We have implemented a whistleblower policy that establish formal protocols for receiving and handling complaints from employees through an independent third-party reporting company. Any concerns regarding accounting or auditing matters reported under these procedures will be communicated promptly to our Audit Committee.
To date, there have been no waivers under our Code of Business Conduct and Ethics or Code of Ethics for Senior Financial Officers. We intend to disclose future amendments to certain provisions of these codes or waivers of their requirements, will be disclosedsuch codes granted to executive officers and directors on our website.
website at www.rockleyphotonics.com within four business days following the date of such amendment or waiver.84
Director Compensation
Name | Fees Earned or Paid in Cash ($) | Option Awards ($) (1) | All other Compensation ($) | Total ($) | ||||||||||||
Caroline Brown (2) | 50,000 | 40,063 | — | 90,063 | ||||||||||||
Markku Hirvonen (4) | 47,500 | 40,063 | (3) | 103,509 | (5) | 191,072 | ||||||||||
Robert Rickman | 40,000 | 40,063 | — | 80,063 | ||||||||||||
Sunit Rikhi | 40,000 | 40,063 | (3) | 20,247 | (6) | 100,310 | ||||||||||
John Burgess | 12,500 | (7) | — | 33,764 | (8) | 46,264 | ||||||||||
Andy Parker | — | — | — | — | ||||||||||||
Jianquiang Ma | — | — | — | — | ||||||||||||
The following table summarizes equityshows certain information with respect to the compensation of our non-employee directors during the fiscal year ended December 31, 2021:
| Fees earned or paid in cash ($) | Option awards ($) (1) | Stock awards ($) (2) | Non-equity incentive plan compensation ($) | Change in pension value and nonqualified deferred compensation earnings | All other compensation ($) | Total ($) | ||||||||||||||||||||||||||||||||||||||
| William Huyett | $ 33,087 | $ — | $ 157,080 | $ — | $ — | $ — | $ 190,167 | |||||||||||||||||||||||||||||||||||||
| Brian Blaser | 21,284 | — | 157,080 | — | — | — | 178,364 | |||||||||||||||||||||||||||||||||||||
| Caroline Brown | 57,521 | — | 157,080 | — | — | — | 214,601 | |||||||||||||||||||||||||||||||||||||
Nicolaus Henke(3) | — | — | — | — | — | — | — | |||||||||||||||||||||||||||||||||||||
| Karim Karti | 18,712 | — | 326,760 | — | — | 16,500 | 361,972 | |||||||||||||||||||||||||||||||||||||
| Michele Klein | 24,187 | — | 157,080 | — | — | — | 181,267 | |||||||||||||||||||||||||||||||||||||
| Pamela Puryear | 25,154 | — | 157,080 | — | — | — | 182,234 | |||||||||||||||||||||||||||||||||||||
(1)Amounts represent the aggregate fair value of the option awards computed as of the grant date of each award in accordance with Financial Accounting Standards Board Accounting Standards Codification Topic 718 (FASB ASC 718) for financial reporting purposes, rather than amounts paid to or realized by the named individual. See the notes to our consolidated financial statements in our Annual Report on Form 10-K for the year ended December 31, 2021 for a discussion of assumptions made in determining the grant date fair value and compensation expense of our stock options. There can be no assurance that option awards will be exercised (in which case no value will be realized by the individual) or that the value on exercise will approximate the fair value as computed in accordance with ASC 718.
(2)The amounts in this column represent the aggregate fair value of the restricted stock unit awards computed as of the grant date of each award in accordance with ASC 718, which was determined using the closing price of our common stock on the date of grant. For grants made prior to our initial public offering, the fair value of the stock awards was determined using a third-party valuation firm.
The following table sets forth the aggregate number of shares of common stock underlying option awards and restricted stock unit awards outstanding onas of December 31, 20202021:
| Name | Number of shares | ||||
| William Huyett | 22,000 | ||||
| Brian Blaser | 22,000 | ||||
| Caroline Brown, Ph.D | 84,085 | ||||
| Karim Karti | 46,000 | ||||
| Michele Klein | 22,000 | ||||
| Pamela Puryear | 22,000 | ||||
(3)Dr. Nicolaus Henke joined our Board in 2022, and therefore did not receive any compensation for eachservices in 2021
Employee directors do not receive any compensation for service as a member of Rockley UK:
Name | Option Awards (#) | |||
Caroline Brown | 25,000 | |||
Markku Hirvonen | 168,490 | (1) | ||
Robert Rickman | 18,750 | |||
Sunit Rikhi | 72,500 | |||
John Burgess | 169,650 | |||
non-employee
director compensation policy | Committee | Chair | Member | ||||||||||||||||||||||||
| Compensation Committee | $ | 15,000 | $ | 7,500 | ||||||||||||||||||||||
| Nominating and Corporate Governance Committee | 10,000 | 5,000 | ||||||||||||||||||||||||
| Audit Committee | 20,000 | 10,000 | ||||||||||||||||||||||||
85
The non-employee director compensation policy also provides for the Director Compensation Program and in connection with the Closing, HoldCo willannual grant of RSUs to eachnon-employeedirector (each an “Initial RSU Award”) under theour 2021 Stock Incentive Plan covering HoldCo Ordinary Shares with an aggregate fair market value of $220,000 determined at the date of grant or, fornon-employeedirectors who joined the HoldCo board prior to the date, such RSUs may be issued under applicable U.S. securities laws, the later of the date suchnon-employeedirector joined the HoldCo board of directors or the Closing. Each Initial RSU Award vests as to 1/3 of the total number of shares subject to the award on the earlier of the first anniversary of the date of grant or the next annual meeting of HoldCo’s shareholders, and in each of the next two calendar years following the year of the initial vesting date, 1/3 of the total number of shares will vest on the earlier of theone-yearanniversary of the prior annual meeting of shareholders or the current year annual meeting of shareholders. Each Initial RSU Award will become 100% vested if a change in control as defined in the 2021 Plan occurs during such director’s service.
non-employee
director who will continue serving as a member of the non-employee
director is elected to thenon-employee
director willreceive an Annualannual RSU Awardaward upon election to HoldCo’s board of directorsthe Board that is prorated based upon the number of calendar days remaining before (1) the next annual meeting of shareholders, if scheduled, or (2) the date of the first anniversary of the last annual meeting of shareholders, if the next annual meeting is not yet scheduled.
Each Annualannual RSU Awardaward will become fully vested, subject to the applicablenon-employeedirector’s continued service as a director, on the earliest of theone-year twelve (12) month anniversary of the date of grant, the next annual meeting of shareholders following the date of grant, or the consummation of a change in control as defined in the 2021 plan.Plan.
Non-Employee
Director Share Ownership PolicyIn connection with the closing of the Business Combination, HoldCoRockley adopted a share ownership policy (the “Share Ownership Policy”) for itsHoldCo.Rockley.
non-employee
directors to further align the personal interests of such directors with the interests of Under the Share Ownership Policy, eachHoldCo’sRockley’s board of directors, ownership of HoldCo Ordinary SharesRockley ordinary shares having a value equal to four times the annual cash retainer paid by HoldCoRockley to itsHoldCo’sRockley’s equity incentive plans (net of the number applied to pay applicable taxes) until the Share Ownership Policy is satisfied.
non-employee
director is expected to acquire, and continue to hold during the term or his or her service on non-employee
directors. For this purpose, shares are considered owned by anon-employee
director which are directly owned by such director or subject to vested RSUs.Non-employee
directors are required to hold 100% of the shares acquired through any of Director Nominations
Our nominating and corporate governance committee recommends to the Board candidates for nomination for election at the annual meeting of the stockholders. We have not formally established any specific, minimum qualifications that must be met or skills that are necessary for directors to possess. In general, in identifying and evaluating nominees for director, the Board of directors considers several factors, including, without limitation, high personal and professional integrity, strong ethics and values, the ability to make mature business judgments, experience in corporate management such as serving as an officer or former officer of a publicly held company,
experience as a board member of another publicly held company, professional and academic experience relevant to our business, leadership skills, experience in finance and accounting, or executive compensation practices, whether candidate has the time required for preparation, participation and attendance at board of directors meetings and committee meetings, if applicable, independence, and the ability to represent the best interests of HoldCo’sRockley’s shareholders. See “Board Committees — Committees—Nominating and Corporate Governance Committee.”
EXECUTIVE COMPENSATION
Throughout this section, unless otherwise noted, “we,” “us,” “our,” and similar terms refer to Rockley (which includes its subsidiaries) prior to the closing of the Business Combination, and to HoldCoRockley (which includes its subsidiaries) after the closing of the Business Combination.
This section discusses the material components of the executive compensation program for Rockley’s executive officers who are named in the “2020 Summary“Summary Compensation Table” below. For 2020,2021, the “named executive officers” and their positions with Rockley were as follows:
Andrew Rickman, OBE, Chief Executive Officer;
Mahesh Karanth, Chief Financial Officer; and
Amit Nagra, Ph.D., Chief Operating Officer.
The following table sets forth information concerning the total compensation of the following persons, whom we refer to as our named executive officers: (i) our Chief Executive Officer and (ii) our next two most highly compensated executive officers on December 31, 2021.
Summary Compensation Table
| Name and Principal Position | Fiscal Year | Salary ($) | Stock Awards ($) (1) | Option Awards ($) (1) (2) | Non-Equity Incentive Plan Compensation ($) (3) | All Other Compensation ($) (4) | Total ($) | ||||||||||||||||
| Dr. Andrew Rickman, OBE | 2021 | $430,806 | $5,500,003 | $4,561,612 | $1,666,947 | $14,409 | $12,173,777 | ||||||||||||||||
| Chief Executive Officer | 2020 | 366,200 | — | — | 165,275 | 10,679 | 542,154 | ||||||||||||||||
Mr. Mahesh Karanth (5) | 2021 | 358,658 | 1,272,383 | 1,824,650 | 913,006 | 3,072 | 4,371,769 | ||||||||||||||||
| Chief Financial Officer | 2020 | 300,012 | — | 586,814 | 138,006 | 3,072 | 1,027,904 | ||||||||||||||||
Dr. Amit Nagra, PhD (6) | 2021 | 384,711 | 954,283 | 1,368,485 | 186,494 | 3,081 | 2,897,054 | ||||||||||||||||
| Chief Operating Officer | 2020 | 337,851 | — | — | 311,494 | 3,081 | 652,426 | ||||||||||||||||
(1)The amounts in this column represent the aggregate grant-date fair value of awards granted to each named executive officer under our equity incentive plans, computed in accordance with the Financial Accounting Standards Board’s (“FASB”) Accounting Standards Codification (“ASC”) Topic 718.
(2)Includes the value of options granted to our named executive officers upon the consummation of Rockleythe Business Combination, which is calculated using $15.84, the last trading price of our SPAC partner and the exercise price of the options, as the fair market value of the option’s underlying shares on the date of grant. The number of shares underlying each stock option award was calculated based on a target grant date fair value determined using $10 (i.e., the purchase price for one of our shares under the Business Combination agreement) as both the per share fair market value of our stock on the date of grant and the option exercise price. For more information, see “Equity and Incentive Awards Grant in 2021 to our Named Executive Officers”.
(3)The amounts in this column represent the applicable named executive officer’s total annual performance-based cash bonus for the year endedyears ending on December 31 2020.
of 2020 and 2021. See “Annual Cash Bonuses” below.Name and Principal Position | Salary ($) | Option Awards ($) (1) | Nonequity Incentive Plan Compensation ($) (2) | All other Compensation ($) (4) | Total ($) | |||||||||||||||
Andrew Rickman, OBE | 366,200 | 165,275 | 10,679 | 542,154 | ||||||||||||||||
Chief Executive Officer | ||||||||||||||||||||
Mahesh Karanth | 300,012 | 586,814 | 138,006 | 3,072 | 1,027,904 | |||||||||||||||
Chief Financial Officer | ||||||||||||||||||||
Amit Nagra, Ph.D. | 337,851 | 311,494 | (3) | 3,081 | 652,426 | |||||||||||||||
Chief Operating Officer | ||||||||||||||||||||
(4)All other compensation in 2021 consisted of the following:
Name Executive Officer | Employer Retirement Contributions ($) | AD&D Premium ($) | ||||||||||||||||||||||||||
| Named Executive Officer | Named Executive Officer | Employer Retirement Contribution ($) | Life Insurance Premium ($) | AD&D Premium ($) | ||||||||||||||||||||||||
Andrew Rickman, OBE | 10,679 | — | Andrew Rickman, OBE | $10,593 | $3,816 | $— | ||||||||||||||||||||||
Mahesh Karanth | 3,000 | 72 | Mahesh Karanth | 3,000 | 412 | 72 | ||||||||||||||||||||||
Amit Nagra, Ph.D. | 3,000 | 81 | ||||||||||||||||||||||||||
| Amit Nagra, PhD | Amit Nagra, PhD | 3,000 | 462 | 81 | ||||||||||||||||||||||||
(6)On January 19, 2022, the Compensation Committee approved an amendment to Dr. Nagra’s employment agreement, pursuant to which, Dr. Nagra’s employment would be terminated on or around March 31, 2022 (or such later date as mutually agreed) in connection with the Company monetizing its ultra-high-speed fiber optic communication solutions. As contemplated by that amendment, Dr. Nagra’s employment was terminated effective April 15, 2022.
Narrative to the Summary Compensation Table
87
We review compensation annually for all employees, including our named executive officers. In setting our named executive officers’ base salaries and bonuses and granting equity incentive awards, we seek to align pay for performance and consider, among other factors, compensation for comparable positions in the market, the historical compensation levels of our named executive officers, individual performance as compared to our expectations and objectives, our desire to motivate our named executive officers to achieve short- and long-term results that are in the best interests of our shareholders, and a long-term commitment to our company.
In 2020,2021, each of the named executive officers of Rockley received an annual base salary to compensate them for services rendered to Rockley. The base salary payable to each named executive officer was intended to provide a fixed component of compensation reflecting such executive’s skill set, experience, role, and responsibilities.
Annual Cash Bonuses
In 2020,2021, Dr. Rickman, Mr. Karanth, and Dr. Nagra were eligible to earn annual cash bonuses targeted at 50%100%, 50%60%, and 60% of their respective base salaries. Each named executive officer was eligible to earn his bonus based on the attainment of company and individual performance metrics, as determined by the board of directors of Rockley,Board, in its discretion. The actual annual cash bonuses awarded to each named executive officer for 20202021 performance are set forth above in the 2020 Summary Compensation Table in the column titled “Nonequity Incentive Plan Compensation.”
Equity Compensation
Upon the consummation of the Business Combination on August 11, 2021, Dr. Rickman, Mr. Karanth and Dr. Nagra were awarded the stock options contemplated by their employment terms described below in “Employment Agreements with our Named Executive Officers”, with target grant date fair values of $2.5 million, $1 million, and $750,000, respectively. The 2013 Plannumber of shares underlying each stock option award was adopteddetermined by Rockley’s boarddividing the target grant date fair value of directors,each award by the fair value of an option to purchase one share of our stock calculated using $10 (i.e., the purchase price for one of our shares under the Business Combination agreement) as both the per share fair market value of our stock and approved by its shareholders, on November 12, 2013. The 2013 Plan has been amended since that date,the option exercise price. However, these options were granted with the most recent amendment adopted by Rockley’s board of directors on November 18, 2020 and approved by its shareholders on December 4, 2020. Rockley’s board of directors or the remuneration committee thereof administers the 2013 Plan and any awards granted thereunder.
On October 25, 2021, in connection with the filing of our registration statement on Form S-8, Dr. Rickman, Mr. Karanth and Dr. Nagra were awarded the RSUs contemplated by their employment terms, with grant date values of $2.5 million, $1 million and $750,000, respectively. The RSUs vest in equal quarterly installments over four years beginning on August 11, 2021, subject to each executive’s continued service and to acceleration upon an involuntary termination in connection with a change in control, as defined in our 2021 Stock Incentive Plan.
On December 13, 2021, due to the disparity between the $10 purchase price for our shares under the Business Combination agreement and the $15.84 exercise price of our named executive officer’s options granted upon the consummation of the Business Combination, the Board granted Mr. Karanth and Dr. Nagra RSUs with grant date values of $204,283 and $272,377, respectively, representing the difference between the target value of Mr. Karanth and Dr. Nagra’s August 11, 2021 option grants, and their grant date fair value calculated assuming a fair market value of the underlying stockshares equal to the per share purchase price under the Business Combination agreement. The RSUs vest in equal quarterly installments over four years beginning on the date of grant. Options generally vestAugust 11, 2021, subject to each executive’s continued service and become exercisable over a four-year period, oftento acceleration upon an involuntary termination in connection with a 25% cliff vest atchange in control, as defined in our 2021 Stock Incentive Plan.
On December 16, 2021, the first anniversaryBoard, upon recommendation by the Company’s Compensation Committee and advice of its independent compensation consultant, Semler Brossy, approved an award to Dr. Rickman with an aggregate value of $4.5 million, a portion of which would be paid in cash and a portion of which would be paid in the form of a RSUs. The award was approved in recognition of Dr. Rickman’s extraordinary services and contributions to the completion of the vesting commencement date, subjectBusiness Combination, including but not limited to the option holder’s continued service with Rockley. Options generally expire ten years fromcommitment to the dateCompany that Dr. Rickman demonstrated by entering into an agreement whereby he pledged 6.0 million of grant.
(a) A cash payment of $1.5 million, subject to applicable withholdings, to be paid prior to the end of 2021.
(b) An RSU award for 574,713 ordinary shares of the Company, which was determined by dividing $3.0 million by the Company’s closing stock price on December 16, 2021. The RSU award vests over three years in three equal annual installments following December 16, 2021, Plan becoming effective, no new awards will be granted undersubject to Dr. Rickman’s continued service. The Board determined that applying a retention and incentive element to the 2013 Plan.
RSU award was beneficial and aligned Dr. Rickman’s interests with those of Rockley’s stockholders.Retirement Plans
In 2020,2021, Dr. Rickman participated in the Rockley U.K. pension (“U.K. Pension”) and Mr. Karanth and Dr. Nagra participated in the ADP TotalSource Retirement Savings Plan, a multiple employer defined contribution plan in which Rockley participates (“401(k) Plan”). The U.K. Pension and the 401(k) Plan are designed to take advantage of certain provisions of Her Majesty’s Revenue and Customs (“HRMC”) and the Internal Revenue Code, respectively, which allow eligible employees to defer a portion of their compensation, within prescribed limits, on a2020,2021, contributions made by participants in the U.K. Pension and the 401(k) Plan were matched up to a specified percentage of the employee contributions on behalf of the named executive officers. These matching contributions are fully vested as of the date on which the contribution is made. Rockley anticipates that, following the closing of the Business Combination, its named executive officers will continue to participate in these retirement plans on the same terms as other full-time employees.
pre-tax
basis to the U.K. Pension or the 401(k) Plan, as applicable. In 88
Employee Benefits and Perquisites
Health
& Welfare Benefit Plans.
In 2020, the named executive officers of Rockley participated in health and welfare plans maintained by Rockley, including:
•medical, dental, and vision benefits;
•medical and dependent care flexible spending accounts;
•short-term and long-term disability insurance;
•life insurance; and
•paid time off and paid holidays.
No Tax
Gross-Ups
In 2020,2021, Rockley did not make
gross-up
payments to cover the named executive officers’ personal income taxes that may pertain to any of the compensation or perquisites paid or provided by Rockley.Outstanding Equity Awards at 2020 Fiscal
Year-End
Option Awards | ||||||||||||||||||||
Name | Grant Date | Number of Securities Underlying Unexercised Options Exercisable (#) | Number of Securities Underlying Unexercised Options Unexercisable (#) | Options Exercise Price ($) | Options Expiration Date | |||||||||||||||
Andrew Rickman, OBE | — | — | — | — | — | |||||||||||||||
Mahesh Karanth | 12/22/17 | (1) | 303,750 | 101,250 | 5.363 | 12/21/27 | ||||||||||||||
| 10/05/20 | (2) | 4,218 | 97,032 | 7.722 | 06/28/30 | |||||||||||||||
Amit Nagra, Ph.D. | 05/20/15 | (3) | 712,230 | — | 1.331 | 05/19/26 | ||||||||||||||
The following table sets forth information regarding outstanding equity awards for each of our named executive officers as of December 31, 2021:
| Option Awards | Stock Awards | |||||||||||||||||||||||||||||||
| Name | Date Granted | Number of Securities Underlying Unexercised Options Exercisable (#) | Number of Securities Unerxercised Options Unexercisable (#) | Option Exercise Price ($) | Option Expiration Date | Number of Shares or Units of Stock that have not Vested (#) | Market Value of Shares or Units of Stock that have not Vested ($) | Equity Incentive Plan Awards: Number of Unearned Shares, Units or Other Rights that have not Vested (#) | Equity Incentive Plan Awards: Market Payout Value of Unearned Shares, Units or Other Rights that have not Vested ($) | |||||||||||||||||||||||
| Andrew Rickman | 12/16/21(1) | — | — | $ — | — | 353,607 | $ | 1,538,190 | — | $ — | ||||||||||||||||||||||
10/25/21(2) | — | — | — | — | 575,576 | 2,503,756 | — | — | ||||||||||||||||||||||||
08/11/21(4) | 47,964 | 527,612 | 15.84 | 8/10/31 | — | — | — | — | ||||||||||||||||||||||||
| Mahesh Karanth | 12/13/21(3) | — | — | — | — | 46,345 | 201,601 | — | — | |||||||||||||||||||||||
10/25/21(3) | — | — | — | — | 132,602 | 576,819 | — | — | ||||||||||||||||||||||||
08/11/21(4) | 19,185 | 211,046 | 15.84 | 08/10/31 | — | — | — | — | ||||||||||||||||||||||||
10/05/20(6) | 73,347 | 178,106 | 3.11 | 10/04/30 | — | — | — | — | ||||||||||||||||||||||||
12/22/17(5) | 1,005,817 | 0 | 2.16 | 12/21/27 | — | — | — | — | ||||||||||||||||||||||||
| Amit Nagra | 12/13/21(3) | — | — | — | — | 34,758 | 151,197 | — | — | |||||||||||||||||||||||
10/25/21(2) | — | — | — | — | 99,452 | 432,616 | — | — | ||||||||||||||||||||||||
08/11/21(4) | 14,389 | 158,284 | 15.84 | 8/10/31 | — | — | — | — | ||||||||||||||||||||||||
05/20/15(7) | 1,737,779 | — | 0.54 | 5/19/25 | — | — | — | — | ||||||||||||||||||||||||
| (1) | RSUs vest annually over three years following the date of grant. | ||||
| (2) | RSUs vest quarterly over a 48-month period August 11, 2021, subject to continued service. All unvested RSUs will vest upon an involuntary termination on or within 12 months following a Change in Control as defined in the 2021 Plan. | ||||
| (3) | RSUs vest quarterly over a 48-month period following August 11, 2021, subject to continued service. | ||||
| (4) | Option vests monthly over a 48-month period following the grant date, subject to continued service. All unvested options will vest upon an involuntary termination on or within 12 months following a Change in Control as defined in the 2021 Plan. | ||||
| (5) | Option vests monthly over a 48-month period, with 25% vesting on December 20, 2018 and the remaining portion vesting in 36 equal monthly installments | ||||
Option vests monthly over a 48-month period following the grant date. All unvested options will vest in the event of a Change in Control or Sale of Assets, each as defined in the 2013 Plan. |
Options 48-month period, with 25% vesting on first anniversary of the grant date and the remaining portion vesting in 36 equal monthly installments |
89
Employment Agreements
Employment Agreement with such agreements, each executive officer waived any entitlement to accelerated vesting under the terms of their respective option award agreements with respect to the Business Combination.
Andrew Rickman, OBE
Under the amended employment agreement, among other terms, Dr. Rickman is entitled to receive an initial annual base salary of $500,000, which will be subject to increase at the discretion of the board of directors of HoldCoBoard or the Compensation Committee thereof, and to beis eligible to receive an annual performance bonus targeted at 100% of Dr. Rickman’s then current annual base salary. The actual amount of any such bonus will be determined by reference to the attainment of applicable HoldCoRockley and/or individual performance objectives, as determined by the board of directors of HoldCoBoard or the Compensation Committee.
Dr. Rickman will also be eligible to participate in the customary health, welfare, and fringe benefit plans we provided by HoldCo to itsour employees.
In addition, HoldCowe entered into a side letter pursuant to which Dr. Rickman will bebecame eligible to receive equity awards with a fair value of $5.0 million determined at HoldCo’s board of directors’ discretion either onin connection with the date of grant or on the Closing, and weighted equallyBusiness Combination, to be split between (i) stock options to purchase HoldCo Ordinary Shares at a price equal to such stock’s fair market value at grant and (ii) restricted stock units (“RSUs”), in each case under the 2021 Plan. Both Dr. Rickman’s stock options and his RSUs, would be subjectwhich awards were granted in 2021 and are described in “Equity and Incentive Awards Granted in 2021 to ratable vesting over 4 years beginning onour Named Executive Officers” above and the closing of the Business Combination, subject to acceleration upon involuntary termination in connection with a change in control, as defined in the 2021 Plan. Upon the Closing, Dr. Rickman received the above referenced stock options, which stock options will become exercisable (to the extent vested) only after the shares underlying such options are registered on an applicable FormS-8“Outstanding Equity Awards at Fiscal Year-End” table, below.registration statement and will not be exercisable before such date.
Under his amended employment agreement, HoldCowe must provide Dr. Rickman at least 12 months’ notice, or pay in lieu of notice, prior to any termination of his employment unless that termination is for “cause” (as defined under his amended employment agreement). Dr. Rickman must provide HoldCous with at least 12 months’ notice prior to his resignation, unless HoldCowe reasonably determinesdetermine that such resignation is for “good reason” (as defined in his amended employment agreement).
If Dr. Rickman’s employment is terminated by HoldCous without “cause,” or by Dr. Rickman for “good reason”,reason,” subject to his execution and
non-revocation
of a release of claims and continued compliance with his confidentiality andnon-solicitation
requirements, then, in addition to any accrued amounts, Dr. Rickman will be entitled to receive the following severance payments and benefits: (i) an amount equal to the sum of (a) his annual base salary then in effect and (b) 100% of his target annual bonus amount, payable in equal instalments over one year and reduced by any basic salary paid in lieu of notice; and (ii) continuation of all benefits for a period of 12 months.The amended employment agreement containsHoldCo’sour competitors, customers or suppliers, for a period of 12 months following his termination (reduced by any portion of Dr. Rickman’s
non-competition
andnon-solicitation
and confidentiality provisions which, among other restrictions, and except in the case of an involuntary termination, restrict Dr. Rickman’s ability to be engaged or employed by, undertake duties for or be otherwise interested in pre-termination
notice period during which time he is not providing services, or “garden leave”).Employment and Severance Agreement with Mahesh Karanth
base salary of $450,000, which will bewas subject to increase at the discretion of the board of directors of HoldCoBoard or the Compensation Committee thereof and will bewas eligible to receive an annual performance bonus targeted at 60% of Mr. Karanth’shis then-current annual base salary. The actual amount of any such bonus willwas to be determined by reference to the attainment of applicable company and/or individual performance objectives, as determined by the board of directors of HoldCoBoard or the Compensation Committee thereof.
Pursuant to his amended employment agreement, Mr. Karanth willwas also be eligible to participate in the customary health, welfare, and fringe benefit plans provided by HoldCowe provide to itsour employees.
In addition, pursuant his amended employment agreement, Mr. Karanth will bewas eligible to receive equity awards with a fair value of $2.0 million determined at HoldCo’s board of director’s discretion either onin connection with the date of grant or on the Closing, and weighted equallyBusiness Combination, to be split between (i) stock options to purchase HoldCo Ordinary Shares at a price equal to such stock’s fair market value at grant and (ii) RSUs, in each case under the 2021 Plan. Both Mr. Karanth’s stock options and his RSUs, wouldwhich awards were granted in 2021 and are described in “Equity and Incentive Awards Granted in 2021 to our Named Executive Officers” above and the “Outstanding Equity Awards at Fiscal Year-End” table, below.
The amended employment agreement contains customary confidentiality and non-solicitation provisions, and also includes a “best pay” provision under Section 280G of the Code, pursuant to which any “parachute payments” that become payable to Mr. Karanth will either be paid in full or reduced so that such payments are not subject to ratable vesting over 4 years beginning on the closingexcise tax under Section 4999 of the Business Combination, subject to acceleration upon involuntary termination in connection with a change in control, as definedCode, whichever results in the 2021 Plan. Upon the Closing,better after-tax treatment to Mr. Karanth received the above referenced stock options, which stock options will become exercisable (to the extent vested) only after the shares underlying such options are registered on an applicable FormS-8registration statement and will not be exercisable before such date.
non-revocation
of a general release of claims in our favor and continued compliance with customary confidentiality andnon-solicitation
requirements, then, in addition to any accrued amounts, Mr. Karanth will would be entitled to receive the following severance payments and benefits: (i) an amount equal to the sum of (a) 6 months of his annual base salary then in effect and (b) 50% of his target annual bonus amount, payable in equal installments over six months; and (ii) payment of premiums for continued healthcare coverage under the Consolidated Omnibus Budget Reconciliation Act of 1985 (“COBRA”) for up to 6 months after the termination date.90
In connection with his resignation effective June 17, 2022, Mr. Karanth and the Company entered into a severance agreement which included a general release of claims in favor of the Company and provided for: (i) the extension of the post-termination exercise period for Mr. Karanth’s outstanding options that were originally granted under the Company’s 2013 Plan through the earliest of (a) June 13, 2024, (b) the breach of any agreement between Mr. Mahesh and the company or its affiliates, or (c) the termination of such options upon a change in control event pursuant to the terms of the equity plan under which such awards were granted, and (ii) the severance payments and benefits contemplated under his employment agreement as then in effect, namely: an amount equal to the sum of (a) $225,000, which is equal to 6 months of his annual base salary then in effect and (b) $135,000, which is equal to 50% of his target annual bonus amount, payable in equal installments over six months; and payment of premiums for COBRA for up to 6 months after his termination date.
Employment Agreement with Amit Nagra, Ph.D.
In connection with the Business Combination, we entered into an amended employment agreement (the “Employment Agreement”) with Dr. Nagra, pursuant to which Dr. Nagra served as our chief operating officer and reported directly to our chief executive officer. On January 19, 2022, the Compensation Committee approved an amendment (the “First Amendment”) to Dr. Nagra’s employment agreement, pursuant to which Dr. Nagra’s employment would be terminated on or around March 31, 2022 in connection with the Company monetizing its ultra-high-speed fiber optic communication solutions (as discussed below and previously in our December 22, 2021 press release), which date may be extended upon mutual agreement. Under the First Amendment, Dr. Nagra was to receive an initial annual base salary of $450,000, which would be subject to increase at the discretion of the Board or the Compensation Committee thereof and would be eligible to receive an annual performance bonus targeted at 60% of Dr. Nagra’s then-current annual base salary. The actual amount of any such bonus would be determined by reference to the attainment of applicable company and/or individual performance objectives, as determined by the Board or the Compensation Committee thereof.
Pursuant to his Employment Agreement, Dr. Nagra was also eligible to participate in the customary health, welfare, and fringe benefit plans, provided by us to our employees.
In addition, pursuant to his Employment Agreement, Dr. Nagra was eligible to receive equity awards with a fair value of $1.5 million in connection with the Business Combination, to be split between stock options and RSUs, which awards were granted in 2021 and are described in “Equity and Incentive Awards Granted in 2021 to our Named Executive Officers” above and the “Outstanding Equity Awards at Fiscal Year-End” table, below.
Dr. Nagra’s Employment Agreement also contains customary confidentiality andMr. KaranthDr. Nagra will either be paid in full or reduced so that such payments are not subject to the excise tax under Section 4999 of the Code, whichever results in the betterMr. Karanth.
non-solicitation
provisions, and also includes a “best pay” provision under Section 280G of the Code, pursuant to which any “parachute payments” that become payable to after-tax
treatment to If Dr. Nagra’s employment is terminated by HoldCous without “cause,” or by Dr. Nagra for “good reason” (each, as defined in his amended employment agreement)the First Amendment), subject to his execution and
non-revocation
of a general release of claims in our favor, then, in addition to any accrued amounts, Dr. Nagra will be entitled to receive the following severance payments and benefits: (i) an amount equal to the sum of (a) six months of his annual base salary then in effect and (b) 50% of his target annual bonus amount, payable in equal installments over six months; and (ii) payments of premiums for continued healthcare coverage under COBRA for up to six months after the termination date.Employment Terms with Chad Becker
Mr. Becker was recently appointed interim Chief Financial Officer to succeed Mahesh Karanth. While serving as interim Chief Financial Officer, Mr. Becker’s annual base salary will be $370,000 with a target bonus opportunity equal to 60% of his annual base salary on a pro rata basis during his time as interim Chief Financial Officer.
2021 Stock Incentive Plan
Prior to the Closing, HoldCoclosing of the Business Combination, Rockley adopted the Rockley Photonics Holdings Limited 2021 Stock Incentive Plan of Rockley (the “2021 Plan”) that was considered and approved by SC Health shareholders at the extraordinary general meeting of the SC Health shareholders held on August 6, 2021, and approved by the shareholders of HoldCoRockley and Rockley UK, to be effective as of and contingent on the Closing.closing of the Business Combination. The purpose of the 2021 Plan is to enhance HoldCo’sRockley’s ability to attract, retain, incentivize, reward, and motivate persons who make (or are expected to make) important contributions by providing these individuals with equity ownership opportunities and/or equity-linked compensatory opportunities.
91
Rockley’s employees, consultants and directors, and employees, consultants and directors of its subsidiaries will beare eligible to receive awards under the 2021 Plan. The 2021 Plan will beis administered by the compensation committee of the HoldCoRockley Board or by the HoldCoRockley Board acting as the compensation committee, each of which may delegate its duties and responsibilities to committees of HoldCoRockley directors and/or officers (referred to collectively as the “plan administrator” below), subject to certain limitations that may be imposed under Section 16 of the Exchange Act, and/or stock exchange rules, as applicable. Subject to the limitations set forth in the 2021 Plan, the compensation committee will havehas the authority to determine, among other things, to whom awards will be granted, the number of shares subject to awards, the term during which an option or stock appreciation right may be exercised and the rate at which the awards may vest or be earned, including any performance criteria to which they may be subject. The compensation committee also will havehas the authority to determine the consideration and methodology of payment for awards. To the extent permitted by applicable law, the board of directors or compensation committee may also authorize one or more officers of HoldCoRockley to designate employees, other than officers under Section 16 of the Exchange Act, to receive awards and/or to determine the number of such awards to be received by such persons subject to a maximum total number of awards.
The aggregate number HoldCo Ordinary SharesRockley ordinary shares on an after the Closing under the 2021 Plan will not exceed the sum of (x) 7,631,196 shares, plus (y) the
as-converted
basis that may be issued pursuant to stock awardssum of the number of shares subject to outstanding awards under the Rockley Photonic Limited 2013 Equity Incentive Plan, as amended (the “2013 Plan”), following the Effective Date that (i) are subsequently forfeited or terminated for any reason before being exercised or settled, (ii) are not issued because such stock award or any portion thereof is settled in cash, (iii) are subject to vesting restrictions and are subsequently forfeited, (iv) are withheld or reacquired to satisfy the exercise, strike or purchase price, or (v) are withheld or reacquired to satisfy a tax withholding obligation, plus (z) the number of shares reserved on an
as-converted
basis which, but for their cancellation immediately prior to the Effective Date, were at such time under the 2013 Plan but not issued or subject to outstanding grants under the 2013 Plan. In addition, the share reserve will be subject to an annual increase on the first day of each fiscal year, for a period of not more than 10 years, beginning on January 1, 2022 and ending on (and including) January 1,2031, in an amount equal to the lesser of (i) four percent of the outstanding shares on the last day of the immediately preceding fiscal year or (ii) such lesser amount (including zero) that the compensation committee determines for purposes of the annual increase for that fiscal year.
If restricted shares or shares issued upon the exercise of options are forfeited, then such shares will again become available for awards under the 2021 Plan. If stock units, options, or stock appreciation rights are forfeited or terminate for any reason before being exercised or settled, or an award is settled in cash without the delivery of shares to the holder, then the corresponding shares will again become available for awards under the 2021 Plan. Any shares withheld to satisfy the exercise price or tax withholding obligation pursuant to any award of options or stock appreciation rights will again become available for awards under the 2021 Plan. If stock units or stock appreciation rights are settled, then only the number of shares (if any) actually issued in settlement of such stock units or stock appreciation rights will reduce the number of shares available under the 2021 Plan, and the balance (including any shares withheld to cover taxes) will again become available for awards under the 2021 Plan.
Awards granted under the 2021 Plan upon the assumption of, or in substitution for, outstanding equity awards previously granted by an entity in connection with a corporate transaction, such as a merger, combination, consolidation or acquisition of property or shares will not reduce the number of shares authorized for grant under the 2021 Plan. The sum of (i) the grant date fair value for financial reporting purposes of any awards granted during any calendar year under the 2021 Plan to an outside director as compensation for services as an outside director and (ii) any cash fees paid by HoldCoRockley to such outside director during such calendar year for service on HoldCo’sRockley’s board of directors, may not exceed $750,000 (other than in the calendar year in which the outside director commences service). In addition, initial awards granted under the 2021 Plan to outside directors who are members of the board on the Effective Date or who first join the board in the calendar year of the Effective Date will not be taken into account for purposes of this limitation.
The 2021 Plan provides for the grant of stock options, including incentive stock options (“ISOs”) andHoldCo’sRockley’s employees, including officers, and the employees of HoldCo’sRockley’s parent or subsidiaries. All other stock awards may be granted to HoldCo’sRockley’s employees, officers, HoldCo’sHoldCo’sRockley’s parent, subsidiaries, and affiliates. Certain awards under the 2021 Plan may constitute or provide for a deferral of compensation, subject to Section 409A of the Internal Revenue Code of 1986, as amended (the “Code”), which may impose additional requirements on the terms and conditions of such awards. All awards under the 2021 Plan will be set forth in award agreements, which will detail all terms and conditions of the awards, including any applicable vesting and payment terms and post-termination exercise limitations. Awards, other than cash awards, generally will be settled in HoldCo Ordinary Shares,Rockley ordinary shares, but the plan administrator may provide for cash settlement of any award.
non-qualified
stock options (“NSOs”), restricted share awards, stock unit awards, stock appreciation rights, other stock-based awards, and cash-based awards, and performance-based stock awards, (collectively, “stock awards”). ISOs may be granted only to Rockley’s non-employee
directors, and consultants and the employees and consultants of No award may be granted pursuant to the 2021 Plan after the tenth anniversary of March 31, 2021, the date on which the sole director of HoldCoRockley adopted the 2021 Plan prior to the Closing.
closing of the Business Combination.The 2021 Plan contains an “evergreen” provision, pursuant to which the number of ordinary shares reserved for issuance pursuant to awards under such plan shall be increased on the first day of each year for a period of ten years beginning in 2022, equal to the lesser of (x) 4% of the number of ordinary shares outstanding on the last day of the immediately preceding fiscal year or (y) such lesser amount that our Board determines for purposes of the annual increase for that fiscal year. As of January 1, 2022, the 2021 Plan was increased by 5,114,425 shares pursuant to such evergreen provision.
The foregoing description of the 2021 Plan does not purport to be complete and is qualified in its entirety by reference to the text of the 2021 Plan filed as Exhibit 10.510.3 hereto and incorporated herein by reference.
2021 Employee Stock Purchase Plan
Prior to the Closing, HoldCoclosing of the Business Combination, Rockley adopted the Rockley Photonics Holdings Limited 2021 Employee Stock Purchase Plan (the “ESPP”), effective as of and contingent on the Closing,closing of the Business Combination, which plan was approved by the shareholders of HoldCo,Rockley, Rockley UK, and SC Health. Under the ESPP, HoldCoRockley is authorized to provide eligible employees with an
92
opportunity to request payroll deductions to purchase a number of HoldCo Ordinary SharesRockley ordinary shares at a discount and in an amount determined in accordance with the ESPP’s terms.
The purpose of the ESPP is to provide a broad-based employee benefit to attract the services of new employees, to retain the services of existing employees, and to provide incentives for such individuals to exert maximum efforts toward our success by purchasing HoldCo Ordinary SharesRockley ordinary shares from HoldCoRockley on favorable terms and to pay for such purchases through payroll deductions. HoldCoRockley believes by providing eligible employees with an opportunity to increase their proprietary interest in the success of HoldCo,Rockley, the ESPP will motivate recipients to offer their maximum effort to HoldCoRockley and help focus them on the creation of long-term value consistent with the interests of the HoldCoRockley shareholders.
The ESPP is intended to qualify as an “employee stock purchase plan” under Code Section 423, except as explained below with respect toHoldCo Ordinary SharesRockley ordinary shares at a discount and in an amount determined in accordance with the ESPP’s terms.
non-U.S.
employees. During regularly scheduled “offerings” under the ESPP, participants will be able to request payroll deductions and then expend the accumulated deduction to purchase a number of The ESPP is administered by the compensation committee, or by the HoldCoRockley Board acting as the compensation committee. The compensation committee has the authority to construe, interpret and apply the terms of the ESPP, to determine eligibility, to establish such limitations and procedures as it determines are consistent with the ESPP and to adjudicate any disputed claims under the ESPP.
Each employee of HoldCoRockley and any of its participating subsidiaries who is employed by HoldCoRockley (or its participating subsidiaries) on the day preceding the start of any offering period, is eligible to participate in the ESPP. The ESPP requires that any such employee customarily work more than 20 hours per week and more than 5 months per calendar year with HoldCoRockley (or its participating subsidiaries) in order to be eligible to participate in the ESPP. The ESPP will permit an eligible employee to purchase HoldCo Ordinary SharesRockley ordinary shares through payroll deductions, which may not be less than one percent nor more than fifteen percent of the employee’s compensation, or such lower limit as may be determined by the Compensation Committee from time to time. However, no employee is eligible to participate in the ESPP if, immediately after electing to participate, the employee would own stock (including stock such employee may purchase under this plan or other outstanding options) representing five percent or more of the total combined voting power or value of all classes of HoldCo’sRockley’s stock. No employee will be able to purchase more than 5,000 shares, or such number of shares as may be determined by the Compensation Committee with respect to a single offering period, or purchase period, if applicable. In addition, no employee is permitted to accrue, under the ESPP and all similar purchase plans of HoldCoRockley or its subsidiaries, a right to purchase stock of the HoldCoRockley having a value in excess of $25,000 of the fair market value of such stock (determined at the time the right is granted) for each calendar year. Employees will be able to withdraw their accumulated payroll deductions prior to the end of the offering period in accordance with the terms of the offering. Participation in the ESPP will end automatically on termination of employment.
The ESPP is implemented through a series of offerings of purchase rights to eligible employees. Under the ESPP, the compensation committee may specify offerings with a duration of not more than 27 months and may
specify shorter purchase periods within each offering. During each purchase period, payroll deductions will accumulate, without interest. On the last day of the purchase period, accumulated payroll deductions will be used to purchase HoldCo Ordinary SharesRockley ordinary shares for employees participating in the offering.
The purchase price will be specified pursuant to the offering, but cannot, under the terms of the ESPP, be less than 85% of the fair market value per HoldCoRockley ordinary share on either the offering date or on the purchase date, whichever is less. The fair market value of HoldCo Ordinary SharesRockley ordinary shares for this purpose will generally be the closing price on the NYSE (or such other exchange as the HoldCo Ordinary SharesRockley ordinary shares may be traded at the relevant time) for the date in question, or if such date is not a trading day, for the last trading day before the date in question.
The compensation committee may specify that, if the fair market value of HoldCo Ordinary SharesRockley ordinary shares on any purchase date within a particular offering period is less than or equal to the fair market value on the start date of that offering period, then the offering period will automatically terminate and the employee in that offering period will automatically be transferred and enrolled in a new offering period which will begin on the next day following such purchase date.
To provide HoldCoRockley with greater flexibility in structuring HoldCo’sRockley’s equity compensation programs for HoldCo’sHoldCoRockley to grant employees of HoldCo’sHoldCo Ordinary SharesRockley ordinary shares pursuant to other offering rules or
Rockley’s non-U.S.
employees, the ESPP also permits Rockley’s non-U.S.
subsidiary entities rights to purchase sub-plans
adopted by the compensation committee in order to achieve tax, securities law, or other compliance objectives. The internationalsub-plans
or offerings are subject to the ESPP terms limiting the overall shares available for issuance, the maximum payroll deduction rate, maximum purchase price discount and maximum offering period length.The ESPP contains an “evergreen” provision, pursuant to which the number of ordinary shares available for purchase under such plan shall be increased on the first day of each year for a period of ten years beginning in 2022, equal to the lesser of (x) 1% of the number of ordinary shares outstanding on such date, (y) 7,631,196 shares, or (z) a lesser amount determined by our Board. As of January 1, 2022, the ESPP was increased by 1,278,606 shares pursuant to such evergreen provision.
The foregoing description of the ESPP does not purport to be complete and is qualified in its entirety by reference to the text of the ESPP filed as Exhibit 10.710.18 hereto and incorporated herein by reference.
CERTAIN RELATIONSHIPS AND RELATED PARTY TRANSACTIONS
The following includes a summary of transactions since January 1, 20202019 to which we have been or will be a party, and in which the amount involved in the transaction exceeded or will exceed $120,000 and in which any of our directors, executive officers, or, to our knowledge, beneficial ownersholders of more than 5% of our capital stock, or any member of theentities affiliated with, or immediate family members of, any of the foregoing, persons had or will have a direct or indirect material interest, other than equity and other compensation, termination, change of control, and other arrangements, which are described under the section entitled “Executive Compensation.”
HengtongJV
In 2017, Rockley formed HRT, a joint venture with Hengtong pursuant to the JV Agreement. Under the JV Agreement, HRT must procure chipsets from Rockley for use in finished products and HRT owns the copyright in the final designs. HRT has a license to the underlying intellectual property in the reference designs, including a license to modify and improve. Rockley has certainDuringAs of and in the yearsyear ended December 31, 2020, and 2019, Rockleywe made sales to and were owed from the HRT ofjoint venture, $5.3 million and $6.7$3.3 million, respectively. As of December 31, 2020 and 2019, theThe balance owed by the joint venture amounted to $3.3 million and $2.9 million, respectively, and iswas included in accounts receivable in the accompanyingconsolidated balance sheets.sheet. As of and in the year ended December 31, 2021, sales to and balances owed from the HRT joint venture were immaterial. Effective December 17, 2021, the U.S. Bureau of Industry and Security (“BIS”) of the U.S. Department of Commerce placed Hengtong and certain of its affiliates on the BIS “Entity List.” In response to this decision, the Company terminated a planned technology license to the JV.
non-compete
obligations under the JVAgreement.
On December 19, 2017, Hengtong participated in Rockley’s Round D financing and entered into a Subscription Agreement whereby Hengtong agreed to purchase, and Rockley agreed to sell, 70,000 Ordinary Sharesordinary shares for an aggregate purchase price of $6,650,000. On March 22, 2018 Rockley conducted a 10/1 share split resulting in Hengtong owning 700,000 Ordinary Shares.ordinary shares. On March 15, 2019, Hengtong participated in Rockley’s Round E financing, and entered into a further Subscription Agreement whereby Hengtong agreed to purchase, and Rockley agreed to sell, 2,098,195 Ordinary Sharesordinary shares at a purchase price of $14.298, for an aggregate of $30,000,000.
Consultancy Agreements
Rockley engages two affiliate entities of certain of Rockley’s directors for consulting and administrative services, Rockley Ventures Limited and Rockley Management (HK) Limited. For the six monthsyears ended June 30,
December 31, 2021 and 2020, Rockley incurred $0.3$0.4 million and $0.2$0.8 million in fees for these services, respectively. ForOn March 14, 2021, Rockley Photonics, Inc., a subsidiary of Rockley, entered into a consulting agreement with HealthKapital LLC, a California limited liability company wholly owned by Karim Karti, a director of Rockley. Pursuant to the yearsterms of the consulting agreement, Mr. Karti is entitled to cash compensation at the rate of $600 per hour, estimated at up to 20 hours per week, and fully vested 4,000 RSUs for every 30 days of service during the consultation period, up to a maximum of 24,000 RSUs, subject to the terms and conditions of the consulting agreement. On October 27, 2021, the Company issued 24,000 fully vested RSUs and recorded $0.2 million stock compensation expense for the year ended December 31, 2020 and 2019,2021. For the year ended December 31, 2021, Rockley incurred $0.8 million and $1.9but not paid $0.3 million in fees for these services respectively. As of December 31, 2020 and 2019, the amounts included in accounts payable and accrued expenses in the accompanying balance sheets were not considered material.
under this agreement.Indemnification Agreements
The limitation of liability and indemnification provisions in HoldCo’sRockley’s governing documents may discourage shareholders from bringing a lawsuit against directors for breach of their fiduciary duties. They may also reduce the likelihood of derivative litigation against directors and officers, even though an action, if successful, might benefit HoldCoRockley and its shareholders. A shareholder’s investment may decline in value to the extent HoldCoRockley pays the costs of settlement and damage awards against directors and officers pursuant to these indemnification provisions.
Related Person Transactions Policy
Transactions involving compensation for services provided to HoldCoRockley as an employee, consultant or director will not be considered related person transactions under this policy. A related person is any executive officer, director, nominee to become a director or a holder of more than 5% of any class of HoldCo’sRockley’s voting securities (including HoldCo’s Ordinary Shares)Rockley’s ordinary shares), including any of their immediate family members and affiliates, including entities owned or controlled by such persons.
Under the policy, the related person in question or, in the case of transactions with a holder of more than 5% of any class of HoldCo’sRockley’s voting securities, an officer with knowledge of a proposed transaction, must present information regarding the proposed related person transaction to HoldCo’sRockley’s audit committee (or, where review by HoldCo’sRockley’s audit committee would be inappropriate, to another
94
independent body of HoldCo’sRockley’s Board) for review. To identify related person transactions in advance, HoldCoRockley will rely on information supplied by HoldCo’sRockley’s executive officers, directors and certain significant shareholders. In considering related
person transactions, HoldCo’sRockley’s audit committee will take into account the relevant available facts and circumstances, which may include, but are not limited to:
•the risks, costs, and benefits to HoldCo;
•the impact on a director’s independence in the event the related person is a director, immediate family member of a director or an entity with which a director is affiliated;
•the terms of the transaction;
•the availability of other sources for comparable services or products; and
•the terms available to or from, as the case may be, unrelated third parties.
PRINCIPAL SECURITYHOLDERS
The following table sets forth information regarding the beneficial ownership of HoldCo Ordinary Shares immediately following the Business CombinationRockley ordinary shares as of June 30, 2022 by:
| • | each person who is known to be the beneficial owner of more than 5% of Rockley’s ordinary shares; | ||||||||||
| • | each of Rockley’s named executive officers, current executive officers and directors; and | ||||||||||
| • | all executive officers and directors of Rockley as a group. | ||||||||||
Beneficial ownership is determined according to the rules of the SEC, which generally provide that a person has beneficial ownership of a security if he, she or it possesses sole or shared voting or investment power over that security, including options, warrants, and other similar instruments that are currently exercisable or exercisable within 60 days, but does not include any other HoldCo Ordinary SharesRockley ordinary shares issuable upon the exercise of any other outstanding options, warrants or similar instruments held by other persons. The beneficial ownership percentages below are based on 126,256,257 HoldCo Ordinary Shares129,910,925 Rockley ordinary shares issued and outstanding as of August 11, 2021 afterJune 30, 2022. The following table includes holders who may be deemed to beneficially own more than 5% of Rockley’s ordinary shares as a result of the Closing.
private placement financing which closed in May 2022. See “Selling Shareholders” for additional information regarding these holders.Unless otherwise indicated, and subject to applicable community property laws, HoldCoRockley believes that all persons named in the table have sole voting and investment power with respect to all Ordinary Sharesordinary shares beneficially owned by them.
Name and Address of Beneficial Owner (1) | Number of Shares Beneficially Owned | Percentage | ||||||
5% Holders: | ||||||||
SC Health Group Limited (2) | 9,237,500 | 7.3 | % | |||||
Hengtong Optic-Electric International Co. Limited | 6,949,317 | 5.5 | % | |||||
Executive Officers and Directors: | ||||||||
Andrew Rickman (3) | 17,462,734 | 13.8 | % | |||||
Mahesh Karanth (4) | 1,262,791 | 1.0 | % | |||||
Amit Nagra (5) | 1,771,042 | 1.4 | % | |||||
William Huyett | — | — | ||||||
Brian Blaser | — | — | ||||||
Caroline Brown (6) | 62,085 | * | ||||||
Karim Karti | — | — | ||||||
Michele Klein | — | — | ||||||
Pamela Puryear | — | — | ||||||
All directors and executive officers as a group (nine individuals) (7) | 20,558,652 | 16.2 | % | |||||
Name and Address of Beneficial Owner (1) | Number of Shares Beneficially Owned | Percentage | ||||||
| 5% Holders: | ||||||||
ROC SPV XIX LLC(2) | 12,978,101 | 9.9% | ||||||
Hengtong Optic-Electric International Co. Limited (3) | 6,949,317 | 5.3% | ||||||
Wazee Street Capital Management LLC (4) | 12,978,101 | 9.9% | ||||||
Whitebox Advisors LLC (5) | 12,978,101 | 9.9% | ||||||
| Named Executive Officers, Current Executive Officers and Directors: | ||||||||
Andrew Rickman (6) | 17,564,188 | 13.5% | ||||||
| Chad Becker | 3,166 | * | ||||||
Mahesh Karanth(7) | 1,187,988 | * | ||||||
Amit Nagra(8) | 1,808,951 | 1.4% | ||||||
| William Huyett | 32,333 | * | ||||||
| Brian Blaser | 54,393 | * | ||||||
Caroline Brown (9) | 55,510 | * | ||||||
| Nicolaus Henke | — | — | ||||||
| Karim Karti | 31,333 | * | ||||||
| Michele Klein | 7,333 | * | ||||||
| Pamela Puryear | 7,333 | * | ||||||
All directors and executive officers as a group (nine individuals) (10). | 17,755,589 | 13.7% | ||||||
* Less than 1%
| (1) | Unless otherwise noted, the business address of each of those listed in the table above is 3rd Floor 1 Ashley Road, Altrincham, Cheshire, United Kingdom, WA14 2DT. |
96
| (2) | Based on a Schedule 13G filed on June 23, 2022. Represents ordinary shares deemed to be beneficially | ||||
| (3) | Based on a Schedule 13G/A filed on February 14, 2022. Lawrence Lau holds voting and dispositive power over these shares and disclaims beneficial ownership | ||||
| (4) | Based on a Schedule 13G filed on June 13, 2022. Represents ordinary shares owned by (i) Wazee Street Opportunities Fund V LP, a Delaware limited partnership (“Fund V”); (ii) Wazee Street Capital Management LLC, a Delaware limited liability company (“Wazee Capital”), which serves as the | ||||
| (5) | Based on a Schedule 13G filed on June 6, 2022. Each of Whitebox Advisors LLC, a Delaware limited liability company (“WA”) and Whitebox General Partner LLC, a Delaware limited liability company (“WGP”), as a result of WA’s clients’ ownership, holds voting and dispositive power over these shares. Includes: (i) 144A Warrants to purchase 4,870,130 ordinary shares at an exercise price of $5.00 per ordinary share; (ii) $15,000,000 principal amount of Notes, which are convertible into 4,870,130 ordinary shares based on the | ||||
Includes 17,496,005 ordinary shares and 68,183 ordinary shares subject to options and restricted stock units held by Dr. Rickman exercisable (with respect to options) or which will vest (with respect to restricted stock units) within 60 days of June 30, 2022, respectively. Dr. Rickman has pledged up to 6.0 million of his |
Name of Selling Stockholder | Number of Ordinary Shares Owned Prior to Offering | Number of Ordinary Shares to be Offered Pursuant to this Prospectus 1 | Number of Ordinary Shares Owned After Offering 2 | |||||||||||||||||
Number | Percent | Number | Percent | |||||||||||||||||
Andrew George Rickman 3 | 17,462,734 | 13.8 | % | 17,462,734 | — | — | ||||||||||||||
SC Health Holdings Limited 4 | 7,187,500 | 5.7 | % | 7,187,500 | — | — | ||||||||||||||
RP Bridge LLC 5 | 1,941,187 | 1.5 | % | 1,941,187 | — | — | ||||||||||||||
Roc SPV XIV LLC 6 | 1,808,813 | 1.4 | % | 1,808,813 | — | — | ||||||||||||||
Mahesh Karanth 7 | 5,520 | * | 5,520 | — | — | |||||||||||||||
Amit Nagra 8 . | 33,263 | * | 33,263 | — | — | |||||||||||||||
Robert James Rickman 9 | 735,319 | * | 735,319 | — | — | |||||||||||||||
Sunit Rikhi 10 | 185,597 | * | 185,597 | — | — | |||||||||||||||
Markku Hirvonen 11 | 420,648 | * | 420,648 | — | — | |||||||||||||||
Aaron Zilkie 12 | 2,483,500 | 1.97 | % | 2,483,500 | — | — | ||||||||||||||
Ara Nazarian 13 | 5,545 | * | 5,545 | — | — | |||||||||||||||
Averil Finn 14 | 759,131 | * | 759,131 | — | — | |||||||||||||||
Edward Geoffrey Rickman 15 | 4,967 | * | 4,967 | — | — | |||||||||||||||
George James Rickman 16 | 4,967 | * | 4,967 | — | — | |||||||||||||||
Gregory Finn 17 | 284,360 | * | 284,360 | — | — | |||||||||||||||
Hengtong Optic-Electric International Co. Limited 18 | 6,949,317 | 5.5 | % | 6,949,317 | — | — | ||||||||||||||
Julia Rickman 19 | 24,812 | * | 24,812 | — | — | |||||||||||||||
Morningside Technology Ventures Limited 20 | 2,666,561 | 2.11 | % | 2,666,561 | — | — | ||||||||||||||
Moulton Goodies Limited 21 | 3,014,452 | 2.39 | % | 3,014,452 | — | — | ||||||||||||||
Rebecca Harriet Rickman 22 | 4,967 | * | 4,967 | — | — | |||||||||||||||
Richard von Tscharner 23 | 6,003,116 | 4.75 | % | 6,003,116 | — | — | ||||||||||||||
Caroline Brown 24 | 62,085 | * | 62,085 | — | — | |||||||||||||||
| (7) | Includes 29,435 ordinary shares and 1,158,553 ordinary shares subject to options and restricted stock units held by Mr. Karanth exercisable (with respect to options) or which will vest (with respect to restricted stock units) within 60 days of June 30, 2022, respectively. | ||||
| (8) | Includes 755,367 ordinary shares and 1,053,584 ordinary shares subject to options and restricted stock units held by Dr. Nagra exercisable (with respect to options) or which will vest (with respect to restricted stock units) within 60 days of June 30, 2022, respectively. | ||||
97
| (9) | Represents 7,333 ordinary shares and 48,177 ordinary shares subject to options and restricted stock units held by Dr. Brown exercisable (with respect to options) or which will vest (with respect to restricted stock units) within 60 days of June 30, 2022, respectively. | ||||
| (10) | Includes 116,360 ordinary shares subject to options and restricted stock units held by our current directors and executive officers exercisable within 60 days of June 30, 2022, respectively. Excludes Mr. Karanth, who resigned as Chief Financial Officer effective June 17, 2022, and Dr. Nagra, whose employment was terminated on April 15, 2022. | ||||
98
SELLING SHAREHOLDERS
We are registering for resale an aggregate of up to 87,567,895 ordinary shares that may be sold by the selling shareholders named in this prospectus, as well as the pledgees, donees, transferees, assignees, successors-in-interest, designees and others that receive any of the shares as a gift, pledge, distribution, redemption, repurchase, cancellation, or other non-sale related transfer or who later come to hold any of the selling shareholder’s interest in the ordinary shares other than through a public sale (collectively, the “selling shareholders”). The selling shareholders listed in the table below may from time to time offer and sell any or all of the ordinary shares set forth below pursuant to this prospectus. We are filing the registration statement of which this prospectus forms a part pursuant to the provisions of the Registration Rights Agreement, which we entered into with the selling shareholders on May 27, 2022, concurrently with the closing of the private placement financing, in which we agreed to provide certain registration rights with respect to sales by the selling shareholders of the ordinary shares that may be issued in connection with the conversion of the Convertible Notes, or exercise of the 144A Warrants.
The following table sets forth, based on written representations from the selling shareholders, certain information regarding the beneficial ownership of our ordinary shares by the selling shareholders and the ordinary shares being offered by the selling shareholders. The applicable percentage ownership of ordinary shares is based on approximately 129,910,925 ordinary shares outstanding as of June 30, 2022. Information with respect to ordinary shares owned beneficially after the offering assumes the sale of all of the ordinary shares offered and no other purchases or sales of our ordinary shares. The selling shareholders may offer and sell some, all or none of their ordinary shares.
We have determined beneficial ownership in accordance with the rules of the SEC. Except as indicated by the footnotes below, we believe, based on the information furnished to us, that the selling shareholders have sole voting and investment power with respect to all ordinary shares that they beneficially own, subject to applicable community property laws. Except as otherwise described below, based on the information provided to us by the selling shareholders, no selling shareholder is a broker-dealer or an affiliate of a broker-dealer.
Name of Selling Stockholder1 | Number of Ordinary Shares Owned Prior to Offering | Number of Ordinary Shares to be Offered Pursuant to this Prospectus2 | Number of Ordinary Shares Owned After Offering3 | ||||||||||||||||||||||||||
| Number | Percent | Number | Percent | ||||||||||||||||||||||||||
| Highbridge Tactical Credit Master Fund, L.P. | 12,978,101 | 4 | 9.9% | 10,744,527 | — | — | |||||||||||||||||||||||
| ROC SPV XIX LLC | 12,978,101 | 5 | 9.9% | 39,217,523 | — | — | |||||||||||||||||||||||
| Wazee Street Opportunities Fund V LP | 12,978,101 | 6 | 9.9% | 21,489,053 | — | — | |||||||||||||||||||||||
| Whitebox Multi-Strategy Partners, L.P. | 10,389,612 | 7 | 7.4 | % | 8,595,623 | — | — | ||||||||||||||||||||||
| Whitebox Relative Value Partners, LP | 7,142,856 | 8 | 5.2 | % | 5,909,489 | — | — | ||||||||||||||||||||||
| Whitebox GT Fund, LP | 1,298,700 | 9 | 1.0 | % | 1,074,452 | — | — | ||||||||||||||||||||||
| Pandora Select Partners, LP | 649,352 | 10 | * | 537,228 | — | — | |||||||||||||||||||||||
| _______________ | ||||||||
| * | Represents less than 1% of the outstanding shares. | |||||||
| 1 | Unless otherwise noted, the business address of each of those listed in the table above is 3rd Floor 1 Ashley Road, Altrincham, Cheshire, United Kingdom, WA14 2DT. | |||||||
| 2 | Represents the number of ordinary shares that may be offered by the selling shareholders using this prospectus. These amounts do not represent any other ordinary shares that the selling shareholder may own beneficially or otherwise. These amounts include the amount of ordinary shares initially issuable to a selling shareholder upon (i) conversion by such holder of all of the Notes in which it holds a beneficial interest at a conversion price of $3.08 per ordinary share and (ii) the exercise by such holder of all of the 144A Warrants in which it holds a beneficial interest at an exercise price of $5.00 per ordinary share. These amounts also include: (X) the additional ordinary shares that would have become due in connection with such conversion by such holder assuming that such holder converted its Notes on the date they were issued and the interest make-whole payment (as defined in the Indenture) that may become due in connection therewith was paid in ordinary shares or that would be due upon conversion by such holder of all such Notes in connection with a make-whole fundamental change (as defined in the Indenture); and (Y) the additional ordinary shares that, together with the amount of ordinary shares described in clause (ii) of the immediately preceding sentence, would be issuable to such selling shareholder upon the exercise of all of the 144A Warrants held by it in connection with a ratchet anti-dilution adjustment as provided in the 144A Warrants at an assumed exercise price of $2.80 per ordinary share (the floor price for such ratchet anti-dilution adjustment) as a result thereof. The number of ordinary shares issuable in connection with an interest make-whole payment, if any, or a ratchet anti-dilution adjustment, if any, represent good faith estimates only and the actual number of ordinary shares which may be issued, if any, may vary. The information in this prospectus is not intended to constitute an indication or prediction of (i) the date on which the selling shareholders or Rockley will convert the Notes into ordinary shares, or on which the selling shareholders will exercise the 144A Warrants, if at all, or (ii) if the interest make-whole payment (as defined in the Indenture) becomes due in connection with the conversion of any Note, whether Rockley would elect to make such payment in ordinary shares or have satisfied the conditions set forth in the Indenture to make such payment in ordinary shares. These amounts do not include any ordinary shares issuable upon conversion of the Additional Notes or exercise of the Additional 144A Warrants and do not give effect to the Beneficial Ownership Limitation. These amounts may not equal to the total number of shares offered pursuant to this prospectus due to rounding. As noted above, these amounts do not give effect to the Beneficial Ownership Limitation, and thus may exceed the number of shares listed as beneficially owned under “Number of Ordinary Shares Owned Prior to Offering”, which amounts give effect to the Beneficial Ownership Limitation. | |||||||
99
| 3 | Assumes that all ordinary shares being registered under the registration statement of which this prospectus forms a part are sold in this offering, and that none of the selling securityholders acquire additional ordinary shares after the date of this prospectus and prior to completion of this offering. | |||||||
| 4 | Consists of | |||||||
| 5 | Based on a Schedule 13G filed on June 23, 2022 by or on behalf of ROC SPV XIX LLC and other information provided by the | |||||||
selling shareholder. Consists of |
| Based on a Schedule 13G filed on June 13, 2022 by or on behalf of Wazee Street Opportunities Fund V LP and other information provided by the |
selling shareholder. Consists of |
100
| 7 | Based on a Schedule 13G filed on June 6, 2022 by or on behalf of Whitebox Multi-Strategy Partners, L.P. and other information provided by the selling shareholder. Consists of (i) 144A Warrants to purchase 2,597,403 ordinary shares at an exercise price of $5.00 per share, (ii) $8,000,000 principal amount of Notes, which are convertible into 2,597,403 ordinary shares per the initial conversion price of $3.08 per ordinary share and (iii) the option to acquire an additional $8,000,000 principal amount of Notes, which would be convertible into 2,597,403 ordinary shares per the initial conversion price of $3.08 per ordinary share, and additional 144A Warrants to purchase 2,597,403 ordinary shares at an exercise price of $5.00 per share, which option is exercisable from the date of the issuance of the Notes until the | |||||||
| 8 | Based on a Schedule 13G filed on June 6, 2022 by or on behalf of Whitebox Relative Value Partners, LP and other information provided by the selling shareholder. Consists of (i) 144A Warrants to purchase 1,785,714 ordinary shares at an exercise price of $5.00 per share, (ii) $5,500,000 principal amount of Notes, which are convertible into 1,785,714 ordinary shares per the initial conversion price of $3.08 per ordinary share and (iii) the option to acquire an additional $5,500,000 principal amount of Notes, which would be convertible into 1,785,714 ordinary shares per the initial conversion price of $3.08 per ordinary share, and additional 144A Warrants to purchase 1,785,714 ordinary shares at an exercise price of $5.00 per share, which option is exercisable from the | |||||||
101
| 9 | Based on a Schedule 13G filed on June 6, 2022 by or on behalf of Whitebox GT Fund, LP and other information provided by the selling shareholder. Consists of (i) 144A Warrants to purchase 324,675 ordinary shares at an exercise price of $5.00 per share, (ii) $1,000,000 principal amount of Notes, which are convertible into 324,675 ordinary shares per the initial conversion price of $3.08 per ordinary share and (iii) the option to acquire an additional $1,000,000 principal amount of Notes, which would be convertible into 324,675 ordinary shares per the initial conversion price of $3.08 per ordinary share, and additional 144A Warrants to purchase 324,675 ordinary shares at an exercise price of $5.00 per share, which option is exercisable from the | |||||||
| 10 | Based on a Schedule 13G filed on June 6, 2022 by or on behalf of Pandora Select Partners, LP and other information provided by the selling shareholder. Includes (i) 144A Warrants to purchase 162,338 ordinary shares at an exercise price of $5.00 per share, (ii) $500,000 principal amount of Notes, which are convertible into 162,338 ordinary shares per the initial conversion price of $3.08 per ordinary share and (iii) the option to acquire an additional $500,000 principal amount of Notes, which would be convertible into 162,338 ordinary shares per the initial conversion price of $3.08 per ordinary share, and additional 144A Warrants to purchase 162,338 ordinary shares at an exercise price of $5.00 per share, which option is exercisable from the date of the issuance of the Notes until the date that is 12 months following the effective date of the registration statement covering the ordinary shares underlying the Notes. The number of shares being offered hereby does not include shares issuable upon the conversion of Notes or the exercise of 144A Warrants which may be acquired pursuant to such option as such option has not been exercised. Each of (i) through (iii) are subject to the Beneficial Ownership Limitation. Whitebox Advisors LLC is the investment manager of Whitebox GT Fund, LP and has the power to vote and dispose of such shares. Whitebox Advisors LLC is owned by the Whitebox Members, and such individuals and entity disclaim beneficial ownership of the shares except to the extent of its or his direct or indirect economic interest in Whitebox Advisors LLC or Pandora Select Partners, LP. Excludes any ordinary shares that may be issuable in connection with an interest make-whole payment, if any, or a ratchet anti-dilution adjustment, if any, as these shares will be issuable solely as the result of actions or elections taken or made by the Company, and thus holders of the warrants and Notes do not have the right to acquire beneficial ownership of such ordinary shares within 60 days of June 30, 2022. The address of Pandora Select Partners, LP is 3033 Excelsior Boulevard, Minneapolis, MN 55416. | |||||||
DESCRIPTION OF OUR SECURITIES
The following summary of the material terms of our securities is not intended to be a complete summary of the rights and preferences of such securities, and is qualified by reference to the Articles of Association and the warrant-related documents described herein, which are exhibits to the registration statement of which this prospectus is a part. We urge to you reachread each of the Articles of Association and the warrant-related documents described herein in their entirety for a complete description of the rights and preferences of our securities.
Share Capital
Authorized Capitalization
General
The total amount of HoldCo’sRockley’s authorized share capital consists of 12,417,500,000 Ordinary Sharesordinary shares with a par value of $0.00004026575398$0.000004026575398 per share. HoldCoAs of June 30, 2022, Rockley had 126,256,257 HoldCo Ordinary Shares129,910,925 ordinary shares and warrants to purchase 14,204,266 Ordinary Shares outstanding immediately after the Closing.
40,536,024 ordinary shares outstanding.Ordinary Shares
Voting Rights
Each holder of HoldCo Ordinary SharesRockley ordinary shares is entitled to one vote per share on each matter submitted to a vote of shareholders, as provided by the governing documents. The governing documents provide that the holders of
one-third
of the share capital issued and outstanding and entitled to vote thereat, present in person, or by remote communication, if applicable, or represented by proxy, will constitute a quorum at all meetings of the shareholders for the transaction of business. When a quorum is present, the affirmative vote of a majority of the votes cast is required to take action, unless otherwise specified by law, the governing documents. There are no cumulative voting rights.Dividend Rights
Each holder of HoldCo Ordinary SharesRockley ordinary shares is entitled to the payment of dividends and other distributions as may be declared by the Board from time to time out of HoldCo’sRockley’s assets or funds legally available for dividends or other distributions. These rights are subject to the preferential rights of the holders of HoldCo’sRockley’s preferred shares, if any, and any contractual limitations on HoldCo’sRockley’s ability to declare and pay dividends.
Other Rights