Registration No. 333-______333-176894
UNITED STATES
SECURITIES AND EXCHANGE COMMISSION
Washington, D.C. 20549
PRE-EFFECTIVE AMENDMENT NO. 5 To
FORM S-1
REGISTRATION STATEMENT
UNDER
THE SECURITIES ACT OF 1933
__________________________________________
DAIS ANALYTIC CORPORATION
(Exact Name of Registrant as Specified in Its Charter)
__________________________________________
__________________________________________
| New York | 3990 | 14-1760865 | ||
(State or other jurisdiction of incorporation or organization) | (Primary Standard Industrial Classification Code Number) | (I.R.S. Employer Identification Number) |
11552 Prosperous Drive Odessa, FL 33556 Telephone: (727) 375-8484 Facsimile: (727) 375-8485 | State of New York – Secretary of State Department of State One Commerce Plaza 99 Washington Avenue, 6th Floor Albany, New York 12231 Telephone: (518) 473-2492 Facsimile: (518) 474-1418 | |
(Address, Including Zip Code, and Telephone Number, Including Area Code, of Principal Executive Offices) | (Name, Address, Including Zip Code and Telephone Number, Including Area Code, of Agent for Service) |
Copies to:
Erick Richardson, Esq.
Peter DiChiara, Esq.
Richardson & Patel LLP
10900 Wilshire Boulevard, Suite 500
Los Angeles, California 90024
(310) 208-1182
APPROXIMATE DATE OF PROPOSED SALE TO THE PUBLIC: From time to time after the effective date of this Registration Statement.
If any of the securities being registered on this Form are to be offered on a delayed or continuous basis pursuant to Rule 415 under the Securities Act of 1933, as amended (the “Securities Act”), other than securities offered only in connection with dividend or interest reinvestment plans, check the following box. x
If this Form is filed to register additional securities for an offering pursuant to Rule 462(b) under the Securities Act, please check the following box and list the Securities Act registration statement number of the earlier effective registration statement for the same offering. o
If this Form is a post-effective amendment filed pursuant to Rule 462(c) under the Securities Act, check the following box and list the Securities Act registration statement number of the earlier effective registration statement for the same offering. o
If this Form is a post-effective amendment filed pursuant to Rule 462(d) under the Securities Act, check the following box and list the Securities Act registration statement number of the earlier effective registration statement for the same offering. o
Indicate by check mark whether the registrant is a large accelerated filer, an accelerated filer, a non-accelerated filer, or a smaller reporting company. See definitions of “large accelerated filer,” “accelerated filer” and “smaller reporting company” in Rule 12b-2 of the Exchange Act. (Check one):
| Large accelerated filer | o | Accelerated filer | o | |||
| Non-accelerated filer | o (Do not check if a smaller reporting company) | Smaller reporting company | x |
CALCULATION OF REGISTRATION FEE
| Title of Each Class of Securities to be Registered | Amount to be Registered | Proposed Maximum Aggregate Offering Price(1) | Amount of Registration Fee(6) | |||||||||
| Common stock, $0.01 par value per share(2) | 4,312,500 | $ | 21,562,500 | $ | 2,503.41 | |||||||
| Underwriter Warrant(3)(4)(5) | 1 warrant | $ | 100 | — | ||||||||
| Shares of Common Stock underlying Underwriter’s Warrant | 431,250 | $ | 2,587,500 | $ | 300.41 | |||||||
| Amount Paid | $ | 2,753.75 | ||||||||||
| Balance Due | $ | 50.07 | ||||||||||
| Title of Each Class of Securities to be Registered | Amount to be Registered | Proposed Maximum Offering Price Per Security | Proposed Maximum Aggregate Offering Price(1) | Amount of Registration Fee( 2 ) | ||||||||||||
| Common stock, $0.01 par value per share | 33,000,000 | $ | 0.3 4 | $ | 11,220,000 | $ | 1,28 5.81 | |||||||||
| Amount Due ( 2 ) | $ | 0 | ||||||||||||||
| (1) | Estimated solely for the purpose of calculating the amount of the registration fee pursuant to Rule 457(o) under the Securities Act of 1933, as amended. The Proposed Maximum Aggregate Offering Price is determined by the shares of common stock to be registered multiplied by the Proposed Maximum Offering Price Per Security. For purposes of the registration fee, we used the highest price of our estimated range of the offering price. |
| Previously paid |
THE COMPANY HEREBY AMENDS THIS REGISTRATION STATEMENT ON SUCH DATE OR DATES AS MAY BE NECESSARY TO DELAY ITS EFFECTIVE DATE UNTIL THE COMPANY SHALL FILE A FURTHER AMENDMENT WHICH SPECIFICALLY STATES THAT THIS REGISTRATION STATEMENT SHALL THEREAFTER BECOME EFFECTIVE IN ACCORDANCE WITH SECTION 8(A) OF THE SECURITIES ACT OF 1933, AS AMENDED, OR UNTIL THE REGISTRATION STATEMENT SHALL BECOME EFFECTIVE ON SUCH DATE AS THE SECURITIES AND EXCHANGE COMMISSION, ACTING PURSUANT TO SAID SECTION 8(A), MAY DETERMINE.
THE INFORMATION IN THIS PROSPECTUS IS NOT COMPLETE AND MAY BE CHANGED. WE MAY NOT SELL THESE SECURITIES UNTIL THE REGISTRATION STATEMENT FILED WITH THE SECURITIES AND EXCHANGE COMMISSION IS EFFECTIVE. THIS PROSPECTUS IS NOT AN OFFER TO SELL THESE SECURITIES AND WE ARE NOT SOLICITING AN OFFER TO BUY THESE SECURITIES IN ANY STATE WHERE THE OFFER OR SALE IS NOT PERMITTED.
SUBJECT TO COMPLETION, DATED SEPTEMBER 19, 2011 February 8 , 2012
PRELIMINARY PROSPECTUS
3,750,00033,000,000 Shares of Common Stock
PRELIMINARY PROSPECTUS


_____________________________________________
This is a firm commitment public offering of 3,750,000up to 33,000,000 shares of our common stock.
The public offering price for the common stock offered hereby is estimated to be between $3.00$0.30 and $5.00$0.3 4 per share. Once the offering price has been determined, the common stock offering price will remain fixed for the duration of the offering. Our common stock is quoted on the OTC Bulletin Board under the symbol “DLYT.OB”. On September 15, 2011,February 8 , 2012, the last reported sale price for our common stock was $0 .49$0. 26 per share. Immediately after the effectiveness of the registration statement of which this prospectus is a part, and prior to closing of this offering, we will effect a reverse stock split anticipated to be on a 10-for-1 basis. The proposed aggregate price of the shares offered hereby assuming a midpoint offering price of $4.00$0.3 2 per share and excluding shares that may be sold on exercise of the underwriter’s over- allotment option, is $15,000,000.$ 10, 560 ,000.
Investing in our securities involves certain risks, including those set forth in the “Risk Factors” section beginning on page 1 510 of this prospectus as well as those set forth in any prospectus supplement that should be considered in connection with an investment in our securities.securities.
| Per Share | Total | |||||||
| Public Offering Price | $ | 0.3 2 | $ | 10, 560 ,000 | ||||
| $ | 0.0 192 | $ | 6 33,600 | |||||
| Offering Proceeds to Dais, before expenses(2) | $ | 0.3 008 | $ | 9, 926,400 | ||||
________________
| (1) | |
| (2) | We estimate |
Our officers and directors will not receive any compensation for their role in offering or selling the shares. The placement agent will receive cash compensation equal to 6% of the underwriteraggregate proceeds from the sale of common stock to investors secured by said placement agent and a 45-day optionwarrant to purchase up to 562,500 additional6% of the aggregate number of shares of common stock solelyissued to cover over-allotments, if any. Wesaid purchasers Any such warrant shall have also agreed to issue to the underwriter a warrant to purchase up to a total of 431,250 shares of common stock at an exercise price of $ (120%equal to 125% of the publicprice per share paid by investors in this offering, price). The underwriter warrant isbe exercisable at any time, in whole or in part, for five years from the date of effectiveness of the registration statement of which this prospectus is a part, subject toand shall contain a one year lock-up.
cashless exercise provision. The underwriterissuer expects to deliver our shares to purchasers in the offering on or about , 2011._______, 2012.
NEITHER THE SECURITIES AND EXCHANGE COMMISSION NOR ANY STATE SECURITIES COMMISSION HAS APPROVED OR DISAPPROVED OF THESE SECURITIES OR PASSED UPON THE ADEQUACY OR ACCURACY OF THE PROSPECTUS. ANY REPRESENTATION TO THE CONTRARY IS A CRIMINAL OFFENSE.
The date of this prospectus is _______, 2011
2012
2012


TABLE OF CONTENTS
| Page No. | ||||
| 88 | ||||
| 89 | ||||
| 89 | ||||
| 90 | ||||
Unless otherwise stated or the context otherwise requires, the terms “Dais Analytic,” “we,” “us,” “our” and the “Company” refer to Dais Analytic Corporation.
You should rely only on the information contained in this prospectus. We have not authorized anyone to provide you with additional or different information. The information contained in this prospectus is accurate only as of the date on the front cover of this prospectus, regardless of the time of delivery of this prospectus or of any sale of our common stock.
No dealer, salesperson or any other person is authorized in connection with this offering to give any information or make any representations about us, the securities offered hereby or any matter discussed in this prospectus, other than those contained in this prospectus and, if given or made, the information or representations must not be relied upon as having been authorized by us. This prospectus does not constitute an offer to sell or a solicitation of an offer to buy any security other than the securities offered by this prospectus, or an offer to sell or a solicitation of an offer to buy any securities by anyone in any circumstance in which the offer or solicitation is not authorized or is unlawful.
CAUTIONARY STATEMENT REGARDING
FORWARD-LOOKING STATEMENTS
FORWARD-LOOKING STATEMENTS
This prospectus, including the sections titled “Prospectus Summary”, “Management’s Discussion and Analysis of Financial Condition and Results of Operations”, “Description of Business”, “Risk Factors” and other sections generally, contains certain statements that constitute “forward-looking statements”. These forward-looking statements include certain statements regarding intent, belief or current expectations about matters (including statements as to “beliefs,” “expectations,” “anticipations,” “intentions” or similar words). Forward-looking statements are also statements that are not statements of historical fact. Because these statements are based on factors that involve risks and uncertainties, actual results may differ materially from those expressed or implied by the forward-looking statements. These factors include, among others:
our ability to achieve and maintain profitability;
the price volatility of the Common Stock;
the historically low trading volume of the Common Stock;
our ability to manage and fund our growth;
our ability to attract and retain qualified personnel;
litigation;
our ability to compete with current and future competitors;
our ability to obtain additional financing;
general economic and business conditions;
our ability to continue as a going concern;
our ability to do business overseas;
other risks and uncertainties included in the section of this document titled “Risk Factors”; and
other factors discussed in our other filings made with the Commission.
The subsequent forward-looking statements relating to the matters described in this document and attributable to us or to persons acting on our behalf are expressly qualified in their entirety by such factors. Actual events or results may differ materially from those discussed in forward-looking statements as a result of various factors, including, without limitation, the risks outlined under “Risk Factors” and matters described in this prospectus generally. In light of these risks and uncertainties, there can be no assurance that the forward-looking statements contained in this prospectus will in fact occur. We have no obligation to publicly update or revise these forward-looking statements to reflect new information, future events, or otherwise, except as required by applicable laws, and we caution you not to place undue reliance on these forward looking statements.
Third Party Data
This prospectus also contains estimates, statistical, industry-related and market-related data, and other information concerning our industry, including market size and growth rates, which are based on industry publications, surveys and forecasts, based on or derived from third party sources which we believe are reliable. This information involves a number of limitations and assumptions which may or may not be or become true, and for the foregoing reasons you are cautioned not to give undue weight to the estimates presented in these third party materials. The industry in which we operate is subject to a high degree of uncertainty and risk due to a variety of factors, including those described in “Risk Factors”.
PROSPECTUS SUMMARY This summary highlights selected information contained elsewhere in this prospectus and does not contain all the information that you need to consider in making your investment decision. You should carefully read this entire prospectus before deciding whether to invest in the common stock. You should pay special attention to the “Risk Factors” section of this prospectus to determine whether an investment in the common stock is appropriate for you. This registration statement, including the exhibits and schedules thereto, contains additional relevant information about us and our capital stock. We file annual, quarterly, and current reports, proxy statements, and other information with the SEC. You may read and copy any document we file at the SEC’s public reference room at 100 F Street, N.E., Washington, D.C. 20549. You can also request copies of the documents, upon payment of a duplicating fee, by writing the Public Reference Section of the SEC. Please call the SEC at 1-800-SEC-0330 for further information on the public reference room. These SEC filings are also available to the public from the SEC’s web site at www.sec.gov. About Dais Analytic Corporation We have developed and are commercializing specialty nano-structured polymer materials (Aqualyte™). Using Aqualyte ™ materials we are creating value added products which are designed to: (i) improve the energy efficiency in Heating, Ventilation and Air Conditioning (HVAC) equipment, (ii) replace the chemical refrigerants used in today’s HVAC systems as well as most all forms of refrigeration systems; (iii) remove impurities in contaminated water (such as waste water and seawater); and (iv) allow the storage of electrical energy in a device called an “ultracapacitor.” Several applications that use the Aqualyte™ platform are under development. These potential applications include: | |
| ● | NanoAir™, a water based packaged HVAC system that is potentially capable of achieving improvements in energy efficiency over traditional AC and refrigeration systems, |
| ● | NanoClear™, a water clean-up process that has been demonstrated to provide parts per billion potable water from most forms of contaminated water, including salt, brackish or wastewater1, and |
| ● | NanoCap™, an energy storage device (ultracapacitor) we are currently researching and developing that uses the attributes of the Aqualyte™ material to potentially provide significantly greater energy density and power than conventional capacitors or batteries. |
We are a New York corporation established on April 8, 1993 as Dais Corporation. We subsequently changed our name to Dais Analytic Corporation on December 13, 1999. Our principal executive offices are located at 11552 Prosperous Drive, Odessa, FL 33556. Our telephone number is (727) 375-8484. Our website can be accessed at www.daisanalytic.com and www.conserv.com. Information contained in our website is not a part of this prospectus and the inclusion of our website address in this prospectus is an inactive textual reference only. Our Proprietary Technologies We have multiple pending and issued patents in the U.S., China, Hong Kong and Europe, and under the Patent Cooperation Treaty (PCT). In addition, we co-own two PCT applications with Aegis Biosciences LLC, a biomaterials drug delivery technology company. These patents relate to, or are applications of, our nano-structured polymer materials that perform functions such as ion exchange and modification of surface properties. The polymers are selectively permeable to polar materials, such as water, in molecular form. Selective permeability allows these materials to function as a nano-filter in various transfer applications. These materials are made from base polymer resins available from commercial firms worldwide and possess what we believe to be some unique and controllable properties, such as: | |
| ● | Selectivity: Based on our research, we believe that when the polymer is made there are small channels created that are 5 to 30 nanometers in diameter. There are two types of these channels: hydrophilic (water permeable), and hydrophobic (water impermeable). The channels can be chemically tuned to be selective for the ions or molecules they transfer. The selectivity of the polymer can be adjusted to efficiently transfer water molecules from one face to the other using these channels. |
| ● | High transfer rate: Based on in-house testing protocols and related results, we have found that the channels created when casting the materials into a nano-structured membrane have a transfer rate of water molecules, or flux, greater than 90% of an equivalent area of an open tube. This feature is fundamental to the material’s ability to transfer moisture at the molecular level while substantially allowing or disallowing the transfer of certain other substances at a molecular level. |
| ● | Unique surface characteristics: The materials offer a surface characteristics that we believe inhibit the growth of bacteria, fungus and algae and prevent adhesives from attaching. |
| The molecular selectivity, transfer rate and surface coating properties, coupled with our ability to produce the nano-structured materials at what we believe is an affordable price, distinguishes our technology and value-added products. By incorporating our nano-structured materials into our products, we strive to address current real-world market needs by offering what we believe to be higher efficiencies and improved price performance, compared to, for example, other energy recovery mechanisms available for HVAC that use coated paper or desiccant materials instead of our nano-structured polymer materials. For further details about our technology, please refer to our “Description of Business” in this prospectus. Our Target Markets We are currently focusing our efforts on applications of our nano-structure polymer technology materials in the following areas: Energy Recovery Ventilators ConsERV™ is a heating, ventilation and air conditioning (HVAC) energy conservation product which after reviewing the results of various third party tests, we believe will save an average of up to 30% on HVAC ventilation air operating costs and allow HVAC equipment to be up to 30% smaller, reducing peak energy usage by up to 20% while simultaneously improving indoor air quality by increasing the level of fresh air ventilation. This product makes HVAC systems operate more efficiently, and in many cases results in energy and cost savings. ConsERV™ may be added to most existing HVAC systems, typically in commercial buildings, to provide ventilation within the structure. It pre-conditions the incoming air by passing the air through our nano-technology polymer which has been formed into a filter, known in the market as a fixed plate core. The nano-technology core uses the stale building air that is simultaneously exhausted to transfer heat and moisture into or out of the incoming air. For summer air conditioning, the core removes some of the heat and humidity from the incoming air, transferring it to the exhaust air stream thereby, under certain conditions, saving energy. For winter heating, the core transfers a portion of the heat and humidity into the incoming air from the exhaust air stream thereby often saving energy. | |
We believe that there is significant demand for energy recovery ventilators in the U.S. and international markets. As reported by Frost and Sullivan in 2007, the North American market for energy recovery ventilators (ERVs) was estimated to be approximately $1.1 billion. Projections made at that time were for 200% growth from that level by 2012. Market drivers behind this growth include higher ventilation standards, greater end user awareness, LEED (Leadership in Energy Efficiency and Design) certification points or incentives, Our ConsERV™ product is the primary focus of our resources and commercialization efforts. When compared to similar competitive products and based on test results conducted by the Air-Conditioning, Heating and Refrigeration Institute (AHRI), a leading industry association in 2008, we believe ConsERV™ is twice as effective in managing a combination of latent and sensible heat as other fixed plate cores. This study is publicly available and was not prepared for our benefit or funded by us. Residential and Commercial Heating, Air-Conditioning and Refrigeration Our water-based packaged HVAC system, NanoAir™, which is in the early beta stage of development, dehumidifies and cools air in warm weather, or humidifies and heats air in cold weather. NanoAir™ may be capable of replacing a traditional refrigerant loop-based heating, cooling, and refrigeration system. We have a number of small prototype units showing fundamental heating, cooling, humidification, and dehumidification operations of this evolving application. Based on our lab results to date, NanoAir™ may have the potential to reduce energy consumption by up to 50%, and is projected to be up to 3 times more energy efficient than current refrigerant gas-based technologies on the market today. Since heating and cooling costs account for approximately 19% of all energy consumed in the U.S. (second only to transportation), as stated by Dr. Steven Chu of the U.S. Department of Energy in 2010, we believe NanoAir™ may have the ability to provide significant energy |
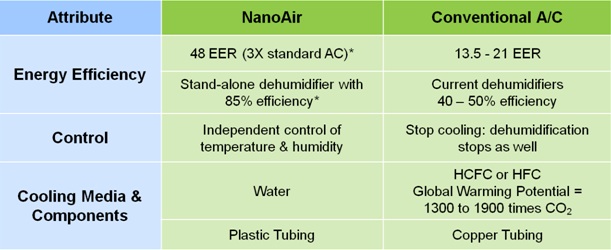 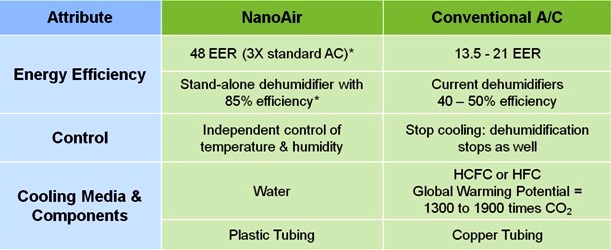 |
| *projected Projected NanoAir™ is being partially funded by a $681,322 grant from the U.S. Department of Energy’s Advanced Research Projects Agency – Energy (ARPA-E) awarded to us in September of 2010, and a $254,500 grant from Pasco County, Florida in December of 2010. The grant from Pasco County requires us to pay the county 2% of the gross sales of products using a certain unique pump assembly for 5 years, |
Water Clean-Up According to water quality evaluated by the Pasco County Technical Services in March 2010, and the China Academy of Environmental Science in December 2010, our NanoClear™ prototype system has demonstrated the ability to remove salt and other impurities from water to produce potable water using what we believe is an environmentally friendly design projected to be more energy efficient, reduce capital costs, and lower operating expenditures up to 50% over the market leading technology in use today (Reverse Osmosis). We have developed a number of functional demonstration units of various sizes, which highlight the basics of how this system works to produce potable water. These demonstration units are being used as the basis for the application’s next planned inflection point: the construction and operation of a 10 cubic meter (approximately 26,500 gallons per day) pilot plant to be located near our office outside of Tampa, Florida at a Pasco County off-line waste water treatment facility where the local municipal government has granted Dais permission to construct and operate the pilot NanoClear™ facility. The NanoClear™ application is currently in the early stages of beta development. We believe significant market opportunities for the Further, based on our projections, we believe certain facility and mechanical layouts of the NanoClear™ process for water clean-up may be able to accomplish 90-95% water capture vs. 40-60% for traditional Reverse Osmosis (RO) systems clean water using NanoClear™ has a projected energy/water cost of $0.25 to $0.33 per cubic meters, (desalination) vs. $0.50-$1 per cubic meters for Reverse Osmosis.2 Energy Storage Based on initial material tests conducted by General Electric’s Global Research and Development Center in 2008, and the University of Florida in 2010 and 2011, we believe that by applying a combination of our nano-material in a process which exercises key attributes of the material’s properties, we may be able to construct an energy storage device akin to an ultracapacitor. An ultracapacitor is a device which stores energy similar to a battery but in this case with projected increases in energy density and lifetimes. We call this application NanoCap™. We believe the key application for NanoCap™ would be in transportation. We signed a research agreement with the University of Florida to conduct materials testing for the time period from July 2010 through September 2011. Although very early in the development path, preliminary results obtained in research by both GE and the University of Florida suggest that a NanoCap™ ultracapacitor, if fully developed, may possess an energy density comparable to that of gasoline. |
The market size for ultracapacitors, worldwide, is projected to be $500 million by 2012 as estimated by Greentech Media in January 2010 and includes electric vehicles, various electronics, smart grid and other applications. Other We have identified other potential products for our nano-materials and processes. Some have basic data to support additional functionality and market differentiation of a product based on our nano-technology inventions. These other products are based, in part, upon the known functionality of our materials and processes. Management anticipates that many of these other applications will be developed in the future with partners already in a given sales channel or line of business with us, as we grow and are able to internally fund such activities, development, manufacturing, and sales. We expect ConsERV™ to continue to be the focus of our commercial product sales through Proposed We have entered into an agreement with our CEO, Tim Tangredi, that provides that upon closing of the offering and receipt by us of gross proceeds of $6 million or more, Mr. Tangredi’s accrued compensation through the closing date in the approximate amount of $1.05 million shall be paid with a combination of (a) cash, which we estimate at this time to be approximately $380,000, which is intended to cover payment of income and other taxes due from the payment of such accrued compensation, and (b) shares of restricted common stock at a price equal to the price per share paid by investors in the public offering, for the remainder (which is assumed for purposes of this calculation to be For additional details regarding the above, see “Use of Proceeds” below in this prospectus. Risk Factors An investment in our common stock involves a high degree of risk. You should carefully consider the risks described under “Risk Factors” beginning on page |
| The Offering The following summary contains basic information about the offering and our common stock and is not intended to be complete. It does not contain all the information that is important to you. For a more complete understanding of our common stock, please refer to the section of this prospectus entitled “Description of Capital Stock.” | ||
| Issuer | Dais Analytic Corporation, a New York corporation. | |
| Common stock offered by us | 33,000,000 shares of common stock, par value $0.01 per share. | |
| Common stock outstanding before this offering | 37,517,604 shares of common stock, par value $0.01 per share. (1) (2) | |
| Common stock outstanding after this offering | ||
| Use of Proceeds | We intend to use the net proceeds from the sale of our common stock in this offering for working capital, to pay certain outstanding note obligations, to pay accrued salaries, and for general corporate purposes. For additional details concerning the use of proceeds see the section below in the prospectus titled “Use of Proceeds.” | |
| Market and trading symbol for the common stock | Our common stock is quoted on the Over-the-Counter Bulletin Board under the symbol | |
Placement agent common stock purchase | We will grant the agent, pursuant to | |
| (1) | ||||
| The number of shares of our common stock outstanding before and after this offering is based on the number of shares outstanding as of | ||||
| • | 17,402,757 shares of our common stock issuable upon exercise of stock options under our stock plans, | |||
| • | 26,390,778 shares of our common stock reserved for issuance under various outstanding warrant | |||
| • | Shares of our common stock issuable upon conversion of our convertible promissory notes in the aggregate principal amount of $2,500,000 plus accrued interest as of the closing date of the offering, which (as of | |||
| • | 9,348,000 shares of our common stock reserved for future issuance under our stock plans; and, | |||
| • | Shares of our common stock issuable upon conversion of a portion of the accrued salary of our CEO to common stock; as of | |||
| Unless otherwise specifically stated, information throughout this prospectus assumes that none of our outstanding options or warrants to purchase shares of our common stock have been exercised, and that none of our convertible securities have been converted. | ||||
Unless otherwise indicated, the number of shares of common stock presented in this prospectus excludes shares issuable pursuant to any warrant granted to the | ||||
SUMMARY FINANCIAL DATA
The table below includes historical selected financial data for each of the years ended December 31, 2010 and 2009 (as restated), derived from our audited financial statements included elsewhere in this prospectus. The table below also includes historical financial data for the three and sixnine month periods ending JuneSeptember 30, ,2011 and 2010 (as restated) and 2011,, derived from our unaudited financial statements included elsewhere in this prospectus.
You should read the historical selected financial information presented below in conjunction with the “Management’s Discussion and Analysis of Financial Condition and Results of Operations” section and our financial statements and the notes to those financial statements included elsewhere in this prospectus. Historical results are not necessarily indicative of the results that may be expected for any future period.
For the Years Ended December 31, | For the Three Months Ended June 30, | For the Six Months Ended June 30, | ||||||||||||||||||||||
| 2010 | 2009 | 2011 | 2010 | 2011 | 2010 | |||||||||||||||||||
| as restated | as restated | |||||||||||||||||||||||
| STATEMENT OF OPERATIONS: | ||||||||||||||||||||||||
| Revenues | $ | 3,342,468 | $ | 1,531,215 | $ | 1,124,079 | $ | 1,010,142 | $ | 1,982,773 | $ | 1,417,454 | ||||||||||||
| Cost of goods sold | (2,290,041 | ) | (1,071,098 | ) | (806,674 | ) | (550,196 | ) | (1,507,564 | ) | (871,522 | ) | ||||||||||||
| Operating expenses | (2,931,274 | ) | (3,224,592 | ) | (803,725 | ) | (1,029,394 | ) | (1,728,058 | ) | (1,588,914 | ) | ||||||||||||
| Loss from operations | (1,878,847 | ) | (2,764,475 | ) | (486,320 | ) | (569,448 | ) | (1,252,849 | ) | (1,042,982 | ) | ||||||||||||
| Change in fair value of warrant liability | 618,801 | (3,731,694 | ) | 1,694,170 | 1,835,094 | (657,937 | ) | 327,066 | ||||||||||||||||
| Interest and other expense | (173,547 | ) | (620,907 | ) | (416,265 | ) | (55,233 | ) | (579,774 | ) | (101,736 | ) | ||||||||||||
| Net loss | $ | (1,433,593 | ) | $ | (7,117,076 | ) | $ | 791,585 | $ | 1,210,413 | $ | (2,490,560 | ) | $ | (817,652 | ) | ||||||||
| Net loss per common share, basic | $ | (0.05 | ) | $ | (0.36 | ) | $ | 0.02 | $ | 0.04 | $ | (0.07 | ) | $ | (0.03 | ) | ||||||||
| Net loss per common share, diluted | $ | (0.05 | ) | $ | (0.36 | ) | $ | 0.02 | $ | 0.03 | $ | (0.07 | ) | $ | (0.03 | ) | ||||||||
| Weighted average common shares | ||||||||||||||||||||||||
| outstanding, basic | 29,985,632 | 19,960,150 | 35,089,169 | 29,800,194 | 34,335,348 | 29,577,797 | ||||||||||||||||||
| Weighted average common shares | ||||||||||||||||||||||||
| outstanding, diluted | 29,985,632 | 19,960,150 | 56,239,845 | 40,245,491 | 34,335,348 | 29,577,797 | ||||||||||||||||||
| PROFORMA: * | ||||||||||||||||||||||||
| Proforma net loss per common share, basic | $ | (0.19 | ) | $ | (1.10 | ) | $ | 0.10 | $ | 0.16 | $ | (0.32 | ) | $ | (0.11 | ) | ||||||||
| Proforma net loss per common share, diluted | $ | (0.19 | ) | $ | (1.10 | ) | $ | 0.08 | $ | 0.14 | $ | (0.32 | ) | $ | (0.11 | ) | ||||||||
Proforma weighted average common shares outstanding, basic | 7,463,702 | 6,461,154 | 7,974,056 | 7,445,158 | 7,898,674 | 7,422,919 | ||||||||||||||||||
Proforma weighted average common shares outstanding, diluted | 7,463,702 | 6,461,154 | 10,089,124 | 8,489,688 | 7,898,674 | 7,422,919 | ||||||||||||||||||
For the Years Ended December 31, | For the Three Months Ended September 30, | For the Nine Months Ended September 30, | ||||||||||||||||||||||
| 2010 | 2009 | 2011 | 2010 | 2011 | 2010 | |||||||||||||||||||
| as restated | as restated | as restated | ||||||||||||||||||||||
| STATEMENT OF OPERATIONS: | ||||||||||||||||||||||||
| Revenues | $ | 3,342,468 | $ | 1,531,215 | $ | 625,949 | $ | 952,374 | $ | 2,608,722 | $ | 2,369,828 | ||||||||||||
| Cost of goods sold | (2,290,041 | ) | (1,071,098 | ) | (466,271 | ) | (755,034 | ) | (1,973,835 | ) | (1,626,556 | ) | ||||||||||||
| Operating expenses | (2,931,274 | ) | (3,224,592 | ) | (484,123 | ) | (697,099 | ) | (2,212,088 | ) | (2,286,013 | ) | ||||||||||||
| Loss from operations | (1,878,847 | ) | (2,764,475 | ) | (324,445 | ) | (499,759 | ) | (1,577,201 | ) | (1,542,741 | ) | ||||||||||||
| Change in fair value of warrant liability | 618,801 | (3,731,694 | ) | (126,008 | ) | (611,231 | ) | (783,944 | ) | (284,165 | ) | |||||||||||||
| Interest and other expense | (173,547 | ) | (620,907 | ) | (446,131 | ) | (55,933 | ) | (1,025,907 | ) | (157,669 | ) | ||||||||||||
| Net loss | $ | (1,433,593 | ) | $ | (7,117,076 | ) | $ | (895,384 | ) | $ | (1,166,923 | ) | $ | (3,385,852 | ) | $ | (1,948,575 | ) | ||||||
| Net loss per common share, basic | $ | (0.05 | ) | $ | (0.36 | ) | $ | (0.02 | ) | $ | (0.04 | ) | $ | (0.10 | ) | $ | (0.03 | ) | ||||||
| Net loss per common share, diluted | $ | (0.05 | ) | $ | (0.36 | ) | $ | (0.02 | ) | $ | (0.04 | ) | $ | (0.10 | ) | $ | (0.03 | ) | ||||||
| Weighted average common shares outstanding, basic | 29,985,632 | 19,960,150 | 36,682,582 | 19,872,184 | 35,126,357 | 29,696,897 | ||||||||||||||||||
| Weighted average common shares outstanding, diluted | 29,985,632 | 19,960,150 | 36,682,582 | 19,872,184 | 35,126,357 | 29,696,897 | ||||||||||||||||||
| STATEMENT OF FINANCIAL CONDITION: | ||||||||||||||||
| December 31 | June 30 | |||||||||||||||
| 2010 | 2009 | 2011 | 2010 | |||||||||||||
| as restated | as restated | |||||||||||||||
| Working capital | (2,861,488 | ) | (2,265,370 | ) | (1,846,593 | ) | (3,028,616 | ) | ||||||||
| Total assets | 1,970,573 | 1,620,746 | 2,972,862 | 2,070,061 | ||||||||||||
| Total long-term notes payable, related party, less current installments | — | 300,000 | — | — | ||||||||||||
| Total shareholders’ deficit | (6,722,092 | ) | (7,256,058 | ) | (6,323,185 | ) | (3,094,998 | ) | ||||||||
| December 31 | September 30 | |||||||||||||||
| 2010 | 2009 | 2011 | 2010 | |||||||||||||
| as restated | as restated | |||||||||||||||
Working capital | $ | (2,861,488 | ) | $ | (2,265,370 | ) | $ | (2,532,426 | ) | $ | (3,390,029 | ) | ||||
Total assets | $ | 1,970,573 | $ | 1,620,746 | $ | 2,699,838 | $ | 1,719,517 | ||||||||
Total long-term notes payable, related party, less current installments | $ | — | $ | 300,000 | $ | — | $ | — | ||||||||
Total shareholders’ deficit | $ | (6,722,092 | ) | $ | (7,256,058 | ) | $ | (6,097,657 | ) | $ | (8,289,424 | ) | ||||
RISK FACTORS
You should carefully consider the risks described below before making an investment decision. Our business, financial condition, results of operations or cash flows could be materially adversely affected by any of the events or circumstances described in these risk factors. The valuation for the Company could also decline due to any of the events or circumstances, and you may lose all or part of your investment. This document also contains forward-looking statements that involve risks and uncertainties. Our actual results could differ materially from those anticipated in these forward-looking statements as a result of several factors, including the risks faced by us described below and elsewhere in this prospectus. In assessing these risks, you should also refer to the other information contained in this prospectus, including our financial statements and related notes.
Risks Related to Our Business
Our independent registered public accounting firm has issued an unqualified opinion with an explanatory paragraph to the effect that there is substantial doubt about our ability to continue as a going concern.
Our independent registered public accounting firm has issued an unqualified opinion with an explanatory paragraph to the effect that there is substantial doubt about our ability to continue as a going concern. This unqualified opinion with an explanatory paragraph could have a material adverse effect on our business, financial condition, results of operations and cash flows. See “Management’s Discussion and Analysis of Financial Condition and Results of Operations - Liquidity and Capital Resources” and Footnotes to our financial statements for the fiscal year ended December 31, 2010, included elsewhere in this prospectus.
We have no committed sources of capital and do not know whether additional financing will be available when needed on terms that are acceptable, if at all. This going concern statement from our independent registered public accounting firm may discourage some investors from purchasing our stock or providing alternative capital financing. The failure to satisfy our capital requirements will adversely affect our business, financial condition, results of operations and prospects.
Unless we raise additional funds, either through the sale of our securities or one or more collaborative arrangements, we will not have sufficient funds to continue operations. Even if we take these actions, they may be insufficient, particularly if our costs are higher than projected or unforeseen expenses arise.
We intend to use proceeds from the offering to repay secured and unsecured convertible promissory notes in the aggregate principal amount of $2,500,000. However, if we do not complete the offering or the proceeds of the offering are insufficient to repay the notes in full, we may be unable to convert, repay or secure an extension of these notes. If we do not complete the offering or the proceeds of the offering are insufficient to repay the notes in full , and if we are unable to reach an agreement with our note holders regarding conversion, repayment and/or extension of the maturity date of these notes, the note holders could foreclose on our assets, which ultimately could require us to curtail or cease our operations and could ultimately result in the loss of our patent and patent applications.
We intend to use proceeds from the offering to repay secured and unsecured convertible promissory notes in the aggregate principal amount of $2,500,000. However, if we do not complete the offering or the proceeds of the offering are insufficient to repay the notes in full, we may be unable to convert, repay or secure an extension of these notes. Apart from proceeds from the contemplated offering, we do not currently have, and do not expect to attain, adequate funds for repayment of the above-mentioned notes from our current operations. Although we intend to continue to finance our operations, including the repayment of these notes, primarily through private sales of debt and equity securities, we may not be able to secure additional financing to repay the notes on acceptable terms, if at all. Further, our outstanding secured $1.5 million convertible promissory note and the $1.0 million unsecured convertible promissory note contain limitations on the amount of debt we can incur prior to repayment of these notes. Hence, absent completion of the contemplated offering, unless the note holders waiveholder waives the debt limit we may not be able to avail ourselves of sufficient financing should it be available. Further, the unsecured promissory note and the secured convertible promissory note provide for conversion of the principal and interest into shares of our common stock, upon certain conditions and subject to certain limitations. Any conversion of either of these notes could substantially dilute existing shareholders. Absent completion of the contemplated offering, if we are unable to secure additional financing to repay the notes we will seek to renegotiate the notes. However, there is no guarantee that the note holders will accept any offer we may make and may request additional concessions from us for any accommodation we do secure. Any terms we may be able to secure may not be favorable to us. Unfavorable terms would adversely impact our business, financial condition and/or results of operations. In the event we are unable to secure such additional financing sufficient to pay the notes prior to their respective maturity dates and we are not able to renegotiate the terms of the note, the note holders will have the option to either convert the principal and interest into shares of our common stock or foreclose on the notes, which would have material adverse consequences on our business operations, financial condition, results of operations and cash flows and possibly result in the loss of all of our patent rights and the failure of our business.
If we do not repay or convert the principal and interest on the above mentioned $1.5 million 10% interest secured convertible note when due, we may lose all our patents and patent applications.
If we do not repay the $1,500,000 10% secured convertible note currently outstanding when due we could suffer the loss of our patents and patent applications, which secure our payment obligations under this note. Our success depends, to a significant extent, on the technology that is incorporated in our product and the underlying patents and patent applications securing this note. We intend to continue to finance our operations, including the repayment of this note, primarily through sales of debt and equity securities. If the contemplated offering is not completed or the proceeds of the offering are not sufficient to repay this note in full, we will have to seek alternative financing and may not be able to secure such additional financing to repay the note on acceptable terms, if at all. If we are not able to repay this note there is no guarantee that the note holder will accept any offer we may make with regard to extending or converting this note. Further, the note holder may request additional concessions from us in return for extending or converting the note. Any re-negotiated terms we may be able to secure may not be favorable to us. Unfavorable terms, in either a financing transaction or debt renegotiation, would adversely impact our business, financial condition and/or results of operations. In the event (i) the contemplated offering is not completed or the proceeds of the offering are not sufficient to repay this note in full and we are unable to secure additional financing sufficient to pay this note, (ii) this note is not converted into shares of our common stock, or (iii) we are not able to renegotiate the terms of this convertible note, the note holder will have the option to foreclose on all of our patents and patent applications securing the notes, which would likely result in the failure of our business.
We have a history of operating losses, and we expect our operating losses to continue for the foreseeable future. If we fail to obtain additional financing we will be unable to execute our business plan and/or we may not be able to continue as a going concern.
We have incurred substantial losses since we were funded in 1993 and have not achieved profitability in any year to date. We have developed a family of nano-structured polymers and processes and are now marketing our first product application, ConsERV™. We anticipate the other listed applications in this document may take at least 612 to 4836 months to develop. We expect our operating losses to continue for the foreseeable future as we continue to expend substantial resources to expand the ConsERV™ business while working to bring the identified applications to the market including research and development, design and testing, obtaining third party validations, identifying and securing collaborative partnerships, executing to enter into strategic relationships, or selling materials or value-added components. Furthermore, even if we achieve our projection of selling a greater number of ConsERV™ units in 2011,201 2 , we anticipate that we will continue to incur losses until we can cost-effectively produce and sell our products to a wider market. Our accumulated deficit was $38,128,522$39,023,814 as of JuneSeptember 30, , 2011. It is possible that we will never generate sufficient revenue to achieve and sustain profitability. Even if we achieve profitability, we may not be able to sustain or increase profitability.
We financed our operations since inception primarily through private sales of our common stock and preferred stock, issuance of convertible promissory notes; issuance of unsecured promissory notes, cash received in connection with exercise of warrants, license fees and the sale of certain fuel cell assets in 2002. As of JuneSeptember 30, , 2011, we had $2,746,359$2,421,820 in current assets.
Even if we are successful in raising additional equity capital to fund our operations, we will still be required to raise an additional substantial amount of capital in the future to fund our development initiatives and to achieve profitability. Our ability to fund our future operating requirements will depend on many factors, including the following:
| · | ability to obtain funding from third parties; |
| · | progress on research and development programs; |
| · | time and cost required to gain third party approvals; |
| · | cost of manufacturing, marketing and distributing our products; |
| · | cost of filing, prosecuting and enforcing patents, patent applications, patent claims and trademarks; |
| · | status of competing products; and |
| · | market acceptance and third-party reimbursement of our products, if successfully developed. |
There are no assurances that future funding will be available on favorable terms or at all. If additional funding is not obtained, we will need to reduce, defer or cancel development programs and planned initiatives, to the extent necessary. The failure to fund our capital requirements would have a material adverse effect on our business, financial condition and results of operations.
12
Failure to achieve and maintain effective internal controls in accordance with Section 404 of the Sarbanes-Oxley Act of 2002 could have a material adverse effect on our business and operating results. In addition, current and potential stockholders could lose confidence in our financial reporting, which could have a material adverse effect on our stock price.
Effective internal controls are necessary for us to provide reliable financial reports and effectively prevent fraud. If we cannot provide reliable financial reports or prevent fraud, our operating results could be harmed. We are required to document and test our internal control procedures in order to satisfy the requirements of Section 404 of the Sarbanes-Oxley Act, which requires annual management assessments of the effectiveness of our internal controls over financial reporting. During the course of our testing, we may identify deficiencies which we may not be able to remediate in time for compliance with the requirements of Section 404. In addition, if we fail to maintain the adequacy of our internal controls, as such standards are modified, supplemented or amended from time to time; we may not be able to ensure that we can conclude on an ongoing basis that we have effective internal controls over financial reporting in accordance with Section 404 of the Sarbanes-Oxley Act. Failure to achieve and maintain an effective internal control environment could also cause investors to lose confidence in our reported financial information, which could have a material adverse effect on our stock price.
Our CEO and CFO identified a material weakness in our internal controls over financial reporting relating to the accounting and disclosure for complex and non-standard common stock warrant transactions, which required us to restate our financial statements for the year ended December 31, 2009 as provided herein. To address our material weakness related to the accounting and disclosure for complex financial instruments, we have enhanced our internal control processes in order to be able to comprehensively review the accounting and disclosure implications of such transactions on a timely basis.
We cannot provide assurance as to the result of these efforts. We cannot be certain that any measures we take will ensure that we implement and maintain adequate internal controls in the future. Any failure to implement required new or improved controls, or difficulties encountered in their implementation, could harm our operating results or cause us to fail to meet our reporting obligations.
In the event the lease on our corporate office and production space is terminated, we may not be able to acquire a lease on another suitable property, or a lease on a suitable property at a comparable cost.
Ethos Business Ventures, LLC is our landlord. Our CEO, Mr. Tangredi, is a principal owner of this entity. We note that under the terms of our lease agreement for our corporate office and production space, the lease may be terminated upon 30 days prior written notice by landlord and 90 days prior written notice by us. If this lease is terminated, or if for any reason Mr. Tangredi should become unable to continue to lease this space to us, we may not be able to acquire another lease for another suitable property or a lease on a suitable property at a comparable cost in a timely manner, which could materially disrupt our operations. Even if we are able to relocate into another suitable property at a comparable cost in a timely manner, we would incur significant moving expenses.
Our future indebtedness could adversely affect our financial health.
We have and may continue to incur a significant amount of indebtedness to finance our operations and growth. Any such indebtedness could result in negative consequences to us, including:
increasing our vulnerability to general adverse economic and industry conditions;
requiring a portion of our cash flow from operations be used for the payment of interest on our debt, thereby reducing our ability to use our cash flow to fund working capital, capital expenditures and general corporate requirements;
limiting our ability to obtain additional financing to fund future working capital, capital expenditures and general corporate requirements;
limiting our flexibility in planning for, or reacting to, changes in our business;
placing us at a competitive disadvantage to competitors who have less indebtedness; and
as the majority of our assets are pledged under a significant portion of our outstanding debt, the failure to meet the terms and conditions of the debt instruments, or a failure to timely rearrange the current terms and conditions of the notes, if so required, will result in us having no access to our technology.
The recent economic downturn has affected, and is likely to continue to adversely affect, our operations and financial condition potentially impacting our ability to continue as a going concern.
The recent economic downturn has resulted in a reduction in new construction and less than favorable credit markets, both of which may adversely affect us. Certain vendors from which we currently secure parts for our ConsERV™ product have and may continue to either reduce or eliminate payment terms. Hence, more capital is required to secure parts necessary to produce our products. In addition, our products are often incorporated in new construction which has experienced a marked down turn in project starts over the past year and such trend is expected for 2011.2012. Although the portion of new construction most affected is home sales, which represents a minority of our sales, commercial construction has also experienced a reduction in starts with some projects being delayed and possibly eliminated. If the commercial construction market stagnates or decreases in volume or project size, our operations and financial condition could be negatively impacted. Various economic stimulus measures by the federal and state governments appear to have targeted energy products. ConsERV™ may qualify under said programs and we may potentially benefit. However, when and if we will experience any increase in sales or investment due to these programs is uncertain. As noted above, we intend to continue to finance operations, including the repayment of all outstanding debt, such as the secured convertible note and unsecured promissory note, primarily through private sales of debt and equity securities. In light of the recent economic downturn we may not be able to secure additional financing on acceptable terms, if at all. Unfavorable terms for a financing transaction would adversely impact our business, financial condition and/or results of operations. In the event we are unable to secure additional financing our business may fail.
If we fail to successfully address the challenges, risks and uncertainties associated with operating as a public company, our business, results of operations and financial condition would be materially harmed.
We have and will continue to incur a significant increase in costs as a result of operating as a public company, and our management has and will be required to devote substantial time to new compliance initiatives. Until November of 2008 we had never operated as a public company. In preparation for and since reporting as a public company, we have and expect to continue to incur significant legal, accounting and other expenses that we did not incur as a non-reporting company. In addition, the Sarbanes-Oxley Act of 2002 (the “Sarbanes-Oxley Act”), as well as new rules subsequently implemented by the Securities and Exchange Commission (the “SEC”) and various stock exchanges, has imposed many new requirements on public companies, including requiring changes in corporate governance practices. Our management and other personnel have and will continue to devote a substantial amount of time to these new compliance procedures.
As a public company, we are now subject to the reporting requirements of the Securities and Exchange Act of 1934, as amended (the “Exchange Act”), the Sarbanes-Oxley Act and the rules promulgated by the SEC and AMEX, if and when accepted, in response to the Sarbanes-Oxley Act. The Exchange Act requires, among other things, that we file annual, quarterly and current reports with respect to our business and financial condition. The Sarbanes-Oxley Act requires, among other things, that we maintain effective disclosure controls and procedures and internal controls for financial reporting.
If we or our independent registered public accounting firm identifies deficiencies in our internal controls that are deemed to be material weaknesses, the market price of our stock could decline and we could be subject to sanctions or investigations by SEC or other regulatory authorities, which would entail expenditure of additional financial and management resources.
These rules and regulations could also make it more difficult for us to attract and retain qualified independent members of our Board of Directors. Additionally, we have found these rules and regulations make it more difficult and more expensive for us to obtain director and officer liability insurance. We have, and may be required once again, to accept reduced policy limits and/or coverage or incur substantially higher costs to obtain the same or similar coverage.
Our ConsERV™ product is in small volume production, we have no long term experience manufacturing our products on a commercial basis and may not be able to achieve cost effective large volume production.
Our ConsERV™ product is built in growing volumes. Our ability to expand commercial production of that product is subject to significant uncertainties, including: completion of necessary product automation, developing experience in manufacturing and assembly on a large commercial scale; assuring the availability of raw materials and key component parts from third party suppliers; and developing effective means of marketing and selling our product.
We are in the process of assembling our ConsERV™ product at our facility in Odessa, Florida with overflow being produced by outsourced firms, which limits our capital outlay. Initial production costs of this product line are high with no or a lower than desired profit margin. As a result, we believe we will need to reduce unit production costs, including the nano-structured materials themselves made to our specifications by third parties, over time in order to offer our products at a profitable basis on a commercial scale. Our ability to achieve cost reductions in all areas of nano-structured materials and value added products depends on entering into suitable manufacturing relationships with component suppliers, as well as increasing sales volumes so that we can achieve economies of scale. A failure to achieve a lower cost structure through economies of scale and improvements in engineering and manufacturing in a timely manner would have a material adverse effect on our business and financial results. There can be no assurance that we will obtain higher production levels or that the anticipated sales prices of our products will ever allow an adequate profit margin.
We may not be able to meet our product development and commercialization milestones.
We have established internal product and commercialization milestones and dates for achieving development goals related to technology and design improvements of our products. To achieve these milestones we must complete substantial additional research, development and testing of our products and technologies. Except for our ConsERV™ product, we anticipate that it will take at least 612 to 36 months to develop and ready our other products for scaled production. Product development and testing are subject to unanticipated and significant delays, expenses and technical or other problems. We cannot guarantee that we will successfully achieve our milestones. Our business strategy depends on acceptance of our products by key market participants and end-users.
Our plans and ability to achieve profitability depend on acceptance by key market participants, such as vendors and marketing partners, and potential end-users of our products. We continue to educate designers and manufacturers of HVAC equipment with respect to our ConsERV™ product. More generally, the commercialization of our products may also be adversely affected by many factors that are out of our control, including:
willingness of market participants to try a new product and the perceptions of these market participants of the safety, reliability and functionality of our products;
emergence of newer, possibly more effective technologies;
future cost and availability of the raw materials and components needed to manufacture and use our products;
cost competitiveness of our products; and
adoption of new regulatory or industry standards which may adversely affect the use or cost of our products.
Accordingly, we cannot predict with any certainty that there will be acceptance of our products on a scale sufficient to support development of mass markets for those products.
We are dependent on third party suppliers and vendors for the supply of key components for our products.
We are dependent on third parties to manufacture the key components needed for our nano-structured based materials and value added products made with these materials. Accordingly, a supplier’s failure to supply components in a timely manner, or to supply components that meet our quality, quantity and cost requirements, technical specifications, or the inability to obtain alternative sources of these components on a timely basis or on terms acceptable to us, would create delays in production of our products or increase unit costs of production. Certain of the components contain proprietary products of our suppliers, or the processes used by our suppliers to manufacture these components are proprietary. If we are required to replace any of our suppliers, while we should be able to obtain comparable components from alternative suppliers at comparable costs, this would create a delay in production. If we experience such delays or our third party suppliers and vendors fail to supply us with components that meet our quality, quantity, or cost standards, we may lose our customers or be subject to product liability claims. Our applications require extensive commercial testing and will take long periods of time to commercialize.
Our nano-structured materials and associated applications need to undergo extensive testing before becoming commercial products. Consequently, the commercialization of our products could be delayed significantly or rendered impractical. Moreover, much of the commercial process testing will be dependent on the efforts of others. Any failure in a manufacturing step or an assembly process may render a given application or our nano-structured materials unsuitable or impractical for commercialization. Testing and required development of the manufacturing process will require the expenditure of funds and take time and effort.
We have not devoted any significant resources towards the marketing and sale of our products, we expect to face intense competition in the markets in which we do business, and have and expect to continue to rely, to a significant extent, on the marketing and sales efforts of third parties that we do not control.
To date, we primarily focused on the sale of ConsERV™ products and, while we have sold increasing quantities of our products on a yearly basis, even by adding staff experienced in the industry we continue to experience a learning curve in the marketing and sale of products on a commercial basis. We expect that the marketing and sale of the ConsERV product will continue to be conducted by a combination of independent manufactures representatives, third-party strategic partners, distributors, or OEMs. Consequently, commercial success of our products will depend to a great extent on the efforts of others. We have and intend to continue to enter into additional strategic marketing and distribution agreements or other collaborative relationships to market and sell our nano-structured materials and value added product.product s . However, we may not have identified or established appropriate relationships or be able to identify or establish appropriate relationships in the future. Even ifTo the extent we have or will in the future enter into these types of relationships, we cannot assure you that the distributors or OEMs with which we have or will form relationships will focus adequate resources on selling our products or will be successful in selling them. In addition, our chosen third-party distributors or OEMs have or may require us to provide volume price discounts and other allowances, customize our products or provide other concessions which could reduce the potential profitability of these relationships. To the extent any strategic relationships that we have or may establish in the future are exclusive, we may not be able to enter into other arrangements at a time when the distributor or OEM with which we have form ed or will form a relationship is not successful in selling our products or has reduced its commitment to marketing our products. Failure to develop sufficient distribution and marketing relationships in our target markets will adversely affect our commercialization schedule and to the extent we have enter ed or enter into such relationships, the failure of our distributors and other third parties in assistingto assist us with the marketing and distribution of our products or to meet their monetary obligations to us, may adversely affect our financial condition and results of operations.
We will face intense competition in the markets of our product applications for our nano-structured materials and value-added products. We will compete directly with currently available products, some of which may be less expensive. The companies that make these other products may have established sales relationships and more name-brand recognition in the market than we do. In addition, some of those companies may have significantly greater financial, marketing, manufacturing and other resources.
16
Our future results could be harmed by economic, political, regulatory and other risks associated with international sales and operations.
We intend to market, distribute and service our products on an international basis and expect to derive a significant portion of our revenue in coming years from international sales. If we fail to successfully sell our products internationally, our ability to increase our future revenue and grow our business would be impaired. We have limited experience developing, and no experience manufacturing, our products to comply with the commercial, regulatory and legal requirements of international markets. Our success in those markets will depend on our ability to secure relationships with foreign resellers and our ability to manufacture products that meet foreign regulatory and commercial requirements. In addition, our planned international operations could be harmed by a variety of factors, including but not limited to:
increased costs associated with maintaining international marketing efforts;
compliance with potential United States Department of Commerce export controls;
increases in duty rates or other adverse changes in tax laws;
trade protection measures and import or export licensing requirements;
fluctuations in currency exchange rates;
political and economic instability in foreign countries; and
difficulties in securing and enforcing intellectual property rights, foreign (where filed and obtained) or domestic, and time and complexities of vetting and establishing relations with foreign resellers or licensees including but not limited to designing, validating and marketing a product geared specifically to a particular market segment.
We depend on our intellectual property and failure to protect it could enable competitors to market products with similar features that may reduce demand for our products.
We currently have eight United States patents, nine patent applications and co-own six patent applications, some of which apply to the composition and structure of a family of ion conducting polymers and membranes. These patents and patent applications often make reference to applications for, and in some instances, are application patents relating to materials we are developing. Our patent applications may or may not mature into issued patents.
Our success depends, to a significant extent, on the technology that is incorporated in our product. Although some of the inventions which we have obtained or applied for patent protection are no longer suitable for use with our planned products, we believe that some of the other inventions covered by the patents and patent applications are important to the success of our products. If we are unable to protect our intellectual property, competitors could use our intellectual property to market products similar to our products, which could reduce demand for our products. We may be unable to prevent unauthorized parties from attempting to copy or otherwise obtain and use our products or technology. Policing unauthorized use of our technology is difficult, and we may not be able to prevent misappropriation of our technology, particularly in foreign countries where the laws may not protect our intellectual property as fully as those in the United States. Others may circumvent trade secrets, trademarks and copyrights that we own or may own. Any such infringements, or any alleged infringements, could have a material adverse effect on our business, results of operations, and financial condition.
17
Any of the United States patents or foreign patents owned by us or subsequently issued to us may be invalidated, circumvented, challenged or rendered unenforceable. We may not be issued any patents as a result of our pending and future patent applications and any patents we are issued may not have the claim coverage sought by us or necessary to prevent others from introducing similar products. Any litigation surrounding our patent rights could force us to divert significant financial and other important resources away from our business operations.
Some of our intellectual property is not covered by any patent or patent application. We seek to protect this proprietary intellectual property, which includes intellectual property that may not be patented or patentable, in part by confidentiality agreements with our distributors and employees. These agreements afford only limited protection and may not provide us with adequate remedies for any breach or prevent other persons or institutions from asserting rights to intellectual property arising out of these relationships. In addition, we cannot assure you that these agreements will not be breached, that we will have adequate remedies for any such breach or that the parties to such agreements will not assert rights to intellectual property arising out of these relationships.
Members of any scientific advisory board we had in the past or may have in the future have been or may be employed by entities other than us, some of which may compete with us. While we intend to enter into non-competition agreements with our scientific advisors, if any of them were to consult with or become employed by any of our competitors, our business could be negatively affected.
We have entered into agreements with various third parties that may affect our intellectual property rights.
We have entered into agreements with various third parties in connection with the development of various applications for our technology. In some instances such agreements provide that a third party will own any resulting intellectual property rights and for the grant of a license to us relating to those rights. We cannot assure you that the terms of any such licenses will not limit our ability to apply such rights to specific applications in competition with the relevant third party, which may adversely affect our business.
Our products employ technology that may unknowingly infringe on the proprietary rights of others, and, as a result, we could become liable for significant damages and suffer other harm.
We cannot assure you that our technologies and products do not or will not infringe on the proprietary rights of third parties or that third parties will not assert infringement claims against us in the future. We are aware of some patents in the nano-materials field held by potential competitors and other third parties. We cannot assure you that a third party will not claim infringement by us with respect to these patents, other patents or proprietary rights, or that we would prevail in any such proceeding. Any such infringement claim, whether meritorious or not, could:
be time-consuming;
result in costly litigation or arbitration and the diversion of technical and management personnel, as well as the diversion of financial resources from business operations;
require us to develop non-infringing technology or seek to enter into royalty or licensing agreements; or
require us to cease use of any infringing technology.
We may not be successful in developing non-infringing technologies. Royalty or licensing agreements, if required, may not be available on terms acceptable to us, or at all, and could significantly harm our business and operating results. A successful claim of infringement arising from the existence of a ‘submarine patent’ or another existing patent against us or our failure or inability to license the infringed or similar technology could require us to pay substantial damages and could harm our business. In addition, to the extent we agree to indemnify customers or other third parties against infringement of the intellectual property rights of others, a claim of infringement could disrupt or terminate their ability to use, market or sell our products and we may be liable for the related losses that may incur.
18
We may not be able to control our warranty exposure, which could increase our expenses.
We currently offer and expect to continue to offer a warranty with respect to our ConsERV™ product and we expect to offer a warranty with each of our future product applications. If the cost of warranty claims exceeds any reserves we may establish for such claims, our results of operations and financial condition could be adversely affected.
We may be exposed to lawsuits and other claims if our products malfunction, which could increase our expenses, harm our reputation and prevent us from growing our business.
Any liability for damages resulting from malfunctions of our products could be substantial, increase our expenses and prevent us from growing or continuing our business. Potential customers may rely on our products for critical needs, such as backup power. A malfunction of our products could result in warranty claims or other product liability. In addition, a well-publicized actual or perceived problem could adversely affect the market’s perception of our products. This could result in a decline in demand for our products, which would reduce revenue and harm our business. Further, since our products are used in devices that are manufactured by other manufacturers, we may be subject to product liability claims even if our products do not malfunction.
Our key employees are critical to our success and the loss of any key employees could impair our ability to execute our strategy and grow our business.
Our future success depends, to a significant extent, on the continued service of our executive officers and other key technical, sales and senior management personnel and their ability to execute our growth strategy. All of our personnel have non-compete agreements with us however such agreements may not withstand court review if litigation were to occur. The loss of the services of any of our senior level management or other key employees could harm our business. Our future performance will depend, in part, on our ability to retain management personnel and for our executive officers to work together effectively. Our executive officers may not be successful in carrying out their duties or running our business. Any dissent among executive officers could impair our ability to make strategic decisions.
We have, when required, reduced the salaries of our employees. Such salary reductions may have an adverse effect on our ability to retain key employees.
If we fail to attract, retain and motivate qualified employees, we may be unable to execute our business strategy.
Our future success will depend in part on our ability to attract and retain highly qualified individuals, including researchers, engineers, sales and marketing personnel and management. Competition for these individuals may become intense, and it may become increasingly difficult to attract, assimilate and retain these highly qualified persons. Competitors and others may attempt to recruit our employees. Should we experience attrition or need to augment our staff, the cost of securing personnel may be significantly higher than currently experienced and thus negatively impact our financial position.
Our failure to manage our growth could harm our business.
We may grow in the number of our employees, the size of our physical facilities and the scope of our operations. In addition, we intend to focus greater resource on ConsERV™ margins, sales/marketing activities and channel expansion, and marketplace education. Any expansion would likely place a significant strain on our senior management team and other internal and external resources. Furthermore, we may be required to hire additional senior management personnel. Our ability to manage growth will depend in part on our ability to continue to enhance our operating, financial and management information systems. Our personnel, systems and controls may be unable to support any growth we may experience and as a result, our financial results would suffer.
Any acquisitions we make could disrupt our business and harm our financial condition.
As part of our growth strategy we may review opportunities to acquire other businesses or technologies that would complement our products, expand the breadth of our target markets or enhance our technical capabilities. Acquisitions entail a number of risks that could materially and adversely affect our business and operating results, including but not limited to:
problems integrating the acquired operations, technologies or products with our existing businesses and products;
constraints arising from increased expenses and working capital requirements;
constraints on our ability to incur debt;
dilution of our stock if we issue additional securities;
disruption of our ongoing business, diversion of capital and distraction of our management;
difficulties in retaining business relationships with suppliers and customers of acquired companies;
difficulties in coordinating and integrating overall business strategies, sales, marketing, research and development efforts;
potential liabilities in businesses and facilities acquired;
difficulties in maintaining corporate cultures, controls, procedures and policies;
difficulties evaluating risks associated with entering markets in which we lack prior experience; and
potential loss of key employees.
Our revenue and operating results may fluctuate significantly as a result of factors outside of our control, which could cause the value of our business to decline.
Unless and until we establish a predictable sales record for our products, we expect our revenue and operating results to vary significantly from quarter to quarter. As a result, quarterly comparisons of our financial results are not necessarily meaningful and you should not rely on them as an indication, in any manner, of our future performance. In addition, due to our stage of development, we cannot predict our future revenue or results of operations accurately. As a consequence, our operating results may fall below the expectations of investors, which could cause the valuation of our company to decline.
We expect to make significant investments in all areas of our business, particularly in research and product development and in expanding in-house or outsourced manufacturing capability. Because the investments associated with these activities are relatively fixed in the short-term, we may be unable to adjust our spending quickly enough to offset any unexpected shortfall in our revenue growth. In addition, because we are in the early stages of commercializing the ConsERV™ application and anticipate that it will take at least an additional 12 to 36 months to develop our other products for commercial sales, we expect our order flow to be uneven from period to period.
Risks Related to Our Industry
If our products fail to meet certain technical standards, we could be subject to claims, fines or other penalties and we may be curtailed from conducting our business operations.
Our nano-structured membrane products are designed for specific applications with specific technical objectives and standards. If these membranes, or the hardware device(s) used to make the membranes work, fail to meet those technical objectives and/or standards, we could be liable for potential personal injury, loss of life and damages (including consequential damages). Depending on the nature of the claim, our current insurance policies may not adequately reimburse us for costs incurred by reason of said claims, including, but not limited to, environmental damage claims, and in certain instances, we may not be reimbursed at all. Our business may be or become subject to numerous federal, state and local laws, regulations and policies that govern environmental protection. These laws and regulations have changed frequently in the past and may continue to do so in the future. Our operations may not comply with such changes and we may be required to make significant unanticipated capital and operating expenditures to comply with such changes. If we fail to comply with any such applicable environmental laws and regulations, governmental authorities may seek to impose fines or other penalties on us or to revoke or deny the issuance or renewal of certain permits issued to us. Accordingly, we might be subject to damage claims or penalties, and we may be curtailed from conducting our business operations.
We could become liable for environmental damages resulting from our research, development and manufacturing operations.
Our business may expose us to the potential risk of harmful substances escaping into the environment, resulting in potential personal injury or loss of life, damage to or destruction of property, and natural resource damage. Depending on the nature of the claim, our current insurance policies may not adequately reimburse us for costs incurred in settling environmental damage claims, and in certain instances, we may not be reimbursed at all.
Future government regulation may impair our ability to market and sell our products.
Our current and planned products are potentially subject to federal, state, local and foreign laws and regulations governing, among other things, emissions to air as well as laws relating to occupational health and safety. As these products are introduced commercially, it is possible that governmental authorities will adopt new regulations that will limit or curtail our ability to market and sell such products. We may also incur substantial costs or liabilities in complying with such new governmental regulations. Our potential customers and distributors, some of which operate in highly regulated industries, may also be required to comply with new laws and regulations applicable to products such as ours, which could adversely affect their interest in our products.
Alternatives to our technology could render our systems obsolete prior to commercialization.
Our nano-structured materials and their identified uses are one of a number of products being developed today as potential answers to perceived market needs such as additional water sources, energy and emissions savings with regard to HVAC operation, alternative energy storage and “clean” power sources. Improvements are also being made to existing products. Technological advances in all fields and improvements in key targeted application areas with existing or different new technology may render our nano-structured material approach obsolete before or during commercialization.
Risks Related to This Offering and an Investment in Our Securities
Our common stock has traded only sporadically and is expected to experience significant price and volume volatility in the future which substantially increases the risk of loss to persons owning our common stock.
We cannot predict the extent to which an active public market for our common stock will develop or be sustained . We have applied for listing of our common stock on AMEX, but no assurance can be given that our application will be approved. If the application is not approved, we will not complete this offering, and the shares of our common stock will continue to be traded on the OTC Bulletin Board.sustained.
Our common stock has been quoted on OTC Market Group Inc.'s OTC Pink Market since November 15, 2005 and the Over the Counter Bulletin Board since November 24, 2008. The market price of our common stock has been and will likely continue to be subject to fluctuations. In addition, the stock market in general and the market for technology companies in particular, have from time to time experienced significant price and volume fluctuations that have been often unrelated or disproportionate to the operating performance of such companies. These broad market and industry factors may cause our common stock to materially decline, regardless of our operating performance. Because of the limited trading market for our common stock, meaning that the number of persons interested in purchasing our common shares at or near bid prices at any given time may be relatively small or non-existent, and the possible price volatility given our status as a relatively small company with a small and thinly traded “float”, you may not be able to sell your shares of common stock when you desire to do so. The inability to sell your shares in a rapidly declining market may substantially increase your risk of loss because of such illiquidity and because the price for our common stock may suffer greater declines because of its price volatility.
Volatility in our common share price may subject us to securities litigation.
The market for our common stock is characterized by significant price volatility, and we expect that our share price will continue to be volatile for the indefinite future. In the past, following periods of volatility in the stock market and the market price of a particular company’s securities, securities litigation has often been instituted against that company. Litigation of this type could result in substantial legal fees and other costs, potential liabilities and a diversion of management’s attention and resources.
We have not and do not intend to pay dividends on our common stock.
The payment of dividends upon our capital stock is solely within the discretion of our board of directors and dependent upon our financial condition, results of operations, capital requirements, restrictions contained in our future financing instruments and any other factors our board of directors may deem relevant. We have never declared or paid a dividend on our common stock and, because we have very limited resources, we do not anticipate declaring or paying any dividends on our common stock in the foreseeable future. Rather, we intend to retain any future earnings for the continued operation and expansion of our business. It is unlikely, therefore, that the holders of our common stock will have an opportunity to profit from anything other than potential appreciation in the value of our common shares held by them.
Our executive officers and directors have significant shareholdings, which may lead to conflicts with other shareholders over corporate governance matters.
As of September 12, 2011,February 6 , 2012, our directors and officers, as a group, beneficially own approximately 31.9%31.8% of our outstanding common stock, including shares of common stock issuable upon exercise of warrants and options they hold. Acting together, these shareholders would be able to significantly influence all matters that our shareholders vote upon, including the election of directors, mergers or other business combinations.
Unless an active trading market develops for our securities, shareholders may have difficulty or be unable to sell their shares of common stock.
We cannot predict the extent to which an active public market for our common stock will develop or be sustained. It is a condition to the closing of this offering that we be listed on the AMEX but we cannot assure you that we will be able to meet the requirements for continued listing going forward.
Our common stock is currently quoted on the OTC Bulletin Board under the symbol “DLYT.” However, currently there is not an active trading market for our common stock, meaning that the number of persons interested in purchasing shares of our common stock at or near ask prices at any given time may be relatively small or non-existent, and there can be no assurance that an active trading market may ever develop or, if developed, that it will be maintained. There are a number of factors that contribute to this situation, including, without limitation, the fact that we are a small development-stage company that is relatively unknown to stock analysts, stock brokers, institutional investors and others in the investment community that generate or influence sales volume, and even if we came to the attention of such persons, they tend to be risk-averse and would be reluctant to follow an unproven, development-stage company such as ours or purchase or recommend the purchase of shares of our common stock until such time we become more seasoned and viable.
As a consequence, our stock may be characterized by a lack of liquidity, sporadic trading, larger spreads between bid and ask quotations, and other conditions that may affect shareholders’ ability to re-sell our securities. Moreover, there may be periods of several days or more when trading activity in our shares is minimal or non-existent, as compared to a seasoned issuer which has a large and steady volume of trading activity that will generally support continuous sales without an adverse effect on share price. Unless an active trading market for our common stock is developed and maintained, shareholders may be unable to sell their common stock and any attempted sale of such shares may have the effect of lowering the market price of our common stock and a shareholder’s investment could be a partial or complete loss.
Since our common stock is thinly traded, it is more susceptible to extreme rises or declines in price and shareholders may not be able to sell their shares at or above the price paid.
Since our common stock is thinly traded, its trading price is likely to be highly volatile and could be subject to extreme fluctuations in response to various factors, many of which are beyond our control, including:
the trading volume of our shares whether large or small;
the number of securities analysts, market-makers and brokers following our common stock;
new products or services introduced or announced by us or our competitors;
actual or anticipated variations in quarterly operating results;
conditions or trends in our business industries;
announcements by us of significant contracts, acquisitions, strategic partnerships, joint ventures or capital commitments;
additions or departures of key personnel;
sales of our common stock;
general stock market price and volume fluctuations of publicly-quoted, and particularly microcap, companies that tend to have products or services in development or have yet to be tested in the market;
material legal action.
Shareholders, including but not limited to those who hold shares as a result of the exercise or conversion of our convertible securities and warrants, may have difficulty reselling shares of our common stock, either at or above the price paid, or even at fair market value. The stock markets often experience significant price and volume changes that are not related to the operating performance of individual companies, and because our common stock is thinly traded it is particularly susceptible to such changes. These broad market changes may cause the market price of our common stock to decline regardless of how well we perform as a company. Price fluctuations in such shares are particularly volatile and subject to manipulation by market-makers, short-sellers and option traders.
Our common stock is currently and may in the future be subject to the “penny stock” regulations, which are likely to make it more difficult to sell.
The trading price of our common stock is currently below $5 per share. Following the completion of our 10-for-1 reverse stock split we anticipate that the trading price of our stock will be adjusted by a factor of ten. If at any time the per-share price of our stock trades below $5.00 per share our common stock will beand therefore is currently subject to the “penny stock” rules. We anticipate that after the reverse stock split has been effected and our common stock has been listed on a national exchange we will not be subject to the “penny stock” rules, however there is no guarantee we will continue to meet such listing requirements or share prices. The SEC has adopted rules that regulate broker-dealer practices in connection with transactions in penny stocks. These rules generally have the result of reducing trading in such stocks, restricting the pool of potential investors for such stocks, and making it more difficult for investors to sell their shares once acquired. Prior to a transaction in a penny stock, a broker-dealer is required to:
deliver to a prospective investor a standardized risk disclosure document that provides information about penny stocks and the nature and level of risks in the penny stock market;
provide the prospective investor with current bid and ask quotations for the penny stock;
explain to the prospective investor the compensation of the broker-dealer and its salesperson in the transaction;
provide investors monthly account statements showing the market value of each penny stock held in their account; and
make a special written determination that the penny stock is a suitable investment for the purchaser and receive the purchaser’s written agreement to the transaction.
These requirements may have the effect of reducing the level of trading activity in the secondary market for a stock that is subject to the penny stock rules. Since our common stock is subject to the penny stock rules, investors in our common stock may find it more difficult to sell their shares.
Shares eligible for future sale may adversely affect the market.
From time to time, certain of our stockholders may be eligible to sell all or some of their shares of common stock by means of ordinary brokerage transactions in the open market pursuant to Rule 144, promulgated under the Securities Act, subject to certain limitations. In general, pursuant to Rule 144, non-affiliate stockholders may sell freely after six months subject only to the current public information requirement (which disappears after one year). Affiliates may sell after six months subject to the Rule 144 volume, manner of sale (for equity securities), current public information and notice requirements. Of the 36,834,73537,517,604 shares ( 3,683,474 shares upon giving effect to the anticipated 10-for-1 reverse stock split) of our common stock outstanding as of September 12February 6 , 2011,2012, approximately 28,006,40928,689,278 shares (approximately 2,800,641 shares upon giving effect to the anticipated 10-for-1 reverse split) are held by non-affiliates and are, or will be, freely tradable without restriction, and the remaining shares are held by our affiliates, as of such date. Any substantial sale of our common stock pursuant to Rule 144 or pursuant to any resale prospectus (including sales by investors of securities acquired in connection with this offering) may have a material adverse effect on the market price of our common stock.
As of September 12February 6 , 2011,2012, the Company has issued options, warrants and convertible securities which could result in the issuance of up to 55,729,90854,7 39,267 shares of common stock (approximately 5,572,991 shares upon giving effect to the 10-for-1 reverse stock split) from time to time, consisting of:
| · | 17,402,757 shares under options; |
| · | 26,390,778 shares under warrants; and |
| · | 10,9 45,732 shares under convertible securities. |
Of these securities, a substantial number of the shares are obtainable at exercise and conversion prices at less than the public offering price of shares offered by this prospectus, including by means of cashless exercise provisions. Accordingly, a substantial number of the shares issuable on exercise or conversion of the securities could be sold by the holders of these securities immediately or promptly after the offering. If these shares are issued and available for sale or actually sold in the public market, the market could be adversely impacted and the market price depressed.
You will experience immediate dilution in the book value per share of the common stock you purchase.
Because the price per share of our common stock being offered is substantially higher than the book value per share of our common stock, you will suffer substantial dilution in the net tangible book value of the common stock you purchase in this offering. Based onAssuming all shares offered are sold at an assumed offering price of $4.00$0.3 2 per share, if you purchase shares of common stock in this offering, you will suffer immediate and substantial dilution of $ 2.30$0. 27 per share in the net tangible book value of the common stock at JuneSeptember 30, 2011. See the section entitled “Dilution” below for a more detailed discussion of the dilution you will incur if you purchase common stock in this offering.
A large number of shares may be sold in the market following this offering, which may depress the market price of our common stock.
A large number of shares may be sold in the market following this offering, which may depress the market price of our common stock. Sales of a substantial number of shares of our common stock in the public market following this offering could cause the market price of our common stock to decline. If there are more shares of common stock offered for sale than buyers are willing to purchase, then the market price of our common stock may decline to a market price at which buyers are willing to purchase the offered shares.
Upon completion of this offering and assuming the sale of all 3,750,00033,000,000 shares of our common stock offered pursuant to this prospectus, the issuance of approximately 474,200 shares of common stock for the conversion of the outstanding convertible notes and the issuance of an estimated 166,9712,087,138 shares of common stock to our CEO as partial payment of his accrued salary, , we will have approximately 8,074,64572,604,742 shares of our common stock outstanding after giving effectoutstanding.
There is no minimum amount required to be raised in the anticipated 10-for-1 reverse stock split.offering, and if we cannot raise sufficient funds from this offering, we may not be able to achieve our business objectives.
There is not a minimum amount of shares that need to be sold in this offering for us to access the funds. Therefore, the proceeds of this offering will be immediately available for use by us and we do not have to wait until a minimum number of shares have been sold to keep the proceeds from any sales. We cannot assure you the maximum number of shares offered will be sold, if at all. We have the right to terminate this offering at any time, regardless of the number of securities we have sold since there is no minimum subscription requirement. Our ability to achieve our objectives could be adversely affected if the maximum number of shares offered are not sold in this offering.
DETERMINATION OF OFFERING PRICE
Our common stock is currently quoted on the OTC Bulletin Board, we are applying to have our common stock listed for trading on AMEX which we expect to occur prior to the closing of the offering . Our underwriter, MDB Capital Group LLC, is not obligated to make a market in our securities. Neither we nor the underwriter canBoard. We cannot provide any assurance that an active and liquid trading market in our securities will develop or, if developed, that the market will continue.
The public offering price of the shares offered by this prospectus has been determined by negotiation between us and the underwriter.us. Among the factors we considered in determining the public offering price of the shares were:
our history and our prospects;
the industry in which we operate including industry comparable information;
our past and present operating results;
our outstanding debt, and the value of the various option grants and warrants at the time of pricing;
the previous experience of our executive officers; and
the general condition of the securities markets at the time of this offering.
The offering price stated on the cover page of this prospectus should not be considered an indication of the actual value of the shares. That price is subject to change as a result of market conditions and other factors, and we cannot assure you that the shares can be resold at or above the public offering price.
USE OF PROCEEDS
We estimate the gross proceeds from the sale of 3,750,00033,000,000 shares of common stock, prior to deducting underwriting discounts and commissions to any placement agents we may retain with respect to this offering, and the estimated offering expenses payable by us, will be approximately $15.0$10. 6 million (approximately $17.3 million if the over-allotment option granted to the underwriter is exercised in full)(assuming an estimated offering price of $0.3 2 per share).
However, there is not a minimum number of shares that must be sold in this offering. Therefore, the underwriter exercises its right to purchase an additional 562,500 shares of common stock to cover over-allotments, we will receive an additional $2,025,000, after deducting $225,000 million for underwriting discounts and commissions.
| Application of Net Proceeds | Application of Net Proceeds | |||||||
| Working Capital and General Corporate Purposes | $ | 3,805,000 | 29.0 | % | ||||
Marketing, Research and Development (1) | $ | 7,045,000 | 53.8 | % | ||||
Repayment of Convertible Notes (2) | $ | 1,512,000 | 11.6 | % | ||||
Payment of Employee Accrued Salaries (3) | $ | 358,000 | 2.7 | % | ||||
Payment of CEO Accrued Salary (4) | $ | 380,000 | 2.9 | % | ||||
| Total | 13,100,000 | 100 | % | |||||
In the event we sell the following percent of the total number of shares offered at an assumed offering price of $0.3 2 per share we anticipate using the proceeds (after deducting placement agent commissions, if any, and estimated expenses including all legal, accounting, printing costs and various fees associated with the registration of our shares) as follows:
| IF 25% OF SHARES SOLD | IF 50% OF SHARES SOLD | IF 75% OF SHARES SOLD | IF 100% OF SHARES SOLD | |||||||||||||
| GROSS PROCEEDS FROM THIS OFFERING | $ | 2, 204,600 | $ | 4, 686,2 00 | $ | 7,167,8 00 | $ | 9,649,4 00 | ||||||||
| LESS: OFFERING EXPENSES | ||||||||||||||||
Working Capital and General Corporate Purposes (1) | 572,6 00 | 790,2 00 | 1, 538,8 00 | 1,915,400 | ||||||||||||
| Marketing, Research and Development ( 2 ) | 1,050 ,000 | 2, 045 ,000 | 4,150,000 | |||||||||||||
| Repayment of Secured Convertible Note ( 3 ) | 1,6 32 ,000 | 1,6 32 ,000 | 1,6 32 ,000 | 1,6 32 ,000 | ||||||||||||
| Repayment of Unsecured Convertible Note ( 3 ) | 1,21 4 ,000 | 1,21 4 ,000 | 1,21 4 ,000 | |||||||||||||
| Payment of Employee Accrued Salaries ( 4 ) | 358,000 | 358,000 | ||||||||||||||
| Payment of CEO Accrued Salary (5) | 380,000 | 380,000 | ||||||||||||||
| TOTALS | $ | 2, 204,6 00 | $ | 4,686,2 00 | $ | 7,167,8 00 | $ | 9,649,4 00 | ||||||||
| (1) | Among other expenses, we will use proceeds to conduct a national search to identify and hire a Chief Operating Officer with experience within our industry by the end of the second quarter of 2012 if we are able to identify an appropriate candidate with the requisite qualifications. |
Includes proceeds to be applied to a portion of the estimated marketing, research and development costs relating to the commercialization of our ConsERV™, NanoClear™, NanoAir™ and ultracapacitor applications as discussed in the section of the prospectus titled “Description of Business”. This amount represents a current estimate, and is subject to change depending on various factors discussed below. |
Assumes |
Includes payment in the amount of approximately $348,000 to repay the outstanding accrued salary and expenses of our general counsel, Ms. Patricia Tangredi and approximately $10,000 to repay the outstanding |
We have entered into an agreement with our CEO, Tim Tangredi, that provides that upon |
DESCRIPTION OF BUSINESS
Dais Analytic Corporation is a nano-structure polymer technology materials company that has developed and is commercializing applications using its materials. The first commercial product is called ConsERV™, a fixed plate energy recovery ventilator which we believe is useful in meeting building indoor fresh air requirements while often saving energy and lowering emissions for most forms of Heating, Ventilation and Air Conditioning (HVAC) equipment. We are developing other nano-structure polymer technology applications including (i) “NanoAirTM ”,”, a water based packaged heating and cooling system and (ii) “NanoClearTM ”,”, a water purification process useful in the creation of potable water from salt, brackish or waste water. We further believe that our nano-structure polymer technology may be useful in developing an ultra-capacitor, a device that may be capable of greater energy density and power per pound than traditional capacitors or batteries.
Corporate History
We were incorporated as a New York corporation on April 8, 1993 as Dais Corporation. We subsequently changed our name to Dais Analytic Corporation on December 13, 1999. We were formed to develop new, cost-effective polymer materials for various applications, including providing a lower cost membrane material for Polymer Electrolyte Membrane (PEM) fuel cells. We believe our research on materials science has yielded technological advances in the field of selective ion transport polymer materials.
In December 1999, we purchased the assets of Analytic Power Corporation, which was founded in 1984 to provide fuel cell and fuel processor design and consulting services, systems integration and analysis services to develop integrated fuel cell power systems, and we were re-named Dais Analytic Corporation. Analytic Power Corporation developed a portfolio of fuel cell and related fuel cell component technologies, including fuel cell stack designs, a membrane electrode assembly process, and natural gas, propane, diesel and ammonia fuel processors for use in creating integrated fuel cell systems.
In March 2002, we sold substantially all of our fuel cell assets to a large U.S. oil company for a combination of cash and the assumption by such company of certain of our obligations. After we sold a substantial portion of our fuel cell assets, we focused on expanding our nano-structured polymer platform, having already identified the Energy Recovery Ventilator (ERV) application as our first commercial product.
Technology
We reformulate thermoplastic materials called polymers to produce a nano material .material. Nano-technology involves studying and working with matter on an ultra-small scale. One nanometer is one-millionth of a millimeter and a single human hair is around 80,000 nanometers in width. Polymers are chemical, plastic-like compounds used in diverse products such as Dacron, Teflon, and polyurethane. A thermoplastic is a material that is plastic or deformable, melts to a liquid when heated and to a brittle, glassy state when cooled sufficiently.
These reformulated polymers have properties that allow them to be used in unique ways. We transform polymers from a hard, water impermeable substance into a material which water and similar liquids can, under certain conditions, diffuse (although there are no openings in the material) as molecules as opposed to liquid water. Water and similar liquids penetrate the thermoplastic material at the molecular level without oxygen and other atmospheric gases penetrating the material. It is believed this selectivity is dependent on the size and type of a particular molecule.
Products
ConsERV™
We currently have commercialized the ConsERV™ product. ConsERV ™ConsERV™ is an Energy Recovery Ventilation product useful in most forms of HVAC as a way to meet building ventilation code(s), save energy (after reviewing the results of various third party tests, we believe ConsERV ™ConsERV™ saves between 10% and 57% of the operating costs of providing HVAC ventilation air), lower CO2CO2 emissions, allow HVAC equipment to be up to 30% smaller, reduce peak energy usage by up to 20% all while simultaneously improving indoor air quality. ConsERV™ attaches onto existing HVAC systems to provide ventilation within the structure. It pre-conditions the incoming air by flowing that air on one side of our material while stale, exhaust air from the building flows over the other side of the same material .material. The Dais material acts akin to a ‘temperature and moisture ‘filter’ by transferring excess heat and moisture bi-directionally based on the temperature and moisture content of the two air streams. Many layers of our material are stacked and placed in what is called a ‘core’. As a summer time example the “core” removes some of the heat and humidity from the incoming air, transferring it to the exhaust air stream thereby, under certain conditions, saving energy. For winter heating, the “core” transfers a portion of the heat and humidity into the incoming air from the exhaust air stream thereby often saving energy.
Our ConsERV™ product is the primary focus of our resources and commercialization efforts. When compared to similar competitive products, we believe based on test results conducted by the Air-Conditioning, Heating and Refrigeration Institute (AHRI)1, a leading industry association, ConsERV™ is twice as effective in managing the combination of latent and sensible heat. We expect ConsERV™ to continue to be the commercial product of focus through 2011,2012, with a growing emphasis on moving components of NanoAir ™NanoAir™ technologies towards commercialization.
___________________________
| 1 | Air-Conditioning, Heating, and Refrigeration Institute (AHRI) – May 2008 test results. This study is publicly available and was not prepared for our benefit or funded by us. |
How ConsERV™ Works
Most building codes mandate commercial structures to provide certain levels of ventilation determined by use and occupancy. ERVs are systems used by HVAC manufacturers to increase energy efficiencies in HVAC units by transferring heat and humidity between air flows. They do this by capturing a portion of the energy already used to heat or cool air that is being released to the outside and use such released air to condition the incoming air stream. In an air conditioning application, heat and humidity that are part of the incoming air stream are transferred to the cool, dry exhaust air, thereby “pre-conditioning” the incoming air before it reaches the building’s air conditioning system. By pre-conditioning the incoming air, ERVs should increase the operating efficiency of the HVAC unit, thereby lowering the overall costs associated with heating and cooling buildings and potentially reducing the size and initial capital cost of the overall HVAC unit.
ConsERV™ has a “core” component made using our nano-structured material and may be described as a high-performance ERV. It is used in conjunction with a building’s HVAC equipment. The ConsERV™ energy recovery ventilator employs nano-technology based materials to create an exchange of sensible (temperature) and latent (humidity) energy between the two air streams using HVAC equipment to provide building ventilation. The first air stream typically exits a building at the temperature and relative humidity level set by the buildings' air conditioning and heating equipment. The second air stream comes from the outside environment at a different temperature and relative humidity level and is used to bring outdoor air to the occupants of the building. The ConsERV™ product uses the energy found in the first air stream (air already cooler or heated) to condition the second air stream (the outdoor air coming in) before the second air stream (outside air) enters the HVAC equipment. The ConsERV™ product may save energy, in that it often reduces the required energy and size of the HVAC equipment and thereby may lower the cost of providing ventilation. In addition, it may lower carbon dioxide emissions because the HVAC equipment may not need to be used as frequently and often times can be reduced in size to provide the same levels of comfort indoors. The process is shown in the picture below.
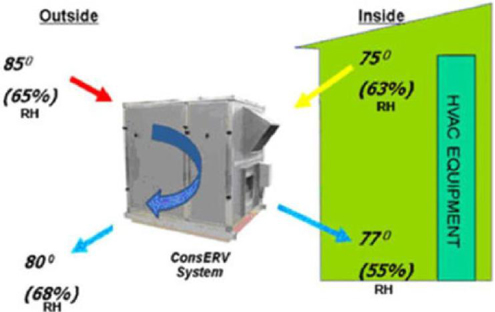
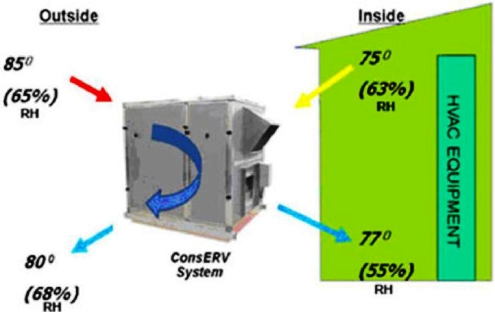
Given third-party test data, our ConsERV™ product, with its Aqualyte™ Core, offers better total performance than other fixed plate ERV products of which we are aware, with no moving parts and little or no cross-air stream contamination1. Our ConsERV™ core product has received UL 900 recognition and Air-Conditioning, Heating and Refrigeration Institute (“AHRI”) standard 1060 certification. Our ConsERV™ product is compatible with most commercial HVAC units and requires only a small amount of additional HVAC technical expertise to install. We believe the purchase and installation costs of our ConsERV™ product are comparable to the costs of many competing energy recovery products and our ConsERV™ product is more efficient in transferring moisture with lower life cycle maintenance costs.
Achieving increased sales revenue growth from our ConsERV™ product is predicated on the success in seven key areas:
Achieving continued engineering or technological improvements in key materials to lower our ‘per unit’ cost structure.
Recruiting and retaining the necessary people and infrastructure to support sales growth of ConsERV™ and other products as they are introduced into their respective sales channels.
Engineering of add-on components (such as coils, heaters, dampers, new fan options and controls) to ConsERV™ systems to meet market demands.
Development of new core designs to meet broad spectrum of performance needs.
Continuing to implement ‘Lean Manufacturing’ techniques for in-house assembly processes as well as monitoring existing outsourced manufacturing and assembly relationships that lower our ‘per unit’ cost structure.
Securing additional depth in the sales channels including adding more independent sales representatives, supplying HVAC equipment manufacturers, as well as ERV Original Equipment Manufacturers (“OEM”) (or licensees), securing key international sales channels seeking license opportunities for other consumer uses.
Having access to sufficient working capital in a timely manner for the necessary steps outlined above to continue without interruption.
We are devoting varying amounts of time to other uses of our nano-structured products in ways which are not disruptive to the key ConsERV™ effort. To date, small revenues have been generated from these non-ConsERV™ related applications.
________
| 1 | Air-Conditioning, Heating, and Refrigeration Institute (AHRI) – May 2008 test results. This study is publicly available and was not prepared for our benefit or funded by us. |
These product applications and activities include:
NanoAir TM
Water Based packaged HVAC system or “NanoAir ™ ”:“NanoAir™”: We expect this application would function to dehumidify and cool air in warm weather, or humidify and heat in cold weather. This NanoAir ™NanoAir™ application may be capable of replacing a traditional refrigerant loop based heating/cooling system. We have several small prototypes showing fundamental heating, cooling, humidification, and dehumidification operation of this evolving product. The NanoAir ™NanoAir™ product is in the early beta stage of prototype development. We received a grant of $681,322 from the US Department of Energy’s Advanced Research Projects Agency – Energy (ARPAE) in September of 2010, and a grant of $254,500 from Pasco County, Florida in December of 2010. Both grants are designed to assist us to get the NanoAir ™NanoAir™ family of products into commercialization.
NanoClear TM
Water Clean-up: We expect that our NanoClear™NanoClear™ application would function to remove quantities of salt and other impurities from water to produce potable water using an environmentally friendly design that would use less energy and be less expensive than most other current methods. We have developed a series of functional demonstration units which highlight the basics of how this system works using the Company’s nano-structured materials to produce potable water from a number of types of contaminated input water (contaminated) to the NanoClear ™NanoClear™ process. The information accumulated from the demonstration units is being used as the basis for the product’s next planned inflexion point: the buildup of a 10 cubic meter (approximately 26,500 gallons of clean water per day) pilot plant projected to be set up at a local County waste water treatment facility. The NanoClear ™NanoClear™ product is currently in the early beta stage development where it is to undergo further testing and scaling.
NanoCap TM
Ultra-capacitor: Based on initial material tests conducted by two third parties, we believe that by applying a combination of our nano-materials we may be able to construct a device which stores energy similar to a battery with projected increases in energy density and lifetimes. We believe the key application for such a device would be in transportation. We have not invested significant resources to date in the development of this product.
Detailed information including development stage and estimated funding and time to market follows:
| Application | Current Stage | Estimated Funding Required Commercialize | Estimated Time to Market (post funding)(1) | Current Stage | Estimated Funding Required Commercialize | Estimated Time to Market (post funding)(1) | ||||||||||
| Energy Recovery Ventilation (ConsERV TM ) – An energy efficient process that exchanges heat and humidity between incoming and outgoing airstreams to increase fresh air within commercial and residential facilities | Varied - Additional components to meet market demand are necessary | $ | 1.5 Million | Commercial | Varied - Additional components to meet market demand are necessary | $ | 1.5 Million | Commercial | ||||||||
| Water Clean – up (NanoClear TM ) – A process using a low temperature, low pressure approach to process brackish, salt, and waste water into potable water. | 1st Stage Beta | $ | 3.8 Million | 12 – 36 months | 1st Stage Beta | $ | 3.8 Million | 12 – 36 months | ||||||||
| Advanced Heating, Ventilating, and Air Conditioning (NanoAir) – A process using the nano – technology materials to create an advanced heating, ventilating, and air – conditioning system. | 1st Stage Beta | $ | 3.8 Million | 12 – 36 months | 1st Stage Beta | $ | 3.8 Million | 12 – 36 months | ||||||||
| Ultracapacitor – if fully developed, may have a greater energy density and power per pound than traditional capacitors or the batteries on the market today. | Base materials testing underway by third party to confirm the effectiveness of the Company’s materials in the application. Current activities are moving us closer to the optimization of materials. | $ | 500,000 | — | Base materials testing underway by third party to confirm the effectiveness of the Company’s materials in the application. Current activities are moving us closer to the optimization of materials. | $ | 500,000 | — | ||||||||
| 1 | Estimated time to market (post funding) for the Ultracapacitor cannot be determined at this time because it is subject to completion of materials testing. |
We have identified other potential products for our materials and processes as well as accumulating basic data to support the needed functionality and market differentiation of these product sproducts based on using our nano-technology based inventions. Such applications may include immersion coatings and performance fabrics. These other products are based, in part, upon the known functionality of the Company’s materials and processes.
Patents
We own eight U.S. patents, two pending U.S. patent applications, and four Patent Cooperation Treaty (“PCT”) applications. National stage applications based on one of the PCT application have been filed in the U.S., China, Hong Kong and Europe. In addition, we co-own two PCT applications with Aegis Biosciences LLC, a biomaterials drug delivery technology company. National stage applications based on one of the co-owned PCT applications have been filed in the U.S., China, Hong Kong and Europe, and a National stage application based on the other co-owned PCT application has been filed in the U.S. and China. These patents relate to, or are applications of, our nano-structured polymer materials that perform functions such as ion exchange and modification of surface properties. The polymers are selectively permeable to polar materials, such as water, in molecular form. Selective permeability allows these materials to function as a nano-filter in various transfer applications. These materials are made from base polymer resins available from a number of commercial firms worldwide and possess what we believe to be some unique and controllable properties, such as:
Selectivity: Based on our research, we believe that when the polymer is made there are small channels created that are 5 to 30 nanometers in diameter. There are two types of these channels: hydrophilic (water permeable), and hydrophobic (water impermeable). The channels can be chemically tuned to be selective for the ions or molecules they transfer. The selectivity of the polymer can be adjusted to efficiently transfer water molecules from one face to the other using these channels.
High transfer rate: Based on in-house testing protocols and related results, we have found that the channels created when casting the materials into a nano-structured membrane have a transfer rate of water, or flux, greater than 90% of an equivalent area of an open tube. This feature is fundamental to the material’s ability to transfer moisture at the molecular level while substantially allowing or disallowing the transfer of certain other substances at a molecular level.
Unique surface characteristics: The materials offer surface characteristics that we believe inhibit the growth of bacteria, fungus and algae and prevent adhesives from attaching.
The molecular selectivity, transfer rate and surface coating properties, coupled with our ability to produce the nano-structured materials at what we believe is an affordable price, distinguishes our technology and value-added products. By incorporating our nano-structured materials into existing products, we strive to address current real-world market needs by offering what we believe to be higher efficiencies and improved price performance. For example, there are other energy recovery mechanisms available for HVAC that use coated paper or desiccant technology instead of our highly efficient nano-structured polymer materials.
Manufacturing
We do not have long term contractual relationships with any of our manufacturers or vendors. The only product or service which we could not have purchased elsewhere and used in the on-going growth of the ConsERV™ business is the plastic based sheet good. In progress is a project aimed at lessening the Company’s exposure in this sheet good area. All purchases to date of raw materials and related services have been on a purchase order basis. Our manufacturing process is described below.
Polymer Material
Commercially available polymer resin in flake form and industrial grade solvents are mixed together using a proprietary process involving heat, industrial mixers, and solvents. The resin and the solvents are commercially available from any number of chemical supply houses, or firms such as Dow and Kraton (formerly Shell Elastomers then part of Royal Dutch Shell). Our process changes the molecular properties of the starting polymer resins into a liquid material which we believe gives the attribute of being selective in what molecules it will allow through the plastic, which includes water molecules. This process, called ‘sulfonation’, is done at facilities around the world known as Toll Houses. These are firms which specialize in making small lot (by industry standards) runs of specialty chemicals.
Plastic Based Sheet Good
A thin coating of the liquid polymer material is applied on one side of the sheet good by a ‘tape casting’ firm of which there are many in the United States. The coated sheet good is heated to rapidly dry the liquid material thus bonding the polymer solution and rolled sheet good together. The resulting ‘modified sheet good’ is then re-coiled into rolls and shipped to us. Currently one vendor provides this to us. We have not sought additional vendors for this component. However, we have identified other entities making similar types of products and believe such entities and products may provide alternatives should one be required. As noted above we are actively working on this project to lower our exposure.
The “Core”
The modified sheet good is cut into defined dimensions and glued to a PVC formed spacer. This ‘spacer/glued modified sheet good’ is a single layer. Multiple layers are stacked one on top the other until a certain height is achieved. Once the proper height is achieved, these layers are then fitted with a galvanized sheet metal plate on the top and bottom of the stack along with galvanized sheet metal ‘Y’ shaped bracket on each of the four corners of the assembly. This assembly is called a ‘core’. The galvanized sheet metal is a world-wide commodity material formed to our specifications by local and out-of-town sheet metal forming companies. We have no long term contractual relationships with firms making the PVC spacers, supplying the glue, supplying rivets to hold the structure together, and the sheet metal firms making the top and bottom plate as well as the side rails.
Completion
For the complete ConsERV™ system, one or more cores are placed inside of aluminum or steel boxes built by a vendor or us. The box may or may not also be fitted with an electric motor, fan, electric relay, and electrical disconnect. Inclusion or exclusion of the electric motor and fan is dictated by the customers’ needs and current HVAC system. Once outfitted with cores, the product is complete. We have no long term contractual relationships with firms providing the aluminum or steel parts used to build the box, the motors, the fans, the relays, or the electrical disconnects.
Licensing
While we have earned licensing revenue under agreements licensing our technology in the past, we may not receive any material revenue from these agreements in the near or foreseeable future.
Research and Development
We have spent approximately $338,000 (gross) and $6,600 on research and development during the years ended December 31, 2010 and 2009, respectively. During the year ended December 31, 2010, we received $99,000 to offset the cost of research and development expenses as it relates to a project that is funded by grants from Pasco County and the Department of Energy, American Economic Investment and Recovery Act. For the sixnine months ended JuneSeptember 30, 2011, the Company incurred research and development costs of approximately $300,600$602,200 and recognized approximately $287,500$592,900 in grant proceeds.
Key Relationships
We have strategic relationships with leaders in the energy industry who have entered into sales, marketing, distribution and product development arrangements with us and, in some cases, hold equity in us. They include:
Trane Corporation
On August 12, 2010, we entered into an Independent Sales Representative Agreement with Trane U.S. Inc. (“Trane”). Under the terms of the agreement, Trane agreed to act as exclusive independent sales representative to offer for sale and sell ConsERV™ products, including the cores and/or the systems (“Products”) in over 20 areas within the United States, with additional territories to be added by mutual agreement of the parties. We retain the right to offer for sale and sell and permit third parties to offer for sale and sell any ConsERV™ product within the territory under private label arrangements. In addition, we may sell Products to certain national accounts and sell any component of the Products without limitation. Sales of other fixed plate energy recovery ventilator products by Trane are not to be made within the territory. Products are purchased by Trane and delivered F.O.B. our factory. Trane is to pay us the established purchase price for all Products ordered and received at any time under this agreement. Product prices may change upon advance notice by us. We provide a two year warranty on the Products and a 10 year warranty on the core component with the warranty applying, subject to additional terms and conditions, to defects in any Product resulting from improper workmanship and/or materials provided the Product was subject to normal use and properly installed. We may under certain conditions be subject to liquidated damages for orders accepted and not delivered on a timely basis, however, such damages are not exceed the purchase price of the Product on which delivery was delayed or apply if such delay was due to a force majeure. The agreement may be terminated by either party upon 90 days prior written notice or immediately in certain situations, for instance if either party become insolvent, cease to function as a going business, file a petition in bankruptcy. If we terminate the contract and the basis for termination is not a breach of this agreement by Trane, we shall fill all orders placed on or prior to the date of termination.
Electric Power Research Institute (EPRI)
We have an on-going relationship with a number of utilities through EPRI. The EPRI participants include Public Service Company of New Mexico, Kansas City Power & Light, Reliant Energy Incorporated, Alliant Energy Company, Omaha Public Power District, Wisconsin Public Service Corporation, Southern California Gas Company, EDF Electricite de France, Consolidated Edison of New York, Tokyo Gas Co., Ltd., CINERGY Corporation, Northern States Power Company, American Electric Power Company, Inc., Sierra Pacific Power Company, Public Service Electric & Gas Company (PSE&G), and Tennessee Valley Authority. The EPRI users group has been helpful in creating opportunities for us to define specifications and applications for our nano-structured materials that address existing energy related challenges while possibly opening new sources of revenue.
35
Genertec America, Inc (“Genertec”).
On August 21, 2009, we entered into an Exclusive Distribution Agreement with Genertec, under which we are to supply and Genertec is to distribute, on an exclusive basis, three of our nanotechnology-based membrane products and related products in Greater China, including mainland China, Hong Kong, Macau and Taiwan. The agreement provides that during the initial term of the agreement, Genertec will order and purchase these products in the aggregate amount of $200 million. A minimum quantity of said products is to be purchased by Genertec during each contract year of the initial term. In the event Genertec fails to purchase the minimum amount of products in any given year, we may convert the exclusivity provided to Genertec to a non-exclusive or terminate the agreement. Genertec has agreed to engage and appoint authorized person(s) or firm(s), to install, engineer, perform maintenance, sell and use the products within the defined distribution area and neither Genertec nor its designated buyer is permitted to alter, decompile or modify our products in any way. As consideration for entering into this agreement, Genertec agreed to pay us a deposit in monthly installments beginning in September 2009 and continuing through April, 2010. All such payments are to be applied to products purchased by Genertec. During the initial term of the agreement, the parties are to negotiate in good faith a royalty bearing license agreement whereby Genertec may be granted a license to manufacture certain portions of the our products in the designated territory. The initial term of the agreement shall be for a period of five (5) years, commencing on August 21, 2009, unless earlier terminated. Unless notice of termination is delivered to the respective parties 180 days prior to the expiration of the initial term, the Agreement will automatically renew for consecutive one year periods. We may terminate this agreement in the event: (1) Genertec fails to pay the deposit as indicated, (2) Genertec does not purchase the minimum amount of our designated products during any contract year, (3) breach by Genertec of its obligations under the Agreement, or (4) at our discretion immediately upon the transfer of fifty percent (50%) or more of either the assets of the voting stock of Genertec to any third party. Genertec may not assign the Agreement to any party without our prior written consent. As of June 30,December 31, 2011, , the Company has $406,356 in accounts receivable and $500,000 in deferred revenue to be applied against future orders. Genertec America’s partners in China have received the product and have concluded their tests. Recently, Genertec expressed a desire to limit its participation in this endeavor as they find NanoAir™ and NanoClear™ to have engineering requirements they are continuingnot best suited to perform tests; however there have been delays in completingundertake. As such, the parties are discussing modification s to or termination of this testing process. As a result, Genertec America has not yet begun to order product fromagreement and the Company under this Agreement.CAST agreement. The Company is currently meeting with Genertec to resolve the payment of the receivable and expects that the amountsoutstanding receivables will be collected.discussed as a part of any negotiations. The modification or termination of this agreement and/or the CAST agreement may affect our financial statements, the extent to which is not determinable at this time.
In April of 2010, the Company entered into a technical and sales agreement with CAST Systems Control Technology Co., Ltd. (“CAST”) and Genertec with a value of up to approximately $48 million over a twelve month period. Under the terms of the Agreement, the Company will supply to CAST, through Genertec, key system components of its nanotechnology clean water process. The Agreement is conditioned upon the Company obtaining a letter of credit from GTA in the amount as agreed to by the parties on or before April 13, 2010. As of the date of this filing, the Company has received the required letter of credit. This Agreement, the terms of which are disclosed in the Company’s Current Report on Form 8-K, filed on April 9, 2010, is made pursuant to and in support of the $200 million distribution agreement made between the Company and Genertec on August 21, 2009, granting Genertec the exclusive right to obtain, distribute and market the Company’s nanotechnology-based membrane and related products in China, including mainland China, Hong Kong, Macau and Taiwan, the terms of which are summarized above and more fully disclosed in the Company’s Current Report on Form 8-K, filed August 27, 2009. For the year ended December 31, 2010, we have sold one unit under this agreement and recognized $300,000 in revenue which has been billed and $254,000 of which has been collected. We expect theThe remainder of the $300,000 receivable towill be collected in 2011.
discussed as a part of the negotiations cited above.ConsERV™ – Sales and Marketing Strategies
We market our ConsERV™ product in North America principally through alliances with local independent manufacturer representatives. We currently have approximately 60 independent commercial sales representatives in various locations throughout North America selling the ConsERV™ product. We intend to increase the number of commercial independent sales representatives to more than 100 by the end of 2012, to properly cover the North American commercial sales territory. We are also working to secure ongoing relationships with other leading industry HVAC manufacturers and other ERV manufacturers. Other potential and targeted sales channels for the ConsERV™ product are energy service companies and HVAC product distributorships. We continue to leverage our relationship with Trane Corporation, EPRI and a group of 16 utility companies (consisting of EPRI members and some of our minority shareholders) into expected sources of future product sales through the introduction of demand reduction incentives. As interest has grown in ConsERV™ – and growth begins in NanoAirTM – we decided to bring in an HVAC industry veteran to oversee the sales and marketing of ConsERV™ as well as to prepare to integrate the NanoAirTM applications as they come available for commercialization. In January 2010, we hired a new Vice President of Sales and Marketing who possesses 25 years of experience in the HVAC industry. Additionally this growth found our manufacturing efforts in need of bolstering. In June 2010 we hired a General Manager of Operations and Manufacturing, who is LEAN certified, and has over 18 years of experience in growing, running and optimizing manufacturing organizations, to run the manufacturing effort and to plan for our projected future manufacturing and assembly expansion.When invited, we will also participate in U.S. trade missions to countries and regions, such as recent missions in Brazil and the Middle East, with governmental delegations and regional and large multinational companies to lay the groundwork for sales in those regions. These missions give us access to business and government leaders we expect we could not achieve on our own.
Future Products – Sales and Marketing Strategies
Our intended sales and marketing strategy will require us to create alliances with companies having strong, existing channel presence in the target industries. We intend to bring industry seasoned executive talent into the company at the appropriate time to influence the product’s feature set, and to then to develop the market for and produce revenue from the NanoAir™ and NanoClear™ products. We believe working with OEM’s who are industry leaders during development allows us to better address the market’s needs and possibly accelerate the time to market cycle.
Competition and Barriers to Entry
We believe the efficacy of our value-added products and technology has the ability to decrease sales of competing products, thus taking business away from more established firms using older technology. We believe that our ConsERV™ product may become a functional component of newer, more efficient OEM products. Our key challenge is to educate channel decision makers of the benefits of products made using our materials and processes to overcome the strength of the current product sales.
There are a number of companies located in the United States, Canada, Europe and Asia that have been developing and selling technologies and products in the energy recovery industry, including but not limited to: Semco, Greenheck, Venmar, Bry-Air, dPoint, Renewaire and AirXchange.
We will experience significant competition regarding our products because certain competing companies possess greater financial and personal resources than us. Future product competitors include, but are not limited to:
Products | Current and Future Competitors | |
ConsERV™ | Semco, Greenheck, Venmar, Bry-Air, dPoint, Renewaire and AirXchange. | |
NanoClear™ | Dow, Siemens, GE | |
NanoAir™ | AAON, Trane, Carrier, York, Hier, Mitsubishi, LG | |
| Ultracapacitor | Maxwell, Ioxus, B&D |
We believe that the combination of our nano-material platform’s characteristics (high selectivity, high flux rate, manufacturability, et al.), growing patent position, and possible ‘first to market’ position, are competitive advantages, which may allow us time to execute our business plan. Competitors may experience barriers to entry in these markets primarily related to the lack of similarly performing proprietary materials and processes.
Intellectual Property
As stated above, we have eight U.S. patents, including patents covering the composition and structure of a family of ion conducting polymers and membranes and applications of the polymer. We believe some of these patents make reference to applications relating to the materials we are developing. Please see the “Risk Factors” Section of this prospectus. A list of our existing patents follows:
| 1. | Patent No. 6,841,601– Cross-linked polymer electrolyte membranes for heat and moisture exchange devices. This patent was issued on January 11, 2005 and expires on or about March 12, 2022. |
| 2. | Patent No. 6,413,298 – Water and ion-conducting membranes and uses thereof. This patent was issued on July 2, 2002 and expires on or about July 27, 2020. |
| 3. | Patent No. 6,383,391 – Water and ion-conducting membranes and uses thereof. This patent was issued on May 7, 2002 and expires on or about July 27, 2020. |
| 4. | Patent No. 6,110,616 – Ion-conducting membrane for fuel cell. This patent was issued on August 29, 2000 and expires on or about January 29, 2018. |
| 5. | Patent No. 5,679,482 – Fuel Cell incorporating novel ion-conducting membrane. This patent was issued on October 21, 1997 and expires on or about October 20, 2014. |
| 6. | Patent No. 5,468,574 – Fuel Cell incorporating novel ion-conducting membrane. This patent was issued on October 21, 1995 and expires on or about May 22, 2014. |
| 7. | Patent No. 7,179,860 – Cross-linked polymer electrolyte membranes for heat, ion and moisture exchange devices. This patent was issued on February 20, 2007 and expires on or about March 11, 2022. |
| 8. | Patent No. 7,990,679 – Nanoparticle Ultra Capacitor. This patent was issued on August 2, 2011 and expires on or about December 10, 2028. |
We have provisional and patent applications in the following areas: Advanced Polymer Synthesis Processes, Reversible Liquid to Air Enthalpy Core Applications and Construction, and Water Treatment and Desalination.
The following is a partial list of the patent applications publicly visible:
| WO/2008/039779 – Enhanced HVAC System and Method |
| WO/2008/089484 – Multiphase selective Transport Through a Membrane |
| WO/2008/141179 – Molecule Sulphonation Process * |
| WO/2009/002984 – Stable and Compatible Polymer Blends* |
| WO2009/002984 – Novel Coblock Polymers and Methods for Making Same |
________
* Patent applications jointly owned with Aegis Biosciences, LLC.
Patents may or may not be granted on these applications. As noted above, some of these applications are jointly owned with Aegis Biosciences, LLC. We also seek to protect our proprietary intellectual property, including intellectual property that may not be patented or patentable, in part by entering into confidentiality agreements with our current and prospective strategic partners and employees.
Government Regulation
We do not believe the sale, installation or use of our current nano-structured products will be subject to any government regulation, other than perhaps adherence to building codes, and water safety regulations. We do not believe that the cost of complying with such codes and regulations, to the extent applicable to our products, will be prohibitive.
We do not know the extent to which any existing or new regulations may affect our ability to distribute, install and service any of our products. Once our products reach the commercialization stage and we begin distributing them to our target markets, federal, state or local governmental entities may seek to impose regulations.
We are also subject to various international, federal, state and local laws and regulations relating to, among other things, land use, safe working conditions, and environmental regulations regarding handling and disposal of hazardous and potentially hazardous substances and emissions of pollutants into the atmosphere. Our business may expose us to the risk of harmful substances escaping into the environment, resulting in potential personal injury or loss of life, damage to or destruction of property, and natural resource damage. Depending on the nature of the claim, our current insurance policies may not adequately reimburse us for costs incurred in settling environmental damage claims, and in some instances, we may not be reimbursed at all. To date, we are not aware of any claims or liabilities under these existing laws and regulations that would materially affect our results of operations or financial condition.
Employees
As of September 12, 2011February 6 , 2012, we employed 212 7 full-time employees and one part time employee in our Odessa, Florida facility. Of the 2227 employees, we have 61 1 technicians, 2 product managers, a polymer chemist, a polymer engineer, 45 engineers, a Chief Technology Officer Development, a General Manager of Operations, 1 administrative assistant, 2 administrators, a Vice President of Sales, a Chief Financial Officer and a President and Chief Executive Officer. None of the employees are subject to a collective bargaining agreement. We consider our relations with our employees to be good.
Principal Offices
Our principal office is located at 11552 Prosperous Drive, Odessa, FL 33556.
We currently lease 7,200 square feet of combined office and production space located at 11552 Prosperous Drive, Odessa, FL 33556. We lease the site from Ethos Business Ventures, LLC, a limited liability company in which our Chief Executive Officer, Timothy N. Tangredi, has a controlling financial interest.
The lease for our corporate headquarters began on March 18, 2005. The lease term will terminate upon 30 days’ written notice from landlord or 90 days written termination from us. The current monthly rent is $3,800. At June 20,September 30, 2011, we owed $45,779$53,465 to the landlord for rent due. We also pay all taxes, insurance and utilities as well as most repairs relating to our office. Most of the Company functions are performed at this site including corporate, marketing, administration, on-going product and nano-structured polymer development, and product assembly and shipping. Key polymer synthesis and casting is out-sourced and not done at this facility. Management will consider moving the synthesis and casting activitesactivities in-house with use of proceeds from this offering.
We do not anticipate investing in real estate or interests in real estate, real estate mortgages, or securities of or interests in persons primarily engaged in real estate activities. We currently have no formal investment policy and do not intend to undertake investments in real estate as a part of our normal operations.
LEGAL PROCEEDINGS
We are not currently a party to any pending legal proceedings. In the ordinary course of business, we may become a party to various legal proceedings generally involving contractual matters, infringement actions, product liability claims and other matters.
From time to time, claims are made against us in the ordinary course of our business, which could result in litigation. Claims and associated litigation are subject to inherent uncertainties and unfavorable outcomes could occur, such as monetary damages, fines, penalties or injunctions prohibiting us from selling one or more products or engaging in other activities. The occurrence of an unfavorable outcome in any specific period could have a material adverse effect on our results of operations for that period or future periods.
The following table sets forth the names and ages of all of our directors and executive officers as of September 12, 2011.February 6 , 2012. Also provided herein is a brief description of the business experience of each director and executive officer during the past five years and an indication of directorships held by each director in other companies subject to the reporting requirements under the Federal securities laws. All of the directors will serve until the next annual meeting of shareholders and until their successors are elected and qualified, or until their earlier death, retirement, resignation or removal. There are no arrangements or understandings between any director or executive officer and any other person pursuant to which the director or executive officer was selected.
| Name | Age | Position | |||
Timothy N. Tangredi | 56 | President, Chief Executive Officer and Chairman of the Board of Directors | |||
Scott G. Ehrenberg | 57 | Chief Technology Officer and Secretary | |||
Judith C. Norstrud | 43 | Chief Financial Officer and Treasurer | |||
David Longacre | 53 | Vice President – Sales and Marketing | |||
Robert W. Schwartz | 67 | Director | |||
Raymond Kazyaka, Sr. | 76 | Director |
Directors and Executive Officers
Biographical information with respect to our executive officers and directors is provided below. There are no family relationships between any of our executive officers or directors.
Timothy N. Tangredi has been our Chief Executive Officer since 1996. Mr. Tangredi joined the Company in 1996, and was appointed a member of our board of directors in 1997. In 1999 and 2000, respectively, Mr. Tangredi initiated and executed the strategic purchases of the assets of Analytic Power and American Fuel Cell Corporation. From 1979 to 1990, Mr. Tangredi worked for AT&T, as a member of the Leadership Continuity Program working in technical marketing, network operations, and project management.
Mr. Tangredi earned his BS from Siena College and an MBA from Rensselaer Polytechnic Institute. He is a founder and member of the board of directors of Aegis BioSciences, LLC (“Aegis”). Aegis, created in 1995, is a licensee of the Company’s nano-structured intellectual property and materials in the biomedical and healthcare fields. Mr. Tangredi spends approximately one to two days per month on Aegis business and is compensated by Aegis for his time and contributions.
Mr. Tangredi’s experience in nanotechnology, strategic planning and leadership skills makes him highly qualified to be a member of our board. He has a comprehensive understanding of our company and management, operations, financial requirements and technologies.
Scott G. Ehrenberg, is a founder of the Company and has been our Chief Technology Officer since 1993 and Secretary since November 7, 2008. He has thirty years of experience developing along with others new materials and applications. These applications range from laser cutting systems, optical inspection technology, and new organic electronic packages for IBM to new polymer electrolytes for electrochemical and mass transport devices for the Company. His background includes 12 years at IBM plus two previous startups in the fields of electronic packaging and ultrasonic devices: one firm which ultimately became Tessera of San Jose, CA and the other which ultimately became Sono-Tek of Milton, NY. He has
Judith C. Norstrud, CPA was appointed Chief Financial Officer and Treasurer on October 14, 2009. In March 2002, Ms. Norstrud founded Norco Accounting & Consulting, Inc., a firm that provides various accounting and consulting services to small companies on an as needed basis. She continues her consulting work with Norco Accounting & Consulting concurrently with her services to the Company as our CFO and Treasurer. From July 1999 to June 2002, Ms. Norstrud served as a manager with Pender, Newkirk and Company, CPAs. While at Pender, Ms. Norstrud served a variety of companies from start up enterprises to mid-sized publicly traded companies. Previously, from August 1996 to July 1999, Ms. Norstrud was an Audit Senior with PricewaterhouseCoopers, LLP. Ms. Norstrud graduated from the University of South Florida’s College of Business Administration with a Master of Accountancy degree in 2002.
David E. Longacre has been Vice President of Sales and Marketing since January 2010. His background includes over 25 years of experience in the Heating, Ventilation and Air Conditioning (HVAC) industry. His career started with York International as a Sales Engineer, progressing to a Zone Manager over 17 years. He worked as an independent manufactures representative for two years before joining Trane, where he was a Strategic Account Manager and Team Leader for five years. He then worked with Siemens Building Technologies as their Service Sales Manager for a district from 2005 through 2007, then became Branch Manager for Johnson Controls handling the profit and loss for both sales and operations during 2007 through 2009. Mr. Longacre received his BS in Commerce and Engineering from Drexel University in 1980. He is also a LEED AP.
Raymond Kazyaka, Sr. was appointed to our board of directors in 1995. He is the President of RJK Tech Ltd. since 2005. Mr. Kazyaka is the former President (1976-2004) and a co-founder of Wright Malta Corporation, which was founded in 1972 after a buy-out of a GE business. Wright Malta, liquidated in 2005, owned and operated the Malta Test Station, which had performed military product development for various governmental and commercial organizations including Lockheed Martin and Northrup. Mr. Kazyaka has also served as a consultant to the Canadian National Defense on facility noise abatement. Prior to founding Wright Malta, Mr. Kazyaka worked for General Electric as a rocket engine design engineer and a manager. Mr. Kazyaka holds 19 patents on rocket engine components and noise abatement systems, and is a senior member of the American Institute of Aeronautics and Astronautics. Mr. Kazyaka graduated from Union College with a degree in Mechanical Engineering in 1953. Mr. Kazyaka’s experience in strategic planning and business acumen provides us with assistance in our overall goals and initiatives.
Robert W. Schwartz was appointed to our board of directors in 2001. Mr. Schwartz founded the Schwartz-Heslin Group (“SHG”) in 1985 and serves as one of its Managing Directors. Mr. Schwartz specializes in corporate planning, finance and development. Prior to starting SHG, he was a founder, President and Chief Executive Officer of a venture-funded high tech telecommunications company (Windsource, Inc.). In addition, he was the President and Chief Operating Officer of an AMEX listed company (Coradian Corporation). He was also the Chief Financial Officer of a major manufacturer of outdoor power equipment (Troy Built Products, Troy, NY). His earlier experience was with KPMG as a management consultant and with IBM. Mr. Schwartz received a Bachelor of Science from Cornell University in 1967 and attended graduate courses at the University of New York Albany. He currently serves on the boards of five corporations, including ours. Mr. Schwartz’s experience in financial planning and reporting provides assistance to us in these areas and he is considered to be a financial expert to the company.
The Board members serve for the latter of a period of one year or until the next annual meeting of shareholders. Our executive officers are appointed by our board of directors and hold office until removed by the Board.
Director Candidates
Peter Termyn, age 51, has recently agreed to join our Board. Mr. Termyn has been the President and CEO at Parkinson Technologies since January 2007. Parkinson Technologies Inc. is a world-wide industry leader in the development, design and manufacturing of web processing machinery for
Staying highly focused on its core objectives, making world-class personnel additions, and leading investments that improved his company’s operations and abilities to serve its diverse customer base Termyn created solid, sustainable growth in its existing business areas and newer areas such as the extrusionprocessing of newernovel materials using polylactic acid films, and specialty films like separator films for rechargeable batteries.
He previously directed the company’s commercial organization and led efforts to unlock its growth potential in emerging clean-tech and bio-based material processing applications.
Prior to Parkinson, Mr. Termyn held multiple technical, commercial and business management roles in the semiconductor, fluid transfer, and chemical, automotive and engineered products industries with Helix Technology, Tyco International, BOC Group, ITT Corporation, and Dresser Industries.
Mr. Termyn holds dual engineering degrees in Chemical Engineering and Materials/Metallurgical Engineering from the University of Michigan, in addition to a Masters of Business Administration from the University of Michigan.
42
Director Independence
We have applied for listing ofdetermined that our common stock on AMEX, which listing we expect to occur on or immediately prior to the date of this prospectus. Therefore, our determination of the independenceboard of directors currently has two members who qualify as “independent” as the term is made usingused in Item 407 of Regulation S-K as promulgated by the definition of “independent” contained in the listing standards of AMEX.SEC and as that term is defined under NASDAQ Rule 4200(a)(15). The independent directors are Raymond Kazyaka, Sr. and Robert W. Schwartz. On the basis of information solicited from each director, the board has determined that Raymond Kazyaka, Sr. and Robert W. Schwartz have no material relationship with us and are independent within the meaning of such rules. In making this determination, the board evaluated responses to a questionnaire completed by each director regarding relationships and possible conflicts of interest between each director, the company and management. In its review of director independence, the board considered all commercial, industrial, banking, consulting, legal, accounting, charitable, and familial relationships any director may have with the company or management. At presentAlthough we do not have audit or compensation committees established. It is our intention on the closing of this offeringintend to add new outside Board members, and establish at a minimum an audit committee and compensation committee.committee, our board of directors has not adopted any committees to the board of directors.
Involvement in Certain Legal Proceedings
To our knowledge, none of our directors or officers is or was a party to any legal proceeding required to be disclosed pursuant to Item 401(f) of Regulation S-K.
Director Compensation
The following table sets forth the compensation awarded to, earned by or paid to the nonemployee directors during the fiscal year ended December 31, 2011, 2010 and 2009.
Fees Earned or Paid in Cash | Stock Awards | Option Awards | Non-Equity Incentive Plan Compensation | Change in Pension Value and Non-qualified Deferred Compensation Earnings | All Other Compensation | |||||||||||||||||||||||
| ($) | ($) | ($) | ($) | ($) | ($) | Total ($) | ||||||||||||||||||||||
| Name (a) | (b) | (c) | (d) | (e) | (f) | (g) | (h) | |||||||||||||||||||||
| Raymond Kazyaka Sr., Director(1) | 2011 | — | — | $ | 79,583 | — | — | — | $ | 79,583 | ||||||||||||||||||
| 2010 | — | — | $ | 95,869 | — | — | — | $ | 95,869 | |||||||||||||||||||
| 2009 | — | — | $ | 31,165 | — | — | — | $ | 31,165 | |||||||||||||||||||
| Robert W. Schwartz, Director(2) | 2011 | — | — | $ | 79,583 | — | — | — | $ | 79,583 | ||||||||||||||||||
| 2010 | — | — | $ | 95,869 | — | — | — | $ | 95,869 | |||||||||||||||||||
| 2009 | — | — | $ | 31,165 | — | — | — | $ | 31,165 | |||||||||||||||||||
Fees Earned or Paid in Cash | Stock Awards | Option Awards | Non-Equity Incentive Plan Compensation | Change in Pension Value and Non-qualified Deferred Compensation Earnings | All Other Compensation | |||||||||||||||||||||
| ($) | ($) | ($) | ($) | ($) | ($) | Total ($) | ||||||||||||||||||||
| Name (a) | (b) | (c) | (d) | (e) | (f) | (g) | (h) | |||||||||||||||||||
| Raymond Kazyaka Sr., Director(1) | 2010 | — | — | $ | 95,869 | — | — | — | $ | 95,869 | ||||||||||||||||
| 2009 | — | — | 31,165 | — | — | — | 31,165 | |||||||||||||||||||
| Robert W. Schwartz, Director(2) | 2010 | — | — | $ | 95,869 | — | — | — | $ | 95,869 | ||||||||||||||||
| 2009 | — | — | 31,165 | — | — | — | 31,165 | |||||||||||||||||||
| (1) | At December 31, |
| (2) | At December 31, |
We do not have a plan pursuant to which our directors are compensated and directors currently do not receive cash compensation for their services on the Board of Directors although they do receive stock options as determined by the full board of directors with each director abstaining from any such vote involving himself or a member of his immediate family. Timothy N. Tangredi, Raymond Kazyaka Sr. and Robert W. Schwartz were each granted an option on June 25, 2010 to purchase 400,000 shares of common stock at an exercise price of $0.30 per share, (an option to purchase 40,000 shares of common stock at an exercise price of $3.00 upon reflecting proposed 10-for-1 reverse stock split) vesting immediately upon issuance and exercisable for a period of ten years. This option grant to Mr. Tangredi as a director is contained in the table summarizing grants made to our officers.
Our non-employee directors are currently compensated with the issuance of stock options, which generally become exercisable upon the date of grant, and which generally expire on the earlier of ten years from the date of grant or up to three years after the date that the optionee ceases to serve as a director. Non-employee directors are also reimbursed for out-of-pocket expenses associated with attending to our business.
EXECUTIVE COMPENSATION
The table below summarizes the total compensation paid to or earned by our principal executive officer, our principal financial officer and each of our two other executive officers other than our principal executive officer and principal financial officer in the last two fiscal years. The amounts represented in the “Option Awards” column reflect the stock compensation expense recorded by the Company under GAAP and does not necessarily equate to the income that will ultimately be realized by the named executive officers for such awards.
| Name and principal position (a) | Year (b) | Salary ($) (c) | Bonus ($) (d) | Stock Awards ($)(2) (e) | Option Awards ($)(2) (f) | Non-Equity Incentive Plan (g) | Non-qualified Deferred Compensation Earnings ($) (h) | All other compensation ($) (i) | Total ($) (j) | ||||||||||||||||||||||
Timothy N. Tangredi Chief Executive Officer, President, and Chairman of the Board of Directors(1) | 2010 2009 | | $ $ | 170,000 170,000 | | | — — | | | — — | | $ $ | 95,869 1,134,425 | | | — — | | | — — | | | — — | $ $ | 265,869 1,304,425 | | ||||||
Robert W. Brown Vice President of Marketing (3) | 2009 | $ | 57,187 | — | — | — | — | — | — | $ | 57,187 | ||||||||||||||||||||
David E. Longacre Vice President of Sales and Marketing | 2010 | $ | 125,000 | $ | 10,000 | — | $ | 73,386 | — | — | — | $ | 208,386 | ||||||||||||||||||
Scott G. Ehrenberg Chief Technology Officer and Secretary | 2010 2009 | | $ $ | 74,808 67,100 | | | — | | | — — | | $ | 89,877 — | | | — — | | | — — | | | — — | $ $ | 164,685 67,100 | | ||||||
Judith C. Norstrud Chief Financial Officer and Treasurer | 2010 2009 | | $ $ | 50,000 13,447 | | | — — | | | — — | | $ $ | 35,951 82,930 | | | — — | | | — — | | | — — | $ $ | 85,951 96,377 | | ||||||
| Name and principal position (a) | Year (b) | Salary ($) (c) | Bonus ($) (d) | Stock Awards ($)(2) (e) | Option Awards ($)(2) (f) | Non-Equity Incentive Plan (g) | Non-qualified Deferred Compensation Earnings ($) (h) | All other compensation ($) (i) | Total ($) (j) | ||||||||||||||||||||||
Timothy N. Tangredi Chief Executive Officer, President, and Chairman of the Board of Directors(1) | 2011 2010 2009 | $ $ $ | 170,000 170,000 170,000 | — — — | — — — | $ $ $ | 79,583 95,869 1,134,425 | — — — | — — — | — — — | $ $ $ | 249,583 265,869 1,304,425 | |||||||||||||||||||
Robert W. Brown Vice President of Marketing (3) | 2009 | $ | 57,187 | — | — | — | — | — | — | $ | 57,187 | ||||||||||||||||||||
David E. Longacre Vice President of Sales and Marketing | 2011 2010 | $ $ | 125,000 125,000 | $ | — 10,000 | — — | $ $ | 24,565 80,186 | — — | — — | — — | $ $ | 149,565 215,186 | ||||||||||||||||||
Scott G. Ehrenberg Chief Technology Officer and Secretary | 2011 2010 2009 | $ $ $ | 105,000 74,808 67,100 | — — — | — — — | $ $ | 178,380 89,877 — | — — — | — — — | — — — | $ $ $ | 283,380 164,685 67,100 | |||||||||||||||||||
Judith C. Norstrud Chief Financial Officer and Treasurer | 2011 2010 2009 | $ $ $ | 68,333 50,000 13,447 | — — — | — — — | $ $ $ | 82,365 82,930 | — — — | — — — | — — — | $ $ $ | 150,698 96,377 | |||||||||||||||||||
________________
| (1) | Mr. Tangredi |
| (2) | The amounts included in these columns are the aggregate dollar amounts of |
| (3) | Mr. Brown’s employment with us terminated on July 6, 2010. |
Narrative Disclosure to Summary Compensation Table
Timothy N. Tangredi. We are party to an employment agreement with Mr. Tangredi, our President, Chief Executive Officer, and director, which was amended and restated on September 14, 2011. Mr. Tangredi’s employment agreement provides for an initial term of three years commencing on September 14, 2011 with the term extending on the second anniversary thereof for an additional two-year period and on each subsequent anniversary of the commencement date for an additional year period. Mr. Tangredi’s initial base salary is $200,000. Mr. Tangredi’s base salary shall be increased annually, if applicable, by a sum equal to his current base salary multiplied by one third of the percentage increase in our yearly revenue compared to our prior fiscal year revenue; provided however any annual increase in Mr. Tangredi’s base salary shall not exceed a maximum of 50% for any given year. Any further increase in Mr. Tangredi’s base salary shall be at the sole discretion of our board of directors or compensation committee (if applicable). In addition, Mr. Tangredi will be eligible for bonus compensation at the discretion of board of directors, as well as option-based compensation under our 2009 Plan. Among the option grants Mr. Tangredi is eligible to receive under the employmentthis agreement he will be entitled to receiveis a grant to purchase up to 520,000 shares of common stock (52,000 shares upon giving effect to the anticipated 10-for-1 reverse stock split) upon the successful completion of this offering. For a full description of the terms of our agreement with Mr. Tangredi, please refer to the section below entitled “Certain Relationships and Related Party Transactions —Employment Agreements.”
Scott G. Ehrenberg. We are party to an employment agreement dated May 24, 2011 withIn 2010, Mr. Ehrenberg, our Chief Technology Officer and Secretary.Secretary, received a salary of $ 74,808 and he was granted an option to purchase up to 375,000 shares of common stock at an exercise price of $0.30 per share. The value of this option is approximately $89,877. In January and April of 2011, our Board granted Mr. Ehrenberg an option to purchase 625,000 shares at an exercise price of $.30 per share and 75,000 shares of our common stock at an exercise price of $0.40. The value of these options were $153,535 and $24,845, respectively. The above options were granted pursuant to the terms and conditions of the 2009 Long Term Incentive Plan. On May 24, 2011 we entered into an employment agreement with Mr. Ehrenberg. Mr. Ehrenberg’s employment agreement provides for an initial term of two years with the term extending on the second anniversary thereof for an additional one year period and on each subsequent anniversary of the agreement for an additional year period. Mr. Ehrenberg’s initial base salary is $110,000, with an increase to $165,000 per annum.annum after the date on which we obtain $10 million or more in equity financing . Additionally, at the discretion of our board of directors and its compensation committee, Mr. Ehrenberg may be eligible for an annual bonus which amount, if any, will not be below 50% of his effective base salary and not exceeding 100% of his then effective base salary; provided that, under certain extraordinary circumstances, Mr. Ehrenberg may be eligible for an annual bonus greater than 150% of his then effective base salary. After the completion of this offering, Mr. Ehrenberg is eligible to receive a one-time payment of $20,000 for each U.S. patent of which he is the originator and the first name listed on the patent as inventor of the intellectual property described in such patent. In addition to any other compensation which Mr. Ehrenberg may receive under the agreement, he will be granted a stock option to purchase 40,000 shares of common stock (4,000 shares upon giving effect to the anticipated 10-for-1 reverse stock split) at the end of each year or on the annual anniversary of the agreement, whichever is mutually acceptable to the Company and Mr. Ehrenberg. For a full description of the terms of our agreement with Mr. Ehrenberg, please refer to the section below entitled “Certain Relationships and Related Party Transactions — Employment Agreements.”
David Longacre. Mr. Longacre receives a salary of $125,000 per year and may receive a bonus which is measured by meeting certain performance goals. In 2010, received a bonus of 10,000 and was granted two options which permit him to purchase up to 200,000 shares of common stock at an exercise price of $0.28 per share and 100,000 shares of common stock at an exercise price of $0.30 per share. The value of each option is $51,785 and $28,401 respectively. In January of 2011, Mr. Longacre was granted an option to purchase up to 100,000 shares of common stock at an exercise price of $0.30 per shares and a value of $34,576. All options granted to Mr. Longacre were granted pursuant to the terms and conditions of the 2009 Long Term Incentive Plan.
Judith Norstrud. In 2011, Ms. Norstrud salary was increased to $72,000. In addition, during that year, Ms. Norstrud received three option awards to purchase 100,000, 137,500 and 35,000 shares of our common stock at exercise prices of $0.30, $0.40 and $0.35 per share, respectively. The value of these options are $24,566, $45,549 and $12,250, respectively. The options were granted pursuant to the terms and conditions of the 2009 Long Term Incentive Plan
Patricia K. Tangredi. We are a party to an employment agreement with Patricia Tangredi, our general counsel and wife of Timothy Tangredi, our Chief Executive Officer, which agreement was amended and restated on April 8, 2011. Ms. Tangredi’s employment agreement provides for an initial term of four years with the term extending on the fourth anniversary thereof for an additional one year period and on each subsequent anniversary of the agreement for an additional year period. Ms. Tangredi’s initial base salary is $120,000, with an increase to $150,000 per annum or such higher sum as our board of directors may set after the date on which we obtain $10 million or more in equity or debt financing. In addition to any other compensation which she may receive under the agreement, Ms. Tangredi shall be granted options to purchase a minimum of 50,000 shares of our common stock
Outstanding Equity Awards
The following table summarizes the outstanding equity awards for the year ended December 31, 2010 prior to the effect of the anticipated 10-for-1 reverse stock split:2011 and 2010:
| OPTION AWARDS | STOCK AWARDS | |||||||||||||||||||||||||||||||||||
Name (a) | Number of securities underlying unexercised options (#) Exercisable (b) | Number of securities underlying unexercised options (#) Unexercisable (c) | Equity Incentive Plan Awards: Number of Securities underlying unexercised unearned options (#) (d) | Option exercise price ($) (e) | Option expiration date (f) | Number of shares or units of stock that have not vested (#) (g) | Market value of shares or units of stock that have not vested ($) (h) | Equity incentive plan awards: number of unearned shares, units or other rights that have not vested (#) (i) | Equity incentive plan awards: Market or payout value of unearned shares, units or other rights that have not vested ($) (j) | |||||||||||||||||||||||||||
| Timothy N. Tangredi (1) | 825,000 | — | — | $ | 0.26 | 9/23/2014 | — | — | — | — | ||||||||||||||||||||||||||
| 150,000 | — | — | $ | 0.10 | 5/10/2015 | — | — | — | — | |||||||||||||||||||||||||||
| 120,000 | — | — | $ | 0.10 | 10/1/2015 | — | — | — | — | |||||||||||||||||||||||||||
| 40,000 | — | — | $ | 0.30 | 5/2/2016 | — | — | — | — | |||||||||||||||||||||||||||
| 110,000 | — | — | $ | 0.55 | 11/1/2016 | — | — | — | — | |||||||||||||||||||||||||||
| 140,000 | — | — | $ | 0.55 | 2/20/2017 | — | — | — | — | |||||||||||||||||||||||||||
| 300,000 | — | — | $ | 0.21 | 8/18/2017 | — | — | — | — | |||||||||||||||||||||||||||
| 350,000 | — | — | $ | 0.21 | 1/30/2018 | — | — | — | — | |||||||||||||||||||||||||||
| 3,000,000 | * | — | — | $ | 0.36 | 8/4/2013 | — | — | — | — | ||||||||||||||||||||||||||
| 75,000 | — | — | $ | 0.30 | 8/4/2018 | — | — | — | — | |||||||||||||||||||||||||||
| 100,000 | — | — | $ | 0.42 | 11/12/2019 | — | — | — | — | |||||||||||||||||||||||||||
| 3,540,058 | — | — | $ | 0.42 | 11/12/2019 | — | — | — | — | |||||||||||||||||||||||||||
| 400,000 | — | — | $ | 0.30 | 6/25/2020 | — | — | — | — | |||||||||||||||||||||||||||
| * Warrant | ||||||||||||||||||||||||||||||||||||
| Scott G. Ehrenberg (2) | 140,000 | — | — | $ | 0.26 | 9/23/2014 | — | — | — | — | ||||||||||||||||||||||||||
| 110,000 | — | — | $ | 0.10 | 5/10/2015 | — | — | — | — | |||||||||||||||||||||||||||
| 80,000 | — | — | $ | 0.10 | 10/1/2015 | — | — | — | — | |||||||||||||||||||||||||||
| 40,000 | — | — | $ | 0.55 | 11/1/2016 | — | — | — | — | |||||||||||||||||||||||||||
| 120,000 | — | — | $ | 0.55 | 2/20/2017 | — | — | — | — | |||||||||||||||||||||||||||
| 50,000 | — | — | $ | 0.21 | 8/18/2017 | — | — | — | — | |||||||||||||||||||||||||||
| 250,000 | — | — | $ | 0.30 | 8/4/2018 | — | — | — | — | |||||||||||||||||||||||||||
| *250,000 | — | — | $ | 0.30 | 8/4/2013 | — | — | — | — | |||||||||||||||||||||||||||
| 125,000 | 250,000 | 250,000 | $ | 0.30 | 6/25/2020 | — | — | — | — | |||||||||||||||||||||||||||
| ________ | ||||||||||||||||||||||||||||||||||||
| * Warrant | ||||||||||||||||||||||||||||||||||||
| Judith C. Norstrud (3) | 200,000 | — | — | $ | 0.45 | 10/15/2019 | — | — | — | — | ||||||||||||||||||||||||||
| 50,000 | 100,000 | 100,000 | $ | 0.30 | 6/25/2020 | — | — | — | — | |||||||||||||||||||||||||||
| David E. Longacre (4) | — | 200,000 | — | $ | 0.28 | 1/20/2020 | — | — | — | — | ||||||||||||||||||||||||||
| — | 100,000 | — | $ | 0.30 | 7/6/2020 | — | — | — | — | |||||||||||||||||||||||||||
| OPTION AWARDS | STOCK AWARDS | |||||||||||||||||||||||||||||||||||
Name (a) | Number of securities underlying unexercised options (#) Exercisable (b) | Number of securities underlying unexercised options (#) Unexercisable (c) | Equity Incentive Plan Awards: Number of Securities underlying unexercised unearned options (#) (d) | Option exercise price ($) (e) | Option expiration date (f) | Number of shares or units of stock that have not vested (#) (g) | Market value of shares or units of stock that have not vested ($) (h) | Equity incentive plan awards: number of unearned shares, units or other rights that have not vested (#) (i) | Equity incentive plan awards: Market or payout value of unearned shares, units or other rights that have not vested ($) (j) | |||||||||||||||||||||||||||
| Timothy N. Tangredi (1) | 825,000 | — | — | $ | 0.26 | 9/23/2014 | — | — | — | — | ||||||||||||||||||||||||||
| 150,000 | — | — | $ | 0.10 | 5/10/2015 | — | — | — | — | |||||||||||||||||||||||||||
| 120,000 | — | — | $ | 0.10 | 10/1/2015 | — | — | — | — | |||||||||||||||||||||||||||
| 40,000 | — | — | $ | 0.30 | 5/2/2016 | — | — | — | — | |||||||||||||||||||||||||||
| 110,000 | — | — | $ | 0.55 | 11/1/2016 | — | — | — | — | |||||||||||||||||||||||||||
| 140,000 | — | — | $ | 0.55 | 2/20/2017 | — | — | — | — | |||||||||||||||||||||||||||
| 300,000 | — | — | $ | 0.21 | 8/18/2017 | — | — | — | — | |||||||||||||||||||||||||||
| 350,000 | — | — | $ | 0.21 | 1/30/2018 | — | — | — | — | |||||||||||||||||||||||||||
| 3,000,000 | * | — | — | $ | 0.36 | 8/4/2013 | — | — | — | — | ||||||||||||||||||||||||||
| 75,000 | — | — | $ | 0.30 | 8/4/2018 | — | — | — | — | |||||||||||||||||||||||||||
| 100,000 | — | — | $ | 0.42 | 11/12/2019 | — | — | — | — | |||||||||||||||||||||||||||
| 3,540,058 | — | — | $ | 0.42 | 11/12/2019 | — | — | — | — | |||||||||||||||||||||||||||
| 400,000 | — | — | $ | 0.30 | 6/25/2020 | — | — | — | — | |||||||||||||||||||||||||||
| 125,000 | — | — | $ | 0.30 | 1/18/2021 | — | — | — | — | |||||||||||||||||||||||||||
| 100,000 | — | — | $ | 0.40 | 4/5/2021 | — | — | — | — | |||||||||||||||||||||||||||
| 45,000 | — | — | $ | 0.35 | 10/7/2021 | — | — | — | — | |||||||||||||||||||||||||||
______
| * Warrant | |||||||||||||||||||||||||||||||||||||||||||||||||||||||||||||||||||||||||||||||||||||||||||
46
| Scott G. Ehrenberg (2) | 140,000 | — | — | $ | 0.26 | 9/23/2014 | — | — | — | — | ||||||||||||||||||||||||||
| 110,000 | — | — | $ | 0.10 | 5/10/2015 | — | — | — | — | |||||||||||||||||||||||||||
| 80,000 | — | — | $ | 0.10 | 10/1/2015 | ��� | — | — | — | |||||||||||||||||||||||||||
| 40,000 | — | — | $ | 0.55 | 11/1/2016 | — | — | — | — | |||||||||||||||||||||||||||
| 120,000 | — | — | $ | 0.55 | 2/20/2017 | — | — | — | — | |||||||||||||||||||||||||||
| 50,000 | — | — | $ | 0.21 | 8/18/2017 | — | — | — | — | |||||||||||||||||||||||||||
| 250,000 | — | — | $ | 0.30 | 8/4/2018 | — | — | — | — | |||||||||||||||||||||||||||
| *250,000 | — | — | $ | 0.30 | 8/4/2013 | — | — | — | — | |||||||||||||||||||||||||||
| 125,000 | 250,000 | 250,000 | $ | 0.30 | 6/25/2020 | — | — | — | — | |||||||||||||||||||||||||||
| 625,000 | — | — | $ | 0.30 | 1/18/2021 | — | — | — | — | |||||||||||||||||||||||||||
| 75,000 | — | — | $ | 0.40 | 4/5/2021 | — | — | — | — | |||||||||||||||||||||||||||
| ________ | ||||||||||||||||||||||||||||||||||||
| * Warrant | ||||||||||||||||||||||||||||||||||||
| Judith C. Norstrud (3) | 200,000 | — | — | $ | 0.45 | 10/15/2019 | — | — | — | — | ||||||||||||||||||||||||||
| 50,000 | 100,000 | 100,000 | $ | 0.30 | 6/25/2020 | — | — | — | — | |||||||||||||||||||||||||||
| 100,000 | — | — | $ | 0.30 | 1/18/2021 | — | — | — | — | |||||||||||||||||||||||||||
| 137,500 | — | — | $ | 0.40 | 4/5/2021 | — | — | — | — | |||||||||||||||||||||||||||
| 35,000 | — | — | $ | 0.35 | 10/7/2021 | — | — | — | — | |||||||||||||||||||||||||||
| David E. Longacre (4) | — | 200,000 | — | $ | 0.28 | 1/20/2020 | — | — | — | — | ||||||||||||||||||||||||||
| — | 100,000 | — | $ | 0.30 | 7/06/2020 | — | — | — | — | |||||||||||||||||||||||||||
| — | 100,000 | — | $ | 0.30 | 1/18/2021 | — | — | — | — | |||||||||||||||||||||||||||
| OPTION AWARDS | STOCK AWARDS | |||||||||||||||||||||||||||||||||||
Name (a) | Number of securities underlying unexercised options (#) Exercisable (b) | Number of securities underlying unexercised options (#) Unexercisable (c) | Equity Incentive Plan Awards: Number of Securities underlying unexercised unearned options (#) (d) | Option exercise price ($) (e) | Option expiration date (f) | Number of shares or units of stock that have not vested (#) (g) | Market value of shares or units of stock that have not vested ($) (h) | Equity incentive plan awards: number of unearned shares, units or other rights that have not vested (#) (i) | Equity incentive plan awards: Market or payout value of unearned shares, units or other rights that have not vested ($) (j) | |||||||||||||||||||||||||||
| Timothy N. Tangredi (1) | 82,500 | — | — | $ | 2.60 | 9/23/2014 | — | — | — | — | ||||||||||||||||||||||||||
| 15,000 | — | — | $ | 1.00 | 5/10/2015 | — | — | — | — | |||||||||||||||||||||||||||
| 12,000 | — | — | $ | 1.00 | 10/1/2015 | — | — | — | — | |||||||||||||||||||||||||||
| 4,000 | — | — | $ | 3.00 | 5/2/2016 | — | — | — | — | |||||||||||||||||||||||||||
| 11,000 | — | — | $ | 5.50 | 11/1/2016 | — | — | — | — | |||||||||||||||||||||||||||
| 14,000 | — | — | $ | 5.50 | 2/20/2017 | — | — | — | — | |||||||||||||||||||||||||||
| 30,000 | — | — | $ | 2.10 | 8/18/2017 | — | — | — | — | |||||||||||||||||||||||||||
| 35,000 | — | — | $ | 2.10 | 1/30/2018 | — | — | — | — | |||||||||||||||||||||||||||
| 300,000 | * | — | — | $ | 3.60 | 8/4/2013 | — | — | — | — | ||||||||||||||||||||||||||
| 7,500 | — | — | $ | 3.00 | 8/4/2018 | — | — | — | — | |||||||||||||||||||||||||||
| 10,000 | — | — | $ | 4.20 | 11/12/2019 | — | — | — | — | |||||||||||||||||||||||||||
| 354,006 | — | — | $ | 4.20 | 11/12/2019 | — | — | — | — | |||||||||||||||||||||||||||
| 40,000 | — | — | $ | 3.00 | 6/25/2020 | — | — | — | — | |||||||||||||||||||||||||||
| * Warrant | ||||||||||||||||||||||||||||||||||||
| Scott G. Ehrenberg (2) | 14,000 | — | — | $ | 2.60 | 9/23/2014 | — | — | — | — | ||||||||||||||||||||||||||
| 11,000 | — | — | $ | 1.00 | 5/10/2015 | — | — | — | — | |||||||||||||||||||||||||||
| 8,000 | — | — | $ | 1.00 | 10/1/2015 | — | — | — | — | |||||||||||||||||||||||||||
| 4,000 | — | — | $ | 5.50 | 11/1/2016 | — | — | — | — | |||||||||||||||||||||||||||
| 12,000 | — | — | $ | 5.50 | 2/20/2017 | — | — | — | — | |||||||||||||||||||||||||||
| 5,000 | — | — | $ | 2.10 | 8/18/2017 | — | — | — | — | |||||||||||||||||||||||||||
| 25,000 | — | — | $ | 3.00 | 8/4/2018 | — | — | — | — | |||||||||||||||||||||||||||
| *25,000 | — | — | $ | 3.00 | 8/4/2013 | — | — | — | — | |||||||||||||||||||||||||||
| 12,500 | 25,000 | 25,000 | $ | 3.00 | 6/25/2020 | — | — | — | — | |||||||||||||||||||||||||||
| * Warrant | ||||||||||||||||||||||||||||||||||||
| Judith C. Norstrud (3) | 20,000 | — | — | $ | 4.50 | 10/15/2019 | — | — | — | — | ||||||||||||||||||||||||||
| 5,000 | 10,000 | 10,000 | $ | 3.00 | 6/25/2020 | — | — | — | — | |||||||||||||||||||||||||||
| David E. Longacre (4) | — | 20,000 | — | $ | 2.80 | 1/20/2020 | — | — | — | — | ||||||||||||||||||||||||||
| — | 10,000 | — | $ | 3.00 | 7/6/2020 | — | — | — | — | |||||||||||||||||||||||||||
| (1) | The April 2008 warrant grant to Mr. Tangredi for 3,000,000 shares |
| (2) | All stock options issued to Mr. Ehrenberg prior to December 31, 2009 were issued under the 2000 Plan. The remaining options issued under the 2009 Plan. |
| (3) | All stock options issued to Ms. Norstrud prior to December 31, 2009 were issued under the 2000 Plan. The remaining options were issued under the 2009 Plan. |
| (4) | All stock options issued to Mr. Longacre were issued under the 2009 Plan. |
SECURITY OWNERSHIP OF CERTAIN BENEFICIAL OWNERS AND MANAGEMENT
The following table sets forth information as of the date of this prospectus as to each person or group who is known to us to be the beneficial owner of more than 5% of our outstanding voting securities and as to the security and percentage ownership of each of our executive officers, directors and nominees and of all of our officers, directors and nominees as a group.
Beneficial ownership is determined under the rules of the SEC and generally includes voting or investment power over securities. The number of shares shown as beneficially owned in the tables below are calculated pursuant to Rule 13d-3(d)(1) of the Exchange Act. Under Rule 13d-3(d)(1), shares not outstanding that are subject to options, warrants, rights or conversion privileges exercisable within 60 days are deemed outstanding for the purpose of calculating the number and percentage owned by such person, but not deemed outstanding for the purpose of calculating the percentage owned by each other person listed. Except in cases where community property laws apply or as indicated in the footnotes to this table, we believe that each shareholder identified in the table possesses sole voting and investment power over all of the shares of common stock shown as beneficially owned by the shareholder.
48
The address for each of the persons named below is 11552 Prosperous Drive, Odessa, FL 33556, unless otherwise indicated.
Applicable percentage ownership in the following table is based on approximately 36,834,73537,517,604 shares of common stock outstanding as of September 12, 2011 (3,683,474 shares of common stock upon giving effect to the anticipated 10-for-1 reverse stock split)February 6 , 2012 plus, for each individual, any securities that individual has the right to acquire within 60 days of September 12, 2011.February 6 , 2012. The following table does not reflect any conversion of notes or accrued compensation which may occur within the above-mentioned 60 day period.
| Name of Beneficial Owner | Common Stock Beneficially Owned Number of Shares of Common Stock | Percentage of Class | Common Stock Beneficially Owned Number of Shares of Common Stock after giving effect to the anticipated reverse stock | |||||||||
| Timothy N. Tangredi | ||||||||||||
| (Officer and Chairman) (1) | 12,230,477 | 25.0 | % | 1,223,048 | ||||||||
| David Longacre (Officer) (2) | 100,001 | .3 | % | 10,000 | ||||||||
| Scott G. Ehrenberg (3) (Officer) | 2,077,800 | 5.4 | % | 207,780 | ||||||||
| Judith Norstrud (Officer) (4) | 537,500 | 1.4 | % | 53,750 | ||||||||
| Raymond Kazyaka Sr. (Director) (5) | 1,129,600 | 3.0 | % | 112,960 | ||||||||
| Robert W. Schwartz (Director) (6) | 1,099,600 | 2.9 | % | 109,960 | ||||||||
| Richard Rutkowski (Director Nominee) | 0 | 0.0 | % | 0 | ||||||||
| Lon Bell (Director Nominee) | 0 | 0.0 | % | 0 | ||||||||
| Peter Termyn (Director Nominee) | 0 | 0.0 | % | 0 | ||||||||
| Executive officers, directors and nominees, as a group (9 persons) | 17,174,978 | 31.9 | % | 1,717,498 | ||||||||
| Brian A. Kelly | ||||||||||||
| 181C Hague Blvd. Glenmont, N.Y. 12077 | 2,254,085 | 6.1 | % | 225,409 | ||||||||
| Michael Gostomski (7) | ||||||||||||
| 1666 Valley View Dr. Winnona, MN 55987 | 3,355,535 | 8.9 | % | 335,554 | ||||||||
| Louis M. Jaffe (8) | ||||||||||||
| 1500 S. Ocean Blvd #5201 Boca Raton, FL 33432 | 3,684,300 | 9.7 | % | 368,430 | ||||||||
| Mark Nordlich (9) | ||||||||||||
| 152 West 575th St. 4th Floor New York, NY 10019 | 3,680,436 | 9.99 | % | 368,044 | ||||||||
| Leonard Samuels ( 10 ) | ||||||||||||
| 1011 Centennial Road Penn Valley, PA 19072 | 13,478,165 | 32.3 | % | 1,347,817 | ||||||||
| Leah Kaplan Samuels ( 11 ) | ||||||||||||
| 1011 Centennial Road Penn Valley, PA 19072 | 3,629,696 | 9.6 | % | 362,970 | ||||||||
| Name of Beneficial Owner | Common StockBeneficially OwnedNumber of Sharesof CommonStock | Percentage ofClass | ||||||
Timothy N. Tangredi | ||||||||
(Officer and Chairman) (1) | 12,310,477 | 25.0 | % | |||||
David Longacre (Officer) (2) | 100,001 | .3 | % | |||||
Scott G. Ehrenberg (3) (Officer) | 2,077,800 | 5.3 | % | |||||
Judith Norstrud (Officer) (4) | 572,500 | 1.5 | % | |||||
Raymond Kazyaka Sr. (Director) (5) | 1,174,600 | 3.0 | % | |||||
Robert W. Schwartz (Director) (6) | 1,144,600 | 3.0 | % | |||||
Peter Termyn (Director Nominee) | 0 | 0.0 | % | |||||
Executive officers, directors and nominees, as a group (9 persons) | 17,379,978 | 31.8 | % | |||||
Brian A. Kelly | ||||||||
181C Hague Blvd. Glenmont, N.Y. 12077 | 2,254,085 | 6.0 | % | |||||
Michael Gostomski (7) | ||||||||
1666 Valley View Dr. Winnona, MN 55987 | 3,355,535 | 8.8 | % | |||||
Louis M. Jaffe (8) | ||||||||
1500 S. Ocean Blvd #5201 Boca Raton, FL 33432 | 3,684,300 | 9.5 | % | |||||
Mark Nordlicht (9) | ||||||||
152 West 575th St. 4th Floor New York, NY 10019 | 3,793,240 | 9.99 | % | |||||
Leonard Samuels (10) | ||||||||
1011 Centennial Road Penn Valley, PA 19072 | 13,478,165 | 31.8 | % | |||||
Leah Kaplan Samuels (11) | ||||||||
1011 Centennial Road Penn Valley, PA 19072 | 3,629,696 | 9.4 | % | |||||
_________________
| (1) | Includes |
49
| (2) | Includes 100,001 shares of common stock |
| (3) | Includes |
| (4) | Includes |
| (5) | Includes |
| (6) | Includes |
| (7) | Includes 807,087 common shares issuable |
| (8) | Includes 666,500 shares of common stock |
| (9) | Includes 3,324,740 shares of common stock, |
| Includes 905,000 shares of common stock |
| Includes 905,000 shares of common stock |
Securities Authorized for Issuance under Equity Compensation Plans
In June 2000 and November 2009, our Board of Directors adopted, and our shareholders approved, the 2000 Incentive Compensation Plan and 2009 Long-Term Incentive Plan, respectively (together the “Plans”). The Plans provide for the granting of options to our qualified employees, independent contractors, consultants, directors and other individuals. The Company’s Board of Directors approved and made available 15,000,000 shares of common stock (1,500,000 upon giving effect to the anticipated 10-for-1 reverse stock split) to be issued pursuant to the 2009 Plan. The Plans permit grants of options to purchase common shares authorized and approved by our Board of Directors.
51
The following summarizes the information relating to outstanding stock options activity with employees during 2011, 2010 and 2009:
| Common Shares | Weighted Average Exercise Price | Weighted Average Remaining Contractual Term (in years) | Aggregate Intrinsic Value | |||||||||||||||||||||||||||||
Common Shares | Weighted Average Exercise Price | Weighted Average Remaining Contractual Term (in years) | Aggregate Intrinsic Value | |||||||||||||||||||||||||||||
| Outstanding at December 31, 2008 | 8,606,556 | $ | 0.26 | 7.58 | $ | 38,294 | 8,606,556 | $ | 0.26 | 7.58 | $ | 38,294 | ||||||||||||||||||||
| Granted | 4,190,058 | $ | 0.21 | — | — | 4,240,058 | $ | 0.21 | — | — | ||||||||||||||||||||||
| Exercised | (25,000 | ) | $ | 0.17 | — | $ | 3,250 | (25,000 | ) | $ | 0.17 | — | $ | 3,250 | ||||||||||||||||||
| Forfeited or expired | (472,732 | ) | $ | 0.58 | — | — | (472,732 | ) | $ | 0.58 | — | — | ||||||||||||||||||||
| Outstanding at December 31, 2009 | 12,298,882 | $ | 0.26 | 7.64 | $ | 1,052,839 | 12,348,882 | $ | 0.26 | 7.64 | $ | 1,052,839 | ||||||||||||||||||||
| Granted | 2,970,000 | $ | 0.30 | — | — | 2,970,000 | $ | 0.30 | — | — | ||||||||||||||||||||||
| Forfeited or expired | (371,125 | ) | $ | 0.32 | — | — | (371,125 | ) | $ | 0.32 | — | — | ||||||||||||||||||||
| Outstanding at December 31, 2010 | 14,897,757 | $ | 0.25 | 7.19 | $ | 946,754 | 14,947,757 | $ | 0.25 | 7.19 | $ | 946,754 | ||||||||||||||||||||
| Granted | 2,510,000 | $ | 0.3 3 | — | — | 2,535,000 | $ | 0.33 | — | — | ||||||||||||||||||||||
| Forfeited or expired | (136,667 | ) | $ | 0.11 | — | — | (136,667 | ) | $ | 0.11 | — | — | ||||||||||||||||||||
| Outstanding at June 30 , 2011 | 1 7,271,090 | $ | 0. 32 | 7. 04 | $ | 1,406,643 | ||||||||||||||||||||||||||
Outstanding at September 30, 2011 | 17,296,090 | $ | 0.32 | 6.79 | $ | 1,516,086 | ||||||||||||||||||||||||||
| Exercisable at June 3 0 , 2011 | 15 ,958,937 | $ | 0. 32 | 6. 86 | $ | 1,326,355 | ||||||||||||||||||||||||||
Exercisable at September 30, 2011 | 16,061,854 | $ | 0.32 | 6.62 | $ | 1,433,926 | ||||||||||||||||||||||||||
Common Shares | Weighted Average Exercise Price | Weighted Average Remaining Contractual Term (in years) | Aggregate Intrinsic Value | |||||||||||||
| Outstanding at December 31, 2008 | 860,656 | $ | 2.60 | 7.58 | $ | 38,294 | ||||||||||
| Granted | 419,006 | $ | 2.10 | — | — | |||||||||||
| Exercised | (2,500 | ) | $ | 1.70 | — | $ | 3,250 | |||||||||
| Forfeited or expired | (47,273 | ) | $ | 5.80 | — | — | ||||||||||
| Outstanding at December 31, 2009 | 1,229,889 | $ | 2.60 | 7.64 | $ | 1,052,839 | ||||||||||
| Granted | 297,000 | $ | 3.00 | — | — | |||||||||||
| Forfeited or expired | (37,113 | ) | $ | 3.20 | — | – | ||||||||||
| Outstanding at December 31, 2010 | 1,489,776 | $ | 2.50 | 7.19 | $ | 946,754 | ||||||||||
| Granted | 251 ,000 | $ | 3. 30 | — | — | |||||||||||
| Forfeited or expired | (13,667 | ) | $ | 1.10 | — | — | ||||||||||
| Outstanding at June 30 , 2011 | 1, 727,109 | $ | 3.20 | 7. 04 | $ | 1,406,643 | ||||||||||
| Exercisable at June 30 , 2011 | 1,5 95,894 | $ | 3.20 | 6. 86 | $ | 1,326,355 | ||||||||||
Stock compensation expense was approximately $651,000 for the year ended December 31, 2010 and $1,580,000 for the year ended December 31, 2009, including approximately $75,000 that was accrued for warrants issued subsequent to year end. The total fair value of shares vested during the years ended December 31, 2010 and 2009 was approximately $556,000 and $1,549,000, respectively.
As of December 31, 2010, there was approximately $222,000 of unrecognized employee stock-based compensation expense related to non-vested stock options, of which $129,000, $81,000 and $12,000 is expected to be recognized for the years ended December 31, 2011, 2012 and 2013, respectively.
CERTAIN RELATIONSHIPS AND RELATED PARTY TRANSACTIONS
The following is a description of transactions, or proposed transactions, since January 1, 2008, to which we have been a party in which the amount involved exceeded or will exceed the lesser of $120,000 or one percent of our total assets at year end for the last two completed fiscal years and in which any of our directors, nominees, executive officers, beneficial holders of more than 5% of our capital stock, or entities affiliated with them, had or will have a direct or indirect material interest.
We rent a building on a month to month basis from a related party which is wholly-owned by two shareholders of the Company, one of which is Timothy N. Tangredi, our Chief Executive Officer. The base monthly rent expense is $3,800 per month. We also pay the taxes, insurance and most repairs on the building. For the years ended December 31, 2011, 2010 and 2009, we recorded $48,792, $48,792 and $49,604, in rent expense to this related party, respectively. The Company recognized rent expense of approximately $11,400$12,198, $36,594, $12,198 and $22,800$36,594 for each of the three and sixnine months ended JuneSeptember 30, 2011 and 2010.the three and nine months ended September 30, 2010, respectively. At June 30,December 31, 2011 and December 31, 2010, $45,779$52,858 and $151,440, respectively, were included in accounts payable for amounts owed to these shareholders for rent.
52
Timothy N. Tangredi, our Chief Executive Officer and Chairman, is a founder and a member of the board of directors of Aegis BioSciences, LLC (“Aegis”). Mr. Tangredi currently owns 52% of Aegis’ outstanding equity and spends approximately one to two days per month on Aegis business for which he is compensated by Aegis. Aegis has two exclusive, world-wide licenses from us under which it has the right to use and sell products containing our polymer technologies in biomedical and health care applications. As a result of a $150,000 payment made by Aegis, the first license is considered fully paid and as such no additional license revenue will be forthcoming. Pursuant to the second license Aegis made an initial one-time payment of $50,000 and is to make royalty payments of 1.5% of the net sales price it receives with respect to any personal hygiene product, surgical drape or clothing products (the latter when employed in medical and animal related fields) and license revenue it receives should Aegis grant a sublicense to a third party. To date Aegis has sold no such products nor has it received any licensing fees requiring a royalty payment be made to us. We are currently negotiating to purchase all rights Aegis has in its patent applications, including without limitation, any rights it possesses to patent applications it co-owns with us,
E. Todd Tracy and potentially terminateMichael Stone, two individuals holding warrants as a result of the two licenses from us, subject to irrevocable sub-licenses, if any, for a one-time payment of $200,000 in cashFinancing exercised and $100,000 intendered their warrants on September 13, 2011 and received 537,037 and 145,832 shares of ourthe Company’s common stock. The common stock at the same price per share as the price offered to the public in this offering. As a member of Aegis, Mr. Tangredi will receive approximately $104,000 in cash and $52,000 in shares of our common stockwas issued pursuant to the proposed transaction, which we anticipate will be structured as an asset sale and expect will be contemporaneously consummated with the closing of this offering. We anticipate securing most, if not all,exemption from registration under Section 4(2) of the funds for this proposed purchase from our cash on hand prior to the closing of the offering.Securities Act
On September 6, 2011, RP Capital and Richardson and Patel, LLP, two entities holding warrants (one as a result of the Financing and the other as a part of a payment arrangement for services) tendered and exercised their warrants and received 244,897 and 188,225 shares of the Company’s common stock (24,490 and 18,823 shares, respectively, upon giving effect to the anticipated 10-for-1 reverse stock split).stock. The common stock was issued pursuant to an exemption from registration under Section 4(2) of the Securities Act.
On September 6, 2011, the Company issued 202,703 shares of common stock (20,270 shares upon giving effect to the anticipated 10-for-1 reverse stock split) to legal counsel, Richardson and Patel, LLP, in settlement of accounts payable for services rendered. The issuance of these securities was exempt from registration under Section 4(2) and Regulation D of the Securities Act.
On November 4, 2010, RP Capital elected to convert the balance of its 9% secured convertible note in the amount of $100,000 into 625,384 shares of our common stock (62,538 shares of common stock upon giving effect to the anticipated 10-for-1 reverse split).stock. RP Capital also received an additional five-year warrant to purchase up to 62,538 shares of common stock, at an exercise price of $0.75 per share (6,254 shares of common stock, at an exercise price of $7.50 upon giving effect to the anticipated 10-for-1 reverse split) in consideration for converting its 9% secured convertible note. The warrant is immediately exercisable and subject to adjustment for standard anti-dilution events.
On February 19, 2010, we obtained $620,000 of financing from RBC Capital Markets Corporation Custodian for Leonard Samuels IRA (“RBC”) in the form of an unsecured, interest-bearing note, due May 31, 2011 (the “Note”). The Note bears interest at 10% per annum. In connection with the loan, we granted RBC the right to participate in our subsequent financings until the maturity date (the “Right of Participation”). The Right of Participation entitles RBC the right to participate in subsequent financings up to the unpaid amount of the Note in such applicable subsequent financing. We agreed not to incur additional debt exceeding $500,000 during the Term of the Note without the note holder’s consent. On May 12, 2011, RBC elected to apply all of the proceeds due and payable pursuant to this note, in the principal amount of $620,000 plus accrued interest, to purchase our common stock. Pursuant to this transaction, RBC subscribed for and purchased 2,667,503 shares of common stock at a purchase price of $0.26 per share (266,750 shares of common stock upon giving effect to the anticipated 10-for-1 reverse split) resulting in an aggregate purchase price of $693,550 (the principal amount and related accrued interest under the note). As part of the purchase, RBC also received a five-year warrant to purchase 962,500 shares of Common Stock, at an exercise price of $0.45 per share (96,250 shares of common stock at an exercise price of $4.50 after giving effect to the anticipated reverse split).share. The warrants are immediately exercisable and subject to adjustment for standard anti-dilution events, including but not limited to stock dividends, split-up, reclassification or combination of our shares, exchange of stock for other Company stock, or certain capital reorganizations or reclassification of the capital stock or consolidation, merger or sale of substantially all our assets. In addition, as part of this transaction, the warrants issued to this investor on December 20, 2007 and December 31, 2007 were amended to include a cashless exercise provision.
On February 19, 2010, we obtained $250,000 of financing from Leah-Kaplan and Leonard Samuels (“Samuels”) in the form of an unsecured, interest bearing note, payable in full oneon June 30, 2010 (the “Note”). The Note bears interest at 10% per annum. In connection with the loan, we granted Samuels the right to participate in our subsequent financings until the maturity date. The maturity date of the note was extended to December 31, 2010. On December 27, 2010, the holders elected to apply all of the proceeds due and payable under the Note, including all accrued interest, to purchase our common stock. Pursuant to this transaction, the Samuels subscribed for and purchased 1,052,950 shares of common stock at a purchase price of $0.26 per share (105,295 shares of common stock, at a purchase price of $2.60 upon giving effect to the anticipated 10-for-1 reverse split) resulting in an aggregate purchase price of $273,767 (the principal amount and related accrued interest under the note).
In December, 2009, we obtained $1,000,000 of financing from Platinum-Montaur Life Sciences, LLC (“Investor”). Mark Nordlich,Nordlicht, who is a significant beneficial holder of our securities, is a control person with respect to the Investor. Pursuant to the terms of the note, we are to pay the holder simple interest at the rate of ten percent per annum commencing on the date of issuance with all interest and principal due and payable in cash on or before June 17, 2010. The note’s maturity date was extended to April 30, 2011. On March 22, 2011, the Company entered into a Securities Amendment and Exchange Agreement and an Amended and Restated Convertible Promissory Note (“2011 Convertible Note”, collectively “Exchange Agreements”) with this investor. Pursuant to the terms and subject to the conditions set forth in the Exchange Agreements, the Company and the Investor amended and restated the $1,000,000 unsecured promissory note issued by the Company to Investor on or about December 17, 2009 (“Original Note”) to, among other things, extend the term to March 22, 2012. Interest in the amount of 10% per annum, commencing on December 17, 2009 and calculated on a 365 day year, and the principal amount of $1,000,000 will be paid on March 22, 2012. Subject to the terms and conditions of the 2011 Convertible Note, including limitations on conversion, the outstanding principal and interest under the 2011 Convertible Note will automatically convert into shares of the Company’s common stock at the then-effective conversion price upon the closing of a qualified firm commitment underwritten public offering or may be voluntarily converted by the investor at anytime during the term. The initial conversion price is $0.26 per share ($2.60 upon giving effect to the anticipated 10-for-1 reverse stock split). Any principal or interest which is not converted will be repaid by the Company at the earlier of a qualified offering, (as defined in the 2011 Convertible Note which is filed as an exhibit to the Form 8K filed with the Securities and Exchange Commission on March 28, 2011), or March 22, 2012. Pursuant to and during the term of the 2011 Convertible Note, the Company will not issue or allow to exist any obligation for borrowed money, except for subordinate indebtedness in payment and priority, trade payables incurred in the ordinary course of business, purchase money secured indebtedness for equipment or inventory, unsecured and subordinate, or unsecured and subordinate working capital guarantees provided by, the Export Import Bank of the United States (the “EXIM Bank”), and indebtedness evidenced by the promissory note dated February 19, 2010 issued to RBC Capital Markets- Custodian of Leonard Samuels IRA (as amended) in the principal amount of $620,000. In addition, on March 22, 2011, in connection with the above Exchange Agreements, the Company entered into an Amendment to 2007 Warrant and an Amendment to 2009 Warrant to extend the terms of the Stock Purchase Warrant, dated on or about December 31, 2007, and Stock Purchase Warrant, dated on or about March 12, 2009, respectively, to March 22, 2016 and to provide for cashless exercise unless such warrant shares are registered for resale under a registration statement. In addition, on March 22, 2011, the Company issued a Stock Purchase Warrant to the Investor to purchase 1,000,000 shares of the Company’s common stock at $0.45 per share, (100,000 shares of the Company’s common stock at an exercise price of $4.50 per share upon giving effect to the anticipated 10-for-1 reverse split), exercisable commencing on the earliest of the consummation of the qualified offering (as defined in the Exchange Agreements), the date of conversion of the 2011 Convertible Note in full, or the date of conversion of the 2011 Convertible Note by the Investor in the greatest number of shares of the Company’s common stock not to exceed 9.99% beneficial ownership of Company outstanding common stock and terminating on March 22, 2016.
Also, on March 22, 2011, the Company entered into a 10% Note and Warrant Purchase Agreement, Secured Convertible Promissory Note and Patent Security Agreement (“Financing Agreements”) with the above Investor. Pursuant to the terms and subject to the conditions set forth in the Financing Agreements, the Investor has provided a bridge loan in the amount of $1,500,000 (“Loan”) to the Company, which is secured by all patents, patent applications and similar protections of the Company and all rents, royalties, license fees and “accounts” with respect to such intellectual property assets. Pursuant to the Secured Convertible Promissory Note (“Secured Note”), interest in the amount of 10% per annum, calculated on a 365 day year, and the principal amount of $1,500,000 is due and payable on March 22, 2012, but repayment is accelerated upon a qualified firm commitment underwritten public offering (as defined in the note). In the event of such qualified offering, and subject to the terms and conditions of the Secured Note, the outstanding principal and interest under the Secured Note will automatically convert, subject to the limitations on conversion described in the note, into shares of the Company’s common stock at the then-effective conversion price upon the closing of such qualified offering. The initial conversion price is $0.26 per share ($2.60 upon giving effect to the anticipated 10-for-1 reverse stock split) which is subject to adjustment for standard anti-dilution provisions. Any principal or interest which is not converted will be repaid by the Company at the earlier of a qualified offering or March 22, 2012. No cash fees were paid to any party to the transaction in exchange for lending the money.
On March 22, 2011, in connection with the Financing Agreements, the Company issued a Stock Purchase Warrant to the Investor to purchase 3,000,000 shares of the Company’s common stock at $0.45 per share, (300,000 shares of the Company’s common stock at an exercise price of $4.50 per share upon giving effect to the anticipated 10-for-1 reverse split), exercisable until March 22, 2016. Pursuant to and during the term of the Secured Note, the Company will not issue or permit to exist any obligation for borrowed money, except for trade payables incurred in the ordinary course of business, purchase money secured indebtedness for equipment or inventory, unsecured and subordinate indebtedness to, or unsecured and subordinate working capital guarantees provided by, the EXIM Bank, the promissory note dated February 19, 2010 issued to RBC Capital Markets- Custodian of Leonard Samuels IRA (as amended) in the principal amount of $620,000, the Amended and Restated Convertible Promissory Note, dated March 22, 2011, issued to the Investor in the principal amount of $1,000,000 and other unsecured indebtedness for borrowed money in an amount not to exceed $750,000.
Pursuant to the Patent Security Agreement issued in connection with the Note and Warrant Purchase of March 22, 2011, the Company shall not, without the Investor’s prior consent, sell, dispose or otherwise transfer all or any portion of the Collateral, except for license grants in the ordinary course of business. In addition, the Company will take all actions reasonably necessary to prosecute applications for patents and maintain all patents, and to seek to recover damages for infringement, misappropriation or dilution of the Collateral with limited exceptions.
On December 8, 2009, Company obtained $300,000 of financing from Michael Gostomski (“Gostomski”) in the form of an unsecured, interest bearing note, due January 16, 2011 (the “Note”). The Note bears interest at 7% per annum. On December 30, 2010, the holder elected to apply all of the proceeds due and payable under the Note, including all accrued interest, to purchase the Company’s Common Stock. Pursuant to this transaction, Gostomski subscribed for and purchased 1, 268,4721,268,472 shares of Common Stock at a purchase price of $0.26 per share, (126, 847 shares of the Company’s common stock at an exercise price of $2.60 per share upon giving effect to the anticipated 10-for-1 reverse stock split), resulting in an aggregate purchase price of $329,402.
On November 23, 2009, Michael Stone elected to convert the interest accrued on his 9% secured convertible note in the amount of $34,027 into 170,137 shares of our common stock (17,014 shares of the Company’s common stock upon giving effect to the anticipated 10-for-1 reverse stock split). The note was modified so as to end accrual of interest on November 20, 2009.
On October 9, 2009, Leonard and Leah Kaplan Samuels JTWROS and RBC Capital- Custodian for Leonard Samuels IRA elected to convert their 9% secured convertible notes and the related accrued interest in the amounts of $174,349 and $638,693 into 871,746 and 3,193,466 shares of our common stock, respectively (87,175 and 319,347 shares our common stock, respectively, upon giving effect to the anticipated 10-for-1 reverse stock split).respectively. Said investors also received an additional five-year warrant to purchase up to 75,000 and 275,000 shares, respectively, of common stock, at an exercise price of $0.75 per share (7,500 and 27,500 shares, respectively, of common stock, at an exercise price of $7.50 per share upon giving effect to the anticipated 10-for-1 reverse stock split) in consideration for converting their 9% secured convertible note. The warrant is immediately exercisable and subject to adjustment for standard anti-dilution events.
On September 17, 2009, we entered into subscription agreements with Leonard and Leah Kaplan Samuels pursuant to which the investors purchased 800,000 shares of our common stock (80,000 shares of our common stock upon giving effect to the anticipated 10-for-1 reverse stock split).stock. As part of the purchase, the Samuels received a five year warrant to purchase 80,000 shares of Common Stock, at an exercise price of $0.75 per share (8,000 shares of our common stock at an exercise price of $7.50 upon giving effect to the anticipated 10-for-1 reverse stock split). The aggregate gross proceeds received by us for the sale was $200,000. The warrants are immediately exercisable and subject to adjustment for standard anti-dilutions events.
On September 11, 2009, to evidence a loan, we issued Timothy N. Tangredi a promissory note in the principal amount of $124,000. The note is unsecured and bears a simple interest rate of 9% per annum. This note was paid in full prior to October 15, 2009.
On September 11, 2009, to evidence a loan, we issued a promissory note in the principal amount of $37,000 to Ethos Business Ventures. Our CEO, Mr. Tangredi, is a principal owner of this entity. The note is unsecured and bears a simple interest rate of 9% per annum. This note was paid in full prior to October 15, 2009.
On June 30, 2009, we entered into a subscription agreement with the Louis M. Jaffe 2004 Intangible Asset Trust U/A DTD 5/24/04 pursuant to which the trust purchased 596,154 shares of Company’s Common Stock and a five year warrant to purchase an additional 298,078 shares of Common Stock at an exercise price of $0.26 per share (59,615 shares of Company’s Common Stock and a five year warrant to purchase an additional 29, 808 shares of Common Stock at an exercise price of $2.60 per share upon giving effect to the anticipated 10-for-1 reverse stock split) .share. The aggregate gross proceeds received by Company for this sale was $155,000. The warrants are immediately exercisable and subject to adjustment for standard anti-dilution events.
On June 10, 2009, to evidence a loan, we issued a promissory note in the principal amount of $10,000 to Ethos Business Ventures, an entity in which our Chief Executive Officer holds a position. The note is unsecured and bears a simple interest rate of 9% per annum. The note was paid in full July of 2009.
On May 21, 2009, to evidence a loan, we issued our Chief Executive Officer a promissory note in the principal amount of $51,900. The note is unsecured and bears a simple interest rate of 9% per annum. The note was paid in full prior to July 31, 2009. On April 30, 2009, the Company issued a five year warrant to purchase 250,000 shares of Common Stock at an exercise price of $0.26 per share (25,000 shares of Common Stock at an exercise price of $2.60 per share upon giving effect to the anticipated 10-for-1 reverse stock split) pursuant to Louis Jaffe pursuant to a consulting agreement. The warrants are immediately exercisable and subject to adjustment for standard anti-dilution events.
On April 30, 2009, MSSRPS, Inc. elected to convert its 9% secured convertible note and the related accrued interest in the amounts of $167,125 into 835,623 shares of common stock (83,562 shares of Common Stock upon giving effect to the anticipated 10-for-1 reverse stock split). This investor also received an additional warrant to purchase up to 249,750 shares of common stock at an exercise price of $0.25 per share (24,975 shares of common stock at an exercise price of $2.50 per share upon giving effect to the anticipated 10-for-1 reverse stock split) in consideration for converting its 9% secured convertible note. The warrant is immediately exercisable and subject to adjustment for standard anti-dilution events.
On April 6, 2009 the Louis M. Jaffe 2004 Intangible Asset Trust U/A DTD 5/24/04 elected to convert its 9% secured convertible notes and the related accrued interest in the amounts of $110,849 into 554,247 shares of common stock (55,425 shares of Common Stock upon giving effect to the anticipated 10-for-1 reverse stock split).stock. This investor also received an additional warrant to purchase up to 166,500 shares of common stock at an exercise price of $0.25 per share (16,650 shares of common stock at an exercise price of $2.50 per share upon giving effect to the anticipated 10-for-1 reverse stock split) in consideration for converting its 9% secured convertible note. The warrant is immediately exercisable and subject to adjustment for standard anti-dilution events.
On March 9, 2009, we entered into a subscription agreement Michael Gostomski pursuant to which Mr. Gostomski purchased 576,923 shares of common stock and a five year warrant to purchase an additional 288,462 shares of common stock at an exercise price of $0.26 per share (57,692 shares of common stock and a five year warrant to purchase an additional 28,846 shares of common stock at an exercise price of $2.60 per share upon giving effect to the anticipated 10-for-1 reverse stock split).share. The aggregate gross proceeds received by us for this sale was $150,000. The warrant is immediately exercisable and subject to adjustment for standard anti-dilutions events.
On February 16, 2009, and March 12, 2009, Michael Gostomski and Platinum Montaur Life Sciences, L.L.C.; respectively, elected to convert their 9% secured convertible notes and the related accrued interest in the amounts of $83,007 and $664,948 into 415,038 and 3,324,740 shares of common stock, respectively (41,504 and 332,474 shares of common stock, respectively upon giving effect to the anticipated 10-for-1 reverse stock split).respectively. Such investors also received an additional warrant to purchase up to 124,875 and 999,000 shares of common stock, respectively, at an exercise price of $0.25 per share (12,488 and 99,900 shares of common stock, respectively, and $2.50 per share upon giving effect to the anticipated 10-for-1 reverse stock split) in consideration for converting their 9% secured convertible note. The warrants are immediately exercisable and subject to adjustment for standard anti-dilution events.
In August 2008, we issued a five year warrant to purchase 250,000 shares of common stock (25,000 shares of Common Stock upon giving effect to the anticipated 10-for-1 reverse stock split)stock) to Scott Ehrenberg our Chief Technology Officer and Secretary, in recognition for Mr. Ehrenberg’s achievement of certain company goals. The fair value of the warrant issued is approximately $49,000. The warrant vested upon issuance and has an exercise price of $0.30 per share ($3.00 per share upon giving effect to the anticipated 10-for-1 reverse stock split).share.
In April 2008, we issued a warrant to purchase 3,000,000 shares of common stock at an exercise price of $0.36 per share (300,000 shares of Common Stock at an exercise price of $3.60 upon giving effect to the anticipated 10-for-1 reverse stock split) to Mr. Tangredi in recognition for Mr. Tangredi’s achievement of the following goals: negotiating conversion of the convertible notes issued in the Additional Financing, securing a release with respect to the consulting agreement with Gray Capital Partners, Inc. and securing and closing upon the Financing. The fair value of the warrant issued is approximately $687,000.
In June 2008 we agreed to issue and have since issued 100,000 shares of common stock (10,000 shares of Common Stock upon giving effect to the anticipated 10-for-1 reverse stock split) to Gemini Strategies, LLC in connection with consulting services. The fair value of the equity instruments issued for these services is approximately $51,000. Gemini Strategies, LLC is related to Gemini Master Fund Ltd., a convertible note holder.
In February of 2008, we issued 20,000 shares of our common stock (2,000 shares of Common Stock upon giving effect to the anticipated 10-for-1 reverse stock split) to an employee for cash consideration of $2,000 upon the exercise of a stock option granted under our 2000 Plan. The shares were issued in reliance upon an exemption for registration under Rule 701.
In January 2008 we closed on an aggregate of $2,950,000 in gross proceeds from the private sale to 21 accredited investors of 9% secured convertible notes and warrants to purchase 14,750,000 shares of our Common Stock at an exercise price of $0.25 per share (1,475,000 shares of Common Stock at an exercise price of $2.50 per share upon giving effect to the anticipated 10-for-1 reverse stock split).share. Pursuant to the terms of this financing we granted the investors a security interest in certain of our assets. We entered into an agreement with placement agent, Legend Merchant Group, Inc. on October 5, 2007 pursuant to which, Legend Merchant Group, Inc. received a cash commission equal to 8% of the gross proceeds raised by Legend Merchant (and its subagent), which totaled $2,800,000, plus a warrant equal to 10% of the number of shares of common stock underlying certain warrants issued to convertible note holders, or 1,400,000 at $0.25 per share (140,000 shares at $2.50 per share upon giving effect to the anticipated 10-for-1 reverse stock split).share.
We also have accrued compensation due to the Chief Executive Officer and one other employee for deferred salaries earned and unpaid as of JuneSeptember 30, , 2011 and December 31, 2011, 2010, 2009 and 2008 of $1,405, 190 ,$1,405,190, $1,405,190, $1,426,022, $1,314,356 and $1,147,389, respectively.
Employment Agreements
In addition we have the following employment agreements with our officers and significant employees:
Timothy N. Tangredi. We are party to an employment agreement with Mr. Tangredi, our President, Chief Executive Officer, and director. The employment agreement, as amended and restated on September 14, 2011, sets forth Mr. Tangredi’s compensation level and eligibility for salary increases, bonuses, benefits, and option grants. Mr. Tangredi’s employment agreement provides for an initial term of three years commencing on September 14, 2011 with the term extending on the second anniversary thereof for an additional two-year period and on each subsequent anniversary of the commencement date for an additional year period. Mr. Tangredi’s initial base salary is $200,000. Mr. Tangredi’s base salary shall be increased annually, if applicable, by a sum equal to his current base salary multiplied by one third of the percentage increase in our yearly revenue compared to our prior fiscal year revenue; provided however any annual increase in Mr. Tangredi’s base salary shall not exceed a maximum of 50% for any given year. Any further increase in Mr. Tangredi’s base salary shall be at the sole discretion of our board of directors or compensation committee (if applicable). Additionally, at the discretion of our board of directors and its compensation committee, Mr. Tangredi may be eligible for an annual bonus, if any, of up to 100% of his then-effective base salary, if he meets or exceeds certain annual performance goals established by the board of directors. In addition to this bonus, Mr. Tangredi may be eligible for a separate merit bonus if approved by the board of directors, for specific extraordinary events or achievements such as a sale of a division, major license or distribution arrangement or merger. Mr. Tangredi is entitled to medical, disability and life insurance, as well as four weeks of paid vacation annually, an automobile allowance, reimbursement of all reasonable business expenses, automobile insurance and maintenance, and executive conference or educational expenses.
Under his employment agreement, in addition to any other compensation which he may receive, if we complete the offering Mr. Tangredi will be granted an option under our 2009 Plan to purchase up to 520,000 shares of our common stock (52,000 shares upon giving effect to the anticipated 10-for-1 reverse stock split) with an exercise price equal to the fair market value per share on the date of grant. This option will become vested and exercisable in thirds, with one third vested upon grant, another third at the one-year anniversary of the grant, and another third upon the second anniversary of the grant. The option shall have a term of ten years, shall be exercisable for up to three years after termination of employment (unless termination is for cause, in which event it shall expire on the date of termination), shall have a “cashless” exercise feature, and shall be subject to such additional terms and conditions as are then applicable to options granted under such plan provided they do not conflict with the terms set forth in the agreement.
59
If Mr. Tangredi’s employment is terminated for any reason, we will be obligated to pay him his accrued but unpaid base salary, bonus and accrued vacation pay, and any unreimbursed expenses (“Accrued Sums”).
In addition to any Accrued Sums owed, if Mr. Tangredi’s employment is terminated by us in the event of his disability or without cause or by Mr. Tangredi for good reason, he shall be entitled to:
(i) | an amount equal to the sum of (A) the greater of 150% of the base salary then in effect or $320,000 plus (B) the cash bonus and/or merit bonus, if any, awarded for the most recent year; |
(ii) | health and life insurance, a car allowance and other benefits set forth in the agreement until two years following termination of employment, and thereafter to the extent required by COBRA or similar statute; and |
(iii) | all stock options, to the extent they were not exercisable at the time of termination of employment, shall become exercisable in full. |
In addition to any Accrued Sum owed, in the event of termination upon death, Mr. Tangredi shall be entitled to (i) and (iii) above.
In addition to any Accrued Sums owed, in the event that Mr. Tangredi elects to terminate employment within one year following a change in control, he shall receive a lump sum payment equal to the sum of (a) the greater of his then current base salary or $210,000 plus (b) the cash bonus and merit bonus, if any, awarded in the most recent year. In addition, he will be entitled to (ii) and (iii) above.
The employment agreement also contains customary covenants restricting the use of our confidential information and solicitation of employees, which are similarly applicable to our other executive officers. In addition we are obligated to indemnify Mr. Tangredi for any claims made against him in connection with his employment with us, to advance indemnification expenses, and maintain his coverage under our directors’ and officers’ liability insurance policy.
Under the employment agreement, we and Mr. Tangredi have agreed that we will retain an independent compensation consultant, whose recommendations shall be obtained by January 31, 2012 which may modify the compensation program for Mr. Tangredi and other officers, subject to certain conditions including approval of the board of directors. Notwithstanding the recommendation and board consideration, Mr. Tangredi has the right to continue the current terms of the employment agreement.
Scott G. Ehrenberg.We are party to an employment agreement with Mr. Ehrenberg, our Chief Technology Officer and Secretary. The employment agreement, dated May 24, 2011, sets forth Mr. Ehrenberg’s compensation level and eligibility for salary increases, bonuses, benefits, and option grants. Mr. Ehrenberg’s employment agreement provides for an initial term of two years with the term extending on the second anniversary thereof for an additional one year period and on each subsequent anniversary of the agreement for an additional year period. Mr. Ehrenberg’s initial base salary is $110,000, with an increase to $165,000 per annum.annum after the date on which we obtain $10 million or more in equity financing . Additionally, at the discretion of our board of directors and its compensation committee, Mr. Ehrenberg may be eligible for an annual bonus which amount, if any, will not be below 50% of his effective base salary and not exceeding 100% of his then effective base salary; provided that, under certain extraordinary circumstances, Mr. Ehrenberg may be eligible for an annual bonus greater than 150% of his then-effective base salary. Mr. Ehrenberg is entitled to medical, disability and life insurance as generally offered to other and made available to other executive officers of the Company, and after the completion of this offering, 75% of the regular portion of Executive’s Health Benefit. In addition, Mr. Ehrenberg is entitled to four weeks of paid vacation annually, and reimbursement of certain business expenses including expenses for executive conferences or education.
60
After the completion of this offering, Mr. Ehrenberg is eligible to receive a one-time payment of $20,000 for each U.S. patent of which he is the originator and the first name listed on the patent as inventor of the intellectual property described in such patent. In addition to any other compensation which Mr. Ehrenberg may receive under the agreement, he will be granted options to purchase 40,000 shares of common stock (4,000 shares upon giving effect to the anticipated 10-for-1 reverse stock split) at the end of each year or on the annual anniversary of the agreement, whichever is mutually acceptable to the Company and Mr. Ehrenberg. These options will be immediately exercisable, have a term of ten years, shall be exercisable for up to three years after termination of or resignation from employment (unless termination is for cause, in which event they shall expire on the date of termination).
If Mr. Ehrenberg’s employment is terminated for any reason, we will be obligated to pay him his accrued but unpaid base salary, bonus and accrued vacation pay, and any unreimbursed expenses (“Accrued Sums”).
In addition to any Accrued Sums owed, if Mr. Ehrenberg’s employment is terminated by us in the event of his disability or without cause or by Mr. Ehrenberg for good reason, he shall be entitled to:
| (i) | an amount equal to the greater of the base salary then in effect or $175,000; |
| (ii) | continuation of medical benefits set forth in the agreement until one year following termination of employment or resignation, and beyond such one year period to the extent required by COBRA or similar statute; and |
| (iii) | all stock options, to the extent they were not exercisable at the time of termination of employment, shall become exercisable in full, and shall remain exercisable for a period of three years following the date of termination or resignation. |
In addition to any Accrued Sum owed, in the event of termination upon death, Mr. Ehrenberg shall be entitled to (i) and (iii) above.
In addition to any Accrued Sums owed, in the event that Mr. Ehrenberg elects to terminate employment within 6 months following a change in control, he shall be entitled to receive, within the later of ten days following the date on which the change in control occurs or the date on which he gives notice of his election to resign from employment, a lump sum payment equal to $400,000 plus cash bonus and equity, if any, awarded to Mr. Ehrenberg for the most recent year. In addition, he will be entitled to (ii) and (iii) above.
The employment agreement also contains customary covenants restricting the use of our confidential information and solicitation of employees, which are similarly applicable to our other executive officers. In addition we are obligated to indemnify Mr. Ehrenberg for any claims made against him in connection with his employment with us, to advance indemnification expenses, and maintain his coverage under our directors’ and officers’ liability insurance policy.
Patricia K. Tangredi. We are a party to an employment agreement with Patricia Tangredi, wife of Timothy Tangredi, our Chief Executive Officer. The employment agreement, as amended and restated on April 8, 2011, sets forth Ms. Tangredi’s compensation level and eligibility for salary increases, bonuses, benefits, and option grants. Ms. Tangredi’s employment agreement provides for an initial term of four years with the term extending on the fourth anniversary thereof for an additional one year period and on each subsequent anniversary of the agreement for an additional year period. Ms. Tangredi’s initial base salary is $120,000, with an increase to $150,000 per annum or such higher sum as our board of directors may set after the date on which we obtain $10 million or more in equity or debt financing. Ms. Tangredi is entitled to, and we will pay 50% of her, medical, vision, dental, accidental death and travel insurance as provided under company plans. In addition, Ms. Tangredi is eligible to receive four weeks of paid vacation annually.
In addition to any other compensation which she may receive under the agreement, Ms. Tangredi shall be granted options to purchase a minimum of 50,000 shares of our common stock (5,000 shares upon giving effect to the anticipated 10-for-1 reverse stock split) which shall be issued at year end or upon the anniversary of this agreement, as the parties shall agree. These options shall be immediately exercisable, have a term of ten years, shall be exercisable for up to three years after termination of employment (unless termination is for cause, in which event they shall expire on the date of termination), and shall be subject to such additional terms and conditions as are then applicable to options granted under such plan provided they do not conflict with the terms set forth in the agreement.
61
If Ms. Tangredi’s employment is terminated for any reason, we will be obligated to pay her accrued but unpaid base salary, bonus and accrued vacation pay, and any unreimbursed expenses (“Accrued Sums”).
In addition to any Accrued Sums owed, if Ms. Tangredi’s employment is terminated by us in the event of her disability or without cause or by Ms. Tangredi for good reason, Ms. Tangredi shall also be entitled to:
| (i) | an amount equal to the greater of the base salary then in effect or $150,000; |
| (ii) | continuation of the health and other insurance coverage and other benefits set forth in the agreement until one year following termination of employment or resignation, and beyond such one year period to the extent required by COBRA or similar statute; and |
| (iii) | all stock options, to the extent they were not exercisable at the time of termination of employment, shall become exercisable in full and shall remain exercisable for a period of three years following the date of termination or resignation. |
In addition to any Accrued Sum owed, in the event of termination upon death, Ms. Tangredi shall be entitled to (i) and (iii) above.
In addition to any Accrued Sums owed, in the event that Ms. Tangredi elects to terminate employment within six months following a change in control, she shall receive a lump sum payment equal to three times the sum of the greater of her then current base salary or $150,000. In addition, she will be entitled to (ii) and (iii) above.
The employment agreement also contains customary covenants restricting the use of our confidential information and solicitation of employees, which are similarly applicable to our other executive officers. In addition we are obligated to indemnify Ms. Tangredi for any claims made against her in connection with her employment with us, to advance indemnification expenses, and maintain her coverage under our directors’ and officers’ liability insurance policy.
Executive Compensation Agreement
On September 14, 2011,January 11, 2012, we entered into an Executive Compensation Agreement with Tim Tangredi. Under this agreement, upon closing of the offering and receipt by us of gross proceeds of $6 million or more , Mr. Tangredi’s accrued compensation through the closing date in the approximate amount of $1.05 million shall be paid with a combination of (a) cash, which we estimate at this time to be approximately $380,000, which is intended to cover payment of income and other taxes due from the payment of such accrued compensation, and (b) shares of restricted common stock at a price equal to the price per share paid by investors in the public offering for the remainder (which is assumed for purposes of this calculation to be $4.00$0.3 2 per share after giving effect to the anticipated 10-for-1 reverse stock split, and which based on this assumption would consist of approximately 166, 971an estimated 2,087,138 shares of common stock).
There are no material relationships between us and our directors or executive officers except as previously discussed herein.
Since the beginning of our 2008 fiscal year, we have not been a participant in any transaction, or proposed transaction, not disclosed herein in which any related person had or will have a direct or indirect material interest and in which the amount involved exceeds the lesser of $120,000 or one percent of our total assets at year end for the last t wotwo completed fiscal years.
MANAGEMENT’S DISCUSSION AND ANALYSIS OF FINANCIAL CONDITION AND RESULTS OF OPERATIONS
The following discussion and analysis of our financial condition and results of operations should be read in conjunction with “Summary Financial Data” and our financial statements and related notes appearing elsewhere in this prospectus. In addition to historical information, this discussion and analysis contains forward-looking statements that involve risks, uncertainties and assumptions. Our actual results may differ materially from those anticipated in these forward-looking statements as a result of certain factors, including, but not limited, to those set forth under “Risk Factors” and elsewhere in this prospectus.
OVERVIEW
We have developed and patented a nano-structure polymer technology, which is being commercialized in products based on the functionality of these materials. We believe the applications of our technology have promise in a number of diverse market segments and products.
The initial product focus of the Company is ConsERV™ConsERV™, an energy recovery ventilator. Our primary focus is to expand our marketing and sales of our ConsERV™ product.
We also have new product applications in various stages of developmental. We believe that three of these product applications, including an advanced air conditioning system which is projected to be more energy efficient and have lower emissions compared to current HVAC equipment, a sea-water desalination product and an electrical energy storage device, may be brought to market in the foreseeable future if we receive adequate capital funding.
63
REVENUES
We generate our revenues primarily from the sale of our ConsERV™ products in largely commercial HVAC markets with a small amount of revenues coming from residential sales to consumers and HVAC distributors. Sales channels for our ConsERV™ products include OEMs, distributors, retailers, and consumers. We also occasionally look to license our technology to strategic partners and sell various prototypes of other product applications that use our polymer technology.
Our near term revenue growth is dependent on continued sales from (i) more seasoned independent sales representatives, (ii) a greater number of independent sales representatives, (iii) fulfilling the ventilation needs of the growing “energy consultant” marketplace which work to lower their client’s energy costs and emissions, and (iv) from the Company’s own ‘customer direct’ sales activities, all of which focus on the sale of product sproducts primarily to commercial user susers with a growing emphasis on low rise structures (small commercial buildings, multi-purpose structures, and residences). In addition, we and our independent sales representative sales force will work to secure orders for ConsERV™ “core only” sales from HVAC equipment manufacturers, and from distribution firms servicing the equipment needs of the HVAC installer community. We will also work to create license/supply relationships with HVAC or ERV OEMs preferably having a dominant presence in existing direct related sales channels.
COST OF SALES
Our cost of sales consists primarily of materials (including freight), direct labor, and outsourced manufacturing expenses incurred to produce our ConsERV™ products.
We are dependent on third parties to manufacture the key components needed for our nano-structured based materials and value added products made with these materials. Accordingly, a supplier’s failure to supply components in a timely manner, or to supply components that meet our quality, quantity and cost requirements or our technical specifications, or the inability to obtain alternative sources of these components on a timely basis or on terms acceptable to us, would create delays in production of our products or increase our unit costs of production. Certain of the components contain proprietary products of our suppliers, or the processes used by our suppliers to manufacture these components are proprietary. If we are required to replace any of our suppliers, while we should be able to obtain comparable components from alternative suppliers at comparable costs, this would create a delay in production.
SELLING, GENERAL AND ADMINISTRATIVE EXPENSES
Our selling, general and administrative expenses consist primarily of payroll and related benefits, share-based compensation, professional fees, marketing and other infrastructure costs such as insurance, information technology and occupancy expenses.
RESULTS OF OPERATIONS
December 31, 2010 Compared to December 31, 2009
The following table sets forth, for the periods indicated, certain data derived from our Statements of Operations:
| Year Ended December 31, | ||||||||||||||||
| Year Ended December 31, | 2010 | 2009 | ||||||||||||||
| 2010 | 2009 | as restated | ||||||||||||||
| Revenues | $ | 3,342,468 | $ | 1,531,215 | $ | 3,342,468 | $ | 1,531,215 | ||||||||
| Percentage of revenues | 100.0 | % | 100.0 | % | 100.0 | % | 100.0 | % | ||||||||
| Cost of goods sold | $ | 2,290,041 | $ | 1,071,098 | $ | 2,290,041 | $ | 1,071,098 | ||||||||
| Percentage of revenues | 68.5 | % | 70.0 | % | 68.5 | % | 70.0 | % | ||||||||
| Research and development expenses, net grant revenue | $ | 238,182 | 6,600 | $ | 238,182 | 6,600 | ||||||||||
| Percentage of revenues | 7.1 | % | .4 | % | 7.1 | % | .4 | % | ||||||||
| Selling, general and administrative expenses | $ | 2,693,092 | $ | 3,217,992 | $ | 2,693,092 | $ | 3,217,992 | ||||||||
| Percentage of revenues | 80.6 | % | 210.2 | % | 80.6 | % | 210.2 | % | ||||||||
| Interest expense | $ | 209,550 | $ | 621,574 | $ | 209,550 | $ | 621,574 | ||||||||
| Percentage of revenues | 6.3 | % | 40.6 | % | 6.3 | % | 40.6 | % | ||||||||
| Change in fair value of warrant liability | $ | (618,801 | ) | $ | 3,731,694 | $ | (618,801 | ) | $ | 3,731,694 | ||||||
| Percentage of revenues | 18.5 | % | 243.7 | % | 18.5 | % | 243.7 | % | ||||||||
| Net loss | $ | (1,433,593 | ) | $ | (7,117,076 | ) | $ | (1,433,593 | ) | $ | (7,117,076 | ) | ||||
| Percentage of revenues | (42.9 | )% | (464.8 | )% | (42.9 | )% | (464.8 | )% | ||||||||
Revenues: Total revenues for the year ended December 31, 2010 and 2009 were $3,342,468 and $1,531,215 respectively, an increase of $1,811,253, or 118.3%. The increase in revenues for 2010 is primarily attributable to the 6% increase in the sales price of our ConsERV™ConsERV™ product, introducing new products (C-series and semi-custom units) to the ConsERV™ConsERV™ line, generating additional sales in new price categories and an increase in the number and size of its sales transactions in 2010 compared to 2009. We also attribute the sales increase to a realignment of and an increase in the number of our independent sales representatives. During the year ended December 31, 2010 and 2009, seven and five customers accounted for approximately 61% and 66% of revenues, respectively.
Cost of Goods Sold: Cost of goods sold was $2,290,041 and $1,071,098 or 68.5% and 70.0% of revenues for the years ended December 31, 2010 and 2009, respectively. The increase in 2010 of $1,218,943 is primarily due an increase in sales. Gross profit margin increased from 30% in 2009 to 31.4% in 2010. The increase in the gross profit margin was due to a decrease in the cost of materials due to improved production processes, volume pricing and new suppliers. We also were able to reduce labor costs by approximately 10% through the implementation of lean manufacturing and QRM processes. The effect of these cost savings that were achieved through these measures was partially offset by an increase in contract labor of approximately $80,000 and an overall increase in freight costs by approximately $100,000.
Selling, General and Administrative Expenses: Selling, general and administrative expenses were $2,693,092 for the year ended December 31, 2010, compared to $3,217,992 for the year ended December 31, 2009, a decrease of $524,900 or 16.3%. This decrease is primarily due to a decrease in stock-based compensation of approximately $785,000 which was partially offset by an increase in professional fees of approximately $174,000 which was due to hiring an investor relations firm in 2010 and additional consultants. The Company also had an increase in payroll expenses of approximately $106,700 for the addition of two new managerial employees.
Interest Expense: Interest expense was $209,550 for the year ended December 31, 2010 compared to $621,574 for the same period of 2009, a decrease of $412,024 or 66.3%. During the year ended December 31, 2009, interest expense was primarily related to convertible notes issued from December 2007 to January 2008, and comprised of approximately $172,000 of stated interest expense on the notes, approximately $413,000 in expense relating to warrants issued to induce conversion of principal and $30,100 in expense related to the amortization of the discount and embedded beneficial conversion feature. The decrease in interest expense is due to the fact that the beneficial conversion feature and discount on the notes payable became fully amortized in January 2009 and outstanding convertible debt was reduced by $275,000 in 2010.
Change in Fair Value of Warrant Liability: The change in the fair value of warrant liability increased by $4,350,495 for the year ended December 31, 2010 to income of ($618,801) from expense of $3,731,694 in the prior year due to the change in the fair value of the underlying warrant liability based on the Black-Scholes option pricing model.
Net Loss: Net loss for the year ended December 31, 2010 decreased by $5,683,483 to $1,433,593 from $7,117,076 for the year ended December 31, 2009. The decrease in net loss is primarily due to the increases in sales and the change in fair value of the warrant liability net of decreases in interest expense and selling, general and administrative expenses.
Summary of Three Months Ended JuneSeptember 30, 2011 Results of Operations
The following table sets forth, for the periods indicated, certain data derived from our Statements of Operations and certain of such data expressed as a percentage of revenues:
| Three Months Ended June 30, | Three Months Ended September 30, | |||||||||||||||
| 2011 | 2010 | 2011 | 2010 | |||||||||||||
| restated | as restated | |||||||||||||||
| Revenues | $ | 1,124,079 | $ | 1,010,142 | $ | 625,949 | $ | 952,374 | ||||||||
| Percentage of revenues | 100.0 | % | 100.0 | % | 100.0 | % | 100.0 | % | ||||||||
| Cost of goods sold | $ | 806,674 | $ | 550,196 | $ | 466,271 | $ | 755,034 | ||||||||
| Percentage of revenues | 71.8 | % | 54.5 | % | 74.5 | % | 79.3 | % | ||||||||
| Research and development expenses, net grant revenue | $ | 11,119 | $ | - | ||||||||||||
| Research and development expenses, net of grant proceeds | $ | (3,838 | ) | $ | - | |||||||||||
| Percentage of revenues | 1.0 | % | 0.0 | % | 0.6 | % | 0.0 | % | ||||||||
| Selling, general and administrative expenses | $ | 792,606 | $ | 1,029,394 | $ | 487,961 | $ | 697,099 | ||||||||
| Percentage of revenues | 70.5 | % | 101.9 | % | 78.0 | % | 73.2 | % | ||||||||
| Interest expense | $ | 416,899 | $ | 55,233 | $ | 446,505 | $ | 55,933 | ||||||||
| Percentage of revenues | 37.1 | % | 5.5 | % | 71.3 | % | 5.9 | % | ||||||||
| Change in fair value of warrant liability (gain) | $ | (1,694,170 | ) | $ | (1,835,094 | ) | ||||||||||
| Change in fair value of warrant liability | $ | 126,008 | $ | 611,231 | ||||||||||||
| Percentage of revenues | 150.7 | % | 181.7 | % | 20.1 | % | 64.2 | % | ||||||||
| Net income | $ | 791,585 | $ | 1,210,413 | ||||||||||||
| Net loss | $ | 895,384 | $ | 1,166,923 | ||||||||||||
| Percentage of revenues | 70.4 | % | 119.8 | % | 143.0 | % | 122.5 | % | ||||||||
67
NET INCOME:LOSS: Net incomeloss for the three months ended JuneSeptember 30, 2011 decreased by $418,828$271,539 to $791,585$895,384 from $1,210,413$1,166,923 for the three months ended JuneSeptember 30, 2010. The decrease in net income wasis primarily due to athe decrease in the change in the fair value of the warrant liability and an increase in interest expense as discussed above.
Summary of SixNine Months Ended JuneSeptember 30, 2011 Results of Operations
The following table sets forth, for the periods indicated, certain data derived from our Statements of Operations and certain of such data expressed as a percentage of revenues:
| Six Months Ended June 30, | Nine Months Ended September 30, | |||||||||||||||
| 2011 | 2010 | 2011 | 2010 | |||||||||||||
| restated | as restated | |||||||||||||||
| Revenues | $ | 1,982,773 | $ | 1,417,454 | $ | 2,608,722 | $ | 2,369,828 | ||||||||
| Percentage of revenues | 100.0 | % | 100.0 | % | 100.0 | % | 100.0 | % | ||||||||
| Cost of goods sold | $ | 1,507,564 | $ | 871,522 | $ | 1,973,835 | $ | 1,626,556 | ||||||||
| Percentage of revenues | 76.0 | % | 61.5 | % | 75.7 | % | 68.6 | % | ||||||||
| Research and development expenses, net grant revenue | $ | 13,155 | $ | - | ||||||||||||
| Research and development expenses, net of grant proceeds | $ | 9,317 | $ | - | ||||||||||||
| Percentage of revenues | 0.7 | % | 0.0 | % | 0.4 | % | 0.0 | % | ||||||||
| Selling, general and administrative expenses | $ | 1,714,903 | $ | 1,588,914 | $ | 2,202,771 | $ | 2,286,013 | ||||||||
| Percentage of revenues | 86.5 | % | 112.1 | % | 84.4 | % | 96.5 | % | ||||||||
| Interest expense | $ | 580,438 | $ | 101,736 | $ | 1,026,945 | $ | 157,669 | ||||||||
| Percentage of revenues | 29.3 | % | 7.2 | % | 39.4 | % | 6.7 | % | ||||||||
| Change in fair value of warrant liability loss/(gain) | $ | 657,937 | $ | (327,066 | ) | |||||||||||
| Change in fair value of warrant liability | $ | 783,944 | $ | 284,165 | ||||||||||||
| Percentage of revenues | 33.2 | % | 23.1 | % | 30.1 | % | 12.0 | % | ||||||||
| Net loss | $ | 2,490,560 | $ | 817,652 | $ | 3,385,852 | $ | 1,948,575 | ||||||||
| Percentage of revenues | 125.6 | % | 57.7 | % | 129.8 | % | 82.2 | % | ||||||||
69
INTEREST EXPENSE: Interest expense was $580,438$1,026,945 for the sixnine months ended JuneSeptember 30, 2011 compared to $101,736$157,669 for the same period of 2010, an increase of $478,702.$869,276. During the sixnine months ended JuneSeptember 30, 2011, $450,568$791,707 of interest expense was related to the amortization of the note discount and embedded beneficial conversion feature on a convertible note.
CHANGE IN FAIR VALUE OF WARRANT LIABILITY: The change in the fair value of warrant liability increased by $985,003$499,779 for the sixnine months ended JuneSeptember 30, 2011 to $657,937$783,944 from ($327,066)$284,165 in the prior period ended JuneSeptember 30, 2010 due to the change in the fair value of the underlying warrant liability based on the Black-Scholes option pricing model. See Note 10 in the accompanying Financial Statements.
NET LOSS: Net loss for the sixnine months ended JuneSeptember 30, 2011 increased by $1,672,908$1,437,277 to $2,490,560$3,385,852 from $817,652$1,948,575 for the sixnine months ended JuneSeptember 30, 2010. The increase in net loss is primarily due to anthe increase in selling, general and administrative expenses, interest expense and the change in fair value of warrant liability as discussed above.
LIQUIDITY AND CAPITAL RESOURCES
We finance our operations primarily through sales of our ConsERV™ products, sales of our common stock, the issuance of convertible promissory notes, unsecured promissory notes and license agreements.
Our historical revenues have not been sufficient to sustain our operations. We have not achieved profitability in any year since inception and we expect to continue to incur net losses and negative cash flow from operations until we can produce sufficient revenues to cover our costs, which are not expected for several years. Furthermore, even if we achieve our goal of selling a greater number of ConsERV™ units, we anticipate that we will continue to incur losses until we can cost-effectively produce and sell our products to a wider market. Our profitability will require the successful commercialization of our ConsERV™ products and any future products we develop. No assurances can be given when this will occur.
We have filed a registration statement on Form S-1 of which this prospectus is a part of with the SEC for a contemplated public offering of common stock for gross proceeds, based on an assumed midpoint offering price of up to fifteen$0.3 2 per share, of $10 .5 million dollars. We have engaged MDB Capital Group LLC as underwriter for this public offering. As disclosed in our registration statement, we intend to use the proceeds of the public offering for working capital, general corporate purposes and repayment of certain outstanding indebtedness.
During the year ended December 31, 2009 eighteen holders converted their c onvertible n otes,convertible notes, having an aggregate outstanding principal balance of $2,350,000 plus accrued interest of $361,600, into 13,553,822 shares of common stock (1,355,382 after giving effect to the anticipated 10-for-1 reverse stock split).stock. Some of the holders converted during periods in which we were offering an additional warrant as an inducement to convert. In accordance with said offers we issued additional warrants to purchase 1,665,000 shares of common stock, exercisable immediately at $0.25 per share (166,500 at $2.50 after giving effect to the anticipated 10-for-1 reverse stock split) and valued at $126,367, and 575,000 warrants, exercisable immediately at $0.75 per share (57,500 at $7.50 after giving effect to the anticipated 10-for-1 reverse stock split) valued at $286,641 which was recorded as interest expense during the twelve months ended December 31, 2009.
During 2009, four investors holding c onvertible n otesconvertible notes with an aggregate outstanding principal balance of approximately $450,000 at December 31, 2008 notified us that they were asserting their rights to receive payment of the principal and interest pursuant to the terms of the c onvertible n otes.convertible notes. In June of 2009, three of these investors, holding an aggregate principal note balance of $250,000, entered into a confession of judgment with us .us. Under that agreement, the three investors had the right, should we fail to pay all principal and interest due pursuant to their c onvertible n otesconvertible notes on or before September 11, 2009, to file the confession of judgment with the court and seek to secure a judgment against us in the amount of all principal and interest due under their c onvertible n otesconvertible notes together with the reasonable cost and expense of collection. All accrued interest and principal related to the three convertible notes, $289,600 in the aggregate, was paid in full by us on or before September 11, 2009. In July 2009, the fourth investor, holding a c onvertible n oteconvertible note in the principal amount of $200,000, agreed to extend said note to September 2009. In November 2009, we modified the c onvertible n oteconvertible note with this investor to extend the maturity date of said note to July 2010, pay the principal amount due in eight monthly installments commencing December of 2009, end the accrual of interest as of November 20, 2009 and convert the $34,861 in interest due under the c onvertible n oteconvertible note as of November 20, 2009 into 170,137 shares of our common stock (17,014 after giving effect to the anticipated 10-for-1 reverse stock split).stock. During the year ended December 31, 2010, $75,000 of the outstanding balance was repaid and $75,000 was converted into 325,000 shares of common stock (32,500 after giving effect to the anticipated 10-for-1 reverse stock split).stock.
As of December 31, 2010, $50,000 of principal on the c onvertible n otesconvertible notes was outstanding, in default and due and payable in full. On March 23, 2011 this note was paid in full by us .us. As of the date of this filing all c onvertible n otesconvertible notes issued under the Financing have been paid in full or converted.
In July 2009, we secured a loan of $300,000 from an investor. Pursuant to the terms of the note, we are to pay the note holder simple interest at the rate of seven percent per annum commencing on July 17, 2009 with all interest and principal due there under payable in cash on or before January 16, 2011. On December 30, 2010, the investor elected to apply all of the proceeds due and payable under the n ote,note, including all accrued interest, to purchase our c ommon s tock.common stock. Pursuant to this transaction, the investor subscribed for and purchased 1,268,472 shares of Common Stock (126,847 at $2.60 after giving effect to the anticipated 10-for-1 reverse stock split) at a purchase price of $0.26 per share resulting in an aggregate purchase price of $329,803.
In December 2009, we secured a loan in the principal amount of $1,000,000 from an investor. Pursuant to the terms of th isthis note, we are to pay the holder simple interest at the rate of ten percent per annum commencing on the date of issuance with all interest and principal due and payable in cash on or before June 17, 2010. The note’s maturity date was extended to April 30, 2011. On March 22, 2011, we entered into a Securities Amendment and Exchange Agreement and an Amended and Restated Convertible Promissory Note (“2011 Convertible Note”, collectively “Exchange Agreements”) with the this investor. Pursuant to the terms and subject to the conditions set forth in the Exchange Agreements, the Company and the Investor amended and restated the $1,000,000 unsecured promissory note issued by us to the Investor on or about December 17, 2009 (“Original Note”) to, among other things, extend the term to March 22, 2012. Interest in the amount of 10% per annum, commencing on December 17, 2009 and calculated on a 365 day year, and the principal amount of $1,000,000 will be paid on March 22, 2012. Subject to the terms and conditions of the 2011 Convertible Note, including limitations on conversion, the outstanding principal and interest under the 2011 Convertible Note will automatically convert into shares of our common stock at the then-effective conversion price upon the closing of a qualified firm commitment underwrittenunderwitten public offering or may be voluntarily converted by the investor at anytime during the term. The initial conversion price is $0.26 per share ($2.60 after giving effect to the ancticipated 10-for-1 reverse stock split).share. Any principal or interest which is not converted will be repaid by us at the earlier of a qualified offering, (as defined in the “2011 Convertible Note” which is filed as an exhibit to the Form 8K filed with the Securities and Exchange Commission on March 28, 2011 and is incorporated by reference to this annual report on Form 10K), or March 22, 2012. Pursuant to and during the term of the 2011 Convertible Note, we will not issue or allow to exist any obligation for borrowed money, except for subordinate indebtedness in payment and priority, trade payables incurred in the ordinary course of business, purchase money secured indebtedness for equipment or inventory, unsecured and subordinate, or unsecured and subordinate working capital guarantees provided by, the Export Import Bank of the United States (the “EXIM Bank”), and indebtedness evidenced by the promissory note dated February 19, 2010 issued to RBC Capital Markets- Custodian of Leonard Samuels IRA (as amended) in the principal amount of $620,000.
On March 22, 2011, in connection with the above Exchange Agreements, we entered into an Amendment to 2007 Warrant and an Amendment to 2009 Warrant to extend the term of the Stock Purchase Warrant, dated on or about December 31, 2007, and the term of the Stock Purchase Warrant, dated on or about March 12, 2009, respectively, to March 22, 2016 and to provide for cashless exercise unless such warrant shares are registered for resale under a registration statement. In addition, on March 22, 2011, we issued an additional Stock Purchase Warrant to the Investor to purchase 1,000,000 shares of our common stock at $0.45 per share, (100,000 and $4.50 after giving effect to the anticipated 10-for-1 stock split) , exercisable commencing on the earliest of the consummation of the qualified offering (as defined in the Exchange Agreements), the date of conversion of the 2011 Convertible Note in full, or the date of conversion of the 2011 Convertible Note by the Investor in the greatest number of shares of our common stock not to exceed 9.99% beneficial ownership of our outstanding common stock and terminating on March 22, 2016.
The 2011 Convertible Note is a hybrid financial instrument that blends characteristics of both debt and equity securities. The note embodies settlement alternatives to the holder providing for either redemption of principal and interest in cash (forward component) or conversion into our common stock (embedded conversion feature). The forward component was valued using the present value of discounted cash flows arising from the contractual principal and interest payment terms and the embedded conversion feature was valued using the Monte Carlo simulation method. The fair value of the 2011 Convertible Note was estimated to be $1,964,905 on the date of the exchange, which resulted in a loss on extinguishment of debt of $964,905. Further, in accordance with ASC 470-20-25 and ASC 470-50-40, the net premium of $964,905 associated with the 2011 Convertible Note was reclassified to capital in excess of par value under the presumption that such net premium represented a capital contribution. Consequently, the 2011 Convertible Note is being carried at face value. The fair value of the additional warrant to purchase 1,000,000 shares (100,000 after giving effect to the anticipated 10-for-1 reverse stock split) and the value associated with the previously issued warrants that were amended was determined to be $716,890 using the Black-Scholes option model and is included in the aggregate loss on extinguishment of $1,681,795. Since the loan is held by a related party, the loss on extinguishment has been treated as a capital transaction and, as a result, this transaction had no net effect on capital in excess of par value.
Also, on March 22, 2011, we entered into a 10% Note and Warrant Purchase Agreement, Secured Convertible Promissory Note and Patent Security Agreement (“Financing Agreements”) with the Investor. Pursuant to the terms and subject to the conditions set forth in the Financing Agreements, the Investor has provided a bridge loan in the amount of $1,500,000 (“Loan”) to us, which will is secured by all patents, patent applications and similar protections and all rents, royalties, license fees and “accounts” with respect to such intellectual property assets (“collateral”Collateral”). Pursuant to the Secured Convertible Promissory Note (“Secured Note”), interest in the amount of 10% per annum, calculated on a 365 day year, and the principal amount of $1,500,000 is due and payable on March 22, 2012, but repayment is accelerated upon a qualified firm commitment underwritten public offering (as defined in the note). In the event of such qualified offering, and subject to the terms and conditions of the Secured Note, the outstanding principal and interest under the Secured Note will automatically convert, subject to the limitations on conversion described in the note, into shares of our common stock at the then-effective conversion price upon the closing of such qualified offering. The initial conversion price is $0.26 per share ($2.60 after giving effect to the anticipated 10-for-1 reverse stock split) .share. Any principal or interest which is not converted will be repaid by us at the earlier of a qualified offering or March 22, 2012. No cash fees were paid to any party to the transaction in exchange for lending the money.
On March 22, 2011, in connection with the Financing Agreements, we issued a Stock Purchase Warrant to the Investor to purchase 3,000,000 shares of our common stock at $0.45 per share (300,000 and $4.50 after giving effect to the anticipated 10-for-1 reverse stock split) exercisable until March 22, 2016. The Warrant was fair valued on the date of issuance, which amounted to $1,204,787. The warrant value was recorded as a debt discount based on the relative fair value of the warrant to the total proceeds received, which amounted to $668,142. The Warrant was fair valued using the Black-Scholes valuation model. In addition, the debt contained a beneficial conversion feature, which was valued at the date of issuance at $2,019,231; however, since this amount is in excess of the net value of the debt less the warrant discount, the beneficial conversion feature will be limited to $831,859 and recorded as a discount on the loan. The total debt discount of $1,500,000 is being amortized using the effective interest method over the 12-month term of the Secured Note. F orFor the three and sixnine month periods ended JuneSeptember 30, 2011, we recognized $ 450,568$341,139 and $332,749,$791,707, respectively, , in additional interest expense representing amortization of this debt discount.
Pursuant to and during the term of the Secured Note, we will not issue or permit to exist any obligation for borrowed money, except for trade payables incurred in the ordinary course of business, purchase money secured indebtedness for equipment or inventory, unsecured and subordinate indebtedness to, or unsecured and subordinate working capital guarantees provided by, the EXIM Bank, the promissory note dated February 19, 2010 issued to RBC Capital Markets- Custodian of Leonard Samuels IRA (as amended) in the principal amount of $620,000, the Amended and Restated Convertible Promissory Note, dated March 22, 2011, issued to the investor in the principal amount of $1,000,000 and other unsecured indebtedness for borrowed money in an amount not to exceed $750,000.
Pursuant to the Patent Security Agreement issued in connection with the Note and Warrant Purchase of March 22, 2011, we will not, without the investor’s prior consent, sell, dispose or otherwise transfer all or any portion of the Collateral, except for license grants in the ordinary course of business. In addition, we will take all actions reasonably necessary to prosecute to allowance applications for patents and maintain all patents, and to seek to recover damages for infringement, misappropriation or dilution of the Collateral with limited exceptions.
In connection with such qualified offering, and subject to the terms and conditions of the Convertible Note, we will use reasonable efforts to include the Investor’s securities in such offering. Pursuant to the terms and conditions of the Exchange Agreements, the investor will not, if requested in writing by the underwriter, sell, offer to sell or otherwise transfer or dispose of (other than to affiliates) any securities issued by us and held by it for a period of 180 days from the date of the final prospectus relating to such qualified offering, except for certain limited sales as more fully described in the Exchange Agreements.
We secured a loan from an investor in the principal amount of $620,000. Pursuant to the terms of the note, we are to pay the holder simple interest at the rate ten percent per annum commencing on the date of issuance with all interest and principal due and payable in cash on or before August 10, 2010, which has been extended to May 31, 2011. May 12, 2011, the investor elected to apply all of the proceeds due and payable under the promissory note, including all accrued interest, to the purchase of the Company’s Common Stock. Pursuant to this transaction, the investor subscribed for and received 2,667,503 shares of Common Stock at a purchase price of $0.26 per share (266,750 shares of common stock at an exercise price of $2.60 after giving effect to the anticipated 10-for-1 stock split) resulting in an aggregate purchase price of $693,550. As part of the purchase, the investor also received a five-year warrant to purchase 962,500 shares of Common Stock, at an exercise price of $0.45 per share (96,250 shares of common stock at an exercise price of $4.50 after giving effect to the anticipated 10-for-1 stock split).share. The warrant is immediately exercisable and subject to adjustment for standard anti-dilution events, including but not limited to stock dividends, split-up, reclassification or combination of Company’s shares, exchange of stock for other Company stock, or certain capital reorganizations or reclassification of the capital stock or consolidation, merger or sale of substantially all Company’s assets. In addition, as part of this transaction, the warrants issued to this investor on December 20, 2007 and December 31, 2007 were amended to include a cashless exercise provision.
We expect to repay all of our outstanding convertible notes, via a combination ofin cash and stock conincident withsecured from the closing of this offering.offer . If we do not consumateconsummate this offering, or do not sell a sufficient number of our shares pursuant to this offering, at maturity, we may not be able to repay all or any of the outstanding notes when due without severely impacting our ability to continue operations and we may not be able to secure additional financing to repay the notes on acceptable terms, if at all. Should we be unable to repay or renegotiate the notes, as an alternative, management could attempt to renegotiate the repayment terms of the notes and seek extension of the maturity dates. There is no guarantee that, if we should need to renegotiate these notes, any negotiated terms we may be able to secure would be favorable to us. Unfavorable terms, in either a financing transaction or a debt renegotiation, could adversely impact our business, financial condition and/or results of operations. Should we be unable to repay the loan and unsuccessful in securing additional financing or renegotiating the $1.5 million dollar secured convertible note the holder would have the option to foreclose on all of our patents and patent applications which would likely result in the failure of our business.
Any future financing may result in substantial dilution to existing shareholders, and future debt financing, if available, may include restrictive covenants or may require us to grant a lender a security interest in any of our assets not already subject to an existing security interest. To the extent that we attempt to raise additional funds through third party collaborations and/or licensing arrangements, we may be required to relinquish some rights to our technologies or products currently in various stages of development, or grant licenses or other rights on terms that are not favorable to us. Any failure by us to timely procure additional financing or investment adequate to fund our ongoing operations, including planned product development initiatives and commercialization efforts, will have material adverse consequences on our financial condition, results of operations and cash flows.
If we do not consumateconsummate this offering, we will be dependent upon our existing cash of $841,797$423,908 at JuneSeptember 30, 2011, cash generated from product sales, and additional issuances of our securities, in order to finance our operations through the next 12 months. These operational expenses include debt service on a principal amount of $2,500,000 in outstanding indebtedness, and other contractual obligations amounting to approximately $415,400.$276,695. We must raise additional capital in the amount of approximately $13$8.9 million, net of expenses, during the next eighteen months in order to pay down existing debt, secure new patents for innovative applications of our core technology, purchase equipment, and fund our working capital requirements in accordance with our existing plans through September 2012.July 2013. This additional capital would be provided by the successful completion of the offering under this prospectus. If we are unable to raise these funds, we may be required to delay our development plans and curtail our expenditures.
The accompanying financial statements have been prepared assuming that wethe Company will continue as a going concern. For the sixnine months ended JuneSeptember 30, 2011, wethe Company incurred a net loss of $ 2,490,560$3,385,852 and we ha vehas incurred significant losses since inception. As of JuneSeptember 30, , 2011, we havethe Company has an accumulated deficit of $38, 128,522 ,$39,023,814, negative working capital of $1,8 46,593$2,532,426 and a stockholders’ deficit of $ 6,323,185 . We$6,097,657. The Company used $ 463,334$787,910 and $ 1,183,705$1,332,591 of cash from operations during the sixnine months ended JuneSeptember 30, , 2011 and 2010, respectively, which was funded by proceeds from debt and equity financings. There is no assurance that such financing will be available in the future. In view of these matters, there is substantial doubt that wethe Company will continue as a going concern. In addition to the proceeds we shall secure if we complete this offering, we areThe Company is currently pursuing the following sources of short and long-term working capital:
| 1. | We are currently holding preliminary discussions with parties who are interested in licensing, purchasing the rights to, or establishing a joint venture to commercialize, certain applications of our technology. |
| 2. | We are seeking growth capital from certain strategic and/or government (grant) related sources. In addition to said capital, these sources may, pursuant to any agreements that may be developed in conjunction with such funding, assist in the product definition and design, roll-out, and channel penetration of our products. As part of this step we will attempt to take advantage of key programs associated with the recently enacted American Recovery and Reinvestment Act of 2009. |
Our ability to continue as a going concern is highly dependent on our ability to obtain additional sources of cash flow sufficient to fund our working capital requirements. However, there can be no assurance that we will be successful in our efforts to secure such cash flow. Any failure by us to timely procure additional financing or investment adequate to fund our ongoing operations, including planned product development initiatives and commercialization efforts, will have material adverse consequences on our financial condition, results of operations and cash flows.
Our financial statements do not include any adjustments relating to the recoverability and classification of recorded assets, or the amounts and classifications of liabilities that might be necessary should we be unable to continue as a going concern.
Cash and cash equivalents as of December 31, 2010 was $304,656 compared to $1,085,628 as of December 31, 2009. Cash is primarily used to fund our working capital requirements.
As of December 31, 2010, we had an increase in working capital of $596,118, resulting in a working capital deficit of $2,861,488 compared to $2,265,370 of working capital deficit as of December 31, 2009. During the year ended 2010, we used approximately $1,180,800 of cash to fund our operations, approximately $100,000 to repay debt, and approximately $113,300 to purchase property and equipment. These uses of cash are partially offset by approximately $620,000 of proceeds received during 2010 in connection with the issuance of debt.
Net cash used in operating activities was approximately $1,180,800 for the year ended December 31, 2010 compared to approximately $818,000 for the same period in 2009. During the year ended December 31, 2010, we used additional cash to fund operating losses of approximately $1,879,000 and working capital requirements of approximately $2,861,500 compared to the same period in 2009.
Net cash used in investing activities was approximately $120,000 for the year ended December 31, 2010 compared to approximately $41,000 for the same period in 2009. During the year ended December 31, 2010, we used additional cash to purchase equipment.
Net cash provided by financing activities was approximately $520,000 for the year ended December 31, 2010 compared to approximately $1,918,000 for the same period in 2009. During the year ended December 31, 2010, we received net proceeds of $620,000 from the issuance of debt net of $100,000 of payments on notes payable.
Cash Flows for the SixNine Months Ended JuneSeptember 30, , 2011 Compared to JuneSeptember 30, , 2010
The following table sets forth, for the periods indicated, selected cash flow information:
| Six Months Ended June 30, | Nine Months Ended September 30, | |||||||||||||||
| 2011 | 2010 | 2011 | 2010 | |||||||||||||
| restated | as restated | |||||||||||||||
| Cash flows used in operating activities | $ | (463,334 | ) | $ | (1,183,705 | ) | $ | (787,910 | ) | $ | (1,332,591 | ) | ||||
| Cash flows used in investing activities | (27,342 | ) | (10,484 | ) | (92,442 | ) | (23,981 | ) | ||||||||
| Cash flows provided by financing activities | 1,027,817 | 520,000 | 999,604 | 520,000 | ||||||||||||
| Net increase (decrease) in cash and cash equivalents | $ | 537,141 | $ | (674,189 | ) | $ | 119,252 | $ | (836,572 | ) | ||||||
Cash and cash equivalents as of JuneSeptember 30, 2011 was $841,797$423,908 compared to $411,439$249,056 as of JuneSeptember 30, 2010. Cash is primarily used to fund our working capital requirements.
Net cash used in operating activities was approximately $463,300$787,900 for the sixnine months ended JuneSeptember 30, 2011 compared to approximately $1,183,700$1,332,600 for the same period in 2010. During the sixnine months ended JuneSeptember 30, 2011, we used additional cash to fund operating losses of approximately $2,490,600$3,385,900 (of this amount approximately $1,870,000$2,530,400 related to non-cash expenses) and working capital requirements of approximately $1,843,000$2,532,400 compared to the same period in 2010.
Net cash used in investing activities was approximately $27,300$92,400 for the sixnine months ended JuneSeptember 30, 2011 compared to approximately $10,500$24,000 for the same period in 2010. During the sixnine months ended JuneSeptember 30, 2011, we used additional cash for patents and to purchase equipment.
Net cash provided by financing activities was approximately $1,027,800$999,600 for the sixnine months ended JuneSeptember 30, 2011 compared to approximately $520,000 for the same period in 2010. During the sixnine months ended JuneSeptember 30, 2011, we received net proceeds of $1,500,000 from the issuance of debt net of $50,000 of payments on notes payable.payable and approximately $450,400 of debt issue costs and deferred offering costs.
Economy and Inflation
Except as disclosed herein, we have not experienced any significant cancellation of orders due to the downturn in the economy and only a small number offew customers have requested delays in delivery or production of orders in process. Our management believes that inflation has not had a material effect on our results of operations.
Contractual Obligations
As of September 12February 6 , 2011,2012, we have contractual obligations of $ 2,597,1502,7 30,125 as indicated below:
Contractual Obligations | Total | Less than 1 Year | 1-3 Years | 3-5 Years | ||||||||||||
| Long – term debt | $ | 2,500,000 | $ | 2,500,000 | $ | 0 | $ | 0 | ||||||||
| Purchase Obligations | 97,150 | 97,150 | $ | 0 | $ | 0 | ||||||||||
| Total | $ | 2, 597,150 | $ | 2 ,597,150 | $ | 0 | $ | 0 | ||||||||
| Contractual Obligations | Total | Less than 1 Year | 1-3 Years | 3-5 Years | ||||||||||||
| Long – term debt | $ | 2,500,000 | $ | 2,500,000 | $ | 0 | $ | 0 | ||||||||
| Purchase Obligations | $ | 2 30,125 | $ | 2 30,125 | $ | 0 | $ | 0 | ||||||||
| Total | $ | 2,7 30,125 | $ | 2,7 30,125 | $ | 0 | $ | 0 | ||||||||
Off-Balance Sheet Arrangements
We do not have any off balance sheet arrangements that are reasonably likely to have a current or future effect on our financial condition, revenues, results of operations, liquidity or capital expenditures.
Critical Accounting Policies and Estimates
The preparation of the accompanying financial statements and related disclosures in conformity with U.S. GAAP requires us to make judgments, assumptions and estimates that affect the amounts reported in the accompanying financial statements and the accompanying notes. The preparation of these financial statements requires management to make estimates and assumptions that affect the reported amounts of assets, liabilities, revenue and expenses, and related disclosure of contingent assets and liabilities. When making these estimates and assumptions, we consider our historical experience, our knowledge of economic and market factors and various other factors that we believe to be reasonable under the circumstances. Actual results could differ from these estimates. The following critical accounting policies are significantly affected by judgments, assumptions and estimates used in the preparation of the financial statements.
Revenue Recognition
Generally, we recognize revenue upon shipment of our products to customers, provided no significant obligations remain and collection is probable. This policy applies to all of our customers, including Genertec America (a distribution agreement) and CAST Systems Control Technology Co. (an agreement for the purchase of specific goods).
Our ConsERV™ConsERV™ product typically carries a warranty of two years for all parts contained therein with the exception of the energy recovery ventilator core which typically carries a 10 year warranty. The warranty includes replacement of defective parts. We have recorded an accrual of approximately $1 5 ,000$36,000 and $11,500 for future warranty expenses at JuneSeptember 30, , 2011 and December 31, 2010, respectively.
Revenue derived from the sale of licenses is deferred and recognized as revenue on a straight-line basis over the life of the license, or until the license arrangement is terminated.
Impairment of Long-Lived and Intangible Assets
Long-lived and intangible assets are reviewed for impairment whenever events or changes in circumstances indicate that the book value of the asset may not be recoverable. We periodically evaluate whether events and circumstances have occurred that indicate possible impairment. When impairment indicators exist, we use market quotes, if available or an estimate of the future undiscounted net cash flows of the related asset or asset group over the remaining life in measuring whether or not the asset values are recoverable.
Stock-Based Compensation
We recognize all share-based payments to employees, including grants of employee stock options, as compensation expense in the financial statements based on their fair values. That expense is recognized over the period during which an employee is required to provide services in exchange for the award, known as the requisite service period (usually the vesting period).
The value of each grant is estimated at the grant date using the Black-Scholes option model.
The basis for the Black-Scholes assumptions are as follows: the dividend rate is based upon our history of dividends; the risk-free interest rate for periods within the expected term of the option is based on the U.S. Treasury yield curve in effect at the time of grant; the expected term was calculated based on our historical pattern of options granted and the period of time they are expected to be outstanding; and expected volatility was calculated by review of a peer company’s historical stock prices.
Forfeitures are estimated at the time of grant and revised, if necessary, in subsequent periods if actual forfeitures differ from those estimates.
Non-employee stock-based compensation
Our accounting policy for equity instruments issued to consultants and vendors in exchange for goods and services follows the provisions of EITF 96-18, “Accounting for Equity Instruments That are Issued to Other Than Employees for Acquiring, or in Conjunction with Selling Goods or Services,” now ASC 505 and EITF 00- 18 “Accounting Recognition for Certain Transactions Involving Equity Instruments Granted to Other Than Employees,” now ASC 505. The measurement date for the fair value of the equity instruments issued is determined at the earlier of (i) the date at which a commitment for performance by the consultant or vendor is reached or (ii) the date at which the consultant or vendor’s performance is complete. In the case of equity instruments issued to consultants, the fair value of the equity instrument is recognized over the term of the consulting agreement. Stock-based compensation related to non-employees is accounted for based on the fair value of the related stock or options or the fair value of the services, whichever is more readily determinable in accordance with ASC 718.
Derivative Financial Instruments
We do not use derivative instruments to hedge exposure to cash flow, market or foreign currency risk. Terms of convertible promissory note instruments are reviewed to determine whether or not they contain embedded derivative instruments that are required under ASC 815 “Derivative and Hedging” (ASC 815) to be accounted for separately from the host contract, and recorded on the balance sheet at fair value. The fair value of derivative liabilities, if any, is required to be revalued at each reporting date, with corresponding changes in fair value recorded in current period operating results.
Freestanding warrants issued by us in connection with the issuance or sale of debt and equity instruments are considered to be derivative instruments and are evaluated and accounted for in accordance with the provisions of ASC 815. Pursuant to ASC 815, an evaluation of specifically identified conditions is made to determine whether fair value of warrants issued is required to be classified as equity or as a derivative liability.
Taxes
Income taxes are provided for the tax effects of transactions reported in the financial statements and consist of taxes currently due plus deferred taxes resulting from temporary differences. Such temporary differences result from differences in the carrying value of assets and liabilities for tax and financial reporting purposes. The deferred tax assets and liabilities represent the future tax consequences of those differences, which will either be taxable or deductible when the assets and liabilities are recovered or settled. Valuation allowances are established when necessary to reduce deferred tax assets to the amount expected to be realized.
Recent Accounting Pronouncements
Recent accounting pronouncements issued by FASB (including EITF), the AICPA and the SEC did not or are not believed by management to have a material impact on our present or future financial statements.
Our common stock was traded from November 15, 2005 to November 23, 2008 on the Pink Sheets and from November 24, 2008 to present on the Over the Counter Bulletin Board under the trading symbol “DLYT.” The following table sets forth the range of reported high and low sales prices of our common stock reported during the periods indicated, giving effect to the anticipated 10-for-1 reverse stock split.indicated. Such quotations reflect prices between dealers in securities and do not include any retail mark-up, mark-down or commission, and may not necessarily represent actual transactions. Trading in our common stock should not be deemed to constitute an “established trading market.”
After giving effect to the anticipated 10-for-1 reverse stock split | High | Low | ||||||||||||||||||||||
| High | Low | High | Low | |||||||||||||||||||||
| For the year ending December 31, 2011: | ||||||||||||||||||||||||
| First Quarter | $ | 0.50 | $ | 0.27 | $ | 5.00 | $ | 2.70 | $ | 0.50 | $ | 0.27 | ||||||||||||
| Second Quarter | $ | 0.44 | $ | 0.35 | $ | 4.40 | $ | 3.50 | $ | 0.44 | $ | 0.35 | ||||||||||||
| Third Quarter | $ | 0.60 | $ | 0.22 | ||||||||||||||||||||
| Fourth Quarter | $ | 0.48 | $ | 0.25 | ||||||||||||||||||||
| For the year ending December 31, 2010: | ||||||||||||||||||||||||
| First Quarter | $ | 0.44 | $ | 0.22 | $ | 4.40 | $ | 2.20 | $ | 0.44 | $ | 0.22 | ||||||||||||
| Second Quarter | $ | 0.50 | $ | 0.23 | $ | 5.00 | $ | 2.30 | $ | 0.50 | $ | 0.23 | ||||||||||||
| Third Quarter | $ | 0.40 | $ | 0.27 | $ | 4.00 | $ | 2.70 | $ | 0.40 | $ | 0.27 | ||||||||||||
| Fourth Quarter | $ | 0.37 | $ | 0.24 | $ | 3.70 | $ | 2.40 | $ | 0.37 | $ | 0.24 | ||||||||||||
| For the year ending December 31, 2009: | ||||||||||||||||||||||||
| First Quarter | $ | 0.20 | $ | 0.08 | $ | 2.00 | $ | 0.80 | $ | 0.20 | $ | 0.08 | ||||||||||||
| Second Quarter | $ | 0.19 | $ | 0.13 | $ | 1.90 | $ | 1.30 | $ | 0.19 | $ | 0.13 | ||||||||||||
| Third Quarter | $ | 0.26 | $ | 0.10 | $ | 2.60 | $ | 1.00 | $ | 0.26 | $ | 0.10 | ||||||||||||
| Fourth Quarter | $ | 0.95 | $ | 0.22 | $ | 9.50 | $ | 2.20 | $ | 0.95 | $ | 0.22 | ||||||||||||
| For the year ending December 31, 2008: | ||||||||||||||||||||||||
| First Quarter | $ | 0.51 | $ | 0.15 | $ | 5.10 | $ | 1.50 | $ | 0.51 | $ | 0.15 | ||||||||||||
| Second Quarter | $ | 0.51 | $ | 0.24 | $ | 5.10 | $ | 2.40 | $ | 0.51 | $ | 0.24 | ||||||||||||
| Third Quarter | $ | 0.45 | $ | 0.16 | $ | 4.50 | $ | 1.60 | $ | 0.45 | $ | 0.16 | ||||||||||||
| Fourth Quarter | $ | 0.20 | $ | 0.07 | $ | 2.00 | $ | 0.70 | $ | 0.20 | $ | 0.07 | ||||||||||||
Transfer Agent
Our transfer agent is Clear Trust Transfer located at 16540 Pointe Village Dr., Suite 201, Lutz, Florida 33558, telephone (813) 235- 4490.
Holders
As of September 12February 6 , 20112012 there were approximately 19 2200 shareholders of record of our common stock. This does not include an indeterminate number of shareholders whose shares are held by brokers in street name.
Dividend Policy
We have not declared or paid any dividends and do not intend to pay any dividends in the foreseeable future to the holders of our common stock. We intend to retain future earnings, if any, for use in the operation and expansion of our business. Any future decision to pay dividends on common stock will be at the discretion of our board of directors and will depend on our financial condition, results of operations, capital requirements and other factors our board of directors may deem relevant.
Equity Compensation Plan Information
The following table sets forth information regarding our 2000 Incentive Compensation Plan (the “2000 Plan”) and the 2009 Long-Term Incentive Plan (the “2009 Plan”) under which our securities are authorized for issuance as of JuneSeptember 30, , 2011:
Plan Category | (a) Number of Securities to be Issued Upon Exercise of Outstanding Options, Warrants and Rights | (b) Weighted Average Exercise Price of Outstanding Options, Warrants and Rights | (c) Number of Securities Remaining Available for Future Issuance Under Equity Compensation Plans Excluding Securities Reflected in Column (a) | (a) Number of Securities to be Issued Upon Exercise of Outstanding Options, Warrants and Rights | (b) Weighted Average Exercise Price of Outstanding Options, Warrants and Rights | (c) Number of Securities Remaining Available for Future Issuance Under Equity Compensation Plans Excluding Securities Reflected in Column (a) | ||||||||||||||||||
| Equity compensation plans approved by security holders: | 17, 321,090 | $ | 0.3 2 | 9,530,000 | 17,346,090 | $ | 0.32 | 9,505,000 | ||||||||||||||||
| Equity compensation plans approved by security holders (after giving effect to the anticipated 10-for-1 reverse stock split) | 1,732,109 | $ | 3.20 | 953,000 | ||||||||||||||||||||
In June 2000 and November 2009, our board of directors adopted, and our shareholders approved, the 2000 Plan and 2009 Plan, respectively (together the “Plans”). The Plans provide for the grant of stock options, incentive stock options, stock appreciation rights, restricted stock, restricted stock units and bonus stock and other awards to eligible persons, as defined in said plans, including, but not limited to, our officers, directors and employees. Certain awards under the Plans may be subject to performance conditions.
Number of Shares of Common Stock Available Under the Plans. As of December 31, 2007, our board of directors approved and made available 6,093,882 shares of common stock (609,388 after giving effect to the anticipated 10-for-1 reverse stock split) to be issued pursuant to the 2000 Plan. Subsequently, our board of directors approved and made available an additional 5,000,000 shares of our common stock (500,000 after giving effect to the anticipated 10-for-1 reverse stock split) for issuance under the 2000 Plan. The 2000 Plan permits grants of options to purchase common shares authorized and approved by our Board of Directors and shareholders for issuance prior to the enactment of the 2000 Plan. On November 5, 2009, our board of directors approved and made available a total of 15,000,000 shares of common stock (1,500,000 after giving effect to the anticipated 10-for-1 reverse stock split) to be issued pursuant to the 2009 Plan.
Administration of the Plans. The Plans are administered by a committee of two or more directors designated by the board of directors to administer the Plans (the “Committee”) or, in the absence of such Committee, by the full board of directors. Currently, the Plans are administered by our board of directors. The board of directors has the authority to select the participants to whom awards under Plans will be granted, grant awards, determine the type, number and other terms and conditions of, and all other matters relating to, awards granted under the Plans and to prescribe the rules and regulations for the administration of the Plans. No option or stock appreciation rights granted under the Plans shall be exercisable, however, more than ten years after the date of the grant.
Exercise Price. The Plans require the Committee to grant qualified options with an exercise price per share not less than the fair market price of a share of common stock on the date of grant of the option.
Transferability. Awards granted under the Plans are generally not transferable by the optionee otherwise than by will or the laws of descent and distribution and generally exercisable during the lifetime of the optionee only by the optionee.
Change in Control. All awards granted under the 2000 Plan which were not previously exercisable and vested shall become fully exercisable and vested upon a change of control, which includes the consummation of a merger or consolidation with or into any other entity, sale of all or substantially all of our assets, replacement of a majority of our board of directors, acquisition by any person of securities representing 20% or more of the voting power of our then outstanding securities (other than securities issued by us) or any other event which the board of directors determines would materially alter our structure or ownership.
Options Granted to Non-Employee Directors. Non-employee directors are usually granted options each year, which generally become exercisable upon the date of grant, and generally expire on the earlier of ten years from the date of grant or up to three years after the date that the optionee ceases to serve as a director.
Stand-Alone Grants
Our board of directors may grant common share purchase options or warrants to selected directors, officers, employees, consultants and advisors in payment of goods or services provided by such persons on a stand-alone basis outside of any of our Plans. The terms of these grants may be individually negotiated.
Our net tangible book value as of JuneSeptember 30, , 2011 was approximately $( 1,699,399) ($6,179,296), or $(0. 05)($0.16) per share of our common stock (($ 0.47) after giving effect to the anticipated 10-for-1 reverse stock split).stock. Our net tangible book value per share represents our total tangible assets less total liabilities divided by the number of shares of our common stock outstanding on JuneSeptember 30, , 2011. Assuming that we (i) effect a 10-for-1 reverse stock split, (ii) issue all of the shares of our common stock offered by us at an assumed public offering price of $4.00$0.3 2 per share, (iii) convert(ii) repayment of all convertible notes outstanding in the aggregate principal amount of $2,500,000 plus accrued interest, discharged by conversion or repayment using proceeds from the offering, which as of September 12, 2011February 6 , 2012 we estimate will be approximately $1.51$2.8 5 million of net proceeds from the offering, and approximately 474,200 shares of common stock, (iv)(iii ) issue approximately 166,971an estimated 2,087,138 shares of common stock pursuant to the executive compensation agreement, as described in “certain relationships“Certain Relationships and related party transactions,Related Party Transactions,” (v) issue 30,655 shares of common stock for services rendered, and (vi) issued 43,313 shares of common stock in connection with the exercise of warrants subsequent to June 30, 2011, and after deducting the commissions and estimated offering expenses payable by us, our net tangible book value as of JuneSeptember 30, , 2011 would have been approximately $ 13,713,5743,280,846 or $ 1.70$0.0 5 per share of our common stock. This amount represents an immediate increase in net tangible book value of $ 1.75$0.2 1 per share for our existing stockholders and an immediate dilution in net tangible book value of $ 2.30$0. 27 per share to new investors purchasing shares of our common stock in this offering.
We determine dilution by subtracting the adjusted net tangible book value per share after this offering from the public offering price per share of our common stock. The following table illustrates the dilution in net tangible book value per share to new investors:investors if all shares in the offering are sold:
| Public offering price per share | $ | 4.00 | ||||||
| Net tangible book deficit per share available to common shareholders as of June 30, 2011 | $ | (0.05 | ) | |||||
| Increase attributable to pro forma adjustments before the offering | $ | 0.53 | ||||||
| Pro forma net tangible book value per share before the offering | $ | 0.48 | ||||||
| Increase per share attributable to new investors in the offering | $ | 1.22 | ||||||
| Pro forma net tangible book value per share after the offering | $ | 1.70 | ||||||
| Dilution per share to new investors in the offering | $ | 2.30 | ||||||
| Public offering price per share | $ | 0.3 2 | ||||||
| Net tangible book deficit per share available to common shareholders as of September 30, 2011 | $ | (0.16 | ) | |||||
| Increase attributable to pro forma adjustments before the offering | $ | 0. 08 | ||||||
| Pro forma net tangible book value per share before the offering | $ | (0.0 8 | ) | |||||
| Increase per share attributable to new investors in the offering | $ | 0. 13 | ||||||
| Pro forma net tangible book value per share after the offering | $ | 0.0 5 | ||||||
| Dilution per share to new investors in the offering | $ | 0. 27 | ||||||
There is not a minimum number of shares that must be sold in this offering. Therefore, the proceeds of this offering will be immediately available for use by us and we do not have to wait until a minimum number of shares have been sold to use the proceeds from any sales. In the event we sell less than the total number of shares offered, the following table indicates the dilution in net tangible book value per share to new investors based on the percentage sold under the offering:
| 25% | 50% | 75% | ||||||||||
| Public offering price per share | $ | 0.3 2 | $ | 0.3 2 | $ | 0.3 2 | ||||||
| Net tangible book deficit per share available to common shareholders as of September 30, 2011 | $ | (0.16 | ) | $ | (0.16 | ) | $ | (0.16 | ) | |||
| Increase attributable to pro forma adjustments before the offering | $ | 0.0 4 | $ | 0.0 5 | $ | 0.0 8 | ||||||
| Pro forma net tangible book value per share before the offering | $ | (0.1 2 | ) | $ | (0. 11 | ) | $ | (0.0 8 | ) | |||
| Increase per share attributable to new investors in the offering | $ | 0.0 4 | $ | 0.0 7 | $ | 0.0 9 | ||||||
| Pro forma net tangible book value per share after the offering | $ | (0.08 | ) | $ | (0.04 | ) | $ | 0.01 | ||||
| Dilution per share to new investors in the offering | $ | 0.4 0 | $ | 0. 28 | $ | 0.3 1 |
The following shares were not included in the above calculation:calculations:
Shares of our common stock issuable upon exercise of stock options under our stock plans, which includes (as of JuneSeptember 30, , 2011) approximately 1 7,321,09017,346,090 shares of common stock (1, 732,109 shares of common stock upon giving effect to the anticipated 10-for-1 reverse split);stock;
Shares of our common stock reserved for issuance under various outstanding warrant agreements, which includes (as of JuneSeptember 30, , 2011) approximately 27,825,33326,575,333 shares of our common stock ( 2,782,533 upon effecting the anticipated 10-for-1 reverse split); however, we included 892,310 shares of common stock (89,231 shares of common stock upon effecting the anticipated 10-for-1 reverse split) issuable pursuant to common stock warrants, which were exercised via cashless exercise into approxinately 433,130 shares of common stock (43,313 shares of common stock upon effecting the anticipated 10-for-1 reverse split) after June 30, 2011;stock; and
Shares of our common stock reserved for future issuance under our stock plans, which includes approximately 9,530,000as of September 30, 2011 9,505,000 shares of our common stock (953,000 shares after giving effect to the anticipated 10-for-1 reverse stock split).stock.
To the extent that any outstanding options or warrants are exercised, new investors will experience further dilution.
Unless otherwise specifically stated, information throughout this prospectus assumes that none of our outstanding options or warrants to purchase shares of our common stock are exercised and no shares have been issued from the exercise of the Underwriter’s Warrant.any warrant that may be issued to a placement agent with respect to this offering.
The table below sets forth our capitalization as of JuneSeptember 30, , 2011. You should read this table together with Management’s Discussion and Analysis of Financial Condition and Results of Operation, and our financial statements and the related notes, appearing elsewhere in this prospectus.
| June 30 , 2011 Actual * | After giving effect to the anticipated 10- for -1 reverse stock split June 30 , 2011 | Conversion and Repayment of Convertible Notes | Issuance of Shares for Accrued Unpaid Compensation | Issuance of Shares for Services and Cashless Exercise of Warrants | The Offering | June 30 , 2011 Proforma ** | ||||||||||||||||||||||
| Common stock issued and outstanding | 36,095,064 | 3, 609,506 | 474,200 | 166, 971 | 73,968 | 3,750,000 | 8,074,645 | |||||||||||||||||||||
| Common stock underlying warrants | 2 8,717,641 | 2,871,764 | (89,231 | ) | 375,000 | 3,157,533 | ||||||||||||||||||||||
| Common stock underlying convertible promissory notes | 9,615,385 | 961,538 | (961,538 | ) | 0 | |||||||||||||||||||||||
| Options authorized and issued | 17,321,090 | 1,732,109 | 1,727,109 | |||||||||||||||||||||||||
| 91,749,180 | 9,174,917 | 12,963,287 | ||||||||||||||||||||||||||
As of September 30, 2011 | ||||
| Common stock issued and outstanding | 37,517,604 | |||
| Common stock underlying warrants | 26,575,332 | |||
| Common stock underlying convertible promissory notes | 10,605,900 | |||
| Options authorized and issued | 17 ,346,090 | |||
DESCRIPTION OF CAPITAL STOCK
The following is a brief description of our capital stock, including their material terms and provisions and as such terms and provisions are applied to our certificate of incorporation, as amended and our restated bylaws, copies of which have been filed with the SEC and are also available upon request from us, and applicable corporate laws of the State of New York.
Authorized Capital
We are authorized to issue shares of stock to be designated respectively “common stock” and “preferred stock” and collectively referred to herein as “capital stock.” The total number of shares of capital stock which we have the authority to issue are 210,000,000, consisting of 200,000,000 shares of common stock, par value $0.01 per share, and 10,000,000 shares of preferred stock, par value $0.01 per share.
Common Stock
We have approximately 36, 834,73537,517,604 shares of common stock issued and outstanding as of September 12February 6 , 2011 (3,6 83,474 after giving effect to the anticipated 10-for-1 reverse stock split).2012. We also have 257,213 shares (25,721 after giving effect to the anticipated 10-for-1 reverse stock split) held in our treasury. Each shareholder of our common stock is entitled to a pro rata share of cash distributions made to shareholders, including dividend payments. The holders of our common stock are entitled to one vote for each share of record on all matters to be voted on by shareholders. There is no cumulative voting with respect to the election of our directors or any other matter. The holders of our common stock are entitled to receive dividends when, as and if declared by our board of directors from funds legally available therefore. Cash dividends are at the sole discretion of our board of directors. In the event of our liquidation, dissolution or winding up, the holders of common stock are entitled to share ratably in all assets remaining available for distribution to them after payment of our liabilities and after provision has been made for each class of stock, if any, having any preference in relation to our common stock. Holders of shares of our common stock have no conversion, preemptive or other subscription rights, and there are no redemption provisions applicable to our common stock.
Stock Options and Warrants
As of September 12February 6 , 2011,2012, the following were outstanding:
Assuming the full exercise of the above options and warrants for cash in accordance with the respective terms of these securities (and assuming no cancellation, termination, forfeiture or adjustment), we would realize gross proceeds in the amount of $5 ,474,962$5,509,863 from the exercise of outstanding options and $9, 020,590$8,606,585 from the exercise of outstanding warrants, which would add up to an aggregate amount of $14, 495,552.$14,116,448. We note however, that no assurance can be provided that these options or warrants will ever be exercised by their holders, and that some of the above-mentioned warrants may be exercised on a cashless basis, if at all.
PLAN OF DISTRIBUTIONUNDERWRITING
None of our securities included in this offering may be offered or sold, directly or indirectly, nor may this prospectus and any other offering material or advertisements in connection with the offer and sales of any of our common stock be distributed or published in any jurisdiction, except under circumstances that will result in compliance with the applicable rules and regulations of that jurisdiction. Persons who receive this prospectus are advised to inform themselves about and to observe any restrictions relating to this offering of our common stock and the distribution of this prospectus.
This prospectus is neither an offer to sell nor a solicitation of any offer to buy any of our common stock included in this offering in any jurisdiction where that would not be permitted or legal.
Distribution
This is a public offering of up to 33,000,000 shares of our common stock. The underwriteroffering will be made by us to accredited investors with an existing relationship with us or a placement agent which is registered with FINRA. Funds to purchase shares of our common stock will be deposited by subscribers into an escrow account. If we terminate this offering, all funds received will be returned promptly without deduction or any interest earned thereon.
84
Compensation
Placement agents will receive cash compensation of 6% of the aggregate proceeds from the sale of common stock to investors secured by said placement agent and a warrant to purchase 6% of the aggregate number of shares of common stock issued to said purchasers. Any such warrant shall have an exercise price equal to 125% of the price per share paid by investors in this offering, be exercisable at any time, in whole or in part, for five years from the date of effectiveness of the registration statement of which this prospectus is a part, and shall contain a cashless exercise provision
| Per Share | Total | |||||||
| Public Offering Price | $ | 0.32 | $ | 10,560,000 | ||||
| Placement agent commission (1) | $ | 0.0192 | $ | 633,600 | ||||
| Offering Proceeds to Dais, before expenses(2) | $ | 0.3008 | $ | 9,926,400 | ||||
(1) For the purpose of estimating the placement agent’s fees, we have assumed that they will receive their maximum commission on all sales made in the offering. Does not include additional compensation to the placement agent consisting of warrants entitling the placement agent to purchase the number of shares of common stock equal to 6% of the number of shares of common stock sold by the placement agent in this offering.
(2) We estimate the total expenses of this offering, excluding the placement agent's commissions, will be approximately $277,804. Because there is no minimum offering amount required as a condition to closing in this offering, the actual public offering amount, the placement agent's commissions, and proceeds to us, if any, are not presently determinable and may be substantially less than the total maximum offering set forth above. Once the offering price has advised usbeen determined, the common stock offering price will remain fixed for the duration of the offering.
Our officers and directors will not receive any compensation for their role in offering or selling the shares.
Placement Agent Warrants
We have also agreed to issue to placement agents a warrant to purchase a number of our shares of common stock equal to an aggregate of 6% of the shares of common stock sold by any placement agent in this offering. The warrant will have an exercise price equal to 125% of the offering price of the shares sold in this offering and may be exercised on a cashless basis. The warrant is exercisable for a period of five years commencing after the effective date of the registration statement related to this offering. The warrant is not redeemable by us.
Pricing of this Offering
Our common stock is currently quoted on the OTC Bulletin Board. We cannot provide any assurance that it doesan active and liquid trading market in our securities will develop or, if developed, that the market will continue.
85
The public offering price of the shares offered by this prospectus has been determined by us. Among the factors we considered in determining the public offering price of the shares were:
| • | our history and our prospects; | ||
| • | the industry in which we operate including industry comparable information; | ||
| • | our past and present operating results; | ||
| • | our outstanding debt, and the value of the various option grants and warrants at the time of pricing; | ||
| • | the previous experience of our executive officers; and | ||
| • | the general condition of the securities markets at the time of this offering. |
The offering price stated on the cover page of this prospectus should not intendbe considered an indication of the actual value of the shares. That price is subject to confirm saleschange as a result of market conditions and other factors, and we cannot assure you that the shares can be resold at or above the public offering price.
Foreign Sales
Notice to Investors in the United Kingdom
In relation to each Member State of the European Economic Area which has implemented the Prospectus Directive (each, a “Relevant Member State”) an offer to the public of any securities which are the subject of the offering contemplated by this prospectus may not be made in that Relevant Member State except that an offer to the public in that Relevant Member State of any such securities may be made at any time under the following exemptions under the Prospectus Directive, if they have been implemented in that Relevant Member State:
(a) to legal entities which are authorized or regulated to operate in the financial markets or, if not so authorized or regulated, whose corporate purpose is solely to invest in securities;
(b) to any accounts overlegal entity which they exercise discretionary authority.has two or more of (1) an average of at least 250 employees during the last financial year; (2) a total balance sheet of more than €43,000,000 and (3) an annual net turnover of more than €50,000,000, as shown in its last annual or consolidated accounts;
(c) by the placement agent to fewer than 100 natural or legal persons (other than qualified investors as defined in the Prospectus Directive); or
(d) in any other circumstances falling within Article 3(2) of the Prospectus Directive, provided that no such offer of shares shall result in a requirement for the publication by the issuer or the placement agent of a prospectus pursuant to Article 3 of the Prospectus Directive.
For the purposes of this provision, the expression an “offer to the public” in relation to any security in any Relevant Member State means the communication in any form and by any means of sufficient information on the terms of the offer and any securities to be offered so as to enable an investor to decide to purchase such securities, as the same may be varied in that Member State by any measure implementing the Prospectus Directive in that Member State and the expression “Prospectus Directive” means Directive 2003/71/EC and includes any relevant implementing measure in each Relevant Member State.
86
• to legal entities which are authorized or regulated to operate in the financial markets or, if not so authorized or regulated, whose corporate purpose is solely to invest in securities;
• to any legal entity which has two or more of (1) an average of at least 250 employees during the last financial year; (2) a total balance sheet of more than 43,000,000 euros; and (3) an annual net turnover of more than 50,000,000 euros, as shown in the last annual or consolidated accounts; or
• in any other circumstances which do not require the publication by the issuer of a prospectus pursuant to Article 3 of the Prospectus Directive.
For the purposes of this provision, the expression an “offer of securities to the public” in relation to any common shares in any Relevant Member State means the communication in any form and by any means of sufficient information on the terms of the offer and the securities to be offered so as to enable an investor to decide to purchase or subscribe such securities, as the same may be varied in that Member State by any measure implementing the Prospectus Directive in that Member State. For these purposes the shares of common stock are being offered hereby.
We have agreed to issue MDB Capital Group, LLC a warrant to purchase shares of our common stock (10% of the shares of common stock sold in this offering, including the number of shares sold pursuant to the overallotment option). This warrant is exercisable at $ per share (equal to % of the price of the common stock sold in this offering), commencing on the date of effectiveness of the registration statement of which this prospectus forms a part, and expiring five years thereafter. We have granted the underwriter one demand registration right, and unlimited “piggy-back” registration rights, which rights are exercisable one year after the date of effectiveness of the registration statement of which this prospectus forms a part, for a period of four years, with respect to the shares of common stock underlying the warrant. The warrant and the shares of common stock underlying the warrant have been deemed compensation by the FINRA, and therefore they are subject to a one year lock-up pursuant to Rule 5110(g)(1) of the FINRA. Except as permitted by the FINRA rules, MDB Capital Group, LLC and any permitted assignees will not sell, transfer, assign, pledge, or hypothecate this warrant or the securities underlying this option, nor will it engage in any hedging, short sale, derivative, put, or call transaction that would result in the effective economic disposition of the warrant or the underlying securities for a period of one year from the date of effectiveness of the registration statement for this offering.
INDEMNIFICATION, LIMITATION OF LIABILITY, AND
DISCLOSURE OF COMMISSION POSITION ON INDEMNIFICATION
FOR SECURITIES ACT LIABILITIES
As permitted under the Business Corporation Law of the State of New York, our Certificate of Incorporation provides that all our directors shall be entitled to be indemnified for any breach of duty, provided that no indemnification maybe made to or on behalf of any director if a judgment or other final adjudication adverse to the director establishes that his acts were committed in bad faith or were the result of active and deliberate dishonesty and were material to the cause of action so adjudicated, or that he personally gained in fact a financial profit or other advantage to which he was not legally entitled.
Our Certificate of Incorporation further provides for indemnification of any person for actions as a director, officer, employee or agent of the Company to the fullest extent permitted by law with regards to fines, judgments fees and amounts paid in a settlement in an action or proceeding if the person acted in good faith and in a manner the person reasonably believed in or not opposed to the best interests of the Company and, with respect to any criminal action or proceeding, had no reasonable cause to believe the person’s conduct was unlawful.
Under our Director and Officer Insurance Policy, our directors and officers are provided liability coverage of $5 million subject to retention. In addition, we have secured a form following excess Director and Officer Insurance Policy in the amount of $2.5 million. The policies have a one year term with annual renewal possible. The policies can be terminated by the insurer if there is a merger or consolidation which includes a change in ownership of 50% of the voting shares. Upon such an occurrence the insurer may elect to cancel the policies. We may elect to then obtain “run off” insurance for a period of between one and six years at a cost of between 125% and 225% of the initial policy premiums. The policies are claims made policies. Each policy covers only claims relating to acts occurring after the continuity date provided such claims are made during the policy term. If an act giving rise to a claim occurs during the policy term, but the claim is not reported within 60 days of the termination or expiration policy, the claim will not be covered.
Insofar as indemnification for liabilities arising under the Securities Act may be permitted to directors, officers and controlling persons of the Registrant pursuant to the foregoing provisions, or otherwise, the Registrant has been advised that in the opinion of the Securities and Exchange Commission such indemnification is against public policy as expressed in the Act and is, therefore, unenforceable. In the event that a claim for indemnification against such liabilities (other than the payment by the Registrant of expenses incurred or paid by a director, officer or controlling person of the Registrant in the successful defense of any action, suit or proceeding) is asserted by such director, officer or controlling person in connection with the securities being registered, the Registrant will, unless in the opinion of its counsel that the matter has been settled by controlling precedent, submit to a court of appropriate jurisdiction the question whether such indemnification by it is against public policy as expressed in the Act and will be governed by the final adjudication of such issue.
LEGAL MATTERS
Certain legal matters will be passed upon by Richardson & Patel, LLP, Los Angeles, CA, as counsel to Dais. Certain legal matters will be passed upon by Golenbock Eiseman Assor Bell & Peskoe LLP, New York, New York, as counsel to the underwriter. Certain members of, and investment entities comprised of members of, and persons associated with, Richardson & Patel beneficially hold an aggregate 1,698,747 shares of common stock ( 169,875 shares upon giving effect to the anticipated 10 for 1 reverse stock split).stock.
INTEREST OF NAMED EXPERTS AND COUNSEL
Our audited financial statements for the fiscal years ended December 31, 2010 and 2009 have been included in this prospectus in reliance on the reports of Cross, Fernandez and Riley, LLP, independent registered public accounting firm, given on the authority of said firm as an expert in auditing and accounting. The aforesaid reports contain an explanatory paragraph relating to the registrant’s ability to continue as a going concern as described in the footnotes to the financial statements, and an explanatory paragraph related to the restatement of the December 31, 2009 financial statements for the correction of errors in accounting for certain common stock warrants.
Certain members of, and investment entities comprised of members of, and persons associated with, Richardson & Patel beneficially hold an aggregate 1,698,747 shares of common stock, ( 169,875 shares upon giving effect to the anticipated 10 for 1 reverse stock split), which represents 4.6%4.5% of our outstanding shares of common stock.
WHERE YOU CAN FIND FURTHER INFORMATION
We filed with the Securities and Exchange Commission (the “Commission”) a Registration Statement on Form S-1, under the Securities Act with respect to the common stock being offered in this offering. Although this prospectus, which forms a part of the Registration Statement, contains all of the material information set forth in the Registration Statement, parts of the Registration Statement are omitted in accordance with the rules and regulations of the Commission.
The omitted information may be inspected and copied, at prescribed rates, at the public reference facilities maintained by the Commission at Judiciary Plaza, 100 F Street, NE, Washington, D.C. 20549. The public may obtain information on the operation of the Public Reference Room by calling the Commission at 1-800-SEC-0330. The Commission maintains an Internet site at http://www.sec.gov that contains reports, proxy and information statements and other information regarding issuers that file electronically with the Commission. For further information with respect to our company and the securities being offered in this offering, reference is hereby made to the Registration Statement, including the exhibits thereto and the financial statements, notes, and schedules filed as a part thereof.
The Registration Statement, including all exhibits and schedules and amendments, has been filed with the Commission through the Electronic Data Gathering, Analysis and Retrieval (EDGAR) system. Copies of all of our filings with the Commission may be viewed on the Commission’s internet web site at http://www.sec.gov. We also maintain a website at http://www.daisanalytic.com. We may include our public filings on our website, and will include such information to the extent required by applicable law and the rules and regulations of any exchange on which our shares are listed.
CHANGES IN AND DISAGREEMENTS WITH ACCOUNTANTS ON ACCOUNTING AND FINANCIAL DISCLOSURE
Effective April 23, 2009, Pender Newkirk & Company LLP (“Pender”) notified Dais that it declined to stand for re-election as Dais’ independent registered public accounting firm since “the Company no longer met Pender’s continuation criteria”.
Effective April 24, 2009, the board of directors of Dais recommended and approved the appointment of Cross, Fernandez and Riley, LLP, Bayshore Center, 2907 Bay to Bay Blvd, Suite 360, Tampa, FL 33629 (“CFR”) as our new independent certified public accounting firm for the fiscal year ending December 31, 2009.
During our two most recent fiscal years ended December 31, 2010 and 2009, the audit report of CFR did not contain an adverse opinion or a disclaimer of opinion, and was not qualified or modified as to uncertainty, audit scope or accounting principles, except as follows: In our Annual Report on Form 10-K for the fiscal years ending December 31, 2010 and 2009, the Audit Report regarding our audited financial statements for the fiscal year ending December 31, 2010 and 2009 contained opinions regarding the significant doubt about our ability to continue as a going concern due to our lack of working capital and no near term prospect to raise additional growth capital, and an explanatory paragraph related to the restatement of the December 31, 2009 financial statements for the correction of errors in accounting for certain common stock warrants.
During our two most recent fiscal years, and any subsequent interim period prior to engaging Cross, Fernandez and Riley, LLP neither we nor anyone on behalf of us have consulted with Cross, Fernandez and Riley, LLP regarding either:
| 1. | The application of accounting principles to specified transactions, either completed or proposed or the type of audit opinion that might be rendered on our financial statements, and neither was a written report provided to us nor was oral advice provided that Cross, Fernandez and Riley, LLP concluded was an important factor considered by us in reaching a decision as to an accounting, auditing or financial reporting issue; or |
| 2. | Any matter that was either the subject of a disagreement or a reportable event, as each term is defined in Items 304(a)(1)(iv) or (v) of Regulation S-K, respectively. |
INDEX TO FINANCIAL STATEMENTS
| Page No. | ||||
| ANNUAL FINANCIAL INFORMATION | ||||
| Report of Independent Registered Public Accounting Firm for the years ended 2010 and 2009 | F-1 | |||
| Balance Sheets for the years ended December 31, 2010 and 2009 | F-2 | |||
| Statements of Operations for the years ended December 31, 2010 and 2009 | F-3 | |||
| Statements of Stockholders’ Deficit for the years ended December 31, 2010 and 2009 | F-4 | |||
| Statements of Cash Flows for the years ended December 31, 2010 and 2009 | F-5 | |||
| Notes to Financial Statements | F-7 | |||
| INTERIM FINANCIAL INFORMATION | ||||
| Balance Sheets | F-26 | |||
| Statements of Operations for the three and nine months periods ended | F-27 | |||
| Statement of Stockholders’ Deficit | F-28 | |||
| Statements of Cash Flows | F-29 | |||
| Notes to Financial Statements (Unaudited) | F-30 | |||
Report of Independent Registered Public Accounting Firm
Board of Directors and Stockholders
Dais Analytic Corporation
Odessa, Florida
We have audited the accompanying balance sheets of Dais Analytic Corporation (“the Company”) as of December 31, 2010 and 2009, and the related statements of operations, stockholders’ deficit, and cash flows for the years then ended. These financial statements are the responsibility of the Company’s management. Our responsibility is to express an opinion on these financial statements based on our audits.
We conducted our audits in accordance with the standards of the Public Company Accounting Oversight Board (United States). Those standards require that we plan and perform the audit to obtain reasonable assurance about whether the financial statements are free of material misstatement. The Company is not required to have, nor were we engaged to perform, an audit of its internal controls over financial reporting. Our audits included consideration of internal control over financial reporting as a basis for designing audit procedures that are appropriate in the circumstances, but not for the purpose of expressing an opinion on the effectiveness of the Company’s internal control over financial reporting. Accordingly, we express no such opinion. An audit also includes examining, on a test basis, evidence supporting the amounts and disclosures in the financial statements, assessing the accounting principles used and significant estimates made by management, as well as evaluating the overall financial statement presentation. We believe that our audits provide a reasonable basis for our opinion.
In our opinion, the financial statements referred to above present fairly, in all material respects, the financial position of Dais Analytic Corporation as of December 31, 2010 and 2009, and the results of its operations and its cash flows for the years then ended, in conformity with accounting principles generally accepted in the United States.
As more fully discussed in Note 12, the Company has restated the accompanying financial statements as of and for the year ended December 31, 2009 to correct errors in accounting for certain common stock warrants.
The accompanying financial statements have been prepared assuming that the Company will continue as a going concern. As discussed in Note 2, the Company has incurred significant losses since inception and has a working capital deficit and stockholders’ deficit of $2,861,448 and $6,722,092 at December 31, 2010. These factors raise substantial doubt about the Company’s ability to continue as a going concern. Management’s plans in regard to these matters are also discussed in Note 2. The financial statements do not include any adjustments that might result from the outcome of this uncertainty.
  |
| Cross, Fernandez & Riley LLP |
| Orlando, Florida March 31, 2011 |
F-1
Dais Analytic Corporation
Balance Sheets
| December 31, | ||||||||
| 2010 | 2009 | |||||||
| Restated | ||||||||
| Assets | ||||||||
| Current assets: | ||||||||
| Cash and cash equivalents | $ | 304,656 | $ | 1,085,628 | ||||
| Accounts receivable | 828,632 | 187,434 | ||||||
| Other receivables | 59,526 | |||||||
| Inventory | 294,069 | 149,986 | ||||||
| Prepaid expenses and other current assets | 258,136 | 103,571 | ||||||
| Total current assets | 1,745,019 | 1,526,619 | ||||||
| Property and equipment, net | 147,911 | 19,383 | ||||||
| Other assets: | ||||||||
| Deposits | 3,280 | 2,280 | ||||||
| Patents, net of accumulated amortization of $112,240 and $107,319 at December 31, 2010 and 2009, respectively | 74,363 | 72,464 | ||||||
| Total other assets | 77,643 | 74,744 | ||||||
| $ | 1,970,573 | $ | 1,620,746 | |||||
| Liabilities and Stockholders’ Deficit | ||||||||
| Current liabilities: | ||||||||
| Accounts payable, including related party payables of $151,440 and $150,740 at December 31, 2010 and 2009, respectively | $ | 620,196 | $ | 385,955 | ||||
| Accrued compensation and related benefits | 1,426,022 | 1,314,356 | ||||||
| Accrued expenses, other | 241,861 | 223,597 | ||||||
| Current portion of deferred revenue | 647,804 | 292,457 | ||||||
| Current portion of notes payable | 50,000 | 150,000 | ||||||
| Current portion of notes payable, related party | 1,620,624 | 1,425,624 | ||||||
| Total current liabilities | 4,606,507 | 3,791,989 | ||||||
| Long-term liabilities: | ||||||||
| Long-term portion of notes payable, related party | — | 300,000 | ||||||
| Warrant liability | 3,958,318 | 4,577,119 | ||||||
| Deferred revenue, net of current portion | 127,840 | 207,696 | ||||||
| Total long-term liabilities | 4,086,158 | 5,084,815 | ||||||
| Stockholders’ deficit: | ||||||||
| Preferred stock; $0.01 par value; 10,000,000 shares authorized; 0 shares issued and outstanding | — | — | ||||||
| Common stock; $0.01 par value; 200,000,000 shares authorized; 33,563,428 and 29,352,930 shares issued and 33,306,215 and 29,095,717 shares outstanding at December 31, 2010 and 2009, respectively | 335,635 | 293,530 | ||||||
| Capital in excess of par value | 29,852,347 | 27,926,893 | ||||||
| Accumulated deficit | (35,637,962 | ) | (34,204,369 | ) | ||||
| (5,449,980 | ) | (5,983,946 | ) | |||||
| Treasury stock at cost, 257,213 shares | (1,272,112 | ) | (1,272,112 | ) | ||||
| Total stockholders’ deficit | (6,722,092 | ) | (7,256,058 | ) | ||||
| $ | 1,970,573 | $ | 1,620,746 | |||||
The accompanying notes are an integral part of the financial statements.
F-2
Dais Analytic Corporation
Statements of Operations
| Year Ended December 31, | Year Ended December 31, | |||||||||||||||
| 2010 | 2009 | 2010 | 2009 | |||||||||||||
| Restated | Restated | |||||||||||||||
Revenue: | ||||||||||||||||
Sales | $ | 3,260,468 | $ | 1,447,071 | $ | 3,260,468 | $ | 1,447,071 | ||||||||
License fees | 82,000 | 84,144 | 82,000 | 84,144 | ||||||||||||
| 3,342,468 | 1,531,215 | 3,342,468 | 1,531,215 | |||||||||||||
Cost of goods sold | 2,290,041 | 1,071,098 | 2,290,041 | 1,071,098 | ||||||||||||
Gross profit | 1,052,427 | 460,117 | 1,052,427 | 460,117 | ||||||||||||
Expenses: | ||||||||||||||||
Research and development expenses, net of government grant proceeds of $99,732 and $0 | 238,182 | 6,600 | 238,182 | 6,600 | ||||||||||||
Selling, general and administrative | 2,693,092 | 3,217,992 | 2,693,092 | 3,217,992 | ||||||||||||
| 5,221,315 | 4,295,690 | |||||||||||||||
2,931,274 | 3,224,592 | |||||||||||||||
Loss from operations | (1,878,847 | ) | (2,764,475 | ) | (1,878,847 | ) | (2,764,475 | ) | ||||||||
Other expense (income): | ||||||||||||||||
Other (income) | (36,003 | ) | — | (36,003 | ) | — | ||||||||||
Change in fair value of warrant liability | (618,801 | ) | 3,731,694 | (618,801 | ) | 3,731,694 | ||||||||||
Interest expense | 209,550 | 621,574 | 209,550 | 621,574 | ||||||||||||
Interest income | — | (667 | ) | — | (667 | ) | ||||||||||
| (445,254 | ) | 4,352,601 | (445,254 | ) | 4,352,601 | |||||||||||
Net loss | $ | (1,433,593 | ) | $ | (7,117,076 | ) | $ | (1,433,593 | ) | $ | (7,117,076 | ) | ||||
Net loss per common share, basic and diluted | $ | (0.05 | ) | $ | (0.36 | ) | $ | (0.05 | ) | $ | (0.36 | ) | ||||
Weighted average number of common shares, basic and diluted | 29,985,632 | 19,960,150 | 29,985,632 | 19,960,150 | ||||||||||||
The accompanying notes are an integral part of the financial statements.
F-3
Dais Analytic Corporation
Statements of Stockholders’ Deficit
Years Ended December 31, 2010 and 2009
Common Stock | Capital in Excess of Par Value | Accumulated Deficit | Prepaid Services Paid for with Common Stock | Treasury Stock | Total Stockholders’ Deficit | Common Stock | Capital in Excess of Par Value | Accumulated Deficit | Prepaid Services Paid for with Common Stock | Treasury Stock | Total Stockholders’ Deficit | |||||||||||||||||||||||||||||||||||||||
| Shares | Amount | Shares | Amount | |||||||||||||||||||||||||||||||||||||||||||||||
| Balance, December 31, 2008 | 12,162,398 | 121,624 | 25,253,196 | (28,776,769 | ) | (23,375 | ) | (1,272,112 | ) | (4,697,436 | ) | 12,162,398 | 121,624 | 25,253,196 | (28,776,769 | ) | (23,375 | ) | (1,272,112 | ) | (4,697,436 | ) | ||||||||||||||||||||||||||||
Issuance of common stock for conversion of notes payable and related accrued interest | 13,553,822 | 135,538 | 2,576,062 | — | — | — | 2,711,600 | 13,553,822 | 135,538 | 2,576,062 | — | — | — | 2,711,600 | ||||||||||||||||||||||||||||||||||||
Issuance of common stock and warrant for services | 344,692 | 3,448 | 105,029 | — | 23,375 | — | 131,852 | 344,692 | 3,448 | 105,029 | — | 23,375 | — | 131,852 | ||||||||||||||||||||||||||||||||||||
Stock-based compensation expense | — | — | 1,504,669 | — | — | — | 1,504,669 | — | — | 1,504,669 | — | — | — | 1,504,669 | ||||||||||||||||||||||||||||||||||||
Issuance of warrants for debt conversion | — | — | 413,008 | — | — | — | 413,008 | — | — | 413,008 | — | — | — | 413,008 | ||||||||||||||||||||||||||||||||||||
Issuance of common stock and warrants for cash | 2,490,385 | 24,904 | 613,596 | — | — | — | 638,500 | 2,490,385 | 24,904 | 613,596 | — | — | — | 638,500 | ||||||||||||||||||||||||||||||||||||
Cumulative effect of change in accounting principle for warrant classification | — | — | (3,623,448 | ) | 1,689,476 | — | — | (1,933,972 | ) | — | — | (3,623,448 | ) | 1,689,476 | — | — | (1,933,972 | ) | ||||||||||||||||||||||||||||||||
Exercise of warrants and options | 801,633 | 8,016 | 1,084,781 | — | — | — | 1,092,797 | 801,633 | 8,016 | 1,084,781 | — | — | — | 1,092,797 | ||||||||||||||||||||||||||||||||||||
Net loss, restated | — | — | — | (7,117,076 | ) | — | — | (7,117,076 | ) | — | — | — | (7,117,076 | ) | — | — | (7,117,076 | ) | ||||||||||||||||||||||||||||||||
| Balance, December 31, 2009, restated | 29,352,930 | $ | 293,530 | $ | 27,926,893 | $ | (34,204,369 | ) | $ | — | $ | (1,272,112 | ) | $ | (7,256,058 | ) | 29,352,930 | $ | 293,530 | $ | 27,926,893 | $ | (34,204,369 | ) | $ | — | $ | (1,272,112 | ) | $ | (7,256,058 | ) | ||||||||||||||||||
Issuance of common stock and warrants for services | 888,692 | 8,887 | 503,993 | — | — | — | 512,880 | 888,692 | 8,887 | 503,993 | — | — | — | 512,880 | ||||||||||||||||||||||||||||||||||||
Issuance of common stock for conversion of notes payable | 1,000,384 | 10,004 | 190,073 | — | — | — | 200,077 | 1,000,384 | 10,004 | 190,073 | — | — | — | 200,077 | ||||||||||||||||||||||||||||||||||||
Stock based compensation | — | — | 651,032 | — | — | — | 651,032 | — | — | 651,032 | — | — | — | 651,032 | ||||||||||||||||||||||||||||||||||||
Issuance of common stock in exchange for debt settlement | 2,321,422 | 23,214 | 580,356 | — | — | — | 603,570 | 2,321,422 | 23,214 | 580,356 | — | — | — | 603,570 | ||||||||||||||||||||||||||||||||||||
| Net loss | — | — | — | (1,433,593 | ) | — | — | (1,433,593 | ) | — | — | — | (1,433,593 | ) | — | — | (1,433,593 | ) | ||||||||||||||||||||||||||||||||
| Balance, December 31, 2010 | 33,563,428 | $ | 335,635 | $ | 29,852,347 | $ | (35,637,962 | ) | $ | — | $ | (1,272,112 | ) | $ | (6,722,092 | ) | 33,563,428 | $ | 335,635 | $ | 29,852,347 | $ | (35,637,962 | ) | $ | — | $ | (1,272,112 | ) | $ | (6,722,092 | ) | ||||||||||||||||||
The accompanying notes are an integral part of the financial statements.
F-4
Dais Analytic Corporation
Statements of Cash Flows
| Years Ended December 31, | ||||||||
| 2010 | 2009 | |||||||
| (restated) | ||||||||
| Operating activities | ||||||||
| Net loss | $ | (1,433,593 | ) | $ | (7,117,076 | ) | ||
| Adjustments to reconcile net loss to net cash used by operating activities: | ||||||||
| Depreciation and amortization | 15,276 | 19,826 | ||||||
| Amortization of deferred loan costs | — | 1,004 | ||||||
| Amortization of discount on convertible notes | — | 144 | ||||||
| Amortization of the beneficial conversion feature on convertible notes | — | 29,992 | ||||||
| Issuance of common stock, stock options and stock warrants for services and amortization of common stock issued for services | 287,035 | 110,316 | ||||||
| Stock based compensation expense | 651,034 | 1,504,669 | ||||||
| Issuance of common stock warrants to induce conversion of notes payable | — | 413,008 | ||||||
| Change in fair value of warrant liability | (618,801 | ) | 3,731,694 | |||||
| (Increase) decrease in: | ||||||||
| Accounts receivable | (641,198 | ) | 1,536 | |||||
| Other receivables | (59,526 | ) | — | |||||
| Inventory | (144,083 | ) | (2,858 | ) | ||||
| Prepaid expenses and other current assets | (4,984 | ) | (50,853 | ) | ||||
| Increase (decrease) in: | ||||||||
| Accounts payable and accrued expenses | 380,835 | 251,014 | ||||||
| Accrued compensation and related benefits | 111,666 | 166,967 | ||||||
| Deferred revenue | 275,491 | 122,239 | ||||||
| Net cash used by operating activities | (1,180,848 | ) | (818,378 | ) | ||||
| Investing activities | ||||||||
| Increase in patent costs | (6,819 | ) | (39,265 | ) | ||||
| Purchase of property and equipment | (113,305 | ) | (1,346 | ) | ||||
| �� | ||||||||
| Net cash used by investing activities | (120,124 | ) | (40,611 | ) | ||||
| Financing activities | ||||||||
| Proceeds from issuance of notes payable, related party | 620,000 | 1,565,000 | ||||||
| Payments on notes payable, related party | (100,000 | ) | (290,000 | ) | ||||
| Proceeds from advance from related party | — | 222,900 | ||||||
| Repayments of advance from related party | — | (222,900 | ) | |||||
| Issuance of common stock and exercise of warrants for cash | — | 642,750 | ||||||
| Net cash provided by financing activities | 520,000 | 1,917,750 | ||||||
| Net (decrease) increase in cash and cash equivalents | (780,972 | ) | 1,058,761 | |||||
| Cash and cash equivalents, beginning of period | 1,085,628 | 26,867 | ||||||
| Cash and cash equivalents, end of period | $ | 304,656 | $ | 1,085,628 | ||||
| Cash paid during the year for interest | $ | — | $ | 42,651 | ||||
The accompanying notes are an integral part of the financial statements.
F-5
Dais Analytic Corporation
Statements of Cash Flows
Supplemental disclosures of cash flow information and noncash investing and financing activities:
During the years ended December 31, 2010 and 2009, the Company issued 1,000,384 and 13,553,822 shares of common stock in conversion of $175,000 and $2,350,000 of notes payable and $25,077 and $361,600 of accrued interest, respectively.
During the year ended December 31, 2010, two note holders elected to apply all of the proceeds due and payable under their notes, including all accrued interest, to purchase 2,321,422 shares of the Company’s Common Stock at a purchase price of $0.26 per share resulting in an aggregate purchase price of $603,570.
During the years ended December 31, 2010 and 2009, the Company issued 888,692 and 344,692 shares of common stock and warrants for services valued at $512,880 and $110,316, respectively.
The cumulative effect for the change in accounting principle related to warrant classification resulted in an increase of $1,689,476 to retained earnings and a $3,623,448 decrease to capital in excess of par value at January 1, 2009. Additionally, the exercise of certain warrants during the year ended December 31, 2009 resulted in the reclassification of $1,088,547 from warranty liability to capital in excess of par value.
The accompanying notes are an integral part of the financial statements.
F-6
Dais Analytic Corporation
Notes to Financial Statements
Years Ended December 31, 2010 and 2009
1. Background Information
Dais Analytic Corporation (the “Company”), a New York corporation, has developed and is commercializing applications using its nano-structure polymer technology. The first commercial product is an energy recovery ventilator (“ERV”) (cores and systems) for use in commercial Heating, Ventilating, and Air Conditioning (HVAC) applications. In addition to direct sales, the Company licenses its nano-structured polymer technology to strategic partners in the aforementioned application and is in various stages of development with regard to other applications employing its base technologies. The Company was incorporated in April of 1993 with its corporate headquarters located in Odessa, Florida.
The Company is dependent on third parties to manufacture the key components needed for our nano-structured based materials and value added products made with these materials. Accordingly, a supplier’s failure to supply components in a timely manner, or to supply components that meet our quality, quantity and cost requirements or our technical specifications, or the inability to obtain alternative sources of these components on a timely basis or on terms acceptable to us, would create delays in production of our products or increase our unit costs of production. Certain of the components contain proprietary products of our suppliers, or the processes used by our suppliers to manufacture these components are proprietary. If we are required to replace any of our suppliers, while we should be able to obtain comparable components from alternative suppliers at comparable costs, this would create a delay in production.
For the years ended December 31, 2010 and 2009, seven five customers accounted for approximately 61% (seven customers represented the following percentages of sales 13%, 13%, 9%, 7%, 7%, 6% and 6%) and 66% (five customers represented the following percentages of sales 27%, 16%, 12%, 7% and 4%) of the Company’s total revenue, respectively. At December 31, 2010 and 2009 amounts due from these customers was approximately 61% and 25% of total accounts receivable, respectively.
2. Going Concern
The accompanying financial statements have been prepared assuming that the Company will continue as a going concern. For the year ended December 31, 2010, the Company incurred a net loss of $1,433,593 and has incurred significant losses since inception. As of December 31, 2010, the Company has an accumulated deficit of $35,673,962, negative working capital of $2,861,488 and a stockholders’ deficit of $6,722,092. The Company used $1,180,848 and $818,378 of cash from operations during 2010 and 2009, respectively, which was funded by proceeds from debt and equity financings. There is no assurance that such financing will be available in the future. In view of these matters, there is substantial doubt that the Company will continue as a going concern. The Company is currently pursuing the following sources of short and long-term working capital:
| 1. | We are currently holding preliminary discussions with parties who are interested in licensing, purchasing the rights to, or establishing a joint venture to commercialize certain applications of our technology. |
| 2. | We are seeking growth capital from certain strategic and/or government (grant) related sources. In addition to said capital, these sources may, pursuant to any agreements that may be developed in conjunction with such funding, assist in the product definition and design, roll-out, and channel penetration of our products. As part of this step we will attempt to take advantage of key programs associated with the recently enacted American Recovery and Reinvestment Act of 2009. |
The Company’s ability to continue as a going concern is highly dependent on our ability to obtain additional sources of cash flow sufficient to fund our working capital requirements. However, there can be no assurance that the Company will be successful in its efforts to secure such cash flow. Any failure by us to timely procure additional financing or investment adequate to fund our ongoing operations, including planned product development initiatives and commercialization efforts, will have material adverse consequences on our financial condition, results of operations and cash flows.
F-7
The financial statements of the Company do not include any adjustments relating to the recoverability and classification of recorded assets, or the amounts and classifications of liabilities that might be necessary should the Company be unable to continue as a going concern.
3. Significant Accounting Policies
The significant accounting policies followed are:
Use of estimates - The preparation of financial statements in conformity with accounting principles generally accepted in the United States of America requires management to make estimates and assumptions that affect the reported amounts of assets and liabilities and disclosure of contingent assets and liabilities at the date of the financial statements and the reported amounts of revenues and expenses during the reporting period. Actual results could differ from those estimates.
Cash and cash equivalents - All cash, other than held in escrow, is maintained with a major financial institution in the United States. Deposits with this bank may exceed the amount of insurance provided on such deposits. Temporary cash investments with an original maturity of three months or less are considered to be cash equivalents.
Accounts receivable - Accounts receivable consist primarily of receivables from the sale of our ERV products. The Company regularly reviews accounts receivable for any bad debts based on an analysis of the Company’s collection experience, customer credit worthiness, and current economic trends. At December 31, 2010, the days sales outstanding was 93, as compared to 47 at December 31, 2009. The increase in the number of days to collect our receivables is primarily a result of the downturn in the economy and additional approval and certifications that our products had to pass (for a small number of customers) prior to payment being made. Based on management’s review of accounts receivable, no allowance for doubtful accounts is considered necessary at December 31, 2010 and 2009.
Inventory - Inventory consists of raw materials and work-in-process and is stated at the lower of cost, determined by first-in, first-out method, or market. Market is determined based on the net realizable value, with appropriate consideration given to obsolescence, excessive levels, deterioration and other factors. At December 31, 2010 and 2009, the Company had $11,869 and $2,160 of in-process inventory, respectively. A reserve is recorded for any inventory deemed excessive or obsolete. No reserve is considered necessary at December 31, 2010 and 2009.
Property and equipment - Property and equipment are recorded at cost. Depreciation is calculated using the straight-line method over the estimated useful lives of the assets ranging from 5 to 7 years. Depreciation expense was approximately $10,400 and $8,900 for the years ended December 31, 2010 and 2009, respectively. Gains and losses upon disposition are reflected in the statement of operations in the period of disposition. Maintenance and repair expenditures are charged to expense as incurred.
Intangible assets - Identified intangible assets are reviewed for impairment whenever events or changes in circumstances indicate that the carrying amount may not be recoverable. The Company’s existing intangible assets consist solely of patents. Patents are amortized over their estimated useful or economic lives of 15 years. Patent amortization expense was approximately $4,900 and $10,100 for the years ended December 31, 2010 and 2009, respectively. Total patent amortization expense for the next five years is estimated to be approximately $15,000 per year.
Long-lived assets - Long-lived assets are reviewed for impairment whenever events or changes in circumstances indicate that the book value of the asset may not be recoverable. The Company periodically evaluates whether events and circumstances have occurred that indicate possible impairment. When impairment indicators exist, the Company uses market quotes, if available or an estimate of the future undiscounted net cash flows of the related asset or asset group over the remaining life in measuring whether or not the asset values are recoverable. There have been no significant impairments of long-lived assets during the two-year period ended December 31, 2010.
F-8
Research and development expenses, and grant proceeds - Expenditures for research, development, and engineering of products are expensed as incurred. For the years ended December 31, 2010 and 2009, the Company incurred research and development costs of approximately $337,900 and $6,600, respectively. The Company accounts for proceeds received from government grants for research as a reduction in research and development costs. For the year ended December 31, 2010, the Company recorded approximately $99,000 in grant proceeds against research and development expenses on the statement of operations. No such grant proceeds were recognized for the year ended December 31, 2009.
Stock issuance costs - Stock issuance costs are recorded as a reduction of the related proceeds through a charge to stockholders’ equity.
Common stock - The Company records common stock issuances when all of the legal requirements for the issuance of such common stock have been satisfied.
Revenue recognition - Generally, the Company recognizes revenue for its products upon shipment to customers, provided no significant obligations remain and collection is probable. This policy applies to all of our customers, including Genertec America (a distribution agreement) and CAST Systems Control Technology Co. (an agreement for the purchase of specific goods).
Our ConsERV product typically carries a warranty of two years for all parts contained therein with the exception of the energy recovery ventilator core which typically carries a 10 year warranty. The warranty includes replacement of defective parts. The Company has recorded an accrual of approximately $11,500 for future warranty expenses at December 31, 2010.
Revenue derived from the sale of licenses is deferred and recognized as revenue on a straight-line basis over the life of the license, or until the license arrangement is terminated. The Company recognized revenue of approximately $82,000 and $84,000 from license agreements for the years ended December 31, 2010 and 2009, respectively.
Government Grants - Grants are recognized when there is reasonable assurance that the grant will be received and that any conditions associated with the grant will be met. When grants are received related to Property and Equipment, the Company reduces the basis of the assets on the Statement of Financial Position, resulting in lower depreciation expense over the life of the associated asset. Grants received related to expenses are reflected as a reduction of the associated expense in the period in which the expense is incurred.
Stock based compensation - The Company recognizes all share-based payments to employees, including grants of employee stock options, as compensation expense in the financial statements based on their fair values. That expense will be recognized over the period during which an employee is required to provide services in exchange for the award, known as the requisite service period (usually the vesting period).
The value of each grant is estimated at the grant date using the Black-Scholes option model with the following assumptions for options granted during the years ended December 31, 2010 and 2009:
| Years Ended December 31, | ||||||
| 2010 | 2009 | |||||
| Dividend rate | 0 | % | 0 | % | ||
| Risk free interest rate | 1.96%–3.68 | % | 1.65%–3.49 | % | ||
| Expected term | 5 – 6.5 years | 5 – 10 years | ||||
| Expected volatility | 97%– 112 | % | 92%– 106 | % | ||
F-9
The basis for the above assumptions are as follows: the dividend rate is based upon the Company’s history of dividends; the risk-free interest rate for periods within the expected term of the option is based on the U.S. Treasury yield curve in effect at the time of grant; the expected term was calculated based on the Company’s historical pattern of options granted and the period of time they are expected to be outstanding; and expected volatility was calculated by review of a peer company’s historical activity.
Forfeitures are estimated at the time of grant and revised, if necessary, in subsequent periods if actual forfeitures differ from those estimates. Based on historical experience of forfeitures, the Company estimated forfeitures at 0% for each of the years ended December 31, 2010 and 2009.
Non-employee stock-based compensation - The Company’s accounting policy for equity instruments issued to consultants and vendors in exchange for goods and services follows the provisions of EITF 96-18, “Accounting for Equity Instruments That are Issued to Other Than Employees for Acquiring , or in Conjunction with Selling Goods or Services,” now ASC 505 and EITF 00- 18 “Accounting Recognition for Certain Transactions Involving Equity Instruments Granted to Other Than Employees,” now ASC 505. The measurement date for the fair value of the equity instruments issued is determined at the earlier of (i) the date at which a commitment for performance by the consultant or vendor is reached or (ii) the date at which the consultant or vendor’s performance is complete. In the case of equity instruments issued to consultants, the fair value of the equity instrument is recognized over the term of the consulting agreement. Stock-based compensation related to non-employees is accounted for based on the fair value of the related stock or options or the fair value of the services, whichever is more readily determinable in accordance with ASC 718.]
The fair value of warrants issued in 2010 and 2009 was calculated using the Black-Scholes model with the following assumptions: Expected life in years: 5-10 years and 5-10 years, respectively; Estimated volatility 96% - 100% and 80% - 114%, respectively; Risk-free interest rate: 2.38% - 2.57% and 2.64% - 3.98%, respectively; Dividend yield: 0%.
Financial instruments - In September 2006, the Financial Accounting Standards Board (FASB) introduced a framework for measuring fair value and expanded required disclosure about fair value measurements of assets and liabilities. The Company adopted the standard for those financial assets and liabilities as of the beginning of the 2008 fiscal year and the impact of adoption was not significant. FASB Accounting Standards Codification (ASC) 820 “Fair Value Measurements and Disclosures” (ASC 820) which defines fair value as the exchange price that would be received for an asset or paid to transfer a liability (an exit price) in the principal or most advantageous market for the asset or liability in an orderly transaction between market participants on the measurement date. ASC 820 also establishes a fair value hierarchy that distinguishes between
(1) market participant assumptions developed based on market data obtained from independent sources (observable inputs) and
(2) an entity’s own assumptions about market participant assumptions developed based on the best information available in the circumstances (unobservable inputs). The fair value hierarchy consists of three broad levels, which gives the highest priority to unadjusted quoted prices in active markets for identical assets or liabilities (Level 1) and the lowest priority to unobservable inputs (Level 3). The three levels of the fair value hierarchy are described below:
Level 1 - Unadjusted quoted prices in active markets that are accessible at the measurement date for identical, unrestricted assets or liabilities.
Level 2 - Inputs other than quoted prices included within Level 1 that are observable for the asset or liability, either directly or indirectly, including quoted prices for similar assets or liabilities in active markets; quoted prices for identical or similar assets or liabilities in markets that are not active; inputs other than quoted prices that are observable for the asset or liability (e.g., interest rates); and inputs that are derived principally from or corroborated by observable market data by correlation or other means.
Level 3 - Inputs that are both significant to the fair value measurement and unobservable.
Fair value estimates discussed herein are based upon certain market assumptions and pertinent information available to management as of December 31, 2010. The Company uses the market approach to measure fair value for its Level 1 financial assets and liabilities, which include cash equivalents of $10,150 at December 31, 2010. The market approach uses prices and other relevant information generated by market transactions involving identical or comparable assets and liabilities.
F-10
The respective carrying value of certain on-balance sheet financial instruments approximated their fair values due to the short-term nature of these instruments. These financial instruments include cash, accounts receivable, other receivables, accounts payable, accrued compensation and accrued expenses. The fair value of the Company’s notes payable is estimated based on current rates that would be available for debt of similar terms which is not significantly different from its stated value.
The Company’s financial liabilities measured at fair value consisted of the following as of December 31, 2010 and were valued as discussed in Note 12:
| Fair Value Measurements at December 31, 2010 | ||||||||||||||||
Total carrying value | Quoted prices in active markets (Level 1) | Significant other observable inputs (Level 2) | Significant unobservable inputs (Level 3) | |||||||||||||
| Warrant liability | 3,958,318 | — | — | 3,958,318 | ||||||||||||
A reconciliation of the beginning and ending fair values of financial instruments valued using significant unobservable inputs (Level 3) is presented as follows:
| Warrant Liability | ||||||||
Balance at December 31, 2009 | $ | 4,577,119 | ||||||
Changes in fair value | (618,801 | ) | ||||||
Balance at December 31, 2010 | $ | 3,958,318 | ||||||
| Warrant Liability | ||||
| Balance at December 31, 2009 | $ | 4,577,119 | ||
| Changes in fair value | (618,801 | ) | ||
| Balance at December 31, 2010 | $ | 3,958,318 | ||
Income taxes - Income taxes are provided for the tax effects of transactions reported in the financial statements and consist of taxes currently due plus deferred taxes resulting from temporary differences. Such temporary differences result from differences in the carrying value of assets and liabilities for tax and financial reporting purposes. The deferred tax assets and liabilities represent the future tax consequences of those differences, which will either be taxable or deductible when the assets and liabilities are recovered or settled. Valuation allowances are established when necessary to reduce deferred tax assets to the amount expected to be realized.
The Company identifies and evaluates uncertain tax positions, if any, and recognizes the impact of uncertain tax positions for which there is a less than more-likely-than-not probability of the position being upheld when reviewed by the relevant taxing authority. Such positions are deemed to be unrecognized tax benefits and a corresponding liability is established on the balance sheet. The Company has not recognized a liability for uncertain tax positions. If there were an unrecognized tax benefit, the Company would recognize interest accrued related to unrecognized tax benefits in interest expense and penalties in operating expenses. The Company’s remaining open tax years subject to examination by the Internal Revenue Service include the years ended December 31, 2007 through 2009.
Loss per share - Basic and diluted earnings per share are computed based on the weighted-average common shares and common share equivalents outstanding during the period. Common share equivalents consist of stock options, warrants and convertible notes payable. Common share equivalents of 39,026,278 and 30,003,977 were excluded from the computation of diluted earnings per share for the years ended December 31, 2010 and 2009, respectively, because their effect is anti-dilutive.
F-11
Derivative Financial Instruments - The Company does not use derivative instruments to hedge exposure to cash flow, market or foreign currency risk. Terms of convertible promissory note instruments are reviewed to determine whether or not they contain embedded derivative instruments that are required under ASC 815 “Derivative and Hedging” (ASC 815) to be accounted for separately from the host contract, and recorded on the balance sheet at fair value. The fair value of derivative liabilities, if any, is required to be revalued at each reporting date, with corresponding changes in fair value recorded in current period operating results.
Freestanding warrants issued by the Company in connection with the issuance or sale of debt and equity instruments are considered to be derivative instruments and are evaluated and accounted for in accordance with the provisions of ASC 815. Pursuant to ASC 815, an evaluation of specifically identified conditions is made to determine whether fair value of warrants issued is required to be classified as equity or as a derivative liability.
Recent accounting pronouncements
Recent accounting pronouncements issued by FASB (including EITF), the AICPA and the SEC did not or are not believed by management to have a material impact on the Company’s present or future financial statements.
4. Property and Equipment
Property and equipment consist of the following:
| December 31, | ||||||||
| 2010 | 2009 | |||||||
| Furniture and fixtures | $ | 38,764 | $ | 33,530 | ||||
| Computer equipment | 64,305 | 57,344 | ||||||
| Demonstration equipment | 104,871 | — | ||||||
| Office and lab equipment | 216,248 | 194,429 | ||||||
| 424,188 | 285,303 | |||||||
| Less accumulated depreciation | 276,277 | 265,920 | ||||||
| $ | 147,911 | $ | 19,383 | |||||
5. Prepaid Expenses and Other Current Assets
Prepaid expenses and other current assets consist of the following:
| December 31, | ||||||||
| 2010 | 2009 | |||||||
| Prepaid expenses | $ | 31,070 | $ | 50,335 | ||||
| Prepaid insurance | 29,948 | 31,699 | ||||||
| Prepaid services paid for with common stock | 172,118 | 21,537 | ||||||
| Prepaid loan costs | 25,000 | — | ||||||
| $ | 258,136 | $ | 103,571 | |||||
F-12
6. Accrued Expenses, Other
Accrued expenses, other consist of the following:
| December 31, | ||||||||
| 2010 | 2009 | |||||||
| Accrued expenses, other | $ | 39,850 | $ | 127,768 | ||||
| Accrued registration rights penalty | 5,000 | 41,000 | ||||||
| Accrued interest | 14,676 | 28,127 | ||||||
| Accrued interest, related party | 157,683 | 13,502 | ||||||
| Accrued warranty costs | 11,452 | — | ||||||
| Contractual obligation | 13,200 | 13,200 | ||||||
| $ | 241,861 | $ | 223,597 | |||||
7. Notes Payable
Notes payable consist of the following:
| December 31, | ||||||||
| 2010 | 2009 | |||||||
| Convertible notes payable; interest at 9%; $50,000 currently in default; collateralized by the Company’s patents and patent applications | $ | 50,000 | $ | 150,000 | ||||
| Convertible notes payable, related party; interest at 9%; collateralized by the Company’s patents and patent applications | — | 175,000 | ||||||
| Note payable, related party; 7% interest; unsecured; settled during 2010 | — | 300,000 | ||||||
| Note payable, related party; interest at 10% per annum; due April 30, 2011 | 1,000,000 | 1,000,000 | ||||||
| Note payable, related party; 10% interest; unsecured; due April 30, 2011 | 620,000 | 250,000 | ||||||
| Note payable; related party | 624 | 624 | ||||||
| 1,670,624 | 1,875,624 | |||||||
| Less amounts currently due | 1,670,624 | 1,575,624 | ||||||
| Long-term portion | $ | $ | 300,000 | |||||
F-13
Convertible Notes
December 2007 and January 2008, the Company issued convertible promissory notes (the “Convertible Notes”) and warrants to purchase common stock in exchange for proceeds totaling $2,950,000. The Convertible Notes bear interest at nine percent per annum and have stated maturity dates from December 2008 to January 2009. The Convertible Notes are repayable in cash or convertible into shares of the Company’s stock at a rate of one share per $0.20 of outstanding principal and interest. Warrants to purchase 14,750,000 shares of the Company’s common stock accompanying the Convertible Notes are, subject to certain limitations, exercisable at $0.25 per share, vest immediately, and expire between December 2012 and January 2013. Due to certain adjustments that may be made to the terms of the warrants issued in December 2007, January 2008 and August 2008, if the Company issues or sell shares below the exercise price, the warrants have been classified as a liability as opposed to equity in accordance with the Derivatives and Hedging Topic of the FASB ASC 815-10-15 as it was determined that these warrants were not indexed to the Company’s stock. As a result, the fair market value of these warrants was remeasured on January 1, 2009 and marked to market at each subsequent financial reporting period. The Company has restated their 2009 Financial Statements to reflect this adjustment, see Note 12.
The Convertible Notes contain an embedded conversion feature. The Company accounted for this conversion feature and the detachable warrants by allocating the proceeds from issuance of the convertible notes to the beneficial conversion feature and the warrants based on their relative fair values.
To recognize the fair value of the warrants, the Company discounted the notes and increased additional paid in capital. The fair value of the beneficial conversion feature of $1,383,437 and discount of $1,566,563 related to the warrants were amortized over the term of the Convertible Notes. For the years ended December 31, 2010 and 2009, the Company recognized interest expense from the amortization of the beneficial conversion feature and discount of $0 and $30,136, respectively.
During the year ended December 31, 2009 eighteen holders converted their Convertible Notes, having an aggregate principal balance of $2,350,000 plus accrued interest of $361,600, into 13,553,822 shares of common stock. Some of the holders converted during periods in which we were offering an additional warrant as an inducement to convert. In accordance with said offers we issued additional warrants to purchase 1,665,000 shares of common stock, exercisable immediately at $0.25 per share and valued at $126,367, and 575,000 warrants, exercisable immediately at $0.75 per share valued at $286,641 which was recorded as interest expense during the twelve months ended December 31, 2009.
F-14
The value of each of the above groups of warrants was estimated using the Black-Scholes option model with the following assumptions for each of the exercise prices:
| Exercise Prices | ||||||||||
| $0.25 per share | $0.75 per share | |||||||||
| Fair value of underlying stock on date of award | $ | $ | 0.09 – 0.19 | $ | $ | 0.51 – 1.49 | ||||
| Dividend rate | 0 | % | 0 | % | ||||||
| Risk free interest rate | 1.65%–2.58 | % | 2.20%–2.49 | % | ||||||
| Expected term | 5 years | 5 years | ||||||||
| Expected volatility | 92%–94 | % | 95%–96 | % | ||||||
The warrants to purchase 1,665,000 shares of common stock as compared to the warrants to purchase 575,000 shares of common stock resulted in a lower fair value due to the lower fair value of the underlying common stock on the date of the award.
The warrants were issued as follows:
February 2009 | 124,875 | ||||
March 2009 | 999,000 | ||||
April 2009 | 416,250 | ||||
August 2009 | 124,875 | ||||
1,665,00 | |||||
September 2009 | 162,500 | ||||
October 2009 | 412,500 | ||||
| 575,000 | |||||
During 2009, four investors holding Convertible Notes with an aggregate outstanding principal balance of approximately $450,000 at December 31, 2008 notified the Company that they were asserting their rights to receive payment of the principal and interest pursuant to the terms of the Convertible Notes. In June of 2009, three of these investors, holding an aggregate principal note balance of $250,000, entered into a confession of judgment with the Company. Under that agreement, the three investors had the right, should the Company fail to pay all principal and interest due pursuant to their Convertible Notes on or before September 11, 2009, to file the confession of judgment with the court and seek to secure a judgment against the Company in the amount of all principal and interest due under their Convertible Notes together with the reasonable cost and expense of collection. All interest and principal related to the three Convertible Notes, $289,803 in the aggregate, was paid in full by the Company on or before September 11, 2009. In July 2009, the fourth investor, holding a Convertible Note in the principal amount of $200,000, agreed to extend said note to September 2009. In November 2009, this investor and the Company modified the Convertible note to extend the maturity date of said note to July 2010, pay the principal amount due in eight monthly installments commencing December of 2009, end the accrual of interest as of November 20, 2009 and convert the $34,861 in interest due under the Convertible Note as of November 20, 2009 into 170,137 shares of Company’s common stock. During the year ended December 31, 2010 the remaining principal balance of said loan of $175,000 was extinguished in full by the Company through cash payments of $100,000 and the conversion of $75,000 into 375,000 shares of common stock based on a per share conversion rate of $0.20. As of December 31, 2010 the outstanding principal balance of said loan was $0.
On November 4, 2010, an investor elected to convert his 9% secured convertible note of $100,000 principal and the related accrued interest $25,077 into 625,384 shares of Company’s Common Stock. Said investor also received an additional five-year warrant to purchase up to 62,538 shares of Common Stock, at an exercise price of $0.75 per share in consideration for converting his 9% secured convertible note.
F-15
As of December 31, 2010, $50,000 of principal on the Convertible Notes was outstanding, in default and due and payable in full. On March 23, 2011 this note was paid in full by Company.
Other Notes
In July 2009 we secured a loan of $300,000 from an investor and issued the lender an unsecured promissory note for the principal amount on December 8, 2009. Pursuant to the terms of the note, we are to pay the note holder simple interest at the rate seven percent per annum commencing on July 17, 2009 with all interest and principal due there under payable in cash on or before January 16, 2011. If an event of default were to occur the interest rate would increase to ten percent for the duration of the event. Should we not cure the default within 60 days of receiving notice the note holder may, at his option, declare all interest accrued and unpaid and principal outstanding immediately due and payable. On December 30, 2010, the investor elected to apply all of the proceeds due and payable under the Note, including all accrued interest, to the purchase of the Company’s Common Stock. Pursuant to this transaction, the investor subscribed for and received 1,268,472 shares of Common Stock at a purchase price of $0.26 per share resulting in an aggregate purchase price of $329,803. The number of shares issued was based upon the $0.26 fair value of the Company’s common stock on the settlement date.
In December 2009, we secured a loan in the principal amount of $1,000,000 from an investor. Pursuant to the terms of the note, we are to pay the holder simple interest at the rate of ten percent per annum commencing on the date of issuance with all interest and principal due and payable in cash on or before June 17, 2010 the note’s maturity date was extended to April 30, 2011. On March 22, 2011, the Company entered into a Securities Amendment and Exchange Agreement and an Amended and Restated Convertible Promissory Note (“2011 Convertible Note”, collectively “Exchange Agreements”) with the this investor. Pursuant to the terms and subject to the conditions set forth in the Exchange Agreements, the Company and the Investor amended and restated the $1,000,000 unsecured promissory note issued by the Company to Investor on or about December 17, 2009 (“Original Note”) to, among other things, extend the term to March 22, 2012. Interest in the amount of 10% per annum, commencing on December 17, 2009 and calculated on a 365 day year, and the principal amount of $1,000,000 will be paid on March 22, 2012. Subject to the terms and conditions of the 2011 Convertible Note, including limitations on conversion, the outstanding principal and interest under the 2011 Convertible Note will automatically convert into shares of the Company’s common stock at the then-effective conversion price upon the closing of a qualified firm commitment underwritten public offering (as defined in said note) or may be voluntarily converted by the investor at anytime during the term. The initial conversion price is $0.26 per share. Any principal or interest which is not converted will be repaid by the Company at the earlier of a qualified offering, (as defined in the 2011 Convertible Note which is filed as an exhibit to the Form 8K filed with the Securities and Exchange Commission on March 28, 2011), or March 22, 2012. Pursuant to and during the term of the 2011 Convertible Note, the Company will not issue or allow to exist any obligation for borrowed money, except for subordinate indebtedness in payment and priority, trade payables incurred in the ordinary course of business, purchase money secured indebtedness for equipment or inventory, unsecured and subordinate, or unsecured and subordinate working capital guarantees provided by, the Export Import Bank of the United States (the “EXIM Bank”), and indebtedness evidenced by the promissory note dated February 19, 2010 issued to RBC Capital Markets- Custodian of Leonard Samuels IRA (as amended) in the principal amount of $620,000.
The Company secured loans from two investors in the principal amounts of $250,000 and $620,000. The loan amounts were received by the Company on December 31, 2009 and February 18, 2010, respectively, and the Company issued the lenders unsecured promissory notes with respect to said loans on February 19, 2010. Pursuant to the terms of the notes, the Company is to pay the holders simple interest at the rate ten percent per annum commencing on the date of issuance with all interest and principal due and payable in cash on or before June 30, 2010 and August 10, 2010. After receipt of proceeds on the foregoing loans, we may not incur more than $500,000 in debt without the holders’ prior approval and said additional debt may not be senior to these promissory notes without holder’s permission. During the term of the notes, each note holder has the right to participate, by investing additional funds the total amount of which may not exceed the outstanding balance of the holder’s note, in any subsequent financings undertaken by Company. Any such participation shall be upon the same terms as provided for in the subsequent financing. If an event of default were to occur and said default is not cured within the allotted period, the holders may declare all principal and accrued and unpaid interest due and payable without presentment, demand, protest or notice. Further, in addition to all remedies available under law, each holder may in the event of a default opt to convert the principal and interest outstanding under its note into any debt or equity security which Company issued after the date of its note and prior to the date of full payment of its note in accordance with the same terms as the subsequent financing.
F-16
On December 27, 2010, one of the investors elected to apply all of the proceeds due and payable under the $250,000 Note, including all accrued interest, to the purchase of our common stock. Pursuant to this transaction, the investors subscribed for and received 1,052,950 shares of common stock at a purchase price of $0.26 per share resulting in an aggregate purchase price of $273,767 (the principal amount and related accrued interest under the note). The number of shares issued was based upon the $0.26 fair value of the Company’s common stock on the settlement date.
The $620,000 note’s maturity date was extended to April 30, 2011.
Accrued interest on the notes was $157,683 and $13,502 at December 31, 2010 and 2009, respectively.
8. Related Party Transactions
Timothy Tangredi, the Company’s Chief Executive Officer and Chairman, is a founder and a member of the Board of Directors of Aegis Biosciences, LLS (“Aegis”). Aegis, created in 1995, is a licensee of the Company’s nano-structured intellectual property and materials in the biomedical and healthcare fields. Mr. Tangredi spends approximately one to two days per month on Aegis business and is compensated by Aegis for his time and contribution(s). We granted Aegis two exclusive, world-wide licenses, the first in 1995 and the second in 2005. Pursuant to these licenses, Aegis has the right to use and sell products containing our polymer technologies in biomedical and healthcare applications. The first license was entered into in 1995 has been amended twice. In 2005, we agreed to accept $150,000 as payment in full of all royalties and no further license revenue will be forthcoming. The second license allows Aegis the use of our intellectual property in the field of healthcare. A one-time payment of $50,000 was made under this license in 2005. In addition, under the second license Aegis is to make royalty payments of 1.5% of the net sales price it receives with respect to any personal hygiene product, surgical drape or clothing products (the latter when employed in medical and animal related fields) and license revenue it receives should Aegis grant a sublicense to a third party. To date Aegis has sold no such products nor has it received any licensing fees requiring a royalty payment be made to us. All obligations for such payments will end on the earlier of June 2, 2015 or upon the aggregate of all sums paid to us by Aegis under the agreement reaching $1 million. The term of each respective license runs for the duration of the patented technology.
The Company rents a building that is owned by two stockholders of the Company, one of which is the Chief Executive Officer. Rent expense for this building is $3,800 per month. The Company recognized rent expense of approximately $49,000 in each of years ended December 31, 2010 and 2009. At December 31, 2010 and 2009, $151,440 and $150,740, respectively, were included in accounts payable for amounts owed to these stockholders for rent.
The Company also has accrued compensation due to the Chief Executive Officer and one other employee for deferred salaries earned and unpaid as of December 31, 2010 and 2009 of $1,415,606 and $1,314,356, respectively.
On May 21, 2009, to evidence a loan, the Company issued its Chief Executive Officer a promissory note in the principal amount of $51,900. The note is unsecured and bears a simple interest rate of 9% per annum. The principal amount plus all accrued interest is to be paid in full to the holder no later than July 31, 2009. This note was paid in full prior to maturity.
On June 10, 2009, to evidence a loan, the Company issued a promissory note in the principal amount of $10,000 to Ethos Business Ventures, an entity in which the Company’s Chief Executive Officer holds a controlling financial position. The note is unsecured and bears a simple interest rate of 9% per annum. The principal amount plus all interest accrued is to be paid in full to the holder no later than July 31, 2009. This note was paid in full prior to July 31, 2009.
On September 11, 2009, to evidence a loan, Company issued its Chief Executive Officer a promissory note in the principal amount of $124,000. The note is unsecured and bears a simple interest rate of 9% per annum. The principal amount plus all accrued interest is to be paid in full to the holder no later than October 15, 2009. This note was paid in full prior to October 15, 2009.
On September 11, 2009, to evidence a loan, the Company issued a promissory note in the principal amount of $37,000 to Ethos Business Ventures, an entity in which its Chief Executive Officer holds a position. The note is unsecured and bears a simple interest rate of 9% per annum. The principal amount plus all interest accrued is to be paid in full to the holder no later than October 15, 2009. This note was paid in full prior to October 15, 2009.
F-17
9. Authorized Shares
During the year ended December 31, 2009, the Company’s board of directors approved proposals to amend the Articles of Incorporation to increase the number of authorized shares of common stock from 100,000,000 to 200,000,000, respectively.
10. Preferred Stock
The Company’s Board of Directors has authorized 10,000,000 million shares of preferred stock with a par value of $0.01 to be issued in series with terms and conditions to be determined by the Board of Directors. The Company has designated 400,000 shares of Series A convertible preferred stock; 1,000,000 shares of Series B convertible preferred stock; 500,000 shares of Series C convertible preferred stock; and 1,100,000 shares of Series D convertible preferred stock. The Series A through D convertible preferred stock rank senior to the common stock as to dividends and liquidation. Each share of Series A through D convertible preferred stock is convertible into one share of common stock, except in specified circumstances as defined by the Company’s Certificate of Incorporation, and is automatically converted into common stock upon the occurrence of an initial public offering that meets certain criteria. No dividend or distribution may be paid on any shares of the Company’s common stock unless an equivalent dividend or distribution is paid on the Series A through D convertible preferred stock.
11. Stock Options and Warrants
In June 2000 and November 2009, our Board of Directors adopted, and our shareholders approved, the 2000 Plan and 2009 Plan, respectively (together the “Plans”). The Plans provide for the granting of options to qualified employees of the Company, independent contractors, consultants, directors and other individuals. As of December 31, 2009, the Company’s Board of Directors approved and made available 15,000,000 shares of common stock to be issued pursuant to the 2009 Plan. The Plans permit grants of options to purchase common shares authorized and approved by the Company’s Board of Directors.
The average fair value of options granted at market during 2010 and 2009 was $0.25 and $0.31 per option, respectively. The total intrinsic value of options exercised during the years ended December 31, 2010 and 2009 was $0 and $3,250, respectively.
The following summarizes the information relating to outstanding stock options activity with employees during 2010 and 2009:
Common Shares | Weighted Average Exercise Price | Weighted Average Remaining Contractual Term (in years) | Aggregate Intrinsic Value | |||||||||||||
| Outstanding at December 31, 2008 | 8,606,556 | $ | 0.26 | 7.58 | $ | 38,294 | ||||||||||
| Granted | 4,190,058 | $ | 0.21 | |||||||||||||
| Exercised | (25,000 | ) | $ | 0.17 | $ | 3,250 | ||||||||||
| Forfeited or expired | (472,732 | ) | $ | 0.58 | ||||||||||||
| Outstanding at December 31, 2009 | 12,298,882 | $ | 0.26 | 7.64 | $ | 1,052,839 | ||||||||||
| Granted | 2,970,000 | $ | 0.30 | |||||||||||||
| Forfeited or expired | (371,125 | ) | $ | 0.32 | ||||||||||||
| Outstanding at December 31, 2010 | 14,897,757 | $ | 0.25 | 7.19 | $ | 946,754 | ||||||||||
| Exercisable at December 31, 2010 | 13,834,563 | $ | 0.25 | 7.02 | $ | 940,594 | ||||||||||
| Exercisable at December 31, 2009 | 11,951,021 | $ | 0.24 | 7.61 | $ | 1,034,594 | ||||||||||
Stock compensation expense was approximately $651,000 for the year ended December 31, 2010 and $1,580,000 for the year ended December 31, 2009, including approximately $75,000 that was accrued for warrants issued subsequent to year end. The total fair value of shares vested during the years ended December 31, 2010 and 2009 was approximately $556,000 and $1,549,000, respectively.
F-18
As of December 31, 2010, there was approximately $222,000 of unrecognized employee stock-based compensation expense related to non vested stock options, of which $129,000, $81,000 and $12,000 is expected to be recognized for the years ended December 31, 2011, 2012 and 2013, respectively.
The following table represents our non vested share-based payment activity with employees for the year ended December 31, 2010 and 2009:
Number of Options | Weighted Average Grant Date Fair Value | |||||||
| Nonvested options - December 31, 2008 | 1,276,563 | $ | 0.37 | |||||
| Granted | 4,190,058 | $ | 0.31 | |||||
| Forfeited | (30,334 | ) | $ | 0.17 | ||||
| Vested | (5,088,426 | ) | $ | 0.30 | ||||
| Nonvested options - December 31, 2009 | 347,861 | $ | 0.27 | |||||
| Granted | 2,970,000 | $ | 0.25 | |||||
| Vested | (2,244,663 | ) | $ | 0.25 | ||||
| Forfeited | (10,004 | ) | $ | 0.28 | ||||
| Nonvested options - December 31, 2010 | 1,063,194 | $ | 0.25 | |||||
Warrants
At December 31, 2010, the Company had outstanding warrants to purchase the Company’s common stock which were issued in connection with multiple financing arrangements and consulting agreements. Information relating to these warrants is summarized as follows:
| Warrants | Remaining Number Outstanding | Weighted Average Remaining Life (Years) | Weighted Average Exercise Price | |||||||||
| Warrants-Daily Financing | 197,055 | .98 | $ | 0.55 | ||||||||
| Warrants-Additional Financing | 428,637 | 1.70 | $ | 0.40 | ||||||||
| Warrants-Robb Trust Note | 50,000 | 1.42 | $ | 0.55 | ||||||||
| Warrants-Financing | 14,750,000 | 1.99 | $ | 0.25 | ||||||||
| Warrants-Placement Agent Warrants | 793,641 | 2.26 | $ | 0.25 | ||||||||
| Warrants-Tangredi | 3,000,000 | 2.25 | $ | 0.36 | ||||||||
| Warrants-Ehrenberg | 250,000 | 2.59 | $ | 0.30 | ||||||||
| Warrants-Consulting Agreement | 825,000 | 3.77 | $ | 0.31 | ||||||||
| Warrants-Note Conversions | 2,302,538 | 3.42 | $ | 0.39 | ||||||||
| Warrants-Stock Purchases 2009 | 758,270 | 3.40 | $ | 0.34 | ||||||||
| Warrants-Mandelbaum | 50,000 | 3.33 | $ | 0.19 | ||||||||
| Warrants-Services | 400,000 | 4.06 | $ | 0.50 | ||||||||
| Total | 23,805,141 | |||||||||||
Common Stock Issued For Services
The Company entered into a consulting agreement in September of 2008. In October of 2009, the agreement was amended to extend the term for nine months. Company is to issue the consultant 10,000 shares of common stock in each of said nine months for total shares of 90,000, with no award of stock for January and February 2010. For the year ended December 31, 2010, the Company has issued 106,000 shares of common stock and recorded $44,050 as consulting expense on its statement of operations.
F-19
The Company entered into an agreement for consulting services in April 2010. The term of the agreement is for twelve months and calls for the Company to issue the consultant 100,000 shares of common stock upon execution of the agreement and an additional 100,000 shares of common stock after six months of service. The agreement also calls for a monthly cash payment of $6,000 for the first six months and $7,500 per month for the remainder of the agreement. The Company has fair valued the initial 100,000 shares of common stock at $53,000 and the additional 100,000 shares of common stock at $36,000 and is expensing the fair value of those shares over life of the agreement. For the year ended December 31, 2010, the Company has recorded $68,000 as consulting expense on its statement of operations and included $21,000 as prepaid expenses in the balance sheet.
The Company issued 207,692 shares of common stock during the year ended December 31, 2010 valued at $64,384 for legal services to be provided from January 1, 2010 through December 31, 2010. For the year ended December 31, 2010, the Company has recorded $64,384 as legal expense in its statement of operations.
On November 4, 2010, the Company entered into an agreement for legal services in exchange for 375,000 shares of Common Stock valued at $150,000. For the year ended December 31, 2010, the Company has recorded $150,000 as prepaid expenses in the accompanying balance sheet.
12. Derivative Financial Instruments
In September 2008, the FASB ratified the consensus reached on EITF Issue No. 07-5, Determining Whether an Instrument (or an Embedded Feature) is Indexed to an Entity’s Own Stock (“EITF 07-5”) (codified as ASC 815-40-15-5). This EITF provides guidance for determining whether an equity-linked financial instrument (or embedded feature) is indexed to an entity’s own stock. The EITF applies to any freestanding financial instrument or embedded feature that has all the characteristics of a derivative under ASC 815-10- 15-13 through 15-130, Accounting for Derivative Instruments and Hedging Activities, for purposes of determining whether that instrument or embedded feature qualifies for the first part of the scope exception. The EITF also applies to any freestanding financial instrument that is potentially settled in an entity’s own stock, regardless of whether the instrument has all the characteristics of a derivative under ASC 815-10-13 through 15-130, for purposes of determining whether the instrument is within the scope of EITF No. 00-19 Accounting for Derivative Financial Instruments Indexed to, and Potentially Settled in, a Company’s Own Stock (“EITF 00- 19”) (codified as ASC subtopic 815-40). EITF No. 07-5 was effective beginning the first quarter of fiscal 2009.
Due to certain adjustments that may be made to the exercise price of the warrants issued in December 2007, January 2008 and August 2008, if the Company issues or sell shares of its common stock at a price which is less than the then current warrant exercise price, these warrants have been classified as a liability as opposed to equity in accordance with the Derivatives and Hedging Topic of the FASB ASC 815-10-15 as it was determined that these warrants were not indexed to the Company’s stock. As a result, the fair market value of these warrants was remeasured on January 1, 2009 and marked to market at each subsequent financial reporting period. The change in fair value of the warrants is recorded in the statement of operations and is estimated using the Black-Scholes option-pricing model with the following assumptions:
| For the Years Ended December 31, | ||||||||
| 2010 | 2009 | |||||||
| Exercise price | $ | 0.25 | $ | 0.25 | ||||
| Market value of stock at end of period | $ | 0.29 | $ | 0.30 | ||||
| Expected dividend rate | N/A | N/A | ||||||
| Expected volatility | 158% – 165 | % | 112% – 117 | % | ||||
| Risk-free interest rate | 0.61% – 0.82 | % | 1.70% – 2.20 | % | ||||
| Expected life in years | 2.00 – 2.58 | 3.00 – 3.58 | ||||||
| Shares underlying warrants outstanding classified as liabilities | 15,543,641 | 15,543,641 | ||||||
All warrants issued by the Company other than the above noted warrants are classified as equity.
F-20
During the fourth quarter of the year ended December 31, 2010, the Company applied the guidance of Accounting Standards Codification 815-40 (ASC 815-40) and recorded a $618,801 gain on the fair value of the warrant liability for the year then ended. The warrants had been issued in December 2007, January 2008 and August 2008, in connection with convertible promissory notes as described in Note 7 and were originally accounted for as an equity instrument. Upon further review of the warrants, it was determined that these warrants were not indexed to the Company’s stock and therefore required derivative accounting treatment. Accordingly, the Company has restated its financial statements for the year ended December 31, 2009 provided herein to reflect the proper accounting treatment. If the Company would have recorded these warrants as a derivative liability upon initial adoption of ASC 815-40, the Company would have recorded the following amounts in the accompanying balance sheet and income statement:
Total Liabilities As previously Reported | Change | Total Liabilities As Restated | Stockholders’ Deficit As previously Reported | Change | Stockholders’ Deficit As Restated | |||||||||||||||||||
| March 31, 2009 | $ | 4,599,317 | $ | 2,080,830 | $ | 6,680,147 | $ | (4,246,075 | ) | $ | (2,080,830 | ) | $ | (6,326,905 | ) | |||||||||
| June 30, 2009 | $ | 4,565,431 | $ | 2,425,223 | $ | 6,990,654 | $ | (3,982,146 | ) | $ | (2,425,223 | ) | $ | (6,407,369 | ) | |||||||||
| September 30, 2009 | $ | 3,968,231 | $ | 10,774,888 | $ | 14,743,119 | $ | (3,158,106 | ) | $ | (10,774,888 | ) | $ | (13,932,994 | ) | |||||||||
| December 31, 2009 | $ | 4,299,685 | $ | 4,577,119 | $ | 8,876,8045 | $ | (2,678,939 | ) | $ | (4,577,1119 | ) | $ | (7,256,058 | ) | |||||||||
| March 31, 2010 | $ | 5,117,253 | $ | 6,085,147 | $ | 11,202,400 | $ | (3,058,161 | ) | $ | (6,085,147 | ) | $ | (9,143,308 | ) | |||||||||
| June 30, 2010 | $ | 5,165,059 | $ | 4,250,053 | $ | 9,415,112 | $ | (3,094,998 | ) | $ | (4,250,053 | ) | $ | (7,345,051 | ) | |||||||||
| September 30, 2010 | $ | 5,147,657 | $ | 4,861,284 | $ | 10,008,941 | $ | (3,428,140 | ) | $ | (4,861,284 | ) | $ | (8,289,424 | ) | |||||||||
Other Inc (Exp) As previously Reported | Change | Other Inc (Exp) As Restated | Net Loss As previously Reported | Change | Net (Loss) Income As Restated | EPS As previously Reported | EPS As Restated | |||||||||||||||||||||||||
| For the Three Months Ended: | ||||||||||||||||||||||||||||||||
| March 31, 2009 | $ | (156,161 | ) | $ | (146,858 | ) | $ | (303,019 | ) | $ | (648,786 | ) | $ | (146,858 | ) | $ | (795,644 | ) | $ | (0.05 | ) | $ | (0.06 | ) | ||||||||
| June 30, 2009 | $ | (95,353 | ) | $ | (344,392 | ) | $ | (439,745 | ) | $ | (344,000 | ) | $ | (344,392 | ) | $ | (688,392 | ) | $ | (0.04 | ) | $ | (0.04 | ) | ||||||||
| September 30, 2009 | $ | (203,771 | ) | $ | (9,438,212 | ) | $ | (9,641,983 | ) | $ | (436,927 | ) | $ | (9,438,212 | ) | $ | (9,875,139 | ) | $ | (0.06 | ) | $ | (0.50 | ) | ||||||||
| For the Year Ended | ||||||||||||||||||||||||||||||||
| December 31, 2009 | $ | (620,907 | ) | $ | (3,731,694 | ) | $ | (4,352,601 | ) | $ | (3,385,382 | ) | $ | (3,731,694 | ) | $ | (7,117,076 | ) | $ | (0.17 | ) | $ | (0.36 | ) | ||||||||
| For the Three Months Ended: | ||||||||||||||||||||||||||||||||
| March 31, 2010 | $ | (46,504 | ) | $ | (1,508,027 | ) | $ | (1,554,531 | ) | $ | (520,038 | ) | $ | (1,508,027 | ) | $ | (2,028,065 | ) | $ | (0.02 | ) | $ | (0.07 | ) | ||||||||
| June 30, 2010 | $ | (55,233 | ) | $ | 1,835,094 | $ | 1,779,861 | $ | (624,681 | ) | $ | 1,835,094 | $ | 1,210,413 | $ | (0.02 | ) | $ | 0.04 | |||||||||||||
| September 30, 2010 | $ | (55,933 | ) | $ | (611,231 | ) | $ | (667,164 | ) | $ | (555,692 | ) | $ | (611,231 | ) | $ | (1,166,923 | ) | $ | (0.02 | ) | $ | (0.04 | ) | ||||||||
13. Deferred Revenue
The Company entered into a licensing agreement during the year ended December 31, 2003 and received an initial fee of $770,000. This fee is deferred and recognized on a straight-line basis over the life of the license agreement of 10 years. In addition, the Company received royalties of $100,000 in each of the first three years of the agreement. The Company recognized revenue of approximately $77,000 for this agreement during each of the years ended December 31, 2010 and 2009.
F-21
The Company entered into a licensing agreement with a biomedical entity during the year ended December 31, 2005 and received an initial license fee of $50,000. This fee is deferred and recognized on a straight-line basis over the life of the license agreement of 7 years. The Company recognized revenue of approximately $5,000 for this agreement during each of the years ended December 31, 2010 and 2009.
14. Commitments and Contingencies
The Company has employment agreements with some of its key employees and executives. These agreements provide for minimum levels of compensation during current and future years. In addition, these agreements call for grants of stock options and for payments upon termination of the agreements.
The Company entered into an agreement with the holders of the Convertible Notes to file a registration statement within 45 days of the first Note conversion and to have the registration statement declared effective within 150 days. The Company will incur penalties and damages of up to approximately $236,000 if it does not file and keep the registration statement effective pursuant to the terms of this agreement. As of December 31, 2010, the Company has recorded a liability of $5,000 in accrued expenses related to this agreement on its balance sheet.
On September 17, 2010, the U.S. Department of Energy approved a grant of up to $681,322 to the Company for the funding of a project to scale up, in size and field trial, a novel dehumidification system similar to the Company’s NanoAir prototype, that is operated by directly manipulating water vapor using a selectively permeable membrane made of a nano-structure solid polymer. The grant is conditioned upon the Company contributing $171,500 of the proposed total project cost of $852,822. The Company will receive the grant amount in phases upon the meeting of certain milestones. As of December 31, 2010, the Company has incurred $79,786 in expenses and recognized the same amount as revenue related to this grant award.
In December 2010, Pasco County Florida approved a grant of $254,500 to the Company for the funding of the NanoAir product into commercialization. The grant from Pasco County requires us to pay the county 2% of the gross sales of products using a certain unique pump assembly for 5 years or for a total of $1,000,000 whichever comes first. As of December 31, 2010, the Company has incurred $19,946 in expenses and recognized the same amount as revenue related to this grant award.
The Company is not currently a party to any pending legal proceedings. In the ordinary course of business the Company may become a party to various legal proceedings generally involving contractual matters, infringement actions, product liability claims and other matters.
15. Income Taxes
There is no current or deferred income tax expense or benefit for the years ended December 31, 2010 and 2009.
The provision for income taxes is different from that which would be obtained by applying the statutory federal income tax rate to income before income taxes. The items causing this difference are as follows:
| Year ended December 31, | ||||||||
| 2010 | 2009 | |||||||
| Tax benefit at U.S. statutory rate | $ | (487,000 | ) | $ | (2,420,000 | ) | ||
| State income tax benefit, net of federal benefit | (52,000 | ) | (258,000 | ) | ||||
| Effect of non-deductible expenses | 1,000 | 1,000 | ||||||
| Employee stock-based compensation | 221,000 | 536,000 | ||||||
| Change in warrant valuation | (210,000 | ) | 1,269,000 | |||||
| Other adjustments | 154,000 | 994,000 | ||||||
| Change in valuation allowance | 373,000 | (132,000 | ) | |||||
| $ | — | $ | — | |||||
F-22
The tax effects of temporary differences that give rise to significant portions of the deferred tax assets and deferred tax liabilities are as follows:
| December 31, | ||||||||
| 2010 | 2009 | |||||||
| Deferred tax assets (liabilities), current: | ||||||||
| Bonus payable | $ | 108,300 | $ | 108,300 | ||||
| Accrued deferred compensation payable | 428,300 | 386,300 | ||||||
| Stock warrant consideration and other | 84,000 | 49,100 | ||||||
| Deferred license revenue | 30,900 | 32,400 | ||||||
| Valuation allowance | (651,500 | ) | (576,100 | ) | ||||
| $ | — | $ | — | |||||
| Deferred tax assets (liabilities), noncurrent: | ||||||||
| Deferred license revenue | $ | 48,100 | $ | 77,400 | ||||
| Depreciation | 3,400 | 3,400 | ||||||
| Net operating loss carryforwards | 7,644,600 | 7,261,000 | ||||||
| Valuation allowance | (7,596,100 | ) | (7,341,800 | ) | ||||
| $ | — | $ | — | |||||
As of December 31, 2010 and 2009, the Company had federal and state net operating loss carry-forwards totaling approximately $20,100,000 and $21,400,000, respectively, which begin expiring in 2012. The Company has established a valuation allowance to fully reserve all deferred tax assets at December 31, 2010 and 2009 because it is more likely than not that the Company will not be able to utilize these assets.
As of December 31, 2010, the Company has not performed an IRC Section 382 study to determine the amount, if any, of its net operating losses that may be limited as a result of the ownership change percentages during 2010. However, the Company will complete the study prior to the utilization of any of its recorded net operating losses.
16. Genertec Agreement
On August 21, 2009, we entered into an Exclusive Distribution Agreement with Genertec, under which we are to supply and Genertec is to distribute, on an exclusive basis, three of our nanotechnology-based membrane products and related products in Great China, including mainland China, Hong Kong, Macau and Taiwan. The agreement provides that during the initial term of the agreement, Genertec will order and purchase these products in the aggregate amount of Two Hundred Million U.S. Dollars. A minimum quantity of said products is to be purchased by Genertec during each contract year of the initial term. In the event Genertec fails to purchase the minimum amount of products in any given year, we may convert the exclusivity provided to Genertec to a non-exclusive or terminate the agreement. Genertec has agreed to engage and appoint authorized person(s) or firm(s), to install, engineer, perform maintenance, sell and use the products within the defined distribution area and neither Genertec nor its designated buyer is permitted to alter, decompile or modify our products in any way. As consideration for entering into this agreement, Genertec agreed to pay us a deposit in monthly installments beginning in September 2009 and continuing through April, 2010. All such payments are to be applied to products purchased by Genertec. During the initial term of the agreement, the parties are to negotiate in good faith a royalty bearing license agreement whereby Genertec may be granted a license to manufacture certain portions of the our products in the designated territory. The initial term of the agreement shall be for a period of five (5) years, commencing on August 21, 2009, unless earlier terminated. Unless notice of termination is delivered to the respective parties 180 days prior to the expiration of the initial term, the Agreement will automatically renew for consecutive one year periods. We may terminate this agreement in the event: (1) Genertec fails to pay the deposit as indicated, (2) Genertec does not purchase the minimum amount of our designated products during any contract year, (3) breach by Genertec of its obligations under the Agreement, or (4) at our discretion immediately upon the transfer of fifty percent (50%) or more of either the assets of the voting stock of Genertec to any third party. Genertec may not assign the Agreement to any party without our prior written consent. As of December 31, 2010, the Company has $406,356 in accounts receivable and $500,000 in deferred revenue to be applied against future orders. Genertec America’s partners in China have received the product and are continuing to perform tests; however there have been delays in completing this testing process. As a result, Genertec America has not yet begun to order product from the Company under this agreement. The Company is currently meeting with Genertec to resolve the payment of the receivable and expects that the amounts will be collected.
F-23
17. CAST Systems Control Technology
In April 2010, the Company entered into a technical and sales agreement with CAST Systems Control Technology Co., Ltd. (“CAST”) and Genertec with a value of up to approximately $48 million U.S. Dollars over a twelve month period. Under the terms of the Agreement, the Company will supply to CAST, through Genertec, key system components of its nanotechnology clean water process. The Agreement is conditioned upon the Company obtaining a letter of credit from Genertec in the amount as agreed to by the parties on or before April 13, 2010. As of the date of this filing, the Company has received the required letter of credit from Genertec. This Agreement, the terms of which are disclosed in the Company’s Current Report on Form 8-K, filed on April 9, 2010, is made pursuant to and in support of the $200 million distribution agreement made between the Company and Genertec on August 21, 2009, granting Genertec the exclusive right to obtain, distribute and market the Company’s nanotechnology-based membrane and related products in China, including mainland China, Hong Kong, Macau and Taiwan, the terms of which are summarized above and more fully disclosed in the Company’s Current Report on Form 8-K, filed August 27, 2009. For the year ended December 31, 2010, the Company has sold one unit under this agreement and recognized $300,000 in revenue which has been billed and $254,000 of which has been collected. The Company expects the remainder of the $300,000 receivable to be collected in 2011.
18. Subsequent Events
Subsequent to December 31, 2010, the Company issued 121,346 shares of common stock for services.
During January 2011, the Company issued 1,810,000 options under the 2009 Option Plan.
In December 2009, we secured a loan in the principal amount of $1,000,000 from an investor. Pursuant to the terms of the note, we are to pay the holder simple interest at the rate of ten percent per annum commencing on the date of issuance with all interest and principal due and payable in cash on or before June 17, 2010 the note’s maturity date was extended to April 30, 2011. On March 22, 2011, the Company entered into a Securities Amendment and Exchange Agreement and an Amended and Restated Convertible Promissory Note (“Convertible Note”, collectively “Exchange Agreements”) with the this investor. Pursuant to the terms and subject to the conditions set forth in the Exchange Agreements, the Company and the Investor amended and restated the $1,000,000 unsecured promissory note issued by the Company to Investor on or about December 17, 2009 (“Original Note”) to, among other things, extend the term to March 22, 2012 (“2011 Convertible Note”). Interest in the amount of 10% per annum, commencing on December 17, 2009 and calculated on a 365 day year, and the principal amount of $1,000,000 will be paid on March 22, 2012. Subject to the terms and conditions of the 2011 Convertible Note, including limitations on conversion, the outstanding principal and interest under the 2011 Convertible Note will automatically convert into shares of the Company’s common stock at the then-effective conversion price upon the closing of a qualified firm commitment underwritten public offering or may be voluntarily converted by the investor at anytime during the term. The initial conversion price is $0.26 per share. Any principal or interest which is not converted will be repaid by the Company at the earlier of a qualified offering, (as defined in the 2011 Convertible Note which is filed as an exhibit to the Form 8K filed with the Securities and Exchange Commission on March 28, 2011), or March 22, 2012. Pursuant to and during the term of the 2011 Convertible Note, the Company will not issue or allow to exist any obligation for borrowed money, except for subordinate indebtedness in payment and priority, trade payables incurred in the ordinary course of business, purchase money secured indebtedness for equipment or inventory, unsecured and subordinate, or unsecured and subordinate working capital guarantees provided by, the Export Import Bank of the United States (the “EXIM Bank”), and indebtedness evidenced by the promissory note dated February 19, 2010 issued to RBC Capital Markets- Custodian of Leonard Samuels IRA (as amended) in the principal amount of $620,000.
On March 22, 2011, in connection with the above Exchange Agreements, the Company entered into Amendment to 2007 Warrant and Amendment to 2009 Warrant to extend the terms of the Stock Purchase Warrant, dated on or about December 31, 2007, and Stock Purchase Warrant, dated on or about March 12, 2009, respectively, to March 22, 2016 and to provide for cashless exercise unless such warrant shares are registered for resale under a registration statement. In addition, on March 22, 2011, the Company issued a Stock Purchase Warrant to the Investor to purchase 1,000,000 shares of the Company’s common stock at $0.45 per share, exercisable commencing on the earliest of the consummation of the qualified offering (as defined in the Exchange Agreements), the date of conversion of the Convertible Note in full, or the date of conversion of the Convertible Note by the Investor in the greatest number of shares of the Company’s common stock not to exceed 9.99% beneficial ownership of Company outstanding common stock and terminating on March 22, 2016.
F-24
Also, on March 22, 2011, the Company entered into a Note and Warrant Purchase Agreement, Secured Convertible Promissory Note and Patent Security Agreement (“Financing Agreements”) with the Investor. Pursuant to the terms and subject to the conditions set forth in the Financing Agreements, the Investor has provided a bridge loan in the amount of $1,500,000 (“Loan”) to the Company, which will be secured in all patents, patent applications and similar protections of the Company and all rents, royalties, license fees and “accounts” with respect to such intellectual property assets. Pursuant to the Secured Convertible Promissory Note (“Secured Note”), interest in the amount of 10% per annum, calculated on a 365 day year, and the principal amount of $1,500,000 will be paid on March 22, 2012, but repayment is accelerated upon a qualified offering (as defined in the note). In the event of such qualified offering, and subject to the terms and conditions of the Secured Note, the outstanding principal and interest under the Secured Note will automatically convert, subject to the limitations on conversion described in the note, into shares of the Company’s common stock at the then-effective conversion price upon the closing of such qualified offering. The initial conversion price is $0.26 per share. Any principal or interest which is not converted will be repaid by the Company at the earlier of a qualified offering or March 22, 2012. No cash fees were paid to any party to the transaction in exchange for lending the money. On March 22, 2011, in connection with the Financing Agreements, the Company issued a Stock Purchase Warrant to the Investor to purchase 3,000,000 shares of the Company’s common stock at $0.45 per share, exercisable until March 22, 2016.
Pursuant to and during the term of the Secured Note, the Company will not issue or permit to exist any obligation for borrowed money, except for trade payables incurred in the ordinary course of business, purchase money secured indebtedness for equipment or inventory, unsecured and subordinate indebtedness to, or unsecured and subordinate working capital guarantees provided by, the EXIM Bank, the promissory note dated February 19, 2010 issued to RBC Capital Markets- Custodian of Leonard Samuels IRA (as amended) in the principal amount of $620,000, the Amended and Restated Convertible Promissory Note, dated March 22, 2011, issued to the Investor in the principal amount of $1,000,000 and other unsecured indebtedness for borrowed money in an amount not to exceed $750,000.
Pursuant to the Patent Security Agreement issued in connection with the Note and Warrant Purchase of March 22, 2011, the Company shall not, without the Investor’s prior consent, sell, dispose or otherwise transfer all or any portion of the Collateral, except for license grants in the ordinary course of business. In addition, the Company will take all actions reasonably necessary to prosecute to allowance applications for patents and maintain all patents, and to seek to recover damages for infringement, misappropriation or dilution of the Collateral with limited exceptions.
In connection with such qualified offering, and subject to the terms and conditions of the Convertible Note, the Company will use reasonable efforts to include the Investor’s securities in such offering. Pursuant to the terms and conditions of the Exchange Agreements, the Investor will not sell, offer to sell or otherwise transfer or dispose of (other than to affiliates) any securities of the Company held by it for a period of 180 days from the date of the final prospectus relating to such qualified offering, except for certain limited sales as more fully described in the Exchange Agreements.
F-25
Dais Analytic Corporation
Balance Sheets
June 30, 2011 | December 31, 2010 | September 30, 2011 | December 31, 2010 | |||||||||||||
| (unaudited) | (unaudited) | Assets | ||||||||||||||
| Current assets: | ||||||||||||||||
| Cash and cash equivalents | $ | 841,797 | $ | 304,656 | $ | 423,908 | $ | 304,656 | ||||||||
| Accounts receivable, net of allowance for doubtful accounts of $18,650 and $0 at June 30, 2011 and December 31, 2010, respectively | 807,967 | 828,632 | ||||||||||||||
| Accounts receivable, net of allowance for doubtful accounts of $42,263 and $0 at September 30, 2011 and December 31, 2010, respectively | 795,940 | 828,632 | ||||||||||||||
| Other receivables | 69,526 | 59,526 | 114,157 | 59,526 | ||||||||||||
| Inventory | 371,970 | 294,069 | 372,372 | 294,069 | ||||||||||||
| Deferred offering costs | 547,376 | 175,000 | 592,881 | 175,000 | ||||||||||||
| Debt issue costs | 49,807 | — | 32,515 | — | ||||||||||||
| Prepaid expenses and other current assets | 57,916 | 83,136 | 90,047 | 83,136 | ||||||||||||
| Total current assets | 2,746,359 | 1,745,019 | 2,421,820 | 1,745,019 | ||||||||||||
| Property and equipment, net | 144,914 | 147,911 | 194,102 | 147,911 | ||||||||||||
| Other assets: | ||||||||||||||||
| Deposits | 2,280 | 3,280 | 2,280 | 3,280 | ||||||||||||
| Patents, net of accumulated amortization of $120,890 and $112,240 at June 30, 2011 and December 31, 2010, respectively | 79,309 | 74,363 | ||||||||||||||
| Patents, net of accumulated amortization of $124,836 and $112,240 at September 30, 2011 and December 31, 2010, respectively | 81,636 | 74,363 | ||||||||||||||
| Total other assets | 81,589 | 77,643 | 83,916 | 77,643 | ||||||||||||
| $ | 2,972,862 | $ | 1,970,573 | $ | 2,699,838 | $ | 1,970,573 | Liabilities and Stockholders’ Deficit | ||||||||
| Current liabilities: | ||||||||||||||||
| Accounts payable, including related party payables of $434,437 and $151,440 at June 30, 2011 and December 31, 2010, respectively | $ | 877,239 | $ | 620,196 | ||||||||||||
| Accounts payable, including related party payables of $423,101 and $151,440 at September 30, 2011 and December 31, 2010, respectively | $ | 810,923 | $ | 620,196 | ||||||||||||
| Accrued compensation and related benefits | 1,405,606 | 1,426,022 | 1,405,606 | 1,426,022 | ||||||||||||
| Accrued interest | 257,535 | 172,359 | ||||||||||||||
| Accrued expenses, other | 268,374 | 241,861 | 72,646 | 69,502 | ||||||||||||
| Current portion of deferred revenue | 590,541 | 647,804 | 615,206 | 647,804 | ||||||||||||
| Current portion of convertible notes payable | — | 50,000 | — | 50,000 | ||||||||||||
| Current portion of notes payable, related party | 624 | 1,620,624 | 624 | 1,620,624 | ||||||||||||
| Current portion of convertible notes payable, related party net of unamortized discount of $1,049,432 and $0 at June 30, 2011 and December 31, 2010, respectively | 1,450,568 | — | ||||||||||||||
| Current portion of convertible notes payable, related party net of unamortized discount of $708,294 and $0 at September 30, 2011 and December 31, 2010, respectively | 1,791,706 | — | ||||||||||||||
| Total current liabilities | 4,592,952 | 4,606,507 | 4,954,246 | 4,606,507 | ||||||||||||
| Long-term liabilities: | ||||||||||||||||
| Warrant liability | 4,616,255 | 3,958,318 | 3,776,909 | 3,958,318 | ||||||||||||
| Deferred revenue, less current portion | 86,840 | 127,840 | 66,340 | 127,840 | ||||||||||||
| Total long-term liabilities | 4,703,095 | 4,086,158 | 3,843,249 | 4,086,158 | ||||||||||||
| Stockholders’ deficit: | ||||||||||||||||
| Preferred stock; $0.01 par value; 10,000,000 shares authorized; 0 shares issued and outstanding | — | — | — | — | ||||||||||||
| Common stock; $0.01 par value; 200,000,000 shares authorized; 36,352,277 and 33,563,428 shares issued and 36,095,064 and 33,306,215 shares outstanding at June 30, 2011 and December 31, 2010, respectively | 363,523 | 335,635 | ||||||||||||||
| Common stock; $0.01 par value; 200,000,000 shares authorized; 37,774,817 and 33,563,428 shares issued and 37,517,604 and 33,306,215 shares outstanding at September 30, 2011 and December 31, 2010, respectively | 377,749 | 335,635 | ||||||||||||||
| Capital in excess of par value | 32,713,926 | 29,852,347 | 33,820,520 | 29,852,347 | ||||||||||||
| Accumulated deficit | (38,128,522 | ) | (35,637,962 | ) | (39,023,814 | ) | (35,637,962 | ) | ||||||||
| (5,051,073 | ) | (5,449,980 | ) | (4,825,545 | ) | (5,449,980 | ) | |||||||||
| Treasury stock at cost, 257,213 shares | (1,272,112 | ) | (1,272,112 | ) | (1,272,112 | ) | (1,272,112 | ) | ||||||||
| Total stockholders’ deficit | (6,323,185 | ) | (6,722,092 | ) | (6,097,657 | ) | (6,722,092 | ) | ||||||||
| $ | 2,972,862 | $ | 1,970,573 | $ | 2,699,838 | $ | 1,970,573 | |||||||||
The accompanying notes are an integral part of the financial statements.
F-26
Dais Analytic Corporation
Statements of Operations
Three Months Ended June 30, | Six Months Ended June 30, | Three Months Ended September 30, | Nine Months Ended September 30, | |||||||||||||||||||||||||||||
| 2011 | 2010 | 2011 | 2010 | 2011 | 2010 | 2011 | 2010 | |||||||||||||||||||||||||
| (restated) | (restated) | (restated) | (restated) | |||||||||||||||||||||||||||||
| Revenue: | ||||||||||||||||||||||||||||||||
| Sales | $ | 1,103,579 | $ | 989,642 | $ | 1,941,773 | $ | 1,376,424 | $ | 605,449 | $ | 931,874 | $ | 2,547,222 | $ | 2,308,298 | ||||||||||||||||
| License fees | 20,500 | 20,500 | 41,000 | 41,030 | 20,500 | 20,500 | 61,500 | 61,530 | ||||||||||||||||||||||||
| 1,124,079 | 1,010,142 | 1,982,773 | 1,417,454 | 625,949 | 952,374 | 2,608,722 | 2,369,828 | |||||||||||||||||||||||||
| Cost of goods sold | 806,674 | 550,196 | 1,507,564 | 871,522 | 466,271 | 755,034 | 1,973,835 | 1,626,556 | ||||||||||||||||||||||||
| Gross profit | 317,405 | 459,946 | 475,209 | 545,932 | 159,678 | 197,340 | 634,887 | 743,272 | ||||||||||||||||||||||||
| Expenses: | ||||||||||||||||||||||||||||||||
| Research and development expenses, net of government grant proceeds of $126,109, $0, 287,473 and $0, respectively | 11,119 | — | 13,155 | — | ||||||||||||||||||||||||||||
| Research and development expenses, net of government grant proceeds of $305,425, $0, $592,897 and $0, respectively | (3,838 | ) | — | 9,317 | — | |||||||||||||||||||||||||||
| Selling, general and administrative | 792,606 | 1,029,394 | 1,714,903 | 1,588,914 | 487,961 | 697,099 | 2,202,771 | 2,286,013 | ||||||||||||||||||||||||
| 803,725 | 1,029,394 | 1,728,058 | 1,588,914 | 484,123 | 697,099 | 2,212,088 | 2,286,013 | |||||||||||||||||||||||||
| Loss from operations | (486,320 | ) | (569,448 | ) | (1,252,849 | ) | (1,042,982 | ) | (324,445 | ) | (499,759 | ) | (1,577,201 | ) | (1,542,741 | ) | ||||||||||||||||
| Other expense (income): | ||||||||||||||||||||||||||||||||
| Change in fair value of warrant liability | (1,694,170 | ) | (1,835,094 | ) | 657,937 | (327,066 | ) | 126,008 | 611,231 | 783,944 | 284,165 | |||||||||||||||||||||
| Interest expense | 416,899 | 55,233 | 580,438 | 101,736 | 446,505 | 55,933 | 1,026,945 | 157,669 | ||||||||||||||||||||||||
| Interest income | (634 | ) | — | (664 | ) | — | (374 | ) | — | (1,038 | ) | — | ||||||||||||||||||||
| Other income | (1,200 | ) | — | (1,200 | ) | — | ||||||||||||||||||||||||||
| (1,277,905 | ) | (1,779,861 | ) | 1,237,711 | (225,330 | ) | 570,939 | 667,164 | 1,808,651 | 441,834 | ||||||||||||||||||||||
| Net income (loss) | $ | 791,585 | $ | 1,210,413 | $ | (2,490,560 | ) | $ | (817,652 | ) | ||||||||||||||||||||||
| Net Loss | $ | (895,384 | ) | $ | (1,166,923 | ) | $ | (3,385,852 | ) | $ | (1,948,575 | ) | ||||||||||||||||||||
| Net income (loss) per common share, basic | $ | 0.02 | $ | 0.04 | $ | (0.07 | ) | $ | (0.03 | ) | ||||||||||||||||||||||
| Net income (loss) per common share, diluted | $ | 0.02 | $ | 0.03 | $ | (0.07 | ) | $ | (0.03 | ) | ||||||||||||||||||||||
| Net loss per common share, basic and diluted | $ | (0.02 | ) | $ | (0.04 | ) | $ | (0.10 | ) | $ | (0.03 | ) | ||||||||||||||||||||
| Weighted average number of common shares, basic | 35,089,169 | 29,800,194 | 34,335,348 | 29,577,797 | ||||||||||||||||||||||||||||
| Weighted average number of common shares, diluted | 56,239,845 | 40,245,491 | 34,335,348 | 29,577,797 | ||||||||||||||||||||||||||||
| Weighted average number of common shares, basic and diluted | 36,682,582 | 19,872,184 | 35,126,357 | 29,696,897 | ||||||||||||||||||||||||||||
The accompanying notes are an integral part of the financial statements.
F-27
Dais Analytic Corporation
Statements of Stockholders’ Deficit
(Unaudited)
| Common Stock | Capital in Excess of | Accumulated | Treasury | Total Stockholders’ | Common Stock | Capital in Excess of | Accumulated | Treasury | Total Stockholders’ | |||||||||||||||||||||||||||||||||||||||
| Shares | Amount | Par Value | Deficit | Stock | Deficit | Shares | Amount | Par Value | Deficit | Stock | Deficit | |||||||||||||||||||||||||||||||||||||
| Balance, December 31, 2010 | 33,563,428 | $ | 335,635 | $ | 29,852,347 | $ | (35,637,962 | ) | $ | (1,272,112 | ) | $ | (6,722,092 | ) | 33,563,428 | $ | 335,635 | $ | 29,852,347 | $ | (35,637,962 | ) | $ | (1,272,112 | ) | $ | (6,722,092 | ) | ||||||||||||||||||||
| Issuance of common stock for services | 121,346 | 1,213 | 41,608 | — | — | 42,821 | 225,192 | 2,252 | 78,993 | — | — | 81,245 | ||||||||||||||||||||||||||||||||||||
| Stock based compensation | — | — | 630,096 | — | — | 630,096 | — | — | 671,099 | — | — | 671,099 | ||||||||||||||||||||||||||||||||||||
| Issuance of common stock for settlement of accounts payable | 202,703 | 2,027 | 72,973 | — | — | 75,000 | ||||||||||||||||||||||||||||||||||||||||||
| Warrant issued with convertible note payable, related party | — | — | 435,240 | — | — | 435,240 | — | — | 435,240 | — | — | 435,240 | ||||||||||||||||||||||||||||||||||||
| Beneficial conversion feature on convertible notes payable, related party | — | — | 1,064,760 | — | — | 1,064,760 | — | — | 1,064,760 | — | — | 1,064,760 | ||||||||||||||||||||||||||||||||||||
| Issuance of common stock in exchange for settlement of debt | 2,667,503 | 26,675 | 666,875 | — | — | 693,550 | 2,667,503 | 26,675 | 666,875 | — | — | 693,550 | ||||||||||||||||||||||||||||||||||||
| Exercise of warrants | 1,115,991 | 11,160 | (11,160 | ) | — | — | — | |||||||||||||||||||||||||||||||||||||||||
| Reclassification of warrant liability upon warrant exercise | — | — | 965,354 | — | — | 965,354 | ||||||||||||||||||||||||||||||||||||||||||
| Revaluation of common stock issued to vendors for services | — | — | 23,000 | — | — | 23,000 | — | — | 24,039 | — | — | 24,039 | ||||||||||||||||||||||||||||||||||||
| Net loss | — | — | — | (2,490,560 | ) | — | (2,490,560 | ) | — | — | — | (3,385,852 | ) | — | (3,385,852 | ) | ||||||||||||||||||||||||||||||||
| Balance, June 30, 2011 | 36,352,277 | $ | 363,523 | $ | 32,713,926 | $ | (38,128,522 | ) | $ | (1,272,112 | ) | $ | (6,323,185 | ) | ||||||||||||||||||||||||||||||||||
| Balance, September 30, 2011 | 37,774,817 | $ | 377,749 | $ | 33,820,520 | $ | (39,023,814 | ) | $ | (1,272,112 | ) | $ | (6,097,657 | ) | ||||||||||||||||||||||||||||||||||
The accompanying notes are an integral part of the financial statements.
F-28
Dais Analytic Corporation
Statements of Cash Flows
For the Six Months Ended June 30, | ||||||||
| 2011 | 2010 | |||||||
| (restated) | ||||||||
| Operating activities | ||||||||
| Net loss | $ | (2,490,560 | ) | $ | (817,652 | ) | ||
| Adjustments to reconcile net loss to net cash used by operating activities: | ||||||||
| Depreciation and amortization | 25,393 | 2,153 | ||||||
| Amortization of discount and beneficial conversion feature on notes payable | 450,568 | — | ||||||
| Issuance of common stock, stock options and stock warrants for services and amortization of common stock issued for services | 87,937 | 163,164 | ||||||
| Stock based compensation | 630,096 | 478,548 | ||||||
| Change in fair value of warrant liability | 657,937 | (327,066 | ) | |||||
| Increase in allowance for doubtful accounts | 18,450 | — | ||||||
| (Increase) decrease in: | ||||||||
| Accounts receivable | 2,215 | (999,829 | ) | |||||
| Other receivables | (10,000 | ) | — | |||||
| Inventory | (77,901 | ) | (96,982 | ) | ||||
| Prepaid expenses and other current assets | 4,104 | (6,415 | ) | |||||
| Increase (decrease) in: | ||||||||
| Accounts payable and accrued expenses | 357,106 | 51,279 | ||||||
| Accrued compensation and related benefits | (20,416 | ) | 56,667 | |||||
| Deferred revenue | (98,263 | ) | 312,428 | |||||
| Net cash used by operating activities | (463,334 | ) | (1,183,705 | ) | ||||
| Investing activities | ||||||||
| Increase in patent costs | (13,596 | ) | — | |||||
| Purchase of property and equipment | (13,746 | ) | (10,484 | ) | ||||
| Net cash used by investing activities | (27,342 | ) | (10,484 | ) | ||||
| Financing activities | ||||||||
| Proceeds from issuance of notes payable, related party | 1,500,000 | 620,000 | ||||||
| Payments on notes payable | (50,000 | ) | (100,000 | ) | ||||
| Payments for debt issue costs and deferred offering costs | (422,183 | ) | — | |||||
| Net cash provided by financing activities | 1,027,817 | 520,000 | ||||||
| Net increase (decrease) in cash and cash equivalents | 537,141 | (674,189 | ) | |||||
| Cash and cash equivalents, beginning of period | 304,656 | 1,085,628 | ||||||
| Cash and cash equivalents, end of period | $ | 841,797 | $ | 411,439 | ||||
| Supplemental cash flow information: | ||||||||
| Cash paid during the year for interest | $ | 34,158 | $ | — | ||||
| Supplemental disclosure of non-cash investing and financing activities: | ||||||||
For the Nine Months Ended September 30, | ||||||||
| 2011 | 2010 | |||||||
| (restated) | ||||||||
| Operating activities | ||||||||
| Net loss | $ | (3,385,852 | ) | $ | (1,948,575 | ) | ||
| Adjustments to reconcile net loss to net cash used by operating activities: | ||||||||
| Depreciation and amortization | 38,979 | 7,879 | ||||||
| Amortization of discount and beneficial conversion feature on notes payable | 791,707 | — | ||||||
| Issuance of common stock, stock options and stock warrants for services and amortization of common stock issued for services | 127,400 | 326,060 | ||||||
| Stock based compensation | 671,099 | 549,330 | ||||||
| Change in fair value of warrant liability | 783,944 | 248,165 | ||||||
| Increase in allowance for doubtful accounts | 42,263 | — | ||||||
| (Increase) decrease in: | ||||||||
| Accounts receivable | (9,571 | ) | (736,058 | ) | ||||
| Other receivables | (54,631 | ) | — | |||||
| Inventory | (78,303 | ) | (133,734 | ) | ||||
| Prepaid expenses and other current assets | (28,027 | ) | (48,630 | ) | ||||
| Increase (decrease) in: | ||||||||
| Accounts payable and accrued expenses | 427,596 | 92,369 | ||||||
| Accrued compensation and related benefits | (20,416 | ) | 80,416 | |||||
| Deferred revenue | (94,098 | ) | 230,187 | |||||
| Net cash used by operating activities | (787,910 | ) | (1,332,591 | ) | ||||
| Investing activities | ||||||||
| Increase in patent costs | (19,869 | ) | (4,210 | ) | ||||
| Purchase of property and equipment | (72,573 | ) | (19,771 | ) | ||||
| Net cash used by investing activities | (92,442 | ) | (23,981 | ) | ||||
| Financing activities | ||||||||
| Proceeds from issuance of notes payable, related party | 1,500,000 | 620,000 | ||||||
| Payments on notes payable | (50,000 | ) | (100,000 | ) | ||||
| Payments for debt issue costs and deferred offering costs | (450,396 | ) | — | |||||
| Net cash provided by financing activities | 999,604 | 520,000 | ||||||
| Net increase (decrease) in cash and cash equivalents | 119,252 | (836,572 | ) | |||||
| Cash and cash equivalents, beginning of period | 304,656 | 1,085,628 | ||||||
| Cash and cash equivalents, end of period | $ | 423,908 | $ | 249,056 | ||||
| Supplemental cash flow information: | ||||||||
| Cash paid during the year for interest | $ | 76,512 | $ | — | ||||
| Supplemental disclosure of non-cash investing and financing activities: | ||||||||
| Settlement of accounts payable with the issuance of 202,703 shares of common stock | $ | 75,000 | $ | — | ||||
| Reclassification of warrant liability to equity upon warrant exercise | $ | 965,354 | — | |||||
| Application of proceeds due and payable under note, including accrued interest, to purchase 2,667,503 shares of common stock at $0.26 per share | $ | 693,550 | $ | — | ||||
| Issuance of note payable with a beneficial conversion feature | $ | 1,064,760 | $ | — | ||||
| Issuance of note payable with a discount equivalent to the relative fair value of the accompanying warrant | $ | 435,240 | $ | — | ||||
| Issuance of 375,000 shares of common stock in conversion of notes payable | $ | — | $ | 75,000 |
The accompanying notes are an integral part of the financial statements.
F-29
Dais Analytic Corporation
Notes to Financial Statements
Three and SixNine Months Ended JuneSeptember 30, 2011
| 1. | Background Information |
The accompanying financial statements of Dais Analytic Corporation (the “Company”) are unaudited, but in the opinion of management, reflect all adjustments necessary to fairly state the Company’s financial position, results of operations, stockholders’ deficit and cash flows as of and for the dates and periods presented. The financial statements of the Company are prepared in accordance with accounting principles generally accepted in the United States of America for interim financial information.
The unaudited financial statements and notes are presented as permitted by Form 10-Q. Accordingly, certain information and note disclosures normally included in the financial statements prepared in accordance with accounting principles generally accepted in the United States of America have been omitted although the Company generally believes that the disclosures are adequate to ensure that the information presented is not misleading. The accompanying financial statements and notes should be read in conjunction with the audited financial statements and notes of the Company for the fiscal year ended December 31, 2010 included in the Company’s Annual Report on Form 10-K filed with the Securities and Exchange Commission on March 31, 2011. The results of operations for the three and sixnine month periods ended JuneSeptember 30, 2011 are not necessarily indicative of the results that may be expected for any future quarters or for the entire year ending December 31, 2011.
Dais Analytic Corporation, a New York corporation, has developed and is commercializing applications using its nano-structure polymer technology. The first commercial product is an energy recovery ventilator (“ERV”) (cores and systems) for use in commercial Heating, Ventilating, and Air Conditioning (HVAC) applications. In addition to direct sales, the Company licenses its nano-structured polymer technology to strategic partners in the aforementioned application and is in various stages of development with regard to other applications employing its base technologies. The Company was incorporated in April 1993 with its corporate headquarters located in Odessa, Florida.
| 2. | Going Concern |
The accompanying financial statements have been prepared assuming that the Company will continue as a going concern. For the three and sixnine months ended JuneSeptember 30, 2011, the Company incurred net incomelosses of $791,585$895,384 and net loss of $2,490,560,$3,385,852, respectively. As of JuneSeptember 30, 2011, the Company has an accumulated deficit of $38,128,522,$39,023,814, negative working capital of $1,846,593$2,532,426 and a stockholder’s deficit of $6,323,185.$6,097,657. In view of these matters, there is substantial doubt that the Company will continue as a going concern. The recoverability of recorded property and equipment, intangible assets, and other asset amounts shown in the accompanying financial statements is dependent upon the Company’s ability to continue as a going concern and to achieve a level of profitability. The Company intends on financing its future activities and its working capital needs largely from the sale of public equity securities and possible exercise of warrants with some additional funding from other traditional financing sources, including term notes and proceeds from licensing agreements until such time that funds provided by operations are sufficient to fund working capital requirements. However, there can be no assurance that the Company will be successful in its efforts. The financial statements of the Company do not include any adjustments relating to the recoverability and classification of recorded assets, or the amounts and classifications of liabilities that might be necessary should the Company be unable to continue as a going concern.
| 3. | Significant Accounting Policies |
In the opinion of management, all adjustments necessary for a fair statement of (a) the results of operations for the three and sixnine month periods ended JuneSeptember 30, 2011 and 2010, (b) the financial position at JuneSeptember 30, 2011 and December 31, 2010, and (c) cash flows for the sixnine month periods ended JuneSeptember 30, 2011 and 2010, have been made.
F-30
The significant accounting policies followed are:
Use of estimates - The preparation of financial statements in conformity with accounting principles generally accepted in the United States of America requires management to make estimates and assumptions that affect the reported amounts of assets and liabilities and disclosure of contingent assets and liabilities at the date of the financial statements and the reported amounts of revenues and expenses during the reporting period. Actual results could differ from those estimates.
Accounts receivable - The Company regularly reviews accounts receivable for any bad debts based on an analysis of the Company’s collection experience, customer credit worthiness, and current economic trends. At JuneSeptember 30, 2011, the day’s sales outstanding were 76,58, as compared to 93 at December 31, 2010. Based on management’s review of accounts receivable, an allowance of $18,450$42,263 is considered adequate at JuneSeptember 30, 2011, based on an analysis of accounts receivable balances and no allowance for doubtful accounts was considered necessary at December 31, 2010.
Inventory - Inventory consists primarily of raw materials and is stated at the lower of cost, determined by first-in, first-out method, or market. Market is determined based on the net realizable value, with appropriate consideration given to obsolescence, excessive levels, deterioration and other factors.
Revenue recognition - Generally, the Company recognizes revenue for its products upon shipment to customers, provided no significant obligations remain and collection is probable. This policy applies to all of our customers, including Genertec America (a distribution agreement) and CAST Systems Control Technology Co. (an agreement for the purchase of specific goods). During the sixnine months ended JuneSeptember 30, 2011 and 2010, four and fivesix customers accounted for approximately 52%55% and 55%61% of revenues, respectively.
Our ConsERV product typically carries a warranty of two years for all parts contained therein with the exception of the energy recovery ventilator core which typically carries a 10 year warranty. The warranty includes replacement of defective parts. The Company has recorded an accrual of approximately $15,000$36,000 for future warranty expenses at JuneSeptember 30, 2011.
Revenue derived from the sale of licenses is deferred and recognized as revenue on a straight-line basis over the life of the license, or until the license arrangement is terminated. The Company recognized revenue of approximately $20,500 and $41,000$61,500 from license agreements for the three and sixnine months ended JuneSeptember 30, 2011 and 2010, respectively.
Employee stock-based compensation - The Company recognizes all share-based awards to employees, including grants of employee stock options, as compensation expense in the financial statements based on their fair values. That expense will be recognized over the period during which an employee is required to provide services in exchange for the award, known as the requisite service period (usually the vesting period).
The fair value of each award is estimated at the grant date using the Black-Scholes option model with the following assumptions for awards granted during the sixnine months ended JuneSeptember 30, 2011 and 2010:
Six Months Ended June 30, 2011 | Six Months Ended June 30, 2010 | Nine Months Ended September 30, 2011 | Nine Months Ended September 30, 2010 | |||||||||||||
| Dividend rate | 0 | % | 0 | % | 0 | % | 0 | % | ||||||||
| Risk free interest rate | 2.70 – 2.93 | % | 2.38% - 2.59 | % | 1.45% – 2.93 | % | 1.96% - 3.68 | % | ||||||||
| Expected term | 6.5 years | 5 – 10 years | 6.5 years | 5 – 10 years | ||||||||||||
| Expected volatility | 101 - 103 | % | 96% - 107 | % | 101% - 114 | % | 96% - 107 | % | ||||||||
F-31
The basis for the above assumptions areis as follows: the dividend rate is based upon the Company’s history of dividends; the risk-free interest rate for periods within the expected term of the option is based on the U.S. Treasury yield curve in effect at the time of grant; the expected term was calculated based on the Company’s historical pattern of options granted and the period of time they are expected to be outstanding; and expected volatility was calculated by review of a peer company’s historical activity. The Company previously used a peer company’s historical activity due to the limited trading volume and historical information of the Company’s own common stock.stock, however, beginning in July 2011, the Company began using their own common stock to determine volatility.
Forfeitures of unvested options are estimated at the time of grant and revised, if necessary, in subsequent periods if actual forfeitures differ from those estimates. Based on historical experience of forfeitures, the Company estimated forfeitures at 0% for each of the sixnine month periods ended JuneSeptember 30, 2011 and 2010, respectively.
Non-employee stock-based compensation - The Company’s accounting policy for equity instruments issued to consultants and vendors in exchange for goods and services follows the provisions of EITF 96-18, “Accounting forStandards Codification (ASC) 505-050 – Equity Instruments That are Issued– Based Payments to Other Than Employees for Acquiring , or in Conjunction with Selling Goods or Services,” now ASC 505 and EITF 00-18 “Accounting Recognition for Certain Transactions Involving Equity Instruments Granted to Other Than Employees,” now ASC 505.Non-Employees (ASC 505). The measurement date for the fair value of the equity instruments issued is determined at the earlier of (i) the date at which a commitment for performance by the consultant or vendor is reached or (ii) the date at which the consultant or vendor’s performance is complete. In the case of equity instruments issued to consultants, the fair value of the equity instrument is recognized over the term of the consulting agreement. Stock-based compensation related to non-employees is accounted for based on the fair value of the related stock or options or the fair value of the services, whichever is more readily determinable in accordance with ASC 718. The fair value of common stock issued for services is based on the closing stock price on the date the common stock was issued. During the sixnine months ended JuneSeptember 30, 2011, the Company issued 121,346427,895 shares of common stock valued at $42,821$156,245 for services rendered. During the sixnine months ended JuneSeptember 30, 2010, the Company issued 186,000413,692 shares of common stock valued at $175,111$326,879 for services rendered.
Research and development expenses and grant proceeds - Expenditures for research, development and engineering of products are expensed as incurred. For the three months ended JuneSeptember 30, 2011 and 2010, the Company incurred research and development costs of approximately $137,200$301,587 and $0, respectively. For the sixnine months ended JuneSeptember 30, 2011 and 2010, the Company incurred research and development costs of approximately $300,600$602,215 and $0, respectively. The Company accounts for proceeds received from government grants for research as a reduction in research and development costs. For the three and sixnine months ended JuneSeptember 30, 2011, the Company recorded approximately $126,100$305,400 and $287,500,$592,900, respectively, in grant proceeds against research and development expenses on the statement of operations. No such grant proceeds were recognized for the three and sixnine months ended JuneSeptember 30, 2010.
Government grants - Grants are recognized when there is reasonable assurance that the grant will be received and that any conditions associated with the grant will be met. When grants are received related to Property and Equipment, the Company reduces the basis of the assets resulting in lower depreciation expense over the life of the associated asset. Grants received related to expenses are reflected as a reduction of the associated expense in the period in which the expense is incurred.
Financial instruments - Fair value is defined as the price that would be received to sell an asset or paid to transfer a liability in an orderly transaction between market participants at the measurement date. The fair value hierarchy distinguishes between (1) market participant assumptions developed based on market data obtained from independent sources (observable inputs) and (2) an entity’s own assumptions about market participant assumptions developed based on the best information available in the circumstances (unobservable inputs). The fair value hierarchy consists of three broad levels, which gives the highest priority to unadjusted quoted prices in active markets for identical assets or liabilities (Level 1) and the lowest priority to unobservable inputs (Level 3). The three levels of the fair value hierarchy are described below:
| • | Level 1 - Unadjusted quoted prices in active markets that are accessible at the measurement date for identical, unrestricted assets or liabilities. | ||
| • | Level 2 - Inputs other than quoted prices included within Level 1 that are observable for the asset or liability, either directly or indirectly, including quoted prices for similar assets or liabilities in active markets; quoted prices for identical or similar assets or liabilities in markets that are not active; inputs other than quoted prices that are observable for the asset or liability (e.g., interest rates); and inputs that are derived principally from or corroborated by observable market data by correlation or other means. |
F-32
Level 3 - Inputs that are both significant to the fair value measurement and unobservable.
Fair value estimates discussed herein are based upon certain market assumptions and pertinent information available to management as of JuneSeptember 30, 2011. The Company uses the market approach to measure fair value for its Level 1 financial assets and liabilities, which include cash equivalents of $736,506approximately $423,900 at JuneSeptember 30, 2011. The market approach uses prices and other relevant information generated by market transactions involving identical or comparable assets and liabilities.
The respective carrying value of certain on-balance sheet financial instruments approximated their fair values due to the short-term nature of these instruments. These financial instruments include cash, accounts receivable, other receivables, accounts payable, accrued compensation and accrued expenses. The fair value of the Company’s notes payable is estimated based on current rates that would be available for debt of similar terms which is not significantly different from its stated value.
The Company’s financial liabilities measured at fair value consisted of the following as of JuneSeptember 30, 2011:
| Fair Value Measurements | ||||||||||||||||
Total carrying value | Quoted prices in active markets (Level 1) | Significant other observable inputs (Level 2) | Significant unobservable inputs (Level 3) | |||||||||||||
| Warrant liability | $ | 4,616,255 | — | — | $ | 4,616,255 | ||||||||||
| Fair Value Measurements | ||||||||||||||||
Total carrying value | Quoted prices in active markets (Level 1) | Significant other observable inputs (Level 2) | Significant unobservable inputs (Level 3) | |||||||||||||
| Warrant liability | $ | 3,776,909 | — | — | $ | 3,776,909 | ||||||||||
A reconciliation of the beginning and ending fair values of financial instruments valued using significant unobservable inputs (Level 3) is presented as follows:
| Warrant Liability | Warrant Liability | |||||||
| Balance at December 31, 2010 | $ | 3,958,318 | $ | 3,958,318 | ||||
| Reclassification to equity upon warrant exercise | (965,354 | ) | ||||||
| Changes in fair value | 657,937 | 783,945 | ||||||
| Balance at June 30, 2011 | $ | 4,616,255 | ||||||
| Balance at September 30, 2011 | $ | 3,776,909 | ||||||
Income taxes - Income taxes are accounted for under the asset and liability method. Deferred income tax assets and liabilities are computed on the basis of differences between the financial statement and tax basis of assets and liabilities that will result in taxable or deductible amounts in the future based upon enacted tax laws and rates applicable to the periods in which the differences are expected to affect taxable income. Valuation allowances are established when necessary to reduce deferred tax assets to the amount expected to be realized.
The Company accounts for tax uncertainties under the provisions of FASB ASC 740-10 “Uncertainty in Income Taxes” (ASC 740-10). The Company has not recognized a liability as a result of the implementation of ASC 740-10. A reconciliation of the beginning and ending amount of unrecognized tax benefits has not been provided since there is no unrecognized benefit since the date of adoption. The Company has not recognized interest expense or penalties as a result of the implementation of ASC 740-10. If there were an unrecognized tax benefit, the Company would recognize interest accrued related to unrecognized tax benefits in interest expense and penalties in operating expenses.
F-33
Earnings (Loss) per share - Basic earnings (loss) per share is computed by dividing net income (loss) attributable to common stockholders by the weighted average common shares outstanding for the period. Diluted earnings (loss) per share is computed giving effect to all potentially dilutive common shares. Potentially dilutive common shares may consist of incremental shares issuable upon the exercise of stock options and warrants and the conversion of notes payable to common stock. In periods in which a net loss has been incurred, all potentially dilutive common shares are considered antidilutive and thus are excluded from the calculation. At JuneSeptember 30, 2011 and 2010, the Company had 52,026,55554,577,323 and 38,043,16738,302,769 potentially dilutive common shares, respectively, which were not included in the computation of loss per share.
| For the Three Months Ended | For the Six Months Ended | |||||||||||||||
| June 30, 2011 | June 30, 2010 | June 30, 2011 | June 30, 2010 | |||||||||||||
| Numerator: | (1) | (2) | ||||||||||||||
| Net income (loss) to common shareholders | $ | 791,585 | $ | 1,210,413 | $ | (2,490,560 | ) | $ | (817,652 | ) | ||||||
| Interest on convertible debentures | 62,500 | 5,625 | — | — | ||||||||||||
| Net income (loss) available to common stockholders | $ | 854,085 | $ | 1,216,038 | $ | (2,490,560 | ) | $ | (817,652 | ) | ||||||
| Denominator: | ||||||||||||||||
| Weighted average basic shares outstanding | 35,089,169 | 29,800,194 | 34,335,348 | 29,577,797 | ||||||||||||
| Effect of dilutive securities: | ||||||||||||||||
| Convertible debt | 10,363,542 | 981,090 | — | — | ||||||||||||
| Stock options | 4,085,153 | 4,617,032 | — | — | ||||||||||||
| Stock warrants | 6,701,980 | 4,847,175 | — | — | ||||||||||||
| Weighted average fully diluted shares outstanding | 56,239,845 | 40,245,491 | 34,335,348 | 29,577,797 | ||||||||||||
| Net income (loss) per common share—Basic | $ | 0.02 | $ | 0.04 | $ | (0.07 | ) | $ | (0.03 | ) | ||||||
| Net income (loss) per common share—Diluted | $ | 0.02 | $ | 0.03 | $ | (0.07 | ) | $ | (0.03 | ) | ||||||
Derivative financial instruments - The Company does not use derivative instruments to hedge exposure to cash flow, market or foreign currency risk. Terms of convertible promissory note instruments are reviewed to determine whether or not they contain embedded derivative instruments that are required under ASC 815 “Derivative and Hedging” (ASC 815) to be accounted for separately from the host contract, and recorded on the balance sheet at fair value. The fair value of derivative liabilities, if any, is required to be revalued at each reporting date, with corresponding changes in fair value recorded in current period operating results.
Freestanding warrants issued by the Company in connection with the issuance or sale of debt and equity instruments are considered to be derivative instruments and are evaluated and accounted for in accordance with the provisions of ASC 815. Pursuant to ASC 815, an evaluation of specifically identified conditions is made to determine whether fair value of warrants issued is required to be classified as equity or as a derivative liability.
Reclassifications - Certain reclassifications have been made to the financial statements as of and for the periods ended December 31, 2010 and JuneSeptember 30, 2010 to conform to the presentation as of and for the three and sixnine months ended JuneSeptember 30, 2011.
Recent accounting pronouncements -
In April 2011, the FASB issued ASU 2011-02, “A Creditor’s Determination of Whether a Restructuring Is a Troubled Debt Restructuring”. This new guidance requires a creditor performing an evaluation of whether a restructuring constitutes a troubled debt restructuring, to separately conclude that both (i) the restructuring constitutes a concession and (ii) the debtor is experiencing financial difficulties. This standard clarifies the guidance on a creditor’s evaluation of whether it has granted a concession as well as the guidance on a creditor’s evaluation of whether a debtor is experiencing financial difficulties. The update also requires entities to disclose additional quantitative activity regarding troubled debt restructurings of finance receivables that occurred during the period, as well as additional information regarding troubled debt restructurings that occurred within the previous twelve months and for which there was a payment default during the current period. The new accounting guidance iswas effective beginning July 1, 2011, and should be applied retrospectively to January 1, 2011. The Company does not anticipate the adoption of this update to havehas not had a material impact on the Company’s financial statements.
Other recent accounting pronouncements issued by the FASB, (including EITF), the AICPA and the SEC did not have, or are not expected to have a material impact on the Company’s present or future financial statements.
F-34
| 4. | Notes Payable |
Notes payable consist of the following:
June 30, 2011 | December 31, 2010 | |||||||
| Convertible note payable; interest at 9%; collateralized by the Company’s patents and patent applications | $ | — | $ | 50,000 | ||||
| Convertible note payable, related party; interest at 10% per annum; due in full March 22, 2012 | 1,000,000 | 1,000,000 | ||||||
| Secured convertible note payable, related party; interest at 10% per annum; due March 22, 2012 | 1,500,000 | — | ||||||
| Note payable, related party; 10% interest; unsecured; paid in full | — | 620,000 | ||||||
| Note payable; related party | 624 | 624 | ||||||
| 2,500,624 | 1,670,624 | |||||||
| Less unamortized discount | (1,049,432 | ) | — | |||||
| Less amounts currently due, net of unamortized discount | 1,451,192 | 1,670,624 | ||||||
| Long-term portion | $ | — | $ | — | ||||
September 30, 2011 | December 31, 2010 | |||||||
| (unaudited) | ||||||||
| Convertible note payable; interest at 9%; collateralized by the Company’s patents and patent applications | $ | — | $ | 50,000 | ||||
| Convertible note payable, related party; interest at 10% per annum; due in full March 22, 2012 | 1,000,000 | 1,000,000 | ||||||
| Secured convertible note payable, related party; interest at 10% per annum; due March 22, 2012 | 1,500,000 | — | ||||||
| Note payable, related party; 10% interest; unsecured; paid in full | — | 620,000 | ||||||
| Note payable; related party | 624 | 624 | ||||||
| 2,500,624 | 1,670,624 | |||||||
| Less unamortized discount | (708,294 | ) | — | |||||
| Less amounts currently due, net of unamortized discount | 1,792,330 | 1,670,624 | ||||||
| Long-term portion | $ | — | $ | — | ||||
Notes Payable
In December 2009, we secured a 10% loan in the principal amount of $1,000,000 from an investor. Pursuant to the terms of the note, we are to pay the holder simple interest at the rate of ten percent per annum commencing on the date of issuance with all interest and principal due and payable in cash on or before June 17, 2010. The note’s maturity date was extended to April 30, 2011. On March 22, 2011, the Company entered into a Securities Amendment and Exchange Agreement and an Amended and Restated Convertible Promissory Note (“Convertible Note”, collectively “Exchange Agreements”) with this investor. Pursuant to the terms and subject to the conditions set forth in the Exchange Agreements, the Company and the Investor amended and restated the $1,000,000 unsecured promissory note to, among other things, add a conversion option and extend the maturity date to March 22, 2012 (as amended and restated, the “2011 Convertible Note”). Interest in the amount of 10% per annum, commencing on December 17, 2009 and calculated on a 365 day year, and the principal amount of $1,000,000 will be due in full on March 22, 2012. Subject to the terms and conditions of the 2011 Convertible Note, including limitations on conversion, the outstanding principal and interest under the 2011 Convertible Note will automatically convert into shares of the Company’s common stock at the then-effective conversion price upon the closing of a qualified firm commitment underwritten public offering (as defined in said note) or may be voluntarily converted by the investor at anytime during the debt term. The initial conversion price is $0.26 per share. Any principal or interest which is not converted will be repaid by the Company at the earlier of a qualified offering, (as defined in the 2011 Convertible Note which is filed as an exhibit to the Form 8K filed with the Securities and Exchange Commission on March 28, 2011), or March 22, 2012. Pursuant to and during the term of the 2011 Convertible Note, the Company will not issue or allow to exist any obligation for borrowed money, except for subordinate indebtedness in payment and priority, trade payables incurred in the ordinary course of business, purchase money secured indebtedness for equipment or inventory, unsecured and subordinate, or unsecured and subordinate working capital guarantees provided by, the Export Import Bank of the United States (the “EXIM Bank”), and indebtedness evidenced by the promissory note dated February 19, 2010 issued to RBC Capital Markets- Custodian of Leonard Samuels IRA (as amended) in the principal amount of $620,000.
F-35
On March 22, 2011, in connection with the above Exchange Agreements, the Company entered into amendments to existing warrant agreements with the investor to extend the terms of the existing Stock Purchase Warrants, dated on or about December 31, 2007 and March 12, 2009, respectively, to March 22, 2016 and to provide for cashless exercise unless such warrant shares are registered for resale under a registration statement. In addition, on March 22, 2011, the Company issued an additional Stock Purchase Warrant to the investor to purchase 1,000,000 shares of the Company’s common stock at $0.45 per share, exercisable commencing on the earliest of the consummation of the qualified offering (as defined in the Exchange Agreements), the date of conversion of the Convertible Note in full, or the date of conversion of the Convertible Note by the investor in the greatest number of shares of the Company’s common stock not to exceed 9.99% beneficial ownership of Company outstanding common stock and terminating on March 22, 2016.
The 2011 Convertible Note is a hybrid financial instruments that blends characteristics of both debt and equity securities. The note embodies settlement alternatives to the holder providing for either redemption of principal and interest in cash (forward component) or conversion into the Company’s common stock (embedded conversion feature). The forward component was valued using the present value of discounted cash flows arising from the contractual principal and interest payment terms and the embedded conversion feature was valued using the Monte Carlo simulation method. The fair value of the 2011 Convertible Note was estimated to be $1,964,905 on the date of the exchange, which resulted in a loss on extinguishment of debt of $964,905. Further, in accordance with ASC 470-20-25 and ASC 470-50-40, the net premium of $964,905 associated with the 2011 Convertible Note was reclassified to capital in excess of par value under the presumption that such net premium represented a capital contribution. Consequently, the 2011 Convertible Note is being carried at face value. The fair value of the additional warrant to purchase 1,000,000 shares and the value associated with the previously issued warrants that were amended was determined to be $716,890 using the Black-Scholes option model and is included in the aggregate loss on extinguishment of $1,681,795. Since the loan is held by a related party, the loss on extinguishment has been treated as a capital transaction and, as a result, this transaction had no effect on capital in excess of par value.
Also, on March 22, 2011, the Company entered into a 10% Note and Warrant Purchase Agreement, Secured Convertible Promissory Note and Patent Security Agreement (“Financing Agreements”) with the investor. Pursuant to the terms and subject to the conditions set forth in the Financing Agreements, the investor has provided a bridge loan in the amount of $1,500,000 (“Loan”) to the Company, which is secured by all patents, patent applications and similar protections of the Company and all rents, royalties, license fees and “accounts” with respect to such intellectual property assets (“collateral”). Pursuant to the Secured Convertible Promissory Note (“Secured Note”), interest in the amount of 10% per annum, calculated on a 365 day year, and the principal amount of $1,500,000 is due and payable on March 22, 2012, but repayment is accelerated upon a qualified offering (as defined in the note). In the event of such qualified offering, and subject to the terms and conditions of the Secured Note, the outstanding principal and interest under the Secured Note will automatically convert, subject to the limitations on conversion described in the note, into shares of the Company’s common stock at the then-effective conversion price upon the closing of such qualified offering. The initial conversion price is $0.26 per share. Any principal or interest which is not converted will be repaid by the Company at the earlier of a qualified offering or March 22, 2012. No cash fees were paid to any party to the transaction in exchange for lending the money.
On March 22, 2011, in connection with the above Financing Agreements, the Company issued a Stock Purchase Warrant to the investor to purchase 3,000,000 shares of the Company’s common stock at $0.45 per share, exercisable until March 22, 2016. The warrant was fair valued on the date of issuance, which amounted to $1,204,787. The warrant value was recorded as a debt discount based on the relative fair value of the warrant to the total proceeds received, which amounted to $435,240. The warrant was fair valued using the Black-Scholes-Merton valuation model. In addition, the debt contained a beneficial conversion feature, which was valued at the date of issuance at $1,762,163; however, since this amount is in excess of the net value of the debt less the warrant discount, the beneficial conversion feature will be limited to $1,064,760 and recorded as a discount on the loan. The total debt discount of $1,500,000 is being amortized using the effective interest method over the 12-month term of the Secured Note. For the sixnine and three months ended JuneSeptember 30, 2011, the Company recognized $450,568$791,707 and $332,749,$341,139, respectively, in additional interest expense representing amortization of this debt discount.
F-36
Pursuant to and during the term of the Secured Note, the Company will not issue or permit to exist any obligation for borrowed money, except for trade payables incurred in the ordinary course of business, purchase money secured indebtedness for equipment or inventory, unsecured and subordinate indebtedness to, or unsecured and subordinate working capital guarantees provided by, the EXIM Bank, the promissory note dated February 19, 2010 issued to RBC Capital Markets- Custodian of Leonard Samuels IRA (as amended) in the principal amount of $620,000, the Amended and Restated Convertible Promissory Note, dated March 22, 2011, issued to the investor in the principal amount of $1,000,000 and other unsecured indebtedness for borrowed money in an amount not to exceed $750,000.
Pursuant to the Patent Security Agreement issued in connection with the Note and Warrant Purchase of March 22, 2011, the Company shall not, without the investor’s prior consent, sell, dispose or otherwise transfer all or any portion of the collateral, except for license grants in the ordinary course of business. In addition, the Company will take all actions reasonably necessary to prosecute to allowance applications for patents and maintain all patents, and to seek to recover damages for infringement, misappropriation or dilution of the Collateral with limited exceptions.
In connection with such qualified offering, and subject to the terms and conditions of the Convertible Note, the Company will use reasonable efforts to include the investor’s securities in such offering. Pursuant to the terms and conditions of the Exchange Agreements, the investor will not, if requested in writing by the underwriter, sell, offer to sell or otherwise transfer or dispose of (other than to affiliates) any securities of the Company held by it for a period of 180 days from the date of the final prospectus relating to such qualified offering, except for certain limited sales as more fully described in the Exchange Agreements.
The number of shares issued was based upon an agreed-upon per share price of $0.26, which was below the underlying fair value of the Company’s common stock on May 12, 2011 of $0.40 resulting in a loss on extinguishment of debt of $373,450. The fair value of the five year warrant that was issued was determined to be $310,652 using the Black-Scholes option model and is included in the aggregate loss on extinguishment of $684,102. Since the investor is a related party, the loss on extinguishment has been recorded as a capital transaction and, as a result, had no effect on capital in excess of par.
Accrued interest on the above outstanding notes was $194,521$257,535 and $157,683 at JuneSeptember 30, 2011 and December 31, 2010, respectively.
During the three months ended September 30, 2011, E. Todd Tracy and Michael Stone, two individuals holding warrants as a result of the Financing exercised and tendered their warrants on September 13, 2011 and received 537,037 and 145,832 shares of the Company’s common stock. The common stock was issued pursuant to an exemption from registration under Section 4(2) of the Securities Act.
On September 6, 2011, RP Capital and Richardson and Patel, LLP, two entities holding warrants (one as a result of the Financing and the other as a part of a payment arrangement for services) tendered and exercised their warrants and received 244,897 and 188,225 shares of the Company’s common stock. The common stock was issued pursuant to an exemption from registration under Section 4(2) of the Securities Act.
F-37
| 5. | Related Party Transactions |
Timothy N. Tangredi, the Company’sour Chief Executive Officer and Chairman, is a founder and a member of the Boardboard of Directorsdirectors of Aegis Biosciences, LLSBioSciences, LLC (“Aegis”). Aegis, created in 1995, is a licenseeMr. Tangredi currently owns 52% of the Company’s nano-structured intellectual propertyAegis’ outstanding equity and materials in the biomedical and healthcare fields. Mr. Tangredi spends approximately one to two days per month on Aegis business andfor which he is compensated by Aegis. Aegis for his time and contribution(s). We granted Aegishas two exclusive, world-wide licenses the first in 1995 and the second in 2005. Pursuant to these licenses, Aegisfrom us under which it has the right to use and sell products containing our polymer technologies in biomedical and healthcarehealth care applications. TheAs a result of a $150,000 payment made by Aegis, the first license was entered into in 1995 has been amended twice. In 2005, we agreed to accept $150,000is considered fully paid and as payment in full of all royalties andsuch no furtheradditional license revenue will be forthcoming. ThePursuant to the second license allows Aegis the use of our intellectual property in the field of healthcare. Amade an initial one-time payment of $50,000 was made under this license in 2005. In addition, under the second license Aegisand is to make royalty payments of 1.5% of the net sales price it receives with respect to any personal hygiene product, surgical drape or clothing products (the latter when employed in medical and animal related fields) and license revenue it receives should Aegis grant a sublicense to a third party. To date Aegis has sold no such products nor has it received any licensing fees requiring a royalty payment be made to us. All obligationsWe are currently negotiating to purchase all rights Aegis has in its patent applications, including without limitation, any rights it possesses to patent applications it co-owns with us, and potentially terminate the two licenses from us, subject to irrevocable sub-licenses, if any, for such paymentsa one-time payment of $200,000 in cash and $100,000 in shares of our common stock at the same price per share as the price offered to the public in a proposed offering. As a member of Aegis, Mr. Tangredi will end onreceive approximately $104,000 in cash and $52,000 in shares of our common stock pursuant to the earlierproposed transaction, which we anticipate will be structured as an asset sale and expect will be contemporaneously consummated with the closing of June 2, 2015 or upon the aggregate ofthat offering. We anticipate securing most, if not all, sums paid to us by Aegis under the agreement reaching $1 million. The term of each respective license runs for the duration of the patented technology.funds for this proposed purchase from our cash on hand prior to the closing of that proposed offering.
The Company rents a building that is owned by two stockholders of the Company, one of which is the Chief Executive Officer. Rent expense for this building is $3,800 per month. The Company recognized rent expense of approximately $11,400 and $22,800$34,200 each of the three and sixnine months ended JuneSeptember 30, 2011 and 2010. At JuneSeptember 30, 2011 and December 31, 2010, $45,779$53,465 and $151,440, respectively, were included in accounts payable for amounts owed to these stockholders for rent.
The Company also has accrued compensation due to the Chief Executive Officer and two other employees for deferred salaries earned and unpaid as of JuneSeptember 30, 2011 and December 31, 2010 of $1,405,606 and $1,426,022, respectively.
The Company has contracted with Richardson and Patel LLP,a law firm who is also a stockholder, for legal services rendered in connection with the Form S-1 Offering. As of JuneSeptember 30, 2011, the Company has included approximately $388,000$369,600 in accounts payable.payable due to this law firm.
The above terms and amounts are not necessarily indicative of the terms and amounts that would have been incurred had comparable transactions been entered into with independent parties.
| 6. | Stock Options and Warrants |
Options
In June 2000 and November 2009, our Board of Directors adopted, and our shareholders approved, the 2000 Incentive Compensation Plan (“2000 Plan”) and the 2009 Long-Term Incentive Plan (“2009 Plan”), respectively (together the “Plans”). The Plans provide for the granting of options to qualified employees of the Company, independent contractors, consultants, directors and other individuals. The Company’s Board of Directors approved and made available 11,093,882 and 15,000,000 shares of common stock to be issued pursuant to the 2000 Plan and the 2009 Plan, respectively. The 2000 Plan permits grants of options to purchase common shares authorized and approved by our Board of Directors and shareholders for issuance prior to the enactment of the 2000 Plan. The Plans permit grants of options to purchase common shares authorized and approved by the Company’s Board of Directors.
The average fair value of options granted at market during sixnine months ended JuneSeptember 30, 2011 and 2010 was $0.27 and $0.24$0.22 per option, respectively. There were no options exercised during the sixnine months ended JuneSeptember 30, 2011 and 2010.
F-38
The following summarizes the information relating to outstanding stock options activity with employees during 2011 and 2010:
Common Shares | Weighted Average Exercise Price | Weighted Average Remaining Contractual Term (in years) | Aggregate Intrinsic Value | Common Shares | Weighted Average Exercise Price | Weighted Average Remaining Contractual Term (in years) | Aggregate Intrinsic Value | |||||||||||||||||||||||||
| Outstanding at December 31, 2010 | 14,897,757 | $ | 0.25 | 7.19 | $ | 946,754 | 14,897,757 | $ | 0.25 | 7.19 | $ | 946,754 | ||||||||||||||||||||
| Granted | 2,510,000 | $ | 0.33 | 2,535,000 | $ | 0.33 | ||||||||||||||||||||||||||
| Expired/Forfeited | (136,667 | ) | $ | 0.11 | (136,667 | ) | $ | 0.11 | ||||||||||||||||||||||||
| Outstanding at June 30, 2011 | 17,271,090 | $ | 0.32 | 7.04 | $ | 1,406,643 | ||||||||||||||||||||||||||
| Exercisable at June 30, 2011 | 15,958,937 | $ | 0.32 | 6.86 | $ | 1,326,355 | ||||||||||||||||||||||||||
| Outstanding at September 30, 2011 | 17,296,090 | $ | 0.32 | 6.79 | $ | 1,516,086 | ||||||||||||||||||||||||||
| Exercisable at September 30, 2011 | 16,061,854 | $ | 0.32 | 6.62 | $ | 1,433,926 | ||||||||||||||||||||||||||
Stock compensation expense was approximately $238,500$41,000 and $630,100$671,100 for the three and sixnine months ended JuneSeptember 30, 2011, respectively, and approximately $397,700$70,800 and $478,500$549,300 for the three and sixnine months ended JuneSeptember 30, 2010, respectively. The total fair value of shares vested during the sixnine months ended JuneSeptember 30, 2011 and 2010 was approximately $527,200 and $30,800,$509,943, respectively.
As of JuneSeptember 30, 2011, there was approximately $319,000$271,000 of unrecognized employee stock-based compensation expense related to non vested stock options, of which $82,000, $160,000$39,500, $157,000, $70,900 and $77,000$3,400 is expected to be recognized for the remainder of the fiscal year ending December 31, 2011, and for the fiscal years ending 2012, 2013 and 2013,2014, respectively.
The following table represents our non-vested share-based payment activity with employees for the sixnine months ended JuneSeptember 30, 2011:
Number of Options | Weighted Average Grant Date Fair Value | Number of Options | Weighted Average Grant Date Fair Value | |||||||||||||
| Nonvested options - December 31, 2010 | 1,063,194 | $ | 0.25 | 1,063,194 | $ | 0.25 | ||||||||||
| Granted | 2,510,000 | $ | 0.27 | 2,535,000 | $ | 0.27 | ||||||||||
| Vested | (2,261,041 | ) | $ | 0.24 | (2,363,958 | ) | $ | 0.22 | ||||||||
| Nonvested options – June 30, 2011 | 1,312,153 | $ | 0.24 | |||||||||||||
| Nonvested options – September 30, 2011 | 1,234,236 | $ | 0.13 | |||||||||||||
F-39
Warrants
At JuneSeptember 30, 2011, the Company had outstanding warrants to purchase the Company’s common stock which were issued in connection with multiple financing arrangements and consulting agreements. Information relating to these warrants is summarized as follows:
| Warrants | Remaining Number Outstanding | Weighted Average Remaining Life (Years) | Weighted Average Exercise Price | Remaining Number Outstanding | Weighted Average Remaining Life (Years) | Weighted Average Exercise Price | ||||||||||||||||||
| Warrants-Daily Financing | 197,055 | .49 | $ | 0.55 | 197,055 | .24 | $ | 0.55 | ||||||||||||||||
| Warrants-Additional Financing | 428,637 | 1.21 | $ | 0.40 | 428,637 | .96 | $ | 0.40 | ||||||||||||||||
| Warrants-Robb Trust Note | 50,000 | .93 | $ | 0.55 | 50,000 | .68 | $ | 0.55 | ||||||||||||||||
| Warrants-Financings (2007, 2008 and 2011) | 18,750,000 | 2.19 | $ | 0.29 | 17,000,000 | 2.01 | $ | 0.30 | ||||||||||||||||
| Warrants-Placement Agent Warrants | 793,641 | 1.76 | $ | 0.25 | 401,333 | 1.34 | $ | 0.25 | ||||||||||||||||
| Warrants-Tangredi | 3,000,000 | 1.76 | $ | 0.36 | 3,000,000 | 1.51 | $ | 0.36 | ||||||||||||||||
| Warrants-Ehrenberg | 250,000 | 2.10 | $ | 0.30 | 250,000 | 1.85 | $ | 0.30 | ||||||||||||||||
| Warrants-Consulting Agreements | 825,000 | 3.28 | $ | 0.31 | 825,000 | 3.02 | $ | 0.31 | ||||||||||||||||
| Warrants-Note Conversions | 2,302,538 | 2.93 | $ | 0.39 | 2,302,538 | 2.67 | $ | 0.39 | ||||||||||||||||
| Warrants-Stock Purchases | 1,720,770 | 4.00 | $ | 0.40 | 1,720,770 | 3.75 | $ | 0.40 | ||||||||||||||||
| Warrants-Mandelbaum | 50,000 | 2.84 | $ | 0.19 | 50,000 | 2.59 | $ | 0.19 | ||||||||||||||||
| Warrants-Services | 400,000 | 3.56 | $ | 0.50 | 400,000 | 3.31 | $ | 0.50 | ||||||||||||||||
| Tota | 28,767,641 | |||||||||||||||||||||||
| To | 26,625,333 | |||||||||||||||||||||||
Common Stock Issued For Services
The Company issued 103,846207,692 shares of common stock during the sixnine months ended JuneSeptember 30, 2011 valued at $36,346$74,769 for legal services provided from January 1, 2011 through June 30, 2011.services. For the three and sixnine months ended JuneSeptember 30, 2011, the Company has recorded $18,173$19,211 and $36,346,$55,557, respectively, as legal expense related to these services in its statements of operations.
On September 6, 2011, the Company issued 202,703 shares of common stock valued at $75,000 to legal counsel, Richardson and Patel, LLP, in settlement of accounts payable for services rendered.
The Company entered into an agreement for consulting services in April 2010. The term of the agreement is for seventeen months and calls for the Company to issue the consultant 100,000 shares of common stock upon execution of the agreement and an additional 100,000 shares of common stock after six months of service. The agreement also calls for a monthly cash payment of $6,000 for the first six months and $7,500 per month for the remainder of the agreement. The Company has fair valued the initial 100,000 shares of common stock at $53,000 and the additional 100,000 shares of common stock at $36,000 and is expensing the fair value of those shares over life of the agreement. For the three and sixnine months ended JuneSeptember 30, 2011,2010, the Company has recorded $3,667$26,500 and $29,000$48,583 as consulting expense on its statementsstatement of operations.
F-40
The Company issued 207,692 shares of common stock during the three months ended September 30, 2010 valued at $64,384 for legal services. For the three and nine months ended September 30, 2010, the Company has recorded $16,096 and $48,288 as legal expense in its statement of operations.
On November 4, 2010, the Company entered into an agreement for legal services relating to our pending public offering in exchange for 375,000 shares of Common Stock valued at $165,000. This cost is included in deferred offering costs in the accompanying balance sheet.
| 7. | Commitments and Contingencies |
The Company has employment agreements with some of its key employees and executives. These agreements provide for minimum levels of compensation during current and future years. In addition, these agreements call for grants of stock options and for payments upon termination of the agreements.
The Company entered into an amended and restated employment agreement with Mr. Timothy N. Tangredi, our President, Chief Executive Officer, and director, dated as of May 23,September 14, 2011. Mr. Tangredi’s employment agreement provides for an initial term of three years commencing on September 14, 2011 with the term extending on the second anniversary thereof for an additional onetwo year period and on each subsequent anniversary of the agreementcommencement date for an additional year period.year. Mr. Tangredi’s initial base salary is $170,000, with an$200,000. Mr. Tangredi’s base salary shall be increased annually, if applicable, by a sum equal to his current base salary multiplied by one third of the percentage increase in our yearly revenue compared to $210,000 per annum orour prior fiscal year revenue; provided however any annual increase in Mr. Tangredi’s base salary shall not exceed a higher sum asmaximum of 50% for any given year. Any further increase in Mr. Tangredi’s base salary shall be at the sole discretion of our board of directors may set after the date on which we obtain $10 million or more in equity or debt financing. If our market capitalization at the end of the calendar year is more than two times greater than the year before Mr. Tangredi is to receive a cash payment of 0.25% of the difference in capitalization from last year to the current year. compensation committee (if applicable). Additionally, at the discretion of our board of directors and its compensation committee, Mr. Tangredi may be eligible for an annual bonus, which amount, if any, will not be below 75%of up to 100% of his effectivethen-effective base salary, and not exceeding 200%if he meets or exceeds certain annual performance goals established by the board of his then effective base salary; provided that, under certain extraordinary circumstances,directors. In addition to this bonus, Mr. Tangredi may be eligible for an annuala separate merit bonus greater than 200%if approved by the board of his then effective base salary.directors, for specific extraordinary events or achievements such as a sale of a division, major license or distribution arrangement or merger. Mr. Tangredi is entitled to medical, disability and life insurance, as well as 4four weeks of paid vacation annually, an automobile allowance, of $800 per month, reimbursement of all reasonable business expenses, automobile insurance and maintenance, and up to $7,500 for one executive conference or educational venue.expenses.
If Mr. Tangredi’s employment is terminated for any reason, we have completed a secondary public offering of our common stock priorwill be obligated to the date of grant (with the market price to be the average of the closing sale prices during the five trading days immediately preceding the date of grant of the option)pay him his accrued but unpaid base salary, bonus and accrued vacation pay, and any unreimbursed expenses (“Accrued Sums”).
In addition to any Accrued Sums owed, if Mr. Tangredi’s employment is terminated by us in the event thatof his disability or without cause or by Mr. Tangredi for good reason, he shall be entitled to:
| (i) | an amount equal to the sum of (A) the greater of 150% of the base salary then in effect or $320,000 plus (B) the cash bonus and/or merit bonus, if any, awarded for the most recent year; |
| (ii) | health and life insurance, a car allowance and other benefits set forth in the agreement until two years following termination of employment, and thereafter to the extent required by COBRA or similar statute; and |
| (iii) | all stock options, to the extent they were not exercisable at the time of termination of employment, shall become exercisable in full. |
F-41
In addition to any Accrued Sum owed, in the fair market valueevent of our common stock (the average of the closing prices of the common stock for any five consecutive trading days, as reported by the principal exchange or other stock market on which the common stock is then traded) equals or exceeds 200% of the price at which we sell common stock in a secondary public offering (the “Target Value”) at any time during the term of the agreement,termination upon death, Mr. Tangredi shall be granted optionsentitled to purchase 500,000 shares of common stock at an exercise price(i) and (iii) above.
In addition to any Accrued Sums owed, in the event that Mr. Tangredi elects to terminate employment within one year following a change in control, he shall receive a lump sum payment equal to 75%the sum of (a) the Target Value, on terms identicalgreater of his then current base salary or $210,000 plus (b) the cash bonus and merit bonus, if any, awarded in the most recent year. In addition, he will be entitled to the options provided for(ii) and (iii) above.
In April 2011, the Company entered into an employment agreement with the Company’s General Counsel, Patricia Tangredi. The employment term is for four years with automatic renewals. The agreement includes an annual base salary of $120,000 with an increase to $150,000 upon completion of a successful Initial Public Offering of at least $10 million. The agreement also provides for a minimum of 50,000 options to be awarded annually along with other standard employment benefits.
In May 2011, the Company entered into an employment agreement with Scott Ehrenberg, our Chief Technology Officer and Secretary. The employment agreement provides for an initial term of two years with the term extending on the second anniversary thereof for an additional one year period and on each subsequent anniversary of the agreement for an additional year period. The agreement includes an initial base salary is $110,000, with an increase to $165,000 per annum. Additionally, at the discretion of our board of directors and its compensation committee, Mr. Ehrenberg may be eligible for an annual bonus which amount, if any, will not be below 50% of his effective base salary and not exceeding 100% of his then effective base salary; provided that, under certain extraordinary circumstances, Mr. Ehrenberg may be eligible for an annual bonus greater than 150% of his then effective base salary. Upon completion of a successful secondary Public Offering, Mr. Ehrenberg is eligible to receive a one-time payment of $20,000 for each U.S. patent of which he is the originator and the first name listed on the patent as inventor of the intellectual property described in such patent. In addition to any other compensation which Mr. Ehrenberg may receive under the agreement, he will be granted a stock option to purchase 40,000 shares of common stock at the end of each year or on the annual anniversary of the agreement, whichever is mutually acceptable to the Company and Mr. Ehrenberg.
On September 17, 2010, the U.S. Department of Energy approved a grant of up to $681,322 to the Company for the funding of a project to scale up, in size and field trial, a novel dehumidification system similar to the Company’s NanoAir prototype, that is operated by directly manipulating water vapor using a selectively permeable membrane made of a nano-structure solid polymer.prototype. The grant is conditioned upon the Company contributing $171,500 of the proposed total project cost of $852,822. The Company will receive the grant amount upon submission of reimbursement request for allowable expenses. As of JuneFor the nine months ended September 30, 2011, the Company has incurred $229,049$474,550 in expenses and recognized the same amount as revenue related to this grant award.
In December 2010, Pasco County Florida approved a grant of $254,500 to the Company for the funding of the NanoAir product into commercialization. The grant from Pasco County requires us to pay the county 2% of the gross sales of products using a certain unique pump assembly for 5 years or for a total of $1,000,000 whichever comes first. As of JuneFor the nine months ended September 30, 2011, the Company has incurred $57,262$118,347 in expenses and recognized the same amount as revenue related to this grant award.
The Company is not currently a party to any pending legal proceedings. In the ordinary course of business the Company may become a party to various legal proceedings generally involving contractual matters, infringement actions, product liability claims and other matters.
| 8. | Genertec Agreement |
On August 21, 2009, we entered into an Exclusive Distribution Agreement with Genertec, under which we are to supply and Genertec is to distribute, on an exclusive basis, three of our nanotechnology-based membrane products and related products in Great China, including mainland China, Hong Kong, Macau and Taiwan. The agreement provides that during the initial term of the agreement, Genertec will order and purchase these products in the aggregate amount of Two Hundred Million U.S. Dollars. A minimum quantity of said products is to be purchased by Genertec during each contract year of the initial term. In the event Genertec fails to purchase the minimum amount of products in any given year, we may convert the exclusivity provided to Genertec to a non-exclusive or terminate the agreement. Genertec has agreed to engage and appoint authorized person(s) or firm(s), to install, engineer, perform maintenance, sell and use the products within the defined distribution area and neither Genertec nor its designated buyer is permitted to alter, decompile or modify our products in any way. As consideration for entering into this agreement, Genertec agreed to pay us a deposit in monthly installments beginning in September 2009 and continuing through April 2010. All such payments are to be applied to products purchased by Genertec. During the initial term of the agreement, the parties are to negotiate in good faith a royalty bearing license agreement whereby Genertec may be granted a license to manufacture certain portions of the our products in the designated territory. The initial term of the agreement shall be for a period of five (5) years, commencing on August 21, 2009, unless earlier terminated. Unless notice of termination is delivered to the respective parties 180 days prior to the expiration of the initial term, the Agreement will automatically renew for consecutive one year periods. We may terminate this agreement in the event: (1) Genertec fails to pay the deposit as indicated, (2) Genertec does not purchase the minimum amount of our designated products during any contract year, (3) breach by Genertec of its obligations under the Agreement, or (4) at our discretion immediately upon the transfer of fifty percent (50%) or more of either the assets of the voting stock of Genertec to any third party. Genertec may not assign the Agreement to any party without our prior written consent. As of JuneSeptember 30, 2011, the Company has $406,356 in accounts receivable and $500,000 in deferred revenue to be applied against future orders. Genertec America’s partners in China have received the product and are continuing to perform tests; however there have been delays in completing this testing process. As a result, Genertec America has not yet begun to order product from the Company under this agreement. The Company is currently meeting with Genertec to resolve the payment of the receivable and expects that the amounts will be collected.
| 9. | CAST Systems Control Technology |
In April 2010, the Company entered into a technical and sales agreement with CAST Systems Control Technology Co., Ltd. (“CAST”) and Genertec with a value of up to approximately $48 million U.S. Dollars over a twelve month period. Under the terms of the Agreement, the Company will supply to CAST, through Genertec, key system components of its nanotechnology clean water process. The Agreement is conditioned upon the Company obtaining a letter of credit from Genertec in the amount as agreed to by the parties on or before April 13, 2010. As of the date of this filing, the Company has received the required letter of credit from Genertec. This Agreement, the terms of which are disclosed in the Company’s Current Report on Form 8-K, filed on April 9, 2010, is made pursuant to and in support of the $200 million distribution agreement made between the Company and Genertec on August 21, 2009, granting Genertec the exclusive right to obtain, distribute and market the Company’s nanotechnology-based membrane and related products in China, including mainland China, Hong Kong, Macau and Taiwan, the terms of which are summarized above and more fully disclosed in the Company’s Current Report on Form 8-K, filed August 27, 2009. For the year ended December 31, 2010, the Company has sold one unit under this agreement and recognized $300,000 in revenue which has been billed and $254,000 of which has been collected. The Company expects the remainder of the $300,000 receivable to be collected in 2011.
F-43
| 10. | Derivative Financial Instruments |
In September 2008, the FASB ratified the consensus reached on EITF Issue No. 07-5, Determining Whether an Instrument (or an Embedded Feature) is Indexed to an Entity’s Own Stock (“EITF 07-5”) (codified as ASC 815-40-15-5). This EITF provides guidance for determining whether an equity-linked financial instrument (or embedded feature) is indexed to an entity’s own stock. The EITF applies to any freestanding financial instrument or embedded feature that has all the characteristics of a derivative under ASC 815-10-15-13 through 15-130, Accounting for Derivative Instruments and Hedging Activities, for purposes of determining whether that instrument or embedded feature qualifies for the first part of the scope exception. The EITF also applies to any freestanding financial instrument that is potentially settled in an entity’s own stock, regardless of whether the instrument has all the characteristics of a derivative under ASC 815-10-13 through 15-130, for purposes of determining whether the instrument is within the scope of EITF No. 00-19 Accounting for Derivative Financial Instruments Indexed to, and Potentially Settled in, a Company’s Own Stock (“EITF 00-19”) (codified as ASC subtopic 815-40). EITF No. 07-5 was effective beginning the first quarter of fiscal 2009.
Due to certain adjustments that may be made to the exercise price of the warrants issued in December 2007, January 2008 and August 2008 if the Company issues or sells shares of its common stock at a price which is less than the then current warrant exercise price, these warrants have been classified as a liability as opposed to equity in accordance with the Derivatives and Hedging Topic of the FASB ASC 815-10-15 as it was determined that these warrants were not indexed to the Company’s stock. As a result, the fair market value of these warrants was remeasured on January 1, 2009 and marked to market at each subsequent financial reporting period. The change in fair value of the warrants is recorded in the statements of operations and is estimated using the Black-Scholes option-pricing model with the following assumptions:
| Three Months Ended | Six Months Ended | Three Months Ended | Nine Months Ended | |||||||||||||||||||||||||||||
| June 30, | June 30, | September 30, | September 30, | |||||||||||||||||||||||||||||
| 2011 | 2010 | 2011 | 2010 | 2011 | 2010 | 2011 | 2010 | |||||||||||||||||||||||||
| Exercise price | $ | 0.25 | $ | 0.25 | $ | 0.25 | $ | 0.25 | $ | 0.25 | $ | 0.25 | $ | 0.25 | $ | 0.25 | ||||||||||||||||
| Market value of stock at end of period | $ | 0.37 | $ | 0.30 | $ | 0.37 | $ | 0.30 | $ | 0.38 | $ | 0.36 | $ | 0.38 | $ | 0.36 | ||||||||||||||||
| Expected dividend rate | 0 | % | 0 | % | 0 | % | 0 | % | 0 | % | 0 | % | 0 | % | 0 | % | ||||||||||||||||
| Expected volatility | 164 | % | 123% - 137 | % | 164% - 173 | % | 119% - 137 | % | 165 | % | 135% - 158 | % | 164% - 173 | % | 135% - 158 | % | ||||||||||||||||
| Risk-free interest rate | 0.19% – 0.45 | % | 0.81% – 1.00 | % | 0.19% – 1.25 | % | .81% – 1.60 | % | 0.13% – 0.25 | % | 0.42% – 0.64 | % | 0.13% – 0.25 | % | 0.42% – 0.64 | % | ||||||||||||||||
F-44
All warrants issued by the Company other than the above noted warrants are classified as equity.
During the fourth quarter of the year ended December 31, 2010, the Company applied the guidance of Accounting Standards Codification 815-40 (ASC 815-40) and recorded a $618,801 gain on the fair value of the warrant liability for the year then ended. The warrants had been issued in December 2007, January 2008 and August 2008, in connection with convertible promissory notes and were originally accounted for as an equity instrument. Accordingly, the Company has restated its financial statements to reflect the proper accounting treatment. If the Company would have recorded these warrants as a derivative liability upon initial adoption of ASC 815-40, the Company would have recorded the following amounts in its balance sheets and income statements in the periods indicated:
Total Liabilities As previously Reported | Change | Total Liabilities As Restated | Stockholders’ Deficit As previously Reported | Change | Stockholders’ Deficit As Restated | |||||||||||||||||||
| March 31, 2010 | $ | 5,117,253 | $ | 6,085,147 | $ | 11,202,400 | $ | (3,058,161 | ) | $ | (6,085,147 | ) | $ | (9,143,308 | ) | |||||||||
| June 30, 2010 | $ | 5,165,059 | $ | 4,250,053 | $ | 9,415,112 | $ | (3,094,998 | ) | $ | (4,250,053 | ) | $ | (7,345,051 | ) | |||||||||
| September 30, 2010 | $ | 5,147,657 | $ | 4,861,284 | $ | 10,008,941 | $ | (3,428,140 | ) | $ | (4,861,284 | ) | $ | (8,289,424 | ) | |||||||||
Other Inc (Exp) As previously Reported | Change | Other Inc (Exp) As Restated | Net Loss As previously Reported | Change | Net (Loss) Income As Restated | EPS As previously Reported | EPS As Restated | |||||||||||||||||||||||||
| For the Three Months Ended: | ||||||||||||||||||||||||||||||||
| March 31, 2010 | $ | (46,504 | ) | $ | (1,508,027 | ) | $ | (1,554,531 | ) | $ | (520,038 | ) | $ | (1,508,027 | ) | $ | (2,028,065 | ) | $ | (0.02 | ) | $ | (0.07 | ) | ||||||||
| June 30, 2010 | $ | (55,233 | ) | $ | 1,835,094 | $ | 1,779,861 | $ | (624,681 | ) | $ | 1,835,094 | $ | 1,210,413 | $ | (0.02 | ) | $ | 0.04 | |||||||||||||
| September 30, 2010 | $ | (55,933 | ) | $ | (611,231 | ) | $ | (667,164 | ) | $ | (555,692 | ) | $ | (611,231 | ) | $ | (1,166,923 | ) | $ | (0.02 | ) | $ | (0.04 | ) | ||||||||
| 11. | Subsequent Events |
No other material subsequent events have occurred since JuneSeptember 30, 2011 that requires recognition or disclosure in these financial statements.
33,000,000 Shares of Common Stock
Dais Analytic Corporation
PROSPECTUS

Until , 2011,2012, all dealers that effect transactions in these securities, whether or not participating in this offering, may be required to deliver a prospectus. This is in addition to the dealers’ obligation to deliver a prospectus when acting as underwriters and with respect to their unsold allotments or subscriptions.
PART II
INFORMATION NOT REQUIRED IN PROSPECTUS
Item 13. Other Expenses of Issuance and Distribution
The following table sets forth the fees and expenses the Company expects to incur in connection with the issuance and distribution of the securities being registered. With the exception of the SEC registration fee, all amounts are estimates:
SEC Filing Fee | $ | 2,803.82 | $ | 2,803.82 | ||||
FINRA Fee | $ | 2,700 | ||||||
AMEX Fee | $ | 40,000 | ||||||
Printing Expenses* | $ | 40,000 | $ | 40,000 | ||||
Accounting Fees and Expenses* | $ | 60,000 | $ | 60,000 | ||||
Legal Fees and Expenses* | $ | 275,000 | $ | 150,000 | ||||
Transfer Agent and Registrar Expenses* | $ | 10,000 | $ | 10,000 | ||||
Miscellaneous* | $ | 15,000 | $ | 15,000 | ||||
Total | $ | 445,503.82 | $ | 277,803.82 | ||||
____________________
| * | Estimated. |
Item 14. Indemnification Of Directors And Officers
As permitted under the Business Corporation Law of the State of New York, our Certificate of Incorporation provides that all our directors shall be entitled to be indemnified for any breach of duty, provided that no indemnification may be made to or on behalf of any director if a judgment or other final adjudication adverse to the director establishes that his acts were committed in bad faith or were the result of active and deliberate dishonesty and were material to the cause of action so adjudicated, or that he personally gained in fact a financial profit or other advantage to which he was not legally entitled.
Our Certificate of Incorporation further provides for indemnification of any person for actions as a director, officer, employee or agent of the Company to the fullest extent permitted by law with regards to fines, judgments fees and amounts paid in a settlement in an action or proceeding if the person acted in good faith and in a manner the person reasonably believed in or not opposed to the best interests of the Company and, with respect to any criminal action or proceeding, had no reasonable cause to believe the person’s conduct was unlawful.
Under our Director and Officer Insurance Policy, our directors and officers are provided liability coverage of $5 million subject to retention. In addition, we have secured a form following excess Director and Officer Insurance Policy in the amount of $2.5 million. The policies have a one year term with annual renewal possible. The policies can be terminated by the insurer if there is a merger or consolidation which includes a change in ownership of 50% of the voting shares. Upon such an occurrence the insurer may elect to cancel the policies. We may elect to then obtain “run off” insurance for a period of between one and six years at a cost of between 125% and 225% of the initial policy premiums. The policies are claims made policies. Each policy covers only claims relating to acts occurring after the continuity date provided such claims are made during the policy term. If an act giving rise to a claim occurs during the policy term, but the claim is not reported within 60 days of the termination or expiration policy, the claim will not be covered.
II-1
Insofar as indemnification for liabilities arising under the Securities Act may be permitted to directors, officers and controlling persons of the Registrant pursuant to the foregoing provisions, or otherwise, the Registrant has been advised that in the opinion of the Securities and Exchange Commission such indemnification is against public policy as expressed in the Act and is, therefore, unenforceable. In the event that a claim for indemnification against such liabilities (other than the payment by the Registrant of expenses incurred or paid by a director, officer or controlling person of the Registrant in the successful defense of any action, suit or proceeding) is asserted by such director, officer or controlling person in connection with the securities being registered, the Registrant will, unless in the opinion of its counsel that the matter has been settled by controlling precedent, submit to a court of appropriate jurisdiction the question whether such indemnification by it is against public policy as expressed in the Act and will be governed by the final adjudication of such issue.
Item 15. Recent Sales of Unregistered Securities
During the past three years, we issued the following securities without registration under the Securities Act of 1933, as amended (the “Securities Act”) pursuant to exemption from registration under Section 4(2) and Regulation D of the Securities Act.
E. Todd Tracy and Michael Stone, two individuals holding warrants as a result of the Financing exercised and tendered their warrants on September 13, 2011 and received 537,037 and 145,832 shares of the Company’s common stock. The common stock was issued pursuant to an exemption from registration under Section 4(2) of the Securities Act.
On September 6, 2011, RP Capital and Richardson and Patel, LLP, two entities holding warrants (one as a result of the Financing and the other as a part of a payment arrangement for services) tendered and exercised their warrants and received 244,897 and 188,225 shares of the Company’s common stock (24,490 and 18,823 shares, respectively, upon giving effect to the anticipated 10-for-1 reverse stock split).stock. The common stock was issued pursuant to an exemption from registration under Section 4(2) of the Securities Act.
On September 6, 2011, the Company issued 202,703 shares of common stock (20,270 shares upon giving effect to the anticipated 10-for-1 reverse stock split) valued at $75,000 for to legal counsel, Richardson and Patel, LLP, in settlement of accounts payable for services rendered. The issuance of these securities was exempt from registration under Section 4(2) and Regulation D of the Securities Act
On August 30, 2011, the Company issued 103,846 shares of common stock (10,385 shares upon giving effect to the anticipated 10-for-1 reverse stock split) valued at $38,423 for to legal counsel, Ellenoff, Grossman and Schole PA, for services rendered. The issuance of these securities was exempt from registration under Section 4(2) and Regulation D of the Securities Act
On May 12, 2011, a note holder elected to apply all of the proceeds due and payable pursuant to this note, in the principal amount of $620,000 plus accrued interest, to purchase our common stock. Pursuant to this transaction, the investor subscribed for and purchased 2,667,503 shares of common stock at a purchase price of $0.26 per share (266,750 shares of common stock upon giving effect to the anticipated 10 for 1 reverse split) resulting in an aggregate purchase price of $693,550 (the principal amount and related accrued interest under the note). As part of the purchase, the investor also received a five-year warrant to purchase 962,500 shares of Common Stock, at an exercise price of $.45 per share (96,250 shares of common stock at an exercise price of $4.50 after giving effect to the anticipated reverse split).share. The Common Stock was issued pursuant to exemption from registration under Section 4(2) of the Securities Act.
On April 27, 2011, the Company issued 103,846 shares of common stock (10,385 shares upon giving effect to the anticipated 10-for-1 reverse stock split) valued at $45,692 for to legal counsel, Ellenoff, Grossman and Schole PA, for services rendered. The issuance of these securities was exempt from registration under Section 4(2) and Regulation D of the Securities ActAct.
On March 23, 2011, we entered into a Securities Amendment and Exchange Agreement and an Amended and Restated Convertible Promissory Note, in the amount of $1,000,000. Pursuant to the terms of this note, interest in the amount of 10% per annum, calculated on a 365 day year, commencing on December 17, 2009, and the principal amount of $1,000,000 will be paid on March 22, 2012, but repayment is accelerated upon a firm commitment underwritten public offering. The initial conversion price is $0.26 per share. Any principal or interest which is not converted will be repaid by the Company at the earlier of qualified firm commitment underwritten public offering on March 22, 2012. We also issued a warrant to an existingthis investor to purchase 1,000,000 shares of our common stock at $0.45 per share (100,000 shares at $4.50 per share upon giving effect to the anticipated 10-for-1 reverse stock split) terminating on March 22, 2016.
On March 23, 2011, we also issued a secured convertible promissory note to such investor in the amount of $1,500,000, which will be secured by all patents, patent applications and similar protections of the Company and all rents, royalties, license fees and “accounts” with respect to such intellectual property assets. Pursuant to the terms of the secured note, interest in the amount of 10% per annum, calculated on a 365 day year, and the principal amount of $1,500,000 will be paid on March 22, 2012, but repayment is accelerated upon a qualified firm commitment underwitten public offering. The initial conversion price is $.26 per share ($2.60 per share upon giving effect to the anticipated 10-for-1 reverse stock split).share. Any principal or interest which is not converted will be repaid by the Company at the earlier of the qualified offering or March 22, 2012. We also issued a warrant to the investor to purchase 3,000,000 shares of Company’s common stock at $0.45 per share, (300,000 shares at $4.50 per share upon giving effect to the anticipated 10-for-1 reverse stock split) exercisable until March 22, 2012. The proceeds from these notes were used for working capital, research and development expenses and general corporate purposes.
II-2
On February 18, 2011, the Company issued 17,500 shares of common stock (1,750 shares upon giving effect to the anticipated 10-for-1 reverse stock split) valued at $6,475 for services rendered pursuant to an agreement. The issuance of these securities was exempt from registration under Section 4(2) and Regulation D of the Securities Act.
On December 28, 2010, the Company issued 375,000 shares of common stock (37,500 shares upon giving effect to the anticipated 10 for 1 reverse stock split) valued at $165,000 for to our legal counsel, Richardson and Patel LLP, for services rendered in connection with this offering. The issuance of these securities was exempt from registration under Section 4(2) and Regulation D of the Securities Act.
On December 27, 2010, an investor elected to apply all of the proceeds due and payable under our promissory note, including all accrued interest, to purchase our common stock. Pursuant to this transaction, the investors subscribed for and purchased 1,052,950 shares of common stock at a purchase price of $0.26 per share (105,295 shares of common stock, at a purchase price of $2.60 upon giving effect to the anticipated 10 for 1 reverse split) resulting in an aggregate purchase price of $273,767 (the principal amount and related accrued interest under the note). The issuance of these securities was exempt from registration under Section 4(2) and Regulation D of the Securities Act.
On December 30, 2010, an investor elected to apply all of the proceeds due and payable under our promissory note, including all accrued interest, to purchase our Common Stock. Pursuant to this transaction, the investor subscribed for and purchased 1,266,930 shares of Common Stock at a purchase price of $0.26 per share, (126,693 shares of the Company’s common stock at an exercise price of $2.60 per share upon giving effect to the anticipated 10 for 1 reverse stock split), resulting in an aggregate purchase price of $329,402. The issuance of these securities was exempt from registration under Section 4(2) and Regulation D of the Securities Act.
On November 4, 2010 an investor elected to convert the balance of its 9% secured convertible note in the amount of $100,000 into 625,384 shares of the Company’s Common Stock (62,538 shares upon giving effect to the anticipated 10-for-1 reverse stock split).Stock. The Common Stock was issued pursuant to exemption from registration under Section 3(a)(9) of the Securities Act. The investor also received an additional five-year warrant to purchase up to 62,538 shares of Common Stock, at an exercise price of $0.75 per share (6,254 shares at $7.50 per share upon giving effect to the anticipated 10-for-1 reverse stock split) in consideration for converting its 9% secured convertible note. The warrant is immediately exercisable and subject to adjustment for standard anti-dilution events. The Common Stock was issued pursuant to exemption from registration under Section 4(2) of the Securities Act.
On November 4, 2010, the Company issued 100,000 shares of Common Stock (10,000 shares upon giving effect to the anticipated 10-for-1 reverse stock split) valued at $36,000 for services provided. The issuance of these securities was exempt from registration under Section 4(2) and Regulation D of the Securities Act.
During the three months ended September 30, 2010, the Company issued 247,692 shares of Common Stock (24,769 shares upon giving effect to the anticipated 10-for-1 reverse stock split) valued at $75,984 for services provided. The issuance of these securities was exempt from registration under Section 4(2) and Regulation D of the Securities Act.
On June 25, 2010, the Company issued an option to purchase 15,000 shares of Common Stock (1,500 shares upon giving effect to the anticipated 10-for-1 reverse stock split) valued at $3,595 for services provided. The issuance of these securities was exempt from registration under Section 4(2) and Regulation D of the Securities Act.
On April 20, 2010 an investor elected to convert the balance of his 9% secured convertible note in the amount of $75,000 into 375,000 shares of Company’s Common Stock (37,500 shares upon giving effect to the anticipated 10-for-1 reverse stock split).Stock. The Common Stock was issued pursuant to exemption from registration under Section 3(a)(9) of the Securities Act.
In April of 2010, we issued 10,000 shares of the Company’s Common Stock (1,000 shares upon giving effect to the anticipated 10-for1 reverse stock split) to an individual in connection with performance of services. The Common Stock was issued pursuant to exemption from registration under Section 4(2) of the Securities Act. The fair value of the services for which the equity instruments were issued is approximately $4,800.
II-3
During the three months ended March 31, 2010, the Company issued 56,000 shares of Common Stock (5,600 shares upon giving effect to the anticipated 10-for-1 reverse stock split) valued at $24,200 for services provided. The issuance of these securities was exempt from registration under Section 4(2) and Regulation D of the Securities Act.
During the three months ended March 31, 2010, the Company issued warrants to purchase 250,000, 50,000, 50,000 and 60,000 shares of Common Stock at an exercise price of $0.28 per share, respectively (25,000, 5,000, 5,000 and 6,000 shares at $2.80 per share, respectively, upon giving effect to the anticipated 10-for-1 reverse stock split).respectively. Each warrant was issued for services rendered or to be rendered to the Company, has a five year term, is immediately exercisable and subject to adjustment for standard anti-dilution events, including but not limited to stock dividends, split-up, reclassification or combination of Company’s share, exchange of stock for other Company stock, or certain capital reorganizations or reclassification of the capital stock or consolidation, merger or sale of substantially all Company’s assets. In addition, subject to certain conditions, upon the per share market price of the Common Stock (as defined in warrant) being $1.50 per share ($15.00 per share upon giving effect to the anticipated 10-for-1 reverse stock split) for ten consecutive trading days, the Company may require the holder of the warrant to exercise the warrant or it will automatically terminate. The issuance of these securities was exempt from registration under Section 4 (2) and Regulation D of the Securities Act.
In December of 2009, Company issued 25,000 shares of our Common Stock (2,500 shares upon giving effect to the anticipated 10-for1 reverse stock split) to an employee for cash consideration of $4,250 upon the exercise of a stock option granted under our 2000 Plan.
From January 1, 2008 to April of 2011 Company granted, pursuant to its 2000 Plan and 2009 Plan, options to purchase a total of 12,786,725 shares (1,278,673 shares upon giving effect to the anticipated 10-for-1 reverse stock split ).shares. In December of 2009 and in February of 2008 two employees exercised two of the options. Pursuant to these exercises we e issued 25,000 and 20,000 shares, respectively, of our Common Stock (2,500 and 2,000 shares, respectively, upon giving effect to the anticipated 10-to1 reverse stock split) for cash consideration of $4,250 and $2,000.
On November 23, 2009 an investor elected to convert the interest accrued on his 9% secured convertible note in the amount of $34,027 into 170,137 shares of Company’s Common Stock (17,014 shares upon giving effect to the anticipated 10-for-1 reverse stock split).Stock. The note was modified so as to end accrual of interest on November 20, 2009. The Common Stock was issued pursuant to exemption from registration under Section 3(a)(9) of the Securities Act.
On October 9, 2009, four investors elected to convert their 9% secured convertible notes and the related accrued interest in the amounts of $174,349, $638,693, $28,859 and $57,989 into 871,746, 3,193,466, 144,295 and 289,945 shares of Company’s Common Stock, respectively (87,175, 319,347, 14,430 and 28,995 shares, respectively, upon giving effect to the anticipated 10-for-1 reverse stock split).respectively. Said investors also received an additional five-year warrant to purchase up to 75,000, 275,000, 12,500 and 25,000 shares, respectively, of Common Stock at an exercise price of $0.75 per share (7,500, 27,500, 1,250 and 2,500 shares, respectively, of Common Stock at an exercise price of $7.50 upon giving effect to the anticipated 10 for 1 reverse stock split) in consideration for converting their 9% secured convertible note. The warrant is immediately exercisable and subject to adjustment for standard anti-dilution events. The Common Stock was issued pursuant to exemption from registration under Section 4(2) of the Securities Act.
II-4
In September of 2009, seven individuals issued warrants by the Placement Agents as a result of the Financing exercised their warrants and received the 88,643, 225,418, 14,738, 225,418, 20,536, 156,701 and 45,179 shares of Company’s common stock (8,864, 22,542, 1,474, 22,542, 2,054, 15,670 and 4,518 shares, respectively, upon giving effect to the anticipated 10-for-1 reverse stock split) valued at $7,766; respectively. The Common Stock was issued pursuant to exemption from registration under Section 4(2) of the Securities Act.
On September 30, 2009, an investor elected to convert his 9% secured convertible note and the related accrued interest in the amounts of $57,866 into 289,329 shares of Company’s Common Stock (28,933 shares upon giving effect to the anticipated 10-for-1 reverse stock split).Common. Said investor also received an additional five-year warrant to purchase up to 25,000 shares of Common Stock, at an exercise price of $0.75 per share (2,500 shares at $7.50 per share upon giving effect to the anticipated 10-for-1 reverse stock split) in consideration for converting his 9% secured convertible note. The warrant is immediately exercisable and subject to adjustment for standard anti-dilution events. The Common Stock was issued pursuant to exemption from registration under Section 4(2) of the Securities Act.
On September 27, 2009, the Company entered into a subscription agreement with an investor pursuant to which the investor purchased 100,000 shares of Company’s Common Stock (10,000 shares upon giving effect to the anticipated 10-for-1 reverse stock split).Stock. As part of the purchase, the investor also received a five year warrant to purchase 10,000 shares of Common Stock, at an exercise price of $0.75 per share (1,000 shares at $7.50 per share upon giving effect to the anticipated 10-for-1 reverse stock split).share. The aggregate gross proceeds received by the Company for the sale was $25,000. The warrants are immediately exercisable and subject to adjustment for standard anti-dilutions events, including but not limited to stock dividends, split-up, reclassification or combination of Company’s shares, exchange of stock for other Company stock, or certain capital reorganizations or reclassification of the capital stock or consolidation, merger or sale of substantially all Company’s assets. In addition, subject to certain conditions, upon the per share market price of the Common Stock (as defined in warrant) being $1.50 per share ($15.00 per share upon giving effect to the anticipated 10-for-1 reverse stock split) for ten consecutive trading days the Company may require the holder of the warrant to exercise the warrant or it will automatically terminate. The issuance of these securities was exempt from registration under Section 4(2) and Regulation D of the Securities Act.
On September 23, 2009 and September 27, 2009 the Company entered into subscription agreements with two investors pursuant to which the investors purchased 192,308 and 125,000 shares of Company’s Common Stock, respectively (19,231 and 12,500 shares, respectively, upon giving effect to the anticipated 10-for-1 reverse stock split).respectively. As part of the purchase, these investors also received a five year warrant to purchase 19,231 and 12,500 shares of Common Stock, respectively, at an exercise price of $0.75 per share (1,923 and 1,250 shares at $7.50 per share, respectively, upon giving effect to the anticipated 10-for-1 reverse stock split).share. The aggregate gross proceeds received by the Company for each sale was $50,000 and $32,500, respectively. The warrants are immediately exercisable and subject to adjustment for standard anti-dilutions events, including but not limited to stock dividends, split-up, reclassification or combination of Company’s shares, exchange of stock for other Company stock, or certain capital reorganizations or reclassification of the capital stock or consolidation, merger or sale of substantially all Company’s assets. In addition, subject to certain conditions, upon the per share market price of the Common Stock (as defined in warrant) being $1.50 per share ($15.00 per share upon giving effect to the anticipated 10-for-1 reverse stock split) for ten consecutive trading days the Company may require the holder of the warrant to exercise the warrant or it will automatically terminate. The issuance of these securities was exempt from registration under Section 4(2) and Regulation D of the Securities Act.
On September 24, 2009, two investors elected to convert their 9% secured convertible notes and the related accrued interest in the amounts of $58,026 and $116,052 into 290,130 and 580,260 shares of Company’s Common Stock, respectively (29,013 and 58,026 shares, respectively, upon giving effect to the anticipated 10-for-1 reverse stock split).respectively. Said investors also received an additional five-year warrant to purchase up to 25,000 and 50,000 shares, respectively of Common Stock, at an exercise price of $0.75 per share (2,500 and 5,000 shares at $7.50 per share upon giving effect to the anticipated 10-for-1 reverse stock split) in consideration for converting their 9% secured convertible note. The warrant is immediately exercisable and subject to adjustment for standard anti-dilution events. The Common Stock was issued pursuant to exemption from registration under Section 4(2) of the Securities Act.
II-5
On September 23, 2009 one investor elected to convert his 9% secured convertible note and the related accrued interest in the amounts of $58,013 into 290,068 shares of Company’s Common Stock (29,007 shares upon giving effect to the anticipated 10-for-1 reverse stock split).Stock. Said investor also received an additional five-year warrant to purchase up to 25,000 shares of Common Stock, at an exercise price of $0.75 per share (2,500 shares at $7.50 per share upon giving effect to the anticipated 10-for-1 reverse stock split) in consideration for converting their 9% secured convertible note. The warrant is immediately exercisable and subject to adjustment for standard anti-dilution events. The Common Stock was issued pursuant to exemption from registration under Section 4(2) of the Securities Act.
On September 18, 2009, two investors elected to convert their 9% secured convertible notes and the related accrued interest in the amounts of $86,928 and $57,866 into 434,640 and 289,329 shares of Company’s Common Stock, respectively (43,464 and 28,933 shares, respectively, upon giving effect to the anticipated 10-for-1 reverse stock split).respectively. Said investors also received an additional five-year warrant to purchase up to 37,500 and 25,000 shares, respectively of Common Stock, at an exercise price of $0.75 per share (3,750 and 2,500 shares at $7.50 per share, respectively, upon giving effect to the anticipated 10-for-1 reverse stock split) in consideration for converting their 9% secured convertible note. The warrant is immediately exercisable and subject to adjustment for standard anti-dilution events. The Common Stock was issued pursuant to exemption from registration under Section 4(2) of the Securities Act.
On September 17, 2009, the Company entered into subscription agreements with two investors pursuant to which the investors purchased 800,000 and 100,000 shares of Company’s Common Stock, respectively (80,000 and 10,000 shares upon giving effect to the anticipated 10-for-1 reverse stock split).respectively. As part of the purchase, these investors also received a five year warrant to purchase 80,000 and 10,000 shares of Common Stock, respectively, at an exercise price of $0.75 per share (8,000 and 1,000 shares, respectively, at $7.50 per share upon giving effect to the anticipated 10-for-1 reverse stock split).share. The aggregate gross proceeds received by the Company for each sale was $200,000 and $25,000, respectively. The warrants are immediately exercisable and subject to adjustment for standard anti-dilutions events, including but not limited to stock dividends, split-up, reclassification or combination of Company’s shares, exchange of stock for other Company stock, or certain capital reorganizations or reclassification of the capital stock or consolidation, merger or sale of substantially all Company’s assets. In addition, subject to certain conditions, upon the per share market price of the Common Stock (as defined in warrant) being $1.50 per share ($15.00 per share upon giving effect to the anticipated 10-for-1 reverse stock split) for ten consecutive trading days the Company may require the holder of the warrant to exercise the warrant or it will automatically terminate. The issuance of these securities was exempt from registration under Section 4 (2) and Regulation D of the Securities Act.
On September 2, 2009, September 3, 2009 and September 4, 2009, three investors elected to convert their 9% secured convertible notes and the related accrued interest in the amounts of $57,274 and $57,767 and $115,584 into 286,370, 288,836 and 577,918 shares of the Company’s common stock, respectively (28,637, 28,884 and 57,792 shares upon giving effect to the anticipated 10-for-1 reverse stock split).respectively.
II-6
In August of 2009, the Company issued warrants to purchase 200,000 and 50,000 shares of Common Stock at an exercise price of $0.37 and $0.51 per share, respectively (20,000 and 5,000 shares at $3.70 and $5,10 per share, respectively, upon giving effect to the anticipated 10-for-1 reverse stock split).respectively. Each warrant was issued for services rendered or to be rendered to the Company, has a five year term, vested equally over a two year period and is subject to adjustment for standard anti-dilution events, including but not limited to stock dividends, split-up, reclassification or combination of Company’s share, exchange of stock for other Company stock, or certain capital reorganizations or reclassification of the capital stock or consolidation, merger or sale of substantially all Company’s assets. In addition, subject to certain conditions, upon the per share market price of the Common Stock (as defined in warrant) being $1.50 per share ($15.00 per share upon giving effect to the anticipated 10-for-1 reverse stock split) for ten consecutive trading days, the Company may require the holder of the warrant to exercise the warrant or it will automatically terminate. As the services of the first warrant holder were terminated prior to all shares vesting, the number of shares subject to exercise of this warrant is 100,000. The issuance of these securities was exempt from registration under Section 4(2) and Regulation D of the Securities Act.
On August 13, 2009, an investor elected to convert its 9% secured convertible notes and the related accrued interest in the amount of $85,541 into 427,706 shares of Common Stock (42,771 shares upon giving effect to the anticipated 10-for-1 reverse stock split).Stock. Said investor also received an additional warrant to purchase up to 124,875 shares of Common Stock, at an exercise price of $0.25 per share (12,488 shares at $2.50 per share upon giving effect to the anticipated 10-for-1 reverse stock split) in consideration for converting their 9% secured convertible note.
On August 3, 2009, we issued 32,000 shares of the Company’s Common Stock (3,200 shares upon giving effect to the anticipated 10- for-1 reverse stock split) an individual in connection with performance of services. The Common Stock was issued pursuant to exemption from registration under Section 4(2) of the Securities Act. The fair value of the services for which the equity instruments were issued is approximately $5,400.
On July 3, 2009, we issued 103,846 shares of the Company’s Common Stock (10,385 shares upon giving effect to the anticipated 10- for-1 reverse stock split) to an entity in connection with performance of services. The Common Stock was issued pursuant to exemption from registration under Section 4(2) of the Securities Act.
On June 30, 2009, the Company entered into a subscription agreement with an investor pursuant to which the investor purchased 596,154 shares of Company’s Common Stock (59,615 shares upon giving effect to the anticipated 10-for-1 reverse stock split) and a five year warrant to purchase an additional 298,078 shares of Common Stock at an exercise price of $0.26 per share (29,808 shares at $2.60 per share upon giving effect to the anticipated 10-for-1 reverse stock split).share. The aggregate gross proceeds received by Company for this sale was $155,000. The warrants are immediately exercisable and subject to adjustment for standard anti-dilution events, including but not limited to stock dividends, split-up, reclassification or combination of Company’s share, exchange of stock for other Company stock, or certain capital reorganizations or reclassification of the capital stock or consolidation, merger or sale of substantially all Company’s assets. In addition, subject to certain conditions, upon the per share market price of the Common Stock (as defined in warrant) being $1.50 per share ($15.00 per share upon giving effect to the anticipated 10-for-1 reverse stock split) for ten consecutive trading days the Company may require the holder of the warrant exercise the warrant or it will automatically terminate. The issuance of these securities was exempt from registration under Section 4(2) and Regulation D of the Securities Act.
II-7
On June 8, 2009, we issued 32,000 shares of the Company’s Common Stock (3,200 shares upon giving effect to the anticipated 10-for-1 reverse stock split) to an individual in connection with performance of services. The Common Stock was issued pursuant to exemption from registration under Section 4(2) of the Securities Act. The fair value of the services for which the equity instruments were issued is approximately $4,800. In April of 2009, we issued 16,000 shares of the Company’s Common Stock (1,600 shares upon giving effect to the anticipated 10-for-1 reverse stock split) to an entity in connection with performance of services. The Common Stock was issued pursuant to exemption from registration under Section 4(2) of the Securities Act. The fair value of the services for which the equity instruments were issued is approximately $2,240.
On April 30, 2009, Company issued a five year warrant to purchase 250,000 shares of Common Stock at an exercise price of $0.26 per share (25,000 shares at $2.60 per share upon giving effect to the anticipated 10-for-1 reverse stock split) pursuant to a consulting agreement. The warrants are immediately exercisable and subject to adjustment for standard anti-dilutions events, including but not limited to stock dividends, split-up, reclassification or combination of Company’s share, exchange of stock for other Company stock, or certain capital reorganizations or reclassification of the capital stock or consolidation, merger or sale of substantially all Company’s assets. In addition, subject to certain conditions, upon the per share market price of the Common Stock (as defined in warrant) being $1.50 per share for ten consecutive trading days the Company may require the holder of the warrant exercise the warrant or it will automatically terminate. The issuance of these securities was exempt from registration under Section 4(2) and Regulation D of the Securities Act.
On April 6, 2009, and April 30, 2009, two investors elected to convert their 9% secured convertible notes and the related accrued interest in the amounts of $110,849 and $167,125 into 554,247 and 835,623 shares of Common Stock, respectively (55,425 and 83,562 shares upon giving effect to the anticipated 10-for-1 reverse stock split).respectively. Such investors also received an additional warrant to purchase up to 166,500 and 249,750 shares of Common Stock, respectively, at an exercise price of $0.25 per share (16,650 and 24,975 shares at $2.50 per share upon giving effect to the anticipated 10-for-1 reverse stock split) in consideration for converting their 9% secured convertible note.
On March 9, 2009, the Company entered into a subscription agreement with an investor pursuant to which the investor purchased 576,923 shares of Company’s Common Stock (57,692 shares upon giving effect to the anticipated 10-for-1 reverse stock split) and a five year warrant to purchase an additional 288,462 shares of Common Stock at an exercise price of $0.26 per share (28,846 shares at $2.60 per share upon giving effect to the anticipated 10-for-1 reverse stock split).share. The aggregate gross proceeds received by Company for this sale was $150,000. On the same date, an additional investor entered into a subscription agreement with Company and purchased 100,000 shares of Company’s Common Stock (10,000 shares upon giving effect to the anticipated 10-for-1 reverse stock split) and a five year warrant to purchase an additional 50,000 shares of Common Stock at a purchase price of $0.26 per share (5,000 shares at $2.60 per share upon giving effect to the anticipated 10-for-1 reverse stock split).share. The aggregate gross proceeds received by Company for this sale was $26,000. The warrants issued to these purchasers are identical in their terms, immediately exercisable and subject to adjustment for standard anti-dilutions events, including but not limited to stock dividends, split-up, reclassification or combination of Company’s share, exchange of stock for other Company stock, or certain capital reorganizations or reclassification of the capital stock or consolidation, merger or sale of substantially all Company’s assets. In addition, subject to certain conditions, upon the per share market price of the Common Stock (as defined in warrant) being $1.50 per share ($15.00 per share upon giving effect to the anticipated 10-for-1 reverse stock split) for ten consecutive trading days the Company may require the holder of the warrant exercise the warrant or it will automatically terminate. The issuance of these securities was exempt from registration under Section 4 (2) and Regulation D of the Securities Act.
From October 2008 to March 2009, Company issued a total of 96,000 shares of Common Stock (9,600 shares giving effect to the anticipated 10-for-1 reverse stock split) pursuant to a consulting agreement. Said agreement required the Company to issue 16,000 shares (1,600 shares upon giving effect to the anticipated 10-for-1 reverse stock split) per month for each month of the agreement. The fair value of the Common Stock issued for these services is approximately $12,640.
II-8
On February 16, 2009, and March 12, 2009, two investors elected to convert their 9% secured convertible notes and the related accrued interest in the amounts of $83,008 and $664,948 into 415,038 and 3,324,740 shares of Common Stock, respectively (41,504 and 332,474 shares upon giving effect to the anticipated 10-for-1 reverse stock split).respectively. Such investors also received an additional warrant to purchase up to 124,875 and 999,000 shares of Common Stock, respectively, at an exercise price of $0.25 per share (12,488 and 99,900 shares at $2.50 per share upon giving effect to the anticipated 10-for-1 reverse stock split) in consideration for converting their 9% secured convertible note.
On January 8, 2009, we issued 9,000 and 103,846 shares of the Company’s common stock (900 and 10,385 shares upon giving effect to the anticipated 10-for-1 reverse stock split) to two entities, respectively, in connection with performance of services. The Common Stock was issued pursuant to exemption from registration under Section 4(2) of the Securities Act. The fair value of the services for which the equity instruments were issued is approximately $2,700 and $27,000, respectively.
In August 2008 we issued a five year warrant to purchase 250,000 shares of common stock (25,000 shares upon giving effect to the anticipated 10-for-1 reverse stock split) to Mr. Ehrenberg in recognition for Mr. Ehrenberg’s achievement of certain company goals. The fair value of the warrant issued is approximately $49,000. The warrant vested upon issuance and has an exercise price of $0.30 per share.
In June 2008 we agreed to issue and have since issued 100,000 shares of common stock (10,000 shares upon giving effect to the anticipated 10-for-1 reverse stock split) to Gemini Strategies, LLC in connection with consulting services related to establishing an environmental based carbon credit program pursuant to exemption from registration under Section 4(2) of the Securities Act. The fair value of the equity instruments issued for these services is approximately $51,000.
In April 2008 we issued a warrant to purchase 3,000,000 shares of Common Stock (300,000 shares upon giving effect to the anticipated 10-for-1 reverse stock split) to Mr. Tangredi in recognition for Mr. Tangredi’s achievement of the following goals: negotiating conversion of the convertible notes issued in the Additional Financing, securing a release with respect to the consulting agreement with Gray Capital Partners, Inc. and securing and closing upon the Financing. The fair value of the warrant issued is approximately $687,000.
In February 2008 we issued 140,000 shares of common stock (14,000 shares upon giving effect to the anticipated 10-for-1 reverse stock split) and warrants to purchase an additional 140,000 shares (14,000 shares upon giving effect to the anticipated 10-for-1 reverse stock split) to Richardson & Patel LLP, our legal counsel, in connection with performance of legal services pursuant to exemption from registration under Section 4(2) of the Securities Act. The fair value of the equity instruments issued for these services is approximately $59,000. On August 7, 2008 we issued an additional 252,308 shares of common stock (25,231 shares upon giving effect to the anticipated 10-for-1 reverse stock split) and warrants to purchase an additional 252,308 shares (25,231 shares upon giving effect to the anticipated 10-for-1 reverse stock split) to Richardson & Patel LLP in connection with performance of legal services pursuant to exemption from registration under Section 4(2) of the Securities Act. The fair value of the equity instruments issued for these services is approximately $136,000.
In January 2008 we closed on an aggregate of $2,950,000 in gross proceeds from the private sale to 21 accredited investors of 9% secured convertible notes and warrants to purchase 14,750,000 shares of our common stock (1,475,000 shares upon giving effect to the anticipated 10-for-1 reverse stock split).stock. Pursuant to the terms of this financing we granted the investors a security interest in certain of our assets. We entered into an agreement with placement agent, Legend Merchant Group, Inc. on October 5, 2007 pursuant to which, Legend Merchant Group, Inc. received a cash commission equal to 8% of the gross proceeds raised by Legend Merchant (and its subagent), which totaled $2,800,000, plus a warrant equal to 10% of the number of shares of common stock underlying the warrants issued to convertible note holders, or 1,400,000 (140,000 shares upon giving effect to the anticipated 10-for-1 reverse stock split).1,400,000. The issuance of these securities was exempt from registration under Section 4(2) and Regulation D of the Securities Act. The Company made this determination based on the representations of the investors, which included, in pertinent part, that such investors were either (a) “accredited investors” within the meaning of Rule 501 of Regulation D promulgated under the Securities Act or (b) had a preexisting or personal relationship with the Company. Each investor further represented that he or she was acquiring our common stock for investment purposes not with a view to the resale or distribution thereof and understood that the shares of our common stock may not be sold or otherwise disposed of without registration under the Securities Act or an applicable exemption there from. A legend was included on all offering materials and documents which stated that the shares have not been registered under the Securities Act and may not be offered or sold unless the shares are registered under the Securities Act, or an exemption from the registration requirements of the Securities Act is available.
II-9
In January 2008, we issued 439,293 shares of common stock and warrants to purchase 50,000 additional shares (5,000 shares upon giving effect to the anticipated 10-for-1 reverse stock split) of common stock to the Robb Charitable Trust pursuant to exemption from registration under Section 4(2) and Regulation D of the Securities Act. The 439,293 shares of common stock (43,929 shares upon giving effect to the anticipated 10-for-1 reverse stock split) were issued in connection with an amendment to a prior note pursuant to which one half of the principal and interest was payable in cash and one half of the principal and interest was payable in common stock. The aggregate value of principal and interest relating to the conversion was $108,540. The warrant was issued pursuant to the terms of the original note. The warrants have a five-year term and anti-dilution protection for stock dividends or splits, mergers, consolidation, reclassification, capital reorganization or a sale of substantially all of the Company’s assets. The exercise price is $0.55 per share of common stock and the warrants do not provide for cashless exercise. These warrants are exercisable as follows: (a) one third of the total number of warrant shares on or after the six month anniversary of the issuance date, (b) an additional one third of the total number of warrant shares on or after the one year anniversary of the issuance date, and (c) in full commencing on or after the 18 month anniversary of the issuance date. If the per share market value of the Company’s common stock is $1.50 per share or greater for ten consecutive trading days (subject to adjustment to reflect stock splits, stock dividends, recapitalizations and the like), the Company may require the holder to exercise the warrant and purchase all warrant shares within ten business days of the Company issuing notice to the holder or the warrant will automatically terminate. The warrants do not contain any redemption features.
Item 16. Exhibits.
No. | Exhibit | |
| 3.1 | Certificate of Incorporation of The Dais Corporation filed April 8, 1993 (Incorporated by reference to Exhibit 3.1 to Registration Statement on Form S-1 (File No. 333-152940), as filed August 11, 2008) | |
| 3.2 | Certificate of Amendment of the Certificate of Incorporation of The Dais Corporation filed February 21, 1997 (Incorporated by reference to Exhibit 3.2 to Registration Statement on Form S-1 (File No. 333-152940), as filed August 11, 2008) | |
| 3.3 | Certificate of Amendment of the Certificate of Incorporation of The Dais Corporation filed June 25, 1998 (Incorporated by reference to Exhibit 3.3 to Registration Statement on Form S-1 (File No. 333-152940), as filed August 11, 2008) | |
| 3.4 | Certificate of Amendment of the Certificate of Incorporation of Dais Analytic Corporation filed December 13, 1999 (Incorporated by reference to Exhibit 3.4 to Registration Statement on Form S-1 (File No. 333-152940), as filed August 11, 2008) | |
| 3.5 | Certificate of Amendment of the Certificate of Incorporation of Dais Analytic Corporation filed September 26, 2000 (Incorporated by reference to Exhibit 3.5 to Registration Statement on Form S-1 (File No. 333-152940), as filed August 11, 2008) | |
| 3.6 | Certificate of Amendment of the Certificate of Incorporation of Dais Analytic Corporation filed September 28, 2000 (Incorporated by reference to Exhibit 3.6 to Registration Statement on Form S-1 (File No. 333-152940), as filed August 11, 2008) | |
| 3.7 | Certificate of Amendment of the Certificate of Incorporation of Dais Analytic Corporation filed August 28, 2007 (Incorporated by reference to Exhibit 3.7 to Registration Statement on Form S-1 (File No. 333-152940), as filed August 11, 2008) | |
| 3.8 | Certificate of Amendment of the Certificate of Incorporation of Dais Analytic Corporation filed March 20, 2008 (Incorporated by reference to Exhibit 3.8 to Registration Statement on Form S-1 (File No. 333-152940), as filed August 11, 2008) |
II-10
| 3.9 | Bylaws of The Dais Corporation (Incorporated by reference to Exhibit 3.9 to Registration Statement on Form S-1 (File No. 333-152940), as filed August 11, 2008) | |
| 3.10 | Certificate of Amendment of the Certificate of Incorporation of Dais Analytic Corporation filed December 17, 2009 (Incorporated by reference to the exhibits included with the Definitive Proxy Statement Form DEF 14A as filed on October 9, 2009) | |
| 3.11 | Form of Certificate of Amendment of the Certificate of Incorporation of Dais Analytic Corporation (Incorporated by reference to the exhibits included with the Definitive Proxy Statement Form DEF 14A as filed on October 27, 2010) | |
| 4.1 | Form of Non-Qualified Stock Option Agreement (Incorporated by reference to Exhibit 4.1 to Registration Statement on Form S-1 (File No. 333-152940), as filed August 11, 2008) | |
| 4.2 | Form of Non-Qualified Option Agreement (Incorporated by reference to Exhibit 4.2 to Registration Statement on Form S-1 (File No. 333-152940), as filed August 11, 2008) | |
| 4.3 | Form of Warrant (Daily Financing) (Incorporated by reference to Exhibit 4.3 to Registration Statement on Form S-1 (File No. 333-152940), as filed August 11, 2008) | |
| 4.4 | Form of Warrant (Financing) (Incorporated by reference to Exhibit 4.4 to Registration Statement on Form S-1 (File No. 333-152940), as filed August 11, 2008) | |
| 4.5 | Form of Warrant (Robb Trust Note and Additional Financing) (Incorporated by reference to Exhibit 4.5 to Registration Statement on Form S-1 (File No. 333-152940), as filed August 11, 2008) | |
| 4.6 | Form of Placement Agent Warrant (Financing) (Incorporated by reference to Exhibit 4.6 to Registration Statement on Form S-1 (File No. 333-152940), as filed August 11, 2008) | |
| 4.7 | Form of 9% Secured Convertible Note (Financing) (Incorporated by reference to Exhibit 4.7 to Registration Statement on Form S-1 (File No. 333-152940), as filed August 11, 2008) | |
| 4.8 | Form of Note (Robb Trust Note) (Incorporated by reference to Exhibit 4.8 to Registration Statement on Form S-1 (File No. 333-152940), as filed August 11, 2008) | |
| 4.9 | Form of Amendment to Note (Robb Trust Note) (Incorporated by reference to Exhibit 4.9 to Registration Statement on Form S-1 (File No. 333-152940), as filed August 11, 2008) | |
| 4.10 | Form of Warrant (Note Conversion) (Incorporated by reference to the Exhibits 4.1 included with the Current Report on Form 8-K, as filed March 13, 2009) | |
| 4.11 | Form of Warrant (2009 Purchases) (Incorporated by reference to the Exhibits 4.2 included with the Current Report on Form 8-K, as filed March 13, 2009) | |
| 4.12 | Unsecured Promissory Note from Gostomski, dated December 8, 2009 (Incorporated by reference to the exhibits included with the Annual Report on Form 10K as filed on March 30, 2010) | |
| 4.13 | Unsecured Promissory Note from Platinum-Montaur, dated December 17, 2009 (Incorporated by reference to the exhibits included with the Current Report on Form 8-K/A as filed on December 22, 2009) | |
| 4.14 | Unsecured Promissory Note from Samuels, dated February 19, 2010 (Incorporated by reference to the exhibits included with the Current Report on Form 8-K as filed on February 23, 2010) |
II-11
| 4.15 | Unsecured Promissory Note from RBC Capital Markets - Custodian for Leonard Samuels IRA, dated February 19, 2010. (Incorporated by reference to the exhibits included with the Current Report on Form 8-K as filed on February 23, 2010) | |
| 4.16 | First Amendment to Unsecured Promissory Note from Platinum-Montaur, dated June 28, 2010 (Incorporated by reference to exhibits included in Quarterly Report on Form 10Q as filed August 16, 2010) | |
| 4.17 | First Amendment to Unsecured Promissory Note from Samuels, dated June 28, 2010 (Incorporated by reference to exhibits included in Quarterly Report on Form 10Q as filed August 16, 2010) | |
| 4.18 | First Amendment to Unsecured Promissory Note from RBC Capital Markets- Custodian for Leonard Samuels IRA, dated June 28, 2010 (Incorporated by reference to exhibits included in Quarterly Report on Form 10Q as filed August 16, 2010) | |
| 4.19 | Second Amendment to Unsecured Promissory Note from Platinum-Montaur, dated September 30, 2010 (Incorporated by reference to exhibits included in Quarterly Report on Form 10Q as filed November 15, 2010) | |
| 4.20 | Second Amendment to Unsecured Promissory Note from Samuels, dated September 30, 2010 (Incorporated by reference to exhibits included in Quarterly Report on Form 10Q as filed November 15, 2010) | |
| 4.21 | Second Amendment to Unsecured Promissory Note from RBC Capital Markets- Custodian for Leonard Samuels IRA, dated September 30, 2010 (Incorporated by reference to exhibits included in Quarterly Report on Form 10Q as filed November 15, 2010) | |
| 4.22 | Third Amendment to Unsecured Promissory Note from Platinum-Montaur, dated December 29, 2010 (Incorporated by reference Exhibit 4.22 to Registration Statement on Form S-1 (File No. 333-172259), as filed February 14, 2011) | |
| 4.23 | Third Amendment to Unsecured Promissory Note from RBC Capital Markets- Custodian for Leonard Samuels IRA, dated December 31, 2010 (Incorporated by reference Exhibit 4.23 to Registration Statement on Form S-1 (File No. 333-172259), as filed February 14, 2011) | |
| 4.24 | Form of Non-Qualified Stock Option Agreement – 2009 Long-Term Incentive 2009 Plan – Directors and certain designated employees (Incorporated by reference Exhibit 4.24 to Registration Statement on Form S-1 (File No. 333-172259), as filed February 14, 2011) | |
| 4.25 | Form of Non-Qualified Option Agreement -2009 Long-Term Incentive 2009 Plan – employees (Incorporated by reference Exhibit 4.25 to Registration Statement on Form S-1 (File No. 333-172259), as filed February 14, 2011) | |
| 4.26 | ||
| Amended and Restated Convertible Promissory Note by and between Dais Analytic Corporation and Platinum-Montaur Life Sciences, LLC dated March 22, 2011 (Incorporated by reference to Exhibit 10.2 to Current Report on Form 8-K, as filed March 28, 2011) | ||
| Form of Warrant by and between Dais Analytic Corporation and Investors dated 2007 and 2008. (Incorporated by reference to Exhibit 10.3 to Current Report on Form 8-K, as filed March 28, 2011) | ||
| Amendment to 2007 Warrant by and between Dais Analytic Corporation and Platinum-Montaur Life Sciences, LLC dated March 22, 2011 (Incorporated by reference to Exhibit 10.4 to Current Report on Form 8-K, as filed March 28, 2011) |
II-12
| Amendment to 2009 Warrant by and between Dais Analytic and Platinum-Montaur Life Sciences, LLC dated March 22, 2011 (Incorporated by reference to Exhibit 10.5 to Current Report on Form 8-K, as filed March 28, 2011) | ||
| Stock Purchase Warrant by and between Dais Analytic Corporation and Platinum-Montaur Life Sciences, LLC dated March 22, 2011 (Incorporated by reference to Exhibit 10.6 to Current Report on Form 8-K, as filed March 28, 2011) | ||
| Secured Convertible Promissory Note by and between Dais Analytic and Platinum-Montaur Life Sciences, LLC dated March 22, 2011 (Incorporated by reference to Exhibit 10.8 to Current Report on Form 8-K, as filed March 28, 2011) | ||
| Stock Purchase Warrant by and between Dais Analytic Corporation and Platinum-Montaur Life Sciences, LLC dated March 22, 2011 (Incorporated by reference to Exhibit 10.9 to Current Report on Form 8-K, as filed March 28, 2011) | ||
| Fourth Amendment to Unsecured Promissory Note from Platinum-Montaur, dated February 28, 2011 (Incorporated by reference to Exhibit 4.26 to Annual Report on Form 10-K, as filed March 31, 2011) | ||
| Fourth Amendment to Unsecured Promissory Note from RBC Capital Markets – Custodian for Leonard Samuels IRA, dated February 28, 2011 (Incorporation by reference to Exhibit 4.27 to Annual Report on Form 10-K, as filed March 31, 2011) | ||
| Fifth Amendment to Unsecured Promissory Note from RBC Capital Markets – Custodian for Leonard Samuels IRA, dated April 29, 2011 (Incorporation by reference to Exhibit 4.36 to Quarterly Report on Form 10-Q, as filed May 16, 2011) | ||
| Amendment to 2007 Warrant by and between Dais Analytic Corporation and RBC Capital Markets- Custodian for Leonard Samuels IRA dated May 12, 2011 (Incorporation by reference to Exhibit 4.37 to Quarterly Report on Form 10-Q, as filed May 16, 2011) | ||
| Amendment to 2009 Warrant by and between Dais Analytic Corporation and RBC Capital Markets- Custodian for Leonard Samuels IRA dated May 12, 2011 (Incorporation by reference to Exhibit 4.38 to Quarterly Report on Form 10-Q, as filed May 16, 2011) |
II-13
| Stock Purchase Warrant by and between Dais Analytic Corporation and RBC Capital Markets- Custodian for Leonard Samuels IRA dated May 12, 2011(Incorporation by reference to Exhibit 4.39 to Quarterly Report on Form 10-Q, as filed May 16, 2011) | ||
| Stock and Warrant Purchase Agreement dated May 12, 2011 (Incorporation by reference to Exhibit 4.40 to Quarterly Report on Form 10-Q, as filed May 16, 2011) | ||
| 5.1 | Legal Opinion of Richardson & Patel LLP * | |
| 10.1 | 2000 Equity Compensation Plan (Incorporated by reference to Exhibit 10.1 to Registration Statement on Form S-1 (File No. 333-152940), as filed August 11, 2008) | |
| 10.2 | Form of Employee Non-Disclosure and Non-Compete Agreement (Incorporated by reference to Exhibit 10.2 to Registration Statement on Form S-1 (File No. 333-152940), as filed August 11, 2008) | |
| 10.3 | Amended and Restated Employment Agreement between Dais Analytic Corporation and Timothy N. Tangredi dated July 29, 2008 (Incorporated by reference to Exhibit 10.3 to Registration Statement on Form S-1 (File No. 333-152940), as filed August 11, 2008) |
II-14
| 10.4 | Amended and Restated Employment Agreement between Dais Analytic Corporation and Patricia K. Tangredi dated July 29, 2008 (Incorporated by reference to Exhibit 10.4 to Registration Statement on Form S-1 (File No. 333-152940), as filed August 11, 2008) | |
| 10.5 | Commercial Lease Agreement between Ethos Business Venture LLC and Dais Analytic Corporation dated March 18, 2005 (Incorporated by reference to Exhibit 10.6 to Registration Statement on Form S-1 (File No. 333-152940), as filed August 11, 2008) | |
| 10.6 | First Amendment of Lease Agreement between Ethos Business Venture LLC and Dais Analytic Corporation dated November 15, 2005 (Incorporated by reference to Exhibit 10.7 to Registration Statement on Form S-1 (File No. 333- 152940), as filed August 11, 2008) | |
| 10.7 | Form of Subscription Agreement (Daily Financing) (Incorporated by reference to Exhibit 10.8 to Registration Statement on Form S-1 (File No. 333-152940), as filed August 11, 2008) | |
| 10.8 | Form of Subscription Agreement (Financing) (Incorporated by reference to Exhibit 10.9 to Registration Statement on Form S-1 (File No. 333-152940), as filed August 11, 2008) | |
| 10.9 | Form of Registration Rights Agreement (Financing) (Incorporated by reference to Exhibit 10.10 to Registration Statement on Form S-1 (File No. 333-152940), as filed August 11, 2008) | |
| 10.10 | Form of Secured Patent Agreement (Financing) (Incorporated by reference to Exhibit 10.11 to Registration Statement on Form S-1 (File No. 333-152940), as filed August 11, 2008) | |
| 10.11 | Placement Agent Agreement between Dais Analytic Corporation and Legend Merchant Group, Inc., dated October 5, 2007 (Incorporated by reference to Exhibit 10.12 to Registration Statement on Form S-1 (File No. 333-152940), as filed August 11, 2008) | |
| 10.12 | Consulting Agreement between Dais Analytic Corporation and Harold Mandelbaum dated August 12, 2009 (Incorporated by reference to Exhibit 10.12 to Quarterly Report on Form 10-Q, as filed August 14, 2009) | |
| 10.13 | Exclusive Distribution Agreement, dated August 21, 2009 between the Company and Genertec America, Inc. (Incorporated by reference to Exhibit 10.1 to the Company’s Current Report on Form 8-K filed on August 27, 2009) | |
| 10.14 | Employee Non-Disclosure and Non-Compete Agreement entered into between Judith Norstrud and Dais Analytic Corporation on October 15, 2009 (Incorporated by reference to the exhibits included with the Current Report on Form 8-K, as filed October 16, 2009). | |
| 10.15 | 2009 Long Term Incentive Plan (Incorporated by reference to the exhibits included with the Definitive Proxy Statement Form DEF14A as filed on October 9, 2009). | |
| 10.16 | Technical and Sales Agreement between Dais Analytic Corporation, Beijing Jiexun-CAST Systems Control Technology Co., Ltd. and Genertec America, Inc. dated April 8, 2010, incorporated by reference to the exhibits included with the Current Report on Form 8-K, as filed on April 9, 2010. | |
| 10.17 | Amended and Restated Employment Agreement between Dais Analytic Corporation and Timothy N. Tangredi dated April 11, 2011(Incorporated by reference to exhibit 10.17 to Amendment 1 to Pre-Effective Registration Statement on Form S-1, as filed April 13, 2011). |
II-15
| 10.18 | Amended and Restated Employment Agreement between Dais Analytic Corporation and Patricia K. Tangredi dated April 8, 2011. (Incorporated by reference to exhibit 10.18 to Amendment 1 to Pre-Effective Registration Statement on Form S-1, as filed April 13, 2011). | |
| 10.19 | Securities Amendment and Exchange Agreement by and between the Dais Analytic Corporation and Platinum-Montaur Life Sciences, LLC dated as of March 22, 2011. (Incorporated by reference to Exhibit 10.1 to Current Report on Form 8-K, as filed March 28, 2011). | |
| 10.20 | Note and Warrant Purchase Agreement by and between Dais Analytic Corporation and Platinum-Montaur Life Sciences, LLC dated March 22, 2011. (Incorporated by reference to Exhibit 10.7 to Current Report on Form | |
| 10.21 | Patent Security Agreement by and between Dais Analytic Corporation and Platinum-Montaur Life Sciences, LLC dated March 22, 2011. (Incorporated by reference to Exhibit 10.10 to Current Report on Form | |
| 10.22 | Second Amendment of Lease Agreement between Ethos Business Venture LLC and Dais Analytic Corporation dated May 23, 2011. (Incorporated by reference to Registrant's Registration Statement on Form S-1/A filed on May 26, 2011) | |
| 10.23 | Amended and Restated Employment Agreement between Dais Analytic Corporation and Timothy N. Tangredi dated May 23, 2001. (Incorporated by reference to Registrant's Registration Statement on Form S-1/A filed on May 26, 2011) | |
| 10.24 | Employment Agreement between Dais Analytic Corporation and Scott G. Ehrenberg dated May 24, 2011. (Incorporated by reference to Registrant's Registration Statement on Form S-1/A filed on May 26, 2011) | |
| 10.25 | Executive Compensation Agreement dated June 17, 2011 between Dais Analytic Corporation and Timothy Tangredi. (Incorporated by reference to Registrant's Registration Statement on Form S-1/A filed on June 22, 2011) | |
| 10.26 | Executive Compensation Agreement dated September 14, 2011 between Dais Analytic Corporation and Timothy N. | |
| 10.27 | Amended and Restated Employment Agreement between Dais Analytic Corporation and Timothy Tangredi dated September 14, 2011 (Incorporated by reference to Exhibit 10.1 to Current Report on Form 8-K as filed September 15, 2011) | |
| 10.28 | Executive Compensation Agreement dated January 11, 2012 between Dais Analytic Corporation and Timothy Tangredi (Incorporated by reference to Exhibit 10.48 to Registration Statement on Form S-1/A, filed January 13, 2012) | |
| 14.1 | Code of Ethics (Incorporated by reference to Exhibit 14.1 to Annual Report on Form 10-K, as filed March 31, 2009) | |
| 16.1 | Letter from Pender Newkirk & Company LLP, Certified Public Accountants, dated April 27, 2009 (Incorporated by reference to Exhibit 16.1 to Form 8-K, as filed April 28, 2009) | |
| 23.1 | Consent of Cross, Fernandez & Riley LLP, Certified Public |
II-16
| 23.2 | Consent of Richardson & Patel LLP. (contained in the opinion filed as Exhibit 5.1) | |
| 24.1 | Power of Attorney. (Incorporated by reference to signature page of Registration Statement on Form S-1) | |
| 99.1 | Consent of |
_________________
| * | ||
| Portions of this exhibit have been omitted pursuant to a request for confidential treatment. |
Item 17. Undertakings.
(a) The undersigned registrant hereby undertakes to:
(1) File, during any period in which offers or sales are being made, a post-effective amendment to this registration statement to:
i. Include any prospectus required by Section 10(a)(3) of the Securities Act of 1933, as amended (the “Securities Act”);
ii. Reflect in the prospectus any facts or events arising after the effective date of the registration statement (or the most recent post-effective amendment thereof) which, individually or in the aggregate, represent a fundamental change in the information in the registration statement. Notwithstanding the foregoing, any increase or decrease in volume of securities offered (if the total dollar value of securities offered would not exceed that which was registered) and any deviation from the low or high end of the estimated maximum offering range may be reflected in the form of prospectus filed with the Securities and Exchange Commission (the “Commission”) pursuant to Rule 424(b) if, in the aggregate, the changes in volume and price represent no more than 20 percent change in the maximum aggregate offering price set forth in the “Calculation of Registration Fee” table in the effective registration statement.
iii. Include any additional or changed material information on the plan of distribution.
(2) For determining liability under the Securities Act, each such post-effective amendment as a new registration statement relating to the securities offered, and the offering of such securities at that time shall be deemed to be the initial bona fide offering.
(3) File a post-effective amendment to remove from registration by means of a post-effective amendment any of the securities that remain unsold at the end of the offering.
(4) For determining liability of the undersigned under the Securities Act to any purchaser in the initial distribution of the securities, the undersigned undertakes that in a primary offering of securities of the undersigned pursuant to this registration statement, regardless of the underwriting method used to sell the securities to the purchaser, if the securities are offered or sold to such purchaser by means of any of the following communications, the undersigned will be a seller to the purchaser and will be considered to offer or sell such securities to such purchaser:
i. Any preliminary prospectus or prospectus of the undersigned relating to the offering required to be filed pursuant to Rule 424;
II-17
ii. Any free writing prospectus relating to the offering prepared by or on behalf of the undersigned or used or referred to by the undersigned;
iii. The portion of any other free writing prospectus relating to the offering containing material information about the undersigned or its securities provided by or on behalf of the undersigned; and
iv. Any other communication that is an offer in the offering made by the undersigned to the purchaser.
(b) Provide to the underwriterspurchasers at the closing, specified in the underwriting agreements, certificates in such denominations and registered in such names as required by the underwriters to permit prompt delivery to each purchaser.
(c) Insofar as indemnification for liabilities arising under the Securities Act may be permitted to directors, officers and controlling persons of the undersigned pursuant to the foregoing provisions, or otherwise, the undersigned has been advised that in the opinion of the Commission such indemnification is against public policy as expressed in the Securities Act and is, therefore, unenforceable. In the event that a claim for indemnification against such liabilities (other than the payment by the undersigned of expenses incurred or paid by a director, officer or controlling person of the undersigned in the successful defense of any action, suit or proceeding) is asserted by such director, officer or controlling person in connection with the securities being registered, the undersigned will, unless in the opinion of its counsel the matter has been settled by controlling precedent, submit to a court of appropriate jurisdiction the question whether such indemnification by it is against public policy as expressed in the Securities Act and will be governed by the final adjudication of such issue.
(d)
(1) For determining any liability under the Securities Act, treat the information omitted from the form of prospectus filed as part of this registration statement in reliance upon Rule 430A and contained in a form of prospectus filed by the undersigned under Rule 424(b)(1), or (4), or 497(h) under the Securities Act as part of this registration statement as of the time the Commission declared it effective.
(2) For the purpose of determining any liability under the Securities Act of 1933, each post-effective amendment that contains a form of prospectus shall be deemed to be a new registration statement relating to the securities offered therein, and the offering of such securities at that time shall be deemed to be the initial bona fide offering thereof.
(3) For determining any liability under the Securities Act, treat each post-effective amendment that contains a form of prospectus as a new registration statement for the securities offered in the registration statement, and that offering of the securities at that time as the initial bona fide offering of those securities.
(e) If the Company is subject to Rule 430C, each prospectus filed pursuant to Rule 424(b) as part of this registration statement relating, other than registration statements relying on Rule 430B or other than prospectuses filed in reliance on Rule 430A, shall be deemed to be part of and included in this registration statement as of the date it is first used after effectiveness. Provided, however, that no statement made in this registration statement or prospectus that is part of this registration statement or made in a document incorporated or deemed incorporated by reference into this registration statement or prospectus that is part of this registration statement will, as to a purchaser with a time of contract of sale prior to such first use, supersede or modify any statement that was made in this registration statement or prospectus that was part of this registration statement or made in any such document immediately prior to such date of first use.
II-18
SIGNATURES
Pursuant to the requirements of the Securities Act of 1933, the Registrant has duly caused this registration statement to be signed on behalf of the undersigned, thereunto duly authorized, in the City of Odessa, State of Florida on September 19, 2011.February 8 , 2012.
| DAIS ANALYTIC CORPORATION, | |||
| a New York corporation | |||
| By: | /S/ TIMOTHY N. TANGREDI | ||
| Timothy N. Tangredi, | |||
| Chief Executive Officer, President & Chairman | |||
| (Principal Executive Officer) | |||
Each person whose signature appears below constitutes and appoints Mr. Timothy Tangredi or Judith Norstrud as his or her true and lawful attorneys-in-fact and agents, each acting alone, with full power of substitution and resubstitution, for him or her and in his or her name, place and stead, in any and all capacities, to sign any or all amendments (including post-effective amendments) to the Registration Statement, and to sign any registration statement for the same offering covered by this Registration Statement that is to be effective upon filing pursuant to Rule 462(b) under the Securities Act of 1933, as amended, and all post-effective amendments thereto, and to file the same, with all exhibits thereto, and all documents in connection therewith, with the Securities and Exchange Commission, granting unto said attorneys-in-fact and agents, full power and authority to do and perform each and every act and thing requisite and necessary to be done in and about the premises, as fully to all intents and purposes as he might or could do in person, hereby ratifying and confirming all that said attorneys-in-fact and agents, each acting alone, or his substitute or substitutes, may lawfully do or cause to be done by virtue hereof.
Pursuant to the requirements of the Securities Act of 1933, this Registration Statement has been signed by the following persons in the capacities with Dais Analytic Corporation and on the dates indicated.
| Dated: | By: | /S/ TIMOTHY N. TANGREDI | |
| Timothy N. Tangredi, Chief Executive Officer, President and Chairman | |||
| (Principal Executive Officer) | |||
| Dated: | By: | /S/ JUDITH C. NORSTRUD | |
| Judith C. Norstrud, Chief Financial Officer and Treasurer | |||
| (Principal Financial Officer and Accounting Officer) | |||
| Dated: | By: | /S/ ROBERT W. SCHWARTZ | |
| Robert W. Schwartz, Director | |||
| Dated: | By: | /S/ RAYMOND KAZYAKA SR. | |
| Raymond Kazyaka Sr., Director |
II-19