


As filed with the Securities and Exchange Commission on March 15, 2021.
Registration No. 333-252541
UNITED STATES
SECURITIES AND EXCHANGE COMMISSION
Washington, D.C. 20549
FORM S-1S-1/A
Amendment No. 1
REGISTRATION STATEMENT UNDER THE SECURITIES ACT OF 1933
DSG GLOBAL INC.
(Exact name of registrant as specified in its charter)
| Nevada | 7373 | 26-1134956 | ||
(State of Incorporation) | (Primary Standard Industrial Classification Number) | (IRS Employer Identification Number) |
312207 – 263015272 Croydon Drive,
Surrey British Columbia,BC, V3Z 6T3, Canada0Z5, Canada.
(604) 575-3848
(Address, including zip code, and telephone number, including area code,
of registrant’s principal executive offices)
Please send copies of all communications to:
BRUNSON CHANDLER & JONES, PLLC
175 South Main Street, Suite 1410
Salt Lake City, Utah 84111
801-303-5772
chase@bcjlaw.com
(Address, including zip code, and telephone, including area code)
Approximate date of proposed sale to the public:From time to time after the effective date of this registration statement.
If any of the securities being registered on this Form are to be offered on a delayed or continuous basis pursuant to Rule 415 under the Securities Act of 1933, check the following box. [X]
If this Form is filed to register additional securities for an offering pursuant to Rule 462(b) under the Securities Act, please check the following box and list the Securities Act registration statement number of the earlier effective registration statement for the same offering. [ ]
If this Form is a post-effective amendment filed pursuant to rule 462(c) under the Securities Act, check the following box and list the Securities Act registration statement number of the earlier effective registration statement for the same offering. [ ]
If this Form is a post-effective amendment filed pursuant to Rule 462(d) under the Securities Act, check the following box and list the Securities Act registration statement number of the earlier effective registration statement for the same offering. [ ]
Indicate by check mark whether the registrant is a large accelerated filer, an accelerated filer, a non-accelerated filer, or a smaller reporting company. See definitions of “large accelerated filer,” “accelerated filer” and “smaller reporting company” in Rule 12b-2 of the Exchange Act. (Check one):
| Large accelerated filer | [ ] | Accelerated filer | [ ] | ||
| Non-accelerated filer | [ ] | Smaller reporting company | [X] | ||
| (do not check if a smaller reporting company) | Emerging Growth Company | [ ] | |||
CALCULATION OF REGISTRATION FEE
Title of Each Class of securities to be registered | Amount of common stock to | Proposed Maximum Offering Price Per Share (2) | Proposed Maximum Aggregate Offering Price | Amount of Registration Fee (3) | Amount of common stock to | Proposed Maximum Offering Price Per Share (2) | Proposed Maximum Aggregate Offering Price | Amount of Registration Fee (3) | ||||||||||||||||||||||||
| Common Stock | 230,000 | $ | 1.08 | $ | 248,400 | $ | 32.24 | |||||||||||||||||||||||||
| Common Stock, par value $0.001 | 7,000,000 | $ | 0.63 | $ | 4,410,000 | $ | 481.13 | |||||||||||||||||||||||||
| Common Stock, par value $0.001 (4) | 3,000,000 | $ | 0.50 | $ | 1,500,000 | $ | 163.65 | |||||||||||||||||||||||||
| (1) | In accordance with Rule 416(a), this registration statement shall also cover an indeterminate number of shares that may be issued and resold resulting from stock splits, stock dividends or similar transactions. |
| (2) | Based on the lowest traded price of the Company’s common stock during the |
(3) | The fee is calculated by multiplying the aggregate offering amount by |
| (4) | Issuable upon exercise of warrants |
We hereby amend this registration statement on such date or dates as may be necessary to delay our effective date until the registrant shall file a further amendment which specifically states that this registration statement shall, thereafter, become effective in accordance with Section 8(a) of the Securities Act of 1933, or until the registration statement shall become effective on such date as the Commission, acting pursuant to Section 8(a) may determine.
PRELIMINARY PROSPECTUS SUBJECT TO COMPLETION DATED OCTOBERMARCH ____, 20192021
The information in this prospectus is not complete and may be changed. These securities may not be sold until the registration statement filed with the Securities and Exchange Commission is effective. This preliminary prospectus is not an offer to sell these securities and is not soliciting an offer to buy these securities in any state where the offer or sale is not permitted.
DSG Global Inc.
230,00010,000,000 Shares of Common SharesStock
The selling stockholderSelling Stockholder identified in this prospectus may offer an indeterminate number ofand sell up to 10,000,000 shares of its common stock, which will consist of up to 230,0003,000,000 shares of common stock issuable upon exercise of outstanding warrants to be soldpurchase shares of common stock (the “Warrants”) and up to 7,000,000 shares of common stock upon conversion of 3,000 shares of Series F Preferred Stock of the Company (the “Preferred Stock”), in each case as issued by us to GHS Investments LLC (“GHS” or the “Selling Stockholder”) pursuant to an Equity Financinga Securities Purchase Agreement (the “Financing“Securities Purchase Agreement”) dated September 18, 2019.December 23, 2020. If issued presently, the 230,00010,000,000 of common stock registered for resale by GHS would represent 20.26%8.59% of our issued and outstanding shares of common stock as of October 3, 2019.March 4, 2021.
The selling stockholderSelling Stockholder may sell all or a portion of the shares being offered pursuant to this prospectus at fixed prices and prevailing market prices at the time of sale, at varying prices, or at negotiated prices. The timing and amount of any sale are within the sole discretion of the Selling Stockholder. Our registration of the shares of common stock covered by this prospectus does not mean that the Selling Stockholder will offer or sell any of the shares. For further information regarding the possible methods by which the shares may be distributed, see “Plan of Distribution” of this prospectus.
We received proceeds from our sale of the Preferred Stock to GHS pursuant to the Securities Purchase Agreement. We have sold 3,000 shares of Preferred Stock to GHS at a price equal to $1,000 per share. Each share of Preferred Stock is convertible at the stated value of $1,200 per share divided by the market price, which is defined as the lowest traded price of the Company’s common stock during the fifteen (15) consecutive trading day period immediately prior to a conversion. Upon conversion of the Preferred Stock, we will not receive any proceeds from the sale of the shares of our common stock by GHS. However, weWe will receive a maximum of an additional $1,500,000 from GHS if and when they elect to exercise the Warrants. As we are unable to predict the timing or amount of any such exercise, we currently intend to use such proceeds, from our initial sale of sharesif any, for general corporate purposes and working capital. The Selling Stockholder is not obligated to GHS pursuant toexercise the Financing Agreement. We will sell shares to GHS at a price equal to 82%Warrants, and we cannot predict whether or when, if ever, the Selling Stockholder of the lowest trading price of our common stock duringWarrants will choose to exercise the ten (10) consecutive trading day period preceding on the date on which we deliver a put notice to GHS (the “Market Price”).Warrants, in whole or in part.
In addition, the Preferred Stock and Warrants are subject to a beneficial ownership limitation for GHS is an underwriter withinof 4.99% (in the meaningaggregate) of all outstanding common shares of the Securities Act of 1933, and any broker-dealers or agents that are involved in selling the shares may be deemed to be “underwriters” within the meaning of the Securities Act of 1933 in connection with such sales. In such event, any commissions received by such broker-dealers or agents and any profit on the resale of the shares purchased by them may be deemed to be underwriting commissions or discounts under the Securities Act of 1933.Company.
Our common stock is traded on OTC Markets under the symbol “DSGT”. On October 2, 2019,March 4, 2021, the last reported sale price for our common stock was $1.56$0.531 per share.
Prior to this offering, there has been a very limited market for our securities. While our common stock is on the OTC Markets, there has been negligible trading volume. There is no guarantee that an active trading market will develop in our securities.
This offering is highly speculative, and these securities involve a high degree of risk and should be considered only by persons who can afford the loss of their entire investment. See “Risk Factors” beginning on page 18.23. Neither the Securities and Exchange Commission nor any state securities commission has approved or disapproved of these securities or passed upon the accuracy or adequacy of this prospectus. Any representation to the contrary is a criminal offense.
The date of this prospectus is ________________, 2019.2021.
| 2 |
Table of Contents
The following table of contents has been designed to help you find information contained in this prospectus. We encourage you to read the entire prospectus.
| 3 |
We have not authorized any person to give you any supplemental information or to make any representations for us. You should not rely upon any information about our company that is not contained in this prospectus. Information contained in this prospectus may become stale. You should not assume the information contained in this prospectus or any prospectus supplement is accurate as of any date other than their respective dates, regardless of the time of delivery of this prospectus, any prospectus supplement or of any sale of the shares. Our business, financial condition, results of operations, and prospects may have changed since those dates. The selling stockholders areSelling Stockholder is offering to sell and seeking offers to buy shares of our common stock only in jurisdictions where offers and sales are permitted.
In this prospectus, “DSG Global”, “DSG,” the “Company,” “we,” “us,” and “our” refer to DSG Global Inc., a Nevada corporation.
Item 3.PROSPECTUS SUMMARY INFORMATION
YouThis summary highlights selected information contained elsewhere in this prospectus and does not contain all of the information that you should consider in making your investment decision. Before investing in our common stock, you should carefully read all information in thethis entire prospectus, including theour consolidated financial statements and their explanatorythe notes thereto and the information set forth under the “Risk Factors” and “Management’s Discussion and Analysis of Financial Statements prior to making an investment decision.Condition and Results of Operations” sections of this prospectus.
Summary of the Offering
| Shares currently outstanding: | 106,449,471 | |
| Shares being offered: | 10,000,000 | |
| Offering Price per share: | The Selling Stockholder may sell all or a portion of the shares being offered pursuant to this prospectus at fixed prices and prevailing market prices at the time of sale, at varying prices or at negotiated prices. | |
| Use of Proceeds: | We are not selling any shares of our common stock in this offering and we will not receive any of the proceeds from the sale of shares of our common stock by the Selling Stockholder. The Selling Stockholder will receive all of the proceeds from any sales of the shares of our common stock offered hereby. However, we will receive the exercise price upon any exercise of the Warrants. If the Warrants are exercised in full, we would receive gross proceeds of approximately $1,500,000. We currently intend to use such proceeds, if any, for general corporate purposes and working capital. The Selling Stockholder is not obligated to exercise the Warrants, and we cannot predict whether and when, if ever, the Selling Stockholder will choose to exercise the Warrants, in whole or in part. See “Use of Proceeds” beginning on page 30 of this prospectus. | |
| OTC Markets Symbol: | DSGT | |
| Risk Factors: | See “Risk Factors” beginning on page 23 and the other information in this prospectus for a discussion of the factors you should consider before deciding to invest in shares of our common stock. |
Our Business
DSG Global Inc. (“DSG”) is a technology development company based in Surrey, British Columbia, Canada, engaged in the design, manufacture, and marketing of fleet management solutions for the golf industry, as well as commercial, government and military applications. Our principal activities are the sale and rental of GPS tracking devices and interfaces for golf vehicles, and related support services. We were founded by a group of individuals who have dedicated their careers to fleet management technologies and have been at the forefront of the industry’s most innovative developments, and our executive team has over 50 years of experience in the design and manufacture of wireless, GPS, and fleet tracking solutions. We have developed the TAG suite of products that we believe is the first completely modular fleet management solution for the golf industry. The TAG suite of products is currently sold and installed around the world in golf facilities and as commercial applications through a network of established distributors and partnerships with some of the most notable brands in fleet and equipment manufacture.
VTS is giving fleet operators new capabilities to track and control their vehicles through the new INFINITY XL system and the new 3G-4G TAG. We have developed inhouse a proprietary combination of hardware and software that is marketed around the world as the INFINITY TAG system. We have primarily focused on the golf industry where the TAG system is deployed to help golf course operators manage their fleet of golf carts, turf equipment, and utility vehicles. We are a leader in the category of fleet management in the golf industry and were awarded “Best Technology of the Year” in 2010 by Boardroom magazine, a publication of the National Golf Course Owners Association. To date, the TAG system is installed on vehicles around the world and has been used to monitor millions of rounds of golf.
| 4 |
We believe the TAG system fills a void in the marketplace by offering a modular structure that allows the customer to customize their system to meet desired functionality and budget constraints. In addition to the core TAG system vehicle control functionality, which can operate independently, we offer 3 information display systems to the golf courses management and golfer — the alphanumeric TEXT and high definition 12” INFINITY XL, 10” INFINITY RM and 7” INFINITY DM— providing the operator with three display options which is unique in the industry. VTS also offers inhouse financing thru purchase or lease.
The primary market for our TAG system is the golf industry, with over 40,000 golf operations worldwide. While the golf industry remains the primary focus of our sales and marketing efforts, we have completed several successful pilots of the TAG system in other markets such as agriculture and commercial fleet operations. With appropriate resources, we intend to expand our sales and marketing efforts into these new markets.
We are expanding our sales force in North America, which comprises the most significant portion of the golf fleet market and have developed key relationships with privately owned distributors and golf equipment manufacturers such as E-Z-GO, Yamaha and Ransomes Jacobsen to help drive sales through-out Europe, Asia, UK and many other markets worldwide Including our most recent move to New Zealand and Australia.
Our most recent product that is used to increase the pace of play on the course by up to 90 minutes per round is the RAPTOR. Our 3- wheel single rider cart allows the course to revenue share with VTS as the RAPTOR is put on the course free of charge and then allows the course to revenue share with VTS along the way. Each seat is rented to the customers for a minimum of $25 per round.
In order to successfully deliver products, increase sales, and maintain customer satisfaction, we need to have a reliable supplier of our hardware units and components at competitive prices. Presently, we source our TAG and INFINITY fleet from a Fortune 200 company in North America who has manufacturing in China and our RAPTORS from a supplier in the United Kingdom and Asia. This new relationship that has been established provides us with higher quality, newer technology at competitive pricing.
In addition, VTS recently engaged with a telecommunications provider to provide new technology in hardware and wireless access through-out the world therefore allowing VTS to substantially reduce cellular cost.
On September 15, 2020, the Company incorporated Imperium Motor Corp. (“Imperium”), under the laws of the State of Nevada on September 10, 2020, for which it subscribed to all authorized capital stock, 100 shares of Preferred Class A Stock, at a price of $0.001 per share. Imperium is a wholly owned subsidiary of the Company.
Imperium Motor Company
Company Overview
Imperium Motor Company (“Imperium”), a wholly owned subsidiary of the Company, is a global technology company with roots in the technology industry specializing in fleet management, vehicle charging network, and electric vehicles.
Business Unit Overview
TAG/Fleet Management
e-Rickshaw Potential:
| ● | We believe approximately 11,000 new e-Rickshaws hit the streets every month, with annual sales expected to increase about nine percent (9%) by 2021. | |
| ● | Research on car-data-monetization trends and characteristics suggests that this value pool could be as large as $750 billion by 2030. |
Low Speed Electric Vehicles (LSEV)
| ● | The global market size for LSEVs is expected to reach $68B by 2025. | |
| ● | Imperium LSEV and HSEV sales are on track to reach $40 million by 2021. |
High Speed Electric Vehicles (HSEV)
| ● | The global electric vehicle market size was valued at $11.9B in 2017 and is projected to reach $56.7B by 2025, growing at a CAGR of 22.3% from 2018 to 2025. | |
| ● | Imperium LSEV and HSEV sales are on track to reach $40 million by 2021. |
| 5 |
Production Partners
Zhejiang Jonway Automobile Co.
Imperium has exclusive US distribution rights for Zhejiang Jonway Automobile Co., Ltd (“Jonway”) built EVs.
Jonway began manufacturing in May 2003. The Taizhou city, Zhejiang province manufacturing plant has an area of 57.3 hectares with more than 800 employees. It has invested more than 600 million RMB in producing the three and five-door SUVs, with a capacity to produce up to 30,000 units per year. The manufacturing operations include pressing, welding, painting and assembling lines. It has also gained the TS16949:2009, GCC, SASO, SONCAP and CCC certification. Jonway offers a network of more than 500 auto dealerships in China alone and has started a distribution network in Italy.
As a national first-class production enterprise, Jonway has passed the ISO 9001 quality management system certification, the product has passed the European certification and the American DOT, EPA certification, and has been exported to more than 80 countries in the world. Jonway has announced its third assembly plant in the city of Xuzhou, China.
Earlier last year Jonway completed the purchase of a new assembly plant located in the city of Xuzhou, China. The city is located about halfway between Beijing and Shanghai, China in Jiangsu Province. Xuzhou is one of the largest cities in China and an important gateway to East China.
The new plant is the third major assembly plant for Jonway. All Four Wheel and Three Wheel vehicles will be assembled at this new location. The capacity is over 50,000 vehicles annually running only one shift and can be increased with a second shift.
There are two additional buildings being added and when finished will give them over 1,000,000 square feet of under roof. This ultra-modern plant has Kawasaki welding robots, high-capacity plastic injection machinery and cutting-edge paint facilities. Jonway plans on introducing several new electric vehicle models during 2021. The facility will produce new vehicles for Imperium Motor Company for delivery in the United States, Mexico, Canada and Caribbean. Jonway is a leading supplier of affordable Electric Vehicles in Asia and Europe and now in North America via their exclusive distribution partner Imperium Motor, a division of DSG Global. Along with assembling new vehicles the facility will also be able to provide Semi Knock Down Kits that can be final assembled in their prospective markets.
Imperium Exclusive Distribution Territory for Jonway Vehicles
United States
The number of electric vehicles on U.S. roads is projected to reach 18.7 million in 2030, up from 1 million at the end of 2018. This is about 7% of the 259 million vehicles (cars and light trucks) expected to be on U.S. roads in 2030. EV sales in the United States were up 79% in 2018 while global EV sales grew 64% in the same year.
Canada
Sales for 2018 were over 150% higher than 2017 and saw more EVs sold across the country in 2018 than in the previous three years combined. Nearly 3% of all new vehicles are electric, a higher rate than in the United States.
Mexico
EV sales in Latin America increased by 90% in 2018 due to growing demand in Mexico, Colombia and Costa Rica. While the LatAm EV market is far smaller than East Asia, Europe and North America, accounting for less than 1% of global EV sales in 2018, it is starting to grow thanks to a handful of incentives and targets. Mexico and Costa Rica, for example, exempt EVs from numerous taxes while Colombia has an ambitious target of 600,000 EVs on its roads by 2030.
Companies are also increasing their activity. BYD Co. now sells electric buses across the region and Tesla Inc. recently launched its best-selling Model 3 in Mexico.
Caribbean
While most Caribbean islands are rapidly modernizing their electric grids, the modernization of transportation systems has lagged. Is change in the air? In November, the government of Bermuda signed a memorandum of understanding with the Rocky Mountain Institute (RMI), embracing a plan to fully transition the island’s transportation sector to EVs.
The case for EVs is strong in Bermuda, as it is across the Caribbean. With predominantly flat terrain and driving distances that are short enough to eliminate “range anxiety,” EVs make perfect sense.
Caribbean nations are uniquely positioned to reap major benefits from EVs with the abundance of sunshine that could provide renewable solar power on a significant scale. EV adoption would also reduce reliance on fuel imports, which creates extreme economic vulnerability linked to oil price fluctuations as well as contribute to disaster resilience through energy storage—EV batteries can serve as backup power sources during hurricanes.
| 6 |
Imperium Motor Company Experience Center
Our Imperium Electric Vehicle Northern California Experience Center is located in Fairfield, Solano County, California. Solano County is situated between two of the largest Electric Vehicle markets in California, the San Francisco Bay Area and Greater Sacramento with a combined population of over 10 million people. California is historically the top EV sales volume state with 50% of sales within the United States. The building sits right next to the crossroads of Freeway 80 and Freeway 680 in one of the best economic areas in the nation.
The Experience Center will feature the various models of new Electric Cars, Trucks, Vans, UTVs, ATVs and Scooters arriving soon from the manufacturer. The new building will not only display our new selection of Electric Vehicles but will also host the center for Dealer training and Parts and Service support.
58 public electric vehicle (EVs) charging locations available in Solano County, California. The number of charging points worldwide was estimated to be approximately 5.2 million at the end of 2018, up 44% from the year before. As of March 2020, the U.S. had approximately 78,500 charging outlets and almost 25,000 charging stations for plug-in electric vehicles. ChargePoint, which manages a network of EV charging locations worldwide, has pledged to build out 2.5 million public charging ports by 2025, with roughly half of those in North America and half in Europe.
Imperium’s Green Story
Gas powered combustion engines are not the future of transportation, they are the past. Our line of electric vehicles produces no emissions, almost no heat, little noise, and can be fully powered by renewable resources like solar and wind energy. Imperium will be offering a combination solar/wind home charging station for a 100%
sustainable, 100% zero carbon solution.
Imperium EV Passenger Vehicles
| IMPERIUM ET5 by Skywell | ||
| ● | SEATING for five passengers | ||
| ● | MOTOR 150 kW max power | ||
| ● | SPEED up to 150 kp/h | ||
| ● | RANGE up to 404 km or 520 km NEDC estimate | ||
| ● | BATTERY 55.33 or 71.98 kWh Li-ion | ||
| ● | EQUIPPED with Automatic Transmission, Air Conditioning, Heater, Power Windows, Power Door Locks, Rear Camera, Push Button Start, Alloy Wheels, Am-Fm USB/SD Stereo and more | ||
| IMPERIUM Terra-e by ZXAUTO in development | ||
| ● | SEATING for five passengers | ||
| ● | MOTOR 135 kW max power | ||
| ● | SPEED up to 145 kp/h | ||
| ● | RANGE up to 322 to 435 km estimate | ||
| ● | BATTERY 53.84 or 75.22 kWh Li-ion | ||
| ● | EQUIPPED with Automatic Transmission, Air Conditioning, Heater, Power Windows, Power Door Locks, Rear Camera, Push Button Start, Alloy Wheels, Am-Fm USB/SD Stereo and more | ||
| IMPERIUM W Coupe | ||
| ● | SEATING for four and Unibody Construction | ||
| ● | MOTOR 4.5 kW or optional 7.5 kW Brushless DC Motor available | ||
| ● | SPEED of 40 km/h for LSV model or 75 km/h for mid speed model | ||
| ● | RANGE of up to 120km on Lead Acid Battery Pack or up to 150km with optional Lithium Battery Pack | ||
| ● | BATTERY 72-volt 720 Ah Battery Power with Lead Acid or Optional Lithium Battery Pack available | ||
| ● | EQUIPPED with Automatic Transmission, Air Conditioning, Heater, Power Windows, Power Door Locks, Rear Camera, Push Button Start, Alloy Wheels, Am-Fm USB/SD Stereo and more | ||
| 7 |
 | IMPERIUM Maxi “SUV” Style | ||
| ● | SEATING for four with Steel Safety Cell Construction | ||
| ● | MOTOR 4.5 kW or optional 7.5 kW Brushless DC Motor available | ||
| ● | SPEED up to 40 km/h for LSV model or 60 km/h for mid speed model | ||
| ● | RANGE up to 120 km on Lead Acid Battery Pack or up to 150 km with optional Lithium Battery Pack | ||
| ● | BATTERY 72-volt 720 Ah with Lead Acid or Optional Lithium Battery Pack available | ||
| ● | EQUIPPED with Automatic Transmission, Alloy Wheels, Air Conditioning, Heater, Power Windows, Power Door Locks, Rear Camera, Push Button Start, Am-Fm USB/SD Stereo, Rear Mounted Spare Tire and more | ||
 | IMPERIUM Maxi Sport Sedan | ||
| ● | SEATING for four with Steel Safety Cell Construction | ||
| ● | MOTOR 4.5 kW or optional 7.5 kW Brushless DC Motor available | ||
| ● | SPEED up to 40 km/h for LSV model or 60 km/h for mid speed model | ||
| ● | RANGE up to 120 km on Lead Acid Battery Pack or up to 150 km with optional Lithium Battery Pack | ||
| ● | BATTERY 72-volt 720 Ah with Lead Acid or Optional Lithium Battery Pack available | ||
| ● | EQUIPPED with Automatic Transmission, Alloy Wheels, Air Conditioning, Heater, Power Windows, Power Door Locks, Rear Camera, Push Button Start, Am-Fm USB/SD Stereo, Rear Mounted Spare Tire and more | ||
 | IMPERIUM Euro Coupe | ||
| ● | SEATING for four with Steel Safety Cell Construction | ||
| ● | MOTOR 4.5 kW to 7.5 kW Brushless DC | ||
| ● | SPEED of up to 45 km/h or up to 55 km/h with optional Performance Package | ||
| ● | RANGE up to 120 km on a single charge | ||
| ● | BATTERY 60-volt 600 Ah Maintenance Free Lead Acid or Lithium Battery Pack with Optional Performance Package | ||
| ● | EQUIPPED with Automatic Transmission, Alloy Wheels, Air Conditioning, Heater, Power Windows, Power Door Locks, Rear Camera, Push Button Start, Rear Hatch Am-Fm USB/SD Stereo and more | ||
 | IMPERIUM Urbee 4S | ||
| ● | SEATING for four with Steel Safety Cell Construction | ||
| ● | MOTOR 4.0 kW Brushless DC | ||
| ● | SPEED up to 40 km/h | ||
| ● | RANGE up to 120 km on a single charge | ||
| ● | BATTERY 60-volt 600 Ah Maintenance Free Lead Acid | ||
| ● | EQUIPPED with Alloy Wheels, Sunroof, Rear Locking Trunk Heater, Power Windows, Optional Air Conditioning, Alloy Wheels, Am-Fm USB/SD Stereo and more | ||
 | IMPERIUM Urbee 2S | ||
| ● | SEATING for two with Steel Safety Cell Construction | ||
| ● | MOTOR 2.8 kW or optional 4.0 kW Brushless DC | ||
| ● | SPEED up to 55 km/h | ||
| ● | RANGE up to 140 km on a single charge | ||
| ● | BATTERY 60-volt 600 Ah Maintenance Free Lead Acid | ||
| ● | EQUIPPED with Sunroof, Lockable Rear Trunk, Heater, Power Windows, Optional Air Conditioning, Alloy Wheels, Am-Fm USB/SD Stereo and more | ||
| 8 |
 | IMPERIUM Urbee Cargo Van | ||
| ● | SEATING for two with Steel Safety Cell Construction | ||
| ● | MOTOR 4.5 kW Brushless DC Motor Standard | ||
| ● | SPEED up to 45 km/h | ||
| ● | RANGE up to 120 km on a single charge | ||
| ● | BATTERY 60-volt 600 Ah Maintenance Free Lead Acid | ||
| ● | EQUIPPED with Large All Steel Locking Cargo Box with Dual Doors, Heater, Power Windows, Optional Air Conditioning, Alloy Wheels, Am-Fm USB/SD Stereo and more | ||
 | IMPERIUM Five Star Van | ||
| ● | SEATING for two or five Passengers for Cargo Van | ||
| ● | MOTOR up to 18 kW and 320 volt rated | ||
| ● | SPEED up to 55 km/h for LSV and 100 km/h for Mid Speed Model | ||
| ● | RANGE up to 150 km for Lead Acid Battery Pack or up to 300 km with optional Lithium Battery Pack | ||
| ● | BATTERY Quick Change Swappable Battery Packs with level one, two and optional level 3 DC Fast Charging | ||
| ● | EQUIPPED with Dual Air Conditioning, Heater, Power Windows, Power Door Locks, Am-Fm USB/SD Stereo and more | ||
 | IMPERIUM T-Truck | ||
| ● | READY for the road or use inside a warehouse with no tailpipe emissions | ||
| ● | CARGO BED with fold down tailgate | ||
| ● | PERSONAL transportation or commercial ready | ||
| ● | MOTOR 2.0 kW Permanent Magnet DC | ||
| ● | ADJUSTABLE SPEED up to 55 kp/h | ||
| ● | BATTERY Maintenance Free Lead Acid or optional Lithium | ||
| ● | EQUIPPED with Alloy Wheels and Radial Tires, Full Lighting, Turn Signals, Windshield Wiper, Motorcycle Style Front Controls and more | ||
 | IMPERIUM T-Van | ||
| ● | READY for the road or use inside a warehouse with no tailpipe emissions | ||
| ● | STEEL VAN BOX with HD locking dual doors | ||
| ● | PERSONAL transportation or commercial use | ||
| ● | MOTOR 2.0 kW Permanent Magnet DC | ||
| ● | ADJUSTABLE SPEED up to 55 kp/h | ||
| ● | BATTERY Maintenance Free Lead Acid or optional Lithium | ||
| ● | EQUIPPED with Alloy Wheels and Radial Tires, Full Lighting, Turn Signals, Windshield Wiper, Motorcycle Style Front Controls and more | ||
 | IMPERIUM T01 | ||
| ● | SEATING for three passengers or Taxi open style model | ||
| ● | MOTOR 1.0 kW Permanent Magnet DC with optional 1.5 kW Motor Available | ||
| ● | SPEED up to 40 km/h | ||
| ● | RANGE up to 80 km | ||
| ● | BATTERY 60V 225 Ah Maintenance Free Lead Acid or Optional Lithium Ion Battery. | ||
| ● | EQUIPPED with Auto Trans, Stereo, Heater, Alloy Wheels, Full or Half Doors, DOT Lighting, Turn Signals and more | ||
| 9 |
 | IMPERIUM e-Rickshaw Extended Deluxe | ||
| ● | SEATING for five | ||
| ● | MOTOR 1.5kW or optional 2.0kW Permanent Magnet Motor | ||
| ● | SPEED 32 km/h | ||
| ● | RANGE 60 km or 80 km with optional Battery | ||
| ● | BATTERY 45Ah or 60Ah Optional Colloid Battery Maintenance Free | ||
| ● | E-TAXI style with side seating, roof rack, stereo, alloy wheels, safety steel frame and more | ||
 | Imp-Moto Product Lineup | ||
| ● | Full Lineup of Electric Scooters, ATVs, UTVs and Motorbikes | ||
| ● | Lithium Battery power available on most models | ||
| ● | Off-Road or on road models | ||
| ● | Low Maintenance EV Units | ||
| ● | Units for most every purpose including specialized delivery models and ride share Scooters with quick change battery packs | ||
Products and Services
Technology Overview
DSG produces a “modular” suite of products to provide fleet management solution for any vehicle required for a golf operation and provides two golfer information display options to meet the operators budget requirements. DSG believes that it is currently the only company in the golf fleet management industry with these capabilities.
The VTS TAG System is designed from the ground up to be a golf/turf vehicle fleet management system. Its main function is addressing the golf course operator needs. While employing same core technology (cellular wireless and GPS) as traditional commercial vehicle fleet management systems, DSG has created patent pending solutions to adapt it to the very specific requirements of the golf environment. Compared to mainstream fleet tracking products, DSG collects 10 to 50 times more data points per MB (megabyte) of cellular data due to its proprietary data collection and compression algorithms. Also the relative positioning accuracy is improved by almost one order of magnitude by the use of application-specific geo-data validation and correction methods.
DSG’s proprietary methods make it possible to offer a solution suitable for use on golf courses at a price low enough to be affordable in the industry. Every system component incorporates state-of-the-art technology (server, mobile trackers, display). In developing its products VTS TAG Systems has adopted an application-oriented approach placing the most emphasis (and research & development) on server and end-user software by taking advantage of the commodity level reached by mainstream technologies such as Global Positioning (GPS) and M2M (Machine to Machine) Cellular Data in the wider context of Commercial Fleet Management.
DSG leveraged the existence of an abundance of very cost-effective telematics solutions by selecting an “off-the-shelf” hardware platform that meets all the main performance and environmental requirements for operation in the harsh, outdoor golf course environment. While removing all risk and cost associated with developing a proprietary hardware platform, DSG has maintained the unique nature of its hardware solution by developing a set of proprietary adapters and interfaces specifically for the golf application.
DSG has secured an exclusive supply agreement with the third-party hardware manufacturers for the vertical of golf industry. Additionally, DSG owns the design of all proprietary adapters and interfaces. This removes the risk of a potential competitor utilizing the same hardware platform. Competitors could attempt to reverse engineer or copycat the TAG technology and equipment. This risk factor is mitigated by the fact that our product does not rely on a particular technology or hardware platform to be successful but on a very specific vertical software application that is far more difficult to copy (and respectively easier to protect).
The application software contains patent features implemented in every core component of the system. The TAG device runs DSG proprietary firmware incorporating unique data collection and compression algorithms. The web server software which powers the end-user application is also proprietary and incorporates the industry knowledge accumulated through the over 70 years of collective experience of the DSG team.
This approach has given the product line a high level of endurance against technology obsolescence. At any point in time, if a hardware component is discontinued or a better/less expensive hardware platform becomes available, the software application can be easily adapted to operate on the new platform or with the new component. The company benefits from the constant increase of performance and cost reduction of mainstream hardware technology without any additional cost.
| 10 |
The web-based Software-as-a-Service (SaaS) model used by VTS TAG System is optimal for low operating and support costs and rapid-cycle release for software updates. It is also a major factor in eliminating or substantially reducing the need for any end-user premises equipment. Customers have access to the service through any internet connected computer or mobile device, there is no need for a local wireless network on the facility and installation time and cost are minimal.
DSG is positioned to take advantage of mainstream technology and utilize “best of breed” hardware platforms to create new generations of products. Our software is designed to be “portable” to future new platforms with better GPS and wireless technology in order to maintain the Company competitive edge.
All new product development effort of DSG is following the same model: select the best of breed third-party hardware platform, design and produce custom proprietary accessories while focusing the bulk of the development efforts on vertical software application to address a very specific set of end-customer needs.
The latest addition to the TAG family of products, the TAG INFINITY is a perfect example of this development philosophy in action: the main component is a last-generation Android tablet PC wrapped in a custom designed outdoor enclosure containing the power supply and interface components required for the golf environment. The software application is taking advantage of all the advanced high-resolution graphics, touch user interface and computing power of the Android OS delivering a vastly superior user experience compared to competitive systems. The time to market for this product was 30% of how long it took to develop and launch this type of products in the past.
The TAG Control Unit
The company’s flagship product is the TAG Control unit. The TAG can operate as a “stand alone” unit or with one of two displays; the INFINITY 7” alphanumeric display or the INFINITY high definition “touch activated” screen. The TAG is GPS enabled and communicates with the TAG software using cellular GSM networks. Utilizing the cellular networks rather than erecting a local Wi-Fi network assures carrier grade uptime, and vehicle tracking “off- property”. GSM is the de facto global standard for mobile communications.
The TAG unit itself is discreetly installed usually in the nose of the vehicle to give the GPS clear line of site. It is then connected to the vehicle battery and ignition. The property is then mapped using the latest satellite imagery that is graphically enhanced and loaded into the TAG System as a map.
Once installed the vehicle owner utilizes the TAG software to locate the vehicle in real time using any computer, smartphone, or tablet that has an internet connection and perform various management operations.

The operator can use the geo-fencing capabilities to create “zones” on the property where they can control the vehicles behavior such as shutting down a vehicle that is entering a sensitive or dangerous area. The TAG System also monitors the strength of the vehicle’s battery helping to prevent sending out vehicles undercharged batteries which can be an inconvenience for the course and negatively impact the golfer experience.
| 11 |
Features and Benefits
| ● | Internal battery utilizing Smart Power technology which charges the battery only when the vehicle is running (gas) or being charged (electric) |
| ● | Pace of Play management and reporting which is a critical statistic for the golf operator |
| ● | No software to install |
| ● | Web based access on any computer, smartphone, or tablet |
| ● | Set up restricted zones to protect property, vehicles, and customers |
| ● | Real time tracking both on and off property (using Street Maps) |
| ● | Email alerts of zone activity |
| ● | Cart lockdown |
| ● | Detailed usage reporting for improved maintenance, proper vehicle rotation, and staff efficiency |
| ● | Geo fencing security features |
| ● | Ability to enforce cart path rules which is key to protecting course on wet weather days |
| ● | Modular system allows for hardware and feature options to fit any budget or operations |
INFINITY 7” Display
The INFINITY 7” is paired with the TAG Control unit as DSG’s entry level display system for operators who desire to provide basic hole distance information and messaging to the golf customer. The INFINITY 7” is a very cost-effective solution for operators who desire to give their customers GPS services with the benefits of a Fleet Management back end. The INFINITY 7” can be mounted on the steering column or the dash depending on the customer’s preference.

VTS’s entry level alphanumeric golf information display
Features and benefits
| ● | Hole information display |
| ● | Yardage displays for front, middle, back locations of the pin |
| 12 |
| ● | Messaging capabilities – to individual carts or fleet broadcast |
| ● | Zone violation warnings |
| ● | Pace of Play notifications |
| ● | Smart battery technology to prevent power drain |
| ● | Versatile mounting option |
INFINITY XL 12” Display
The INFINITY XL 12” is a solution for operators who desire to provide a high-level visual information experience to their customers. The INFINITY XL 12” is a high definition “Infinity XL 12” “activated display screen mounted in the golf cart integrated with the TAG Control unit to provide a full back/front end Fleet Management solution. The INFINITY XL 12” displays hole graphics, yardage, and detailed course information to the golfer and provides interactive features such as Food and Beverage ordering and scorekeeping.

The industry leading Infinity XL 12” HD – the most sophisticated display in the market.
Features and Benefits
| ● | Integrated Food and Beverage ordering |
| ● | Pro Tips |
| ● | Flyover capability |
| ● | Daily pin placement display |
| ● | Interactive Scorecard with email capability |
| ● | Multiple language choices |
| ● | No power drain with Smart Battery technology |
| ● | Full broadcast messaging capabilities |
| ● | Pace of Play display |
| 13 |
| ● | Vivid hole graphics |
| ● | Option of steering or roof mount |
| ● | Generate advertising revenue and market additional services |
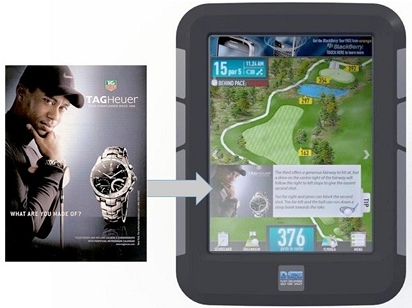
PROGRAMMATIC Advertising Platform
A unique feature of the INFINITY XL 12” system is the advertising display capability. This can be used by the operator for internal promotion of services or for generating revenue by selling the ad real estate since the golf demographic is very desirable to advertisers. The INFINITY XL 12” displays banner, panel, full page, pro tip, and Green view ads. There is also ad real estate on the interactive feature screens for Food and Beverage ordering and the scorecard. The Infinity XL 12” System can also display animated GIF files or play video for added impact.

| 14 |
Advertising displayed in multiple formats including animated GIF and video
DSG has developed proprietary “Ad Manager” software which is used to place and change the ads on the system(s) from a central NOC (Network Operations Center) in real time. The Ad Manager can deploy to a single system or multiple systems. This creates a network of screens that is also very desirable to advertisers as ad content can be deployed locally, regionally, or nationally. The advertising platform is an important part of the company’s future marketing and sales strategy.

DSG R3 Advertising Platform
The DSG R3 program delivers advance ROI (Revenue Optimization Intelligence). Utilizing all streams of advertising delivery, such as automated, direct, and self-serve. The R3 program has the ability to deliver relevant advertising to golfers the moment they sit in the cart. The R3 model is more effective than the previous advertising model of ‘One to One’, these are local ads only sold through direct sales by courses, or 3 rd party advertising sales firms. The new R3 model offers ‘Many to one’ advertising options, delivering thousands of national, regional, and local advertisers an opportunity to advertise on our screens through our R3 Marketplace.
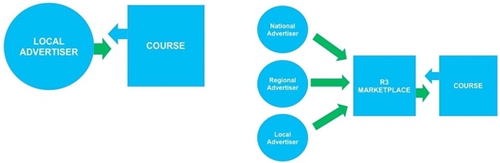
Previous ‘One to One’ model vs the new R3 model ‘Many to One’
TAG TURF/ECO TAG
The TAG Turf and the new ECO TAG were developed to give course operators the same back end management features for their turf equipment and utility vehicles. Turf equipment is expensive, and a single piece can run over $100,000 and represents a large portion of a golf course operating budget. The TAG Turf and ECO TAG have comprehensive reporting that the operator can utilize to implement programs that can increase efficiencies, reduce labor costs, help lower idle times, provide fuel consumption and equipment performance, provide historical data on cutting patterns, and reduce pollution from emissions by monitoring idle times. Since the golf course needs to be maintained regardless of volume these cost saving measures directly impact the operator’s bottom line.
| 15 |
Features and Benefits
| ● | Can be installed on any turf, utility, or service vehicle |
| ● | Work activity tracking and management |
| ● | Work breakdown and analysis per area, work group, activity type or specific vehicle |
| ● | Vehicle idling alerts |
| ● | Zone entry alerts |
| ● | Detailed travel (cutting patterns) history |
| ● | Detailed usage reports with mileage and hours |
| ● | Protection for ecological areas through geo fencing |
| ● | Vehicle lock down and ‘off property’ locating features |

The TAG Turf provides detailed trail history and cutting patterns
Revenue Model
DSG derives revenue from four different sources.
Systems Sales Revenue, which consists of the sales price paid by those customers who purchase our TAG system hardware lease our TAG system hardware.
Monthly Service Fees are paid by all customers for the wireless data fee charges required to operate the GPS tracking on the TAG systems.
Monthly Rental Fees are paid by those customers that rent the TAG system hardware. The amount of a customer’s monthly payment varies based on the type of equipment rented (a TAG, a TAG and INFINITY 7”, or a TAG and INFINITY XL 12”).
Programmatic Advertising Revenue is a new source of revenue that we believe has the potential to be strategic for us in the future. We are in the process of implementing and designing software to provide advertising and other media functionality on our INFINITY.
We recognize revenue when persuasive evidence of an arrangement exists, delivery has occurred, the fee is fixed or determinable, and collectability is reasonably assured. In instances where final acceptance of the product is specified by the customer, revenue is deferred until all acceptance criteria have been met. We accrue for warranty costs, sales returns, and other allowances based on its historical experience.
Our revenue recognition policies are discussed in more detail under “Note 2 – Summary of Significant Accounting Policies” in the notes to our Condensed Consolidated Financial Statements.
| 16 |
Markets
Sales and Marketing Plan
The market for the TAG System is the worldwide golf cart and Turf equipment fleets. There are 40,000 golf courses around the world with North America being the largest individual market with 20,000. This represents over 3,000,000 vehicles. The golf market has five distinct types of operations. Municipal, Private Country Clubs, Destination Resorts, Public Commercial, Military and University affiliated. VTS has deployed and has case studies developed TAG systems in each of these categories.
Our marketing strategy is focused on building brand awareness, generating quality leads, and providing excellent customer service.
North America Sales
Since the largest market is North America the Company employs a direct sales team and sales agents that provide full sales coverage. Our sales agents are experienced golf industry professionals who maintain established relationships with the golf industry and carry multiple golf lines. Our sales objective is to offer our existing and prospective customers a dedicated, knowledgeable, and outstanding customer service team.
In addition, our team is dedicated to existing accounts that focus on up-selling and cross-selling additional products to our current customer base, securing renewal agreements, and providing excellent customer service. The current regions are:
| ● | Western Canada |
| ● | Eastern Canada |
| ● | Northeast USA |
| ● | Western USA |
| ● | Southeastern USA |
| ● | Midwest USA |
International Sales
DSG focuses on select global golf markets that offer significant volume opportunities and that value the benefits that our products deliver.
We utilize strategic distributor partnerships in each targeted region/country to sell, install and service our products. Distributors are selected based on market strength, market share, technical and selling capability, and overall reputation. We believe that DSG solutions appeal to all distributors because they are universal and fit any make or model of vehicle. We maintain and leverage our strong relationship with Yamaha, E-Z-GO and Ransomes Jacobsen (sister company to E-Z-GO) in developing our distributor network around the world. Today, many of our distributor partners are the leading distributors for E-Z-GO and RJ and hold a dominant position in their respective markets. While they are Yamaha or E-Z-GO distributors, most sell DSG products to all courses regardless of their choice of golf car as a value add to their customers and to generate additional revenue. We complement this distributor base with independent distributors as needed to ensure we have sufficient coverage in critical markets.
Currently DSG is focused on expanding in Europe, Asia and South Africa. The Company plans to expand next into Australia, New Zealand and Latin America.
Management Companies
Many golf facilities are managed by management companies. The portfolios of these companies vary from a few to hundreds of golf courses. Troon®, the world’s largest player in golf course management, has over 200 courses under management. The management companies provide everything from branding, staffing, management systems, marketing, and procurement. DSG is currently providing products and services to Troon, OB Sports, Kemper Sports, Trump, Marriott Golf, Blue Green, Crown Golf, American Golf, Billy Casper, Club Corp, and Club Link.
DSG has been successful in completing installations and developing relationships with several of the key players who control a substantial number of courses. DSG will continue to implement system developments that are driven by the needs of these management companies such as combined reporting, multiple course access through a centralized dashboard. This development will become a competitive advantage for DSG in the management company market.
| 17 |
DSG has dedicated a team to create specific collateral for this market and has assigned a senior executive to have direct responsibility to manage these relationships.
Competition
We compete with a number of established producers and distributors of vehicle fleet management systems. Our competitors include producers of golf specific applications, such as GPS Industries, LLC., one of the leading suppliers of golf cart fleet management systems, as well as producers of non-golf specific utility vehicle fleet management systems, such as Toro. Many of our competitors have longer operating histories, better brand recognition and greater financial resources than we do. In order for us to successfully compete in our industry we must:
| ● | demonstrate our products’ competitive advantages; | |
| ● | develop a comprehensive marketing system; and | |
| ● | increase our financial resources. |
However, there can be no assurance that even if we do these things, we will be able to compete effectively with the other companies in our industry.
We believe that we will be able to compete effectively in our industry because of the versatility, reliability, and relative affordability of our products when compared to those of our competitors. We will attempt to build awareness of our competitive advantages among existing and potential customers through trade shows, sales visits and demonstrations, online marketing, and positive word of mouth advertising.
However, as we are a newly established company relative to our competitors, we face the same problems as other new companies starting up in an industry, such as limited access to capital. Our competitors may be substantially larger and better funded than us, and have significantly longer histories of research, operation and development than us. In addition, they may be able to provide more competitive products than we can and generally be able to respond more quickly to new or emerging technologies and changes in legislation and regulations relating to the industry. Additionally, our competitors may devote greater resources to the development, promotion and sale of their products or services than we do. Increased competition could also result in loss of key personnel, reduced margins or loss of market share, any of which could harm our business.
Our primary competitor in the field of golf course fleet management is GPS Industries, a company that was founded in 1996 by our sole officer, founder and one of our directors, Mr. Bob Silzer. GPS Industries is currently the largest player in the marketplace with an installed base of approximately 750 golf courses worldwide. GPS Industries was consolidated by various mergers and acquisitions with a diversity of hardware platforms and application software. Since 2009, when GPS Industries has introduced their latest product offering called the Visage, in an exclusive partnership with Club Car, their strategy has been to target mostly their existing customers and motivate them into replacing their existing, older GPS system, with the Visage system.
GPS Industries is leveraging very heavily their partnership with Club Car, which is one of the three largest golf cart manufacturers in the world and at times is benefiting from golf operators’ preference for Club Car and their vehicles when they select their management system.
Market Mix
Since the introduction of the DSG product line, we have shown golf course operators that they have now access to a budget-friendly fleet management tool that works not only on golf carts but also with all other vehicles used on the golf course such as turf maintenance, shuttles, and other utility vehicles.
Marketing studies have identified that half of the golf course operators only need a fleet management system and only 15% need a high-end GPS golf system. This illustrates the strong competitive advantage that VTS TAG Systems has versus GPS Industries since their product can only address the needs of a relatively small fraction of the marketplace.
Consequently, GPS Industries’ installed base has steadily declined since most of their new product installations have replaced older product for existing customers and some customers have opted for a lower budget system and switched over to VTS TAG Systems.
Marketing Activities
The Company has a multi-layered approach marketing the TAG suite of products. One of the foundations of this plan is attending industry trade shows which are well attended by golf operators. The two largest shows are the PGA Merchandise Show and the Golf Industry Show which are held in Florida at the end of January. The Company also attends a number of regional shows around North America. International events are attended by our distributors and partners.
The second layer of marketing is memberships in key organizations such as the National Golf Course Owners Association, Golf Course Superintendents Association, and Club Managers Association of America. These are very influential in the industry and have marketing channels such as publications, email blasts, and web-based marketing. The Company also markets directly to course operators through email, surveys direct mail programs.
| 18 |
Lead Generation
One of the primary sources of lead generation is through the Company’s strategic partnerships with E-Z-GO, Yamaha, and Ransomes Jacobson. These relationships provide the Company with a great deal of market intelligence. The sales forces of the partners work in tandem with the DSG sales team by passing on the leads, creating joint proposals, and distributing TAG sales material. The Company has also created co-branded materials for specific value items of interest to operators such as Pace of Play solutions. DSG sale s and marketing staff attend partner sales events to conduct training and discuss marketing strategies.
The Company is in the process of testing an internal telemarketing program in several key markets to gauge whether this particular channel warrants larger scale implementation.
Competitive Advantages
Pricing
One of the “heroes” of the TAG System is providing the course operator a range of modular fleet management options that are very competitively priced. Pricing options range from the TURF, TAG, Infinity 7”, and Infinity XL 12” System, giving the customer a wide range of pricing options.
Functional advantages
DSG has the distinctive advantage of being able to offer a true fleet management system, encompassing all the vehicles on the golf course, not just the golf carts. Due to the modular nature of the system, customers have now the option to configure their system’s configuration to match exactly their needs and their budget.
Product advantages
DSG products are the robust, reliable, and user-friendly systems in the world. DSG is the only company currently providing systems that are waterproof with internal batteries to ensure our partners retain the full golf cart manufacturer’s warranty.
Operational Plan
Our Operations Department’s main functions are outlined below:
Product Supply Chain Management
| ● | Product procurement, lead-time management |
| ● | Inventory Control |
Customer Service
| ● | Training |
| ● | Troubleshooting & Support |
| ● | Hardware Repairs |
Installations
| ● | Content & graphics procurement |
| ● | System configurations |
| ● | Shipping and Installation |
Infrastructure Management
| ● | Communication Servers Management |
| ● | Cellular Data Carriers |
| ● | Service and administration tools |
Product Supply Chain
In order to maintain high product quality and control, as well as benefiting from cost savings, the Company is currently procuring all main hardware components offshore. Final assembly is locally performed in order to ensure product quality. Other main components are also procured directly from manufacturers or from local suppliers that outsource components office in order to keep the price as low as possible.
| 19 |
The Company is requesting the suppliers to perform a complete set of quality testing and minimum 24 hours’ burn-in before the product is delivered. The local hardware assembler and components supplier offers a 12-month warranty. The main hardware components offshore supplier offers a warranty plan of 15 months from the date the product is shipped. With an extended 90 days beyond the current warranty, such repair service would be paid by the supplier except for component replacement costs, which would be paid by DSG.
Another important activity related to the management of the product supply chain is working closely with the suppliers and ensuring that we have alternate sources for the main components and identify well in advance any components that may go “end-of-life” and find suitable replacements before product shortages may occur.
Inventory Control
The Company has implemented strict inventory management procedures that govern the inbound flow of products from suppliers, the outgoing flow to customers as well as the internal movement of inventory between warehouses (Canada, US and UK). There are also procedures in place to control the flow of equipment returning from customers for repairs and their replacements.
Installation
The Company is utilizing a small number of its own field engineers, geographically positioned to be in close proximity of areas with high concentrations of current and future customers. Occasionally, when new installations exceed the internal capacity, the company employs a number of external contractors, on a project-by-project basis. Each contractor has been trained extensively to perform product installations and the Company has created an extensive collection of Installation Manuals for all products and vehicle types.
The product was designed with ease of installation as one of its features. Additionally, the installation process includes a pre-shipping configuration process that prepares each device with all the settings and graphics content (if applicable) required for the specific location it will be deployed. This makes the installation process a lot simpler and less time consuming in the field which reduces costs (accommodations, food, travel) for internal staff as well as external contractor cost (less billable time).
Another benefit of the simplified installation procedure is increased scalability in anticipation of increased number of installs in the future by reducing the skill level and training time requirements for additional contractors.
Customer Service
The Company has deployed its Customer Service staff strategically, so it has at least one service representative active during business hours in North America, Europe and South Africa.
The Company is handling Customer Service directly in North America and UK, offering telephone and on-line support to end-customers. In other international markets, the first-line customer service is handled by local distributor’s staff while DSG is supplying training and more advanced support to the distributors.
For the management of the customer service activities, the Company is utilizing SalesForce.com CRM system which allows creating, updating, closing and escalation of service cases, including the issuance of RMA (Return Material Authorization) numbers for defective equipment. Using SalesForce.com also allows generation of management reports for service issues, customer satisfaction, and equipment failures in order to quickly identify trends, problem accounts or systemic issues.
In addition, DSG began offering the DSG Par 72 Service & Support Plan to guarantee service and support to client courses in the golf business, during fiscal 2016. This program for client courses which guarantees service and support programs within 24 hours of a problem arising.
Product Development and Engineering
The Company employs a team of software engineers in house to develop and maintain the main components of the server software and firmware.
All product development is derived from business needs assessment and customer requests.
The Product Manager is reviewing periodically the list of feature requests with the Sales, establishes priorities and updates the Product Roadmap.
The software engineers are also responsible for developing specialized tools and systems utilized increase efficiency in the operation of the Company. These projects include functionality such as: automated system monitoring, automatic service alerts, improved remote troubleshooting tools, cellular data monitoring and reporting. All these tools are critical in future ability to support more customers with less resources, streamline support, and improve internal efficiency.
All hardware development (electronics and mechanical) is generally outsourced, however small projects like mounting solutions or cabling are handled in house.
| 20 |
COVID-19
The recent outbreak of the coronavirus, also known as “COVID-19”, has spread across the globe and is impacting worldwide economic activity. Conditions surrounding the coronavirus continue to rapidly evolve and government authorities have implemented emergency measures to mitigate the spread of the virus. The outbreak and the related mitigation measures may have an adverse impact on global economic conditions as well as on the Company’s business activities. The extent to which the coronavirus may impact the Company’s business activities will depend on future developments, such as the ultimate geographic spread of the disease, the duration of the outbreak, travel restrictions, business disruptions, and the effectiveness of actions taken in Canada and other countries to contain and treat the disease. These events are highly uncertain and as such, the Company cannot determine their financial impact at this time. While certain restrictions are presently in the process of being relaxed, it is unclear when the world will return to the previous normal, if ever. This may adversely impact the expected implementation of the Company’s plans moving forward. The Company has seen a decline in its revenues for the nine months ending September 30, 2020 of approximately 41.8%, largely as a result of the challenges related to COVID-19.
Company OrganizationProducts and Services
Boreal Productions Inc. (the Company) was incorporated under the laws of the State of Nevada on September 24, 2007. Andrea Fehsenfeld was then appointed sole officer and director. The Company was formed to option feature films and TV projects and then package them to sell at a profit to various studios and production companies.Technology Overview
AtDSG produces a “modular” suite of products to provide fleet management solution for any vehicle required for a golf operation and provides two golfer information display options to meet the operators budget requirements. DSG believes that timeit is currently the board of directors voted to seek capital and begin development of our business plan. We received our initial funding of $9,000 throughonly company in the sale of common stock to Ms. Fehsenfeld who purchased 3,000,000 shares of common stock at $0.003 per share and $45,000 from the sale of 3,000,000 shares of common stock issued to 30 un-affiliated investors at $0.015 per share. On June 11, 2008, we effected a five for one forward stock split of our authorized and issued and outstanding common stock. As a result, our authorized capital increased from 75,000,000 to 375,000,000 shares of common stock and our outstanding share capital increased from 6,000,000 shares of common stock to 30,000,000 shares of common stock.
We have not achieved revenues and have accrued a Net Loss of $153,964 since inception through May 6, 2015, the date of the reverse merger. We have been issued a going concern opinion by our auditors and rely upon the sale of our securities to fund operations. To date we have been unable to raise sufficient capital to finance the production of any film or television production and, consequently, ourgolf fleet management has sought alternative strategies, such as business combinations or acquisitions, to create value for our shareholders.
On April 13, 2015, we entered into a share exchange agreementindustry with DSG TAG and the shareholders of DSG TAG who become parties to the share exchange agreement. Pursuant to the terms of the share exchange agreement, we agreed to acquire not less than 75% and up to 100% of the issued and outstanding shares of DSG TAG’s common stock in exchange for the issuance by our company of up to 20,000,000 shares of our common stock to the shareholders of DSG TAG on the basis of one of our common shares for 5.4935 common shares of DSG TAG.
Previously, in anticipation of the share exchange agreement with DSG TAG, we undertook to change our name and effect a reverse stock split of our authorized and issued common stock. Accordingly, on January 19, 2015, our board of directors approved an agreement and plan of merger to merge with our wholly-owned subsidiary DSG Global Inc., a Nevada corporation, to effect a name change from Boreal Productions Inc. to DSG Global Inc. Our company remains the surviving company. DSG Global Inc. was formed solely for the change of name.
Also on January 19, 2015, our company’s board of directors approved a resolution to effect a reverse stock split of our authorized and issued and outstanding shares of common stock on a three (3) old for one (1) new basis. Upon effect of the reverse split, our authorized capital will decrease from 375,000,000 shares of common stock to 125,000,000 shares of common stock and correspondingly, our issued and outstanding shares of common stock will decrease from 30,000,000 to 10,000,000 shares of common stock, all with a par value of $0.001.
Articles of Merger to effect the merger and change of name and a Certificate of Change to effect the reverse stock split were filed with the Nevada Secretary of State on January 22, 2015, with an effective date of February 2, 2015. The name change and forward split were reviewed by the Financial Industry Regulatory Authority (FINRA) were approved for filing with an effective date of February 23, 2015.these capabilities.
The name change became effectiveVTS TAG System is designed from the ground up to be a golf/turf vehicle fleet management system. Its main function is addressing the golf course operator needs. While employing same core technology (cellular wireless and GPS) as traditional commercial vehicle fleet management systems, DSG has created patent pending solutions to adapt it to the very specific requirements of the golf environment. Compared to mainstream fleet tracking products, DSG collects 10 to 50 times more data points per MB (megabyte) of cellular data due to its proprietary data collection and compression algorithms. Also the relative positioning accuracy is improved by almost one order of magnitude by the use of application-specific geo-data validation and correction methods.
DSG’s proprietary methods make it possible to offer a solution suitable for use on golf courses at a price low enough to be affordable in the industry. Every system component incorporates state-of-the-art technology (server, mobile trackers, display). In developing its products VTS TAG Systems has adopted an application-oriented approach placing the most emphasis (and research & development) on server and end-user software by taking advantage of the commodity level reached by mainstream technologies such as Global Positioning (GPS) and M2M (Machine to Machine) Cellular Data in the wider context of Commercial Fleet Management.
DSG leveraged the existence of an abundance of very cost-effective telematics solutions by selecting an “off-the-shelf” hardware platform that meets all the main performance and environmental requirements for operation in the harsh, outdoor golf course environment. While removing all risk and cost associated with developing a proprietary hardware platform, DSG has maintained the unique nature of its hardware solution by developing a set of proprietary adapters and interfaces specifically for the golf application.
DSG has secured an exclusive supply agreement with the Over-the-Counter Bulletin Boardthird-party hardware manufacturers for the vertical of golf industry. Additionally, DSG owns the design of all proprietary adapters and OTC Markets quotation system atinterfaces. This removes the openingrisk of tradinga potential competitor utilizing the same hardware platform. Competitors could attempt to reverse engineer or copycat the TAG technology and equipment. This risk factor is mitigated by the fact that our product does not rely on February 23, 2015 under the symbol “BRPOD”. Effective March 19, 2015 our stock symbol changeda particular technology or hardware platform to “DSGT”. Our new CUSIP number following the symbol changebe successful but on a very specific vertical software application that is 23340C104. The first trade of our common shares occurred on March 25, 2015.far more difficult to copy (and respectively easier to protect).
On May 6, 2015, we completed the acquisition of approximately 75% (82,435,748 common shares)The application software contains patent features implemented in every core component of the issuedsystem. The TAG device runs DSG proprietary firmware incorporating unique data collection and outstanding common sharescompression algorithms. The web server software which powers the end-user application is also proprietary and incorporates the industry knowledge accumulated through the over 70 years of collective experience of the DSG TAG Systems as contemplated byteam.
This approach has given the share exchange agreement by issuing 15,185,875 sharesproduct line a high level of our common stockendurance against technology obsolescence. At any point in time, if a hardware component is discontinued or a better/less expensive hardware platform becomes available, the software application can be easily adapted to shareholders of DSG TAG Systems who became parties tooperate on the agreement. In addition, concurrentnew platform or with the closingnew component. The company benefits from the constant increase of the share exchange agreement, we issued anperformance and cost reduction of mainstream hardware technology without any additional 179,823 shares of our common stock to Westergaard Holdings Ltd. in partial settlement of accrued interest on outstanding indebtedness of DSG TAG Systems.cost.
| 10 |
FollowingThe web-based Software-as-a-Service (SaaS) model used by VTS TAG System is optimal for low operating and support costs and rapid-cycle release for software updates. It is also a major factor in eliminating or substantially reducing the initial closingneed for any end-user premises equipment. Customers have access to the service through any internet connected computer or mobile device, there is no need for a local wireless network on the facility and installation time and cost are minimal.
DSG is positioned to take advantage of mainstream technology and utilize “best of breed” hardware platforms to create new generations of products. Our software is designed to be “portable” to future new platforms with better GPS and wireless technology in order to maintain the Company competitive edge.
All new product development effort of DSG is following the same model: select the best of breed third-party hardware platform, design and produce custom proprietary accessories while focusing the bulk of the share exchange agreement and through October 22, 2015, we acquired an additional 101,200 sharesdevelopment efforts on vertical software application to address a very specific set of common stock of DSG TAG from shareholders who became parties to the share exchange agreement and issued to these shareholders an aggregate of 18,422 pre-reverse split shares of our common stock. Following completion of these additional purchases, DSG Global Inc. owns 100% of the issued and outstanding shares of common stock of DSG TAG.end-customer needs.
The reverse acquisition was accountedlatest addition to the TAG family of products, the TAG INFINITY is a perfect example of this development philosophy in action: the main component is a last-generation Android tablet PC wrapped in a custom designed outdoor enclosure containing the power supply and interface components required for as a recapitalization effected by a share exchange, wherein DSG TAG Systemsthe golf environment. The software application is consideredtaking advantage of all the acquirer for accountingadvanced high-resolution graphics, touch user interface and financial reporting purposes. The assets and liabilitiescomputing power of the acquired entity have been brought forward at their book valueAndroid OS delivering a vastly superior user experience compared to competitive systems. The time to market for this product was 30% of how long it took to develop and no goodwill has been recognized. We adopted the business and operationslaunch this type of DSG TAG Systems upon the closing of the share exchange agreement.
Subsequent to the closing of the share exchange agreement with DSG TAG, we adopted the business and operations of DSG TAG.
DSG TAG was incorporated under the laws of the State of Nevada on April 17, 2008 and extra provincially registered in British Columbia, Canada in 2008. In March 2011, DSG TAG formed DSG Tag Systems International, Ltd.products in the United Kingdom (“DSG UK”). DSG UK is a wholly owned subsidiary of DSG TAG.
Our principal executive office is located at 312 – 2630 Croydon Drive Surrey, British Columbia, V3Z 6T3, Canada. The telephone number at our principal executive office is 1 (877) 589-8806. The Company’s stock symbol is DSGTpast.
Our BusinessThe TAG Control Unit
Subsequent toThe company’s flagship product is the closingTAG Control unit. The TAG can operate as a “stand alone” unit or with one of two displays; the share exchange agreement with DSG Tag Systems, Inc. (“DSG TAG”), we have adoptedINFINITY 7” alphanumeric display or the business and operations of DSG TAG. DSGINFINITY high definition “touch activated” screen. The TAG is now known as Vantage Tag Systems, Inc. (“VTS”).
DSG Global, Inc. (“DSG”) is a technology development company based in Surrey, British Columbia, Canada, engaged in the design, manufacture,GPS enabled and marketing of fleet management solutions for the golf industry, as well as commercial, government and military applications. Our principal activities are the sale and rental of GPS tracking devices and interfaces for golf vehicles, and related support services. We were founded by a group of individuals who have dedicated their careers to fleet management technologies and have been at the forefront of the industry’s most innovative developments, and our executive team has over 50 years of experience in the design and manufacture of wireless, GPS, and fleet tracking solutions. We have developedcommunicates with the TAG suite of products that we believesoftware using cellular GSM networks. Utilizing the cellular networks rather than erecting a local Wi-Fi network assures carrier grade uptime, and vehicle tracking “off- property”. GSM is the first completely modular fleet management solutionde facto global standard for the golf industry. The TAG suite of products is currently sold and installed around the world in golf facilities and as commercial applications through a network of established distributors and partnerships with some of the most notable brands in fleet and equipment manufacture.
VTS is giving fleet operator’s new capabilities to track and control their vehicles through the new INFINITY XL system and the new 3G-4G TAG. We have developed inhouse a proprietary combination of hardware and software that is marketed around the world as the INFINITY TAG system. We have primarily focused on the golf industry where the TAG system is deployed to help golf course operators manage their fleet of golf carts, turf equipment, and utility vehicles. We are a leader in the category of fleet management in the golf industry and were awarded “Best Technology of the Year” in 2010 by Boardroom magazine, a publication of the National Golf Course Owners Association. To date the TAG system is installed on vehicles around the world and has been used to monitor millions of rounds of golf.mobile communications.
The TAG system fills a voidunit itself is discreetly installed usually in the marketplace by offering a modular structure that allowsnose of the customervehicle to customize their system to meet desired functionality and budget constraints. In additiongive the GPS clear line of site. It is then connected to the corevehicle battery and ignition. The property is then mapped using the latest satellite imagery that is graphically enhanced and loaded into the TAG systemSystem as a map.
Once installed the vehicle control functionality, which can operate independently, we offer 3 information display systemsowner utilizes the TAG software to locate the golf coursesvehicle in real time using any computer, smartphone, or tablet that has an internet connection and perform various management and golfer — the alphanumeric TEXT and high definition 12” INFINITY XL, 10” INFINITY RM and 7” INFINITY DM— providing the operator with three display options which is unique in the industry. VTS also offers inhouse financing thru purchase or lease.operations.
The primary market for ouroperator can use the geo-fencing capabilities to create “zones” on the property where they can control the vehicles behavior such as shutting down a vehicle that is entering a sensitive or dangerous area. The TAG system isSystem also monitors the 40,000 golf operations worldwide. While the golf industry remains the primary focus of our sales and marketing efforts, we have completed several successful pilotsstrength of the TAG system in other markets such as agriculturevehicle’s battery helping to prevent sending out vehicles undercharged batteries which can be an inconvenience for the course and commercial fleet operations. With appropriate resources, we intend to expand our sales and marketing efforts into these new markets.
We are expanding our sales force in North America, which comprisesnegatively impact the most significant portion of the golf fleet market and have developed key relationships with privately owned distributors and golf equipment manufacturers such as E-Z-GO, Yamaha and Ransomes Jacobsen to help drive sales through-out Europe, Asia, UK and many other markets worldwide Including our most recent move to New Zealand and Australia.golfer experience.
| 11 |
In orderFeatures and Benefits
| ● | Internal battery utilizing Smart Power technology which charges the battery only when the vehicle is running (gas) or being charged (electric) |
| ● | Pace of Play management and reporting which is a critical statistic for the golf operator |
| ● | No software to install |
| ● | Web based access on any computer, smartphone, or tablet |
| ● | Set up restricted zones to protect property, vehicles, and customers |
| ● | Real time tracking both on and off property (using Street Maps) |
| ● | Email alerts of zone activity |
| ● | Cart lockdown |
| ● | Detailed usage reporting for improved maintenance, proper vehicle rotation, and staff efficiency |
| ● | Geo fencing security features |
| ● | Ability to enforce cart path rules which is key to protecting course on wet weather days |
| ● | Modular system allows for hardware and feature options to fit any budget or operations |
INFINITY 7” Display
The INFINITY 7” is paired with the TAG Control unit as DSG’s entry level display system for operators who desire to successfullyprovide basic hole distance information and messaging to the golf customer. The INFINITY 7” is a very cost-effective solution for operators who desire to give their customers GPS services with the benefits of a Fleet Management back end. The INFINITY 7” can be mounted on the steering column or the dash depending on the customer’s preference.
VTS’s entry level alphanumeric golf information display
Features and benefits
| ● | Hole information display |
| ● | Yardage displays for front, middle, back locations of the pin |
| 12 |
| ● | Messaging capabilities – to individual carts or fleet broadcast |
| ● | Zone violation warnings |
| ● | Pace of Play notifications |
| ● | Smart battery technology to prevent power drain |
| ● | Versatile mounting option |
INFINITY XL 12” Display
The INFINITY XL 12” is a solution for operators who desire to provide a high-level visual information experience to their customers. The INFINITY XL 12” is a high definition “Infinity XL 12” “activated display screen mounted in the golf cart integrated with the TAG Control unit to provide a full back/front end Fleet Management solution. The INFINITY XL 12” displays hole graphics, yardage, and detailed course information to the golfer and provides interactive features such as Food and Beverage ordering and scorekeeping.
The industry leading Infinity XL 12” HD – the most sophisticated display in the market.
Features and Benefits
| ● | Integrated Food and Beverage ordering |
| ● | Pro Tips |
| ● | Flyover capability |
| ● | Daily pin placement display |
| ● | Interactive Scorecard with email capability |
| ● | Multiple language choices |
| ● | No power drain with Smart Battery technology |
| ● | Full broadcast messaging capabilities |
| ● | Pace of Play display |
| 13 |
| ● | Vivid hole graphics |
| ● | Option of steering or roof mount |
| ● | Generate advertising revenue and market additional services |
PROGRAMMATIC Advertising Platform
A unique feature of the INFINITY XL 12” system is the advertising display capability. This can be used by the operator for internal promotion of services or for generating revenue by selling the ad real estate since the golf demographic is very desirable to advertisers. The INFINITY XL 12” displays banner, panel, full page, pro tip, and Green view ads. There is also ad real estate on the interactive feature screens for Food and Beverage ordering and the scorecard. The Infinity XL 12” System can also display animated GIF files or play video for added impact.
| 14 |
Advertising displayed in multiple formats including animated GIF and video
DSG has developed proprietary “Ad Manager” software which is used to place and change the ads on the system(s) from a central NOC (Network Operations Center) in real time. The Ad Manager can deploy to a single system or multiple systems. This creates a network of screens that is also very desirable to advertisers as ad content can be deployed locally, regionally, or nationally. The advertising platform is an important part of the company’s future marketing and sales strategy.
DSG R3 Advertising Platform
The DSG R3 program delivers advance ROI (Revenue Optimization Intelligence). Utilizing all streams of advertising delivery, such as automated, direct, and self-serve. The R3 program has the ability to deliver products,relevant advertising to golfers the moment they sit in the cart. The R3 model is more effective than the previous advertising model of ‘One to One’, these are local ads only sold through direct sales by courses, or 3 rd party advertising sales firms. The new R3 model offers ‘Many to one’ advertising options, delivering thousands of national, regional, and local advertisers an opportunity to advertise on our screens through our R3 Marketplace.
Previous ‘One to One’ model vs the new R3 model ‘Many to One’
TAG TURF/ECO TAG
The TAG Turf and the new ECO TAG were developed to give course operators the same back end management features for their turf equipment and utility vehicles. Turf equipment is expensive, and a single piece can run over $100,000 and represents a large portion of a golf course operating budget. The TAG Turf and ECO TAG have comprehensive reporting that the operator can utilize to implement programs that can increase efficiencies, reduce labor costs, help lower idle times, provide fuel consumption and equipment performance, provide historical data on cutting patterns, and reduce pollution from emissions by monitoring idle times. Since the golf course needs to be maintained regardless of volume these cost saving measures directly impact the operator’s bottom line.
| 15 |
Features and Benefits
| ● | Can be installed on any turf, utility, or service vehicle |
| ● | Work activity tracking and management |
| ● | Work breakdown and analysis per area, work group, activity type or specific vehicle |
| ● | Vehicle idling alerts |
| ● | Zone entry alerts |
| ● | Detailed travel (cutting patterns) history |
| ● | Detailed usage reports with mileage and hours |
| ● | Protection for ecological areas through geo fencing |
| ● | Vehicle lock down and ‘off property’ locating features |
The TAG Turf provides detailed trail history and cutting patterns
Revenue Model
DSG derives revenue from four different sources.
Systems Sales Revenue, which consists of the sales and maintain customer satisfaction, we needprice paid by those customers who purchase our TAG system hardware lease our TAG system hardware.
Monthly Service Fees are paid by all customers for the wireless data fee charges required to haveoperate the GPS tracking on the TAG systems.
Monthly Rental Fees are paid by those customers that rent the TAG system hardware. The amount of a reliable suppliercustomer’s monthly payment varies based on the type of our hardware units and components at competitive prices. Presently, we source ourequipment rented (a TAG, a TAG and INFINITY fleet from one fortune 200 companies in NA who7”, or a TAG and INFINITY XL 12”).
Programmatic Advertising Revenue is a new source of revenue that we believe has manufacturing in China and our RAPTORS from one supplierthe potential to be strategic for us in the United Kingdomfuture. We are in the process of implementing and Asia.designing software to provide advertising and other media functionality on our INFINITY.
We recognize revenue when persuasive evidence of an arrangement exists, delivery has occurred, the fee is fixed or determinable, and collectability is reasonably assured. In instances where final acceptance of the product is specified by the customer, revenue is deferred until all acceptance criteria have been met. We accrue for warranty costs, sales returns, and other allowances based on its historical experience.
Our revenue recognition policies are discussed in more detail under “Note 2 – Summary of Significant Accounting Policies” in the notes to our Condensed Consolidated Financial Statements.
| 16 |
Markets
Sales and Marketing Plan
The market for the TAG System is the worldwide golf cart and Turf equipment fleets. There are 40,000 golf courses around the world with North America being the largest individual market with 20,000. This new relationshiprepresents over 3,000,000 vehicles. The golf market has five distinct types of operations. Municipal, Private Country Clubs, Destination Resorts, Public Commercial, Military and University affiliated. VTS has deployed and has case studies developed TAG systems in each of these categories.
Our marketing strategy is focused on building brand awareness, generating quality leads, and providing excellent customer service.
North America Sales
Since the largest market is North America the Company employs a direct sales team and sales agents that has beenprovide full sales coverage. Our sales agents are experienced golf industry professionals who maintain established provides usrelationships with higher quality, newer technology at competitive pricing.the golf industry and carry multiple golf lines. Our sales objective is to offer our existing and prospective customers a dedicated, knowledgeable, and outstanding customer service team.
In addition, VTS recently engagedour team is dedicated to existing accounts that focus on up-selling and cross-selling additional products to our current customer base, securing renewal agreements, and providing excellent customer service. The current regions are:
| ● | Western Canada |
| ● | Eastern Canada |
| ● | Northeast USA |
| ● | Western USA |
| ● | Southeastern USA |
| ● | Midwest USA |
International Sales
DSG focuses on select global golf markets that offer significant volume opportunities and that value the benefits that our products deliver.
We utilize strategic distributor partnerships in each targeted region/country to sell, install and service our products. Distributors are selected based on market strength, market share, technical and selling capability, and overall reputation. We believe that DSG solutions appeal to all distributors because they are universal and fit any make or model of vehicle. We maintain and leverage our strong relationship with Yamaha, E-Z-GO and Ransomes Jacobsen (sister company to E-Z-GO) in developing our distributor network around the world. Today, many of our distributor partners are the leading distributors for E-Z-GO and RJ and hold a dominant position in their respective markets. While they are Yamaha or E-Z-GO distributors, most sell DSG products to all courses regardless of their choice of golf car as a value add to their customers and to generate additional revenue. We complement this distributor base with independent distributors as needed to ensure we have sufficient coverage in critical markets.
Currently DSG is focused on expanding in Europe, Asia and South Africa. The Company plans to expand next into Australia, New Zealand and Latin America.
Management Companies
Many golf facilities are managed by management companies. The portfolios of these companies vary from a few to hundreds of golf courses. Troon®, the world’s largest player in golf course management, has over 200 courses under management. The management companies provide everything from branding, staffing, management systems, marketing, and procurement. DSG is currently providing products and services to Troon, OB Sports, Kemper Sports, Trump, Marriott Golf, Blue Green, Crown Golf, American Golf, Billy Casper, Club Corp, and Club Link.
DSG has been successful in completing installations and developing relationships with several of the key players who control a substantial number of courses. DSG will continue to implement system developments that are driven by the needs of these management companies such as combined reporting, multiple course access through a centralized dashboard. This development will become a competitive advantage for DSG in the management company market.
| 17 |
DSG has dedicated a team to create specific collateral for this market and has assigned a senior executive to have direct responsibility to manage these relationships.
Competition
We compete with a telecommunications providernumber of established producers and distributors of vehicle fleet management systems. Our competitors include producers of golf specific applications, such as GPS Industries, LLC., one of the leading suppliers of golf cart fleet management systems, as well as producers of non-golf specific utility vehicle fleet management systems, such as Toro. Many of our competitors have longer operating histories, better brand recognition and greater financial resources than we do. In order for us to successfully compete in our industry we must:
| ● | demonstrate our products’ competitive advantages; | |
| ● | develop a comprehensive marketing system; and | |
| ● | increase our financial resources. |
However, there can be no assurance that even if we do these things, we will be able to compete effectively with the other companies in our industry.
We believe that we will be able to compete effectively in our industry because of the versatility, reliability, and relative affordability of our products when compared to those of our competitors. We will attempt to build awareness of our competitive advantages among existing and potential customers through trade shows, sales visits and demonstrations, online marketing, and positive word of mouth advertising.
However, as we are a newly established company relative to our competitors, we face the same problems as other new companies starting up in an industry, such as limited access to capital. Our competitors may be substantially larger and better funded than us, and have significantly longer histories of research, operation and development than us. In addition, they may be able to provide more competitive products than we can and generally be able to respond more quickly to new technologyor emerging technologies and changes in hardwarelegislation and wireless access through-outregulations relating to the world therefor allowing VTSindustry. Additionally, our competitors may devote greater resources to substantially reduce cellular cost.the development, promotion and sale of their products or services than we do. Increased competition could also result in loss of key personnel, reduced margins or loss of market share, any of which could harm our business.
Our primary competitor in the field of golf course fleet management is GPS Industries, a company that was founded in 1996 by our sole officer, founder and one of our directors, Mr. Bob Silzer. GPS Industries is currently the largest player in the marketplace with an installed base of approximately 750 golf courses worldwide. GPS Industries was consolidated by various mergers and acquisitions with a diversity of hardware platforms and application software. Since 2009, when GPS Industries has introduced their latest product offering called the Visage, in an exclusive partnership with Club Car, their strategy has been to target mostly their existing customers and motivate them into replacing their existing, older GPS system, with the Visage system.
GPS Industries is leveraging very heavily their partnership with Club Car, which is one of the three largest golf cart manufacturers in the world and at times is benefiting from golf operators’ preference for Club Car and their vehicles when they select their management system.
Market Mix
Since the introduction of the DSG product line, we have shown golf course operators that they have now access to a budget-friendly fleet management tool that works not only on golf carts but also with all other vehicles used on the golf course such as turf maintenance, shuttles, and other utility vehicles.
Marketing studies have identified that half of the golf course operators only need a fleet management system and only 15% need a high-end GPS golf system. This illustrates the strong competitive advantage that VTS TAG Systems has versus GPS Industries since their product can only address the needs of a relatively small fraction of the marketplace.
Consequently, GPS Industries’ installed base has steadily declined since most recentof their new product thatinstallations have replaced older product for existing customers and some customers have opted for a lower budget system and switched over to VTS TAG Systems.
Marketing Activities
The Company has a multi-layered approach marketing the TAG suite of products. One of the foundations of this plan is usedattending industry trade shows which are well attended by golf operators. The two largest shows are the PGA Merchandise Show and the Golf Industry Show which are held in Florida at the end of January. The Company also attends a number of regional shows around North America. International events are attended by our distributors and partners.
The second layer of marketing is memberships in key organizations such as the National Golf Course Owners Association, Golf Course Superintendents Association, and Club Managers Association of America. These are very influential in the industry and have marketing channels such as publications, email blasts, and web-based marketing. The Company also markets directly to increasecourse operators through email, surveys direct mail programs.
| 18 |
Lead Generation
One of the primary sources of lead generation is through the Company’s strategic partnerships with E-Z-GO, Yamaha, and Ransomes Jacobson. These relationships provide the Company with a great deal of market intelligence. The sales forces of the partners work in tandem with the DSG sales team by passing on the leads, creating joint proposals, and distributing TAG sales material. The Company has also created co-branded materials for specific value items of interest to operators such as Pace of Play on the course upsolutions. DSG sale s and marketing staff attend partner sales events to 90 minutes per round is the RAPTOR. Our 3 wheel single rider allows the course to revenue share with VTS as the RAPTOR is put on the course free of chargeconduct training and then allows the course to revenue share with VTS along the way. Each seat is rented to the customers for minimum $25 per round.discuss marketing strategies.
On March 26, 2019,The Company is in the process of testing an internal telemarketing program in several key markets to gauge whether this particular channel warrants larger scale implementation.
Competitive Advantages
Pricing
One of the “heroes” of the TAG System is providing the course operator a range of modular fleet management options that are very competitively priced. Pricing options range from the TURF, TAG, Infinity 7”, and Infinity XL 12” System, giving the customer a wide range of pricing options.
Functional advantages
DSG has the distinctive advantage of being able to offer a true fleet management system, encompassing all the vehicles on the golf course, not just the golf carts. Due to the modular nature of the system, customers have now the option to configure their system’s configuration to match exactly their needs and their budget.
Product advantages
DSG products are the robust, reliable, and user-friendly systems in the world. DSG is the only company currently providing systems that are waterproof with internal batteries to ensure our partners retain the full golf cart manufacturer’s warranty.
Operational Plan
Our Operations Department’s main functions are outlined below:
Product Supply Chain Management
| ● | Product procurement, lead-time management |
| ● | Inventory Control |
Customer Service
| ● | Training |
| ● | Troubleshooting & Support |
| ● | Hardware Repairs |
Installations
| ● | Content & graphics procurement |
| ● | System configurations |
| ● | Shipping and Installation |
Infrastructure Management
| ● | Communication Servers Management |
| ● | Cellular Data Carriers |
| ● | Service and administration tools |
Product Supply Chain
In order to maintain high product quality and control, as well as benefiting from cost savings, the Company is currently procuring all main hardware components offshore. Final assembly is locally performed in order to ensure product quality. Other main components are also procured directly from manufacturers or from local suppliers that outsource components office in order to keep the price as low as possible.
| 19 |
The Company is requesting the suppliers to perform a complete set of quality testing and minimum 24 hours’ burn-in before the product is delivered. The local hardware assembler and components supplier offers a 12-month warranty. The main hardware components offshore supplier offers a warranty plan of 15 months from the date the product is shipped. With an extended 90 days beyond the current warranty, such repair service would be paid by the supplier except for component replacement costs, which would be paid by DSG.
Another important activity related to the management of the product supply chain is working closely with the suppliers and ensuring that we have alternate sources for the main components and identify well in advance any components that may go “end-of-life” and find suitable replacements before product shortages may occur.
Inventory Control
The Company has implemented strict inventory management procedures that govern the inbound flow of products from suppliers, the outgoing flow to customers as well as the internal movement of inventory between warehouses (Canada, US and UK). There are also procedures in place to control the flow of equipment returning from customers for repairs and their replacements.
Installation
The Company is utilizing a small number of its own field engineers, geographically positioned to be in close proximity of areas with high concentrations of current and future customers. Occasionally, when new installations exceed the internal capacity, the company effectedemploys a reverse stock splitnumber of our authorized and issued and outstanding shares of common stockexternal contractors, on a four thousand (4,000) oldproject-by-project basis. Each contractor has been trained extensively to perform product installations and the Company has created an extensive collection of Installation Manuals for all products and vehicle types.
The product was designed with ease of installation as one (1) new basis. Upon effectof its features. Additionally, the installation process includes a pre-shipping configuration process that prepares each device with all the settings and graphics content (if applicable) required for the specific location it will be deployed. This makes the installation process a lot simpler and less time consuming in the field which reduces costs (accommodations, food, travel) for internal staff as well as external contractor cost (less billable time).
Another benefit of the reverse split, our authorized capital decreased from 3,000,000,000 pre-reverse split sharessimplified installation procedure is increased scalability in anticipation of common stock to 750,000 sharesincreased number of common stockinstalls in the future by reducing the skill level and correspondingly, our issued and outstanding shares of common stock decreased from 2,761,333,254 pre-reverse split to 690,403 shares of common stock, all with a par value of $0.001. Our shares of Preferred Stock remain unchanged.training time requirements for additional contractors.
Customer Service
The Company has deployed its Customer Service staff strategically, so it has at least one service representative active during business hours in North America, Europe and South Africa.
The Company is handling Customer Service directly in North America and UK, offering telephone and on-line support to end-customers. In other international markets, the first-line customer service is handled by local distributor’s staff while DSG is supplying training and more advanced support to the distributors.
For the management of the customer service activities, the Company is utilizing SalesForce.com CRM system which allows creating, updating, closing and escalation of service cases, including the issuance of RMA (Return Material Authorization) numbers for defective equipment. Using SalesForce.com also allows generation of management reports for service issues, customer satisfaction, and equipment failures in order to quickly identify trends, problem accounts or systemic issues.
In addition, DSG began offering the DSG Par 72 Service & Support Plan to guarantee service and support to client courses in the golf business, during fiscal 2016. This program for client courses which guarantees service and support programs within 24 hours of a problem arising.
Product Development and Engineering
The Company employs a team of software engineers in house to develop and maintain the main components of the server software and firmware.
All product development is derived from business needs assessment and customer requests.
The Product Manager is reviewing periodically the list of feature requests with the Sales, establishes priorities and updates the Product Roadmap.
The software engineers are also responsible for developing specialized tools and systems utilized increase efficiency in the operation of the Company. These projects include functionality such as: automated system monitoring, automatic service alerts, improved remote troubleshooting tools, cellular data monitoring and reporting. All these tools are critical in future ability to support more customers with less resources, streamline support, and improve internal efficiency.
All hardware development (electronics and mechanical) is generally outsourced, however small projects like mounting solutions or cabling are handled in house.
| 20 |
COVID-19
The recent outbreak of the coronavirus, also known as “COVID-19”, has spread across the globe and is impacting worldwide economic activity. Conditions surrounding the coronavirus continue to rapidly evolve and government authorities have implemented emergency measures to mitigate the spread of the virus. The outbreak and the related mitigation measures may have an adverse impact on global economic conditions as well as on the Company’s business activities. The extent to which the coronavirus may impact the Company’s business activities will depend on future developments, such as the ultimate geographic spread of the disease, the duration of the outbreak, travel restrictions, business disruptions, and the effectiveness of actions taken in Canada and other countries to contain and treat the disease. These events are highly uncertain and as such, the Company cannot determine their financial impact at this time. While certain restrictions are presently in the process of being relaxed, it is unclear when the world will return to the previous normal, if ever. This may adversely impact the expected implementation of the Company’s plans moving forward. The Company has seen a decline in its revenues for the nine months ending September 30, 2020 of approximately 41.8%, largely as a result of the challenges related to COVID-19.
Products and Services
Technology Overview
DSG produces a “modular” suite of products to provide fleet management solution for any vehicle required for a golf operation and provides two golfer information display options to meet the operators budget requirements. DSG believes that it is currently the only company in the golf fleet management industry with these capabilities.
The VTS TAG System is designed from the ground up to be a golf/turf vehicle fleet management system. Its main function is addressing the golf course operator needs. While employing same core technology (cellular wireless and GPS) as traditional commercial vehicle fleet management systems, DSG has created patent pending solutions to adapt it to the very specific requirements of the golf environment. Compared to mainstream fleet tracking products, DSG collects 10 to 50 times more data points per MB (megabyte) of cellular data due to its proprietary data collection and compression algorithms. Also the relative positioning accuracy is improved by almost one order of magnitude by the use of application-specific geo-data validation and correction methods.
DSG’s proprietary methods make it possible to offer a solution suitable for use on golf courses at a price low enough to be affordable in the industry. Every system component incorporates state-of-the-art technology (server, mobile trackers, display). In developing its products VTS TAG Systems has adopted an application orientedapplication-oriented approach placing the most emphasis (and research & development) on server and end-user software by taking advantage of the commodity level reached by mainstream technologies such as Global Positioning (GPS) and M2M (Machine to Machine) Cellular Data in the wider context of Commercial Fleet Management.
DSG leveraged the existence of an abundance of very cost-effective telematics solutions by selecting an “off-the-shelf” hardware platform that meets all the main performance and environmental requirements for operation in the harsh, outdoor golf course environment. While removing all risk and cost associated with developing a proprietary hardware platform, DSG has maintained the unique nature of its hardware solution by developing a set of proprietary adapters and interfaces specifically for the golf application.
DSG has secured an exclusive supply agreement with the third-party hardware manufacturers for the vertical of golf industry. Additionally, DSG owns the design of all proprietary adapters and interfaces. This removes the risk of a potential competitor utilizing the same hardware platform. Competitors could attempt to reverse engineer or copycat the TAG technology and equipment. This risk factor is mitigated by the fact that our product does not rely on a particular technology or hardware platform to be successful but on a very specific vertical software application that is far more difficult to copy (and respectively easier to protect).
The application software contains patent features implemented in every core component of the system. The TAG device runs DSG proprietary firmware incorporating unique data collection and compression algorithms. The web server software which powers the end-user application is also proprietary and incorporates the industry knowledge accumulated through the over 70 years of collective experience of the DSG team.
This approach has given the product line a high level of endurance against technology obsolescence. At any point in time, if a hardware component is discontinued or a better/less expensive hardware platform becomes available, the software application can be easily adapted to operate on the new platform or with the new component. The company benefits from the constant increase of performance and cost reduction of mainstream hardware technology without any additional cost.
| 10 |
The web-based Software-as-a-Service (SaaS) model used by VTS TAG System is optimal for low operating and support costs and rapid-cycle release for software updates. It is also a major factor in eliminating or substantially reducing the need for any end-user premises equipment. Customers have access to the service through any internet connected computer or mobile device, there is no need for a local wireless network on the facility and installation time and cost are minimal.
DSG is positioned to take advantage of mainstream technology and utilize “best of breed” hardware platforms to create new generations of products. Our software is designed to be “portable” to future new platforms with better GPS and wireless technology in order to maintain the Company competitive edge.
All new product development effort of DSG is following the same model: select the best of breed third-party hardware platform, design and produce custom proprietary accessories while focusing the bulk of the development efforts on vertical software application to address a very specific set of end-customer needs.
The latest addition to the TAG family of products, the TAG INFINITY is a perfect example of this development philosophy in action: the main component is a last-generation Android tablet PC wrapped in a custom designed outdoor enclosure containing the power supply and interface components required for the golf environment. The software application is taking advantage of all the advanced high-resolution graphics, touch user interface and computing power of the Android OS delivering a vastly superior user experience compared to competitive systems. The time to market for this product was 30% of how long it took to develop and launch this type of products in the past.
The TAG Control Unit
The company’s flagship product is the TAG Control unit. The TAG can operate as a “stand alone” unit or with one of two displays; the INFINITY 7” alphanumeric display or the INFINITY high definition “touch activated” screen. The TAG is GPS enabled and communicates with the TAG software using cellular GSM networks. Utilizing the cellular networks rather than erecting a local Wi-Fi network assures carrier grade uptime, and vehicle tracking “off- property”. GSM is the de facto global standard for mobile communications.
The TAG unit itself is discreetly installed usually in the nose of the vehicle to give the GPS clear line of site. It is then connected to the vehicle battery and ignition. The property is then mapped using the latest satellite imagery that is graphically enhanced and loaded into the TAG System as a map.
Once installed the vehicle owner utilizes the TAG software to locate the vehicle in real time using any computer, smartphone, or tablet that has an internet connection and perform various management operations.

The operator can use the geo-fencing capabilities to create “zones” on the property where they can control the vehicles behavior such as shutting down a vehicle that is entering a sensitive or dangerous area. The TAG System also monitors the strength of the vehicle’s battery helping to prevent sending out vehicles undercharged batteries which can be an inconvenience for the course and negatively impact the golfer experience.
| 11 |
Features and Benefits
| ● | Internal battery utilizing Smart Power technology which charges the battery only when the vehicle is running (gas) or being charged (electric) |
| ● | Pace of Play management and reporting which is a critical statistic for the golf operator |
| ● | No software to install |
| ● | Web based access on any computer, smartphone, or tablet |
| ● | Set up restricted zones to protect property, vehicles, and customers |
| ● | Real time tracking both on and off property (using Street Maps) |
| ● | Email alerts of zone activity |
| ● | Cart lockdown |
| ● | Detailed usage reporting for improved maintenance, proper vehicle rotation, and staff efficiency |
| ● | Geo fencing security features |
| ● | Ability to enforce cart path rules which is key to protecting course on wet weather days |
| ● | Modular system allows for hardware and feature options to fit any budget or operations |
INFINITY 7” Display
The INFINITY 7” is paired with the TAG Control unit as DSG’s entry level display system for operators who desire to provide basic hole distance information and messaging to the golf customer. The INFINITY 7” is a very cost-effective solution for operators who desire to give their customers GPS services with the benefits of a Fleet Management back end. The INFINITY 7” can be mounted on the steering column or the dash depending on the customer’s preference.

VTS’s entry level alphanumeric golf information display
Features and benefits
| ● | Hole information display |
| ● | Yardage displays for front, middle, back locations of the pin |
| 12 |
| ● | Messaging capabilities – to individual carts or fleet broadcast |
| ● | Zone violation warnings |
| ● | Pace of Play notifications |
| ● | Smart battery technology to prevent power drain |
| ● | Versatile mounting option |
INFINITY XL 12” Display
The INFINITY XL 12” is a solution for operators who desire to provide a high-level visual information experience to their customers. The INFINITY XL 12” is a high definition “Infinity XL 12” ” activated“activated display screen mounted in the golf cart integrated with the TAG Control unit to provide a full back/front end Fleet Management solution. The INFINITY XL 12” displays hole graphics, yardage, and detailed course information to the golfer and provides interactive features such as Food and Beverage ordering and scorekeeping.

The industry leading Infinity XL 12” HD – the most sophisticated display in the market.
Features and Benefits
| ● | Integrated Food and Beverage ordering |
| ● | Pro Tips |
| ● | Flyover capability |
| ● | Daily pin placement display |
| ● | Interactive Scorecard with email capability |
| ● | Multiple language choices |
| ● | No power drain with Smart Battery technology |
| ● | Full broadcast messaging capabilities |
| ● | Pace of Play display |
| 13 |
| ● | Vivid hole graphics |
| ● | Option of steering or roof mount |
| ● | Generate advertising revenue and market additional services |
PROGRAMMATIC Advertising Platform
A unique feature of the INFINITY XL 12” system is the advertising display capability. This can be used by the operator for internal promotion of services or for generating revenue by selling the ad real estate since the golf demographic is very desirable to advertisers. The INFINITY XL 12” displays banner, panel, full page, pro tip, and Green view ads. There is also ad real estate on the interactive feature screens for Food and Beverage ordering and the scorecard. The Infinity XL 12” System can also display animated GIF files or play video for added impact.

| 14 |

Advertising displayed in multiple formats including animated GIF and video
DSG has developed proprietary “Ad Manager” software which is used to place and change the ads on the system(s) from a central NOC (Network Operations Center) in real time. The Ad Manager can deploy to a single system or multiple systems. This creates a network of screens that is also very desirable to advertisers as ad content can be deployed locally, regionally, or nationally. The advertising platform is an important part of the company’s future marketing and sales strategy.

DSG R3 Advertising Platform
The DSG R3 program delivers advance ROI (Revenue Optimization Intelligence). Utilizing all streams of advertising delivery, such as automated, direct, and self-serve. The R3 program has the ability to deliver relevant advertising to golfers the moment they sit in the cart. The R3 model is more effective than the previous advertising model of ‘One to One’, these are local ads only sold through direct sales by courses, or 3rdparty advertising sales firms. The new R3 model offers ‘Many to one’ advertising options, delivering thousands of national, regional, and local advertisers an opportunity to advertise on our screens through our R3 Marketplace.

Previous ‘One to One’ model vs the new R3 model ‘Many to One’

TAG TURF/ECO TAG
The TAG Turf and the new ECO TAG were developed to give course operators the same back end management features for their turf equipment and utility vehicles. Turf equipment is expensive, and a single piece can run over $100,000 and represents a large portion of a golf course operating budget. The TAG Turf and ECO TAG have comprehensive reporting that the operator can utilize to implement programs that can increase efficiencies, reduce labor costs, help lower idle times, provide fuel consumption and equipment performance, provide historical data on cutting patterns, and reduce pollution from emissions by monitoring idle times. Since the golf course needs to be maintained regardless of volume these cost saving measures directly impact the operator’s bottom line.
| 15 |
Features and Benefits
| ● | Can be installed on any turf, utility, or service vehicle |
| ● | Work activity tracking and management |
| ● | Work breakdown and analysis per area, work group, activity type or specific vehicle |
| ● | Vehicle idling alerts |
| ● | Zone entry alerts |
| ● | Detailed travel (cutting patterns) history |
| ● | Detailed usage reports with mileage and hours |
| ● | Protection for ecological areas through geo fencing |
| ● | Vehicle lock down and ‘off property’ locating features |

The TAG Turf provides detailed trail history and cutting patterns
Revenue Model
DSG derives revenue from four different sources.
Systems Sales Revenue, which consists of the sales price paid by those customers who purchase our TAG system hardware lease our TAG system hardware.
Monthly Service Feesare paid by all customers for the wireless data fee charges required to operate the GPS tracking on the TAG systems.
Monthly Rental Feesare paid by those customers that rent the TAG system hardware. The amount of a customer’s monthly payment varies based on the type of equipment rented (a TAG, a TAG and INFINITY 7”, or a TAG and INFINITY XL 12”).
Programmatic Advertising Revenueis a new source of revenue that we believe has the potential to be strategic for us in the future. We are in the process of implementing and designing software to provide advertising and other media functionality on our INFINITY.
We recognize revenue when persuasive evidence of an arrangement exists, delivery has occurred, the fee is fixed or determinable, and collectability is reasonably assured. In instances where final acceptance of the product is specified by the customer, revenue is deferred until all acceptance criteria have been met. We accrue for warranty costs, sales returns, and other allowances based on its historical experience.
Our revenue recognition policies are discussed in more detail under “Note 2 – Summary of Significant Accounting Policies” in the notes to our Condensed Consolidated Financial Statements included in Part I, Item 1 of this Form 10-Q.Statements.
| 16 |
Markets
Sales and Marketing Plan
The market for the TAG System is the worldwide golf cart and Turf equipment fleets. There are 40,000 golf courses around the world with North America being the largest individual market with 20,000. This represents over 3,000,000 vehicles. The golf market has five distinct types of operations. Municipal, Private Country Clubs, Destination Resorts, Public Commercial, Military and University affiliated. VTS has deployed and has case studies developed TAG systems in each of these categories.
Our marketing strategy is focused on building brand awareness, generating quality leads, and providing excellent customer service.
North America Sales
Since the largest market is North America the Company employs a direct sales team and sales agents that provide full sales coverage. Our sales agents are experienced golf industry professionals who maintain established relationships with the golf industry and carry multiple golf lines. Our sales objective is to offer our existing and prospective customers a dedicated, knowledgeable, and outstanding customer service team.
In addition, our team is dedicated to existing accounts that focus on up-selling and cross-selling additional products to our current customer base, securing renewal agreements, and providing excellent customer service. The current regions are:
| ● | Western Canada |
| ● | Eastern Canada |
| ● | Northeast USA |
| ● | Western USA |
| ● | Southeastern USA |
| ● | Midwest USA |
International Sales
DSG focuses on select global golf markets that offer significant volume opportunities and that value the benefits that our products deliver.
We utilize strategic distributor partnerships in each targeted region/country to sell, install and service our products. Distributors are selected based on market strength, market share, technical and selling capability, and overall reputation. We believe that DSG solutions appeal to all distributors because they are universal and fit any make or model of vehicle. We maintain and leverage our strong relationship with Yamaha, E-Z-GO and Ransomes Jacobsen (sister company to E-Z-GO) in developing our distributor network around the world. Today, many of our distributor partners are the leading distributors for E-Z-GO and RJ and hold a dominant position in their respective markets. While they are Yamaha or E-Z-GO distributors, most sell DSG products to all courses regardless of their choice of golf car as a value add to their customers and to generate additional revenue. We complement this distributor base with independent distributors as needed to ensure we have sufficient coverage in critical markets.
Currently DSG is focused on expanding in Europe, Asia and South Africa. The Company hasplans to expand next into Australia, New Zealand and Latin America.
Management Companies
Many golf facilities are managed by management companies. The portfolios of these companies vary from a few to hundreds of golf courses. Troon®, the world’s largest player in golf course management, has over 200 courses under management. The management companies provide everything from branding, staffing, management systems, marketing, and procurement. DSG is currently providing products and services to Troon, OB Sports, Kemper Sports, Trump, Marriott Golf, Blue Green, Crown Golf, American Golf, Billy Casper, Club Corp, and Club Link.
DSG has been successful in completing installations and developing relationships with several of the key players who control a substantial number of courses. DSG will continue to implement system developments that are driven by the needs of these management companies such as combined reporting, multiple course access through a centralized dashboard. This development will become a competitive advantage for DSG in the management company market.
| 17 |
DSG has dedicated a team to create specific collateral for this market and has assigned a senior executive to have direct responsibility to manage these relationships.
Competition
We compete with a number of established producers and distributors of vehicle fleet management systems. Our competitors include producers of golf specific applications, such as GPS Industries, LLC., one of the leading suppliers of golf cart fleet management systems, as well as producers of non-golf specific utility vehicle fleet management systems, such as Toro. Many of our competitors have longer operating histories, better brand recognition and greater financial resources than we do. In order for us to successfully compete in our industry we must:
| ● | demonstrate our products’ competitive advantages; | |
| ● | develop a comprehensive marketing system; and | |
| ● | increase our financial resources. |
However, there can be no assurance that even if we do these things, we will be able to compete effectively with the other companies in our industry.
We believe that we will be able to compete effectively in our industry because of the versatility, reliability, and relative affordability of our products when compared to those of our competitors. We will attempt to build awareness of our competitive advantages among existing and potential customers through trade shows, sales visits and demonstrations, online marketing, and positive word of mouth advertising.
However, as we are a newly-establishednewly established company relative to our competitors, we face the same problems as other new companies starting up in an industry, such as limited access to capital. Our competitors may be substantially larger and better funded than us, and have significantly longer histories of research, operation and development than us. In addition, they may be able to provide more competitive products than we can and generally be able to respond more quickly to new or emerging technologies and changes in legislation and regulations relating to the industry. Additionally, our competitors may devote greater resources to the development, promotion and sale of their products or services than we do. Increased competition could also result in loss of key personnel, reduced margins or loss of market share, any of which could harm our business.
Our primary competitor in the field of golf course fleet management is GPS Industries, a company that was founded in 1996 by our sole officer, founder and one of our directors, Mr. Bob Silzer, the founder of VTS TAG Systems Inc.Silzer. GPS Industries is currently the largest player in the marketplace with an installed base of approximately 750 golf courses worldwide. GPS Industries was consolidated by various mergers and acquisitions with a diversity of hardware platforms and application software. Since 2009, when GPS Industries has introduced their latest product offering called the Visage, in an exclusive partnership with Club Car, their strategy has been to target mostly their existing customers and motivate them into replacing their existing, older GPS system, with the Visage system.
GPS Industries is leveraging very heavily their partnership with Club Car, which is one of the three largest golf carscart manufacturers in the world and at times is benefiting from golf operators’ preference for Club Car and their vehicles when they select their management system.
Market Mix
Since the introduction of the DSG product line, thewe have shown golf course operators realized that they have now access to a budget-friendly fleet management tool that works not only on golf carscarts but also with all other vehicles used on the golf course such as turf maintenance, shuttles, and other utility vehicles.
Marketing studies have identified that half of the golf course operators only need a fleet management system and only 15% need a high-end GPS golf system. This illustrates the strong competitive advantage that VTS TAG Systems has versus GPS Industries since their product can only address the needs of a relatively small fraction of the marketplace.
Consequently, GPS IndustriesIndustries’ installed base has steadily declined since most of their new product installations have replaced older product for existing customers and some customers have opted for a lower budget system and switched over to VTS TAG Systems.
Marketing Activities
The Company has a multi layeredmulti-layered approach marketing the TAG suite of products. One of the foundations of this plan is attending industry trade shows which are well attended by golf operators. The two largest shows are the PGA Merchandise Show and the Golf Industry Show which are held in Florida at the end of January. The Company also attends a number of regional shows around North America. International events are attended by our distributors and partners.
The second layer of marketing is memberships in key organizations such as the National Golf Course Owners Association, Golf Course Superintendents Association, and Club Managers Association of America. These are very influential in the industry and have marketing channels such as publications, email blasts, and web-based marketing. The Company also markets directly to course operators through email, surveys direct mail programs.
| 18 |
Lead Generation
One of the primary sources of lead generation is through the Company’s strategic partnerships with E-Z-GO, Yamaha, and Ransomes Jacobson. These relationships provide the Company with a great deal of market intelligence. The sales forces of the partners work in tandem with the DSG sales team by passing on the leads, creating joint proposals, and distributing TAG sales material. The Company has also created co-branded materials for specific value items of interest to operators such as Pace of Play solutions. DSG sale s and marketing staff attend partner sales events to conduct training and discuss marketing strategies.
The Company is in the process of testing an internal telemarketing program in several key markets to gauge whether this particular channel warrants larger scale implementation.
Competitive Advantages
Pricing
One of the “heroes” of the TAG System is providing the course operator a range of modular fleet management options that are very competitively priced. Pricing options range from the TURF, TAG, Infinity 7”, and Infinity XL 12” System, giving the customer a wide range of pricing options.
Functional advantages
DSG has the distinctive advantage of being able to offer a true fleet management system, encompassing all the vehicles on the golf course, not just the golf carts. Due to the modular nature of the system, customers have now the option to configure their system’s configuration to match exactly their needs and their budget.
Product advantages
DSG products are the robust, reliable, and user-friendly systems in the world. DSG is the only company currently providing systems that are waterproof with internal batteries to ensure our partners retain the full golf cart manufacturer’s warranty.
Operational Plan
Our Operations Department’s main functions are outlined below:
Product Supply Chain Management
| ● | Product procurement, lead-time management |
| ● | Inventory Control |
Customer Service
| ● | Training |
| ● | Troubleshooting & Support |
| ● | Hardware Repairs |
Installations
| ● | Content & graphics procurement |
| ● | System configurations |
| ● | Shipping and Installation |
Infrastructure Management
| ● | Communication Servers Management |
| ● | Cellular Data Carriers |
| ● | Service and administration tools |
Product Supply Chain
In order to maintain high product quality and control, as well as benefiting from cost savings, the Company is currently procuring all main hardware components offshore. Final assembly is locally performed in order to ensure product quality. Other main components are also procured directly from manufacturers or from local suppliers that outsource components office in order to keep the price as low as possible.
| 19 |
The Company is requesting the suppliers to perform a complete set of quality testing and minimum 24 hours’ burn-in before the product is delivered. The local hardware assembler and components supplier offers 12 months’a 12-month warranty. The main hardware components offshore supplier offers a warranty plan of 15 months from the date the product is shipped. With an extended 90 days beyond the current warranty, such repair service would be paid by the supplier except for component replacement costs, which would be paid by DSG.
Another important activity related to the management of the product supply chain is working closely with the suppliers and ensuring that we have alternate sources for the main components and identify well in advance any components that may go “end-of-life” and find suitable replacements before product shortages may occur.
Inventory Control
The Company has implemented strict inventory management procedures that govern the inbound flow of products from suppliers, the outgoing flow to customers as well as the internal movement of inventory between warehouses (Canada, US and UK). There are also procedures in place to control the flow of equipment returning from customers for repairs and their replacements.
Installation
The Company is utilizing a small number of its own field engineers, geographically positioned to be in close proximity of areas with high concentrations of current and future customers. Occasionally, when new installations exceed the internal capacity, the company employs a number of external contractors, on a project by projectproject-by-project basis. Each contractor has been trained extensively to perform product installations and the Company has created an extensive collection of Installation Manuals for all products and vehicle types.
The product was designed with ease of installation as one of its features. Additionally, the installation process includes a pre-shipping configuration process that prepares each device with all the settings and graphics content (if applicable) required for the specific location it will be deployed. This makes the installation process a lot simpler and less time consuming in the field which reduces costs (accommodations, food, travel) for internal staff as well as external contractor cost (less billable time).
Another benefit of the simplified installation procedure is increased scalability in anticipation of increased number of installs in the future by reducing the skill level and training time requirements for additional contractors.
Customer Service
The Company has deployed its Customer Service staff strategically, so it has at least one service representative active during business hours in North America, Europe and South Africa.
The Company is handling Customer Service directly in North America and UK, offering telephone and on-line support to end-customers. In other international markets, the first-line customer service is handled by local distributor’s staff while DSG is supplying training and more advanced support to the distributors.
For the management of the customer service activities, the Company is utilizing SalesForce.com CRM system which allows creating, updating, closing and escalation of service cases, including the issuance of RMA (Return Material Authorization) numbers for defective equipment. Using SalesForce.com also allows generation of management reports for service issues, customer satisfaction, and equipment failures in order to quickly identify trends, problem accounts or systemic issues.
In addition, DSG began offering the DSG Par 72 Service & Support Plan to guarantee service and support to client courses in the golf business, during fiscal 2016. This program for client courses which guarantees service and support programs within 24 hours of a problem arising.
Product Development and Engineering
The Company employs a team of software engineers in house to develop and maintain the main components of the server software and firmware.
All product development is derived from business needs assessment and customer requests.
The Product Manager is reviewing periodically the list of feature requests with the Sales, establishes priorities and updates the Product Roadmap.
The software engineers are also responsible for developing specialized tools and systems utilized increase efficiency in the operation of the Company. These projects include functionality such as: automated system monitoring, automatic service alerts, improved remote troubleshooting tools, cellular data monitoring and reporting. All these tools are critical in future ability to support more customers with less resources, streamline support, and improve internal efficiency.
All hardware development (electronics and mechanical) is generally outsourced, however small projects like mounting solutions or cabling are handled in house.
| 20 |
GHS Equity Financing AgreementCOVID-19
The recent outbreak of the coronavirus, also known as “COVID-19”, has spread across the globe and Registration Rights Agreementis impacting worldwide economic activity. Conditions surrounding the coronavirus continue to rapidly evolve and government authorities have implemented emergency measures to mitigate the spread of the virus. The outbreak and the related mitigation measures may have an adverse impact on global economic conditions as well as on the Company’s business activities. The extent to which the coronavirus may impact the Company’s business activities will depend on future developments, such as the ultimate geographic spread of the disease, the duration of the outbreak, travel restrictions, business disruptions, and the effectiveness of actions taken in Canada and other countries to contain and treat the disease. These events are highly uncertain and as such, the Company cannot determine their financial impact at this time. While certain restrictions are presently in the process of being relaxed, it is unclear when the world will return to the previous normal, if ever. This may adversely impact the expected implementation of the Company’s plans moving forward. The Company has seen a decline in its revenues for the nine months ending September 30, 2020 of approximately 41.8%, largely as a result of the challenges related to COVID-19.
Company Organization
Boreal Productions Inc. (the “Company”) was incorporated under the laws of the State of Nevada on September 24, 2007. The Company was formed to option feature films and TV projects and then package them to sell at a profit to various studios and production companies.
On April 13, 2015, we entered into a share exchange agreement with DSG Tag Systems, Inc. (“DSG TAG”) and the shareholders of DSG TAG who become parties to the share exchange agreement. Pursuant to the terms of the share exchange agreement, we agreed to acquire not less than 75% and up to 100% of the issued and outstanding shares of DSG TAG’s common stock in exchange for the issuance by our company of up to 20,000,000 shares of our common stock to the shareholders of DSG TAG on the basis of one of our common shares for 5.4935 common shares of DSG TAG.
Previously, in anticipation of the share exchange agreement with DSG TAG, we undertook to change our name and effect a reverse stock split of our authorized and issued common stock. Accordingly, on January 19, 2015, our board of directors approved an agreement and plan of merger to merge with our wholly owned subsidiary DSG Global Inc., a Nevada corporation, to effect a name change from Boreal Productions Inc. to DSG Global Inc. Our company remains the surviving company. DSG Global Inc. was formed solely for the change of name.
Also on January 19, 2015, our company’s board of directors approved a resolution to effect a reverse stock split of our authorized and issued and outstanding shares of common stock on a three (3) for one (1) basis. Upon effect of the reverse split, our authorized capital decreased from 375,000,000 shares of common stock to 125,000,000 shares of common stock and correspondingly, our issued and outstanding shares of common stock decreased from 30,000,000 to 10,000,000 shares of common stock, all with a par value of $0.001.
Articles of Merger to effect the merger and change of name and a Certificate of Change to effect the reverse stock split were filed with the Nevada Secretary of State on January 22, 2015, with an effective date of February 2, 2015. The name change and forward split were reviewed by the Financial Industry Regulatory Authority (FINRA) were approved for filing with an effective date of February 23, 2015.
The name change became effective with the Over-the-Counter Bulletin Board and OTC Markets quotation system at the opening of trading on February 23, 2015 under the symbol “BRPOD”. Effective March 19, 2015 our stock symbol changed to “DSGT”. Our new CUSIP number following the symbol change is 23340C104. The first trade of our common shares occurred on March 25, 2015.
On May 6, 2015, we completed the acquisition of approximately 75% (82,435,748 common shares) of the issued and outstanding common shares of DSG TAG Systems as contemplated by the share exchange agreement by issuing 15,185,875 shares of our common stock to shareholders of DSG TAG Systems who became parties to the agreement. In addition, concurrent with the closing of the share exchange agreement, we issued an additional 179,823 shares of our common stock to Westergaard Holdings Ltd. in partial settlement of accrued interest on outstanding indebtedness of DSG TAG Systems.
Following the initial closing of the share exchange agreement and through October 22, 2015, we acquired an additional 101,200 shares of common stock of DSG TAG from shareholders who became parties to the share exchange agreement and issued to these shareholders an aggregate of 18,422 pre-reverse split shares of our common stock. Following completion of these additional purchases, DSG Global Inc. owns 100% of the issued and outstanding shares of common stock of DSG TAG.
The reverse acquisition was accounted for as a recapitalization effected by a share exchange, wherein DSG TAG Systems is considered the acquirer for accounting and financial reporting purposes. The assets and liabilities of the acquired entity have been brought forward at their book value and no goodwill has been recognized. We adopted the business and operations of DSG TAG Systems upon the closing of the share exchange agreement.
Subsequent to the closing of the share exchange agreement with DSG TAG, we adopted the business and operations of DSG TAG.
DSG TAG was incorporated under the laws of the State of Nevada on April 17, 2008 and extra provincially registered in British Columbia, Canada in 2008. In March 2011, DSG TAG formed DSG Tag Systems International, Ltd. in the United Kingdom (“DSG UK”). DSG UK is a wholly owned subsidiary of DSG TAG.
On March 26, 2019, we effected a reverse stock split of our authorized and issued and outstanding shares of common stock on a four thousand (4,000) for one (1) basis. Upon effect of the reverse split, our authorized capital decreased from 3,000,000,000 pre-reverse split shares of common stock to 750,000 shares of common stock and correspondingly, our issued and outstanding shares of common stock decreased from 2,761,333,254 pre-reverse split to 690,403 shares of common stock, all with a par value of $0.001. Our outstanding shares of Preferred Stock remain unchanged.
Subsequent to the closing of the share exchange agreement with DSG Tag Systems, Inc. (“DSG TAG”), we adopted the business and operations of DSG TAG. DSG TAG is now known as Vantage Tag Systems, Inc. (“VTS”).
Our principal executive office is located at 207-15272 Croydon Drive, Surrey, BC, V3Z 0Z5 Canada. The telephone number at our principal executive office is 1 (877) 589-8806. The Company’s stock symbol is DSGT
| 21 |
Summary of the Offering
Consolidated Financial SummaryInformation
The tables and information below are derived from our consolidated financial statements for the six ended June 30, 2019 and the 12 monthsyear ended December 31, 2018. Our total stockholder’s deficit as of June 30, 2019 was $13,491,805.2020 and the year ended December 31, 2019. Our total stockholder’s deficit as of December 31, 20182020 was $13,370,783.$3,049,119. Our total stockholder’s deficit as of December 31, 2019 was $8,329,124. As of June 30, 2019,December 31, 2020, we had $31,820$1,372,016 of cash on hand. Our historical results are not necessarily indicative of future results of operations and the results of operations for the year ended December 31, 2020 are not necessarily indicative of results for the full year. You should read the following financial information together with the information under “Management’s Discussion and Analysis of Financial Condition and Results of Operations” and our consolidated financial statements and the notes thereto, and our unaudited interim condensed consolidated financial statements and the notes thereto included elsewhere in this prospectus.
| June 30, 2019 | Year End December 31, 2018 | Year End December 31, 2020 | Year End December 31, 2019 | |||||||||||||
| Cash | 31,820 | $ | 5,059 | 1,372,016 | $ | 25,494 | ||||||||||
| Total Assets | 550,111 | 352,713 | 2,103,562 | 406,141 | ||||||||||||
| Total Current Liabilities | 7,339,466 | 7,021,046 | 2,529,034 | 8,627,233 | ||||||||||||
| Total Stockholder’s Equity (Deficit) | (13,491,805 | ) | (13,370,783 | ) | (3,049,119 | ) | (8,329,124 | ) | ||||||||
Statement of Operations
| Six Months Ended June 30, 2019 | Year End December 31, 2018 | Year End December 31, 2020 | Year End December 31, 2019 | |||||||||||||
| Revenue | 786,070 | 1,281,024 | 900,482 | 1,399,420 | ||||||||||||
| Other Income (Expense) | 6,997,648 | (8,641,587 | ) | (1,107,403 | ) | (651,577 | ) | |||||||||
| Net Income (Loss) for the Period | 6,893,187 | (9,825,404 | ) | (6,177,099 | ) | (3,078,120 | ) | |||||||||
| Net Loss per Share | 9.80 | (28.88 | ) | (0.17 | ) | (3.84 | ) | |||||||||
| 22 |
This investment has a high degree of risk. Before you invest you should carefully consider the risks and uncertainties described below and the other information in this prospectus. If any of the following risks actually occur, our business, operating results and financial condition could be harmed, and the value of our stock could go down. This means you could lose all or a part of your investment.
Special Information Regarding Forward-Looking Statements
Some of the statements in this prospectus are “forward-looking statements.” These forward-looking statements involve certain known and unknown risks, uncertainties and other factors which may cause our actual results, performance or achievements to be materially different from any future results, performance or achievements expressed or implied by these forward-looking statements. These factors include, among others, the factors set forth herein under “Risk Factors.” The words “believe,” “expect,” “anticipate,” “intend,” “plan,” and similar expressions identify forward-looking statements. We caution you not to place undue reliance on these forward-looking statements. We undertake no obligation to update and revise any forward-looking statements or to publicly announce the result of any revisions to any of the forward-looking statements in this document to reflect any future or developments. However, the Private Securities Litigation Reform Act of 1995 is not available to us as a non- reporting issuer. Further, Section 27A(b)(2)(D) of the Securities Act and Section 21E(b)(2)(D) of the Securities Exchange Act expressly state that the safe harbor for forward looking statements does not apply to statements made in connection with an initial public offering.
RISKS RELATED TO OUR COMPANY
Our limited operating history may not serve as an adequate basis to judge our future prospects and results of operations.
DSG Global has a relatively limited operating history. Our limited operating history and the unpredictability of the wealth management industry make it difficult for investors to evaluate our business. An investor in our securities must consider the risks, uncertainties and difficulties frequently encountered by companies in rapidly evolving markets.
We will need additional financing to implement our business plan.
The Company will need additional financing to fully implement its business plan in a manner that not only continues to expand an already established direct-to-consumer approach, but also allows the Company to establish a stronger brand name in all the areas in which it operates. In particular, the Company will need additional financing to:
| ● | Effectuate its business plan and further develop its product and service lines; | |
| ● | Expand its facilities, human resources, and infrastructure; and | |
| ● | Increase its marketing efforts and lead generation. |
There are no assurances that additional financing will be available on favorable terms, or at all. If additional financing is not available, the Company will need to reduce, defer or cancel development programs, planned initiatives and overhead expenditures. The failure to adequately fund its capital requirements could have a material adverse effect on the Company’s business, financial condition and results of operations. Moreover, the sale of additional equity securities to raise financing will result in additional dilution to the Company’s stockholders and incurring additional indebtedness could involve the imposition of covenants that restrict the Company’s operations.
Our products and services are subject to changes in applicable laws and regulations.
The Company’s business is particularly subject to changing federal and state laws and regulations related to the provision of financial services to consumers. The Company’s continued success depends in part on its ability to anticipate and respond to these changes, and the Company may not be able to respond in a timely or commercially appropriate manner. If the Company fails to adjust its products and services in response to changing legal and/or regulatory requirements, the ability to deliver its products and services may be hindered, which in turn could have an adverse effect on the Company’s business, financial condition and results of operations.
We may continue to encounter substantial competition in our business.
The Company believes that existing and new competitors will continue to improve their products and services, as well as introduce new products and services with competitive price and performance characteristics. The Company expects that it must continue to innovate, and to invest in product development and productivity improvements, to compete effectively in the several markets in which the Company participates. The Company’s competitors could develop a more efficient product or service or undertake more aggressive and costly marketing campaigns than those implemented by the Company, which could adversely affect the Company’s marketing strategies and have an adverse effect on the Company’s business, financial condition and results of operations.
| 23 |
Important factors affecting the Company’s current ability to compete successfully include:
| ● | lead generation and marketing costs; | |
| ● | service delivery protocols; | |
| ● | branded name advertising; and | |
| ● | product and service pricing. |
In periods of reduced demand for the Company’s products and services, the Company can either choose to maintain market share by reducing product and service pricing to meet the competition, or maintain its product and service pricing, which would likely sacrifice market share. Sales and overall profitability may be reduced in either case. In addition, there can be no assurance that additional competitors will not enter the Company’s existing markets, or that the Company will be able to continue to compete successfully against its competition.
We may not successfully manage our growth.
Our success will depend upon the expansion of our operations and the effective management of our growth, which will place a significant strain on our management and on our administrative, operational and financial resources. To manage this growth, we must expand our facilities, augment our operational, financial and management systems, and hire and train additional qualified personnel. If we are unable to manage our growth effectively, our business would be harmed.
We rely on key executive officers, and their knowledge of our business and technical expertise would be difficult to replace.
We are highly dependent on our executive officers.officer. If one or more of the Company’s senior executivesexecutive or other key personnel are unable or unwilling to continue in their present positions, the Company may not be able to replace them easily or at all, and the Company’s business may be disrupted. Competition for senior management personnel is intense, the pool of qualified candidates is very limited, and we may not be able to retain the services of our senior executives or attract and retain high-quality senior executives in the future. Such failure could have a material adverse effect on the Company’s business, financial condition and results of operations.
We may never pay dividends to our common stockholders.
The Company currently intends to retain its future earnings to support operations and to finance expansion; accordingly, the Company does not anticipate paying any cash dividends in the foreseeable future.
The declaration, payment and amount of any future dividends on common stock will be at the discretion of the Company’s Board of Directors, and will depend upon, among other things, earnings, financial condition, capital requirements, level of indebtedness and other considerations the Board of Directors considers relevant. There is no assurance that future dividends will be paid on common stock or, if dividends are paid, the amount thereof.
Our common stock is quoted through the OTC Markets, which may have an unfavorable impact on our stock price and liquidity.
The Company’s common stock is quoted on the OTC Markets, which is a significantly more limited market than the New York Stock Exchange or NASDAQ. The trading volume may be limited by the fact that many major institutional investment funds, including mutual funds, follow a policy of not investing in OTC Markets stocks and certain major brokerage firms restrict their brokers from recommending OTC Markets stocks because they are considered speculative and volatile.
The trading volume of the Company’s common stock has been and may continue to be limited and sporadic. As a result, the quoted price for the Company’s common stock on the OTC Markets may not necessarily be a reliable indicator of its fair market value.
Additionally, the securities of small capitalization companies may trade less frequently and in more limited volume than those of more established companies. The market for small capitalization companies is generally volatile, with wide price fluctuations not necessarily related to the operating performance of such companies.
Our common stock is subject to price volatility unrelated to our operations.
The market price of the Company’s common stock could fluctuate substantially due to a variety of factors, including market perception of the Company’s ability to achieve its planned growth, operating results of the Company and of other companies in the same industry, trading volume in the Company’s common stock, changes in general conditions in the economy and the financial markets or other developments affecting the Company or its competitors.
Our common stock is classified as a “penny stock.”
Rule 3a51-1 of the Securities Exchange Act of 1934 establishes the definition of a “penny stock,” for purposes relevant to us, as any equity security that has a minimum bid price of less than $5.00 per share or with an exercise price of less than $5.00 per share, subject to a limited number of exceptions which are not available to us. It is likely that the Company’s common stock will be considered to be a penny stock for the immediately foreseeable future.
For any transaction involving a penny stock, unless exempt, the penny stock rules require that a broker or dealer approve a person’s account for transactions in penny stocks and the broker or dealer receive from the investor a written agreement to the transaction, setting forth the identity and quantity of the penny stock to be purchased. In order to approve a person’s account for transactions in penny stocks, the broker or dealer must obtain financial information and investment experience and objectives of the investor, make a reasonable determination that transactions in penny stocks are suitable for that person, and make a reasonable determination that that person has sufficient knowledge and experience in financial matters to be capable of evaluating the risks of transactions in penny stocks.
The broker or dealer must also provide disclosure to its customers, prior to executing trades, about the risks of investing in penny stocks in both public offerings and in secondary trading, the commissions payable to both the broker-dealer and the registered representative, and the rights and remedies available to an investor in cases of fraud in penny stock transactions.
Because of these regulations, broker-dealers may not wish to furnish the necessary paperwork and disclosures and/or may encounter difficulties in their attempt to buy or sell shares of the Company’s common stock, which may in turn affect the ability of Company stockholders to sell their shares.
Accordingly, the penny stock classification adversely affects any market liquidity for the Company’s common stock and subjects the shares to certain risks associated with trading in penny stocks. These risks include difficulty for investors in purchasing or disposing of shares, difficulty in obtaining accurate bid and ask quotations, difficulty in establishing the market value of the shares, and a lack of securities analyst coverage.
Because we may never earn revenues from our operations, our business may fail, and investors may lose all of their investment in our company.
In addition to other information in this current report, the following risk factors should be carefully considered in evaluating our business because such factors may have a significant impact on our business, operating results, liquidity and financial condition. As a result of the risk factors set forth below, actual results could differ materially from those projected in any forward-looking statements. Additional risks and uncertainties not presently known to us, or that we currently consider to be immaterial, may also impact our business, operating results, liquidity and financial condition. If any such risks occur, our business, operating results, liquidity, and financial condition could be materially affected in an adverse manner. Under such circumstances, the trading price of our securities could decline, and you may lose all or part of your investment.
We have limited revenues from operations. We have yet to generate positive earnings and there can be no assurance we will ever operate profitably. Our company has a limited operating history and has yet to launch its first commercial product. The success of our company is significantly dependent on uncertain events, with respect to supply chain, system development, and operation of the system on the scale we currently envision. If our business plan is not successful and we are not able to operate profitably, our stock may become worthless and investors may lose all of their investment in our Company. Should any of the following material risks occur, our business may experience catastrophic and unrecoverable losses, as said risks may harm our current business operations, as well as any future results of operations, resulting in the trading price of our common stock declining and a partial or complete loss of your investment. It is important to note these risks are not the only ones we face. Additional risks not presently known or that we currently consider to be immaterial may also impair our business operations and trading price of our common stock.
We may not achieve profitability or positive cash flow.
Our ability to achieve and maintain profitability and positive cash flow will be dependent upon such factors as our ability to deliver quality risk management and custom app development services. Based upon current plans, we expect to incur operating losses in future periods because we expect to incur expenses that will exceed revenues for an unknown period of time. We cannot guarantee that we will be successful in generating sufficient revenues to support operations in the future.
We have limited operating capital and we may have to seek additional financing.
If we are unable to fund our operations and, therefore, not be able to sustain future operations or support the manufacturing of additional systems, we may be required to delay, reduce and/or cease our operations and/or seek bankruptcy protection.
We cannot assure anyone with any degree of certainty that any necessary additional financing will be available on terms favorable to us, now or at any point in the future. It may be a significant challenge to raise additional funds and there can be no assurance as to the availability of additional financing or the terms upon which additional financing may be available. Even if we raise sufficient capital through additional equity or debt financings, strategic alternatives or otherwise, there can be no assurance the revenue or capital infusion will be sufficient to enable us to develop our business to a level where it will be profitable or generate positive cash flow.
| 24 |
If we raise additional funds through the issuance of equity or convertible debt securities, the percentage ownership of our stockholders could be significantly diluted, and these newly issued securities may have rights, preferences or privileges senior to those of existing stockholders; and if we incur additional debt, a substantial portion of our operating cash flow may be dedicated to the payment of principal and interest on such indebtedness, thus limiting funds available for our business activities. The terms of any debt securities issued could also impose significant restrictions on our operations.
If we and our suppliers cannot obtain financing under favorable terms, and our clients are not able to receive the requisite guarantees for payment to us, our business may be negatively impacted.
Markets for stock are highly volatile.
As a result of market volatility in the U.S. and in international stock markets since 2008, a high degree of uncertainty has been seen in the markets, which may result in an increase in the return required by investors, with respect to their expectations for the financing of our projects. Current and ongoing global conditions could lead to an extended recession in the U.S. and around the world. We currently have no revenue producing assets, which may have a materially adverse impact on our business and financial conditions and results, which places our investors at risk.
Capital and credit markets continue to be unpredictable and the availability of funds from those markets is extremely uncertain. Further, arising from concerns about the stability of financial markets generally and the solvency of borrowers specifically, the cost of accessing the credit markets has increased as many lenders have raised interest rates, enacted tighter lending standards or altogether ceased to provide funding to borrowers. Due to these capital and credit market conditions, we cannot be certain that funding will be available to us in amounts or on terms that we believe are acceptable.
The market price of our common stock may be adversely affected by market conditions affecting the stock markets in general, including price and trading fluctuations on OTC Markets. Market conditions may result in volatility in the level of, and fluctuations in, the market prices of stocks generally and, in turn, our common stock and sales of substantial amounts of our common stock in the market, in each case being unrelated or disproportionate to changes in our operating performance.
The overall weakness in the economy has recently contributed to the extreme volatility of the markets which may have an effect on the market price of our common stock. Our stock price has been and could remain volatile, which could further adversely affect the market price of our stock, our ability to raise additional capital and/or cause us to be subject to securities class action litigation.
We may also be subject to additional securities class action litigation as a result of volatility in the price of our common stock, which could result in substantial costs and a significant diversion of management’s time and attention and intellectual and capital resources and could harm our stock price, business, prospects, and results of operations.
Sales of a significant number of shares of our common stock could depress the market price of our common stock, which could happen in the public market at any time. These sales, or the market perception that the holders of a large number of shares intend to sell shares, could reduce the market price of our common stock. Should industry analysts choose not to publish, or any time discontinue reporting on us, our business or our market, or if they change their recommendations regarding our stock adversely, our stock price and trading volume could decline. Also, the trading market for our common stock will be influenced by the research and reports that industry or securities analysts may publish about us, our business, our market or our competitors. If any of the analysts who may cover us change their recommendation regarding our stock adversely, or provide more favorable relative recommendations about our competitors, our stock price would likely decline.
We may become subject to litigation.
There is the potential that we could be party to disputes for which an adverse outcome could result in us incurring significant expenses, being liable for damages, and subject to indemnification claims. In connection with any disputes or litigation in which we are involved, we may be forced to incur costs and expenses in connection with defending ourselves or in connection with the payment of any settlement or judgment or compliance with any injunctions in connection, therewith, if there is an unfavorable outcome. The expense of defending litigation may be significant, as is the amount of time to resolve lawsuits unpredictable and defending ourselves may divert management’s attention from the day-to-day operations of our business, which could adversely affect our business, results of operations, financial condition, and cash flows. Additionally, an unfavorable outcome in any such litigation could have a material adverse effect on our business, results of operations, financial condition and cash flows.
Product liability or defects could also negatively impact our results of operations. The risk of product liability claims and associated adverse publicity is possible in the development, manufacturing, marketing, and sale of our product offerings. Any liability for damages resulting from malfunctions or design defects could be substantial and could materially adversely affect our business, financial condition, results of operations and prospects.
Also, a highly-publicizedhighly publicized problem, whether actual or perceived, could adversely affect the market’s perception of our product, resulting in a decline in demand for our product and could divert the attention of our management, having a materially adverse effect our business, financial condition, results of operations and prospects.
Our success depends on attracting and retaining key personnel.
Our future plans could be harmed if we are unable to attract or retain key personnel, and our future success will depend, in part, on our ability to attract and retain qualified management and technical personnel. Equally, our success depends on the ability of our management and employees to interpret market data correctly and to interpret and respond to economic market and other conditions in order to locate and adopt appropriate investment opportunities, monitor such investments, and ultimately, if required, to successfully divest such investments. Further, no assurance can be given that our key personnel will continue their association or employment with us or that replacement personnel with comparable skills can be found. We have sought to and will continue to ensure that management and any key employees are appropriately compensated, however, their services cannot be guaranteed. If we are unable to attract and retain key personnel, our business may be adversely affected.
We do not know whether we will be successful in hiring or retaining qualified personnel, and our inability to hire qualified personnel on a timely basis, or the departure of key employees, could materially and adversely affect our development and profitable commercialization plans, our business prospects, results of operations, and financial condition.
Should we fail to maintain an effective system of internal controls, we may not be able to accurately report our financial results or prevent fraud, which could harm our brand and operating results. Our compliance with the annual internal control report requirement for each fiscal year will depend on the effectiveness of our financial reporting and data systems and controls. Inferior internal controls could cause investors to lose confidence in our reported financial information, which could have a negative effect on the trading price of our stock and our access to capital. In addition, our internal control systems rely on people trained in the execution of the controls. Loss of these people or our inability to replace them with similarly skilled and trained individuals or new processes in a timely manner could adversely impact our internal control mechanisms.
The requirements of being a public company may strain our resources, divert management’s attention and affect our ability to attract and retain qualified board members and officers. Compliance with these rules and regulations increase our legal and financial compliance costs, make some activities more difficult, time-consuming or costly and increase demand on our systems and resources.
Protecting our intellectual property is necessary to protect our brand.
We may not be able to protect important intellectual property and we could incur substantial costs defending against claims that our products infringe on the proprietary rights of others. Our ability to compete effectively will depend, in part, on our ability to protect our proprietary system-level technologies, systems designs, and manufacturing processes.
We will rely on patents, trademarks, and other policies and procedures related to confidentiality to protect our intellectual property. However, some of our intellectual property is not covered by any patent or patent application. We could incur substantial costs in prosecuting or defending patent infringement suits or otherwise protecting our intellectual property rights. While we have attempted to safeguard and maintain our proprietary rights, we do not know whether we have been or will be completely successful in doing so. Moreover, patent applications and enforcement, thereof, filed in foreign countries may be subject to laws, rules and procedures that are substantially different from those of the United States, and any resulting foreign patents may be difficult and expensive to enforce. We could incur substantial costs in prosecuting or defending trademark infringement suits.
| 25 |
Further, our competitors may independently develop or patent technologies or processes that are substantially equivalent or superior to ours. In the event we are found to be infringing third party patents, we could be required to pay substantial royalties and/or damages, and we do not know whether we will be able to obtain licenses to use such patents on acceptable terms, if at all.
Failure to obtain needed licenses could delay or prevent the development, manufacture, or sale of our products, and could necessitate the expenditure of significant resources to develop or acquire non-infringing intellectual property.
Asserting, defending and maintaining our intellectual property rights could be difficult and costly and failure to do so may diminish our ability to compete effectively and may harm our operating results. As a result, we may need to pursue legal action in the future to enforce our intellectual property rights, to protect our trade secrets and domain names, and to determine the validity and scope of the proprietary rights of others. If third parties prepare and file applications for trademarks used or registered by us, we may oppose those applications and be required to participate in proceedings to determine the priority of rights to the trademark.
Similarly, competitors may have filed applications for patents, may have received patents and may obtain additional patents and proprietary rights relating to products or technology that block or compete with ours. We may have to participate in interference proceedings to determine the priority of invention and the right to a patent for the technology.
Confidentiality agreements to which we are party may be breached, and we may not have adequate remedies for any breach. Also, our trade secrets may also be known without breach of such agreements or may be independently developed by competitors. Inability to maintain the proprietary nature of our technology and processes could allow our competitors to limit or eliminate any competitive advantages we may have.
As part of our business strategy, we intend to consider acquisitions of companies, technologies and products that we believe could improve our ability to compete in our core markets or allow us to enter new markets. Acquisitions, involve numerous risks, any of which could harm our business, including, difficulty in integrating the technologies, products, operations and existing contracts of a target company and realizing the anticipated benefits of the combined businesses; difficulty in supporting and transitioning customers, if any, of the target company; inability to achieve anticipated synergies or increase the revenue and profit of the acquired business; potential disruption of our ongoing business and distraction of management; the price we pay or other resources that we devote may exceed the value we realize; or the value we could have realized if we had allocated the purchase price or other resources to another opportunity and inability to generate sufficient revenue to offset acquisition costs.
If we finance acquisitions by issuing equity securities, our existing stockholders may be diluted; and as a result, if we fail to properly evaluate acquisitions or investments, we may not achieve the anticipated benefits of any such acquisitions, and we may incur costs in excess of what we anticipate.
The impact of the COVID-19 pandemic has had, and is expected to continue to have, an adverse effect on our business and our financial results.
The COVID-19 pandemic has negatively impacted the global economy, disrupted consumer spending and global supply chains and created significant volatility and disruption of financial markets. The COVID-19 pandemic has had and is expected to continue to have an adverse effect on our business and financial performance. The extent of the impact of the COVID-19 pandemic, including our ability to execute our business strategies as planned, will depend on future developments, including the duration and severity of the pandemic, which are highly uncertain and cannot be predicted.
RISKS ASSOCIATED WITH OUR COMMON STOCK
If we issue additional shares in the future our existing shareholders will experience dilution.
Our certificate of incorporation authorizes the issuance of up to 125,000,000325,000,000 shares of common stock with a par value of $0.001. Our board of directors may choose to issue some or all of such shares to acquire one or more businesses or to provide additional financing in the future. The issuance of any such shares will result in a reduction of the book value and market price of the outstanding shares of our common stock. If we issue any such additional shares, such issuance will cause a reduction in the proportionate ownership and voting power of all current shareholders. Further, such issuance may result in a change of control of our corporation.
Trading on the OTC Markets may be volatile and sporadic, which could depress the market price of our common stock and make it difficult for our stockholders to resell their shares.
Our common stock is quoted on OTC Markets. Trading in stock quoted on OTC Markets is often thin and characterized by wide fluctuations in trading prices due to many factors that may have little to do with our operations or business prospects. This volatility could depress the market price of our common stock for reasons unrelated to operating performance. Moreover, OTC Markets is not a stock exchange, and trading of securities on the OTC Markets is often more sporadic than the trading of securities listed on a quotation system like NASDAQ or a stock exchange like the American Stock Exchange. Accordingly, our shareholders may have difficulty reselling any of their shares.
| 26 |
Our stock is a penny stock. Trading of our stock may be restricted by the SEC’s penny stock regulations and FINRA’s sales practice requirements, which may limit a stockholder’s ability to buy and sell our stock.
Our stock is a penny stock. The Securities and Exchange Commission has adopted Rule 15g-9 which generally defines “penny stock” to be any equity security that has a market price (as defined) less than $5.00 per share or an exercise price of less than $5.00 per share, subject to certain exceptions. Our securities are covered by the penny stock rules, which impose additional sales practice requirements on broker-dealers who sell to persons other than established customers and “accredited investors”. The term “accredited investor” refers generally to institutions with assets in excess of $5,000,000 or individuals with a net worth in excess of $1,000,000 or annual income exceeding $200,000 or $300,000 jointly with their spouse. The penny stock rules require a broker-dealer, prior to a transaction in a penny stock not otherwise exempt from the rules, to deliver a standardized risk disclosure document in a form prepared by the SEC which provides information about penny stocks and the nature and level of risks in the penny stock market. The broker-dealer also must provide the customer with current bid and offer quotations for the penny stock, the compensation of the broker-dealer and its salesperson in the transaction and monthly account statements showing the market value of each penny stock held in the customer’s account. The bid and offer quotations, and the broker-dealer and salesperson compensation information, must be given to the customer orally or in writing prior to effecting the transaction and must be given to the customer in writing before or with the customer’s confirmation. In addition, the penny stock rules require that prior to a transaction in a penny stock not otherwise exempt from these rules, the broker-dealer must make a special written determination that the penny stock is a suitable investment for the purchaser and receive the purchaser’s written agreement to the transaction. These disclosure requirements may have the effect of reducing the level of trading activity in the secondary market for the stock that is subject to these penny stock rules. Consequently, these penny stock rules may affect the ability of broker-dealers to trade our securities. We believe the penny stock rules discourage investor interest in, and limit the marketability of, our common stock.
FINRA sales practice requirements may also limit a stockholder’s ability to buy and sell our stock.
In addition to the “penny stock” rules promulgated by the Securities and Exchange Commission (see above for a discussion of penny stock rules), FINRA rules require that in recommending an investment to a customer, a broker-dealer must have reasonable grounds for believing that the investment is suitable for that customer. Prior to recommending speculative low-priced securities to their non-institutional customers, broker-dealers must make reasonable efforts to obtain information about the customer’s financial status, tax status, investment objectives and other information. Under interpretations of these rules, FINRA believes that there is a high probability that speculative low-priced securities will not be suitable for at least some customers. FINRA requirements make it more difficult for broker-dealers to recommend that their customers buy our common stock, which may limit your ability to buy and sell our stock and have an adverse effect on the market for our shares.
We may never pay dividends to our common stockholders.
The Company currently intends to retain its future earnings to support operations and to finance expansion; accordingly, the Company does not anticipate paying any cash dividends in the foreseeable future.
The declaration, payment and amount of any future dividends on common stock will be at the discretion of the Company’s Board of Directors, and will depend upon, among other things, earnings, financial condition, capital requirements, level of indebtedness and other considerations the Board of Directors considers relevant. There is no assurance that future dividends will be paid on common stock or, if dividends are paid, the amount thereof.
Our common stock is quoted through the OTC Markets, which may have an unfavorable impact on our stock price and liquidity.
The Company’s common stock is quoted on the OTC Markets, which is a significantly more limited market than the New York Stock Exchange or NASDAQ. The trading volume may be limited by the fact that many major institutional investment funds, including mutual funds, follow a policy of not investing in OTC Markets stocks and certain major brokerage firms restrict their brokers from recommending OTC Markets stocks because they are considered speculative and volatile.
The trading volume of the Company’s common stock has been and may continue to be limited and sporadic. As a result, the quoted price for the Company’s common stock on the OTC Markets may not necessarily be a reliable indicator of its fair market value.
Additionally, the securities of small capitalization companies may trade less frequently and in more limited volume than those of more established companies. The market for small capitalization companies is generally volatile, with wide price fluctuations not necessarily related to the operating performance of such companies.
Our common stock is subject to price volatility unrelated to our operations.
The market price of the Company’s common stock could fluctuate substantially due to a variety of factors, including market perception of the Company’s ability to achieve its planned growth, operating results of the Company and of other companies in the same industry, trading volume in the Company’s common stock, changes in general conditions in the economy and the financial markets or other developments affecting the Company or its competitors.
| 27 |
Our common stock is classified as a “penny stock.”
Rule 3a51-1 of the Securities Exchange Act of 1934 establishes the definition of a “penny stock,” for purposes relevant to us, as any equity security that has a minimum bid price of less than $5.00 per share or with an exercise price of less than $5.00 per share, subject to a limited number of exceptions which are not available to us. It is likely that the Company’s common stock will be considered to be a penny stock for the immediately foreseeable future.
For any transaction involving a penny stock, unless exempt, the penny stock rules require that a broker or dealer approve a person’s account for transactions in penny stocks and the broker or dealer receive from the investor a written agreement to the transaction, setting forth the identity and quantity of the penny stock to be purchased. In order to approve a person’s account for transactions in penny stocks, the broker or dealer must obtain financial information and investment experience and objectives of the investor, make a reasonable determination that transactions in penny stocks are suitable for that person, and make a reasonable determination that that person has sufficient knowledge and experience in financial matters to be capable of evaluating the risks of transactions in penny stocks.
The broker or dealer must also provide disclosure to its customers, prior to executing trades, about the risks of investing in penny stocks in both public offerings and in secondary trading, the commissions payable to both the broker-dealer and the registered representative, and the rights and remedies available to an investor in cases of fraud in penny stock transactions.
Because of these regulations, broker-dealers may not wish to furnish the necessary paperwork and disclosures and/or may encounter difficulties in their attempt to buy or sell shares of the Company’s common stock, which may in turn affect the ability of Company stockholders to sell their shares.
Accordingly, the penny stock classification adversely affects any market liquidity for the Company’s common stock and subjects the shares to certain risks associated with trading in penny stocks. These risks include difficulty for investors in purchasing or disposing of shares, difficulty in obtaining accurate bid and ask quotations, difficulty in establishing the market value of the shares, and a lack of securities analyst coverage.
Markets for stock are highly volatile.
As a result of market volatility in the U.S. and in international stock markets since 2008, a high degree of uncertainty has been seen in the markets, which may result in an increase in the return required by investors, with respect to their expectations for the financing of our projects. Current and ongoing global conditions could lead to an extended recession in the U.S. and around the world. We currently have no revenue producing assets, which may have a materially adverse impact on our business and financial conditions and results, which places our investors at risk.
Capital and credit markets continue to be unpredictable and the availability of funds from those markets is extremely uncertain. Further, arising from concerns about the stability of financial markets generally and the solvency of borrowers specifically, the cost of accessing the credit markets has increased as many lenders have raised interest rates, enacted tighter lending standards or altogether ceased to provide funding to borrowers. Due to these capital and credit market conditions, we cannot be certain that funding will be available to us in amounts or on terms that we believe are acceptable.
The market price of our common stock may be adversely affected by market conditions affecting the stock markets in general, including price and trading fluctuations on OTC Markets. Market conditions may result in volatility in the level of, and fluctuations in, the market prices of stocks generally and, in turn, our common stock and sales of substantial amounts of our common stock in the market, in each case being unrelated or disproportionate to changes in our operating performance.
The overall weakness in the economy has recently contributed to the extreme volatility of the markets which may have an effect on the market price of our common stock. Our stock price has been and could remain volatile, which could further adversely affect the market price of our stock, our ability to raise additional capital and/or cause us to be subject to securities class action litigation.
We may also be subject to additional securities class action litigation as a result of volatility in the price of our common stock, which could result in substantial costs and a significant diversion of management’s time and attention and intellectual and capital resources and could harm our stock price, business, prospects, and results of operations.
Sales of a significant number of shares of our common stock could depress the market price of our common stock, which could happen in the public market at any time. These sales, or the market perception that the holders of a large number of shares intend to sell shares, could reduce the market price of our common stock. Should industry analysts choose not to publish, or any time discontinue reporting on us, our business or our market, or if they change their recommendations regarding our stock adversely, our stock price and trading volume could decline. Also, the trading market for our common stock will be influenced by the research and reports that industry or securities analysts may publish about us, our business, our market or our competitors. If any of the analysts who may cover us change their recommendation regarding our stock adversely, or provide more favorable relative recommendations about our competitors, our stock price would likely decline.
RISKS RELATED TO THE OFFERING
Our existing stockholders may experience significant dilution from the sale of our common stock pursuant to the GHS FinancingSecurities Purchase Agreement.
The sale of our common stock to GHS Investments LLC in accordance with the FinancingSecurities Purchase Agreement may have a dilutive impact on our shareholders. As a result, the market price of our common stock could decline. In addition, the lower our stock price is at the time we exercise our put options,GHS converts their preferred shares, the more shares of our common stock we will have to issue to GHS in order to exercise a put under the Financing Agreement.GHS. If our stock price decreases, then our existing shareholders would experience greater dilution for any given dollar amount raised through the offering.
| 28 |
The perceived risk of dilution may cause our stockholders to sell their shares, which may cause a decline in the price of our common stock. Moreover, the perceived risk of dilution and the resulting downward pressure on our stock price could encourage investors to engage in short sales of our common stock. By increasing the number of shares offered for sale, material amounts of short selling could further contribute to progressive price declines in our common stock.
The issuance of shares pursuant to the GHS Financing Agreement may have a significant dilutive effect.
Depending on the number of shares we issue pursuant to the GHS Financing Agreement, it could have a significant dilutive effect upon our existing shareholders. Although the number of shares that we may issue pursuant to the Financing Agreement will vary based on our stock price (the higher our stock price, the less shares we have to issue), there may be a potential dilutive effect to our shareholders, based on different potential future stock prices, if the full amount of the Financing Agreement is realized. Dilution is based upon common stock put to GHS and the stock price discounted to GHS’s purchase price of 82% of the lowest trading price during the pricing period.
GHS Investments LLC will pay less than the then-prevailing market price of our common stock which could cause the price of our common stock to decline.
Our common stock to be issued underto GHS upon the GHS Financing Agreementconversion of their preferred stock will be purchased at a eighteenone hundred percent (18%) discount, or eighty percent (82%(100%) of the lowest trading price during the ten (10)fifteen (15) consecutive trading days immediately preceding our notice to GHS of our election to exercise our “put” right.conversion.
GHS has a financial incentive to sell our shares immediately upon receiving them to realize the profit between the discounted price and the market price.them. If GHS sells our shares, the price of our common stock may decrease. If our stock price decreases, GHS may have further incentive to sell such shares. Accordingly, the discounted sales price in the Financing Agreement may cause the price of our common stock to decline.
We may not have access to the full amount under the Financing Agreement.
On October 3, 2019, the lowest traded price of the Company’s common stock during the ten (10) consecutive trading day period immediately preceding the filing of this Registration Statement was $1.08. At that price we would be able to sell shares to GHS under the Financing Agreement at the discounted price of $0.886. At that discounted price, the 230,000 shares registered for issuance to GHS under the Financing Agreement would, if sold by us to GHS, result in aggregate proceeds of $203,780. There is no assurance the price of our common stock will remain the same as the market price or increase.
Unless an active trading market develops for our securities, investors may not be able to sell their shares.
We are a reporting company and our common shares are quoted on OTC Markets (OTC Pink) under the symbol “DSGT”. However, there is a very limited active trading market for our common stock; and an active trading market may never develop or, if it does develop, may not be maintained. Failure to develop or maintain an active trading market will have a generally negative effect on the price of our common stock, and you may be unable to sell your common stock or any attempted sale of such common stock may have the effect of lowering the market price, and therefore, your investment may be partially or completely lost.
Since our common stock is thinly traded it is more susceptible to extreme rises or declines in price, and you may not be able to sell your shares at or above the price paid.
Since our common stock is thinly traded its trading price is likely to be highly volatile and could be subject to extreme fluctuations in response to various factors, many of which are beyond our control, including (but not necessarily limited to):
| ● | the trading volume of our shares; | |
| ● | the number of securities analysts, market-makers and brokers following our common stock; | |
| ● | new products or services introduced or announced by us or our competitors; | |
| ● | actual or anticipated variations in quarterly operating results; | |
| ● | conditions or trends in our business industries; | |
| ● | announcements by us of significant contracts, acquisitions, strategic partnerships, joint ventures or capital commitments; | |
| ● | additions or departures of key personnel; | |
| ● | sales of our common stock; and | |
| ● | general stock market price and volume fluctuations of publicly-traded, and particularly microcap, companies. |
Investors may have difficulty reselling shares of our common stock, either at or above the price they paid for our stock, or even at fair market value. The stock markets often experience significant price and volume changes that are not related to the operating performance of individual companies, and because our common stock is thinly traded it is particularly susceptible to such changes. These broad market changes may cause the market price of our common stock to decline regardless of how well we perform as a company. In addition, there is a history of securities class action litigation following periods of volatility in the market price of a company’s securities. Although there is no such litigation currently pending or threatened against us, such a suit against us could result in the incursion of substantial legal fees, potential liabilities and the diversion of management’s attention and resources from our business. Moreover, and as noted below, our shares are currently traded on the OTC Link (OTC Pink tier) and, further, are subject to the penny stock regulations. Price fluctuations in such shares are particularly volatile and subject to potential manipulation by market-makers, short-sellers and option traders.
| 29 |
The CompanyWe are not selling any shares of our common stock in this offering and we will usenot receive any of the proceeds from the sale of shares of our common stock by the SharesSelling Stockholder. The Selling Stockholder will receive all of the proceeds from any sales of the shares of our common stock offered hereby. However, we will incur expenses in connection with the registration of the shares of our common stock offered hereby. We will receive the exercise price upon any exercise of the Warrants. If all the Warrants were exercised, we would receive gross proceeds of approximately $1,500,000. However, the Selling Stockholder is not obligated to exercise the Warrants, and we cannot predict whether or when, if ever, the Selling Stockholder will choose to exercise the Warrants, in whole or in part. Accordingly, any proceeds from such exercise will be used for general corporate purposes and working capital purposes and acquisitions or assets, businesses or operations or for other purposes that the Board of Directors, in good faith deem to be in the best interest of the Company.capital.
Item 5. DETERMINATION OF OFFERING PRICE
We have not set an offering price for the shares registered hereunder, as the only shares being registered are those sold pursuant to the GHS FinancingSecurities Purchase Agreement. GHS may sell all or a portion of the shares being offered pursuant to this prospectus at fixed prices and prevailing market prices at the time of sale, at varying prices or at negotiated prices.
Not applicable. The shares registered under this registration statement are not being offered for purchase.purchase by the Company. The shares are being registered on behalf of our selling shareholdersSelling Stockholder pursuant to the GHS FinancingSecurities Purchase Agreement.
Item 7. SELLING SECURITY HOLDER
The selling stockholderSelling Stockholder identified in this prospectus may offer and sell up to 230,000 shares of our common stock, which consists of10,000,000 shares of common stock, which will consist of up to be sold3,000,000 shares of common stock issuable upon exercise of outstanding warrants to purchase shares of common stock and up to 7,000,000 shares of common stock upon conversion of 3,000 shares of Series F Preferred Stock of the Company, in each case as issued by us to GHS Investments LLC (“GHS”) pursuant to the Financing Agreement.a Securities Purchase Agreement (the “Securities Purchase Agreement”) dated December 23, 2020. If issued presently, the 10,000,000 shares of common stock registered for resale by GHS would represent 20.26%8.59% of our issued and outstanding shares of common stock as of October 3, 2019.March 4, 2021.
We may require the selling stockholderSelling Stockholder to suspend the sales of the shares of our common stock being offered pursuant to this prospectus upon the occurrence of any event that makes any statement in this prospectus or the related registration statement untrue in any material respect or that requires the changing of statements in those documents in order to make statements in those documents not misleading.
The selling stockholderSelling Stockholder identified in the table below may from time to time offer and sell under this prospectus any or all of the shares of common stock described under the column “Shares of Common Stock Being Offered” in the table below.
GHS will be deemed to be an underwriter within the meaning of the Securities Act. Any profits realized by such selling stockholder may be deemed to be underwriting commissions.
Information concerning the selling stockholderSelling Stockholder may change from time to time and, if necessary, we will amend or supplement this prospectus accordingly. We cannot give an estimate as to the number of shares of common stock that will actually be held by the selling stockholderSelling Stockholder upon termination of this offering, because the selling stockholdersSelling Stockholder may offer some or all of the common stock under the offering contemplated by this prospectus or acquire additional shares of common stock. The total number of shares that may be sold, hereunder, will not exceed the number of shares offered, hereby. Please read the section entitled “Plan of Distribution” in this prospectus.
The manner in which the selling stockholderSelling Stockholder acquired or will acquire shares of our common stock is discussed below under “The Offering.”
The following table sets forth the name of each selling stockholder,Selling Stockholder, the number of shares of our common stock beneficially owned by such stockholder before this offering, the number of shares to be offered for such stockholder’s account and the number and (if one percent or more) the percentage of the class to be beneficially owned by such stockholder after completion of the offering. The number of shares owned are those beneficially owned, as determined under the rules of the SEC, and such information is not necessarily indicative of beneficial ownership for any other purpose. Under such rules, beneficial ownership includes any shares of our common stock as to which a person has sole or shared voting power or investment power and any shares of common stock which the person has the right to acquire within 60 days, through the exercise of any option, warrant or right, through conversion of any security or pursuant to the automatic termination of a power of attorney or revocation of a trust, discretionary account or similar arrangement, and such shares are deemed to be beneficially owned and outstanding for computing the share ownership and percentage of the person holding such options, warrants or other rights, but are not deemed outstanding for computing the percentage of any other person. Beneficial ownership percentages are calculated based on 904,969106,449,471 shares of our common stock outstanding as of October 3, 2019.March 4, 2021.
Unless otherwise set forth below, (a) the persons and entities named in the table have sole voting and sole investment power with respect to the shares set forth opposite the selling stockholder’sSelling Stockholder’s name, subject to community property laws, where applicable, and (b) no selling stockholderSelling Stockholder had any position, office or other material relationship within the past three years, with us or with any of our predecessors or affiliates. The number of shares of common stock shown as beneficially owned before the offering is based on information furnished to us or otherwise based on information available to us at the timing of the filing of the registration statement of which this prospectus forms a part.
| Shares Owned by the Selling Stockholders | Shares of Common Stock | Number of Shares to be Owned by Selling Stockholder After the Offering and Percent of Total Issued and Outstanding Shares | ||||||||||||||
| Name of Selling Stockholder | before the Offering (1) | Being Offered | # of Shares (2) | % of Class (2) | ||||||||||||
| GHS Investments LLC (3) | 0 | 230,000 | (4) | 0 | 0 | % | ||||||||||
| 30 |
| Shares Owned by the Selling Stockholders | Shares of Common Stock | Number of Shares to be Owned by Selling Stockholder After the Offering and Percent of Total Issued and Outstanding Shares | ||||||||||||||
| Name of Selling Stockholder | before the Offering (1) | Being Offered | # of Shares (2) | % of Class (2) | ||||||||||||
| GHS Investments LLC (3) | 5,311,828 | 10,000,000 | (4) | 0 | 0 | % | ||||||||||
Notes:
| (1) | Beneficial ownership is determined in accordance with Securities and Exchange Commission rules and generally includes voting or investment power with respect to shares of common stock. Shares of common stock subject to options, warrants and convertible debentures currently exercisable or convertible, or exercisable or convertible within 60 days, are counted as outstanding. The actual number of shares of common stock issuable upon the conversion of the convertible debentures is subject to adjustment depending on, among other factors, the future market price of our common stock, and could be materially less or more than the number estimated in the table. |
| (2) | Because the |
| (3) | Mark Grober exercises voting and dispositive power with respect to the shares of our common stock that are beneficially owned by GHS Investments LLC. |
| (4) | Consists of up to |
On September 18, 2019,December 23, 2020, we entered into an Equity Financinga Securities Purchase Agreement (the “Financing“Securities Purchase Agreement”) with GHS Investments LLC (“GHS”). Although we are not mandated to sell shares underUnder the FinancingSecurities Purchase Agreement, the Financing Agreement gives us the optionCompany agrees to sell to GHS up to $7,000,000 worthshares of our common stock over the period ending forty-eight (48) months afterCompany’s Series F Preferred Stock (the “Preferred Stock”) at a price of $1,000 per share. Each share of Preferred Stock is convertible at the date this Registration Statement is deemed effective. The $7,000,000 was stated as the total amountvalue of available funding in the Financing Agreement because this was the maximum amount that GHS agreed to offer us in funding. There is no assurance$1,200 per share divided by one hundred percent (100%) of the market price of ourthe Company’s common stock, will increase in the future. The number of common shares that remain issuable may not be sufficient, dependent upon the share price, to allow us to access the full amount contemplated under the Financing Agreement. If the bid/ask spread remains the same, we will not be able to place a put for the full commitment under the Financing Agreement. Based onwhich equals the lowest traded price of ourthe Company’s common stock during the ten (10) consecutive trading day period preceding October 3, 2019 of $1.08, the registration statement covers the offer and possible sale of $203,780 worth of our shares.
The purchase price of the common stock will be set at eighty percent (82%) of the lowest trading price of the common stock during the ten (10)fifteen (15) consecutive trading day period immediately precedingprior to a conversion (the “Market Price”). As of the date of this registration statement, GHS has purchased 3,000 shares of Preferred Stock from the Company.
In conjunction with the Securities Purchase Agreement, on whichDecember 23, 2020, we issued a Common Stock Purchase Warrant (the “Warrant”) to GHS. Under the Warrant, GHS has to option to subscribe for and purchase from the Company delivers a put noticeup to GHS.3,000,000 shares of common stock of the Company. The exercise price per share of the common stock under the Warrant will be $0.50 per share. The Warrants expires five (5) years from the date of issuance, may be only be exercise by cash payment to the Company and have no cashless provision. In addition, there is anthe Preferred Stock and Warrants are subject to a beneficial ownership limitlimitation for GHS of 4.99%.
GHS is not permitted to engage in short sales involving our (in the aggregate) of all outstanding common stock during the termshares of the commitment period. In accordance with Regulation SHO, however, sales of our common stock by GHS after delivery of a put notice of such number of shares reasonably expected to be purchased by GHS under a put will not be deemed a short sale.
In addition, we must deliver the other required documents, instruments and writings required. GHS is not required to purchase the put shares unless:
As we draw down on the equity line of credit, shares of our common stock will be sold into the market by GHS. The sale of these shares could cause our stock price to decline. In turn, if our stock price declines and we issue more puts, more shares will come into the market, which could cause a further drop in our stock price. You should be aware that there is an inverse relationship between the market price of our common stock and the number of shares to be issued under the equity line of credit. If our stock price declines, we will be required to issue a greater number of shares under the equity line of credit. We have no obligation to utilize the full amount available under the equity line of credit.
Neither the Financing Agreement nor any of our rights or GHS’s rights thereunder may be assigned to any other person.Company.
Each of the selling stockholdersThe Selling Stockholder named above and any of their pledgees and successors-in-interest may, from time to time, sell any or all of their shares of common stock on OTC Markets or any other stock exchange, market or trading facility on which the shares of our common stock are traded or in private transactions. These sales may be at fixed prices and prevailing market prices at the time of sale, at varying prices or at negotiated prices. The selling stockholdersSelling Stockholder may use any one or more of the following methods when selling shares:
| ● | ordinary brokerage transactions and transactions in which the broker-dealer solicits purchasers; | |
| ● | block trades in which the broker-dealer will attempt to sell the shares as agent but may position and resell a portion of the block as principal to facilitate the transaction; | |
| ● | purchases by a broker-dealer as principal and resale by the broker-dealer for its account; | |
| ● | privately negotiated transactions; | |
| ● | broker-dealers may agree with the | |
| ● | a combination of any such methods of sale; or |
Broker-dealers engaged by the selling stockholdersSelling Stockholder may arrange for other brokers-dealers to participate in sales. Broker-dealers may receive commissions or discounts from the selling stockholdersSelling Stockholder (or, if any broker-dealer acts as agent for the purchaser of shares, from the purchaser) in amounts to be negotiated, but, except as set forth in a supplement to this prospectus, in the case of an agency transaction not in excess of a customary brokerage commission in compliance with FINRA Rule 2440; and in the case of a principal transaction a markup or markdown in compliance with FINRA IM-2440.
| 31 |
GHS is an underwriter within the meaning of the Securities Act of 1933 and any broker-dealers or agents that are involved in selling the shares may be deemed to be “underwriters” within the meaning of the Securities Act of 1933 in connection with such sales. In such event, any commissions received by such broker-dealers or agents and any profit on the resale of the shares purchased by them may be deemed to be underwriting commissions or discounts under the Securities Act of 1933. GHS has informed us that it does not have any written or oral agreement or understanding, directly or indirectly, with any person to distribute the common stock of our company. Pursuant to a requirement by FINRA, the maximum commission or discount to be received by any FINRA member or independent broker-dealer may not be greater than 8% of the gross proceeds received by us for the sale of any securities being registered pursuant to Rule 415 promulgated under the Securities Act of 1933.
Discounts, concessions, commissions and similar selling expenses, if any, attributable to the sale of shares will be borne by the selling stockholder.Selling Stockholder. The selling stockholderSelling Stockholder may agree to indemnify any agent, dealer, or broker-dealer that participates in transactions involving sales of the shares if liabilities are imposed on that person under the Securities Act of 1933.
We are required to pay certain fees and expenses incurred by us incident to the registration of the shares covered by this prospectus. We have agreed to indemnify the selling stockholders against certain losses, claims, damages and liabilities, including liabilities under the Securities Act of 1933. We will not receive any proceeds from the resale of any of the shares of our common stock by the selling stockholders.Selling Stockholder. We may, however, receive proceeds from the sale of our common stockPreferred Stock under the FinancingSecurities Purchase Agreement with GHS.GHS, and we will receive a maximum of an additional $1,500,000 from GHS if and when they elect to exercise the Warrants. The Preferred Stock and Warrants are subject to a beneficial ownership limitation for GHS of 4.99% (in the aggregate) of all outstanding common shares of the Company. Neither the FinancingSecurities Purchase Agreement with GHS nor any rights of the parties under the FinancingSecurities Purchase Agreement with GHS may be assigned or delegated to any other person.
We have entered into an agreement with GHS to keep this prospectus effective until GHS has sold all of the common shares purchased by it under the Financing Agreement and has no right to acquire any additional shares of common stock under the Financing Agreement.
The resale shares will be sold only through registered or licensed brokers or dealers if required under applicable state securities laws. In addition, in certain states, the resale shares may not be sold unless they have been registered or qualified for sale in the applicable state or an exemption from the registration or qualification requirement is available and is complied with.
Under applicable rules and regulations under the Securities Exchange Act of 1934, any person engaged in the distribution of the resale shares may not simultaneously engage in market making activities with respect to the common stock for the applicable restricted period, as defined in Regulation M, prior to the commencement of the distribution. In addition, the selling stockholdersSelling Stockholder will be subject to applicable provisions of the Securities Exchange Act of 1934 and the rules and regulations thereunder, including Regulation M, which may limit the timing of purchases and sales of shares of the common stock by the selling stockholdersSelling Stockholder or any other person. We will make copies of this prospectus available to the selling stockholders.Selling Stockholder.
Item 9. DESCRIPTION OF SECURITIES TO BE REGISTERED
General
We are authorized to issue an aggregate of onethree hundred fifty million (150,000,000)(350,000,000) shares of common stock, $0.001 par value per share. As of October 3, 2019,March 4, 2021, we had 904,969106,449,471 shares of common stock are outstanding.
Each share of common stock shall havehas one (1) vote per share. Our common stock does not provide a preemptive, subscription or conversion rights and there are no redemption or sinking fund provisions or rights. Our common stock holders are not entitled to cumulative voting for election of Board of Directors.
Dividends
We have not paid any cash dividends to our shareholders. The declaration of any future cash dividends is at the discretion of our board of directors and depends upon our earnings, if any, our capital requirements and financial position, our general economic conditions, and other pertinent conditions. It is our present intention not to pay any cash dividends in the foreseeable future, but rather to reinvest earnings, if any, in our business operations.
WarrantsSeries F Preferred Stock.
ThereGeneral
We are currently authorized to designate and issue up to 14,010,000 shares of preferred stock, par value $0.001, issuable from time to time in one or more series.
Dividends
Each share of Preferred Stock shall be entitled to receive, and the Corporation shall pay, cumulative dividends of ten percent (10%) per annum, payable quarterly, in cash or Preferred Shares, beginning on the Original Issuance Date and ending on the date that such share of Preferred Share has been converted or redeemed (the “Dividend End Date”), at the discretion of the Company.
Voting Rights
The Preferred Stock will vote together with the common stock on an as-converted basis. However, as long as any shares of Preferred Stock are outstanding, the Corporation shall not, without the affirmative vote of the Holders of a majority of the then outstanding shares of the Preferred Stock directly and/or indirectly (a) alter or change adversely the powers, preferences or rights given to the Preferred Stock or alter or amend the Certificate of Designation, (b) authorize or create any class of stock ranking as to redemption or distribution of assets upon a Liquidation (as defined in Section 5) senior to, or otherwise pari passu with, the Preferred Stock or, authorize or create any class of stock ranking as to dividends senior to, or otherwise pari passu with, the Preferred Stock, (c) amend its Articles of Incorporation or other charter documents in any manner that adversely affects any rights of the Holders, (d) increase the number of authorized shares of Preferred Stock, or (e) enter into any agreement with respect to any of the foregoing.
| 32 |
Liquidation
Upon any liquidation, dissolution or winding-up of the Corporation, whether voluntary or involuntary (a “Liquidation”), the Holders shall be entitled to receive out of the assets, whether capital or surplus, of the Corporation an amount equal to the Stated Value, plus any accrued and unpaid dividends thereon and any other fees or liquidated damages then due and owing thereon under this Certificate of Designation, for each share of Preferred Stock before any distribution or payment shall be made to the holders of any Junior Securities, and if the assets of the Corporation shall be insufficient to pay in full such amounts, then the entire assets to be distributed to the Holders shall be ratably distributed among the Holders in accordance with the respective amounts that would be payable on such shares if all amounts payable thereon were paid in full. A Fundamental Transaction or Change of Control Transaction shall not be deemed a Liquidation. The Corporation shall mail written notice of any such Liquidation, not less than 45 days prior to the payment date stated therein, to each Holder.
Conversion
Each share of Preferred Stock shall be convertible, at any time and from time to time from and after the Original Issue Date at the option of the Holder thereof, into that number of shares of Common Stock (subject to the limitations set forth in Section 5(d)) determined by dividing the Stated Value of such share of Preferred Stock by the Conversion Price. Holders shall effect conversions by providing the Corporation with the form of conversion notice (a “Notice of Conversion”). Each Notice of Conversion shall specify the number of shares of Preferred Stock to be converted, the number of shares of Preferred Stock owned prior to the conversion at issue, the number of shares of Preferred Stock owned subsequent to the conversion at issue and the date on which such conversion is to be effected, which date may not be prior to the date the applicable Holder delivers by facsimile or email such Notice of Conversion to the Corporation (such date, the “Conversion Date”). If no Conversion Date is specified in a Notice of Conversion, the Conversion Date shall be the date that such Notice of Conversion to the Corporation is deemed delivered hereunder. No ink-original Notice of Conversion shall be required, nor shall any medallion guarantee (or other type of guarantee or notarization) of any Notice of Conversion form be required. The calculations and entries set forth in the Notice of Conversion shall control in the absence of manifest or mathematical error. To effect conversions of shares of Preferred Stock, a Holder shall not be required to surrender the certificate(s) representing the shares of Preferred Stock to the Corporation unless all of the shares of Preferred Stock represented thereby are so converted, in which case such Holder shall deliver the certificate representing such shares of Preferred Stock promptly following the Conversion Date at issue. Shares of Preferred Stock converted into Common Stock or redeemed in accordance with the terms hereof shall be canceled and shall not be reissued.
Conversion Price
The conversion price (the “Conversion Price”) for the Preferred Stock shall be the amount equal to the lesser of (a) one hundred percent (100%) of the lowest traded price for the Company’s stock for the fifteen (15) trading days immediately preceding the relevant Conversion and (b) a twenty percent (20%) discount to the price of the common stock in a Qualified Offering. Notwithstanding the above, the Holder agrees to convert fifty percent (50%) of the outstanding warrantsPreferred Stock at a twenty percent (20%) discount to purchasethe price of the common stock in a Qualified Offering, subject to the Beneficial Ownership Limitation. All such foregoing determinations will be appropriately adjusted for any stock dividend, stock split, stock combination, reclassification or similar transaction that proportionately decreases or increases the Common Stock during such measuring period. Nothing herein shall limit a Holder’s right to pursue actual damages including, but not limited to, as a result of a Triggering Event pursuant to Section 10 hereof and the Holder shall have the right to pursue all remedies available to it hereunder, at law or in equity including, without limitation, a decree of specific performance and/or injunctive relief. The exercise of any such rights shall not prohibit the Holder from seeking to enforce damages pursuant to any other Section hereof or under applicable law. Following a “Triggering Event” or an “Event of Default,” as defined in the Purchase Agreement, the Conversion price shall equal the lower of : (a) the then applicable Conversion Price; or (b) a price per share equaling eighty five percent (85%) of the lowest traded price for the Company’s common stock during the fifteen (15) trading days preceding the relevant Conversion.
Warrants to Purchase Common Stock
In conjunction with the Securities Purchase Agreement, we issued GHS 3,000,000 Warrants. Each Warrant will be exercisable for one share of our securities.Common Stock at an exercise price of $0.50 per share. Each Warrant will be exercisable from its date of issuance and at any time up to the date that is five years after its original date of issuance. A holder shall have no right to exercise any portion of a Warrant, to the extent that, after giving effect to such exercise, such holder, together with such holder’s affiliates, and any persons acting as a group together with such holder or any such affiliate, would beneficially own in excess of 4.99% of the number of shares of Common Stock outstanding immediately after giving effect to the issuance of the shares of Common Stock upon such exercise. Beneficial ownership of the holder and its affiliates will be determined in accordance with Section 13(d) of the Exchange Act, and the rules and regulations promulgated thereunder. Holders of Warrants who are subject to such beneficial ownership limitation are and will remain responsible for ensuring their own compliance with Regulation 13D-G promulgated under the Exchange Act, consistent with their individual facts and circumstances. In addition, pursuant to Rule 13d-3(d)(1)(i) of the Exchange Act, any person who acquires such Warrants with the purpose or effect of changing or influencing the control of our company, or in connection with or as a participant in any transaction having such purpose or effect, immediately upon such acquisition will be deemed to be the beneficial owner of the underlying Common Stock.
The exercise price of the Warrants is subject to adjustment (but not below the par value of our Common Stock) in the case of stock splits, stock combinations, reclassifications or similar events affecting our Common Stock.
Prior to the exercise of any Warrants, holders of the Warrants will not have any of the rights of holders of the Common Stock purchasable upon exercise, including voting rights, however, the holders of the Warrants will have certain rights to participate in distributions or dividends paid on our Common Stock to the extent set forth in the Warrants.
| 33 |
Options
There are no outstanding options to purchase our securities.
Nevada Anti-Takeover Laws
As a Nevada corporation, we are subject to certain anti-takeover provisions that apply to public corporations under Nevada law. Pursuant to Section 607.0901 of the Nevada Business Corporation Act, or the Nevada Act, a publicly held Nevada corporation may not engage in a broad range of business combinations or other extraordinary corporate transactions with an interested shareholder without the approval of the holders of two-thirds of the voting shares of the corporation (excluding shares held by the interested shareholder), unless:
| ● | the transaction is approved by a majority of disinterested directors before the shareholder becomes an interested shareholder; | |
| ● | the interested shareholder has owned at least 80% of the corporation’s outstanding voting shares for at least five years preceding the announcement date of any such business combination; | |
| ● | the interested shareholder is the beneficial owner of at least 90% of the outstanding voting shares of the corporation, exclusive of shares acquired directly from the corporation in a transaction not approved by a majority of the disinterested directors; or | |
| ● | the consideration paid to the holders of the corporation’s voting stock is at least equal to certain fair price criteria. |
An interested shareholder is defined as a person who, together with affiliates and associates, beneficially owns more than 10% of a corporation’s outstanding voting shares. We have not made an election in our amended Articles of Incorporation to opt out of Section 607.0901.
In addition, we are subject to Section 607.0902 of the Nevada Act which prohibits the voting of shares in a publicly held Nevada corporation that are acquired in a control share acquisition unless (i) our board of directors approved such acquisition prior to its consummation or (ii) after such acquisition, in lieu of prior approval by our board of directors, the holders of a majority of the corporation’s voting shares, exclusive of shares owned by officers of the corporation, employee directors or the acquiring party, approve the granting of voting rights as to the shares acquired in the control share acquisition. A control share acquisition is defined as an acquisition that immediately thereafter entitles the acquiring party to 20% or more of the total voting power in an election of directors.
Penny Stock Considerations
Our shares will be “penny stocks” as that term is generally defined in the Securities Exchange Act of 1934 to mean equity securities with a price of less than $5.00 per share. Thus, our shares will be subject to rules that impose sales practice and disclosure requirements on broker-dealers who engage in certain transactions involving a penny stock. Under the penny stock regulations, a broker-dealer selling a penny stock to anyone other than an established customer must make a special suitability determination regarding the purchaser and must receive the purchaser’s written consent to the transaction prior to the sale, unless the broker-dealer is otherwise exempt.
In addition, under the penny stock regulations, the broker-dealer is required to:
| ● | Deliver, prior to any transaction involving a penny stock, a disclosure schedule prepared by the Securities and Exchange Commission relating to the penny stock market, unless the broker-dealer or the transaction is otherwise exempt; | |
| ● | Disclose commissions payable to the broker-dealer and our registered representatives and current bid and offer quotations for the securities; | |
| ● | Send monthly statements disclosing recent price information pertaining to the penny stock held in a customer’s account, the account’s value, and information regarding the limited market in penny stocks; and | |
| ● | Make a special written determination that the penny stock is a suitable investment for the purchaser and receive the purchaser’s written agreement to the transaction, prior to conducting any penny stock transaction in the customer’s account. |
Because of these regulations, broker-dealers may encounter difficulties in their attempt to sell shares of our common stock, which may affect the ability of selling shareholders or other holders to sell their shares in the secondary market, and have the effect of reducing the level of trading activity in the secondary market. These additional sales practice and disclosure requirements could impede the sale of our securities, if our securities become publicly traded. In addition, the liquidity for our securities may be decreased, with a corresponding decrease in the price of our securities. Our shares in all probability will be subject to such penny stock rules and our shareholders will, in all likelihood, find it difficult to sell their securities.
Item 10. INTERESTS OF NAMED LEGAL MATTERS
The legality of the shares offered under this registration statement is being passed upon by Brunson Chandler, & Jones, PLLC. Brunson Chandler & Jones, PLLC is the holder of 300,000 restricted shares of the Company’s common stock.
The audited financial statements for the Company for the yearyears ended December 31, 2017 included in this prospectus have been audited by Saturna Group Chartered Professional Accountants LLP, an independent registered public accounting firm, to the extent2020 and for the periods set forth in our report and are incorporated herein in reliance upon such report given upon the authority of said firm as experts in auditing and accounting.
The audited financial statements for the Company for the year ended December 31, 20182019 included in this prospectus have been audited by Buckley Dodds LLP, an independent registered public accounting firm, to the extent and for the periods set forth in our report and are incorporated herein in reliance upon such report given upon the authority of said firm as experts in auditing and accounting.
The legality of the shares offered under this registration statement is being passed upon by Brunson Chandler, & Jones, PLLC.
| 34 |
Item 11. INFORMATION WITH RESPECT TO THE REGISTRANTBUSINESS
DESCRIPTION OF BUSINESS
DSG Global Inc. is a technology development company based in Surrey, British Columbia, Canada, engaged in the design, manufacture, and marketing of fleet management solutions for the golf industry, as well as commercial, government and military applications. Our principal activities are the sale and rental of GPS tracking devices and interfaces for golf vehicles, and related support services. We were founded by a group of individuals who have dedicated their careers to fleet management technologies and have been at the forefront of the industry’s most innovative developments, and our executive team has over 50 years of experience in the design and manufacture of wireless, GPS, and fleet tracking solutions. We have developed the TAG suite of products that we believe is the first completely modular fleet management solution for the golf industry. The TAG suite of products is currently sold and installed around the world in golf facilities and as commercial applications through a network of established distributors and partnerships with some of the most notable brands in fleet and equipment manufacture.
DSG stands for “Digital Security Guard”, which is our primary value statement giving fleet operator’s new capabilities to track and control their vehicles. We have developed a proprietary combination of hardware and software that is marketed around the world as the TAG system. We have primarily focused on the golf industry where the TAG system is deployed to help golf course operators manage their fleet of golf carts, turf equipment, and utility vehicles. We are a leader in the category of fleet management in the golf industry and were awarded “Best Technology of the Year” in 2010 by Boardroom magazine, a publication of the National Golf Course Owners Association. To date the TAG system is installed on over 8,000 vehicles and has been used to monitor over 6,000,000 rounds of golf.
The TAG system fills a void in the marketplace by offering a modular structure that allows the customer to customize their system to meet desired functionality and budget constraints. In addition to the core TAG system vehicle control functionality, which can operate independently, we offer two golfer information display systems — the alphanumeric INFINITY 7” and high definitionhigh-definition INFINITY XL 12” — providing the operator with two display options which is unique in the industry.
The primary market for our TAG system is the 40,000 golf operations worldwide. While the golf industry remains the primary focus of our sales and marketing efforts, we have completed several successful pilots of the TAG system in other markets such as agriculture and commercial fleet operations. With appropriate resources, we intend to expand our sales and marketing efforts into these new markets.
We have a direct sales force in North America, which comprises the most significant portion of the golf fleet market and have developed key relationships with distributors and golf equipment manufacturers such as E-Z-GO, Yamaha and Ransomes Jacobsen to help drive sales for the North American and worldwide markets.
In order to successfully deliver products, increase sales, and maintain customer satisfaction, we need to have a reliable supplier of our hardware units and components at competitive prices. Presently, we source our INFINITY XL 12” units from one supplier in China and our TAG units from one supplier in the United Kingdom. We have recently established a new relationship with a supplier for our INFINITY XL 12” units in China to provide us with higher quality, newer technology at competitive pricing. We are also exploring the opportunity of a partnership with a US manufacturer.
On April 13, 2015, the Company entered into a share exchange agreement with DSG Tag Systems Inc., now a wholly owned subsidiary of the Company, incorporated under the laws of the State of Nevada on April 17, 2008 and extra provincially registered in British Columbia, Canada in 2008. Subsequent to the closing of the share exchange agreement with DSG Tag Systems, Inc. (“DSG TAG”), we adopted the business and operations of DSG TAG. DSG TAG is now known as Vantage Tag Systems, Inc. (“VTS”). VTS focuses on the fleet management solution and GPS tracking systems for DSG.
On September 15, 2020, the Company incorporated Imperium Motor Corp. (“Imperium”), under the laws of the State of Nevada on September 10, 2020, for which it subscribed to all authorized capital stock, 100 shares of Preferred Class A Stock, at a price of $0.001 per share. Imperium is a wholly owned subsidiary of the Company.
Competition
We compete with a number of established producers and distributors of vehicle fleet management systems, as well as producers of non-golf specific utility vehicle fleet management systems. Many of our competitors have longer operating histories, better brand recognition and greater financial resources than we do. In order for us to successfully compete in our industry we must demonstrate our products’ competitive advantages, develop a comprehensive marketing system, and increase our financial resources.
We believe that we will be able to compete effectively in our industry because of the versatility, reliability, and relative affordability of our products when compared to those of our competitors. We will attempt to build awareness of our competitive advantages among existing and potential customers through trade shows, sales visits and demonstrations, online marketing, and positive word of mouth advertising. However, there can be no assurance that even if we do these things, we will be able to compete effectively with the other companies in our industry.
| 35 |
Intellectual Property
General
Our success will depend in part on our ability to protect our products and product candidates by obtaining and maintaining a strong proprietary position both in the United States and in other countries. To develop and maintain our proprietary position, we will rely on patent protection, trade secrets, know-how, continuing technological innovations and licensing opportunities. In that regard, we retain and rely on the advice of legal counsel specialized in the field of intellectual property.
Patents
| ● | DSG owns two U.S. patents | |
| ● | US Patent No. 8,836,490 for a “Vehicle Management” was issued September 16, 2014 and expires June 29, 2031. | |
| ● | US Patent No. 9,280,902 for a “Facilities Management” was issued March 8, 2016 and expires January 24, 2032. |
Patent Litigation
On December 30, 2012, a corporation filed an action against DSG in the United States courts claiming patent infringement. On March 8, 2013, the parties agreed to a settlement, with the Company admitting no wrong doing, in the amount of $125,000. The settlement is to be paid over an 18-month period in equal installments of $7,500 with annual interest rate of 8%. DSG has accrued all liabilities related to this matter in the financial statements.
Domain Names
We have registered and own the domain name of our website www.dsgtag .com.www.dsgtag.com.
Copyright
We own the common law copyright in the contents of our website (www.dsgtag.com) and our various promotional materials.
Trademarks
We own the common-law trademark rights in our corporate name, product names, and associated logos, including “DSG TAG”, “TAG Golf”, “ECO TAG”, “TAG Infinity 7”, “TAG Infinity XL 12”, “TAG Turf”, “TAG Commercial” and “TAG Military”. We have not applied to register any trademarks with the U.S. Patent and Trademark Office.
Employees
As of April 28, 2017,January 25, 2021, we have 5fifteen full-time employees in general and administrative, operations, engineering, research and development, business development, sales and marketing, and finance. We also engage independent contractors and consultants from time to time on an as-needed basis to supplement our core staff.
Legal Proceedings
On June 4, 2015, a lawsuit was commenced against VTS TAG Systems Inc. in the Supreme Court of British Columbia, captioned Amanda McGuire v. DSG TAG Systems Inc., No. S-154634, Vancouver Registry. The plaintiff alleges that a promissory note in the principal amount of $100,000 CDN issued by DSG TAG Systems was not converted into common shares of DSG TAG Systems, as asserted by DSG TAG Systems, and the plaintiff seeks repayment of indebtedness in the amount of $100,000 CDN plus interest and costs. An agreement was reached on August 13, 2015 between DSG TAG Systems and the plaintiff, pursuant to which DSG TAG Systems agreed to pay the plaintiff $119,700 CDN in monthly installations of $17,100 CDN, the first payment commencing on October 1, 2015, and the plaintiff agreed to exchange 101,200 shares of common stock of DSG Tag Systems for 18,422 shares of common stock of DSG Global, which exchange occurred on October 22, 2015. On October 17, 2016, the Supreme Court of British Columbia made an order in relating to the above discussed lawsuit from a shareholder to recover a loan of CAD$100,000. DSG TAG was ordered to repay the remaining loan plus costs in the amount of $77,589 to the shareholder in 14 monthly payments of $5,500 each plus $589 at the 15th month, starting February 15, 2017.
On September 7, 2016, Chetu Inc. has filed a Complaint for Damage in Florida to recover unpaid invoice amounts of $27,335 plus interest of $4,939. The invoice was not paid due to a dispute that DSG TAG did not think that vendor had delivered the service according to the agreement between the two parties. As at December 31, 2018, we have accrued $22,396 related to this unpaid invoice plus additional interest and legal fees.
On May 24, 2017, we received a notice of default from Coastal Investment Partners LLC (“Coastal”), on three 8% convertible promissory notes issued by the Company in aggregate principal amount of $261,389 and commenced a lawsuit on June 12, 2017 in the United States District Court, Southern District of New York. Coastal alleges that the Company failed to deliver shares of common stock underlying the Coastal notes, and thus giving rise to an event of default. Coastal seeks damages in excess of $250,000 for breach of contact damages, and legal fees incurred by Coastal with respect to the lawsuit. This actionOn August 19, 2020, Coastal obtained a default judgment in the amount of $1,080,481.73. The Company is still pending.currently in settlement discussions with Coastal to satisfy this judgment. As at December 31, 2018,September 30, 2020, the principal balance and accrued interest on this convertible note is included on the consolidated balance sheet under convertible notes payable.
On October 10, 2017, The Company entered into a vendor filed a complaintSettlement Agreement with Coastal for Breachfull and final satisfaction of Contract with Superior Court of the State of California. The Complainant is alleging that it is contractually owed 1,848,130its claims and all outstanding principal debt and accrued interest for $250,000 paid in cash and 200,000 shares of the Company’srestricted common stock and is seeking damages of $270,000. In addition, a related vendor filed in the same filing a complaint for $72,000 as part of a consulting agreement the Company executed. No accrual has been recorded because the Company is of the opinion that no obligation exists since the vendors have not performed their contractual duties.
On February 9, 2017, we received a notice of default from Auctus Fund LLC (“Auctus”), on a 12% convertible promissory note issued to the Company in the principal amount of $75,000 and commenced a lawsuit on February 2, 2018 in the United States District Court, District of Massachusetts. Auctus alleges that the Company failed to honor a conversion notice under the terms of the note, and thus giving rise to an event of default. Auctus seeks damages in excess of $306,681, which consists of the principal amount of the note, liquidated damages, and default interest, and legal fees incurred by Auctus with respect to the lawsuit. On June 1, 2018 the remaining $58,167 note balance, including principal and interest, was reassigned to another unrelated note holder and the note was extinguished. Refer to Note 9(e) and 9(z) of the consolidated financial statements.
On April 9, 2018, we received a share-reserve increase letter from JSJ Investments Inc. (“JSJ”) pursuant to the terms of a 10% convertible promissory note issued to the Company in the principal amount of $135,000. On April 24, 2018, the Company received a notice of default from JSJ for failure to comply with the share-reserve increase and on April 30, 2018 demanded payment in full of the default amount totaling $172,845. On May 7, 2018, JSJ commenced a lawsuit in the United States District Court, District of Dallas County, Texas. JSJ alleges that the Company failed to comply with the share-reserve increase letter, thus giving rise to an event of default, and failed to pay the outstanding default amount due under the terms of the note. JSJ seeks damages in excess of $200,000 but not more than $1,000,000, which consists of the principal amount of the note, default interest, and legal fees incurred by JSJ with respect to the lawsuit. This action is still pending.fair valued at $268,000. As at December 31, 2018, the principal balance2020, $250,000 is included in loans and accrued interest on this convertible noteinterested and $268,000 is included in shares to be issued in relation to the settlement. The Company paid cash of $250,000 on February 11, 2021, in satisfaction of the consolidated balance sheet under convertible notes payable.Settlement Agreement.
We may, from time to time, be party to litigation and subject to claims incident to the ordinary course of business. As our growth continues, we may become party to an increasing number of litigation matters and claims. The outcome of litigation and claims cannot be predicted with certainty, and the resolution of any future matters could materially affect our future financial position, results of operations or cash flows.
Government Regulation
In addition to regulations applicable to businesses in general, we may also be subject to direct regulation by governmental agencies, including the FCC and Department of Defense.
Other Information
None.
| 36 |
DESCRIPTION OF PROPERTY
Our principal executive office is located at 312 – 2630207-15272 Croydon Drive, Surrey, BC, V3Z 6T30Z5 Canada, where we lease approximately 2,024 square feet of office space. On June 1, 2018,July 14, 2020, the Company signed a two-yearthree-year operating lease agreement which commenced on JulyAugust 1, 20182020 and expires on MayJuly 31, 20202023 with the right to renew for an additional two-year term if written notice is provided within 120 days prior to the expiration of the current term. Imperium has an office located at 4670 Central Way, Unit D, Fairfield, California 94534.
MARKET PRICE OF THE REGISTRANT’SFOR COMMON EQUITYSTOCK AND RELATED STOCKHOLDER MATTERSDIVIDEND POLICY
Common Stock
Our common stock is currently quoted on the OTC Market’s OTCQB Venture Marketplace (“OTCQB”) under the symbol “DSGT”. The following table sets forth for the periods indicated the high and low price per share of our common stock as reported on the OTCQB. The following quotations reflect inter-dealer prices, without retail mark-up, mark-down or commission, and may not represent actual transactions:
OTC Markets Group Inc. OTCQB(1)
High $ | Low $ | |||||||
| June 30, 2019 | 3.75 | 0.98 | ||||||
| March 31, 2019 | 4.00 | 0.80 | ||||||
| December 31, 2018 | 6.00 | 2.40 | ||||||
| September 30, 2018 | 10.40 | 2.40 | ||||||
| June 30, 2018 | 33.20 | 4.60 | ||||||
| March 31, 2018 | 26.00 | 4.00 | ||||||
| December 31, 2017 | 2,320 | 400 | ||||||
| September 30, 2017 | 2,520 | 280 | ||||||
High $ | Low $ | |||||||
| December 31, 2020 | 1.52 | 0.09 | ||||||
| September 30, 2020 | 0.188 | 0.0108 | ||||||
| June 30, 2020 | 0.21 | 0.05 | ||||||
| March 31, 2020 | 1.05 | 0.0635 | ||||||
| December 31, 2019 | 1.58 | 0.72 | ||||||
| September 30, 2019 | 1.87 | 0.30 | ||||||
| June 30, 2019 | 3.75 | 0.98 | ||||||
| March 31, 2019 | 4.00 | 0.80 | ||||||
(1) Over-the-counter market quotations reflect inter-dealer prices without retail mark-up, mark-down or commission, and may not represent actual transactions.
Holders of Record
As of December 31, 2018,January 6, 2021, we had 7692 holders of record of our common stock. The actual number of stockholders is greater than this number of record holders and includes stockholders who are beneficial owners but whose shares are held in street name by brokers and other nominees.
Dividends
We have never declared or paid cash dividends on our common stock. We currently intend to retain all available funds and any future earnings for use in the operation of our business and do not anticipate paying any dividends on our common stock in the foreseeable future, if at all. Any future determination to declare dividends will be made at the discretion of our board of directors and will depend on our financial condition, results of operations, capital requirements, general business conditions and other factors that our board of directors may deem relevant.
| 37 |
MANAGEMENT’S DISCUSSION AND ANALYSIS OF FINANCIAL CONDITION AND RESULTS OF OPERATION
You should read the following discussion of our financial condition and results of operations in conjunction with financial statements and notes thereto included elsewhere in this prospectus. The following discussion contains forward-looking statements that reflect our plans, estimates and beliefs. Our actual results could differ materially from those discussed in the forward-looking statements. Factors that could cause or contribute to these differences include those discussed below and elsewhere in this prospectus, particularly in the section labeled “Risk Factors.”
This section of the prospectus includes a number of forward-looking statements that reflect our current views with respect to future events and financial performance. Forward-looking statements are often identified by words like “believe,” “expect,” “estimate,” “anticipate,” “intend,” “project,” and similar expressions, or words that, by their nature, refer to future events. You should not place undue certainty on these forward-looking statements, which apply only as of the date of this prospectus. These forward-looking statements are subject to certain risks and uncertainties that could cause actual results to differ materially from historical results or our predictions.
Overview
DSG Global Inc. is a technology development company based in Surrey, British Columbia, Canada, engaged in the design, manufacture, and marketing of fleet management solutions for the golf industry, as well as commercial, government and military applications. Our principal activities are the sale and rental of GPS tracking devices and interfaces for golf vehicles, and related support services. We were founded by a group of individuals who have dedicated their careers to fleet management technologies and have been at the forefront of the industry’s most innovative developments, and our executive team has over 50 years of experience in the design and manufacture of wireless, GPS, and fleet tracking solutions. We have developed the TAG suite of products that we believe is the first completely modular fleet management solution for the golf industry. The TAG suite of products is currently sold and installed around the world in golf facilities and as commercial applications through a network of established distributors and partnerships with some of the most notable brands in fleet and equipment manufacture.
DSG stands for “Digital Security Guard”, which is our primary value statement giving fleet operator’s new capabilities to track and control their vehicles. We have developed a proprietary combination of hardware and software that is marketed around the world as the TAG system. We have primarily focused on the golf industry where the TAG system is deployed to help golf course operators manage their fleet of golf carts, turf equipment, and utility vehicles. We are a leader in the category of fleet management in the golf industry and were awarded “Best Technology of the Year” in 2010 by Boardroom magazine, a publication of the National Golf Course Owners Association. To date the TAG system is installed on over 8,000 vehicles and has been used to monitor over 6,000,000 rounds of golf.
The TAG system fills a void in the marketplace by offering a modular structure that allows the customer to customize their system to meet desired functionality and budget constraints. In addition to the core TAG system vehicle control functionality, which can operate independently, we offer two golfer information display systems — the alphanumeric INFINITY 7” and high definition INFINITY XL 12” — providing the operator with two display options which is unique in the industry.
The primary market for our TAG system is the 40,000 golf operations worldwide. While the golf industry remains the primary focus of our sales and marketing efforts, we have completed several successful pilots of the TAG system in other markets such as agriculture and commercial fleet operations. With appropriate resources, we intend to expand our sales and marketing efforts into these new markets.
We have a direct sales force in North America, which comprises the most significant portion of the golf fleet market and have developed key relationships with distributors and golf equipment manufacturers such as E-Z-GO, Yamaha and Ransomes Jacobsen to help drive sales for the North American and worldwide markets.
Reverse Acquisition
DSG Global Inc. (formerly Boreal Productions Inc.) was incorporated under the laws of the State of Nevada on September 24, 2007. We were formed to option feature films and TV projects to be packaged and sold to movie studios and production companies.
In January 2015, we changed our name to DSG Global Inc. and effected a one-for-three reverse stock split of our issued and outstanding common stock in anticipation of entering in a share exchange agreement with DSG TAG Systems, Inc., a corporation incorporated under the laws of the State of Nevada on April 17, 2008 and extra provincially registered in British Columbia, Canada in 2008.
On April 13, 2015, we entered into a share exchange agreement with DSG TAG Systems Inc. (“DSG Tag”) and the shareholders of DSG TAG who become parties to the agreement. Pursuant to the terms of the share exchange agreement, we agreed to acquire not less than 75% and up to 100% of the issued and outstanding common shares in the capital stock of DSG TAG in exchange for the issuance to the selling shareholders of up to 20,000,000 pre-reverse split shares of our common stock on the basis of 1 common share for 5.4935 common shares of DSG TAG.
On May 6, 2015, we completed the acquisition of approximately 75% (82,435,748 common shares) of the issued and outstanding common shares of DSG TAG as contemplated by the share exchange agreement by issuing 15,185,875 pre-reverse split shares of our common stock to shareholders of DSG TAG who became parties to the agreement. In addition, concurrent with the closing of the share exchange agreement, we issued an additional 179,823 pre-reverse split shares of our common stock to Westergaard Holdings Ltd. in partial settlement of accrued interest on outstanding indebtedness of DSG TAG.
| 38 |
Following the initial closing of the share exchange agreement and through October 22, 2015, we acquired an additional 101,200 shares of common stock of DSG TAG from shareholders who became parties to the share exchange agreement and issued to these shareholders an aggregate of 18,422 pre-reverse split shares of our common stock. Following completion of these additional purchases, DSG Global Inc. owns approximately 100% of the issued and outstanding shares of common stock of DSG TAG. An aggregate of 4,229,384 shares of Series A Convertible Preferred Stock of DSG TAG were exchanged for 51 Series B and 3,000,000 Series E preferred shares during the year ended December 31, 2018 by Westergaard Holdings Ltd., an affiliate of Keith Westergaard, a previous member of our board of directors which have not been issued as of December 31, 2018.
The reverse acquisition was accounted for as a recapitalization effected by a share exchange, wherein DSG TAG is considered the acquirer for accounting and financial reporting purposes. The assets and liabilities of the acquired entity have been brought forward at their book value and no goodwill has been recognized. We adopted the business and operations of DSG TAG upon the closing of the share exchange agreement.
Factors Affecting Our Performance
We believe that the growth of our business and our future success depend on various opportunities, challenges and other factors, including the following:
Inventory Sourcing
In order to successfully deliver products, increase sales, and maintain customer satisfaction, we need to have a reliable supplier of our hardware units and components at competitive prices. Presently, we source our INFINITY XL 12” units from one supplier in China and our TAG units from one supplier in the United Kingdom. We have recently established a new relationship with a supplier for our INFINITY XL 12” units in China to provide us with higher quality, newer technology at competitive pricing.
In addition, DSG is currently in negotiations with a telecommunications provider to provide new technology in hardware and wireless access.
Competition
We compete with a number of established producers and distributors of vehicle fleet management systems, as well as producers of non-golf specific utility vehicle fleet management systems. Many of our competitors have longer operating histories, better brand recognition and greater financial resources than we do. In order for us to successfully compete in our industry we must demonstrate our products’ competitive advantages, develop a comprehensive marketing system, and increase our financial resources.
We believe that we will be able to compete effectively in our industry because of the versatility, reliability, and relative affordability of our products when compared to those of our competitors. We will attempt to build awareness of our competitive advantages among existing and potential customers through trade shows, sales visits and demonstrations, online marketing, and positive word of mouth advertising. However, there can be no assurance that even if we do these things, we will be able to compete effectively with the other companies in our industry.
Additional Capital
We require additional capital to continue to develop software and products, meet our contractual obligations, and execute our business plan. There can be no assurances that we will be able to raise additional capital on acceptable terms or at all, which would adversely affect our ability to achieve our business objectives.
Components of Our Results of Operations
Revenue
We derive revenue from four different sources, as follows:
Systems Sales Revenue, which consists of the sales price paid by those customers who purchase our TAG system hardware.
Monthly Service Feesare paid by all customers for the wireless data fee charges required to operate the GPS tracking on the TAG systems.
Monthly Rental Feesare paid by those customers that rent the TAG system hardware. The amount of a customer’s monthly payment varies based on the type of equipment rented (a TAG, a TAG and INFINITY 7”, or a TAG and INFINITY XL 12” ).
Advertising Revenueis a new source of revenue that we believe has the potential to be strategic for us in the future. We are in the process of implementing and designing software to provide advertising and other media functionality on our INFINITY XL 12” units.
| 39 |
We recognize revenue when persuasive evidence of an arrangement exists, delivery has occurred, the fee is fixed or determinable, and collectability is reasonably assured. In instances where final acceptance of the product is specified by the customer, revenue is deferred until all acceptance criteria have been met. We accrue for warranty costs, sales returns, and other allowances based on its historical experience.
Our revenue recognition policies are discussed in more detail under “Note 2 – Summary of Significant Accounting Policies” in the notes to our Consolidated Financial Statements included in Part I, Item 1 of this Form 10-K.Statements.
Cost of Revenue
Our cost of revenue consists primarily of hardware purchases, wireless data fees, mapping, installation costs, freight expenses and inventory adjustments.
Hardware purchases.Our equipment purchases consist primarily of TAG system control units, INFINITY 7” display, and INFINITY XL 12” display tablets. The TAG system control unit is sold as a stand-alone unit or in conjunction with our INFINITY 7” alphanumeric display or INFINITY XL 12” high definition “Infinity XL 12” activated” display. Hardware purchases also include costs of components used during installations, such as cables, mounting solutions, and other miscellaneous equipment.
Wireless data fees.Our wireless data fees consist primarily of the data fees charged by outside providers of GPS tracking used in all of our TAG system control units.
Mapping.Our mapping costs consist of aerial mapping, course map, geofencing, and 3D flyovers for golf courses. This cost is incurred at the time of hardware installation.
Installation.Our installation costs consist primarily of costs incurred by our employed service technicians for the cost of travel, meals, and miscellaneous components required during installations. In addition, these costs also include fees paid to external contractors for installations on a project by project basis.
Freight expenses and Inventory adjustments.Our freight expenses consist primarily of costs to ship hardware to courses for installations. Our inventory adjustments include inventory write offs, write downs, and other adjustments to the cost of inventory.
Operating Expenses & Other Income (Expenses)We classify our operating expenses and other income (expenses) into six categories: compensation, research and development, general and administrative, warranty, foreign currency exchange, and finance costs. Our operating expenses consist primarily of sales and marketing, salaries and wages, consulting fees, professional fees, trade shows, software development, and allocated costs. Allocated costs include charges for facilities, office expenses, telephones and other miscellaneous expenses. Our other income (expenses) primarily consists of financing costs and foreign exchange gains or losses.
Compensation expense.Our compensation expenses consist primarily of personnel costs, such as employee salaries, payroll expenses, and employee benefits. This includes salaries for management, administration, engineering, sales and marketing, and service support technicians. Salaries and wages directly related to projects or research and development are expensed as incurred to their operating expense category.
Research and development. Our research and development expenses consist primarily of personnel costs and professional services associated with the ongoing development and maintenance of our technology.
Research and development expenses include payroll, and other headcount-related expenses associated with product development. Research and development expenses also include third-party development and programming costs. Such costs related to software development are included in research and development expense until the point that technological feasibility is reached. Research and development is expensed and is included in operating expenses.
General and administrative. Our general and administrative expenses consist primarily of sales and marketing, commissions, travel, trade shows, consultant fees, insurance, and compliance and other administrative functions, as well as accounting and legal professional services fees, allocated costs and other corporate expenses. Sales and marketing includes brand marketing, marketing materials, and media management.
We expect to continue to invest in corporate infrastructure and incur additional expenses associated with being a public company, including increased legal and accounting costs, investor relations costs, higher insurance premiums and compliance costs associated with Section 404 of the Sarbanes-Oxley Act of 2002. In addition, we expect sales and marketing expenses to increase in absolute dollars in future periods. In particular, we expect to incur additional marketing costs to support the expansion of our offerings in new markets like commercial fleet management and agriculture.
Warranty expense (recovery). Our warranty expenses consist primarily of associated material product costs, labor costs for technical support staff, and other associated overhead. Warranty costs are expensed as they are incurred.
Bad debt. Our bad debt expense consists primarily of amounts written down for doubtful accounts recorded on trade receivables.
Depreciation and amortization. Our depreciation and amortization costs consist primarily of depreciation and amortization on fixed assets, equipment on lease, and intangible assets.
Foreign currency exchange. Our foreign currency exchange consists primarily of foreign exchange fluctuations recorded in Canadian dollar (CAD), British Pounds (GBP), or Euro (EUR) at the rates of exchange in effect when the transaction occurred.
Finance costs. Our finance costs consist primarily of investor interest expense, investor commission fees, and other financing charges for obtaining debt financing.
We expect to continue to invest in corporate infrastructure and incur additional expenses associated with being a public company, including increased legal and accounting costs, investor relations costs, higher insurance premiums and compliance costs associated with Section 404 of the Sarbanes-Oxley Act of 2002. In addition, we expect sales and marketing expenses to increase in absolute dollars in future periods. In particular, we expect to incur additional marketing costs to support the expansion of our offerings in new markets like commercial fleet management and agriculture.
| 40 |
Results of Operations
We recognized net incomeThe following tables set forth our consolidated results of $6,893,187operations as a percentage of revenue for the three-month period ended June 30, 2019, which was $2,392,177 or 53.1% more than the net income of $4,501,010 for the three-month period ended June 30, 2018. The primary reasons are attributable to the increase in gain from change in fair value of derivative liabilities, decrease in loss on extinguishment of debt and decrease in finance costs. Also contributing to this increase in gain is a decrease in loss from operations.periods presented:
| For the year ended | ||||||||
| December 31, 2020 | December 31, 2019 | |||||||
| Revenue | 100.0 | % | 100.0 | % | ||||
| Cost of revenue | 45.5 | % | 67.8 | % | ||||
| Gross profit | 54.5 | % | 32.2 | % | ||||
| Operating expenses | ||||||||
| Compensation expense | 240.4 | % | 137.3 | % | ||||
| General and administration expense | 374.4 | % | 63.4 | % | ||||
| Warranty recovery | - | % | - | % | ||||
| Bad debt | 1.9 | % | 4.7 | % | ||||
| Depreciation and amortization expense | 0.8 | % | 0.3 | % | ||||
| Total operating expense | 617.5 | % | 205.6 | % | ||||
| Loss from operations | (563.0 | )% | (173.4 | )% | ||||
| Other income (expense) | ||||||||
| Foreign currency exchange | 2.8 | % | 2.7 | % | ||||
| Change in fair value of derivative instruments | 339.2 | % | 19.4 | % | ||||
| Loss on extinguishment of debt | (322.6 | )% | 47.2 | % | ||||
| Finance costs | (142.3 | )% | (115.8 | )% | ||||
| Total other expense | (123.0 | )% | (46.6 | )% | ||||
| Loss before income taxes | (686.0 | )% | (220.0 | )% | ||||
| Provision for income taxes | - | % | - | % | ||||
| Net loss | (686.0 | )% | (220.0 | )% | ||||
| Other comprehensive income (expense) | ||||||||
| Foreign currency translation adjustments | (13.4 | )% | (6.6 | )% | ||||
| Comprehensive loss | (699.3 | )% | (226.6 | )% | ||||
We recognized a net loss of $279,786 for the six-month period ended June 30, 2019, which was $4,041,621 or 93.5% less than the net loss of $4,321,407 for the six-month period ended June 30, 2018. The primary reasons are attributable to decrease in loss on extinguishment of debt, decrease in finance costs the increase in gain from change in fair value of derivative liabilities. Also contributing to this increase in gain is a decrease in loss from operations and increase in gain from change in fair value of derivative liabilities.
Comparison of the threeYears Ended December 31, 2020 and six months ended June 30, 2019 and 2018:
Revenue
| For the Three Months Ended June 30, | For the Six Months Ended June 30, | |||||||||||||||||||||||
| 2019 | 2018 | % Change | 2019 | 2018 | % Change | |||||||||||||||||||
| Revenue | $ | 284,646 | $ | 237,046 | 20.1 | $ | 786,070 | 347,942 | 125.9 | |||||||||||||||
For the Years Ended December 31, | ||||||||||||
| 2020 | 2019 | % Change | ||||||||||
| Revenue | $ | 900,482 | $ | 1,399,420 | (35.7 | )% | ||||||
Revenue increaseddecreased by $47,600$498,938 or 20.1%35.7%, for the three monthsyear ended June 30, 2019December 31, 2020 as compared to the three monthsyear ended June 30, 2018. Revenue increased by $438,128 or 125.9%,December 31, 2019. Sales decreased for the six monthsyear ended, June 30, 2019year over year, as comparedthe result of challenges related to COVID-19 and normal customer attrition. This compares to the three months ended June 30, 2018.
Sales increasedcomparative period in which the Company experienced growth as thea result of aggressive marketing and installation of the new infinityInfinity suite of products compared to lower sales in the comparative period.products.
Cost of Revenue
| For the Three Months Ended June 30, | For the Six Months Ended June 30, | |||||||||||||||||||||||
| 2019 | 2018 | % Change | 2019 | 2018 | % Change | |||||||||||||||||||
| Cost of revenue | $ | 32,886 | $ | 79,552 | (58.7 | ) | $ | 338,954 | $ | 97,881 | 246.3 | |||||||||||||
For the Years Ended December 31, | ||||||||||||
| 2020 | 2019 | % Change | ||||||||||
| Cost of revenue | $ | 409,793 | $ | 948,273 | (56.8 | )% | ||||||
Cost of revenue decreased by $46,666, or 58.7%, for the three months ended June 30, 2019 as compared to the three months June 30, 2018. The overall decrease was due to the decrease of cost of goods sold, partially offset by an increase in wireless fees. The table below outlines the differences in detail:
| For the Three Months Ended | ||||||||||||||||
June 30, | June 30, | Difference | % Difference | |||||||||||||
| Cost of Goods | $ | 8,576 | $ | 64,570 | $ | (55,994 | ) | (86.7 | ) | |||||||
| Labour | (28 | ) | - | (28 | ) | (100.0 | ) | |||||||||
| Mapping & Freight Costs | (38 | ) | 4,478 | (4,516 | ) | (100.8 | ) | |||||||||
| Wireless Fees | 24,368 | 10,504 | 13,864 | 132.0 | ||||||||||||
| Inventory Write-off/Adjustments | 8 | - | 8 | 100.0 | ||||||||||||
| $ | 32,886 | $ | 79,552 | $ | (46,666 | ) | (58.7 | ) | ||||||||
| 41 |
Cost of revenue increased by $241,073,$538,480 or 246.3%56.8%, for the six monthsyear ended June 30, 2019December 31, 2020 as compared to the six months June 30, 2018. The overall increase was due to the increase of cost of goods sold and labour, partially offset by a decrease in wireless fees.year ended December 31, 2019. The table below outlines the differences in detail:
| For the Six Months Ended | ||||||||||||||||
June 30, | June 30, | Difference | % Difference | |||||||||||||
| Cost of Goods | $ | 296,270 | $ | 64,570 | $ | 231,700 | 358.8 | |||||||||
| Labour | 8,967 | - | 8,967 | 100.0 | ||||||||||||
| Mapping & Freight Costs | 12,112 | 5,138 | 6,974 | 135.7 | ||||||||||||
| Wireless Fees | 24,368 | 28,173 | (3,805 | ) | (13.5 | ) | ||||||||||
| Inventory Write-off/Adjustments | (2,763 | ) | - | (2,763 | ) | (100.0 | ) | |||||||||
| $ | 338,954 | $ | 97,881 | $ | 241,073 | 246.3 | ||||||||||
| For the Years Ended | ||||||||||||||||
| December 31, 2020 | December 31, 2019 | Difference | % Difference | |||||||||||||
| Cost of goods | $ | 319,185 | $ | 857,507 | $ | (538,322 | ) | (62.8 | ) | |||||||
| Labour | - | 9,016 | (9,016 | ) | (100.0 | ) | ||||||||||
| Mapping & freight costs | 26,795 | 24,442 | 2,353 | 9.6 | ||||||||||||
| Wireless fees | 63,813 | 60,086 | 3,727 | 6.2 | ||||||||||||
| Inventory adjustments & write offs | - | (2,778 | ) | 2,7781 | (100.0 | ) | ||||||||||
| $ | 409,793 | $ | 948,273 | $ | (538,480 | ) | (56.8 | ) | ||||||||
Cost of sales decreased for the years ended, year over year, primarily due to challenges related to COVID-19 and normal customer attrition. This decrease was consistent with the decrease in revenue for the same period.
Compensation Expense
| For the Three Months Ended June 30, | For the Six Months Ended June 30, | |||||||||||||||||||||||
| 2019 | 2018 | % Change | 2019 | 2018 | % Change | |||||||||||||||||||
| Compensation Expense | $ | 144,673 | $ | 209,174 | (30.8 | ) | $ | 279,756 | $ | 417,802 | (33.0 | ) | ||||||||||||
For the Years Ended December 31, | ||||||||||||
| 2020 | 2019 | % Change | ||||||||||
| Compensation expense | $ | 2,164,776 | $ | 1,921,078 | 12.7 | % | ||||||
Compensation expense decreasedincreased by $64,501,$243,698 or 30.8%12.7%, for the three monthsyear ended June 30, 2019December 31, 2020 as compared to the three monthsyear ended June 30, 2018December 31, 2019 primarily as a result of non-cash warrants and shares issued for consulting services during the period as well as due to a reductionan increase in headcount and employees. Compensation expense decreased by $138,046, or 33.0%,the CEO’s wage of $100,000 for the six months ended June 30, 2019 as compared to the six months ended June 30, 2018 due to a reduction in headcount and employees.fiscal year 2020.
General and Administration Expense
For the Years Ended December 31, | ||||||||||||
| 2020 | 2019 | % Change | ||||||||||
| General & administration expense | $ | 3,371,325 | $ | 886,592 | 280.3 | % | ||||||
General & administration expense decreasedincreased by $71,542$2,484,733 or 26.0%280.3% for the three monthsyear ended June 30, 2019December 31, 2020 as compared to the three monthsyear ended June 30, 2018.December 31, 2019. The table below outlines the differences in detail:
| For the Three Months Ended | ||||||||||||||||
June 30, | June 30, | Difference | % Difference | |||||||||||||
| Accounting & Legal | $ | 75,534 | $ | 96,884 | $ | (21,350 | ) | (22.0 | ) | |||||||
| Marketing & Advertising | 24,887 | 7,535 | 17,352 | 230.3 | ||||||||||||
| Subcontractor & Commissions | 36,435 | 64,854 | (28,419 | ) | (43.8 | ) | ||||||||||
| Hardware | 1,091 | 21,632 | (20,541 | ) | (95.0 | ) | ||||||||||
| Office Expense, Rent, Software, Bank & Credit Card Charges, Telephone, Travel, & Meals | 65,991 | 84,575 | (18,584 | ) | (22.0 | ) | ||||||||||
| $ | 203,938 | $ | 275,480 | $ | (71,542 | ) | (26.0 | ) | ||||||||
| For the Years Ended | ||||||||||||||||
| December 2020 | December 2019 | Difference | % Difference | |||||||||||||
| Accounting & legal | $ | 413,268 | $ | 187,144 | $ | 226,124 | 120.8 | % | ||||||||
| Marketing & advertising | 2,043,735 | 73,281 | 1,970,454 | 2,688.9 | % | |||||||||||
| Subcontractor & commissions | 401,913 | 181,571 | 220,342 | 121.4 | % | |||||||||||
| Hardware | 5,243 | 13,487 | (8,244 | ) | (61.1 | )% | ||||||||||
| Office expense, rent, software, design, bank & credit card charges, telephone & meals | 507,166 | 431,109 | 76,057 | 17.6 | % | |||||||||||
| $ | 3,371,325 | $ | 886,592 | $ | 2,484,733 | 280.3 | % | |||||||||
The overall decrease inincrease general and administrativeadmin expenses was primary related to a decrease in subcontractor and commissions. Also contributing to this decrease was a decrease in office expense, rent, software and other charges primarily due to increases in marketing and advertising, general office expenses and accounting and legal expenses. Marketing and advertising increased as a reduction in rent expenseresult of non-cash shares issued for investor relations and travel and other expenses. Rent expense decreasedmarketing services. General office expenses increased as the Company relocating to a new office space. Travel and other expenses decreased as the Company began providing remote service and support, rather than on-site support and attended aresult of greater trade show and operating lease expenses in the current period. Accounting and legal expenses increased as a result of lower expenses in the prior but not current period.period from delays in preparing and issuing financial statements for the prior period as well as due to one-time charges which we incurred in relation to the Exchange Agreement.
| 42 |
General & administration expense decreased by $201,799 or 31.9% for the six months ended June 30, 2019 compared to the three months ended June 30, 2018. The table below outlines the differences in detail:
| For the Six Months Ended | ||||||||||||||||
| June 30, 2019 | June 30, | Difference | % Difference | |||||||||||||
| Accounting & Legal | $ | 84,855 | $ | 144,670 | $ | (59,815 | ) | (41.3 | ) | |||||||
| Marketing & Advertising | 45,793 | 20,218 | 25,575 | 126.5 | ||||||||||||
| Subcontractor & Commissions | 127,311 | 121,162 | 6,149 | 5.1 | ||||||||||||
| Hardware | 3,814 | 37,240 | (33,426 | ) | (89.8 | ) | ||||||||||
| Office Expense, Rent, Software, Bank & Credit Card Charges, Telephone, Travel, & Meals | 169,921 | 310,203 | (140,282 | ) | (45.2 | ) | ||||||||||
| $ | 431,694 | $ | 633,493 | $ | (201,799 | ) | (31.9 | ) | ||||||||
The overall decrease in general and administrative expenses was primary related to a decrease in office expense, rent, software and other charges of $140,282 or 45.2% primarily due to a reduction in rent expense and travel and other expenses. Rent expense decreased as the Company relocating to a new office space. Travel and other expenses decreased as the Company began providing remote service and support, rather than on-site support and attended a trade show in the prior but not current period.
Foreign Currency Exchange
| For the Three Months Ended June 30, | For the Six Months Ended June 30, | |||||||||||||||||||||||
| 2019 | 2018 | % Change | 2019 | 2018 | % Change | |||||||||||||||||||
| Foreign currency exchange (gain) loss | $ | (13,526 | ) | $ | (410,454 | ) | (96.7 | ) | $ | (31,163 | ) | $ | 150,212 | (120.7 | ) | |||||||||
For the Years Ended December 31, | ||||||||||||
| 2020 | 2019 | % Change | ||||||||||
| Foreign currency exchange (gain) loss | $ | (24,900 | ) | $ | (37,224 | ) | (33.1 | )% | ||||
For the three monthsyear ended June 30, 2019,December 31, 2020, we recognized a $13,526$24,900 in foreign exchange gain as compared to a $410,454$37,224 in foreign exchange gainloss for the three monthsyear ended June 30, 2018.December 31, 2019. The change was primarily due to settlement of various foreign currency denominated debt instruments in the prior year as well as beneficial changesmovements in foreign currency rates on payables, receivables and other foreign exchange transactions denominated in currencies other than the functional currencies of the legal entities in which the transactions are recorded. Foreign currency fluctuations are primarily from the Canadian Dollar, Euro and British pound.
For the six months ended June 30, 2019, we recognized a $31,163 foreign exchange gain as compared to a $150,212 foreign exchange loss for the six months ended June 30, 2018. The change was primarily due to settlement of various foreign currency denominated debt instruments in the prior year as well as beneficial changes in foreign currency rates on payables, receivables and other foreign exchange transactions denominated in currencies other than the functional currencies of the legal entities in which the transactions are recorded. Foreign currency fluctuations are primarily from the Canadian Dollar,dollar, Euro and British pound.
Unrealized (Gain) Loss on DerivativeChange in fair value of derivative instruments
| For the Three Months Ended June 30, | For the Six Months Ended June 30, | |||||||||||||||||||||||
| 2019 | 2018 | % Change | 2019 | 2018 | % Change | |||||||||||||||||||
| Unrealized (gain) loss on derivative | $ | (7,356,541 | ) | $ | (6,013,778 | ) | 22.3 | $ | (720,624 | ) | $ | (397,517 | ) | 81.3 | ||||||||||
For the Years Ended December 31, | ||||||||||||
| 2020 | 2019 | % Change | ||||||||||
| Change in fair value of derivative instruments | $ | (3,054,034 | ) | $ | (271,704 | ) | 1,024.0 | % | ||||
Derivative gain increased by $1,342,763$2,782,330 or 22.3%,1,024.0% to a gain of $3,054,034, for the three monthsyear ended June 30, 2019December 31, 2020 as compared to a gain of $271,704 for the three monthsyear ended June 30, 2018December 31, 2019. This was largely due to significant settlement of derivative instruments during the current period.
(Gain) loss on extinguishment of debt
For the Years Ended December 31, | ||||||||||||
| 2020 | 2019 | % Change | ||||||||||
| (Gain) loss on extinguishment of debt | $ | 2,904,832 | $ | (659,999 | ) | (540.1 | )% | |||||
(Gain) loss on extinguishment of debt decreased by $3,564,831 or 540.1% to a loss of $2,904,832, for the year ended December 31, 2020 as compared to a gain of $659,999 for the year ended December 31, 2019. During the year ended December 31, 2020, the Company incurred greater losses on conversion of convertible debt and share settled debt due to the change in fairsettlement of various accounts payable balances and debts which were converted into common stock at a value ashigher than the carrying value of June 30, 2018 triggeringthe liabilities settled. These increases were primarily a result of unrealized gains on derivative instrumentsmore conversions of convertible debt and accrued interest in the current quarter ending on convertible notes payable. The changeperiod and decreases in fair value was impacted heavilythe strike price due to the volatility in the Company’s stock price.price movement. During the year ended December 31, 2019 the Company settled various accounts payable balances, debt and preferred shares in exchange for shares of common stock to be issued and warrants at a value lower than the carrying value of the liabilities settled.
Derivative gain increased by $323,107 or 81.3%, for the six months ended June 30, 2019 as compared to the six months ended June 30, 2018 due to the change in fair value as of June 30, 2018 triggering of unrealized gains on derivative instruments in the current quarter ending on convertible notes payable. The change in fair value was impacted heavily due to the volatility in the Company’s stock price.Finance Costs
| For the Three Months Ended June 30, | For the Six Months Ended June 30, | |||||||||||||||||||||||
| 2019 | 2018 | % Change | 2019 | 2018 | % Change | |||||||||||||||||||
| Finance costs | $ | 318,274 | $ | 776,506 | (59.0 | ) | $ | 620,030 | $ | 1,517,068 | (59.1 | ) | ||||||||||||
For the Years Ended December 31, | ||||||||||||
| 2020 | 2019 | % Change | ||||||||||
| Finance costs | $ | 1,281,505 | $ | 1,620,504 | (20.9 | )% | ||||||
Finance costs decreased by $458,232$338,999 or 59.0%20.9%, for the three monthsyear ended June 30, 2019December 31, 2020 as compared to the three monthsyear ended June 30, 2018.December 31, 2019. Finance costs decreased due to the large number of conversions ofand settlement of notes in the current period and prior year.period.
Finance costs decreased by $897,038 or 59.1%, for the six months ended June 30, 2019 as compared to the six months ended June 30, 2018. Finance costs decreased due to the large number of conversions of settlement of notes in the current period and prior year.
| 43 |
Net Loss
| For the Three Months Ended June 30, | For the Six Months Ended June 30, | |||||||||||||||||||||||
| 2019 | 2018 | % Change | 2019 | 2018 | % Change | |||||||||||||||||||
| Net income (loss) | $ | 6,893,187 | $ | 4,501,010 | 53.1 | $ | (279,786 | ) | $ | (4,321,407 | ) | (93.5 | ) | |||||||||||
For the Years Ended December 31, | ||||||||||||
| 2020 | 2019 | % Change | ||||||||||
| Net loss | $ | (6,177,099 | ) | $ | (3,078,120 | ) | 100.7 | % | ||||
As a result of the above factors, net incomeloss increased by $2,392,177$3,098,979 or 53.1% and net loss decreased by $4,041,621 or 93.5%100.7% for the three and six monthsyear ended June 30, 2019December 31, 2020 as compared to the three and six monthsyear ended June 30, 2018, respectively.December 31, 2019.
Liquidity and Capital Resources
From our incorporation in April 17, 2008 through June 30, 2019,December 31, 2020, we have financed our operations, capital expenditures and working capital needs through the sale of common shares and the incurrence of indebtedness, including term loans, convertible loans, revolving lines of credit and purchase order financing. At June 30, 2019,December 31, 2020, we had $7,346,720$2,529,034 in outstanding indebtedness, all ofcurrent liabilities which has either already reached maturity or matures within the next twelve months.
We had cash in the amount of $31,820 as of June 30, 2019, as$1,372,016 at December 31, 2020, compared to $5,059 as of$25,494 at December 31, 2018.2019. We had a working capital deficit of $6,839,345$746,341 as of June 30, 2019December 31, 2020 compared to working capital deficit of $6,687,807$8,376,433 as of December 31, 2018.2019.
Liquidity and Financial Condition
Our financial position as of June 30, 2019 and 2018, and the changes for the periods then ended are as follows:
| At December 31, 2020 | At December 31, 2019 | Percentage Increase/(Decrease) | ||||||||||
| Current assets | $ | 1,782,693 | $ | 250,800 | 610.8 | % | ||||||
| Current liabilities | $ | 2,529,034 | $ | 8,627,233 | (70.7 | )% | ||||||
| Working capital | $ | (746,341 | ) | $ | (8,376,433 | ) | (91.1 | )% | ||||
Working Capital
At June 30, 2019 | At December 31, 2018 | |||||||
| Current Assets | $ | 500,121 | $ | 333,239 | ||||
| Current Liabilities | $ | 7,339,466 | $ | 7,021,046 | ||||
| Working Capital | $ | (6,839,345 | ) | $ | (6,687,807 | ) | ||
Cash Flow Analysis
Our cash flows from operating, investing, and financing activities are summarized as follows:
| June 30, | ||||||||
| 2019 | 2018 | |||||||
| Net cash used in by operating activities | $ | (248,239 | ) | $ | (991,604 | ) | ||
| Net cash used in investing activities | - | (1,544 | ) | |||||
| Net cash provided by financing activities | 275,000 | 1,003,659 | ||||||
| Net increase in cash | 26,761 | 10,511 | ||||||
| Cash at beginning of period | 5,059 | 5,488 | ||||||
| Cash at end of period | $ | 31,820 | $ | 15,999 | ||||
| December 31 | ||||||||
| 2020 | 2019 | |||||||
| Net cash (used in) provided by operating activities | $ | (1,400,086 | ) | $ | (848,777 | ) | ||
| Net cash (used in) provided by investing activities | (23,161 | ) | (1,383 | ) | ||||
| Net cash (used in) provided by financing activities | 2,835,880 | 869,991 | ||||||
| Effect of exchange rate changes on cash | (66,111 | ) | 604 | |||||
| Net (decrease) increase in cash | 1,346,522 | 20,435 | ||||||
| Cash at beginning of period | 25,494 | 5,059 | ||||||
| Cash and equivalents at end of period | $ | 1,372,016 | $ | 25,494 | ||||
| 44 |
During the year ended December 31, 2020, cash used in operations totaled $1,400,086. This consists of the net loss of $6,177,099, adjusted by $4,777,013 for non-cash items and changes in non-cash working capital. Changes in non-cash working capital items consisted primarily of change in trade and other payables of $664,239, partially offset by changes in inventory and prepaid expenses of $139,219 and $114,369, respectively.
During the year ended December 31, 2019, cash used in operations totaled $848,777. This consists of the net loss of $3,078,120, adjusted by $2,229,343 for non-cash items and changes in non-cash working capital. Changes in non-cash working capital items consisted primarily of change in trade and other payables of $797,785, partially offset by change in deferred revenue of $111,456.
Net Cash Used in Operating Activities.Investing Activities. During the six monthsyear ended June 30,December 31, 2020, cash used in investing activities consisted of $23,161 for the acquisition of fixed assets.
During the year ended December 31, 2019, cash used in operations totaled $248,239. This reflectsinvesting activities consisted of $1,383 for the net lossacquisition of $279,786 less $31,547 provided by changes in operating assets and liabilities and adjustments for non-cash items. Non-cash items and working capital items consisted primarily of non-cash change in fair value of derivative liabilities of $720,624, non-cash accretion of discounts on debt of $328,055 and increase in trade payables and accruals of $554,903.fixed assets.
Net Cash (Used in) Provided by Investing Activities . The Company had no investing activities in the six months ended June 30, 2019. Investing activities reduced cash by $1,544 in the six months ended June 30, 2018, related to the purchase of property, plant and equipment.
Net Cash Provided by Financing Activities . Net cash from financing activities during the six months ended June 30, 2019 totaled $275,000, from various note and loan facilities entered during the period. Net cash provided by financing activities during the six months ended June 30, 2018 was $1,003,659, primarily from various note and loan facilities entered during the period in addition to the issuance of shares.
Outstanding IndebtednessFinance Costs
Our current indebtedness as of June 30, 2019 is comprised of the following:
For the Years Ended December 31, | ||||||||||||
| 2020 | 2019 | % Change | ||||||||||
| Finance costs | $ | 1,281,505 | $ | 1,620,504 | (20.9 | )% | ||||||
Prospective Capital Needs
We estimate our operating expenses and working capital requirements for the twelve-month period to be as follows:
| Estimated Expenses for the Twelve-Month Period ending June 30, 2020 | ||||
| Management compensation | $ | 500,000 | ||
| Professional fees | $ | 150,000 | ||
| General and administrative | $ | 1,900,000 | ||
| Total | $ | 2,550,000 | ||
As noted earlier, during the six months ended June 30, 2019, cash used in operations totaled $241,038. The relatively low level of cash used compared to our estimated working capital needs in the future was the result of an accumulation of vendor payables, customer receivables, and an increasing loan payable balance. We need to reduce the current level of payables in the near future to keep a good relationship with our vendors and expand our sales and service team to achieve our operational objectives. At present, our cash requirements for the next 12 months outweigh the funds available. Of the $2,550,000 that we require for the next 12 months, we had $39,021 in cash as of June 30, 2019 and a working capital deficit of $6,839,398. Our principal sources of liquidity are cash generated from product sales. In order to achieve sustained profitability and positive cash flows from operations, we will need to increase revenue and/Finance costs decreased by $338,999 or reduce operating expenses. Our ability to maintain, or increase, current revenue levels to achieve and sustain profitability will depend, in part, on demand for our products.
In order to improve our liquidity, we also plan to pursue additional equity financing from private investors or possibly a registered public offering. We do not currently have any definitive arrangements in place for the completion of any further private placement financings and there is no assurance that we will be successful in completing any further private placement financings. To help finance our day to day working capital needs, the founder and CEO of the company has made a total payment of $113,475 since late 2015. If we are unable to achieve the necessary additional financing, then we plan to reduce the amounts that we spend on our business activities and administrative expenses in order to be within the amount of capital resources obligations and execute our business plan. There can be no assurances that we will be able to raise additional capital on acceptable terms or at all, which would adversely affect our ability to achieve our business objectives.
Comparison of the Years Ended December 31, 2018 and 2017
Revenue
| For the Years Ended December 31, | ||||||||||||
| 2018 | 2017 | % Change | ||||||||||
| Revenue | $ | 1,281,024 | $ | 1,100,577 | 16.4 | % | ||||||
Revenue increased by $180,447, or 16.4%20.9%, for the year ended December 31, 20182020 as compared to the year ended December 31, 2017. Sales increased as2019. Finance costs decreased due to the resultlarge number of aggressive marketingconversions and installationsettlement of notes in the new infinity suite of products compared to lower sales in 2017 from continued design and redevelopment of our product line.current period.
| 43 |
Cost of RevenueNet Loss
| For the Years Ended December 31, | ||||||||||||
| 2018 | 2017 | % Change | ||||||||||
| Cost of revenue | $ | 191,560 | $ | 388,220 | (50.6 | )% | ||||||
For the Years Ended December 31, | ||||||||||||
| 2020 | 2019 | % Change | ||||||||||
| Net loss | $ | (6,177,099 | ) | $ | (3,078,120 | ) | 100.7 | % | ||||
CostAs a result of revenue decreasedthe above factors, net loss increased by $196,570$3,098,979 or 50.6%,100.7% for the year ended December 31, 20182020 as compared to the year ended December 31, 2017. The table below outlines the differences in detail:2019.
| For the Years Ended | ||||||||||||||||
| December 31, 2018 | December 31, 2017 | Difference | % Difference | |||||||||||||
| Cost of Goods | $ | 86,832 | $ | 92,019 | $ | (5,187 | ) | (5.6 | ) | |||||||
| Mapping & Freight Costs | 12,332 | 20,952 | (8,620 | ) | (41.1 | ) | ||||||||||
| Wireless Fees | 14,483 | 264,426 | (249,943 | ) | (94.5 | ) | ||||||||||
| Inventory Adjustments & Write offs | 78,003 | 10,823 | 67,180 | 620.7 | ||||||||||||
| $ | 191,650 | $ | 388,220 | $ | (196,570 | ) | (50.6 | ) | ||||||||
Liquidity and Capital Resources
The decrease was primarily due manufacturingFrom our incorporation in April 17, 2008 through December 31, 2020, we have financed our operations, capital expenditures and supply efficienciesworking capital needs through the sale of common shares and better negotiated rates with suppliers, specifically the Company’s wireless carrier. Costincurrence of revenue was partially offset by an increaseindebtedness, including term loans, convertible loans, revolving lines of $67,180credit and purchase order financing. At December 31, 2020, we had $2,529,034 in inventory allowance and adjustments recorded in 2018outstanding current liabilities which has either already reached maturity or matures within the next twelve months.
We had cash of $1,372,016 at December 31, 2020, compared to 2017 related$25,494 at December 31, 2019. We had a working capital deficit of $746,341 as of December 31, 2020 compared to an allowance recorded on used inventory to account for amounts expected to be written off.working capital deficit of $8,376,433 as of December 31, 2019.
Compensation ExpenseLiquidity and Financial Condition
| For the Years Ended December 31, | ||||||||||||
| 2018 | 2017 | % Change | ||||||||||
| Compensation expense | $ | 726,520 | $ | 746,739 | (2.7 | )% | ||||||
| At December 31, 2020 | At December 31, 2019 | Percentage Increase/(Decrease) | ||||||||||
| Current assets | $ | 1,782,693 | $ | 250,800 | 610.8 | % | ||||||
| Current liabilities | $ | 2,529,034 | $ | 8,627,233 | (70.7 | )% | ||||||
| Working capital | $ | (746,341 | ) | $ | (8,376,433 | ) | (91.1 | )% | ||||
Compensation expense decreased by $20,219 or 2.7%, forCash Flow Analysis
Our cash flows from operating, investing, and financing activities are summarized as follows:
| December 31 | ||||||||
| 2020 | 2019 | |||||||
| Net cash (used in) provided by operating activities | $ | (1,400,086 | ) | $ | (848,777 | ) | ||
| Net cash (used in) provided by investing activities | (23,161 | ) | (1,383 | ) | ||||
| Net cash (used in) provided by financing activities | 2,835,880 | 869,991 | ||||||
| Effect of exchange rate changes on cash | (66,111 | ) | 604 | |||||
| Net (decrease) increase in cash | 1,346,522 | 20,435 | ||||||
| Cash at beginning of period | 25,494 | 5,059 | ||||||
| Cash and equivalents at end of period | $ | 1,372,016 | $ | 25,494 | ||||
| 44 |
During the year ended December 31, 2018 as compared to2020, cash used in operations totaled $1,400,086. This consists of the net loss of $6,177,099, adjusted by $4,777,013 for non-cash items and changes in non-cash working capital. Changes in non-cash working capital items consisted primarily of change in trade and other payables of $664,239, partially offset by changes in inventory and prepaid expenses of $139,219 and $114,369, respectively.
During the year ended December 31, 2017. The decrease was insignificant.
2019, cash used in operations totaled $848,777. This consists of the net loss of $3,078,120, adjusted by $2,229,343 for non-cash items and changes in non-cash working capital. Changes in non-cash working capital items consisted primarily of change in trade and other payables of $797,785, partially offset by change in deferred revenue of $111,456.
General and Administration ExpenseNet Cash Used in Investing Activities
| For the Years Ended December 31, | ||||||||||||
| 2018 | 2017 | % Change | ||||||||||
| General & administration expense | $ | 1,561,000 | $ | 1,414,983 | 10.3 | % | ||||||
General & administration expense increased by $146,017 or 10.3% for. During the year ended December 31, 2018 as compared to2020, cash used in investing activities consisted of $23,161 for the acquisition of fixed assets.
During the year ended December 31, 2017. The table below outlines2019, cash used in investing activities consisted of $1,383 for the differences in detail:
| December 2018 | December 2017 | Difference | % Difference | |||||||||||||
| Accounting & Legal, & Setup Costs for Public Company | 283,445 | 160,515 | 122,930 | 76.6 | % | |||||||||||
| Marketing & Advertising | 404,391 | 581,653 | (177,262 | ) | (30.5 | )% | ||||||||||
| Subcontractor & Commissions | 334,490 | 166,623 | 167,867 | 100.7 | % | |||||||||||
| Hardware | 47,604 | 14,486 | 33,118 | 228.6 | % | |||||||||||
| Office Expense, Rent, Software, Bank & Credit Card Charges, Telephone & Meals | 491,070 | 491,706 | (636 | ) | (0.1 | )% | ||||||||||
| 1,561,000 | 1,414,983 | 146,017 | 10.3 | % | ||||||||||||
For the year ended December 31, 2018 as compared to the year ended December 31, 2017, the overall increase in expenses is primary related to increases in accounting and legalacquisition of $122,930 or 76.6% due to additional legal fees incurred pursuant to new debt agreements as well as subcontractor and commission increases of $167,897 or 100.7%. This increase was partially offset by decreases in marketing expenses of $177,262 or 30.5% due to shares issued as compensation for marketing services in the prior year which were not issued in the current year.fixed assets.
Warranty Expense
| For the Years Ended December 31, | ||||||||||||
| 2018 | 2017 | % Change | ||||||||||
| Warranty expense | $ | (89,037 | ) | $ | 90,284 | (198.6 | )% | |||||
Warranty expense decreased by $179,231, or 198.6% for the year ended December 31, 2018 as compared to the year ended December 31, 2017. The decrease in warranty expense from 2018 to 2017 was primarily due to fewer breakdowns, warranty costs were expensed as incurred, and we recorded a recovery on our warranty reserve due to a change in warranty policies.
As of December 31, 2018, our balance sheet included a reserve of $Nil for future warranty costs (December 31, 2017 - $165,523).
Foreign Currency Exchange
| For the Years Ended December 31, | ||||||||||||
| 2018 | 2017 | % Change | ||||||||||
| Foreign currency exchange (gain) loss | $ | 59,050 | $ | (107,096 | ) | (155.1 | )% | |||||
For the year ended December 31, 2018, we recognized $59,050 in foreign currency transaction losses as compared to $107,096 in foreign currency transaction gains for the year ended December 31, 2017. The loss was primarily due to the losses arising from exchange rate fluctuations on payables, receivables, and other foreign exchange transactions denominated in currencies other than the functional currencies of the legal entities in which the transactions are recorded. Foreign currency fluctuations are primarily from the Canadian Dollar, Euro and British pound.
Unrealized (gain) loss on derivative
| For the Years Ended December 31, | ||||||||||||
| 2018 | 2017 | % Change | ||||||||||
| Unrealized (gain) loss on derivative | $ | (1,005,458 | ) | $ | 824,986 | (221.9 | )% | |||||
Derivative loss decreased by $1,830,444 to a gain of $1,005,4585 or 221.9%, for the year ended December 31, 2018 as compared to the year ended December 31, 2017 due to the change in fair value as of December 31, 2018 triggering unrealized gains on derivative instruments in the current year ending on convertible notes payable. The change in fair value was impacted heavily due to the volatility in the Company’s stock price.
Finance Costs
| For the Years Ended December 31, | ||||||||||||
| 2018 | 2017 | % Change | ||||||||||
| Finance costs | $ | 2,698,330 | $ | 1,731,921 | 55.8 | % | ||||||
For the Years Ended December 31, | ||||||||||||
| 2020 | 2019 | % Change | ||||||||||
| Finance costs | $ | 1,281,505 | $ | 1,620,504 | (20.9 | )% | ||||||
Finance costs increaseddecreased by $966,409$338,999 or 55.8%20.9%, for the year ended December 31, 20182020 as compared to the year ended December 31, 2017. Significant finance2019. Finance costs were incurred in relationdecreased due to the restructuring work, which resultedlarge number of conversions and settlement of notes in additional accretion and extinguishment of debt costs.the current period.
| 43 |
Net Loss
| For the Years Ended December 31, | ||||||||||||
| 2018 | 2017 | % Change | ||||||||||
| Net loss | $ | (9,825,404 | ) | $ | (4,116,831 | ) | 138.7 | % | ||||
For the Years Ended December 31, | ||||||||||||
| 2020 | 2019 | % Change | ||||||||||
| Net loss | $ | (6,177,099 | ) | $ | (3,078,120 | ) | 100.7 | % | ||||
As a result of the above factors, net loss increased by $5,708,573$3,098,979 or 138.7%100.7% for the year ended December 31, 20182020 as compared to the year ended December 31, 2017. The overall increase was primarily due to the $8,641,587 in other expenses inclusive of losses on extinguishment of debt of $6,889,665 and finance costs of $2,698,330. This was partially offset by a gain on change in derivative instruments of $1,005,458 and an overall decrease in operating losses of $461,053 or 28.0%.2019.
Liquidity and Capital Resources
From our incorporation in April 17, 2008 through December 31, 2018,2020, we have financed our operations, capital expenditures and working capital needs through the sale of common shares and the incurrence of indebtedness, including term loans, convertible loans, revolving lines of credit and purchase order financing. At December 31, 2018,2020, we had $7,021,046$2,529,034 in outstanding current liabilities which has either already reached maturity or matures within the next twelve months.
We had cash in the amount of $5,059 as of$1,372,016 at December 31, 2018 as2020, compared to $5,488 as of$25,494 at December 31, 2017.2019. We had a working capital deficit of $6,687,807$746,341 as of December 31, 20182020 compared to working capital deficit of $8,487,059$8,376,433 as of December 31, 2017.2019.
Liquidity and Financial Condition
| At December 31, 2018 | At December 31, 2017 | Percentage Increase/(Decrease) | ||||||||||
| Current Assets | $ | 333,239 | $ | 59,542 | 459.7 | % | ||||||
| Current Liabilities | $ | 7,021,046 | $ | 8,546,601 | (17.8 | )% | ||||||
| Working Capital | $ | (6,687,807 | ) | $ | (8,487,059 | ) | (21.2 | )% | ||||
| At December 31, 2020 | At December 31, 2019 | Percentage Increase/(Decrease) | ||||||||||
| Current assets | $ | 1,782,693 | $ | 250,800 | 610.8 | % | ||||||
| Current liabilities | $ | 2,529,034 | $ | 8,627,233 | (70.7 | )% | ||||||
| Working capital | $ | (746,341 | ) | $ | (8,376,433 | ) | (91.1 | )% | ||||
Cash Flow Analysis
Our cash flows from operating, investing, and financing activities are summarized as follows:
| December 31 | December 31 | |||||||||||||||
| 2018 | 2017 | 2020 | 2019 | |||||||||||||
| Net cash (used in) provided by operating activities | $ | (1,421,237 | ) | $ | (568,972 | ) | $ | (1,400,086 | ) | $ | (848,777 | ) | ||||
| Net cash (used in) provided by investing activities | (2,670 | ) | - | (23,161 | ) | (1,383 | ) | |||||||||
| Net cash (used in) provided by financing activities | 1,328,659 | 984,684 | 2,835,880 | 869,991 | ||||||||||||
| Effect of exchange rate changes on cash | (66,111 | ) | 604 | |||||||||||||
| Net (decrease) increase in cash | (95,248 | ) | 415,712 | 1,346,522 | 20,435 | |||||||||||
| Effect of exchange rate changes on cash and cash equivalents | 94,819 | (410,224 | ) | |||||||||||||
| Cash at beginning of period | 5,488 | - | 25,494 | 5,059 | ||||||||||||
| Cash and equivalents at end of period | $ | 5,059 | $ | 5,488 | $ | 1,372,016 | $ | 25,494 | ||||||||
| 44 |
During the year ended December 31, 2020, cash used in operations totaled $1,400,086. This consists of the net loss of $6,177,099, adjusted by $4,777,013 for non-cash items and changes in non-cash working capital. Changes in non-cash working capital items consisted primarily of change in trade and other payables of $664,239, partially offset by changes in inventory and prepaid expenses of $139,219 and $114,369, respectively.
During the year ended December 31, 2019, cash used in operations totaled $848,777. This consists of the net loss of $3,078,120, adjusted by $2,229,343 for non-cash items and changes in non-cash working capital. Changes in non-cash working capital items consisted primarily of change in trade and other payables of $797,785, partially offset by change in deferred revenue of $111,456.
Net Cash (Used in) Provided by OperatingUsed in Investing Activities. During the year ended December 31, 2018,2020, cash used in operations totaled $1,421,237. This reflectsinvesting activities consisted of $23,161 for the net lossacquisition of $9,825,404 less $8,404,167 provided by changes in operating assets and liabilities and adjustments for non-cash items. Cash provided by working capital items was primarily impacted by increases in deferred revenue of $55,997 and trade payables and accruals of $568,132 and offset by increases in trade receivables of $216,538 and inventory purchases of $278,659.fixed assets.
During the year ended December 31, 2017,2019, cash used in operations totaled $568,972. This reflectsinvesting activities consisted of $1,383 for the net lossacquisition of $4,116,821 less $3,547,849 provided by changes in operating assets and liabilities and adjustments for non-cash items. Cash provided by working capital items was primarily impacted by increases in warranty reserve of $53,808 and trade payables and accruals of $719,127, decreases in inventory purchases of $71,644 and offset by increases in trade receivables of $9,238 and related party receivables of $2,560.fixed assets.
Net Cash (Used in) Provided by Investing Activities. Investing activities used $2,670 of cash in the year ended December 31, 2018, for the addition of property, plant, and equipment. Investing activities used $Nil of cash in the year ended December 31, 2017.
Net Cash (Used in) Provided by Financing Activities. Net cash provided by financing activities during the year ended December 31, 20182020 totaled $1,328,659 provided$2,835,880 which consisted primarily byof $922,845 in proceeds of $1,292,000 from various note and loan facilities entered during the period and $1,532,023 in proceeds from shares and shares to be issued and $768,009 in proceeds from issuing warrants, partially offset by payments on outstanding notes payable of $81,659 for the issuances of shares. $386,996.
Net cash provided by financing activities during the year ended December 31, 20172019 totaled $984,684 provided$869,991 which consisted primarily byof $846,538 proceeds of $946,750 from various note and loan facilities entered during the period and $23,453 proceeds of $50,000 for the issuances of shares.from shares to be issued.
| 45 |
Outstanding Indebtedness
Our current indebtedness as of December 31, 20182020 is comprised of the following:
| ● | Unsecured, | |
| ● | Senior secured, convertible note payable | |
| ● | Senior secured, convertible note payable with an outstanding principal amount of $Nil, and a carrying value of $9,487 relating to an outstanding penalty. |
| ● | Unsecured loan payable with an outstanding principal amount of $31,396 (CDN$40,000). The loan is non-interest bearing and eligible for CDN$10,000 forgiveness if repaid by December 31, 2022. If not repaid by December 31, 2022, the loan bears interest at | |
| ● | Unsecured |
| ● | Unsecured | |
| ● | ||
| ||
Preferred Stock Redemption Obligations
| 46 |
Westergaard Holdings Ltd., an affiliate of Keith Westergaard, a member of our board of directors, owned 4,229,384 shares (the “Series A Shares”) of Series A Convertible Preferred Stock of DSG TAG Systems. Pursuant to a Subscription / Debt Settlement Agreement dated September 26, 2014 between DSG TAG Systems and Westergaard Holdings, as amended on November 10, 2015, DSG TAG Systems has agreed that DSG Global, Inc. will complete financings for gross proceeds of at least $10 million and use a portion of the proceeds to redeem all of the Series A Shares at a price of $1.25 per share, as follows:
If we failed to satisfy the above described financing and share redemption schedule, we would have been in default of the Subscription and Debt Settlement Agreement which would entitle the holder of the Preferred Shares to convert the Series A Convertible Preferred Shares into common shares in the capital of DSG Global at the price of $1.25 per share.
As described in Note 11 of the consolidated financial statements, on August 27, 2018, pursuant to a debt exchange agreement, the Company exchanged all 4,229,384 issued and outstanding DSG TAG Series A Shares with a fair value of $5,873,481 ($7,627,303 CDN), for 51 and 3,000,000 shares of Series B and Series E preferred shares, respectively.
Related Party Transactions
As at December 31, 2018,2020, the Company owed $139,835$317,997 ($190,764391,896 CDN) (December 31, 2017(2019 - $204,929$263,409 ($257,084342,853 CDN)) to the President, CEO, and CFO of the Company for management fees and salaries, which has beenis recorded in trade and other payables. The amounts owed and owing are unsecured, non-interest bearing, and due on demand. During the year ended December 31, 20182020 the Company incurred $200,000 (2017$300,000 (2019 - $200,000) in salaries to the President, CEO, and CFO of the Company.
As at December 31, 2018, the Company owes $Nil (2017 - $52,838) to the Senior Vice President of Global Sales of the Company, which has been recorded in trade and other payables. The amount owing is unsecured, non-interest bearing, and due on demand.
As at December 31, 2018,2020, the Company owed $12,791$Nil (2019 - $7,260 ($17,450 CDN) (December 31, 2017 - $22,280 ($27,9509,450 CDN)) to a company controlled by the son of the President, CEO, and CFO of the Company for subcontractor services. The balance owing has beenis recorded in trade and other payables. The amount owing is unsecured, non-interest bearing, and due on demand.
Prospective Capital Needs
We estimate our operating expenses and working capital requirements for the twelve-month period to be as follows:
| Estimated Expenses for the Twelve-Month Period ending December 31, 2019 | ||||
| Management compensation | $ | 500,000 | ||
| Professional fees | $ | 150,000 | ||
| General and administrative | $ | 1,900,000 | ||
| Total | $ | 2,550,000 | ||
| Estimated Expenses for the Twelve-Month Period ending December 31, 2021 | ||||
| General and administrative | $ | 3,404,000 | ||
| Research and development | 1,043,600 | |||
| Marketing | 755,000 | |||
| Sales and dealer network | 540,000 | |||
| Payroll overhead | 1,259,000 | |||
| Service and maintenance | 785,900 | |||
| Assembly facility | 1,750,000 | |||
| Inventory | 10,700,000 | |||
| Total | $ | 20,237,500 | ||
During the year ended December 31, 2018,2020, cash used in operations totaled $1,421,237.$1,400,086. The relatively low level of cash used compared to our estimated working capital needs in the future was the result of an accumulation of vendor payables, customer receivables, and an increasing loan payable balance.some of which were settled with equity. We need to reduce the current level of payables in the near future to keepmaintain a good relationship with our vendors and expand our sales and service team to achieve our operational objectives. At present, our cash requirements for the next 12 months outweigh the funds available. Of the $2,550,000$20,237,500 that we require for the next 12 months, we had $5,059$1,372,016 in cash as of December 31, 2018,2020, and a working capital deficit of $6,687,807.$746,341. Our principal sources of liquidity are cash generated from product sales and debt financings. In order to achieve sustained profitability and positive cash flows from operations, we will need to increase revenue and/or reduce operating expenses. Our ability to maintain, or increase, current revenue levels to achieve and sustain profitability will depend, in part, on demand for our products.
| 47 |
In order to improve our liquidity, we also plan to pursue additional equity financing from private investors or possibly a registered public offering. We do not currently have any definitive arrangements in place for the completion of any further private placement financings and there is no assurance that we will be successful in completing any further private placement financings. To help finance our day to day working capital needs, the founder and CEO of the Company has made total payments of $113,475 since late 2015. If we are unable to achieve the necessary additional financing, then we plan to reduce the amounts that we spend on our business activities and administrative expenses in order to be within the amount of capital resources obligations and execute our business plan. There can be no assurances that we will be able to raise additional capital on acceptable terms or at all, which would adversely affect our ability to achieve our business objectives.
Off-Balance Sheet Transactions
We do not have any off-balance sheet arrangements.
Contractual Obligations and Known Future Cash Requirements
Indemnification Agreements
In the ordinary course of business, we enter into agreements of varying scope and terms pursuant to which we agree to indemnify customers, vendors, lessors, business partners and other parties with respect to certain matters, including, but not limited to, losses arising out of breach of such agreements, services to be provided by us or from intellectual property infringement claims made by third parties. In addition, we have entered into indemnification agreements with directors and certain officers and employees that will require us, among other things, to indemnify them against certain liabilities that may arise by reason of their status or service as directors, officers or employees. No demands have been made upon us to provide indemnification under such agreements and there are no claims that we are aware of that could have a material effect on our consolidated balance sheet, consolidated statements of operations, consolidated statements of comprehensive loss or consolidated statements of cash flows.
Operating Leases
We currently lease our corporate headquarters in Surrey, British Columbia and a showroom office in Vacaville, California, under operating lease agreements that expire through to Mayon July 31, 2020.2023 and August 31, 2022, respectively. The terms of theboth lease agreements provide for rental payments on a graduated basis. We recognize rent expense on a straight-line basis over the lease periods.
| 48 |
Critical Accounting Policies and Estimates
We prepare our consolidated financial statements in accordance with U.S. GAAP. The preparation of consolidated financial statements also requires us to make estimates and assumptions that affect the reported amounts of assets, liabilities, revenue, costs and expenses, and related disclosures. We base our estimates on historical experience and on various other assumptions that we believe to be reasonable under the circumstances. Actual results could differ significantly from the estimates made by our management. To the extent that there are differences between our estimates and actual results, our future financial statements presentation, financial condition, results of operations, and cash flows will be affected.
We believe that the assumptions and estimates associated with revenue recognition, derivative liabilities, foreign currency and foreign currency transactions and comprehensive loss have the greatest potential impact on our consolidated financial statements. Therefore, we consider these to be our critical accounting policies and estimates. For further information on all of our significant accounting policies, see the notes to our consolidated financial statements.
Recently Issued and Adopted Accounting Pronouncements
Recently Adopted Accounting Pronouncements
In May 2014, the FASB issued ASU No. 2014-09,Revenue from Contracts with Customers. ASU 2014-09 is a comprehensive revenue recognition standard that will supersede nearly all existing revenue recognition guidance under current U.S. GAAP and replace it with a principle-based approach for determining revenue recognition. ASU 2014-09 will require that companies recognize revenue based on the value of transferred goods or services as they occur in the contract. The ASU also will require additional disclosure about the nature, amount, timing and uncertainty of revenue and cash flows arising from customer contracts, including significant judgments and changes in judgments and assets recognized from costs incurred to obtain or fulfill a contract. ASU 2014-09 is effective for interim and annual periods beginning after December 15, 2017. Early adoption is permitted only in annual reporting periods beginning after December 15, 2016, including interim periods therein. Entities will be able to transition to the standard either retrospectively or as a cumulative-effect adjustment as of the date of adoption. The Company adopted this ASU beginning on January 1, 2018 and used the modified retrospective method of adoption. The adoption of this ASU did not have a material impact on the Company’s consolidated financial statements and disclosures.
Recently Issued Accounting Pronouncements
Applicable for fiscal years beginning after December 15, 2018:
In February 2016, the Financial Accounting Standards Board, or FASB, issued ASUestablished Topic 842, Leases, by issuing Accounting Standards Update (“ASU”) No. 2016-02,“Leases (Topic 842).” This accounting standard seeks which requires lessors to increase transparencyclassify leases as a sales-type, direct financing, or operating lease and comparability among organizations by recognizing lease assets and lease liabilities on the balancerequires lessees to recognize leases on-balance sheet and disclosingdisclose key information about leasing arrangements. Current U.S. GAAP does not require lessees to recognize assets and liabilities arising from operating leases on the balance sheet. This standard also provides guidance from the lessees’ perspective on how to determine if a lease is an operating lease or a financing lease and the differences in accounting for each. In January 2018, the FASB issuedTopic 842 was subsequently amended by ASU No. 2018-01, which allowsLand Easement Practical Expedient for an entityTransition to elect an optional transition practical expedient for land easements that exist or expired before adoption of Topic 842. The adoption of this standard is required for interim842; ASU No. 2018-10, Codification Improvements to Topic 842, Leases; and fiscal periods beginning after December 15, 2018 and it is required to be applied using the modified retrospective approach. ASU No. 2018-11, Targeted Improvements.
The Company will adopt thisadopted the new standard effective January 1, 2019 and is currently evaluatingelected to use the impact of the above standard on its consolidated financial statements.modified retrospective for transition. The Company expectselected the following practical expedients:
| ● | Transition method practical expedient – permits the Company to use the effective date as the date of initial application. Upon adoption, the Company did not have a cumulative-effect adjustment to the opening balance of retained earnings. Financial information and disclosures for periods before January 1, 2019 were not updated. | |
| ● | Package of practical expedients – permits the Company not to reassess under the new standard its prior conclusions about lease identification, lease classification, and initial direct costs. This allowed the Company to continue classifying its leases at transition in substantially the same manner. | |
| ● | Single component practical expedient – permits the Company to not separate lease and non-lease components of leases. Upon transition, rental income, expense reimbursement, and other were aggregated into a single line within rental and other revenues on the condensed consolidated statement of operations. | |
| ● | Short-term lease practical expedient – permits the Company not to recognize leases with a term equal to or less than 12 months. |
Lessee Accounting
The new standard requires lessees to recognize a right-of-use asset and lease liability on the balance sheet for all leases with a term longer than 12 months. Leases are classified as finance or operating at inception, with classification affecting the pattern and recording of expenses in the statement of operations. Upon transition the Company recognized lease assets and lease liabilities principally for its office lease. When measuring lease liabilities for leases that were classified as operating leases, the Company discounted lease payments using its incremental borrowing rate at January 1, 2019. The weighted average incremental borrowing rate applied was 11.98%. Refer to Notes 5 and 11.
| 49 |
Lessor Accounting
The new standard remained largely unchanged from that applied under previous GAAP. The majority of operating leases should remain classified as operating leases and should continue to recognize lease income on its consolidated balance sheets pursuanta generally straight-line basis over the lease term. The new standard made changes to its operating lease commitment, see Note 15lessor accounting guidance to align with lessee accounting guidance and Topic 606 Revenue Recognition.
In June 2016, FASB issued ASU 2016-13, Measurement of Credit Loss on financial Instruments. ASU 2016-13 replaces the current incurred loss impairment methodology with the expected credit loss impairment model, which requires consideration of a broader range of reasonable and supportable information to estimate expected credit losses over the life of the instrument instead of only when losses are incurred. This standard applies to financial assets measured at amortized cost basis and investments in leases recognized by the lessor. The Company adopted ASU 2016-13 on January 1, 2020 with no impact on the consolidated financial statements.
In March 2017, the “FASB” issued ASU 2017-08 “Receivables – Nonrefundable Fees and Other Costs (Subtopic 310-20) – Premium Amortization on Purchased Callable Debt Securities” an amendment to shorten the amortization period for certain callable debt securities held at a premium to the earliest call date. The amendments do not require an accounting change for securities held at a discount.
In July 2017, the FASB issued ASU 2017-11 “Earnings Per Share (Topic 260), Distinguishing Liability from Equity (Topic 480), and Derivatives and Hedging (Topic 815) – (i) Accounting for Certain Financial Instruments with Down Round Features (ii) Replace of the Indefinite Deferral for Mandatorily Redeemable Financial Instruments.” The amendments in (i) change the classification analysis of certain equity-linked financial instruments (or embedded features) with down round features and to help clarify existing disclosure requirements. The amendments in (ii) characterize the indefinite deferral of certain provisions and do not have an accounting effect.
The Company is currently evaluating the impact of the above standards on its consolidated financial statements. Other recent accounting pronouncements issued by the FASB, including its Emerging Issues Task Force, the American Institute of Certified Public Accountants, and the Securities and Exchange Commission did not or are not believed by management to have a material impact on the Company’s consolidated financial statements.
Recently Issued Accounting Pronouncements
Applicable for fiscal years beginning after December 15, 2020:
In August 2020, FASB issued ASU 2020-06, Accounting for Convertible Instruments and Contracts in an Entity’s Own Equity. ASU 2020-06 amends the guidance for convertible instruments and contract in an entity’s own equity by simplifying the accounting in order to reduce the unnecessarily complex and difficult nature of the guidance and its inconsistent application which has been the subject of a significant number of restatements. This standard applies to entities who issue convertible instruments and/or contracts in an entity’s own equity. The amendments are effective for fiscal years beginning after December 15, 2023. Early adoption is permitted, but no earlier than fiscal years beginning after December 15, 2020 and should be adopted as of the beginning of its annual fiscal year.
The Company is currently evaluating the impact of the above standard on its consolidated financial statements. Other recent accounting pronouncements issued by FASB, including its Emerging Issues Task Force, the American Institute of Certified Public Accountants, and the Securities and Exchange Commission did not or are not believed by management to have a material impact on the Company’s consolidated financial statements.
| 50 |
DIRECTORS, EXECUTIVE OFFICERS, PROMOTERS, AND CONTROL PERSONS
The Board of Directors elects our executive officers annually. A majority vote of the directors who are in office is required to fill vacancies. Each director shall be elected for the term of one year, and until his successor is elected and qualified, or until the earlier of his resignation or removal. Information on our Board of Directors and executive officers is included below. Our executive officers are appointed annually by our Board of Directors. Our executive officers hold their offices until they resign, are removed by the Board, or their successor is elected and qualified.
Directors and Executive Officers
The following sets forth information about our director and executive officer as of the date of this report:
| NAME | AGE | POSITION | ||||
| Robert Silzer | Director, President, Chief Executive Officer, Chief Financial Officer, Secretary, Treasurer | |||||
| Stephen Johnston | Director | |||||
| James Singerling | Director | |||||
| Director | ||||||
(1)Rupert Wainwright resigned from his position as director in February 2018.
Our directors will serve in that capacity until our next annual shareholder meeting or until his successor is elected and qualified. Officers hold their positions at the will of our Board of Directors. There are no arrangements, agreements or understandings between non-management security holders and management under which non-management security holders may directly or indirectly participate in or influence the management of our affairs.
Executive Management
Our executive management team represents a significant depth of experience in biometrics and facial recognition technologies, intelligent security and surveillance, high-growth and technology marketing, and domestic and international sales and business development. The team represents a cross-disciplinary approach to management and business development.
Robert Silzer,Director, President, Chief Executive Officer, Chief Financial Officer, Secretary and Treasurer.
Robert Silzer has over 20 years’ experience in the GPS tracking and fleet solutions industries. He is the founder of DSG TAG Systems Inc. and has served as Chief Executive Officer of DSG TAG since its inception in April 2008. Mr. Silzer is a product designer who has developed multiple new product concepts and successfully introduced these products to market including the world’s first handheld bingo gaming unit, the first handheld and color handheld GPS golf units and the first Wi-Fi enabled GPS golf business solution. Prior to establishing DSG Tag, Mr. Silzer’s designed and a total golf solution that addressed the growing needs in Golf Course management. Through a series of mergers and acquisitions different companies with diversified hardware and software platforms, he founded GPS Industries in 1996, serving as its president, CEO, Chairman and director until 2007. Under his leadership, it became the largest operator of golf GPS systems in the world and with a remarkable 750 golf courses worldwide using the installed system. Prior to founding GPSI, Mr. Silzer founded XGA, an online golf store and website company in 1993. He also founded Advanced Gaming Technology, Inc. in 1992, an electronic gaming company, where he served as Chief Executive Officer until 1998. From 1986 to 1992, Mr. Silzer founded and operated the private company Supercart International. With over 30 years as an entrepreneur in the technology and other markets, Mr. Silzer has developed expertise in taking companies to market, growing start-up business, initial public offerings, raising funds, operations, marketing and international licensing.
Stephen Johnston,Director
Stephen Johnston is the founding Partner of Global Golf Advisors and one of the leading authorities on operational analysis and financial solutions for golf businesses. Steve began his career at the accounting firm of Thorne Gunn/Thorne Riddell in Toronto in 1973. He earned his Chartered Accountant designation while with Thorne Riddell in 1976 and in 1984 was promoted to Partner and given responsibility for major client accounts. His audit experience with major accounts subsequently expanded into real estate, communications and insurance.
When the firm became known as KPMG, Steve continued as an Audit Partner and in 1992 created the KPMG Golf Industry Practice and assumed responsibility as National Director. In 2006 Steve purchased the KPMG Golf Industry Practice and created Global Golf Advisors Inc., bringing with him the entire staff complement and client files to the new firm.
Steve is a graduate of the University of Toronto with a Bachelor of Science degree and business courses complement relevant to his Chartered Accountant designation. Steve’s main focus is developing financial and business solutions for private clubs, public golf courses and resorts, golf communities, investors and lenders. He provides a keen insight for banking and finance solutions arising from his years of advising numerous international financial institutions.
| 51 |
He has completed due diligence and valuation assignments for some of the largest golf-related transactions in North America and has completed multiple market studies to reposition various golf assets. In addition, Steve has been actively involved with workouts/receiverships, providing operational and financial guidance. These assignments typically lead to member buyouts/transitions from developers or to an outright disposition of property. Steve has been recognized as one of the Top Powerbrokers in Canadian Golf by The National Post over the past 15 years.
James Singerling,Director
From 1990 until his retirement in 2015, James Singerling, CCM, served as the CEO of Club Managers Association of America (CMAA), the foremost professional association for managers of membership clubs in the US. In this role Mr. Singerling was credited for elevating the professional role of club managers by creating industry-standard development and certification programs. For over two decades, he spearheaded efforts to adopt the general manager/chief operating officer model at clubs nationwide, raising the qualifications and quality of club managers. Mr. Singerling is also recognized for building new relationships for the industry with federal and state governments and within the association community.
In addition to his work within the U.S., Mr. Singerling was instrumental in the development of professional club management associations internationally, helping other nations elevate the role of club managers by adopting professional standards and certifications. Regions where his leadership is recognized include South America, Australia, China, South Africa and the Asian-Pacific corridor, among others.
Prior to becoming chief executive at CMAA, Mr. Singerling was a leader in the golf course design and management companies of Robert Trent Jones, Sr., and also served as vice president and general manager of the Coral Ridge Country Club in Ft. Lauderdale, FL.
Mr. Singerling has been recognized as Industry Leader of the Year by the University of Nevada, Las Vegas, and Michigan State University, in addition to receiving awards from Florida State University, Pennsylvania State University, Oklahoma State University and Sun Yat Sen University – China. He also was elected to the Association Committee of 100 by the U.S. Chamber of Commerce, widely recognized as the most prestigious organization of chief executives in the United States.
Jason Sugarman,Michael Leemhuis,Director
With over 20 years’Michael Leemhuis, M.A. Ed., CCM, CCE, PGA Master Professional is known for his extensive leadership and sports experience. Michael’s experience Jason Sugarmanhas been gained in his roles as the President of the Ocean Reef Club; CEO of Congressional Country Club; President of the Club Managers Association of America in 2009; GM/Director of Golf at the PGA TOUR; General Manager, Sport and Recreation at Sun City Resort; Tournament Director of the Nedbank Million Dollar Golf Challenge and MD of Sports International. One of Mike’s career highlights was guiding Congressional Country Club to the #1 spot in the Platinum Clubs of America and into the top 100 of Platinum Clubs in the World.
Education combined with certification are what Mike believes are the cornerstones of success in business and in life and to that end Mike is a leaderCertified Club Manager (CCM) and Certified Chief Executive (CCE) through CMAA, as well as a certified PGA member through the PGA of America and the PGA of South Africa (Master Professional).
Carol Cookerly,Director
Carol Cookerly is a graduate of Duke University and former broadcast journalist, Carol worked in public relations in New York City before founding the agency in Atlanta. Founder and CEO of Cookerly Public Relations has grown the Company into one of the Southeast’s leading public relations agencies representing a client roster more typical of national firms. In addition to creating higher visibility for a variety of clients, the agency has built a stellar reputation for its ability to: manage high-profile issues and direct crisis communications strategies; use data driven marketing to create behavioral change; and, drive engagement and brand success in social media.
Recent visibility campaign successes include the award-winning introduction of the A-Class line of vehicles for Mercedes-Benz USA and the launch of Novelis Inc.’s advanced-design lightweight aluminum battery enclosure for electric vehicles. Active in the finance industry incommunity, Carol is a councilwoman serving the areascity of asset-based lending, private equity, and debt investments. He has beenMilton, Ga. She is a principal investor and financierboard member of all asset classes and has led real estate, financial services, and infrastructure investments both domestically and overseas.
Mr. Sugarman’s current concentration is on private equity transactions. Hethe nation’s most innovative law enforcement support organization, the Atlanta Police Foundation, for which she serves on two committees. In addition, she was recently appointed to the boardsboard of a numberOglethorpe University’s Hammock School of private and public companies and has invested in several professional sports teams including Los Angeles Football Club and Oklahoma City Dodgers.
He is married with three boys and lives in Los Angeles, California.”Business.
Significant Employees
Other than Bob Silzer, we have no full-time employees whose services are materially significant to our business and operations who are employed at will by DSG Global Inc.
Family Relationships
There are no family relationships among any of our directors or officers.
| 52 |
Involvement in Certain Legal Proceedings
To the best of our knowledge, none of our directors or executive officers has, during the past ten years:
| 1. | been convicted in a criminal proceeding or been subject to a pending criminal proceeding (excluding traffic violations and other minor offences); |
| 2. | had any bankruptcy petition filed by or against the business or property of the person, or of any partnership, corporation or business association of which he was a general partner or executive officer, either at the time of the bankruptcy filing or within two years prior to that time; |
| 3. | been subject to any order, judgment, or decree, not subsequently reversed, suspended or vacated, of any court of competent jurisdiction or federal or state authority, permanently or temporarily enjoining, barring, suspending or otherwise limiting, his involvement in any type of business, securities, futures, commodities, investment, banking, savings and loan, or insurance activities, or to be associated with persons engaged in any such activity; |
| 4. | been found by a court of competent jurisdiction in a civil action or by the SEC or the Commodity Futures Trading Commission to have violated a federal or state securities or commodities law, and the judgment has not been reversed, suspended, or vacated; |
| 5. | been the subject of, or a party to, any federal or state judicial or administrative order, judgment, decree, or finding, not subsequently reversed, suspended or vacated (not including any settlement of a civil proceeding among private litigants), relating to an alleged violation of any federal or state securities or commodities law or regulation, any law or regulation respecting financial institutions or insurance companies including, but not limited to, a temporary or permanent injunction, order of disgorgement or restitution, civil money penalty or temporary or permanent cease-and-desist order, or removal or prohibition order, or any law or regulation prohibiting mail or wire fraud or fraud in connection with any business entity; or |
| 6. | been the subject of, or a party to, any sanction or order, not subsequently reversed, suspended or vacated, of any self-regulatory organization (as defined in Section 3(a)(26) of the Exchange Act (15 U.S.C. 78c(a)(26))), any registered entity (as defined in Section 1(a)(29) of the Commodity Exchange Act (7 U.S.C. 1(a)(29))), or any equivalent exchange, association, entity or organization that has disciplinary authority over its members or persons associated with a member. |
Compliance with Section 16(a) of the Securities Exchange Act of 1934
Section 16(a) of the Securities Exchange Act of 1934 requires our executive officers and directors and persons who own more than 10% of our common stock to file with the Securities and Exchange Commission initial statements of beneficial ownership, reports of changes in ownership and annual reports concerning their ownership of our common stock and other equity securities, on Forms 3, 4 and 5 respectively. Executive officers, directors and greater than 10% shareholders are required by the SEC regulations to furnish us with copies of all Section 16(a) reports that they file.
Based solely on our review of the copies of such forms received by us, or written representations from certain reporting persons, we believe that during fiscal year ended December 31, 2016,2019, all filing requirements applicable to our officers, directors and greater than 10% percent beneficial owners were complied with.
Corporate Governance Guidelines, Code of Ethics, and Business Conduct
The Board has adopted Corporate Governance Guidelines (the “Guidelines”) to assist it in the exercise of its responsibilities. These Guidelines reflect the Board’s commitment to monitor the effectiveness of policy and decision making both at the Board and at the management level, with a view to enhancing stockholder value over the long term.
We have adopted a written code of ethics and business conduct to provide guidance to all Company’s directors, officers and employees, for each employee, including our including the Company’s principal executive officer, principal accounting officer or controller or persons performing similar functions. The code of ethics is posted on our website at www.dsgtag.com. If we make certain amendments to or waivers of our code of ethics, we intend to satisfy the SEC disclosure requirements by promptly posting the amendment or waiver on our website.
Audit Committee and Audit Committee Financial Expert
Our board of directors has determined that it does not have a member of its audit committee that qualifies as an “audit committee financial expert” as defined in Item 407(d)(5)(ii) of Regulation S-K, and is “independent” as the term is used in Item 7(d)(3)(iv) of Schedule 14A under the Securities Exchange Act of 1934, as amended.
We believe that our board of directors is capable of analyzing and evaluating our financial statements and understanding internal controls and procedures for financial reporting. We believe that retaining an independent director who would qualify as an “audit committee financial expert” would be overly costly and burdensome and is not warranted in our circumstances given the early stages of our development and the fact that we have not generated any material revenues to date. In addition, we currently do not have nominating, compensation or audit committees or committees performing similar functions nor do we have a written nominating, compensation or audit committee charter. Our sole director does not believe that it is necessary to have such committees because believes the functions of such committees can be adequately performed by the sole member of our board of directors.
Code of Ethics
Our Board of Directors has not adopted a code of ethics due to the fact that we presently only have one director who also serves as the sole executive officer of the Company and the Board of Directors chose not to reduce to writing standards designed to deter wrongdoing and promote honest and ethical conduct. The Board of Directors believes that the Company’s small size and the limited number of personnel who are responsible for its operations make a formal Code of Ethics unnecessary. We anticipate that we will adopt a code of ethics when we increase either the number of our directors and officers or the number of our employees.
Compliance with Section 16(a) of the Exchange Act
Section 16(a) of the Securities Exchange Act of 1934, as amended (the “Exchange Act”), requires officers, directors and persons who beneficially own more than 10% of a class of our equity securities registered under the Exchange Act to file reports of ownership and changes in ownership with the Securities and Exchange Commission. Based solely upon a review of Forms 3 and 4 and amendments thereto furnished to us during fiscal year 2011 and Forms 5 and amendments thereto furnished to us with respect to fiscal year 2011, or written representations that Form 5 was not required for fiscal year 2011, we believe that all Section 16(a) filing requirements applicable to each of our officers, directors and greater-than-ten percent stockholders were fulfilled in a timely manner. We have notified all known beneficial owners of more than 10% of our common stock of their requirement to file ownership reports with the Securities and Exchange Commission.
| 53 |
EXECUTIVE AND DIRECTOR COMPENSATION
Summary Compensation Table — Fiscal Years of DSG Global Inc. Years Ended December 31, 20182020 & 20172019
The particulars of the compensation paid to the following persons:
| (a) | our principal executive officer; |
| (b) | our principal financial officer; |
| (c) | each of our three most highly compensated executive officers who were serving as executive officers at the end of the years ended December 31, |
| (d) | up to two additional individuals for whom disclosure would have been provided under (c) but for the fact that the individual was not serving as our executive officer at the end of the years ended December 31, |
who we will collectively refer to as the named executive officers of our company, are set out in the following summary compensation table, except that no disclosure is provided for any named executive officer, other than our principal executive officers, whose total compensation did not exceed $100,000 for the respective fiscal year:
EXECUTIVE SUMMARY COMPENSATION TABLE
Name and principal position | Year | Salary ($) | Bonus ($) | Stock Awards ($) | Option Awards ($) | Non-Equity Incentive Plan Compensation ($) | Nonqualified Deferred Compensation Earnings ($) | All Other Compensation ($) | Total ($) | Year | Salary ($) | Bonus ($) | Stock Awards ($) | Option Awards ($) | Non-Equity Incentive Compensation ($) | Nonqualified Deferred Compensation Earnings ($) | All Other Compensation ($) | Total ($) | ||||||||||||||||||||||||||||||||||||||||||
| Robert Silzer, | 2018 | 200,000 | Nil | Nil | Nil | Nil | Nil | Nil | 200,000 | 2020 | 300,000 | Nil | 338,400 | Nil | Nil | Nil | Nil | 668,400 | ||||||||||||||||||||||||||||||||||||||||||
| Director, President, Chief Executive Officer, Chief Financial Officer, Secretary, Treasurer | 2017 | 200,000 | Nil | Nil | Nil | Nil | Nil | Nil | 200,000 | 2019 | 200,000 | Nil | Nil | Nil | Nil | Nil | Nil | 200,000 | ||||||||||||||||||||||||||||||||||||||||||
As of December 31, 2018,2020, we had no employment agreements with any of our executive officers or employees.
Summary of Employment Agreements and Material Terms
We have not entered into any employment or consulting agreements with any of our current officers, directors or employees.
Outstanding Equity Awards at Fiscal Year Ended December 31, 20182020 and 20172019 of DSG Global Inc.
For the years ended December 31, 20182020 and 2017,2019, no director or executive officer of DSG Global Inc. has received compensation from us pursuant to any compensatory or benefit plan. There is no plan or understanding, express or implied, to pay any compensation to any director or executive officer pursuant to any compensatory or benefit plan, although we anticipate that we will compensate our officers and directors for services to us with stock or options to purchase stock, in lieu of cash.
Compensation of Directors
The particulars of the compensation paid to each of our director during our fiscal years ended December 31, 20182019 are set out in the following summary compensation table, except that no disclosure is provided for any director who’s also a named executive officer and whose compensation is fully reflected in the above Executive Summary Compensation Table:
| 54 |
DIRECTOR COMPENSATION TABLE
|
|
|
|
|
|
|
|
| ||||||||||
Name and principal position | Year | Salary ($) | Bonus ($) | Stock Awards ($) | Option Awards ($) | Non-Equity Incentive Plan Compensation ($) | Nonqualified Deferred Compensation Earnings ($) | All Other Compensation ($) | Total ($) | |||||||||||||||||||||||||||
| Stephen Johnston, | 2020 | Nil | Nil | 33,840 | Nil | Nil | Nil | Nil | 33,840 | |||||||||||||||||||||||||||
| Director | 2019 | Nil | Nil | Nil | Nil | Nil | Nil | Nil | Nil | |||||||||||||||||||||||||||
| James Singerling, | 2020 | Nil | Nil | 33,840 | Nil | Nil | Nil | Nil | 33,840 | |||||||||||||||||||||||||||
| Director | 2019 | Nil | Nil | Nil | Nil | Nil | Nil | Nil | Nil | |||||||||||||||||||||||||||
| Michael Leemhuis, | 2020 | Nil | Nil | Nil | Nil | Nil | Nil | Nil | Nil | |||||||||||||||||||||||||||
| Director | 2019 | Nil | Nil | Nil | Nil | Nil | Nil | Nil | Nil | |||||||||||||||||||||||||||
| Carol Cookerly, | 2020 | Nil | Nil | Nil | Nil | Nil | Nil | Nil | Nil | |||||||||||||||||||||||||||
| Director | 2019 | Nil | Nil | Nil | Nil | Nil | Nil | Nil | Nil | |||||||||||||||||||||||||||
| Jason Sugarman, | 2020 | Nil | Nil | 11,280 | Nil | Nil | Nil | Nil | 11,280 | |||||||||||||||||||||||||||
| Former Director | 2019 | Nil | Nil | Nil | Nil | Nil | Nil | Nil | Nil | |||||||||||||||||||||||||||
SECURITY OWNERSHIP OF CERTAIN BENEFICIAL OWNERS
The following table sets forth information regarding beneficial ownership of our common stock as of December 31, 2018January 20, 2020 (i) by each person who is known by us to beneficially own more than 5% of our common stock; (ii) by each of our officers and directors; and (iii) by all of our officers and directors as a group.
| Name and Address of Beneficial Owner | Office, If Any | Title of Class | Amount and Nature of Beneficial Ownership(1) | Percent of Class(2) | Office, if Any | Title of Class | Amount and Nature of Beneficial Ownership (1) | Percent of Class (2) | ||||||||||||||||
| Officers and Directors | ||||||||||||||||||||||||
| Robert Silzer 312-2630 CROYDON DRIVE Surrey, British Columbia, Canada V3Z 6T3 | Director, president, chief executive officer, chief financial officer, secretary, and treasurer | Common Stock | 2,018 | 0.32 | % | |||||||||||||||||||
| Former Director | Common Stock | 813 | (3) | 0.13 | % | |||||||||||||||||||
| Jason Sugarman 214 - 5455 152nd Street Surrey, British Columbia, Canada V3S 5A5 | Director | Common Stock | (4) | (4) | ||||||||||||||||||||
| Rupert Wainwright 214 - 5455 152nd Street Surrey, British Columbia, Canada V3S 5A5 | Former Director | Common Stock | (4) | (4) | ||||||||||||||||||||
| Robert Silzer 214 - 5455 152nd Street Surrey, British Columbia, Canada V3S 5A5 | Director, president, chief executive officer, chief financial officer, secretary, and treasurer | Common Stock | 6,002,019 | 5.64 | % | |||||||||||||||||||
| Stephen Johnston 214 - 5455 152nd Street Surrey, British Columbia, Canada V3S 5A5 | Director | Common Stock | (4) | (4) | Director | Common Stock | 600,000 | 0.56 | % | |||||||||||||||
| James Singerling 214 - 5455 152nd Street Surrey, British Columbia, Canada V3S 5A5 | Director | Common Stock | (4) | (4) | Director | Common Stock | 600,000 | 0.56 | % | |||||||||||||||
| Michael Leemhuis 214 - 5455 152nd Street Surrey, British Columbia, Canada V3S 5A5 | Director | Common Stock | - | - | ||||||||||||||||||||
| Carol Cookerly 214 - 5455 152nd Street Surrey, British Columbia, Canada V3S 5A5 | Director | Common Stock | - | - | ||||||||||||||||||||
| All officers and directors as a group | Common stock, $0.001 par value | 2,831 | 0.45 | % | Common stock, $0.001 par value | 7,202,019 | 6.77 | % | ||||||||||||||||
| 5%+ Security Holders | ||||||||||||||||||||||||
| 616796 BC Ltd. | n/a | Common Stock | 43,428 | 6.85 | % | |||||||||||||||||||
| Cede & Co | n/a | Common Stock | 61,547 | 9.7 | % | |||||||||||||||||||
| None | - | - | ||||||||||||||||||||||
| All 5%+ Security Holders | Common stock, $0.001 par value | 104,975 | 16.55 | % | Common stock, $0.001 par value | - | - | |||||||||||||||||
| (1) | Under Rule 13d-3, a beneficial owner of a security includes any person who, directly or indirectly, through any contract, arrangement, understanding, relationship, or otherwise has or shares: (i) voting power, which includes the power to vote, or to direct the voting of shares; and (ii) investment power, which includes the power to dispose or direct the disposition of shares. Certain shares may be deemed to be beneficially owned by more than one person (if, for example, persons share the power to vote or the power to dispose of the shares). In addition, shares are deemed to be beneficially owned by a person if the person has the right to acquire the shares (for example, upon exercise of an option) within 60 days of the date as of which the information is provided. In computing the percentage ownership of any person, the amount of shares outstanding is deemed to include the amount of shares beneficially owned by such person (and only such person) by reason of these acquisition rights. |
| (2) | Percentages are based on |
| 55 |
TRANSACTIONS WITH RELATED PERSONS
Transactions with Related Persons of DSG Global Inc.
Except as disclosed herein, no director, executive officer, shareholder holding at least 5% of shares of our common stock, or any family member thereof, had any material interest, direct or indirect, in any transaction, or proposed transaction since the year ended December 31, 2018,2020, in which the amount involved in the transaction exceeded or exceeds the lesser of $120,000 or one percent of the average of our total assets at the year-end for the last three completed fiscal years.
As at December 31, 2018,2020, we owed $139,835$317,997 ($190,764405,225 CDN) (December 31, 2017(2019 - $205,963$263,409 ($258,381342,853 CDN)) to our Director and sole Officer, Robert Silzer, for management fees and salaries $12,791and $Nil (2019 - $7,260 ($17,450 CDN) (December 31, 2017 - $22,280 ($27,9509,450 CDN)) to a company controlled by Robert Silzer, Jr., the son of Robert Silzer, our Director and sole Officer for subcontractor services, and $Nil (2017 - $52,838 to the Senior Vice President of Global Sales of the Company of which have been recorded in trade and other payables.services. The amounts owed and owing are unsecured, non-interest bearing, and due on demand.
On September 26, 2014 DSG TAG entered into a Subscription and Debt Settlement Agreement (as amended on October 7, 2014) whereby Westergaard Holdings Ltd., a corporation owned and controlled by our current director Keith Westergaard, purchased: (i) 4,229,384 Series A Preferred Shares of DSG TAG at a deemed price of $1.25 per share in consideration for the settlement of $5,386,731 in debt payable to Westergaard Holdings; and (ii) 2,001,735 common shares of DSG TAG at a deemed price of $0.25 per share in consideration of $2,502,168.23 in interest and expenses accrued in respect of the debt. Until such time as all Series A Shares had been redeemed by DSG TAG, Westergaard Holdings may have converted any or all of its remaining Series A Shares and accrued interest into common shares of DSG Global at $1.25 per share.
Pursuant to the Agreement, DSG TAG agreed to complete a going public transaction by share exchange within 60 days of the Agreement, and a private placement financing of not less than $5,000,000 in gross proceeds within 60 days of going public., the Company shall have completed a financing for gross proceeds of at least $5,000.000. DSG TAG agreed to pay $2,500,000 of the financing proceeds to Westergaard Holdings to redeem 2,000,000 of the Series A Preferred Shares at the deemed redemption price of $1.25 per share. DSG TAG further agreed to raise additional gross proceeds of $5,000,000 and to redeem an additional 2,000,000 Series A Preferred Shares from Westergaard Holdings (at a redemption price of $1.25 per share or $2,500,000 in the aggregate). within 150 days following the going public transaction. Subsequent to the Agreement, DSG TAG completed its going public transaction on May 6, 2015 but did not raise sufficient capital to redeem the Series A Preferred Shares. The Subscription and Debt Settlement Agreement was subsequently amended by letter of agreement dated December 31, 2015, as described below.
On March 5, 2016, by letter agreement dated December 31, 2015 with Westergaard Holdings Ltd., a corporation owned by our Director Keith Westergaard, we amended the Subscription and Debt Settlement Agreement dated September 26, 2014 between DSG Tag Systems, Inc. and Westergaard Holdings, as previously amended on October 4, 2015. Westergaard Holdings owns 4,229,384 shares Series A Convertible Preferred Stock of DSG TAG. Pursuant to the settlement agreement, the parties have agreed that DSG Global will complete financings for gross proceeds of at least $10 million and use a portion of the proceeds to redeem all of the Series A Convertible Preferred Shares. The letter agreement modifies the redemption provisions of the original agreement, which now obligate us to raise capital and redeem the Series A Convertible Preferred Shares at a price of $1.25 per share as follows: (i) on or before May 1, 2016, DSG Global must complete a financing for gross proceeds of at least $2.5 million and use at least $1.125 million to redeem a minimum of 900,000 Series A Shares; (ii) on or before June 1, 2016, DSG Global must complete an additional financing for gross proceeds of at least $2.5 million and use at least $1.125 million to redeem a minimum of 900,000 additional Series A Shares; and (iii) on or before July 1, 2016, DSG Global must complete an additional financing for gross proceeds of at least $5.0 million and use at least $3.04 million to redeem the remaining 2,429,384 Series A Shares.
As described in Note 11 of the consolidated financial statements above, on August 27, 2018, pursuant to a debt exchange agreement, the Company agreed to exchange all 4,229,384 issued and outstanding DSG TAG Series A Shares with a fair value of $5,873,481 ($7,627,303 CDN), for 51 and 3,000,000 shares of Series B and Series E preferred shares, respectively.
On March 31, 2015, DSG entered into an agreement with Adore Creative Agency Inc., a corporation owned by our director Rupert Wainwright pursuant to which Adore will provide marketing services to DSG. The terms included cash payment of $17,500 and a note in the amount of $310,000, with 5% interest per annum, convertible at the election of the holder into 248,000 common shares in the capital stock of DSG Global, Inc. at a price of $1.25 per share, maturing on March 30, 2016. As of December 31, 2018, 100% of the marketing services have been expensed in the amount of $310,000.
On April 6, 2016, DSG TAG entered into a loan agreement with Westergaard Holdings Ltd. a corporation owned by our director Keith Westergaard, pursuant to which we raised proceeds of $120,000 CAD. DSG TAG agrees to pay the loan plus fees no later than the final due date of July 6, 2016. The fees for service are as follows: (a) DSG TAG agrees to pay a fee for service equal to 5% of the amount of the loan or $6,000 CAD if the loan is paid in full, including fees on or before May 6, 2016; (b) DSG TAG agrees to pay a fee for service equal to 10% of the amount of the original loan, or $12,000 CAD if the loan is paid in full, including fees, between May 7, 2016 and June 5, 2016; and (c) DSG TAG agrees to pay a fee for service equal to 20% of the amount of the original loan, or $24,000 CAD if the loan is paid full, including fees, between June 6, 2016 and July 5, 2016. DSG TAG agrees to pay partial payments towards the principal amount of the loan and fees. DSG TAG agrees that fees will be charged on the initial amount of the loan. On August 1, 2018, the loan and all accrued interest was assigned to 616796 BC Ltd.
On December 16, 2016, a convertible loan was received by Brent Silzer, the son of our President and CEO Robert Silzer, in the amount of $29,791 (CAD $40,000). Interest is 8% annual rate for one month and 4% monthly rate thereafter if not paid by January 15, 2017. The note is convertible at $200 per share. On April 3, 2017, this convertible loan and all unpaid interest and penalties was settled in cash of CDN$45,500 and the issuance of 132 common shares pursuant to a debt settlement and subscription agreement.
Promoters and Certain Control Persons
We did not have any promoters at any time during the past five fiscal years.
Director Independence
We currently act with five (5) directors consisting of Robert Silzer, Jason Sugarman, Rupert Wainwright, Stephen Johnston, James Singerling, Michael Leemhuis and James Singerling.Carol Cookerly. We have not made any determination as to whether any of our directors are independent directors, as that term is used in Rule 4200(a) (15) of the Rules of National Association of Securities Dealers.
PART II - INFORMATION NOT REQUIRED IN PROSPECTUS
Item 13. OTHER EXPENSES OF ISSUANCE AND DISTRIBUTION
The following table is an itemization of all expenses, without consideration to future contingencies, incurred or expected to be incurred by our Corporation in connection with the issuance and distribution of the common shares being offered by this Prospectus. Items marked with an asterisk (*) represent estimated expenses. We have agreed to pay all the costs and expenses of this offering except the GHS has agreed to pay the legal fees associated with the preparation of this registration statement.
| Item | Amount | Amount | ||||||
| SEC Registration Fee | $ | 30.11 | $ | 644.78 | ||||
| Legal Fees and Expenses* | $ | 10,000.00 | $ | 25,000.00 | ||||
| Accounting Fees and Expenses* | $ | NIL | $ | NIL | ||||
| Miscellaneous* | $ | NIL | $ | NIL | ||||
| Total* | $ | 10,001.11 | $ | 25,644.78 | ||||
Audit Fees, Audit Related Fees, and All Other Fees
The following represents fees for professional services rendered by our independent registered public accounting firm for each of the years ended December 31, 2018 and 2017.
| 2018 | 2017 | |||||||
| Audit Fees | $ | 66,220 | $ | 52,800 | ||||
| Audit Related Fees | Nil | Nil | ||||||
| Tax Fees | Nil | Nil | ||||||
| All Other Fees | Nil | Nil | ||||||
| Total | $ | 66,220 | $ | 52,800 | ||||
Lichter, Yu and Associates has served as our independent registered public accounting firm from September 2014 to October 2017.
Saturna Group Chartered Professional Accountants, LLP has served as our independent registered public accounting firm from October 2017 to January 2019.
Buckley Dodds, LLP is our independent registered public accounting firm since March 2019.
| 56 |
Item 14. INDEMNIFICATION OF OFFICERS AND DIRECTORS
Pursuant to Section 607.0850 of the Nevada Revised Statutes, we have the power to indemnify any person made a party to any lawsuit by reason of being a director or officer of the Registrant, or serving at the request of the corporation as a director, officer, employee or agent of another corporation, partnership, joint venture, trust or other enterprise against expenses (including attorneys’ fees), judgments, fines and amounts paid in settlement actually and reasonably incurred by him in connection with such action, suit or proceeding if he acted in good faith and in a manner he reasonably believed to be in or not opposed to the best interests of the corporation, and, with respect to any criminal action or proceeding, had no reasonable cause to believe his conduct was unlawful. Our Bylaws provide that the Registrant shall indemnify its directors and officers to the fullest extent permitted by Nevada law.
With regard to the foregoing provisions, or otherwise, we have been advised that in the opinion of the Securities and Exchange Commission, such indemnification is against public policy as expressed in the Securities Act of 1933, as amended, and is, therefore, unenforceable. In the event that a claim for indemnification against such liabilities (other than the payment by us of expenses incurred or paid by a director, officer or controlling person of the Corporation in the successful defense of any action, suit or proceeding) is asserted by such director, officer or controlling person in connection with the common shares being registered, we will, unless in the opinion of our counsel the matter has been settled by a controlling precedent, submit to a court of appropriate jurisdiction the question of whether such indemnification by us is against public policy as expressed in the Securities Act of 1933, as amended, and will be governed by the final adjudication of such case.
Item 15. RECENT SALES OF UNREGISTERED SECURITIES
During the year ended December 31, 2017:Common Stock Transactions:
| Date issued | Issuance(1) | Common shares issued (#) | Price per share | |||||||
| October 15, 2020 | Conversion - 103 ‘Series C’ | 3,593,024 | $ | 0.030 | ||||||
| October 21, 2020 | Conversion - 121 ‘Series C’ | 1,611,543 | 0.076 | |||||||
| October 26, 2020 | Conversion - 149 ‘Series C’ | 1,984,462 | 0.076 | |||||||
| October 30, 2020 | Shares for services | 2,000,000 | 0.254 | |||||||
| November 3, 2020 | Conversion - 148 ‘Series C’ | 1,545,692 | 0.097 | |||||||
| November 16, 2020 | Conversion - 180 ‘Series C’ | 1,622,840 | 0.112 | |||||||
| November 18, 2020 | Shares for settlement of debt | 1,600,000 | 0.016 | |||||||
| November 30, 2020 | Conversion - 343 ‘Series C’ | 3,087,772 | 0.112 | |||||||
| December 11, 2020 | Conversion - 285 ‘Series C’ | 2,358,621 | 0.122 | |||||||
| December 11, 2020 | Conversion - 4 ‘Series B’ | 400,000 | 0.057 | |||||||
| December 15, 2020 | Conversion - 166 ‘Series C’ | 1,319,206 | 0.127 | |||||||
| December 23, 2020 | Shares for services | 300,000 | 0.525 | |||||||
| December 24, 2020 | Conversion - 52 ‘Series C’ | 279,821 | 0.187 | |||||||
| December 24, 2020 | Conversion - 20 ‘Series C’ | 107,624 | 0.190 | |||||||
| December 30, 2020 | Conversion - 6 ‘Series C’ | 32,287 | 0.195 | |||||||
| December 31, 2020 | Shares for settlement of debt | 1,751,288 | 0.785 | |||||||
| January 5, 2021 | Shares for settlement of debt | 3,264,285 | 0.016 | |||||||
| Total | 26,858,465 | |||||||||
| Date Issued | Common Shares Issued (#) | Fair Value | Converted Balance | Gain (loss) on Conversion | ||||||||||||
| April 3, 2017(3) | 131 | $ | 26,252 | $ | 26,252 | $ | - | |||||||||
| May 4, 2017 | 750 | 150,000 | 150,000 | - | ||||||||||||
| May 8, 2017 | 25 | 42,000 | 35,000 | (7,000 | ) | |||||||||||
| May 25, 2017 | 53 | 71,400 | 73,500 | 2,100 | ||||||||||||
| July 24, 2017 | 200 | 40,000 | 63,007 | 23,007 | ||||||||||||
| July 28, 2017 | 125 | 21,500 | 15,356 | (6,144 | ) | |||||||||||
| September 7, 2017 | 188 | 22,575 | 21,936 | (639 | ) | |||||||||||
| October 10, 2017 | 250 | 34,000 | 6,821 | (27,179 | ) | |||||||||||
| October 11, 2017 | 354 | 42,456 | 22,273 | (20,183 | ) | |||||||||||
| October 11, 2017 | 188 | 25,500 | 22,019 | (3,481 | ) | |||||||||||
| October 18, 2017 | 531 | 8,494 | 6,508 | (1,986 | ) | |||||||||||
| October 19, 2017 | 1,100 | 43,200 | 41,874 | (1,326 | ) | |||||||||||
| October 19, 2017 | 557 | 26,753 | 28,795 | 2,042 | ||||||||||||
| October 20, 2017 | 557 | 11,147 | 11,358 | 211 | ||||||||||||
| October 23, 2017 | 610 | 19,524 | 21,849 | 2,325 | ||||||||||||
| October 25, 2017 | 675 | 16,200 | 15,251 | (949 | ) | |||||||||||
| October 26, 2017 | 448 | 12,540 | 14,789 | 2,249 | ||||||||||||
| October 27, 2017 | 750 | 21,000 | 19,479 | (1,521 | ) | |||||||||||
| October 27, 2017 | 754 | 21,122 | 24,056 | 2,934 | ||||||||||||
| October 31, 2017 | 625 | 17,505 | 17,998 | 493 | ||||||||||||
| October 31, 2017 | 750 | 21,000 | 19,479 | (1,521 | ) | |||||||||||
| November 2, 2017 | 375 | 8,996 | 10,704 | 1,708 | ||||||||||||
| November 7, 2017 | 917 | 18,335 | 32,478 | 14,143 | ||||||||||||
| November 13, 2017 | 754 | 18,104 | 20,704 | 2,600 | ||||||||||||
| November 22, 2017 | 1,000 | 12,002 | 21,711 | 9,709 | ||||||||||||
| December 27, 2017 | 1,050 | 12,600 | 9,142 | (3,458 | ) | |||||||||||
| December 27, 2017 | 1,050 | 13,420 | 6,062 | (7,358 | ) | |||||||||||
| December 29, 2017 | 1,150 | 9,200 | 3,920 | (5,280 | ) | |||||||||||
| December 29, 2017 | 1,155 | 10,462 | 12,816 | 2,354 | ||||||||||||
| Total | 17,072 | $ | 797,287 | $ | 775,137 | $ | (22,150 | ) | ||||||||
During the year ended December 31, 2018 the Company issued an aggregate of:
| Date Issued | Common Shares Issued (#) | Fair Value | Converted Balance | Gain (loss) on Conversion | ||||||||||||
| January 2, 2018 | 1,270 | $ | 11,683 | $ | 3,733 | $ | (7,950 | ) | ||||||||
| January 5, 2018 | 1,325 | 10,600 | 5,300 | (5,300 | ) | |||||||||||
| January 5, 2018 | 1,334 | 10,666 | 2,986 | (7,680 | ) | |||||||||||
| January 9, 2018 | 1,450 | 11,600 | 5,800 | (5,800 | ) | |||||||||||
| January 11, 2018 | 1,525 | 15,860 | 6,100 | (9,760 | ) | |||||||||||
| January 11, 2018 | 1,539 | 15,997 | 3,446 | (12,551 | ) | |||||||||||
| January 12, 2018 | 1,692 | 16,911 | 3,788 | (13,123 | ) | |||||||||||
| January 16, 2018 | 1,675 | 13,400 | 6,701 | (6,699 | ) | |||||||||||
| January 16, 2018 | 1,776 | 14,204 | 3,977 | (10,227 | ) | |||||||||||
| January 17, 2018 | 1,948 | 15,581 | 4,363 | (11,218 | ) | |||||||||||
| January 19, 2018 | 2,045 | 18,812 | 4,580 | (14,232 | ) | |||||||||||
| January 22, 2018 | 2,045 | 35,170 | 4,580 | (30,590 | ) | |||||||||||
| January 23, 2018 | 2,125 | 27,200 | 8,500 | (18,700 | ) | |||||||||||
| January 24, 2018 | 2,249 | 29,685 | 5,038 | (24,647 | ) | |||||||||||
| January 26, 2018 | 2,468 | 27,632 | 5,526 | (22,106 | ) | |||||||||||
| January 31, 2018 | 2,133 | 36,678 | 7,506 | (29,172 | ) | |||||||||||
| January 31, 2018 | 2,591 | 27,975 | 5,802 | (22,173 | ) | |||||||||||
| February 1, 2018 | 2,591 | 25,903 | 5,802 | (20,101 | ) | |||||||||||
| February 6, 2018 | 1,511 | 14,501 | 3,806 | (10,695 | ) | |||||||||||
| February 6, 2018 | 2,956 | 28,370 | 6,620 | (21,750 | ) | |||||||||||
| February 7, 2018 | 2,821 | 29,076 | 10,550 | (18,526 | ) | |||||||||||
| February 8, 2018 | 1,511 | 12,084 | 4,350 | (7,734 | ) | |||||||||||
| February 9, 2018 | 3,500 | 32,200 | 14,000 | (18,200 | ) | |||||||||||
| February 9, 2018 | 3,653 | 33,607 | 8,182 | (25,425 | ) | |||||||||||
| February 12, 2018 | 3,613 | 36,124 | 15,100 | (21,024 | ) | |||||||||||
| February 12, 2018 | 4,010 | 40,098 | 9,543 | (30,555 | ) | |||||||||||
| February 13, 2018 | 2,450 | 18,816 | 9,800 | (9,016 | ) | |||||||||||
| February 14, 2018 | 3,588 | 28,696 | 10,331 | (18,365 | ) | |||||||||||
| February 14, 2018 | 4,513 | 36,099 | 10,740 | (25,359 | ) | |||||||||||
| February 16, 2018 | 4,917 | 33,433 | 9,637 | (23,796 | ) | |||||||||||
| February 20, 2018 | 3,276 | 19,654 | 10,089 | (9,565 | ) | |||||||||||
| February 22, 2018 | 2,470 | 15,610 | 7,064 | (8,546 | ) | |||||||||||
| February 22, 2018 | 5,326 | 27,692 | 9,692 | (18,000 | ) | |||||||||||
| February 28, 2018 | 3,588 | 18,652 | 8,394 | (10,258 | ) | |||||||||||
| February 28, 2018 | 5,715 | 29,714 | 8,000 | (21,714 | ) | |||||||||||
| March 2, 2018 | 6,179 | 81,556 | 8,650 | (72,906 | ) | |||||||||||
| March 5, 2018 | 1,068 | 11,099 | 1,494 | (9,605 | ) | |||||||||||
| March 5, 2018 | 2,583 | 26,859 | 3,616 | (23,243 | ) | |||||||||||
| March 6, 2018 | 6,137 | 81,000 | 13,500 | (67,500 | ) | |||||||||||
| March 6, 2018 | 6,068 | 60,671 | 10,921 | (49,750 | ) | |||||||||||
| March 7, 2018 | 5,428 | 54,280 | 7,599 | (46,681 | ) | |||||||||||
| March 8, 2018 | 5,946 | 64,213 | 8,324 | (55,889 | ) | |||||||||||
| March 8, 2018 | 3,476 | 40,318 | 8,064 | (32,254 | ) | |||||||||||
| March 12, 2018 | 5,942 | 64,167 | 8,318 | (55,849 | ) | |||||||||||
| March 13, 2018 | 5,244 | 50,335 | 11,535 | (38,800 | ) | |||||||||||
| March 14, 2018 | 6,549 | 70,726 | 11,788 | (58,938 | ) | |||||||||||
| March 14, 2018 | 5,507 | 57,263 | 7,708 | (49,555 | ) | |||||||||||
| March 15, 2018 | 5,669 | 56,683 | 7,936 | (48,747 | ) | |||||||||||
| March 19, 2018 | 8,316 | 76,501 | 11,641 | (64,860 | ) | |||||||||||
| March 22, 2018 | 6,537 | 52,291 | 9,151 | (43,140 | ) | |||||||||||
| March 26, 2018 | 5,825 | 72,230 | 8,155 | (64,075 | ) | |||||||||||
| March 27, 2018 | 4,567 | 42,016 | 10,047 | (31,969 | ) | |||||||||||
| March 29, 2018 | 1,558 | 19,938 | 10,000 | (9,938 | ) | |||||||||||
| April 2, 2018 | 4,580 | 75,105 | 18,135 | (56,970 | ) | |||||||||||
| April 5, 2018 | 11,087 | 319,277 | 19,955 | (299,322 | ) | |||||||||||
| April 6, 2018 | 2,190 | 21,893 | 3,941 | (17,952 | ) | |||||||||||
| April 19, 2018 | 12,050 | 173,512 | 66,272 | (107,240 | ) | |||||||||||
| May 14, 2018 | 18,068 | 252,948 | 113,174 | (139,774 | ) | |||||||||||
| May 25, 2018 | 10,000 | 112,000 | 52,800 | (59,200 | ) | |||||||||||
| June 13, 2018 | 3,250 | 26,000 | 9,750 | (16,250 | ) | |||||||||||
| June 13, 2018 | 10,000 | 72,000 | 33,000 | (39,000 | ) | |||||||||||
| June 19, 2018 | 9,975 | 59,850 | 32,918 | (26,932 | ) | |||||||||||
| June 25, 2018 | 10,840 | 60,704 | 28,618 | (32,086 | ) | |||||||||||
| July 2, 2018 | 3,438 | 19,250 | 7,906 | (11,344 | ) | |||||||||||
| July 2, 2018 | 12,327 | 69,028 | 31,186 | (37,842 | ) | |||||||||||
| July 12, 2018 | 11,000 | 61,600 | 25,300 | (36,300 | ) | |||||||||||
| July 23, 2018 | 4,774 | 21,006 | 10,503 | (10,503 | ) | |||||||||||
| July 24, 2018 | 14,250 | 62,700 | 28,500 | (34,200 | ) | |||||||||||
| July 25, 2018 | 10,626 | 38,253 | 21,039 | (17,214 | ) | |||||||||||
| August 2, 2018 | 18,500 | 88,800 | 22,200 | (66,600 | ) | |||||||||||
| August 3, 2018 | 9,581 | 45,988 | 12,647 | (33,341 | ) | |||||||||||
| August 10, 2018 | 10,399 | 41,593 | 13,726 | (27,867 | ) | |||||||||||
| August 23, 2018 | 2,723 | 23,956 | 4,192 | (19,764 | ) | |||||||||||
| September 4, 2018 | 13,887 | 116,644 | 15,000 | (101,644 | ) | |||||||||||
| September 10, 2018 | 17,073 | 122,922 | 26,292 | (96,631 | ) | |||||||||||
| September 10, 2018 | 10,792 | 43,167 | 12,950 | (30,217 | ) | |||||||||||
| September 25, 2018 | 21,250 | 95,200 | 32,725 | (62,475 | ) | |||||||||||
| October 5, 2018 | 16,352 | 77,834 | 35,974 | (41,860 | ) | |||||||||||
| October 17, 2018 | 18,121 | 79,729 | 31,892 | (47,837 | ) | |||||||||||
| October 24, 2018 | 15,132 | 54,474 | 26,632 | (27,842 | ) | |||||||||||
| October 24, 2018 | 22,500 | 90,000 | 39,600 | (50,400 | ) | |||||||||||
| November 2, 2018 | 9,705 | 34,936 | 14,945 | (19,991 | ) | |||||||||||
| November 7, 2018 | 43,428 | 121,598 | 86,856 | (34,742 | ) | |||||||||||
| December 28, 2018 | 8,851 | 31,861 | 15,576 | (16,285 | ) | |||||||||||
| Total | 572,547 | $ | 4,315,958 | $ | 1,302,077 | $ | (3,013,881 | ) | ||||||||
During the three months ended March 31, 2019 the Company had the following transactions:
| Date Issued | Common Shares Issued (#) | Fair Value | Converted Balance | Gain (loss) on Conversion | ||||||||||||
| January 22, 2019 | 10,189 | $ | 28,527 | $ | 15,690 | $ | (12,837 | ) | ||||||||
| March 11, 2019 | 18,606 | 37,212 | 12,280 | (24,932 | ) | |||||||||||
| March 15, 2019 | 27,137 | 54,238 | 17,898 | (36,340 | ) | |||||||||||
| Total | 55,932 | $ | 119,977 | $ | 45,868 | $ | (74,109 | ) | ||||||||
Subsequent to March 31, 2019, the Company had the following transactions:
The above referenced shares have been adjusted to reflect a four thousand (4,000) old for one (1) new common share as a result of the reverse stock split of the Company’s common shares on March 26, 2019.Preferred Stock Transactions:
The above referencedPreferred Shares – Series C
| Date issued | Issuance | Preferred shares Issued - Series C (#) | Price per share | |||||||
| October 15, 2020 | Share Purchase Agreement | 250 | $ | 800.00 | ||||||
| October 15, 2020 | Exchange Agreement | 2,347 | $ | 1000.51 | ||||||
| Total | 2,597 | |||||||||
Preferred Shares – Series F
| Date issued | Issuance | Preferred shares Issued - Series F (#) | Price per share | |||||||||
| December 23, 2020 | Share Purchase Agreement | 1,500 | $ | 1000.00 | ||||||||
| Total | 1,500 | |||||||||||
These shares were issued in reliance onpursuant to an exemption from the registration underrequirements of the Securities Act of 1933, set forth inas amended, pursuant to Section 4(2) thereof 4(a)(2) and/or Rule 506 of Regulation D promulgated thereunder.thereunder.
| 57 |
INTERIM CONDENSEDINDEX TO CONSOLIDATED BALANCE SHEETS
AS AT JUNE 30, 2019 AND DECEMBER 31, 2018
(Expressed in U.S. dollars)
(UNAUDITED)FINANCIAL STATEMENTS
| June 30, 2019 | December 31, 2018 | |||||||
| (unaudited) | ||||||||
| ASSETS | ||||||||
| CURRENT ASSETS | ||||||||
| Cash | $ | 31,820 | $ | 5,059 | ||||
| Trade receivables, net | 227,350 | 139,400 | ||||||
| Inventories, net of inventory allowance of $149,577 and $146,292, respectively | 162,104 | 141,296 | ||||||
| Prepaid expenses and deposits | 78,847 | 47,484 | ||||||
| TOTAL CURRENT ASSETS | 500,121 | 333,239 | ||||||
| NON-CURRENT ASSETS | ||||||||
| Intangible assets, net | 14,675 | 15,289 | ||||||
| Fixed assets, net | 33,195 | 869 | ||||||
| Equipment on lease, net | 2,120 | 3,316 | ||||||
| TOTAL NON-CURRENT ASSETS | 49,990 | 19,474 | ||||||
| TOTAL ASSETS | $ | 550,111 | $ | 352,713 | ||||
| LIABILITIES AND STOCKHOLDERS’ DEFICIT | ||||||||
| CURRENT LIABILITIES | ||||||||
| Trade and other payables | $ | 2,368,800 | $ | 1,897,530 | ||||
| Deferred revenue | 147,288 | 215,662 | ||||||
| Operating lease liability | 32,695 | - | ||||||
| Convertible note payable to related party | 310,000 | 310,000 | ||||||
| Loans payable | 1,019,383 | 795,588 | ||||||
| Derivative liability | 1,717,939 | 2,188,354 | ||||||
| Convertible loans payable, net of unamortized discounts and premiums of $212,401 and $213,461, respectively | 1,743,361 | 1,613,912 | ||||||
| TOTAL CURRENT LIABILITIES | 7,339,466 | 7,021,046 | ||||||
| Going concern (Note 2) | ||||||||
| Commitments (Note 16) | ||||||||
| Contingencies (Note 17) | ||||||||
| Subsequent events (Note 18) | ||||||||
| MEZZANINE EQUITY | ||||||||
| Redeemable preferred stock, (2019 and 2018 - to be issued) | $ | 6,702,450 | $ | 6,702,450 | ||||
| STOCKHOLDERS’ DEFICIT | ||||||||
| Preferred stock to be issued | 4,872,732 | 4,872,732 | ||||||
| Common stock, $0.001 par value, 150,000,000 shares authorized, (2018 - 750,000); 787,569 issued and outstanding (2018 - 634,471) | 788 | 634 | ||||||
| Additional paid in capital | 22,649,842 | 22,415,121 | ||||||
| Discounts on common stock | (69,838 | ) | (69,838 | ) | ||||
| Other accumulated comprehensive income | 1,389,278 | 1,465,389 | ||||||
| Accumulated deficit | (42,334,607 | ) | (42,054,821 | ) | ||||
| TOTAL STOCKHOLDERS’ DEFICIT | (13,491,805 | ) | (13,370,783 | ) | ||||
| TOTAL LIABILITIES AND STOCKHOLDERS’ DEFICIT | $ | 550,111 | $ | 352,713 | ||||
The accompanying notes are an integral part of the unaudited interim condensed consolidated financial statements
| 58 |
DSG GLOBAL, INC.
INTERIM CONDENSED CONSOLIDATED STATEMENTS OF OPERATIONS
FOR THE THREE AND SIX MONTHS ENDED JUNE 30, 2019 AND 2018
(Expressed in U.S. dollars)
(UNAUDITED)
| Three months ending | Six months ending | |||||||||||||||
| June 30, 2019 | June 30, 2018 | June 30, 2019 | June 30, 2018 | |||||||||||||
| Revenue | $ | 284,646 | $ | 237,046 | $ | 786,070 | $ | 347,942 | ||||||||
| Cost of revenue | 32,886 | 79,552 | 338,954 | 97,881 | ||||||||||||
| Gross profit | 251,760 | 157,494 | 447,116 | 250,061 | ||||||||||||
| Operating expenses | ||||||||||||||||
| Compensation expense | 144,673 | 209,174 | 279,756 | 417,802 | ||||||||||||
| General and administration expense | 203,938 | 275,480 | 431,694 | 633,493 | ||||||||||||
| Warranty expense | - | 46,273 | - | 46,273 | ||||||||||||
| Bad debt | (3,290 | ) | 2,099 | (1,866 | ) | 30,992 | ||||||||||
| Depreciation and amortization expense | 10,900 | 2,220 | 20,821 | 8,914 | ||||||||||||
| Total operating expense | 356,221 | 535,246 | 730,405 | 1,137,474 | ||||||||||||
| Loss from operations | (104,461 | ) | (377,752 | ) | (283,289 | ) | (887,413 | ) | ||||||||
| Other income (expense) | ||||||||||||||||
| Foreign currency exchange gain (loss) | 13,526 | 410,454 | 31,163 | (150,212 | ) | |||||||||||
| Change in fair value of derivative instruments | 7,356,541 | 6,013,778 | 720,624 | 397,517 | ||||||||||||
| Loss on extinguishment of debt | (54,145 | ) | (768,964 | ) | (128,254 | ) | (2,164,231 | ) | ||||||||
| Finance costs | (318,274 | ) | (776,506 | ) | (620,030 | ) | (1,517,068 | ) | ||||||||
| Total other income (expense) | 6,997,648 | 4,878,762 | 3,503 | (3,433,994 | ) | |||||||||||
| Net income (loss) | $ | 6,893,187 | $ | 4,501,010 | $ | (279,786 | ) | $ | (4,321,407 | ) | ||||||
| Net income (loss) per share | ||||||||||||||||
| Basic and diluted: | ||||||||||||||||
| Basic | $ | 9.80 | $ | 16.80 | $ | (0.41 | ) | $ | (23.26 | ) | ||||||
| Diluted | $ | 9.80 | $ | 16.80 | $ | (0.41 | ) | $ | (23.26 | ) | ||||||
Weighted average number of shares used in computing basic and diluted net loss per share: | ||||||||||||||||
| Basic | 703,437 | 267,903 | 677,426 | 185,772 | ||||||||||||
| Diluted | 703,437 | 267,903 | 677,426 | 185,772 | ||||||||||||
The accompanying notes are an integral part of the unaudited interim condensed consolidated financial statements
DSG GLOBAL, INC.
INTERIM CONDENSED CONSOLIDATED STATEMENTS OF COMPREHENSIVE LOSS
FOR THE THREE AND SIX MONTHS ENDED JUNE 30, 2019 AND 2018
(Expressed in U.S. dollars)
(UNAUDITED)
| Three months ending | Six months ending | |||||||||||||||
| June 30, 2019 | June 30, 2018 | June 30, 2019 | June 30, 2018 | |||||||||||||
| Net income (loss) | $ | 6,893,187 | $ | 4,501,010 | $ | (279,786 | ) | $ | (4,321,407 | ) | ||||||
| Other comprehensive income | ||||||||||||||||
| Foreign currency translation adjustments | (6,476 | ) | (361,594 | ) | (76,111 | ) | 279,497 | |||||||||
| Comprehensive income (loss) | $ | 6,886,711 | $ | 4,139,416 | $ | (355,897 | ) | $ | (4,041,910 | ) | ||||||
The accompanying notes are an integral part of the unaudited interim condensed consolidated financial statements
DSG GLOBAL, INC.
INTERIM CONDENSED CONSOLIDATED STATEMENTS OF STOCKHOLDERS’ DEFICIT
(Expressed in U.S. dollars)
(UNAUDITED)
| Common Stock | ||||||||||||||||||||||||||||||||
| Shares | Amount | Additional paid in capital | Discount on common stock | Preferred Stock To be issued | Accumulated comprehensive income | Accumulated deficit | Total stockholders’ deficit | |||||||||||||||||||||||||
| Balance, December 31, 2017 | 25,485 | $ | 25 | $ | 17,613,525 | $ | - | $ | - | $ | 873,250 | $ | (32,229,417 | ) | $ | (13,742,617 | ) | |||||||||||||||
| Shares issued for cash | 12,501 | 12 | 81,647 | - | - | - | - | 81,659 | ||||||||||||||||||||||||
| Shares issued on conversion of debt | 185,798 | 186 | 1,802,955 | - | - | - | - | 1,803,141 | ||||||||||||||||||||||||
| Net loss for the period | - | - | - | - | - | 641,091 | (8,822,417 | ) | (8,181,326 | ) | ||||||||||||||||||||||
| Balance, March 31, 2018 | 223,784 | $ | 223 | $ | 19,498,127 | $ | - | $ | - | $ | 1,514,341 | $ | (41,051,834 | ) | $ | (20,039,143 | ) | |||||||||||||||
| Shares issued for commission | 188 | - | 2,250 | - | - | - | - | 2,250 | ||||||||||||||||||||||||
| Shares issued on conversion of debt | 92,040 | 92 | 1,172,185 | - | - | - | - | 1,172,277 | ||||||||||||||||||||||||
| Net loss for the period | - | - | - | - | - | (361,594 | ) | 4,501,010 | 4,139,416 | |||||||||||||||||||||||
| Balance, June 30, 2018 | 316,012 | $ | 315 | $ | 20,672,562 | $ | - | $ | - | $ | 1,152,747 | $ | (36,550,824 | ) | $ | (14,725,200 | ) | |||||||||||||||
| Balance, December 31, 2018 | 634,471 | $ | 634 | $ | 22,415,121 | $ | (69,838 | ) | $ | 4,872,732 | $ | 1,465,389 | $ | (42,054,821 | ) | $ | (13,370,783 | ) | ||||||||||||||
| Shares issued on conversion of debt | 55,932 | 56 | 119,921 | - | - | - | - | 119,977 | ||||||||||||||||||||||||
| Net loss for the period | - | - | - | - | - | (69,635 | ) | (7,172,973 | ) | (7,242,608 | ) | |||||||||||||||||||||
| Balance, March 31, 2019 | 690,403 | $ | 690 | $ | 22,535,042 | $ | (69,838 | ) | $ | 4,872,732 | $ | 1,395,754 | $ | (49,227,794 | ) | $ | (20,493,414 | ) | ||||||||||||||
| Shares issued for services | 17,500 | 18 | 19,582 | - | - | - | - | 19,600 | ||||||||||||||||||||||||
| Shares issued on conversion of debt | 79,666 | 80 | 95,218 | - | - | - | - | 95,298 | ||||||||||||||||||||||||
| Net loss for the period | - | - | - | - | - | (6,476 | ) | 6,893,187 | 6,886,711 | |||||||||||||||||||||||
| Balance, June 30, 2019 | 787,569 | $ | 788 | $ | 22,649,842 | $ | (69,838 | ) | $ | 4,872,732 | $ | 1,389,278 | $ | (42,334,607 | ) | $ | (13,491,805 | ) | ||||||||||||||
The accompanying notes are an integral part of the unaudited interim condensed consolidated financial statements
DSG GLOBAL INC.
INTERIM CONDENSED CONSOLIDATED STATEMENTS OF CASH FLOWS
FOR THE SIX MONTHS ENDED JUNE 30, 2019 AND 2018
(Expressed in U.S. Dollars)
(UNAUDITED)
| 2019 | 2018 | |||||||
| Net loss | $ | (279,786 | ) | $ | (4,321,407 | ) | ||
| Adjustments to reconcile net loss to net cash used in operating activities: | ||||||||
| Depreciation and amortization | 20,821 | 8,914 | ||||||
| Change in inventory allowance | (2,814 | ) | - | |||||
| Non-cash financing costs | - | 224,956 | ||||||
| Accretion of discounts on debt | 328,055 | 924,905 | ||||||
| Change in fair value of derivative liabilities | (720,624 | ) | (397,517 | ) | ||||
| Reserve for bad debt | (1,866 | ) | 30,992 | |||||
| Shares issued for services | 19,600 | 2,250 | ||||||
| Loss on extinguishment of debt | 128,254 | 2,164,231 | ||||||
| Unrealized foreign exchange loss (gain) | (81,146 | ) | 152,901 | |||||
| (Increase) decrease in assets: | ||||||||
| Trade receivables, net | (81,051 | ) | (107,836 | ) | ||||
| Inventories | (12,103 | ) | (47,868 | ) | ||||
| Prepaid expense and deposits | (35,880 | ) | (33,629 | ) | ||||
| Related party receivable | - | 1,034 | ||||||
| Increase (decrease) in current liabilities: | ||||||||
| Trade payables and accruals | 554,903 | 313,849 | ||||||
| Deferred revenue | (68,374 | ) | 123,204 | |||||
| Warranty reserve | - | (30,583 | ) | |||||
| Operating lease liabilities | (16,228 | ) | - | |||||
| Net cash used in operating activities | (248,239 | ) | (991,604 | ) | ||||
| Cash flows from investing activities | ||||||||
| Purchase of property, plant and equipment | - | (1,544 | ) | |||||
| Net cash used in investing activities | - | (1,544 | ) | |||||
| Cash flows from financing activities: | ||||||||
| Proceeds from issuing shares | - | 81,659 | ||||||
| Repayments of notes payable | - | (45,000 | ) | |||||
| Proceeds from notes payable | 275,000 | 967,000 | ||||||
| Net cash provided by financing activities | 275,000 | 1,003,659 | ||||||
| Net increase in cash | 26,761 | 10,511 | ||||||
| Cash at beginning of period | 5,059 | 5,488 | ||||||
| Cash at the end of the period | $ | 31,820 | $ | 15,999 | ||||
| Supplemental disclosures | ||||||||
| Cash paid during the period for: | ||||||||
| Income tax payments | $ | - | $ | - | ||||
| Interest payments | $ | 2,513 | $ | - | ||||
| Supplemental schedule of non-cash financing activities: | ||||||||
| Convertible debenture issued for financing fees | $ | - | $ | 15,000 | ||||
| Initial recognition of lease asset | $ | 51,203 | $ | - | ||||
| Initial recognition of lease liability | $ | 47,118 | $ | - | ||||
| Shares issued for convertible notes payable | $ | 215,275 | $ | 2,975,418 | ||||
The accompanying notes are an integral part of the unaudited interim condensed consolidated financial statements
DSG GLOBAL, INC.NOTES TO INTERIM CONDENSED CONSOLIDATED FINANCIAL STATEMENTS
Note 1 – ORGANIZATION
DSG Global, Inc. (the “Company”) was incorporated under the laws of the State of Nevada on September 24, 2007.
The Company is a technology development company engaged in the design, manufacture, and marketing of fleet management solutions in the golf industry. The Company’s principal activities are the sale and rental of GPS tracking devices and interfaces for golf vehicles and related support services.
On April 13, 2015, the Company entered into a share exchange agreement with Vantage Tag Systems Inc. (“VTS”) (formerly DSG Tag Systems Inc.), now wholly-owned subsidiary of the Company, incorporated under the laws of the State of Nevada on April 17, 2008 and extra provincially registered in British Columbia, Canada in 2008. In March 2011, VTS formed DSG Tag Systems International, Ltd. in the United Kingdom (“DSG UK”). DSG UK is a wholly owned subsidiary of VTS.
On March 26, 2019, the Company effected a reverse stock split of its shares of common stock on a four thousand (4,000) old for one (1) new basis. Upon effect of the reverse split, authorized capital decreased from 3,000,000,000 shares of common stock to 750,000 shares of common stock, with a par value of $0.001. Subsequently, on May 23, 2019, an increase in common shares to 150,000,000 was authorized, with a par value of $0.001. Shares of Preferred Stock remain unchanged. These consolidated financial statements give retroactive effect to such reverse stock split named above and all share and per share amounts have been adjusted accordingly, unless otherwise noted.
Note 2 – GOING CONCERN
These unaudited interim condensed consolidated financial statements have been prepared on a going concern basis, which implies the Company will continue to realize its assets and discharge its liabilities in the normal course of business. The continuation of the Company as a going concern is dependent upon the continued financial support from its shareholders and note holders, the ability of the Company to obtain necessary equity financing to continue operations, and ultimately the attainment of profitable operations. As at June 30, 2019, the Company has a working capital deficit of $6,839,345 and has an accumulated deficit of $42,334,607 since inception. Furthermore, the Company incurred a net loss of $279,786 and used $248,239 of cash flows for operating activities during the six months ended June 30, 2019. These factors raise substantial doubt regarding the Company’s ability to continue as a going concern. These unaudited interim condensed consolidated financial statements do not include any adjustments to the recoverability and classification of recorded asset amounts and classification of liabilities that might be necessary should the Company be unable to continue as a going concern.
Note 3 – SUMMARY OF SIGNIFICANT ACCOUNTING POLICIES
Basis of Presentation
The accompanying condensed consolidated financial statements were prepared in conformity with generally accepted accounting principles in the United States (“U.S. GAAP”) and with the instructions to Form 10-Q.
Certain information and footnote disclosures normally included in financial statements prepared in accordance with U.S. GAAP have been condensed or omitted pursuant to U.S. GAAP rules and regulations for presentation of interim financial information. Therefore, the unaudited condensed interim consolidated financial statements should be read in conjunction with the financial statements and the notes thereto, included in the Company’s Annual Report on the Form 10-K for the year ended December 31, 2018. Current and future financial statements may not be directly comparable to the Company’s historical financial statements. However, except as disclosed herein, there have been no material changes in the information disclosed in the notes to the financial statements for the year ended December 31, 2018 included in the Company’s Annual Report on Form 10-K filed with the Securities and Exchange Commission. In the opinion of Management, all adjustments considered necessary for a fair presentation, consisting solely of normal recurring adjustments, have been made. Operating results for the six months ended June 30, 2019 are not necessarily indicative of the results that may be expected for the year ending December 31, 2019.
Principles of Consolidation
The interim condensed consolidated financial statements include the accounts of DSG Global Inc. and its wholly-owned subsidiaries VTS and DSG UK, collectively referred to as the Company. All material intercompany accounts, transactions and profits were eliminated in consolidation.
Use of Estimates
The preparation of interim condensed consolidated financial statements in conformity with U.S. GAAP requires management to make estimates and assumptions that affect the reported amounts of assets and liabilities and the disclosure of contingent assets and liabilities at the date of the interim condensed consolidated financial statements and the reported amounts of revenues and expenses during the reporting period. Actual results could differ from those estimates. Estimates and assumptions are reviewed periodically, and the effects of revisions are reflected in the condensed consolidated financial statements in the period they are determined. New estimates in the period relate to determining the Company’s estimated incremental borrowing rate in recognizing right-of-use assets and lease liabilities. Differences in the estimated incremental borrowing rate could result in materially different lease liabilities and right-of-use assets.
Recently Adopted Accounting Pronouncements
In February 2016, the Financial Accounting Standards Board, or FASB, established Topic 842, Leases, by issuing Accounting Standards Update (“ASU”) No. 2016-02, which requires lessors to classify leases as a sales-type, direct financing, or operating lease and requires lessees to recognize leases on-balance sheet and disclose key information about leasing arrangements. Topic 842 was subsequently amended by ASU No. 2018-01, Land Easement Practical Expedient for Transition to Topic 842; ASU No. 2018-10, Codification Improvements to Topic 842, Leases; and ASU No. 2018-11, Targeted Improvements.
The Company adopted the new standard effective January 1, 2019 and elected the modified retrospective for the transition. The Company elected the following practical expedients:
Lessee Accounting
The new standard requires lessees to recognize a right-of-use asset and lease liability on the balance sheet for all leases with a term longer than 12 months. Leases are classified as finance or operating at inception, with classification affecting the pattern and recording of expenses in the statement of operations. Upon transition the Company recognized lease assets and lease liabilities principally for its office lease. When measuring lease liabilities for leases that were classified as operating leases, the Company discounted lease payments using its incremental borrowing rate at January 1, 2019. The weighted-average incremental borrowing rate applied was 11.98%. Refer to Notes 5 and 11.
Reclassification
Certain prior year amounts have been reclassified for consistency with the current period presentation. These reclassifications had no effect on the reported results of operations or cash flow.
Note 4 – TRADE RECEIVABLES, NET
As of June 30, 2019, and December 31, 2018, trade receivables consist of the following:
| June 30, 2019 | December 31, 2018 | |||||||
| Accounts receivables | $ | 272,132 | $ | 184,214 | ||||
| Allowance for doubtful accounts | (44,782 | ) | (44,814 | ) | ||||
| Total trade receivables, net | $ | 227,350 | $ | 139,400 | ||||
Note 5 – FIXED ASSETS AND EQUIPMENT ON LEASE
As of June 30, 2019 and December 31, 2018, fixed assets consisted of the following:
| June 30, 2019 | December 31, 2018 | |||||||
| Furniture and equipment | $ | 16,250 | $ | 20,509 | ||||
| Computer equipment | 25,459 | 28,460 | ||||||
| Right-of-use lease asset | 51,203 | - | ||||||
| Accumulated depreciation | (59,717 | ) | (48,100 | ) | ||||
| $ | 33,195 | $ | 869 | |||||
As of June 30, 2019 and December 31, 2018, equipment on lease consisted of the following:
| June 30, 2019 | December 31, 2018 | |||||||
| Tags | $ | 126,042 | $ | 120,998 | ||||
| Text | 27,858 | 26,743 | ||||||
| Touch | 23,076 | 22,152 | ||||||
| Accumulated depreciation | (174,856 | ) | (166,577 | ) | ||||
| $ | 2,120 | $ | 3,316 | |||||
For the three months ended June 30, 2019 and 2018, total depreciation expense for fixed assets and leased equipment was $10,593 and $1,937, respectively.
For the six months ended June 30, 2019 and 2018, total depreciation expense for fixed assets and leased equipment was $20,207 and $8,348, respectively.
Note 6 – INTANGIBLE ASSETS
Intangible assets consist of the following as of June 30, 2019 and December 31, 2018:
| June 30, 2019 | December 31, 2018 | |||||||
| Intangible asset – Patent | $ | 22,353 | $ | 22,353 | ||||
| Accumulated depreciation | (7,678 | ) | (7,064 | ) | ||||
| $ | 14,675 | $ | 15,289 | |||||
The estimated useful life of the patent is 20 years. Patents are amortized on a straight-line basis. For the three months ended June 30, 2019 and 2018, total amortization expense was $307 and $283, respectively.
For the six months ended June 30, 2019 and 2018, total amortization expense was $614 and $566, respectively.
Note 7 – TRADE AND OTHER PAYABLES
As of June 30, 2019, and December 31, 2018, trade and other payables consist of the following:
| June 30, 2019 | December 31, 2018 | |||||||
| Accounts payable | $ | 1,190,174 | $ | 978,770 | ||||
| Accrued expenses | 252,502 | 245,737 | ||||||
| Accrued interest | 906,052 | 686,354 | ||||||
| Other liabilities | 20,072 | (13,331 | ) | |||||
| Total payables | $ | 2,368,800 | $ | 1,897,530 | ||||
Note 8 – LOANS PAYABLE
As of June 30, 2019 and December 31, 2018, loans payable consisted of the following:
| Loans Payable | June 30, 2019 | December 31, 2018 | ||||||
| Unsecured, due on demand, interest at 15% per annum | $ | 190,896 | $ | 183,258 | ||||
| Unsecured, due on demand, interest at 36% per annum | 46,701 | 44,830 | ||||||
| Unsecured, loan payable, due on demand, interest at 18% per annum | 317,500 | 317,500 | ||||||
| Unsecured, loan payable, interest 10% per annum, with a minimum interest amount of $25,000, due on demand. | 250,000 | 250,000 | ||||||
| Unsecured share-settled debt, interest at 4.99% per month, due on May 7, 2019. | 214,286 | - | ||||||
| $ | 1,019,383 | $ | 795,588 | |||||
On March 8, 2019, the Company entered into a convertible bridge loan agreement (the “Share-Settled Loan”). The Share-Settled Loan bears interest at 4.99% per month, was due in 60 days on May 7, 2019 and is convertible into restricted common shares of the Company at the lender’s option at the market price per share less a 30% discount to market. The Company has accounted the Share-Settled Loan as share-settled debt. It is initially recognized at its fair value and accreted to its share-settled redemption value of $214,286 over the term of the debt. At June 30, 2019, the carrying value consists of principal of $150,000 and accumulated accretion of $64,286. The Share-Settled Loan was not repaid on May 7, 2019 and is in default.
Note 9 – CONVERTIBLE NOTES
As of June 30, 2019 and December 31, 2018, convertible loans payable consisted of the following:
Related Party Convertible Loans Payable
Third Party Convertible Loans Payable
| |
| |
| |
| |
| |
Note 10 – DERIVATIVE LIABILITIES
The Company records the fair value of the of the conversion price of the convertible debentures disclosed in Note 9 in accordance with ASC 815, Derivatives and Hedging. The fair value of the derivative was calculated using a multi-nominal lattice model. The fair value of the derivative liabilities is revalued on each balance sheet date with corresponding gains and losses recorded in the consolidated statement of operations. For the three and six months ended June 30, 2019, the Company recorded a gain on the change in fair value of derivative liability of $7,356,541 and $720,624, respectively (2018 – $6,013,778 and $397,517, respectively). As at June 30, 2019, the Company’s derivative liability had a balance of $1,717,939 (December 31, 2018 - $2,188,354).
The following inputs and assumptions were used to value the derivative liabilities outstanding at June 30, 2019 and December 31, 2018, assuming no dividend yield:
| 2019 | 2018 | |||||||
| Expected volatility | 218 - 350 | % | 180 - 447 | % | ||||
| Risk free interest rate | 1.92 - 2.44 | % | 1.63 - 2.59 | % | ||||
| Expected life (in years) | 0.25 - 1.0 | 0.1 - 1.0 |
A summary of the activity of the derivative liabilities is shown below:
Note 11 - LEASES
The Company leases certain assets under lease agreements. The lease liability consists of a single lease for office space. Upon adoption of Topic 842, on January 1, 2019 the Company recognized right-of-use assets of $51,203 and lease liabilities of $47,118. The difference between the recorded operating lease assets and lease liabilities is mainly due to the reclassification of prepaid rent deposits. As of June 30, 2019, the lease had a remaining term of 0.92 years. Right-of-use assets have been included within fixed assets, net, and lease liabilities have been included in operating lease liability on the Company’s interim condensed consolidated balance sheet as follows:
| Right-of-use asset | June 30, 2019 | |||
| Right-of-use asset | $ | 51,203 | ||
| Depreciation | (18,072 | ) | ||
| Total right-of-use asset | $ | 33,131 | ||
| Lease liability | June 30, 2019 | |||
| Lease liability | $ | 47,118 | ||
| Lease payments | (18,741 | ) | ||
| Interest | 2,513 | |||
| Change in foreign exchange rate | 1,805 | |||
| Total lease liability | $ | 32,695 | ||
| Current portion | $ | 32,695 | ||
| Long-term portion | - | |||
| Total lease liability | $ | 32,695 |
Operating lease liabilities are measured at the commencement date based on the present value of future lease payments. As the Company’s lease did not provide an implicit rate, the Company uses its incremental borrowing rate based on the information available at the commencement date in determining the present value of future payments. The Company used a weighted average discount rate of 11.98% in determining its lease liabilities. The discount rate was derived from the Company’s assessment of current borrowings.
Right-of-use assets include any prepaid lease payments and exclude any lease incentives and initial direct costs incurred. Lease expense for minimum lease payments is recognized on a straight-line basis over the lease term. The lease terms may include options to extend or terminate the lease if it is reasonably certain that the Company will exercise that option.
Interest on operating lease liabilities for the three and six months ended June 30, 2019 was $1,125 and $2,513, respectively. Total payments for principal and interest on operating lease liabilities for the three and six months ended June 30, 2019 were $9,288 and $18,741, respectively.
Future minimum lease payments to be paid by the Company as a lessee for operating leases as of June 30, 2019 for the next two years and thereafter are as follows:
| 2019 | $ | 18,919 | ||
| 2020 | 15,766 | |||
| Total future minimum lease payments | $ | 34,685 | ||
| Discount | (1,990 | ) | ||
| Total | $ | 32,695 |
Note 12 – MEZZANINE EQUITY
Authorized
5,000,000 shares of convertible, redeemable Series C preferred shares authorized, each having a par value of $0.001 per share. Each share of Series C preferred shares is convertible into 10 shares of common stock.
1,000,000 shares of convertible, redeemable Series D preferred shares authorized, each having a par value of $0.001 per share. Each share of Series D preferred shares is convertible into 5 shares of common stock.
5,000,000 shares of convertible, redeemable Series E preferred shares authorized, each having a par value of $0.001 per share. Each share of Series E preferred shares is convertible into 4 shares of common stock.
The Series C, D and E preferred shares are mandatorily redeemable upon a major transaction which includes a change in control. As a result, they are classified as mezzanine equity.
Mezzanine equity transactions
During the six months ended June 30, 2019, the Company did not have any mezzanine equity transactions.
Note 13 – PREFERRED STOCK
Authorized
3,000,000 shares of Series A preferred shares authorized, each having a par value of $0.001 per share.
10,000 shares of Series B convertible preferred shares authorized, each having a par value of $0.001 per share. Each share of Series B convertible preferred shares is convertible into 1,000,000 shares of common stock.
On March 26, 2019, the Company effected a reverse stock split of its shares of common stock on a four thousand (4,000) old for one (1) new basis. Preferred share amounts remained unchanged.
Preferred Equity Transactions
During the six months ended June 30, 2019, the Company did not have any preferred share equity transactions.
Note 14 – COMMON STOCK
Authorized
On March 26, 2019, the Company effected a reverse stock split of its shares of common stock on a four thousand (4,000) old for one (1) new basis. Upon effect of the reverse split, authorized capital decreased from 3,000,000,000 shares of common stock to 750,000 shares of common stock. Subsequently, on May 23, 2019, an increase in common shares to 150,000,000 was authorized, with a par value of $0.001. These consolidated financial statements give retroactive effect to such reverse stock split named above and all share and per share amounts have been adjusted accordingly, unless otherwise noted.
There were 787,569 and 634,971 shares of common stock of the Company issued and outstanding as of June 30, 2019 and December 31, 2018, respectively. Each share of common stock is entitled to one (1) vote.
Common Equity Transactions
During the six months ended June 30, 2019 the Company had the following transactions:
| ||
| Date Issued | Common Shares Issued (#) | Fair Value(1) | Converted Balance(2) | Gain (loss) on Conversion | ||||||||||||
| January 22, 2019 | 10,189 | $ | 28,527 | $ | 15,690 | $ | (12,837 | ) | ||||||||
| March 11, 2019 | 18,606 | 37,212 | 12,280 | (24,932 | ) | |||||||||||
| March 15, 2019 | 27,137 | 54,238 | 17,898 | (36,340 | ) | |||||||||||
| June 17, 2019 | 45,216 | 58,780 | 21,257 | (37,523 | ) | |||||||||||
| June 27, 2019 | 34,450 | 36,517 | 19,895 | (16,622 | ) | |||||||||||
| Total | 135,598 | $ | 215,274 | $ | 87,020 | $ | (128,254 | ) | ||||||||
Note 15 – RELATED PARTY TRANSACTIONS
As at June 30, 2019, the Company owed $216,579 ($283,632 CDN) (December 31, 2018 - $139,835 ($190,764 CDN)) to the President, CEO, and CFO of the Company for management fees and salaries, which has been recorded in trade and other payables. The amounts owed and owing are unsecured, non-interest bearing, and due on demand. During the six months ended June 30, 2019 the Company incurred $100,000 (2018 - $100,000) in salaries to the President, CEO, and CFO of the Company.
As at June 30, 2019, the Company owed $13,325 ($17,450 CDN) (December 31, 2018 - $12,791 ($17,450 CDN)) to a company controlled by the son of the President, CEO, and CFO of the Company for subcontractor services. The balance owing has been recorded in trade and other payables. The amount owing is unsecured, non-interest bearing, and due on demand.
Note 16 – COMMITMENTS
In the normal course of business, the Company indemnifies other parties, including customers, lessors, and parties to other transactions with the Company, with respect to certain matters. The Company has agreed to hold the other parties harmless against losses arising from a breach of representations or covenants, or out of intellectual property infringement or other claims made against certain parties. These agreements may limit the time within which an indemnification claim can be made and the amount of the claim. In addition, the Company has entered into indemnification agreements with its officers and directors, and the Company’s bylaws contain similar indemnification obligations to the Company’s agents. It is not possible to determine the maximum potential amount under these indemnification agreements due to the Company’s limited history with prior indemnification claims and the unique facts and circumstances involved in each particular agreement. Historically, payments made by the Company under these agreements have not had a material effect on the Company’s operating results, financial position, or cash flows.
Note 17 – CONTINGENCIES
On September 7, 2016, Chetu Inc. filed a Complaint for Damage in Florida to recover an unpaid invoice amount of $27,335 plus interest of $4,939. The invoice was not paid due to a service dispute. As at June 30, 2019, included in trade and other payables is $44,804 related to this unpaid invoice, interest and legal fees.
On May 24, 2017, the Company received a notice of default from Coastal Investment Partners LLC (“Coastal”), on three 8% convertible promissory notes issued by the Company in aggregate principal amount of $261,389 and commenced a lawsuit on June 12, 2017 in the United States District Court, Southern District of New York. Refer to Note 9. Coastal alleges that the Company failed to deliver shares of common stock underlying the Coastal notes, and thus giving rise to an event of default. Coastal seeks damages in excess of $250,000 for breach of contact damages, and legal fees incurred by Coastal with respect to the lawsuit. This action is still pending but management’s assessment is that an unfavorable outcome is not probable. As at June 30, 2019, the principal balance and accrued interest on this convertible note is included on the consolidated balance sheet under convertible notes payable.
On October 10, 2017, a vendor filed a complaint for breach of contract with Superior Court of the State of California. The complainant is alleging that it is contractually owed 462 shares of the Company’s common stock and is seeking damages of $270,000. In addition, a related vendor filed in the same filing a complaint for $72,000 as part of a consulting agreement the Company executed. No accrual has been recorded because the Company is of the opinion that no obligation exists since the vendors have not performed their contractual duties. The outcome of this breach is undecided and the company will defend its position if so required.
On April 9, 2018, the Company received a share-reserve increase letter from JSJ Investments Inc. (“JSJ”) pursuant to the terms of a 10% convertible promissory note issued to the Company in the principal amount of $135,000. On April 24, 2018, the Company received a notice of default from JSJ for failure to comply with the share-reserve increase and on April 30, 2018 demanded payment in full of the default amount totaling $172,845. On May 7, 2018, JSJ commenced a lawsuit in the United States District Court, District of Dallas County, Texas. JSJ alleges that the Company failed to comply with the share-reserve increase letter, thus giving rise to an event of default, and failed to pay the outstanding default amount due under the terms of the note. JSJ seeks damages in excess of $200,000 but not more than $1,000,000, which consists of the principal amount of the note, default interest, and legal fees incurred by JSJ with respect to the lawsuit. This action is still pending but as at June 30, 2019, JSJ has negotiated a reduced amount with a private investor. As at June 30, 2019, the principal balance and accrued interest on this convertible note is included on the consolidated balance sheet under convertible notes payable.
Note 18 – SUBSEQUENT EVENTS
Management has evaluated events subsequent to June 30, 2019, for transactions and other events that may require adjustment of and/or disclosure in such financial statements.
On July 24, 2019, the Company issued 37,900 shares of common stock pursuant to the conversion of outstanding convertible debentures and related accrued interest.

REPORT OF INDEPENDENT PUBLIC ACCOUNTING FIRM
To the Shareholders and Board of Directors of DSG Global, Inc.
Opinion on the Consolidated Financial Statements
We have audited the accompanying consolidated balance sheets of DSG Global Inc. and subsidiaries (the “Company”) as of December 31, 2018,2020 and 2019, and the related consolidated statements of operations, comprehensive loss, stockholders’ deficit, and cash flows for the yearyears then ended and the related notes (collectively referred to as the financial statements). In our opinion, the financial statements present fairly, in all material respects, the financial position of the Company as of December 31, 2018,2020 and 2019, and the results of its operations and its cash flows for the yearyears then ended in conformity with accounting principles generally accepted in the United States of America.
Basis for Opinion
These consolidated financial statements are the responsibility of the Company’s management. Our responsibility is to express an opinion on these consolidated financial statements based on our audits. We are required to be independent with respect to the Company in accordance with the relevant ethical requirements relating to our audit.
We conducted our audits in accordance with the auditing standards of the Public Company Accounting Oversight Board (United States) and in accordance with auditing standards generally accepted in the United States of America. Those standards require that we plan and perform the audit to obtain reasonable assurance about whether the consolidated financial statements are free of material misstatement, whether due to error or fraud. The Company is not required to have, nor were we engaged to perform, an audit of its internal control over financial reporting. As part of our audits, we are required to obtain an understanding of internal control over financial reporting but not for the purpose of expressing an opinion on the effectiveness of the Company’s internal control over financial reporting. Accordingly, we express no such opinion.
Our audit included performing procedures to assess the risks of material misstatement of the consolidated financial statements, whether due to error or fraud, and performing procedures that respond to those risks. Such procedures including examining, on a test basis, evidence regarding the amounts and disclosures in the consolidated financial statements. Our audits also included evaluating the accounting principles used and significant estimates made by management, as well as evaluating the overall presentation of the consolidated financial statements. We believe that our audits provide a reasonable basis for our opinion.
Emphasis of Matter
The accompanying financial statements have been prepared assuming that DSG Global Inc. will continue as a going concern. As discussed in Note 2 to the consolidated financial statements, the Company has a working capital deficit, and has incurred significant operating losses and negative cash flows from operations since inception. These factors raise substantial doubt about the Company’s ability to continue as a going concern. Management’s plans in regard to these matters are also discussed in Note 2 to the consolidated financial statements. The consolidated financial statements do not include any adjustments that might result from the outcome of this uncertainty.
| /s/ | |
| (formerly Buckley Dodds LLP) | |
| Vancouver, Canada | |
| We have served as the Company’s auditor since March 2019. |
We have served as the Company’s auditor since March 2019.


| 59 |
REPORT OF INDEPENDENT REGISTERED PUBLIC ACCOUNTING FIRM
To the Board of Directors and Stockholders of DSG Global, Inc.
Opinion on the Consolidated Financial Statements
We have audited the accompanying consolidated balance sheet of DSG Global, Inc. (the “Company”) as of December 31, 2017, and the related consolidated statements of operations and comprehensive loss, stockholders’ deficit, and cash flows for the year then ended and related notes (collectively, the “consolidated financial statements”). In our opinion, the consolidated financial statements present fairly, in all material respects, the financial position of the Company as at December 31, 2017, and the results of their operations and their cash flows for the year ended December 31, 2017, in conformity with accounting principles generally accepted in the United States of America.
Explanatory Paragraph Regarding Going Concern
The accompanying consolidated financial statements have been prepared assuming the Company will continue as a going concern. As discussed in Note 2 to the consolidated financial statements, the Company has a working capital deficit, and has incurred significant operating losses and negative cash flows from operations since inception. As at December 31, 2017, the Company has an accumulated deficit of $32,229,417. These factors raise substantial doubt about the Company’s ability to continue as a going concern. Management’s plans in regard to these matters are also discussed in Note 2 to the consolidated financial statements. The consolidated financial statements do not include any adjustments that might result from the outcome of this uncertainty.
Basis for Opinion
These consolidated financial statements are the responsibility of the Company’s management. Our responsibility is to express an opinion on the Company’s consolidated financial statements based on our audit. We are a public accounting firm registered with the Public Company Accounting Oversight Board (United States) (“PCAOB”) and are required to be independent with respect to the Company in accordance with the U.S. federal securities laws and the applicable rules and regulations of the Securities and Exchange Commission and the PCAOB.
We conducted our audit in accordance with the standards of the PCAOB. Those standards require that we plan and perform the audit to obtain reasonable assurance about whether the consolidated financial statements are free of material misstatement, whether due to fraud or error. The Company is not required to have, nor were we engaged to perform, an audit of its internal controls over financial reporting. As part of our audit, we are required to obtain an understanding of the Company’s internal controls over financial reporting, but not for the purpose of expressing an opinion on the effectiveness of the Company’s internal controls over financial reporting. Accordingly, we express no such opinion.
Our audit included performing procedures to assess the risks of material misstatement of the consolidated financial statements, whether due to fraud or error, and performing procedures that respond to those risks. Such procedures included examining, on a test basis, evidence regarding the amounts and disclosures in the consolidated financial statements. Our audit also included evaluating the accounting principles used and significant estimates made by management, as well as evaluating the overall presentation of the consolidated financial statements. We believe that our audit provides a reasonable basis for our opinion.
/s/ SATURNA GROUP CHARTERED PROFESSIONAL ACCOUNTANTS LLP
Saturna Group Chartered Professional Accountants LLP
We have served as the Company’s auditor since 2017.
Vancouver, Canada
April 18, 2018
DSG GLOBAL, INC.
AS AT DECEMBER 31, 20182020 AND 20172019
(Expressed in U.S. Dollars)
| December 31, 2018 | December 31, 2017 | December 31, 2020 | December 31, 2019 | |||||||||||||
| (revised – Note 17) | ||||||||||||||||
| ASSETS | ||||||||||||||||
| CURRENT ASSETS | ||||||||||||||||
| Cash | $ | 5,059 | $ | 5,488 | $ | 1,372,016 | $ | 25,494 | ||||||||
| Trade receivables, net | 139,400 | 23,736 | 27,874 | 74,793 | ||||||||||||
| Inventories, net of inventory allowance of $146,292 and $Nil, respectively | 141,296 | 8,929 | ||||||||||||||
| Lease receivable | 4,297 | - | ||||||||||||||
| Inventories, net of inventory allowance of $151,191 and $146,292, respectively | 254,362 | 140,943 | ||||||||||||||
| Prepaid expenses and deposits | 47,484 | 20,355 | 124,144 | 9,570 | ||||||||||||
| Receivable from related party | - | 1,034 | ||||||||||||||
| TOTAL CURRENT ASSETS | 333,239 | 59,542 | 1,782,693 | 250,800 | ||||||||||||
| NON-CURRENT ASSETS | ||||||||||||||||
| Intangible assets, net | 15,289 | 15,395 | ||||||||||||||
| Lease receivable | 38,559 | |||||||||||||||
| Fixed assets, net | 869 | 964 | 268,981 | 139,823 | ||||||||||||
| Equipment on lease, net | 3,316 | 14,814 | 496 | 1,457 | ||||||||||||
| TOTAL NON-CURRENT ASSETS | 19,474 | 31,173 | ||||||||||||||
| Intangible assets, net | 12,833 | 14,061 | ||||||||||||||
| TOTAL ASSETS | $ | 352,713 | $ | 90,715 | $ | 2,103,562 | $ | 406,141 | ||||||||
| LIABILITIES AND STOCKHOLDERS’ DEFICIT | ||||||||||||||||
| CURRENT LIABILITIES | ||||||||||||||||
| Trade and other payables | $ | 1,897,530 | $ | 3,328,851 | $ | 1,786,313 | $ | 2,345,333 | ||||||||
| Deferred revenue | 215,662 | 159,665 | 93,548 | 65,274 | ||||||||||||
| Warranty reserve | �� | - | 165,523 | |||||||||||||
| Convertible note payable to related party | 310,000 | 310,000 | ||||||||||||||
| Operating lease liability | 125,864 | 62,935 | ||||||||||||||
| Loans payable | 795,588 | 887,275 | 9,981 | 789,469 | ||||||||||||
| Derivative liability | 2,188,354 | 1,676,155 | - | 2,856,569 | ||||||||||||
| Convertible notes payable, net of unamortized discount of $213,461 and $301,360, respectively | 1,613,912 | 2,019,132 | ||||||||||||||
| Convertible notes payable | 513,328 | 2,507,653 | ||||||||||||||
| TOTAL CURRENT LIABILITIES | 7,021,046 | 8,546,601 | 2,529,034 | 8,627,233 | ||||||||||||
| Operating lease liability | 150,877 | 74,225 | ||||||||||||||
| Loans payable | 232,834 | - | ||||||||||||||
| TOTAL LIABILITIES | 2,912,745 | 8,701,458 | ||||||||||||||
Going concern (Note 2) | ||||||||||||||||
| Commitments (Note 15) | ||||||||||||||||
| Contingencies (Note 16) | ||||||||||||||||
| Commitments (Note 16) | ||||||||||||||||
| Contingencies (Note 17) | ||||||||||||||||
| Subsequent events (Note 20) | ||||||||||||||||
| MEZZANINE EQUITY | ||||||||||||||||
Redeemable preferred stock, (2018 - to be issued, 2017 – issued) | $ | 6,702,450 | $ | 5,286,731 | ||||||||||||
| Redeemable preferred stock, $0.001 par value, 24,010,000 shares authorized (2019 – 11,000,000), 1,024 issued and outstanding, 49,706 to be issued (2019 – 48,206 to be issued) | 2,239,936 | 33,807 | ||||||||||||||
| STOCKHOLDERS’ DEFICIT | ||||||||||||||||
| Preferred stock to be issued | 4,872,732 | |||||||||||||||
| Common stock, $0.001 par value, 750,000 shares authorized, (2017 - 500,000); 634,471 issued and outstanding (2017 - 25,485) | 634 | 25 | ||||||||||||||
| Preferred stock, $0.001 par value, 3,010,000 shares authorized (2019 – 3,010,000), 200,508 issued and outstanding (2019 - to be issued) | 2,084,680 | 200 | ||||||||||||||
| Common stock, $0.001 par value, 350,000,000 shares authorized, (2019 – 150,000,000); 95,765,736 issued and outstanding (2019 – 1,146,302) | 94,018 | 1,146 | ||||||||||||||
| Additional paid in capital, common stock | 22,415,121 | 17,613,525 | 43,299,937 | 28,097,710 | ||||||||||||
| Discounts on common stock | (69,838 | ) | - | (69,838 | ) | (69,838 | ) | |||||||||
| Common stock to be issued | 1,436,044 | 7,402,254 | ||||||||||||||
| Obligation to issue warrants | 163,998 | - | ||||||||||||||
| Other accumulated comprehensive income | 1,465,389 | 873,250 | 1,252,082 | 1,372,345 | ||||||||||||
| Accumulated deficit | (42,054,821 | ) | (32,229,417 | ) | (51,310,040 | ) | (45,132,941 | ) | ||||||||
| TOTAL STOCKHOLDERS’ DEFICIT | (13,370,783 | ) | (13,742,617 | ) | (3,049,119 | ) | (8,329,124 | ) | ||||||||
| TOTAL LIABILITIES AND STOCKHOLDERS’ DEFICIT | $ | 352,713 | $ | 90,715 | ||||||||||||
| TOTAL LIABILITIES MEZZANINE EQUITY AND STOCKHOLDERS’ DEFICIT | $ | 2,103,562 | $ | 406,141 | ||||||||||||
The accompanying notes are an integral part of the audited consolidated financial statements
| 60 |
DSG GLOBAL, INC.
CONSOLIDATED STATEMENTS OF OPERATIONS
FOR THE YEARS ENDED DECEMBER 31, 20182020 AND 20172019
(Expressed in U.S. Dollars)
| 2018 | 2017 | |||||||
| (revised – Note 17) | ||||||||
| Revenue | $ | 1,281,024 | $ | 1,100,577 | ||||
| Cost of revenue | 191,650 | 388,220 | ||||||
| Gross profit | 1,089,374 | 712,357 | ||||||
| Operating Expenses | ||||||||
| Compensation expense | 726,520 | 746,739 | ||||||
| General and administration expense | 1,561,000 | 1,414,983 | ||||||
| Warranty (recovery) expense | (89,037 | ) | 90,284 | |||||
| Bad debt | 61,059 | 75,540 | ||||||
| Depreciation and amortization expense | 13,649 | 29,681 | ||||||
| Total operating expense | 2,273,191 | 2,357,227 | ||||||
| Loss from operations | (1,183,817 | ) | (1,644,870 | ) | ||||
| Other Income (Expense) | ||||||||
| Foreign currency exchange | (59,050 | ) | 107,096 | |||||
| Unrealized gains (losses) on derivative instruments, net | 1,005,458 | (824,986 | ) | |||||
| Loss on extinguishment of debt | (6,889,665 | ) | (22,150 | ) | ||||
| Finance costs | (2,698,330 | ) | (1,731,921 | ) | ||||
| Total Other Expense | (8,641,587 | ) | (2,471,961 | ) | ||||
| Loss from continuing operations before income taxes | (9,825,404 | ) | (4,116,831 | ) | ||||
| Provision for income taxes | - | - | ||||||
| Net loss | (9,825,404 | ) | (4,116,831 | ) | ||||
| Net loss per share | ||||||||
| Basic and Diluted: | ||||||||
| Basic | $ | (28.88 | ) | $ | (372.67 | ) | ||
| Diluted | $ | (28.88 | ) | $ | (372.67 | ) | ||
| Weighted average number of shares used in computing basic and diluted net loss per share: | ||||||||
| Basic | 340,264 | 11,047 | ||||||
| Diluted | 340,264 | 11,047 | ||||||
| 2020 | 2019 | |||||||
| Revenue | $ | 900,482 | $ | 1,399,420 | ||||
| Cost of revenue | 409,793 | 948,273 | ||||||
| Gross profit | 490,689 | 451,147 | ||||||
| Operating expenses | ||||||||
| Compensation expense | 2,164,776 | 1,921,078 | ||||||
| General and administration expense | 3,371,325 | 886,592 | ||||||
| Bad debt | 17,525 | 65,802 | ||||||
| Depreciation and amortization expense | 6,759 | 4,218 | ||||||
| Total operating expense | 5,560,385 | 2,877,690 | ||||||
| Loss from operations | (5,069,696 | ) | (2,426,543 | ) | ||||
| Other income (expense) | ||||||||
| Foreign currency exchange | 24,900 | 37,224 | ||||||
| Change in fair value of derivative instruments | 3,054,034 | 271,704 | ||||||
| Gain (loss) on extinguishment of debt | (2,904,832 | ) | 659,999 | |||||
| Finance costs | (1,281,505 | ) | (1,620,504 | ) | ||||
| Total other expense | (1,107,403 | ) | (651,577 | ) | ||||
| Loss before income taxes | (6,177,099 | ) | (3,078,120 | ) | ||||
| Provision for income taxes | - | - | ||||||
| Net loss | (6,177,099 | ) | (3,078,120 | ) | ||||
| Net loss per share | ||||||||
| Basic and diluted: | ||||||||
| Basic | $ | (0.17 | ) | $ | (3.84 | ) | ||
| Diluted | $ | (0.17 | ) | $ | (3.84 | ) | ||
| Weighted average number of shares used in computing basic and diluted net loss per share: | ||||||||
| Basic | 35,744,303 | 801,993 | ||||||
| Diluted | 35,744,303 | 801,993 | ||||||
The accompanying notes are an integral part of the audited consolidated financial statements
| 61 |
DSG GLOBAL, INC.
CONSOLIDATED STATEMENTS OF COMPREHENSIVE LOSS
FOR THE YEARS ENDED DECEMBER 31, 20182020 AND 20172019
(Expressed in U.S. Dollars)
| 2018 | 2017 | |||||||
| (revised – Note 17) | ||||||||
| Net loss | $ | (9,825,404 | ) | $ | (4,116,831 | ) | ||
| Other comprehensive income | ||||||||
| Change in foreign currency translation adjustments | 592,139 | (423,402 | ) | |||||
| Comprehensive loss | (9,233,265 | ) | (4,540,233 | ) | ||||
| 2020 | 2019 | |||||||
| Net loss | $ | (6,177,099 | ) | $ | (3,078,120 | ) | ||
| Other comprehensive income (loss) | ||||||||
| Foreign currency translation adjustments | (120,263 | ) | (93,044 | ) | ||||
| Comprehensive loss | $ | (6,297,362 | ) | $ | (3,171,164 | ) | ||
The accompanying notes are an integral part of the audited consolidated financial statements
| 62 |
DSG GLOBAL, INC.
CONSOLIDATED STATEMENTS OF STOCKHOLDERS’ DEFICIT
AS AT DECEMBER 31, 20182020 AND 20172019
(Expressed in U.S. Dollars)
| Common Stock | ||||||||||||||||||||||||||||||||
| Shares | Amount | Additional paid in capital | Discount on common stock | Preferred Stock To be issued | Accumulated Comprehensive Income | Accumulated Deficit | Total Stockholders’ Deficit | |||||||||||||||||||||||||
| Balance, December 31, 2016 | 7,587 | $ | 7 | $ | 16,012,506 | $ | - | $ | - | $ | 1,296,652 | $ | (28,112,586 | ) | $ | (10,803,421 | ) | |||||||||||||||
| Shares issued for cash | 125 | - | 50,000 | - | - | - | - | 50,000 | ||||||||||||||||||||||||
| Shares issued for services | 563 | 1 | 562,499 | - | - | - | - | 562,500 | ||||||||||||||||||||||||
| Shares issued for commitment fee | 138 | - | 198,000 | - | - | - | - | 198,000 | ||||||||||||||||||||||||
| Shares issued on conversion of debt | 17,072 | 17 | 797,270 | - | - | - | - | 797,287 | ||||||||||||||||||||||||
| Share issuance costs | - | - | (6,750 | ) | - | - | - | - | (6,750 | ) | ||||||||||||||||||||||
| Net loss for the period | - | - | - | - | - | (423,402 | ) | (4,116,831 | ) | (4,540,233 | ) | |||||||||||||||||||||
| Balance, December 31, 2017 (revised – Note 17) | 25,485 | $ | 25 | $ | 17,613,525 | $ | - | $ | - | $ | 873,250 | $ | (32,229,417 | ) | $ | (13,742,617 | ) | |||||||||||||||
| Shares issued for cash | 12,501 | 12 | 81,647 | - | - | - | - | 81,659 | ||||||||||||||||||||||||
| Shares issued for services | 23,750 | 24 | 332,476 | - | - | - | - | 332,500 | ||||||||||||||||||||||||
| Shares issued for commission | 188 | - | 2,250 | - | - | - | - | 2,250 | ||||||||||||||||||||||||
| Shares issued on conversion of debt | 572,547 | 573 | 4,385,223 | (69,838 | ) | - | - | - | 4,315,958 | |||||||||||||||||||||||
| Preferred shares to be issued for restructure of debt | - | - | - | - | 4,872,732 | - | - | 4,872,732 | ||||||||||||||||||||||||
| Net loss for the period | - | - | - | - | - | 592,139 | (9,825,404 | ) | (9,233,265 | ) | ||||||||||||||||||||||
| Balance, December 31, 2018 | 634,971 | $ | 634 | $ | 22,415,121 | $ | (69,838 | ) | $ | 4,872,732 | $ | 1,465,389 | $ | (42,054,821 | ) | $ | (13,370,783 | ) | ||||||||||||||
| Common Stock | Preferred Stock | |||||||||||||||||||||||||||||||||||||||
| Shares | Amount | Additional paid in capital | Discount on common stock | To be issued | Obligation to issue warrants | Amount | Accumulated other comprehensive income | Accumulated deficit | Total stockholders’ deficit | |||||||||||||||||||||||||||||||
| Balance, December 31, 2018 | 634,471 | $ | 634 | $ | 22,415,121 | $ | (69,838 | ) | $ | - | $ | - | $ | 4,872,732 | $ | 1,465,389 | $ | (42,054,821 | ) | $ | (13,370,783 | ) | ||||||||||||||||||
| Shares to be issued for cash | - | - | - | - | 23,453 | - | - | - | - | 23,453 | ||||||||||||||||||||||||||||||
| Shares issued and to be issued for services | 72,295 | 72 | 63,365 | - | 1,224,000 | - | - | - | - | 1,287,437 | ||||||||||||||||||||||||||||||
| Shares issued on conversion of debt | 407,536 | 408 | 506,060 | - | - | - | - | - | - | 506,468 | ||||||||||||||||||||||||||||||
| Shares issued for debt settlement | 32,000 | 32 | 37,728 | - | - | - | - | - | - | 37,760 | ||||||||||||||||||||||||||||||
| Shares to be issued and warrants issued for restructure of preferred shares and debt | - | - | 5,075,436 | - | 6,154,801 | - | (4,872,732 | ) | - | - | 6,357,505 | |||||||||||||||||||||||||||||
| Preferred shares issued for services | - | - | - | - | - | - | 200 | - | - | 200 | ||||||||||||||||||||||||||||||
| Net loss for the period | - | - | - | - | - | - | - | (93,044 | ) | (3,078,120 | ) | (3,171,164 | ) | |||||||||||||||||||||||||||
| Balance, December 31, 2019 | 1,146,302 | $ | 1,146 | $ | 28,097,710 | $ | (69,838 | ) | $ | 7,402,254 | $ | - | $ | 200 | $ | 1,372,345 | $ | (45,132,941 | ) | $ | (8,329,124 | ) | ||||||||||||||||||
| Shares to be issued for cash | 191,865 | 192 | 99,839 | - | - | - | - | - | - | 100,031 | ||||||||||||||||||||||||||||||
| Shares issued and to be issued for services | 4,303,000 | 4,303 | 1,356,481 | - | - | - | - | - | - | 1,360,784 | ||||||||||||||||||||||||||||||
| Shares issued on conversion of debt | 52,937,999 | 52,941 | 3,524,064 | - | - | - | - | - | - | 3,577,005 | ||||||||||||||||||||||||||||||
| Shares issued and to be issued for debt settlement | 2,363,532 | 612 | 42,245 | - | 1,555,244 | - | - | - | - | 1,598,101 | ||||||||||||||||||||||||||||||
| Issuance of shares to be issued | 16,880,146 | 16,880 | 7,504,574 | - | (7,521,454 | ) | - | - | - | - | - | |||||||||||||||||||||||||||||
| Warrants issued for cash | - | - | 768,008 | - | - | - | - | - | - | 768,008 | ||||||||||||||||||||||||||||||
| Warrants issued for settlement of debt | - | - | 328,329 | - | - | - | - | - | - | 328,329 | ||||||||||||||||||||||||||||||
| Obligation to issue warrants | - | - | - | - | - | 163,998 | - | - | - | 163,998 | ||||||||||||||||||||||||||||||
| Preferred shares issued for services | - | - | - | - | - | 2,107,040 | - | - | 2,107,040 | |||||||||||||||||||||||||||||||
| Shares issued upon conversion of preferred shares | 17,942,892 | 17,944 | 1,578,687 | - | - | - | (22,560 | ) | - | - | 1,574,071 | |||||||||||||||||||||||||||||
| Net loss for the period | - | - | - | - | - | - | - | (120,263 | ) | (6,177,099 | ) | (6,297,362 | ) | |||||||||||||||||||||||||||
| Balance, December 31, 2020 | 95,765,736 | $ | 94,018 | $ | 43,299,937 | $ | (69,838 | ) | $ | 1,436,044 | $ | 163,998 | $ | 2,084,680 | $ 1,252,082, | $ | (51,310,040 | ) | $ | (3,049,119 | ) | |||||||||||||||||||
The accompanying notes are an integral part of the audited consolidated financial statements
| 63 |
DSG GLOBAL INC.
CONSOLIDATED STATEMENTS OF CASH FLOWS
FOR THE YEARS ENDED DECEMBER 31, 20182020 AND 20172019
(Expressed in U.S. Dollars)
| December 31, 2018 | December 31, 2017 | |||||||
| (revised – Note 17) | ||||||||
| Net loss | $ | (9,825,404 | ) | $ | (4,116,831 | ) | ||
| Adjustments to reconcile net loss to net cash used in operating activities: | ||||||||
| Depreciation and amortization | 13,649 | 29,681 | ||||||
| Change in inventory allowance | 146,292 | - | ||||||
| Depreciation included in cost of revenue | - | 5,359 | ||||||
| Non-cash financing costs | 261,220 | - | ||||||
| Accretion of discounts on convertible debt | 1,742,705 | 950,613 | ||||||
| Change in fair value of derivative liabilities | (1,005,458 | ) | 824,986 | |||||
| Reserve for bad debt | 75,951 | 75,540 | ||||||
| Shares issued for services | 334,750 | 760,500 | ||||||
| Loss on extinguishment of debt | 6,897,744 | 22,150 | ||||||
| (Increase) decrease in assets: | ||||||||
| Trade receivables, net | (216,538 | ) | (9,238 | ) | ||||
| Inventories | (278,659 | ) | 71,644 | |||||
| Prepaid expense and deposits | (27,129 | ) | 35,721 | |||||
| Related party receivable | 1,034 | (2,560 | ) | |||||
| Increase (decrease) in current liabilities: | ||||||||
| Trade payables and accruals | 568,132 | 719,127 | ||||||
| Warranty reserve | 55,997 | 53,808 | ||||||
| Deferred revenue | (165,523 | ) | 10,518 | |||||
| Net cash used in operating activities | (1,421,237 | ) | (568,972 | ) | ||||
| Cash flows from investing activities | ||||||||
| Purchase of fixed assets | (1,570 | ) | - | |||||
| Purchase of intangible assets | (1,100 | ) | - | |||||
| Net cash used in investing activities | (2,670 | ) | - | |||||
| Cash flows from financing activities | ||||||||
| Bank overdraft | - | (5,316 | ) | |||||
| Proceeds from issuing shares | 81,659 | 50,000 | ||||||
| Share issuance costs | - | (6,750 | ) | |||||
| Payments on notes payable | (45,000 | ) | - | |||||
| Proceeds from notes payable | 1,292,000 | 946,750 | ||||||
| Net cash provided by financing activities | 1,328,659 | 984,684 | ||||||
| Net increase in cash and cash equivalents | (95,248 | ) | 415,712 | |||||
| Effect of exchange rate changes on cash and cash equivalents | 94,819 | (410,224 | ) | |||||
| Cash and cash equivalents at beginning of period | 5,488 | - | ||||||
| Cash and cash equivalents at the end of the period | $ | 5,059 | $ | 5,488 | ||||
Supplemental Cash Flow Information (Note 19) | ||||||||
| December 31, 2020 | December 31, 2019 | |||||||
| Net loss | $ | (6,177,099 | ) | $ | (3,078,120 | ) | ||
| Adjustments to reconcile net loss to net cash used in operating activities: | ||||||||
| Depreciation and amortization | 6,759 | 4,218 | ||||||
| Change in inventory allowance | 28,820 | 2,096 | ||||||
| Non-cash financing costs | - | 235,177 | ||||||
| Accretion of discounts on debt | 792,378 | 751,691 | ||||||
| Change in fair value of derivative liabilities | (3,054,034 | ) | (271,704 | ) | ||||
| Bad debt expense | 17,525 | 65,802 | ||||||
| Shares issued and to be issued for services | 3,467,824 | 1,287,637 | ||||||
| Obligation to issue warrants | 163,998 | - | ||||||
| (Gain) loss on extinguishment of debt | 2,904,832 | (659,999 | ||||||
| Unrealized foreign exchange gain | (12,578 | ) | 40,173 | |||||
| Changes in non-cash working capital: | ||||||||
| Trade receivables, net | 30,091 | 42,456 | ||||||
| Inventories | (139,219 | ) | 4,919 | |||||
| Prepaid expense and deposits | (114,369 | ) | 35,240 | |||||
| Lease receivable | (42,856 | ) | - | |||||
| Trade payables and accruals | 664,239 | 797,785 | ||||||
| Deferred revenue | 26,875 | (111,456 | ) | |||||
| Operating lease liabilities | 36,728 | 5,308 | ||||||
| Net cash used in operating activities | (1,400,086 | ) | (848,777 | ) | ||||
| Cash flows from investing activities | ||||||||
| Purchase of fixed assets | (23,161 | ) | (1,383 | ) | ||||
| Net cash used in investing activities | (23,161 | ) | (1,383 | ) | ||||
| Cash flows from financing activities | ||||||||
| Proceeds from issuing shares and shares to be issued | 1,532,023 | 23,453 | ||||||
| Proceeds on warrants issued | 768,008 | - | ||||||
| Payments on notes payable | (386,996 | ) | - | |||||
| Proceeds from notes payable | 922,845 | 846,538 | ||||||
| Net cash provided by financing activities | 2,835,880 | 869,991 | ||||||
| Effect of exchange rate changes on cash | (66,111 | ) | 604 | |||||
| Net increase in cash | 1,346,522 | 20,435 | ||||||
| Cash at beginning of period | 25,494 | 5,059 | ||||||
| Cash at the end of the period | $ | 1,372,016 | $ | 25,494 | ||||
| Supplemental Cash Flow Information (Note 19) | ||||||||
The accompanying notes are an integral part of the audited consolidated financial statements
| 64 |
DSG GLOBAL, INC.
NOTES TO CONSOLIDATED FINANCIAL STATEMENTS
(Expressed in U.S. Dollars)
Note 1 –ORGANIZATION
DSG Global, Inc. (the “Company”) was incorporated under the laws of the State of Nevada on September 24, 2007. The Company was formed to option feature films and TV projects to be packaged for sale to movie studios and production companies.
On January 19, 2015, the Board of Directors approved an agreement and plan of merger to merge with wholly-owned subsidiary DSG Global Inc., a Nevada corporation, and affected a name change from Boreal Productions Inc. to DSG Global, Inc.
On April 13, 2015, the Company entered into a share exchange agreement with DSG Tag Systems Inc. (“DSG Tag”), now wholly-owned subsidiary of the Company, incorporated under the laws of the State of Nevada on April 17, 2008 and extra provincially registered in British Columbia, Canada in 2008. In March 2011, DSG TAG formed DSG Tag Systems International, Ltd. in the United Kingdom (“DSG UK”). DSG UK is a wholly owned subsidiary of DSG TAG.
The Company is a technology development company engaged in the design, manufacture, and marketing of fleet management solutions in the golf industry. The Company’s principal activities are the sale and rental of GPS tracking devices and interfaces for golf vehicles and related support services.
On April 13, 2015, the Company entered into a share exchange agreement with DSG Tag Systems Inc. (“DSG”), now a wholly-owned subsidiary of the Company, incorporated under the laws of the State of Nevada on April 17, 2008 and extra provincially registered in British Columbia, Canada in 2008. In March 2011, DSG formed DSG Tag Systems International, Ltd. in the United Kingdom (“DSG UK”). DSG UK is a wholly owned subsidiary of DSG.
On March 26, 2019, the Company effected a reverse stock split of its shares of common stock on a four thousand (4,000) old for one (1) new basis. Upon effect of the reverse split, authorized capital decreased from 3,000,000,000 shares of common stock to 750,000 shares of common stock, with a par value of $0.001. On May 23, 2019, the Company approved to increase its authorized common stock to 150,000,000, with a par value of $0.001. Shares of Preferred Stockpreferred stock remain unchanged. These consolidated financial statements give retroactive effect to such reverse stock split named above and all share and per share amounts have been adjusted accordingly, unless otherwise noted.
On September 15, 2020, the Company incorporated Imperium Motor Corp. (“Imperium”), under the laws of the State of Nevada on September 10, 2020, for which it subscribed to all authorized capital stock, 100 shares of Preferred Class A Stock, at a price of $0.001 per share. Imperium is a wholly owned subsidiary of the Company.
| 65 |
Note 2 – GOING CONCERN
These unaudited interim condensed consolidated financial statements have been prepared on a going concern basis, which implies the Company will continue to realize its assets and discharge its liabilities in the normal course of business. The continuation of the Company as a going concern is dependent upon the continued financial support from its shareholders and note holders, the ability of the Company to obtain necessary equity financing to continue operations, and ultimately the attainment of profitable operations.
The recent outbreak of the coronavirus, also known as “COVID-19”, has spread across the globe and is impacting worldwide economic activity. Conditions surrounding the coronavirus continue to rapidly evolve and government authorities have implemented emergency measures to mitigate the spread of the virus. The outbreak and the related mitigation measures may have an adverse impact on global economic conditions as well as on the Company’s business activities. The extent to which the coronavirus may impact the Company’s business activities will depend on future developments, such as the ultimate geographic spread of the disease, the duration of the outbreak, travel restrictions, business disruptions, and the effectiveness of actions taken in Canada and other countries to contain and treat the disease. These events are highly uncertain and as such, the Company cannot determine their financial impact at this time. While certain restrictions are presently in the process of being relaxed, it is unclear when the world will return to the previous normal, if ever. This may adversely impact the expected implementation of the Company’s plans moving forward. The Company has seen a decline in its revenues for the twelve months ending December 31, 2020 of approximately 35.7%, largely as a result of the challenges related to COVID-19.
As at December 31, 2018,2020, the Company has a working capital deficit of $6,687,807$746,341 and has an accumulated deficit of $42,054,821$51,310,040 since inception. Furthermore, the Company incurred a net loss of $9,825,404$6,177,099 and used $1,421,237$1,400,086 of cash flows for operating activities during the yeartwelve months ended December 31, 2018.2020. These factors raise substantial doubt regarding the Company’s ability to continue as a going concern. These audited consolidated financial statements do not include any adjustments to the recoverability and classification of recorded asset amounts and classification of liabilities that might be necessary should the Company be unable to continue as a going concern.
Note 3 – SUMMARY OF SIGNIFICANT ACCOUNTING POLICIES
Basis of Presentation
The consolidated financial statements of the Company have been prepared in accordance with accounting principles generally accepted in the United States (“U.S. GAAP”) and are expressed in U.S. dollars. These consolidated financial statements include the accounts of the Company and its wholly-ownedwholly owned subsidiaries. All significant intercompany accounts and transactions have been eliminated. Certain comparative information has been reclassified to conform with the financial statement presentation adopted in the current year.
Principles of Consolidation
The consolidated financial statements include the accounts of DSG Global Inc. and its subsidiary DSG Tag Systems, Inc.VTS and its wholly owned subsidiarysubsidiaries DSG UK and Imperium, collectively referred to as the Company.“Company”. All material intercompany accounts, transactions and profits were eliminated in the consolidated financial statements.
Use of Estimates
The preparation of consolidated financial statements in conformity with U.S. GAAP requires management to make estimates and assumptions that affect the reported amounts of assets and liabilities and the disclosure of contingent assets and liabilities at the date of the financial statements and the reported amounts of revenues and expenses during the reporting period. The Company regularly evaluates estimates and assumptions related to revenue recognition, the collectability of accounts receivable, valuation of inventory, useful lives and recoverability of long-lived assets, valuation of loans payable, fair value of convertible debentures, derivative liabilities, warranty reserves, stock-based compensation,the Company’s incremental borrowing rate, leases and deferred income tax asset valuation allowances. The Company bases its estimates and assumptions on current facts, historical experience and various other factors that it believes to be reasonable under the circumstances, the results of which form the basis for making judgments about the carrying values of assets and liabilities and the accrual of costs and expenses that are not readily apparent from other sources. The actual results experienced by the Company may differ materially and adversely from those estimates. Estimates and assumptions are reviewed periodically, and the effects of revisions are reflected in the consolidated financial statements in the period they are determined.
The Company’s policy for equipment requires judgment in determining whether the present value of future expected economic benefits exceeds capitalized costs. The policy requires management to make certain estimates and assumptions about future economic benefits related to its operations. Estimates and assumptions may change if new information becomes available. If information becomes available suggesting that the recovery of capitalized cost is unlikely, the capitalized cost is written off to the consolidated statement of operations.
The assessment of whether the going concern assumption is appropriate requires management to take into account all available information about the future, which is at least, but is not limited to, 12 months from the end ofdate the reporting period.financial statements are issued. The Company is aware that material uncertainties related to events or conditions may cast significantsubstantial doubt upon the Company’s ability to continue as a going concern.
Foreign Currency Translation
The Company’s functional and reporting currency is the U.S. dollar. The functional currency of DSG TAGVTS is inthe Canadian dollars.dollar. The functional currency of DSG UK is inthe British Pounds.pound. Monetary assets and liabilities denominated in foreign currencies are translated using the exchange rate prevailing at the balance sheet date. Non-monetary assets, liabilities, and items recorded in income arising from transactions denominated in foreign currencies are translated at rates of exchange in effect at the date of the transaction. Gains and losses arising on translation or settlement of foreign currency denominated transactions or balances are included in the determination of income.
The accounts of DSG TAGVTS and DSG UK are translated to U.S. dollars using the current rate method. Accordingly, assets and liabilities are translated into U.S. dollars at the period-end exchange rate while revenues and expenses are translated at the average exchange rates during the period. Related exchange gains and losses are included in a separate component of stockholders’ equity as accumulated other comprehensive income (loss).
| 66 |
Reportable Segment
The Company has one reportable segment. The Company’s activities are interrelated, and each activity is dependent upon and supportive of the other. Accordingly, all significant operating decisions are based on analysis of financial products provided as a single global business.
Revenue Recognition and Warranty Reserve
In May 2014, the FASBFinancial Account Standards Board (“FASB”) issued ASU No. 2014-09, Revenue from Contracts with Customers (“ASU 2014-09”). The Company adopted this standard on a modified retroactive basis on January 1, 2018. No financial statement impact occurred upon adoption.
Revenue from Contracts with Customers
Accounting Standards Update (“ASU”) No. 2014-09, Revenue from Contracts with Customers (“Topic 606”), became effective for the Company on January 1, 2018. The Company’s revenue recognition disclosure reflects its updated accounting policies that are affected by this new standard. The Company applied the “modified retrospective” transition method for open contracts for the implementation of Topic 606.Assales are and have been primarily from product sales, delivery and installation, and customer support services and the Company has no significant post-delivery obligations, this new standard did notresult in a material recognition of revenue on the Company’s accompanying consolidated financial statements for the cumulative impact of applying this new standard. The Company made no adjustments to its previously-reportedpreviously reported total revenues, as those periods continue to be presented in accordance with its historical accounting practices under Topic 605, Revenue Recognition.
The Company recognizes revenue when it satisfies a performance obligation by transferring control over a product to a customer. Revenue is measured based on the consideration the Company expects to receive in exchange for those products.In instances where final acceptance of the product is specified by the customer, revenue is deferred until all acceptance criteria have been met. Revenues are recognized underTopic 606 in a manner that reasonably reflects the delivery of its products and services to customers in return for expected consideration and includes the following elements:
| ● | executed contracts with the Company’s customers that it believes are legally enforceable; | |
| ● | identification of performance obligations in the respective contract; | |
| ● | determination of the transaction price for each performance obligation in the respective contract; | |
| ● | allocation the transaction price to each performance obligation; and | |
| ● | recognition of revenue only when the Company satisfies each performance obligation. |
Performance Obligations and Signification Judgments
The Company’s revenue streams can be categorized into the following performance obligations and recognition patterns:
| 1. | Sale, delivery and installation of Tag, Text and Infinity products, along with digital mapping and customer training. The Company recognizes revenue at a point in time when final sign-off on the installation is obtained from the General Manager and/or Director of Golf. | |
| 2. | Provision of internet connectivity, regular software updates, software maintenance and basic customer support service. The Company recognizes revenue over time, evenly over the term of the service. | |
| 3. | Sale and delivery of Fairway Rider products. The Company recognizes revenue at a point in time when control transfers to the customer. |
Transaction prices for performance obligations are explicitly outlined in relevant agreements, therefore, the Company does not believe that significant judgments are required with respect to the determination of the transaction price, including any variable consideration identified.
Warranty Reserve
The Company accruedaccrues for warranty costs, sales returns, and other allowances based on its historical experience. During the fiscal year endingyears ended December 31, 2018,2020 and 2019, the Company determined it no longer requireddid not provide a warranty reverse due to changes in the warranty policies on new products.for any of its products sold during those periods. The warranty reserve was $Nil and $165,523 as at December 31, 20182020 and 2017, respectively.2019.
Research and Development
Research and development expenses include payroll, employee benefits, and other headcount-related expenses associated with product development. Research and development expenses also include third-party development and programming costs, localization costs incurred to translate software for international markets, and the amortization of purchased software code and services content. Such costs related to software development are included in research and development expense until the point that technological feasibility is reached. Research and development is expensed and is included in operating expenses.
Income Taxes
The Company accounts for income taxes using the asset and liability method in accordance with ASC 740, Income Taxes. The asset and liability method provides that deferred income tax assets and liabilities are recognized for the expected future tax consequences of temporary differences between the financial reporting and tax bases of assets and liabilities, and for operating loss and tax credit carryforwards. Deferred income tax assets and liabilities are measured using the currently enacted tax rates and laws that will be in effect when the differences are expected to reverse. The Company records a valuation allowance to reduce deferred income tax assets to the amount that is believed more likely than not to be realized.
TheAs of December 31, 2020 and 2019, the Company hasdid not recordedhave any amounts recorded pertaining to uncertain tax positions. The Company recognizes interest and penalties related to uncertain tax positions in general and administrative expense. The Company did not incur any penalties or interest during the years ended December 31, 2020 and 2019. On December 22, 2017, the U.S. enacted the Tax Cuts and Jobs Act (“the Tax Act”) which significantly changed U.S. tax law. The Tax Act lowered the Company’s statutory federal income tax rate from a maximum of 39% to a rate of 21% effective January 1, 2018. The Company has deferred tax losses and assets and they were adjusted as a result of the change in tax law reducing the federal income tax rate. The Company’s tax years 2015 and forward remain open.
Concentration of Credit Risk
Financial instruments that potentially subject the Company to concentrations of credit risk are cash, and trade receivables arising from its normal business activities. The Company places its cash in what it believes to be credit-worthy financial institutions. The Company has a diversified customer base, most of which are in Canada, United States and the United Kingdom. The Company controls credit risk related to trade receivables through credit approvals, credit limits and monitoring procedures. The Company routinely assesses the financial strength of its customers and, based upon factors surrounding the credit risk, establishes an allowance, if required, for uncollectible accounts and, as a consequence, believes that its accounts receivable credit risk exposure beyond such allowance is limited.
| 67 |
Risks and Uncertainties
The Company is subject to risks from, among other things, competition associated with the industry in general, other risks associated with financing, liquidity requirements, rapidly changing customer requirements, limited operating history, foreign currency exchange rates and the volatility of public markets.
Contingencies
Certain conditions may exist as of the date the consolidated financial statements are issued, which may result in a loss to the Company, but which will only be resolved when one or more future events occur or fail to occur. The Company’s management and legal counsel assess such contingent liabilities, and such assessment inherently involves judgment. In assessing loss contingencies related to legal proceedings that are pending against the Company or un-asserted claims that may result in such proceedings, the Company’s legal counsel evaluates the perceived merits of any legal proceedings or un-asserted claims as well as the perceived merits of the amount of relief sought or expected to be sought.
If the assessment of a contingency indicates it is probable that a material loss has been incurred and the amount of the liability can be estimated, then the estimated liability would be accrued in the Company’s consolidated financial statements. If the assessment indicates that a potential material loss contingency is not probable but is reasonably possible, or is probable but cannot be estimated, then the nature of the contingent liability, together with an estimate of the range of possible loss if determinable and material would be disclosed. Loss contingencies considered to be remote by management are generally not disclosed unless they involve guarantees, in which case the guarantee would be disclosed.
Cash and Cash Equivalents
Cash and equivalents include cash in hand and cash in demand deposits, certificates of deposit and all highly liquid debt instruments with original maturities of three months or less. At December 31, 20182020 and 2017,2019, there were no uninsured balances for accounts in Canada, the United States and the United Kingdom. The Company has not experienced any losses in such accounts and believes it is not exposed to any risks on its cash in bank accounts. At December 31, 2020 and 2019, the Company did not hold any cash equivalents.
Accounts Receivable
All accounts receivable under standard terms are due thirty (30) days from the date billed. If the funds are not received within thirty (30) days, the customer is contacted to arrange payment. The Company uses the allowance method to account for uncollectable accounts receivable. The allowance for doubtful accounts as of December 31, 2018 and 2017 was $44,814 and $28,637, respectively.
Financing Receivables and Guarantees
The Company provides financing arrangements, including operating leases and financed service contracts for certain qualified customers. Lease receivables primarily represent sales-type and direct-financing leases. Leases typically have two- to three-year terms and are collateralized by a security interest in the underlying assets. The Company makes an allowance for uncollectible financing receivables based on a variety of factors, including the risk rating of the portfolio, macroeconomic conditions, historical experience, and other market factors. At December 31, 20182020 and 20172019 management determined that there was no allowance necessary. The Company also provides financing guarantees, which are generally for various third-party financing arrangements to channel partners and other customers. The Company could be called upon to make payment under these guarantees in the event of nonpayment to the third party. As at December 31, 2018,2020 and 2019, no financing receivables are outstanding.
| 68 |
Advertising Costs
The Company expenses all advertising costs as incurred. Advertising and marketing costs were $404,391$2,043,735 and $581,653$73,281 for the years ended December 31, 20182020 and 2017,2019, respectively.
Inventory
Inventories are valued at the lower of cost or net realizable value. Cost is determined using the first-in-first-out basis for finished goods. Net realizable value is determined on the basis of anticipated sales proceeds less the estimated selling expenses. Management compares the cost of inventories with the net realizable value and an allowance is made to write down inventories to net realizable value, if lower. The inventory allowance as at December 31, 2018 and 2017 was $146,292 and $Nil, respectively.
Fixed Assets and Equipment on Lease
Fixed assets and equipment on lease are stated at cost less accumulated depreciation. Fixed assets and equipment on lease are depreciated using the straight-line method over the shorter of the estimated useful life of the asset or the lease term. The estimated useful lives of fixed assets are generally as follows:
| Furniture and equipment | 5-years straight-line |
| Vehicles | 5-years straight-line |
| Computer equipment | 3-years straight-line |
| Equipment on lease | 5-years straight-line |
Intangible Assets
Intangible assets are stated at cost less accumulated amortization and are comprised of patents. The patents are amortized straight-line over the estimated useful life of 1720 years and are reviewed annually for impairment.
Impairment of Long-Lived Assets
The Company reviews long-lived assets such as equipment, equipment on lease, and intangible assets with finite useful lives for impairment whenever events or changes in circumstance indicate that the carrying amount may not be recoverable. If the total of the expected undiscounted future cash flows is less than the carrying value of the asset, a loss is recognized for the excess of the carrying amount over the fair value of the asset.
Financial Instruments and Fair Value Measurements
For certain of the Company’sThe Company analyzes all financial instruments including cash, trade receivables, trade and other payables, accruedwith features of both liabilities and other short-term debt, the carrying amounts approximate their fair values due to their short maturities. equity under ASC Topic 480, “Distinguishing Liabilities from Equity,” and ASC Topic 815 “Derivatives and Hedging”.
ASC Topic 820, “Fair Value Measurements and Disclosures,” requires disclosure of the fair value of financial instruments held by the Company. ASC Topic 825, “Financial Instruments,” defines fair value, and establishes a three-level valuation hierarchy for disclosures of fair value measurement that enhances disclosure requirements for fair value measures. The carrying amounts reported in the consolidated balance sheets for receivables and current liabilities each qualify as financial instruments and are a reasonable estimate of their fair values because of the short period of time between the origination of such instruments and their expected realization and their current market rate of interest. The three levels of valuation hierarchy are defined as follows:
| 69 |
Level 1
Level 1 applies to assets or liabilities for which there are quoted prices in active markets for identical assets or liabilities.
Level 2
Level 2 applies to assets or liabilities for which there are inputs other than quoted prices that are observable for the asset or liability such as quoted prices for similar assets or liabilities in active markets; quoted prices for identical assets or liabilities in markets with insufficient volume or infrequent transactions (less active markets); or model-derived valuations in which significant inputs are observable or can be derived principally from, or corroborated by, observable market data.
Level 3
Level 3 applies to assets or liabilities for which there are unobservable inputs to the valuation methodology that are significant to the measurement of the fair value of the assets or liabilities.
The Company’s financial instruments consist principally of cash, trade receivables, amounts due from and to related parties, trade and other payables, operating lease liabilities, convertible note payable to related party, loans payable, derivative liabilities and convertible notes payable.
Except for cash and derivative liabilities, the Company’s financial instruments’ carrying amounts, excluding any unamortized discounts, approximate their fair values due to their short term to maturity. The Company analyzes all financial instruments with featuresfair value of bothlong-term operating lease liabilities approximates their carrying value due to minimal changes in interest rates and equity under ASC Topic 480, “Distinguishing Liabilities from Equity,”the Company’s credit risk since initial recognition. Cash and ASC Topic 815 “Derivatives and Hedging”.
The following table represents assets andderivative liabilities that are measured and recognized at fair value as of December 31, 2018,based on a recurring basis:
| Level 1 | Level 2 | Level 3 | ||||||||||
| $ | $ | $ | ||||||||||
| Cash | 5,059 | - | - | |||||||||
| Derivative liabilities | - | 2,188,354 | - | |||||||||
| Total | 5,059 | 2,188,354 | - | |||||||||
The recorded values oflevel 1 and level 2 inputs, respectively, for all other financial instruments approximate their current fair values because of their nature and respective maturity dates or durations.
During the year ended December 31, 2018, the Company recognized a gain on the change in fair value of derivative liabilities of $1,005,458 (2017 – loss of $824,986).periods presented.
Loss per Share
The Company computes net income (loss) per share in accordance with ASC 260, Earnings per Share. ASC 260 requires presentation of both basic and diluted earnings per share (“EPS”) on the face of the consolidated statement of operations. Basic EPS is computed by dividing net income (loss) available to common shareholders (numerator) by the weighted average number of shares outstanding (denominator) during the period. Diluted EPS gives effect to all dilutive potential common shares outstanding during the period using the treasury stock method and convertible preferred stock using the if-converted method. In computing diluted EPS, the average stock price for the period is used in determining the number of shares assumed to be purchased from the exercise of stock options or warrants. Diluted EPS excludes all dilutive potential shares if their effect is anti-dilutive. As at December 31, 2018,2020, the Company had 35,173,897 (201730,083,230 (2019 – 146,259)13,287,548) potentially dilutive shares outstanding.
| 70 |
Stock-Based Compensation
The Company records stock-based compensation in accordance with ASC 718, “Compensation – Stock Compensation”, using the fair value method. All transactions in which goods or services are the consideration received for the issuance of equity instruments are accounted for based on the fair value of the consideration received or the fair value of the equity instrument issued, whichever is more reliably measurable.
The Company uses the Black-Scholes option pricing model to calculate the fair value of stock-based awards. This model is affected by the Company’s stock price as well as assumptions regarding a number of subjective variables. These subjective variables include but are not limited to the Company’s expected stock price volatility over the term of the awards, and actual and projected employee stock option exercise behaviors. The value of the portion of the award that is ultimately expected to vest is recognized as an expense in the consolidated statement of operations over the requisite service period. As atDuring the years ended December 31, 2018,2020 and 2019 there was no stock-based compensation.
Leases
The Company accounts for leases in accordance with ASC 842 “Leases”.
Lessee Arrangements
The Company determines if an arrangement is a lease at inception. Operating and financing right-of-use assets and lease liabilities are included within fixed assets on the consolidated balance sheets. Right-of-use assets represent our right to use an underlying asset for the lease term and lease liabilities represent our obligation to make lease payments arising from the lease. Right-of-use assets and liabilities are recognized at commencement date based on the present value of lease payments over the lease term. The Company uses its incremental borrowing rate, based on the information available at the commencement date, in determining the present value of future lease payments. Right-of-use assets include any prepaid lease payments and exclude any lease incentives and initial direct costs incurred. Operating lease expenses are recognized on a straight-line basis over the term of the lease, consisting of interest accrued on the lease liability and depreciation of the right-of-use asset. The lease terms may include options to extend or terminate the lease if it is reasonably certain the Company will exercise that option.
Lessor Arrangements
The Company determines if an arrangement is a lease at inception. The Company then determines whether to classify the lease as a sales-type or direct financing lease. At commencement date, a lessor shall derecognize the underlying asset and recognize the net investment in the lease, selling profit or loss arising from the lease, and initial direct directs as an expense if the fair value of the underlying asset is different from it carrying amount. The lease receivable (or net investment in the lease) is included on the consolidated balance sheets. The lease receivable amount is recognized based on the present value of lease payments over the lease term and the present value of the unguaranteed residual asset, except when the lease is a direct financing lease, whereby the net investment in the lease should be reduced by the amount of any selling profit. The unguaranteed residual asset is the amount the lessor expects to derive from the underlying asset following the end of the lease term. The Company uses the rate implicit in the lease agreement at the date of commencement, in determining the present value of the future lease payments and unguaranteed residual asset. Interest income is recognized over the term of the lease and lease payments are recognized against the lease receivable balance when received. Currently, the Company only has sales-type operating leases.
Reclassification
Certain prior year amounts have been reclassified for consistency with the current period presentation. These reclassifications had no effect on the reported results of operations or cash flow.
Recently Adopted Accounting Pronouncements
In May 2014, the FASB issued ASU No. 2014-09,Revenue from Contracts with Customers. ASU 2014-09 is a comprehensive revenue recognition standard that will supersede nearly all existing revenue recognition guidance under current U.S. GAAP and replace it with a principle-based approach for determining revenue recognition. ASU 2014-09 will require that companies recognize revenue based on the value of transferred goods or services as they occur in the contract. The ASU also will require additional disclosure about the nature, amount, timing and uncertainty of revenue and cash flows arising from customer contracts, including significant judgments and changes in judgments and assets recognized from costs incurred to obtain or fulfill a contract. ASU 2014-09 is effective for interim and annual periods beginning after December 15, 2017. Early adoption is permitted only in annual reporting periods beginning after December 15, 2016, including interim periods therein. Entities will be able to transition to the standard either retrospectively or as a cumulative-effect adjustment as of the date of adoption. The Company adopted this ASU beginning on January 1, 2018 and used the modified retrospective method of adoption. The adoption of this ASU did not have a material impact on the Company’s consolidated financial statements and disclosures.
Recently Issued Accounting Pronouncements
Applicable for fiscal years beginning after December 15, 2018:
In February 2016, the Financial Accounting Standards Board, or FASB, issued ASUestablished Topic 842, Leases, by issuing Accounting Standards Update (“ASU”) No. 2016-02,“Leases (Topic 842).” This accounting standard seeks which requires lessors to increase transparencyclassify leases as a sales-type, direct financing, or operating lease and comparability among organizations by recognizing lease assets and lease liabilities on the balancerequires lessees to recognize leases on-balance sheet and disclosingdisclose key information about leasing arrangements. Current U.S. GAAP does not require lessees to recognize assets and liabilities arising from operating leases on the balance sheet. This standard also provides guidance from the lessees’ perspective on how to determine if a lease is an operating lease or a financing lease and the differences in accounting for each. In January 2018, the FASB issuedTopic 842 was subsequently amended by ASU No. 2018-01, which allowsLand Easement Practical Expedient for an entityTransition to elect an optional transition practical expedient for land easements that exist or expired before adoption of Topic 842. The adoption of this standard is required for interim842; ASU No. 2018-10, Codification Improvements to Topic 842, Leases; and fiscal periods beginning after December 15, 2018 and it is required to be applied using the modified retrospective approach.ASU No. 2018-11, Targeted Improvements.
The Company will adopt thisadopted the new standard effective January 1, 2019 and is currently evaluatingelected to use the impact of the above standard on its consolidated financial statements.modified retrospective for transition. The Company expectselected the following practical expedients:
| ● | Transition method practical expedient – permits the Company to use the effective date as the date of initial application. Upon adoption, the Company did not have a cumulative-effect adjustment to the opening balance of retained earnings. Financial information and disclosures for periods before January 1, 2019 were not updated. |
| ● | Package of practical expedients – permits the Company not to reassess under the new standard its prior conclusions about lease identification, lease classification, and initial direct costs. This allowed the Company to continue classifying its leases at transition in substantially the same manner. |
| ● | Single component practical expedient – permits the Company to not separate lease and non-lease components of leases. Upon transition, rental income, expense reimbursement, and other were aggregated into a single line within rental and other revenues on the condensed consolidated statement of operations. |
| ● | Short-term lease practical expedient – permits the Company not to recognize leases with a term equal to or less than 12 months. |
Lessee Accounting
The new standard requires lessees to recognize a right-of-use asset and lease liability on the balance sheet for all leases with a term longer than 12 months. Leases are classified as finance or operating at inception, with classification affecting the pattern and recording of expenses in the statement of operations. Upon transition the Company recognized lease assets and lease liabilities principally for its office lease. When measuring lease liabilities for leases that were classified as operating leases, the Company discounted lease payments using its incremental borrowing rate at January 1, 2019. The weighted average incremental borrowing rate applied was 11.98%. Refer to Notes 5 and 11.
Lessor Accounting
The new standard remained largely unchanged from that applied under previous GAAP. The majority of operating leases should remain classified as operating leases and should continue to recognize lease income on its consolidated balance sheets pursuanta generally straight-line basis over the lease term. The new standard made changes to its operating lease commitment, see Note 15.lessor accounting guidance to align with lessee accounting guidance and Topic 606 Revenue Recognition.
In March 2017, the “FASB”June 2016, FASB issued ASU 2017-08 “2016-13, Receivables – Nonrefundable FeesMeasurement of Credit Loss on financial Instruments. ASU 2016-13 replaces the current incurred loss impairment methodology with the expected credit loss impairment model, which requires consideration of a broader range of reasonable and Other Costs (Subtopic 310-20) – Premium Amortizationsupportable information to estimate expected credit losses over the life of the instrument instead of only when losses are incurred. This standard applies to financial assets measured at amortized cost basis and investments in leases recognized by the lessor. The Company adopted ASU 2016-13 on Purchased Callable Debt Securities” an amendment to shortenJanuary 1, 2020 with no impact on the amortization period for certain callable debt securities held at a premium to the earliest call date. The amendments do not require an accounting change for securities held at a discount.consolidated financial statements.
In July 2017, the FASB issued ASU 2017-11 “Earnings Per Share (Topic 260), Distinguishing Liability from Equity (Topic 480), and Derivatives and Hedging (Topic 815) – (i) Accounting for Certain Financial Instruments with Down Round Features (ii) Replace of the Indefinite Deferral for Mandatorily Redeemable Financial Instruments.” The amendments in (i) change the classification analysis of certain equity-linked financial instruments (or embedded features) with down round features and to help clarify existing disclosure requirements. The amendments in (ii) characterize the indefinite deferral of certain provisions and do not have an accounting effect.
The Company is currently evaluating the impact of the above standards on its consolidated financial statements. Other recent accounting pronouncements issued by the FASB, including its Emerging Issues Task Force, the American Institute of Certified Public Accountants, and the Securities and Exchange Commission did not or are not believed by management to have a material impact on the Company’s consolidated financial statements.
Reclassification and RestatementRecently Issued Accounting Pronouncements
Certain prior year amounts have been reclassifiedApplicable for consistency with the current period presentation. Certain prior year amounts have been restated, refer to Note 17.fiscal years beginning after December 15, 2020:
In August 2020, FASB issued ASU 2020-06, Accounting for Convertible Instruments and Contracts in an Entity’s Own Equity. ASU 2020-06 amends the guidance for convertible instruments and contract in an entity’s own equity by simplifying the accounting in order to reduce the unnecessarily complex and difficult nature of the guidance and its inconsistent application which has been the subject of a significant number of restatements. This standard applies to entities who issue convertible instruments and/or contracts in an entity’s own equity. The amendments are effective for fiscal years beginning after December 15, 2023. Early adoption is permitted, but no earlier than fiscal years beginning after December 15, 2020 and should be adopted as of the beginning of its annual fiscal year.
The Company is currently evaluating the impact of the above standard on its consolidated financial statements. Other recent accounting pronouncements issued by FASB, including its Emerging Issues Task Force, the American Institute of Certified Public Accountants, and the Securities and Exchange Commission did not or are not believed by management to have a material impact on the Company’s consolidated financial statements.
| 71 |
Note 4 – TRADE RECEIVABLES
As of December 31, 2018,2020 and 2017,2019, trade receivables consists of the following:
| December 31, 2018 | December 31, 2017 | |||||||
| Accounts receivables | $ | 184,214 | $ | 52,373 | ||||
| Allowance for doubtful accounts | (44,814 | ) | (28,637 | ) | ||||
| Total trade receivables, net | $ | 139,400 | $ | 23,736 | ||||
| December 31, 2020 | December 31, 2019 | |||||||
| Accounts receivables | $ | 44,296 | $ | 82,927 | ||||
| Allowance for doubtful accounts | (16,422 | ) | (8,134 | ) | ||||
| Total trade receivables, net | $ | 27,874 | $ | 74,793 | ||||
Note 5 – FIXED ASSETS AND EQUIPMENT ON LEASE
As of December 31, 2018,2020 and December 31, 2017,2019, fixed assets consisted of the following:
| December 31, 2018 | December 31, 2017 | December 31, 2020 | December 31, 2019 | |||||||||||||
| Furniture and equipment | $ | 20,509 | $ | 17,914 | $ | 2,342 | $ | - | ||||||||
| Computer equipment | 28,460 | 26,435 | 28,804 | 27,025 | ||||||||||||
| Vehicles | 19,619 | - | ||||||||||||||
| Right-of-use assets | 302,477 | 178,202 | ||||||||||||||
| Accumulated depreciation | (48,100 | ) | (43,385 | ) | (84,261 | ) | (65,404 | ) | ||||||||
| $ | 869 | $ | 964 | $ | 268,981 | $ | 139,823 | |||||||||
As of December 31, 2018,2020 and December 31, 2017,2019, equipment on lease consisted of the following:
| December 31, 2018 | December 31, 2017 | December 31, 2020 | December 31, 2019 | |||||||||||||
| Tags | $ | 120,998 | $ | 124,314 | $ | 129,533 | $ | 126,817 | ||||||||
TextInfinity 7” | 26,743 | 27,475 | ||||||||||||||
Infinity XL 12” | 22,152 | 22,759 | ||||||||||||||
| Text | 28,629 | 28,029 | ||||||||||||||
| Infinity/Touch | 23,716 | 23,218 | ||||||||||||||
| Accumulated depreciation | (166,577 | ) | (159,734 | ) | (181,382 | ) | (176,607 | ) | ||||||||
| $ | 3,316 | $ | 14,814 | $ | 496 | $ | 1,457 | |||||||||
For the year ended December 31, 2018 and 2017,2020, total depreciation expense for fixed assets and leased equipment on lease was $12,443$5,531 (2019 - $2,990) and $33,855, respectively, of which $Nilis included in general and $5,359administration expense. For the year ended December 31, 2020, total depreciation for right-of-use assets was recorded$68,218 (2019 - $39,671) and is included in cost of revenue, respectively.general and administration expense as operating lease expense.
Note 6 – INTANGIBLE ASSETS
Asof December 31, 2018,2020 and 2017,2019, intangible assets consisted of the following:
| December 31, 2018 | December 31, 2017 | |||||||
| Intangible Asset - Patents | $ | 22,353 | $ | 21,253 | ||||
| Accumulated Amortization | (7,064 | ) | (5,858 | ) | ||||
| $ | 15,289 | $ | 15,395 | |||||
| December 31, 2020 | December 31, 2019 | |||||||
| Intangible asset - Patents | $ | 22,353 | $ | 22,353 | ||||
| Accumulated amortization | (9,520 | ) | (8,292 | ) | ||||
| $ | 12,833 | $ | 14,061 | |||||
The estimated useful life of the Patent is twenty years. Patents are amortized on a straight-line basis.basis over their estimated useful life of 20 years. For the year ended December 31, 2018 and 2017,2020, total amortization expense for intangible assets was $1,206 and $1,185, respectively.$1,228 (2019 - $1,228).
Note 7 – TRADE AND OTHER PAYABLES
As of December 31, 2018,2020, and 2017,2019, trade and other payables consist of the following:
| December 31, 2018 | December 31, 2017 | |||||||
| Accounts payable | $ | 978,770 | $ | 1,121,841 | ||||
| Accrued expenses | 245,737 | 255,542 | ||||||
| Accrued interest | 686,354 | 1,889,537 | ||||||
| Other liabilities | (13,331 | ) | 61,931 | |||||
| Total payables | $ | 1,897,530 | $ | 3,328,851 | ||||
| December 31, 2020 | December 31, 2019 | |||||||
| Accounts payable and accrued expenses | $ | 1,519,379 | $ | 1,334,685 | ||||
| Accrued interest | 148,682 | 992,755 | ||||||
| Other liabilities | 118,252 | 17,893 | ||||||
| Total trade and other payables | $ | 1,786,313 | $ | 2,345,333 | ||||
Note 8 – LOANS PAYABLE
As of December 31, 2018,2020 and 2017,2019, loans payable consisted of the following:
| Loans Payable | December 31, 2018 | December 31, 2017 | ||||||
| Unsecured, due on demand, interest at 15% per annum | $ | 183,258 | $ | 199,283 | ||||
| Unsecured, due on demand, interest at 36% per annum | 44,830 | 48,750 | ||||||
| Unsecured, loan payable, due on demand, interest at 18% per annum | 317,500 | 317,500 | ||||||
| Unsecured, loan payable, fee for services payable on the original loan amount of 5% by May 6, 2016, 10% payable by June 5, 2016, or 20% payable by July 5, 2016, non-interest bearing, due on demand(1) | - | 71,742 | ||||||
| Unsecured, loan payable, interest 10% per annum, with a minimum interest amount of $25,000, due on demand. | 250,000 | 250,000 | ||||||
| $ | 795,588 | $ | 887,275 | |||||
| December 31, 2020 | December 31, 2019 | |||||||
| Unsecured loan payable, due on demand, interest at 18% per annum | $ | - | $ | 317,500 | ||||
| Unsecured loan payable, due on demand, interest 10% per annum, with a minimum interest amount of $25,000 | - | 250,000 | ||||||
| Unsecured share-settled debt, due on May 7, 2019, non-interest bearing(a) | - | 214,286 | ||||||
| Unsecured loan payable in the amount of CDN$10,000, due on demand, non-interest bearing | - | 7,683 | ||||||
| Unsecured loan payable in the amount of CDN$40,000, due on or before December 31, 2025(b) | 31,350 | - | ||||||
| Unsecured loan payable in the amount of CDN$40,000, due on or before December 31, 2025 (c) | 31,350 | - | ||||||
| Unsecured loan payable, due on May 21, 2022, interest at 1% per annum(d) | 30,115 | - | ||||||
| Secured loan payable, due on June 5, 2050, interest at 3.75% per annum(e) | 150,000 | - | ||||||
| 242,815 | 789,469 | |||||||
| Current portion | (9,981 | ) | (789,469 | ) | ||||
| Loans payable | $ | 232,834 | $ | - | ||||
On March 8, 2019, the Company entered into a convertible bridge loan agreement (the “Share-Settled Loan”). The Share-Settled Loan initially bore interest at 4.99% per month, was due in 60 days on May 7, 2019 and is convertible into restricted common shares of the Company at the lender’s option at the market price per share less a 30% discount to market. The Company has accounted the Share-Settled Loan as share-settled debt. It is initially recognized at its fair value and accreted to its share-settled redemption value of $214,286 over the term of the debt. The Share-Settled Loan was not repaid on May 7, 2019 and is in default. Effective September 1, 2019, interest was reduced to 2% per month and effective December 1, 2019, the loan became non-interest bearing. On April 23, 2020, the Company received notice to settle the debt for 3,061,224 shares of common stock at $0.049 per share, a 30% discount to market. On August | |
| (b) | On April 17, 2020, the Company received a loan |
| (c) | On April 21, 2020, the Company received a loan in the principal amount of |
| (d) | On |
| (e) | On June 5, 2020, the Company received a loan in the principal amount of $150,000. The loan bears interest at 3.75% per annum and is due on June 5, 2050. The loan is secured by all tangible and intangible assets of Company. Fixed payments of $731 are due monthly and begin 12 months from the date of the loan. |
During the year ending December 31, 2018, the Company entered into a debt settlement agreement to issue 73 and 699,908 shares of Series B and Series E preferred shares, respectively, with a fair value of $3,908,614 ($5,075,2752 CDN) for the settlement of outstanding debt, which was recorded in the consolidated financial statements at a fair value of $Nil. The Company recorded a loss on extinguishment of the debt of $3,908,614 in connection with the settlement. The Series E preferred shares are classified as mezzanine equity. Refer to Note 11 and 12. As at December 31, 2018, these Series B and Series E preferred shares have not been issued.
| 72 |
Note 9 – CONVERTIBLE LOANS
As of December 31, 2018,2020, and 2017,2019, convertible loans payable consisted of the following:
RelatedThird Party Convertible LoansNotes Payable
| (a) | On March 31, 2015, the Company issued a convertible promissory note in the principal amount of $310,000 to a company owned by a director of the Company for marketing services. The note is unsecured, bears interest at 5% per annum, is convertible at $1.25 per common share, and is due on demand. As at December 31, |
Third Party Convertible Loans Payable
| (b) | On August 25, 2015, the Company issued a convertible promissory note in the principal amount of $250,000. The convertible promissory note is unsecured, bears interest at 10% per annum, is due on demand, and is convertible at $7,000 per share. On December 30, 2020, the Company entered into a Debt Settlement agreement whereby the Company agreed to issue 300,000 shares of common stock, fair valued at $387,000 to settle principal debt and accrued interest outstanding totaling $378,000. The Company recorded a loss on settlement of debt totaling $9,000. As at December 31, |
| (c) | On November 7, 2016, the Company entered into a securities purchase agreement with a non-related party. Pursuant to the agreement, the Company was provided with proceeds of $125,000 on November 10, 2016 in exchange for the issuance of a secured convertible promissory note in the principal amount of $138,889, which was inclusive of an 8% original issue discount and bears interest at 8% per annum to the holder. The convertible promissory note matures nine months from the date of issuance and is convertible at the option of the holder into our common shares at a price per share that is the lower of $480 or the closing price of the Company’s common stock on the conversion date. In addition, under the same terms, the Company also issued a secured convertible note of $50,000 in consideration for proceeds of $10,000 and another secured convertible note of $75,000 in consideration for proceeds of $10,000. Under the agreements, the Company has the right to redeem $62,500 and $40,000 of the notes for consideration of $1 each at any time prior to the maturity date in the event that the convertible promissory note is exchanged or converted into a revolving credit facility with the lender, whereupon the two $10,000 convertible note balances shall be rolled into such credit facility. |
| On May 7, 2017, the Company triggered an event of default in the convertible note by failing to repay the full principal amount and all accrued interest on the due date. The entire convertible note payable became due on demand and would accrue interest at an increased rate of 1.5% per month (18% per annum) or the maximum rate permitted under applicable law until the convertible note payable was repaid in full. | |
| On May 8, 2017, the Company issued 25 common shares for the conversion of $5,000 of the $72,500 convertible note dated November 7, 2016. On May 24, 2017, the Company issued 53 common shares for the conversion of $10,500 of the $72,500 convertible note dated November 7, 2016. On May 25, 2017, the lender provided conversion notice for the remaining principal $57,000 of the $72,500 convertible note dated November 7, 2016. This conversion was not processed by the Company’s transfer agent due to direction from the Company not to honor any further conversion notices from the lender. In response, the Company received legal notification pursuant to the refusal to process further conversion notices. Refer to Note | |
| During the year ended December 31, | |
| |
During the year ended December 31,
| |
As at December 31, |
| 73 |
| On June 5, 2017, the Company issued a convertible promissory note in the principal amount of $110,000. | |
| As at December 31, | |
On July 17, 2017, the Company issued a convertible promissory note in the principal amount of $135,000. The note is unsecured, bears interest at 10% per annum, is due on July 17, 2018, and is convertible into common shares at a conversion price equal to the lessor of (i) 55% multiplied by the lowest trading price during the previous twenty trading day period ending on the latest complete trading day prior to the date of this note and (ii) $244. Interest will be accrued and payable at the time of promissory note repayment. Financing fees on the note were $16,500. Derivative liability applied as discount on the note was $118,500 and is
| |
| |
On
| |
| As at December 31, |
| (f) | In January 2018, the Company issued a convertible promissory note in the principal amount of |
| On | |
As at December 31, |
| On | |
| |
| |
| During the year ended December 31, 2020, the Company issued 8,618,831 common shares with a fair value of $495,936 for the conversion of $107,350 principal and accrued interest resulting in a loss on settlement of debt of $388,586. | |
| As at December 31, 2020, the note and derivative liability were extinguished (December 31, 2019 - $51,500 and $48,918, respectively). During the twelve months ended December 31, 2020, the Company accreted $Nil (2019 - $7,277) of the debt discount to finance costs. |
| 74 |
| (h) | On May 28, 2018, the Company issued a convertible note in the principal amount of $180,000. The note is unsecured, bears interest at 10% per annum, and is due on February 28, 2019. The note is convertible into common shares at a 32% discount to the lowest intra-day trading price of the Company’s common stock for the ten trading days immediately preceding the conversion date. |
| On September 30, 2020, pursuant to the Exchange Agreement described above, the Company settled outstanding principal and interest of $224,319 for 224 Series C Preferred Shares. As at December 31, 2020, the note and derivative liability were extinguished (December 31, 2019 - $180,000 and $169,234, respectively). During the twelve months ended December 31, 2020, the Company accreted | |
| On |
| |
| |
| During the year ended December 31, | |
| |
During the year ended December 31, On September 30, 2020, pursuant to the Exchange Agreement described above, the Company settled outstanding principal and interest of $26,622 for 26 Series C Preferred Shares. As at December 31, 2020, the note and derivative liability were extinguished (December 31, 2019 - $39,037 and $21,869, respectively). |
| (j) | On April 26, 2019, the Company entered into a note purchase and assignment agreement with two unrelated parties pursuant to a certain secured inventory convertible note issued on March 19, 2018 in the principal amount of $900,000. Pursuant to this agreement, the seller desired to sell the balance owing under the Second and Third tranche of the |
| |
On |
| 75 |
| (k) | On |
| |
| The note was funded in four tranches on May 7, 2019, June 28, 2019, July 8, 2019 and August 8, 2019, totaling $250,420. Proceeds from the note were paid directly to a former lender as an inducement for entering into a debt assignment arrangement. The $250,420 inducement is recorded to finance costs for the year ended December 31, 2019. | |
| On September 30, 2020, pursuant to the Exchange Agreement described above, the Company settled outstanding principal and interest of $286,302 for 286 Series C Preferred Shares. As at December 31, | |
| |
| (l) | On July |
| |
| |
| |
| |
|
During the year ended December 31, | |
As at December 31, 2020, the note and derivative liability were extinguished (December 31, 2019 - $92,219 and $284,734, respectively). During the year ended December 31, 2020, the Company accreted $127,781 (2019 - $92,219) of the debt discount to finance costs. | |
| (m) | On September 4, 2019, the Company issued a convertible promissory note in the principal amount of $137,500. The note is unsecured, bears interest at 10% per annum, is due on June 3, 2020, and is convertible during the first 180 calendar days from the issuance date at a price of $0.50 per share. For the subsequent period until repayment the conversion price shall equal the lesser of (i) 60% multiplied by the lowest traded price of the Common Stock during the previous twenty trading days before the issuance date of the note, or (ii) the lowest traded price for the Common Stock during the twenty-day period ending on the last complete trading day before conversion. Deferred financing fees and original issuance discount on the note were $16,000. The derivative liability applied as a discount on the note was $121,500 and is accreted over the life of the note. |
In connection with the note, the Company granted 100,000 warrants to the lender. Each warrant can be exercised to purchase shares of common stock of the Company at a price of $0.75 per warrant for a period of five years. As the entire net proceeds of $121,500 were first allocated to the derivative liability which is measured at fair value on a recurring basis, the residual value of $Nil was allocated to the equity-classified warrants. | |
| During the year ended December 31, 2020, the Company issued 8,623,931 common shares with a fair value of $494,031 for the conversion of $110,750 of principal and | |
| As at December 31, |
| 76 |
| (n) | On September 19, 2019, the Company issued a convertible promissory note in the principal amount of $55,000. The note is unsecured, bears interest at 10% per annum, is due on September 19, 2020, and is convertible during the first six months from the issuance date at a price of $0.50 per share. For the subsequent period until repayment the conversion price shall equal the lesser of (i) 60% multiplied by the lowest traded price of the Common Stock during the previous twenty trading days before the issuance date of the note, or (ii) the lowest traded price for the Common Stock during the twenty-day period ending on the last complete trading day before conversion. Deferred financing fees and original issuance discount on the note were $7,000. The derivative liability applied as a discount on the note was $48,000 and is accreted over the life of the note. |
During the year ended December 31, 2020, the Company issued 5,758,117 common shares with a fair value of $332,480 for the conversion of total outstanding principal and interest totaling $60,250 resulting in a loss on settlement of debt of $272,230. | |
| As at December 31, 2020, the note and derivative liability were extinguished (December 31, 2019 - $15,370 and $70,052, respectively). During the year ended December 31, 2020, the Company accreted $39,630 (2019 - $Nil), of the debt discount to finance costs. | |
| On | |
| In connection with the note, the Company granted 113,250 warrants to the lender. Each warrant can be exercised to purchase shares of common stock of the Company at a price of $0.75 per warrant for a period of five years. As the entire net proceeds of $125,500 were first allocated to the derivative liability which is measured at fair value on a recurring basis, the residual value of $Nil was allocated to the equity-classified warrants. | |
| During the year ended December 31, 2020, the Company issued 5,159,991 common shares with a fair value of $261,912 for the conversion of $74,620 of principal and accrued interest resulting in a loss on settlement of debt of $187,292. On September 18, 2020, the Company paid cash of $76,000 to settle all outstanding principal and interest on the note, resulting in a gain on the settlement of debt totaling $7,273. | |
| As at December 31, 2020, the note and derivative liability were extinguished (December 31, 2019 - $40,043 and $190,246, respectively). During the year ended December 31, 2020, the Company accreted $101,857 (2019 - $40,043), of the debt discount to finance costs. | |
| (p) | On October 2, 2019, the Company issued a convertible promissory note in the principal amount of $82,500. The note is unsecured, bears interest at 10% per annum, is due on September 30, 2020, and is convertible during the first six months from the issuance date at a price of $0.50 per share. For the subsequent period until repayment the conversion price shall equal the lesser of (i) 60% multiplied by the lowest traded price of the Common Stock during the previous twenty trading days before the issuance date of the note, or (ii) the lowest traded price for the Common Stock during the twenty-day period ending on the last complete trading day before conversion. Deferred financing fees and original issuance discount on the note were $9,500. The derivative liability applied as a discount on the note was $73,000 and is accreted over the life of the note. |
In connection with the note, the Company granted 83,333 warrants to the lender. Each warrant can be exercised to purchase shares of common stock of the Company at a price of $0.75 per warrant for a period of five years. As the entire net proceeds of $73,000 were first allocated to the derivative liability which is measured at fair value on a recurring basis, the residual value of $Nil was allocated to the equity-classified warrants. During the year ended December 31, 2020, the Company issued 3,409,090 common shares with a fair value of $193,296 for the conversion of $22,500 of principal resulting in a loss on settlement of debt of $170,796. On September 18, 2020, the Company paid cash of $60,000 to settle all outstanding principal and interest on the note, resulting in a gain on the settlement of debt totaling $8,075. As at December 31, 2020, the note and derivative liability were extinguished (December 31, 2019 - $20,795 and $105,790, respectively). During the year ended December 31, 2020, the Company accreted $61,705 (2019 - $20,795), of the debt discount to finance costs. |
| 77 |
| (q) | During the year ended December 31, 2019, a convertible promissory note with an outstanding principal balance of $226,000 was assigned to another unrelated party with no changes to the terms of the note upon assignment. The note is unsecured, bears interest at 12% per annum, On September 30, 2020, pursuant to the Exchange Agreement described above, the Company settled outstanding principal and |
| (r) | |
| |
| On September 30, 2020, pursuant to the Exchange Agreement described above, the Company settled outstanding principal and interest of $342,641 for 343 Series C Preferred Shares. As at December 31, 2020, the note and derivative liability were extinguished (December 31, 2019 - $258,736 and $351,774, respectively). | |
| (s) | During the year ended December 31, 2019, a convertible promissory note with an outstanding principal balance of $137,500 was assigned to another unrelated party with no changes to the terms of the note upon assignment. The |
| On September 30, 2020, pursuant to the Exchange Agreement described above, the Company settled outstanding principal and interest of $166,401 for 166 Series C Preferred Shares. As at December 31, 2020, the note and derivative liability were extinguished (December 31, 2019 - $137,500 and $170,201, respectively). | |
| (t) | On February 10, 2020, the Company issued a convertible promissory note in the principal amount of $119,600. The note is unsecured, bears interest at 8% per annum, is due on February 10, 2021, and is convertible into common shares of the Company, beginning 180 days from the date of the note up to maturity or repayment, at a price equal to 80% of the average of the lowest two trading prices for the common stock during the fifteen trading days before conversion. Deferred financing fees and original issuance discount on the note were $22,135. The derivative liability applied as |
| During the year ended December 31, 2020, the Company issued 11,549,008 common shares with a fair value of $549,376 for the conversion of $119,600 of principal resulting in a loss on settlement of debt of $429,776. | |
| As at December 31, | |
| (u) | On March 2, 2020, the Company issued a convertible promissory note in the principal amount of $60,950. The note is unsecured, bears interest at 8% per annum, is due on March 2, 2021, and is convertible into common shares of the Company, beginning 180 days from the date of the note |
| On September 18, 2020, the Company paid cash, received pursuant to the promissory note outlined in Note 8(g), of $78,643 for outstanding principal and interest on the note including a prepayment penalty of $15,221 to settle the debt. | |
| As at December 31, 2020, the note and derivative liability were extinguished. During the year ended December 31, 2020, the Company accreted $60,950, of the debt discount to finance costs. |
| 78 |
| (v) | On April 15, 2020, the Company issued a convertible promissory note in the principal amount of $60,950. The note is unsecured, bears interest at 8% per annum, is due on April 15, 2021, and is convertible into common shares of the Company, beginning 180 days from the date of the note up to maturity or repayment, at a price equal to 80% of the average of the lowest two trading prices for the common stock during the fifteen trading days before conversion. Deferred financing fees and original issuance discount on the note were $10,950. The derivative liability applied as a discount on the note was $50,000 and is accreted over the life of the note. |
On September 18, 2020, the Company paid cash of $66,000 to settle all outstanding principal and interest on the note, resulting in a loss on the settlement of debt totaling $2,966. As at December 31, 2020, the note and derivative liability were extinguished. During the year ended December 31, 2020, the Company accreted $60,950, of the debt discount to finance costs. | |
| (w) | On August 31, 2020, the Company issued a convertible promissory note in the principal amount of $166,650 with a 10% original issuance discount totaling $16,650, for net proceeds of $150,000. The note is unsecured, bears interest at 10% per annum, is due and payable on demand, and is convertible into common shares of the Company, at a price equal to the lesser of (a) five cents ($0.05) per share or (b) seventy percent (70%) of the lowest traded price for the Company’s common stock during the fifteen (15) trading days preceding the relevant conversion. |
| On September 30, 2020, pursuant to the Exchange Agreement described above, the Company settled outstanding principal and interest of $167,974 for 168 Series C Preferred Shares. As at December 31, 2020, the note was extinguished. | |
| (x) | On September 17, 2020, the Company issued a convertible promissory note in the principal amount of $288,860 with a 10% original issuance discount totaling $28,860, for net proceeds of $260,000. The note is unsecured, bears interest at 10% per annum, is due on June 17, 2021, and is convertible into common shares of the Company at a price equal to the lesser of (a) four cents ($0.04) per share or (b) seventy percent (70%) of the lowest traded price for the Company’s common stock during the fifteen (15) trading days preceding the relevant conversion. |
| On September 30, 2020, pursuant to the Exchange Agreement described above, the Company settled outstanding principal and interest of $289,889 for 290 Series C Preferred Shares. As at December 31, 2020, the note was extinguished. | |
| (y) | On August 30, 2017, the Company issued a convertible promissory note in the principal amount of $15,000. The note is unsecured, bears interest at 10% per annum, is due on August 30, 2018, and is convertible into common shares of the Company at a price equal to a 20% discount of the average closing bid price for the Company’s common stock during the five (5) trading days immediately preceding a conversion date, with a floor price of $0.005. The note was issued as a Commitment fee and is included in Finance costs during the nine months ending September 30, 2020. |
| On September 30, 2020, pursuant to the Exchange Agreement described above, the Company settled outstanding principal and interest of $18,131 for 18 Series C Preferred Shares. As at December 31, 2020, the note was extinguished. | |
| (z) | On May 2, 2019, the Company issued a convertible promissory note in the principal amount of $10,000. The note is unsecured, bears interest at 8% per annum, is due on May 2, 2020, and is convertible into common shares of the Company at a price equal to a 58% of the lowest traded price of the Company’s common stock during the five (5) trading days immediately preceding the conversion date. The note was issued for proceeds paid directly to legal counsel for legal fees, related to the 2019 S-1 Registration Statement, and is included in Accounting & Legal during the nine months ending September 30, 2020. |
| On September 30, 2020, pursuant to the Exchange Agreement described above, the Company settled outstanding principal and interest of $11,841 for 12 Series C Preferred Shares. As at December 31, 2020, the note was extinguished. | |
| (aa) | On June 10, 2019, the Company issued a convertible promissory note in the principal amount of $15,000. The note is unsecured, bears interest at 10% per annum, is due on August 30, 2018, and is convertible into common shares of the Company at a price equal to a 20% discount of the average closing bid price for the Company’s common stock during the five (5) trading days immediately preceding a conversion date, with a floor price of $0.005. The note was issued for proceeds paid directly to a third party for audit fees, related to the 2019 S-1 Registration Statement, and is included in Accounting & Legal during the nine months ending September 30, 2020. |
| On September 30, 2020, pursuant to the Exchange Agreement described above, the Company settled outstanding principal and interest of $51,999 for 52 Series C Preferred Shares. As at December 30, 2020, the note was extinguished. |
| 79 |
Note 10 – DERIVATIVE LIABILITIES
The Company records the fair value of the of the conversion pricefeature of the convertible loans payable disclosed in Note 9 in accordance with ASC 815, Derivatives and Hedging. The fair value of the derivative was calculated using a multi-nominal lattice model. The fair value of the derivative liabilities is revalued on each balance sheet date with corresponding gains and losses recorded in the consolidated statement of operations. For the year ended December 31, 2018, the Company recorded a gain on the change in fair value of derivative liability of $1,005,458 (December 31, 2017 – $824,986 loss). As at December 31, 2018 and December 31, 2017, the Company recorded derivative liability of $2,188,354 and $1,676,155, respectively.
The following range of inputs and assumptions were used to value the derivative liabilities outstanding during the period and yearyears ended December 31, 20182020 and December 31, 2017 respectively,2019, assuming no dividend yield:
| 2018 | 2017 | |||||||
| Expected volatility | 180 - 447 | % | 96 - 533 | % | ||||
| Risk free interest rate | 1.63 - 2.59 | % | 0.11 - 1.76 | % | ||||
| Expected life (in years) | 0.1 - 1.0 | 0.1 - 1.0 |
| 2020 | 2019 | |||||||
| Expected volatility | 243 - 531 | % | 176 - 374 | % | ||||
| Risk free interest rate | 0.09 - 0.18 | % | 1.6 - 2.6 | % | ||||
| Expected life (years) | 0.25 - 1.0 | 0.25 - 2.0 |
A summary of the activity of the derivative liabilities is shown below:
| $ | ||||
| Balance, January 1, | ||||
| ( | ) | |||
| Balance, December 31, | ||||
| Balance, January 1, | ||||
| Change in fair value | 7,386,252 | |||
| Balance, December 31, |
Note 11 – LEASES
Lessor
During the year ended December 30, 2020, the Company began financing the lease of certain assets under rental revenue contracts with its customers and accounts for them in accordance with ASC 842 as outlined under “Leases” in Note 3.
During the year ended December 31, 2020, the Company recognized lease receivables of $45,856, to reflect lease payments expected to be received over the term of the agreements and derecognized $30,000 in inventory related to the underlying asset.
| Lease receivable | December 31, 2020 | |||
| Balance, January 1, 2020 | $ | - | ||
| Additions | 45,856 | |||
| Receipt of payments | (3,000 | ) | ||
| Balance, December 31, 2020 | 42,856 | |||
| Current portion of lease receivable | (4,297 | ) | ||
| Long term potion of lease receivable | $ | 38,559 | ||
Lease receivables are measured at the commencement date based on the present value of future lease payments less the present value of the unguaranteed residual asset. The Company used the rate implicit in the rental revenue contracts to calculate the present value of future payments and unguaranteed residual asset at the date of commencement.
In accordance with the terms of the agreement, the Company recorded $45,856 in rental revenues related to the lease at the date of commencement and $30,000 in cost of goods sold.
Lessee
The Company leases certain assets under lease agreements.
On October 1, 2019, the Company entered into a 5-year lease agreement for a photocopier (the “Copier Lease”). Upon recognition of the lease, the Company recognized right-of-use assets of $8,683 and lease liabilities of $8,683. As of December 31, 2020, the Copier lease had a remaining term of 3.75 years.
On April 1, 2020, the Company terminated its showroom space lease, resulting in a gain of $8,428 (CDN$11,294) which is included in general and administrative expense. On May 31, 2020, the Company’s office leases expired.
On July 10, 2020, the Company entered into a lease agreement for retail, showroom and warehouse space in Fairfield, CA (the “Fairfield Lease”). Upon initial recognition of the lease, the Company recognized right-of-use assets of $164,114 and lease liabilities of $156,364. The difference between the recorded operating lease assets and lease liabilities is due to prepaid rent deposits to be applied to first months’ rent of $7,750. The lease included a rent-free period with rent payments commencing on October 1, 2020. As of December 31, 2020, Fairfield Lease had a remaining term of 1.67 years. The Fairfield Lease also included a refundable security deposit of $7,750 which is included in prepaid expenses and deposits at December 31, 2020.
On July 14, 2020, the Company entered into a lease agreement for office space in Surrey, BC (the “Croydon Lease”). Upon initial recognition of the lease, the Company recognized right-of-use assets of $133,825 and lease liabilities of $125,014. The difference between the recorded operating lease assets and lease liabilities is due to prepaid rent deposits to be applied to first months’ rent of $8,811 (CDN$11,948). The lease included a rent-free period with rent payments commencing on September 1, 2020. As of December 31, 2020, the lease had a remaining term of 2.58 years.
Right-of-use assets have been included within fixed assets, net and lease liabilities have been included in operating lease liability on the Company’s consolidated balance sheet.
| Right-of-use assets | December 31, 2020 | December 31, 2019 | ||||||
| Cost | $ | 302,477 | $ | 178,202 | ||||
| Accumulated depreciation | (53,158 | ) | (39,671 | ) | ||||
| Total right-of-use assets | $ | 249,319 | $ | 138,531 | ||||
| Lease liability | December 31, 2020 | December 31, 2019 | ||||||
| Current portion | $ | 125,864 | $ | 62,935 | ||||
| Long-term portion | 150,877 | 74,225 | ||||||
| Total lease liability | $ | 276,741 | $ | 137,160 | ||||
Operating lease liabilities are measured at the commencement date based on the present value of future lease payments. As the Company’s lease did not provide an implicit rate, the Company uses its incremental borrowing rate based on the information available at the commencement date in determining the present value of future payments. The Company used a weighted average discount rate of 11.98% in determining its lease liabilities. The discount rate was derived from the Company’s assessment of borrowings.
Right-of-use assets include any prepaid lease payments and exclude any lease incentives and initial direct costs incurred. Lease expense for minimum lease payments is recognized on a straight-line basis over the lease term. The lease terms may include options to extend or terminate the lease if it is reasonably certain that the Company will exercise that option.
Operating lease expense for the twelve months ended December 31, 2020 was $86,645 (2019 - $44,875) and is recorded in general and administration expense.
Future minimum lease payments to be paid by the Company as a lessee for operating leases as of December 31, 2020 for the next three years are as follows:
| Operating lease commitments and lease liability | December 31, 2020 | |||
| 2021 | $ | 152,317 | ||
| 2022 | 124,565 | |||
| 2023 | 37,060 | |||
| 2024 | 1,736 | |||
| Total future minimum lease payments | 315,678 | |||
| Discount | (38,937 | ) | ||
| Total | 276,741 | |||
| Current portion of operating lease liabilities | (125,864 | ) | ||
| Long-term portion of operating lease liabilities | $ | 150,877 | ||
| 80 |
Note 12 – MEZZANINE EQUITY
Authorized
5,000,000 shares of redeemable Series C preferred shares, authorized, each having a par value of $0.001 per share. Each share of Series C preferred shares is convertible into 10 shares of common stock.stock at a conversion rate equal to the lowest traded price for the fifteen trading days immediately preceding the date of conversion.
1,000,000 shares of redeemable Series D preferred shares, authorized, each having a par value of $0.001 per share. Each share of Series D preferred shares is convertible into 5 shares of common stock.
5,000,000 shares of redeemable Series E preferred shares, authorized, each having a par value of $0.001 per share. Each share of Series E preferred shares is convertible into 4 shares of common stock.
10,000 shares of redeemable Series F preferred shares, authorized, each having a par value of $0.001 per share. Each share of Series F preferred shares is convertible into common stock at an amount equal to the lesser of (a) one hundred percent of the lowest traded price for the Company’s stock for the fifteen trading days immediately preceding the relevant Conversion and (b) a twenty percent discount to the price of the common stock in an offering with gross proceeds of at least $10,000,000.
Mezzanine equity transactionsPreferred Equity Transactions
The Company designated 5,000,000 shares as Series A Convertible Preferred Stock (“Series A Shares”) and on October 24, 2014 issued 4,309,384 Series A Shares to a company controlled by a director ofDuring the Company for conversion of its debt of $5,386,731. The Series A Shares have no general voting rights and carried a 5% per annum interest rate. Series A Shares that are converted to common shares are entitled to the same voting rights as other common shareholders. The Series A Shares were subject to a redemption obligation at $1.25 per common share pursuant to the following terms:year ended December 31, 2020:
| ● | On | |
| ● | On | |
| ● | On | |
| ● | On December 7, 2020, the Company received gross proceeds of $200,000 for 200 Series C Preferred Shares in lieu of the Second Closing for the Series C SPA. The shares are included in preferred shares to be issued at December 31, 2020. | |
| ● | On December 23, 2020, the Company entered into a Securities Purchase Agreement (the “Series F SPA”) whereby the Company agrees to sell and the Purchaser agrees to purchase, in a series of closings (the “Closings”) of at least | |
| ● | During the | |
| ● | On December 22, 2020, the Company received conversion notices to convert 18 Series C shares into 96,861 common shares. 18 Series C were converted subsequently on January 19, 2021. | |
| ● | On December 23, 2020, the Company received conversion notices to convert 286 Series C shares into 1,539,014 common shares. 286 Series C were converted subsequently on January 15, 2021. |
During the year ended December 31, 2015, 80,000 Series A Shares with a value of $100,000 were purchased by an unrelated third-party and exchanged for 80,000 shares of common stock of the Company.2019:
The Series A Shares were recorded in the consolidated financial statements as Mezzanine Equity.
On August 27, 2018, pursuant to a debt exchange agreement, the Company agreed to exchange all 4,229,384 issued and outstanding Series A Shares with a fair value of $5,873,481 ($7,627,303 CDN) for 51 shares of Series B and 3,000,000 shares of Series E preferred shares, respectively. The Series B preferred shares are classified as permanent equity. Refer to Note 12. As at December 31, 2018, these Series B and Series E preferred shares have not been issued.
During the year ended December 31, 2018, pursuant to a series of debt exchange agreements, the Company agreed to issue an aggregate of 148,706 shares of Series D preferred shares for the settlement of outstanding accounts payable with a fair value of $91,944. As at December 31, 2018, these Series D preferred shares have not been issued.
During the year ended December 31, 2018, pursuant to a series of debt exchange agreements, the Company agreed to issue an aggregate of 81 shares of Series B and 1,649,908 shares of Series E preferred shares, respectively, for the settlement of outstanding convertible loans with a fair value of $5,609,757 ($7,284,831 CDN). The Series B preferred shares are classified as permanent equity. Refer to Note 12. As at December 31, 2018, these Series B and Series E preferred shares have not been issued.
| The Company settled various accounts payable balances, debt and preferred shares in exchange for shares of common stock to be issued and warrants. Included in these settlements were 100,500 and 4,649,908 shares of Series D and Series E preferred shares, respectively, with an aggregate carrying value of $6,668,643. |
| 81 |
Note 1213 – PREFERRED STOCK
Authorized
On August 27, 2018, the Company amended its Articles3,000,000 shares of Incorporation to authorize and designate Series A through Series E preferred shares for the collective issuance of up to 14,010,000 sharesauthorized, each having a par value of $0.001 per share. The preferred
10,000 shares are designated as: 3,000,000 Series A preferred shares, 10,000of Series B convertible preferred shares 5,000,000authorized, each having a par value of $0.001 per share. Each share of Series CB convertible preferred shares 1,000,000 Series Dis convertible preferredinto 100,000 shares and 5,000,000 Series E convertible preferred shares. The Series C, D and E preferred shares are mandatorily redeemable upon a major transaction which includes a change in control. As a result, they are classified as mezzanine equity. Refer to Note 11.of common stock.
On March 26, 2019, the Company effected a reverse stock split of its shares of common stock on a four thousand (4,000) old for one (1) new basis. Preferred share amounts remained unchanged.
On October 29, 2019, the Company re-designated its Series A Preferred Stock. The Series A Preferred Stock shall be entitled to vote with the holders of the Company’s Common Stock as a class at the rate of 665 common share votes per share of Series A Preferred Stock. The Series A Preferred Stock shall be deemed cancelled five years following issuance, provided that the Board of Directors may, in its discretion, retire the Series A Preferred Stock at any time after two years following issuance, or defer the retirement of the Series A Preferred Stock for up to 10 years following issuance.
EquityPreferred Stock Transactions
During the year ended December 31, 2018 the Company agreed to issue an aggregate of:2020:
| ● | On May 21, 2020, the Company issued an aggregate of 136 shares of Series B | |
| ● | On October 26, 2020, the Company agreed to issue 100 shares of | |
| ● | On December 11, 2020, 4 Series B preferred shares were converted into common shares, see note 14. |
During the year ended December 31, 2019:
| ● | The Company settled various accounts payable balances, debt and | |
| ● | On October 29, 2019, the Company issued an aggregate of 200,376 shares of Series |
| 82 |
Note 1314 – COMMON STOCK AND ADDITIONAL PAID IN CAPITAL
Authorized
On August 27, 2018, the Company amended its Articles of Incorporation to increase the shares of common stock authorized from 2,000,000,000 to 3,000,000,000.
On March 26, 2019, the Company effected a reverse stock split of its shares of common stock on a four thousand (4,000) old for one (1) new basis. Upon effect of the reverse split, authorized capital decreased from 3,000,000,000 shares of common stock to 750,000 shares of common stock. Subsequently, on May 23, 2019, an increase in common shares to 150,000,000 was authorized, with a par value of $0.001. These consolidated financial statements give retroactive effect to such reverse stock split named above and all share and per share amounts have been adjusted accordingly, unless otherwise noted.
There were 634,971 and 25,485 shares of common stock of the Company issued and outstanding as of December 31, 2018 and 2017, respectively. Each share of common stock is entitled to one (1) vote.
EquityCommon Stock Transactions
During the year ended December 31, 2018 the Company issued an aggregate of:2020:
| ● | The Company issued an aggregate of |
| Date Issued | Common Shares Issued (#) | Fair Value(1) | Converted Balance(2) | Gain (loss) on Conversion | ||||||||||||
| January 2, 2018 | 1,270 | $ | 11,683 | $ | 3,733 | $ | (7,950 | ) | ||||||||
| January 5, 2018 | 1,325 | 10,600 | 5,300 | (5,300 | ) | |||||||||||
| January 5, 2018 | 1,334 | 10,666 | 2,986 | (7,680 | ) | |||||||||||
| January 9, 2018 | 1,450 | 11,600 | 5,800 | (5,800 | ) | |||||||||||
| January 11, 2018 | 1,525 | 15,860 | 6,100 | (9,760 | ) | |||||||||||
| January 11, 2018 | 1,539 | 15,997 | 3,446 | (12,551 | ) | |||||||||||
| January 12, 2018 | 1,692 | 16,911 | 3,788 | (13,123 | ) | |||||||||||
| January 16, 2018 | 1,675 | 13,400 | 6,701 | (6,699 | ) | |||||||||||
| January 16, 2018 | 1,776 | 14,204 | 3,977 | (10,227 | ) | |||||||||||
| January 17, 2018 | 1,948 | 15,581 | 4,363 | (11,218 | ) | |||||||||||
| January 19, 2018 | 2,045 | 18,812 | 4,580 | (14,232 | ) | |||||||||||
| January 22, 2018 | 2,045 | 35,170 | 4,580 | (30,590 | ) | |||||||||||
| January 23, 2018 | 2,125 | 27,200 | 8,500 | (18,700 | ) | |||||||||||
| January 24, 2018 | 2,249 | 29,685 | 5,038 | (24,647 | ) | |||||||||||
| January 26, 2018 | 2,468 | 27,632 | 5,526 | (22,106 | ) | |||||||||||
| January 31, 2018 | 2,133 | 36,678 | 7,506 | (29,172 | ) | |||||||||||
| January 31, 2018 | 2,591 | 27,975 | 5,802 | (22,173 | ) | |||||||||||
| February 1, 2018 | 2,591 | 25,903 | 5,802 | (20,101 | ) | |||||||||||
| February 6, 2018 | 1,511 | 14,501 | 3,806 | (10,695 | ) | |||||||||||
| February 6, 2018 | 2,956 | 28,370 | 6,620 | (21,750 | ) | |||||||||||
| February 7, 2018 | 2,821 | 29,076 | 10,550 | (18,526 | ) | |||||||||||
| February 8, 2018 | 1,511 | 12,084 | 4,350 | (7,734 | ) | |||||||||||
| February 9, 2018 | 3,500 | 32,200 | 14,000 | (18,200 | ) | |||||||||||
| February 9, 2018 | 3,653 | 33,607 | 8,182 | (25,425 | ) | |||||||||||
| February 12, 2018 | 3,613 | 36,124 | 15,100 | (21,024 | ) | |||||||||||
| February 12, 2018 | 4,010 | 40,098 | 9,543 | (30,555 | ) | |||||||||||
| February 13, 2018 | 2,450 | 18,816 | 9,800 | (9,016 | ) | |||||||||||
| February 14, 2018 | 3,588 | 28,696 | 10,331 | (18,365 | ) | |||||||||||
| February 14, 2018 | 4,513 | 36,099 | 10,740 | (25,359 | ) | |||||||||||
| February 16, 2018 | 4,917 | 33,433 | 9,637 | (23,796 | ) | |||||||||||
| February 20, 2018 | 3,276 | 19,654 | 10,089 | (9,565 | ) | |||||||||||
| February 22, 2018 | 2,470 | 15,610 | 7,064 | (8,546 | ) | |||||||||||
| February 22, 2018 | 5,326 | 27,692 | 9,692 | (18,000 | ) | |||||||||||
| February 28, 2018 | 3,588 | 18,652 | 8,394 | (10,258 | ) | |||||||||||
| February 28, 2018 | 5,715 | 29,714 | 8,000 | (21,714 | ) | |||||||||||
| March 2, 2018 | 6,179 | 81,556 | 8,650 | (72,906 | ) | |||||||||||
| March 5, 2018 | 1,068 | 11,099 | 1,494 | (9,605 | ) | |||||||||||
| March 5, 2018 | 2,583 | 26,859 | 3,616 | (23,243 | ) | |||||||||||
| March 6, 2018 | 6,137 | 81,000 | 13,500 | (67,500 | ) | |||||||||||
| March 6, 2018 | 6,068 | 60,671 | 10,921 | (49,750 | ) | |||||||||||
| March 7, 2018 | 5,428 | 54,280 | 7,599 | (46,681 | ) | |||||||||||
| March 8, 2018 | 5,946 | 64,213 | 8,324 | (55,889 | ) | |||||||||||
| March 8, 2018 | 3,476 | 40,318 | 8,064 | (32,254 | ) | |||||||||||
| March 12, 2018 | 5,942 | 64,167 | 8,318 | (55,849 | ) | |||||||||||
| March 13, 2018 | 5,244 | 50,335 | 11,535 | (38,800 | ) | |||||||||||
| March 14, 2018 | 6,549 | 70,726 | 11,788 | (58,938 | ) | |||||||||||
| March 14, 2018 | 5,507 | 57,263 | 7,708 | (49,555 | ) | |||||||||||
| March 15, 2018 | 5,669 | 56,683 | 7,936 | (48,747 | ) | |||||||||||
| March 19, 2018 | 8,316 | 76,501 | 11,641 | (64,860 | ) | |||||||||||
| March 22, 2018 | 6,537 | 52,291 | 9,151 | (43,140 | ) | |||||||||||
| March 26, 2018 | 5,825 | 72,230 | 8,155 | (64,075 | ) | |||||||||||
| March 27, 2018 | 4,567 | 42,016 | 10,047 | (31,969 | ) | |||||||||||
| March 29, 2018 | 1,558 | 19,938 | 10,000 | (9,938 | ) | |||||||||||
| April 2, 2018 | 4,580 | 75,105 | 18,135 | (56,970 | ) | |||||||||||
| April 5, 2018 | 11,087 | 319,277 | 19,955 | (299,322 | ) | |||||||||||
| April 6, 2018 | 2,190 | 21,893 | 3,941 | (17,952 | ) | |||||||||||
| April 19, 2018 | 12,050 | 173,512 | 66,272 | (107,240 | ) | |||||||||||
| May 14, 2018 | 18,068 | 252,948 | 113,174 | (139,774 | ) | |||||||||||
| May 25, 2018 | 10,000 | 112,000 | 52,800 | (59,200 | ) | |||||||||||
| June 13, 2018 | 3,250 | 26,000 | 9,750 | (16,250 | ) | |||||||||||
| June 13, 2018 | 10,000 | 72,000 | 33,000 | (39,000 | ) | |||||||||||
| June 19, 2018 | 9,975 | 59,850 | 32,918 | (26,932 | ) | |||||||||||
| June 25, 2018 | 10,840 | 60,704 | 28,618 | (32,086 | ) | |||||||||||
| July 2, 2018 | 3,438 | 19,250 | 7,906 | (11,344 | ) | |||||||||||
| July 2, 2018 | 12,327 | 69,028 | 31,186 | (37,842 | ) | |||||||||||
| July 12, 2018 | 11,000 | 61,600 | 25,300 | (36,300 | ) | |||||||||||
| July 23, 2018 | 4,774 | 21,006 | 10,503 | (10,503 | ) | |||||||||||
| July 24, 2018 | 14,250 | 62,700 | 28,500 | (34,200 | ) | |||||||||||
| July 25, 2018 | 10,626 | 38,253 | 21,039 | (17,214 | ) | |||||||||||
| August 2, 2018 | 18,500 | 88,800 | 22,200 | (66,600 | ) | |||||||||||
| August 3, 2018 | 9,581 | 45,988 | 12,647 | (33,341 | ) | |||||||||||
| August 10, 2018 | 10,399 | 41,593 | 13,726 | (27,867 | ) | |||||||||||
| August 23, 2018 | 2,723 | 23,956 | 4,192 | (19,764 | ) | |||||||||||
| September 4, 2018 | 13,887 | 116,644 | 15,000 | (101,644 | ) | |||||||||||
| September 10, 2018 | 17,073 | 122,922 | 26,292 | (96,631 | ) | |||||||||||
| September 10, 2018 | 10,792 | 43,167 | 12,950 | (30,217 | ) | |||||||||||
| September 25, 2018 | 21,250 | 95,200 | 32,725 | (62,475 | ) | |||||||||||
| October 5, 2018 | 16,352 | 77,834 | 35,974 | (41,860 | ) | |||||||||||
| October 17, 2018 | 18,121 | 79,729 | 31,892 | (47,837 | ) | |||||||||||
| October 24, 2018 | 15,132 | 54,474 | 26,632 | (27,842 | ) | |||||||||||
| October 24, 2018 | 22,500 | 90,000 | 39,600 | (50,400 | ) | |||||||||||
| November 2, 2018 | 9,705 | 34,936 | 14,945 | (19,991 | ) | |||||||||||
| November 7, 2018 | 43,428 | 121,598 | 86,856 | (34,742 | ) | |||||||||||
| December 28, 2018 | 8,851 | 31,861 | 15,576 | (16,285 | ) | |||||||||||
| Total | 572,547 | $ | 4,315,958 | $ | 1,302,077 | $ | (3,013,881 | ) | ||||||||
| ||
During the year ended December 31, 2017:
| ● | The Company issued an aggregate of | |
| ● | The Company issued an aggregate of 16,880,146 shares of common stock with a fair value of $7,521,454 to satisfy shares to be issued. | |
| ● | The Company issued 2,363,532 shares of common stock with a fair value of $214,286 for share-settled debt. | |
| ● | The Company issued an aggregate of 52,937,999 shares of common stock with a fair value of $3,577,005 upon the conversion of $777,872 of convertible debentures and accrued interest, as |
| Date Issued | Common Shares Issued (#) | Fair Value(1) | Converted Balance(2) | Gain (loss) on Conversion | ||||||||||||
| April 3, 2017(3) | 131 | $ | 26,252 | $ | 26,252 | $ | - | |||||||||
| May 4, 2017 | 750 | 150,000 | 150,000 | - | ||||||||||||
| May 8, 2017 | 25 | 42,000 | 35,000 | (7,000 | ) | |||||||||||
| May 25, 2017 | 53 | 71,400 | 73,500 | 2,100 | ||||||||||||
| July 24, 2017 | 200 | 40,000 | 63,007 | 23,007 | ||||||||||||
| July 28, 2017 | 125 | 21,500 | 15,356 | (6,144 | ) | |||||||||||
| September 7, 2017 | 188 | 22,575 | 21,936 | (639 | ) | |||||||||||
| October 10, 2017 | 250 | 34,000 | 6,821 | (27,179 | ) | |||||||||||
| October 11, 2017 | 354 | 42,456 | 22,273 | (20,183 | ) | |||||||||||
| October 11, 2017 | 188 | 25,500 | 22,019 | (3,481 | ) | |||||||||||
| October 18, 2017 | 531 | 8,494 | 6,508 | (1,986 | ) | |||||||||||
| October 19, 2017 | 1,100 | 43,200 | 41,874 | (1,326 | ) | |||||||||||
| October 19, 2017 | 557 | 26,753 | 28,795 | 2,042 | ||||||||||||
| October 20, 2017 | 557 | 11,147 | 11,358 | 211 | ||||||||||||
| October 23, 2017 | 610 | 19,524 | 21,849 | 2,325 | ||||||||||||
| October 25, 2017 | 675 | 16,200 | 15,251 | (949 | ) | |||||||||||
| October 26, 2017 | 448 | 12,540 | 14,789 | 2,249 | ||||||||||||
| October 27, 2017 | 750 | 21,000 | 19,479 | (1,521 | ) | |||||||||||
| October 27, 2017 | 754 | 21,122 | 24,056 | 2,934 | ||||||||||||
| October 31, 2017 | 625 | 17,505 | 17,998 | 493 | ||||||||||||
| October 31, 2017 | 750 | 21,000 | 19,479 | (1,521 | ) | |||||||||||
| November 2, 2017 | 375 | 8,996 | 10,704 | 1,708 | ||||||||||||
| November 7, 2017 | 917 | 18,335 | 32,478 | 14,143 | ||||||||||||
| November 13, 2017 | 754 | 18,104 | 20,704 | 2,600 | ||||||||||||
| November 22, 2017 | 1,000 | 12,002 | 21,711 | 9,709 | ||||||||||||
| December 27, 2017 | 1,050 | 12,600 | 9,142 | (3,458 | ) | |||||||||||
| December 27, 2017 | 1,050 | 13,420 | 6,062 | (7,358 | ) | |||||||||||
| December 29, 2017 | 1,150 | 9,200 | 3,920 | (5,280 | ) | |||||||||||
| December 29, 2017 | 1,155 | 10,462 | 12,816 | 2,354 | ||||||||||||
| Total | 17,072 | $ | 797,287 | $ | 775,137 | $ | (22,150 | ) | ||||||||
| Date issued | Common shares issued (#) | Fair value(1) | Converted balance(2) | Loss on conversion | ||||||||||||
| January 7, 2020 | 53,764 | $ | 53,226 | $ | 20,000 | $ | (33,226 | ) | ||||||||
| February 4, 2020 | 135,802 | 127,654 | 20,000 | (107,654 | ) | |||||||||||
| February 7, 2020 | 151,234 | 142,160 | 24,500 | (117,660 | ) | |||||||||||
| February 26, 2020 | 151,515 | 45,455 | 20,000 | (25,455 | ) | |||||||||||
| February 26, 2020 | 140,151 | 39,242 | 18,500 | (20,742 | ) | |||||||||||
| March 9, 2020 | 170,000 | 27,200 | 13,090 | (14,110 | ) | |||||||||||
| March 9, 2020 | 195,547 | 68,441 | 13,000 | (55,441 | ) | |||||||||||
| March 11, 2020 | 180,505 | 63,177 | 12,000 | (51,177 | ) | |||||||||||
| April 1, 2020 | 140,000 | 9,800 | 3,889 | (5,911 | ) | |||||||||||
| April 1, 2020 | 220,000 | 15,400 | 6,666 | (8,734 | ) | |||||||||||
| April 2, 2020 | 218,678 | 16,379 | 7,000 | (9,379 | ) | |||||||||||
| April 21, 2020 | 264,026 | 24,649 | 8,000 | (16,649 | ) | |||||||||||
| May 15, 2020 | 258,000 | 25,800 | 7,166 | (18,634 | ) | |||||||||||
| May 19, 2020 | 426,000 | 80,940 | 17,338 | (63,602 | ) | |||||||||||
| May 19, 2020 | 675,675 | 100,000 | 30,000 | (70,000 | ) | |||||||||||
| May 19, 2020 | 350,000 | 33,250 | 12,705 | (20,545 | ) | |||||||||||
| May 19, 2020 | 337,837 | 50,000 | 15,000 | (35,000 | ) | |||||||||||
| May 21, 2020 | 298,606 | 56,735 | 13,258 | (43,477 | ) | |||||||||||
| May 21, 2020 | 611,111 | 116,111 | 27,750 | (88,361 | ) | |||||||||||
| July 8, 2020 | 500,000 | 45,000 | 10,500 | (34,500 | ) | |||||||||||
| July 8, 2020 | 857,142 | 72,857 | 18,000 | (54,857 | ) | |||||||||||
| July 8, 2020 | 600,000 | 22,800 | 11,549 | (11,251 | ) | |||||||||||
| July 8, 2020 | 639,846 | 51,188 | 13,437 | (37,751 | ) | |||||||||||
| July 8, 2020 | 880,952 | 70,476 | 18,500 | (51,976 | ) | |||||||||||
| July 10, 2020 | 809,523 | 29,952 | 17,000 | (12,952 | ) | |||||||||||
| July 17, 2020 | 1,121,212 | 55,948 | 18,500 | (37,448 | ) | |||||||||||
| July 17, 2020 | 1,151,515 | 46,291 | 19,500 | (26,791 | ) | |||||||||||
| July 20, 2020 | 1,130,000 | 45,426 | 17,091 | (28,335 | ) | |||||||||||
| July 23, 2020 | 879,157 | 43,870 | 14,506 | (29,364 | ) | |||||||||||
| August 3, 2020 | 1,309,824 | 35,234 | 14,146 | (21,088 | ) | |||||||||||
| August 3, 2020 | 1,638,117 | 33,991 | 17,692 | (16,299 | ) | |||||||||||
| August 10, 2020 | 1,412,525 | 30,553 | 15,255 | (15,298 | ) | |||||||||||
| August 13, 2020 | 1,000,000 | 20,100 | 15,000 | (5,100 | ) | |||||||||||
| August 13, 2020 | 1,130,000 | 25,877 | 11,311 | (14,566 | ) | |||||||||||
| August 13, 2020 | 1,465,201 | 29,451 | 16,000 | (13,451 | ) | |||||||||||
| August 19, 2020 | 1,484,615 | 22,269 | 19,300 | (2,969 | ) | |||||||||||
| August 25, 2020 | 1,750,000 | 125,125 | 11,340 | (113,785 | ) | |||||||||||
| August 25, 2020 | 1,483,146 | 106,045 | 13,200 | (92,845 | ) | |||||||||||
| August 25, 2020 | 620,033 | 44,332 | 4,018 | (40,314 | ) | |||||||||||
| August 25, 2020 | 1,490,000 | 106,535 | 8,851 | (97,684 | ) | |||||||||||
| August 25, 2020 | 1,893,939 | 135,417 | 12,500 | (122,917 | ) | |||||||||||
| August 26, 2020 | 1,818,182 | 130,000 | 12,000 | (118,000 | ) | |||||||||||
| August 27, 2020 | 1,808,989 | 156,839 | 16,100 | (140,739 | ) | |||||||||||
| August 31, 2020 | 1,808,989 | 84,842 | 16,100 | (68,742 | ) | |||||||||||
| September 1, 2020 | 1,560,000 | 79,560 | 9,266 | (70,294 | ) | |||||||||||
| September 2, 2020 | 1,808,989 | 80,283 | 16,100 | (64,183 | ) | |||||||||||
| September 9, 2020 | 1,808,989 | 66,119 | 16,100 | (50,019 | ) | |||||||||||
| September 10, 2020 | 2,727,273 | 92,045 | 18,000 | (74,045 | ) | |||||||||||
| September 14, 2020 | 1,560,000 | 46,566 | 9,266 | (37,300 | ) | |||||||||||
| September 17, 2020 | 345,291 | 12,879 | 7,700 | (5,179 | ) | |||||||||||
| September 18, 2020 | 2,938,117 | 113,705 | 19,039 | (94,666 | ) | |||||||||||
| September 22, 2020 | 1,515,151 | 57,879 | 10,000 | (47,879 | ) | |||||||||||
| September 24, 2020 | 412,831 | 51,232 | 5,699 | (45,533 | ) | |||||||||||
| September 29, 2020 | 2,600,000 | 310,700 | 15,444 | (295,256 | ) | |||||||||||
| Total | 52,937,999 | $ | 3,577,005 | $ | 777,872 | $ | (2,799,133 | ) | ||||||||
| (1) | Fair values are derived based on the closing price of the Company’s common stock on the date of the conversion notice. | |
| (2) | Converted balance includes portions of principal, accrued interest, |
| 83 |
During the year ended December 31, 2019:
| ● | The Company issued an aggregate of 72,295 shares of common stock with a fair value of $63,437 in exchange for services. | |
| ● | The Company issued an aggregate of 32,000 shares of common stock with a fair value of $37,760 as partial settlement for accounts payable, as outlined in Note 8. | |
| ● | The Company issued an aggregate of 407,536 shares of common stock with a fair value of $506,468 upon the conversion of $180,642 of convertible debentures, accrued interest and accounts payable, as outlined in Note 9, per the table below: |
| Date issued | Common shares issued (#) | Fair value(1) | Converted balance(2) | Loss on conversion | ||||||||||||
| January 22, 2019 | 10,189 | $ | 28,527 | $ | 15,690 | $ | (12,837 | ) | ||||||||
| March 11, 2019 | 18,606 | 37,211 | 12,280 | (24,931 | ) | |||||||||||
| March 15, 2019 | 27,137 | 54,238 | 17,899 | (36,339 | ) | |||||||||||
| June 17, 2019 | 45,216 | 58,781 | 31,651 | (27,130 | ) | |||||||||||
| June 20, 2019 | 34,450 | 36,517 | 19,895 | (16,622 | ) | |||||||||||
| July 17, 2019 | 37,900 | 33,352 | 5,628 | (27,724 | ) | |||||||||||
| August 26, 2019 | 40,000 | 27,020 | 6,620 | (20,400 | ) | |||||||||||
| September 18, 2019 | 39,500 | 49,376 | 8,255 | (41,121 | ) | |||||||||||
| October 11, 2019 | 35,000 | 44,450 | 13,475 | (30,975 | ) | |||||||||||
| November 13, 2019 | 47,500 | 77,899 | 18,810 | (59,089 | ) | |||||||||||
| November 7, 2019 | 23,149 | 18,519 | 10,000 | (8,519 | ) | |||||||||||
| December 19, 2019 | 48,889 | 40,578 | 22,000 | (18,578 | ) | |||||||||||
| Total | 407,536 | $ | 506,468 | $ | 182,203 | $ | (324,265 | ) | ||||||||
| (1) | Fair values are derived based on the closing price of the Company’s common stock on the date of the conversion notice. | |
| (2) | Converted balance includes portions of principal, accrued interest, accounts payable, financing fees and interest penalties converted upon the issuance of shares of common stock. |
| 84 |
Common Stock to be Issued
Common stock to be issued as at December 31, 2020 consists of:
| ● | 4,874,690 shares valued at $1,383,815 to be issued pursuant to settlement of various accounts payable balances and outstanding debt in exchange for shares of common stock to be issued. |
As at December 31, 2020, 8,138,975 shares of common stock remain to be issued with a value of $1,436,044, all of which were issued subsequent to year end.
Warrants
On December 23, 2020, the Company granted 3,000,000 warrants concurrently with the execution of the Series F SPA. The warrants are exercisable into one share of common stock at an exercise price of $0.50 per share. Warrants were valued at $768,008, under the relative fair value allocation approach. The warrants expire on the five-year anniversary of the Initial Exercise Date.
On March 2, 2020, the Company granted 2,829,859 warrants with a contractual life of five years and exercise price of $0.25 per share in exchange for strategic advisory services. Warrants were valued at $465,248 using the Black Scholes Option Pricing Model with the assumptions outlined below. Expected life was determined based on historical exercise data of the Company.
On October 26, 2020, the Company promised to grant 1,000,000 warrants with a contractual life of three years and exercise price of $0.25 per share in exchange for investor relations services. Warrants were valued at $163,998 using the Black Scholes Option Pricing Model with the assumptions outlined below and were issued subsequently on February 10, 2021. As at December 31, 2020, the value of the warrants was included in obligation to issue warrants.
On December 31, 2020, the Company granted 250,000 warrants with a contractual life of two years and exercise price of $1.00 per share as part of a Debt Conversion and Settlement agreement. Warrants were valued at $328,329 using the Black Scholes Option Pricing Model with the assumptions outlined below.
| December 31, 2020 | December 31, 2019 | |||||||
| Risk-free interest rate | 0.13% - 0.88 | % | 1.62 | % | ||||
| Expected life | 2.0 - 5.0 years | 3.0 years | ||||||
| Expected dividend rate | 0 | % | 0 | % | ||||
| Expected volatility | 266 - 321 | % | 280 | % | ||||
Continuity of the Company’s common stock purchase warrants issued and outstanding is as follows:
| Warrants | Weighted average exercise price | |||||||
| Outstanding at year end December 31, 2018 | - | $ | - | |||||
| Granted | 6,859,954 | 0.77 | ||||||
| Exercised | - | - | ||||||
| Expired | - | - | ||||||
| Outstanding at year December 31, 2019 | 6,859,954 | $ | 0.77 | |||||
| Granted | 6,079,859 | 0.40 | ||||||
| Exercised | - | - | ||||||
| Expired | - | - | ||||||
| Outstanding as at December 31, 2020 | 12,939,813 | $ | 0.60 | |||||
As at December 31, 2020, the weighted average remaining contractual life of warrants outstanding was 3.20 years (2019 – 3.08 years) with an intrinsic value of $9,605,067 (2019 - $108,246).
| 85 |
Note 1415 – RELATED PARTY TRANSACTIONS
As at December 31, 2018,2020, the Company owed $139,835 ($190,764 CDN)$317,997 (December 31, 20172019 - $204,929 ($257,084 CDN))$263,409) to the President, CEO, and CFO of the Company for management fees and salaries, which has been recorded in trade and other payables. The amounts owed and owing are unsecured, non-interest bearing, and due on demand. During the year ended December 31, 20182020 the Company incurred $200,000 (2017$300,000 (2019 - $200,000)$100,000) in salaries to the President, CEO, and CFO of the Company.Company and made payments of $170,381.
As at December 31, 2018, the Company owes $Nil (2017 - $52,838) to the Senior Vice President of Global Sales of the Company, which has been recorded in trade and other payables. The amount owing is unsecured, non-interest bearing, and due on demand.
As at December 31, 2018,2020, the Company owed $12,791 ($17,450 CDN)$Nil (December 31, 20172019 - $22,280 ($27,950 CDN)$7,260 (CDN$9,450)) to a company controlled by the son of the President, CEO, and CFO of the Company for subcontractor services. The balance owing has been recorded in trade and other payables. The amount owing is unsecured, non-interest bearing, and due on demand.
Note 15 – COMMITMENTSOn May 21, 2020, the Company issued an aggregate of 136 shares of Series B convertible preferred shares to various parties for past services to the Company, which included 122 issued to related parties and 2 issued to a former director of the Company. These preferred shares were valued at $767,040, based on the fair value of the underlying common stock, discounted for the six months hold period before the preferred shares can be converted. The issuance is recorded under compensation expense.
Lease ObligationsNote 16 – COMMITMENTS
On June 1, 2018, the Company signed a two-year operating lease agreement expiring on May 31, 2020 with the right to renew for an additional two-year term if written notice is provided within 120 days prior to the expiration of the current term. The annual rent for the premises in Canada is approximately $46,552 CDN and commenced on July 1, 2018.
Product Warranties
Previously, the Company’s product warranty costs are part of its cost of sales based on associated material product costs, labor costs for technical support staff, and associated overhead. The products sold were generally covered by a warranty for a period of one year. During the year ending December 31, 2018, the Company’s warranty policy change to generally covercovers a period of two years which is also covered by the manufacturer warranty. Thus, any warranty costs incurred by the Company are immaterial. Due to this, as of December 31, 2018, the Company has reserved $Nil (December 31, 2017 - $165,523) for future warranty costs. The Company’s past experience with warranty related costs was used as a basis for the reserve. During the year ended December 31, 2018, the Company recorded a warranty recovery of $89,037 (2017 – warranty expense of $90,284) for the write down of the warranty reserve.
A tabular reconciliation of the Company’s aggregate product warranty liability for the reporting periods is as follows:Indemnifications
| Year ended | Year ended | |||||||
| December 31, 2018 | December 31, 2017 | |||||||
| Opening balance | $ | 165,523 | $ | 111,715 | ||||
| Accruals for product warranties issued in the period | - | 99,699 | ||||||
| Adjustments to liabilities for pre-existing warranties | (71,284 | ) | (45,891 | ) | ||||
| Write down warranty for change in policy | (94,239 | ) | - | |||||
| Ending liability | $ | - | $ | 165,523 | ||||
In the normal course of business, the Company indemnifies other parties, including customers, lessors, and parties to other transactions with the Company, with respect to certain matters. The Company has agreed to hold the other parties harmless against losses arising from a breach of representations or covenants, or out of intellectual property infringement or other claims made against certain parties. These agreements may limit the time within which an indemnification claim can be made and the amount of the claim. In addition, the Company has entered into indemnification agreements with its officers and directors, and the Company’s bylaws contain similar indemnification obligations to the Company’s agents. It is not possible to determine the maximum potential amount under these indemnification agreements due to the Company’s limited history with prior indemnification claims and the unique facts and circumstances involved in each particular agreement. Historically, payments made by the Company under these agreements have not had a material effect on the Company’s operating results, financial position, or cash flows.
| 86 |
Note 1617 – CONTINGENCIES
On September 7, 2016, Chetu Inc. filed a Complaint for Damage in Florida to recover an unpaid invoice amount of $27,335 plus interest of $4,939. The invoice was not paid due to a service dispute. As at December 31, 2018,2020, included in trade and other payables is $46,533$47,023 (December 31, 2019 - $40,227) related to this unpaid invoice, interest and legal fees.
On May 24, 2017, the Company received a notice of default from Coastal Investment Partners LLC (“Coastal”), on three 8% convertible promissory notes issued by the Company in aggregate principal amount of $261,389 and commenced a lawsuit on June 12, 2017 in the United States District Court, Southern District of New York. Coastal alleges that the Company failed to deliver shares of common stock underlying the Coastal notes, and thus giving rise to an event of default. Coastal seeks damages in excess of $250,000 for breach of contact damages, and legal fees incurred by Coastal with respect to the lawsuit. This action is still pending.On June 13, 2017, Coastal filed a complaint and motion for a preliminary injunction seeking conversion of the principal amount of a note issued by it to the Company into common stock of the Company. The Court issued an Order to Show Cause as to why a preliminary injunction should not be issued on June 27, 2017, and the Company opposed Coastal’s motion. A hearing on the motion for preliminary injunction was held on July 26, 2017. For the following reasons, the Court denied Coastal’s motion for a preliminary injunction. The Company also filed a cross motion to dismiss on the grounds that the $72,500 Note violates New York’s criminal usury law. The Court did not address this motion at that time and has set a separate briefing schedule for it. On December 31, 2020, the Company entered into a Settlement Agreement with Coastal for full and final satisfaction of its claims and all outstanding principal debt and accrued interest for $250,000 paid in cash and 200,000 shares of common stock fair valued at $268,000. As at December 31, 2018, the principal balance2020, $250,000 is included in loans and accrued interest on this convertible noteinterested and $268,000 is included in shares to be issued in relation to the settlement. The Company paid cash of $250,000 on February 11, 2021, in satisfaction of the consolidated balance sheet under convertible notes payable.agreement.
On October 10, 2017, a vendor filed a complaint for Breach of Contract with Superior Court of the State of California. The Complainant is alleging that it is contractually owed 1,848,130 shares of the Company’s common stock and is seeking damages of $270,000. In addition, a related vendor filed in the same filing a complaint for $72,000 as part of a consulting agreement the Company executed. No accrual has been recorded becauseSubsequent to year end, the Company reached a settlement of which the terms have not, as yet, occurred. As at December 31, 2020, included in accrued liabilities is a contingent liability of $115,000 for the expected financial impact of the opinion that no obligation exists since the vendors have not performed their contractual duties.
On February 9, 2017,settlement. Subsequent to December 31, 2020, the Company received a noticeissued 115,000 shares of default from Auctus Fund LLC (“Auctus”), on a 12% convertible promissory note issuedrestricted common stock pursuant to the Company in the principal amount of $75,000 and commenced a lawsuit on February 2, 2018 in the United States District Court, District of Massachusetts. Auctus alleges that the Company failed to honor a conversion notice under the terms of the note, and thus giving rise to an event of default. Auctus seeks damages in excess of $306,681, which consists of the principal amount of the note, liquidated damages, and default interest, and legal fees incurred by Auctus with respect to the lawsuit. On June 1, 2018 the remaining $58,167 note balance, including principal and interest, was reassigned to another unrelated note holder and the note was extinguished. Refer to Note 9(e) and 9(z).settlement.
On April 9, 2018, the Company received a share-reserve increase letter from JSJ Investments Inc. (“JSJ”) pursuant to the terms of a 10% convertible promissory note issued to the Company in the principal amount of $135,000. On April 24, 2018, the Company received a notice of default from JSJ for failure to comply with the share-reserve increase and on April 30, 2018 demanded payment in full of the default amount totaling $172,845. On May 7, 2018, JSJ commenced a lawsuit in the United States District Court, District of Dallas County, Texas. JSJ alleges that the Company failed to comply with the share-reserve increase letter, thus giving rise to an event of default, and failed to pay the outstanding default amount due under the terms of the note. JSJ seeks damages in excess of $200,000 but not more than $1,000,000, which consists of the principal amount of the note, default interest, and legal fees incurred by JSJ with respect to the lawsuit. This action is still pending.pending but as at September 30, 2020, JSJ has negotiated a reduced amount with a private investor. As at December 31, 2018,September 30, 2020, the principal balance and accrued interest on this convertible note is included on the consolidated balance sheet under convertible notes payable. In November 2020, the Company entered into a Settlement Agreement with JSJ for full and final satisfaction if its claims for $100,000 (the “Settlement Payment”) paid in cash on or before November 10, 2020. Upon receipt of the Settlement Payment, JSJ agreed to provide (a) a settlement agreement and release of all its claims against the Company; and (b) a consent dismissal order in B.C. Supreme Court Action No. 1911876 on a “without costs” basis. The Company paid cash of $100,000 on November 10, 2020 in satisfaction of the agreement. See Note 9(e).
Note 17 – REVISION OF PRIOR YEAR FINANCIAL STATEMENTS
While preparing the interim condensed consolidated financial statements for the period ending March 31, 2018, the Company noted that there was a revision of the fair value of the derivative liabilities and during the period ended June 30, 2018, determined that no non-controlling interest exists. Accordingly, the Company has revised its consolidated financial statements as at and for the year ended December 31, 2017 to reflect the change in fair value of derivative liabilities and retained earnings during the period and the fair value of the derivative liabilities and retained earnings as at December 31, 2017. This revision resulted in an increase to deficit of $1,819,564, an increase to net loss of $484,759, an increase to comprehensive loss of $720,424 and an increase to net loss per share of $43.89. There was no impact on the consolidated statement of cash flows. In accordance with the guidance provided by the SEC’s Staff Accounting Bulletin 99, Materiality and Staff Accounting Bulletin No. 108,“Considering the Effects of Prior Year Misstatements when Quantifying Misstatements in Current Year Financial Statements”, the Company has determined that the impact of adjustments relating to the correction of this accounting error was derived from an estimate, has no impact on compliance with regulatory requirements or loan covenants, and has no impact on the Company’s cash flows. Accordingly, these changes are disclosed herein and have been disclosed prospectively.
The impact of the revision as at December 31, 2017 and for the year then ended is summarized below:
Consolidated Balance Sheet
| As at December 31, 2017 | ||||||||||||
| As reported $ | Adjustment $ | As restated $ | ||||||||||
| LIABILITIES AND STOCKHOLDERS’ DEFICIT | ||||||||||||
| Current Liabilities | ||||||||||||
| Derivative liabilities | 1,191,396 | 484,759 | 1,676,155 | |||||||||
| Total Current Liabilities | 8,061,842 | 484,759 | 8,546,601 | |||||||||
| Total Liabilities | 8,061,842 | 484,759 | 8,546,601 | |||||||||
| Stockholders’ Equity | ||||||||||||
| Deficit | (30,409,853 | ) | (1,819,564 | ) | (32,229,417 | ) | ||||||
| Noncontrolling interest | (1,334,805 | ) | 1,334,805 | - | ||||||||
| Total Stockholders’ Deficit | (13,257,858 | ) | (484,759 | ) | (13,742,617 | ) | ||||||
Consolidated Statement of Operations and Comprehensive Loss
| Year ended December 31, 2017 | ||||||||||||
| As reported $ | Adjustment $ | As restated $ | ||||||||||
| Other income (expense) | ||||||||||||
| Change in fair value of derivative liabilities | (340,227 | ) | (484,759 | ) | (824,986 | ) | ||||||
| Total other income (expense) | (1,987,202 | ) | (484,759 | ) | (2,471,961 | ) | ||||||
| Net loss for the year | (3,632,072 | ) | (484,759 | ) | (4,116,831 | ) | ||||||
| Net loss attributed to non-controlling interest | 235,665 | (235,665 | ) | - | ||||||||
| Comprehensive loss | (3,819,809 | ) | (720,424 | ) | (4,540,233 | ) | ||||||
Consolidated Statement of Stockholders’ Equity
| Year ended December 31, 2017 | ||||||||||||
| As reported $ | Adjustment $ | As restated $ | ||||||||||
| Deficit | (30,409,853 | ) | (1,819,564 | ) | (32,229,417 | ) | ||||||
| Non-controlling interest | (1,334,805 | ) | 1,334,805 | - | ||||||||
| Stockholders’ Deficit | (13,257,858 | ) | (484,759 | ) | (13,742,617 | ) | ||||||
Consolidated Statement of Cash Flows
| Year ended December 31, 2017 | ||||||||||||
| As reported $ | Adjustment $ | As restated $ | ||||||||||
| Operating activities | ||||||||||||
| Net loss | (3,632,072 | ) | (484,759 | ) | (4,116,831 | ) | ||||||
| Adjustments to reconcile net loss to net cash used in operating activities: | ||||||||||||
| Change in fair value of derivative liabilities | (340,227 | ) | (484,759 | ) | (824,986 | ) | ||||||
| 87 |
Note 18 – INCOME TAX
For the years ended December 31, 20182020 and 2017,2019, there is $Nil and $Nil current and deferred income tax expense, respectively, reflected in the Statement of Operations.
The following are the components of income before income tax reflected in the Statement of Operations for the years ended December 31, 20182020 and 2017:2019:
Component of Loss Before Income Tax
| December 31, 2018 | December 31, 2017 | December 31, 2020 | December 31, 2019 | |||||||||||||
| Loss before income tax | $ | (9,825,404 | ) | $ | (4,116,821 | ) | $ | (6,177,099 | ) | $ | (3,078,120 | ) | ||||
| Income Tax | $ | - | $ | - | ||||||||||||
| Income tax | $ | - | $ | - | ||||||||||||
| Effective tax rate | 21.0 | % | 21.0 | % | 21.0 | % | 21.0 | % | ||||||||
Deferred income taxes arise from temporary differences between the tax and financial statement recognition of revenue and expense. In evaluating the ability to recover the deferred tax assets within the jurisdiction from which they arise, the Company considered all available positive and negative evidence, including scheduled reversals of deferred tax liabilities, projected future taxable income, tax planning strategies and recent financial operations. In projecting future taxable income, the Company began with historical results adjusted for changes in accounting policies and incorporates assumptions including the amount of future pretax operating income, the reversal of temporary differences, and the implementation of feasible and prudent tax planning strategies. These assumptions require significant judgment about the forecasts of future taxable income and are consistent with the plans and estimate the Company are using to manage the underlying businesses. In evaluating the objective evidence that historical results provide, the Company consider three years of cumulative operating income (loss).
On December 22, 2017, the President of the United States signed into law the Tax Cuts and Jobs Act (the “Act”), which reduced the corporate tax rate for businesses from a maximum of 35% to a flat 21% rate. The rate reduction is effective on January 1, 2018. As a result of the rate reduction, the Company reduced the deferred tax asset balance as of December 31, 2017 by $4,257,379. Due to the Company’s full valuation allowance position, there was no net impact on the Company’s income tax provision at December 31, 2017 as the reduction in the deferred tax asset balance was fully offset by a corresponding decrease in the valuation allowance.
As of December 31, 2018,2020, the Company had aggregate net operating losses of $42,054,821 (2017$51,310,040 (2019 - $30,409,853)$45,132,941) to offset future taxable income in Canadathe United States and the United Kingdom. The deferred tax assets at December 31, 20182020 were fully reserved. Management believes it is more likely than not that these assets will not be realized in the near future.
Note 19 – SUPPLEMENTAL CASH FLOW INFORMATION
| Year Ended | ||||||||
| December 31, 2018 | December 31, 2017 | |||||||
| Cash paid during the period for: | ||||||||
| Income tax payments | $ | - | $ | - | ||||
| Interest payments | $ | - | $ | 29,952 | ||||
| Non-cash investing and financing transactions: | ||||||||
| Convertible debenture issued for financing fees | $ | 15,000 | $ | - | ||||
| Shares issued for convertible loans payable | $ | 4,343,730 | $ | 771,035 | ||||
| Preferred shares issued in exchange for mezzanine preferred shares and accrued interest | $ | 1,751,740 | $ | - | ||||
| Preferred shares issued in exchange for convertible debt and accrued interest | $ | 3,120,992 | $ | - | ||||
| Mezzanine preferred shares issued in exchange for mezzanine preferred shares and accrued interest | $ | 4,121,741 | $ | - | ||||
| Mezzanine preferred shares issued in exchange for convertible debt and accrued interest | $ | 2,488,765 | $ | - | ||||
| Preferred shares issued for accounts payable | $ | 91,944 | $ | - | ||||
| Shares issued for convertible related party payable | $ | - | $ | 26,252 | ||||
| Returnable shares issued for commitment fee | $ | - | $ | 198,000 | ||||
| Year Ended | ||||||||
| December 31, 2020 | December 31, 2019 | |||||||
| Cash paid during the period for: | ||||||||
| Income tax payments | $ | — | $ | — | ||||
| Interest payments | $ | 21,206 | $ | 46,500 | ||||
| Non-cash investing and financing transactions: | ||||||||
| Shares issued for convertible notes payable and accrued interest | $ | 5,501,965 | $ | 506,468 | ||||
| Shares issued and to be issued for share-settled debt | $ | 2,246,334 | $ | 634,498 | ||||
| Convertible debenture issued for financing fees | $ | - | $ | 250,419 | ||||
| Preferred shares exchanged for shares to be issued | $ | - | $ | 11,541,375 | ||||
| Initial recognition of lease assets | $ | 306,622 | $ | 178,202 | ||||
| Initial recognition of lease liabilities | $ | 290,061 | $ | 171,648 | ||||
| 88 |
Note 20 – SUBSEQUENT EVENTS
Management has evaluated events subsequent to the year ended December 31, 2018 through May 24, 2019 for transactions and other events that may require adjustment of and/or disclosure in such consolidated financial statements.
On April 26, 2019, the Company entered into a note purchase and assignment agreement (the “Assignment Agreement”) with two unrelated parties pursuant to a certain secured inventory convertible note issued on March 19, 2018 in the principal amount of $900,000. Refer to Note 9(t). Pursuant to the Assignment Agreement, the Seller desires to sell the balance owing under the Second and Third tranche of the original note in four separate closings on April 26, May 22, June 24, and July 24, 2019 totaling $84,396, $85,838, $120,490 and $122,866, respectively (consisting of $375,804 principal and $37,786 of accrued interest).
Subsequent to December 31, 2018,2020, the Company issued:
| ● | ||
| ● | 1,751,288 shares of common stock were cancelled and returned to treasury due to a duplicated issuance for share settled debt. | |
| ● | 3,264,285 shares of common stock with a fair value of $52,229 to satisfy shares to be issued at December 31, 2020. | |
| ● | The Company issued 100 Series B Preferred Shares with a fair value of $1,340,000 and 1,000,000 warrants with a fair value of $163,998 pursuant to an investor relations agreement dated October 26, 2020. | |
| ● | 300,000 shares of common stock with a fair value of $387,000 to satisfy shares to be issued at December 31, 2020. | |
| ● | 35,148 shares of common stock with a fair value of $45,341 to satisfy shares to be issued at December 31, 2020. | |
| ● | 96,861 shares of common stock for | |
| ● | 1,700,000 shares of common stock | |
| ● | 375,000 shares of common stock with a fair value of $502,500 to satisfy shares to be issued at December 31, 2020. | |
| ● | 200,000 shares of common stock with a fair value of $268,000 to satisfy shares to be issued at December 31, 2020. | |
| ● | 3,964,542 shares of common stock with a fair value of $180,974 to satisfy shares to be issued at December 31, 2020. | |
| ● | 3,000 shares of Series F preferred shares with a fair value of $731,992 to satisfy preferred shares to be issued at December 31, 2020, pursuant to the Series F SPA, see note 12. | |
| ● | 150,000 shares of common stock with a fair value of $138,750 pursuant to a consulting services agreement dated January 26, 2021. | |
| ● | 115,000 shares of common stock with a fair value of $60,835 pursuant to a legal settlement, see Note 17. | |
| ● | 695,173 shares of common stock for conversion of 168 Series C Preferred Shares with an aggregate carrying value of $51,999. | |
| ● | 16 shares of Series B Preferred Shares, convertible into 100,000 shares of common stock per Series B preferred shares, to members of the Board of Directors for compensation with an aggregate fair value of $849,600 based on the underlying security. |
| 89 |
EXHIBITS
| 90 |
| 10.12 | Lease agreement (Modified), dated January 21, 2016 and February 1, 2016 between DSG TAG Systems Inc. and Benchmark Group | 10-K | 10.6 | 05-28-19 | ||||||
| 10.13 | Loan agreement, dated February 11, 2016 between DSG TAG Systems Inc. and Jeremy Yaseniuk | 10-K | 10.7 | 05-28-19 | ||||||
| 10.14 | Loan agreement, dated March 31, 2016 between DSG TAG Systems Inc. and E. Gary Risler | 10-K | 10.8 | 05-28-19
| ||||||
| 10.15 | Equity Financing Agreement dated September 18, 2019 between DSG Global, Inc. and GHS Investments, LLC | S-1 | 10.9 | 10-04-19 | ||||||
| 10.16 | Registration Rights Agreement dated September 18, 2019 between DSG Global, Inc. and GHS Investments, LLC | S-1 | 10.10 | 10-04-19 | ||||||
| 23.1 | Consent of Buckley Dodds LLP | x |
| 91 |
Item 16 EXHIBITS
Item 17. UNDERTAKINGS
The undersigned registrant hereby undertakes
| 1. | To file, during any period in which offers or sales are being made, a post-effective amendment to this registration statement: |
| i. | To include any Prospectus required by section 10(a)(3) of the Securities Act of 1933; | |
| ii. | To reflect in the Prospectus any facts or events arising after the effective date of the registration statement (or the most recent post-effective amendment thereof) which, individually or in the aggregate, represent a fundamental change in the information set forth in the registration statement. Notwithstanding the foregoing, any increase or decrease in volume of securities offered (if the total dollar value of securities offered would not exceed that which was registered) and any deviation from the low or high end of the estimated maximum offering range may be reflected in the form of Prospectus filed with the Commission pursuant to Rule 424(b) if, in the aggregate, the changes in volume and price represent no more than 20% change in the maximum aggregate offering price set forth in the “Calculation of Registration Fee” table in the effective registration statement. | |
| iii. | To include any material information with respect to the plan of distribution not previously disclosed in the registration statement or any material change to such information in the registration statement; |
| 2. | That, for the purpose of determining any liability under the Securities Act of 1933, each such post-effective amendment shall be deemed to be a new registration statement relating to the securities offered therein, and the offering of such securities at that time shall be deemed to be the initial bona fide offering thereof. | |
| 3. | To remove from registration by means of a post-effective amendment any of the securities being registered which remain unsold at the termination of the offering. | |
| 4. | That, for the purpose of determining liability of the registrant under the Securities Act of 1933 to any purchaser in the initial distribution of the securities: The undersigned registrant undertakes that in a primary offering of securities of the undersigned registrant pursuant to this registration statement, regardless of the underwriting method used to sell the securities to the purchaser, if the securities are offered or sold to such purchaser by means of any of the following communications, the undersigned registrant will be a seller to the purchaser and will be considered to offer or sell such securities to such purchaser: |
| i. | Any Preliminary Prospectus or Prospectus of the undersigned registrant relating to the offering required to be filed pursuant to Rule 424; | |
| ii. | Any free writing Prospectus relating to the offering prepared by or on behalf of the undersigned registrant or used or referred to by the undersigned registrant; | |
| iii. | The portion of any other free writing Prospectus relating to the offering containing material information about the undersigned registrant or its securities provided by or on behalf of the undersigned registrant; and | |
| iv. | Any other communication that is an offer in the offering made by the undersigned registrant to the purchaser. |
| 5. | That, for the purpose of determining liability under the Securities Act of 1933 to any purchaser: Each Prospectus filed pursuant to Rule 424(b) as part of a registration statement relating to an offering, other than registration statements relying on Rule 430B or other than Prospectuses filed in reliance on Rule 430A, shall be deemed to be part of and included in the registration statement as of the date it is first used after effectiveness. Provided, however, that no statement made in a registration statement or Prospectus that is part of the registration statement or made in a document incorporated or deemed incorporated by reference into the registration statement or Prospectus that is part of the registration statement will, as to a purchaser with a time of contract of sale prior to such first use, supersede or modify any statement that was made in the registration statement or Prospectus that was part of the registration statement or made in any such document immediately prior to such date of first use. |
Insofar as indemnification for liabilities arising under the Securities Act of 1933 may be permitted to our directors, officers and controlling persons, we have been advised that in the opinion of the Securities and Exchange Commission, such indemnification is against public policy as expressed in the Securities Act of 1933 and is, therefore, unenforceable. In the event that a claim for indemnification against such liabilities (other than the payment by us of expenses incurred or paid by a director, officer or controlling person of the corporation in the successful defense of any action, suit or proceeding) is asserted by such director, officer or controlling person in connection with the securities being registered, we will, unless in the opinion of our counsel the matter has been settled by a controlling precedent, submit to a court of appropriate jurisdiction the question of whether such indemnification by us is against public policy as expressed in the Securities Act of 1933, as amended, and will be governed by the final adjudication of such case.
| 92 |
SIGNATURES
Pursuant to the requirements of the Securities Act of 1933, the registrant has duly caused this registration statement to be signed on its behalf by the undersigned, thereunto duly authorized on October 4, 2019.March 15, 2021.
| DSG Global Inc. | ||
| /s/ Robert Silzer | ||
| By: | Robert Silzer | |
| Its: | Principal Executive Officer and Principal Accounting Officer and Director | |
In accordance with the requirements of the Securities Act of 1933, this registration statement was signed by the following persons in the capacities and on the dates stated:
| Name | Title | Date | ||
| /s/ Robert Silzer | President, CEO, CFO, Principal Executive Officer, Principal | |||
| Robert Silzer | Financial Officer, Secretary, Treasurer, Director | |||
| /s/ Stephen Johnson | Director | March 15, 2021 | ||
| Stephen Johnson | ||||
| /s/ James Singerling | Director | March 15, 2021 | ||
| James Singerling | ||||
| /s/ | Director | March 15, 2021 | ||
Michael Leemhuis | ||||
| /s/ Carol Cookerly | Director | March 15, 2021 |
| 93 |